Embed Size (px)
Citation preview
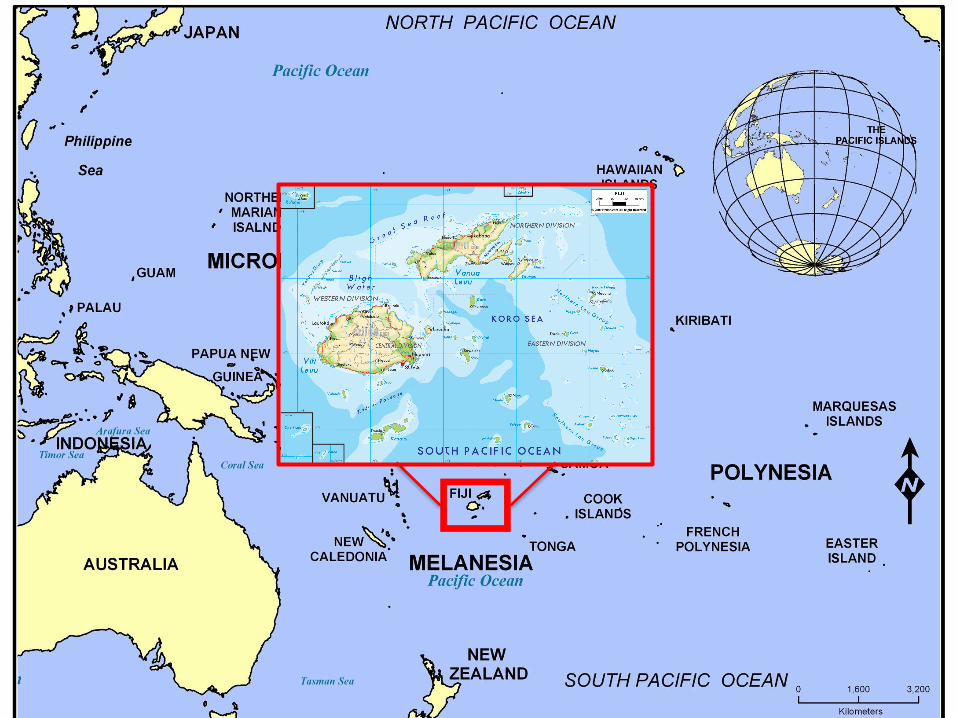
Case control study to identify risk
factors for typhoid fever in Central
Division, Fiji – Preliminary results
Namrata Prasad, BSc, MPH
Research Fellow
University of Otago
Overview
• Background
• Methods
• Results
• Conclusions
• Recommendations
0
50
100
150
200
250
300
350
400
450
1991
1992
1993
1994
1995
1996
1997
1998
1999
2000
2001
2002
2003
2004
2005
2006
2007
2008
2009
2010
2011
2012
2013
2014
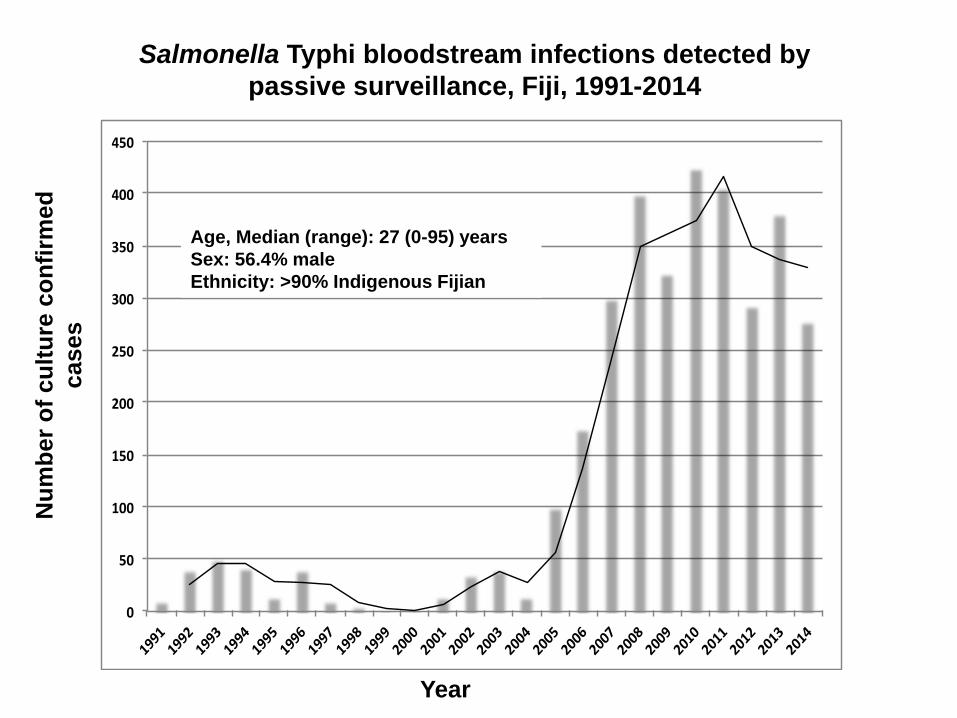
Salmonella Typhi bloodstream infections detected by
passive surveillance, Fiji, 1991-2014
Year
Nu
mb
er
of
cu
ltu
re c
on
firm
ed
ca
se
s
Age, Median (range): 27 (0-95) years
Sex: 56.4% male
Ethnicity: >90% Indigenous Fijian
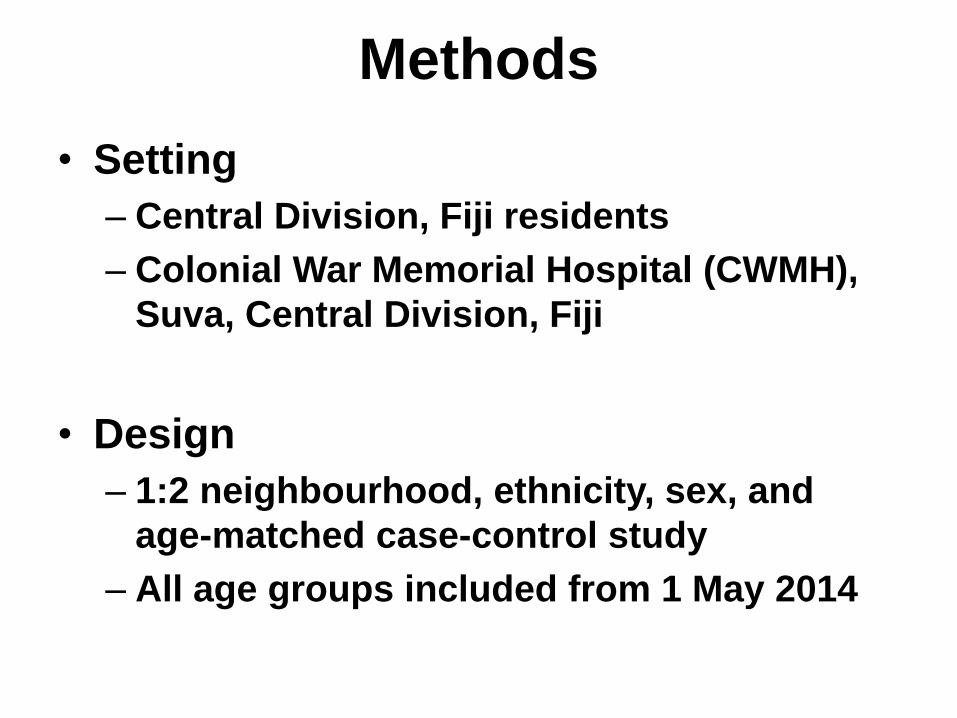
Methods
• Setting
– Central Division, Fiji residents
– Colonial War Memorial Hospital (CWMH),
Suva, Central Division, Fiji
• Design
– 1:2 neighbourhood, ethnicity, sex, and
age-matched case-control study
– All age groups included from 1 May 2014
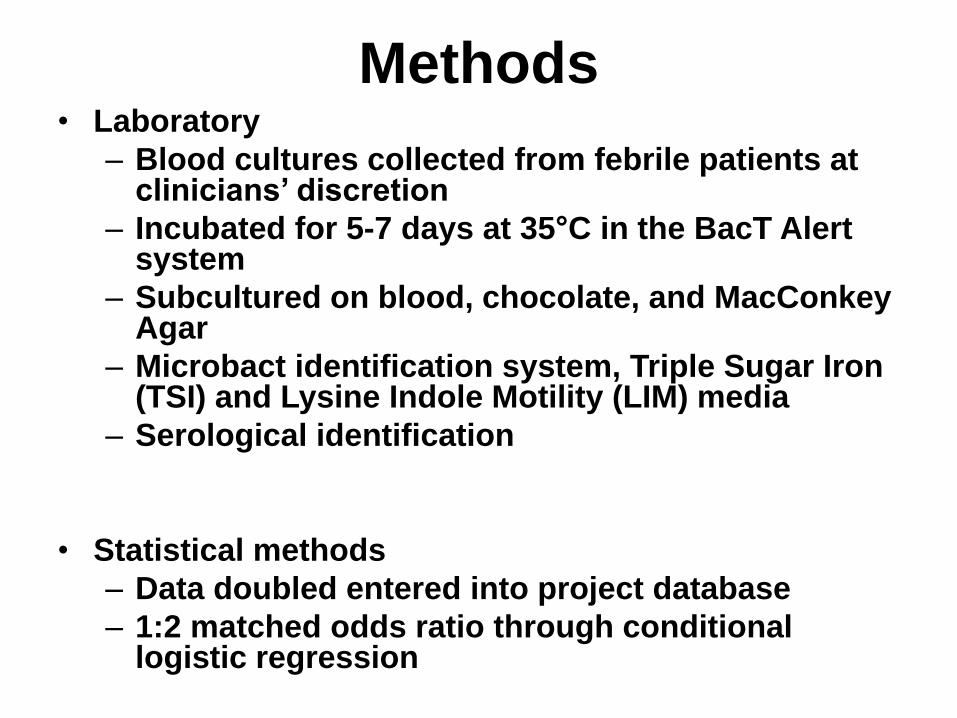
Methods• Laboratory
– Blood cultures collected from febrile patients at clinicians’ discretion
– Incubated for 5-7 days at 35°C in the BacT Alert system
– Subcultured on blood, chocolate, and MacConkeyAgar
– Microbact identification system, Triple Sugar Iron (TSI) and Lysine Indole Motility (LIM) media
– Serological identification
• Statistical methods
– Data doubled entered into project database
– 1:2 matched odds ratio through conditional logistic regression
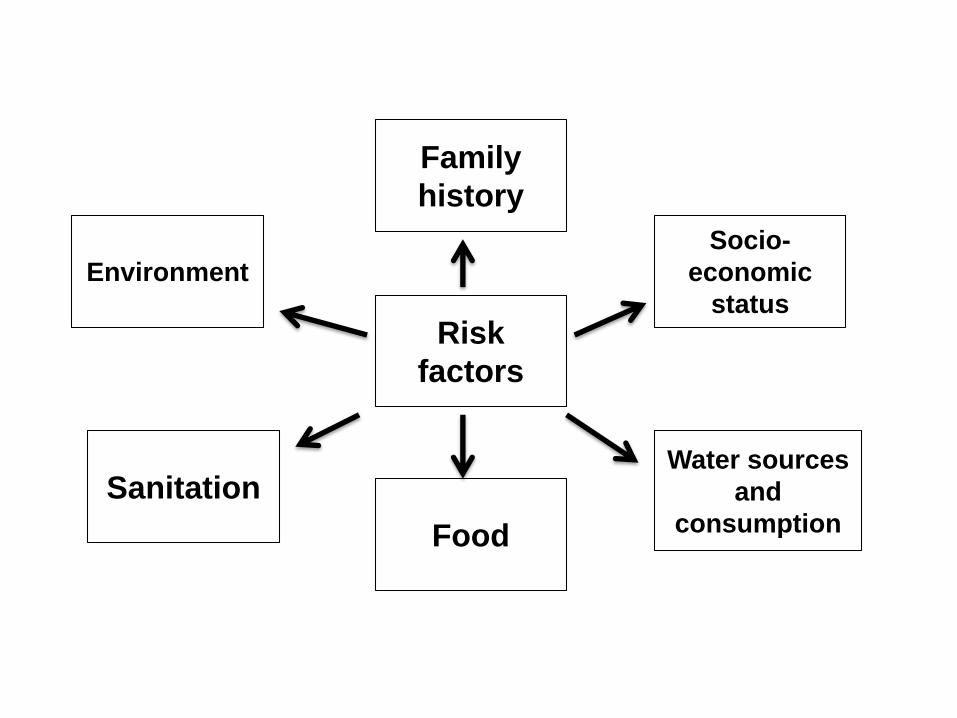
Risk
factors
Socio-
economic
status
Family
history
Environment
Sanitation
Food
Water sources
and
consumption
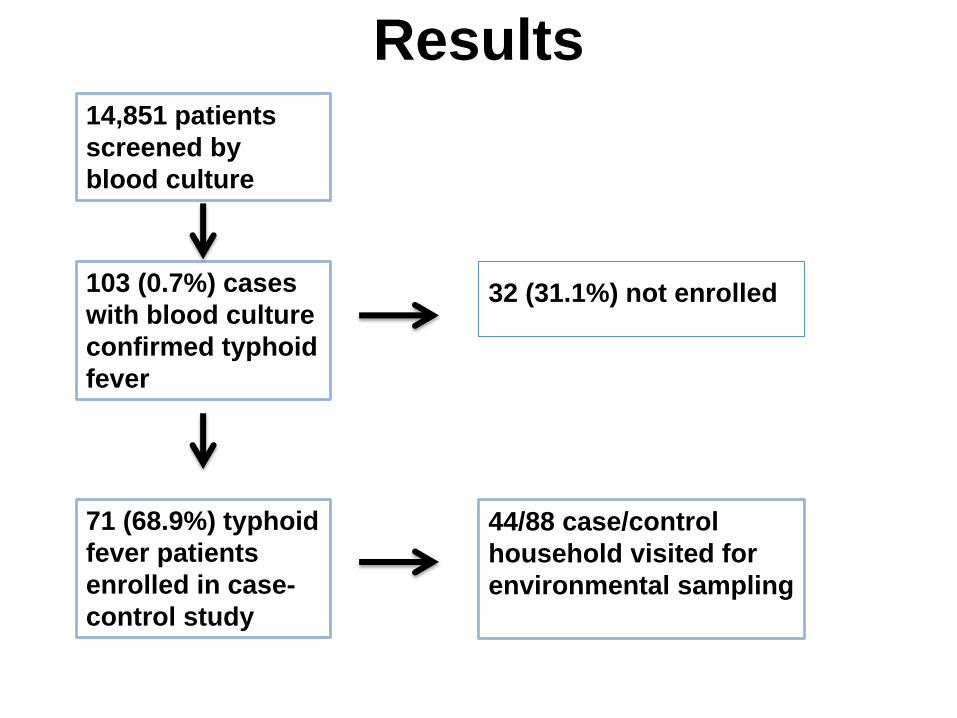
Results14,851 patients
screened by
blood culture
103 (0.7%) cases
with blood culture
confirmed typhoid
fever
71 (68.9%) typhoid
fever patients
enrolled in case-
control study
32 (31.1%) not enrolled
44/88 case/control
household visited for
environmental sampling
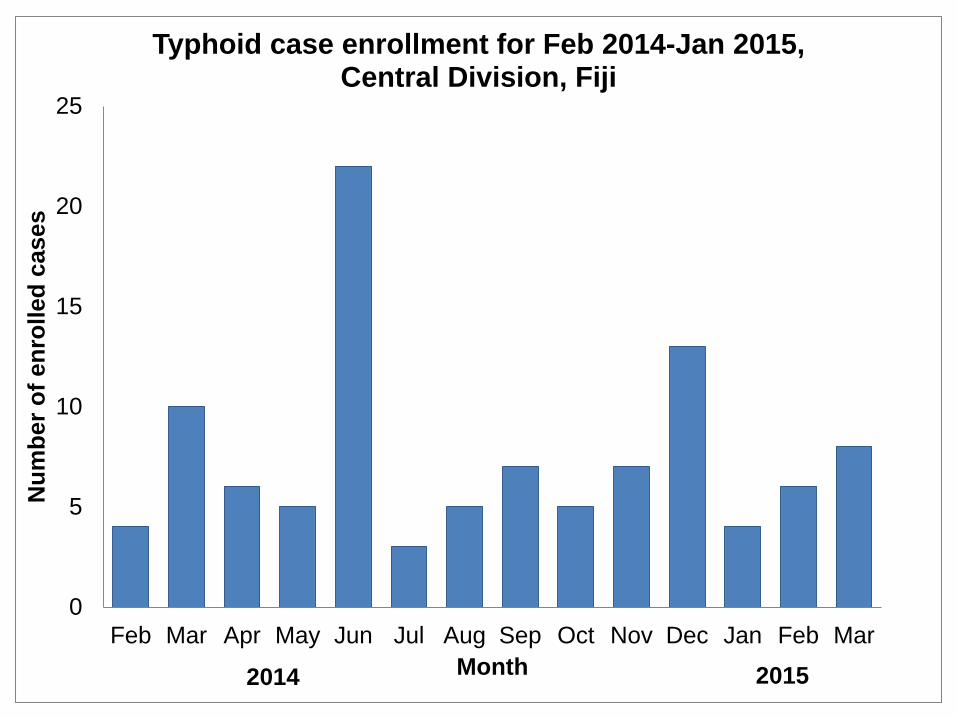
0
5
10
15
20
25
Feb Mar Apr May Jun Jul Aug Sep Oct Nov Dec Jan Feb Mar
Nu
mb
er
of
en
rolled
cases
Month
Typhoid case enrollment for Feb 2014-Jan 2015, Central Division, Fiji
20152014
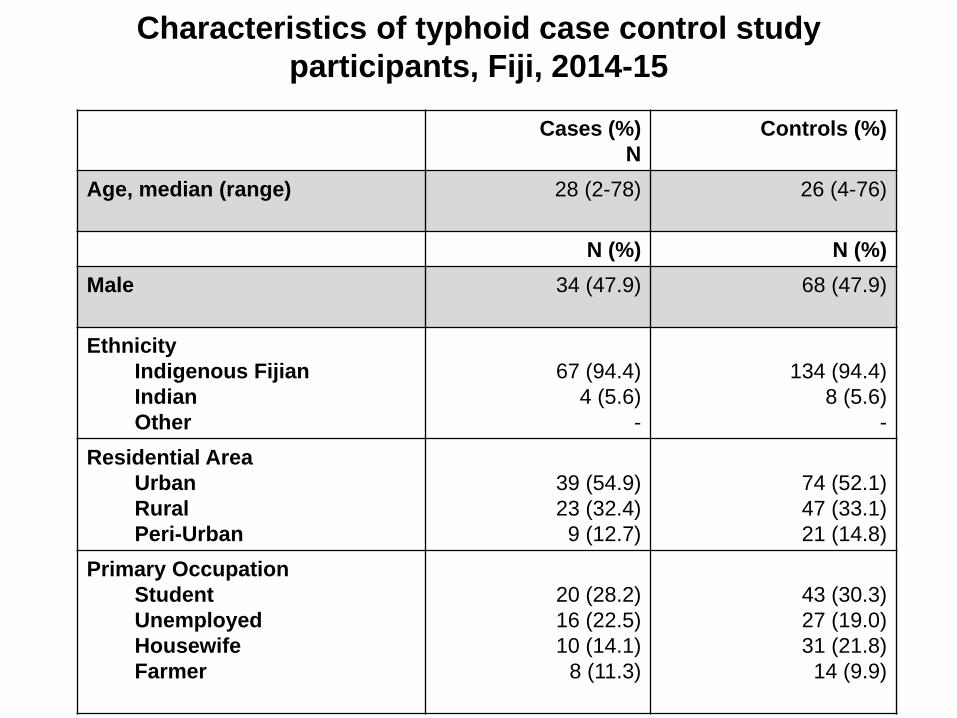
Characteristics of typhoid case control study
participants, Fiji, 2014-15
Cases (%)
N
Controls (%)
Age, median (range) 28 (2-78) 26 (4-76)
N (%) N (%)
Male 34 (47.9) 68 (47.9)
Ethnicity
Indigenous Fijian
Indian
Other
67 (94.4)
4 (5.6)
-
134 (94.4)
8 (5.6)
-
Residential Area
Urban
Rural
Peri-Urban
39 (54.9)
23 (32.4)
9 (12.7)
74 (52.1)
47 (33.1)
21 (14.8)
Primary Occupation
Student
Unemployed
Housewife
Farmer
20 (28.2)
16 (22.5)
10 (14.1)
8 (11.3)
43 (30.3)
27 (19.0)
31 (21.8)
14 (9.9)

n (%) participants
Risk factor Cases
(n=71)
Controls
(n=142)
Matched odds
ratio
(95% CI) P-value
Family History
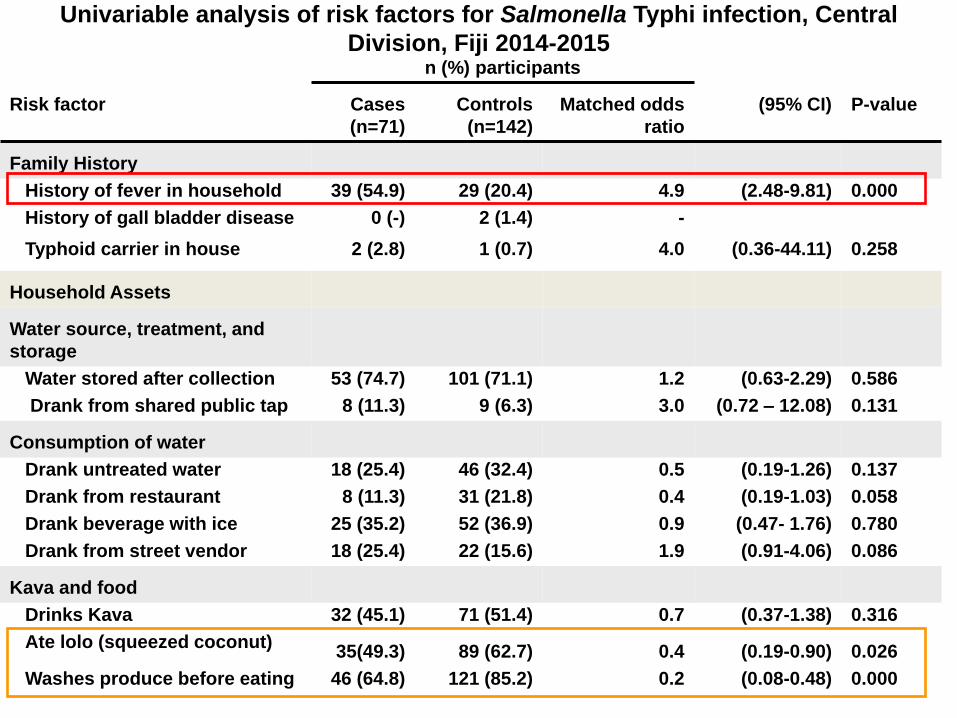
History of fever in household 39 (54.9) 29 (20.4) 4.9 (2.48-9.81) 0.000
History of gall bladder disease 0 (-) 2 (1.4) -
Typhoid carrier in house 2 (2.8) 1 (0.7) 4.0 (0.36-44.11) 0.258
Household Assets
Water source, treatment, and
storage
Water stored after collection 53 (74.7) 101 (71.1) 1.2 (0.63-2.29) 0.586
Drank from shared public tap 8 (11.3) 9 (6.3) 3.0 (0.72 – 12.08) 0.131
Consumption of water
Drank untreated water 18 (25.4) 46 (32.4) 0.5 (0.19-1.26) 0.137
Drank from restaurant 8 (11.3) 31 (21.8) 0.4 (0.19-1.03) 0.058
Drank beverage with ice 25 (35.2) 52 (36.9) 0.9 (0.47- 1.76) 0.780
Drank from street vendor 18 (25.4) 22 (15.6) 1.9 (0.91-4.06) 0.086
Kava and food
Drinks Kava 32 (45.1) 71 (51.4) 0.7 (0.37-1.38) 0.316
Ate lolo (squeezed coconut)35(49.3) 89 (62.7) 0.4 (0.19-0.90) 0.026
Washes produce before eating 46 (64.8) 121 (85.2) 0.2 (0.08-0.48) 0.000
Univariable analysis of risk factors for Salmonella Typhi infection, Central
Division, Fiji 2014-2015
n (%) participants
Risk factor Cases
(n=71)
Controls
(n=142)
Matched odds
ratio
(95% CI) P-value
Family History
History of fever in household 39 (54.9) 29 (20.4) 4.9 (2.48-9.81) 0.000
History of gall bladder disease 0 (-) 2 (1.4) -
Typhoid carrier in house 2 (2.8) 1 (0.7) 4.0 (0.36-44.11) 0.258
Household Assets
Water source, treatment, and
storage
Water stored after collection 53 (74.7) 101 (71.1) 1.2 (0.63-2.29) 0.586
Drank from shared public tap 8 (11.3) 9 (6.3) 3.0 (0.72 – 12.08) 0.131
Consumption of water
Drank untreated water 18 (25.4) 46 (32.4) 0.5 (0.19-1.26) 0.137
Drank from restaurant 8 (11.3) 31 (21.8) 0.4 (0.19-1.03) 0.058
Drank beverage with ice 25 (35.2) 52 (36.9) 0.9 (0.47- 1.76) 0.780
Drank from street vendor 18 (25.4) 22 (15.6) 1.9 (0.91-4.06) 0.086
Kava and food
Drinks Kava 32 (45.1) 71 (51.4) 0.7 (0.37-1.38) 0.316
Ate lolo (squeezed coconut)35(49.3) 89 (62.7) 0.4 (0.19-0.90) 0.026
Washes produce before eating 46 (64.8) 121 (85.2) 0.2 (0.08-0.48) 0.000
Univariable analysis of risk factors for Salmonella Typhi infection, Central
Division, Fiji 2014-2015
n (%) participants
Risk factor Cases Controls Matched OR (95% CI) P-value
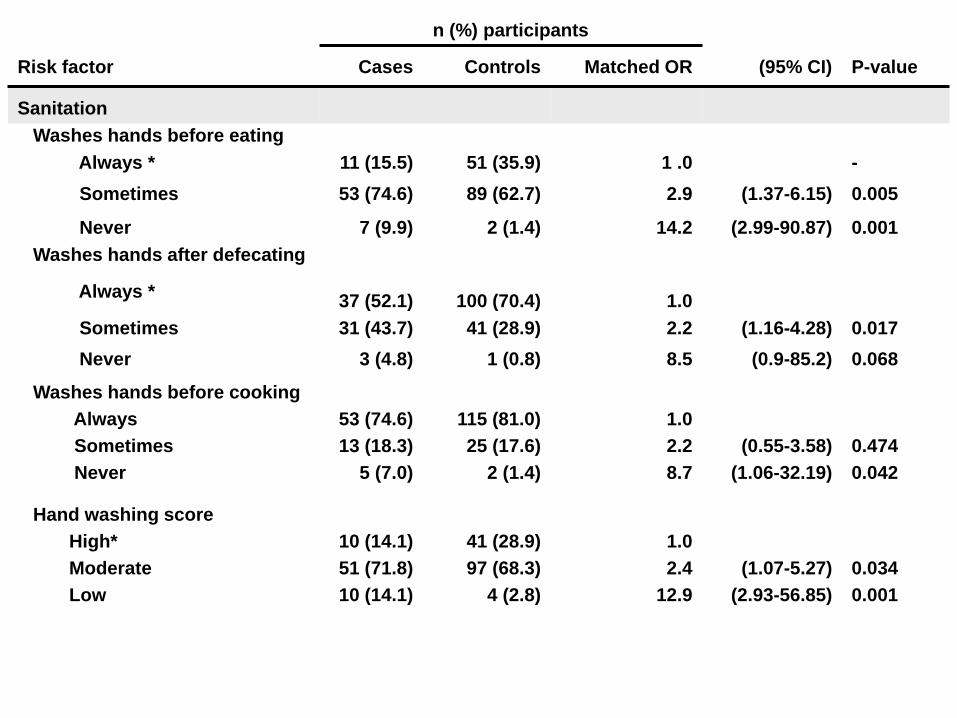
Sanitation
Washes hands before eating
Always * 11 (15.5) 51 (35.9) 1 .0 -
Sometimes 53 (74.6) 89 (62.7) 2.9 (1.37-6.15) 0.005
Never 7 (9.9) 2 (1.4) 14.2 (2.99-90.87) 0.001
Washes hands after defecating
Always *37 (52.1) 100 (70.4) 1.0
Sometimes 31 (43.7) 41 (28.9) 2.2 (1.16-4.28) 0.017
Never 3 (4.8) 1 (0.8) 8.5 (0.9-85.2) 0.068
Washes hands before cooking
Always
Sometimes
Never
53 (74.6)
13 (18.3)
5 (7.0)
115 (81.0)
25 (17.6)
2 (1.4)
1.0
2.2
8.7
(0.55-3.58)
(1.06-32.19)
0.474
0.042
Hand washing score
High*
Moderate
Low
10 (14.1)
51 (71.8)
10 (14.1)
41 (28.9)
97 (68.3)
4 (2.8)
1.0
2.4
12.9
(1.07-5.27)
(2.93-56.85)
0.034
0.001
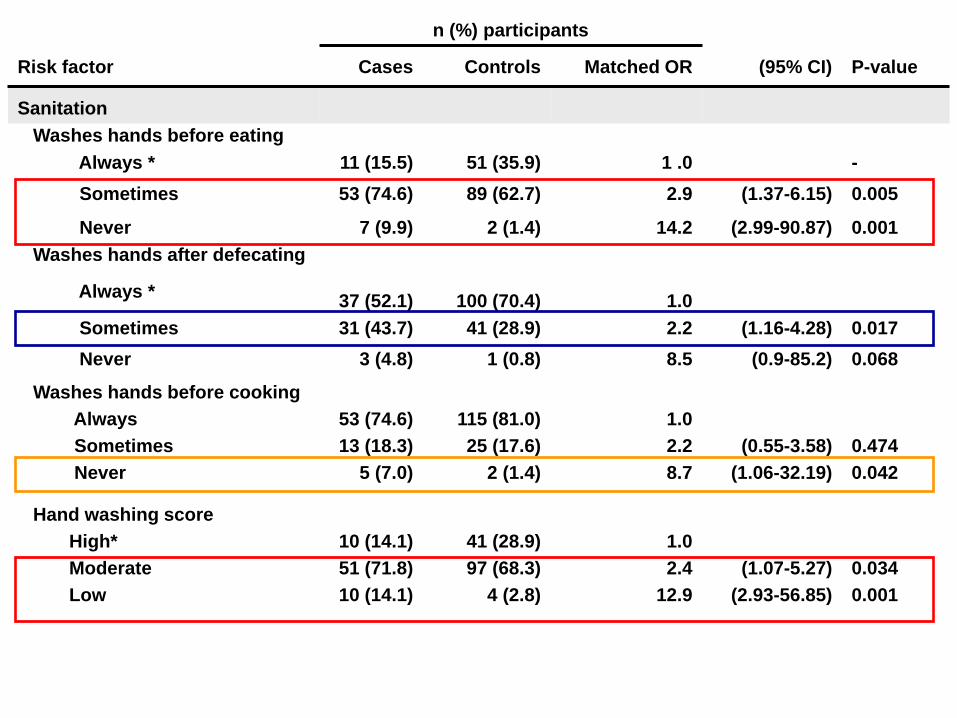
n (%) participants
Risk factor Cases Controls Matched OR (95% CI) P-value
Sanitation
Washes hands before eating
Always * 11 (15.5) 51 (35.9) 1 .0 -
Sometimes 53 (74.6) 89 (62.7) 2.9 (1.37-6.15) 0.005
Never 7 (9.9) 2 (1.4) 14.2 (2.99-90.87) 0.001
Washes hands after defecating
Always *37 (52.1) 100 (70.4) 1.0
Sometimes 31 (43.7) 41 (28.9) 2.2 (1.16-4.28) 0.017
Never 3 (4.8) 1 (0.8) 8.5 (0.9-85.2) 0.068
Washes hands before cooking
Always
Sometimes
Never
53 (74.6)
13 (18.3)
5 (7.0)
115 (81.0)
25 (17.6)
2 (1.4)
1.0
2.2
8.7
(0.55-3.58)
(1.06-32.19)
0.474
0.042
Hand washing score
High*
Moderate
Low
10 (14.1)
51 (71.8)
10 (14.1)
41 (28.9)
97 (68.3)
4 (2.8)
1.0
2.4
12.9
(1.07-5.27)
(2.93-56.85)
0.034
0.001
n (%) participants
Risk factor Cases Controls Matched OR (95% CI) P-value
Environment
Heavy to moderate rainfall-
2 months
36 (50.7) 59 (41.6) 1.9 (0.87- 3.95) 0.108
Nearest river/stream flooded –
2 months
13 (18.3) 9 (6.3) 5.0 (1.58-15.71) 0.006
Livestock above where water
is collected
6 (8.5) 4 (2.8) 4.7 (0.91-23.82) 0.066
Dams higher in river basin 33 (46.5) 51 (35.9) 2.8 (1.11 – 7.19) 0.029
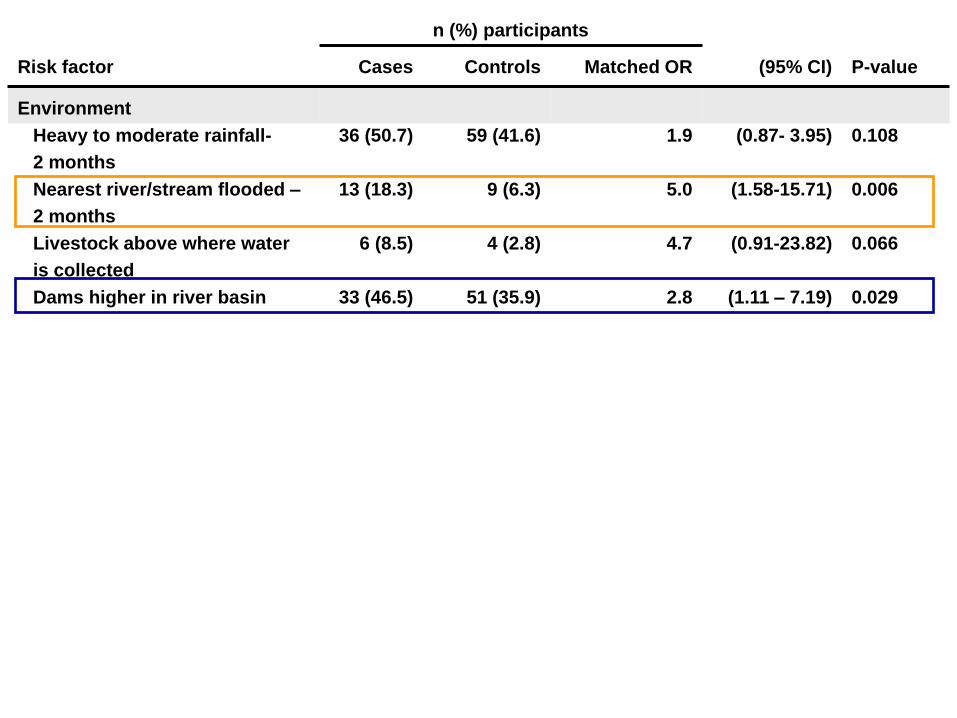
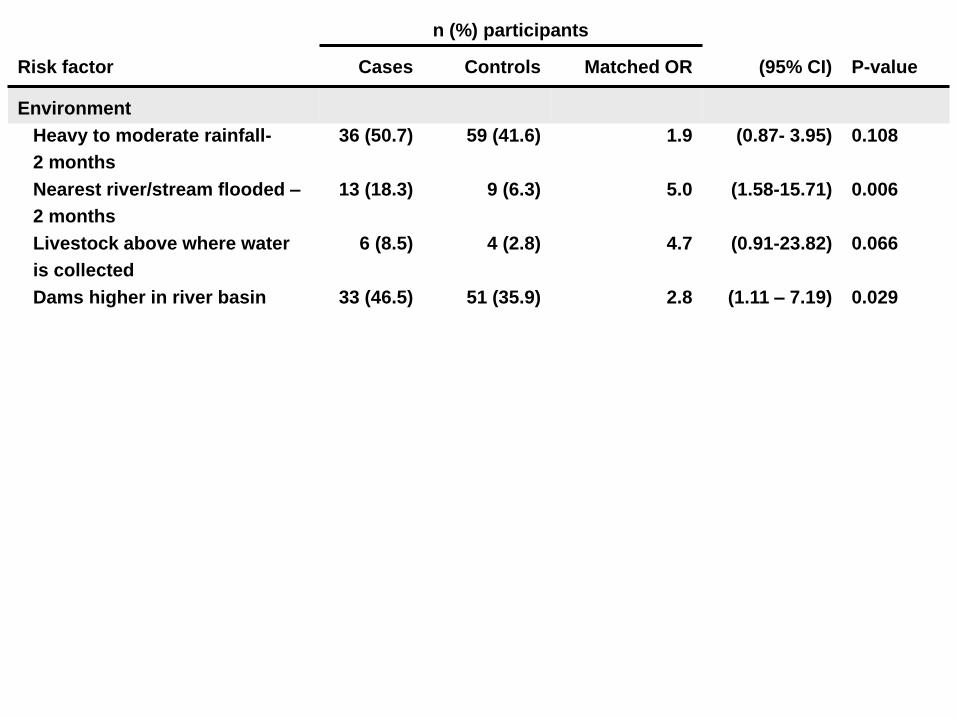
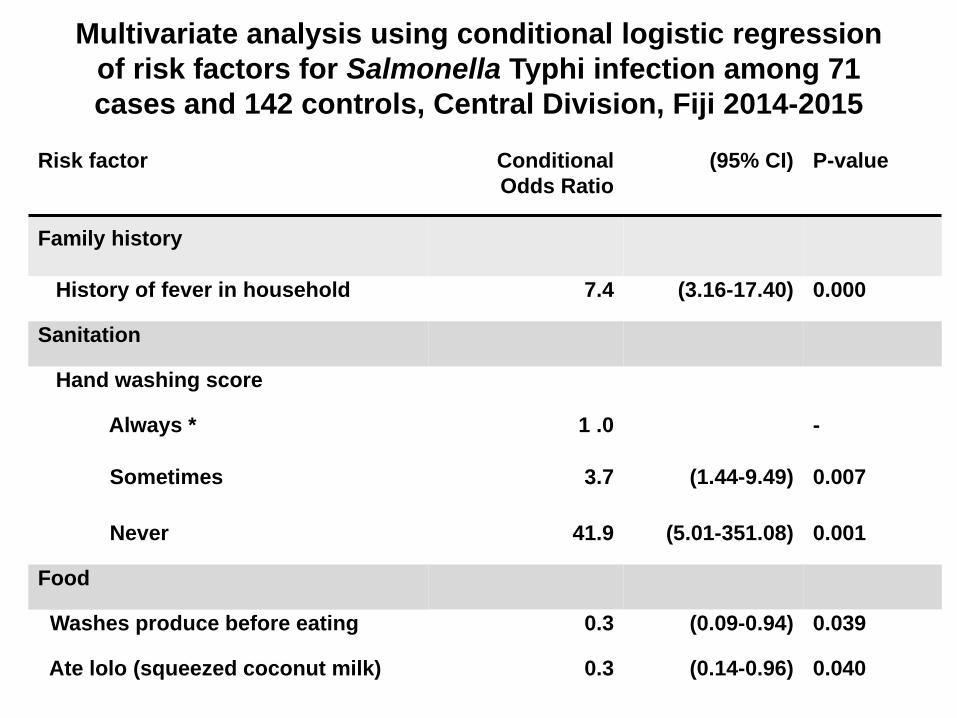
Risk factor Conditional
Odds Ratio
(95% CI) P-value
Family history
History of fever in household 7.4 (3.16-17.40) 0.000
Sanitation
Hand washing score
Always * 1 .0 -
Sometimes 3.7 (1.44-9.49) 0.007
Never 41.9 (5.01-351.08) 0.001
Food
Washes produce before eating 0.3 (0.09-0.94) 0.039
Ate lolo (squeezed coconut milk) 0.3 (0.14-0.96) 0.040
Multivariate analysis using conditional logistic regression
of risk factors for Salmonella Typhi infection among 71
cases and 142 controls, Central Division, Fiji 2014-2015


• Enrollment of cases has been slower than projected
• Alternate etiologies of febrile illness –typhoid cases may have been missed during dengue outbreak due to under utilization of blood cultures
• Homogeneity of risk factors
• Need to continue to study to get a more definitive picture of typhoid fever risks in Fiji
Challenges
Conclusions
• Results suggest a mixture of behavioral, infrastructural, and environmental risk factors.
– Sanitation practices
– Infrastructure in terms of water supply
– Flooding and other environmental conditions
• Improvements in water, sanitation, hygiene infrastructure and practices.
• Sample size is still small – continuation of study with multivariate analysis
Acknowledgements
Murdoch Children's Research
Institute
Kim Mulholland
Lanieta Naucukidi
Varanisese Rosa
Edith Cowan University
Aaron Jenkins
Fiji Ministry of Health
Mike Kama
Aalisha Sahu Khan
University of Otago
John. A. Crump
Susan Jack
Debasish Saha
Fiji Health Sector Support
Program
Kylie Jenkins
Colonial War Memorial Hospital
Silo Baro
University of Melbourne
Richard Strugnell
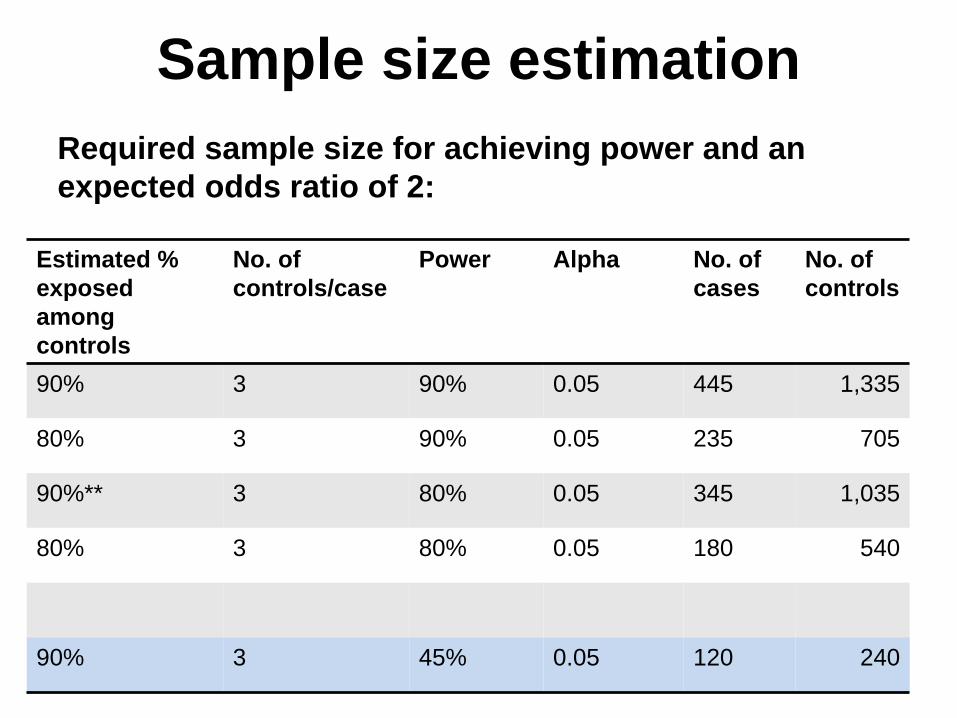
Sample size estimation
Required sample size for achieving power and an
expected odds ratio of 2:
Estimated %
exposed
among
controls
No. of
controls/case
Power Alpha No. of
cases
No. of
controls
90% 3 90% 0.05 445 1,335
80% 3 90% 0.05 235 705
90%** 3 80% 0.05 345 1,035
80% 3 80% 0.05 180 540
90% 3 45% 0.05 120 240