Embed Size (px)
Citation preview

JOURNAL OF
Contaminant Hydrology
E L S E V I E R Journal of Contaminant Hydrology 24 (1997) 205 -219
Using flow interruption to identify factors causing nonideal contaminant transport
Mark L. Brusseau a,b,., Qinhong Hu a, Rajesh Srivastava a
a Department of Soil, Water, and Environmental Science, University of Arizona, Tucson, AZ 85721, USA b Department of Hydrology and Water Resources, University of Arizona, Tucson, AZ 85721, USA
Received 25 July 1995; accepted 1 March 1996
A b s t r a c t
The transport and fate of many contaminants in subsurface systems can be influenced by several rate-limited processes, such as rate-limited sorption, diffusional mass transfer, and transformation reactions. Identification of the controlling process in such systems is often difficult, and is confounded by the possible influence of additional factors such as nonlinear or hysteretic sorption. We present a relatively simple method, flow interruption, that can be used to discrimi- nate between various sets of processes. The application of the method is illustrated with results obtained from experiments performed for selected systems. Specific process-pairs investigated include physical nonequilibrium vs. physical heterogeneity, rate-limited sorption vs. nonlinear sorption, and sorption vs. transformation reactions. The results show that, while both physical nonequilibrium and physical heterogeneity can cause enhanced spreading or dispersion, only the former causes a noticeable concentration perturbation upon imposition of flow interruption under typical conditions. In addition, while both rate-limited sorption and nonlinear sorption can cause breakthrough curves to exhibit tailing, only rate-limited sorption induces a concentration perturba- tion upon imposition of flow interruption. The information obtained from applying flow interrup- tion can be used to assist in the planning of additional, process-specific experiments and to help identify appropriate mathematical models to be used for transport simulation.
Keywords: contamination; sorption; transformation; dispersion; spatial variability
1. I n t r o d u c t i o n
The transport and fate o f many contaminants in subsurface sys tems can be inf luenced
by several ra te- l imi ted processes , such as ra te- l imi ted sorption, diffusional mass transfer,
* Corresponding author.
0169-7722/97/$17.00 Copyright © 1997 Elsevier Science B.V. All rights reserved. PII S0169-7722(96)00009-5

206 M.L. Brusseau et al. / Journal of Contaminant Hydrology 24 (1997) 205-2 l 9
and transformation reactions. Identification of the controlling process in such systems is often difficult, and is confounded by the possible influence of additional factors such as nonlinear or hysteretic sorption. Discrimination among various rate-limited and nonlin- ear processes is often based on inspection of the shape of breakthrough curves. For example, the influence of rate-limited sorption on transport is clearly different from that of nonlinear sorption, as illustrated in Fig. 1A. Both breakthrough curves are asymmetri-
Z _o
n- I- Z h=
0 Z 0 o w _> I.- < ,-1 W
1[
0.8
0.6
0.4
0.2
0 ~ 0
i i ........ NONLINEAR, INSTANT.
, R A T E - L I M I T E D
I I J 5 10 15
PORE VOLUMES
A
20
z o_ I - ,< n,- I - z I.u o z O o LU _> I.-
_1 uJ ¢y-
0.8
0.6
- - L INEAR, R A T E - L I M I T E D
......... NONLINEAR, I N S T A N T A N E O U S 04 0.2 /
0 ' .__ I 0 2 4 6 8
B
10 12
PORE V O L U M E S
Fig. 1. Simulat ions for transport influenced by instantaneous, nonlinear sorption and rate-limited, linear sorption: (A) "'large-volume'" breakthrough curves; and (B) " s m a l l - v o l u m e " breakthrough curves. Parameters values used for this simulation are: P = 50, R 2, N = 0.5. Adapted from Brusseau (1995).

M.L. Brusseau et al. / Journal of Contaminant Hydrology 24 (1997) 205-219 207
cal, and both exhibit tailing. However, the breakthrough curve influenced by rate-limited sorption is self-similar, in that tailing is exhibited in the approach to relative concentra- tion of 1 and 0 (i.e. both the arrival and elution waves, respectively). Conversely, the breakthrough curve influenced by nonlinear sorption exhibits tailing only for the elution wave.
The difference shown in Fig. 1A is apparent, however, only for large-pulse break- through curves. As illustrated in Fig. 1B, the difference in shape is not apparent for "small-volume" breakthrough curves, such as those obtained with small input pulses or those influenced by mass loss. Both breakthrough curves presented in Fig. IB appear to exhibit tailing only for the elution wave. The difference in position is due to the "early breakthrough" associated with rate-limited sorption. However, without an independent measure of the magnitude of sorption, the position difference cannot be used to differentiate between the two processes. Other examples of process-pairs that are often difficult to differentiate are physical nonequilibrium vs. physical heterogeneity and transformation loss vs. hysteretic/irreversible sorption. We illustrate a simple method, based on the flow-interruption technique, that can be used to help identify the control- ling factor in systems such as those described above. The application of the method is illustrated with results obtained from experiments performed for selected systems.
2. Materials and methods
2.1. Theory
Various interruption-based techniques have been developed for parameter determina- tion and process identification. For example, "arrested-flow" chromatography is used to measure diffusion (Knox and McLaren, 1964), and "batch-interruption" tests have been used to discriminate between film mass transfer and intraparticle mass transfer in batch reactors (Kunin and Myers, 1947; Kressman and Kitchener, 1949; Weber and Morris, 1963). Brusseau et al. (1989) developed a flow-interruption method for use in investigat- ing and measuring rate-controlled processes in soil systems. In related work, Murali and Aylmore (1980) discussed the influence of non-constant flow on solute transport in aggregated soil. More recently, the flow interruption method of Brusseau et al. (1989) has been used to investigate diffusion and transport of nonreactive solute in aggregated media (Koch and Fliihler, 1993; Hu and Brusseau, 1995), surfactant-enhanced solubiliza- tion of residual immiscible liquids (Pennell et al., 1993), and transport of reactive solutes (Kookana et al., 1994; Wang et al., 1995).
For the present study, we will use models based on the work presented by Brusseau et al. (1989). The models include provisions for rate-limited sorption or physical nonequilibrium (e.g., diffusive mass transfer between advective and nonadvective water) processes, which are described with the two-domain approach. They also include nonlinear sorption, described by use of the Freundlich equation, and first-order transfor- mation reactions. Description of the governing equations can be found elsewhere (Brusseau et al., 1989; Brusseau, 1995).

208 M.L. Brusseau et al. / Journal of Contaminant Hydrology 24 (1997) 205-219
Four nondimensional parameters that will be used in the analysis are defined below:
P = c , L / D (1)
R = l + ( p / n ) K (2)
R n = 1 q- ( p / r t ) K f C ~ N 1 (3)
T = tc,,/L (4)
where v is pore-water velocity; L is system length; D is the dispersion coefficient; t is time; p is soil bulk density; n is porosity; K is the equilibrium sorption coefficient; Kf is the Freundlich sorption coefficient; N is the Freundlich intensity parameter; and C o is input concentration. The PEclet number, P, is essentially a ratio of advective flux vs. dispersive flux. It is an indicator of the degree of spreading associated with transport of a solute pulse, with large values indicating little spreading (sharp solute waves). The retardation factor, R, represents the effect of sorption on transport, and the pore volume, T, is a nondimensional time parameter.
2.2. Materials
Analytical grade pentafluorobenzoate (PFBA), cadmium nitrate, and 2,4-dichloro- phenoxyacetic acid (2,4-D) were purchased from Aldrich Chemical Co., and atrazine from Supelco Inc. 3H20 and ~4C 2 ,4-D were purchased from New England Nuclear and Sigma Chemical Co., respectively; ~4C atrazine was provided as a gift from Ciba Corp. Two soils and a synthetic aggregated medium were used for the experiments. The first soil is a sandy loam (sand: 77.7%, silt: 18.1%, clay: 4.2%, organic carbon: 1.4%) and will be referred to as the Mixture soil. It was collected from a field that had a history of 2,4-D use, and previous experiments have demonstrated the existence of a microbial population capable of degrading 2,4-D (Estrella et al., 1993). The second soil (Hayhook) is a sandy loam with an organic carbon content that is lower than that of the first soil (sand: 85.5%, silt: 4.3%, clay: 10.2%, organic carbon: 0.2%). Both soils were sieved through a l- or 2-ram mesh prior to use.
Preparative chromatography columns made of precision-bore stainless steel (2.l-cm i.d., and 7.0 cm in length; Alltech Associates Inc.) were used in the experiments employing homogeneously packed soil. The columns are designed to have a minimum void volume in the endplates. The columns were incrementally packed with air-dry soil to obtain uniform bulk densities. The packed columns were slowly wetted from the bottom to establish saturation and ~ 50 pore volumes of electrolyte solution (0.005 M CaCI 2) were pumped through them prior to their use. For the experiment involving cadmium transport in Hayhook soil, a preparative chromatography column made of precision-bore borosilicate glass (2.5-cm i.d., and 5.0 cm in length; Kontes) was employed, with 0.01 M KNO 3 as the electrolyte.
The synthetic aggregated media used in this study consisted of porous spheres with radii of 0.55 cm. Details of the technique used to prepare the water-stable spheres from kaolinite clay suspension were described by Rao et al. (1980). The average porosity of these spheres is 0.36 cm3/cm 3. The porous spheres were saturated with electrolyte solution (0.005 M CaC1 z) for several days and were packed into a Plexiglas column

M.L. Brusseau et al. / Journal o f Contaminant Hydrology 24 (1997) 205-219 209
(7.9-cm diameter, 15.0-cm length) along with the Mixture soil. The column was packed in incremental steps in the presence of the electrolyte solution to establish uniform bulk density. This medium consisted of a distinct bimodal pore-size distribution, comprised of microporosity within the porous spheres and macroporosity between the spheres.
2.3. Methods
The apparatus and methods employed for the miscible displacement studies were similar to those used previously (Brusseau et al., 1990; Hu and Brusseau, 1994). One single-piston high-performance liquid chromatographic (HPLC) pump (SSI Model 300) was connected to the column, with a three-way switching valve placed in-line to facilitate switching between solutions with and without the solute of interest. The systems were designed so that the solute contacted only stainless steel, glass, or Plexiglas.
A flow-through, variable-wavelength UV detector (Gilson, Model 115) was used to continuously monitor concentrations of PFBA and atrazine in the column effluent. Output was recorded on a strip-chart recorder (Fisher, Recordall Series 5000). Effluent fractions were collected with an automated fraction collector (Pharmacia RediFrac) for experiments with cadmium, 3H20, 14C atrazine, and 14C 2,4-D. The concentration of cadmium was measured by use of an Atomic Absorption Spectrophotometer (Perkin- Elmer 503). The activities for 3H20, 14C atrazine, and 14C 2,4-D in the effluent samples were analyzed by radioassay using liquid scintillation counting (Packard Tri-Carb Liquid Scintillation Analyzer, Model 1600TR). Flow rates of 5.0 or 1.5 m l /min were used for the experiments. They correspond to pore-water velocities of ~ 20 and ~ 60 c m / h for the aggregated-media and small packed columns, respectively. These velocities are representative of forced-gradient systems.
3. Results and discussion
3.1. Transport in homogeneous porous media
Flow interruption will have an impact only for systems in a state of disequilibrium, as for example, caused by a rate-controlled process. Hence, imposition of flow interruption should not influence the breakthrough curve obtained for transport of a nonreactive solute in a homogeneous porous medium. This was substantiated by the results obtained from a series of simulations performed for cases representative of homogeneous soil, i.e. very small dispersion coefficients and large Prclet numbers (data not shown). For illustration, a measured breakthrough curve for transport of pentafluorobenzoate through the sandy, homogeneously packed Mixture soil is presented in Fig. 2A. A flow interruption of 1 h had no effect on the effluent concentration profile.
It is important to note that breakthrough curves for homogeneous systems can be influenced by flow interruption through the action of longitudinal (molecular) diffusion, as discussed by Brusseau et al. (1989). The importance of this effect, which can

210 M.L Brusseau et a l . / Journal of Contaminant Hydrology 24 (1997) 205 219
z o I - .<
I - 2: uJ
z o o uJ
0,8
0.6
0.4
0.2
(~:,5> o o o o o @ O O, ,.'3S, .J
' i)
! :i
~ . . . . . Flow Interruption
e
4 6 8
PORE VOLUMES
10
z 0 F- < B: Z LU (J z o o uJ >__ I - ,¢ . - I UJ n-
0.8
0.6
0.4
0.2 ' )
o! J o
©
0
77
B
F l o w I n t e r r u p t i o n ~ ~e
4 6 8 10 12
PORE V O L U M E S
Fig. 2. A. Measured breakthrough curve for transport of pentafluorobenzoate through a column homoge neously packed with Mixture soil; the interruption time is 1 h, the residence time is 0.1 h, and the PEeler number is 59. B. Measured breakthrough curve for transport of 3H20 through a column homogeneously packed with Hayhook soil; the interruption time is 1 h, the residence time is 0.1 h, and the P~clet number is
12.
inf luence all systems, is dependent on the magni tude o f the diffusivi ty and on the t iming
and length o f interruption. The exper iments were des igned so that longitudinal diffusion
was not o f s igni f icance for the systems analyzed in the for thcoming discussion. This was accompl i shed by s topping the f low at re la t ive-concent ra t ion values where in the intracol-
umn concent ra t ion prof i le prec luded signif icant d i f fus ive flux (Brusseau et al., 1989).
M.L. Brusseau et al. / Journal of Contaminant Hydrology 24 (1997) 205-219 211
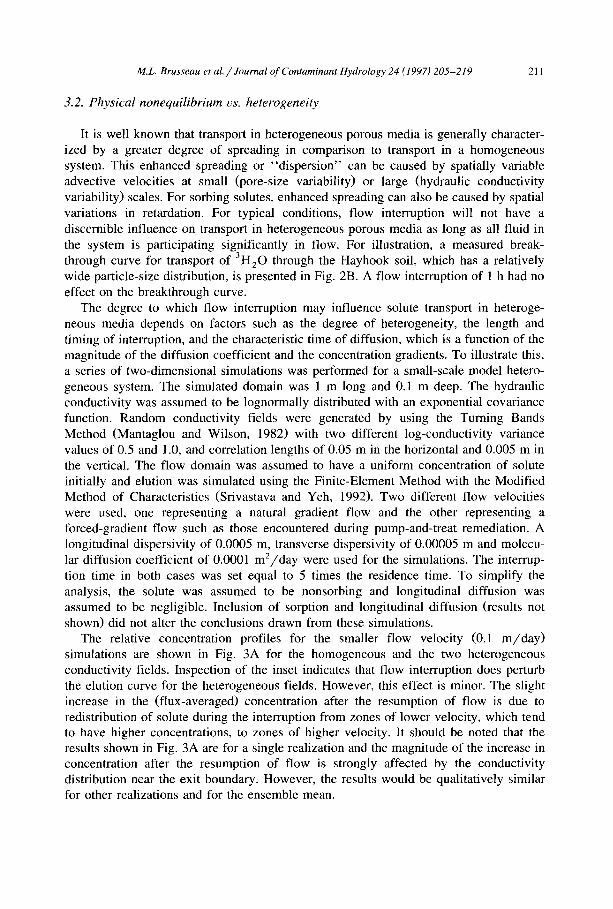
3.2. Phys ica l nonequi l ibr ium vs. heterogeneity
It is well known that transport in heterogeneous porous media is generally character- ized by a greater degree of spreading in comparison to transport in a homogeneous system. This enhanced spreading or "dispersion" can be caused by spatially variable advective velocities at small (pore-size variability) or large (hydraulic conductivity variability) scales. For sorbing solutes, enhanced spreading can also be caused by spatial variations in retardation. For typical conditions, flow interruption will not have a discernible influence on transport in heterogeneous porous media as long as all fluid in the system is participating significantly in flow. For illustration, a measured break- through curve for transport of 3H20 through the Hayhook soil, which has a relatively wide particle-size distribution, is presented in Fig. 2B. A flow interruption of 1 h had no effect on the breakthrough curve.
The degree to which flow interruption may influence solute transport in heteroge- neous media depends on factors such as the degree of heterogeneity, the length and timing of interruption, and the characteristic time of diffusion, which is a function of the magnitude of the diffusion coefficient and the concentration gradients. To illustrate this, a series of two-dimensional simulations was performed for a small-scale model hetero- geneous system. The simulated domain was 1 m long and 0.1 m deep. The hydraulic conductivity was assumed to be lognormally distributed with an exponential covariance function. Random conductivity fields were generated by using the Turning Bands Method (Mantaglou and Wilson, 1982) with two different log-conductivity variance values of 0.5 and 1.0, and correlation lengths of 0.05 m in the horizontal and 0.005 m in the vertical. The flow domain was assumed to have a uniform concentration of solute initially and elution was simulated using the Finite-Element Method with the Modified Method of Characteristics (Srivastava and Yeh, 1992). Two different flow velocities were used, one representing a natural gradient flow and the other representing a forced-gradient flow such as those encountered during pump-and-treat remediation. A longitudinal dispersivity of 0.0005 m, transverse dispersivity of 0.00005 m and molecu- lar diffusion coefficient of 0.0001 m2/day were used for the simulations. The interrup- tion time in both cases was set equal to 5 times the residence time. To simplify the analysis, the solute was assumed to be nonsorbing and longitudinal diffusion was assumed to be negligible. Inclusion of sorption and longitudinal diffusion (results not shown) did not alter the conclusions drawn from these simulations.
The relative concentration profiles for the smaller flow velocity (0.1 m/day ) simulations are shown in Fig. 3A for the homogeneous and the two heterogeneous conductivity fields. Inspection of the inset indicates that flow interruption does perturb the elution curve for the heterogeneous fields. However, this effect is minor. The slight increase in the (flux-averaged) concentration after the resumption of flow is due to redistribution of solute during the interruption from zones of lower velocity, which tend to have higher concentrations, to zones of higher velocity. It should be noted that the results shown in Fig. 3A are for a single realization and the magnitude of the increase in concentration after the resumption of flow is strongly affected by the conductivity distribution near the exit boundary. However, the results would be qualitatively similar for other realizations and for the ensemble mean.

212 M.L. Brusseau et al. / Journal of Contaminant Hydrology 24 (1997) 205-219
Z _o I..--
n- F-
Z
Z 0
_>
uJ n-
1.0
0 .8
0 .6
0 .4
0 .2
0.0
1.0
.......... ':" ":":" "...'............. ~ A
..", \ H O M O G E N E O U S
.... ~ , \ . . . . . . . . . VARIANCE = 0.5
-""'.~.,.: \ ....................... VARIANCE = 1.0 " . , ~
" i ~ i 4.
o.~o ' ~:~ ' ~'.~ " ~.3 " ' - , ~ : ....... , , ' ~ ~ , _ " ~ , ~ , ~ , , - - .
0.6
Z O F- 08 ,< Q: I-- Z 0.6 IJJ
Z O ¢-~ 0 .4 U.I _> I - .< .._I 0.2 IJJ QC
0.0 0.6
0 .8 1.0
P O R E V O L U M E S
....... • "...-..:.:.,...,....-.:., ... - ... ,.....,.,, " . . . , . . . ,
• . j . . . . . . . . . .
1.2 1 .4
B
H O M O G E N E O U S
VARIANCE = 0.5
VARIANCE = 1.0
0 . 1 6 ~ . - " .
I ' ' ' "
' ~,. ~ ~ "~ : ~ ~ " " " , '.. , , ".. , ". " , ". .... " ' , ......
0 , 1 6 t ~ • " . ,
0.8 1.0 1.2 1.4
PORE VOLUMES Fig. 3. Simulated elution curves for transport of a nonreactive solute through homogeneous and heterogeneous porous media: (A) flow velocity 0.1 m/day , residence time 10 days, and interruption time 50 days; and (B) flow velocity 1.0 m/day , residence time 1 day, and interruption time 5 days.
Results for the higher-velocity (1.0 m/day) simulations are shown in Fig. 3B. The effect of flow interruption is similar but less pronounced in this case because the interruption time was smaller. The magnitudes of the interruption time and the character- istic time of diffusion partly control the impact of flow interruption on transport. Given the conditions typical to many field-scale problems, there would be little, if any, discernible effect of flow interruption on measured concentration profiles.

M.L. Brusseau et al. / Journal of Contaminant Hydrology 24 (1997) 205-219 213
Z 0 0.8 I -
n - I-- Z o.s LU C~ Z 0
LIJ 0,4 _> I -
.-I LILI 0.2 n"
0
0 0 0
0
0 0 0
0 0 Q
0 0
0 0 0
o Flow Interruption ~- Q
, I J J 2 4 6
PORE VOLUMES 10 12
Fig. 4. Flow interruption for transport of a nonreactive tracer in a structured soil: measured breakthrough for transport of 3H20 in an aggregated medium; the interruption time is 1 h and the residence time is 0.66 h.
In many structured porous media, there can exist significant volumes of fluid that do not participate significantly in flow. For example, regions of "dead" or "immobile" water may be associated with aggregated, macroporous, fractured, or unsaturated media. Under certain conditions, a state of disequilibrium may exist between the flowing and immobile water, with mass transfer of solute between these domains being rate limited. This phenomenon is often referred to as physical nonequilibrium. In such systems, flow interruption will influence transport (Murali and Aylmore, 1980; Brusseau et al., 1989; Koch and Fliihler, 1993; Hu and Brusseau, 1995). This is illustrated in Fig. 4, wherein is presented a measured breakthrough curve for transport of 3H20 through the aggregated medium. A flow interruption of 1 h caused a perturbation in the effluent concentration profile.
Enhanced spreading can be caused by both heterogeneity and physical nonequilib- rium. In many cases, the shapes of breakthrough curves and magnitudes of Prclet numbers may be similar, which complicates differentiation between the two factors. This is illustrated by comparing the fronts of the breakthrough curves presented in Fig. 2B and 4, both of which exhibit some degree of tailing. In reality, physical nonequilibrium and heterogeneity are limiting cases of a continuum, with the magnitude of non-flowing fluid as the primary criterion of differentiation. Furthermore, it is well known that the definition of "non-flowing" fluid is system and condition dependent. Thus, differentia- tion between physical nonequilibrium and heterogeneity is an artificial construct used to aid description of solute transport. However, as shown by the examples presented in this section, it is possible for practical purposes to use flow interruption to identify systems in which significant volumes of non-flowing fluid exist and, concomitantly, for which diffusive mass transfer may be important.

214 M.L. Brusseau et al. / Journal of Contaminant Hydrology 24 (1997) 205-219
z o_ I.-
I--. z ILl o z o o i.u
I--
. J [lU e¢"
0.8
0.6
0.4
0.2 Interrupt ion
A
I I 2 4 6 8 10
Z 0__ 0.8 I - ,¢ n,. I - Z 0.6 ,-~ U.I , ~
o
I,LI 0.4
U,I 0.2 e¢-
o , ~ - - o
PORE V O L U M E S
B
:3
~, F l o w Interrupt ion
i ' ( ~ • • • • • • • ,e • • ~
1 O0 200 3O0 4OO
PORE V O L U M E
Fig. 5. Flow interruption for transport of a nonlinearly sorbing solute: (A) simulated data; and (B) measured breakthrough curve for trans?ort of cadmium through a column homogeneously packed with Hayhook soil. The interruption time is 4 h ~,~nd the residence time is 0.1 h.
3.3. Rate- l imi ted us, nonl inear sorption
A simulated breakthrough curve for transport of a solute undergoing nonl inear , ins tantaneous sorption is presented in Fig. 5A. Inspect ion shows that a flow interrupt ion of 36 h had no effect on the eff luent concentra t ion profile. This is to be expected, g iven that there is no d isequi l ibr ium associated with nonl inear sorption. This is further il lustrated in Fig. 5B, in which is presented a measured breakthrough curve for transport

M.L. Brusseau et al. / Journal of Contaminant Hydrology 24 (1997) 205-219 215
of cadmium through the Hayhook soil. A flow interruption of 4 h had no impact on the effluent concentration profile. Complementary batch experiments revealed that sorption of cadmium by this soil was strongly nonlinear and that rate-limited sorption was of minor importance (Wang et al., 1995), as would be expected for a system wherein cation exchange is the primary sorption mechanism. In addition, physical nonequilibrium was not a factor for this system, as demonstrated by the negative results obtained for a flow interruption test with a nonreactive tracer (see Fig. 2B).
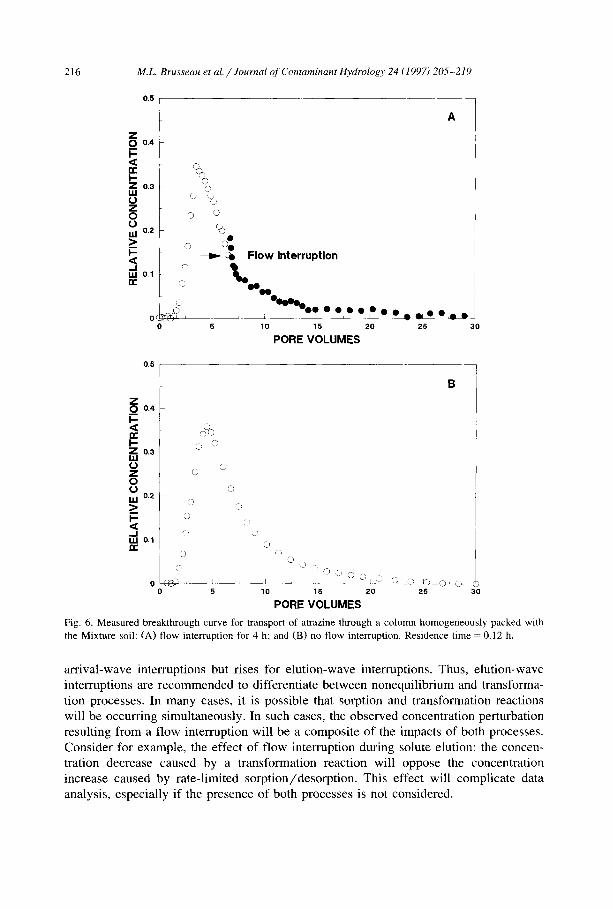
It is clear, based on the results presented above, that flow interruption had no impact for a system in which nonlinear sorption was the major cause of nonideal transport. Conversely, as discussed in detail by Brusseau et al. (1989), flow interruption can significantly influence systems for which rate-limited sorption is important. The sorp- tion/desorption process proceeds during the no-flow period, which results in a decrease in aqueous concentration for an arrival-wave interruption and a concentration increase for an elution-wave interruption. This is illustrated in Fig. 6A, where a flow interruption of 4 h had a large effect for transport of atrazine in a system controlled by rate-limited sorption. For comparison, transport of atrazine without flow interruption is shown in Fig. 6B.
It is possible to use breakthrough-curve shape to differentiate between the effects of rate-limited and nonlinear sorption on transport when large-pulse breakthrough curves are available, as discussed in the introduction (Fig. 1A). However, this is not possible for partial or small-volume breakthrough curves, as illustrated by the results presented in Fig. 1B and in Fig. 5B and 6B, where it is clear that the shapes are very similar. Flow interruption provides a means to differentiate between rate-limited and nonlinear sorp- tion for small-volume breakthrough curves (see Fig. 5B and 6A). Considering that most measured breakthrough curves are not of large volume, flow interruption should be very useful for discriminating between rate-limited and nonlinear sorption.
3.4. Transformation reactions vs. sorption reactions
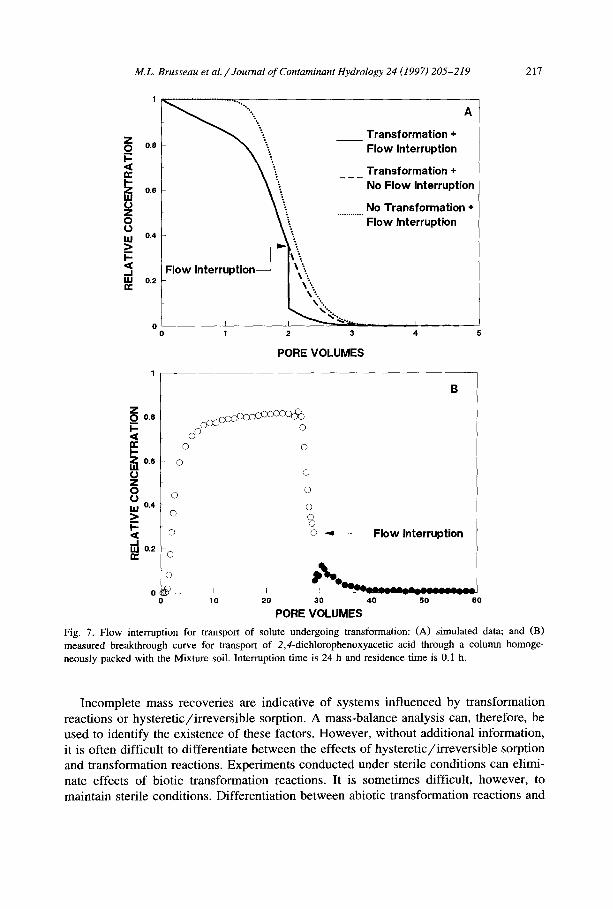
The imposition of a flow interruption during the transport of a solute undergoing a transformation reaction provides additional time for transformation to occur. Hence, the flow interruption will result in a reduction in aqueous concentration, which will be reflected by a drop in the effluent concentration profile upon resumption of flow. This is illustrated in Fig. 7A, in which are presented simulations for three cases: (1) transforma- tion with flow interruption; (2) transformation with no flow interruption; and (3) no transformation with flow interruption. A significant drop in concentration is clearly evident for case 1 (transformation with flow interruption). The influence of flow interruption is further illustrated in Fig. 7B, in which is presented a measured break- through curve for transport of 2,4-D through the Mixture soil. Previous work has shown that 2,4-D undergoes aerobic biodegradation in this system (Estrella et al., 1993). We are not aware of any previous applications of flow interruption to evaluate biodegrada- tion.
For transformation reactions, the concentration will drop for both arrival-wave and elution-wave interruptions. This behavior is different than that for systems influenced by rate-limited sorption or physical nonequilibrium, where the concentration drops for
216 M.L. Brusseau et al. / Journal of Contaminant Hydrology 24 (1997) 205-219
z o_ l- ,¢ n- I - Z uJ L) Z 0 (J
LU _> t - < - I UJ n-
0.5
0.4
0.3
0.2
0.1 (~,
()
o ~ ,
A
0 5
0
O 0
%
~ Flow Interruption
qJ•eeeeeeeeeeee i
10 15 20 25 30
PORE VOLUMES
Z _o I-- ,< r r I ' - Z ILl
Z 0 U UJ >_ I-- <
,,-I,
0 . 5
0.4
0 O 0
0 0 0.3
0
0.2 0
0
O. 1 - C
J 0 k 0 5
B
©
(
,:)
(-) i
: ± () ~:' 0 0 LC, 5) ,% V%~ 0 ' (3' 15 20 25 30
PORE VOLUMES
Fig. 6. Measured breakthrough curve for transport of atrazine through a column homogeneously packed with the Mixture soil: (A) flow interruption for 4 h; and (B) no flow interruption. Residence time = 0.12 h.
arrival-wave interruptions but rises for elution-wave interruptions. Thus, elution-wave interruptions are recommended to differentiate between nonequilibrium and transforma- tion processes. In many cases, it is possible that sorption and transformation reactions will be occurring simultaneously. In such cases, the observed concentration perturbation resulting from a flow interruption will be a composite of the impacts of both processes. Consider for example, the effect of flow interruption during solute elution: the concen- tration decrease caused by a transformation reaction will oppose the concentration increase caused by rate-limited sorption/desorption. This effect will complicate data analysis, especially if the presence of both processes is not considered.
M.L. Brusseau et al. / Journal of Contaminant Hydrology 24 (1997) 205-219 217
~ 0.6
0.4
, \
A
Transformation * F low Interrupt ion
Transformation + No F low Interrupt ion
No Transformat ion + F low Interrupt ion
0 I 2 3 4
PORE VOLUMES
z 0 0.8
,< cc I - Z 0.6 tU o z 0 o
0.4 ILl
< .J • 1 O.2
©
©
©
9
© ©
0 0
2 _ _ I 10 20
0
0
©
B
F low Interrupt ion
30 40 50 60
PORE VOLUMES
Fig. 7. Flow interruption for transport of solute undergoing transformation: (A) simulated data; and (B) measured breakthrough curve for transport of 2,4-dichlorophenoxyacetic acid through a column homoge- neously packed with the Mixture soil. Interruption time is 24 h and residence time is 0.1 h.
Incomplete mass recoveries are indicative of systems influenced by transformation reactions or hysteretic/irreversible sorption. A mass-balance analysis can, therefore, be used to identify the existence of these factors. However, without additional information, it is often difficult to differentiate between the effects of hysteretic/irreversible sorption and transformation reactions. Experiments conducted under sterile conditions can elimi- nate effects of biotic transformation reactions. It is sometimes difficult, however, to maintain sterile conditions. Differentiation between abiotic transformation reactions and

218 M.L. Brusseau et al. / Journal of Contaminant Hydrology 24 (1997) 205-219
hysteretic/irreversible sorption cannot, of course, be accomplished by sterilization. Flow interruption presents a simple but effective way by which to differentiate between transformation reactions and hysteretic/irreversible sorption.
A flow interruption during solute elution causes a decrease in effluent concentration for systems influenced by transformation reactions, as discussed above. Conversely, the imposition of a flow interruption during the elution of a solute undergoing irreversible sorption should have no measurable effect. If sorption is hysteretic, rather than irre- versible, a flow interruption should lead to an increase in the effluent concentration profile. This latter behavior was observed by Milczarek et al. (1994) for the transport of fulvic acid through the Hayhook soil. A flow interruption of 10 days during elution resulted in a very large increase in the effluent concentration, which was ascribed to hysteretic sorption. This discussion illustrates the usefulness of flow interruption for distinguishing between transformation reactions and hysteretic/irreversible sorption during solute transport.
4. Conclusions
The transport of many contaminants in the subsurface is influenced by multiple nonlinear, rate-limited processes, and it is often difficult to easily identify which process or factor is predominant for any given system. We have shown that a relatively simple method, flow interruption, can be used to discriminate between various sets of processes. For some process pairs, such as rate-limited vs. nonlinear sorption and physical nonequilibrium vs. heterogeneity, flow interruption causes a perturbation for one process but either negligible or no perturbation for the other. For these cases, the absence of a concentration perturbation indicates that the process for which a perturbation would occur is not of importance under the given conditions. However, the presence of a concentration perturbation does not necessarily indicate the absence of the process for which a perturbation does not occur. For example, a change in concentration upon flow interruption may indicate the presence of rate-limited sorption. However, sorption could be linear or nonlinear. For other process pairs, flow interruption can cause perturbations for both processes (e.g., transformation reactions vs. sorption reactions). For these systems, the observed effects of flow interruption will be a composite of synergistic or antagonistic interactions between the processes. This can complicate data analysis and interpretation, especially if each process is not considered explicitly. Despite these complications, it is likely that flow interruption can be a useful tool, and that the information obtained from applying flow interruption can be used to assist in the planning of additional, process-specific experiments and to help identify appropriate mathematical models to be used for transport simulation.
Acknowledgements
This work was supported in part by grants from the USDA Water Quality grant program and the USDA National Research Initiative grant program. The authors thank Weizi Wang for his assistance in analyzing Cd 2+, and the reviewers for their comments.
M.L. Brusseau et aL / Journal of Contaminant Hydrology 24 (1997) 205-219 219
References
Brusseau, M.L., 1995. The effect of nonlinear sorption on transformation of contaminants during transport in porous media. J. Contain. Hydrol., 17: 277-291.
Brusseau, M.L., Rao, P.S.C., Jessup, R.E. and Davidson, J.M., 1989. Flow interruption: A method for investigating sorption nonequilibrium. J. Contam. Hydrol., 4(3): 223-240.
Brusseau, M.L., Jessup, R.E. and Rao, P.S.C., 1990. Sorption kinetics of organic chemicals: Evaluation of gas-purge and miscible displacement techniques. Environ. Sci. Technol., 24: 727-735.
Estrella, M.R., Brusseau, M.L., Maier, R.S., Pepper, I.L., Wierenga, P.J. and Miller, R.M., 1993. Biodegrada- tion, sorption, and transport of 2,4-dichlorophenoxyacetic acid (2,4-D) in a saturated and unsaturated Soil. Appl. Environ. Microbiol., 59(12): 4266-4273.
Hu, Q. and Brusseau, M.L., 1994. The influence of solute size on diffusive-dispersive transport in porous media. J. Hydrol., 158: 305-317.
Hu, Q. and Brusseau, M.L., 1995. The effect of solute size on transport in structured porous media. Water Resour. Res., 31: 1637-1646.
Knox, J.H. and McLaren, L., 1964. A new gas chromatographic method for measuring gaseous diffusion coefficients and obstructive factors. Anal. Chem., 36: 1477-1485.
Koch, S. and Fliihler, H., 1993. Non-reactive solute transport with micropore diffusion in aggregated porous media determined by a flow-interruption method. J. Contam. Hydrol., 14: 39-54.
Kookana, R.S., Naidu, R. and Tiller, K.G., 1994. Sorption non-equilibrium during cadmium transport through soils. Aust. J. Soil Res., 32: 635-651.
Kressman, T.R.E. and Kitchener, J.A., 1949. Cation exchange with a synthetic phenolsulphonate resin. Faraday Discuss. Chem. Soc., 7: 90-98.
Kunin, R. and Myers, R.J., 1947. Rates of anion exchange in ion-exchange resins. J. Phys. Colloid Chem., 51: 1111-1119.
Mantaglou, A. and Wilson, J.L., 1982. The turning bands method for simulation of random fields using line generation by spectral method. Water Resour. Res., 18: 1379-1394.
Milczarek, M., Brusseau, M.L., Artiola, J.F., Wang, W.Z. and Miller, R.M., 1994. Sorption and transport phenomena of humic substances through soil. Presented at Am. Chem. Soc. Natl. Meet., Environ. Chem. Div., San Diego, CA, Mar. 13-18, 1994.
Murali, V. and Aylmore, L.A.G., 1980. No-flow equilibrium and adsorption dynamics during ionic transport in soils. Nature (London), 283: 467-452.
Pennell, K.D., Abriola, L.M. and Weber, W.J., 1993. Surfactant-enhanced solubilization of residual dodecane in soil columns. Environ. Sci. Technol., 27: 2332-2340.
Rao, P.S.C., Rolston, R.E., Jessup, R.E. and Davidson, J.M., 1980. Solute transport in aggregated porous media: Theoretical and experimental evaluation. Soil Sci. Soc. Am. J., 44(6): 684-688,
Srivastava, R. and Yeh, T.-C.J., 1992. A three-dimensional numerical model for water flow and transport of chemically reactive solute through porous media under variably saturated conditions. Adv. Water Res., 15: 275-287.
Wang, W., Brusseau, M.L. and Artiola, J.F., 1995. Sorption and transport of cadmium, nickel, strontium, and calcium in soil. In: Proceedings of the American Chemical Society National Meetings, Vol. 35(1), Environmental Chemistry Division, Anaheim, CA, April 2-7, 1995. Am. Chem. Soc., Washington, DC.
Weber, W.J. and Morris, J.C., 1963. Kinetics of adsorption on carbon from solution. J. Sanitary Eng. Div., Proc. Am. Soc. Civ. Eng., 89(SA2): 3483-3495.