Embed Size (px)
Citation preview
June 2016
Cascadia Foodshed Financing ProjectMARKET RESEARCH SYNTHESIS
For more than twenty years, Ecotrust has converted $80 million in grants into more than $800
million in assets for local people, businesses, and organizations from Alaska to California. Ecotrust’s
many innovations include cofounding an environmental bank, starting the world’s first ecosystem
investment fund, creating programs in fisheries, forestry, food, farms, and social finance, and
developing new tools to improve social, economic, and environmental decision-making. Ecotrust
honors and supports the wisdom of Native and First Nation leadership in its work. Learn more at
www.ecotrust.org
This research was commissioned by the Cascadia Foodshed Financing Project, a project of Philanthropy Northwest, and made possible by generous grants from JPMorgan Chase Foundation and the Greater Tacoma Community Foundation, and the Thread Fund. We are gratefulto Chad Kruger, Director of Washington State University’s Center forSustaining Agriculture and Natural Resources, for his role as an advisorto this project. Ecotrust appreciates the thoughtful support and partnership of these organizations to pursue reliable prosperity for all Oregonians and Washingtonians.
Cascadia FoodshedFinancing Project
If our shared goal is to catalyze a strong, thriving regional food economy in the Pacific Northwest, what should we invest in?
This is the question that spurred the Cascadia Foodshed Financing Project and Ecotrust to research the opportunity for regional market viability in six food product categories, and to explore the potential for successful collective investment. This research follows from Ecotrust’s 2015 report, Oregon Food Infrastructure Gap Analysis (www.ecotrust.org/publication/regional-food-
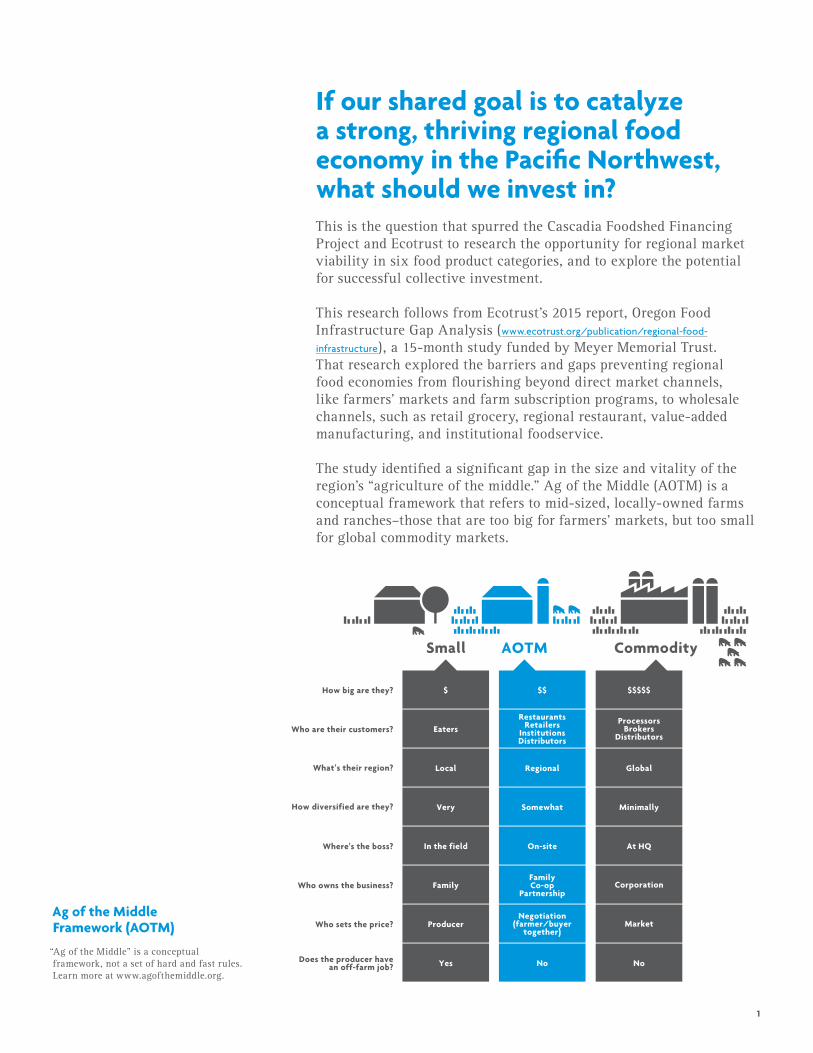
infrastructure), a 15-month study funded by Meyer Memorial Trust. That research explored the barriers and gaps preventing regional food economies from flourishing beyond direct market channels, like farmers’ markets and farm subscription programs, to wholesale channels, such as retail grocery, regional restaurant, value-added manufacturing, and institutional foodservice. The study identified a significant gap in the size and vitality of the region’s “agriculture of the middle.” Ag of the Middle (AOTM) is a conceptual framework that refers to mid-sized, locally-owned farms and ranches–those that are too big for farmers’ markets, but too small for global commodity markets.
Ag of the Middle Framework (AOTM) “Ag of the Middle” is a conceptual framework, not a set of hard and fast rules. Learn more at www.agofthemiddle.org.
1
Ecotrust’s research indicated that AOTM operations would be the ideal scale to support regional food economies because they have the capacity to provide a meaningful volume of product (whether independently or by aggregating with other small and midsized farms), offer more consistent product quality, availability and reliability, and meet the insurance and food safety regulatory requirements of larger supply chains. Plus, they tend to source local inputs and labor (thereby creating a meaningful economic multiplier effect), engage in restorative production practices, and actively participate in their communities. In other words, they tend to retain “local values” while offering wholesale volume.
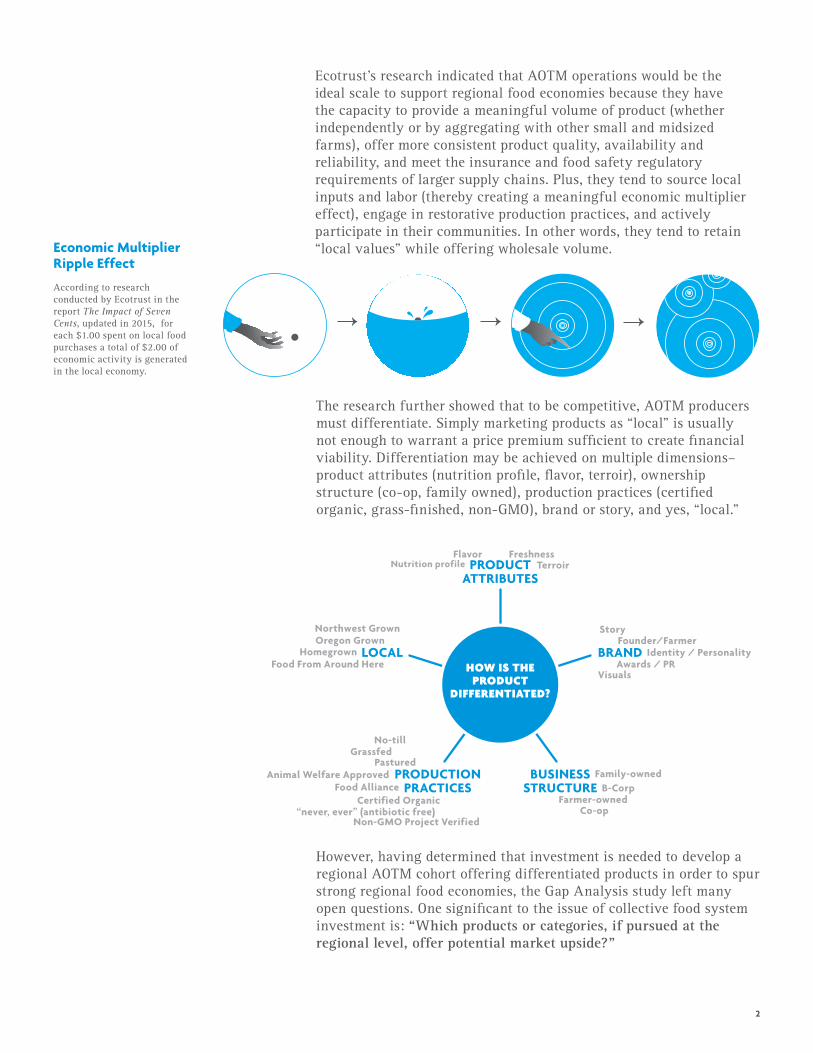
The research further showed that to be competitive, AOTM producers must differentiate. Simply marketing products as “local” is usually not enough to warrant a price premium sufficient to create financial viability. Differentiation may be achieved on multiple dimensions–product attributes (nutrition profile, flavor, terroir), ownership structure (co-op, family owned), production practices (certified organic, grass-finished, non-GMO), brand or story, and yes, “local.”
LOCAL
PRODUCTATTRIBUTES
BRAND
BUSINESSSTRUCTURE
PRODUCTIONPRACTICES
Grassfed
Certified Organic
Pastured
Food Alliance
Non-GMO Project Verified“never, ever” (antibiotic free)
Animal Welfare Approved Family-owned
Co-opFarmer-owned
B-Corp
Oregon GrownHomegrown
Food From Around Here
Story
Identity / PersonalityFounder/Farmer
Awards / PR
Flavor FreshnessTerroirNutrition profile
Visuals
Northwest Grown
No-till
HOW IS THE PRODUCT
DIFFERENTIATED?
Economic Multiplier Ripple Effect
According to research conducted by Ecotrust in the report The Impact of Seven Cents, updated in 2015, for each $1.00 spent on local food purchases a total of $2.00 of economic activity is generated in the local economy.
However, having determined that investment is needed to develop a regional AOTM cohort offering differentiated products in order to spur strong regional food economies, the Gap Analysis study left many open questions. One significant to the issue of collective food system investment is: “Which products or categories, if pursued at the regional level, offer potential market upside?”
2
C A S C A D I A F O O D S H E D F I N A N C I N G P R O J E C TE C O T R U S T
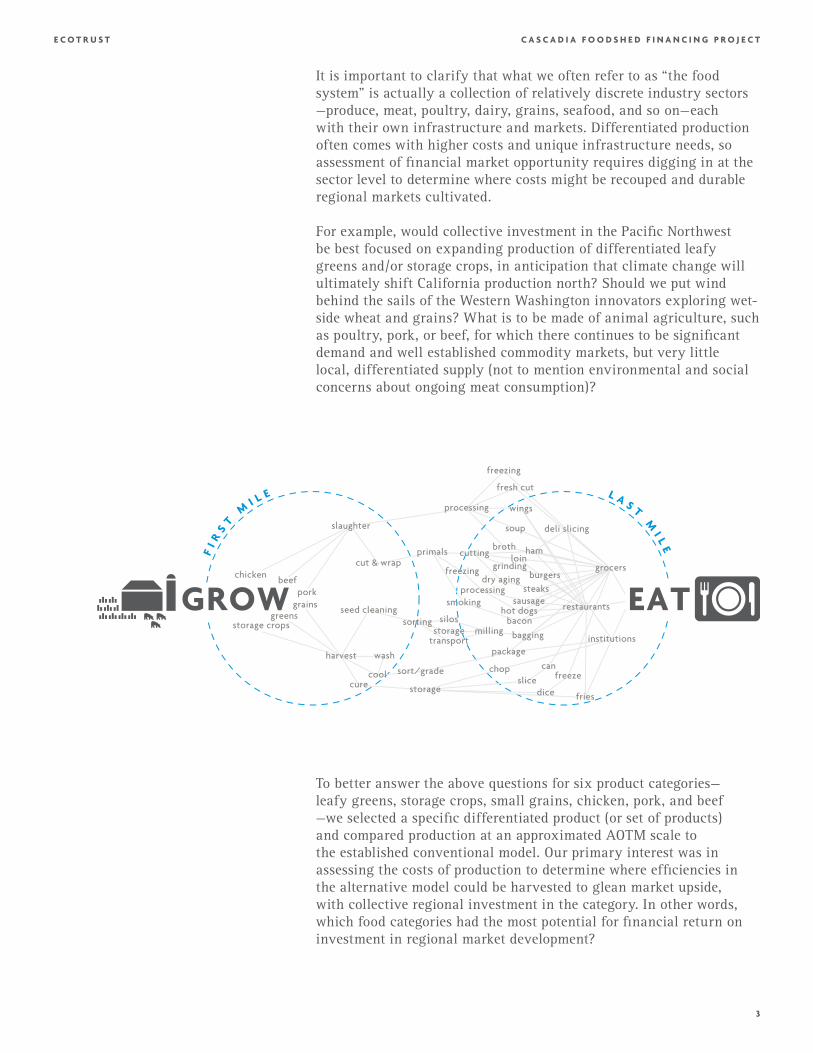
It is important to clarify that what we often refer to as “the food system” is actually a collection of relatively discrete industry sectors —produce, meat, poultry, dairy, grains, seafood, and so on—each with their own infrastructure and markets. Differentiated production often comes with higher costs and unique infrastructure needs, so assessment of financial market opportunity requires digging in at the sector level to determine where costs might be recouped and durable regional markets cultivated. For example, would collective investment in the Pacific Northwest be best focused on expanding production of differentiated leafy greens and/or storage crops, in anticipation that climate change will ultimately shift California production north? Should we put wind behind the sails of the Western Washington innovators exploring wet-side wheat and grains? What is to be made of animal agriculture, such as poultry, pork, or beef, for which there continues to be significant demand and well established commodity markets, but very little local, differentiated supply (not to mention environmental and social concerns about ongoing meat consumption)?
To better answer the above questions for six product categories—leafy greens, storage crops, small grains, chicken, pork, and beef —we selected a specific differentiated product (or set of products) and compared production at an approximated AOTM scale to the established conventional model. Our primary interest was in assessing the costs of production to determine where efficiencies in the alternative model could be harvested to glean market upside, with collective regional investment in the category. In other words, which food categories had the most potential for financial return on investment in regional market development?
3
C A S C A D I A F O O D S H E D F I N A N C I N G P R O J E C TE C O T R U S T
Investment It should be noted, while financial opportunity was the primary interest of this research, the members of the Cascadia Foodshed Financing Project include foundations, nonprofits, and individual investors keen to facilitate the development of a regional food system in the Pacific Northwest that is nutritious, equitable, restorative, and delicious, in addition to being financially prosperous for all supply chain participants. “Investment” in this research therefore refers to the collective investment of time, energy, and resources by members, potentially provided in the form of equity, program or mission-related investments or loans, credit enhancements such as guarantees, grants, or other support. Investor summaries and research narratives, including relevant data and sources, are provided for each product category. The original Food Infrastructure Gap Analysis executive summary (in both English and Spanish) and full report are also available, including overview chapters for each of the same six product categories. All materials will be available at both www.cascadiafoodshed.org and www.ecotrust.org
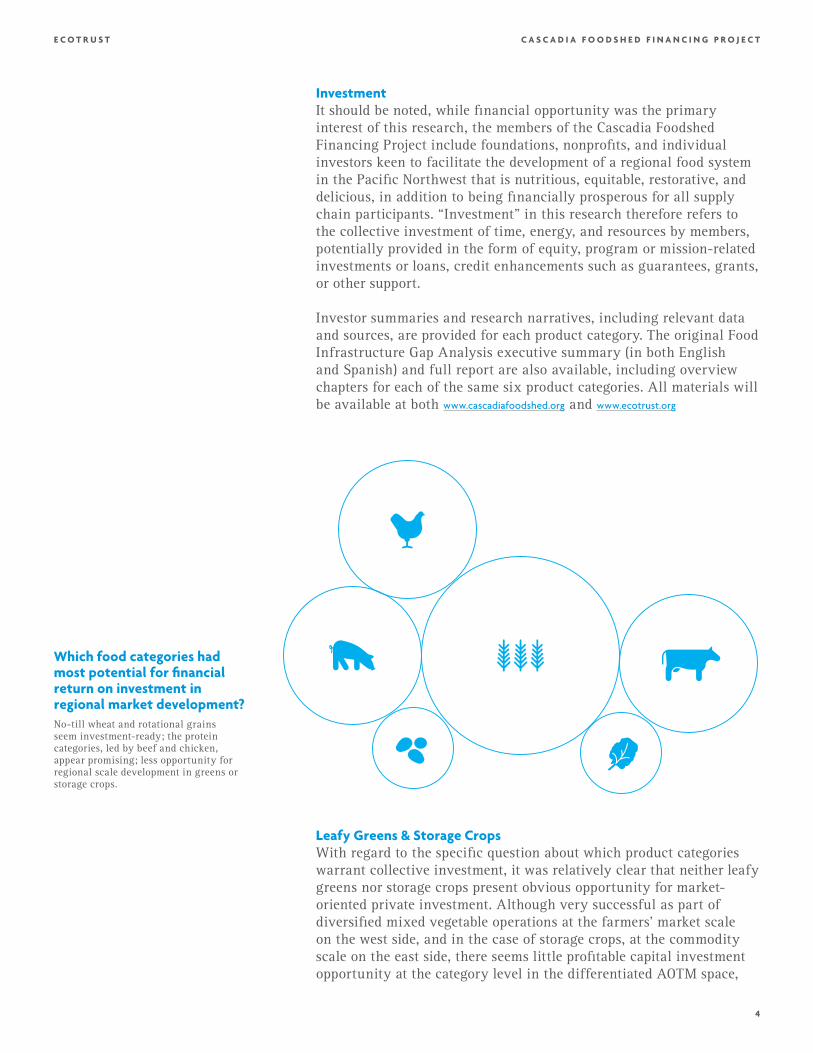
Which food categories had most potential for financial return on investment in regional market development? No-till wheat and rotational grains seem investment-ready; the protein categories, led by beef and chicken, appear promising; less opportunity for regional scale development in greens or storage crops.
Leafy Greens & Storage Crops With regard to the specific question about which product categories warrant collective investment, it was relatively clear that neither leafy greens nor storage crops present obvious opportunity for market-oriented private investment. Although very successful as part of diversified mixed vegetable operations at the farmers’ market scale on the west side, and in the case of storage crops, at the commodity scale on the east side, there seems little profitable capital investment opportunity at the category level in the differentiated AOTM space,
4
C A S C A D I A F O O D S H E D F I N A N C I N G P R O J E C TE C O T R U S T
even as the climate warms. Significant market expansion or systemic transformation of either of these sectors within the Pacific Northwest is unlikely in the short to medium term.
However, there may be a disruptive innovation opportunity in the leafy greens category, in the form of urban indoor, hydroponic agriculture and related technology innovation. Such opportunity is likely to be tightly focused on a high-margin product like micro-greens or herbs, rather than engendering a system-level shift. There may also be potential for market intervention in greens by enhancing supply chain coordination between small-to medium-scale organic diversified vegetable producers and retailers, including pre-harvest crop planning and multi-year contracting. The business feasibility and profitability of such a service has yet to be tested. Protein The three protein categories, beef, poultry, and pork, all offer the potential for successful regional market development in differentiated alternative production models. In our study of grass-finished, pasture-pen, and hoop-house product, we saw a significant need to consider risks and build collective commitment to long-term regional collaboration. In the case of grass-finished beef, the regional market is on a trajectory of continued growth, but requires regional market integration and supply chain management, as well as an effort to raise consumer awareness and comfort. Regarding poultry, a regional supply ecosystem may be viable if producers can collectively create frameworks that facilitate reduced costs in feed, on-farm labor, and processing for all. In the case of pork, there exist opportunities for individual producers to scale up. However, satisfying a significant proportion of regional demand would entail substantially rebuilding the regional industry, which is unlikely, but not impossible.
While there are additional issues unique to each protein category to be explored in the relevant chapters, it is worth highlighting that the challenges identified in the development of regional pastured poultry are consistent across all proteins. The chicken, pork and beef categories are highly dependent on sources, availability, and costs of three primary components: feed, labor and processing. Those are all areas ripe for pre-market development by foundations, nonprofits, and policymakers.
5
C A S C A D I A F O O D S H E D F I N A N C I N G P R O J E C TE C O T R U S T
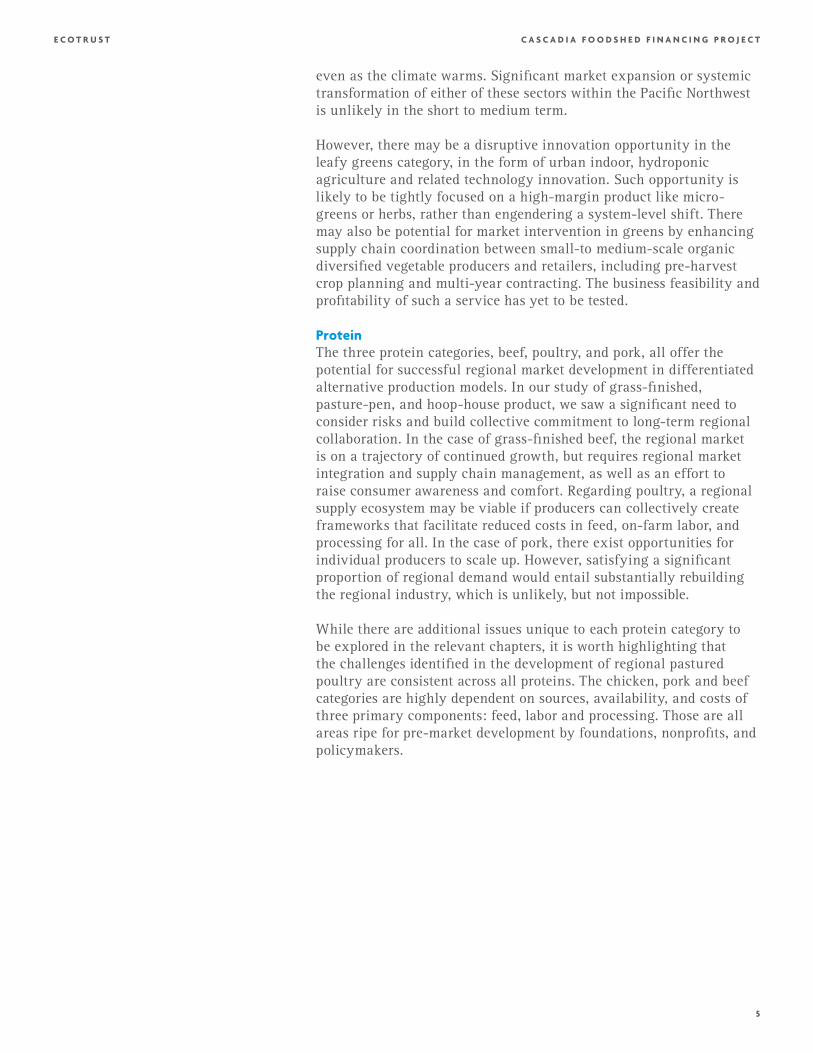
Tilled Soil Non-tilled Soil
The difference between tilled and non-tilled soil
Tillage refers to the loosening up of the soil before planting in order to remove weeds that would otherwise be competing for nutrients in the soil, and to disrupt the regular cycles of their ongoing growth. However, the loss of underground root systems degrades soil quality over time. The soil becomes increasingly dry and thin, making it harder to hold both its structure and water, and therefore very vulnerable to erosion. Loss of underground root systems destroys habitat for vital micronutrients.
No-till soil leaves the existing root system undisturbed when planting, by drilling seeds directly into the soil, which allows for more natural restoration of nutrients. This method facilitates water retention better than tilled soil, allowing plants to take advantage of precious rainwater, and creates robust habitat for micronutrients over time. The primary disadvantages to no-till is that it takes at least 3-5 years to build soil structure, and makes use (albeit at much lower levels than conventional production) of chemical inputs to manage weeds.
Small Grains & No-Till WheatOne clear winner to emerge from the research as a category with regional market opportunity, as well as environmental and social benefit, is small grains, specifically no-till wheat and rotational cropping. No-till (also called direct seeding) refers to drilling wheat seeds directly into the soil following the previous crop. This practice differs dramatically from both conventional and organic wheat production, which both till (turn over) the soil before each planting, releasing soil carbon and creating the conditions for erosion.
No-till wheat production is most successful when rotating other grains such as barley and oats, legumes such as chickpea, oilseeds such as canola, and cover crops such as clover, in concert with wheat, rather than simply letting land lie fallow to recover. Some of the rotation crops, such as chickpeas, are profitable in themselves and have expanding markets. Others, such as the cover crops, are not marketable but may in some cases be used as pasture for grazing animals.
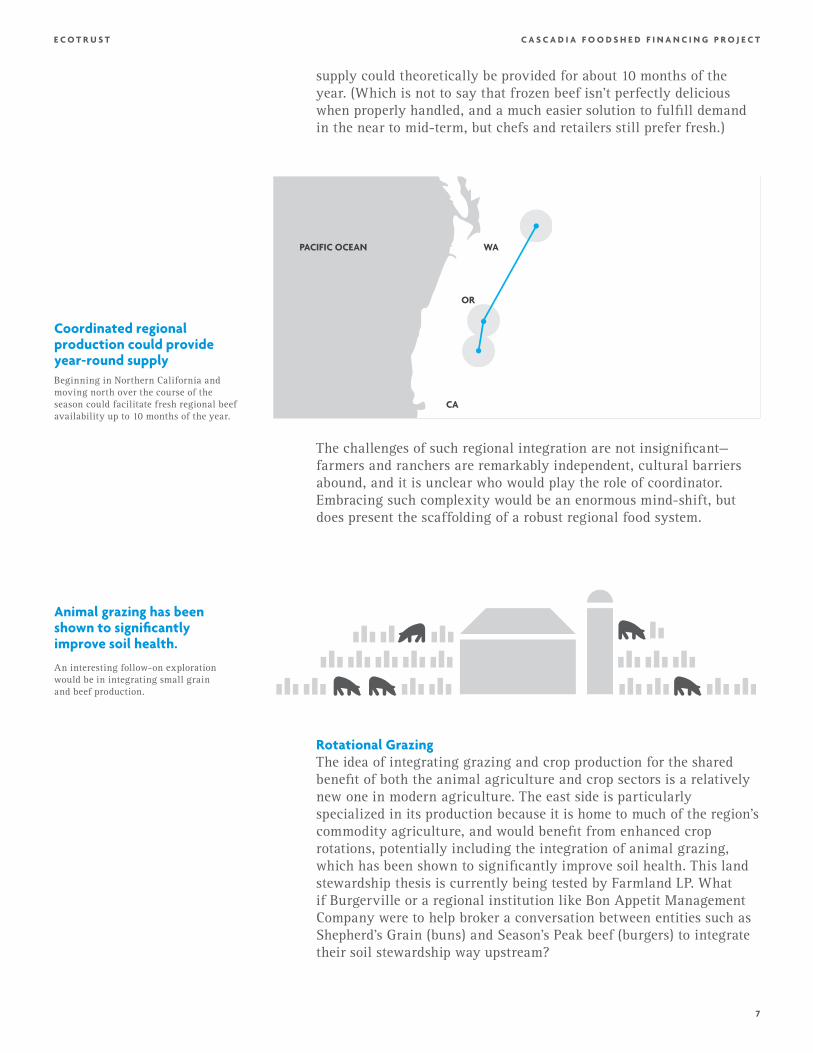
Although still reliant to some degree on herbicides and synthetic fertilizers, no-till and rotational cropping have been shown to build soil health, reduce erosion and nutrient runoff, and sequester soil organic carbon. Innovation in the pelletizing of organic compost for use by direct-seed drills could lay a path toward organic/no-till convergence. Coordinated SupplyThe Pacific Northwest has a great diversity of micro-climates, which support both a diversity of crops and staggered seasonality. If production was coordinated across the region to fulfill large-scale regional demand, several product categories could be timed to provide consistent availability (a key concern for large scale buyers) despite the seasonality of most alternative production systems.
For example, grass-finished beef is a seasonal product in the Northwest, but by coordinating production starting in far northern California and southern Oregon up to northeastern Washington, fresh
6
C A S C A D I A F O O D S H E D F I N A N C I N G P R O J E C TE C O T R U S T
PACIFIC OCEAN
CA
WA
OR
Coordinated regional production could provide year-round supply Beginning in Northern California and moving north over the course of the season could facilitate fresh regional beef availability up to 10 months of the year.
Animal grazing has been shown to significantly improve soil health.
An interesting follow-on exploration would be in integrating small grain and beef production.
supply could theoretically be provided for about 10 months of the year. (Which is not to say that frozen beef isn’t perfectly delicious when properly handled, and a much easier solution to fulfill demand in the near to mid-term, but chefs and retailers still prefer fresh.)
The challenges of such regional integration are not insignificant—farmers and ranchers are remarkably independent, cultural barriers abound, and it is unclear who would play the role of coordinator. Embracing such complexity would be an enormous mind-shift, but does present the scaffolding of a robust regional food system.
Rotational Grazing The idea of integrating grazing and crop production for the shared benefit of both the animal agriculture and crop sectors is a relatively new one in modern agriculture. The east side is particularly specialized in its production because it is home to much of the region’s commodity agriculture, and would benefit from enhanced crop rotations, potentially including the integration of animal grazing, which has been shown to significantly improve soil health. This land stewardship thesis is currently being tested by Farmland LP. What if Burgerville or a regional institution like Bon Appetit Management Company were to help broker a conversation between entities such as Shepherd’s Grain (buns) and Season’s Peak beef (burgers) to integrate their soil stewardship way upstream?
7
C A S C A D I A F O O D S H E D F I N A N C I N G P R O J E C TE C O T R U S T
Regional supply ecosystem coordination requires committed, long-term collaborators. Shifting production practices or expanding production significantly requires confidence on the part of the producer that the new or additional products will be sold. Buyers willing to engage in long-term crop coordination and forward contracting will be vital to creating confidence in new frameworks, and in stimulating large scale investment and behavior change.
As the CFFP considers launching a food investment fund potentially focused on coordinating regional food infrastructure or supporting the development of ag of the middle producers, we recommend prioritizing developing committed markets as a prerequisite step in any fund. Buyers must be willing to commit a portion of their spend on regional products generally, and to specific purchases with identified producers, before infrastructure or supply are actually needed.
Ecotrust is currently engaged in several projects, including the convening of a peer-to-peer network of institutional foodservice directors in the Northwest (www.food-hub.org/nwfba), and in a real-estate development project in Portland devoted to long-term collaboration on food system reform issues (www.ecotrust.org/redd), that will continue to spawn relevant experimentation focused on building long-term collaborations and supply chain coordination.
For additional information or insight into this research, please contact Amanda Oborne at Ecotrust, [email protected].
7 21 N W 9 TH AV E N U E , PO RTL AN D, O R EGO N ECOTRU ST.O RG 503 . 2 27. 62 2 5
June 2016
Differentiated Cost of Production in the Northwest: An Analysis of Six Food Categories
CHICKEN
For more than twenty years, Ecotrust has converted $80 million in grants into more than $800
million in assets for local people, businesses, and organizations from Alaska to California. Ecotrust’s
many innovations include cofounding an environmental bank, starting the world’s first ecosystem
investment fund, creating programs in fisheries, forestry, food, farms, and social finance, and
developing new tools to improve social, economic, and environmental decision-making. Ecotrust
honors and supports the wisdom of Native and First Nation leadership in its work. Learn more at
www.ecotrust.org
This research was commissioned by the Cascadia Foodshed Financing Project, a project of Philanthropy Northwest, and made possible by generous grants from JPMorgan Chase Foundation, the Greater Tacoma Community Foundation and the Thread Fund. Ecotrust appreciates the thoughtful support and partnership of these organizations to pursue reliable prosperity for all Oregonians and Washingtonians.
Cascadia FoodshedFinancing Project
OVERVIEWPoultry is a relatively small part of Pacific Northwest agriculture and food systems; meat chickens (broilers) slaughtered in the region (Oregon and Washington) represented only 0.6% of the national total. Poultry of the Middle is virtually nonexistent in the Northwest: broiler farms in the wide range of size classes between 2,000–199,999 birds sold per year total only 1.2% of all farms, and produce 0.8% of all broilers sold from the region.
The Economics of Pacific Northwest Poultry: Investor Summary
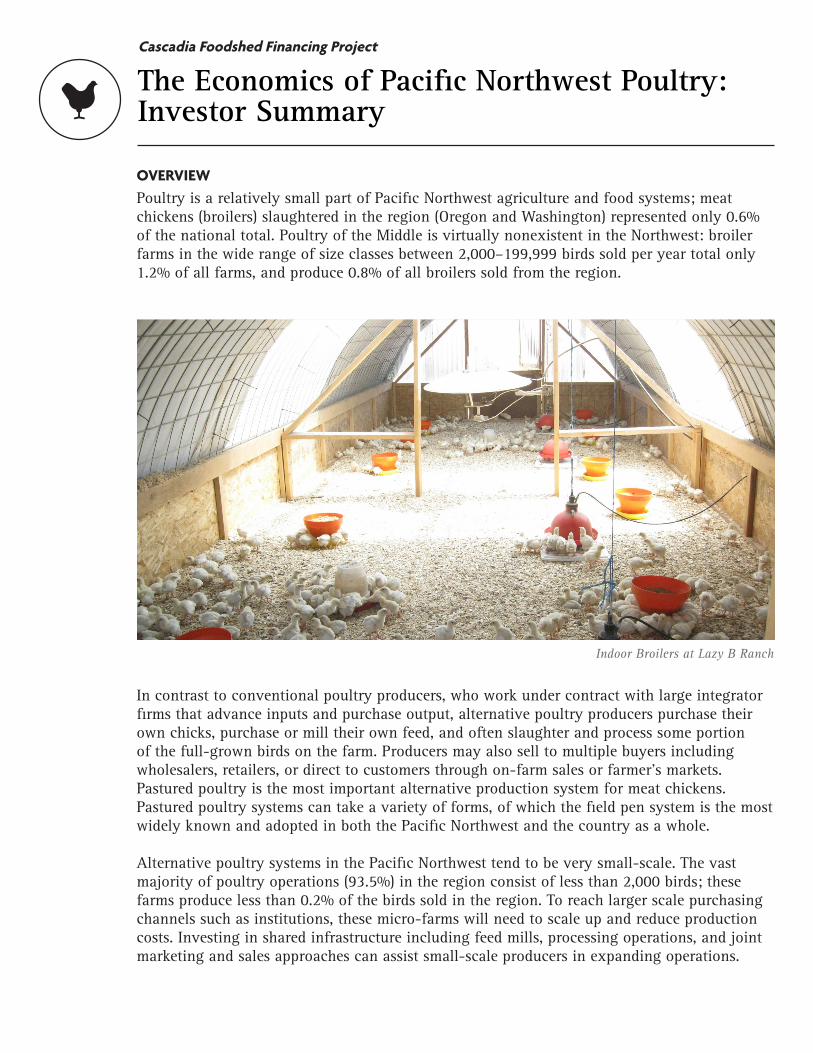
In contrast to conventional poultry producers, who work under contract with large integrator firms that advance inputs and purchase output, alternative poultry producers purchase their own chicks, purchase or mill their own feed, and often slaughter and process some portion of the full-grown birds on the farm. Producers may also sell to multiple buyers including wholesalers, retailers, or direct to customers through on-farm sales or farmer’s markets. Pastured poultry is the most important alternative production system for meat chickens. Pastured poultry systems can take a variety of forms, of which the field pen system is the most widely known and adopted in both the Pacific Northwest and the country as a whole.
Alternative poultry systems in the Pacific Northwest tend to be very small-scale. The vast majority of poultry operations (93.5%) in the region consist of less than 2,000 birds; these farms produce less than 0.2% of the birds sold in the region. To reach larger scale purchasing channels such as institutions, these micro-farms will need to scale up and reduce production costs. Investing in shared infrastructure including feed mills, processing operations, and joint marketing and sales approaches can assist small-scale producers in expanding operations.
Indoor Broilers at Lazy B Ranch
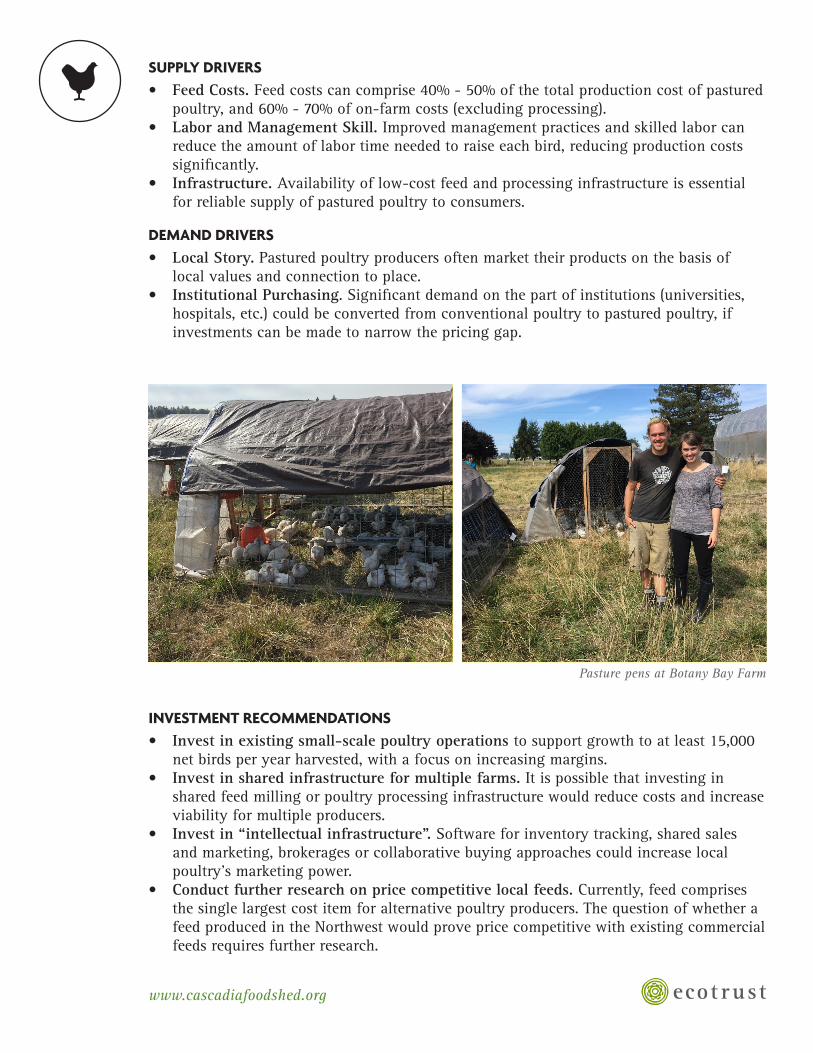
SUPPLY DRIVERS• Feed Costs. Feed costs can comprise 40% - 50% of the total production cost of pastured
poultry, and 60% - 70% of on-farm costs (excluding processing). • Labor and Management Skill. Improved management practices and skilled labor can
reduce the amount of labor time needed to raise each bird, reducing production costs significantly.
• Infrastructure. Availability of low-cost feed and processing infrastructure is essential for reliable supply of pastured poultry to consumers.
DEMAND DRIVERS• Local Story. Pastured poultry producers often market their products on the basis of
local values and connection to place. • Institutional Purchasing. Significant demand on the part of institutions (universities,
hospitals, etc.) could be converted from conventional poultry to pastured poultry, if investments can be made to narrow the pricing gap.
INVESTMENT RECOMMENDATIONS• Invest in existing small-scale poultry operations to support growth to at least 15,000
net birds per year harvested, with a focus on increasing margins. • Invest in shared infrastructure for multiple farms. It is possible that investing in
shared feed milling or poultry processing infrastructure would reduce costs and increase viability for multiple producers.
• Invest in “intellectual infrastructure”. Software for inventory tracking, shared sales and marketing, brokerages or collaborative buying approaches could increase local poultry’s marketing power.
• Conduct further research on price competitive local feeds. Currently, feed comprises the single largest cost item for alternative poultry producers. The question of whether a feed produced in the Northwest would prove price competitive with existing commercial feeds requires further research.
www.cascadiafoodshed.org
Pasture pens at Botany Bay Farm
I I I
C A S C A D I A F O O D S H E D F I N A N C I N G P R O J E C TE C O T R U S T
TABLE OF CONTENTS
Project BackgroundWhat is Poultry of the Middle?Conventional and Alternative Poultry SystemsEstimating Regional Consumer Market SizeData Model for Field Pen System, Pastured PoultrySensitivity Analysis: Feed Costs and Purchase PricesComparison to Conventional Broiler ProductionFurther WorkConclusionsReferenceAppendix A. Data Model AssumptionsAppendix B. Data Model User Instructions
59
101117182021232630
I v
C A S C A D I A F O O D S H E D F I N A N C I N G P R O J E C TE C O T R U S T
Project Background
Consumers have demonstrated a willingness to pay a premium for food attributes such as “free range,” “antibiotic-free,” “organic,” and “local.” However, when production systems designed to yield those attributes are authentically implemented on the ground, such methods also tend to bear higher production and processing costs in comparison to conventional production methods. As a result, higher retail prices do not always ensure a sufficient income to the producer, nor constitute a viable supply chain.
Further, institutions such as schools, hospitals, colleges, and jails are noticeably slower as a buyer segment (versus restaurants, retailers, and manufacturers) to respond to customer interest in differentiated products for a variety of reasons, including high price sensitivity. Such buyers are vital players in the quest to get fresh, nutrient-dense food to vulnerable populations, however, so creating frameworks that allow them to access minimally processed, regionally produced food at reasonable prices would serve farmer and eater alike.
Understanding the costs of differentiated production systems in comparison to conventional approaches is vital to identifying opportunities where efficiencies may be gleaned or market value harvested to support a viable regional food ecosystem.
Ecotrust is conducting cost of production analysis in six distinct food product categories, including this one on beef. In each category we define an “ag of the middle” scale and a “differentiated production system” for analysis purposes, meaning: a specific alternative production system (one that spawns product attributes about which consumers care, such as organic, pastured, or grass fed) will be defined at a particular scale of operation (big enough to participate meaningfully in an institutional supply chain), and be assessed relative to the conventional/commodity/industrial model of production for that category.
While there are certainly many variations of both production systems and scales of operation possible in a thriving regional food system, singling out a specific system allows us to create an economic model that facilitates sensitivity analyses and high level conclusions regarding which regional food sectors could make efficient and effective use of investment.
Note, this project builds on the foundation laid by the Oregon Food Infrastructure Gap Analysis report, released in May 2015. The full report and executive summary can be accessed here: http://www.ecotrust.org/publication/regional-food-infrastructure/, or a quick digital summary of highlights is available at http://food-hub.org/intrepid. The beef chapter from that report is included with this model/report as an addendum.
5
C A S C A D I A F O O D S H E D F I N A N C I N G P R O J E C TE C O T R U S T
What is Poultry of the Middle?
Defining the appropriate scale of operation to study for chicken, the “Poultry of the Middle,” poses a unique challenge. First, it is helpful to understand that egg-laying chickens and chickens destined for consumption as meat are of two different types. Chickens raised for eggs are known as “layers” and meat birds are known as “broilers”. This study focuses on the latter, chickens raised for meat.
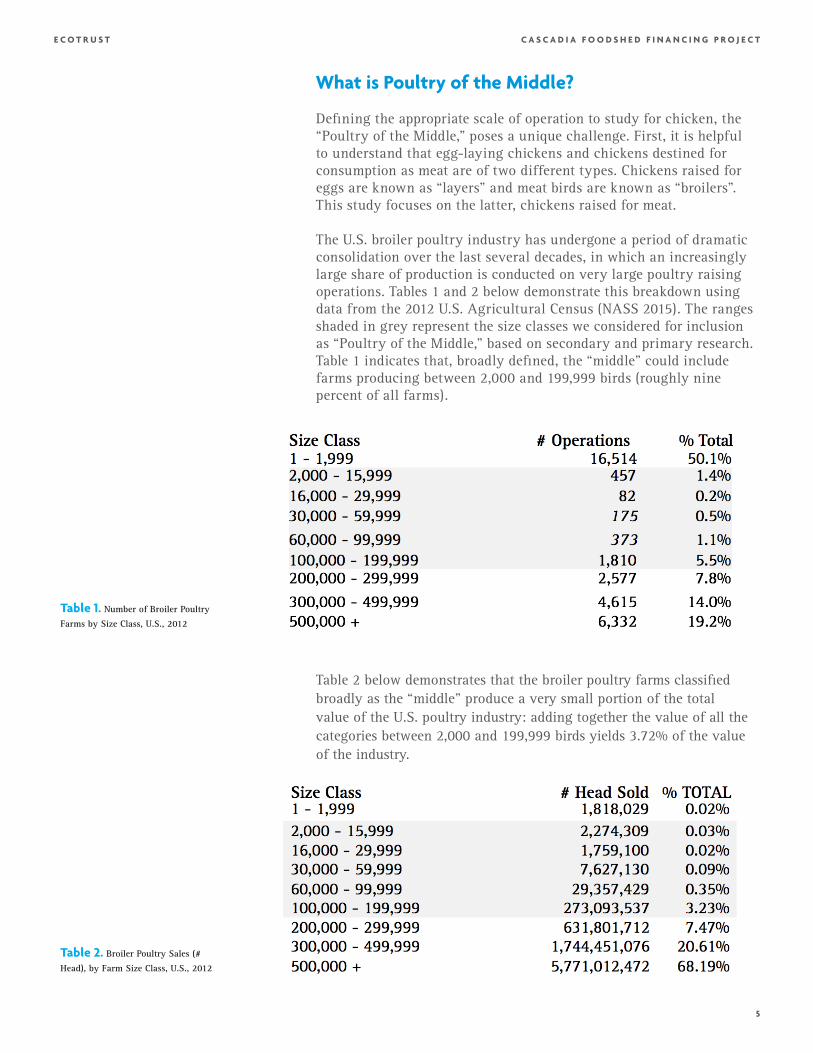
The U.S. broiler poultry industry has undergone a period of dramatic consolidation over the last several decades, in which an increasingly large share of production is conducted on very large poultry raising operations. Tables 1 and 2 below demonstrate this breakdown using data from the 2012 U.S. Agricultural Census (NASS 2015). The ranges shaded in grey represent the size classes we considered for inclusion as “Poultry of the Middle,” based on secondary and primary research. Table 1 indicates that, broadly defined, the “middle” could include farms producing between 2,000 and 199,999 birds (roughly nine percent of all farms).
Table 2 below demonstrates that the broiler poultry farms classified broadly as the “middle” produce a very small portion of the total value of the U.S. poultry industry: adding together the value of all the categories between 2,000 and 199,999 birds yields 3.72% of the value of the industry.
Table 1. Number of Broiler Poultry
Farms by Size Class, U.S., 2012
Table 2. Broiler Poultry Sales (#
Head), by Farm Size Class, U.S., 2012
6
C A S C A D I A F O O D S H E D F I N A N C I N G P R O J E C TE C O T R U S T
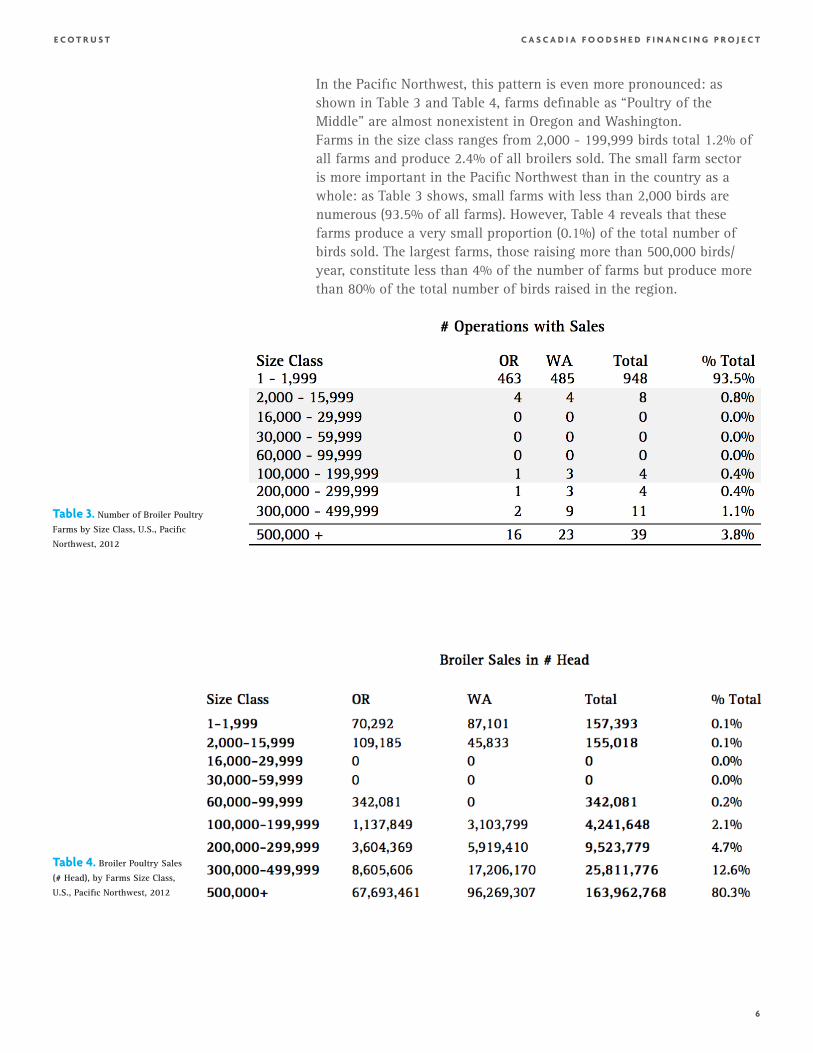
Table 3. Number of Broiler Poultry
Farms by Size Class, U.S., Pacific
Northwest, 2012
In the Pacific Northwest, this pattern is even more pronounced: as shown in Table 3 and Table 4, farms definable as “Poultry of the Middle” are almost nonexistent in Oregon and Washington.Farms in the size class ranges from 2,000 - 199,999 birds total 1.2% of all farms and produce 2.4% of all broilers sold. The small farm sector is more important in the Pacific Northwest than in the country as a whole: as Table 3 shows, small farms with less than 2,000 birds are numerous (93.5% of all farms). However, Table 4 reveals that these farms produce a very small proportion (0.1%) of the total number of birds sold. The largest farms, those raising more than 500,000 birds/year, constitute less than 4% of the number of farms but produce more than 80% of the total number of birds raised in the region.
Table 4. Broiler Poultry Sales
(# Head), by Farms Size Class,
U.S., Pacific Northwest, 2012
7
C A S C A D I A F O O D S H E D F I N A N C I N G P R O J E C TE C O T R U S T
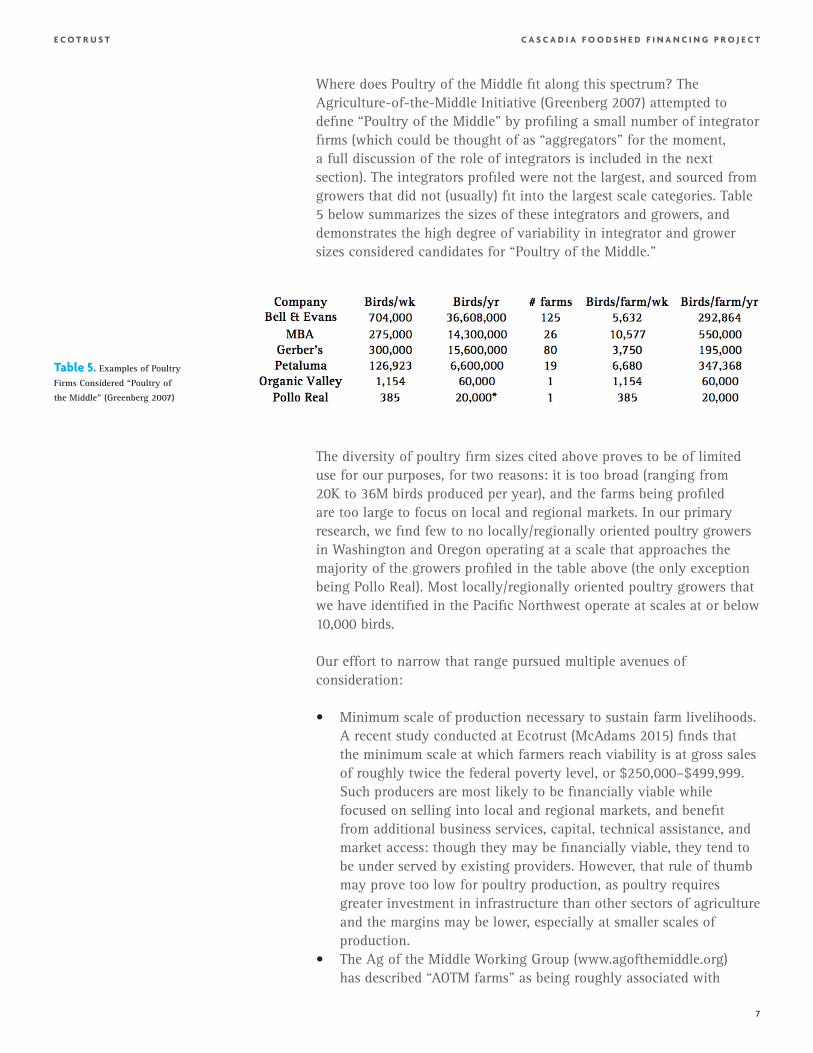
Where does Poultry of the Middle fit along this spectrum? The Agriculture-of-the-Middle Initiative (Greenberg 2007) attempted to define “Poultry of the Middle” by profiling a small number of integrator firms (which could be thought of as “aggregators” for the moment, a full discussion of the role of integrators is included in the next section). The integrators profiled were not the largest, and sourced from growers that did not (usually) fit into the largest scale categories. Table 5 below summarizes the sizes of these integrators and growers, and demonstrates the high degree of variability in integrator and grower sizes considered candidates for “Poultry of the Middle.”
The diversity of poultry firm sizes cited above proves to be of limited use for our purposes, for two reasons: it is too broad (ranging from 20K to 36M birds produced per year), and the farms being profiled are too large to focus on local and regional markets. In our primary research, we find few to no locally/regionally oriented poultry growers in Washington and Oregon operating at a scale that approaches the majority of the growers profiled in the table above (the only exception being Pollo Real). Most locally/regionally oriented poultry growers that we have identified in the Pacific Northwest operate at scales at or below 10,000 birds.
Our effort to narrow that range pursued multiple avenues of consideration:
• Minimum scale of production necessary to sustain farm livelihoods. A recent study conducted at Ecotrust (McAdams 2015) finds that the minimum scale at which farmers reach viability is at gross sales of roughly twice the federal poverty level, or $250,000–$499,999. Such producers are most likely to be financially viable while focused on selling into local and regional markets, and benefit from additional business services, capital, technical assistance, and market access: though they may be financially viable, they tend to be under served by existing providers. However, that rule of thumb may prove too low for poultry production, as poultry requires greater investment in infrastructure than other sectors of agriculture and the margins may be lower, especially at smaller scales of production.
• The Ag of the Middle Working Group (www.agofthemiddle.org) has described “AOTM farms” as being roughly associated with
Table 5. Examples of Poultry
Firms Considered “Poultry of
the Middle” (Greenberg 2007)
8
C A S C A D I A F O O D S H E D F I N A N C I N G P R O J E C TE C O T R U S T
gross annual sales of $50,000 to $500,000. They go on to explain however, that the specific scale of operation that is too big for direct markets but too small for commodity markets (which is the conceptual definition of “ag of the middle”) varies with crops produced, geography and market. Thus, depending on the category, $500,000 as a ceiling may be way too low.
• USDA Economic Research Service defines small family farms as having less than $250,000 in gross farm sales, while mid sized farms are classified at $350,000–$999,999.
Finally, one regulatory issue must be considered in defining the appropriate scale of operation to study, which relates to processing costs. A producer processing more than 20,000 chickens in a year must do so in a USDA licensed facility. Those producing fewer than 20,000 may operate under a state license, which is significantly less expensive.
Finally, we considered the scale of operation necessary, as a solo business, to generate gross sales between $250,000 - $499,999. For pastured poultry, that number is estimated to be about 12,500 to 25,000 birds processed per year. A typical pastured chicken of the fast-growing Cornish Cross variety yields about 4.5 lbs. of meat (Conner 2010). A possible range of farmgate- to-retail prices for whole pastured Cornish Cross chickens is $3.75- $4.50/lb (Blankenship 2015, Sturtevant 2015, Berggren Demonstration Farm 2014). Direct farm-to-consumer prices vary from $4.25 (Blankenship 2015), to $5.89/lb (Kookoolan Farms 2015). We chose a farmgate price that lies between these two extremes of $4.50/lb (Sturtevant 2015). Under these assumptions, a pastured poultry grower raising no other animals or crops for sale would need to raise and sell about 12,500 - 15,000 birds through retailers, or 12,500 direct from the farm to consumers, to reach the $250,000 gross sales threshold.
Thus, the data model presented below assumes 15,000 chicks raised per year; due to mortality during brooding or grow-out, the number of marketed birds will be closer to 13,000 per year. This scale falls within the range of Agriculture of the Middle defined above. It lies conveniently within the range of scales modeled by existing enterprise budgets (Neufeld 2002). And it seems to be within reach for the small group of broiler poultry producers we have interviewed, who currently produce 6,000 – 10,000 birds per year and are optimistic about scaling up. At the moment, actual production at this scale appears to be virtually missing in the Pacific Northwest, as Table 3 above demonstrates. Yet our research suggests that there exist pastured poultry producers with the skills, expertise, and access to land, capital, labor, and inputs to potentially reach this scale.
9
C A S C A D I A F O O D S H E D F I N A N C I N G P R O J E C TE C O T R U S T
The next section defines the alternative poultry production system modeled for this analysis, the field pen system, which can be successfully operated at the 12,500 – 25,000 bird scale, and compares it with the conventional poultry raising system that currently dominates U.S. broiler production.
Conventional and Alternative Poultry Systems
The conventional broiler poultry industry is made up of two types of firms: growers and integrators. Integrators advance inputs including chicks and feed, and provide technical assistance to growers, and guarantee the purchase of the full-grown broilers. Growers who work for integrators tend to sign exclusive contracts with a single integrator. Conventional broiler poultry systems are examined in greater detail below.
“Differentiated,” or alternative broiler poultry systems work fundamentally differently from the conventional industry. Alternative poultry producers purchase their own chicks, purchase or mill their own feed, and often slaughter and process some portion of the full-grown birds on the farm. Producers may also sell to multiple buyers including wholesalers, retailers, or direct to customers through on-farm sales or farmer’s markets.
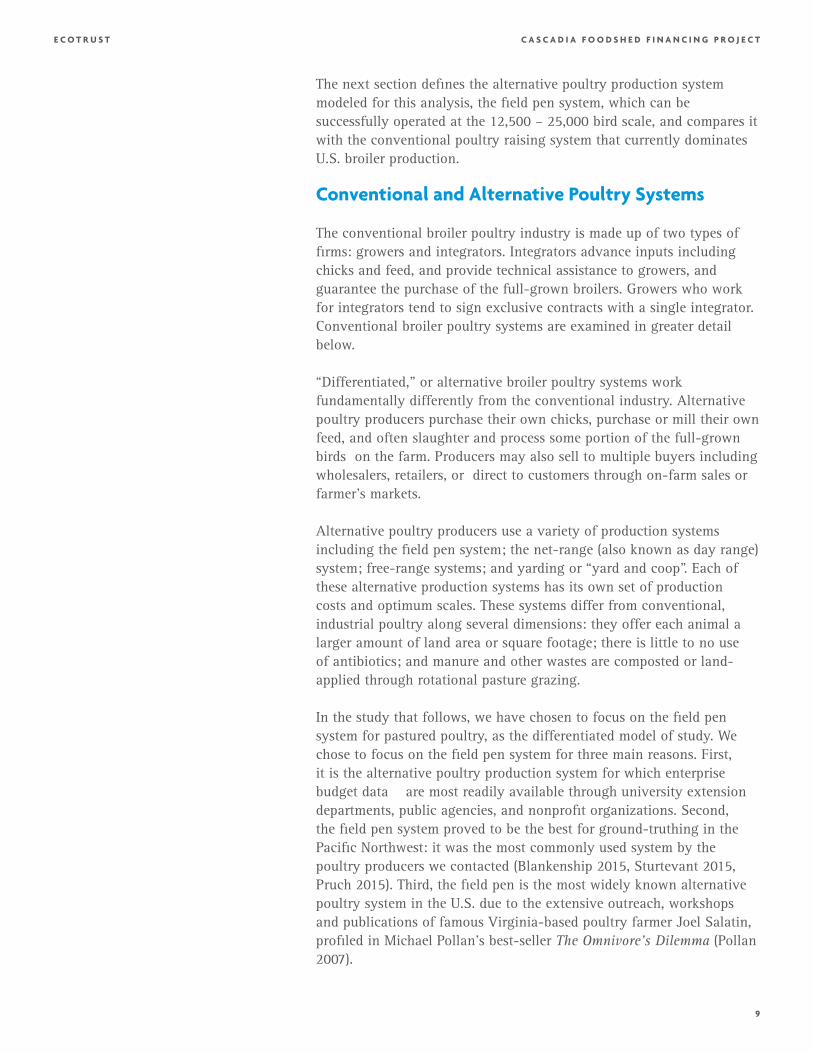
Alternative poultry producers use a variety of production systems including the field pen system; the net-range (also known as day range) system; free-range systems; and yarding or “yard and coop”. Each of these alternative production systems has its own set of production costs and optimum scales. These systems differ from conventional, industrial poultry along several dimensions: they offer each animal a larger amount of land area or square footage; there is little to no use of antibiotics; and manure and other wastes are composted or land-applied through rotational pasture grazing.
In the study that follows, we have chosen to focus on the field pen system for pastured poultry, as the differentiated model of study. We chose to focus on the field pen system for three main reasons. First, it is the alternative poultry production system for which enterprise budget data are most readily available through university extension departments, public agencies, and nonprofit organizations. Second, the field pen system proved to be the best for ground-truthing in the Pacific Northwest: it was the most commonly used system by the poultry producers we contacted (Blankenship 2015, Sturtevant 2015, Pruch 2015). Third, the field pen is the most widely known alternative poultry system in the U.S. due to the extensive outreach, workshops and publications of famous Virginia-based poultry farmer Joel Salatin, profiled in Michael Pollan’s best-seller The Omnivore’s Dilemma (Pollan 2007).
1 0
C A S C A D I A F O O D S H E D F I N A N C I N G P R O J E C TE C O T R U S T
Given these choices of assumptions, we chose to answer the following questions:
• Can the field pen system operate at Poultry of the Middle scale?• Can the price of poultry raised using the field pen system
reach a range that is palatable to consumers seeking a differentiated product?
Estimating Regional Consumer Market Size
In this section, we estimate regional consumer market size at the retail and farmgate levels, for conventional and organic chicken in the Pacific Northwest. Our analysis in this paper has focused on the production system for pastured poultry; ideally, we would estimate the market size for poultry produced using this method. However, there is no data on the market share of pastured chicken/poultry specifically. We focus instead on the market for organic certified chicken, for which there are published estimates. The market share of organic certified chicken at the retail level has been estimated as about 2% (Meatingplace 2016). Since retail sales data for organic and conventional chicken is proprietary, we cannot verify this data point directly, but we believe it is a good enough rule of thumb.
The most recent region-specific estimates of consumer expenditure on poultry is from the 2014 Consumer Expenditure Survey (BLS 2014), which estimates that consumers in the Western United States spent an average of $169 on poultry for at-home consumption. The poultry category comprises chicken and turkey. Based on the relative number of pounds of turkey and chicken consumed reported by USDA (Economic Research Service 2015), we estimate that chicken comprises about 85% of the poultry market by value. Per capita chicken consumption in the Western United States is thus about $144. We assume population size
The field pen system at Botany Bay Farm, Brush Prairie, WA Photo by Matt Ziegler
1 1
C A S C A D I A F O O D S H E D F I N A N C I N G P R O J E C TE C O T R U S T
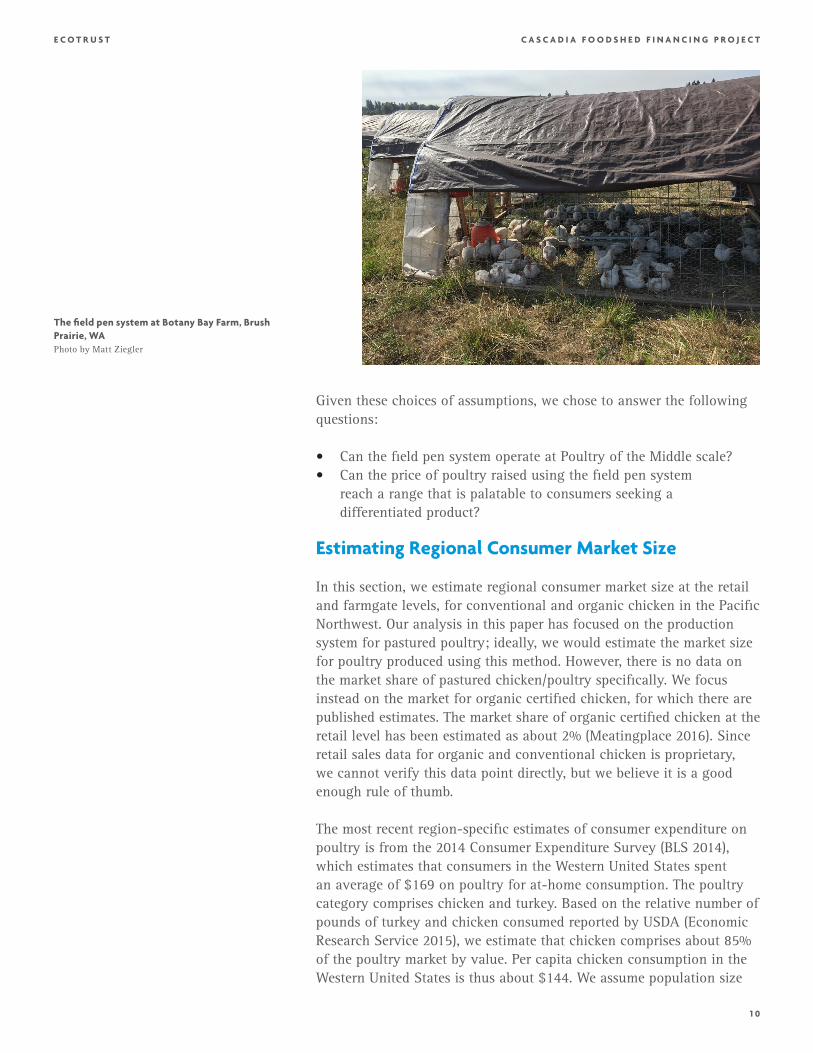
of 4.01 million for Oregon, and 7.06 million for Washington, following the most recent population size estimates for those states. Our estimates for the total and organic retail market size for chicken in the Pacific Northwest are given below. Under the above assumptions, the total retail market size for chicken is about $1.6 billion, and the retail market size for organic chicken alone is about $32 million.
Before concluding, two related points are in order. First, the market for organic chicken is growing fast: Nielsen estimates growth of 29.3% by value between 2014 and 2015 (Sustainable Food News 2016). Second, larger players are entering the market: this year, Pilgrim’s Pride, one of the largest poultry processing companies (integrators) in the United States, plans to convert one of its large-scale vertically integrated chicken raising/processing facilities into a USDA Organic certified plant (Meatingplace 2016). While the overall increase in the organic market should be hopeful to pastured poultry operations, the entry of the biggest players into the organic market should give a pastured poultry producer cause for concern.
Data Model for Field Pen System, Pastured Poultry
The following narrative provides an example of the data model constructed to estimate production costs for pastured poultry producers using the field pen system.
In this model, we make a number of assumptions about the cost of inputs, equipment, and supplies that are based on line item estimates from the literature. Whenever possible, we ground truthed these estimates with material from interviews and site visits with pastured poultry producers.
Table 6. Estimated Retail
Market Size, Total and Organic
Only, Oregon and Washington
(2014)
1 2
C A S C A D I A F O O D S H E D F I N A N C I N G P R O J E C TE C O T R U S T
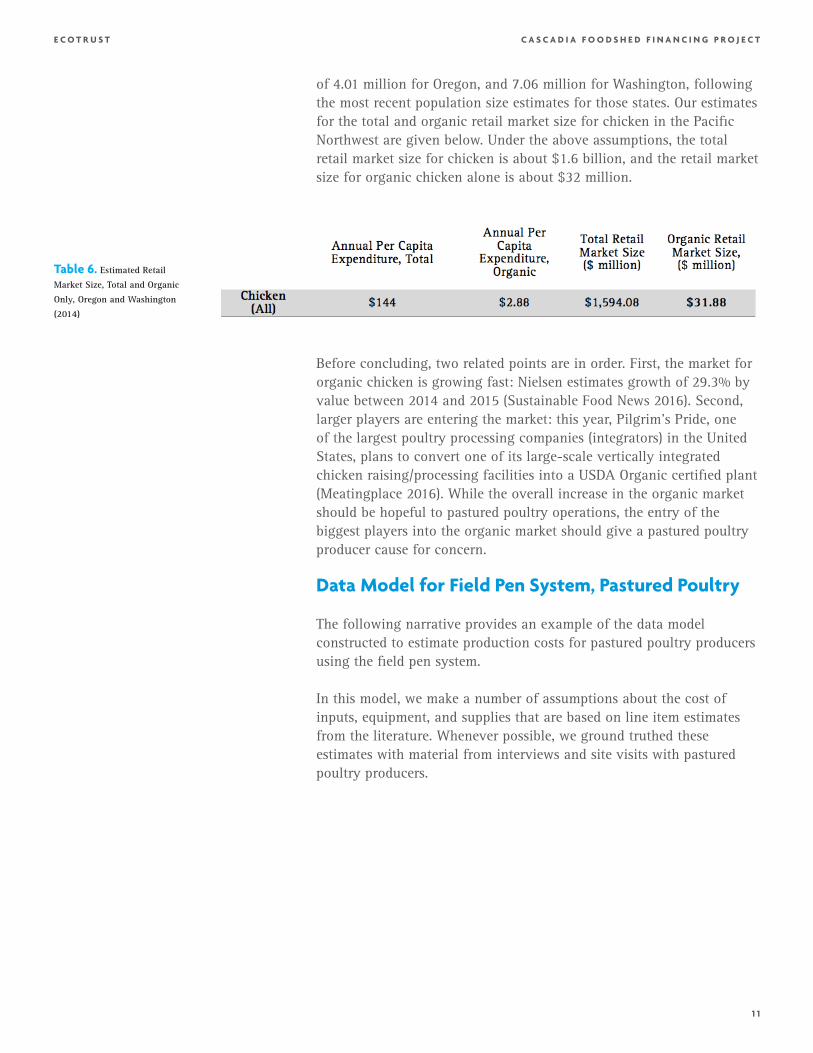
We assumed a field pen production system that started with 15,000 chicks per year purchased. This number of birds can be achieved through a growing season of 25 weeks lasting from May to October. Each bird is raised in a small brooder house for the first three weeks of its life, and then transferred to a field pen for the last five weeks of its life. Each brooder can thus be used eight times, and each pen five times, over the course of the growing season. We assume that birds suffer a 10% mortality rate in the brooder house (Neufeld 2002). Table 7 below provides the model’s assumptions for the brooding stage.
Table 7. Model Assumptions:
Brood Stage
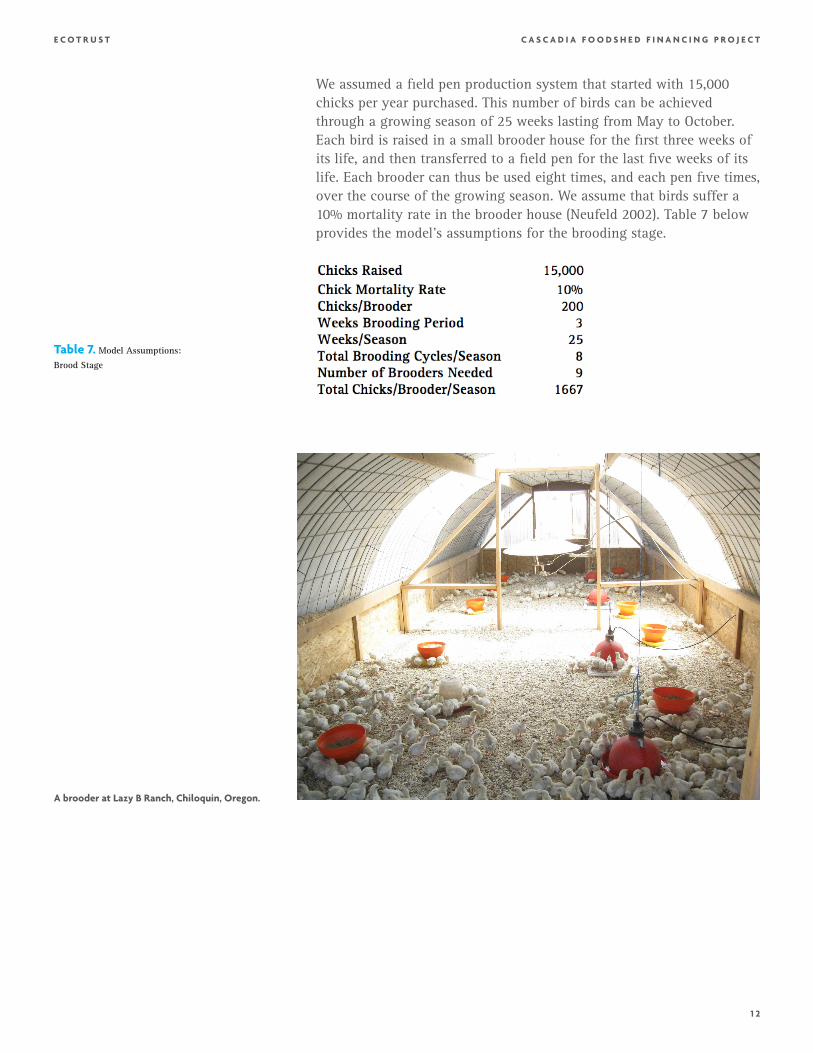
A brooder at Lazy B Ranch, Chiloquin, Oregon.
1 3
C A S C A D I A F O O D S H E D F I N A N C I N G P R O J E C TE C O T R U S T
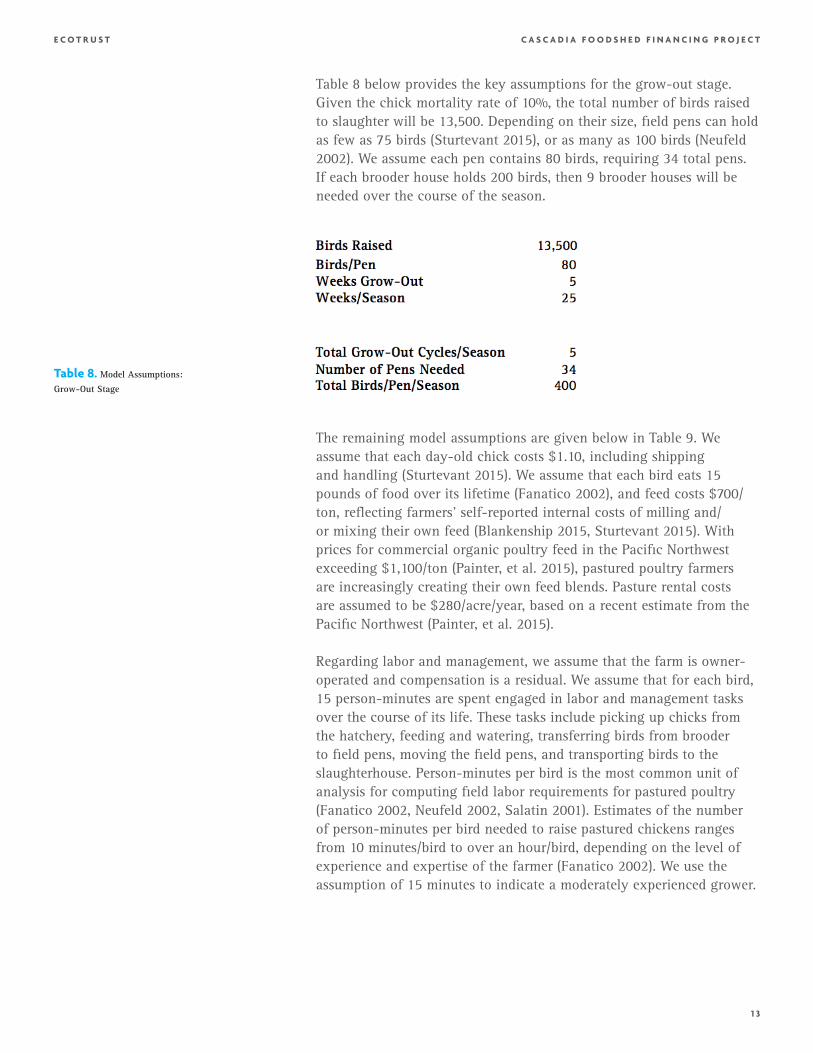
Table 8 below provides the key assumptions for the grow-out stage. Given the chick mortality rate of 10%, the total number of birds raised to slaughter will be 13,500. Depending on their size, field pens can hold as few as 75 birds (Sturtevant 2015), or as many as 100 birds (Neufeld 2002). We assume each pen contains 80 birds, requiring 34 total pens. If each brooder house holds 200 birds, then 9 brooder houses will be needed over the course of the season.
The remaining model assumptions are given below in Table 9. We assume that each day-old chick costs $1.10, including shipping and handling (Sturtevant 2015). We assume that each bird eats 15 pounds of food over its lifetime (Fanatico 2002), and feed costs $700/ton, reflecting farmers’ self-reported internal costs of milling and/or mixing their own feed (Blankenship 2015, Sturtevant 2015). With prices for commercial organic poultry feed in the Pacific Northwest exceeding $1,100/ton (Painter, et al. 2015), pastured poultry farmers are increasingly creating their own feed blends. Pasture rental costs are assumed to be $280/acre/year, based on a recent estimate from the Pacific Northwest (Painter, et al. 2015).
Regarding labor and management, we assume that the farm is owner-operated and compensation is a residual. We assume that for each bird, 15 person-minutes are spent engaged in labor and management tasks over the course of its life. These tasks include picking up chicks from the hatchery, feeding and watering, transferring birds from brooder to field pens, moving the field pens, and transporting birds to the slaughterhouse. Person-minutes per bird is the most common unit of analysis for computing field labor requirements for pastured poultry (Fanatico 2002, Neufeld 2002, Salatin 2001). Estimates of the number of person-minutes per bird needed to raise pastured chickens ranges from 10 minutes/bird to over an hour/bird, depending on the level of experience and expertise of the farmer (Fanatico 2002). We use the assumption of 15 minutes to indicate a moderately experienced grower.
Table 8. Model Assumptions:
Grow-Out Stage
1 4
C A S C A D I A F O O D S H E D F I N A N C I N G P R O J E C TE C O T R U S T
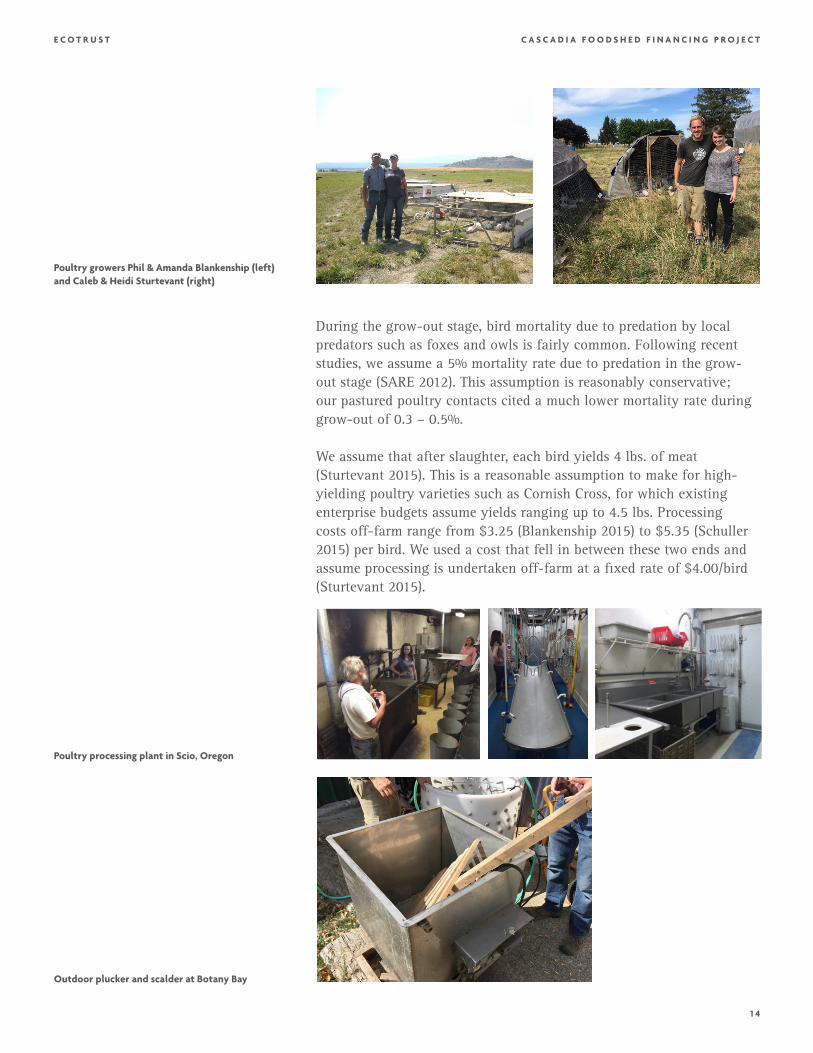
During the grow-out stage, bird mortality due to predation by local predators such as foxes and owls is fairly common. Following recent studies, we assume a 5% mortality rate due to predation in the grow-out stage (SARE 2012). This assumption is reasonably conservative; our pastured poultry contacts cited a much lower mortality rate during grow-out of 0.3 – 0.5%.
We assume that after slaughter, each bird yields 4 lbs. of meat (Sturtevant 2015). This is a reasonable assumption to make for high-yielding poultry varieties such as Cornish Cross, for which existing enterprise budgets assume yields ranging up to 4.5 lbs. Processing costs off-farm range from $3.25 (Blankenship 2015) to $5.35 (Schuller 2015) per bird. We used a cost that fell in between these two ends and assume processing is undertaken off-farm at a fixed rate of $4.00/bird (Sturtevant 2015).
Poultry growers Phil & Amanda Blankenship (left) and Caleb & Heidi Sturtevant (right)
Poultry processing plant in Scio, Oregon
Outdoor plucker and scalder at Botany Bay
1 5
C A S C A D I A F O O D S H E D F I N A N C I N G P R O J E C TE C O T R U S T
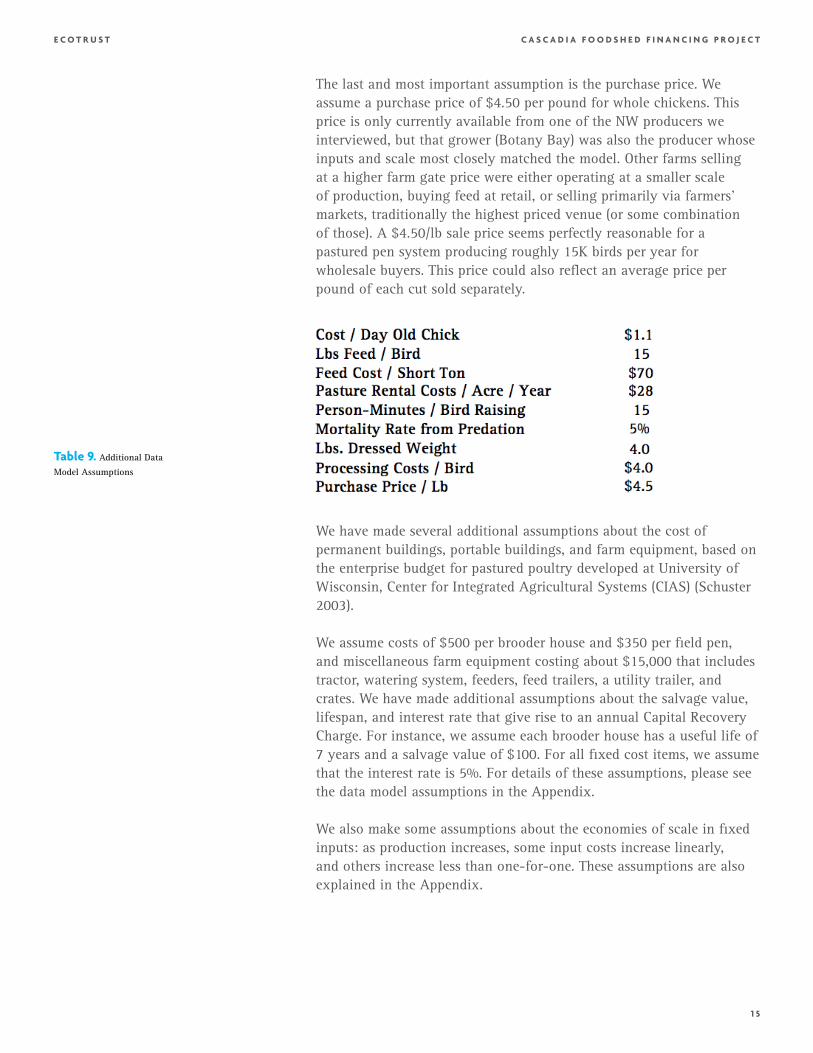
The last and most important assumption is the purchase price. We assume a purchase price of $4.50 per pound for whole chickens. This price is only currently available from one of the NW producers we interviewed, but that grower (Botany Bay) was also the producer whose inputs and scale most closely matched the model. Other farms selling at a higher farm gate price were either operating at a smaller scale of production, buying feed at retail, or selling primarily via farmers’ markets, traditionally the highest priced venue (or some combination of those). A $4.50/lb sale price seems perfectly reasonable for a pastured pen system producing roughly 15K birds per year for wholesale buyers. This price could also reflect an average price per pound of each cut sold separately.
Table 9. Additional Data
Model Assumptions
We have made several additional assumptions about the cost of permanent buildings, portable buildings, and farm equipment, based on the enterprise budget for pastured poultry developed at University of Wisconsin, Center for Integrated Agricultural Systems (CIAS) (Schuster 2003).
We assume costs of $500 per brooder house and $350 per field pen, and miscellaneous farm equipment costing about $15,000 that includes tractor, watering system, feeders, feed trailers, a utility trailer, and crates. We have made additional assumptions about the salvage value, lifespan, and interest rate that give rise to an annual Capital Recovery Charge. For instance, we assume each brooder house has a useful life of 7 years and a salvage value of $100. For all fixed cost items, we assume that the interest rate is 5%. For details of these assumptions, please see the data model assumptions in the Appendix.
We also make some assumptions about the economies of scale in fixed inputs: as production increases, some input costs increase linearly, and others increase less than one-for-one. These assumptions are also explained in the Appendix.
1 6
C A S C A D I A F O O D S H E D F I N A N C I N G P R O J E C TE C O T R U S T
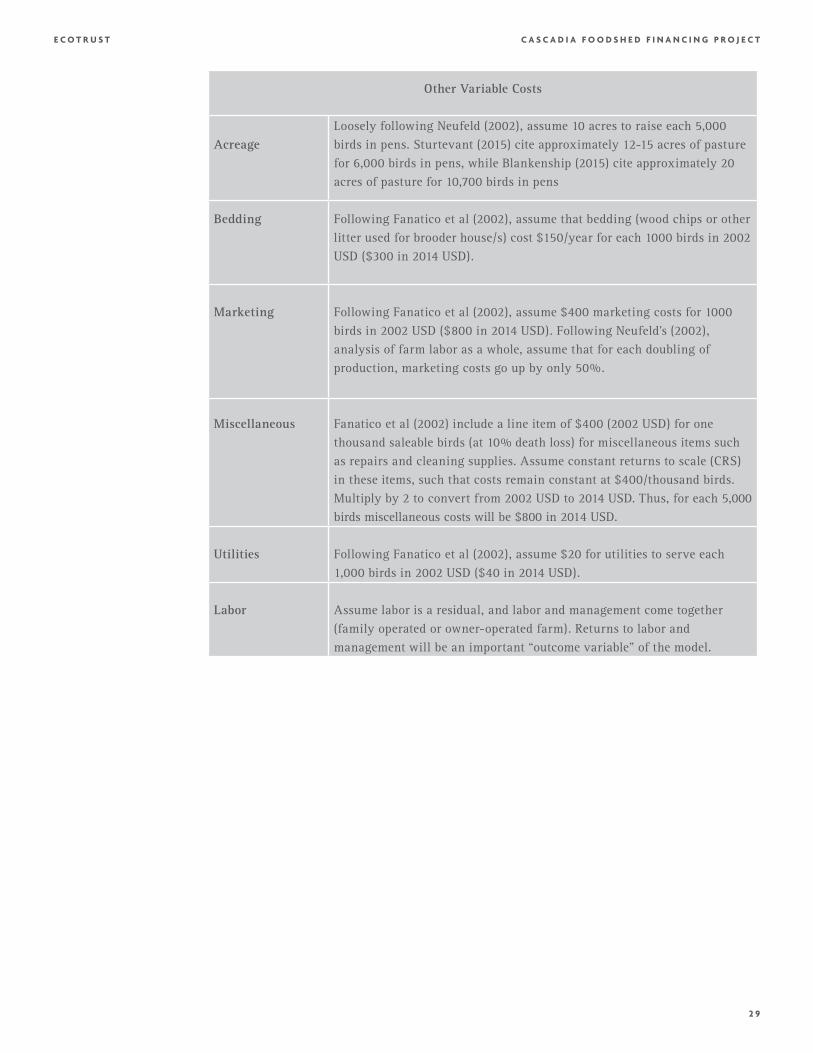
Finally, we have assumed additional variable costs including bedding (litter), utilities costs, marketing costs such as advertisements and product demo equipment, and miscellaneous costs such as cleaning supplies, repair tools, replacement parts, and other costs involved in running an agricultural enterprise. The details of these assumptions are listed in the Appendix.
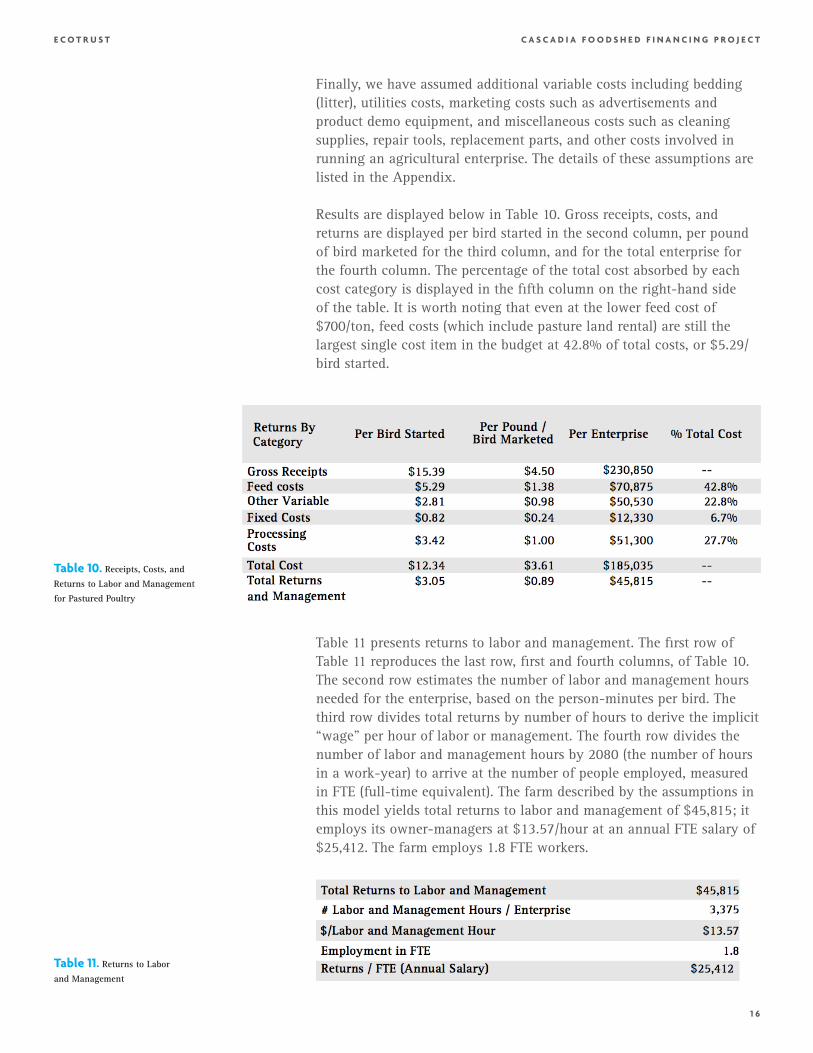
Results are displayed below in Table 10. Gross receipts, costs, and returns are displayed per bird started in the second column, per pound of bird marketed for the third column, and for the total enterprise for the fourth column. The percentage of the total cost absorbed by each cost category is displayed in the fifth column on the right-hand side of the table. It is worth noting that even at the lower feed cost of $700/ton, feed costs (which include pasture land rental) are still the largest single cost item in the budget at 42.8% of total costs, or $5.29/bird started.
Table 11 presents returns to labor and management. The first row of Table 11 reproduces the last row, first and fourth columns, of Table 10. The second row estimates the number of labor and management hours needed for the enterprise, based on the person-minutes per bird. The third row divides total returns by number of hours to derive the implicit “wage” per hour of labor or management. The fourth row divides the number of labor and management hours by 2080 (the number of hours in a work-year) to arrive at the number of people employed, measured in FTE (full-time equivalent). The farm described by the assumptions in this model yields total returns to labor and management of $45,815; it employs its owner-managers at $13.57/hour at an annual FTE salary of $25,412. The farm employs 1.8 FTE workers.
Table 10. Receipts, Costs, and
Returns to Labor and Management
for Pastured Poultry
Table 11. Returns to Labor
and Management
1 7
C A S C A D I A F O O D S H E D F I N A N C I N G P R O J E C TE C O T R U S T
Sensitivity Analysis: Feed Costs and Purchase Prices
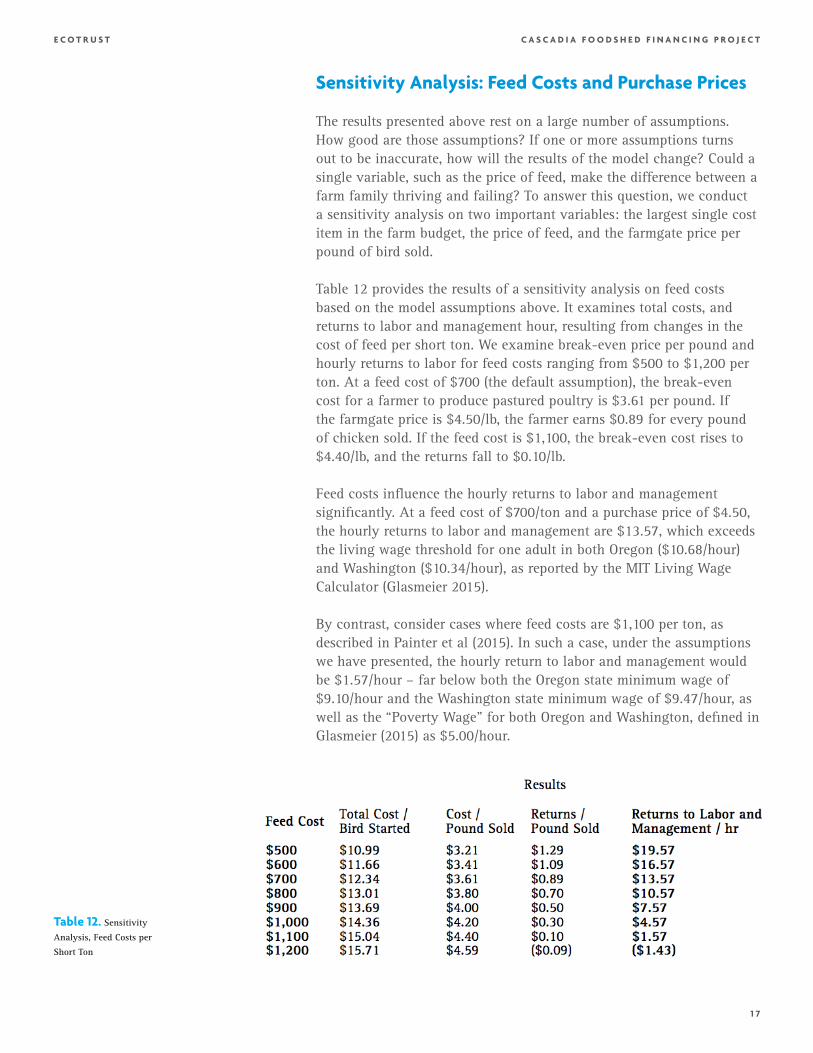
The results presented above rest on a large number of assumptions. How good are those assumptions? If one or more assumptions turns out to be inaccurate, how will the results of the model change? Could a single variable, such as the price of feed, make the difference between a farm family thriving and failing? To answer this question, we conduct a sensitivity analysis on two important variables: the largest single cost item in the farm budget, the price of feed, and the farmgate price per pound of bird sold.
Table 12 provides the results of a sensitivity analysis on feed costs based on the model assumptions above. It examines total costs, and returns to labor and management hour, resulting from changes in the cost of feed per short ton. We examine break-even price per pound and hourly returns to labor for feed costs ranging from $500 to $1,200 per ton. At a feed cost of $700 (the default assumption), the break-even cost for a farmer to produce pastured poultry is $3.61 per pound. If the farmgate price is $4.50/lb, the farmer earns $0.89 for every pound of chicken sold. If the feed cost is $1,100, the break-even cost rises to $4.40/lb, and the returns fall to $0.10/lb.
Feed costs influence the hourly returns to labor and management significantly. At a feed cost of $700/ton and a purchase price of $4.50, the hourly returns to labor and management are $13.57, which exceeds the living wage threshold for one adult in both Oregon ($10.68/hour) and Washington ($10.34/hour), as reported by the MIT Living Wage Calculator (Glasmeier 2015).
By contrast, consider cases where feed costs are $1,100 per ton, as described in Painter et al (2015). In such a case, under the assumptions we have presented, the hourly return to labor and management would be $1.57/hour – far below both the Oregon state minimum wage of$9.10/hour and the Washington state minimum wage of $9.47/hour, as well as the “Poverty Wage” for both Oregon and Washington, defined in Glasmeier (2015) as $5.00/hour.
Table 12. Sensitivity
Analysis, Feed Costs per
Short Ton
1 8
C A S C A D I A F O O D S H E D F I N A N C I N G P R O J E C TE C O T R U S T
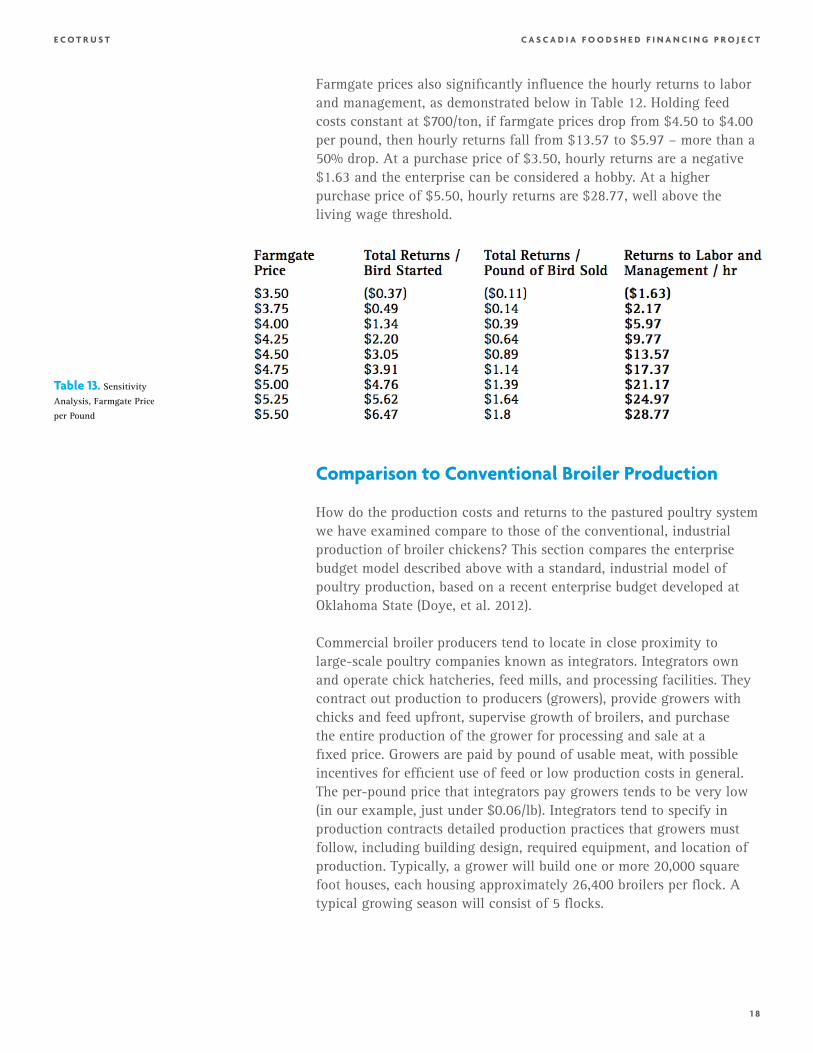
Farmgate prices also significantly influence the hourly returns to labor and management, as demonstrated below in Table 12. Holding feed costs constant at $700/ton, if farmgate prices drop from $4.50 to $4.00 per pound, then hourly returns fall from $13.57 to $5.97 – more than a 50% drop. At a purchase price of $3.50, hourly returns are a negative $1.63 and the enterprise can be considered a hobby. At a higher purchase price of $5.50, hourly returns are $28.77, well above the living wage threshold.
Table 13. Sensitivity
Analysis, Farmgate Price
per Pound
Comparison to Conventional Broiler Production
How do the production costs and returns to the pastured poultry system we have examined compare to those of the conventional, industrial production of broiler chickens? This section compares the enterprise budget model described above with a standard, industrial model of poultry production, based on a recent enterprise budget developed at Oklahoma State (Doye, et al. 2012).
Commercial broiler producers tend to locate in close proximity to large-scale poultry companies known as integrators. Integrators own and operate chick hatcheries, feed mills, and processing facilities. They contract out production to producers (growers), provide growers with chicks and feed upfront, supervise growth of broilers, and purchase the entire production of the grower for processing and sale at a fixed price. Growers are paid by pound of usable meat, with possible incentives for efficient use of feed or low production costs in general. The per-pound price that integrators pay growers tends to be very low (in our example, just under $0.06/lb). Integrators tend to specify in production contracts detailed production practices that growers must follow, including building design, required equipment, and location of production. Typically, a grower will build one or more 20,000 square foot houses, each housing approximately 26,400 broilers per flock. A typical growing season will consist of 5 flocks.
1 9
C A S C A D I A F O O D S H E D F I N A N C I N G P R O J E C TE C O T R U S T
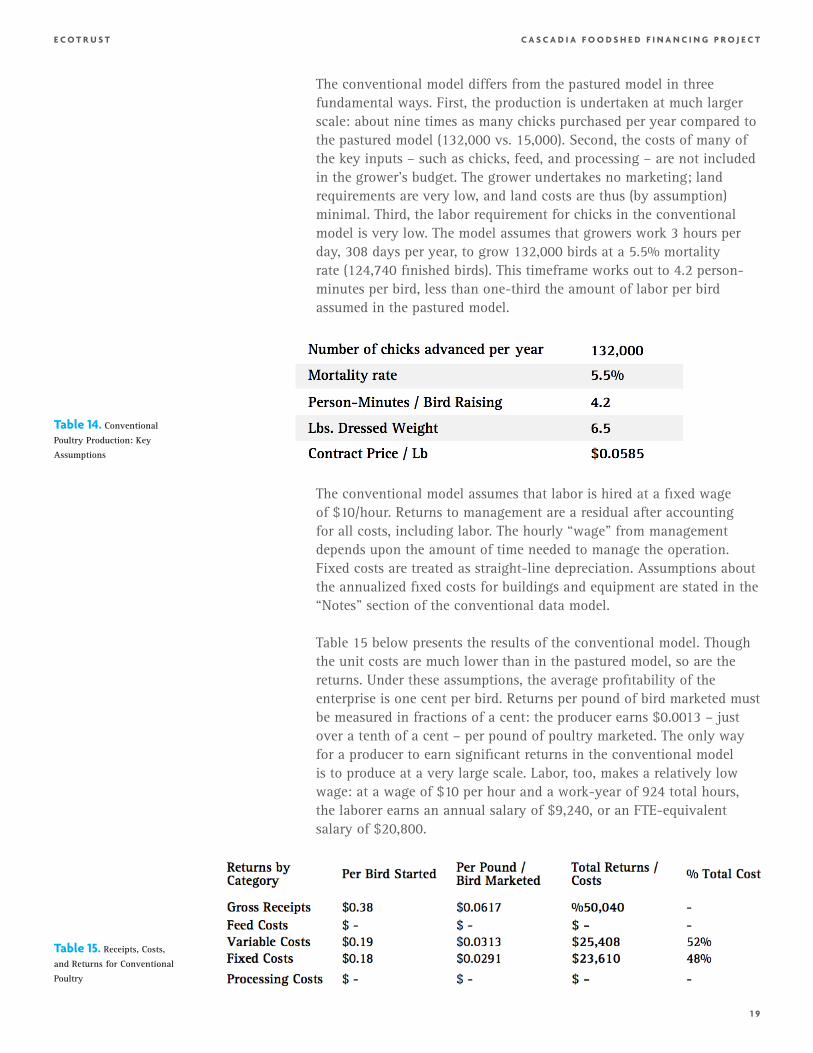
Table 14. Conventional
Poultry Production: Key
Assumptions
The conventional model differs from the pastured model in three fundamental ways. First, the production is undertaken at much larger scale: about nine times as many chicks purchased per year compared to the pastured model (132,000 vs. 15,000). Second, the costs of many of the key inputs – such as chicks, feed, and processing – are not included in the grower’s budget. The grower undertakes no marketing; land requirements are very low, and land costs are thus (by assumption) minimal. Third, the labor requirement for chicks in the conventional model is very low. The model assumes that growers work 3 hours per day, 308 days per year, to grow 132,000 birds at a 5.5% mortality rate (124,740 finished birds). This timeframe works out to 4.2 person- minutes per bird, less than one-third the amount of labor per bird assumed in the pastured model.
The conventional model assumes that labor is hired at a fixed wage of $10/hour. Returns to management are a residual after accounting for all costs, including labor. The hourly “wage” from management depends upon the amount of time needed to manage the operation. Fixed costs are treated as straight-line depreciation. Assumptions about the annualized fixed costs for buildings and equipment are stated in the “Notes” section of the conventional data model.
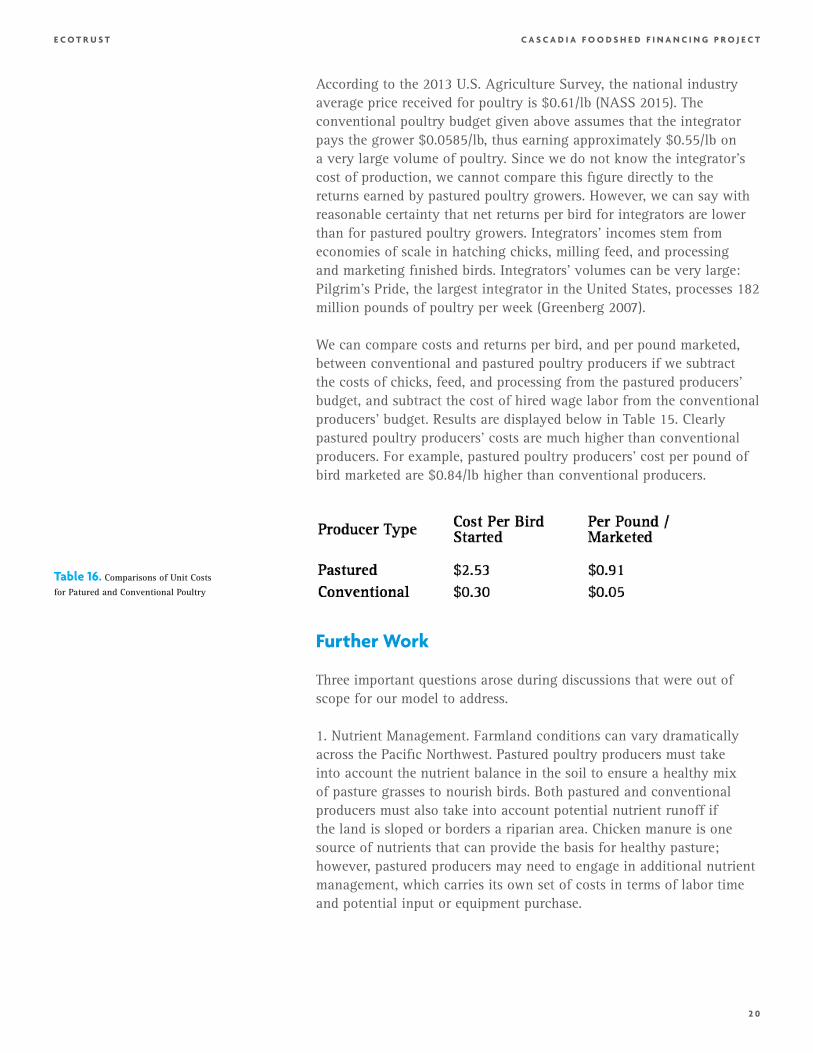
Table 15 below presents the results of the conventional model. Though the unit costs are much lower than in the pastured model, so are the returns. Under these assumptions, the average profitability of the enterprise is one cent per bird. Returns per pound of bird marketed must be measured in fractions of a cent: the producer earns $0.0013 – just over a tenth of a cent – per pound of poultry marketed. The only way for a producer to earn significant returns in the conventional model is to produce at a very large scale. Labor, too, makes a relatively low wage: at a wage of $10 per hour and a work-year of 924 total hours, the laborer earns an annual salary of $9,240, or an FTE-equivalent salary of $20,800.
Table 15. Receipts, Costs,
and Returns for Conventional
Poultry
2 0
C A S C A D I A F O O D S H E D F I N A N C I N G P R O J E C TE C O T R U S T
Table 16. Comparisons of Unit Costs
for Patured and Conventional Poultry
According to the 2013 U.S. Agriculture Survey, the national industry average price received for poultry is $0.61/lb (NASS 2015). The conventional poultry budget given above assumes that the integrator pays the grower $0.0585/lb, thus earning approximately $0.55/lb on a very large volume of poultry. Since we do not know the integrator’s cost of production, we cannot compare this figure directly to the returns earned by pastured poultry growers. However, we can say with reasonable certainty that net returns per bird for integrators are lower than for pastured poultry growers. Integrators’ incomes stem from economies of scale in hatching chicks, milling feed, and processing and marketing finished birds. Integrators’ volumes can be very large: Pilgrim’s Pride, the largest integrator in the United States, processes 182 million pounds of poultry per week (Greenberg 2007).
We can compare costs and returns per bird, and per pound marketed, between conventional and pastured poultry producers if we subtract the costs of chicks, feed, and processing from the pastured producers’ budget, and subtract the cost of hired wage labor from the conventional producers’ budget. Results are displayed below in Table 15. Clearly pastured poultry producers’ costs are much higher than conventional producers. For example, pastured poultry producers’ cost per pound of bird marketed are $0.84/lb higher than conventional producers.
Further Work
Three important questions arose during discussions that were out of scope for our model to address.
1. Nutrient Management. Farmland conditions can vary dramatically across the Pacific Northwest. Pastured poultry producers must take into account the nutrient balance in the soil to ensure a healthy mix of pasture grasses to nourish birds. Both pastured and conventional producers must also take into account potential nutrient runoff if the land is sloped or borders a riparian area. Chicken manure is one source of nutrients that can provide the basis for healthy pasture; however, pastured producers may need to engage in additional nutrient management, which carries its own set of costs in terms of labor time and potential input or equipment purchase.
2 1
C A S C A D I A F O O D S H E D F I N A N C I N G P R O J E C TE C O T R U S T
2. Multiple Products. Many alternative agricultural producers in the Pacific Northwest produce more than one crop or animal on the same land. A pastured poultry producer may use the same land for layer hens, dairy or beef cattle, hogs, rabbits, or other production animals. Raising more than one animal product may be a source of cost savings, since the land rental costs are split among the budgets for each animal. However, it may also be a source of increased costs, as the amount of labor-time per animal may increase due to the time necessary to switch tasks.
3. Integrators’ Costs of Production. Poultry integrators hatch chicks, mill feed, process birds, and market meat at a large scale. We were not able to examine in any depth the primary cost factors that ensure low production costs and high returns for poultry integrators. In particular, integrators’ feed costs are still unknown to us. It is likely that the feed blends milled by integrators make use of large volumes of heavily subsidized grains, including corn and soybeans. Further work might conduct scenario analyses of the production costs that integrators would face, were subsidies for conventional U.S. grains to be removed.
Conclusions
Pastured poultry production holds the potential for growth in the Pacific Northwest. There exist at least a few producers with the skills, land, and market access to produce poultry on pasture at price points that can satisfy consumers seeking differentiated products. However, it is very unlikely that pastured poultry will be competitive to conventional poultry on price. The unit cost of production of pastured poultry is higher than that of conventional poultry, and as we can see from the data, wages for labor and returns to farmers are highly sensitive to the farmgate price garnered. Retailers and consumers buying direct from the farm have shown a willingness to pay the $4.50/lb farmgate price modeled in this analysis, but it remains to be seen whether institutions will be willing/able to make trade-offs in other areas of their menu to pay what amounts to a significant difference between the price of conventional and pastured poultry.
Our research suggests that the primary cost factors that make pastured poultry more expensive to produce are the higher cost of feed, higher land and labor requirements, and scale factors. It is possible that the cost of production for pastured poultry can be reduced by smart interventions in key links of the supply chain, thus making the poultry both a viable product for producers and affordable to institutions.
2 2
C A S C A D I A F O O D S H E D F I N A N C I N G P R O J E C TE C O T R U S T
Potential investments include the following:
1. Invest in existing small-scale poultry operations to support growth to at least 15,000 net birds per year harvested, with a focus on increasing margins. This could include investments in infrastructure, such as additional pasture pens and brooding houses, or for feed-milling equipment, if producers are currently buying feed at retail feed stores. Support for technical assistance, including best practice sharing with regard to efficient use of labor, could help reduce time spent per bird.
2. Invest in shared infrastructure for multiple farms. Further research seems warranted to determine whether investing in community-based infrastructure, such as feed milling or poultry processing, to be shared by a group of midscale producers in close geographic proximity, would reduce costs and increase viability for multiple producers at once.
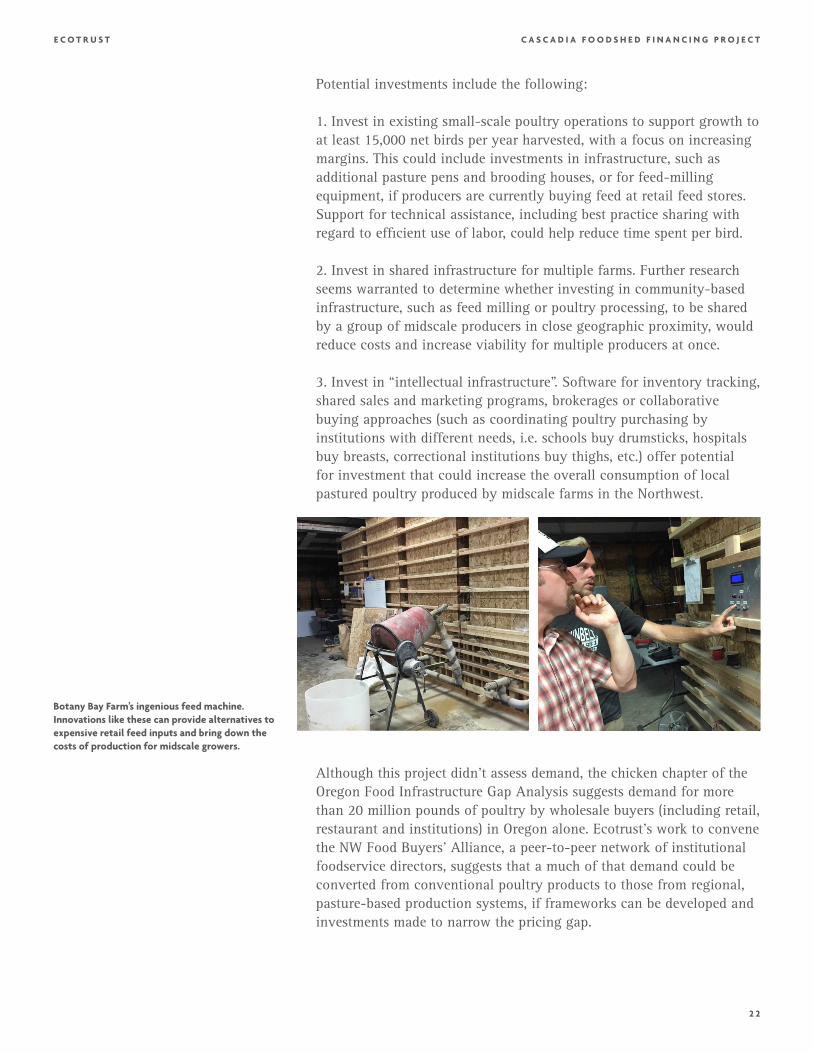
3. Invest in “intellectual infrastructure”. Software for inventory tracking, shared sales and marketing programs, brokerages or collaborative buying approaches (such as coordinating poultry purchasing by institutions with different needs, i.e. schools buy drumsticks, hospitals buy breasts, correctional institutions buy thighs, etc.) offer potential for investment that could increase the overall consumption of local pastured poultry produced by midscale farms in the Northwest.
Botany Bay Farm’s ingenious feed machine. Innovations like these can provide alternatives to expensive retail feed inputs and bring down the costs of production for midscale growers.
Although this project didn’t assess demand, the chicken chapter of the Oregon Food Infrastructure Gap Analysis suggests demand for more than 20 million pounds of poultry by wholesale buyers (including retail, restaurant and institutions) in Oregon alone. Ecotrust’s work to convene the NW Food Buyers’ Alliance, a peer-to-peer network of institutional foodservice directors, suggests that a much of that demand could be converted from conventional poultry products to those from regional, pasture-based production systems, if frameworks can be developed and investments made to narrow the pricing gap.
2 3
E C O T R U S T C A S C A D I A F O O D S H E D F I N A N C I N G P R O J E C T
The next product categories to be analyzed in this project are pork and small grains, and we believe that there may be parallels and synergies to be explored between pastured chicken and pork production systems, as well as between each of those two categories and the production of local grain for feed.
References
Blankenship, Phil and Amanda, interview by Stacey Sobell. 2015. Lazy B Farm (August).
BLS. 2014. Region of residence: Annual expenditure means, shares, standard errors, and
coefficients of variation. Consumer Expenditure Survey Table 1800, Washington, D.C.:
Bureau of Labor Statistics.
Botany Bay Farm. 2015. Whole Chicken {ON--FARM}.
http://www.botanybayfarm.com/store/p23/Whole_Chicken_%7BON--FARM%7D.html.
Conner, Betsy. 2010. Pastured Poultry Budgets: Slow--Growing Broiler and Organic
Comparisons. Butte, MT: National Center for Appropriate Technology (NCAT): ATTRA.
Doye, Damona, Brian Freking, Josh Payne, and Shannon Ferrell. 2012. Broiler
Production: Considerations for Potential Growers. Oklahoma Cooperative Extension
Fact Sheet AGEC--202, Stillwater, OK: Oklahoma State University.
Draper Valley Farms. 2015. “Our Chicken.” Draper Valley Farms.
http://www.drapervalleyfarms.com/our_chicken.htm.
Economic Research Service. 2015. “Food Availability (Per Capita) Data System.” United
States Department of Agriculture. November 12. Accessed February 9, 2016. http://
www.ers.usda.gov/data-products/food-availability-(per-capita)-data-system.aspx.
Ecotrust. 2015. Oregon Food Infrastructure Gap Analysis. Portland, OR:
Ecotrust. European Commission. 2015. “Laying Hens.” European Commission. http://
ec.europa.eu/food/animals/welfare/practice/farm/laying_hens/index_en.htm.
Fanatico, Anne. 2002. Growing Your Range Poultry Business: An Entrepreneur’s
Toolbox. Little Rock, AR: Heifer International; National Center for Appropriate
Technology (NCAT); Kerr Center for Sustainable Agriculture.
—. 2004. “Sustainable Poultry Production Overview -- Part II.” The Poultry Site. http://
www.thepoultrysite.com/articles/113/sustainable--poultry--production--overview--part-
-ii.
Foster Farms. 2015. “How We Raise Foster Farms Poultry.” Foster Farms. Accessed 2015.
http://www.fosterfarms.com/faq/raise.asp.
2 4
C A S C A D I A F O O D S H E D F I N A N C I N G P R O J E C TE C O T R U S T
Glasmeier, Amy K. 2015. “Living Wage Calculation for Oregon.” Massachusetts Institute
of Technology Living Wage Calculator. Accessed September 1, 2015. http://livingwage.
mit.edu/states/41.
Greenaway, Twilight. 2014. “What a Difference a Cage Makes.” Civil Eats. September
3. http://civileats.com/2014/09/03/what--a--difference--a--cage--makes--the--battle--
over--humane--egg---production--in--california--heats--up.
Greenberg, Laurie S.Z. 2007. Poultry of the Middle in the U.S.: Implications for
Sustainable Producers & Scaling Up. Cultural Landscapes, LLC.
Humane Society. 2015. “How to Decipher Egg Carton Labels.” Humane Society. http://
www.humanesociety.org/issues/confinement_farm/facts/guide_egg_labels.html.
Jaeger, William. 2008. Economic of Oilseed Crops and Their Biodiesel Potential in
Oregon’s Willamette Valley . Special Report 1081, Corvallis: Oregon State University.
Khokha, Sasha. 2015. “Who’s Watching the Henhouse to Enforce California’s New Egg
Law?” KQED. January 2. http://ww2.kqed.org/news/2015/01/02/whos--watching- -
the--henhouse--to--enforce-- californias--new- -egg- -law.
Kookoolan Farms. 2015. Chicken flyer. Accessed September 24, 2015. http://media.wix.
com/ugd/d5ff7b_4e61e4e1c95a4fb4924caf75a832ddfd.pdf.
McAdams, Nellie. 2015. “Summary of Agriculture of the Middle Statistics for Oregon.”
Portland, OR: Ecotrust internal report, August.
Meatingplace. 2016. “Pilgrim’s Pride eyes big slice of organic market, talks Costco.”
Meatingplace. April 28. Accessed April 28, 2016. http://www.meatingplace.com/
Industry/News/Details/66104.
NASS. 2015. QuickStats. August 31. http://www.nass.usda.gov/Quick_Stats/.
Washington, DC: National Agriculture Statistics Service.
Neufeld, Liz. 2002. Consumer Preferences for Organic/Free Range Chicken. Manhattan:
Kansas State University: Department of Agricultural Economics: Agricultural Marketing
Resource Center.
Painter, Kathleen, Elizabeth Myrhe, Andy Bary, Craig Cogger, and Whitney Jemmett.
2015. Break--even Analysis of Small--Scale Production of Pastured Organic Poultry.
Pacific Northwest Extension Publication, Puyallup: Washington State University.
Pastured Poultry Foundation. 2015. “What Is Pastured Poultry?” Pastured Poultry
Foundation. http://www.pasturedpoultry.org/pasturedpoultry.htm.
2 5
C A S C A D I A F O O D S H E D F I N A N C I N G P R O J E C TE C O T R U S T
Plamondon, Robert. 2015. “How Many Chickens Per Acre?” Robert Plamondon. http://
plamondon.com/wp/how- -many--chickens--per--acre.
Pollan, Michael. 2007. The Omnivore’s Dilemma. New York: Penguin.
Pruch, Jared, interview by Stacey Sobell. 2015. Berggren Demonstration Farm (April 8).
Salatin, Joel. 2001. Pastured Poultry Profit$. Swoope, VA: Polyface.
SARE. 2012. Profitable Poultry: Raising Birds on Pasture. Bulletin, College Park, MD:
SARE: Sustainable Agriculture Research and Education.
Schuster, Donald. 2003. Generic Poultry Enterprise Budget Version 1.32. Enterprise
Budget, Madison, WI: University of Wisconsin, Center for Integrated Agricultural
Systems.
Sturtevant, Heidi and Caleb, interview by Amanda Oborne, Noah Enelow, Angela
Hedstrom Stacey Sobell. 2015. Botany Bay Farm (August 24).
USDA. 2011. “Meat and Poultry Labeling Terms.” USDA, Food Safety and Inspection
Service. http://www.fsis.usda.gov/wps/wcm/connect/e2853601--3edb--45d3- -90dc- -
1bef17b7f277/Meat_and_Poultry_Labeling_Terms.pdf?MOD=AJPERES.
—. 2015. “USDA Trade Descriptions for Poultry.” USDA Agricultural Marketing Service.
http://www.asi.k- - state.edu/doc/meat- -science/usdaamschickentradedescription.pdf.
Vital Farms. 2015. “What’s So Great About 108?” Vital Farms. Accessed August 2015.
http://vitalfarms.com/great--108/.
2 6
C A S C A D I A F O O D S H E D F I N A N C I N G P R O J E C TE C O T R U S T
Appendix A. Data Model Assumptions
Default Assumptions
Chicks
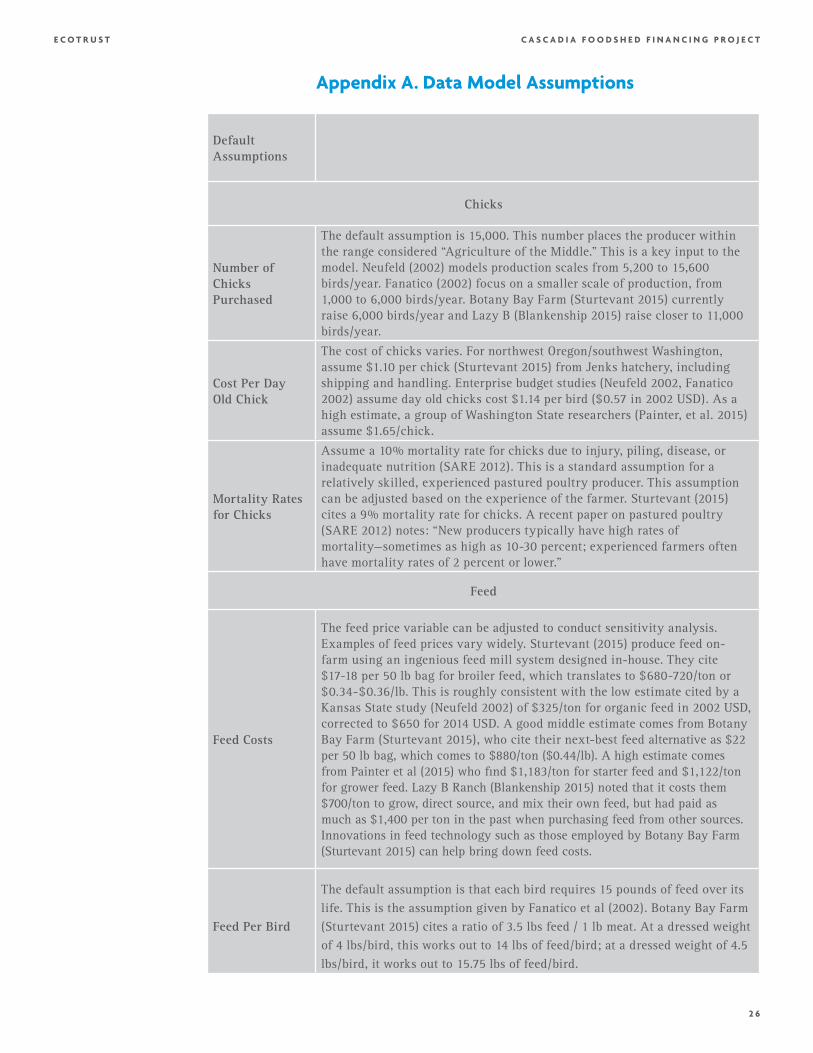
Number ofChicksPurchased
The default assumption is 15,000. This number places the producer withinthe range considered “Agriculture of the Middle.” This is a key input to themodel. Neufeld (2002) models production scales from 5,200 to 15,600birds/year. Fanatico (2002) focus on a smaller scale of production, from1,000 to 6,000 birds/year. Botany Bay Farm (Sturtevant 2015) currentlyraise 6,000 birds/year and Lazy B (Blankenship 2015) raise closer to 11,000birds/year.
Cost Per DayOld Chick
The cost of chicks varies. For northwest Oregon/southwest Washington,assume $1.10 per chick (Sturtevant 2015) from Jenks hatchery, includingshipping and handling. Enterprise budget studies (Neufeld 2002, Fanatico2002) assume day old chicks cost $1.14 per bird ($0.57 in 2002 USD). As ahigh estimate, a group of Washington State researchers (Painter, et al. 2015)assume $1.65/chick.
Mortality Ratesfor Chicks
Assume a 10% mortality rate for chicks due to injury, piling, disease, orinadequate nutrition (SARE 2012). This is a standard assumption for arelatively skilled, experienced pastured poultry producer. This assumptioncan be adjusted based on the experience of the farmer. Sturtevant (2015)cites a 9% mortality rate for chicks. A recent paper on pastured poultry(SARE 2012) notes: “New producers typically have high rates ofmortality—sometimes as high as 10-30 percent; experienced farmers oftenhave mortality rates of 2 percent or lower.”
Feed
Feed Costs
The feed price variable can be adjusted to conduct sensitivity analysis.Examples of feed prices vary widely. Sturtevant (2015) produce feed on-farm using an ingenious feed mill system designed in-house. They cite $17-18 per 50 lb bag for broiler feed, which translates to $680-720/ton or $0.34-$0.36/lb. This is roughly consistent with the low estimate cited by a Kansas State study (Neufeld 2002) of $325/ton for organic feed in 2002 USD, corrected to $650 for 2014 USD. A good middle estimate comes from Botany Bay Farm (Sturtevant 2015), who cite their next-best feed alternative as $22 per 50 lb bag, which comes to $880/ton ($0.44/lb). A high estimate comes from Painter et al (2015) who find $1,183/ton for starter feed and $1,122/ton for grower feed. Lazy B Ranch (Blankenship 2015) noted that it costs them $700/ton to grow, direct source, and mix their own feed, but had paid as much as $1,400 per ton in the past when purchasing feed from other sources. Innovations in feed technology such as those employed by Botany Bay Farm (Sturtevant 2015) can help bring down feed costs.
Feed Per Bird
The default assumption is that each bird requires 15 pounds of feed over its life. This is the assumption given by Fanatico et al (2002). Botany Bay Farm (Sturtevant 2015) cites a ratio of 3.5 lbs feed / 1 lb meat. At a dressed weight of 4 lbs/bird, this works out to 14 lbs of feed/bird; at a dressed weight of 4.5 lbs/bird, it works out to 15.75 lbs of feed/bird.
2 7
C A S C A D I A F O O D S H E D F I N A N C I N G P R O J E C TE C O T R U S T
Land and Labor
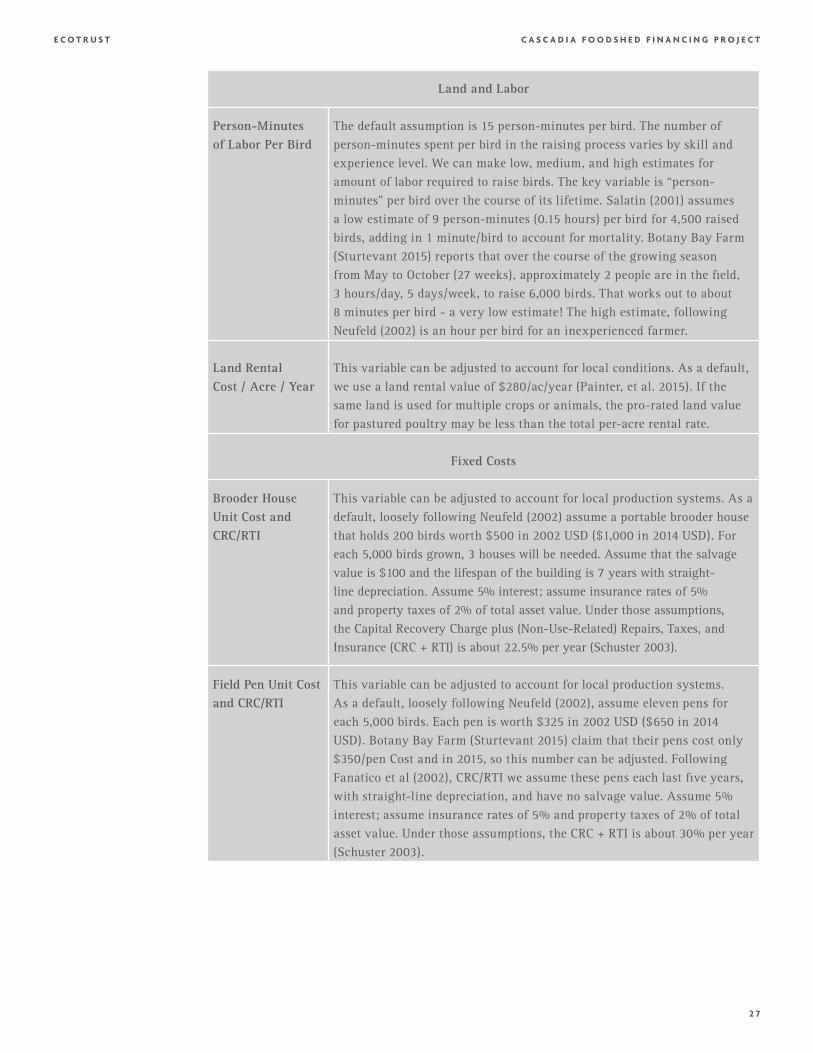
Person-Minutesof Labor Per Bird
The default assumption is 15 person-minutes per bird. The number of person-minutes spent per bird in the raising process varies by skill and experience level. We can make low, medium, and high estimates for amount of labor required to raise birds. The key variable is “person-minutes” per bird over the course of its lifetime. Salatin (2001) assumes a low estimate of 9 person-minutes (0.15 hours) per bird for 4,500 raised birds, adding in 1 minute/bird to account for mortality. Botany Bay Farm (Sturtevant 2015) reports that over the course of the growing season from May to October (27 weeks), approximately 2 people are in the field, 3 hours/day, 5 days/week, to raise 6,000 birds. That works out to about 8 minutes per bird - a very low estimate! The high estimate, following Neufeld (2002) is an hour per bird for an inexperienced farmer.
Land RentalCost / Acre / Year
This variable can be adjusted to account for local conditions. As a default, we use a land rental value of $280/ac/year (Painter, et al. 2015). If the same land is used for multiple crops or animals, the pro-rated land value for pastured poultry may be less than the total per-acre rental rate.
Fixed Costs
Brooder HouseUnit Cost andCRC/RTI
This variable can be adjusted to account for local production systems. As adefault, loosely following Neufeld (2002) assume a portable brooder housethat holds 200 birds worth $500 in 2002 USD ($1,000 in 2014 USD). For each 5,000 birds grown, 3 houses will be needed. Assume that the salvage value is $100 and the lifespan of the building is 7 years with straight-line depreciation. Assume 5% interest; assume insurance rates of 5% and property taxes of 2% of total asset value. Under those assumptions, the Capital Recovery Charge plus (Non-Use-Related) Repairs, Taxes, and Insurance (CRC + RTI) is about 22.5% per year (Schuster 2003).
Field Pen Unit Cost and CRC/RTI
This variable can be adjusted to account for local production systems. As a default, loosely following Neufeld (2002), assume eleven pens for each 5,000 birds. Each pen is worth $325 in 2002 USD ($650 in 2014 USD). Botany Bay Farm (Sturtevant 2015) claim that their pens cost only $350/pen Cost and in 2015, so this number can be adjusted. Following Fanatico et al (2002), CRC/RTI we assume these pens each last five years, with straight-line depreciation, and have no salvage value. Assume 5% interest; assume insurance rates of 5% and property taxes of 2% of total asset value. Under those assumptions, the CRC + RTI is about 30% per year (Schuster 2003).
2 8
C A S C A D I A F O O D S H E D F I N A N C I N G P R O J E C TE C O T R U S T
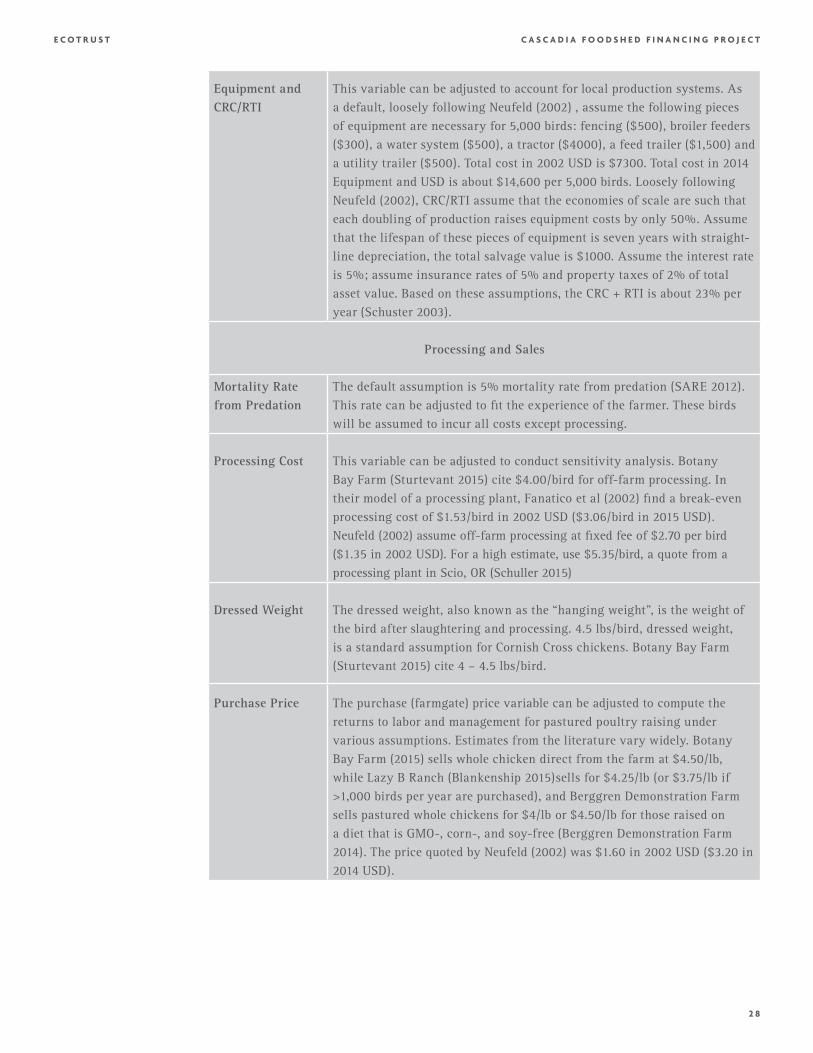
Equipment and CRC/RTI
This variable can be adjusted to account for local production systems. As a default, loosely following Neufeld (2002) , assume the following pieces of equipment are necessary for 5,000 birds: fencing ($500), broiler feeders ($300), a water system ($500), a tractor ($4000), a feed trailer ($1,500) and a utility trailer ($500). Total cost in 2002 USD is $7300. Total cost in 2014 Equipment and USD is about $14,600 per 5,000 birds. Loosely following Neufeld (2002), CRC/RTI assume that the economies of scale are such that each doubling of production raises equipment costs by only 50%. Assume that the lifespan of these pieces of equipment is seven years with straight-line depreciation, the total salvage value is $1000. Assume the interest rate is 5%; assume insurance rates of 5% and property taxes of 2% of total asset value. Based on these assumptions, the CRC + RTI is about 23% per year (Schuster 2003).
Processing and Sales
Mortality Rate from Predation
The default assumption is 5% mortality rate from predation (SARE 2012). This rate can be adjusted to fit the experience of the farmer. These birds will be assumed to incur all costs except processing.
Processing Cost This variable can be adjusted to conduct sensitivity analysis. Botany Bay Farm (Sturtevant 2015) cite $4.00/bird for off-farm processing. In their model of a processing plant, Fanatico et al (2002) find a break-even processing cost of $1.53/bird in 2002 USD ($3.06/bird in 2015 USD). Neufeld (2002) assume off-farm processing at fixed fee of $2.70 per bird ($1.35 in 2002 USD). For a high estimate, use $5.35/bird, a quote from a processing plant in Scio, OR (Schuller 2015)
Dressed Weight The dressed weight, also known as the “hanging weight”, is the weight of the bird after slaughtering and processing. 4.5 lbs/bird, dressed weight, is a standard assumption for Cornish Cross chickens. Botany Bay Farm (Sturtevant 2015) cite 4 – 4.5 lbs/bird.
Purchase Price The purchase (farmgate) price variable can be adjusted to compute the returns to labor and management for pastured poultry raising under various assumptions. Estimates from the literature vary widely. Botany Bay Farm (2015) sells whole chicken direct from the farm at $4.50/lb, while Lazy B Ranch (Blankenship 2015)sells for $4.25/lb (or $3.75/lb if >1,000 birds per year are purchased), and Berggren Demonstration Farm sells pastured whole chickens for $4/lb or $4.50/lb for those raised on a diet that is GMO-, corn-, and soy-free (Berggren Demonstration Farm 2014). The price quoted by Neufeld (2002) was $1.60 in 2002 USD ($3.20 in 2014 USD).
2 9
C A S C A D I A F O O D S H E D F I N A N C I N G P R O J E C TE C O T R U S T
Other Variable Costs
AcreageLoosely following Neufeld (2002), assume 10 acres to raise each 5,000birds in pens. Sturtevant (2015) cite approximately 12-15 acres of pasturefor 6,000 birds in pens, while Blankenship (2015) cite approximately 20acres of pasture for 10,700 birds in pens
Bedding Following Fanatico et al (2002), assume that bedding (wood chips or otherlitter used for brooder house/s) cost $150/year for each 1000 birds in 2002USD ($300 in 2014 USD).
Marketing Following Fanatico et al (2002), assume $400 marketing costs for 1000birds in 2002 USD ($800 in 2014 USD). Following Neufeld’s (2002),analysis of farm labor as a whole, assume that for each doubling ofproduction, marketing costs go up by only 50%.
Miscellaneous Fanatico et al (2002) include a line item of $400 (2002 USD) for one thousand saleable birds (at 10% death loss) for miscellaneous items such as repairs and cleaning supplies. Assume constant returns to scale (CRS) in these items, such that costs remain constant at $400/thousand birds. Multiply by 2 to convert from 2002 USD to 2014 USD. Thus, for each 5,000 birds miscellaneous costs will be $800 in 2014 USD.
Utilities Following Fanatico et al (2002), assume $20 for utilities to serve each 1,000 birds in 2002 USD ($40 in 2014 USD).
Labor Assume labor is a residual, and labor and management come together (family operated or owner-operated farm). Returns to labor and management will be an important “outcome variable” of the model.
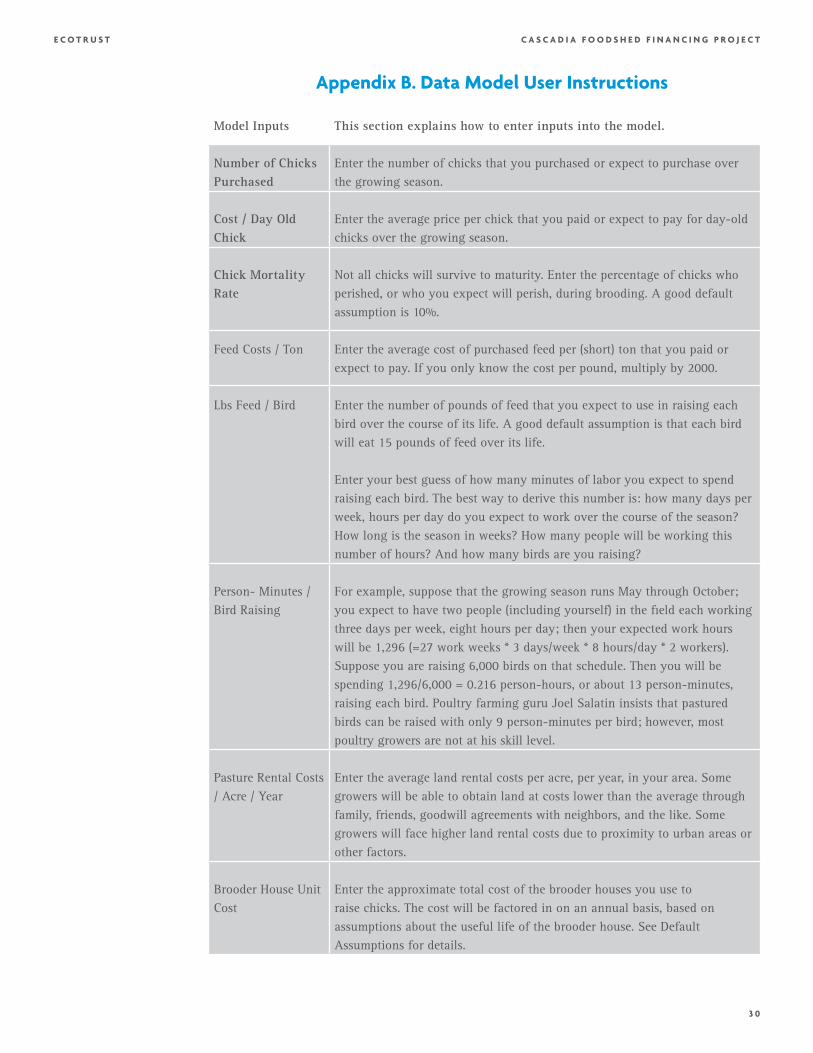
3 0
C A S C A D I A F O O D S H E D F I N A N C I N G P R O J E C TE C O T R U S T
Appendix B. Data Model User Instructions
Model Inputs This section explains how to enter inputs into the model.
Number of Chicks Purchased
Enter the number of chicks that you purchased or expect to purchase over the growing season.
Cost / Day Old Chick
Enter the average price per chick that you paid or expect to pay for day-old chicks over the growing season.
Chick Mortality Rate
Not all chicks will survive to maturity. Enter the percentage of chicks who perished, or who you expect will perish, during brooding. A good default assumption is 10%.
Feed Costs / Ton Enter the average cost of purchased feed per (short) ton that you paid or expect to pay. If you only know the cost per pound, multiply by 2000.
Lbs Feed / Bird Enter the number of pounds of feed that you expect to use in raising each bird over the course of its life. A good default assumption is that each bird will eat 15 pounds of feed over its life.
Enter your best guess of how many minutes of labor you expect to spend raising each bird. The best way to derive this number is: how many days per week, hours per day do you expect to work over the course of the season? How long is the season in weeks? How many people will be working this number of hours? And how many birds are you raising?
Person- Minutes / Bird Raising
For example, suppose that the growing season runs May through October; you expect to have two people (including yourself) in the field each working three days per week, eight hours per day; then your expected work hours will be 1,296 (=27 work weeks * 3 days/week * 8 hours/day * 2 workers). Suppose you are raising 6,000 birds on that schedule. Then you will be spending 1,296/6,000 = 0.216 person-hours, or about 13 person-minutes, raising each bird. Poultry farming guru Joel Salatin insists that pastured birds can be raised with only 9 person-minutes per bird; however, most poultry growers are not at his skill level.
Pasture Rental Costs / Acre / Year
Enter the average land rental costs per acre, per year, in your area. Some growers will be able to obtain land at costs lower than the average through family, friends, goodwill agreements with neighbors, and the like. Some growers will face higher land rental costs due to proximity to urban areas or other factors.
Brooder House Unit Cost
Enter the approximate total cost of the brooder houses you use to raise chicks. The cost will be factored in on an annual basis, based on assumptions about the useful life of the brooder house. See Default Assumptions for details.
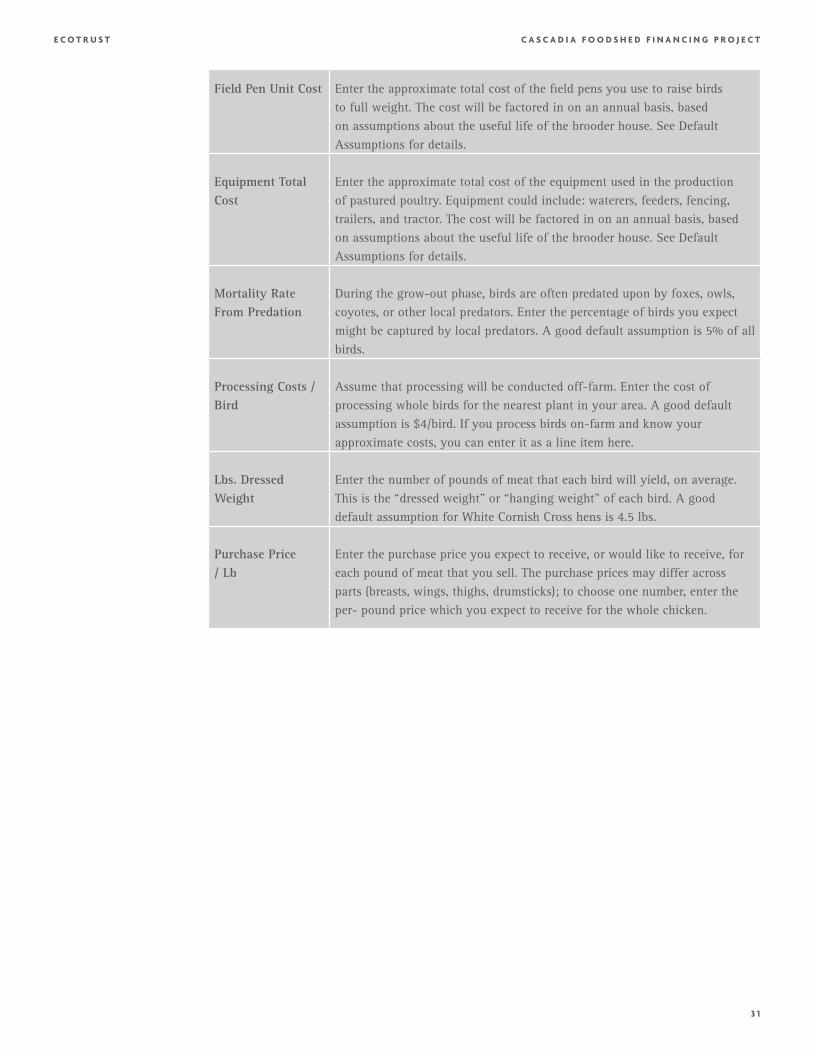
3 1
C A S C A D I A F O O D S H E D F I N A N C I N G P R O J E C TE C O T R U S T
Field Pen Unit Cost Enter the approximate total cost of the field pens you use to raise birds to full weight. The cost will be factored in on an annual basis, based on assumptions about the useful life of the brooder house. See Default Assumptions for details.
Equipment Total Cost
Enter the approximate total cost of the equipment used in the production of pastured poultry. Equipment could include: waterers, feeders, fencing, trailers, and tractor. The cost will be factored in on an annual basis, based on assumptions about the useful life of the brooder house. See Default Assumptions for details.
Mortality Rate From Predation
During the grow-out phase, birds are often predated upon by foxes, owls, coyotes, or other local predators. Enter the percentage of birds you expect might be captured by local predators. A good default assumption is 5% of all birds.
Processing Costs / Bird
Assume that processing will be conducted off-farm. Enter the cost of processing whole birds for the nearest plant in your area. A good default assumption is $4/bird. If you process birds on-farm and know your approximate costs, you can enter it as a line item here.
Lbs. Dressed Weight
Enter the number of pounds of meat that each bird will yield, on average. This is the “dressed weight” or “hanging weight” of each bird. A good default assumption for White Cornish Cross hens is 4.5 lbs.
Purchase Price/ Lb
Enter the purchase price you expect to receive, or would like to receive, for each pound of meat that you sell. The purchase prices may differ across parts (breasts, wings, thighs, drumsticks); to choose one number, enter the per- pound price which you expect to receive for the whole chicken.
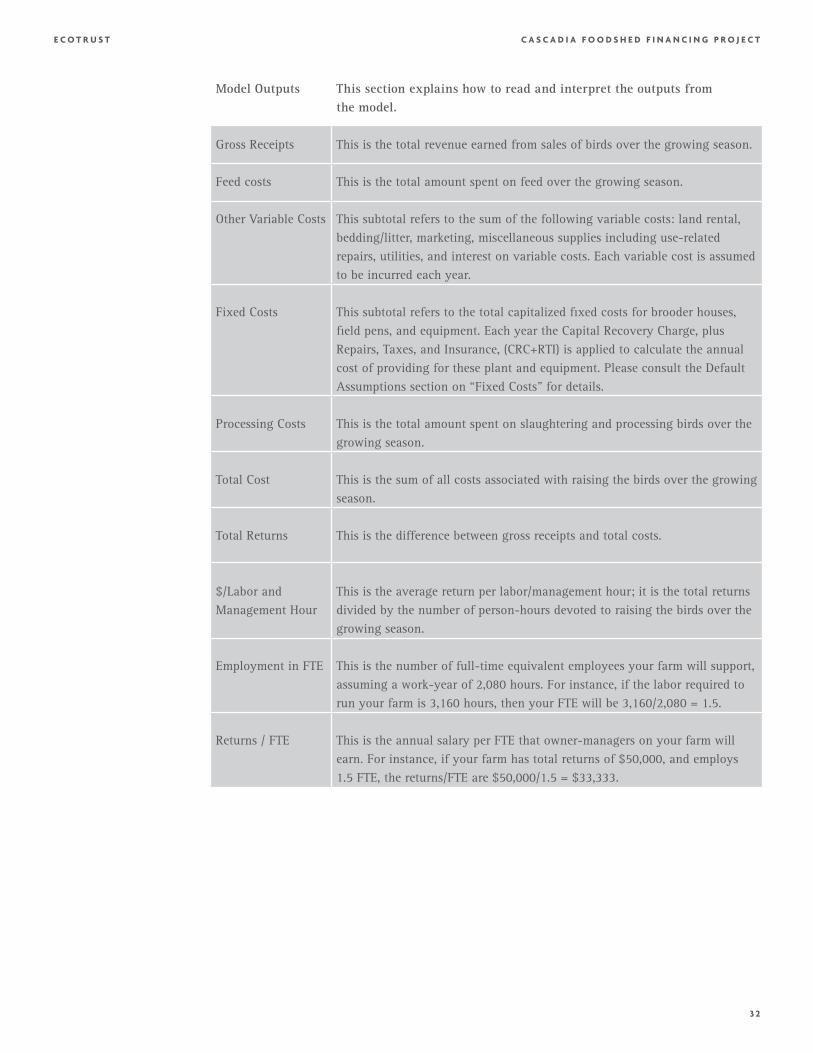
3 2
C A S C A D I A F O O D S H E D F I N A N C I N G P R O J E C TE C O T R U S T
Model Outputs This section explains how to read and interpret the outputs from the model.
Gross Receipts This is the total revenue earned from sales of birds over the growing season.
Feed costs This is the total amount spent on feed over the growing season.
Other Variable Costs This subtotal refers to the sum of the following variable costs: land rental, bedding/litter, marketing, miscellaneous supplies including use-related repairs, utilities, and interest on variable costs. Each variable cost is assumed to be incurred each year.
Fixed Costs This subtotal refers to the total capitalized fixed costs for brooder houses, field pens, and equipment. Each year the Capital Recovery Charge, plus Repairs, Taxes, and Insurance, (CRC+RTI) is applied to calculate the annual cost of providing for these plant and equipment. Please consult the Default Assumptions section on “Fixed Costs” for details.
Processing Costs This is the total amount spent on slaughtering and processing birds over the growing season.
Total Cost This is the sum of all costs associated with raising the birds over the growing season.
Total Returns This is the difference between gross receipts and total costs.
$/Labor and Management Hour
This is the average return per labor/management hour; it is the total returns divided by the number of person-hours devoted to raising the birds over the growing season.
Employment in FTE This is the number of full-time equivalent employees your farm will support, assuming a work-year of 2,080 hours. For instance, if the labor required to run your farm is 3,160 hours, then your FTE will be 3,160/2,080 = 1.5.
Returns / FTE This is the annual salary per FTE that owner-managers on your farm will earn. For instance, if your farm has total returns of $50,000, and employs 1.5 FTE, the returns/FTE are $50,000/1.5 = $33,333.

7 21 N W 9 TH Av E N U E , PO RTL AN D, O R EGO N ECOTRU ST.O RG 503 . 2 27. 62 2 5
Chicken
For more than twenty years, Ecotrust has converted $80 million in grants into more than $800
million in assets for local people, businesses, and organizations from Alaska to California. Ecotrust’s
many innovations include cofounding an environmental bank, starting the world’s first ecosystem
investment fund, creating programs in fisheries, forestry, food, farms, and social finance, and
developing new tools to improve social, economic, and environmental decision-making. Ecotrust
honors and supports the wisdom of Native and First Nation leadership in its work. Learn more at
www.ecotrust.org
This research was made possible through a generous grant from Meyer Memorial Trust. We at Ecotrust appreciate the ongoing support and partnership of an organization so thoughtfully pursuing reliable prosperity for all Oregonians.
Meyer Memorial Trust’s mission is to work with and invest in organizations, communities, ideas, and
efforts that contribute to a flourishing and equitable Oregon by using a mix of strategic, proactive,
and responsive investments, including grantmaking, loans, initiatives, commissioning research,
supporting policy advocacy, and a range of community and nonprofit engagement strategies.
By Ecotrust, with Matthew BuckFunded by Meyer Memorial Trust
April 2015
Oregon Food Infrastructure Gap AnalysisWhere Could Investment Catalyze Regional
Food System Growth and Development?
Project TeamAmanda Oborne, VP, Food & Farms, Ecotrust
Matthew Buck, Matthew Buck Consulting
Lauren Gwin, PhD, Associate Director, Center for Small Farms &
Community Food Systems at Oregon State University
Michael Mertens, PhD, Director, Knowledge Systems, Ecotrust
Stacey Sobell, Director, Food & Farms, Ecotrust
Katy Pelissier, Program Coordinator, Food & Farms, Ecotrust
Angela Hedstrom, Farm to School Assistant, Ecotrust
Jocelyn Tutak, GIS Analyst, Ecotrust
Noah Enelow, PhD, Economist, Ecotrust
William Moore, Senior Developer, Ecotrust
Ryan Sullivan, Graphic Design, Paste in Place
AdvisorsJeff Harvey, CEO, Burgerville
Ashley Henry, Community Engagement Manager, Beneficial State Foundation
Sayer Jones, Director of Finance and Mission Related Investing, Meyer
Memorial Trust
Nathan Kadish, Director of Investment Strategy, Ecotrust
John Klostermann, Director of Operations, Oregon Food Bank
Jason Lafferty, General Manager, SnoTemp
David McGivern, President, Northwest Food Processors Association
Mike Moran, General Manager, Columbia Plateau Producers (Shepherd’s Grain)
Katie Pearmine, Strategic Sourcing Manager, Oregon Food Bank
Gary Roth, Marketing Director, Oregon Department of Agriculture
Richard Satnick, Owner, Dick’s Kitchen
Stakeholders and ContributorsHannah Ancel, ACCESS
Susan Arakelian, Beaverton School District
Mark Anderson, Champoeg Farm
John Boyle, New Seasons Market
Denise Breyley, Whole Foods Market
Sarah Brown, Oregon Tilth
Caitlin Burke, Hacienda CDC
Sarah Cantril, El Huerto del Familia
Cory Carman, Carman Ranch
Karla Chambers, Stahlbush Island Farms
Bridget Cooke, Adelante Mujeres
Eecole Copen, Oregon Health Sciences University
Mitch Daugherty, Built Oregon
Fernando Divina, Oregon Health Sciences University
Piper Davis, Grand Central Baking
Chuck Eggert, Pacific Foods
Lynne Fessenden, Willamette Farm & Food Coalition
Joel Fisher, Oregon Business Association
Gitta Grether-Sweeney, Portland Public Schools
Amy Gilroy, Oregon Department of Agriculture
Rick Gruen, Clackamas County
Greg Higgins, Higgins Restaurant
Alan Hummel, New Seasons Market
Franklin Jones, B-Line Sustainable Urban Delivery
Reg Keddie, Pacific Foods
Jill Kuehler, formerly Friends of Zenger Farm
Spencer Masterson, Oregon Food Bank
Michael Madigan, Bowery Bagels
Chrissie Manion Zaerpoor, Kookoolan Farms
Laura Masterson, 47th Avenue Farm
Sarah Masoni, Food Innovation Center, Oregon State University
Nellie McAdams, Friends of Family Farmers
Michelle McGrath, Oregon Environmental Council
Gretchen Miller, Oregon Food Bank
Sara Miller, Northeast Economic Development District
Michael Morrissey, Food Innovation Center, Oregon State University
Jim Myers, PhD, Oregon State University
Ivan Mulaski, Friends of Family Farmers
Tanya Murray, Oregon Tilth
Ron Paul, James Beard Public Market
Peter Platt, Andina
Madeleine Pullman, PhD, Portland State University
Jared Pruch, Cascade Pacific RC&D
Teresa Retzlaff, North Coast Food Web
Trudy Tolliver, Portland Farmers’ Market
Chris Schreiner, Oregon Tilth
Lane Selman, Culinary Breeding Network
Wendy Siporen, Thrive
Emma Sirois, Healthcare Without Harm
Thomas Stratton, formerly Oregon Rural Action
Sarah Sullivan, Gorge Grown Food Network
Sharon Thornberry, Oregon Food Bank
Chris Tjersland, New Seasons Market
Katrina Van Dis, Central Oregon Intergovernmental Council
Lisa Vincent, Beaverton School District
Karen Wagner, formerly Oregon Rural Action
Bob Wise, Cogan Owens Greene
Philip Yates, ACCESS
Chicken
6
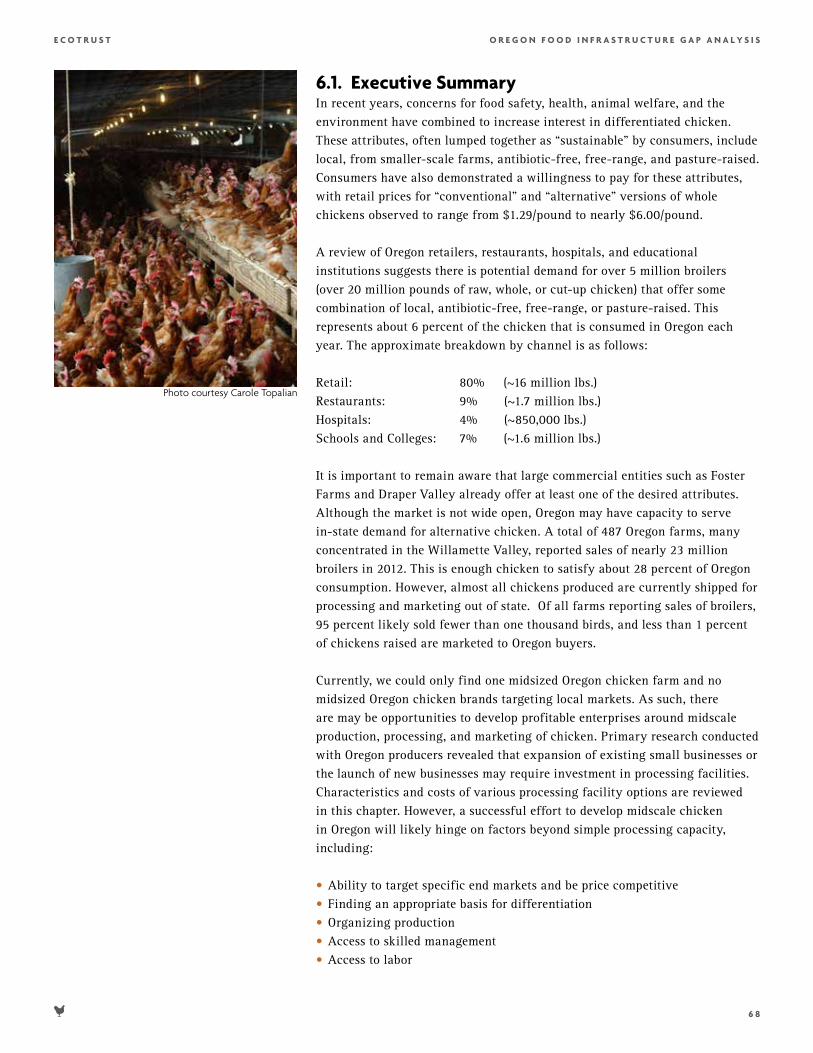
6 8
O R E G O N F O O D I N F R A S T R U C T U R E G A P A N A L Y S I SE C O T R U S T
6.1. Executive Summary In recent years, concerns for food safety, health, animal welfare, and the environment have combined to increase interest in differentiated chicken. These attributes, often lumped together as “sustainable” by consumers, include local, from smaller-scale farms, antibiotic-free, free-range, and pasture-raised. Consumers have also demonstrated a willingness to pay for these attributes, with retail prices for “conventional” and “alternative” versions of whole chickens observed to range from $1.29/pound to nearly $6.00/pound. A review of Oregon retailers, restaurants, hospitals, and educational institutions suggests there is potential demand for over 5 million broilers (over 20 million pounds of raw, whole, or cut-up chicken) that offer some combination of local, antibiotic-free, free-range, or pasture-raised. This represents about 6 percent of the chicken that is consumed in Oregon each year. The approximate breakdown by channel is as follows: Retail: 80% (~16 million lbs.)Restaurants: 9% (~1.7 million lbs.)Hospitals: 4% (~850,000 lbs.)Schools and Colleges: 7% (~1.6 million lbs.)
It is important to remain aware that large commercial entities such as Foster Farms and Draper Valley already offer at least one of the desired attributes. Although the market is not wide open, Oregon may have capacity to serve in-state demand for alternative chicken. A total of 487 Oregon farms, many concentrated in the Willamette Valley, reported sales of nearly 23 million broilers in 2012. This is enough chicken to satisfy about 28 percent of Oregon consumption. However, almost all chickens produced are currently shipped for processing and marketing out of state. Of all farms reporting sales of broilers, 95 percent likely sold fewer than one thousand birds, and less than 1 percent of chickens raised are marketed to Oregon buyers. Currently, we could only find one midsized Oregon chicken farm and no midsized Oregon chicken brands targeting local markets. As such, there are may be opportunities to develop profitable enterprises around midscale production, processing, and marketing of chicken. Primary research conducted with Oregon producers revealed that expansion of existing small businesses or the launch of new businesses may require investment in processing facilities. Characteristics and costs of various processing facility options are reviewed in this chapter. However, a successful effort to develop midscale chicken in Oregon will likely hinge on factors beyond simple processing capacity, including: • Ability to target specific end markets and be price competitive• Finding an appropriate basis for differentiation• Organizing production• Access to skilled management• Access to labor
Photo courtesy Carole Topalian
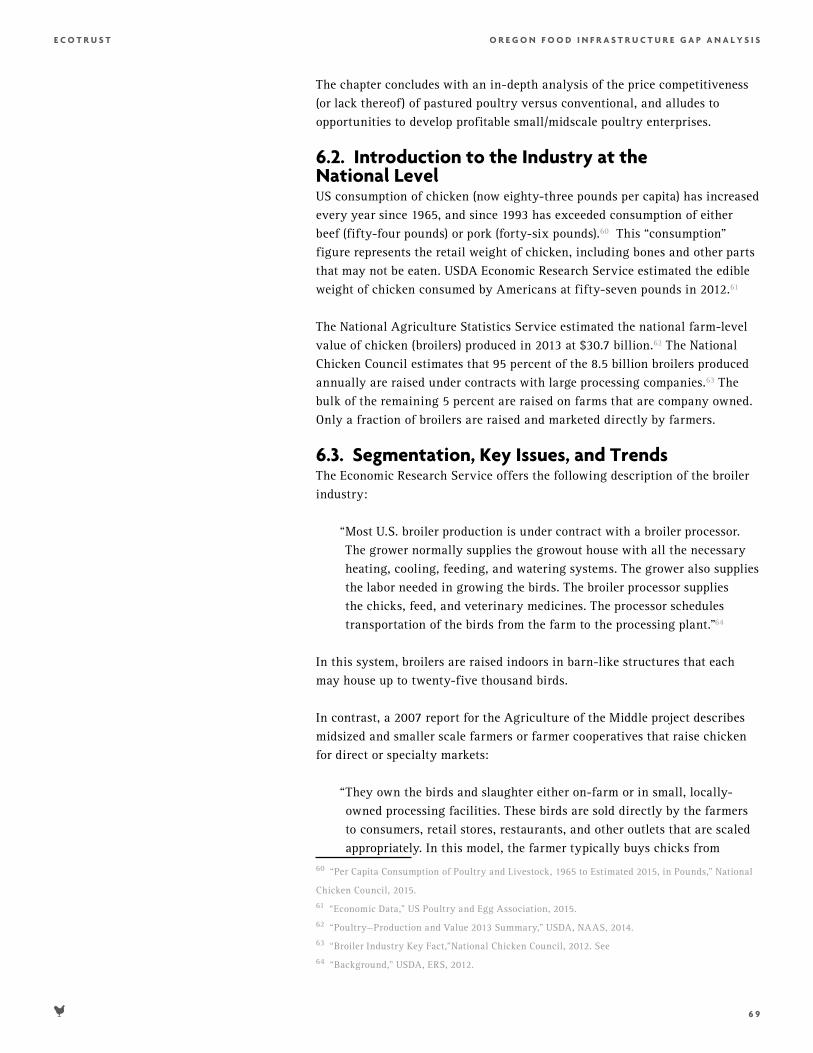
6 9
O R E G O N F O O D I N F R A S T R U C T U R E G A P A N A L Y S I SE C O T R U S T
The chapter concludes with an in-depth analysis of the price competitiveness (or lack thereof) of pastured poultry versus conventional, and alludes to opportunities to develop profitable small/midscale poultry enterprises.
6.2. Introduction to the Industry at the National LevelUS consumption of chicken (now eighty-three pounds per capita) has increased every year since 1965, and since 1993 has exceeded consumption of either beef (fifty-four pounds) or pork (forty-six pounds).60 This “consumption” figure represents the retail weight of chicken, including bones and other parts that may not be eaten. USDA Economic Research Service estimated the edible weight of chicken consumed by Americans at fifty-seven pounds in 2012.61 The National Agriculture Statistics Service estimated the national farm-level value of chicken (broilers) produced in 2013 at $30.7 billion.62 The National Chicken Council estimates that 95 percent of the 8.5 billion broilers produced annually are raised under contracts with large processing companies.63 The bulk of the remaining 5 percent are raised on farms that are company owned. Only a fraction of broilers are raised and marketed directly by farmers. 6.3. Segmentation, Key Issues, and Trends The Economic Research Service offers the following description of the broiler industry:
“ Most U.S. broiler production is under contract with a broiler processor. The grower normally supplies the growout house with all the necessary heating, cooling, feeding, and watering systems. The grower also supplies the labor needed in growing the birds. The broiler processor supplies the chicks, feed, and veterinary medicines. The processor schedules transportation of the birds from the farm to the processing plant.”64
In this system, broilers are raised indoors in barn-like structures that each may house up to twenty-five thousand birds. In contrast, a 2007 report for the Agriculture of the Middle project describes midsized and smaller scale farmers or farmer cooperatives that raise chicken for direct or specialty markets:
“ They own the birds and slaughter either on-farm or in small, locally-owned processing facilities. These birds are sold directly by the farmers to consumers, retail stores, restaurants, and other outlets that are scaled appropriately. In this model, the farmer typically buys chicks from
60 “Per Capita Consumption of Poultry and Livestock, 1965 to Estimated 2015, in Pounds,” National
Chicken Council, 2015. 61 “Economic Data,” US Poultry and Egg Association, 2015. 62 “Poultry—Production and Value 2013 Summary,” USDA, NAAS, 2014. 63 “Broiler Industry Key Fact,”National Chicken Council, 2012. See 64 “Background,” USDA, ERS, 2012.
7 0
O R E G O N F O O D I N F R A S T R U C T U R E G A P A N A L Y S I SE C O T R U S T
a hatchery or feed mill and provides all the feed, lighting, housing, expertise, and other requirements for raising the birds. Farmers maintain control over the bird and its production. For processing, farmers can either conduct their own slaughter or work with a facility that is willing to provide processing.”65
In recent years, a number of issues have coalesced to raise concerns about conventional or “industrial” chicken and increase interest in alternative production models. These include:
• The quality and nutritive value of foods • The incidence of salmonella, e-coli, and other food-borne illnesses• Routine use of antibiotics in the livestock industry• Animal welfare and the conditions under which chickens are raised and
slaughtered• The environmental impacts of concentrated animal feeding operations These concerns have created opportunities for chicken producers to differentiate their products and access potentially profitable niche markets by marketing broilers with a variety of characteristics and claims, sometimes combined under the heading “sustainable.” These include:
• Heritage poultry varieties• Pasture-raised (typically small numbers of chickens raised in open-air
fenced enclosures)• Free-range (typically large numbers of birds raised in closed barns, but
without cages)• No antibiotics used (commonly known as “antibiotic-free” and shortened to
“ABF”)• Organic certified• Animal welfare certified (Animal Welfare Approved, Certified Humane,
Food Alliance, etc.) While advocates like Health Care Without Harm66 and institutional purchasers like Bon Appétit Management Company67 have promoted or made commitments to purchasing more sustainably produced chicken, availability and price remain challenges for procurement managers. The price difference for conventional and alternative chicken can be significant, as demonstrated by a snapshot of Portland retail prices in September 2014:
• Conventional chicken on sale at a major grocer for $1.29/pound (Foster Farms);
• Free-range, ABF chicken available at New Seasons Market for $1.99/pound (Draper Valley); and
65 “Poultry of the Middle in the US,” The Agriculture-of-the-Middle Initiative, 2007. 66 “Purchaser’s Guide to Sourcing Sustainable Poultry,” Health Care Without Harm, (n.d.). 67 “Animal Welfare,” Bon Appétit Management Company, (n.d.).
7 1
O R E G O N F O O D I N F R A S T R U C T U R E G A P A N A L Y S I SE C O T R U S T
• Pasture-raised chicken available direct from Kookoolan Farms in Yamhill, Oregon, at $5.89/pound.
Despite higher prices overall for differentiated products, midsized and smaller-scale farmers pursuing niche markets must earn a margin that enables profitability in spite of typically higher per unit production, processing, and marketing costs. The Agriculture of the Middle report describes the challenges:
“Typically, as small and medium-sized poultry producers grow, there are two tasks that are essential to their set-up, operations, and survival. These companies must seek out a product/niche that will distinguish their company. They must also create for themselves the infrastructure needed to get their product from farm to consumer. The infrastructure needed includes all of the resources that integrated companies own: access to genetics, hatcheries, feed, processing facilities, distribution, marketing, sales staff, and more.”68
In addition, increasing interest in ABF chicken on the part of commercial buyers, including mainstream restaurant chains like Chipotle,69 Chick-fil-A,70 and more recently McDonald’s and Costco, 71 is driving change in the industry and making that product more available and more affordable. This was demonstrated with a 2014 announcement by Perdue,72 the third largest US chicken producer, on a phase-out of antibiotics important for human use in their facilities. 6.4. Demand for Chicken in Oregon Understanding market demand is critical to evaluating potential investments to increase production and profitability of local and more “sustainable” chicken. 6.4.1. Consumer Spending on Chicken According to the Bureau of Labor Statistics73, the average household (2.6 persons) in the western US spent $7,180 on food at home (59 percent) and away (41 percent) in 2013. This includes $169 spent on all types of poultry for at-home consumption. Agricultural Marketing Resource Center74 figures show that production and sale of poultry for meat in the US is dominated by chicken (82 percent) and turkey (18 percent). 68 “Poultry of the Middle: ‘Implications for Sustainable Producers and Scaling Up,’” The
Agriculture-of-the-Middle Initiative, 2007. 69 “Chipotle Sets the Record Straight on Antibiotics, Hormones,” Meat and Poultry, 2013. 70 “Chick-fil-A to Serve Antibiotic-Free Chicken,” Elizabeth Landau, CNN, 2014. 71 “America’s Hunger for Antibiotic-Free Chicken Is Becoming a Costly Headache for Chicken
Suppliers,” P.J. Huffstutter and Lisa Baertlen, Reuters, 2015.
72 “Perdue Cuts Way Back on Use of Antibiotics in Chicken,” Bruce Horvitz, USA Today, 2014. 73 “Region of residence: Annual expenditure means, shares, standard errors, and coefficient of
variation,” Consumer Expenditure Survey, 2013. 74 “Commodity Poultry Profile,” Agricultural Marketing Resource Center, 2012.
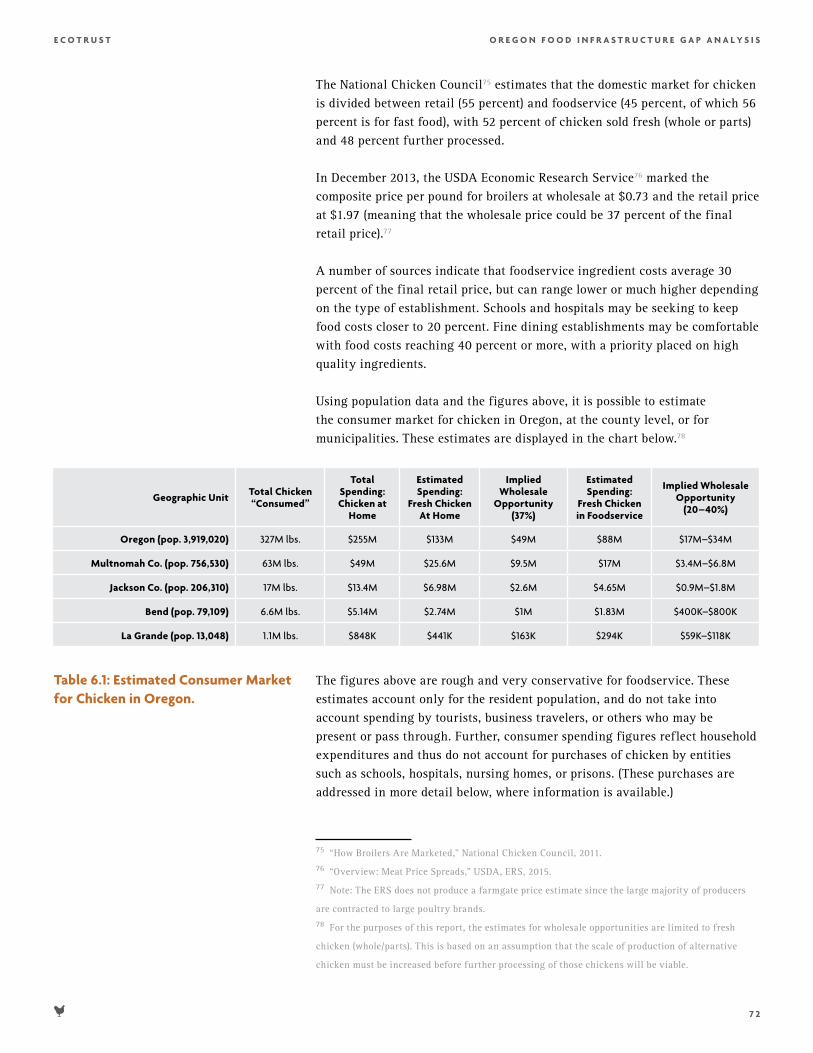
7 2
O R E G O N F O O D I N F R A S T R U C T U R E G A P A N A L Y S I SE C O T R U S T
The National Chicken Council75 estimates that the domestic market for chicken is divided between retail (55 percent) and foodservice (45 percent, of which 56 percent is for fast food), with 52 percent of chicken sold fresh (whole or parts) and 48 percent further processed. In December 2013, the USDA Economic Research Service76 marked the composite price per pound for broilers at wholesale at $0.73 and the retail price at $1.97 (meaning that the wholesale price could be 37 percent of the final retail price).77 A number of sources indicate that foodservice ingredient costs average 30 percent of the final retail price, but can range lower or much higher depending on the type of establishment. Schools and hospitals may be seeking to keep food costs closer to 20 percent. Fine dining establishments may be comfortable with food costs reaching 40 percent or more, with a priority placed on high quality ingredients. Using population data and the figures above, it is possible to estimate the consumer market for chicken in Oregon, at the county level, or for municipalities. These estimates are displayed in the chart below.78
Geographic Unit Total Chicken “Consumed”
Total Spending: Chicken at
Home
Estimated Spending:
Fresh Chicken At Home
Implied Wholesale
Opportunity (37%)
Estimated Spending:
Fresh Chicken in Foodservice
Implied Wholesale Opportunity
(20–40%)
Oregon (pop. 3,919,020) 327M lbs. $255M $133M $49M $88M $17M–$34M
Multnomah Co. (pop. 756,530) 63M lbs. $49M $25.6M $9.5M $17M $3.4M–$6.8M
Jackson Co. (pop. 206,310) 17M lbs. $13.4M $6.98M $2.6M $4.65M $0.9M–$1.8M
Bend (pop. 79,109) 6.6M lbs. $5.14M $2.74M $1M $1.83M $400K–$800K
La Grande (pop. 13,048) 1.1M lbs. $848K $441K $163K $294K $59K–$118K
The figures above are rough and very conservative for foodservice. These estimates account only for the resident population, and do not take into account spending by tourists, business travelers, or others who may be present or pass through. Further, consumer spending figures reflect household expenditures and thus do not account for purchases of chicken by entities such as schools, hospitals, nursing homes, or prisons. (These purchases are addressed in more detail below, where information is available.)
75 “How Broilers Are Marketed,” National Chicken Council, 2011. 76 “Overview: Meat Price Spreads,” USDA, ERS, 2015. 77 Note: The ERS does not produce a farmgate price estimate since the large majority of producers
are contracted to large poultry brands.78 For the purposes of this report, the estimates for wholesale opportunities are limited to fresh
chicken (whole/parts). This is based on an assumption that the scale of production of alternative
chicken must be increased before further processing of those chickens will be viable.
Table 6.1: Estimated Consumer Market for Chicken in Oregon.
7 3
O R E G O N F O O D I N F R A S T R U C T U R E G A P A N A L Y S I SE C O T R U S T
It should also be reiterated that the large majority of chicken consumed comes from lowest-cost commodity producer/processors. This has bearing on interpreting the scope of the implied wholesale opportunities referenced above. In reality, the opportunity for higher priced chicken with special attributes (pasture-raised, etc.) is only a fraction of the estimates provided—likely well under 10 percent. 6.4.2. Market Channels Chicken makes its way from farm to market through a number of channels both direct and wholesale. 6.4.2.1. Direct MarketA growing number of small-scale farmers in Oregon are raising broilers. A good portion of that increase is likely due to the 2011 passage of the one thousand bird “On-Farm Sale Exemption,” which allows small poultry producers without a state-licensed processing facility to process and sell their own fresh or frozen birds to consumers who come to the farm to make their purchase. Farmers that do operate or access a state-licensed processing facility have additional opportunities to sell to consumers through farmers’ markets, or direct to retailers and restaurants. The primary limitations on growth of direct sale chicken are inconvenience and cost. Only a limited number of consumers will be willing or able to travel to a farm or farmers’ market to make purchases. Birds are typically sold whole and may be frozen, adding to the inconvenience. A four-pound bird may also cost over twenty dollars, as much as three times the cost of a conventional bird sold precut in pieces in a supermarket. Higher-end restaurants and grocery retailers are interested in procuring local, pasture-raised birds from farmers, but need assurances for quality, consistency, and predictable availability. Farmers selling to restaurants and retailers must also be able to manage without receiving the full price paid by consumers at the farm or farmers’ markets. Currently, only a handful of Oregon farmers have both access to state-licensed processing and sufficient volume to serve restaurants and retailers successfully. 6.4.2.2. Processing/ManufacturingThere are few examples of food processors/manufacturers deliberately sourcing Oregon-grown chicken as an ingredient. This is due in major part to the lack of access to USDA-licensed poultry processing necessary for sale of finished products across state lines. The most notable example is Pacific Natural Foods (PNF), which has vertically integrated to ensure supplies for its line of packaged broths and soups. PNF helped restart a shuttered hatchery in Oregon to supply chicks for its own farm, and now raises a growing percentage of its own chickens and turkeys. PNF also owns Dayton Natural Meats, the only USDA-licensed poultry processor in Oregon, which handles about ten thousand birds a week for PNF’s use. PNF managers report that
7 4
O R E G O N F O O D I N F R A S T R U C T U R E G A P A N A L Y S I SE C O T R U S T
about 80 percent of their ingredients are certified organic, that 45 percent of their ingredients come from local sources, and that they would like to increase both percentages. 6.4.2.3. Retail US Census County Business Patterns data indicate there were 763 grocery stores and 56 independent meat markets in Oregon in 2012. Many grocery stores are outlets of major chains, like Safeway and Kroger, which are likely too large to integrate smaller local chicken suppliers. However, there are also about 80 independent or natural food stores, including New Seasons Market (15 stores), Market of Choice (9 stores), Whole Foods Market (8 stores in Oregon), Zupan’s (4 stores), and about a dozen cooperative grocery stores (such as People’s Food or Oceana Natural Food), that may be interested in relationships with local suppliers. One local multi-store retailer sells between thirty-five thousand and fifty thousand birds per week. Those birds come primarily from Draper Valley Farms (based in Washington), which is reportedly the only regional supplier capable of meeting the store’s requirements and volume demand. Attributes sought include free-range birds, raised without antibiotics, Non-GMO Project Verified, fresh (not frozen) and preferably air-chilled (not water chilled) for better flavor. The stores buy both whole birds and parts. In the past, the retailer has bought limited numbers of fresh, pasture-raised chickens from Kookoolan Farms (Yamhill, Oregon) and Botony Bay Farms (Brush Prairie, Washington) seasonally. The capacity of those farms to supply birds is the major limit on the relationship. The store’s meat manager describes a vision for procurement in the future in which stores would offer customers three tiers of options for chicken:
• A standard product from Draper Valley Farms, representing 60–70 percent of volume.
• An exclusive private label product, representing 30–40 percent of volume. Product in this line would come from source-identified farms that are members of a local or regional marketing group (like Country Natural Beef or Umpqua Valley Lamb). Chickens would ideally be pastured in season, and raised free range in barns during winter months.
• The store would also continue to support small local farms by offering branded whole birds, fresh in season.
Extrapolating this retailer’s sales volume and vision of having about a third of chicken from identified local/regional farms across eighty independent and natural food stores, suggests there could be an annual market for as many as 4 million local ABF birds (about 16 million pounds total). 6.4.2.4. Restaurants US Census County Business Patterns data indicate there were 3,974 full-service restaurants (not including limited service “fast food”) and 123 catering
7 5
O R E G O N F O O D I N F R A S T R U C T U R E G A P A N A L Y S I SE C O T R U S T
companies in Oregon in 2012. The top 10 percent may be considered “fine dining” and more likely to be engaged in procurement of local products (though primarily through wholesalers). However, it is clear that interest in local is widespread across the industry. A 2014 National Restaurant Association survey on menu trends resulted in the following top three responses:
1. Locally sourced meats and seafood 2. Locally grown produce 3. Environmental sustainability An earlier survey of members of Chefs Collaborative, a national network of more than one thousand chefs that support sustainable cuisine, also found significant support for local foods:
• 90 percent use locally grown food on their menus and in advertising• 81 percent have purchased ingredients directly from farmers• 34 percent purchase more than 50 percent of food from local sources Even some fast casual restaurants, such as the regional Burgerville chain, are promoting local ingredients. A 2008 feasibility study79 for pasture poultry production and processing in Washington’s Puget Sound region estimated restaurants would purchase twenty birds per week. Using that estimate for 397 Oregon restaurants (top 10 percent) suggests a market for 413,000 birds (about 1.7 million pounds total). This estimate is likely conservative. 6.4.2.5. HospitalsHealth Care Without Harm (HCWH) is an international environmental health organization that supports sustainable food procurement at hospitals and healthcare facilities, including sourcing of antibiotic-free chicken. A 2008 report80 by HCWH indicated that 42 percent of 112 hospitals surveyed were buying some quantity of antibiotic-free poultry, and that another 47 percent had plans to start sourcing hormone- and antibiotic-free meat products. A contributor to the report, the Oregon Center for Environmental Health, documented four Portland-area hospitals purchasing a total of 129,720 pounds of chicken in 2007, with 10–20 percent (13,000–26,000 pounds) from antibiotic-free sources. Follow-on inquiries about food procurement by Oregon Physicians for Social Responsibility in 2009 and 2012 resulted in six detailed reports of chicken purchases from five Portland-area hospitals. Combined, the five institutions 79 “Pasture Poultry Production and Processing Feasability in the Puget Sound Region,” Bruce
Dunlop, Cascade Harvest Coalition, 2008. 80 “Menu of Change: Healthy Food in Health Care,” Health Care Without Harm, 2008.
7 6
O R E G O N F O O D I N F R A S T R U C T U R E G A P A N A L Y S I SE C O T R U S T
represent about 1,850 hospital beds and reported purchasing about 260,000 pounds of whole chicken and cut-up chicken parts annually (not including cooked, breaded, or other processed chicken). Extrapolating from those five institutions to Oregon’s 33 private hospitals and 6,008 total hospital beds, this suggests hospitals could represent a market for about 210,000 ABF birds (a total of 845,000 pounds). With an additional 12,403 beds in Oregon’s licensed nursing care facilities, there is potential for the health care sector’s demand to be even greater. Conclusions should be tempered with the knowledge that price remains a major consideration for foodservice in healthcare. If ABF chicken is available from large, conventional suppliers, the added value of local products from smaller-farm suppliers may not be enough to justify paying a price premium. 6.4.2.6. Schools and CollegesSchool Food FOCUS is a national collaborative that is working with fifteen large school districts across the US (including Portland Public Schools and the Beaverton School District in Oregon) to make school meals nationwide healthier, regionally sourced, and sustainably produced, and has also made antibiotic-free chicken a priority.81 Reported purchasing of chicken in 2011–2012 by the fifteen member districts totaled approximately $16 million. In Oregon, approximately 24 percent of school food budgets are spent on local food—the highest percentage in the nation (USDA, 2014). Two large urban school districts (Portland Public Schools and Beaverton School District) have asked Ecotrust to help them procure regionally produced chicken raised without antibiotics. Schools, with limited budgets and limited ability to prepare fresh foods, offer an interesting procurement challenge. In the 2013–14 school year, Portland Public Schools (PPS) purchased more than 320,000 pounds of chicken, of which just over 13,000 pounds was purchased locally. Procurement staff report that the district prefers to source dark meat, which is harder to overcook and holds well in warmers. They prefer drumsticks, which are lower-cost and a convenient means to meet a required two-ounce protein requirement for meals (one drumstick from a three to three-and-a-half pound bird contains approximately one ounce of lean meat). In 2013, PPS served chicken raised without antibiotics sourced from Oregon and Washington twice, spending $23,462 to provide two drumsticks with each meal—about one dollar per serving (estimate: two dollars per pound). Portland Public says it would consider serving local drumsticks monthly if costs were lower. While thighs are potentially more expensive, they have higher yield, less waste, and can also be used in more menu items. If boneless thighs (whole muscle only) were available at the right price, local chicken could be served weekly. 81 “Collaborative Across the Plate: Hatching New Ideas for Chicken,” School Food Focus, (n.d).
7 7
O R E G O N F O O D I N F R A S T R U C T U R E G A P A N A L Y S I SE C O T R U S T
Beaverton School District reports that it is not currently sourcing any local, antibiotic-free chicken, but would be willing to feature it on menus two to four times per month depending on affordability. Beaverton officials quoted one dollar per serving (two drumsticks) as the maximum they would consider, saying a price of fifty cents per serving would be ideal. A case study82 published by School Food FOCUS describes procurement of over 500,000 pounds of fresh, local drumsticks by St. Paul and Chicago Public School Districts, with costs quoted as low as twenty cents per serving (estimate: eighty cents per pound). Jeffco Public Schools in Colorado has also reported serving local ABF drumsticks once a month at a cost of forty-four cents per pound. Portland Public Schools has enrollment of about 46,000 students, serves 21,000 lunches daily, and provided 11,500 servings of chicken in each of the two lunches in 2013 referenced above. Extrapolating to the 567,000 students enrolled in districts across Oregon suggests 141,750 total servings of chicken would be required each time chicken was served. If local ABF chicken was featured twice per month during the school year, that suggests a need for 2.6 million servings equating to 5.2 million drumsticks (2.6 million birds for drumsticks or about 300,000 for 1.2 million pounds of equivalent). Extending that same scenario to the approximately 190,000 students enrolled in Oregon universities and colleges suggests a need for at least another 400,000 pounds of chicken per year. 6.4.3. Demand SummaryCombining the estimates provided above for retail, restaurants, hospitals, and educational institutions suggests there is potential demand in Oregon for over 5 million broilers (over 20 million pounds of raw, whole, or cut-up chicken) that offer a combination of desired attributes including: local, antibiotic-free, free-range, or pasture-raised. This represents about 6 percent of the chicken that is consumed in Oregon each year. The approximate breakdown by channel is as follows:
Retail: 80% (~16 million lbs.)Restaurants: 9% (~1.7 million lbs.)Hospitals: 4% (~850,000 lbs.)Schools and Colleges: 7% (~1.6 million lbs.) As noted above, it is important to keep in mind that large commercial entities already offer at least one of the desired attributes and that the market is not wide open. The next section explores chicken production in Oregon and the state’s ability to meet this demand.82 “Why Can’t Schools Simply Cook a Chicken,” School Food Focus, (n.d.).
7 8
O R E G O N F O O D I N F R A S T R U C T U R E G A P A N A L Y S I SE C O T R U S T
6.5. Oregon Chicken Production Oregon is not considered a major producer of chicken. The 2012 USDA Census of Agriculture83 shows there are a total of 578 farms in Oregon raising broilers or other meat type chickens. The number of farms raising meat chickens has increased 45 percent since 2007 (from 395). A total of 487 Oregon farms reported sales of broilers in 2012, with a combined total of 22,789,036 birds sold. (This is actually a 7 percent decline since 2007—1.8 million fewer birds sold.) Oregon Agriculture Information Network data show the farmgate value of broilers sold in 2012 as $68 million or an average of $2.98 per bird. All told, Oregon farmers produce enough broilers to satisfy 28 percent of Oregon chicken consumption. However, as will be discussed in more detail below, almost all chickens produced in Oregon are shipped for processing out of state, with a good percentage of final products likely marketed out of state as well. Oregon chicken farms are concentrated in Clackamas (77), Yamhill (57), Marion (45), Linn (39), Lane (34), and Washington (29) counties. These six counties contain 58 percent of farms reporting sales of broilers. Map 6.1 shows the value of chicken broiler sales by county.
Of all farms reporting sales of broilers, 95 percent sold fewer than 2,000 birds (463 farms). Most are likely operating under the 1,000-bird processing exemption and so represent fewer than 450,000 birds total (1.8 million pounds at an average retail weight of 4 pounds per bird or 0.5 percent of Oregon consumption). Four farms reported sales between 2,000 and 15,999 birds. These operate under the federal 20,000-bird processing exemption84 and represent fewer than 64,000 birds total (256,000 pounds or less than 0.1 percent of Oregon consumption). No farms reported sales between 16,000 and 99,000 birds.
83 “Poultry—Inventory and Sales,” 2012 Census of Agriculture—County Data, (n.d.).84 Large poultry operations are required to have a Food Safety and Inspection Service (FSIS)
inspector present, and have continuous bird-by-bird inspection, during slaughter and processing.
Businesses/farms that slaughter or process less than twenty thousand birds/year can qualify for an
exemption from this regulation although the poultry cannot be distributed across state lines.
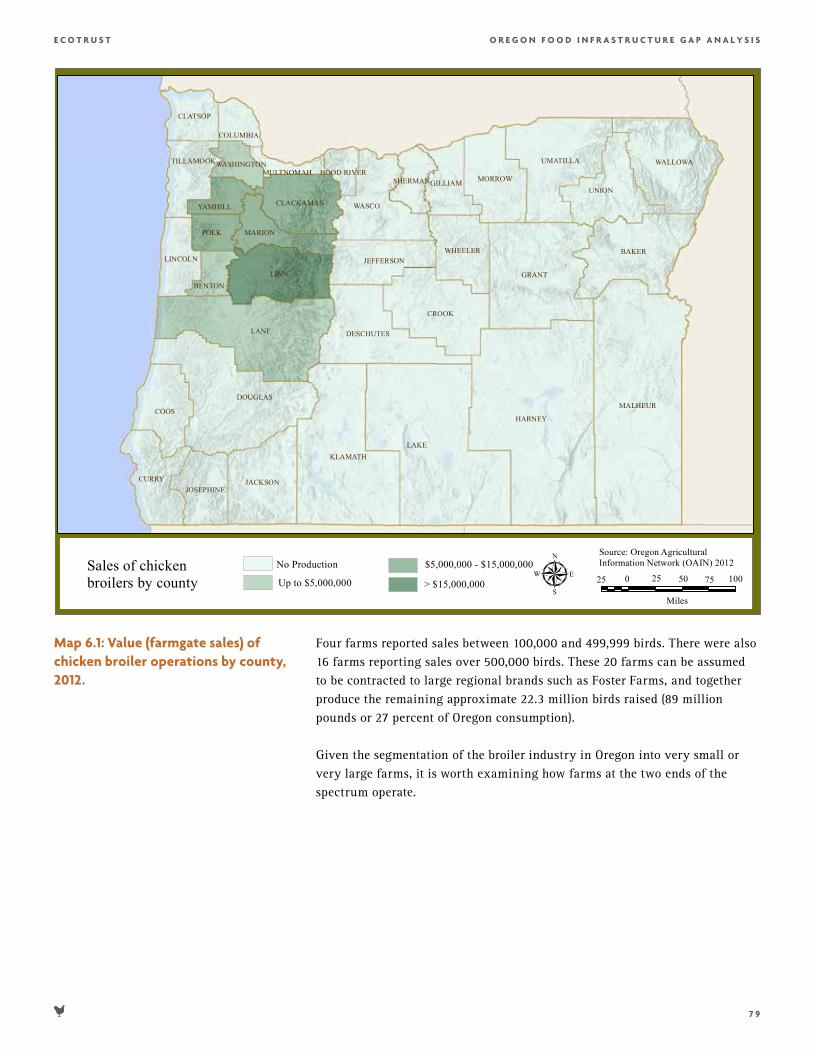
7 9
O R E G O N F O O D I N F R A S T R U C T U R E G A P A N A L Y S I SE C O T R U S T
Four farms reported sales between 100,000 and 499,999 birds. There were also 16 farms reporting sales over 500,000 birds. These 20 farms can be assumed to be contracted to large regional brands such as Foster Farms, and together produce the remaining approximate 22.3 million birds raised (89 million pounds or 27 percent of Oregon consumption). Given the segmentation of the broiler industry in Oregon into very small or very large farms, it is worth examining how farms at the two ends of the spectrum operate.
Map 6.1: Value (farmgate sales) of chicken broiler operations by county, 2012.
LAKE
HARNEY
MALHEUR
LANE
GRANT
KLAMATH
DOUGLAS
LINN
BAKER
CROOK
WASCO
UMATILLA
UNION
COOS
WALLOWA
JACKSONCURRY
DESCHUTES
MORROW
WHEELERJEFFERSON
CLACKAMAS
GILLIAM
MARION
JOSEPHINE
POLK
LINCOLN
CLATSOP
TILLAMOOK
BENTON
YAMHILL
COLUMBIA
SHERMAN
WASHINGTONHOOD RIVERMULTNOMAH
Sales of chickenbroilers by county µ
Source: Oregon AgriculturalInformation Network (OAIN) 2012
Miles
0 50 75 1002525No Production
Up to $5,000,000
$5,000,000 - $15,000,000
> $15,000,000
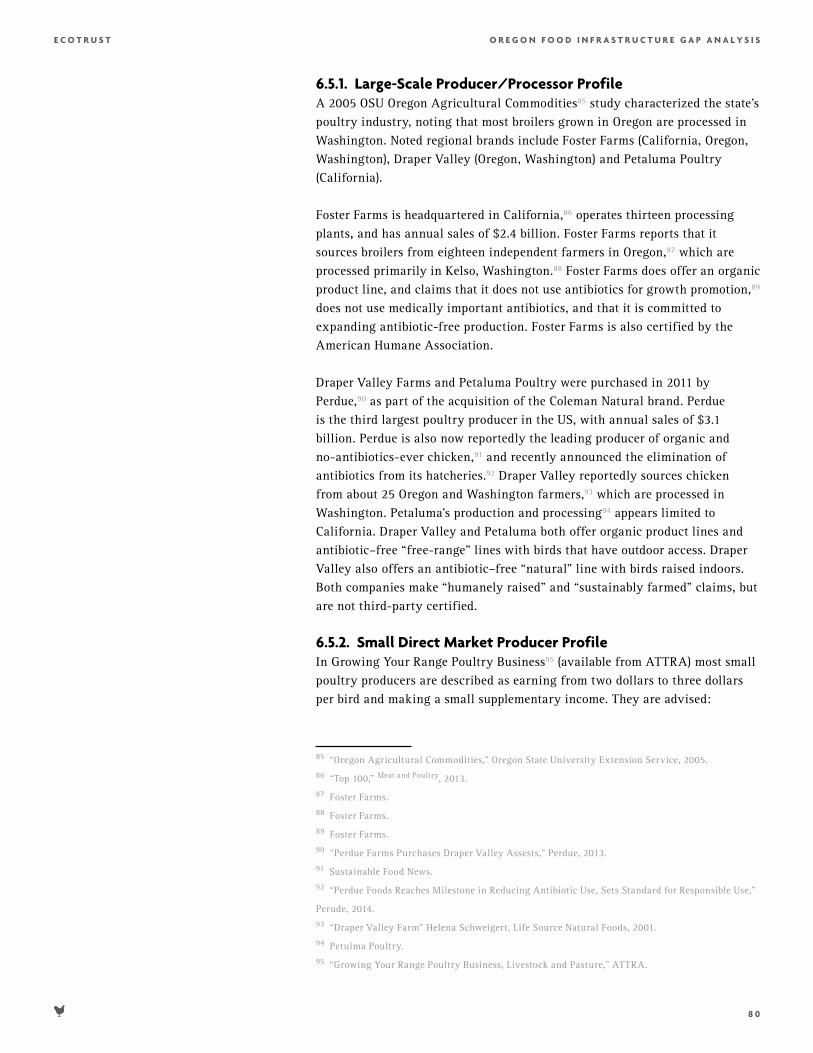
8 0
O R E G O N F O O D I N F R A S T R U C T U R E G A P A N A L Y S I SE C O T R U S T
6.5.1. Large-Scale Producer/Processor ProfileA 2005 OSU Oregon Agricultural Commodities85 study characterized the state’s poultry industry, noting that most broilers grown in Oregon are processed in Washington. Noted regional brands include Foster Farms (California, Oregon, Washington), Draper Valley (Oregon, Washington) and Petaluma Poultry (California). Foster Farms is headquartered in California,86 operates thirteen processing plants, and has annual sales of $2.4 billion. Foster Farms reports that it sources broilers from eighteen independent farmers in Oregon,87 which are processed primarily in Kelso, Washington.88 Foster Farms does offer an organic product line, and claims that it does not use antibiotics for growth promotion,89 does not use medically important antibiotics, and that it is committed to expanding antibiotic-free production. Foster Farms is also certified by the American Humane Association. Draper Valley Farms and Petaluma Poultry were purchased in 2011 by Perdue,90 as part of the acquisition of the Coleman Natural brand. Perdue is the third largest poultry producer in the US, with annual sales of $3.1 billion. Perdue is also now reportedly the leading producer of organic and no-antibiotics-ever chicken,91 and recently announced the elimination of antibiotics from its hatcheries.92 Draper Valley reportedly sources chicken from about 25 Oregon and Washington farmers,93 which are processed in Washington. Petaluma’s production and processing94 appears limited to California. Draper Valley and Petaluma both offer organic product lines and antibiotic–free “free-range” lines with birds that have outdoor access. Draper Valley also offers an antibiotic–free “natural” line with birds raised indoors. Both companies make “humanely raised” and “sustainably farmed” claims, but are not third-party certified. 6.5.2. Small Direct Market Producer ProfileIn Growing Your Range Poultry Business95 (available from ATTRA) most small poultry producers are described as earning from two dollars to three dollars per bird and making a small supplementary income. They are advised:
85 “Oregon Agricultural Commodities,” Oregon State University Extension Service, 2005. 86 “Top 100,” Meat and Poultry, 2013. 87 Foster Farms.88 Foster Farms.89 Foster Farms.90 “Perdue Farms Purchases Draper Valley Assests,” Perdue, 2013. 91 Sustainable Food News.92 “Perdue Foods Reaches Milestone in Reducing Antibiotic Use, Sets Standard for Responsible Use,”
Perude, 2014. 93 “Draper Valley Farm” Helena Schweigert, Life Source Natural Foods, 2001. 94 Petulma Poultry.95 “Growing Your Range Poultry Business, Livestock and Pasture,” ATTRA.
8 1
O R E G O N F O O D I N F R A S T R U C T U R E G A P A N A L Y S I SE C O T R U S T
“labor for a 1,000-bird-per-year enterprise is 20−22 hours per week over a four month production schedule, and the farmer can expect hourly earnings of about $10 per hour.” A larger-scale 5,000-bird enterprise “would require 35−42 hours of work per week over a six-month production schedule. With a net income of $18,000, an experienced farmer could expect to earn about $12−$18 per hour.” The guide also advises that “producers who process on-farm and direct market often see a real limit to the amount of birds they would even want to produce since it is a very labor-intensive enterprise,” suggesting that one thousand birds is a practical limit for most farmers with diversified operations. Farmers attempting to raise and market chicken on a larger scale must find access to commercial processing or invest resources to develop their own processing capacity. A 2011 High Country News article96 profiling several small Oregon chicken farmers and their challenges with processing makes clear this can be difficult. 6.5.3. The Missing Middle A major challenge to increasing production of alternative chicken in Oregon is a lack of midsized farms suitable to develop a brand and serve local and regional markets. Oregon simply does not have a midsized poultry company within the range between White Oak Pastures in Georgia (that processes 200,000 birds/year) or TFC Poultry in the upper Midwest (that processes 1.4 million birds/year). What would be necessary to recreate the missing middle? Can existing small poultry producers can grow into that space or aggregate production to serve that role?
96 “Small Poultry Farmers Grapple with Lack of Slaughterhouses,” Carla A. Wise, High Country News,
2011.
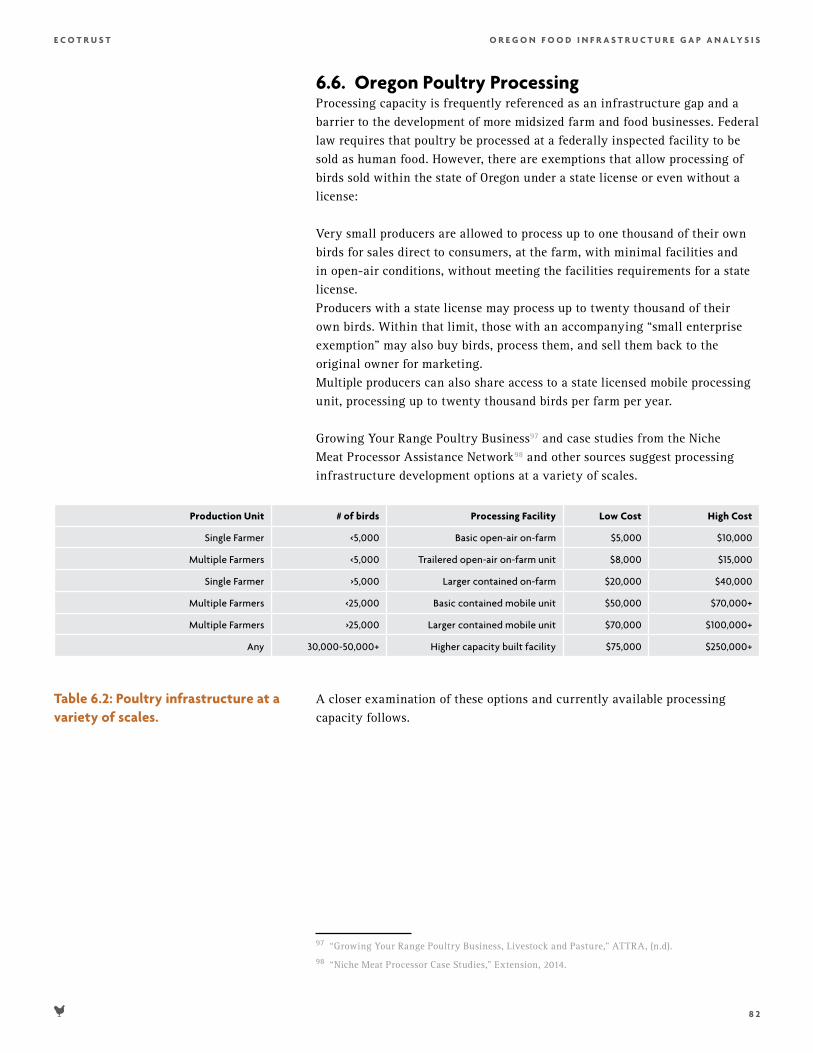
8 2
O R E G O N F O O D I N F R A S T R U C T U R E G A P A N A L Y S I SE C O T R U S T
Table 6.2: Poultry infrastructure at a variety of scales.
6.6. Oregon Poultry Processing Processing capacity is frequently referenced as an infrastructure gap and a barrier to the development of more midsized farm and food businesses. Federal law requires that poultry be processed at a federally inspected facility to be sold as human food. However, there are exemptions that allow processing of birds sold within the state of Oregon under a state license or even without a license:
Very small producers are allowed to process up to one thousand of their own birds for sales direct to consumers, at the farm, with minimal facilities and in open-air conditions, without meeting the facilities requirements for a state license. Producers with a state license may process up to twenty thousand of their own birds. Within that limit, those with an accompanying “small enterprise exemption” may also buy birds, process them, and sell them back to the original owner for marketing. Multiple producers can also share access to a state licensed mobile processing unit, processing up to twenty thousand birds per farm per year. Growing Your Range Poultry Business97 and case studies from the Niche Meat Processor Assistance Network98 and other sources suggest processing infrastructure development options at a variety of scales.
Production Unit # of birds Processing Facility Low Cost High Cost
Single Farmer <5,000 Basic open-air on-farm $5,000 $10,000
Multiple Farmers <5,000 Trailered open-air on-farm unit $8,000 $15,000
Single Farmer >5,000 Larger contained on-farm $20,000 $40,000
Multiple Farmers <25,000 Basic contained mobile unit $50,000 $70,000+
Multiple Farmers >25,000 Larger contained mobile unit $70,000 $100,000+
Any 30,000-50,000+ Higher capacity built facility $75,000 $250,000+
A closer examination of these options and currently available processing capacity follows.
97 “Growing Your Range Poultry Business, Livestock and Pasture,” ATTRA, (n.d).98 “Niche Meat Processor Case Studies,” Extension, 2014.
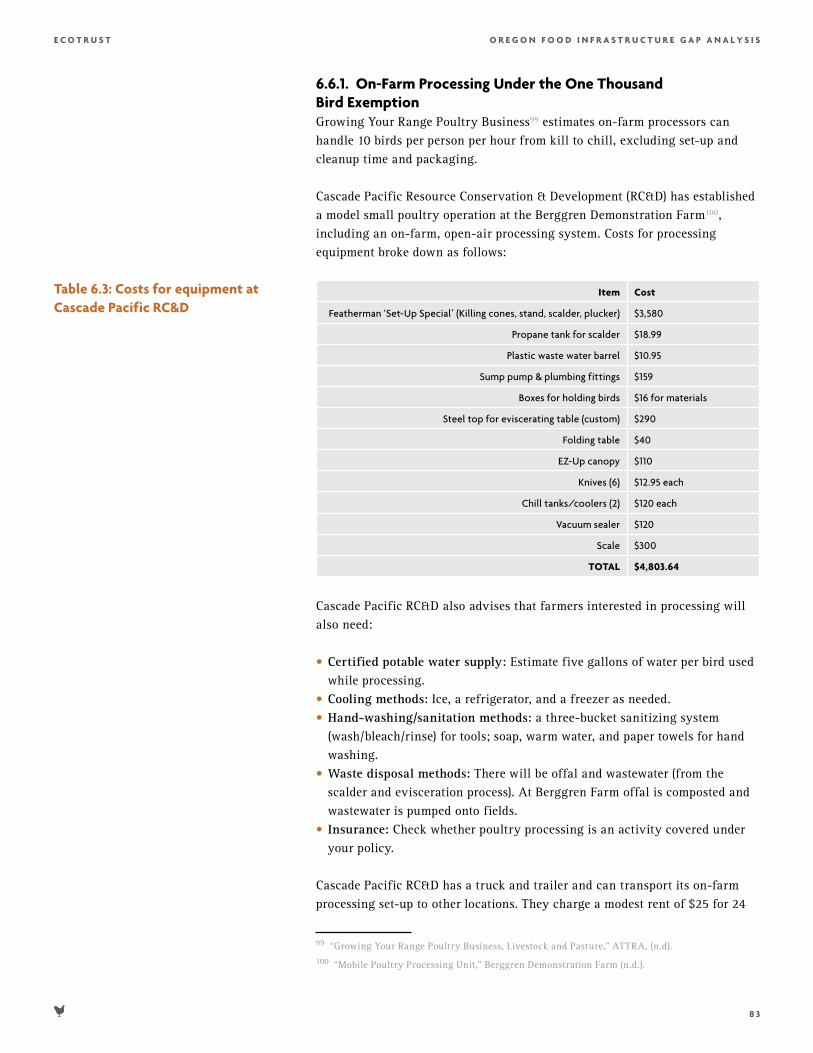
8 3
O R E G O N F O O D I N F R A S T R U C T U R E G A P A N A L Y S I SE C O T R U S T
6.6.1. On-Farm Processing Under the One Thousand Bird ExemptionGrowing Your Range Poultry Business99 estimates on-farm processors can handle 10 birds per person per hour from kill to chill, excluding set-up and cleanup time and packaging.
Cascade Pacific Resource Conservation & Development (RC&D) has established a model small poultry operation at the Berggren Demonstration Farm100, including an on-farm, open-air processing system. Costs for processing equipment broke down as follows:
Item Cost
Featherman ‘Set-Up Special’ (Killing cones, stand, scalder, plucker) $3,580
Propane tank for scalder $18.99
Plastic waste water barrel $10.95
Sump pump & plumbing fittings $159
Boxes for holding birds $16 for materials
Steel top for eviscerating table (custom) $290
Folding table $40
EZ-Up canopy $110
Knives (6) $12.95 each
Chill tanks/coolers (2) $120 each
Vacuum sealer $120
Scale $300
TOTAL $4,803.64
Cascade Pacific RC&D also advises that farmers interested in processing will also need:
• Certified potable water supply: Estimate five gallons of water per bird used while processing.
• Cooling methods: Ice, a refrigerator, and a freezer as needed. • Hand-washing/sanitation methods: a three-bucket sanitizing system
(wash/bleach/rinse) for tools; soap, warm water, and paper towels for hand washing.
• Waste disposal methods: There will be offal and wastewater (from the scalder and evisceration process). At Berggren Farm offal is composted and wastewater is pumped onto fields.
• Insurance: Check whether poultry processing is an activity covered under your policy.
Cascade Pacific RC&D has a truck and trailer and can transport its on-farm processing set-up to other locations. They charge a modest rent of $25 for 24
99 “Growing Your Range Poultry Business, Livestock and Pasture,” ATTRA, (n.d).100 “Mobile Poultry Processing Unit,” Berggren Demonstration Farm (n.d.).
Table 6.3: Costs for equipment at Cascade Pacific RC&D
8 4
O R E G O N F O O D I N F R A S T R U C T U R E G A P A N A L Y S I SE C O T R U S T
hours, plus a subsidized mileage rate of $0.25 round trip. Renters must also complete an initial training ($20) and pay a $250 deposit for damage/cleaning.
6.6.2. Processing Under a State LicenseThere are options for state licensing of both mobile and fixed slaughter and processing units.
6.6.2.1. Mobile Slaughter and Processing UnitsTwo Oregon farmers have collaborated to introduce the state’s first licensed mobile poultry processing unit. Oregon Mobile Poultry Processing,101 based in Philomath, offers custom and state-licensed poultry processing in the Willamette Valley. The unit is contained in a 33-foot trailer, with a fold-down metal platform that creates a 128-square-foot “kill floor” outside the trailer. This helps keep the interior processing space clean. The owners estimate they have the capacity to process as many as 500 birds per day. Cost to process birds appears to vary depending on number, but should be close to $3.50 per. Costs to build the Oregon Mobile Poultry Processing unit were not disclosed. However, case studies from other states and prefabricated units available for sale suggest that mobile units can range from a low of $8,000–$10,000 for an open air system on a 10-foot trailer, to $50,000 for a basic enclosed system in a 23-foot trailer, to $70,000–$100,000 for a higher capacity enclosed system in a 32-foot trailer. Growing Your Range Poultry Business102 suggests that mobile processing units offer a way for producers to start small and share equipment costs, while ironing out production problems and developing markets. Thus they can be a step towards preparing an individual or group to make the investment to build a brick and mortar processing facility, when justified by proven market demand for higher volumes of product. 6.6.2.2. Fixed Slaughter and Processing UnitsFarmers who raise from five thousand to twenty thousand birds each year may find it cost effective to build processing facilities that meet state licensing requirements. In 2013, the Oregonian103 reported there were twenty state-licensed poultry processors. These included a number of farms processing only their own birds, such as Walker Farms in Siletz (4,000 birds/year), Kookoolan Farms (9,000 birds/year), and Afton Fields Farm (10,000 birds/year). With these smaller volumes, owners and their families likely provide a significant portion of the processing labor required. Only a handful of state-licensed facilities in Oregon actually offer processing to independent farmers. These include:101 Provenance Farm.102 “Growing Your Range Poultry Business, Livestock and Pasture,” ATTRA, (n.d).103 “Small Oregon Chicken Farmers See Surge in Demand with Salmonella Outbreak Tied to Foster
Farms,” Lynne Terry, The Oregonian, 2013.
8 5
O R E G O N F O O D I N F R A S T R U C T U R E G A P A N A L Y S I SE C O T R U S T
• B&K Natural Farm near Sutherlin. $3.50 per chicken. • Harrington’s Poultry in Boring. $3.50 per chicken <5pounds; $4.50-$5.50 for
larger birds.• Mineral Springs Poultry near Willamina. $3.48 bagged whole or $4.08 cut
and wrapped on a tray. • Scio Poultry Processing near Scio. $5.25 per chicken <7pounds; $5.85 for
larger birds. Costs to construct processing facilities vary depending on size and processing capacity. At Afton Field Farm, Tyler Jones built his own simple state-licensed butchering shed,104 with concrete floors, large windows, and a clear plastic roof. He estimates he spent between $20,000 and $25,000 on building materials and equipment for the shed. However, costs for a state-licensed on-farm processing facility could easily reach $40,000, and costs for a stand-alone processing facility serving multiple farmers could easily top $100,000. 6.6.3. Processing Under a USDA Federal LicenseDayton Natural Meats is currently the only USDA-licensed poultry plant in Oregon105 and processes ten thousand birds a week—almost exclusively for its parent company, Pacific Natural Foods. Scio Poultry Processing did offer USDA processing briefly, but reverted to a state license in 2011 due to lack of demand for higher cost USDA processing on the part of client farmers. Bernard Smith of Full of Life Farm in St. Paul, Oregon, was quoted in High Country News saying that processing his 4,000 broilers under USDA license at a cost of $1.50 per pound priced him out of the market, and left him with 2,500 chickens in the freezer that could not be sold at a profit. In 2013, Little Farms Inc. (Goldendale, Washington) built a new facility that complies with USDA requirements for $110,000 (not including the cost of the land).106 That facility is capable of processing two hundred birds per day, but is reportedly underutilized. It currently also operates under a state license as owners do not see enough demand for USDA processing. A 2003 small-scale poultry-processing guide107 available from ATTRA offers a case study of a 2,500 square foot plant capable of processing 500 birds per day constructed at a cost of $120,000 (not including cost of land) and suggests that a plant capable of processing as many as 5,000 birds per day could be 104 Photos of Processing, Afton Field Farm. 105 “Q&A with Chuck Eggert,” Hannah Wallace, Oregon Business, 2014.106 “Pluck ’N Grit: Getting a Small Poultry Processing Facility Off the Ground,” Honest Meat, 2013.107 “Small Scale Poultry Processing,” ATTRA, 2013.
8 6
O R E G O N F O O D I N F R A S T R U C T U R E G A P A N A L Y S I SE C O T R U S T
constructed for less than $500,000. The guide estimates that experienced crews in a small processing plant can process 15-plus birds per person per hour, excluding setup and cleanup time and paperwork. 6.7. Support Infrastructure for Poultry Beyond processing capacity, it is important to consider other support infrastructure necessary for production and marketing of chicken. Oregon faces a number of infrastructural challenges to the development of midscale chicken production and the development of local and regional chicken brands. 6.7.1. Hatcheries to Supply ChicksMany commercial chicks come from hatcheries in the midwestern and southern states, where chicken production is centralized. However, Oregon does have a few independently operated hatcheries. Many, such as Winn’s Livestock and Hatchery (Corvallis, Oregon), appear focused on supplying small numbers of specialty poultry to backyard enthusiasts and for show. However, Jenk’s Hatchery in Tangent, Oregon, is a family-owned company that supplies Cornish Cross and Red Ranger chicks for small farmers. Cornish Cross chicks range from $1.35 to $1.15 apiece (for less than 50 and greater than 100 chicks), with additional price breaks for orders over 350. Red Rangers are $2.45 to $2.10 apiece. The relatively high cost of chicks raised in Oregon is a concern. A 2008 feasibility study108 for pastured poultry in Puget Sound estimated a $1.08 chick purchase representing 14 percent of expenses (not including labor) to deliver a bird for processing. 6.7.2. Feed SuppliersFeed is the largest input cost for chicken. A single chicken can consume 10 pounds of feed109 over a 7-week rearing period, more for slower growing varieties. The 2008 feasibility study110 referenced above estimated feed costs between $0.20 and $0.30 per pound, with the cost of feed at the higher end of the scale representing 60 percent of expenses (not including labor) to deliver a bird for processing. Prices for Organic Certified or Non-GMO Verified feeds will be even higher. CHS/Kropf operates a feed mill in Harrisburg, Oregon, which manufactures and distributes bulk and bag conventional and organic feeds. Other local companies include Haystack Farm and Feed, Cascade Feeds, Union Point Custom Feeds, Rogue Quality Feeds, and others. Ingredients for feeds from these companies may or may not come from Oregon farms. 108 “Pasture Poultry Production and Processing Feasability in the Puget Sound Region,” Bruce
Dunlop, Cascade Harvest Coalition, 2008.109 “How Much Will My Chicken Eat?” Jacquie Jacob and Tony Pescatore, University of Kentucky,
Cooperative Extension Service, 2012.110 “Pasture Poultry Production and Processing Feasability in the Puget Sound Region,” Bruce
Dunlop, Cascade Harvest Coalition, 2008.
8 7
O R E G O N F O O D I N F R A S T R U C T U R E G A P A N A L Y S I SE C O T R U S T
6.7.3. Poultry Barns and Cold StorageOne challenge for smaller-scale chicken producers is that pastured poultry is a seasonal product, with production and fresh chicken available from April to October. Other times of the year, farmers either sell frozen product or have no inventory. A 2005 OSU Oregon Agricultural Commodities111 study noted freezing capacity for chicken products in Oregon is quite limited. US Census County Business Patterns data112 shows there were only twenty-one companies offering refrigerated storage services in Oregon in 2012. Food safety requirements for segregation of products will further limit access to those facilities by poultry farmers. Costs to build dedicated cold storage facilities may have to be considered. The alternative is construction of climate controlled poultry barns to enable year-round production. This offers benefits for processors, who can then operate throughout the year, and to some end consumers, who may prefer fresh product. However, there may be marketing challenges if the use of poultry barns is perceived as a recreation of the existing commodity production system. 6.7.4. DistributionSmaller local or regional chicken producers are unlikely to see their products carried by large broadline distributors such as Food Services of America or SYSCO. Once some scale is achieved, there may be opportunities to work with associated businesses, such as Fulton Provision Company (owned by SYSCO). However, there are some smaller, specialty distributors that may offer more immediate support. These include companies like SP Provisions, Nicky USA (which has actually bought land and a USDA-licensed mobile processing unit to be able to raise, process, and distribute its own small animals), Eat Oregon First, and Corfini Gourmet (based in Washington). 6.8. Rebuilding the Missing Middle: Two Paths There appear to be at least two paths to developing midscale production and marketing businesses in Oregon to meet demand for high quality, differentiated, local chicken. The first is a bottom-up farmer entrepreneur model exemplified by Greener Pastures Poultry—a once lauded but now closed Oregon company. The second is a top-down processing and marketing business exemplified by a proposal outlined by Pacific Natural Foods, which uses a hub and spoke approach to coordinate production of birds by a large number of small, independent farmers. 6.8.1. Farm Entrepreneur Model: Greener Pastures PoultryAaron Silverman started raising chickens as a side business on his twenty-acre vegetable farm outside Corvallis. He had relationships with chefs, was already selling produce to restaurants, and was hearing significant demand for 111 “Oregon Agricultural Commodities,” Oregon State University Extension Service, 2005.112 “2012 County Business Patterns (NAICS),” CenStats, US Census, 2012.
8 8
O R E G O N F O O D I N F R A S T R U C T U R E G A P A N A L Y S I SE C O T R U S T
pasture-raised chicken. He started with two thousand birds, processing them on-farm. Then in 2001 as the business started to grow, he leased a shuttered 1950s-era, red-meat processing plant, put $20,000 into renovating the building and $40,000 into equipment, and launched Greener Pastures Poultry (GPP). The facility was not ideal for poultry processing, but could handle as many as 500 birds a day. Aaron increased his own production to 13,000 birds, and began coordinating with three other farmers to supply birds. He processed two days a week during the field season, stockpiling product and selling frozen chickens in the winter. Sales to restaurants, at a farmers’ market, and then to New Seasons Market reached 20,000 birds. However, the business was only marginal at that level. Aaron estimated that GPP needed to be able to process at least 120,000 birds a year to be sustainable, but doing so would require opening a USDA-licensed processing plant. GPP closed its doors in 2006 when Aaron was unable to identify and attract a manager with the skill and experience to operate a USDA plant, and then, as a result, could not secure the funding to build it. Before the closure, GPP was studied intensively as a model for new farm businesses, including in this report by Washington State University.113
In an interview after the closure, Aaron cited a number of lessons learned from the experience, including:
• There is significant demand for pastured poultry.• However, as a small business owner trying to raise chickens, coordinate
production by other farmers, manage processing and packaging, as well as market and deliver product, he exhausted himself. He needed more ability to delegate parts of the enterprise.
• It was extremely difficult to attract and retain employees in the processing plant when operating only seasonally. This added recruitment and training costs, and required more constant oversight.
• The gap from twenty thousand birds processed under state license to the number of birds necessary to justify a USDA-licensed facility is very large.
(Note: With an enterprise of this type, ability to manage manure and processing wastes may also become important. On very small, diversified chicken farms, wastes can be composted, used as fertilizer, and provide an economic benefit. As the number of chickens surpasses the acreage available to absorb nutrients safely, disposal of manure and waste becomes a cost and environmental risk.)
6.8.2. Processing and Marketing Business Model: Pacific Foods Chuck Eggert, the owner of Pacific Natural Foods and Dayton Meats, has proposed a different approach to the challenge. Chuck envisions a system more like the 1950s, when a large percentage of chickens were still raised on small family farms. Those farm families might have raised fewer than one thousand birds over the course of a year for their own consumption and for 113 “Marketing Quality on Creative Growers’ Farms,” Rural Roots and the University of Idaho
Research Team, 2005.
8 9
O R E G O N F O O D I N F R A S T R U C T U R E G A P A N A L Y S I SE C O T R U S T
supplemental income. With a distributed network of independent small farms clustered around central processing nodes, which are in turn owned by a processing and marketing company, Chuck believes he can deliver a small, but reliable income to farmers, better quality of life for a growing number of chickens, and a unique, high-quality product in volume for wholesale. Under this system, an independent small farm, like Champoeg Farms (outside St. Paul, Oregon), would allocate land and invest in mobile broiler houses to move with the chickens from pasture to pasture. A second stage investment in small poultry barns could allow production to continue in winter months. The expectation would be that farmers could sell between one thousand and five thousand birds to the central processor in a season. (Estimate: That effort might be expected to generate a profit of $1,000 to $2,000 per one thousand–bird unit.) The processor might also provide chicks and feed, and specify production standards (humane treatment, no antibiotics, organic for some markets, etc.). For a plant that processes 120,000 birds per year, if each participating farmer raised 5,000 birds/year, there would need to be twenty-four growers in the cluster. Production schedules could be established to enable harvest of flocks in units to keep the plant in operation. 6.8.3. AnalysisBoth paths are likely achievable. The farmer-entrepreneur model requires a deeply committed individual, significant personal risk, and access to labor, management skills, and capital at key junctures. There is a learning curve, but the profitable growth of the enterprise directly benefits the farmer. The processing and marketing business model brings with it management experience, and potentially easier access to staff, facilities, and resources. There is however a significant social challenge, organizing and coordinating the activities of many small farmers, and the revenue to individual farmers is modest.
6.9 Conclusions Expectations coming into research for this report were that there was a shortage in regional supply of antibiotic-free chicken, and that processing capacity was a gap to be overcome to resolve that supply challenge. We found that there is robust demand for antibiotic-free chicken, and restaurateurs and retailers are interested in procuring more pasture-raised chicken. However, it appears that established large regional chicken producers like Foster Farms and Draper Valley are already well underway to meet demand for antibiotic-free, and offer free-range chicken, which addresses at least some of the impulse towards pasture-raised. This may be enough to satisfy much of the need that is currently being expressed. There are likely opportunities to develop profitable enterprises around midscale production, processing, and marketing of chicken. However, processing capacity is not the only challenge and is likely not the largest challenge that will be experienced building those enterprises. Expansion
9 0
O R E G O N F O O D I N F R A S T R U C T U R E G A P A N A L Y S I SE C O T R U S T
of existing small businesses or the launch of new businesses may indeed require investment in processing facilities, but a successful effort to redevelop “poultry of the middle” in Oregon will also likely hinge on factors beyond processing capacity, including: • Ability to target specific end markets and be price competitive: There is
likely a midpoint price opportunity to be struck between commodity broilers at retail at $1.29–$1.99 per pound and farm-direct broilers sold for closer to $6.00 per pound. It would be beneficial to further explore the potential and price sensitivity of markets for that midrange product. A case study below takes a deeper look at production costs, wholesale and retail costs, and consumer willingness to pay.
• Finding an appropriate basis for differentiation: With large-scale brands now marketing organic, free-range, and antibiotic-free chicken, smaller scale entrants to the market will increasingly have to differentiate based on other factors including product quality, authenticity (small farm story), and other production methods (pasture rearing, non-GMO feeds, higher levels of animal welfare, etc.). It remains to be proven what combination of attributes will have sufficient market appeal to justify a premium price.
• Organizing production: It is not clear that any of the existing small chicken farms are interested in and capable of growing significantly, or that groups of smaller farmers have discussed the development of cooperative marketing ventures. Coordination of multiple farms seems likely to be necessary to supply volumes to justify any meaningful investment in processing capacity.
• Access to skilled management: The number of people qualified to operate a USDA-licensed poultry processing plant is small.
• Access to labor: Farm work and meat processing are low paid, and can be strenuous, repetitive, unpleasant, and dangerous. Both farm and processing facility managers report challenges recruiting and retaining workers—especially if operations are seasonal.
6.10 Case Study: Toward a Profitable Supply Chain for Pastured Poultry Given the variety of challenges faced by small and midsized poultry producers in Oregon, we further examined opportunities to develop profitable pasture-based production models. Although midscale production would have been more relevant to this report, “poultry of the middle” doesn’t currently exist. Input data was available for pasture-based models of less than one thousand birds per year however, so we present this market analysis as an illustrative case study.
We conducted an in-depth analysis of the price competitiveness of pastured poultry, including production costs, wholesale/retail prices, and consumer willingness to pay. Results of that analysis are outlined below. In all cases, production costs for pastured poultry were found to greatly exceed those
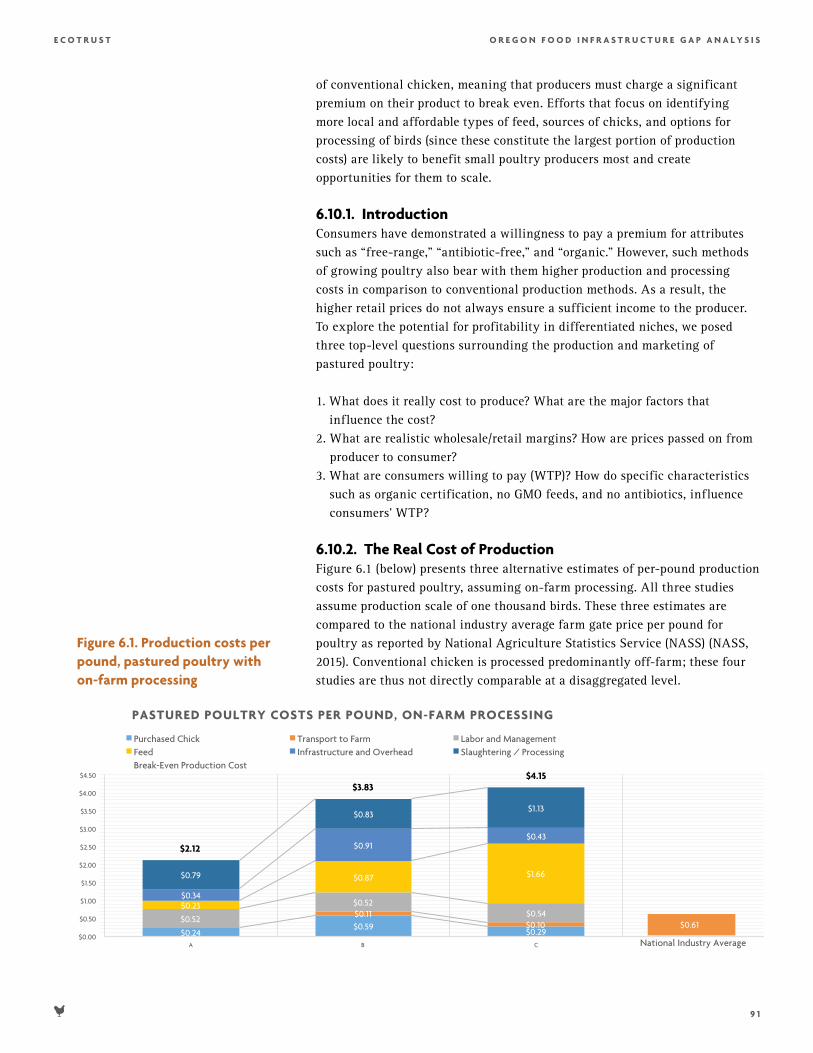
9 1
O R E G O N F O O D I N F R A S T R U C T U R E G A P A N A L Y S I SE C O T R U S T
of conventional chicken, meaning that producers must charge a significant premium on their product to break even. Efforts that focus on identifying more local and affordable types of feed, sources of chicks, and options for processing of birds (since these constitute the largest portion of production costs) are likely to benefit small poultry producers most and create opportunities for them to scale.
6.10.1. Introduction Consumers have demonstrated a willingness to pay a premium for attributes such as “free-range,” “antibiotic-free,” and “organic.” However, such methods of growing poultry also bear with them higher production and processing costs in comparison to conventional production methods. As a result, the higher retail prices do not always ensure a sufficient income to the producer. To explore the potential for profitability in differentiated niches, we posed three top-level questions surrounding the production and marketing of pastured poultry:
1. What does it really cost to produce? What are the major factors that influence the cost?
2. What are realistic wholesale/retail margins? How are prices passed on from producer to consumer?
3. What are consumers willing to pay (WTP)? How do specific characteristics such as organic certification, no GMO feeds, and no antibiotics, influence consumers’ WTP?
6.10.2. The Real Cost of Production Figure 6.1 (below) presents three alternative estimates of per-pound production costs for pastured poultry, assuming on-farm processing. All three studies assume production scale of one thousand birds. These three estimates are compared to the national industry average farm gate price per pound for poultry as reported by National Agriculture Statistics Service (NASS) (NASS, 2015). Conventional chicken is processed predominantly off-farm; these four studies are thus not directly comparable at a disaggregated level.
Figure 6.1. Production costs per pound, pastured poultry with on-farm processing
6.1
$0.24 $0.59
$0.29
$0.11 $0.10
$0.52
$0.52 $0.54
$0.23
$0.87 $1.66
$0.34
$0.91 $0.43
$0.79
$0.83 $1.13
$2.12
$3.83 $4.15
$0.00
$0.50
$1.00
$1.50
$2.00
$2.50
$3.00
$3.50
$4.00
$4.50
A B C
PASTURED POULTRY COSTS PER POUND, ON-FARM PROCESSING
Purchased Chick Transport to Farm Labor and Management Feed Infrastructure and Overhead Slaughtering / Processing Break-Even Production Cost
$0.61
National Industry Average
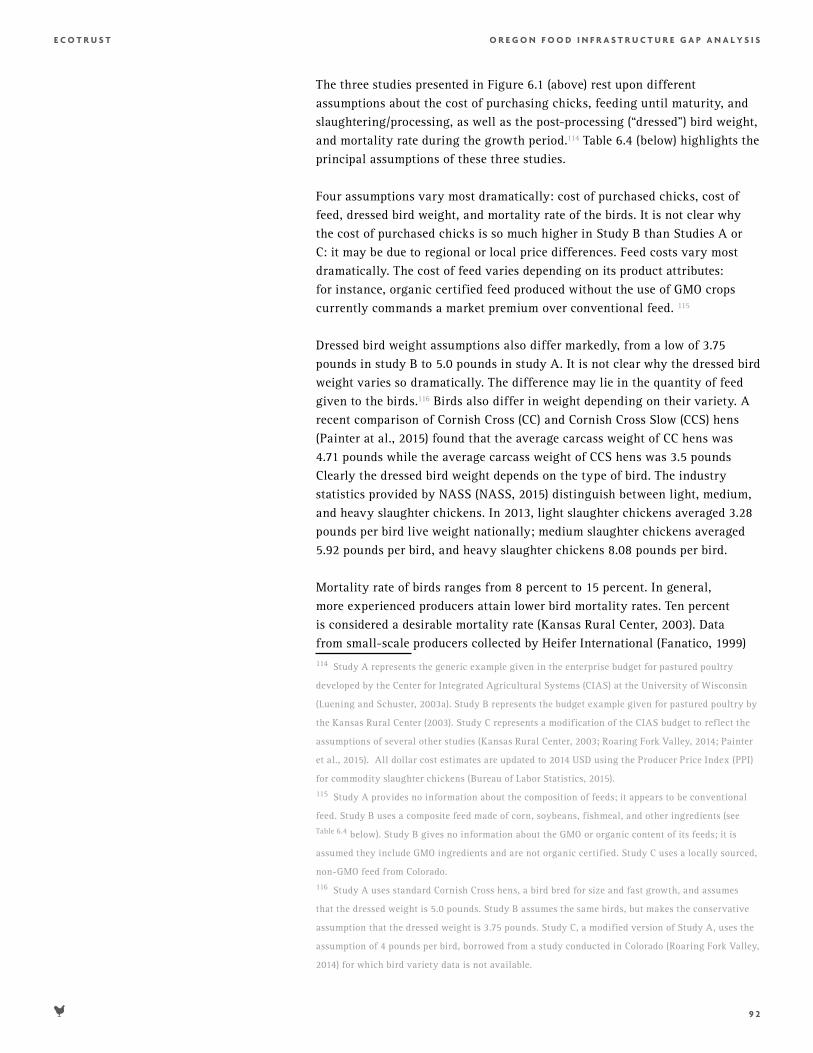
9 2
O R E G O N F O O D I N F R A S T R U C T U R E G A P A N A L Y S I SE C O T R U S T
The three studies presented in Figure 6.1 (above) rest upon different assumptions about the cost of purchasing chicks, feeding until maturity, and slaughtering/processing, as well as the post-processing (“dressed”) bird weight, and mortality rate during the growth period.114 Table 6.4 (below) highlights the principal assumptions of these three studies.
Four assumptions vary most dramatically: cost of purchased chicks, cost of feed, dressed bird weight, and mortality rate of the birds. It is not clear why the cost of purchased chicks is so much higher in Study B than Studies A or C: it may be due to regional or local price differences. Feed costs vary most dramatically. The cost of feed varies depending on its product attributes: for instance, organic certified feed produced without the use of GMO crops currently commands a market premium over conventional feed. 115
Dressed bird weight assumptions also differ markedly, from a low of 3.75 pounds in study B to 5.0 pounds in study A. It is not clear why the dressed bird weight varies so dramatically. The difference may lie in the quantity of feed given to the birds.116 Birds also differ in weight depending on their variety. A recent comparison of Cornish Cross (CC) and Cornish Cross Slow (CCS) hens (Painter at al., 2015) found that the average carcass weight of CC hens was 4.71 pounds while the average carcass weight of CCS hens was 3.5 pounds Clearly the dressed bird weight depends on the type of bird. The industry statistics provided by NASS (NASS, 2015) distinguish between light, medium, and heavy slaughter chickens. In 2013, light slaughter chickens averaged 3.28 pounds per bird live weight nationally; medium slaughter chickens averaged 5.92 pounds per bird, and heavy slaughter chickens 8.08 pounds per bird.
Mortality rate of birds ranges from 8 percent to 15 percent. In general, more experienced producers attain lower bird mortality rates. Ten percent is considered a desirable mortality rate (Kansas Rural Center, 2003). Data from small-scale producers collected by Heifer International (Fanatico, 1999) 114 Study A represents the generic example given in the enterprise budget for pastured poultry
developed by the Center for Integrated Agricultural Systems (CIAS) at the University of Wisconsin
(Luening and Schuster, 2003a). Study B represents the budget example given for pastured poultry by
the Kansas Rural Center (2003). Study C represents a modification of the CIAS budget to reflect the
assumptions of several other studies (Kansas Rural Center, 2003; Roaring Fork Valley, 2014; Painter
et al., 2015). All dollar cost estimates are updated to 2014 USD using the Producer Price Index (PPI)
for commodity slaughter chickens (Bureau of Labor Statistics, 2015). 115 Study A provides no information about the composition of feeds; it appears to be conventional
feed. Study B uses a composite feed made of corn, soybeans, fishmeal, and other ingredients (see Table 6.4 below). Study B gives no information about the GMO or organic content of its feeds; it is
assumed they include GMO ingredients and are not organic certified. Study C uses a locally sourced,
non-GMO feed from Colorado. 116 Study A uses standard Cornish Cross hens, a bird bred for size and fast growth, and assumes
that the dressed weight is 5.0 pounds. Study B assumes the same birds, but makes the conservative
assumption that the dressed weight is 3.75 pounds. Study C, a modified version of Study A, uses the
assumption of 4 pounds per bird, borrowed from a study conducted in Colorado (Roaring Fork Valley,
2014) for which bird variety data is not available.
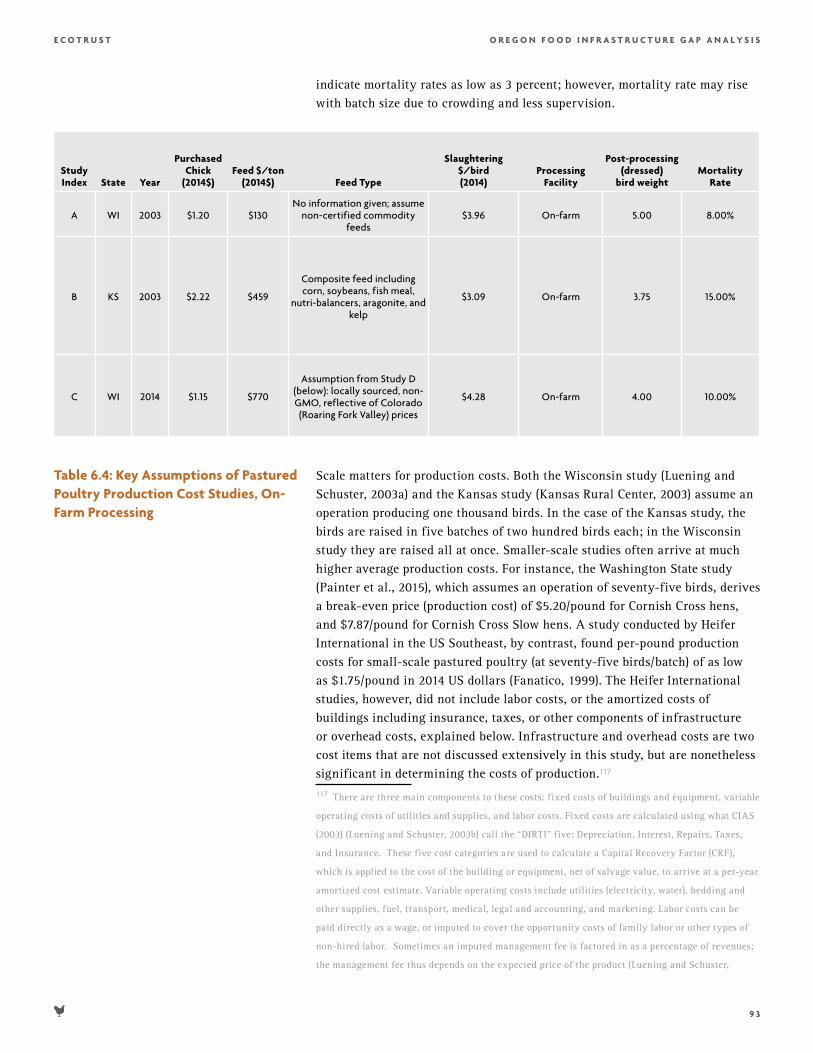
9 3
O R E G O N F O O D I N F R A S T R U C T U R E G A P A N A L Y S I SE C O T R U S T
indicate mortality rates as low as 3 percent; however, mortality rate may rise with batch size due to crowding and less supervision.
Study Index State Year
Purchased Chick
(2014$)Feed $/ton
(2014$) Feed Type
Slaughtering $/bird(2014)
Processing Facility
Post-processing (dressed)
bird weightMortality
Rate
A WI 2003 $1.20 $130 No information given; assume
non-certified commodity feeds
$3.96 On-farm 5.00 8.00%
B KS 2003 $2.22 $459
Composite feed including corn, soybeans, fish meal,
nutri-balancers, aragonite, and kelp
$3.09 On-farm 3.75 15.00%
C WI 2014 $1.15 $770
Assumption from Study D (below): locally sourced, non-GMO, reflective of Colorado (Roaring Fork Valley) prices
$4.28 On-farm 4.00 10.00%
Scale matters for production costs. Both the Wisconsin study (Luening and Schuster, 2003a) and the Kansas study (Kansas Rural Center, 2003) assume an operation producing one thousand birds. In the case of the Kansas study, the birds are raised in five batches of two hundred birds each; in the Wisconsin study they are raised all at once. Smaller-scale studies often arrive at much higher average production costs. For instance, the Washington State study (Painter et al., 2015), which assumes an operation of seventy-five birds, derives a break-even price (production cost) of $5.20/pound for Cornish Cross hens, and $7.87/pound for Cornish Cross Slow hens. A study conducted by Heifer International in the US Southeast, by contrast, found per-pound production costs for small-scale pastured poultry (at seventy-five birds/batch) of as low as $1.75/pound in 2014 US dollars (Fanatico, 1999). The Heifer International studies, however, did not include labor costs, or the amortized costs of buildings including insurance, taxes, or other components of infrastructure or overhead costs, explained below. Infrastructure and overhead costs are two cost items that are not discussed extensively in this study, but are nonetheless significant in determining the costs of production.117 117 There are three main components to these costs: fixed costs of buildings and equipment, variable
operating costs of utilities and supplies, and labor costs. Fixed costs are calculated using what CIAS
(2003) (Luening and Schuster, 2003b) call the “DIRTI” five: Depreciation, Interest, Repairs, Taxes,
and Insurance. These five cost categories are used to calculate a Capital Recovery Factor (CRF),
which is applied to the cost of the building or equipment, net of salvage value, to arrive at a per-year
amortized cost estimate. Variable operating costs include utilities (electricity, water), bedding and
other supplies, fuel, transport, medical, legal and accounting, and marketing. Labor costs can be
paid directly as a wage, or imputed to cover the opportunity costs of family labor or other types of
non-hired labor. Sometimes an imputed management fee is factored in as a percentage of revenues;
the management fee thus depends on the expected price of the product (Luening and Schuster,
Table 6.4: Key Assumptions of Pastured Poultry Production Cost Studies, On-Farm Processing
9 4
O R E G O N F O O D I N F R A S T R U C T U R E G A P A N A L Y S I SE C O T R U S T
6.10.3 Wholesale and Retail MarkupsWhat kinds of wholesale and retail prices are implied by the production costs in Figure 6.1 and Table 6.4 above?
Figure 6.2: below provides a range of possibilities based on the studies explained above. We assume a fixed dollar markup between industrially produced and pastured chicken.118,119
Figure 6.2: also contains the national industry average farm gate price per pound of broiler chickens, $0.61/pound, as reported by NASS (NASS, 2015). Most industrially grown broiler chickens are produced on contract. The grower is provided with chicks, feed, fuel, and management supervision by an integrated poultry company, called an “integrator” in industry parlance. The grower supplies land, labor, housing, equipment, and operating costs. The integrator then purchases the broilers from the grower at a fixed price per pound of live (preprocessed) bird weight. This price is generally very low: for example, an Oklahoma State study gave $0.06/pound as an example (Doye et al., 2008). Broilers are produced in large-scale grow houses—the Oklahoma State example assumes a grow house capacity of 26,400 birds (Doye et al., 2008).
2003a). The local farm wage is usually assumed to be the opportunity cost of family labor (Luening
and Schuster, 2003b). Infrastructure and overhead costs vary considerably across farms, at different
scales, and in different regions of the United States. 118 Were we to assume a percentage markup, the retail prices of pastured poultry would become
much higher (over thirteen/pound for Study C, for example).119 We estimate the wholesale markup by subtracting the average national farmgate prices received
for slaughter chickens, as reported by NASS (NASS, 2015), from the average wholesale prices for
slaughter chickens (broilers) reported by the USDA’s Economic Research Service (ERS) historical
time series data on price spreads (USDA, 2014). We use 2013 wholesale prices, since those are the
latest data available. The same ERS data series (USDA, 2014) reports average retail prices and retail-
wholesale price spreads for broilers. We use the 2013 data on average retail price spreads as our
assumptions for Figure 6.2: above.
Figure 6.2: Pastured Poultry: Farm Production Costs, Wholesale and Retail Markups, dollar/pound.
6.2
$2.12
$3.83 $4.15
$5.43
$4.06
$0.61
$0.27
$0.27 $0.27
$0.27
$0.27
$0.27
$1.08
$1.08 $1.08
$1.08
$1.08
$1.08
$3.47
$5.18 $5.50
$6.78
$5.41
$1.96
$0.00
$1.00
$2.00
$3.00
$4.00
$5.00
$6.00
$7.00
$8.00
A B C D E NATIONAL INDUSTRY AVERAGE
PRODUCTION COSTS, WHOLESALE AND RETAIL MARKUPS, $/LB Break-Even Production Cost Average Wholesale Markup (ERS, 2013) Average Retail Markup (ERS, 2013)
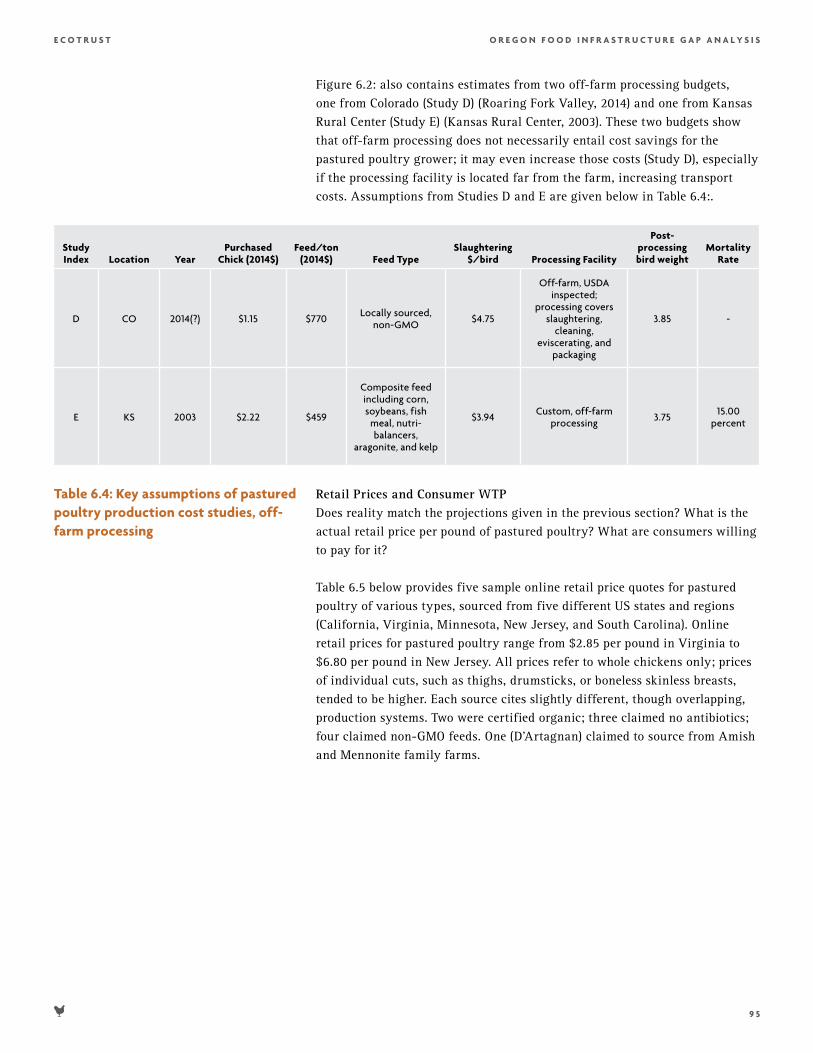
9 5
O R E G O N F O O D I N F R A S T R U C T U R E G A P A N A L Y S I SE C O T R U S T
Figure 6.2: also contains estimates from two off-farm processing budgets, one from Colorado (Study D) (Roaring Fork Valley, 2014) and one from Kansas Rural Center (Study E) (Kansas Rural Center, 2003). These two budgets show that off-farm processing does not necessarily entail cost savings for the pastured poultry grower; it may even increase those costs (Study D), especially if the processing facility is located far from the farm, increasing transport costs. Assumptions from Studies D and E are given below in Table 6.4:.
Study Index Location Year
Purchased Chick (2014$)
Feed/ton (2014$) Feed Type
Slaughtering $/bird Processing Facility
Post-processing bird weight
Mortality Rate
D CO 2014(?) $1.15 $770 Locally sourced, non-GMO $4.75
Off-farm, USDA inspected;
processing covers slaughtering,
cleaning, eviscerating, and
packaging
3.85 -
E KS 2003 $2.22 $459
Composite feed including corn, soybeans, fish
meal, nutri-balancers,
aragonite, and kelp
$3.94 Custom, off-farm processing 3.75 15.00
percent
Retail Prices and Consumer WTPDoes reality match the projections given in the previous section? What is the actual retail price per pound of pastured poultry? What are consumers willing to pay for it?
Table 6.5 below provides five sample online retail price quotes for pastured poultry of various types, sourced from five different US states and regions (California, Virginia, Minnesota, New Jersey, and South Carolina). Online retail prices for pastured poultry range from $2.85 per pound in Virginia to $6.80 per pound in New Jersey. All prices refer to whole chickens only; prices of individual cuts, such as thighs, drumsticks, or boneless skinless breasts, tended to be higher. Each source cites slightly different, though overlapping, production systems. Two were certified organic; three claimed no antibiotics; four claimed non-GMO feeds. One (D’Artagnan) claimed to source from Amish and Mennonite family farms.
Table 6.4: Key assumptions of pastured poultry production cost studies, off-farm processing
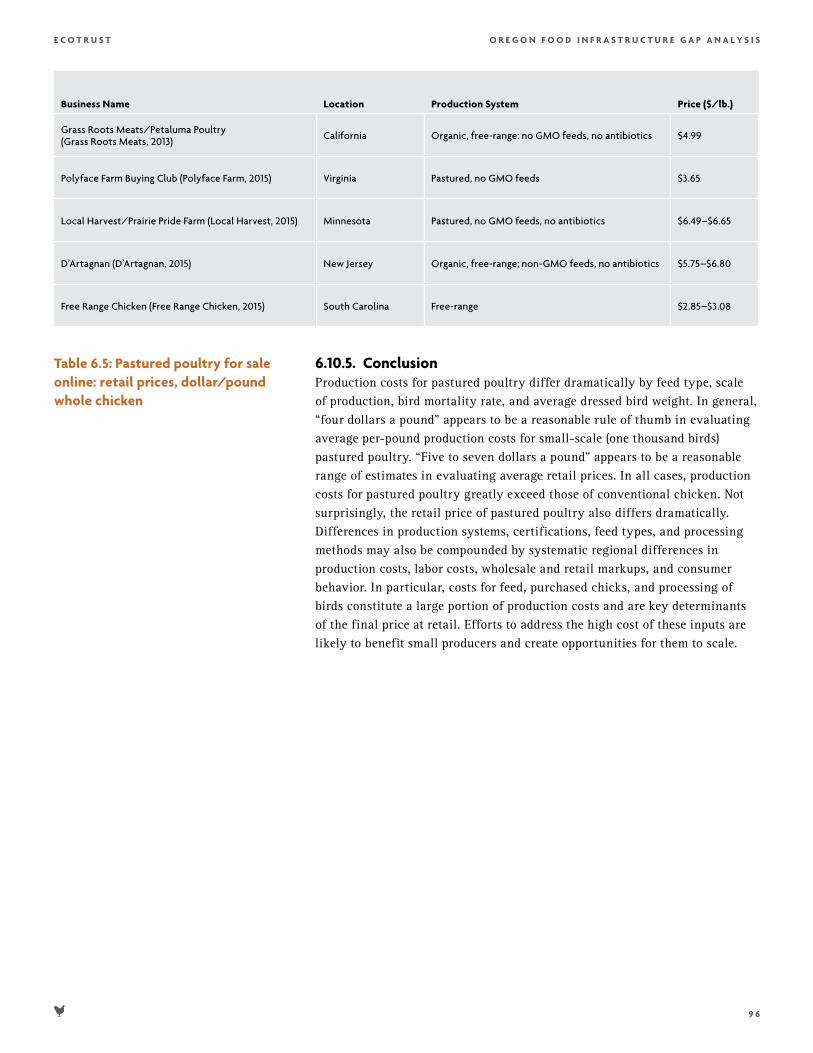
9 6
O R E G O N F O O D I N F R A S T R U C T U R E G A P A N A L Y S I SE C O T R U S T
Business Name Location Production System Price ($/lb.)
Grass Roots Meats/Petaluma Poultry (Grass Roots Meats, 2013) California Organic, free-range: no GMO feeds, no antibiotics $4.99
Polyface Farm Buying Club (Polyface Farm, 2015) Virginia Pastured, no GMO feeds $3.65
Local Harvest/Prairie Pride Farm (Local Harvest, 2015) Minnesota Pastured, no GMO feeds, no antibiotics $6.49–$6.65
D’Artagnan (D’Artagnan, 2015) New Jersey Organic, free-range; non-GMO feeds, no antibiotics $5.75–$6.80
Free Range Chicken (Free Range Chicken, 2015) South Carolina Free-range $2.85–$3.08
6.10.5. ConclusionProduction costs for pastured poultry differ dramatically by feed type, scale of production, bird mortality rate, and average dressed bird weight. In general, “four dollars a pound” appears to be a reasonable rule of thumb in evaluating average per-pound production costs for small-scale (one thousand birds) pastured poultry. “Five to seven dollars a pound” appears to be a reasonable range of estimates in evaluating average retail prices. In all cases, production costs for pastured poultry greatly exceed those of conventional chicken. Not surprisingly, the retail price of pastured poultry also differs dramatically. Differences in production systems, certifications, feed types, and processing methods may also be compounded by systematic regional differences in production costs, labor costs, wholesale and retail markups, and consumer behavior. In particular, costs for feed, purchased chicks, and processing of birds constitute a large portion of production costs and are key determinants of the final price at retail. Efforts to address the high cost of these inputs are likely to benefit small producers and create opportunities for them to scale.
Table 6.5: Pastured poultry for sale online: retail prices, dollar/pound whole chicken


![1996 Coming In To The Foodshed [1631 kb pdf]](https://img.pdfslide.us/doc/110x75/58a2d6c21a28ab7f678b72ae/1996-coming-in-to-the-foodshed-1631-kb-pdf.jpg)