Embed Size (px)
Citation preview
Carolina Manrique Hoyos
Limit Analysis:Collection of Examples ofApplicationsLi
mit
Ana
lysi
s: C
olle
ctio
n of
Exa
mpl
es o
fA
pplic
atio
nsC
arol
ina
Man
rique
Hoy
os
201
0S
pain
Carolina Manrique Hoyos
Limit Analysis:Collection of Examples ofApplications
I 2010Spain
Limit Analysis: Collection of examples of application
Erasmus Mundus Programme ADVANCED MASTERS IN STRUCTURAL ANALYSIS OF MONUMENTS AND HISTORICAL CONSTRUCTIONS i
DECLARATION
Name: Carolina Manrique Hoyos
Email: [email protected]
Title of the
Msc Dissertation:
Limit Analysis: Collection of Examples of Applications
Supervisor(s): Climent Molins
Year: 2010
I hereby declare that all information in this document has been obtained and presented in accordance
with academic rules and ethical conduct. I also declare that, as required by these rules and conduct, I
have fully cited and referenced all material and results that are not original to this work.
I hereby declare that the MSc Consortium responsible for the Advanced Masters in Structural Analysis
of Monuments and Historical Constructions is allowed to store and make available electronically the
present MSc Dissertation.
University: Universitat Politécnica de Catalunya
Date: 12th of July of 2010
Signature:
_ ______________________

Limit Analysis: Collection of examples of application
Erasmus Mundus Programme ii ADVANCED MASTERS IN STRUCTURAL ANALYSIS OF MONUMENTS AND HISTORICAL CONSTRUCTIONS

Limit Analysis: Collection of examples of application
Erasmus Mundus Programme ADVANCED MASTERS IN STRUCTURAL ANALYSIS OF MONUMENTS AND HISTORICAL CONSTRUCTIONS iii
To the mighty tower that kept me safe.

Limit Analysis: Collection of examples of application
Erasmus Mundus Programme iv ADVANCED MASTERS IN STRUCTURAL ANALYSIS OF MONUMENTS AND HISTORICAL CONSTRUCTIONS
Limit Analysis: Collection of examples of application
Erasmus Mundus Programme ADVANCED MASTERS IN STRUCTURAL ANALYSIS OF MONUMENTS AND HISTORICAL CONSTRUCTIONS v
ACKNOWLEDGEMENTS
I want to give a special acknowledgement to the European Commission and the Master Consortium
for the Erasmus Mundus scholarship that allowed me to have the experience of pursuing this master
course in two different countries.
To professors Paulo Lourenço and Daniel Abrams for the amazing lectures at Universidade do Minho.
To professors Pere Roca and Climent Molins for their guidance in Barcelona.
To Elisa Poletti, Joao Leite, Leonardo Avila and Ines Costa for all the precious PhD hours spent in
helping me understand greek.
To Pinar Abacilar for being my sister architect during the struggle for understanding what was going
on during the courses and daily life. I hope we can meet in Istanbul in the near future.
To Gonzalo Roberts for his patience and unbelievable clarity when answering my endless questions
during the program, for saving me when I was completely lost, and for inspiring me to do things better
with his enthusiasm for structures. I know he has an architect inside of him, I hope he finds it.
To Cem Taneri for making me laugh during difficult times.
To Susana Moreira and Clive Allen for their generosity sharing knowledge always with a smile.
To Shouquan Zhu, Gibson Craig, Luana Boromeo, Peter Vonk, Dora Coehlo, Mateus Oliveira, Amr
Fangary, Amol Varshney and Diogo Coutinho for the time shared in Guimarães and Barcelona.
To Mauricio Otero for waking me up.
To Rodrigo Vargas for keeping in contact during all these months, for making me aware of the real life,
for his silly comments that cheered me up, for his inspirational talent as an architect, and for reminding
me I have to write. ¡Suerte en Georgia Tech!
To Diego Javier Lotero for being the mighty tower that has kept me safe during all these years, for
sharing my interest in structures from an architecture point of view, and for understanding more than I
why I came to this program. ¡Te quiero mucho y te he extrañado un montón!
To my aunt Constanza and grandmother Olga for their love since I can remember.
To my brother Juan Carlos and his new family Margarita, Valentina and Tomas for all the joy this year.
To my sister Natalia for coming to visit me in both countries, for all the important conversations we
have always had, for the love we have for our family and beloved pets, and for the pain we share of
being far away. ¡Ànimo Nati, nos vemos en Cali para Navidad!
To my parents Fabiola and Alfonso for their unconditional love and support in every new adventure I
decide to start, for giving me strength during challenging times, for learning every technology available
in order to keep in contact, and for reminding me their house is always mine. Me han hecho mucha
falta, ¡Los quiero mucho!

Limit Analysis: Collection of examples of application
Erasmus Mundus Programme vi ADVANCED MASTERS IN STRUCTURAL ANALYSIS OF MONUMENTS AND HISTORICAL CONSTRUCTIONS
Limit Analysis: Collection of examples of application
Erasmus Mundus Programme ADVANCED MASTERS IN STRUCTURAL ANALYSIS OF MONUMENTS AND HISTORICAL CONSTRUCTIONS vii
ABSTRACT
Limit Analysis constitutes a simplified method for the assessment of masonry historical constructions.
A series of examples of application of both static and kinematic limit analysis are presented with
detailed explanations so as to be used by future SAHC students and others interested in
understanding the principles and operation of these approaches.
A state of art on the concepts underlying limit analysis is presented as well as a selection of real case
studies of different typology of structures such as a single span arch bridge, a barrel vault over
buttresses, a multi-span two level arch bridge (aqueduct), the last arch in a series of arches façade,
and a tower.
Each case is shown in a step-by-step scheme following the sequence of assumptions and procedures
followed with the use of graphic statics.
The examples include cases of structures subjected to dead loading, live loading and earthquake.
For each case a specific objective was defined which included verifying an experimentally known
solution for an arch bridge that was tested to failure, comparing two mechanisms in the kinematic
approach and finding a safe condition for the most critical one in the case of a convent church,
obtaining a thrust line for the exterior buttress of a four story building, evaluating the seismic behavior
for the transversal section of an aqueduct, and applying the kinematic approach for designing the
strengthening with tie rods of a façade in a tower.

Limit Analysis: Collection of examples of application
Erasmus Mundus Programme viii ADVANCED MASTERS IN STRUCTURAL ANALYSIS OF MONUMENTS AND HISTORICAL CONSTRUCTIONS
Limit Analysis: Collection of examples of application
Erasmus Mundus Programme ADVANCED MASTERS IN STRUCTURAL ANALYSIS OF MONUMENTS AND HISTORICAL CONSTRUCTIONS ix
RESUMEN
Análisis Límite: Colección de ejemplos de aplicación.
El Análisis Límite constituye un método simplificado para la evaluación de construcciones históricas
de mampostería.
Una serie de ejemplos de aplicación utilizando las aproximaciones estática y cinemática del análisis
límite son presentadas con explicaciones detalladas para ser utilizadas por futuros estudiantes del
programa SAHC, y por aquellos interesados en los principios y procedimientos de éstos métodos.
El estado del arte de los conceptos que subyacen el análisis límite es presentado así como una
selección de casos de estudio reales de diferente tipología estructural tales como un puente de arco
de luz simple, una bóveda de cañón apoyada en contrafuertes, un puente de arco de dos niveles y
múltiples luces (acueducto), el último arco en una fachada de series de arcos, y una torre.
Cada caso es mostrado en un esquema paso a paso, siguiendo la secuencia de suposiciones y
procedimientos llevados a cabo con el uso de la estática gráfica.
Los ejemplos incluyen casos de estructuras solicitadas a cargas permanentes, cargas vivas y sismo.
Para cada caso un objetivo específico fue definido incluyendo la verificación de una solución conocida
para una prueba de colapso en un puente de arco, la comparación entre dos mecanismos siguiendo
la aproximación cinemática y la búsqueda de una condición segura para el caso encontrado como
más crítico en el caso de una iglesia, la obtención de una línea de empuje para el contrafuerte
exterior de un edificio de cuatro plantas, la evaluación del comportamiento sísmico para la sección
transversal de un acueducto, y la aplicación de la aproximación cinemática para el diseño del
reforzamiento con tensores de una de las fachadas en una torre.

Limit Analysis: Collection of examples of application
Erasmus Mundus Programme x ADVANCED MASTERS IN STRUCTURAL ANALYSIS OF MONUMENTS AND HISTORICAL CONSTRUCTIONS
Limit Analysis: Collection of examples of application
Erasmus Mundus Programme ADVANCED MASTERS IN STRUCTURAL ANALYSIS OF MONUMENTS AND HISTORICAL CONSTRUCTIONS xi
RESUMO
Análise Limite: Compilação de Exemplos de Aplicação
A Análise Limite constitui um método simplificado para a avaliação de construções históricas de
alvenaria.
São apresentados vários exemplos de aplicação de ambas as análises limite estática e cinemática,
com explicações detalhadas de forma a serem usados no futuro por alunos do curso SAHC e por
outros interessados em entender os princípios e procedimento destas abordagens.
É apresentado o estado de arte dos conceitos subjacentes à análise limite, bem como uma selecção
de casos de estudo reais de diferentes tipologias de estruturas, como uma ponte em arco de vão
único, uma abóbada de berço apoiada em contrafortes, uma ponte em arco com vários vãos e de dois
níveis (aqueduto), o último arco numa fachada composta por uma série de arcos, e uma torre.
Cada caso é apresentado num esquema passo por passo, seguindo a sequência de suposições e
procedimentos, e seguido pelo uso de estáticas gráficas.
Os exemplos incluem casos de estruturas sujeitas a cargas permanentes, cargas variáveis e sismos.
Para cada caso é definido um objectivo específico que inclui verificar uma solução conhecida
experimentalmente para uma ponte em arco que foi testado até ao colapso, comparar dois
mecanismos da estrutura de um convento através da abordagem cinemática e encontrar uma
condição de segurança para o mais crítico, obter uma linha de impulso para os contrafortes exteriores
de um edifício de quatro pisos, avaliar o comportamento sísmico da secção transversal de um
aqueduto, e aplicar a abordagem cinemática para o projecto de reforço de tirantes para a fachada de
uma torre.

Limit Analysis: Collection of examples of application
Erasmus Mundus Programme xii ADVANCED MASTERS IN STRUCTURAL ANALYSIS OF MONUMENTS AND HISTORICAL CONSTRUCTIONS
Limit Analysis: Collection of examples of application
Erasmus Mundus Programme ADVANCED MASTERS IN STRUCTURAL ANALYSIS OF MONUMENTS AND HISTORICAL CONSTRUCTIONS xiii
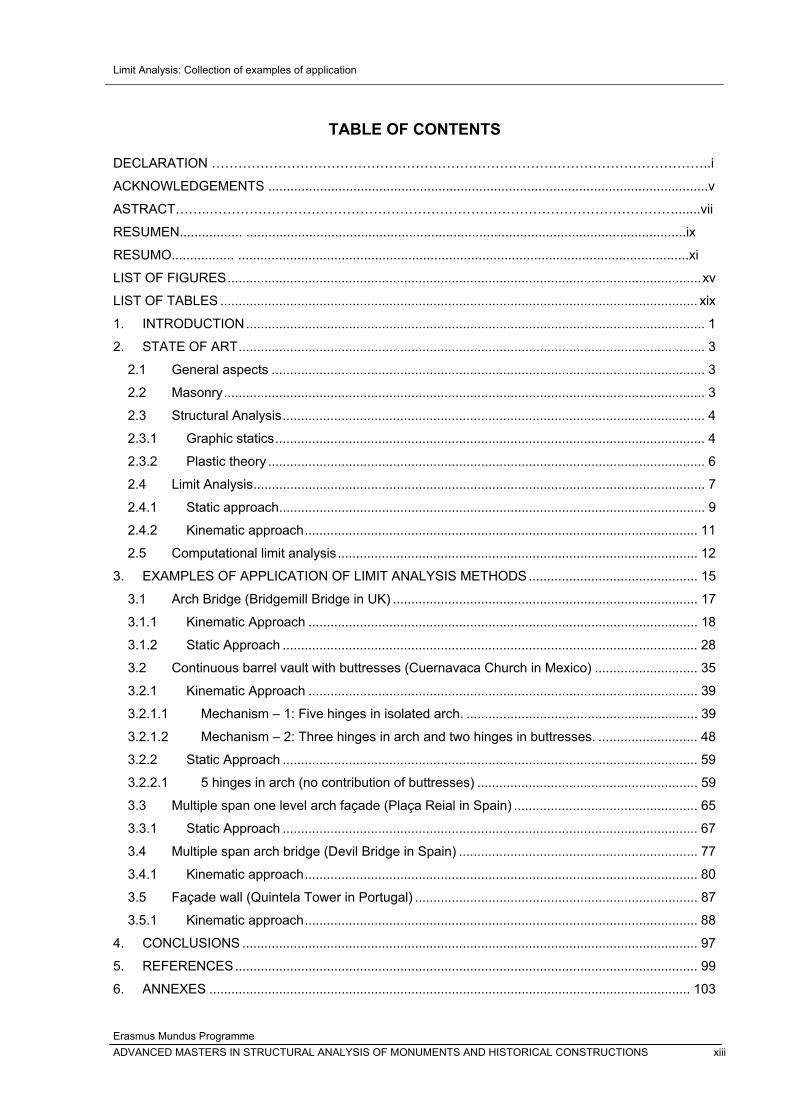
TABLE OF CONTENTS
DECLARATION …………………………………………………………………………………………………..i
ACKNOWLEDGEMENTS .......................................................................................................................v
ASTRACT……..…………………………………………………………………………………………….......vii
RESUMEN................. .......................................................................................................................ix
RESUMO................. ..........................................................................................................................xi
LIST OF FIGURES ................................................................................................................................. xv
LIST OF TABLES .................................................................................................................................. xix
1. INTRODUCTION ............................................................................................................................. 1
2. STATE OF ART ............................................................................................................................... 3
2.1 General aspects ...................................................................................................................... 3
2.2 Masonry ................................................................................................................................... 3
2.3 Structural Analysis ................................................................................................................... 4
2.3.1 Graphic statics ..................................................................................................................... 4
2.3.2 Plastic theory ....................................................................................................................... 6
2.4 Limit Analysis ........................................................................................................................... 7
2.4.1 Static approach .................................................................................................................... 9
2.4.2 Kinematic approach ........................................................................................................... 11
2.5 Computational limit analysis .................................................................................................. 12
3. EXAMPLES OF APPLICATION OF LIMIT ANALYSIS METHODS .............................................. 15
3.1 Arch Bridge (Bridgemill Bridge in UK) ................................................................................... 17
3.1.1 Kinematic Approach .......................................................................................................... 18
3.1.2 Static Approach ................................................................................................................. 28
3.2 Continuous barrel vault with buttresses (Cuernavaca Church in Mexico) ............................ 35
3.2.1 Kinematic Approach .......................................................................................................... 39
3.2.1.1 Mechanism – 1: Five hinges in isolated arch. ............................................................... 39
3.2.1.2 Mechanism – 2: Three hinges in arch and two hinges in buttresses. ........................... 48
3.2.2 Static Approach ................................................................................................................. 59
3.2.2.1 5 hinges in arch (no contribution of buttresses) ............................................................ 59
3.3 Multiple span one level arch façade (Plaça Reial in Spain) .................................................. 65
3.3.1 Static Approach ................................................................................................................. 67
3.4 Multiple span arch bridge (Devil Bridge in Spain) ................................................................. 77
3.4.1 Kinematic approach ........................................................................................................... 80
3.5 Façade wall (Quintela Tower in Portugal) ............................................................................. 87
3.5.1 Kinematic approach ........................................................................................................... 88
4. CONCLUSIONS ............................................................................................................................ 97
5. REFERENCES .............................................................................................................................. 99
6. ANNEXES ................................................................................................................................... 103
Limit Analysis: Collection of examples of application
Erasmus Mundus Programme xiv ADVANCED MASTERS IN STRUCTURAL ANALYSIS OF MONUMENTS AND HISTORICAL CONSTRUCTIONS
6.1. Limit Analysis using RING© ................................................................................................ 103
6.1.1. Bridgemill bridge: Limit Analysis using RING© ............................................................... 103
6.1.2. Cuernavaca Church: Limit Analysis using RING© .......................................................... 106
Limit Analysis: Collection of examples of application
Erasmus Mundus Programme ADVANCED MASTERS IN STRUCTURAL ANALYSIS OF MONUMENTS AND HISTORICAL CONSTRUCTIONS xv
LIST OF FIGURES
Fig. 1 – Different types of masonry arrangements. (Huerta Fernández, 2004) ...................................... 3
Fig. 2 – (a) Funicular construction for a set of loads; (b) magnitude of forces in funicular polygon.
(Block P. , Equilibrium systems: Studies in Masonry Structure, 2005) ................................................... 5
Fig. 3 – Left, force equilibrium of hanging weights on a string (Stevin, 1586); right, graphical analysis
of a funicular shape (Varignon, 1725) (Block, DeJong, & Ochsendorf, As Hangs the Flexible
Line:Equilibrium of Masonry Arches, 2006) ............................................................................................ 5
Fig. 4 – Gaudi´s graphical design for the columns and retaining wall of Park Guell, from Rubió, 1913.
(Block P. , Equilibrium systems: Studies in Masonry Structure, 2005) ................................................... 6
Fig. 5 – Thrust lines in masonry (Huerta Fernández, 2004) ................................................................... 8
Fig. 6 – Semicircular arch under selfweight application of the uniqueness theorem (a) Minimum thrust
(b) Maximum thrust. (Heyman, The Stone Skeleton: Structural Engineering of Masonry Architecture,
1995). ...................................................................................................................................................... 9
Fig. 7 – Computer optimization for alternate solutions in Maynou, 1998 (Roca, Ancient Rules and
Classical Approaches- Part 1-4. SA1 Lectures., 2009-2010) ................................................................. 9
Fig. 8 – Thrust line falls within the boundaries of the structure. (Roca, Ancient Rules and Classical
Approaches- Part 1-4. SA1 Lectures., 2009-2010) ............................................................................... 10
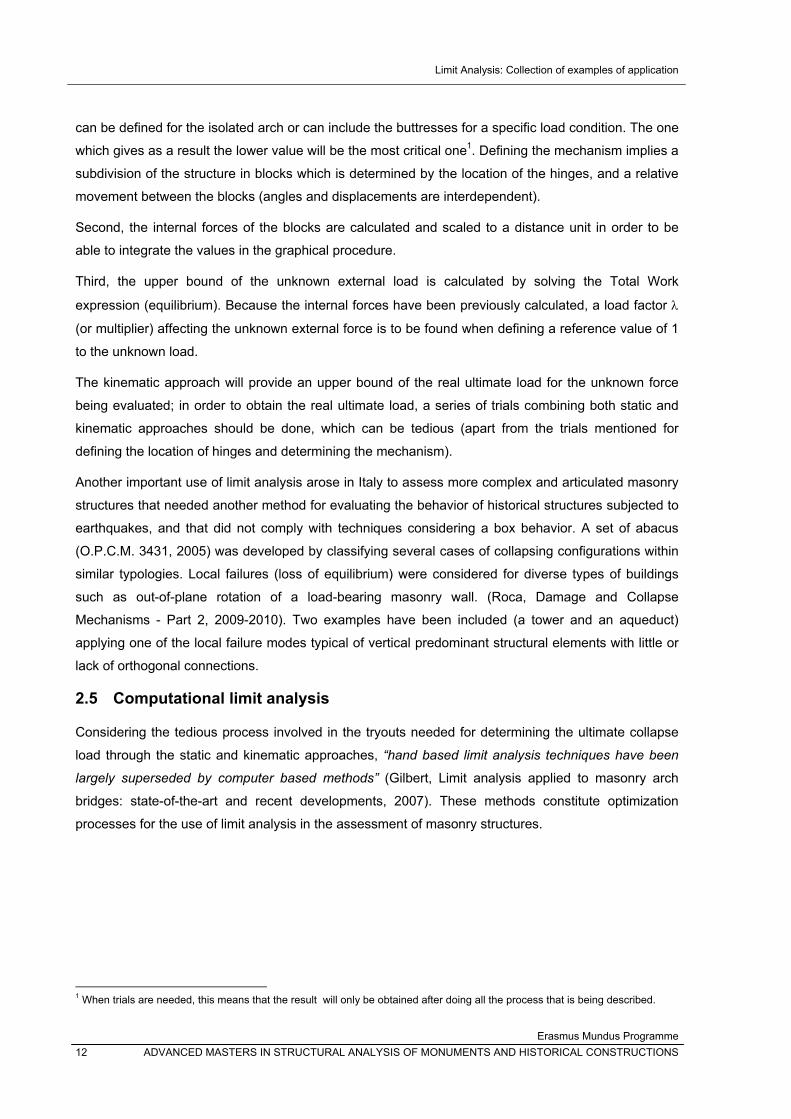
Fig. 9 - The relationship between upper and lower bound solutions (Gilbert, Limit analysis applied to
masonry arch bridges: state-of-the-art and recent developments, 2007) ............................................. 13
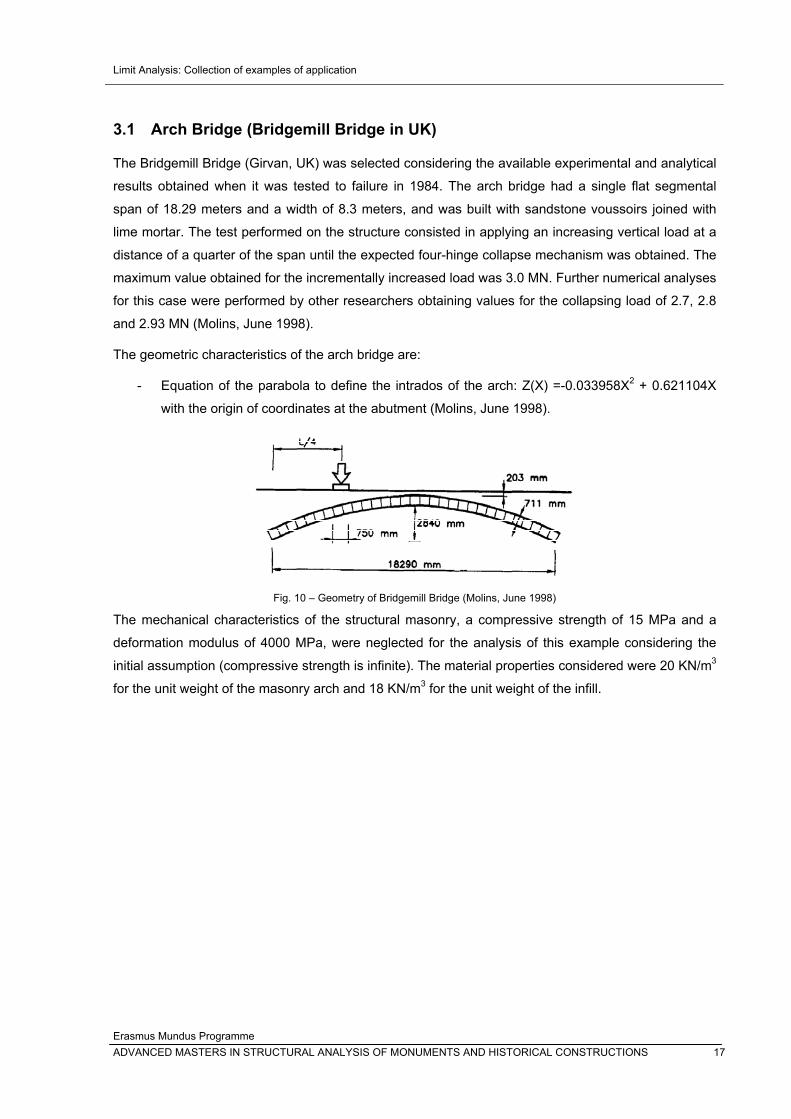
Fig. 10 – Geometry of Bridgemill Bridge (Molins, June 1998) .............................................................. 17
Fig. 11 – Scaled geometry of Bridgemill Bridge with position of the vertical load V at ¼ of the span. . 19
Fig. 12 - Expressions for TOTAL WORK (Roca, Ancient Rules and Classical Approaches- Part 1-4.
SA1 Lectures., 2009-2010) ................................................................................................................... 19
Fig. 13 – Bridgemill Bridge with location of the four hinges. ................................................................. 20
Fig. 14 - Overlapped mechanism from RING© in order to identify the movement of each block. ........ 21
Fig. 15 – Sign criteria. ........................................................................................................................... 21
Fig. 16 - Location of rotation centers for the three blocks in a four-hinge collapse mechanism in arch 21
Fig. 17 - Identification of the rotations, displacements and correlations with the hinges and centers of
rotation. .................................................................................................................................................. 22
Fig. 18 - Identification of the signs of the angles of rotation of the blocks. ........................................... 22
Fig. 19 - Displacements and rotations determined in sequence. .......................................................... 23
Fig. 20 - Measuring the horizontal component distance from centroid of initial block to rotation center
(in red). Verification of vertical displacement between centroids of initial blocks and rotated blocks (in
green). ................................................................................................................................................... 25
Fig. 21 - Discretization of arch, Location of centroids and vertical forces. ............................................ 30
Fig. 22 - Funicular polygon and resultant force. .................................................................................... 31
Fig. 23 - Selection of three hinges for the thrust line to pass through and projection on the funicular
polygon. ................................................................................................................................................. 32
Limit Analysis: Collection of examples of application
Erasmus Mundus Programme xvi ADVANCED MASTERS IN STRUCTURAL ANALYSIS OF MONUMENTS AND HISTORICAL CONSTRUCTIONS
Fig. 24 - Defining the new origin for the force polygon. ......................................................................... 33
Fig. 25 - A thrust line passing through ALL hinges is found inside the arch. ........................................ 33
Fig. 26 - Map of the distribution of convent compounds in Mexico and in the State of Morelos (Meli,
2009) ...................................................................................................................................................... 35
Fig. 27 – Continuous barrel vault of Cuernavaca convent church (Meli, 2009) .................................... 35
Fig. 28 – Typical ground plan of a convent compound and its church (Meli, 2009) .............................. 35
Fig. 29 – Buttress depth verification with Blondel´s Rule to Cuernavaca church. ................................. 36
Fig. 30 – Geometrical properties for the plan view of Cuernavaca Church. The thickness of the
buttress was assumed. .......................................................................................................................... 37
Fig. 31 – Geometrical properties for the vertical section of Cuernavaca Church .................................. 38
Fig. 32 - Expressions for TOTAL WORK (Roca, Ancient Rules and Classical Approaches- Part 1-4.
SA1 Lectures., 2009-2010) .................................................................................................................... 39
Fig. 33 – Overlapped mechanism from RING© in order to identify the movement of each block......... 40
Fig. 34 – Sign criteria. ............................................................................................................................ 40
Fig. 35 - Location of rotation centers for the four blocks in a symmetrical five-hinge collapse
mechanism in arch ................................................................................................................................. 41
Fig. 36 - Identification of the rotations, displacements and correlations with the hinges and centers of
rotation. .................................................................................................................................................. 42
Fig. 37 - Identification of the signs of the angles of rotation of the blocks. ............................................ 42
Fig. 38 – Displacements and rotations determined in sequence. ......................................................... 43
Fig. 39 – Measuring the horizontal component distance from centroid of initial block to rotation center
(in red). .................................................................................................................................................. 45
Fig. 40 - Expressions for TOTAL WORK (Roca, Ancient Rules and Classical Approaches- Part 1-4.
SA1 Lectures., 2009-2010) .................................................................................................................... 48
Fig. 41 - Identification of the movement of each block for the defined mechanism .............................. 49
Fig. 42 – Sign criteria. ............................................................................................................................ 49
Fig. 43 - Location of rotation centers for the four blocks in a symmetrical five-hinge collapse
mechanism in arch ................................................................................................................................. 50
Fig. 44 - Identification of the rotations, displacements and correlations with the hinges and centers of
rotation. .................................................................................................................................................. 51
Fig. 45 - Identification of the signs of the angles of rotation of the blocks. ............................................ 52
Fig. 46 - Displacements and rotations determined in sequence according to the following procedure. 53
Fig. 47 - Measuring the horizontal component distance from centroid of initial block to rotation center,
and distance from point of application of the external vertical force V to the nearest centroid (in red).
Measuring the vertical component distance between the centroids of the initial and the rotated blocks
(in green). .............................................................................................................................................. 56
Fig. 48 – Areas and widths considered for calculating the volume of arches and buttresses. .............. 57
Fig. 49 – Discretization of arch, location of centroids and vertical forces. ............................................ 61
Limit Analysis: Collection of examples of application
Erasmus Mundus Programme ADVANCED MASTERS IN STRUCTURAL ANALYSIS OF MONUMENTS AND HISTORICAL CONSTRUCTIONS xvii
Fig. 50 - Funicular polygon and resultant force ..................................................................................... 62
Fig. 51 - Selection of three hinges for the thrust line to pass through and projection on the funicular
polygon. ................................................................................................................................................. 63
Fig. 52 - Defining the new origin for the force polygon. ........................................................................ 64
Fig. 53 – A thrust line passing through ALL hinges is found inside the arch. ....................................... 64
Fig. 54 – Façade with series of arches in the Plaça Reial. (La Plaça Reial) ........................................ 65
Fig. 55 – Aerial view Plaça Reial. (Aero-plano) ..................................................................................... 65
Fig. 56 – View of the arches. (Alcolea Antiguedades) .......................................................................... 65
Fig. 57 – Arch in corner of Plaça Reial. ................................................................................................. 65
Fig. 58 – Arch in corner of Carrer de Colom ......................................................................................... 65
Fig. 59 - Geometry of last arch in carrer de Colom. .............................................................................. 66
Fig. 60 – Blondel rule applied to the external buttress of the last arch. ................................................ 66
Fig. 61 - Vertical and horizontal areas for calculating the permanent and live loads. ........................... 68
Fig. 62 - Permanent and live loads applied on each segment as point loads. ...................................... 69
Fig. 63 - Discretization of arch, location of centroids and vertical forces. ............................................. 71
Fig. 64 - Sum of the weight vectors. ...................................................................................................... 72
Fig. 65 - Position of the resultant force. ................................................................................................ 72
Fig. 66 – Location of forces and distances from centroids to point A from where the moments are
evaluated. .............................................................................................................................................. 73
Fig. 67 – Results for H through both analytical and graphical procedures. .......................................... 74
Fig. 68 – Magnitud of vectors (analytical) ............................................................................................. 75
Fig. 69 – Magnitud of vectors (graphical) .............................................................................................. 75
Fig. 70 – Thrust line with H found analytically. ...................................................................................... 75
Fig. 71 – Thrustline with H found graphically. ....................................................................................... 75
Fig. 72 – Map of the aqueduct of Tarragona (Schram & Passchier, 2005) .......................................... 77
Fig. 73 - Drawing of the Puente de Ferreras bridge of one of the aqueducts of Tarragona (D. Soberano
and A&C Reus/casado1972) (Schram & Passchier, 2005) .................................................................. 77
Fig. 74 – Aqueduct of las Ferreras (Ajuntament de Tarragona) ........................................................... 77
Fig. 75 – Aqueduct of Las Ferreras in Tarragona (The History of the Spanish Architecture) ............... 78
Fig. 76 – Aqueduct of Las Ferreras detail view (Ajuntament de Tarragona) ........................................ 78
Fig. 77 – Aqueduct of Las Ferreras view from the bottom (Ajuntament de Tarragona) ........................ 78
Fig. 78 – Aqueduct of Las Ferreras (Ajuntament de Tarragona) .......................................................... 78
Fig. 79 – Section of Pillars A15-A30. Source: Eng. Pere Roca (UPC) ................................................. 79
Fig. 80 – Detail of superior arches (Schram & Passchier, 2005) .......................................................... 79
Fig. 81 – Detail. (Schram & Passchier, 2005) ....................................................................................... 79
Fig. 82 – Detail of specus (Schram & Passchier, 2005) ....................................................................... 79
Fig. 83 – Section profile of the Devil´s Bridge. Source: Eng. Pere Roca (Universitat Politécnica de
Catalunya) ............................................................................................................................................. 79

Limit Analysis: Collection of examples of application
Erasmus Mundus Programme xviii ADVANCED MASTERS IN STRUCTURAL ANALYSIS OF MONUMENTS AND HISTORICAL CONSTRUCTIONS
Fig. 84 – ULS verification (Franchetti, 2009) ......................................................................................... 80
Fig. 85 – Geometry of the transversal section and corresponding area in the longitudinal section. ..... 81
Fig. 86 - Positive Reacting Moment (RM) and negative Acting Moment (AM). ..................................... 82
Fig. 87 – Spectral acceleration for the activation of the mechanism a0*. (Franchetti, 2009)................. 84
Fig. 88 – Participation mass M* (Franchetti, 2009) ............................................................................... 84
Fig. 89 – Distances from centroids of blocks to hinge-A; Virtual displacements with rotation of
structure. ................................................................................................................................................ 85
Fig. 90 – mass participant to the kinematism (e*) ................................................................................. 85
Fig. 91 – Spectral acceleration for the activation of the mechanism (a0*) ............................................. 85
Fig. 92 – Safety verification for Ultimate Limit State (ULS) ................................................................... 86
Fig. 93 – Section (SIPA - Sistema de Informação para o Património Arquitectónico (IHRU, Instituto da
Habitação e Reabilitação Urbana, IP)) .................................................................................................. 87
Fig. 94 – Quintela Tower in 1907 (Museu de Arqueologia e Numismática de Vila Real) ..................... 87
Fig. 95 – Orientation and plan geometry (IGESPAR IP - Instituto de Gestão do Património
Arquitectónico e Arqueológico (former IPPAR)) .................................................................................... 87
Fig. 96 – ULS verification (Franchetti, 2009) ......................................................................................... 88
Fig. 97 – Plan and section view of Quintela Tower showing the wall that will be verified. .................... 89
Fig. 98 – Geometry of the cross section with location of the center of masses .................................... 91
Fig. 99 - Location of the vertical and horizontal forces acting in the mechanism. ................................. 91
Fig. 100 – Spectral acceleration for the activation of the mechanism a0*. (Franchetti, 2009) .............. 92
Fig. 101 – Participation mass M* (Franchetti, 2009) ............................................................................. 93
Fig. 102 - Distances from centroids of blocks to hinge-A; Virtual displacements with rotation of
structure. ................................................................................................................................................ 93
Fig. 103 – mass participant to the kinematism (e*) ............................................................................... 94
Fig. 104 – Spectral acceleration for the activation of the mechanism (a0*) ........................................... 94
Fig. 105 – Safety verification for Ultimate Limit State (ULS) ................................................................. 94
Fig. 106 – RING© output showing a four-hinge mechanism and the corresponding thrust line. ........ 103
Fig. 107 – Bridgemill bridge geometry with an axle width of 0.75 meters (Meli, 2009) ....................... 104
Fig. 108 - RING© output showing the same four-hinge mechanism with a modified axle width for the
vertical load. ......................................................................................................................................... 104
Fig. 109 - RING© output showing the relocation of the third hinge for the arch without infill. ............. 105
Fig. 110 - RING© output showing the mechanism obtained for the load applied in the center of the
arch. ..................................................................................................................................................... 105
Fig. 111 - RING© output showing the mechanism obtained for the load applied in the center of the
arch. ..................................................................................................................................................... 107
Limit Analysis: Collection of examples of application
Erasmus Mundus Programme ADVANCED MASTERS IN STRUCTURAL ANALYSIS OF MONUMENTS AND HISTORICAL CONSTRUCTIONS xix
LIST OF TABLES
Table 1 - Load Factor table from Excel© .............................................................................................. 27
Table 2 – Geometric characteristics of the Cuernavaca Convent Church (Meli, 2009) ........................ 36
Table 3 - Mechanical properties of stone masonries. ........................................................................... 37
Table 4 - Load Factor table from Excel© .............................................................................................. 47
Table 5 - Load Factor table from Excel© .............................................................................................. 58
Table 6 – Loads above the half of the arch and buttress analyzed. ..................................................... 69
Table 7 – Total weights in structure ...................................................................................................... 70
Table 9 – Horizontal and vertical distances of centroids from hinge. .................................................... 83
Table 10 – Results of the verification without tie-rods and five tryout for strengthening with tie-rods
modifying the hinge of the mechanism proposed. ................................................................................. 95

Limit Analysis: Collection of examples of application
Erasmus Mundus Programme xx ADVANCED MASTERS IN STRUCTURAL ANALYSIS OF MONUMENTS AND HISTORICAL CONSTRUCTIONS
Limit Analysis: Collection of examples of application
Erasmus Mundus Programme ADVANCED MASTERS IN STRUCTURAL ANALYSIS OF MONUMENTS AND HISTORICAL CONSTRUCTIONS 1
1. INTRODUCTION
The concept of the “gentleman” architect developed during the Renaissance has defined the division
in the education of architects and engineers in the modern Western Europe (Heyman, The Stone
Skeleton: Structural Engineering of Masonry Architecture, 1995). This has lead to a step back when
comparing the practice of architects in the medieval ages and before where the aesthetic aspects
were integrated with the technical knowledge. There was no sacrifice on one or other aspects as the
variations from one heritage building to the other share a common feature that defines an essence:
the nature of a material. This essence defined how a structure was built but also challenges the
understanding of how it is still standing up and if it will be able to withstand actual conditions.
Assessing heritage buildings implies the need of recovering the integrated view of buildings and
structures that was present before the separation in the Renaissance. This is a major challenge as it
requires being able to combine contemporary knowledge with the understanding of the concepts used
in the past. Engineers interested in heritage preservation have the challenge of studying the historic,
philosophic and aesthetic issues present, while architects must make an effort to understand the
structural concepts underlying the behavior of a building.
As an architect my interest in the SAHC Master program was related to this concern. I am convinced
that this separation is generating negative consequences in the intervention in heritage buildings, and
it is also affecting the process of design of contemporary architecture.
However, I am aware of the difficulties that each professional has in the attempt of fully understanding
the complexities of the other area of expertise without the basic background required to control a
different method of approach. For this reason, I have chosen a topic for the thesis that I knew will help
me start with understanding the basics of structural analysis and material behavior. It was also of my
interest to be able to learn a method that requires the use of graphic tools which constitute one of the
main tools of my profession. This is my first step towards integration.
The topic selected, preparing a set of examples of both static and kinematic limit analysis, obliges
understanding the principles and operation applied in each case study selected. The examples that
were chosen are existing masonry structures in different regions of the world (with the exception of a
bridge that existed but was tested to failure). Different typologies were selected as well: a bridge, an
aqueduct, a tower, a church and a four story building. The case studies evaluated include the analysis
for dead loading, live loading and earthquake. The variety of cases and the approach in each one
allows observing the wide applicability of this simplified method of structural analysis.
The methodology used consisted in four steps: First, a literature review was performed in order to
understand the theoretical principles of limit analysis applied to masonry structures. Second, an
identification of the examples that have been done by other others was done. Third, the new examples
Limit Analysis: Collection of examples of application
Erasmus Mundus Programme 2 ADVANCED MASTERS IN STRUCTURAL ANALYSIS OF MONUMENTS AND HISTORICAL CONSTRUCTIONS
were selected, the conditions for the analysis were established for each approach defined, and the
solutions were developed. Finally, the procedure of each analysis was organized in a step-by-step
scheme within each of the chapters of this document.
Limit Analysis: Collection of examples of application
Erasmus Mundus Programme ADVANCED MASTERS IN STRUCTURAL ANALYSIS OF MONUMENTS AND HISTORICAL CONSTRUCTIONS 3
2. STATE OF ART
2.1 General aspects
Masonry structures constitute the majority of the heritage buildings that remain until today considering
that the other traditional material, wood, is subjected to the natural decay of living things. The fact of
the existence of masonry heritage buildings surviving after the effects produced by time and the
conditions of a particular geographical context, suggests “an extreme stability of their structure”.
Stability refers to the fact that the structure must not develop large unstable displacements (locally or
overall). (Heyman, The Stone Skeleton: Structural Engineering of Masonry Architecture, 1995).
The other two structural criteria strength (capacity to withstand the imposed loads) and stiffness
(excessive deflection should not occur) are not of main relevance for the assessment of historical
masonry buildings, considering that for the process of building a structure the proportions of the
elements were defined and once constructed and standing up it will not crush or deflect excessively.
On the other hand, sudden changes of the structural conditions can put an end on the stability of the
structure, even though the strength capacity and the stiffness parameters are not affected.
These conditions define that the main concern for safety assessment of masonry structures is mainly
related to the relationship between stability and geometrical characteristics (that were defined by rules
of proportion until the theory of elasticity was developed).
2.2 Masonry
“Masonry is an assemblage of stones – or bricks, or indeed sun-dried mud (adobe) – classified for
convenience with certain distinct labels, as Byzantine, Romanesque, Gothic, but recognized by
engineers as having a common structural action. This action arises directly from the properties of the
material.” (Heyman, The Stone Skeleton: Structural Engineering of Masonry Architecture, 1995)
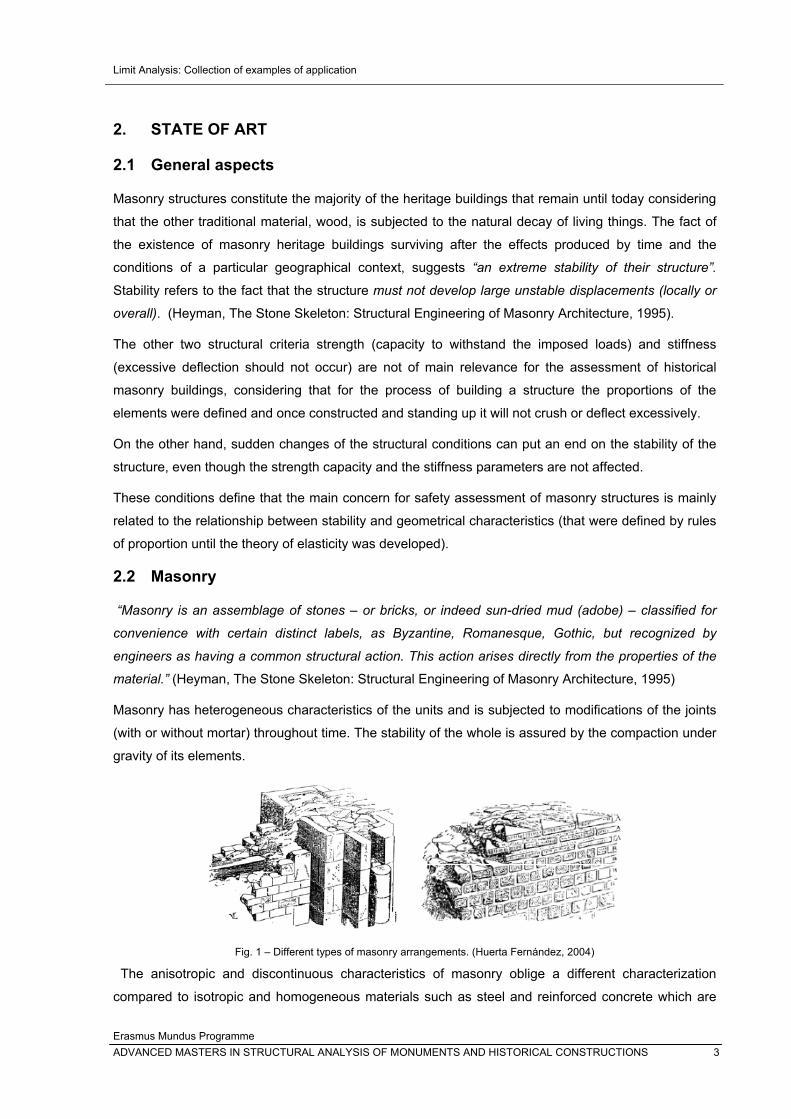
Masonry has heterogeneous characteristics of the units and is subjected to modifications of the joints
(with or without mortar) throughout time. The stability of the whole is assured by the compaction under
gravity of its elements.
Fig. 1 – Different types of masonry arrangements. (Huerta Fernández, 2004)
The anisotropic and discontinuous characteristics of masonry oblige a different characterization
compared to isotropic and homogeneous materials such as steel and reinforced concrete which are
Limit Analysis: Collection of examples of application
Erasmus Mundus Programme 4 ADVANCED MASTERS IN STRUCTURAL ANALYSIS OF MONUMENTS AND HISTORICAL CONSTRUCTIONS
defined by “certain elastic constants” (Young and Poisson Modulus).This difference obliges a shift in
the structural analysis approach, as the elastic approach is interested in knowing the stresses within
the structure in order to compare it with the admissible values obtained experimentally; therefore
strength is the main concern in the elastic analysis. (Huerta Fernández, 2004)
Considering that strength is not the most important parameter for the analysis of masonry structures, a
characterization of the mechanical behavior of masonry is done with the following considerations:
- Masonry has high capacity for compressive stresses.
- Masonry has very low capacity for tensile stresses.
- Failure by sliding of the units is very rare due to the high friction coefficients between them.
With these parameters, it can be observed that the weak aspect of masonry is due to the incapability
of resisting tensile stresses. This parameter has been observed in the existence of cracks in masonry
constructions that have appeared caused by changes in external boundary or load conditions without
causing the collapse of the structure. This property of the material to deform and withstand structural
damage without collapsing is known as ductility (the opposite concept is brittleness). Ductility of
masonry structures “ensure inelastic redistribution of actions among the components”, therefore it
constitutes a positive quality when subjected to seismic actions as the structure “allows large
absorption and dissipation of earthquake-induced energy” (Marcari, Maca, & Oliveira, 2009).
The capacity to deform without rupture of the masonry allows the assumption of small displacements
as a hypothesis that is used for the application of Limit Analysis (Orduña & Lourenço, 2001)
2.3 Structural Analysis
“The aim of structural theory is to be able to design safe buildings or to estimate the safety of existing
ones” (Huerta, Mechanics of masonry vaults: The equilibrium approach, 2001). Masonry structures
have particular characteristics which have obliged specific applications of the analysis techniques that
have been developed.
The traditional “geometrical” theory of the old master builders and the scientific theory developed
afterwards are integrated today in order to understand “what makes a structure safe (or unsafe)”.
Furthermore both theories arrive to the same conclusion:” the safety of a masonry structure is a matter
of geometry”. (Huerta, Mechanics of masonry vaults: The equilibrium approach, 2001)
A brief reference to the evolution of these theories is presented connecting graphic statics with the
plastic theory which are integrated to understand the methods of limit analysis.
2.3.1 Graphic statics
Graphic statics refers to the method for equilibrium analysis developed as the attempt to calculate
structures fundamentally by the use of graphic techniques throughout the process of constructing
Limit Analysis: Collection of examples of application
Erasmus Mundus Programme ADVANCED MASTERS IN STRUCTURAL ANALYSIS OF MONUMENTS AND HISTORICAL CONSTRUCTIONS 5
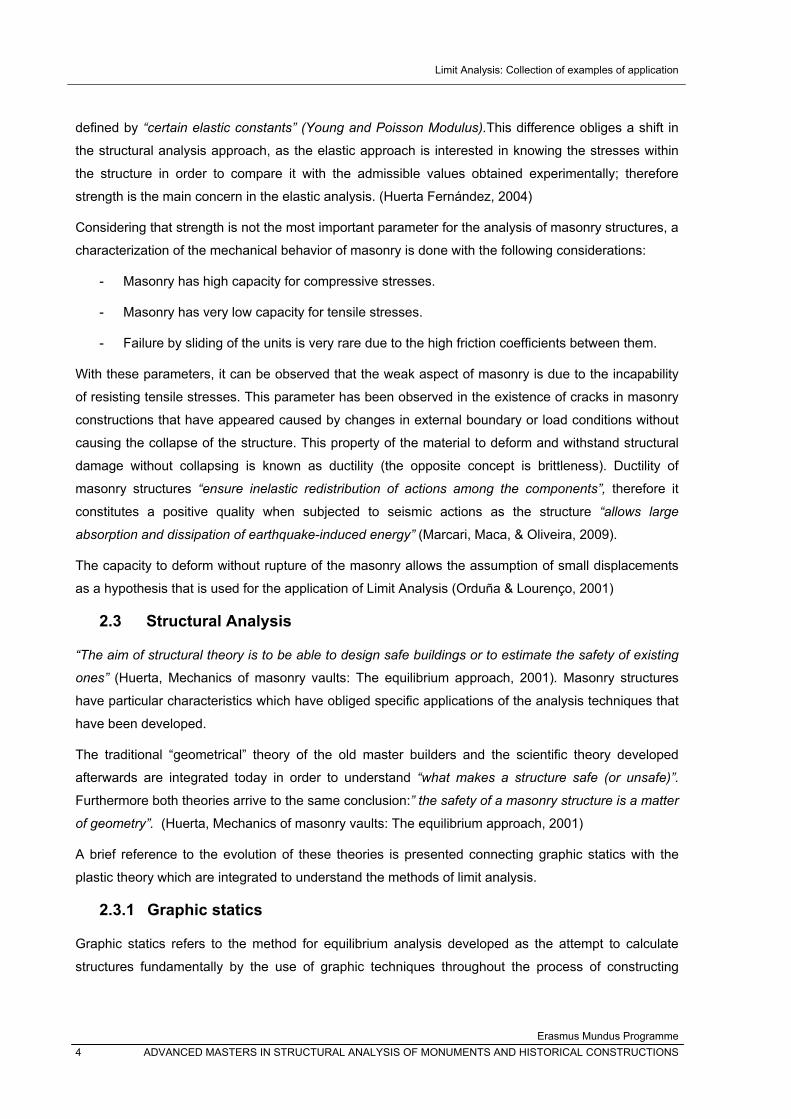
funicular shapes (only tension or compression) for a certain set of loads. (Block P. , Equilibrium
systems: Studies in Masonry Structure, 2005)
Fig. 2 – (a) Funicular construction for a set of loads; (b) magnitude of forces in funicular polygon. (Block P. , Equilibrium systems: Studies in Masonry Structure, 2005)
The use of Graphic statics for structural engineering was formalized by Culmann in 1866. However
the theories and the notion of vectors existed previously since the introduction of Stevin`s
parallelogram rule (1586) where “equilibrium could be described graphically using force vectors and
closed force polygons”. (Block, DeJong, & Ochsendorf, As Hangs the Flexible Line:Equilibrium of
Masonry Arches, 2006)
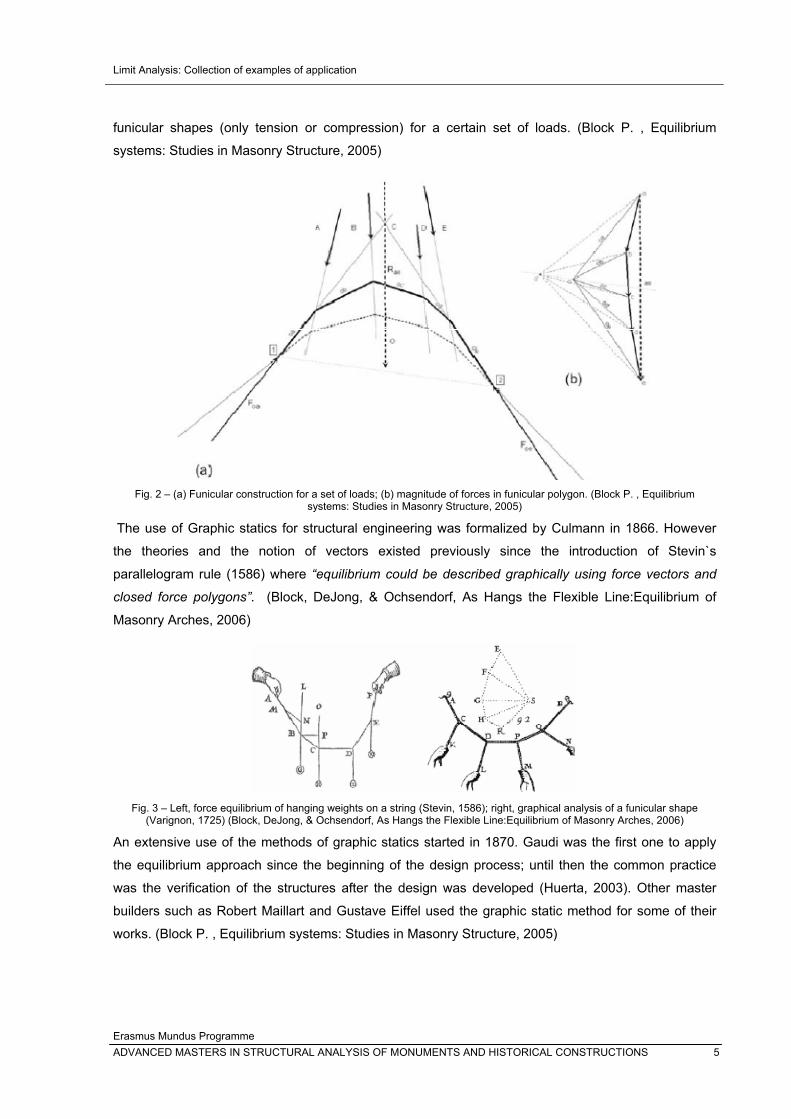
Fig. 3 – Left, force equilibrium of hanging weights on a string (Stevin, 1586); right, graphical analysis of a funicular shape (Varignon, 1725) (Block, DeJong, & Ochsendorf, As Hangs the Flexible Line:Equilibrium of Masonry Arches, 2006)
An extensive use of the methods of graphic statics started in 1870. Gaudi was the first one to apply
the equilibrium approach since the beginning of the design process; until then the common practice
was the verification of the structures after the design was developed (Huerta, 2003). Other master
builders such as Robert Maillart and Gustave Eiffel used the graphic static method for some of their
works. (Block P. , Equilibrium systems: Studies in Masonry Structure, 2005)
Limit Analysis: Collection of examples of application
Erasmus Mundus Programme 6 ADVANCED MASTERS IN STRUCTURAL ANALYSIS OF MONUMENTS AND HISTORICAL CONSTRUCTIONS
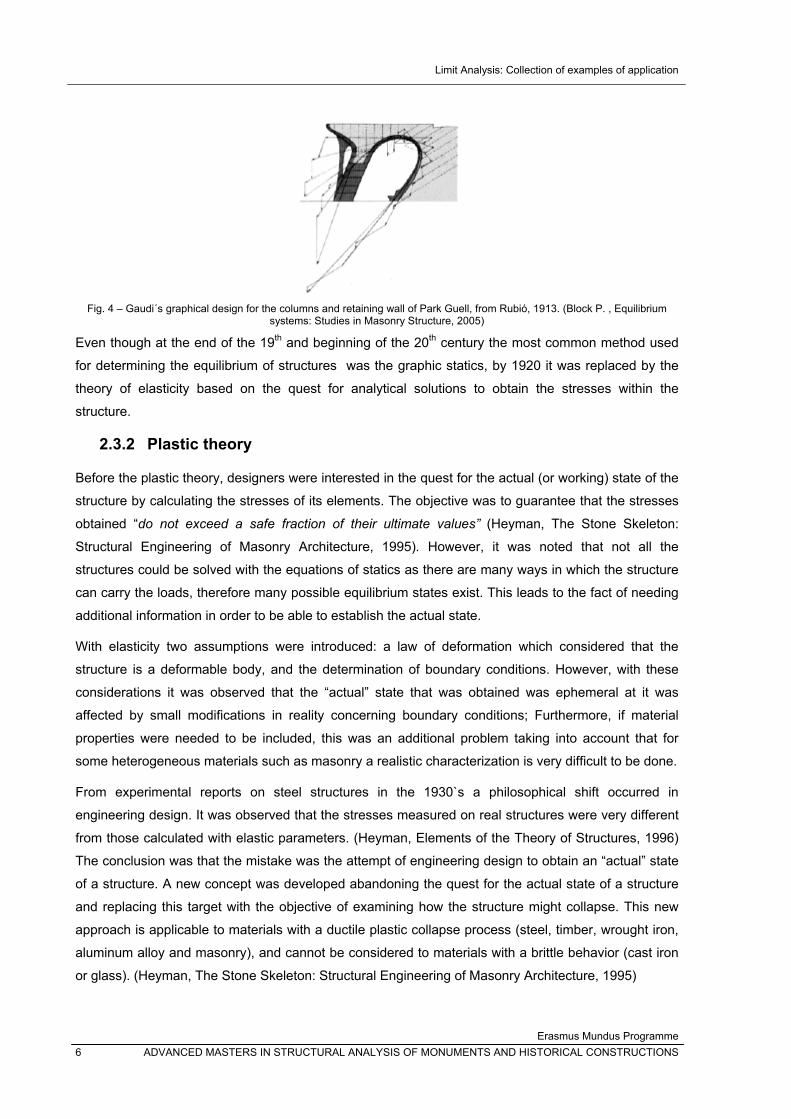
Fig. 4 – Gaudi´s graphical design for the columns and retaining wall of Park Guell, from Rubió, 1913. (Block P. , Equilibrium systems: Studies in Masonry Structure, 2005)
Even though at the end of the 19th and beginning of the 20th century the most common method used
for determining the equilibrium of structures was the graphic statics, by 1920 it was replaced by the
theory of elasticity based on the quest for analytical solutions to obtain the stresses within the
structure.
2.3.2 Plastic theory
Before the plastic theory, designers were interested in the quest for the actual (or working) state of the
structure by calculating the stresses of its elements. The objective was to guarantee that the stresses
obtained “do not exceed a safe fraction of their ultimate values” (Heyman, The Stone Skeleton:
Structural Engineering of Masonry Architecture, 1995). However, it was noted that not all the
structures could be solved with the equations of statics as there are many ways in which the structure
can carry the loads, therefore many possible equilibrium states exist. This leads to the fact of needing
additional information in order to be able to establish the actual state.
With elasticity two assumptions were introduced: a law of deformation which considered that the
structure is a deformable body, and the determination of boundary conditions. However, with these
considerations it was observed that the “actual” state that was obtained was ephemeral at it was
affected by small modifications in reality concerning boundary conditions; Furthermore, if material
properties were needed to be included, this was an additional problem taking into account that for
some heterogeneous materials such as masonry a realistic characterization is very difficult to be done.
From experimental reports on steel structures in the 1930`s a philosophical shift occurred in
engineering design. It was observed that the stresses measured on real structures were very different
from those calculated with elastic parameters. (Heyman, Elements of the Theory of Structures, 1996)
The conclusion was that the mistake was the attempt of engineering design to obtain an “actual” state
of a structure. A new concept was developed abandoning the quest for the actual state of a structure
and replacing this target with the objective of examining how the structure might collapse. This new
approach is applicable to materials with a ductile plastic collapse process (steel, timber, wrought iron,
aluminum alloy and masonry), and cannot be considered to materials with a brittle behavior (cast iron
or glass). (Heyman, The Stone Skeleton: Structural Engineering of Masonry Architecture, 1995)
Limit Analysis: Collection of examples of application
Erasmus Mundus Programme ADVANCED MASTERS IN STRUCTURAL ANALYSIS OF MONUMENTS AND HISTORICAL CONSTRUCTIONS 7
The difference between the two approximations is that during the calculation of a hypothetical collapse
of the structure, when an equilibrium state is achieved for the structure subjected to specific loading
conditions, the elastic approach will consider this as the “actual” state, whereas the plastic approach
will consider having found one particular state out of the infinite possible options. In both cases the
master safe theorem of plasticity is being applied: “If any equilibrium state can be found, that is, one
for which a set of internal forces is in equilibrium with the external loads, and, further, for which every
internal portion of the structure satisfies a strength criterion, then the structure is safe.” “In masonry the
strength criterion is effectively that the forces should lie within the boundaries of the material”.
(Heyman, The Stone Skeleton: Structural Engineering of Masonry Architecture, 1995)
Considering the above, Heyman has pointed out that for the analysis of masonry structures plastic
theory should be used with limit analysis methods considering the structure only in relation to its
ultimate state, with the additional advantage that few material parameters and no prior knowledge of
the initial stress state are required, (Gilbert, Limit analysis applied to masonry arch bridges: state-of-
the-art and recent developments, 2007) being particularly appropriate for the usual lack of information
regarding historical constructions.
“Plastic methods are concerned with estimates of the strength of structures and they make use of the
fact that any practical material has good ductile properties. Such materials allow internal forces in a
structure to redistribute themselves; as loads are slowly increased, their final collapse values are
predictable, and reproducible, with spectacular accuracy. The small imperfections of fabrication and
erection of hyperstatic structures, which alter so markedly the elastic distribution of internal forces,
have no effect on ultimate carrying capacity”. “The plastic designer imagines a hypothetical increase in
loading”. (Heyman, Elements of the Theory of Structures, 1996)
For the case of masonry, the limit condition of the material is the requirement of being always under a
compression state, therefore the stresses must be always between the boundaries of the structure.
(Huerta, 2003)
2.4 Limit Analysis
Limit Analysis (or collapsing mechanism analysis) (Molins, June 1998) developed within the modern
theory of plasticity during the 20th century when Jacques Heyman, in 1966, applied this approach to
evaluate the load capacity and failure mechanisms of masonry arches which today are known as
macro-elements. Heyman related the limit analysis theory with the rigid-perfectly plastic material
model considering three hypotheses (Heyman, 1995):
(i) Masonry has no tensile strength,
(ii) Masonry has infinite compressive strength
(iii) Sliding between stone blocks does not occur
Limit Analysis: Collection of examples of application
Erasmus Mundus Programme 8 ADVANCED MASTERS IN STRUCTURAL ANALYSIS OF MONUMENTS AND HISTORICAL CONSTRUCTIONS
With these considerations, the limit condition of the macro-element analyzed will be reached if two
situations are found that comply with the following theorems (Roca, Ancient Rules and Classical
Approaches- Part 1-4. SA1 Lectures., 2009-2010):
(i) Static approach (Lower Bound): The structure is safe, meaning that the collapse will not
occur, if a statically admissible state of equilibrium can be found.
(ii) Kinematic approach (Upper Bound): If a kinematically admissible mechanism can be
found, for which the work developed by external forces is positive or zero, then the
structure will collapse.
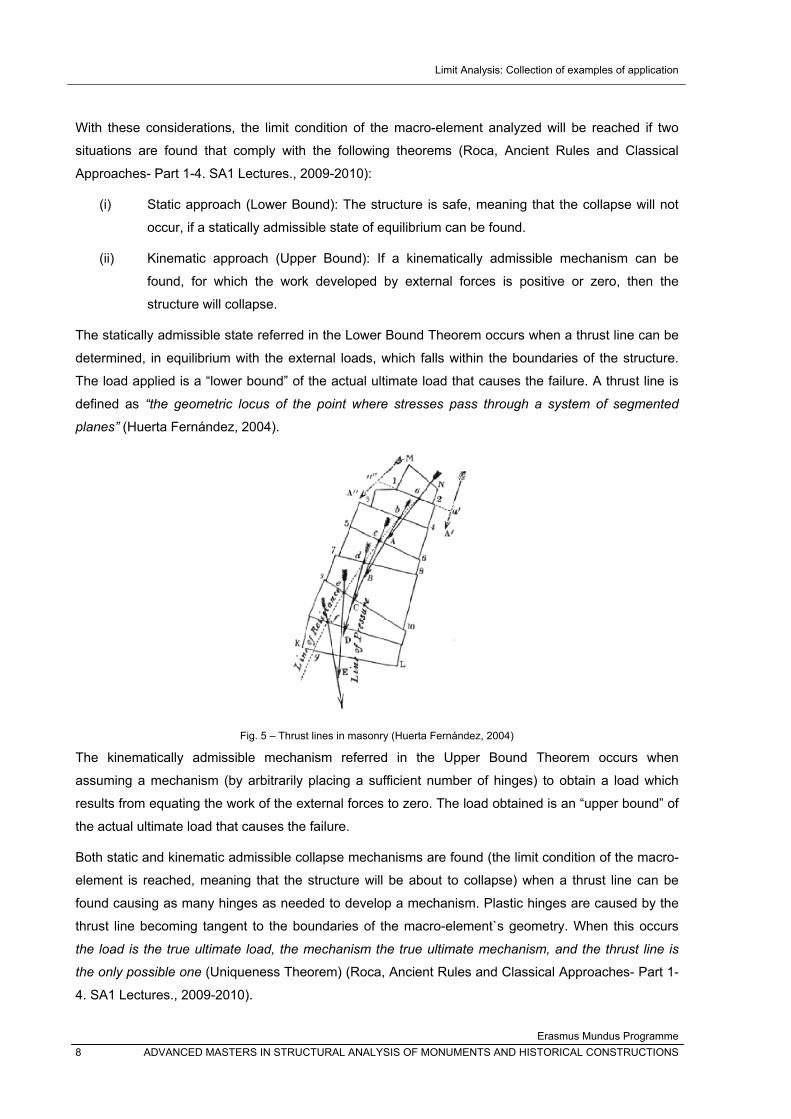
The statically admissible state referred in the Lower Bound Theorem occurs when a thrust line can be
determined, in equilibrium with the external loads, which falls within the boundaries of the structure.
The load applied is a “lower bound” of the actual ultimate load that causes the failure. A thrust line is
defined as “the geometric locus of the point where stresses pass through a system of segmented
planes” (Huerta Fernández, 2004).
Fig. 5 – Thrust lines in masonry (Huerta Fernández, 2004)
The kinematically admissible mechanism referred in the Upper Bound Theorem occurs when
assuming a mechanism (by arbitrarily placing a sufficient number of hinges) to obtain a load which
results from equating the work of the external forces to zero. The load obtained is an “upper bound” of
the actual ultimate load that causes the failure.
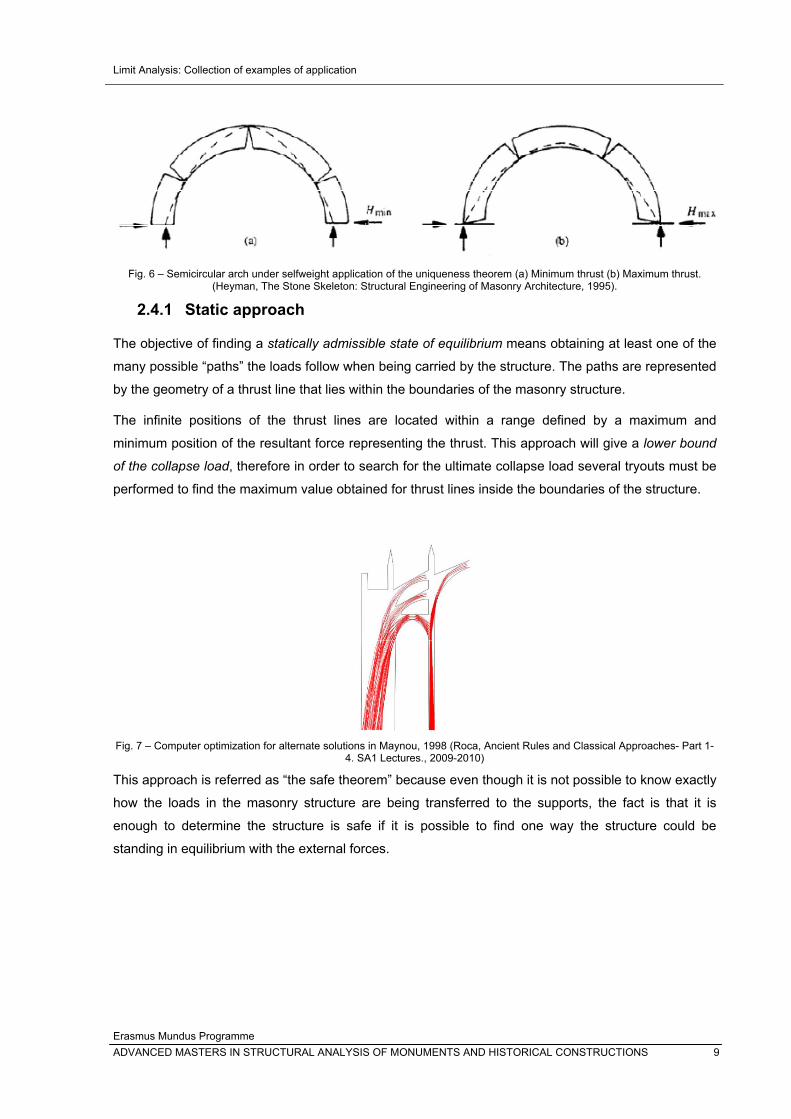
Both static and kinematic admissible collapse mechanisms are found (the limit condition of the macro-
element is reached, meaning that the structure will be about to collapse) when a thrust line can be
found causing as many hinges as needed to develop a mechanism. Plastic hinges are caused by the
thrust line becoming tangent to the boundaries of the macro-element`s geometry. When this occurs
the load is the true ultimate load, the mechanism the true ultimate mechanism, and the thrust line is
the only possible one (Uniqueness Theorem) (Roca, Ancient Rules and Classical Approaches- Part 1-
4. SA1 Lectures., 2009-2010).
Limit Analysis: Collection of examples of application
Erasmus Mundus Programme ADVANCED MASTERS IN STRUCTURAL ANALYSIS OF MONUMENTS AND HISTORICAL CONSTRUCTIONS 9
Fig. 6 – Semicircular arch under selfweight application of the uniqueness theorem (a) Minimum thrust (b) Maximum thrust.
(Heyman, The Stone Skeleton: Structural Engineering of Masonry Architecture, 1995).
2.4.1 Static approach
The objective of finding a statically admissible state of equilibrium means obtaining at least one of the
many possible “paths” the loads follow when being carried by the structure. The paths are represented
by the geometry of a thrust line that lies within the boundaries of the masonry structure.
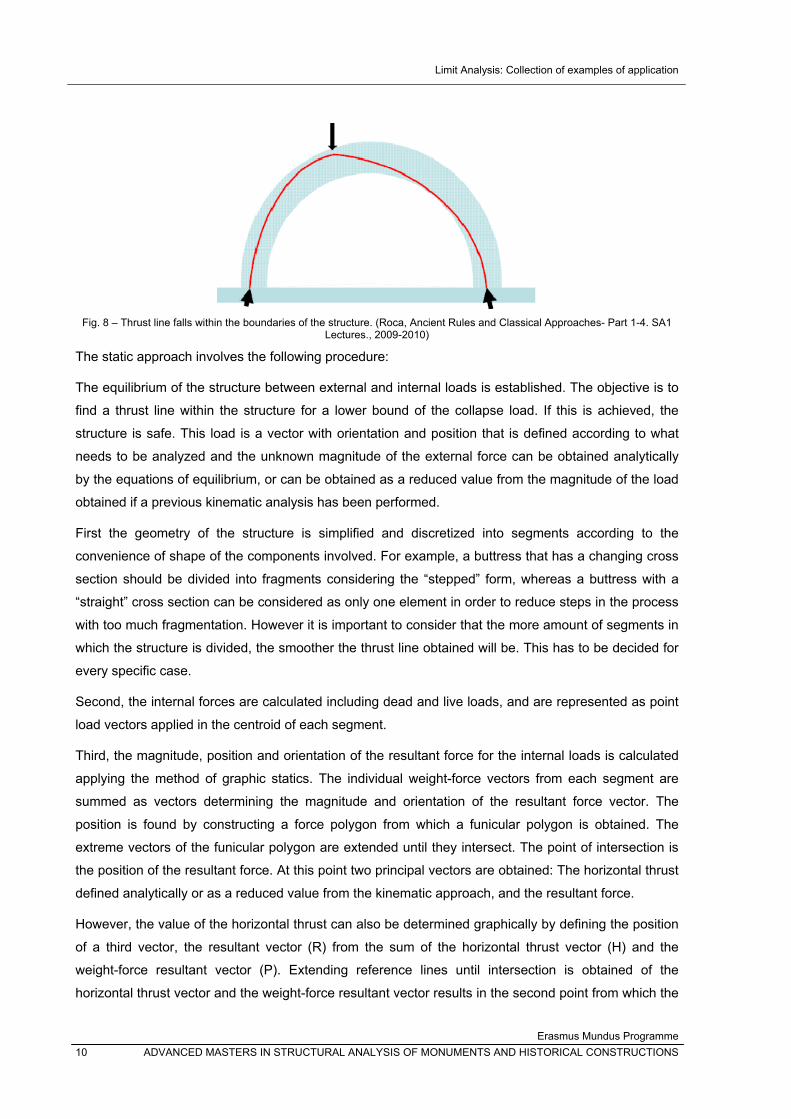
The infinite positions of the thrust lines are located within a range defined by a maximum and
minimum position of the resultant force representing the thrust. This approach will give a lower bound
of the collapse load, therefore in order to search for the ultimate collapse load several tryouts must be
performed to find the maximum value obtained for thrust lines inside the boundaries of the structure.
Fig. 7 – Computer optimization for alternate solutions in Maynou, 1998 (Roca, Ancient Rules and Classical Approaches- Part 1-
4. SA1 Lectures., 2009-2010)
This approach is referred as “the safe theorem” because even though it is not possible to know exactly
how the loads in the masonry structure are being transferred to the supports, the fact is that it is
enough to determine the structure is safe if it is possible to find one way the structure could be
standing in equilibrium with the external forces.
Limit Analysis: Collection of examples of application
Erasmus Mundus Programme 10 ADVANCED MASTERS IN STRUCTURAL ANALYSIS OF MONUMENTS AND HISTORICAL CONSTRUCTIONS
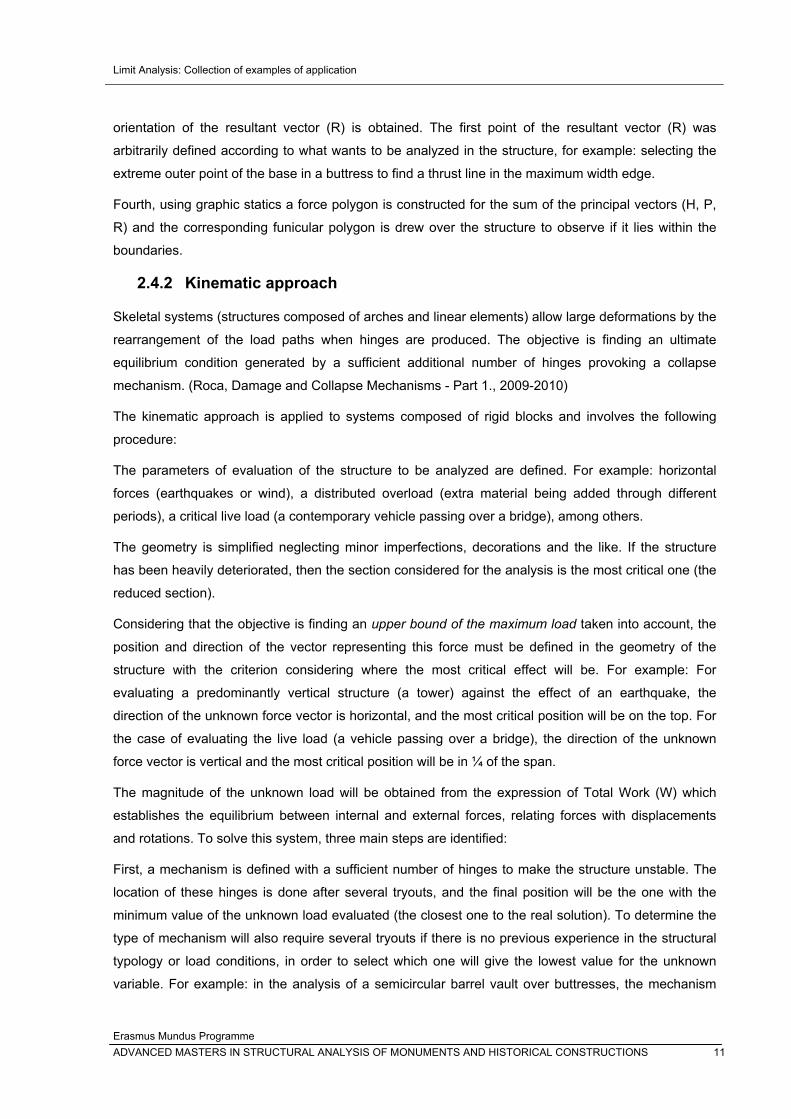
Fig. 8 – Thrust line falls within the boundaries of the structure. (Roca, Ancient Rules and Classical Approaches- Part 1-4. SA1
Lectures., 2009-2010)
The static approach involves the following procedure:
The equilibrium of the structure between external and internal loads is established. The objective is to
find a thrust line within the structure for a lower bound of the collapse load. If this is achieved, the
structure is safe. This load is a vector with orientation and position that is defined according to what
needs to be analyzed and the unknown magnitude of the external force can be obtained analytically
by the equations of equilibrium, or can be obtained as a reduced value from the magnitude of the load
obtained if a previous kinematic analysis has been performed.
First the geometry of the structure is simplified and discretized into segments according to the
convenience of shape of the components involved. For example, a buttress that has a changing cross
section should be divided into fragments considering the “stepped” form, whereas a buttress with a
“straight” cross section can be considered as only one element in order to reduce steps in the process
with too much fragmentation. However it is important to consider that the more amount of segments in
which the structure is divided, the smoother the thrust line obtained will be. This has to be decided for
every specific case.
Second, the internal forces are calculated including dead and live loads, and are represented as point
load vectors applied in the centroid of each segment.
Third, the magnitude, position and orientation of the resultant force for the internal loads is calculated
applying the method of graphic statics. The individual weight-force vectors from each segment are
summed as vectors determining the magnitude and orientation of the resultant force vector. The
position is found by constructing a force polygon from which a funicular polygon is obtained. The
extreme vectors of the funicular polygon are extended until they intersect. The point of intersection is
the position of the resultant force. At this point two principal vectors are obtained: The horizontal thrust
defined analytically or as a reduced value from the kinematic approach, and the resultant force.
However, the value of the horizontal thrust can also be determined graphically by defining the position
of a third vector, the resultant vector (R) from the sum of the horizontal thrust vector (H) and the
weight-force resultant vector (P). Extending reference lines until intersection is obtained of the
horizontal thrust vector and the weight-force resultant vector results in the second point from which the
Limit Analysis: Collection of examples of application
Erasmus Mundus Programme ADVANCED MASTERS IN STRUCTURAL ANALYSIS OF MONUMENTS AND HISTORICAL CONSTRUCTIONS 11
orientation of the resultant vector (R) is obtained. The first point of the resultant vector (R) was
arbitrarily defined according to what wants to be analyzed in the structure, for example: selecting the
extreme outer point of the base in a buttress to find a thrust line in the maximum width edge.
Fourth, using graphic statics a force polygon is constructed for the sum of the principal vectors (H, P,
R) and the corresponding funicular polygon is drew over the structure to observe if it lies within the
boundaries.
2.4.2 Kinematic approach
Skeletal systems (structures composed of arches and linear elements) allow large deformations by the
rearrangement of the load paths when hinges are produced. The objective is finding an ultimate
equilibrium condition generated by a sufficient additional number of hinges provoking a collapse
mechanism. (Roca, Damage and Collapse Mechanisms - Part 1., 2009-2010)
The kinematic approach is applied to systems composed of rigid blocks and involves the following
procedure:
The parameters of evaluation of the structure to be analyzed are defined. For example: horizontal
forces (earthquakes or wind), a distributed overload (extra material being added through different
periods), a critical live load (a contemporary vehicle passing over a bridge), among others.
The geometry is simplified neglecting minor imperfections, decorations and the like. If the structure
has been heavily deteriorated, then the section considered for the analysis is the most critical one (the
reduced section).
Considering that the objective is finding an upper bound of the maximum load taken into account, the
position and direction of the vector representing this force must be defined in the geometry of the
structure with the criterion considering where the most critical effect will be. For example: For
evaluating a predominantly vertical structure (a tower) against the effect of an earthquake, the
direction of the unknown force vector is horizontal, and the most critical position will be on the top. For
the case of evaluating the live load (a vehicle passing over a bridge), the direction of the unknown
force vector is vertical and the most critical position will be in ¼ of the span.
The magnitude of the unknown load will be obtained from the expression of Total Work (W) which
establishes the equilibrium between internal and external forces, relating forces with displacements
and rotations. To solve this system, three main steps are identified:
First, a mechanism is defined with a sufficient number of hinges to make the structure unstable. The
location of these hinges is done after several tryouts, and the final position will be the one with the
minimum value of the unknown load evaluated (the closest one to the real solution). To determine the
type of mechanism will also require several tryouts if there is no previous experience in the structural
typology or load conditions, in order to select which one will give the lowest value for the unknown
variable. For example: in the analysis of a semicircular barrel vault over buttresses, the mechanism
Limit Analysis: Collection of examples of application
Erasmus Mundus Programme 12 ADVANCED MASTERS IN STRUCTURAL ANALYSIS OF MONUMENTS AND HISTORICAL CONSTRUCTIONS
can be defined for the isolated arch or can include the buttresses for a specific load condition. The one
which gives as a result the lower value will be the most critical one1. Defining the mechanism implies a
subdivision of the structure in blocks which is determined by the location of the hinges, and a relative
movement between the blocks (angles and displacements are interdependent).
Second, the internal forces of the blocks are calculated and scaled to a distance unit in order to be
able to integrate the values in the graphical procedure.
Third, the upper bound of the unknown external load is calculated by solving the Total Work
expression (equilibrium). Because the internal forces have been previously calculated, a load factor λ
(or multiplier) affecting the unknown external force is to be found when defining a reference value of 1
to the unknown load.
The kinematic approach will provide an upper bound of the real ultimate load for the unknown force
being evaluated; in order to obtain the real ultimate load, a series of trials combining both static and
kinematic approaches should be done, which can be tedious (apart from the trials mentioned for
defining the location of hinges and determining the mechanism).
Another important use of limit analysis arose in Italy to assess more complex and articulated masonry
structures that needed another method for evaluating the behavior of historical structures subjected to
earthquakes, and that did not comply with techniques considering a box behavior. A set of abacus
(O.P.C.M. 3431, 2005) was developed by classifying several cases of collapsing configurations within
similar typologies. Local failures (loss of equilibrium) were considered for diverse types of buildings
such as out-of-plane rotation of a load-bearing masonry wall. (Roca, Damage and Collapse
Mechanisms - Part 2, 2009-2010). Two examples have been included (a tower and an aqueduct)
applying one of the local failure modes typical of vertical predominant structural elements with little or
lack of orthogonal connections.
2.5 Computational limit analysis
Considering the tedious process involved in the tryouts needed for determining the ultimate collapse
load through the static and kinematic approaches, “hand based limit analysis techniques have been
largely superseded by computer based methods” (Gilbert, Limit analysis applied to masonry arch
bridges: state-of-the-art and recent developments, 2007). These methods constitute optimization
processes for the use of limit analysis in the assessment of masonry structures.
1 When trials are needed, this means that the result will only be obtained after doing all the process that is being described.
Limit Analysis: Collection of examples of application
Erasmus Mundus Programme ADVANCED MASTERS IN STRUCTURAL ANALYSIS OF MONUMENTS AND HISTORICAL CONSTRUCTIONS 13
Fig. 9 - The relationship between upper and lower bound solutions (Gilbert, Limit analysis applied to masonry arch bridges:
state-of-the-art and recent developments, 2007)
The following are examples of computational (mathematical) optimization methods that have been
developed.
RING© software in its version 1.5 for windows has been developed by Matthew Gilbert of the
Computational Limit Analysis and Design Unit of the University of Sheffield in 2005, but it has been
available for public use since 2001. The application is oriented to the assessment of masonry arch
bridges; “it is a computer software designed to compute the ultimate load carrying capacities of
masonry arch bridges” (Gilbert, 2005). It can be applied for single and multi-span masonry arch
bridges. In this thesis RING© software was used to verify some of the results being obtained through
the graphical procedure (the analysis performed for the cases where it was used is included in the
annexes).
Interactive Thrust is a project developed in the Massachusetts Institute of Technology with the
objective of “creating structural analysis tools based on limit state analysis for vaulted masonry
buildings”; “The models developed are interactive and parametric to explore the relationships between
building geometry and possible equilibrium conditions in real time”. “Collapse analysis due to applied
displacements is determined by combining kinematics and statics”. (Massachusetts Institute of
Technology - MIT)
Thrust-Network Analysis is a three-dimensional computational method developed in the
Massachusetts Institute of Technology to obtain lower-bound solutions for masonry vaults with
complex geometries. (Block & Ochsendorf)

Limit Analysis: Collection of examples of application
Erasmus Mundus Programme 14 ADVANCED MASTERS IN STRUCTURAL ANALYSIS OF MONUMENTS AND HISTORICAL CONSTRUCTIONS
Limit Analysis: Collection of examples of application
Erasmus Mundus Programme ADVANCED MASTERS IN STRUCTURAL ANALYSIS OF MONUMENTS AND HISTORICAL CONSTRUCTIONS 15
3. EXAMPLES OF APPLICATION OF LIMIT ANALYSIS METHODS
The application of Static and Kinematic approaches was performed for the following case studies:
- A single span arch bridge: Bridgemill Bridge (UK)
- A barrel vault with buttresses: Cuernavaca Church (México)
- A one level multiple span arch façade: Plaza Reial (Spain)
- A two level multiple span arch bridge: Roman Aqueduct of Tarragona (Spain)
- A wall in a tower: Quintela Tower (Portugal)
The solutions for the case studies include: Kinematic analysis were performed using computer-aided
design software for the graphic schemes and a spreadsheet for the step-by-step calculations. Static
analysis were performed using computer-aided design software in order to obtain the thrust line
corresponding for the specific objectives defined in each case (for example obtaining the
corresponding thrust line for the collapse mechanism and applied load defined in the kinematic
approach). When it was appropriate, an analysis was performed using the analysis software for
masonry arch bridges RING© 1.5 version, in order to verify the results obtained for the behavior of the
structure (location of hinges and shape of the thrust line) with the assumptions considered (geometry,
material properties and loading cases).

Limit Analysis: Collection of examples of application
Erasmus Mundus Programme 16 ADVANCED MASTERS IN STRUCTURAL ANALYSIS OF MONUMENTS AND HISTORICAL CONSTRUCTIONS
Limit Analysis: Collection of examples of application
Erasmus Mundus Programme ADVANCED MASTERS IN STRUCTURAL ANALYSIS OF MONUMENTS AND HISTORICAL CONSTRUCTIONS 17
3.1 Arch Bridge (Bridgemill Bridge in UK)
The Bridgemill Bridge (Girvan, UK) was selected considering the available experimental and analytical
results obtained when it was tested to failure in 1984. The arch bridge had a single flat segmental
span of 18.29 meters and a width of 8.3 meters, and was built with sandstone voussoirs joined with
lime mortar. The test performed on the structure consisted in applying an increasing vertical load at a
distance of a quarter of the span until the expected four-hinge collapse mechanism was obtained. The
maximum value obtained for the incrementally increased load was 3.0 MN. Further numerical analyses
for this case were performed by other researchers obtaining values for the collapsing load of 2.7, 2.8
and 2.93 MN (Molins, June 1998).
The geometric characteristics of the arch bridge are:
- Equation of the parabola to define the intrados of the arch: Z(X) =-0.033958X2 + 0.621104X
with the origin of coordinates at the abutment (Molins, June 1998).
Fig. 10 – Geometry of Bridgemill Bridge (Molins, June 1998)
The mechanical characteristics of the structural masonry, a compressive strength of 15 MPa and a
deformation modulus of 4000 MPa, were neglected for the analysis of this example considering the
initial assumption (compressive strength is infinite). The material properties considered were 20 KN/m3
for the unit weight of the masonry arch and 18 KN/m3 for the unit weight of the infill.
Limit Analysis: Collection of examples of application
Erasmus Mundus Programme 18 ADVANCED MASTERS IN STRUCTURAL ANALYSIS OF MONUMENTS AND HISTORICAL CONSTRUCTIONS
3.1.1 Kinematic Approach
The objective of this approach is determining the upper bound of the applied load that will cause a
defined collapse mechanism. Therefore, the first aspect to be established is what is to be evaluated in
the structure analyzed in order to define the parameters for the kinematic evaluation.
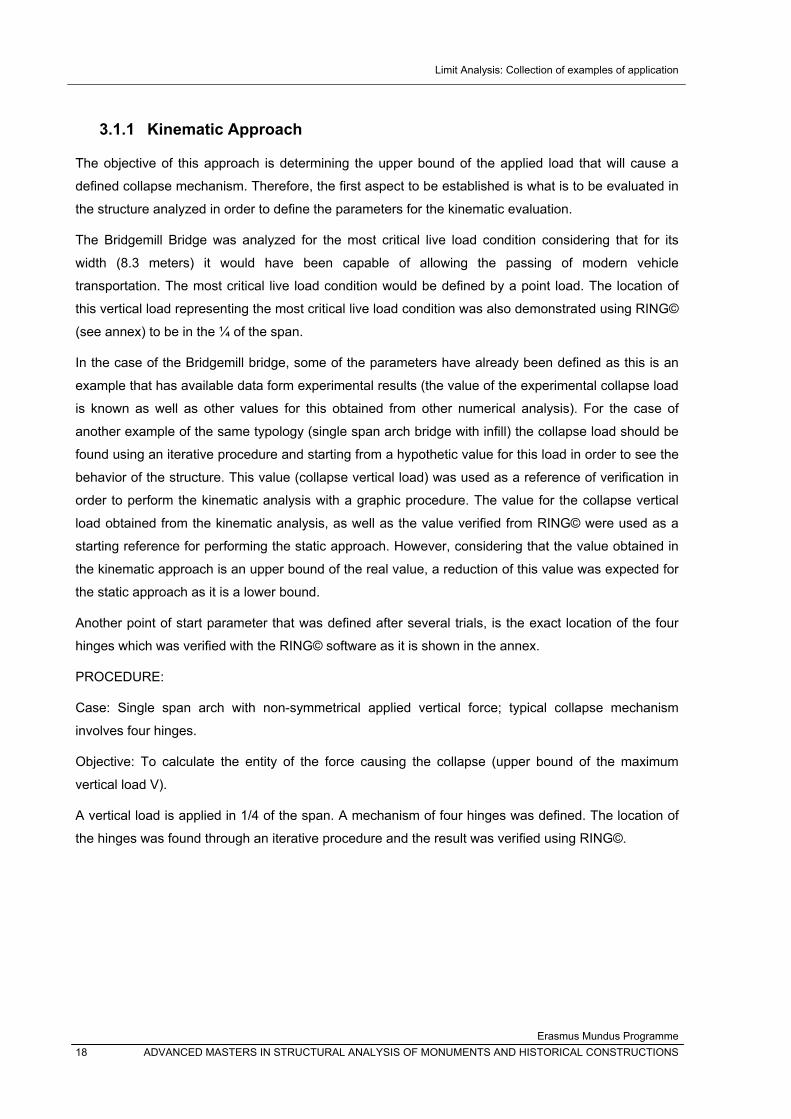
The Bridgemill Bridge was analyzed for the most critical live load condition considering that for its
width (8.3 meters) it would have been capable of allowing the passing of modern vehicle
transportation. The most critical live load condition would be defined by a point load. The location of
this vertical load representing the most critical live load condition was also demonstrated using RING©
(see annex) to be in the ¼ of the span.
In the case of the Bridgemill bridge, some of the parameters have already been defined as this is an
example that has available data form experimental results (the value of the experimental collapse load
is known as well as other values for this obtained from other numerical analysis). For the case of
another example of the same typology (single span arch bridge with infill) the collapse load should be
found using an iterative procedure and starting from a hypothetic value for this load in order to see the
behavior of the structure. This value (collapse vertical load) was used as a reference of verification in
order to perform the kinematic analysis with a graphic procedure. The value for the collapse vertical
load obtained from the kinematic analysis, as well as the value verified from RING© were used as a
starting reference for performing the static approach. However, considering that the value obtained in
the kinematic approach is an upper bound of the real value, a reduction of this value was expected for
the static approach as it is a lower bound.
Another point of start parameter that was defined after several trials, is the exact location of the four
hinges which was verified with the RING© software as it is shown in the annex.
PROCEDURE:
Case: Single span arch with non-symmetrical applied vertical force; typical collapse mechanism
involves four hinges.
Objective: To calculate the entity of the force causing the collapse (upper bound of the maximum
vertical load V).
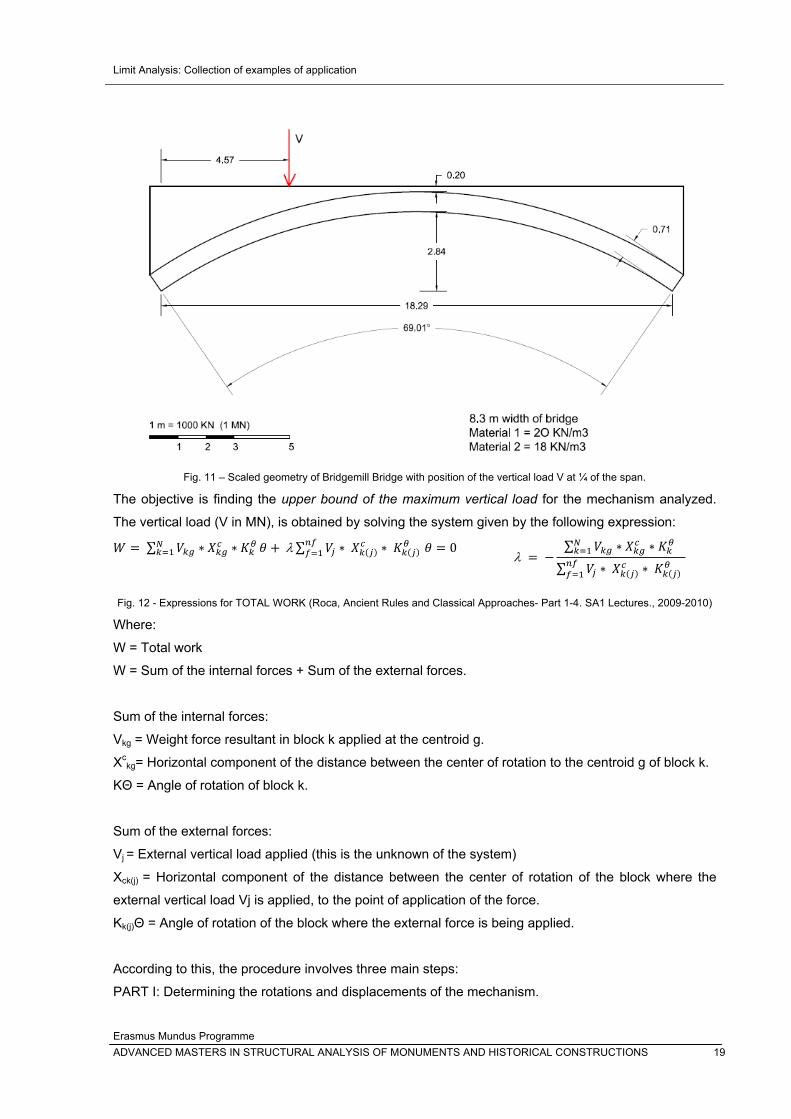
A vertical load is applied in 1/4 of the span. A mechanism of four hinges was defined. The location of
the hinges was found through an iterative procedure and the result was verified using RING©.
Limit Analysis: Collection of examples of application
Erasmus Mundus Programme ADVANCED MASTERS IN STRUCTURAL ANALYSIS OF MONUMENTS AND HISTORICAL CONSTRUCTIONS 19
Fig. 11 – Scaled geometry of Bridgemill Bridge with position of the vertical load V at ¼ of the span.
The objective is finding the upper bound of the maximum vertical load for the mechanism analyzed.
The vertical load (V in MN), is obtained by solving the system given by the following expression:
∑ λ∑ 0
λ
∑∑
Fig. 12 - Expressions for TOTAL WORK (Roca, Ancient Rules and Classical Approaches- Part 1-4. SA1 Lectures., 2009-2010)
Where:
W = Total work
W = Sum of the internal forces + Sum of the external forces.
Sum of the internal forces:
Vkg = Weight force resultant in block k applied at the centroid g.
Xckg= Horizontal component of the distance between the center of rotation to the centroid g of block k.
KΘ = Angle of rotation of block k.
Sum of the external forces:
Vj = External vertical load applied (this is the unknown of the system)
Xck(j) = Horizontal component of the distance between the center of rotation of the block where the
external vertical load Vj is applied, to the point of application of the force.
Kk(j)Θ = Angle of rotation of the block where the external force is being applied.
According to this, the procedure involves three main steps:
PART I: Determining the rotations and displacements of the mechanism.
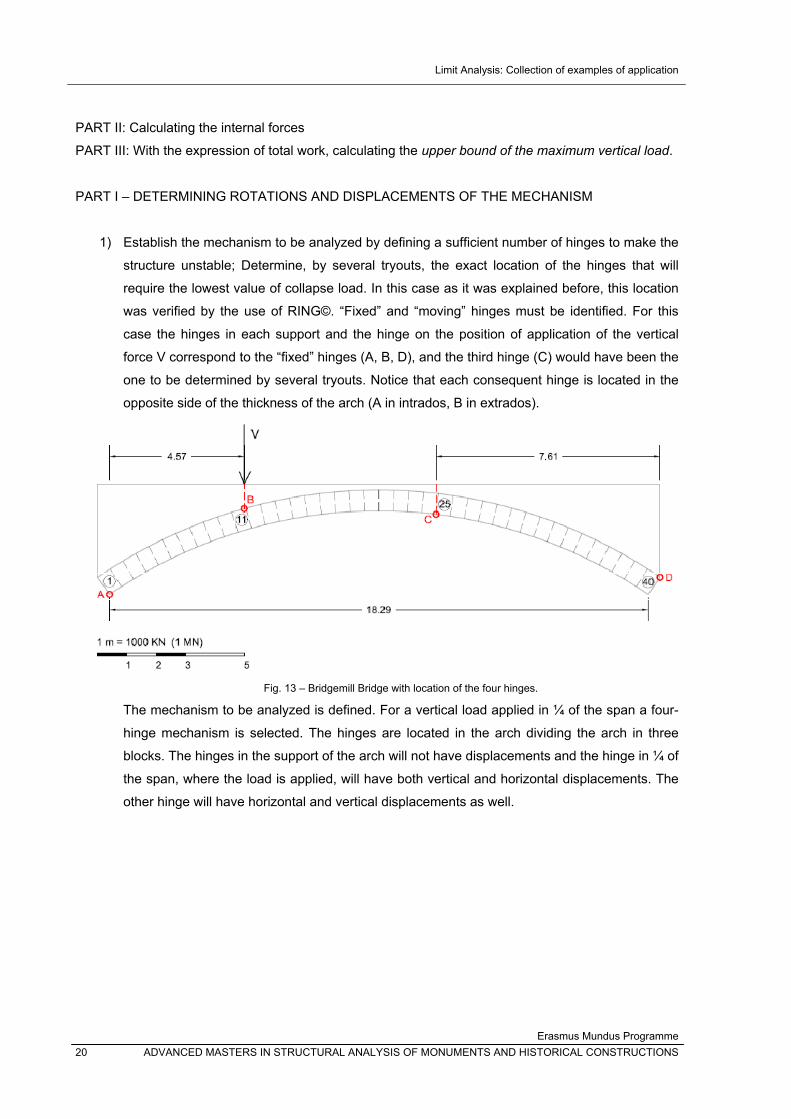
Limit Analysis: Collection of examples of application
Erasmus Mundus Programme 20 ADVANCED MASTERS IN STRUCTURAL ANALYSIS OF MONUMENTS AND HISTORICAL CONSTRUCTIONS
PART II: Calculating the internal forces
PART III: With the expression of total work, calculating the upper bound of the maximum vertical load.
PART I – DETERMINING ROTATIONS AND DISPLACEMENTS OF THE MECHANISM
1) Establish the mechanism to be analyzed by defining a sufficient number of hinges to make the
structure unstable; Determine, by several tryouts, the exact location of the hinges that will
require the lowest value of collapse load. In this case as it was explained before, this location
was verified by the use of RING©. “Fixed” and “moving” hinges must be identified. For this
case the hinges in each support and the hinge on the position of application of the vertical
force V correspond to the “fixed” hinges (A, B, D), and the third hinge (C) would have been the
one to be determined by several tryouts. Notice that each consequent hinge is located in the
opposite side of the thickness of the arch (A in intrados, B in extrados).
Fig. 13 – Bridgemill Bridge with location of the four hinges.
The mechanism to be analyzed is defined. For a vertical load applied in ¼ of the span a four-
hinge mechanism is selected. The hinges are located in the arch dividing the arch in three
blocks. The hinges in the support of the arch will not have displacements and the hinge in ¼ of
the span, where the load is applied, will have both vertical and horizontal displacements. The
other hinge will have horizontal and vertical displacements as well.
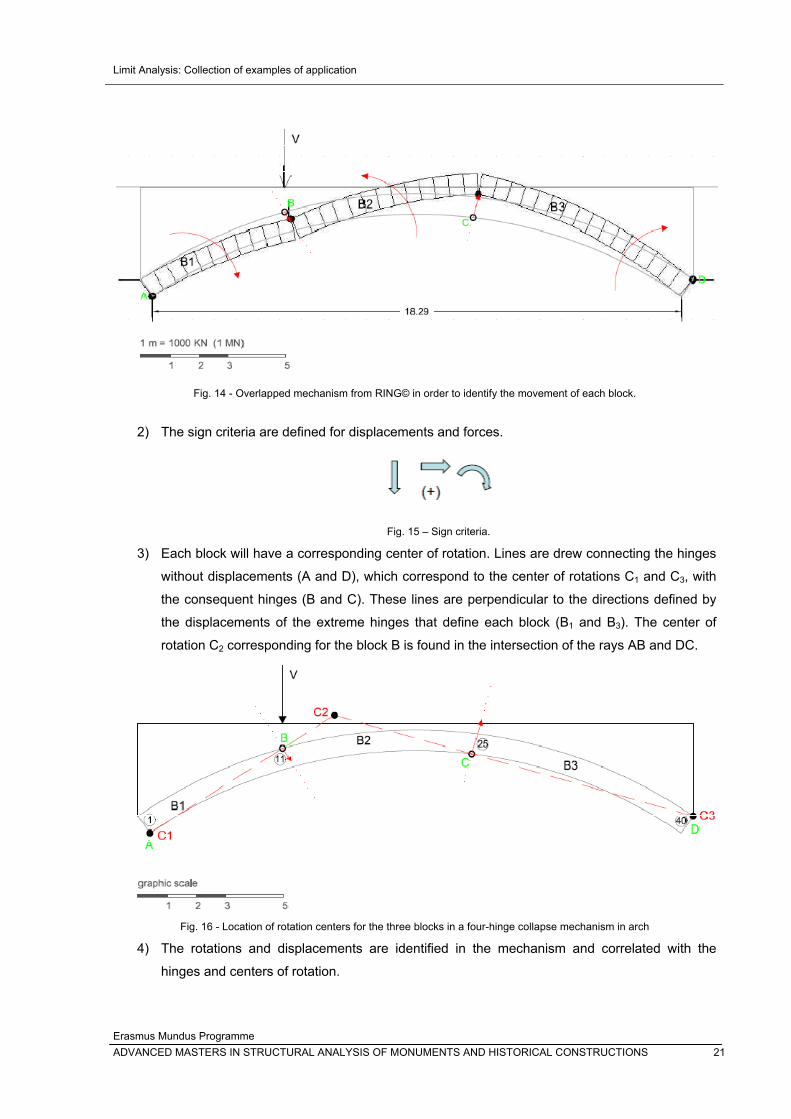
Limit Analysis: Collection of examples of application
Erasmus Mundus Programme ADVANCED MASTERS IN STRUCTURAL ANALYSIS OF MONUMENTS AND HISTORICAL CONSTRUCTIONS 21
Fig. 14 - Overlapped mechanism from RING© in order to identify the movement of each block.
2) The sign criteria are defined for displacements and forces.
Fig. 15 – Sign criteria.
3) Each block will have a corresponding center of rotation. Lines are drew connecting the hinges
without displacements (A and D), which correspond to the center of rotations C1 and C3, with
the consequent hinges (B and C). These lines are perpendicular to the directions defined by
the displacements of the extreme hinges that define each block (B1 and B3). The center of
rotation C2 corresponding for the block B is found in the intersection of the rays AB and DC.
Fig. 16 - Location of rotation centers for the three blocks in a four-hinge collapse mechanism in arch
4) The rotations and displacements are identified in the mechanism and correlated with the
hinges and centers of rotation.
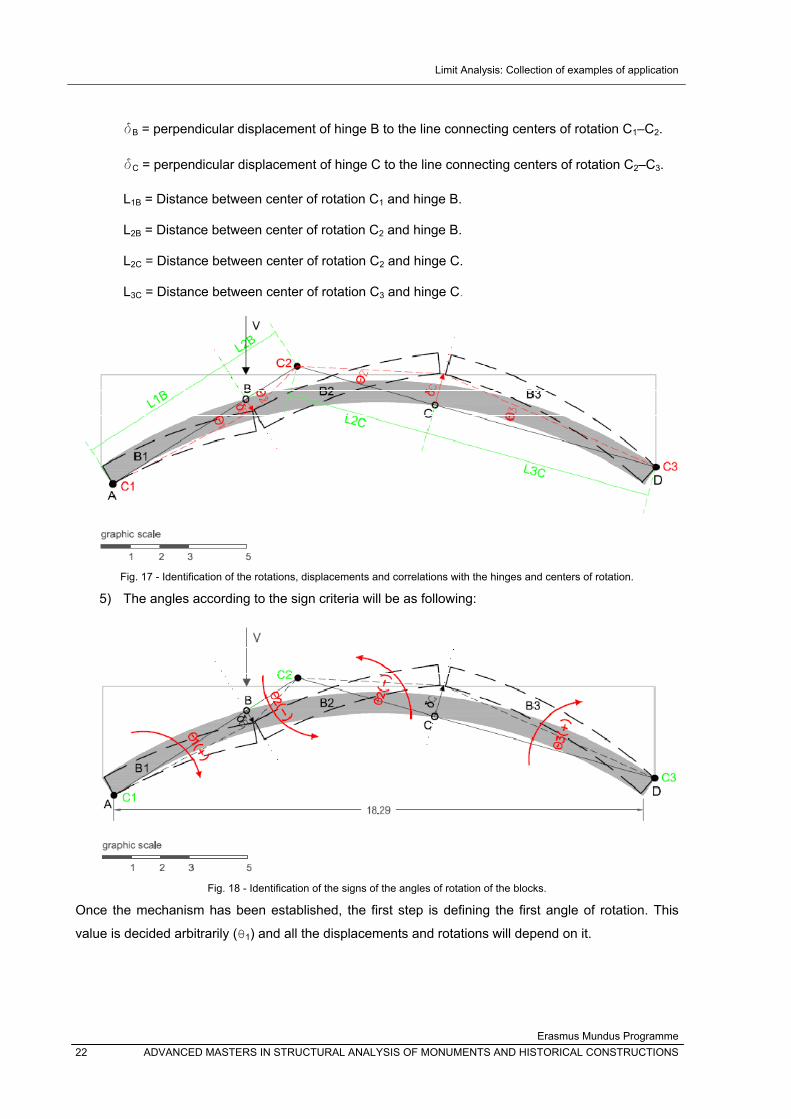
Limit Analysis: Collection of examples of application
Erasmus Mundus Programme 22 ADVANCED MASTERS IN STRUCTURAL ANALYSIS OF MONUMENTS AND HISTORICAL CONSTRUCTIONS
δB = perpendicular displacement of hinge B to the line connecting centers of rotation C1–C2.
δC = perpendicular displacement of hinge C to the line connecting centers of rotation C2–C3.
L1B = Distance between center of rotation C1 and hinge B.
L2B = Distance between center of rotation C2 and hinge B.
L2C = Distance between center of rotation C2 and hinge C.
L3C = Distance between center of rotation C3 and hinge C.
Fig. 17 - Identification of the rotations, displacements and correlations with the hinges and centers of rotation.
5) The angles according to the sign criteria will be as following:
Fig. 18 - Identification of the signs of the angles of rotation of the blocks.
Once the mechanism has been established, the first step is defining the first angle of rotation. This
value is decided arbitrarily (θ1) and all the displacements and rotations will depend on it.
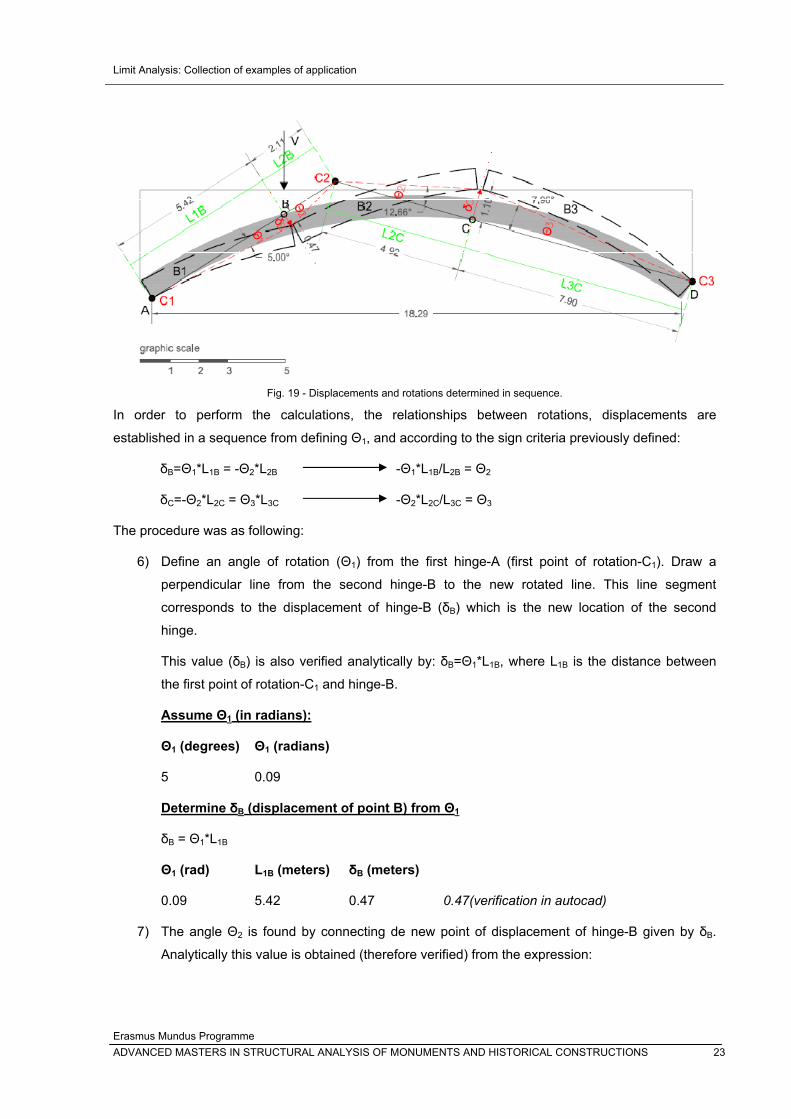
Limit Analysis: Collection of examples of application
Erasmus Mundus Programme ADVANCED MASTERS IN STRUCTURAL ANALYSIS OF MONUMENTS AND HISTORICAL CONSTRUCTIONS 23
Fig. 19 - Displacements and rotations determined in sequence.
In order to perform the calculations, the relationships between rotations, displacements are
established in a sequence from defining Θ1, and according to the sign criteria previously defined:
δB=Θ1*L1B = -Θ2*L2B -Θ1*L1B/L2B = Θ2
δC=-Θ2*L2C = Θ3*L3C -Θ2*L2C/L3C = Θ3
The procedure was as following:
6) Define an angle of rotation (Θ1) from the first hinge-A (first point of rotation-C1). Draw a
perpendicular line from the second hinge-B to the new rotated line. This line segment
corresponds to the displacement of hinge-B (δB) which is the new location of the second
hinge.
This value (δB) is also verified analytically by: δB=Θ1*L1B, where L1B is the distance between
the first point of rotation-C1 and hinge-B.
Assume Θ1 (in radians):
Θ1 (degrees) Θ1 (radians)
5 0.09
Determine δB (displacement of point B) from Θ1
δB = Θ1*L1B
Θ1 (rad) L1B (meters) δB (meters)
0.09 5.42 0.47 0.47(verification in autocad)
7) The angle Θ2 is found by connecting de new point of displacement of hinge-B given by δB.
Analytically this value is obtained (therefore verified) from the expression:
Limit Analysis: Collection of examples of application
Erasmus Mundus Programme 24 ADVANCED MASTERS IN STRUCTURAL ANALYSIS OF MONUMENTS AND HISTORICAL CONSTRUCTIONS
Θ2= (-L1B/L2B)*Θ1. Where L2B is the distance between hinge-B and the second point of rotation-
C2. This expression is obtained from the following equivalence:
δB=Θ1*L1B = -Θ2*L2B
Determine Θ2 (rad) from Θ1
Θ2= (-L1B/L2B)*Θ1
Θ1 (rad) L1B (meters) L2B (meters) Θ2 (rad) Θ2 (degrees)
0.09 5.42 2.11 -0.22 -12.87
8) The displacement of the hinge-C is found with the expression δC = -Θ2*L2C where L2C is the
distance between the second point of rotation-C2 and hinge-C.
Determine δC (displacement of point C) from Θ2
δC = -Θ2*L2C
Θ2 (rad) L2C (meters) δC (meters)
-0.22 4.92 1.10
9) The angle Θ3 is obtained from the expression Θ3= -Θ2*(L2C/L3C)
Determine Θ3 (rad) from Θ2
Θ3=-Θ2*(L2C/L3C)
L2C (meters) L3C (meters) Θ2 (rad) Θ3 (rad) Θ3 (degrees)
4.92 7.90 -0.22 0.14 8.01
Considering that for calculating the work performed by the weight-force of each block a displacement
has to be defined.
Work = Force * Displacement
Work (block-i) = Weight-force resultant located in the centroid of block (Vi) * angle of rotation of block
(Θi)* horizontal component of the distance between the center of rotation of the block and the centroid
of the initial block (Xci),
Or,
Work (block-i) = Weight-force resultant located in the centroid of block (Vi) * vertical component of the
distance between the centroids of the initial and rotated blocks (δiy).
10) For the work of internal vertical forces, measure the horizontal component (Xci) of the distance
between the center of rotation of the block and the centroid of the initial block. Take into
account the signs taking as reference the location of the center of rotation (starting point).
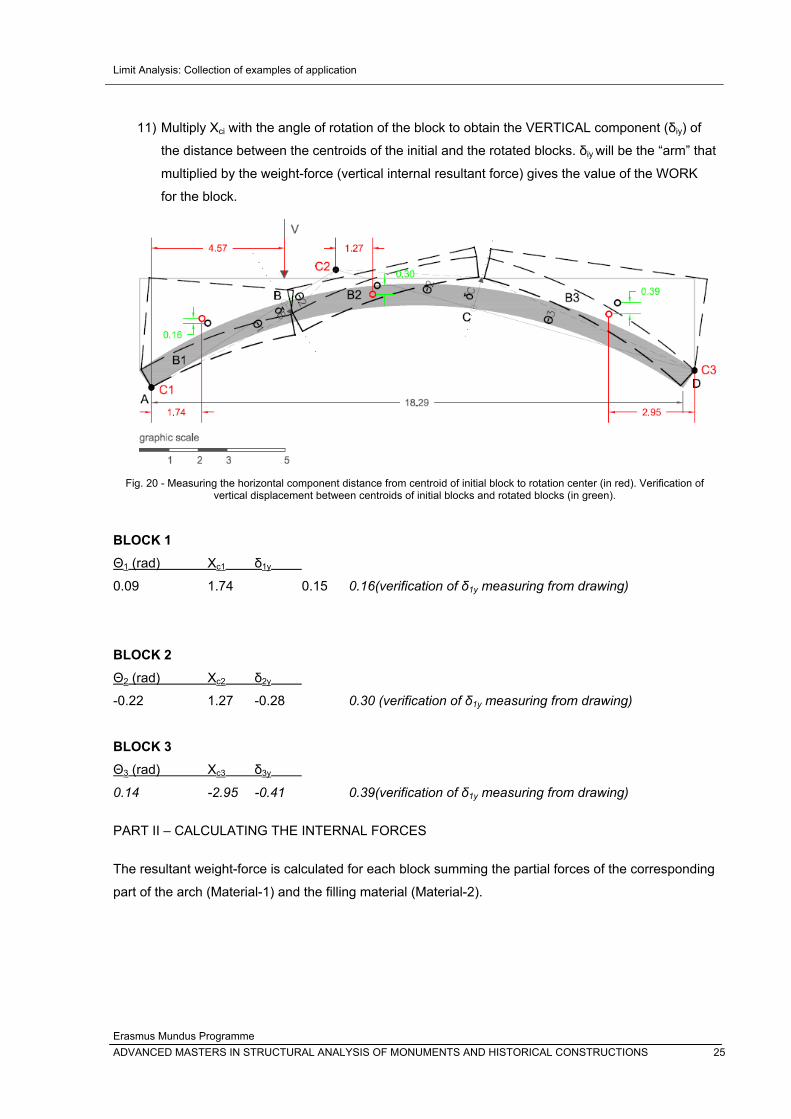
Limit Analysis: Collection of examples of application
Erasmus Mundus Programme ADVANCED MASTERS IN STRUCTURAL ANALYSIS OF MONUMENTS AND HISTORICAL CONSTRUCTIONS 25
11) Multiply Xci with the angle of rotation of the block to obtain the VERTICAL component (δiy) of
the distance between the centroids of the initial and the rotated blocks. δiy will be the “arm” that
multiplied by the weight-force (vertical internal resultant force) gives the value of the WORK
for the block.
Fig. 20 - Measuring the horizontal component distance from centroid of initial block to rotation center (in red). Verification of
vertical displacement between centroids of initial blocks and rotated blocks (in green).
BLOCK 1 Θ1 (rad) Xc1 δ1y
0.09 1.74 0.15 0.16(verification of δ1y measuring from drawing)
BLOCK 2 Θ2 (rad) Xc2 δ2y
-0.22 1.27 -0.28 0.30 (verification of δ1y measuring from drawing)
BLOCK 3 Θ3 (rad) Xc3 δ3y
0.14 -2.95 -0.41 0.39(verification of δ1y measuring from drawing)
PART II – CALCULATING THE INTERNAL FORCES
The resultant weight-force is calculated for each block summing the partial forces of the corresponding
part of the arch (Material-1) and the filling material (Material-2).
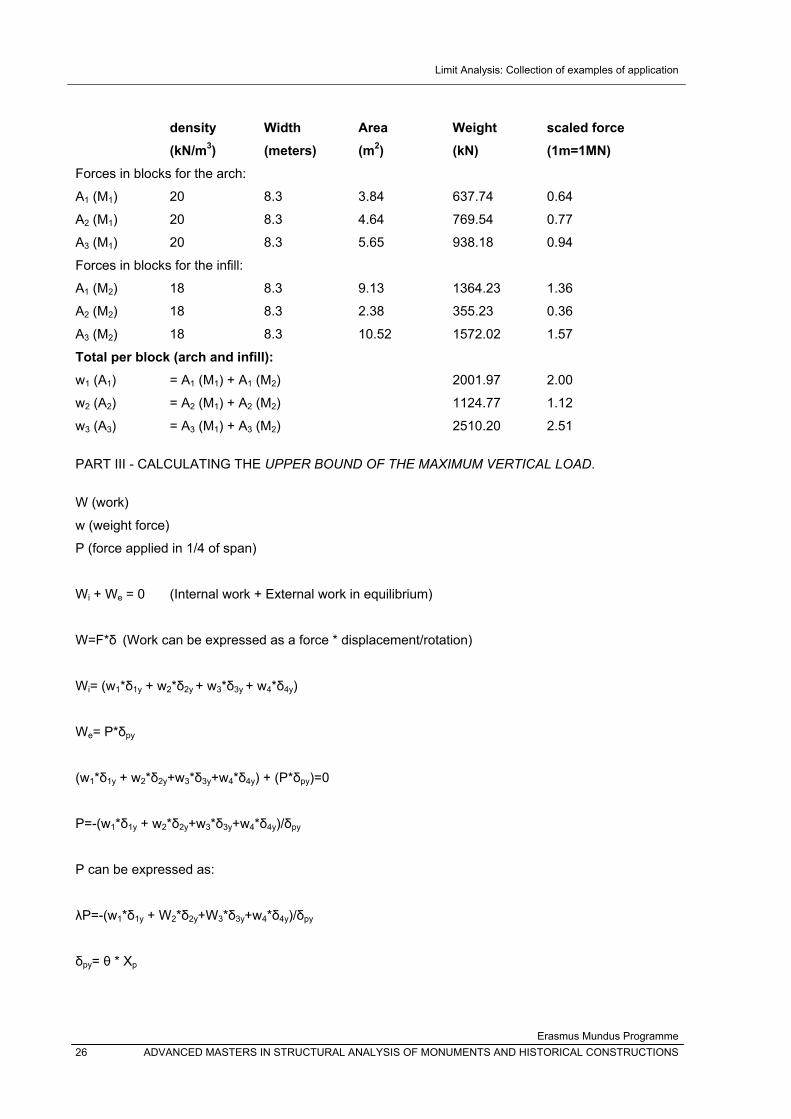
Limit Analysis: Collection of examples of application
Erasmus Mundus Programme 26 ADVANCED MASTERS IN STRUCTURAL ANALYSIS OF MONUMENTS AND HISTORICAL CONSTRUCTIONS
density Width Area Weight scaled force (kN/m3) (meters) (m2) (kN) (1m=1MN) Forces in blocks for the arch:
A1 (M1) 20 8.3 3.84 637.74 0.64
A2 (M1) 20 8.3 4.64 769.54 0.77
A3 (M1) 20 8.3 5.65 938.18 0.94
Forces in blocks for the infill:
A1 (M2) 18 8.3 9.13 1364.23 1.36
A2 (M2) 18 8.3 2.38 355.23 0.36
A3 (M2) 18 8.3 10.52 1572.02 1.57
Total per block (arch and infill): w1 (A1) = A1 (M1) + A1 (M2) 2001.97 2.00
w2 (A2) = A2 (M1) + A2 (M2) 1124.77 1.12
w3 (A3) = A3 (M1) + A3 (M2) 2510.20 2.51
PART III - CALCULATING THE UPPER BOUND OF THE MAXIMUM VERTICAL LOAD.
W (work)
w (weight force)
P (force applied in 1/4 of span)
Wi + We = 0 (Internal work + External work in equilibrium)
W=F*δ (Work can be expressed as a force * displacement/rotation)
Wi= (w1*δ1y + w2*δ2y + w3*δ3y + w4*δ4y)
We= P*δpy
(w1*δ1y + w2*δ2y+w3*δ3y+w4*δ4y) + (P*δpy)=0
P=-(w1*δ1y + w2*δ2y+w3*δ3y+w4*δ4y)/δpy
P can be expressed as:
λP=-(w1*δ1y + W2*δ2y+W3*δ3y+w4*δ4y)/δpy
δpy= θ * Xp

Limit Analysis: Collection of examples of application
Erasmus Mundus Programme ADVANCED MASTERS IN STRUCTURAL ANALYSIS OF MONUMENTS AND HISTORICAL CONSTRUCTIONS 27
Determine δpy: vertical displacement point of application of force P due to rotation of the block where
the force is applied: in this example is Θ1.
δpy = Θ1*Xp Xp: Horizontal distance from rotation center to external vertical load applied
Θ1 (rad) Xp (meters) δpy (meters)
0.09 4.57 0.40 0.41 (verification measured in drawing)
Determine λ (Factor load) for a given P (assumed)
λ=-(w1*δ1y + w2*δ2y+w3*δ3y+w4*δ4y)/P*δpy
Table 1 - Load Factor table from Excel©
Comparing the results obtained with the use of graphic statics, with the verification in RING©:
FAILURE LOAD FACTOR
RING© Spreadsheet-λ 2740 2630.38
w1 (KN) δ1y (M) w2 (KN) δ2y (M) w3 (KN) δ3y (M) δpy (M) P (KN) λ 2001.97 0.15 1124.77 ‐0.28 2510.20 ‐0.41 0.40 1 2630.38
Limit Analysis: Collection of examples of application
Erasmus Mundus Programme 28 ADVANCED MASTERS IN STRUCTURAL ANALYSIS OF MONUMENTS AND HISTORICAL CONSTRUCTIONS
3.1.2 Static Approach
The objective was finding a thrust line that passes through the hinges for the mechanism previously
defined, using the value obtained from the upper bound approach. Therefore the value to be
considered for the static approach will be a reduced value from 2630.38 Kn (2551.5 kN; 3% reduction).
GENERAL ASPECTS
The structure to be analyzed is evaluated considering the equilibrium equations.
The number of available equations is three:
1- Sum of the vertical forces equal to zero
2- Sum of the horizontal forces equal to zero
3- Sum of the moments equal to zero
To define the VECTOR, three properties must be defined:
1- Entity (magnitude)
2 - Direction
3 - Position
PROCEDURE USING CAD
1) Draw the geometry of the structure.
2) The structure is discretized into segments (voussoirs in arches). The more amount of
segments the structure is divided in, the “smoother” the thrust-line obtained will be. However,
doing graphic statics “by hand” can be tedious with too many divisions. An intermediate
consideration is then taken into account. Recommendation: Put a number to identify each
segment in order to have a guide when constructing the force polygon.
3) Find and locate force-weight vector for each segment, taking into account the existence of two
different materials (therefore different densities).
o Find the area of each part of the segment for each material
From <DRAW< use the command <BOUNDARY> to create an "object"
(polyline).
Use the command <area> to obtain the value in m2
o Find the volume of each part of the segment by multiplying the obtained areas with
the width/thickness of the structural element. .
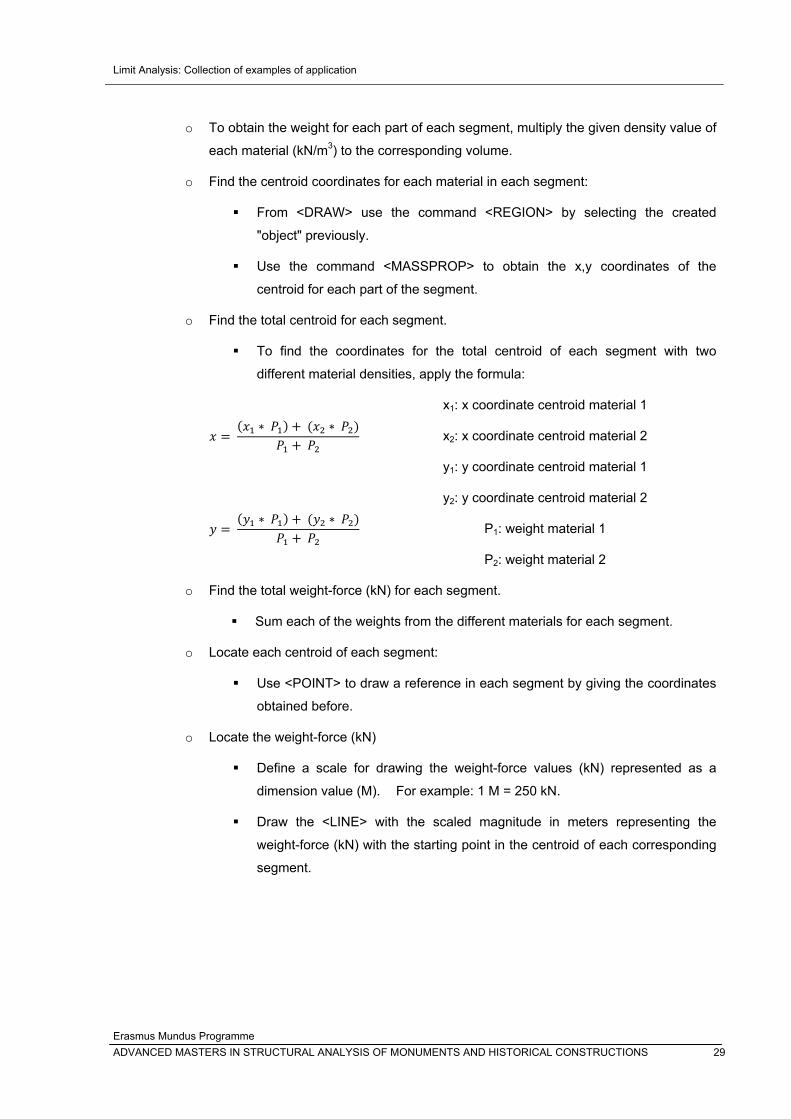
Limit Analysis: Collection of examples of application
Erasmus Mundus Programme ADVANCED MASTERS IN STRUCTURAL ANALYSIS OF MONUMENTS AND HISTORICAL CONSTRUCTIONS 29
o To obtain the weight for each part of each segment, multiply the given density value of
each material (kN/m3) to the corresponding volume.
o Find the centroid coordinates for each material in each segment:
From <DRAW> use the command <REGION> by selecting the created
"object" previously.
Use the command <MASSPROP> to obtain the x,y coordinates of the
centroid for each part of the segment.
o Find the total centroid for each segment.
To find the coordinates for the total centroid of each segment with two
different material densities, apply the formula:
x1: x coordinate centroid material 1
x2: x coordinate centroid material 2
y1: y coordinate centroid material 1
y2: y coordinate centroid material 2
P1: weight material 1
P2: weight material 2
o Find the total weight-force (kN) for each segment.
Sum each of the weights from the different materials for each segment.
o Locate each centroid of each segment:
Use <POINT> to draw a reference in each segment by giving the coordinates
obtained before.
o Locate the weight-force (kN)
Define a scale for drawing the weight-force values (kN) represented as a
dimension value (M). For example: 1 M = 250 kN.
Draw the <LINE> with the scaled magnitude in meters representing the
weight-force (kN) with the starting point in the centroid of each corresponding
segment.
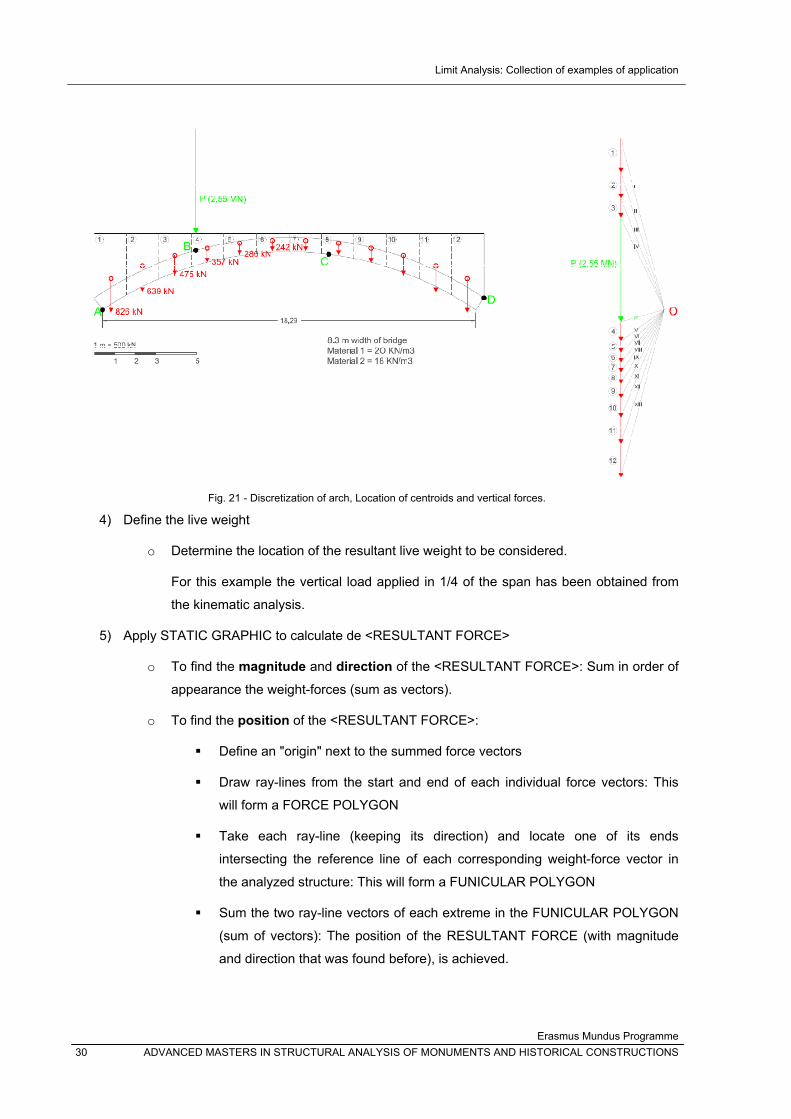
Limit Analysis: Collection of examples of application
Erasmus Mundus Programme 30 ADVANCED MASTERS IN STRUCTURAL ANALYSIS OF MONUMENTS AND HISTORICAL CONSTRUCTIONS
Fig. 21 - Discretization of arch, Location of centroids and vertical forces.
4) Define the live weight
o Determine the location of the resultant live weight to be considered.
For this example the vertical load applied in 1/4 of the span has been obtained from
the kinematic analysis.
5) Apply STATIC GRAPHIC to calculate de <RESULTANT FORCE>
o To find the magnitude and direction of the <RESULTANT FORCE>: Sum in order of
appearance the weight-forces (sum as vectors).
o To find the position of the <RESULTANT FORCE>:
Define an "origin" next to the summed force vectors
Draw ray-lines from the start and end of each individual force vectors: This
will form a FORCE POLYGON
Take each ray-line (keeping its direction) and locate one of its ends
intersecting the reference line of each corresponding weight-force vector in
the analyzed structure: This will form a FUNICULAR POLYGON
Sum the two ray-line vectors of each extreme in the FUNICULAR POLYGON
(sum of vectors): The position of the RESULTANT FORCE (with magnitude
and direction that was found before), is achieved.
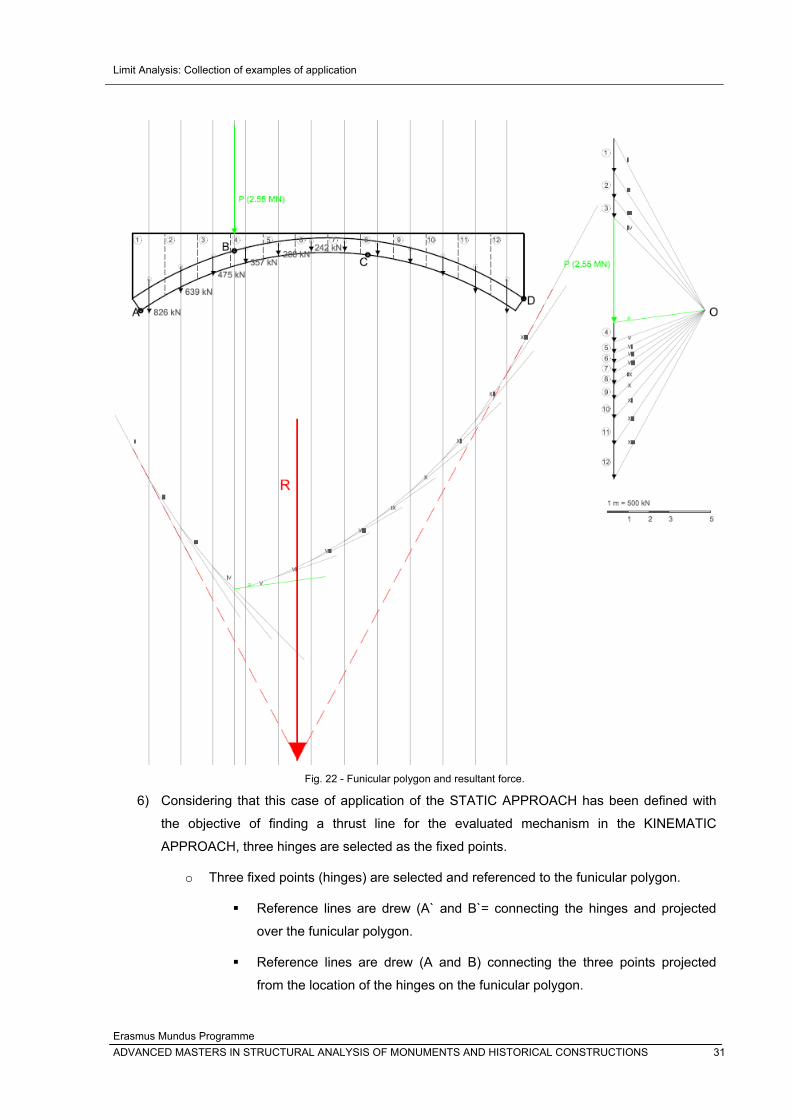
Limit Analysis: Collection of examples of application
Erasmus Mundus Programme ADVANCED MASTERS IN STRUCTURAL ANALYSIS OF MONUMENTS AND HISTORICAL CONSTRUCTIONS 31
Fig. 22 - Funicular polygon and resultant force.
6) Considering that this case of application of the STATIC APPROACH has been defined with
the objective of finding a thrust line for the evaluated mechanism in the KINEMATIC
APPROACH, three hinges are selected as the fixed points.
o Three fixed points (hinges) are selected and referenced to the funicular polygon.
Reference lines are drew (A` and B`= connecting the hinges and projected
over the funicular polygon.
Reference lines are drew (A and B) connecting the three points projected
from the location of the hinges on the funicular polygon.
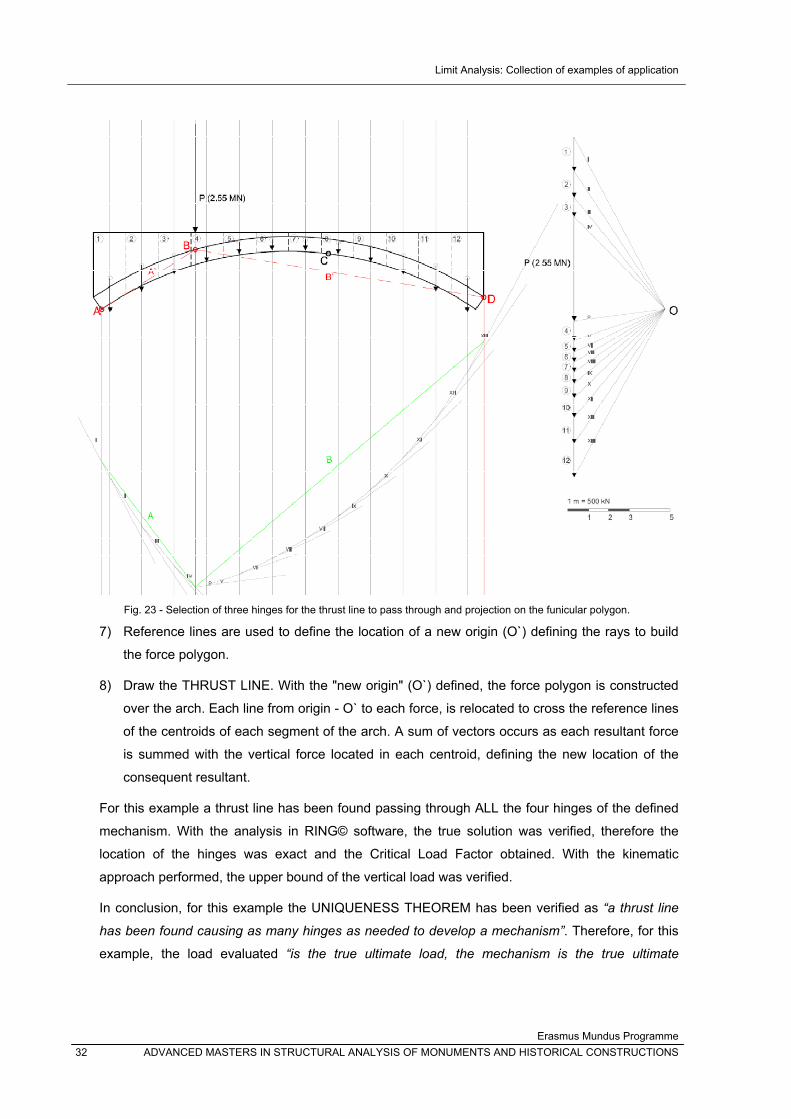
Limit Analysis: Collection of examples of application
Erasmus Mundus Programme 32 ADVANCED MASTERS IN STRUCTURAL ANALYSIS OF MONUMENTS AND HISTORICAL CONSTRUCTIONS
Fig. 23 - Selection of three hinges for the thrust line to pass through and projection on the funicular polygon.
7) Reference lines are used to define the location of a new origin (O`) defining the rays to build
the force polygon.
8) Draw the THRUST LINE. With the "new origin" (O`) defined, the force polygon is constructed
over the arch. Each line from origin - O` to each force, is relocated to cross the reference lines
of the centroids of each segment of the arch. A sum of vectors occurs as each resultant force
is summed with the vertical force located in each centroid, defining the new location of the
consequent resultant.
For this example a thrust line has been found passing through ALL the four hinges of the defined
mechanism. With the analysis in RING© software, the true solution was verified, therefore the
location of the hinges was exact and the Critical Load Factor obtained. With the kinematic
approach performed, the upper bound of the vertical load was verified.
In conclusion, for this example the UNIQUENESS THEOREM has been verified as “a thrust line
has been found causing as many hinges as needed to develop a mechanism”. Therefore, for this
example, the load evaluated “is the true ultimate load, the mechanism is the true ultimate
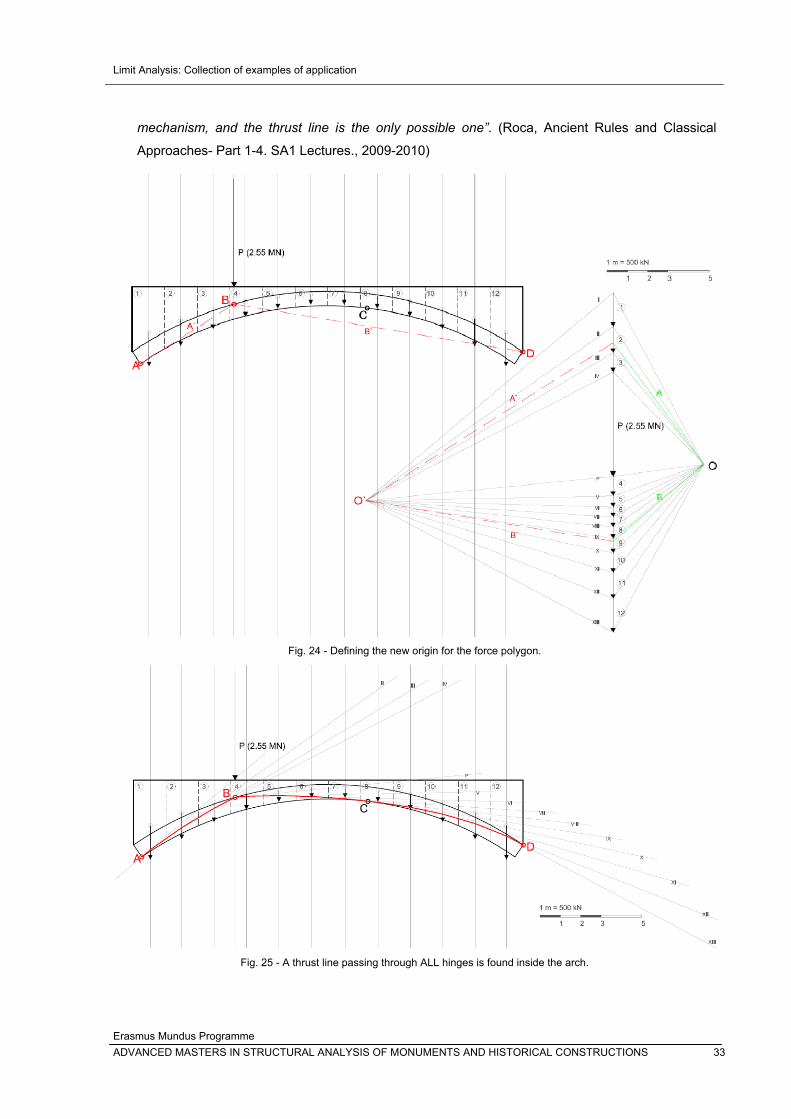
Limit Analysis: Collection of examples of application
Erasmus Mundus Programme ADVANCED MASTERS IN STRUCTURAL ANALYSIS OF MONUMENTS AND HISTORICAL CONSTRUCTIONS 33
mechanism, and the thrust line is the only possible one”. (Roca, Ancient Rules and Classical
Approaches- Part 1-4. SA1 Lectures., 2009-2010)
Fig. 24 - Defining the new origin for the force polygon.
Fig. 25 - A thrust line passing through ALL hinges is found inside the arch.

Limit Analysis: Collection of examples of application
Erasmus Mundus Programme 34 ADVANCED MASTERS IN STRUCTURAL ANALYSIS OF MONUMENTS AND HISTORICAL CONSTRUCTIONS
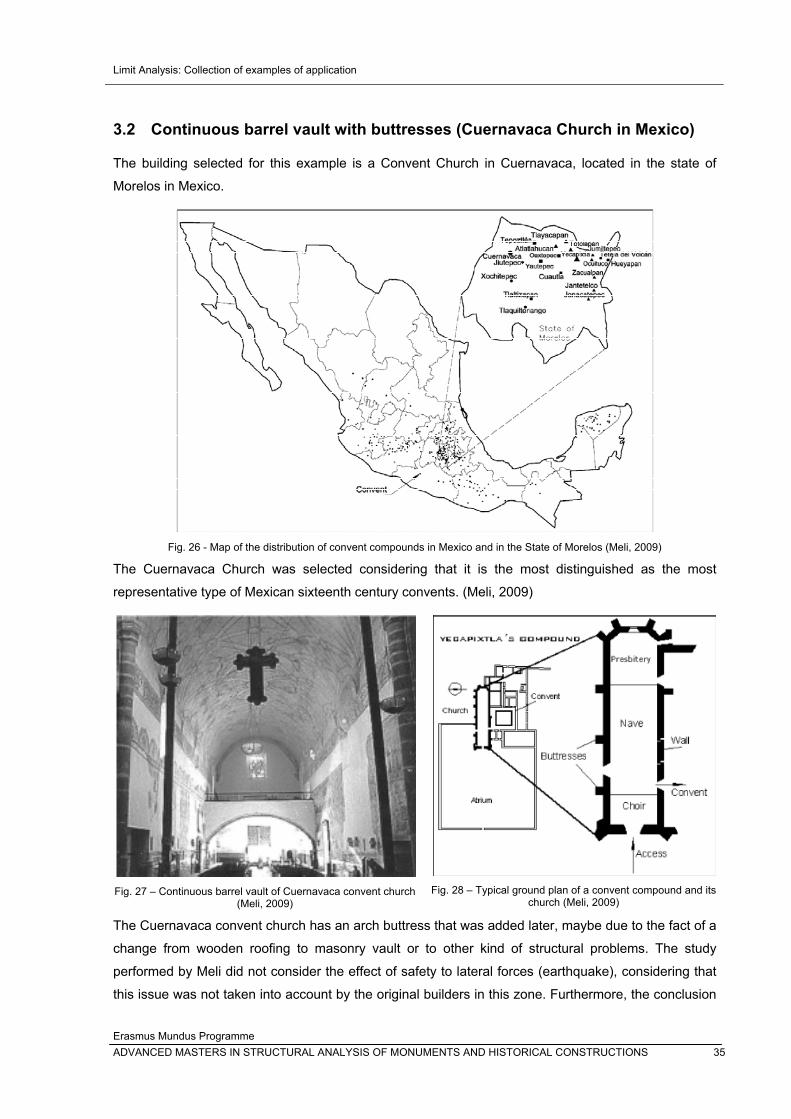
Limit Analysis: Collection of examples of application
Erasmus Mundus Programme ADVANCED MASTERS IN STRUCTURAL ANALYSIS OF MONUMENTS AND HISTORICAL CONSTRUCTIONS 35
3.2 Continuous barrel vault with buttresses (Cuernavaca Church in Mexico)
The building selected for this example is a Convent Church in Cuernavaca, located in the state of
Morelos in Mexico.
Fig. 26 - Map of the distribution of convent compounds in Mexico and in the State of Morelos (Meli, 2009)
The Cuernavaca Church was selected considering that it is the most distinguished as the most
representative type of Mexican sixteenth century convents. (Meli, 2009)
Fig. 27 – Continuous barrel vault of Cuernavaca convent church (Meli, 2009)
Fig. 28 – Typical ground plan of a convent compound and its
church (Meli, 2009)
The Cuernavaca convent church has an arch buttress that was added later, maybe due to the fact of a
change from wooden roofing to masonry vault or to other kind of structural problems. The study
performed by Meli did not consider the effect of safety to lateral forces (earthquake), considering that
this issue was not taken into account by the original builders in this zone. Furthermore, the conclusion
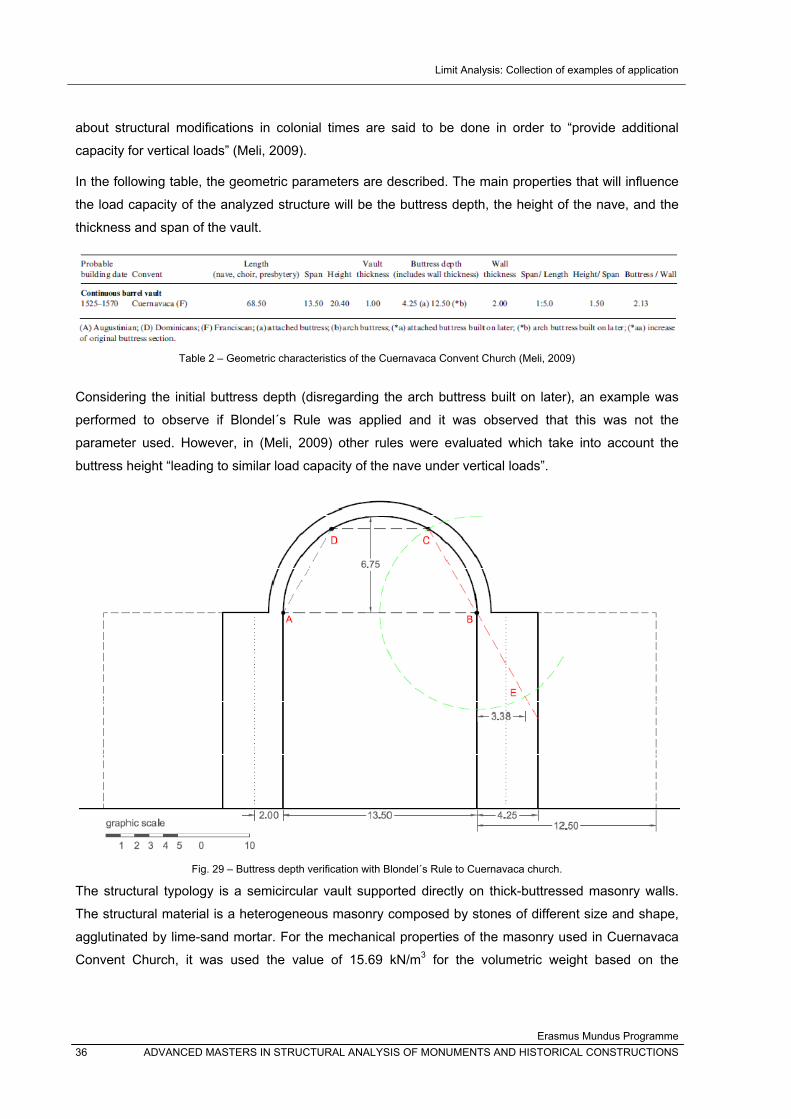
Limit Analysis: Collection of examples of application
Erasmus Mundus Programme 36 ADVANCED MASTERS IN STRUCTURAL ANALYSIS OF MONUMENTS AND HISTORICAL CONSTRUCTIONS
about structural modifications in colonial times are said to be done in order to “provide additional
capacity for vertical loads” (Meli, 2009).
In the following table, the geometric parameters are described. The main properties that will influence
the load capacity of the analyzed structure will be the buttress depth, the height of the nave, and the
thickness and span of the vault.
Table 2 – Geometric characteristics of the Cuernavaca Convent Church (Meli, 2009)
Considering the initial buttress depth (disregarding the arch buttress built on later), an example was
performed to observe if Blondel´s Rule was applied and it was observed that this was not the
parameter used. However, in (Meli, 2009) other rules were evaluated which take into account the
buttress height “leading to similar load capacity of the nave under vertical loads”.
Fig. 29 – Buttress depth verification with Blondel´s Rule to Cuernavaca church.
The structural typology is a semicircular vault supported directly on thick-buttressed masonry walls.
The structural material is a heterogeneous masonry composed by stones of different size and shape,
agglutinated by lime-sand mortar. For the mechanical properties of the masonry used in Cuernavaca
Convent Church, it was used the value of 15.69 kN/m3 for the volumetric weight based on the
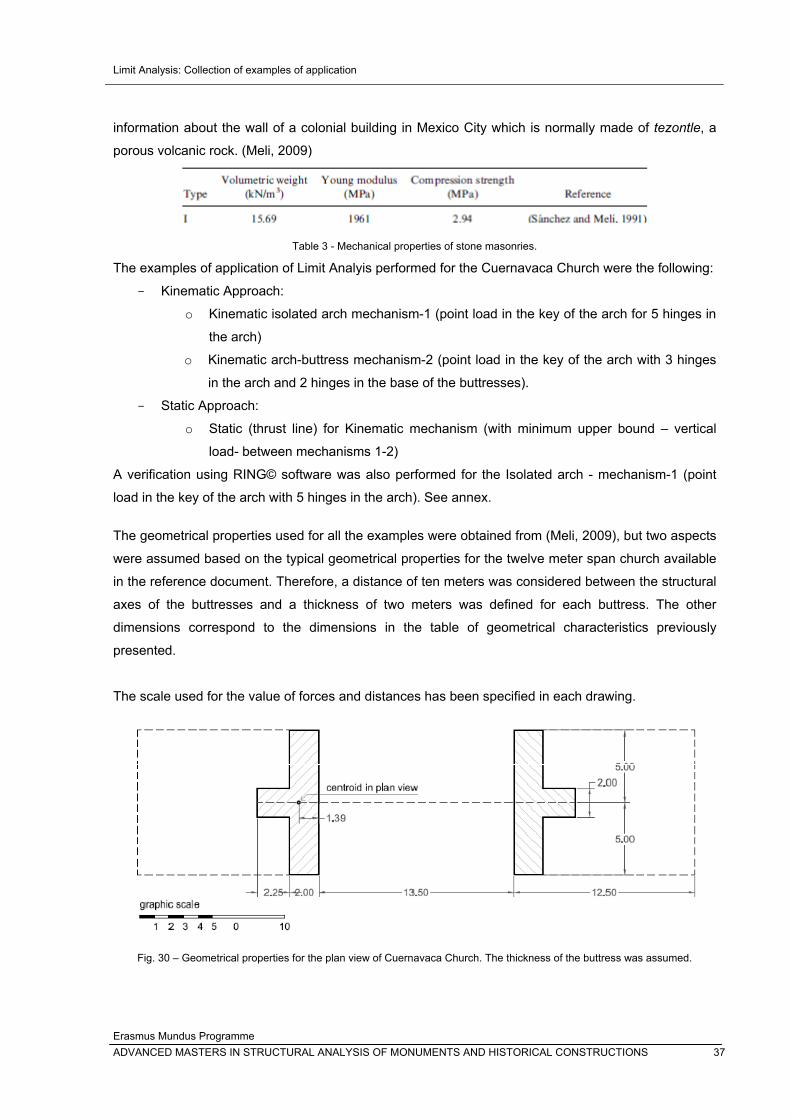
Limit Analysis: Collection of examples of application
Erasmus Mundus Programme ADVANCED MASTERS IN STRUCTURAL ANALYSIS OF MONUMENTS AND HISTORICAL CONSTRUCTIONS 37
information about the wall of a colonial building in Mexico City which is normally made of tezontle, a
porous volcanic rock. (Meli, 2009)
Table 3 - Mechanical properties of stone masonries.
The examples of application of Limit Analyis performed for the Cuernavaca Church were the following:
- Kinematic Approach:
o Kinematic isolated arch mechanism-1 (point load in the key of the arch for 5 hinges in
the arch)
o Kinematic arch-buttress mechanism-2 (point load in the key of the arch with 3 hinges
in the arch and 2 hinges in the base of the buttresses).
- Static Approach:
o Static (thrust line) for Kinematic mechanism (with minimum upper bound – vertical
load- between mechanisms 1-2)
A verification using RING© software was also performed for the Isolated arch - mechanism-1 (point
load in the key of the arch with 5 hinges in the arch). See annex.
The geometrical properties used for all the examples were obtained from (Meli, 2009), but two aspects
were assumed based on the typical geometrical properties for the twelve meter span church available
in the reference document. Therefore, a distance of ten meters was considered between the structural
axes of the buttresses and a thickness of two meters was defined for each buttress. The other
dimensions correspond to the dimensions in the table of geometrical characteristics previously
presented.
The scale used for the value of forces and distances has been specified in each drawing.
Fig. 30 – Geometrical properties for the plan view of Cuernavaca Church. The thickness of the buttress was assumed.
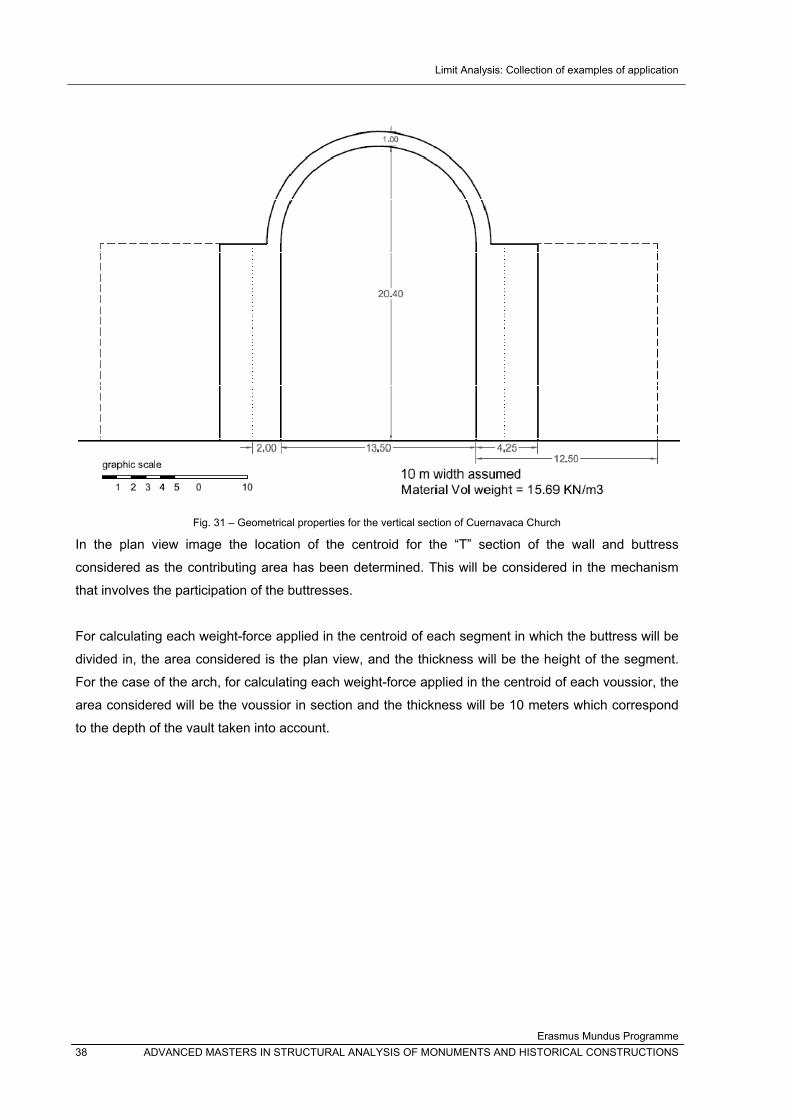
Limit Analysis: Collection of examples of application
Erasmus Mundus Programme 38 ADVANCED MASTERS IN STRUCTURAL ANALYSIS OF MONUMENTS AND HISTORICAL CONSTRUCTIONS
Fig. 31 – Geometrical properties for the vertical section of Cuernavaca Church
In the plan view image the location of the centroid for the “T” section of the wall and buttress
considered as the contributing area has been determined. This will be considered in the mechanism
that involves the participation of the buttresses.
For calculating each weight-force applied in the centroid of each segment in which the buttress will be
divided in, the area considered is the plan view, and the thickness will be the height of the segment.
For the case of the arch, for calculating each weight-force applied in the centroid of each voussior, the
area considered will be the voussior in section and the thickness will be 10 meters which correspond
to the depth of the vault taken into account.
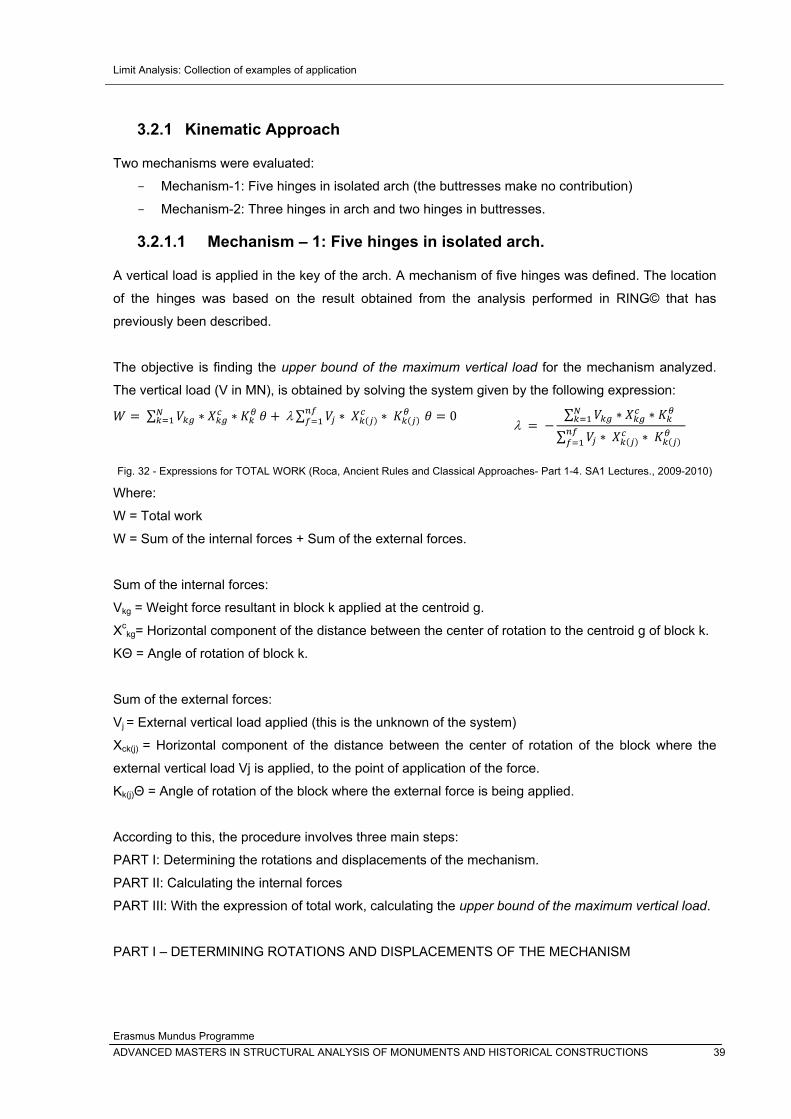
Limit Analysis: Collection of examples of application
Erasmus Mundus Programme ADVANCED MASTERS IN STRUCTURAL ANALYSIS OF MONUMENTS AND HISTORICAL CONSTRUCTIONS 39
3.2.1 Kinematic Approach
Two mechanisms were evaluated:
- Mechanism-1: Five hinges in isolated arch (the buttresses make no contribution)
- Mechanism-2: Three hinges in arch and two hinges in buttresses.
3.2.1.1 Mechanism – 1: Five hinges in isolated arch.
A vertical load is applied in the key of the arch. A mechanism of five hinges was defined. The location
of the hinges was based on the result obtained from the analysis performed in RING© that has
previously been described.
The objective is finding the upper bound of the maximum vertical load for the mechanism analyzed.
The vertical load (V in MN), is obtained by solving the system given by the following expression:
∑ λ∑ 0
λ
∑∑
Fig. 32 - Expressions for TOTAL WORK (Roca, Ancient Rules and Classical Approaches- Part 1-4. SA1 Lectures., 2009-2010)
Where:
W = Total work
W = Sum of the internal forces + Sum of the external forces.
Sum of the internal forces:
Vkg = Weight force resultant in block k applied at the centroid g.
Xckg= Horizontal component of the distance between the center of rotation to the centroid g of block k.
KΘ = Angle of rotation of block k.
Sum of the external forces:
Vj = External vertical load applied (this is the unknown of the system)
Xck(j) = Horizontal component of the distance between the center of rotation of the block where the
external vertical load Vj is applied, to the point of application of the force.
Kk(j)Θ = Angle of rotation of the block where the external force is being applied.
According to this, the procedure involves three main steps:
PART I: Determining the rotations and displacements of the mechanism.
PART II: Calculating the internal forces
PART III: With the expression of total work, calculating the upper bound of the maximum vertical load.
PART I – DETERMINING ROTATIONS AND DISPLACEMENTS OF THE MECHANISM
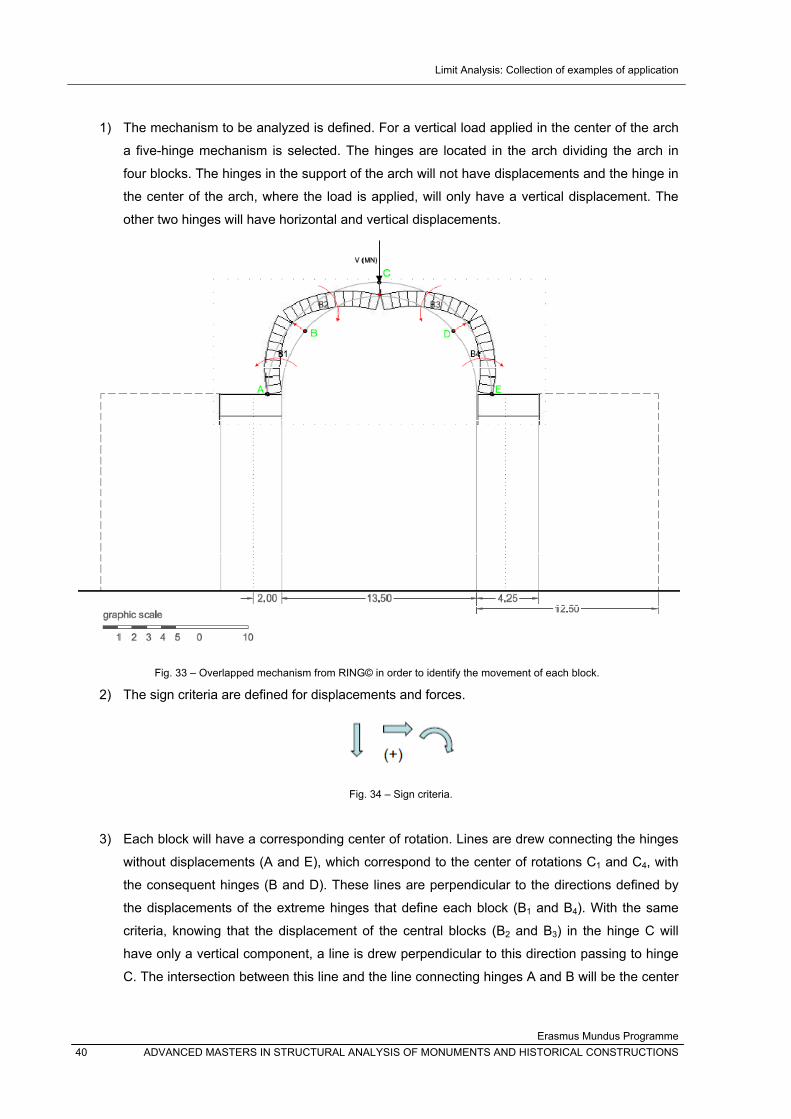
Limit Analysis: Collection of examples of application
Erasmus Mundus Programme 40 ADVANCED MASTERS IN STRUCTURAL ANALYSIS OF MONUMENTS AND HISTORICAL CONSTRUCTIONS
1) The mechanism to be analyzed is defined. For a vertical load applied in the center of the arch
a five-hinge mechanism is selected. The hinges are located in the arch dividing the arch in
four blocks. The hinges in the support of the arch will not have displacements and the hinge in
the center of the arch, where the load is applied, will only have a vertical displacement. The
other two hinges will have horizontal and vertical displacements.
Fig. 33 – Overlapped mechanism from RING© in order to identify the movement of each block.
2) The sign criteria are defined for displacements and forces.
Fig. 34 – Sign criteria.
3) Each block will have a corresponding center of rotation. Lines are drew connecting the hinges
without displacements (A and E), which correspond to the center of rotations C1 and C4, with
the consequent hinges (B and D). These lines are perpendicular to the directions defined by
the displacements of the extreme hinges that define each block (B1 and B4). With the same
criteria, knowing that the displacement of the central blocks (B2 and B3) in the hinge C will
have only a vertical component, a line is drew perpendicular to this direction passing to hinge
C. The intersection between this line and the line connecting hinges A and B will be the center
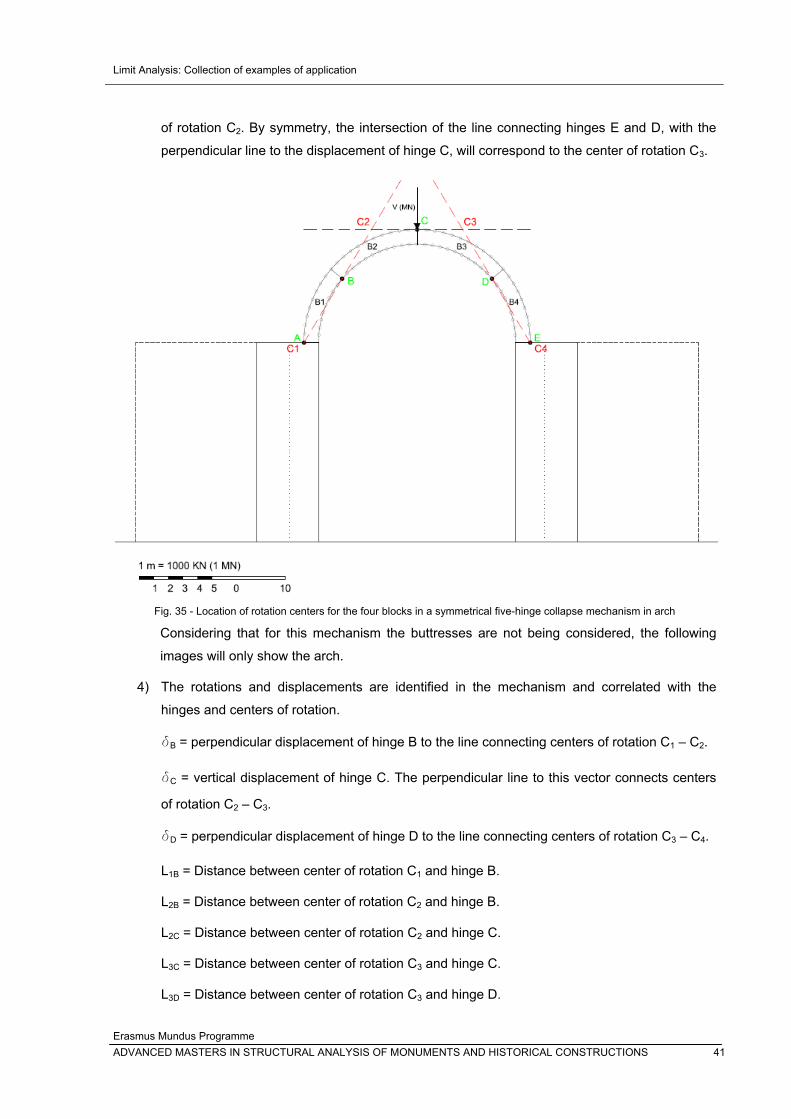
Limit Analysis: Collection of examples of application
Erasmus Mundus Programme ADVANCED MASTERS IN STRUCTURAL ANALYSIS OF MONUMENTS AND HISTORICAL CONSTRUCTIONS 41
of rotation C2. By symmetry, the intersection of the line connecting hinges E and D, with the
perpendicular line to the displacement of hinge C, will correspond to the center of rotation C3.
Fig. 35 - Location of rotation centers for the four blocks in a symmetrical five-hinge collapse mechanism in arch
Considering that for this mechanism the buttresses are not being considered, the following
images will only show the arch.
4) The rotations and displacements are identified in the mechanism and correlated with the
hinges and centers of rotation.
δB = perpendicular displacement of hinge B to the line connecting centers of rotation C1 – C2.
δC = vertical displacement of hinge C. The perpendicular line to this vector connects centers
of rotation C2 – C3.
δD = perpendicular displacement of hinge D to the line connecting centers of rotation C3 – C4.
L1B = Distance between center of rotation C1 and hinge B.
L2B = Distance between center of rotation C2 and hinge B.
L2C = Distance between center of rotation C2 and hinge C.
L3C = Distance between center of rotation C3 and hinge C.
L3D = Distance between center of rotation C3 and hinge D.
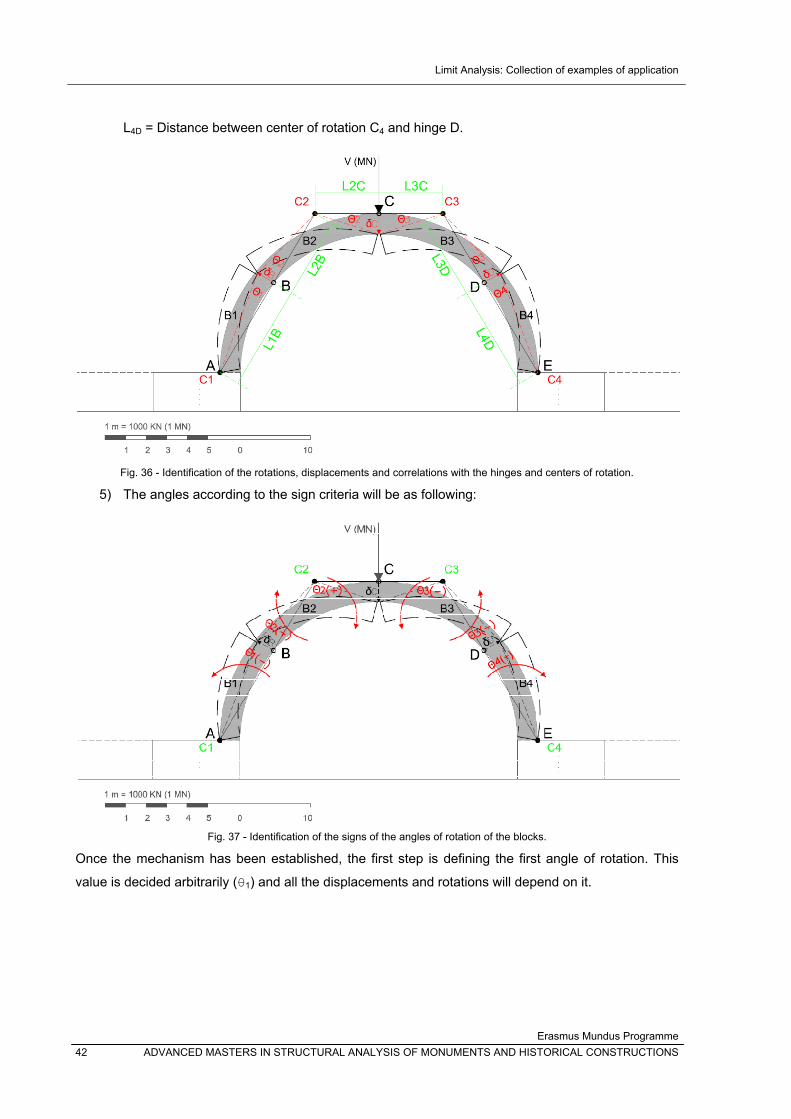
Limit Analysis: Collection of examples of application
Erasmus Mundus Programme 42 ADVANCED MASTERS IN STRUCTURAL ANALYSIS OF MONUMENTS AND HISTORICAL CONSTRUCTIONS
L4D = Distance between center of rotation C4 and hinge D.
Fig. 36 - Identification of the rotations, displacements and correlations with the hinges and centers of rotation.
5) The angles according to the sign criteria will be as following:
Fig. 37 - Identification of the signs of the angles of rotation of the blocks.
Once the mechanism has been established, the first step is defining the first angle of rotation. This
value is decided arbitrarily (θ1) and all the displacements and rotations will depend on it.
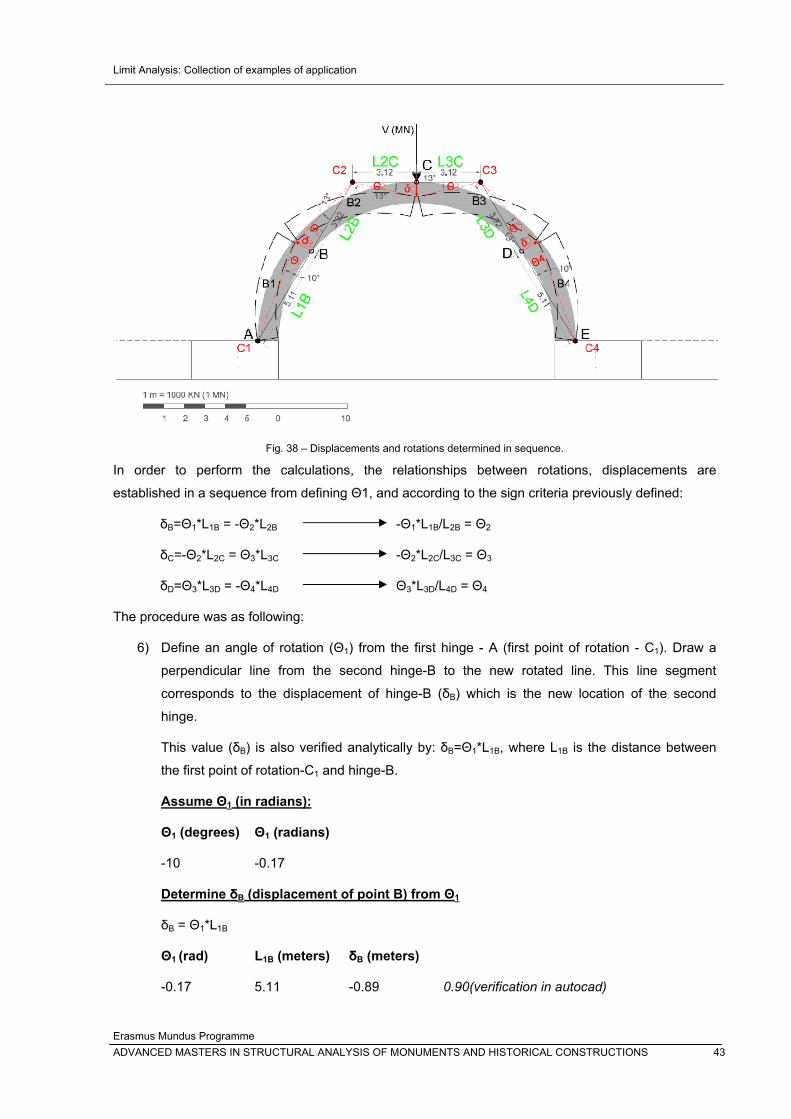
Limit Analysis: Collection of examples of application
Erasmus Mundus Programme ADVANCED MASTERS IN STRUCTURAL ANALYSIS OF MONUMENTS AND HISTORICAL CONSTRUCTIONS 43
Fig. 38 – Displacements and rotations determined in sequence.
In order to perform the calculations, the relationships between rotations, displacements are
established in a sequence from defining Θ1, and according to the sign criteria previously defined:
δB=Θ1*L1B = -Θ2*L2B -Θ1*L1B/L2B = Θ2
δC=-Θ2*L2C = Θ3*L3C -Θ2*L2C/L3C = Θ3
δD=Θ3*L3D = -Θ4*L4D Θ3*L3D/L4D = Θ4
The procedure was as following:
6) Define an angle of rotation (Θ1) from the first hinge - A (first point of rotation - C1). Draw a
perpendicular line from the second hinge-B to the new rotated line. This line segment
corresponds to the displacement of hinge-B (δB) which is the new location of the second
hinge.
This value (δB) is also verified analytically by: δB=Θ1*L1B, where L1B is the distance between
the first point of rotation-C1 and hinge-B.
Assume Θ1 (in radians):
Θ1 (degrees) Θ1 (radians)
-10 -0.17
Determine δB (displacement of point B) from Θ1
δB = Θ1*L1B
Θ1 (rad) L1B (meters) δB (meters)
-0.17 5.11 -0.89 0.90(verification in autocad)

Limit Analysis: Collection of examples of application
Erasmus Mundus Programme 44 ADVANCED MASTERS IN STRUCTURAL ANALYSIS OF MONUMENTS AND HISTORICAL CONSTRUCTIONS
7) The angle Θ2 is found by connecting de new point of displacement of hinge-B given by δB.
Analytically this value is obtained (therefore verified) from the expression
Θ2= (-L1B/L2B)*Θ1
Where L2B is the distance between hinge-B and the second point of rotation-C2. This
expression is obtained from the following equivalence:
δB=Θ1*L1B = -Θ2*L2B
Determine Θ2 (rad) from Θ1
Θ2= (-L1B/L2B)*Θ1 this formula comes from δB = Θ1*L1B = -Θ2*L2B
Θ1 (rad) L1B (meters) L2B (meters) Θ2 (rad) Θ2 (degrees)
-0.17 5.11 3.92 0.23 13.02
8) The displacement of the hinge-C is found with the expression δC = -Θ2*L2C where L2C is the
distance between the second point of rotation - C2 and hinge-C.
Determine δC (displacement of point C) from Θ2
δC = -Θ2*L2C
Θ2 (rad) L2C (meters) δC (meters)
0.23 3.12 -0.71
9) The angle Θ3 is obtained from the expression Θ3= -Θ2*(L2C/L3C)
Determine Θ3 (rad) from Θ2
Θ3=-Θ2*(L2C/L3C) in this example L2C=L3C
L2C (meters) L3C (meters) Θ2 (rad) Θ3 (rad) Θ3 (degrees)
3.12 3.12 0.23 -0.23 -13.02
10) The displacement of the hinge-D is found with the expression δD = Θ3*L3D where L3D is the
distance between the third point of rotation – C3 and hinge-D.
Determine δD (displacement of point D) from Θ3
δD = Θ3*L3D
Θ3 (rad) L3D (meters) δD (meters)
-0.23 3.92 -0.89 0.90(verification in autocad)
11) The angle Θ4 is obtained from the expression Θ4= -Θ3*(L3D/L4D)
Determine Θ4 (rad) from Θ3
Θ4=-Θ3*(L3D/L4D) in this example L4D=L1B
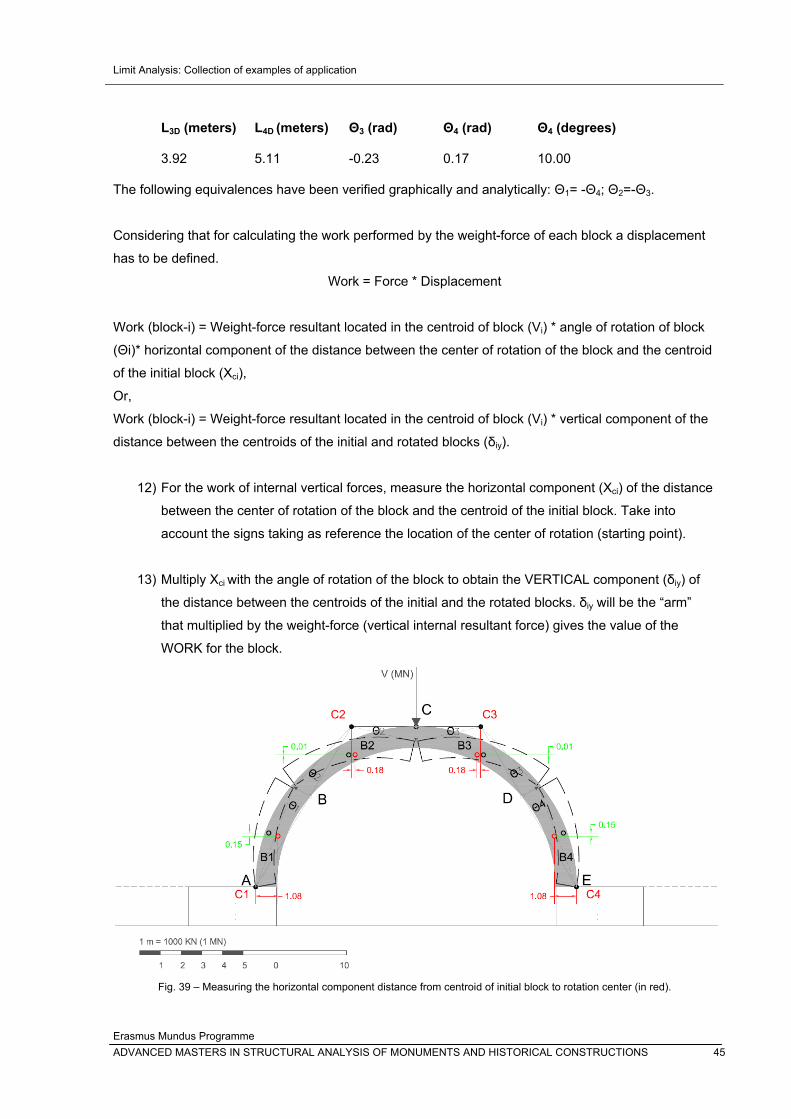
Limit Analysis: Collection of examples of application
Erasmus Mundus Programme ADVANCED MASTERS IN STRUCTURAL ANALYSIS OF MONUMENTS AND HISTORICAL CONSTRUCTIONS 45
L3D (meters) L4D (meters) Θ3 (rad) Θ4 (rad) Θ4 (degrees)
3.92 5.11 -0.23 0.17 10.00
The following equivalences have been verified graphically and analytically: Θ1= -Θ4; Θ2=-Θ3.
Considering that for calculating the work performed by the weight-force of each block a displacement
has to be defined.
Work = Force * Displacement
Work (block-i) = Weight-force resultant located in the centroid of block (Vi) * angle of rotation of block
(Θi)* horizontal component of the distance between the center of rotation of the block and the centroid
of the initial block (Xci),
Or,
Work (block-i) = Weight-force resultant located in the centroid of block (Vi) * vertical component of the
distance between the centroids of the initial and rotated blocks (δiy).
12) For the work of internal vertical forces, measure the horizontal component (Xci) of the distance
between the center of rotation of the block and the centroid of the initial block. Take into
account the signs taking as reference the location of the center of rotation (starting point).
13) Multiply Xci with the angle of rotation of the block to obtain the VERTICAL component (δiy) of
the distance between the centroids of the initial and the rotated blocks. δiy will be the “arm”
that multiplied by the weight-force (vertical internal resultant force) gives the value of the
WORK for the block.
Fig. 39 – Measuring the horizontal component distance from centroid of initial block to rotation center (in red).
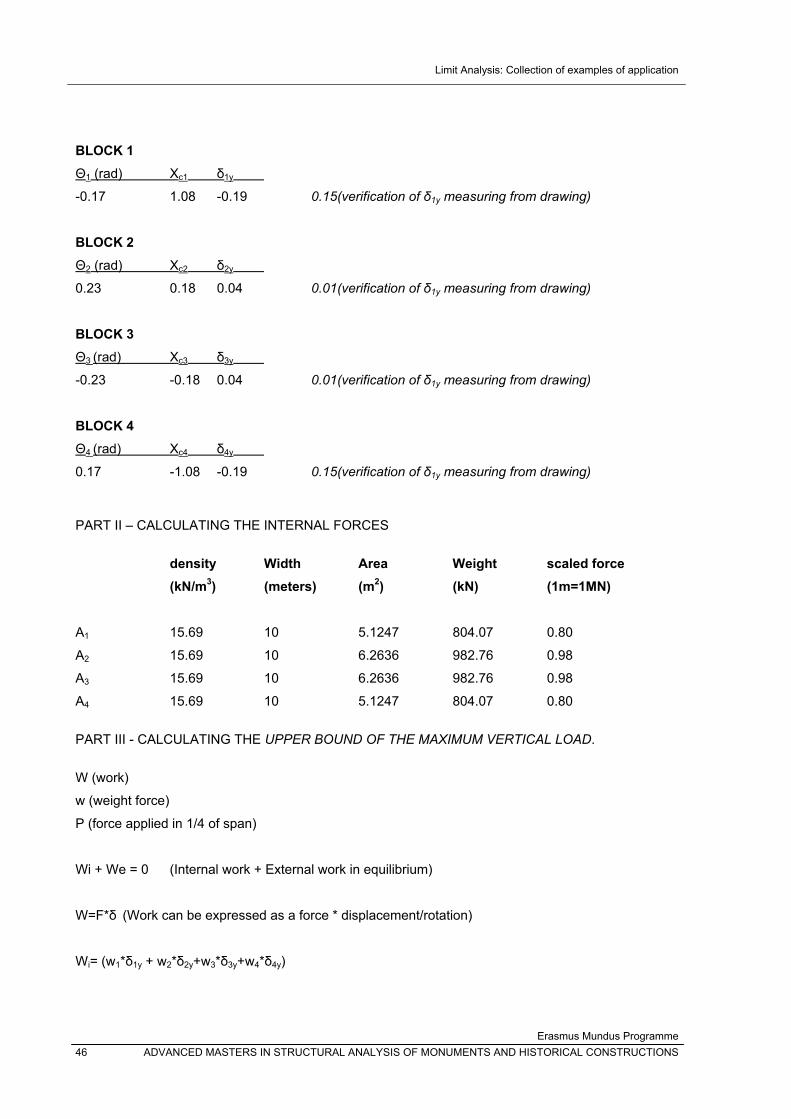
Limit Analysis: Collection of examples of application
Erasmus Mundus Programme 46 ADVANCED MASTERS IN STRUCTURAL ANALYSIS OF MONUMENTS AND HISTORICAL CONSTRUCTIONS
BLOCK 1 Θ1 (rad) Xc1 δ1y
-0.17 1.08 -0.19 0.15(verification of δ1y measuring from drawing)
BLOCK 2 Θ2 (rad) Xc2 δ2y
0.23 0.18 0.04 0.01(verification of δ1y measuring from drawing)
BLOCK 3 Θ3 (rad) Xc3 δ3y
-0.23 -0.18 0.04 0.01(verification of δ1y measuring from drawing)
BLOCK 4 Θ4 (rad) Xc4 δ4y
0.17 -1.08 -0.19 0.15(verification of δ1y measuring from drawing)
PART II – CALCULATING THE INTERNAL FORCES
density Width Area Weight scaled force (kN/m3) (meters) (m2) (kN) (1m=1MN)
A1 15.69 10 5.1247 804.07 0.80
A2 15.69 10 6.2636 982.76 0.98
A3 15.69 10 6.2636 982.76 0.98
A4 15.69 10 5.1247 804.07 0.80
PART III - CALCULATING THE UPPER BOUND OF THE MAXIMUM VERTICAL LOAD.
W (work)
w (weight force)
P (force applied in 1/4 of span)
Wi + We = 0 (Internal work + External work in equilibrium)
W=F*δ (Work can be expressed as a force * displacement/rotation)
Wi= (w1*δ1y + w2*δ2y+w3*δ3y+w4*δ4y)
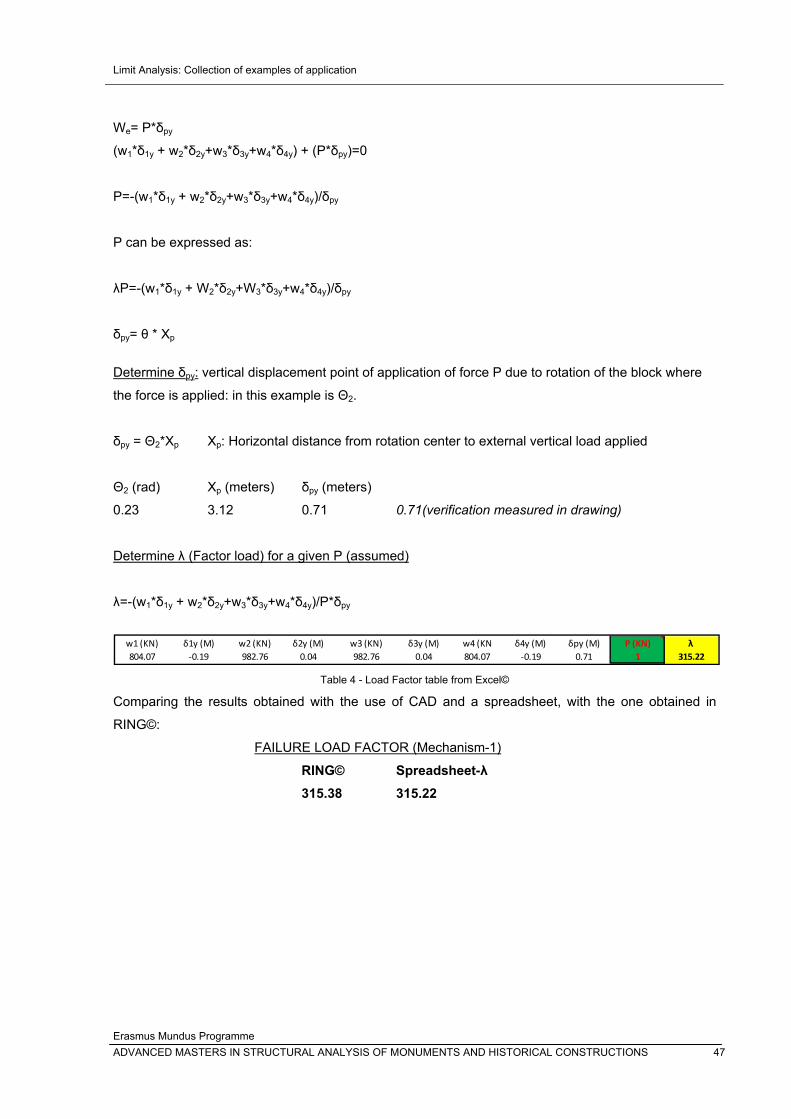
Limit Analysis: Collection of examples of application
Erasmus Mundus Programme ADVANCED MASTERS IN STRUCTURAL ANALYSIS OF MONUMENTS AND HISTORICAL CONSTRUCTIONS 47
We= P*δpy
(w1*δ1y + w2*δ2y+w3*δ3y+w4*δ4y) + (P*δpy)=0
P=-(w1*δ1y + w2*δ2y+w3*δ3y+w4*δ4y)/δpy
P can be expressed as:
λP=-(w1*δ1y + W2*δ2y+W3*δ3y+w4*δ4y)/δpy
δpy= θ * Xp
Determine δpy: vertical displacement point of application of force P due to rotation of the block where
the force is applied: in this example is Θ2.
δpy = Θ2*Xp Xp: Horizontal distance from rotation center to external vertical load applied
Θ2 (rad) Xp (meters) δpy (meters)
0.23 3.12 0.71 0.71(verification measured in drawing)
Determine λ (Factor load) for a given P (assumed)
λ=-(w1*δ1y + w2*δ2y+w3*δ3y+w4*δ4y)/P*δpy
Table 4 - Load Factor table from Excel©
Comparing the results obtained with the use of CAD and a spreadsheet, with the one obtained in
RING©:
FAILURE LOAD FACTOR (Mechanism-1)
RING© Spreadsheet-λ 315.38 315.22
w1 (KN) δ1y (M) w2 (KN) δ2y (M) w3 (KN) δ3y (M) w4 (KN δ4y (M) δpy (M) P (KN) λ 804.07 ‐0.19 982.76 0.04 982.76 0.04 804.07 ‐0.19 0.71 1 315.22
Limit Analysis: Collection of examples of application
Erasmus Mundus Programme 48 ADVANCED MASTERS IN STRUCTURAL ANALYSIS OF MONUMENTS AND HISTORICAL CONSTRUCTIONS
3.2.1.2 Mechanism – 2: Three hinges in arch and two hinges in buttresses.
A vertical load is applied in the key of the arch. A mechanism of three hinges in the arch and two
hinges in the buttresses was defined.
The objective is finding the upper bound of the maximum vertical load for the mechanism analyzed.
The vertical load (V in MN), is obtained by solving the system given by the following expression:
∑ λ∑ 0
λ
∑ ∑
Fig. 40 - Expressions for TOTAL WORK (Roca, Ancient Rules and Classical Approaches- Part 1-4. SA1 Lectures., 2009-2010)
Where:
W = Total work
W = Sum of the internal forces + Sum of the external forces.
Sum of the internal forces:
Vkg = Weight force resultant in block k applied at the centroid g.
Xckg= Horizontal component of the distance between the center of rotation to the centroid g of block k.
KΘ = Angle of rotation of block k.
Sum of the external forces:
Vj = External vertical load applied (this is the unknown of the system)
Xck(j) = Horizontal component of the distance between the center of rotation of the block where the
external vertical load Vj is applied, to the point of application of the force.
Kk(j)Θ = Angle of rotation of the block where the external force is being applied.
According to this, the procedure involves three main steps:
PART I: Determining the rotations and displacements of the mechanism.
PART II: Calculating the internal forces
PART III: With the expression of total work, calculating the upper bound of the maximum vertical load.
PART I – DETERMINING ROTATIONS AND DISPLACEMENTS OF THE MECHANISM
1) The mechanism to be analyzed is defined. For a vertical load applied in the center of the arch
a three-hinges in arch and two-hinges in buttresses mechanism is selected. The hinges are
located in the arch and buttresses dividing the structure in four blocks. The hinges in the
support of the buttresses will not have displacements and the hinge in the center of the arch,
where the load is applied, will only have a vertical displacement. The other two hinges will
have horizontal and vertical displacements.
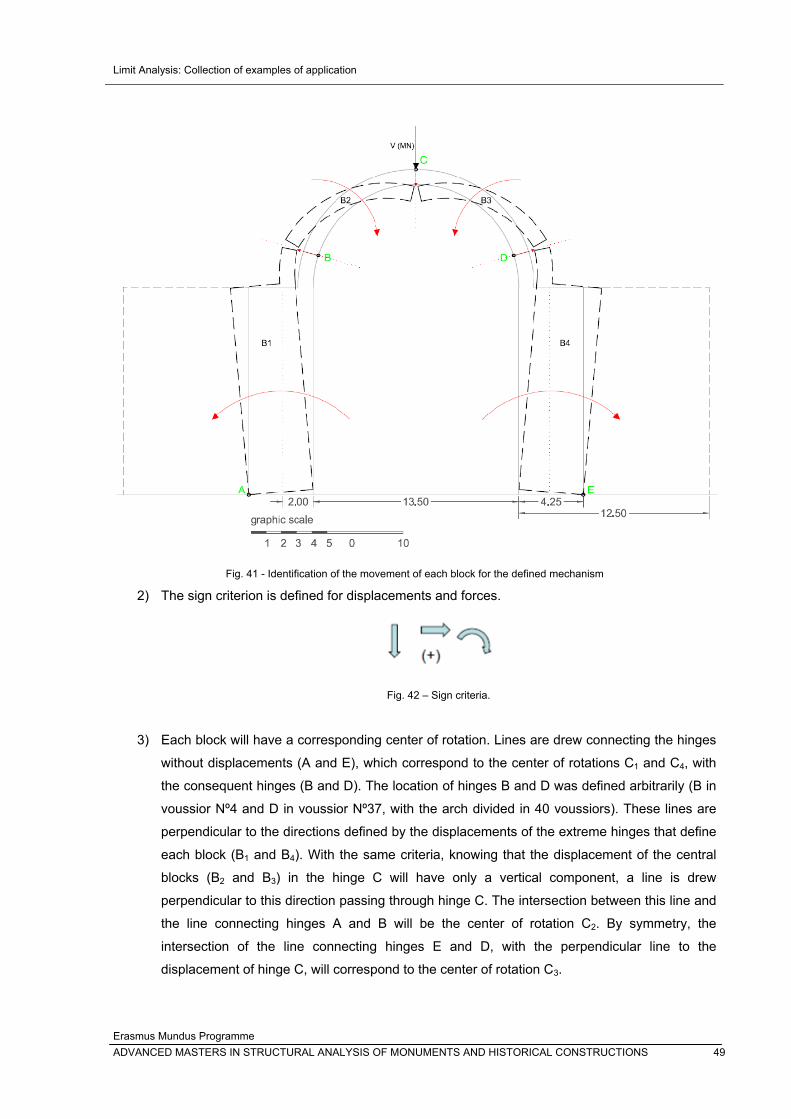
Limit Analysis: Collection of examples of application
Erasmus Mundus Programme ADVANCED MASTERS IN STRUCTURAL ANALYSIS OF MONUMENTS AND HISTORICAL CONSTRUCTIONS 49
Fig. 41 - Identification of the movement of each block for the defined mechanism
2) The sign criterion is defined for displacements and forces.
Fig. 42 – Sign criteria.
3) Each block will have a corresponding center of rotation. Lines are drew connecting the hinges
without displacements (A and E), which correspond to the center of rotations C1 and C4, with
the consequent hinges (B and D). The location of hinges B and D was defined arbitrarily (B in
voussior Nº4 and D in voussior Nº37, with the arch divided in 40 voussiors). These lines are
perpendicular to the directions defined by the displacements of the extreme hinges that define
each block (B1 and B4). With the same criteria, knowing that the displacement of the central
blocks (B2 and B3) in the hinge C will have only a vertical component, a line is drew
perpendicular to this direction passing through hinge C. The intersection between this line and
the line connecting hinges A and B will be the center of rotation C2. By symmetry, the
intersection of the line connecting hinges E and D, with the perpendicular line to the
displacement of hinge C, will correspond to the center of rotation C3.
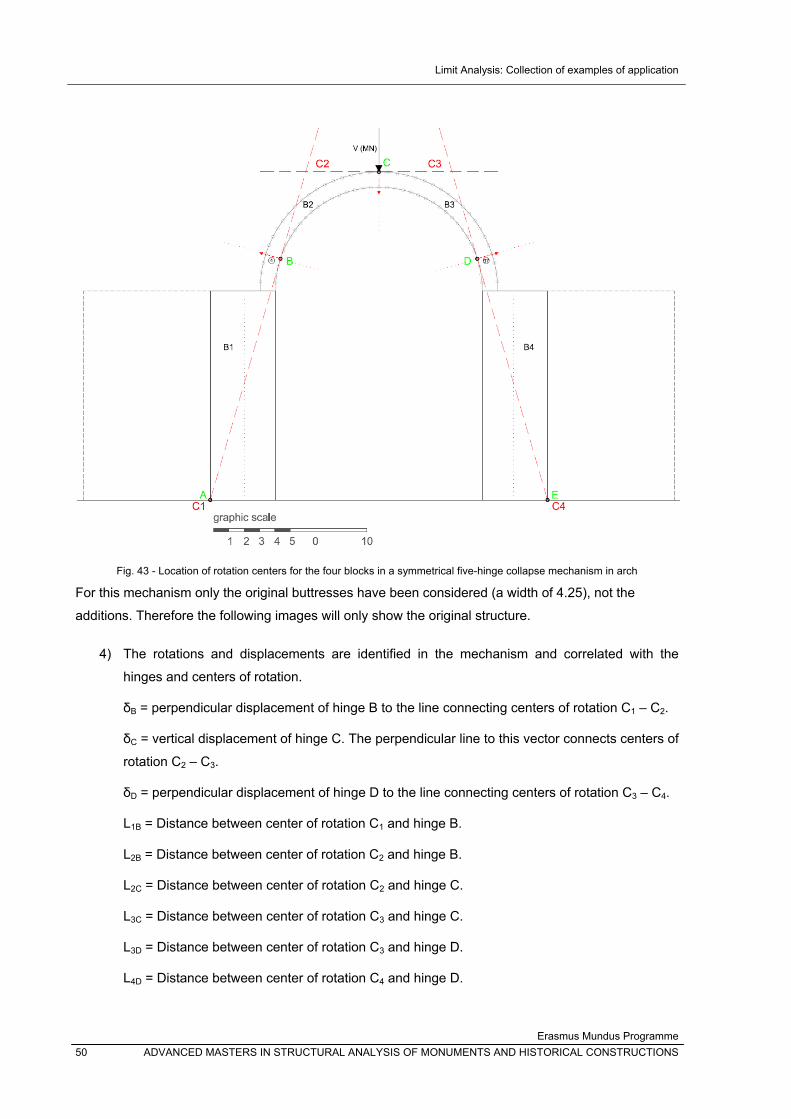
Limit Analysis: Collection of examples of application
Erasmus Mundus Programme 50 ADVANCED MASTERS IN STRUCTURAL ANALYSIS OF MONUMENTS AND HISTORICAL CONSTRUCTIONS
Fig. 43 - Location of rotation centers for the four blocks in a symmetrical five-hinge collapse mechanism in arch
For this mechanism only the original buttresses have been considered (a width of 4.25), not the
additions. Therefore the following images will only show the original structure.
4) The rotations and displacements are identified in the mechanism and correlated with the
hinges and centers of rotation.
δB = perpendicular displacement of hinge B to the line connecting centers of rotation C1 – C2.
δC = vertical displacement of hinge C. The perpendicular line to this vector connects centers of
rotation C2 – C3.
δD = perpendicular displacement of hinge D to the line connecting centers of rotation C3 – C4.
L1B = Distance between center of rotation C1 and hinge B.
L2B = Distance between center of rotation C2 and hinge B.
L2C = Distance between center of rotation C2 and hinge C.
L3C = Distance between center of rotation C3 and hinge C.
L3D = Distance between center of rotation C3 and hinge D.
L4D = Distance between center of rotation C4 and hinge D.
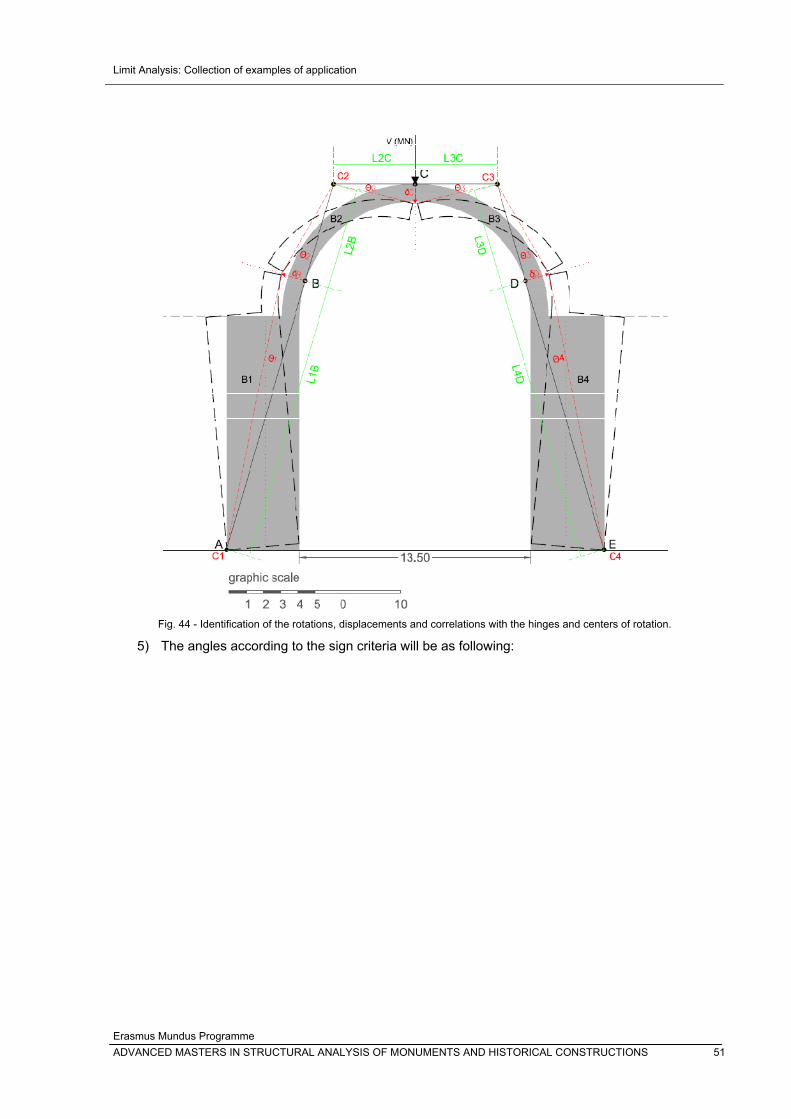
Limit Analysis: Collection of examples of application
Erasmus Mundus Programme ADVANCED MASTERS IN STRUCTURAL ANALYSIS OF MONUMENTS AND HISTORICAL CONSTRUCTIONS 51
Fig. 44 - Identification of the rotations, displacements and correlations with the hinges and centers of rotation.
5) The angles according to the sign criteria will be as following:
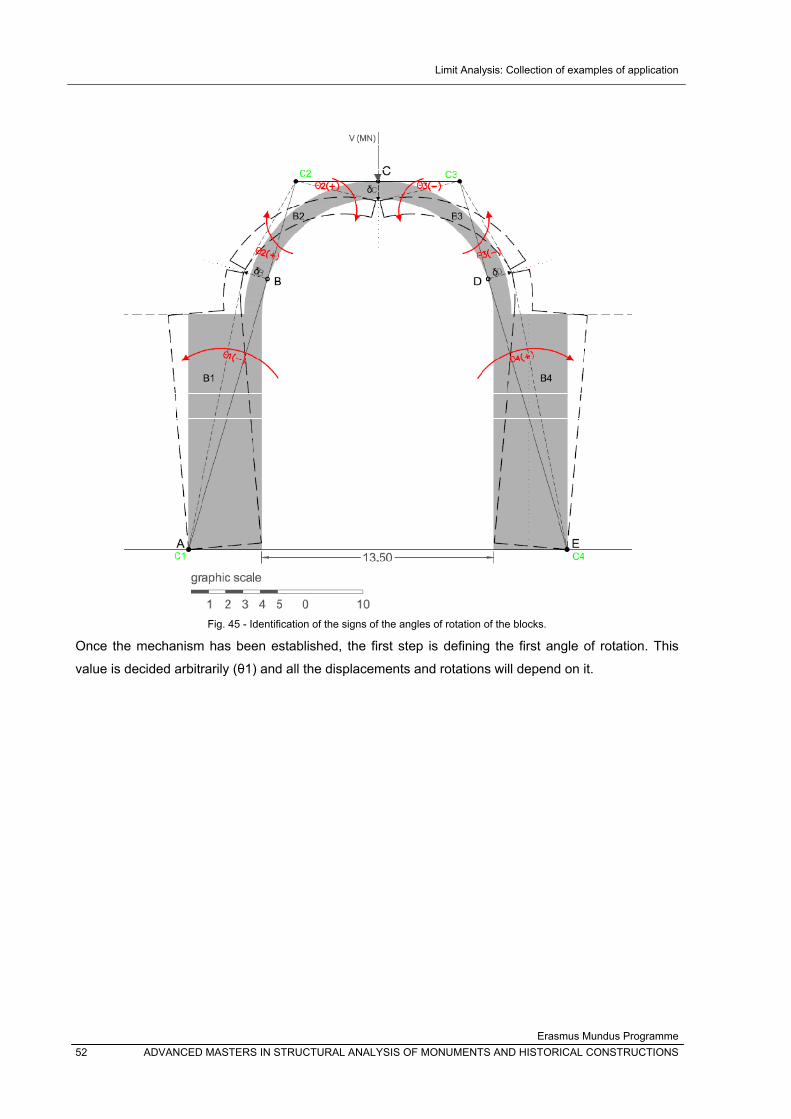
Limit Analysis: Collection of examples of application
Erasmus Mundus Programme 52 ADVANCED MASTERS IN STRUCTURAL ANALYSIS OF MONUMENTS AND HISTORICAL CONSTRUCTIONS
Fig. 45 - Identification of the signs of the angles of rotation of the blocks.
Once the mechanism has been established, the first step is defining the first angle of rotation. This
value is decided arbitrarily (θ1) and all the displacements and rotations will depend on it.
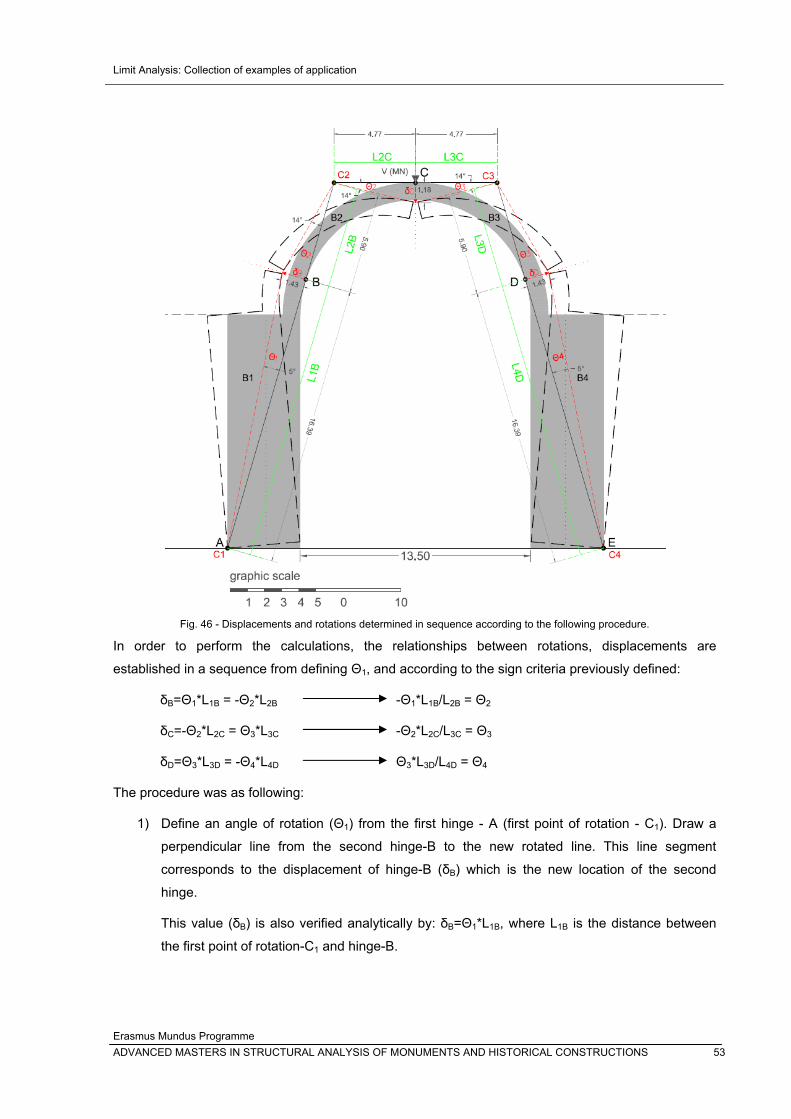
Limit Analysis: Collection of examples of application
Erasmus Mundus Programme ADVANCED MASTERS IN STRUCTURAL ANALYSIS OF MONUMENTS AND HISTORICAL CONSTRUCTIONS 53
Fig. 46 - Displacements and rotations determined in sequence according to the following procedure.
In order to perform the calculations, the relationships between rotations, displacements are
established in a sequence from defining Θ1, and according to the sign criteria previously defined:
δB=Θ1*L1B = -Θ2*L2B -Θ1*L1B/L2B = Θ2
δC=-Θ2*L2C = Θ3*L3C -Θ2*L2C/L3C = Θ3
δD=Θ3*L3D = -Θ4*L4D Θ3*L3D/L4D = Θ4
The procedure was as following:
1) Define an angle of rotation (Θ1) from the first hinge - A (first point of rotation - C1). Draw a
perpendicular line from the second hinge-B to the new rotated line. This line segment
corresponds to the displacement of hinge-B (δB) which is the new location of the second
hinge.
This value (δB) is also verified analytically by: δB=Θ1*L1B, where L1B is the distance between
the first point of rotation-C1 and hinge-B.
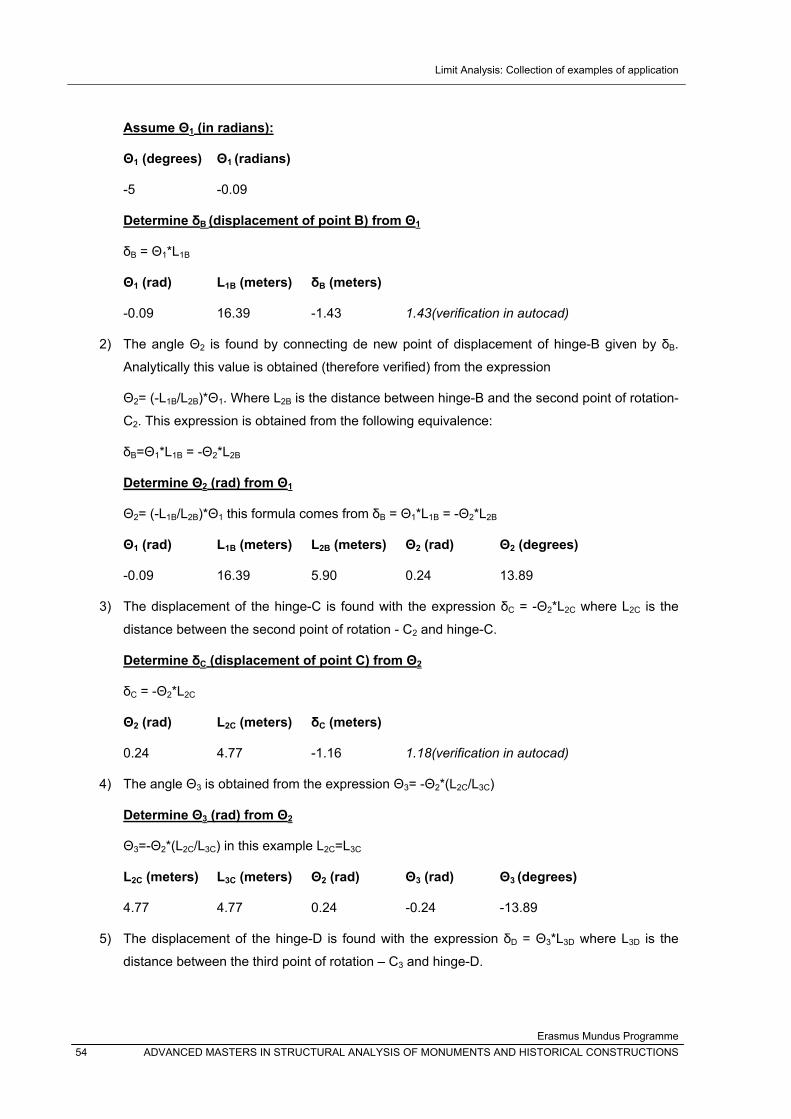
Limit Analysis: Collection of examples of application
Erasmus Mundus Programme 54 ADVANCED MASTERS IN STRUCTURAL ANALYSIS OF MONUMENTS AND HISTORICAL CONSTRUCTIONS
Assume Θ1 (in radians):
Θ1 (degrees) Θ1 (radians)
-5 -0.09
Determine δB (displacement of point B) from Θ1
δB = Θ1*L1B
Θ1 (rad) L1B (meters) δB (meters)
-0.09 16.39 -1.43 1.43(verification in autocad)
2) The angle Θ2 is found by connecting de new point of displacement of hinge-B given by δB.
Analytically this value is obtained (therefore verified) from the expression
Θ2= (-L1B/L2B)*Θ1. Where L2B is the distance between hinge-B and the second point of rotation-
C2. This expression is obtained from the following equivalence:
δB=Θ1*L1B = -Θ2*L2B
Determine Θ2 (rad) from Θ1
Θ2= (-L1B/L2B)*Θ1 this formula comes from δB = Θ1*L1B = -Θ2*L2B
Θ1 (rad) L1B (meters) L2B (meters) Θ2 (rad) Θ2 (degrees)
-0.09 16.39 5.90 0.24 13.89
3) The displacement of the hinge-C is found with the expression δC = -Θ2*L2C where L2C is the
distance between the second point of rotation - C2 and hinge-C.
Determine δC (displacement of point C) from Θ2
δC = -Θ2*L2C
Θ2 (rad) L2C (meters) δC (meters)
0.24 4.77 -1.16 1.18(verification in autocad)
4) The angle Θ3 is obtained from the expression Θ3= -Θ2*(L2C/L3C)
Determine Θ3 (rad) from Θ2
Θ3=-Θ2*(L2C/L3C) in this example L2C=L3C
L2C (meters) L3C (meters) Θ2 (rad) Θ3 (rad) Θ3 (degrees)
4.77 4.77 0.24 -0.24 -13.89
5) The displacement of the hinge-D is found with the expression δD = Θ3*L3D where L3D is the
distance between the third point of rotation – C3 and hinge-D.
Limit Analysis: Collection of examples of application
Erasmus Mundus Programme ADVANCED MASTERS IN STRUCTURAL ANALYSIS OF MONUMENTS AND HISTORICAL CONSTRUCTIONS 55
Determine δD (displacement of point D) from Θ3
δD = Θ3*L3D
Θ3 (rad) L3D (meters) δD (meters)
-0.24 5.90 -1.43 1.43(verification in autocad)
6) The angle Θ4 is obtained from the expression Θ4= -Θ3*(L3D/L4D)
Determine Θ4 (rad) from Θ3
Θ4=-Θ3*(L3D/L4D) in this example L4D=L1B
L3D (meters) L4D (meters) Θ3 (rad) Θ4 (rad) Θ4 (degrees)
5.90 16.39 -0.24 0.09 5.00
The following equivalences have been verified graphically and analytically: Θ1= -Θ4; Θ2=-Θ3.
Considering that for calculating the work performed by the weight-force of each block a displacement
has to be defined.
Work = Force * Displacement
Work (block-i) = Weight-force resultant located in the centroid of block (Vi) * angle of rotation of block
(Θi)* horizontal component of the distance between the center of rotation of the block and the centroid
of the initial block (Xci),
Or,
Work (block-i) = Weight-force resultant located in the centroid of block (Vi) * vertical component of the
distance between the centroids of the initial and rotated blocks (δiy).
7) For the work of internal vertical forces, measure the horizontal component (Xci) of the distance
between the center of rotation of the block and the centroid of the initial block. Take into
account the signs taking as reference the location of the center of rotation (starting point).
8) Multiply Xci with the angle of rotation of the block to obtain the VERTICAL component (δiy) of
the distance between the centroids of the initial and the rotated blocks. δiy will be the “arm”
that multiplied by the weight-force (vertical internal resultant force) gives the value of the
WORK for the block.
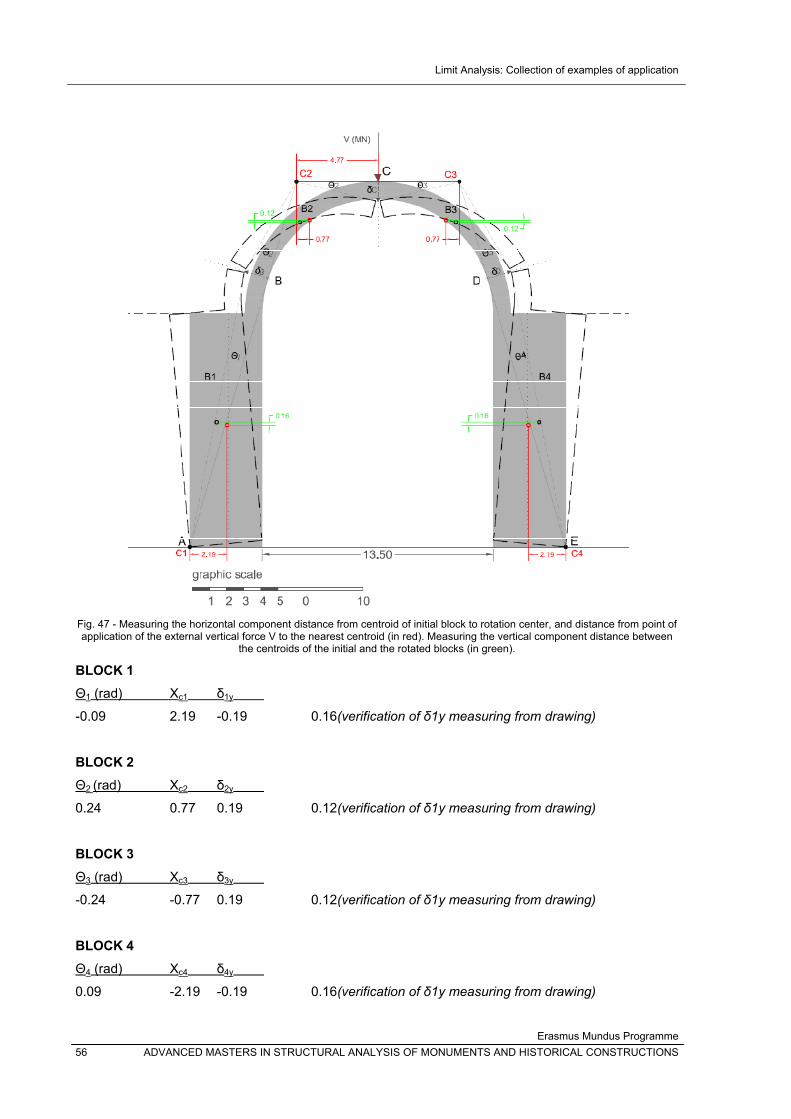
Limit Analysis: Collection of examples of application
Erasmus Mundus Programme 56 ADVANCED MASTERS IN STRUCTURAL ANALYSIS OF MONUMENTS AND HISTORICAL CONSTRUCTIONS
Fig. 47 - Measuring the horizontal component distance from centroid of initial block to rotation center, and distance from point of application of the external vertical force V to the nearest centroid (in red). Measuring the vertical component distance between
the centroids of the initial and the rotated blocks (in green).
BLOCK 1 Θ1 (rad) Xc1 δ1y
-0.09 2.19 -0.19 0.16(verification of δ1y measuring from drawing)
BLOCK 2 Θ2 (rad) Xc2 δ2y
0.24 0.77 0.19 0.12(verification of δ1y measuring from drawing)
BLOCK 3 Θ3 (rad) Xc3 δ3y
-0.24 -0.77 0.19 0.12(verification of δ1y measuring from drawing)
BLOCK 4 Θ4 (rad) Xc4 δ4y
0.09 -2.19 -0.19 0.16(verification of δ1y measuring from drawing)
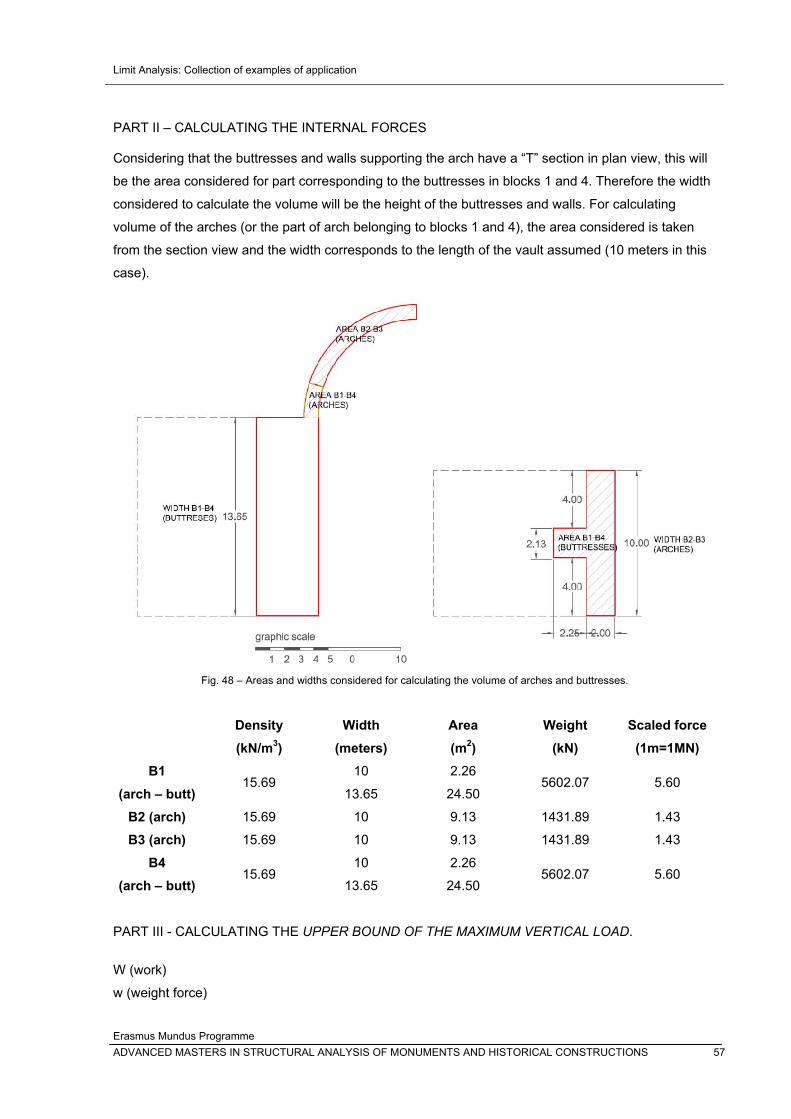
Limit Analysis: Collection of examples of application
Erasmus Mundus Programme ADVANCED MASTERS IN STRUCTURAL ANALYSIS OF MONUMENTS AND HISTORICAL CONSTRUCTIONS 57
PART II – CALCULATING THE INTERNAL FORCES Considering that the buttresses and walls supporting the arch have a “T” section in plan view, this will
be the area considered for part corresponding to the buttresses in blocks 1 and 4. Therefore the width
considered to calculate the volume will be the height of the buttresses and walls. For calculating
volume of the arches (or the part of arch belonging to blocks 1 and 4), the area considered is taken
from the section view and the width corresponds to the length of the vault assumed (10 meters in this
case).
Fig. 48 – Areas and widths considered for calculating the volume of arches and buttresses.
Density (kN/m3)
Width (meters)
Area (m2)
Weight (kN)
Scaled force (1m=1MN)
B1 (arch – butt)
15.69 10 2.26
5602.07 5.60 13.65 24.50
B2 (arch) 15.69 10 9.13 1431.89 1.43
B3 (arch) 15.69 10 9.13 1431.89 1.43
B4 (arch – butt)
15.69 10 2.26
5602.07 5.60 13.65 24.50
PART III - CALCULATING THE UPPER BOUND OF THE MAXIMUM VERTICAL LOAD.
W (work)
w (weight force)
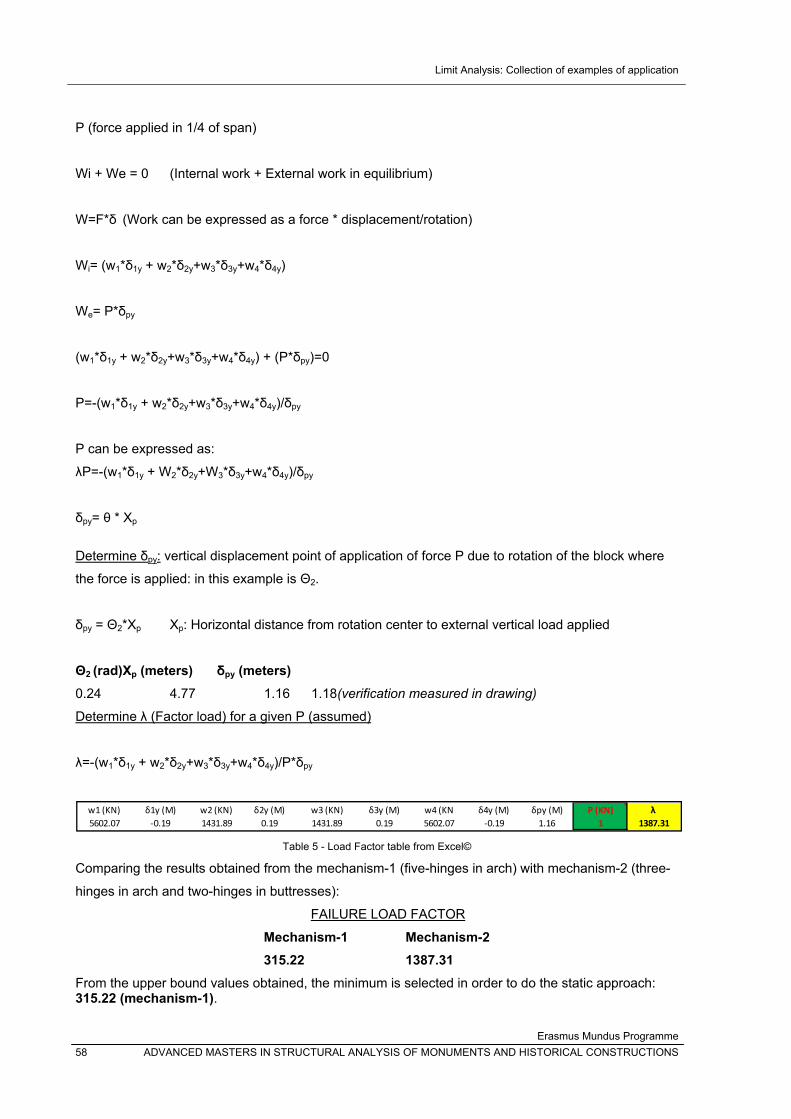
Limit Analysis: Collection of examples of application
Erasmus Mundus Programme 58 ADVANCED MASTERS IN STRUCTURAL ANALYSIS OF MONUMENTS AND HISTORICAL CONSTRUCTIONS
P (force applied in 1/4 of span)
Wi + We = 0 (Internal work + External work in equilibrium)
W=F*δ (Work can be expressed as a force * displacement/rotation)
Wi= (w1*δ1y + w2*δ2y+w3*δ3y+w4*δ4y)
We= P*δpy
(w1*δ1y + w2*δ2y+w3*δ3y+w4*δ4y) + (P*δpy)=0
P=-(w1*δ1y + w2*δ2y+w3*δ3y+w4*δ4y)/δpy
P can be expressed as:
λP=-(w1*δ1y + W2*δ2y+W3*δ3y+w4*δ4y)/δpy
δpy= θ * Xp
Determine δpy: vertical displacement point of application of force P due to rotation of the block where
the force is applied: in this example is Θ2.
δpy = Θ2*Xp Xp: Horizontal distance from rotation center to external vertical load applied
Θ2 (rad) Xp (meters) δpy (meters) 0.24 4.77 1.16 1.18(verification measured in drawing)
Determine λ (Factor load) for a given P (assumed)
λ=-(w1*δ1y + w2*δ2y+w3*δ3y+w4*δ4y)/P*δpy
Table 5 - Load Factor table from Excel©
Comparing the results obtained from the mechanism-1 (five-hinges in arch) with mechanism-2 (three-
hinges in arch and two-hinges in buttresses):
FAILURE LOAD FACTOR
Mechanism-1 Mechanism-2 315.22 1387.31
From the upper bound values obtained, the minimum is selected in order to do the static approach: 315.22 (mechanism-1).
w1 (KN) δ1y (M) w2 (KN) δ2y (M) w3 (KN) δ3y (M) w4 (KN δ4y (M) δpy (M) P (KN) λ 5602.07 ‐0.19 1431.89 0.19 1431.89 0.19 5602.07 ‐0.19 1.16 1 1387.31
Limit Analysis: Collection of examples of application
Erasmus Mundus Programme ADVANCED MASTERS IN STRUCTURAL ANALYSIS OF MONUMENTS AND HISTORICAL CONSTRUCTIONS 59
3.2.2 Static Approach
The objective was finding a thrust line that passes through the hinges for the mechanism that gave the
lower Load Value. Therefore the value to be considered for the static approach will be a reduced value
from 315.22 kN.
3.2.2.1 5 hinges in arch (no contribution of buttresses)
A reduction of 3% is proposed for the maximum load value obtained for the mechanism of five-hinges
in arch without contribution of the buttresses. Therefore the vertical load applied in the center of the
arch will be: 305.76 kN.
GENERAL ASPECTS
The objective is verifying if a thrust line can be found that passes through the five hinges defined for
the mechanism in isolated arch previously for the specified vertical load.
The structure to be analyzed is evaluated considering the equilibrium equations.
The number of available equations is three:
1- Sum of the vertical forces equal to zero
2- Sum of the horizontal forces equal to zero
3- Sum of the moments equal to zero
To define the VECTOR, three properties must be defined:
1- Entity (magnitude)
2 - Direction
3 - Position
PROCEDURE USING CAD
9) Draw the geometry of the structure.
10) The structure is discretized into segments segments (voussoirs in arches). The more amount
of segments the structure is divided in, the “smoother” the thrust-line obtained will be.
However, doing graphic statics “by hand” can be tedious with too many divisions. An
intermediate consideration is then taken into account. Recommendation: Put a number to
identify each segment in order to have a guide when constructing the force polygon.
11) Find and locate force-weight vector for each segment. This example has only one material
(this is one of the differences with the Bridgemill Bridge example).
o Find the area of each part of the segment.
Limit Analysis: Collection of examples of application
Erasmus Mundus Programme 60 ADVANCED MASTERS IN STRUCTURAL ANALYSIS OF MONUMENTS AND HISTORICAL CONSTRUCTIONS
From <DRAW< use the command <BOUNDARY> to create an "object"
(polyline).
Use the command <area> to obtain the value in m2
o Find the volume of each part of the segment by multiplying the obtained areas with
the width/thickness of the structural element. .
o To obtain the weight for each part of each segment, multiply the given density value
(kN/m3) to the corresponding volume.
o Find centroid coordinates for each segment
From <DRAW> use the command <REGION> by selecting the created
"object" previously.
Use the command <MASSPROP> to obtain the x,y coordinates of the
centroid for each part of the segment.
o Locate each centroid of segment:
Use <POINT> to draw a reference in each segment by giving the coordinates
obtained before.
o Locate the weight-force (kN)
Define a scale for drawing the weight-force values (kN) represented as a
dimension value (m). For example: 1 M = 250 kN.
Draw the <LINE> with the scaled magnitud in meters representing the weight-
force (kN) with the starting point in the centroid of each corresponding
segment.

Limit Analysis: Collection of examples of application
Erasmus Mundus Programme ADVANCED MASTERS IN STRUCTURAL ANALYSIS OF MONUMENTS AND HISTORICAL CONSTRUCTIONS 61
Fig. 49 – Discretization of arch, location of centroids and vertical forces.
12) Define the live weight
o Determine the location of the resultant live weight to be considered.
For this example the vertical load applied in the center of the span has been obtained
from the kinematic analysis.
13) Apply STATIC GRAPHIC to calculate de <RESULTANT FORCE>
o To find the magnitud and direction of the <RESULTANT FORCE>: Sum in order of
appearance the weight-forces (sum as vectors).
o To find the position of the <RESULTANT FORCE>:
Define an "origin" next to the summed force vectors
Draw ray-lines from the start and end of each individual force vectors: This
will form a FORCE POLYGON
Take each ray-line (keeping its direction) and locate one of its ends
intersecting the reference line of each corresponding weight-force vector in
the analyzed structure: This will form a FUNICULAR POLYGON
Sum the two ray-line vectors of each extreme in the FUNICULAR POLYGON
(sum of vectors): The position of the RESULTANT FORCE (with magnitude
and direction that was found before), is achieved.

Limit Analysis: Collection of examples of application
Erasmus Mundus Programme 62 ADVANCED MASTERS IN STRUCTURAL ANALYSIS OF MONUMENTS AND HISTORICAL CONSTRUCTIONS
Fig. 50 - Funicular polygon and resultant force
14) Considering that this case has of application of the STATIC APPROACH has been defined
with the objective of finding a thrust line for the evaluated mechanism in the KINEMATIC
APPROACH, three hinges are selected as the fixed points.
o Three fixed points (hinges) are selected and referenced to the funicular polygon.
Reference lines are drew (A` and B`= connecting the hinges and projected
over the funicular polygon.
Reference lines are drew (A and B) connecting the three points projected
from the location of the hinges on the funicular polygon.
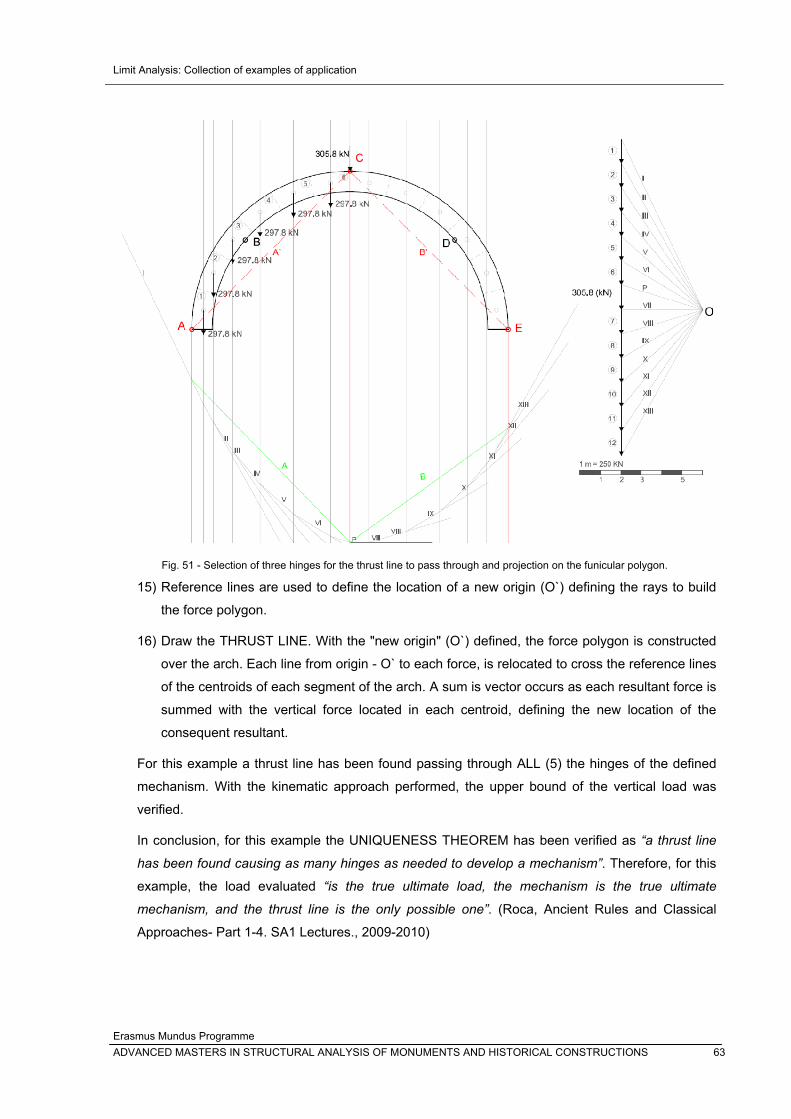
Limit Analysis: Collection of examples of application
Erasmus Mundus Programme ADVANCED MASTERS IN STRUCTURAL ANALYSIS OF MONUMENTS AND HISTORICAL CONSTRUCTIONS 63
Fig. 51 - Selection of three hinges for the thrust line to pass through and projection on the funicular polygon.
15) Reference lines are used to define the location of a new origin (O`) defining the rays to build
the force polygon.
16) Draw the THRUST LINE. With the "new origin" (O`) defined, the force polygon is constructed
over the arch. Each line from origin - O` to each force, is relocated to cross the reference lines
of the centroids of each segment of the arch. A sum is vector occurs as each resultant force is
summed with the vertical force located in each centroid, defining the new location of the
consequent resultant.
For this example a thrust line has been found passing through ALL (5) the hinges of the defined
mechanism. With the kinematic approach performed, the upper bound of the vertical load was
verified.
In conclusion, for this example the UNIQUENESS THEOREM has been verified as “a thrust line
has been found causing as many hinges as needed to develop a mechanism”. Therefore, for this
example, the load evaluated “is the true ultimate load, the mechanism is the true ultimate
mechanism, and the thrust line is the only possible one”. (Roca, Ancient Rules and Classical
Approaches- Part 1-4. SA1 Lectures., 2009-2010)
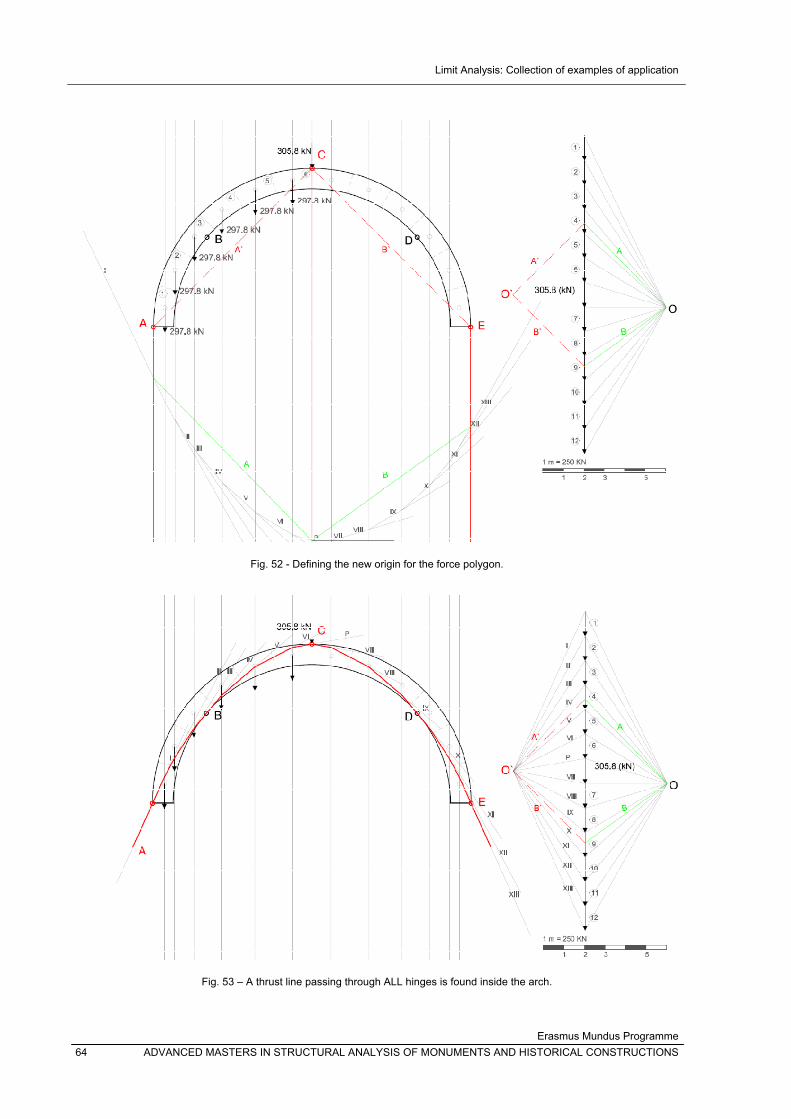
Limit Analysis: Collection of examples of application
Erasmus Mundus Programme 64 ADVANCED MASTERS IN STRUCTURAL ANALYSIS OF MONUMENTS AND HISTORICAL CONSTRUCTIONS
Fig. 52 - Defining the new origin for the force polygon.
Fig. 53 – A thrust line passing through ALL hinges is found inside the arch.
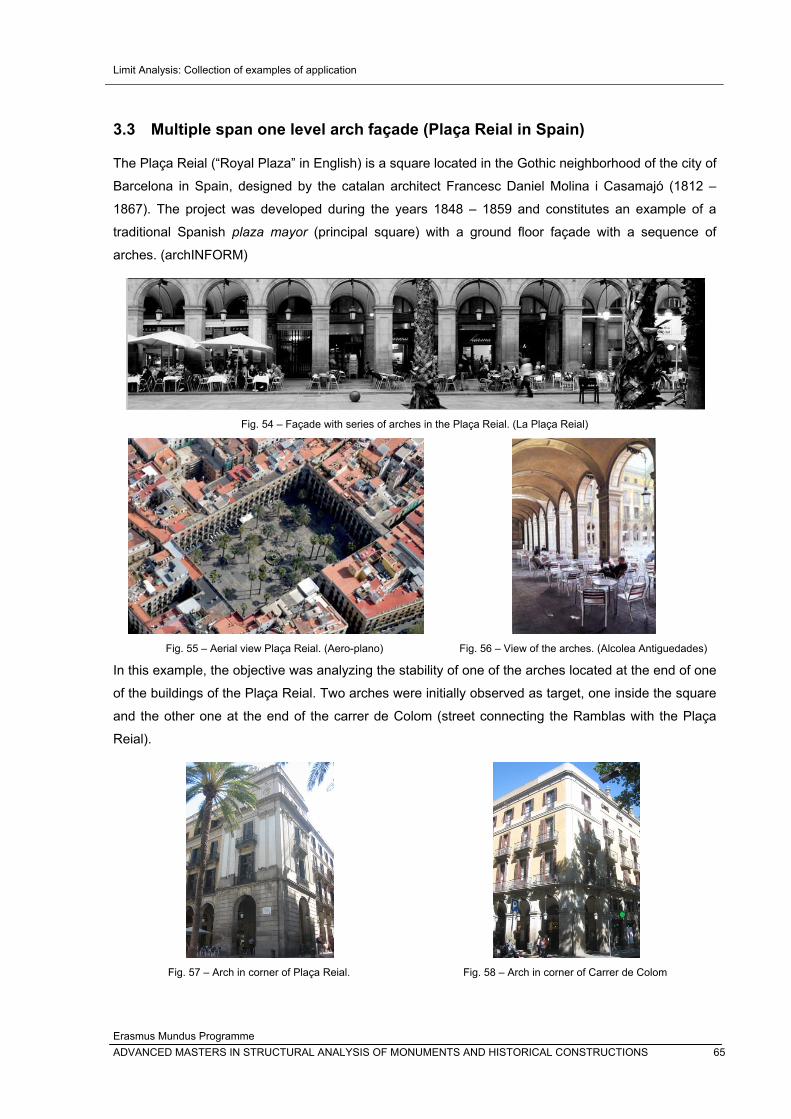
Limit Analysis: Collection of examples of application
Erasmus Mundus Programme ADVANCED MASTERS IN STRUCTURAL ANALYSIS OF MONUMENTS AND HISTORICAL CONSTRUCTIONS 65
3.3 Multiple span one level arch façade (Plaça Reial in Spain)
The Plaça Reial (“Royal Plaza” in English) is a square located in the Gothic neighborhood of the city of
Barcelona in Spain, designed by the catalan architect Francesc Daniel Molina i Casamajó (1812 –
1867). The project was developed during the years 1848 – 1859 and constitutes an example of a
traditional Spanish plaza mayor (principal square) with a ground floor façade with a sequence of
arches. (archINFORM)
Fig. 54 – Façade with series of arches in the Plaça Reial. (La Plaça Reial)
Fig. 55 – Aerial view Plaça Reial. (Aero-plano)
Fig. 56 – View of the arches. (Alcolea Antiguedades)
In this example, the objective was analyzing the stability of one of the arches located at the end of one
of the buildings of the Plaça Reial. Two arches were initially observed as target, one inside the square
and the other one at the end of the carrer de Colom (street connecting the Ramblas with the Plaça
Reial).
Fig. 57 – Arch in corner of Plaça Reial.
Fig. 58 – Arch in corner of Carrer de Colom
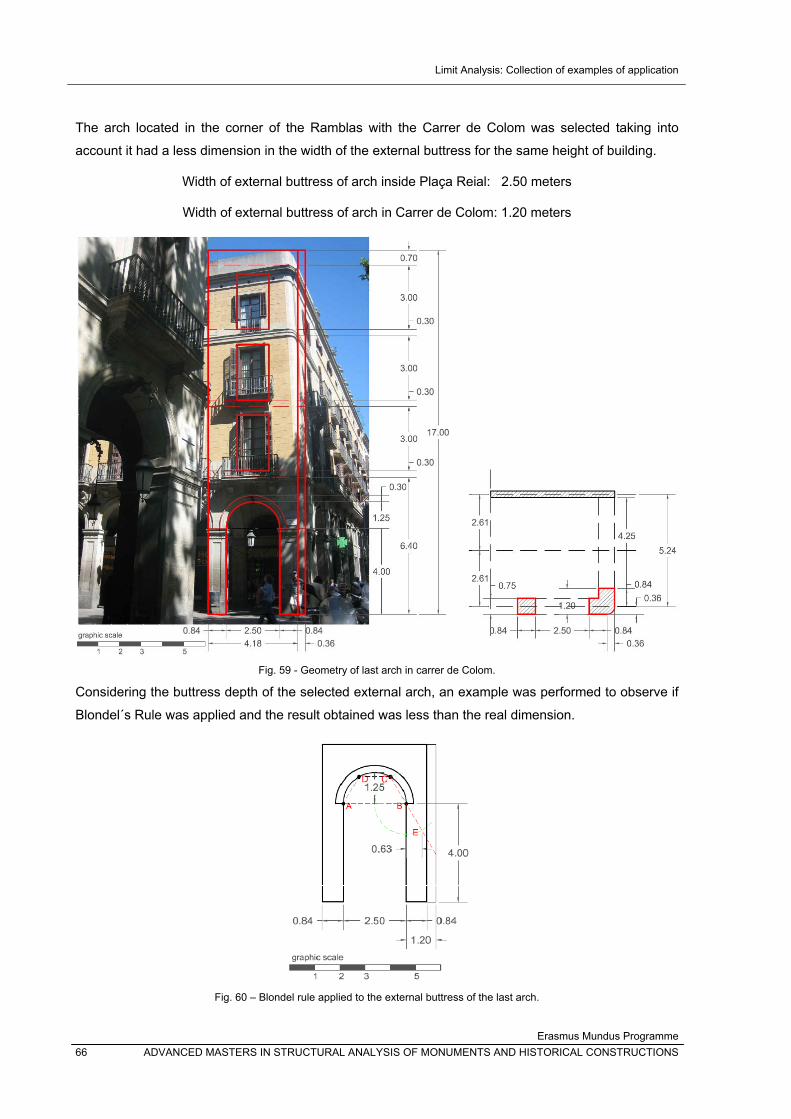
Limit Analysis: Collection of examples of application
Erasmus Mundus Programme 66 ADVANCED MASTERS IN STRUCTURAL ANALYSIS OF MONUMENTS AND HISTORICAL CONSTRUCTIONS
The arch located in the corner of the Ramblas with the Carrer de Colom was selected taking into
account it had a less dimension in the width of the external buttress for the same height of building.
Width of external buttress of arch inside Plaça Reial: 2.50 meters
Width of external buttress of arch in Carrer de Colom: 1.20 meters
Fig. 59 - Geometry of last arch in carrer de Colom.
Considering the buttress depth of the selected external arch, an example was performed to observe if
Blondel´s Rule was applied and the result obtained was less than the real dimension.
Fig. 60 – Blondel rule applied to the external buttress of the last arch.
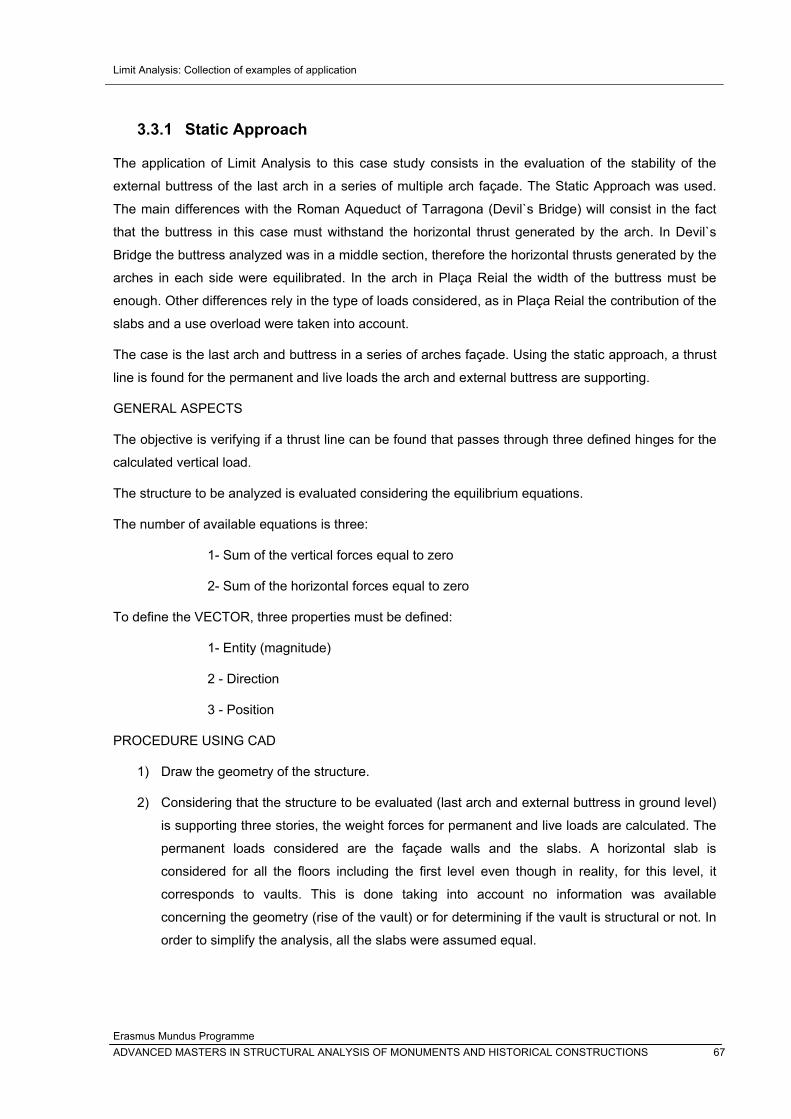
Limit Analysis: Collection of examples of application
Erasmus Mundus Programme ADVANCED MASTERS IN STRUCTURAL ANALYSIS OF MONUMENTS AND HISTORICAL CONSTRUCTIONS 67
3.3.1 Static Approach
The application of Limit Analysis to this case study consists in the evaluation of the stability of the
external buttress of the last arch in a series of multiple arch façade. The Static Approach was used.
The main differences with the Roman Aqueduct of Tarragona (Devil`s Bridge) will consist in the fact
that the buttress in this case must withstand the horizontal thrust generated by the arch. In Devil`s
Bridge the buttress analyzed was in a middle section, therefore the horizontal thrusts generated by the
arches in each side were equilibrated. In the arch in Plaça Reial the width of the buttress must be
enough. Other differences rely in the type of loads considered, as in Plaça Reial the contribution of the
slabs and a use overload were taken into account.
The case is the last arch and buttress in a series of arches façade. Using the static approach, a thrust
line is found for the permanent and live loads the arch and external buttress are supporting.
GENERAL ASPECTS
The objective is verifying if a thrust line can be found that passes through three defined hinges for the
calculated vertical load.
The structure to be analyzed is evaluated considering the equilibrium equations.
The number of available equations is three:
1- Sum of the vertical forces equal to zero
2- Sum of the horizontal forces equal to zero
To define the VECTOR, three properties must be defined:
1- Entity (magnitude)
2 - Direction
3 - Position
PROCEDURE USING CAD
1) Draw the geometry of the structure.
2) Considering that the structure to be evaluated (last arch and external buttress in ground level)
is supporting three stories, the weight forces for permanent and live loads are calculated. The
permanent loads considered are the façade walls and the slabs. A horizontal slab is
considered for all the floors including the first level even though in reality, for this level, it
corresponds to vaults. This is done taking into account no information was available
concerning the geometry (rise of the vault) or for determining if the vault is structural or not. In
order to simplify the analysis, all the slabs were assumed equal.
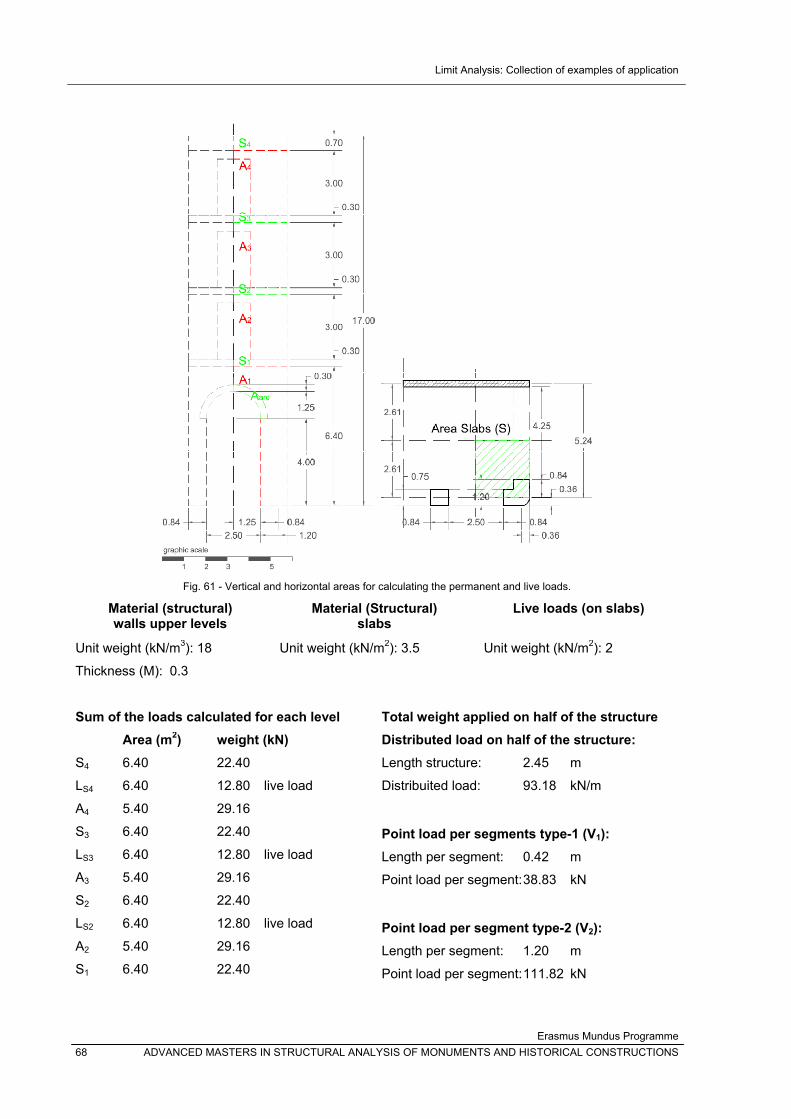
Limit Analysis: Collection of examples of application
Erasmus Mundus Programme 68 ADVANCED MASTERS IN STRUCTURAL ANALYSIS OF MONUMENTS AND HISTORICAL CONSTRUCTIONS
Fig. 61 - Vertical and horizontal areas for calculating the permanent and live loads.
Material (structural) walls upper levels
Material (Structural) slabs
Live loads (on slabs)
Unit weight (kN/m3): 18 Unit weight (kN/m2): 3.5 Unit weight (kN/m2): 2
Thickness (M): 0.3 Sum of the loads calculated for each level Total weight applied on half of the structure Area (m2) weight (kN) S4 6.40 22.40
LS4 6.40 12.80 live load
A4 5.40 29.16
S3 6.40 22.40
LS3 6.40 12.80 live load
A3 5.40 29.16
S2 6.40 22.40
LS2 6.40 12.80 live load
A2 5.40 29.16
S1 6.40 22.40
Distributed load on half of the structure: Length structure: 2.45 m
Distribuited load: 93.18 kN/m
Point load per segments type-1 (V1): Length per segment: 0.42 m
Point load per segment: 38.83 kN
Point load per segment type-2 (V2): Length per segment: 1.20 m
Point load per segment: 111.82 kN
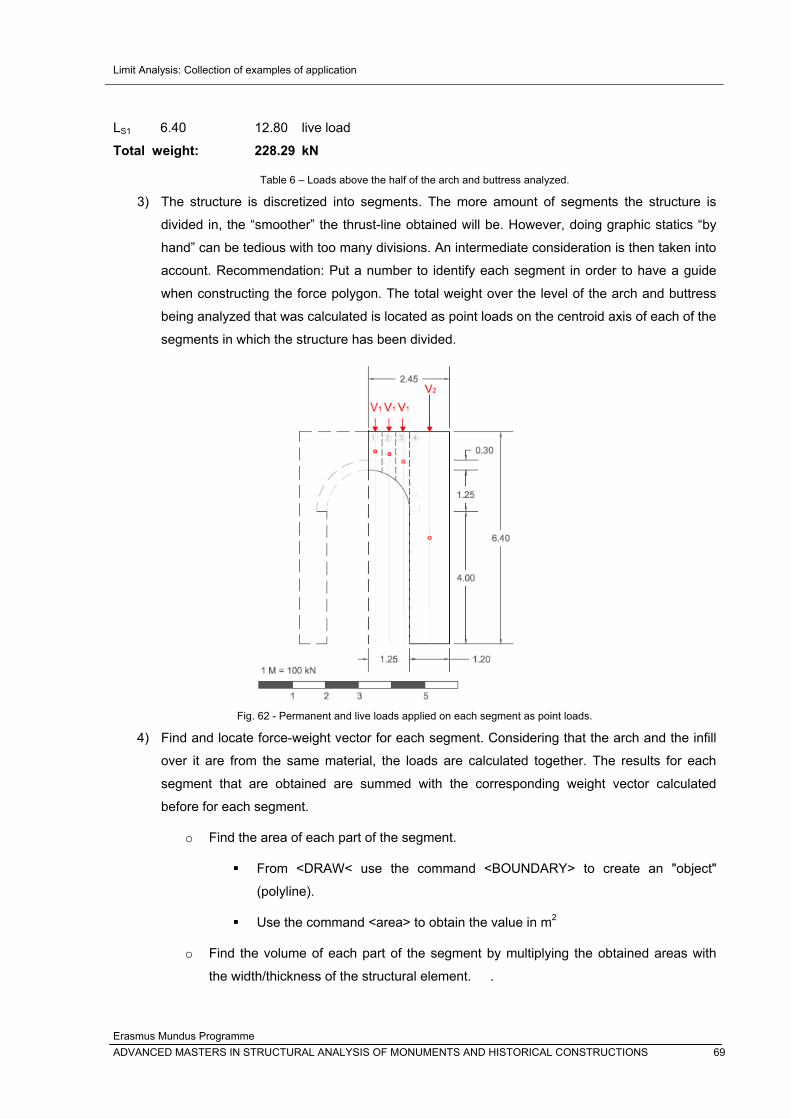
Limit Analysis: Collection of examples of application
Erasmus Mundus Programme ADVANCED MASTERS IN STRUCTURAL ANALYSIS OF MONUMENTS AND HISTORICAL CONSTRUCTIONS 69
LS1 6.40 12.80 live load
Total weight: 228.29 kN
Table 6 – Loads above the half of the arch and buttress analyzed.
3) The structure is discretized into segments. The more amount of segments the structure is
divided in, the “smoother” the thrust-line obtained will be. However, doing graphic statics “by
hand” can be tedious with too many divisions. An intermediate consideration is then taken into
account. Recommendation: Put a number to identify each segment in order to have a guide
when constructing the force polygon. The total weight over the level of the arch and buttress
being analyzed that was calculated is located as point loads on the centroid axis of each of the
segments in which the structure has been divided.
Fig. 62 - Permanent and live loads applied on each segment as point loads.
4) Find and locate force-weight vector for each segment. Considering that the arch and the infill
over it are from the same material, the loads are calculated together. The results for each
segment that are obtained are summed with the corresponding weight vector calculated
before for each segment.
o Find the area of each part of the segment.
From <DRAW< use the command <BOUNDARY> to create an "object"
(polyline).
Use the command <area> to obtain the value in m2
o Find the volume of each part of the segment by multiplying the obtained areas with
the width/thickness of the structural element. .
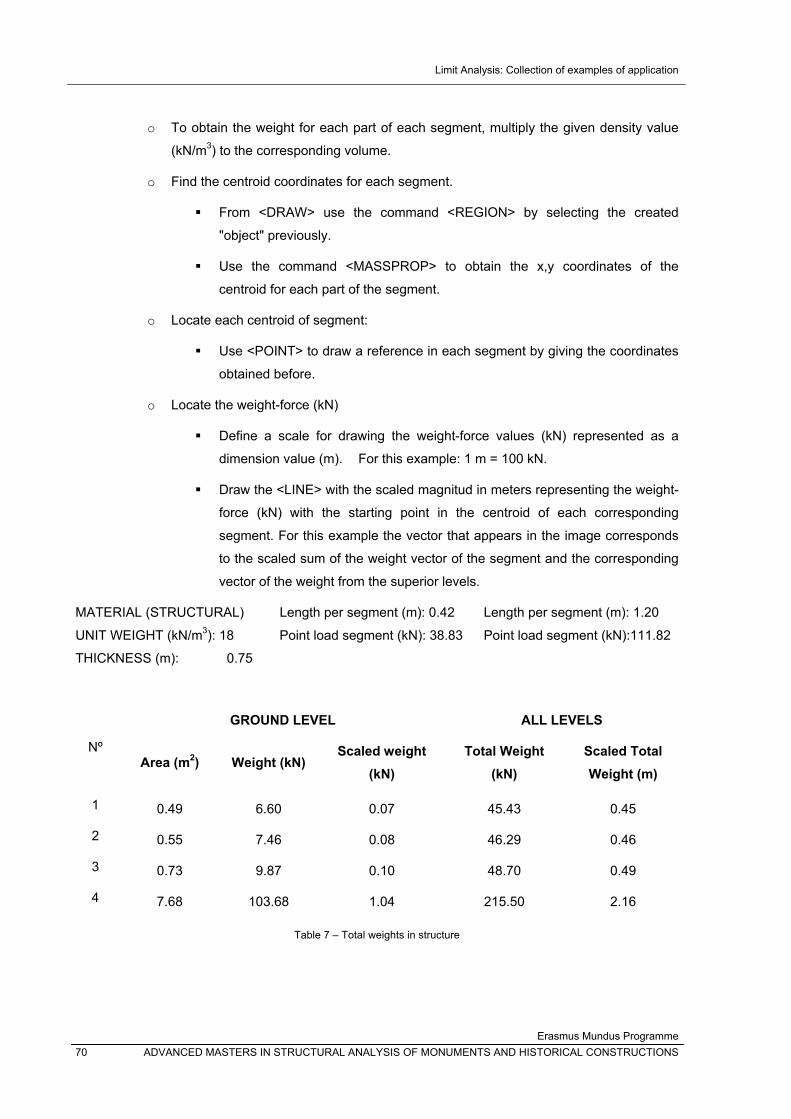
Limit Analysis: Collection of examples of application
Erasmus Mundus Programme 70 ADVANCED MASTERS IN STRUCTURAL ANALYSIS OF MONUMENTS AND HISTORICAL CONSTRUCTIONS
o To obtain the weight for each part of each segment, multiply the given density value
(kN/m3) to the corresponding volume.
o Find the centroid coordinates for each segment.
From <DRAW> use the command <REGION> by selecting the created
"object" previously.
Use the command <MASSPROP> to obtain the x,y coordinates of the
centroid for each part of the segment.
o Locate each centroid of segment:
Use <POINT> to draw a reference in each segment by giving the coordinates
obtained before.
o Locate the weight-force (kN)
Define a scale for drawing the weight-force values (kN) represented as a
dimension value (m). For this example: 1 m = 100 kN.
Draw the <LINE> with the scaled magnitud in meters representing the weight-
force (kN) with the starting point in the centroid of each corresponding
segment. For this example the vector that appears in the image corresponds
to the scaled sum of the weight vector of the segment and the corresponding
vector of the weight from the superior levels.
MATERIAL (STRUCTURAL) Length per segment (m): 0.42 Length per segment (m): 1.20
UNIT WEIGHT (kN/m3): 18 Point load segment (kN): 38.83 Point load segment (kN):111.82
THICKNESS (m): 0.75
Nº
GROUND LEVEL ALL LEVELS
Area (m2) Weight (kN) Scaled weight
(kN) Total Weight
(kN) Scaled Total Weight (m)
1 0.49 6.60 0.07 45.43 0.45
2 0.55 7.46 0.08 46.29 0.46
3 0.73 9.87 0.10 48.70 0.49
4 7.68 103.68 1.04 215.50 2.16
Table 7 – Total weights in structure
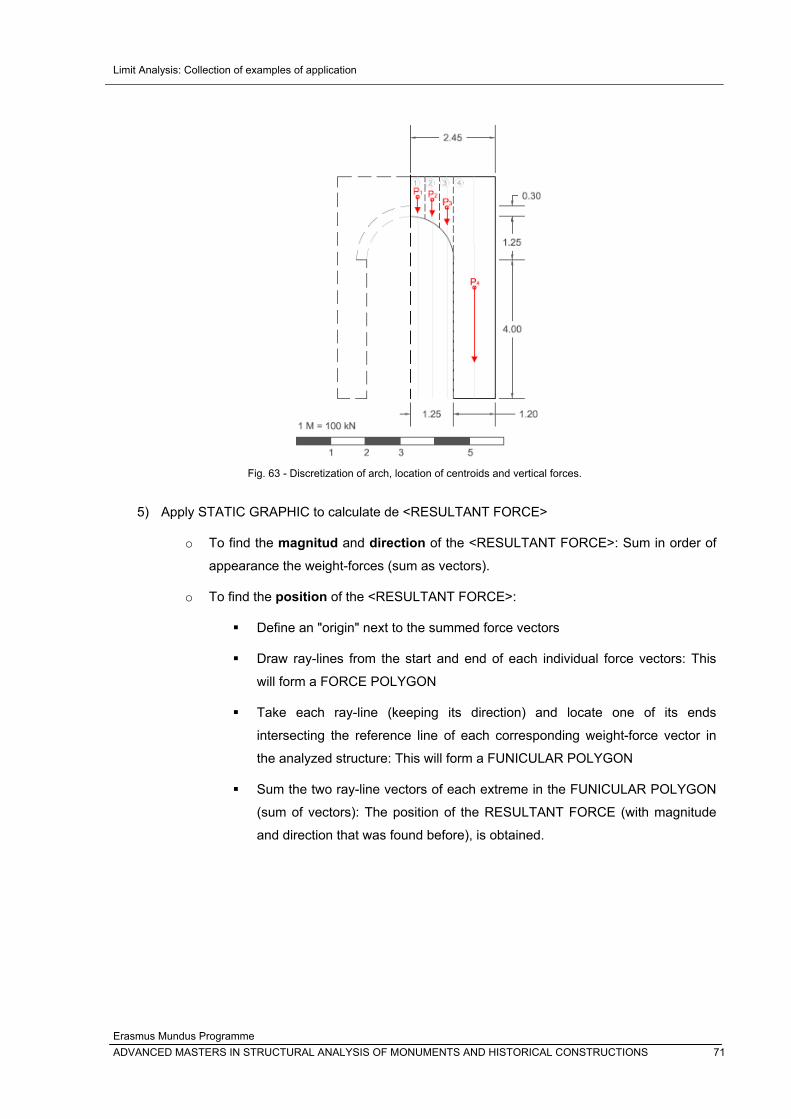
Limit Analysis: Collection of examples of application
Erasmus Mundus Programme ADVANCED MASTERS IN STRUCTURAL ANALYSIS OF MONUMENTS AND HISTORICAL CONSTRUCTIONS 71
Fig. 63 - Discretization of arch, location of centroids and vertical forces.
5) Apply STATIC GRAPHIC to calculate de <RESULTANT FORCE>
o To find the magnitud and direction of the <RESULTANT FORCE>: Sum in order of
appearance the weight-forces (sum as vectors).
o To find the position of the <RESULTANT FORCE>:
Define an "origin" next to the summed force vectors
Draw ray-lines from the start and end of each individual force vectors: This
will form a FORCE POLYGON
Take each ray-line (keeping its direction) and locate one of its ends
intersecting the reference line of each corresponding weight-force vector in
the analyzed structure: This will form a FUNICULAR POLYGON
Sum the two ray-line vectors of each extreme in the FUNICULAR POLYGON
(sum of vectors): The position of the RESULTANT FORCE (with magnitude
and direction that was found before), is obtained.
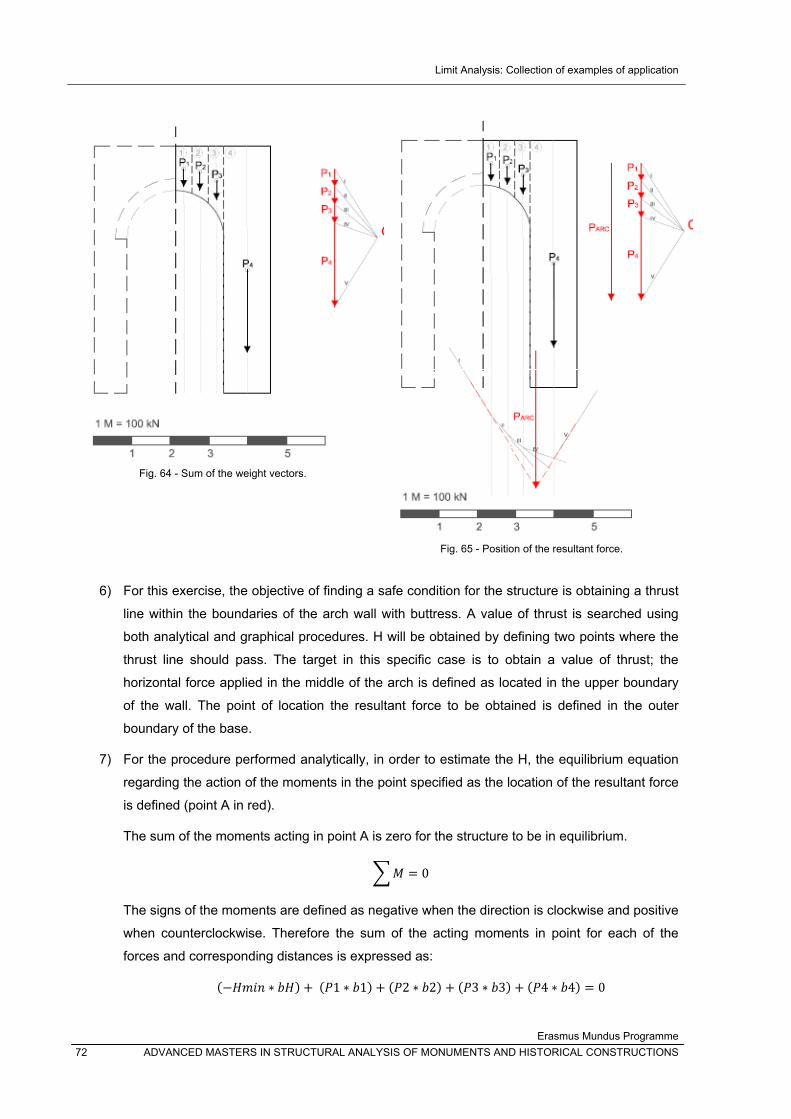
Limit Analysis: Collection of examples of application
Erasmus Mundus Programme 72 ADVANCED MASTERS IN STRUCTURAL ANALYSIS OF MONUMENTS AND HISTORICAL CONSTRUCTIONS
Fig. 64 - Sum of the weight vectors.
Fig. 65 - Position of the resultant force.
6) For this exercise, the objective of finding a safe condition for the structure is obtaining a thrust
line within the boundaries of the arch wall with buttress. A value of thrust is searched using
both analytical and graphical procedures. H will be obtained by defining two points where the
thrust line should pass. The target in this specific case is to obtain a value of thrust; the
horizontal force applied in the middle of the arch is defined as located in the upper boundary
of the wall. The point of location the resultant force to be obtained is defined in the outer
boundary of the base.
7) For the procedure performed analytically, in order to estimate the H, the equilibrium equation
regarding the action of the moments in the point specified as the location of the resultant force
is defined (point A in red).
The sum of the moments acting in point A is zero for the structure to be in equilibrium.
0
The signs of the moments are defined as negative when the direction is clockwise and positive
when counterclockwise. Therefore the sum of the acting moments in point for each of the
forces and corresponding distances is expressed as:
1 1 2 2 3 3 4 4 0
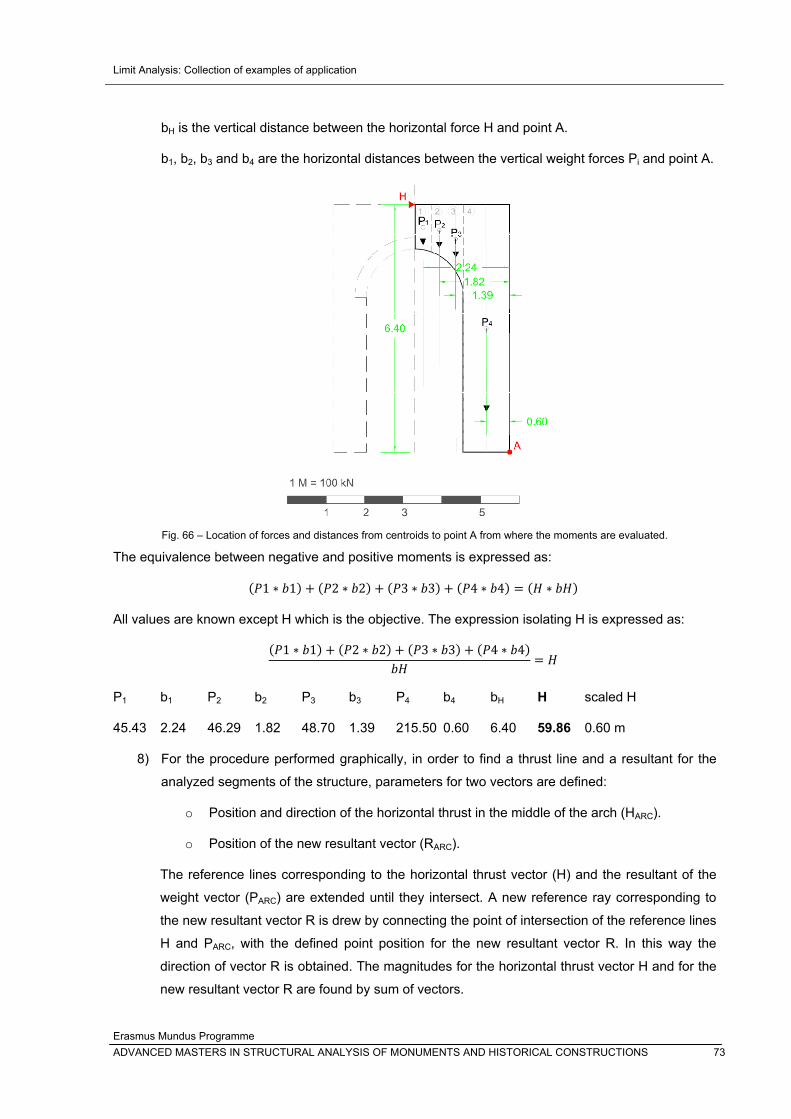
Limit Analysis: Collection of examples of application
Erasmus Mundus Programme ADVANCED MASTERS IN STRUCTURAL ANALYSIS OF MONUMENTS AND HISTORICAL CONSTRUCTIONS 73
bH is the vertical distance between the horizontal force H and point A.
b1, b2, b3 and b4 are the horizontal distances between the vertical weight forces Pi and point A.
Fig. 66 – Location of forces and distances from centroids to point A from where the moments are evaluated.
The equivalence between negative and positive moments is expressed as:
1 1 2 2 3 3 4 4
All values are known except H which is the objective. The expression isolating H is expressed as:
1 1 2 2 3 3 4 4
P1 b1 P2 b2 P3 b3 P4 b4 bH H scaled H
45.43 2.24 46.29 1.82 48.70 1.39 215.50 0.60 6.40 59.86 0.60 m
8) For the procedure performed graphically, in order to find a thrust line and a resultant for the
analyzed segments of the structure, parameters for two vectors are defined:
o Position and direction of the horizontal thrust in the middle of the arch (HARC).
o Position of the new resultant vector (RARC).
The reference lines corresponding to the horizontal thrust vector (H) and the resultant of the
weight vector (PARC) are extended until they intersect. A new reference ray corresponding to
the new resultant vector R is drew by connecting the point of intersection of the reference lines
H and PARC, with the defined point position for the new resultant vector R. In this way the
direction of vector R is obtained. The magnitudes for the horizontal thrust vector H and for the
new resultant vector R are found by sum of vectors.
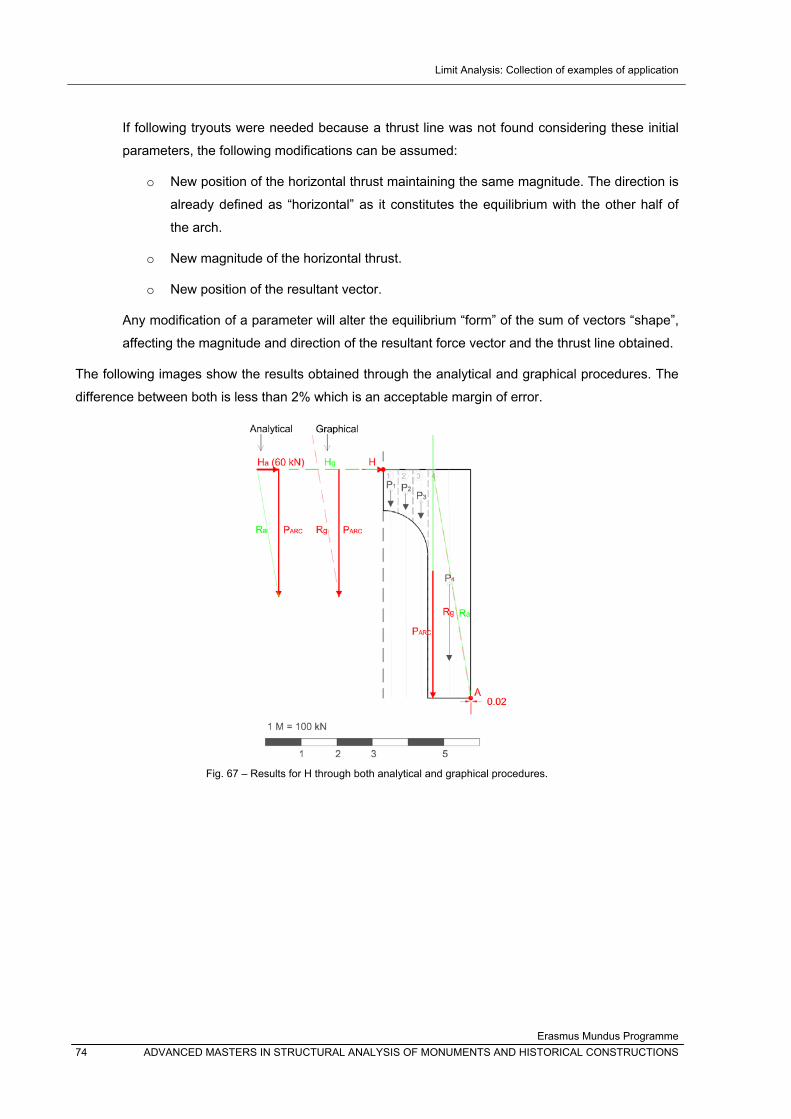
Limit Analysis: Collection of examples of application
Erasmus Mundus Programme 74 ADVANCED MASTERS IN STRUCTURAL ANALYSIS OF MONUMENTS AND HISTORICAL CONSTRUCTIONS
If following tryouts were needed because a thrust line was not found considering these initial
parameters, the following modifications can be assumed:
o New position of the horizontal thrust maintaining the same magnitude. The direction is
already defined as “horizontal” as it constitutes the equilibrium with the other half of
the arch.
o New magnitude of the horizontal thrust.
o New position of the resultant vector.
Any modification of a parameter will alter the equilibrium “form” of the sum of vectors “shape”,
affecting the magnitude and direction of the resultant force vector and the thrust line obtained.
The following images show the results obtained through the analytical and graphical procedures. The
difference between both is less than 2% which is an acceptable margin of error.
Fig. 67 – Results for H through both analytical and graphical procedures.
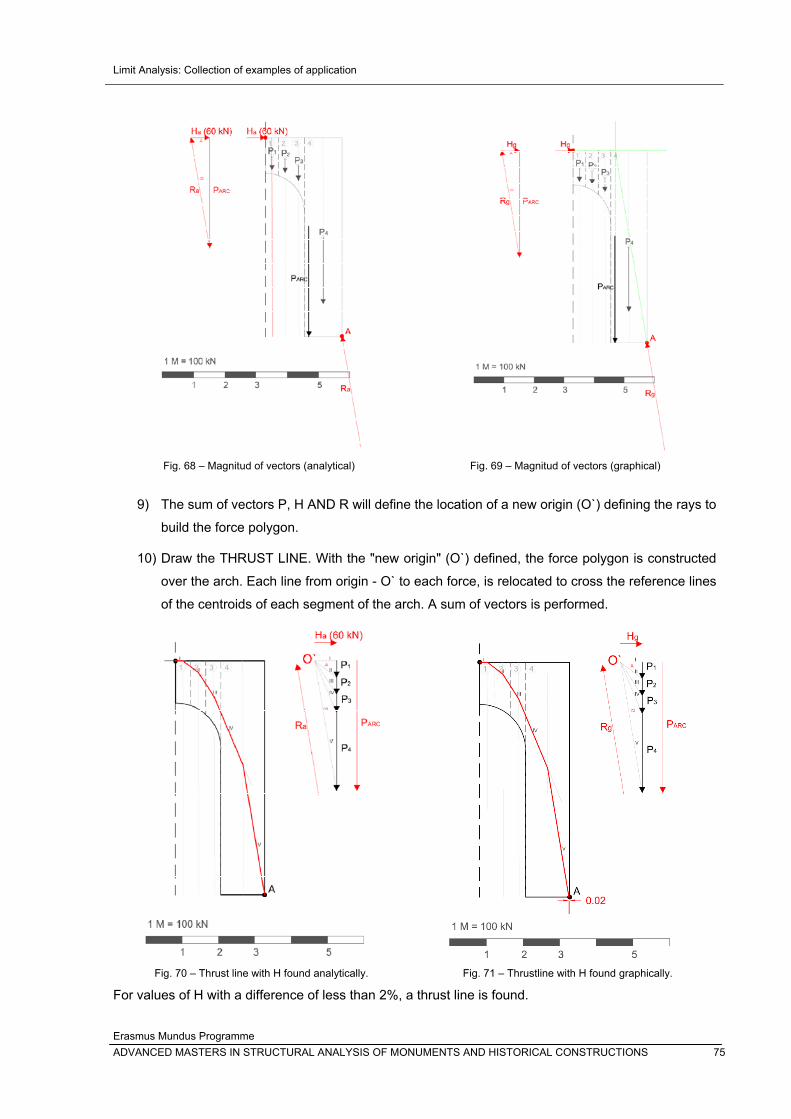
Limit Analysis: Collection of examples of application
Erasmus Mundus Programme ADVANCED MASTERS IN STRUCTURAL ANALYSIS OF MONUMENTS AND HISTORICAL CONSTRUCTIONS 75
Fig. 68 – Magnitud of vectors (analytical)
Fig. 69 – Magnitud of vectors (graphical)
9) The sum of vectors P, H AND R will define the location of a new origin (O`) defining the rays to
build the force polygon.
10) Draw the THRUST LINE. With the "new origin" (O`) defined, the force polygon is constructed
over the arch. Each line from origin - O` to each force, is relocated to cross the reference lines
of the centroids of each segment of the arch. A sum of vectors is performed.
Fig. 70 – Thrust line with H found analytically.
Fig. 71 – Thrustline with H found graphically.
For values of H with a difference of less than 2%, a thrust line is found.

Limit Analysis: Collection of examples of application
Erasmus Mundus Programme 76 ADVANCED MASTERS IN STRUCTURAL ANALYSIS OF MONUMENTS AND HISTORICAL CONSTRUCTIONS
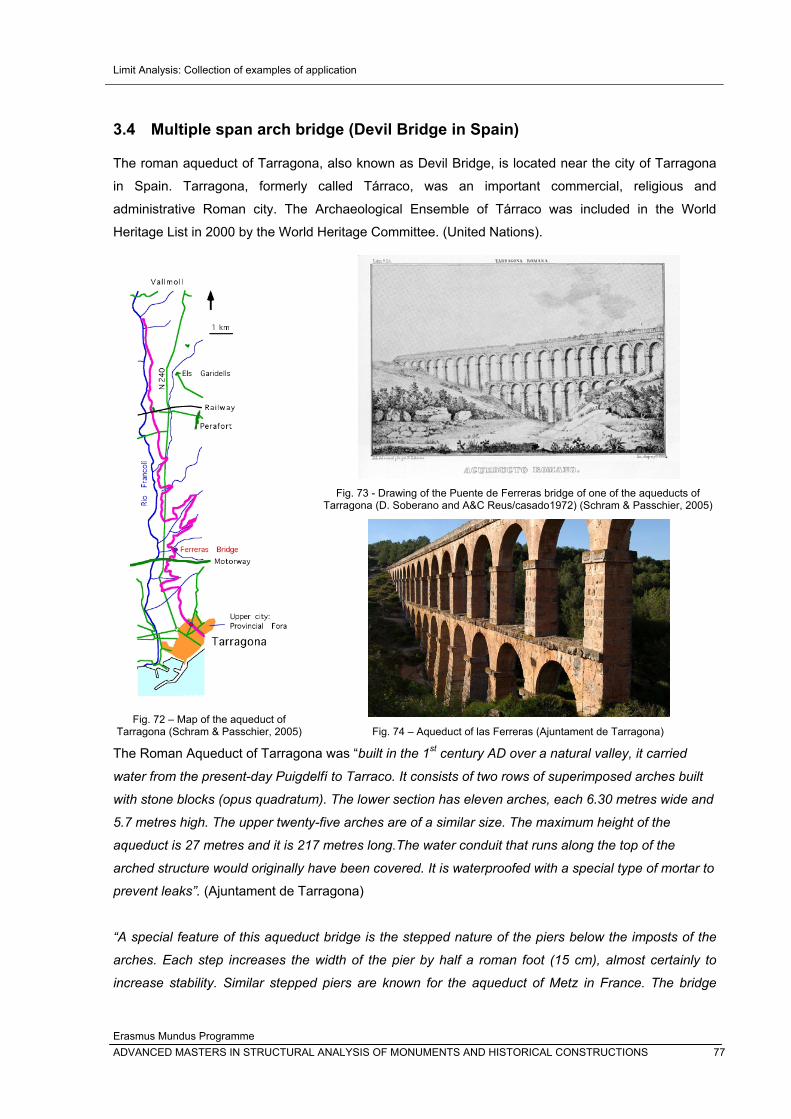
Limit Analysis: Collection of examples of application
Erasmus Mundus Programme ADVANCED MASTERS IN STRUCTURAL ANALYSIS OF MONUMENTS AND HISTORICAL CONSTRUCTIONS 77
3.4 Multiple span arch bridge (Devil Bridge in Spain)
The roman aqueduct of Tarragona, also known as Devil Bridge, is located near the city of Tarragona
in Spain. Tarragona, formerly called Tárraco, was an important commercial, religious and
administrative Roman city. The Archaeological Ensemble of Tárraco was included in the World
Heritage List in 2000 by the World Heritage Committee. (United Nations).
Fig. 72 – Map of the aqueduct of Tarragona (Schram & Passchier, 2005)
Fig. 73 - Drawing of the Puente de Ferreras bridge of one of the aqueducts of
Tarragona (D. Soberano and A&C Reus/casado1972) (Schram & Passchier, 2005)
Fig. 74 – Aqueduct of las Ferreras (Ajuntament de Tarragona)
The Roman Aqueduct of Tarragona was “built in the 1st century AD over a natural valley, it carried
water from the present-day Puigdelfí to Tarraco. It consists of two rows of superimposed arches built
with stone blocks (opus quadratum). The lower section has eleven arches, each 6.30 metres wide and
5.7 metres high. The upper twenty-five arches are of a similar size. The maximum height of the
aqueduct is 27 metres and it is 217 metres long.The water conduit that runs along the top of the
arched structure would originally have been covered. It is waterproofed with a special type of mortar to
prevent leaks”. (Ajuntament de Tarragona)
“A special feature of this aqueduct bridge is the stepped nature of the piers below the imposts of the
arches. Each step increases the width of the pier by half a roman foot (15 cm), almost certainly to
increase stability. Similar stepped piers are known for the aqueduct of Metz in France. The bridge
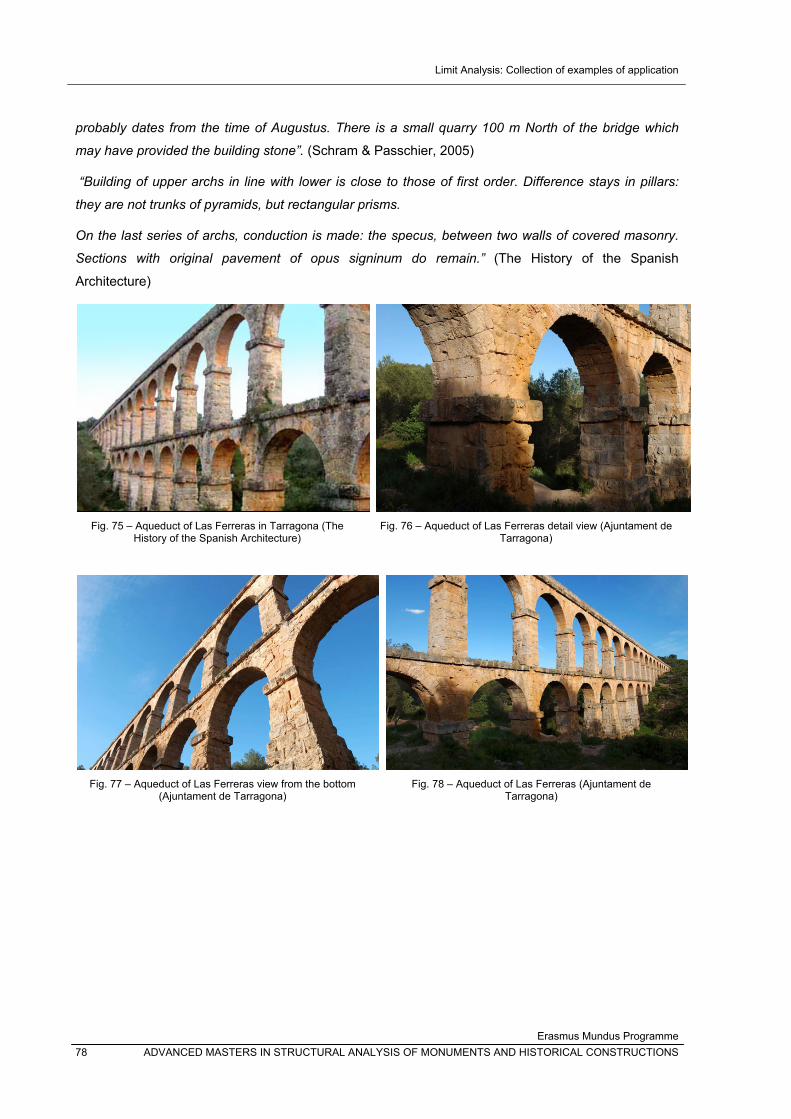
Limit Analysis: Collection of examples of application
Erasmus Mundus Programme 78 ADVANCED MASTERS IN STRUCTURAL ANALYSIS OF MONUMENTS AND HISTORICAL CONSTRUCTIONS
probably dates from the time of Augustus. There is a small quarry 100 m North of the bridge which
may have provided the building stone”. (Schram & Passchier, 2005)
“Building of upper archs in line with lower is close to those of first order. Difference stays in pillars:
they are not trunks of pyramids, but rectangular prisms.
On the last series of archs, conduction is made: the specus, between two walls of covered masonry.
Sections with original pavement of opus signinum do remain.” (The History of the Spanish
Architecture)
Fig. 75 – Aqueduct of Las Ferreras in Tarragona (The History of the Spanish Architecture)
Fig. 76 – Aqueduct of Las Ferreras detail view (Ajuntament de Tarragona)
Fig. 77 – Aqueduct of Las Ferreras view from the bottom (Ajuntament de Tarragona)
Fig. 78 – Aqueduct of Las Ferreras (Ajuntament de Tarragona)
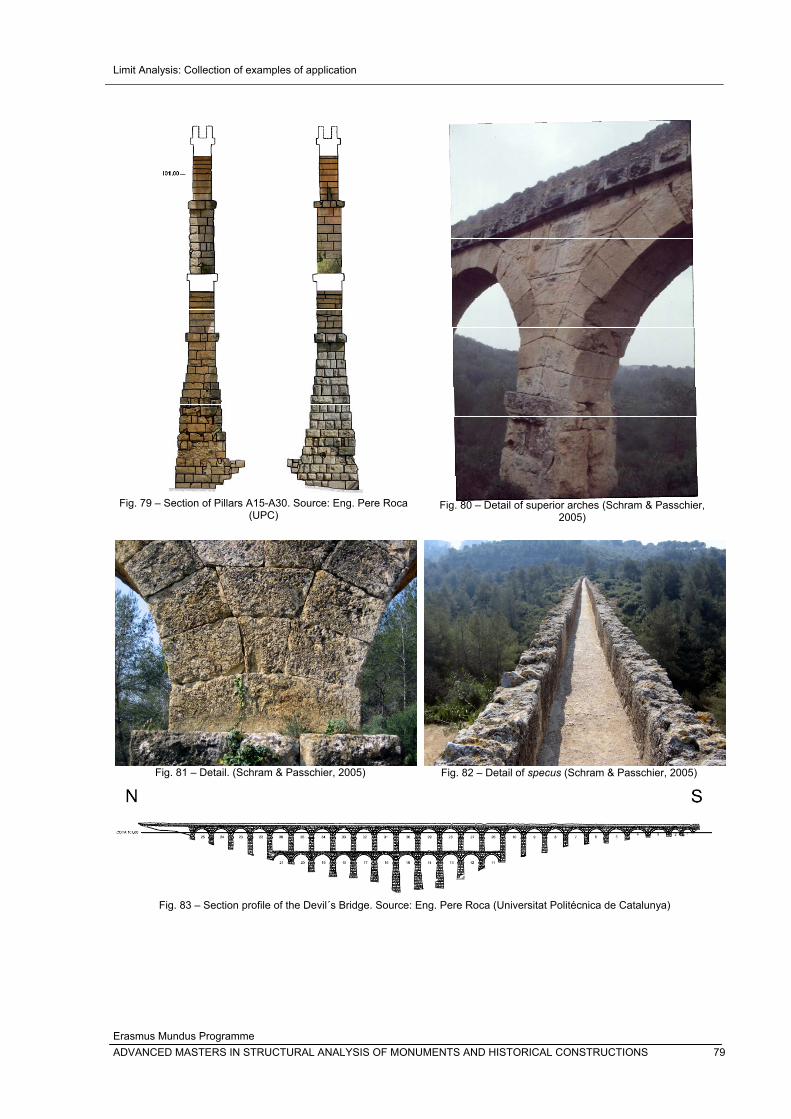
Limit Analysis: Collection of examples of application
Erasmus Mundus Programme ADVANCED MASTERS IN STRUCTURAL ANALYSIS OF MONUMENTS AND HISTORICAL CONSTRUCTIONS 79
Fig. 79 – Section of Pillars A15-A30. Source: Eng. Pere Roca
(UPC)
Fig. 80 – Detail of superior arches (Schram & Passchier, 2005)
Fig. 81 – Detail. (Schram & Passchier, 2005) Fig. 82 – Detail of specus (Schram & Passchier, 2005)
Fig. 83 – Section profile of the Devil´s Bridge. Source: Eng. Pere Roca (Universitat Politécnica de Catalunya)
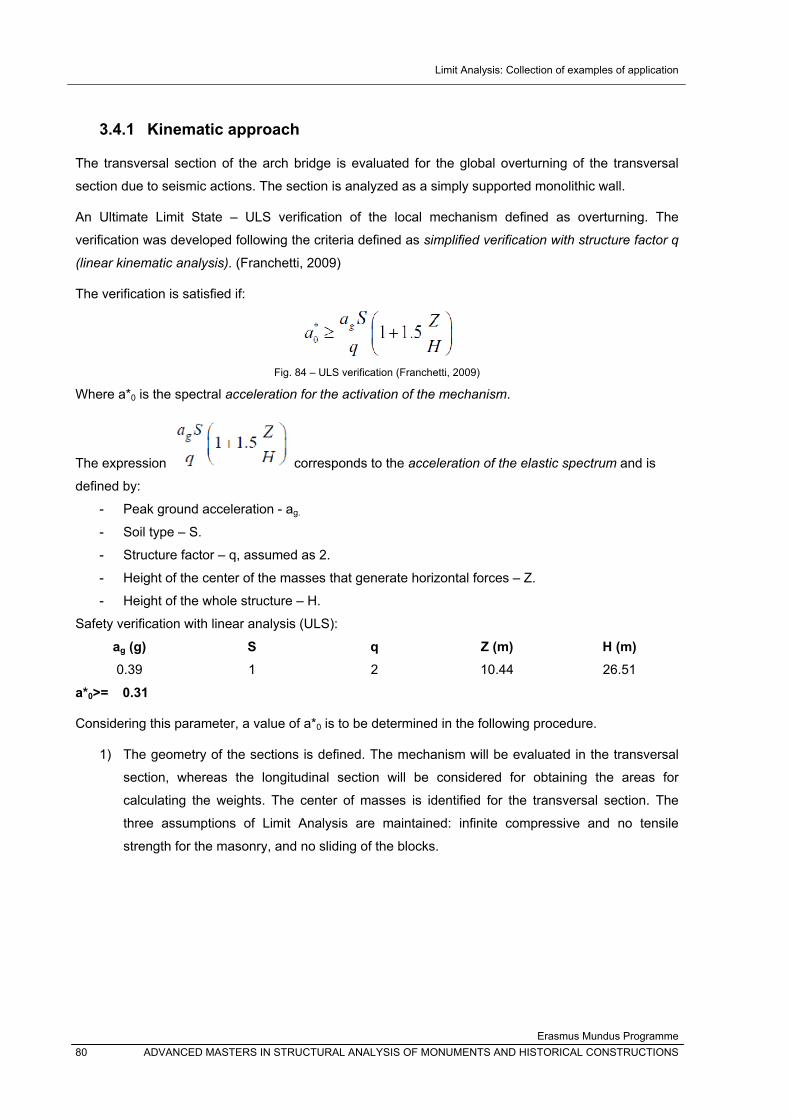
Limit Analysis: Collection of examples of application
Erasmus Mundus Programme 80 ADVANCED MASTERS IN STRUCTURAL ANALYSIS OF MONUMENTS AND HISTORICAL CONSTRUCTIONS
3.4.1 Kinematic approach
The transversal section of the arch bridge is evaluated for the global overturning of the transversal
section due to seismic actions. The section is analyzed as a simply supported monolithic wall.
An Ultimate Limit State – ULS verification of the local mechanism defined as overturning. The
verification was developed following the criteria defined as simplified verification with structure factor q
(linear kinematic analysis). (Franchetti, 2009)
The verification is satisfied if:
Fig. 84 – ULS verification (Franchetti, 2009)
Where a*0 is the spectral acceleration for the activation of the mechanism.
The expression corresponds to the acceleration of the elastic spectrum and is
defined by:
- Peak ground acceleration - ag.
- Soil type – S.
- Structure factor – q, assumed as 2.
- Height of the center of the masses that generate horizontal forces – Z.
- Height of the whole structure – H.
Safety verification with linear analysis (ULS):
ag (g) S q Z (m) H (m) 0.39 1 2 10.44 26.51
a*0>= 0.31
Considering this parameter, a value of a*0 is to be determined in the following procedure.
1) The geometry of the sections is defined. The mechanism will be evaluated in the transversal
section, whereas the longitudinal section will be considered for obtaining the areas for
calculating the weights. The center of masses is identified for the transversal section. The
three assumptions of Limit Analysis are maintained: infinite compressive and no tensile
strength for the masonry, and no sliding of the blocks.
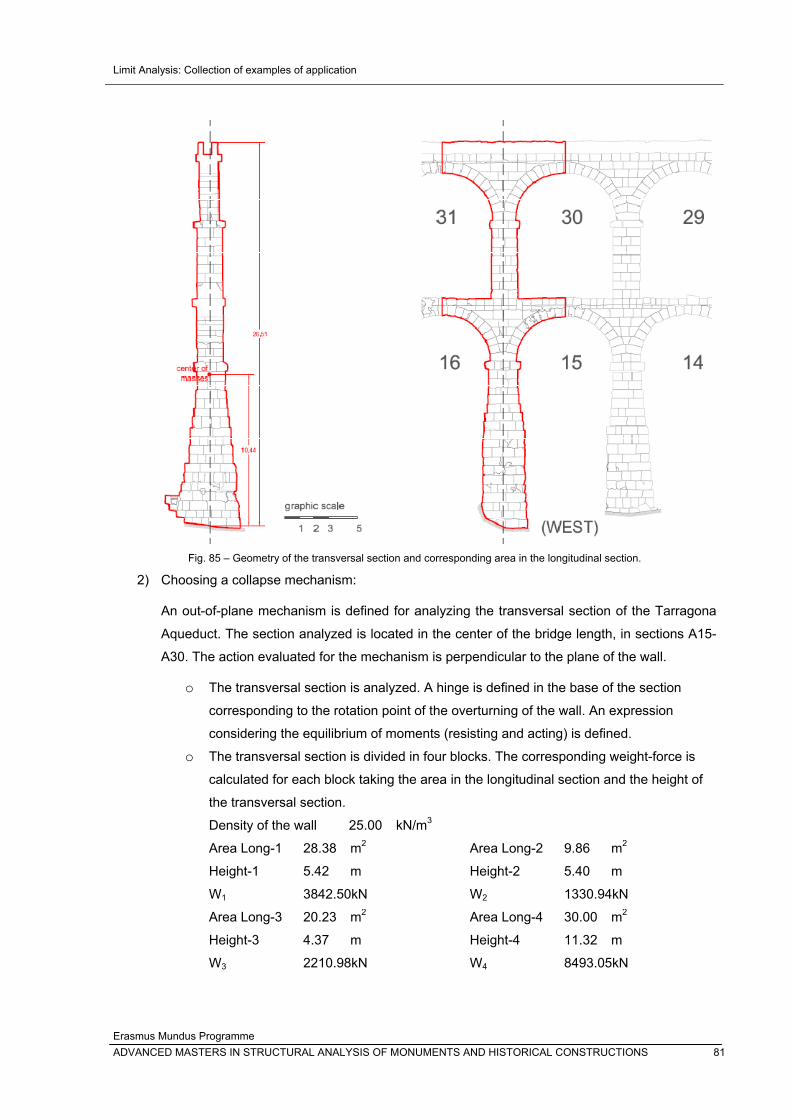
Limit Analysis: Collection of examples of application
Erasmus Mundus Programme ADVANCED MASTERS IN STRUCTURAL ANALYSIS OF MONUMENTS AND HISTORICAL CONSTRUCTIONS 81
Fig. 85 – Geometry of the transversal section and corresponding area in the longitudinal section.
2) Choosing a collapse mechanism:
An out-of-plane mechanism is defined for analyzing the transversal section of the Tarragona
Aqueduct. The section analyzed is located in the center of the bridge length, in sections A15-
A30. The action evaluated for the mechanism is perpendicular to the plane of the wall.
o The transversal section is analyzed. A hinge is defined in the base of the section
corresponding to the rotation point of the overturning of the wall. An expression
considering the equilibrium of moments (resisting and acting) is defined. o The transversal section is divided in four blocks. The corresponding weight-force is
calculated for each block taking the area in the longitudinal section and the height of
the transversal section. Density of the wall 25.00 kN/m3
Area Long-1 28.38 m2
Height-1 5.42 m
W1 3842.50kN
Area Long-2 9.86 m2
Height-2 5.40 m
W2 1330.94kN
Area Long-3 20.23 m2
Height-3 4.37 m
W3 2210.98kN
Area Long-4 30.00 m2
Height-4 11.32 m
W4 8493.05kN
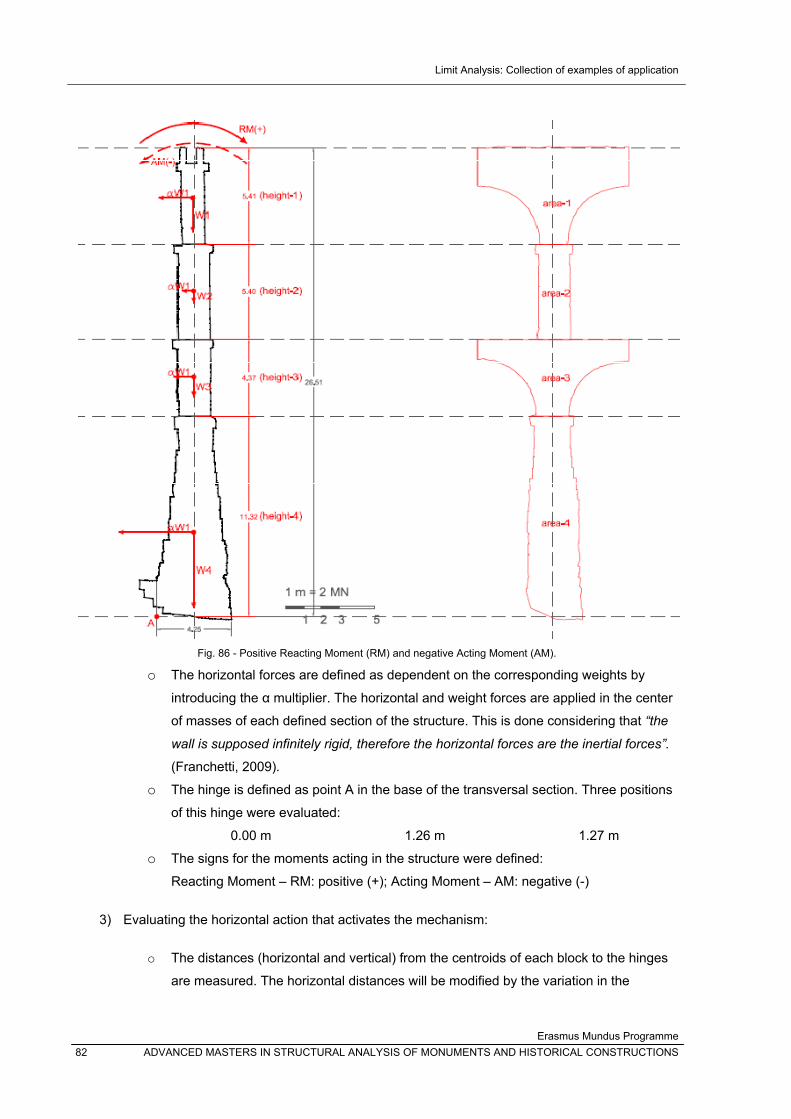
Limit Analysis: Collection of examples of application
Erasmus Mundus Programme 82 ADVANCED MASTERS IN STRUCTURAL ANALYSIS OF MONUMENTS AND HISTORICAL CONSTRUCTIONS
Fig. 86 - Positive Reacting Moment (RM) and negative Acting Moment (AM).
o The horizontal forces are defined as dependent on the corresponding weights by
introducing the α multiplier. The horizontal and weight forces are applied in the center
of masses of each defined section of the structure. This is done considering that “the
wall is supposed infinitely rigid, therefore the horizontal forces are the inertial forces”.
(Franchetti, 2009). o The hinge is defined as point A in the base of the transversal section. Three positions
of this hinge were evaluated: 0.00 m 1.26 m 1.27 m
o The signs for the moments acting in the structure were defined: Reacting Moment – RM: positive (+); Acting Moment – AM: negative (-)
3) Evaluating the horizontal action that activates the mechanism:
o The distances (horizontal and vertical) from the centroids of each block to the hinges
are measured. The horizontal distances will be modified by the variation in the
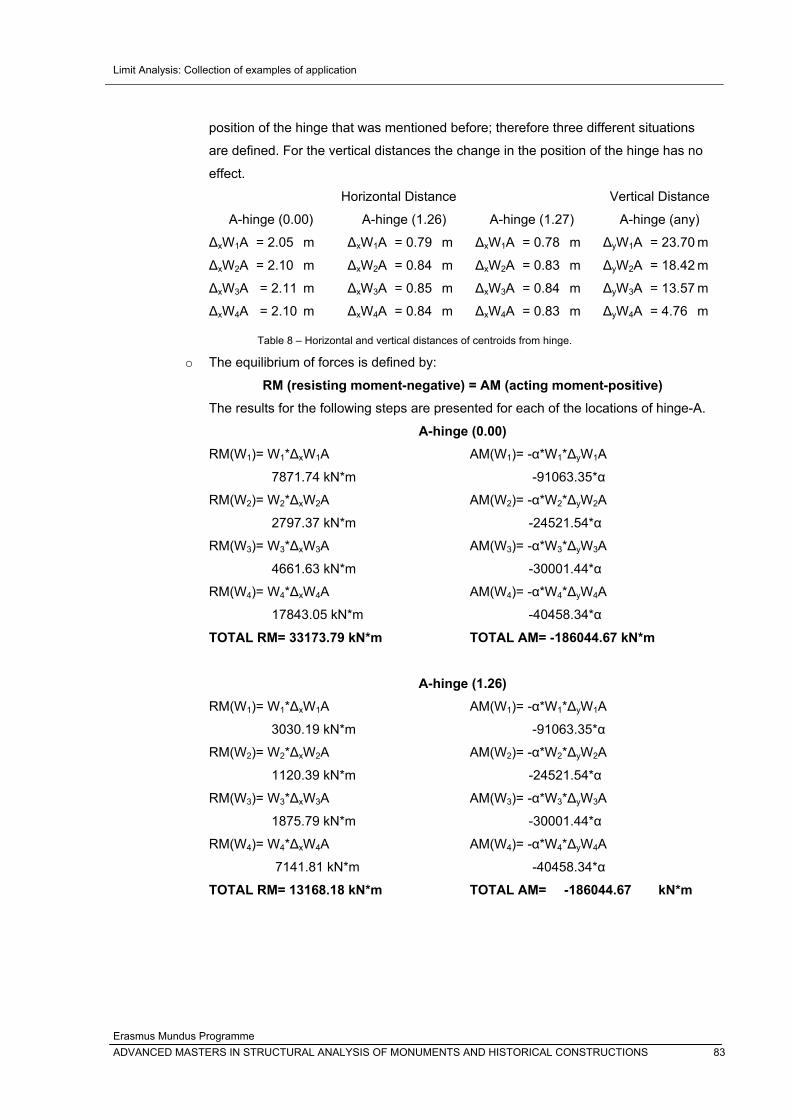
Limit Analysis: Collection of examples of application
Erasmus Mundus Programme ADVANCED MASTERS IN STRUCTURAL ANALYSIS OF MONUMENTS AND HISTORICAL CONSTRUCTIONS 83
position of the hinge that was mentioned before; therefore three different situations
are defined. For the vertical distances the change in the position of the hinge has no
effect.
Horizontal Distance Vertical Distance
A-hinge (0.00) A-hinge (1.26) A-hinge (1.27) A-hinge (any)
ΔxW1A = 2.05 m
ΔxW2A = 2.10 m
ΔxW3A = 2.11 m
ΔxW4A = 2.10 m
ΔxW1A = 0.79 m
ΔxW2A = 0.84 m
ΔxW3A = 0.85 m
ΔxW4A = 0.84 m
ΔxW1A = 0.78 m
ΔxW2A = 0.83 m
ΔxW3A = 0.84 m
ΔxW4A = 0.83 m
ΔyW1A = 23.70 m
ΔyW2A = 18.42 m
ΔyW3A = 13.57 m
ΔyW4A = 4.76 m
Table 8 – Horizontal and vertical distances of centroids from hinge.
o The equilibrium of forces is defined by:
RM (resisting moment-negative) = AM (acting moment-positive) The results for the following steps are presented for each of the locations of hinge-A.
A-hinge (0.00) RM(W1)= W1*ΔxW1A
7871.74 kN*m
RM(W2)= W2*ΔxW2A
2797.37 kN*m
RM(W3)= W3*ΔxW3A
4661.63 kN*m
RM(W4)= W4*ΔxW4A
17843.05 kN*m
TOTAL RM= 33173.79 kN*m
AM(W1)= -α*W1*ΔyW1A
-91063.35*α
AM(W2)= -α*W2*ΔyW2A
-24521.54*α
AM(W3)= -α*W3*ΔyW3A
-30001.44*α
AM(W4)= -α*W4*ΔyW4A
-40458.34*α
TOTAL AM= -186044.67 kN*m
A-hinge (1.26) RM(W1)= W1*ΔxW1A
3030.19 kN*m
RM(W2)= W2*ΔxW2A
1120.39 kN*m
RM(W3)= W3*ΔxW3A
1875.79 kN*m
RM(W4)= W4*ΔxW4A
7141.81 kN*m
TOTAL RM= 13168.18 kN*m
AM(W1)= -α*W1*ΔyW1A
-91063.35*α
AM(W2)= -α*W2*ΔyW2A
-24521.54*α
AM(W3)= -α*W3*ΔyW3A
-30001.44*α
AM(W4)= -α*W4*ΔyW4A
-40458.34*α
TOTAL AM= -186044.67 kN*m
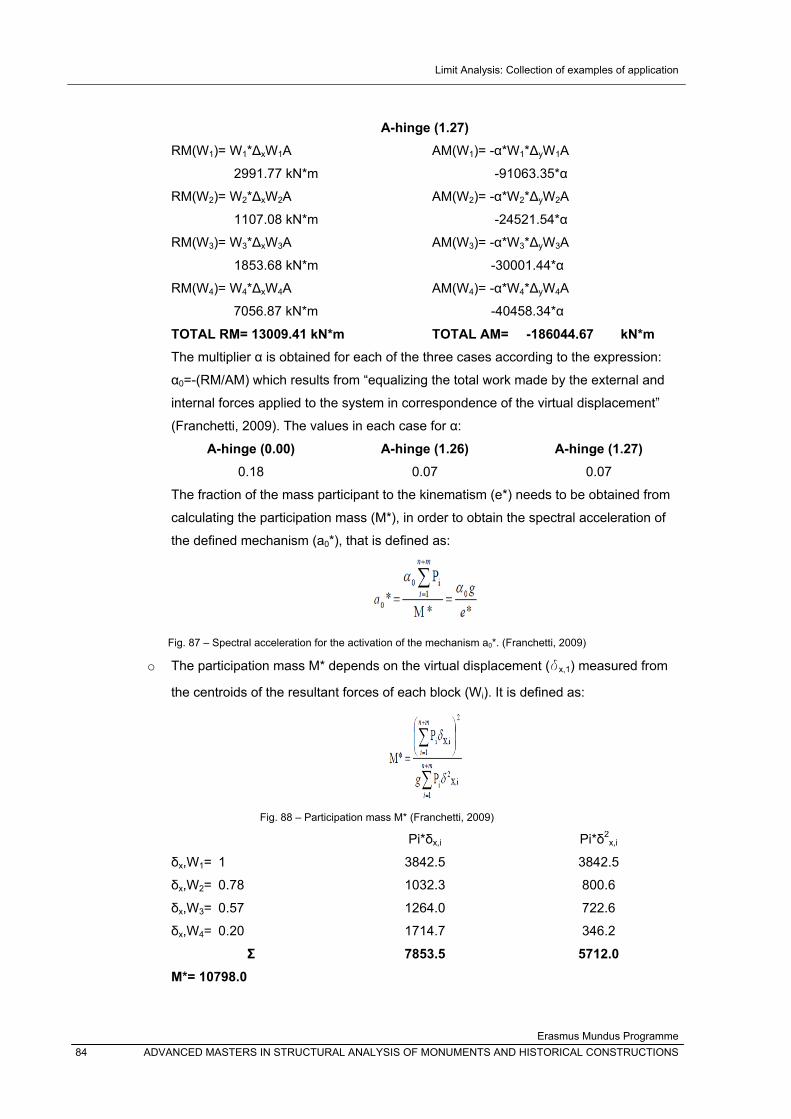
Limit Analysis: Collection of examples of application
Erasmus Mundus Programme 84 ADVANCED MASTERS IN STRUCTURAL ANALYSIS OF MONUMENTS AND HISTORICAL CONSTRUCTIONS
A-hinge (1.27) RM(W1)= W1*ΔxW1A
2991.77 kN*m
RM(W2)= W2*ΔxW2A
1107.08 kN*m
RM(W3)= W3*ΔxW3A
1853.68 kN*m
RM(W4)= W4*ΔxW4A
7056.87 kN*m
TOTAL RM= 13009.41 kN*m
AM(W1)= -α*W1*ΔyW1A
-91063.35*α
AM(W2)= -α*W2*ΔyW2A
-24521.54*α
AM(W3)= -α*W3*ΔyW3A
-30001.44*α
AM(W4)= -α*W4*ΔyW4A
-40458.34*α
TOTAL AM= -186044.67 kN*m The multiplier α is obtained for each of the three cases according to the expression:
α0=-(RM/AM) which results from “equalizing the total work made by the external and
internal forces applied to the system in correspondence of the virtual displacement”
(Franchetti, 2009). The values in each case for α:
A-hinge (0.00) A-hinge (1.26) A-hinge (1.27) 0.18 0.07 0.07
The fraction of the mass participant to the kinematism (e*) needs to be obtained from
calculating the participation mass (M*), in order to obtain the spectral acceleration of
the defined mechanism (a0*), that is defined as:
Fig. 87 – Spectral acceleration for the activation of the mechanism a0*. (Franchetti, 2009)
o The participation mass M* depends on the virtual displacement (δx,1) measured from
the centroids of the resultant forces of each block (Wi). It is defined as:
Fig. 88 – Participation mass M* (Franchetti, 2009)
Pi*δx,i Pi*δ2x,i
δx,W1= 1
δx,W2= 0.78
δx,W3= 0.57
δx,W4= 0.20
3842.5
1032.3
1264.0
1714.7
3842.5
800.6
722.6
346.2
Σ 7853.5 5712.0 M*= 10798.0
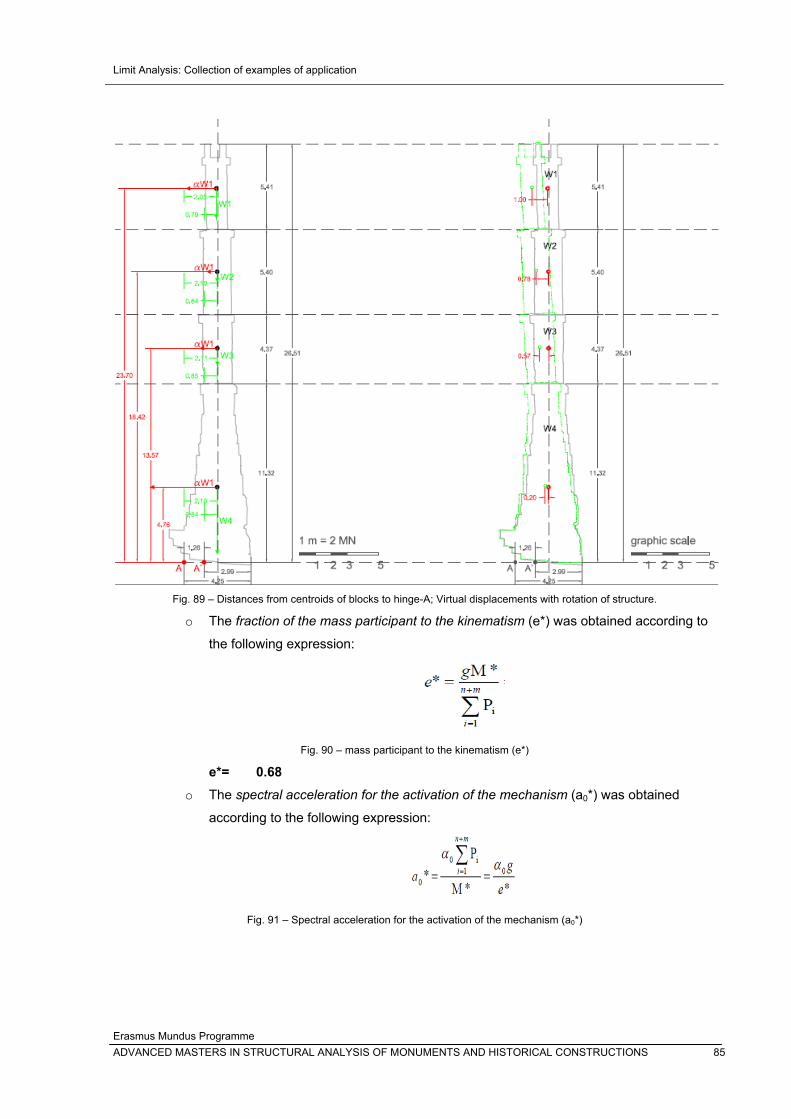
Limit Analysis: Collection of examples of application
Erasmus Mundus Programme ADVANCED MASTERS IN STRUCTURAL ANALYSIS OF MONUMENTS AND HISTORICAL CONSTRUCTIONS 85
Fig. 89 – Distances from centroids of blocks to hinge-A; Virtual displacements with rotation of structure.
o The fraction of the mass participant to the kinematism (e*) was obtained according to
the following expression:
Fig. 90 – mass participant to the kinematism (e*)
e*= 0.68 o The spectral acceleration for the activation of the mechanism (a0*) was obtained
according to the following expression:
Fig. 91 – Spectral acceleration for the activation of the mechanism (a0*)
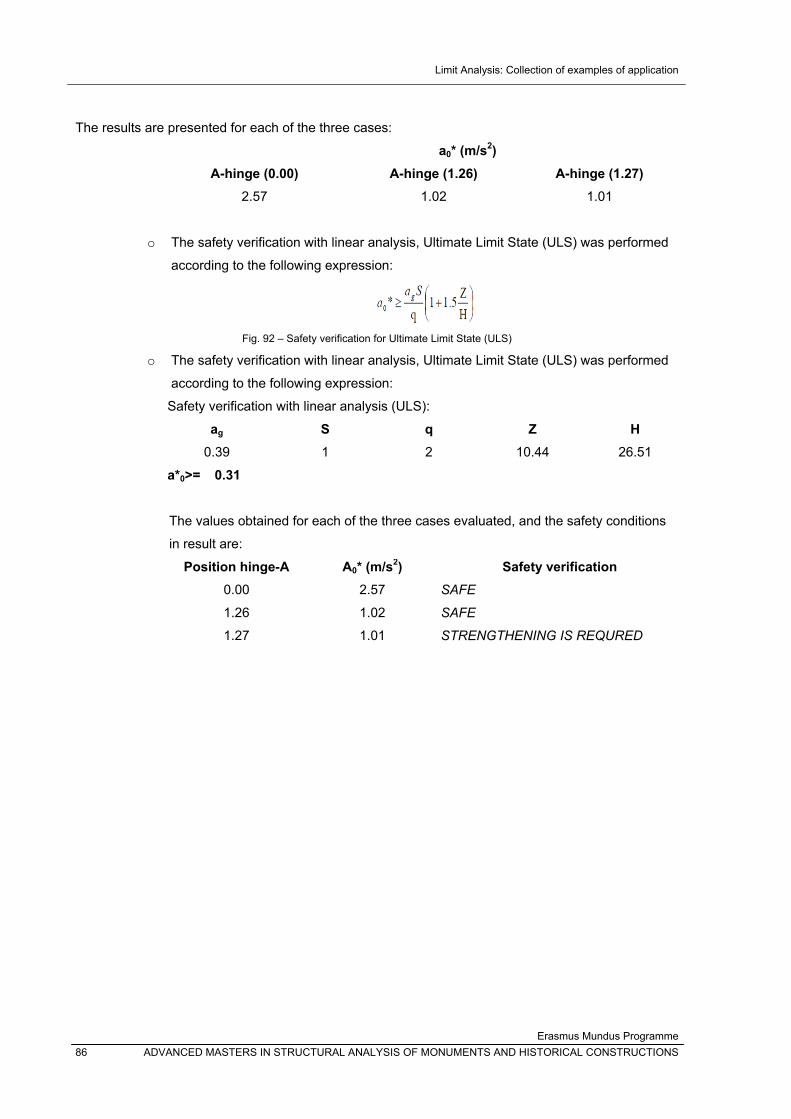
Limit Analysis: Collection of examples of application
Erasmus Mundus Programme 86 ADVANCED MASTERS IN STRUCTURAL ANALYSIS OF MONUMENTS AND HISTORICAL CONSTRUCTIONS
The results are presented for each of the three cases:
a0* (m/s2) A-hinge (0.00) A-hinge (1.26) A-hinge (1.27)
2.57 1.02 1.01
o The safety verification with linear analysis, Ultimate Limit State (ULS) was performed
according to the following expression:
Fig. 92 – Safety verification for Ultimate Limit State (ULS)
o The safety verification with linear analysis, Ultimate Limit State (ULS) was performed
according to the following expression:
Safety verification with linear analysis (ULS):
ag S q Z H 0.39 1 2 10.44 26.51
a*0>= 0.31
The values obtained for each of the three cases evaluated, and the safety conditions
in result are:
Position hinge-A A0* (m/s2) Safety verification 0.00 2.57 SAFE
1.26 1.02 SAFE
1.27 1.01 STRENGTHENING IS REQURED
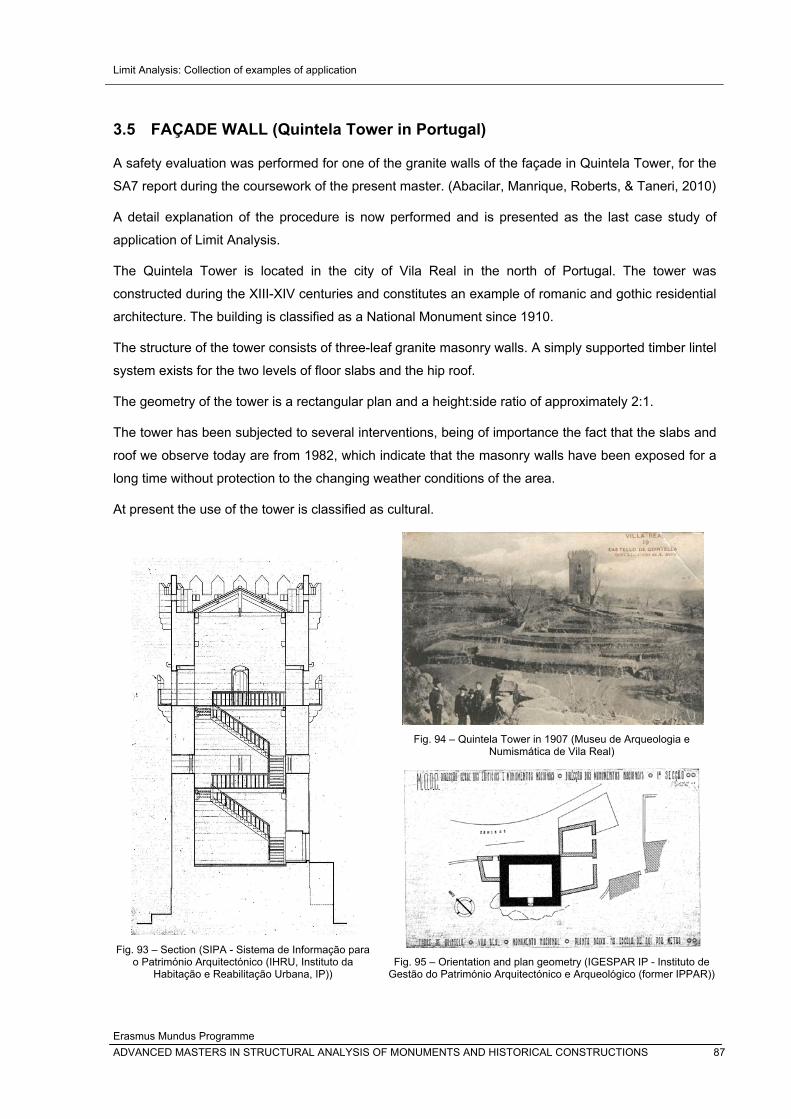
Limit Analysis: Collection of examples of application
Erasmus Mundus Programme ADVANCED MASTERS IN STRUCTURAL ANALYSIS OF MONUMENTS AND HISTORICAL CONSTRUCTIONS 87
3.5 FAÇADE WALL (Quintela Tower in Portugal)
A safety evaluation was performed for one of the granite walls of the façade in Quintela Tower, for the
SA7 report during the coursework of the present master. (Abacilar, Manrique, Roberts, & Taneri, 2010)
A detail explanation of the procedure is now performed and is presented as the last case study of
application of Limit Analysis.
The Quintela Tower is located in the city of Vila Real in the north of Portugal. The tower was
constructed during the XIII-XIV centuries and constitutes an example of romanic and gothic residential
architecture. The building is classified as a National Monument since 1910.
The structure of the tower consists of three-leaf granite masonry walls. A simply supported timber lintel
system exists for the two levels of floor slabs and the hip roof.
The geometry of the tower is a rectangular plan and a height:side ratio of approximately 2:1.
The tower has been subjected to several interventions, being of importance the fact that the slabs and
roof we observe today are from 1982, which indicate that the masonry walls have been exposed for a
long time without protection to the changing weather conditions of the area.
At present the use of the tower is classified as cultural.
Fig. 93 – Section (SIPA - Sistema de Informação para
o Património Arquitectónico (IHRU, Instituto da Habitação e Reabilitação Urbana, IP))
Fig. 94 – Quintela Tower in 1907 (Museu de Arqueologia e
Numismática de Vila Real)
Fig. 95 – Orientation and plan geometry (IGESPAR IP - Instituto de
Gestão do Património Arquitectónico e Arqueológico (former IPPAR))
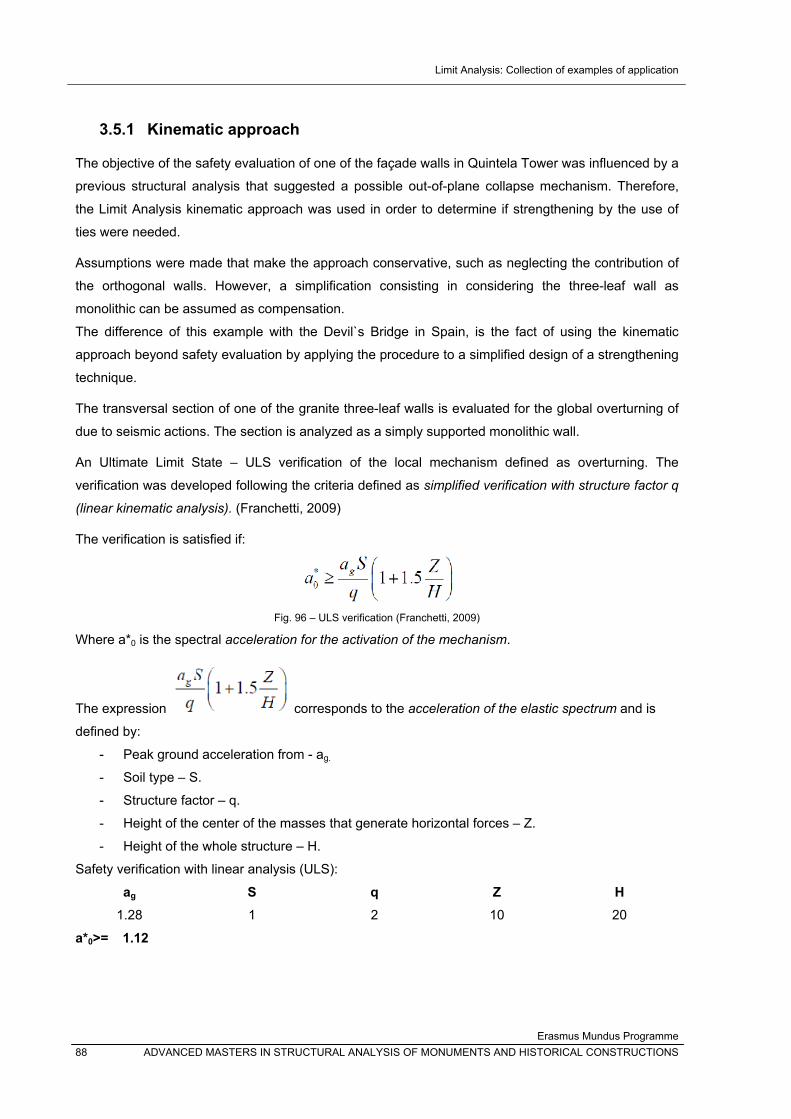
Limit Analysis: Collection of examples of application
Erasmus Mundus Programme 88 ADVANCED MASTERS IN STRUCTURAL ANALYSIS OF MONUMENTS AND HISTORICAL CONSTRUCTIONS
3.5.1 Kinematic approach
The objective of the safety evaluation of one of the façade walls in Quintela Tower was influenced by a
previous structural analysis that suggested a possible out-of-plane collapse mechanism. Therefore,
the Limit Analysis kinematic approach was used in order to determine if strengthening by the use of
ties were needed.
Assumptions were made that make the approach conservative, such as neglecting the contribution of
the orthogonal walls. However, a simplification consisting in considering the three-leaf wall as
monolithic can be assumed as compensation.
The difference of this example with the Devil`s Bridge in Spain, is the fact of using the kinematic
approach beyond safety evaluation by applying the procedure to a simplified design of a strengthening
technique.
The transversal section of one of the granite three-leaf walls is evaluated for the global overturning of
due to seismic actions. The section is analyzed as a simply supported monolithic wall.
An Ultimate Limit State – ULS verification of the local mechanism defined as overturning. The
verification was developed following the criteria defined as simplified verification with structure factor q
(linear kinematic analysis). (Franchetti, 2009)
The verification is satisfied if:
Fig. 96 – ULS verification (Franchetti, 2009)
Where a*0 is the spectral acceleration for the activation of the mechanism.
The expression corresponds to the acceleration of the elastic spectrum and is
defined by:
- Peak ground acceleration from - ag.
- Soil type – S.
- Structure factor – q.
- Height of the center of the masses that generate horizontal forces – Z.
- Height of the whole structure – H.
Safety verification with linear analysis (ULS):
ag S q Z H 1.28 1 2 10 20
a*0>= 1.12
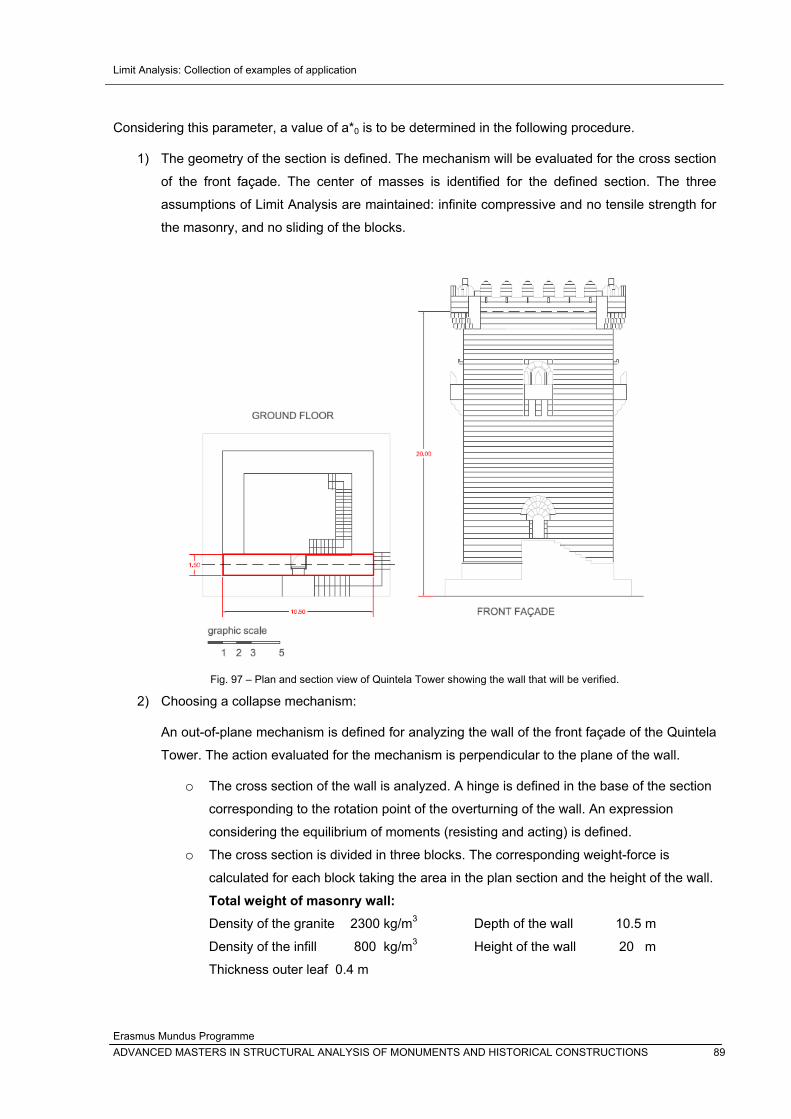
Limit Analysis: Collection of examples of application
Erasmus Mundus Programme ADVANCED MASTERS IN STRUCTURAL ANALYSIS OF MONUMENTS AND HISTORICAL CONSTRUCTIONS 89
Considering this parameter, a value of a*0 is to be determined in the following procedure.
1) The geometry of the section is defined. The mechanism will be evaluated for the cross section
of the front façade. The center of masses is identified for the defined section. The three
assumptions of Limit Analysis are maintained: infinite compressive and no tensile strength for
the masonry, and no sliding of the blocks.
Fig. 97 – Plan and section view of Quintela Tower showing the wall that will be verified.
2) Choosing a collapse mechanism:
An out-of-plane mechanism is defined for analyzing the wall of the front façade of the Quintela
Tower. The action evaluated for the mechanism is perpendicular to the plane of the wall.
o The cross section of the wall is analyzed. A hinge is defined in the base of the section
corresponding to the rotation point of the overturning of the wall. An expression
considering the equilibrium of moments (resisting and acting) is defined. o The cross section is divided in three blocks. The corresponding weight-force is
calculated for each block taking the area in the plan section and the height of the wall. Total weight of masonry wall: Density of the granite 2300 kg/m3 Depth of the wall 10.5 m
Density of the infill 800 kg/m3 Height of the wall 20 m
Thickness outer leaf 0.4 m
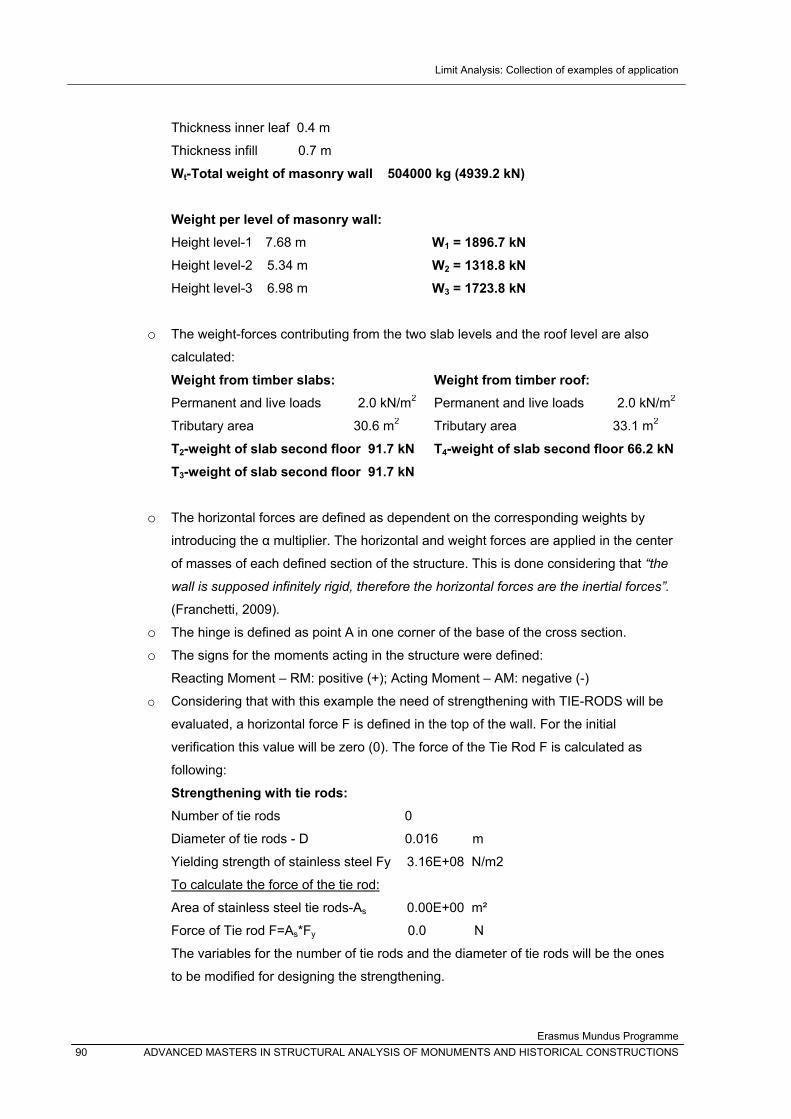
Limit Analysis: Collection of examples of application
Erasmus Mundus Programme 90 ADVANCED MASTERS IN STRUCTURAL ANALYSIS OF MONUMENTS AND HISTORICAL CONSTRUCTIONS
Thickness inner leaf 0.4 m
Thickness infill 0.7 m
Wt-Total weight of masonry wall 504000 kg (4939.2 kN)
Weight per level of masonry wall: Height level-1 7.68 m W1 = 1896.7 kN Height level-2 5.34 m W2 = 1318.8 kN Height level-3 6.98 m W3 = 1723.8 kN
o The weight-forces contributing from the two slab levels and the roof level are also
calculated: Weight from timber slabs: Weight from timber roof: Permanent and live loads 2.0 kN/m2 Permanent and live loads 2.0 kN/m2
Tributary area 30.6 m2 Tributary area 33.1 m2
T2-weight of slab second floor 91.7 kN T4-weight of slab second floor 66.2 kN T3-weight of slab second floor 91.7 kN
o The horizontal forces are defined as dependent on the corresponding weights by
introducing the α multiplier. The horizontal and weight forces are applied in the center
of masses of each defined section of the structure. This is done considering that “the
wall is supposed infinitely rigid, therefore the horizontal forces are the inertial forces”.
(Franchetti, 2009). o The hinge is defined as point A in one corner of the base of the cross section. o The signs for the moments acting in the structure were defined:
Reacting Moment – RM: positive (+); Acting Moment – AM: negative (-)
o Considering that with this example the need of strengthening with TIE-RODS will be
evaluated, a horizontal force F is defined in the top of the wall. For the initial
verification this value will be zero (0). The force of the Tie Rod F is calculated as
following:
Strengthening with tie rods: Number of tie rods 0
Diameter of tie rods - D 0.016 m
Yielding strength of stainless steel Fy 3.16E+08 N/m2
To calculate the force of the tie rod:
Area of stainless steel tie rods-As 0.00E+00 m²
Force of Tie rod F=As*Fy 0.0 N
The variables for the number of tie rods and the diameter of tie rods will be the ones
to be modified for designing the strengthening.
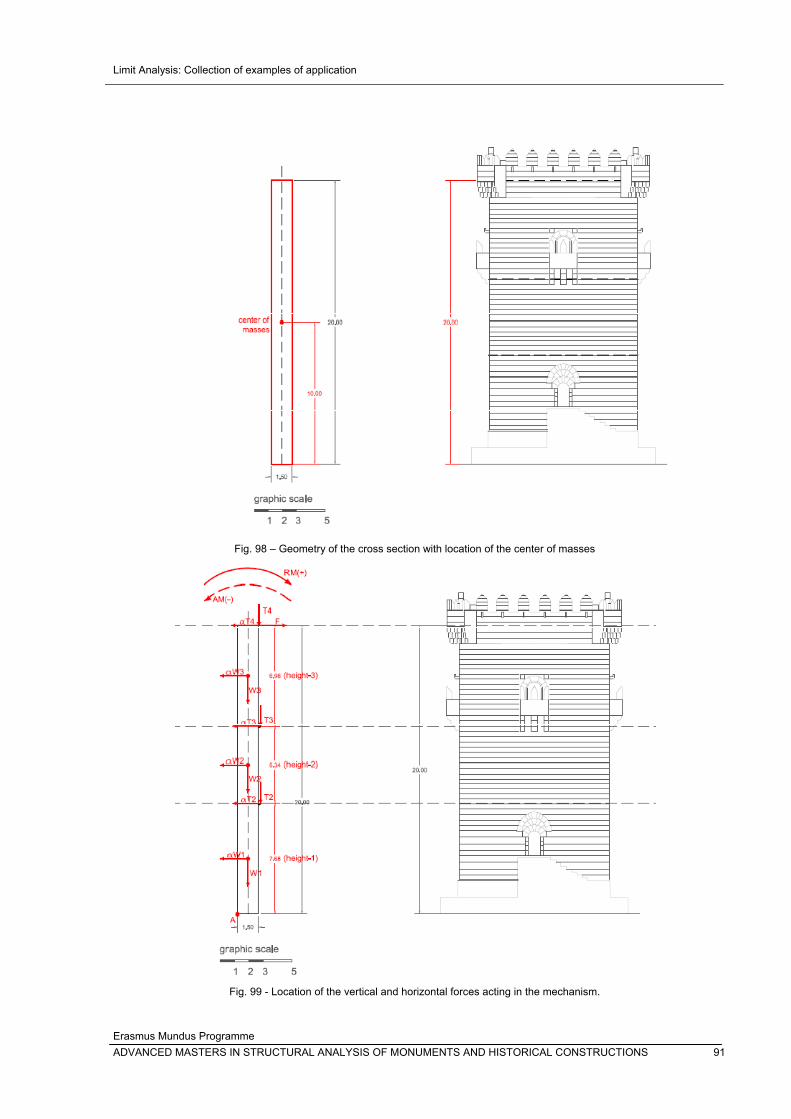
Limit Analysis: Collection of examples of application
Erasmus Mundus Programme ADVANCED MASTERS IN STRUCTURAL ANALYSIS OF MONUMENTS AND HISTORICAL CONSTRUCTIONS 91
Fig. 98 – Geometry of the cross section with location of the center of masses
Fig. 99 - Location of the vertical and horizontal forces acting in the mechanism.
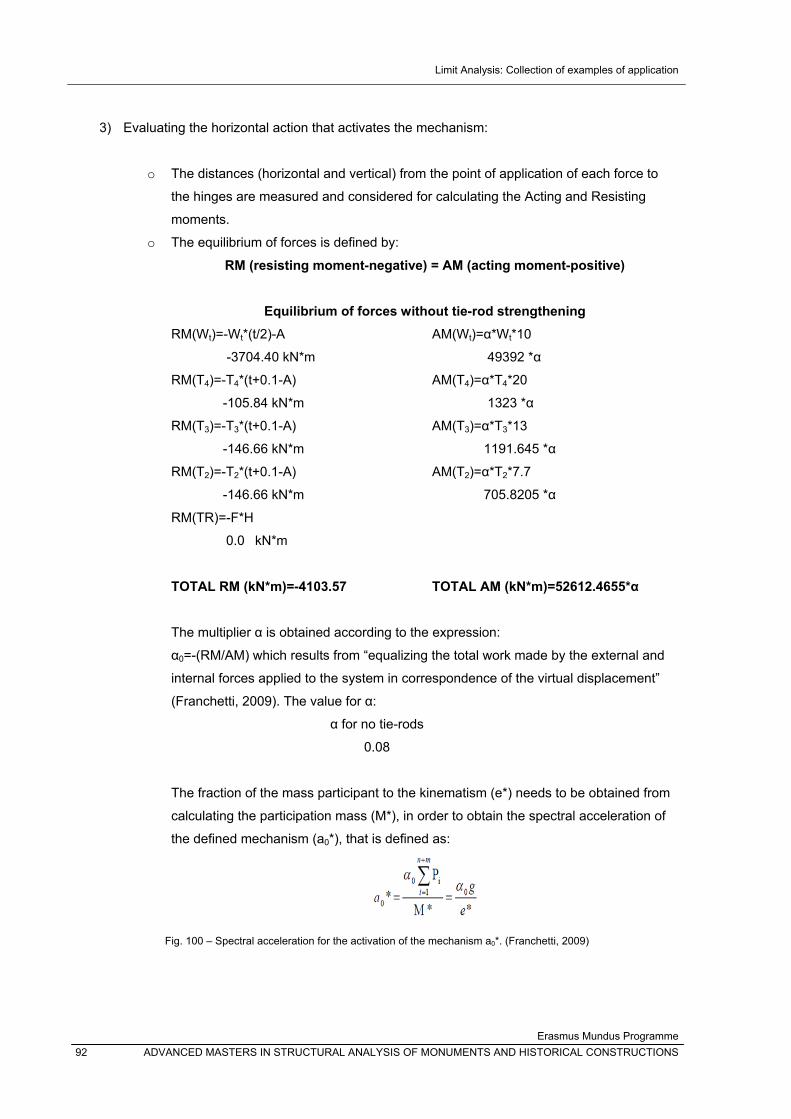
Limit Analysis: Collection of examples of application
Erasmus Mundus Programme 92 ADVANCED MASTERS IN STRUCTURAL ANALYSIS OF MONUMENTS AND HISTORICAL CONSTRUCTIONS
3) Evaluating the horizontal action that activates the mechanism:
o The distances (horizontal and vertical) from the point of application of each force to
the hinges are measured and considered for calculating the Acting and Resisting
moments.
o The equilibrium of forces is defined by:
RM (resisting moment-negative) = AM (acting moment-positive)
Equilibrium of forces without tie-rod strengthening RM(Wt)=-Wt*(t/2)-A
-3704.40 kN*m
RM(T4)=-T4*(t+0.1-A)
-105.84 kN*m
RM(T3)=-T3*(t+0.1-A)
-146.66 kN*m
RM(T2)=-T2*(t+0.1-A)
-146.66 kN*m
RM(TR)=-F*H
0.0 kN*m
TOTAL RM (kN*m)=-4103.57
AM(Wt)=α*Wt*10
49392 *α
AM(T4)=α*T4*20
1323 *α
AM(T3)=α*T3*13
1191.645 *α
AM(T2)=α*T2*7.7
705.8205 *α
TOTAL AM (kN*m)=52612.4655*α
The multiplier α is obtained according to the expression:
α0=-(RM/AM) which results from “equalizing the total work made by the external and
internal forces applied to the system in correspondence of the virtual displacement”
(Franchetti, 2009). The value for α:
α for no tie-rods 0.08
The fraction of the mass participant to the kinematism (e*) needs to be obtained from
calculating the participation mass (M*), in order to obtain the spectral acceleration of
the defined mechanism (a0*), that is defined as:
Fig. 100 – Spectral acceleration for the activation of the mechanism a0*. (Franchetti, 2009)
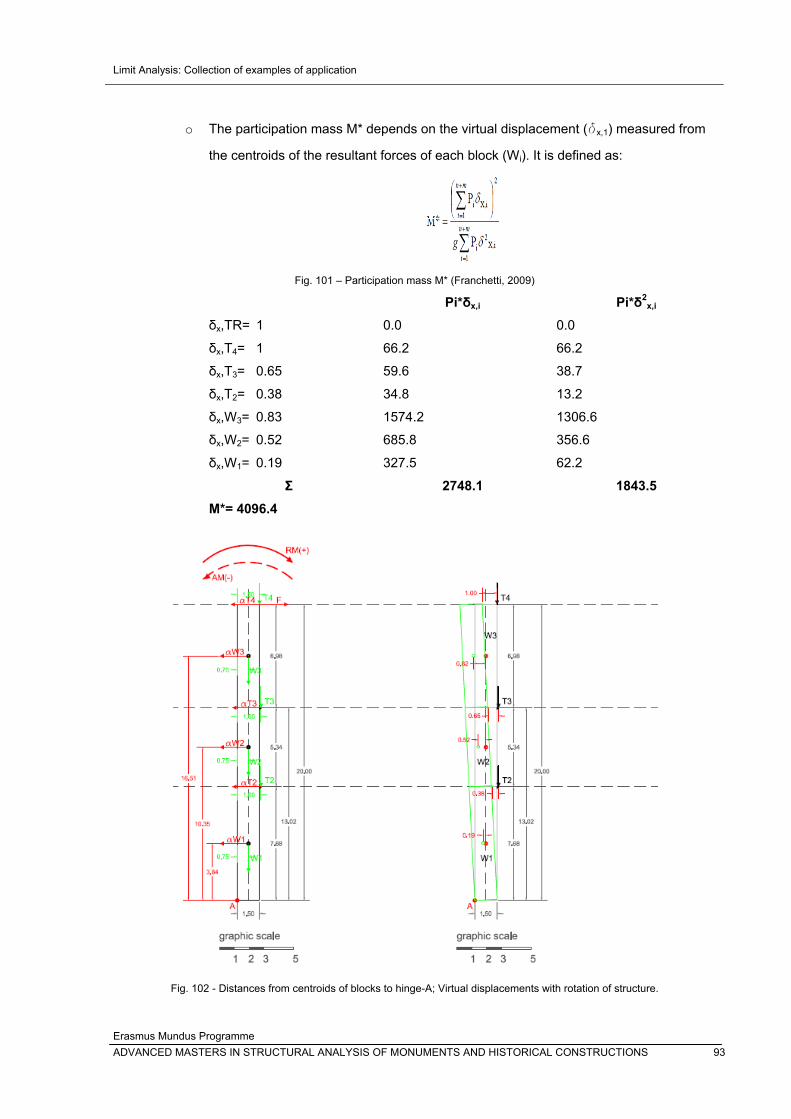
Limit Analysis: Collection of examples of application
Erasmus Mundus Programme ADVANCED MASTERS IN STRUCTURAL ANALYSIS OF MONUMENTS AND HISTORICAL CONSTRUCTIONS 93
o The participation mass M* depends on the virtual displacement (δx,1) measured from
the centroids of the resultant forces of each block (Wi). It is defined as:
Fig. 101 – Participation mass M* (Franchetti, 2009)
Pi*δx,i Pi*δ2x,i
δx,TR= 1
δx,T4= 1
δx,T3= 0.65
δx,T2= 0.38
δx,W3= 0.83
δx,W2= 0.52
δx,W1= 0.19
0.0
66.2
59.6
34.8
1574.2
685.8
327.5
0.0
66.2
38.7
13.2
1306.6
356.6
62.2
Σ 2748.1 1843.5 M*= 4096.4
Fig. 102 - Distances from centroids of blocks to hinge-A; Virtual displacements with rotation of structure.
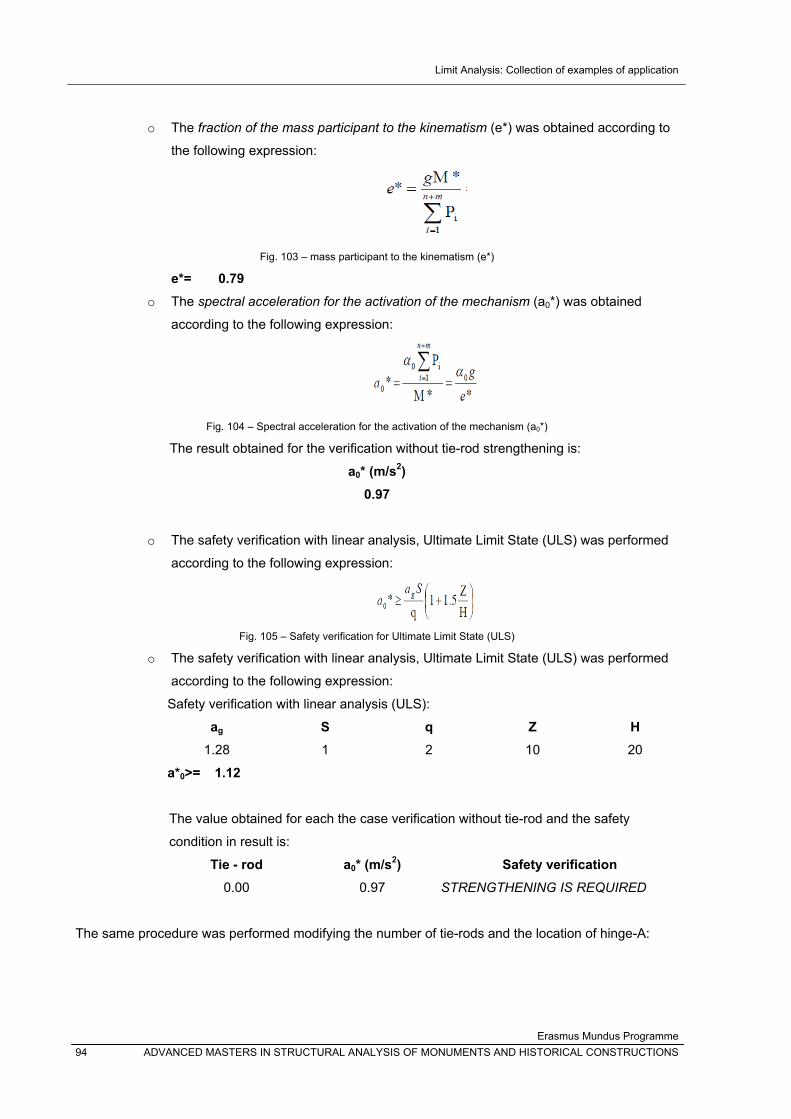
Limit Analysis: Collection of examples of application
Erasmus Mundus Programme 94 ADVANCED MASTERS IN STRUCTURAL ANALYSIS OF MONUMENTS AND HISTORICAL CONSTRUCTIONS
o The fraction of the mass participant to the kinematism (e*) was obtained according to
the following expression:
Fig. 103 – mass participant to the kinematism (e*)
e*= 0.79 o The spectral acceleration for the activation of the mechanism (a0*) was obtained
according to the following expression:
Fig. 104 – Spectral acceleration for the activation of the mechanism (a0*)
The result obtained for the verification without tie-rod strengthening is:
a0* (m/s2) 0.97
o The safety verification with linear analysis, Ultimate Limit State (ULS) was performed
according to the following expression:
Fig. 105 – Safety verification for Ultimate Limit State (ULS)
o The safety verification with linear analysis, Ultimate Limit State (ULS) was performed
according to the following expression:
Safety verification with linear analysis (ULS):
ag S q Z H 1.28 1 2 10 20
a*0>= 1.12
The value obtained for each the case verification without tie-rod and the safety
condition in result is:
Tie - rod a0* (m/s2) Safety verification 0.00 0.97 STRENGTHENING IS REQUIRED
The same procedure was performed modifying the number of tie-rods and the location of hinge-A:
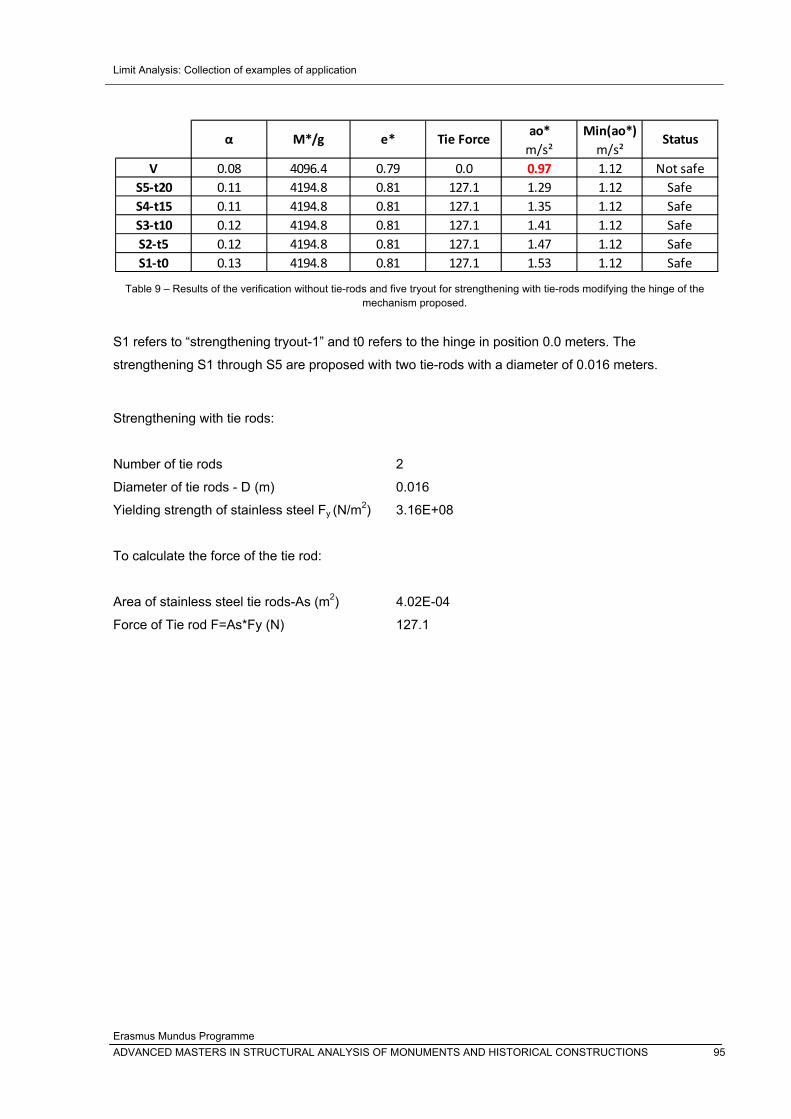
Limit Analysis: Collection of examples of application
Erasmus Mundus Programme ADVANCED MASTERS IN STRUCTURAL ANALYSIS OF MONUMENTS AND HISTORICAL CONSTRUCTIONS 95
Table 9 – Results of the verification without tie-rods and five tryout for strengthening with tie-rods modifying the hinge of the
mechanism proposed.
S1 refers to “strengthening tryout-1” and t0 refers to the hinge in position 0.0 meters. The
strengthening S1 through S5 are proposed with two tie-rods with a diameter of 0.016 meters.
Strengthening with tie rods:
Number of tie rods 2
Diameter of tie rods - D (m) 0.016
Yielding strength of stainless steel Fy (N/m2) 3.16E+08
To calculate the force of the tie rod:
Area of stainless steel tie rods-As (m2) 4.02E-04
Force of Tie rod F=As*Fy (N) 127.1
ao* Min(ao*)m/s² m/s²
V 0.08 4096.4 0.79 0.0 0.97 1.12 Not safeS5‐t20 0.11 4194.8 0.81 127.1 1.29 1.12 SafeS4‐t15 0.11 4194.8 0.81 127.1 1.35 1.12 SafeS3‐t10 0.12 4194.8 0.81 127.1 1.41 1.12 SafeS2‐t5 0.12 4194.8 0.81 127.1 1.47 1.12 SafeS1‐t0 0.13 4194.8 0.81 127.1 1.53 1.12 Safe
α M*/g e* Tie Force Status

Limit Analysis: Collection of examples of application
Erasmus Mundus Programme 96 ADVANCED MASTERS IN STRUCTURAL ANALYSIS OF MONUMENTS AND HISTORICAL CONSTRUCTIONS
Limit Analysis: Collection of examples of application
Erasmus Mundus Programme ADVANCED MASTERS IN STRUCTURAL ANALYSIS OF MONUMENTS AND HISTORICAL CONSTRUCTIONS 97
4. CONCLUSIONS
Limit Analysis techniques have a wide application for a simplified assessment of historical structures.
The graphic approach allows understanding the concepts involved in structural analysis in order to be
able to interpret the results that are obtained with computational limit analysis being developed and
available today.
The examples previously presented constitute a starting point for the development of a compilation
guide of detailed case studies applying Limit Analysis for the safety evaluation of historical
constructions. Different typologies of historical constructions were evaluated in order to understand the
specific considerations in each case such as loading conditions and behavior of the macro elements
when defining the collapse mechanisms. The cases were presented in a step-by-step scheme in order
to follow the sequence being performed and to be able to complement the figures and analytical
procedures in order to be used by future students interested in the use of limit analysis for the
assessment of historical constructions.
With each case study new variables were introduced allowing the application of the theory involved in
the kinematic and static approaches for different targets.
For Bridgemill Bridge, the objective was known from previous reports documenting results for the
collapse load being obtained experimentally and analytically. Therefore in this case the value for the
true solution was already known. This was important as it was the first example being solved and a
reference allowed to verify and to optimize the procedure.
In the example of Cuernavaca Church, it was important to compare two possible mechanisms and
understanding the parameters to define which was more critical.
The last arch in a series within a façade of one of the buildings in Plaça Reial was performed in order
to understand the effect of the loads imposed by several stories in an exterior buttress.
The Roman Aqueduct of Tarragona suggested the challenge of evaluating an out-of-plane mechanism
of the transversal section.
One of the façades of Quintela Tower was evaluated also for an out-of-plane mechanism and
additionally a design of reinforcement was proposed using the limit analysis technique.
The software`s that were used such as computer-aided design and spreadsheets simplified some of
the tasks in terms of time but are not needed for the procedures being performed; these can be done
by hand. The software RING© was used for quick verifications in two of the cases. The graphic
procedure was tedious in the start but with each new example it was possible to notice a reduction in
the time that was needed.
The methodology that was followed suggests the possibility of further examples to be developed which
can include different types of structures (natural and artificial), further parameters of comparison
Limit Analysis: Collection of examples of application
Erasmus Mundus Programme 98 ADVANCED MASTERS IN STRUCTURAL ANALYSIS OF MONUMENTS AND HISTORICAL CONSTRUCTIONS
between mechanisms, among others. Furthermore, it constitutes a learning technique not only as a
reference abacus when more examples are included and classified, but as an approach for
understanding de concepts during the step-by-step process of solving each case.
The assessment of historical constructions requires integrating the knowledge of structural
engineering and architecture. In order to propose the best possible solutions, complex concepts from
both disciplines must be understood by each professional in order to be able to understand the
problem as a whole.
In some undergraduate programs, architecture education has reduced to the minimum the basic
contents of the sciences, therefore the language necessary to understand and explain the physic
world becomes very limited and speculative. Furthermore the possibility to communicate with
engineers is reduced.
However, initiatives like the MSc-SAHC program, has evidenced the growing interest of each side
towards integration. From my point of view as an architect this has been a unique opportunity to
interact with engineers from different parts of the world and being able to see how a common abstract
language allows understanding and solving real problems. With basic tools I have seen how new
techniques were learned and used in practical matters. Within the techniques introduced Limit
Analysis has been the bridge to start understanding basic concepts that were presented during the
courses, and with each case study I have developed for this thesis the fragments have started to
come together.
Leonardo da Vinci used to say: “un arco è la somma di due debolezze che genera una fortezza”2.
2 Italian version from a quote in (Huerta Fernández, 2004)
Limit Analysis: Collection of examples of application
Erasmus Mundus Programme ADVANCED MASTERS IN STRUCTURAL ANALYSIS OF MONUMENTS AND HISTORICAL CONSTRUCTIONS 99
5. REFERENCES
Abacilar, P., Manrique, C., Roberts, G., & Taneri, C. (2010). Quintela Tower - Integrated Project.
Guimaraes.
Aero-plano. (n.d.). Retrieved Junio 28, 2010, from Producciones audiovisuales
Ajuntament de Tarragona. (n.d.). Museu d`Historia de Tarragona. Retrieved June 11, 2010, from
http://www.museutgn.com/monumentos.asp?id=11
Alcolea Antiguedades. (n.d.). Retrieved June 29, 2010, from
http://www.alcoleaantiguedades.com/images/Plaza-Real-81-x-60.jpg
archINFORM. (n.d.). International Architecture Database. Retrieved June 28, 2010, from Francesc
Daniel Molina i Casamajó: http://spa.archinform.net/arch/108346.htm
Block, P. (2005). Equilibrium systems: Studies in Masonry Structure. Cambridge: MIT.
Block, P., & Ochsendorf, J. Lower-bound Analysis of Masonry Vaults. Cambridge.
Block, P., DeJong, M., & Ochsendorf, J. (2006). As Hangs the Flexible Line:Equilibrium of Masonry
Arches. Nexus Network Journal 8 , 13-24.
Franchetti, P. (2009). Damage and collapsing mechanisms in existing (particularly historical)
structures. MSc-SAHC. Guimaraes.
Gilbert, M. (2007). Limit analysis applied to masonry arch bridges: state-of-the-art and recent
developments. ARCH’07 – 5th International Conference on Arch Bridges, (pp. 13-28).
Gilbert, M. (2005). RING: Theory and Modelling Guide. Computational Limit Analysis and Design Unit.
The University of Sheffield.
Heyman, J. (1996). Elements of the Theory of Structures. New York: Cambridge University Press.
Heyman, J. (1995). The Stone Skeleton: Structural Engineering of Masonry Architecture. Cambridge:
Cambridge University Press.
Huerta Fernández, S. (2004). Arcos, bóvedas y cúpulas: Geometría y equilibrio en el cálculo
tradicional de estructuras de fábrica. Madrid: Instituto Juan de Herrera.
Huerta, S. (2003). El cálculo de estructuras en la obra de Gaudí. Ingeniería Civil 129 , 121-133.
Limit Analysis: Collection of examples of application
Erasmus Mundus Programme 100 ADVANCED MASTERS IN STRUCTURAL ANALYSIS OF MONUMENTS AND HISTORICAL CONSTRUCTIONS
Huerta, S. (2001). Mechanics of masonry vaults: The equilibrium approach. Historical Constructions
(pp. 47-69). Guimarães: P.B. Lourenço, P. Roca (Eds.).
IGESPAR IP - Instituto de Gestão do Património Arquitectónico e Arqueológico (former IPPAR). (n.d.).
Retrieved 2010, from
http://www.igespar.pt/pt/patrimonio/pesquisa/geral/benscomproteccaolegal/detail/70323/
La Plaça Reial. (n.d.). Retrieved June 28, 2010, from http://www.lareial.com/
Lourenço, P. B. (2001). Analysis of historical constructions: From thrust-lines to advanced simulations.
Historical Constructions (pp. 91-116). Guimarães: P.B. Lourenço, P. Roca (Eds.).
Marcari, G., Maca, J., & Oliveira, D. (2009). Seismic Behaviour and Structural Dynamics.
SA3_11_2009 MSc-SAHC . Guimaraes: MSc-SAHC.
Massachusetts Institute of Technology - Building Technology Program - Masonry Research Group.
(n.d.). Interactive Thrust. Retrieved June 3, 2010, from
http://web.mit.edu/masonry/interactiveThrust/examples.html
Massachusetts Institute of Technology - MIT. (n.d.). Interactive Thrust. Retrieved June 17, 2010, from
http://web.mit.edu/masonry/interactiveThrust/
Meli, R. (2009). On Structural Bases for Building the Mexican Convent Churches From the Sixteenth
Century. International Journal of Architectural Heritage (3), 24–51.
Molins, C. (June 1998). Capacity of Masonry Arches and Spatial Frames. Journal of Structural
Engineering .
Museu de Arqueologia e Numismática de Vila Real. (n.d.).
O. P. C. M. 3431. (2005). Ordinance of the Prime Minister. 3rd of May.
Orduña, A., & Lourenço, P. B. (2001). Limit analysis as a tool for the simplified assessment of ancient
masonry structures. Historical Constructions (pp. 511-520). Guimarães: P.B. Lourenço, P. Roca
(Eds.).
Roca, P. (2010, June). Acueducto Romano de Tarragona-croquis. Barcelona, España.
Roca, P. (2009-2010). Ancient Rules and Classical Approaches- Part 1-4. SA1 Lectures. Advanced
Masters in Structural Analysis of Monuments and Historical Constructions. Guimaraes.
Limit Analysis: Collection of examples of application
Erasmus Mundus Programme ADVANCED MASTERS IN STRUCTURAL ANALYSIS OF MONUMENTS AND HISTORICAL CONSTRUCTIONS 101
Roca, P. (2009-2010). Damage and Collapse Mechanisms - Part 1. Advanced Masters in Structural
Analysis of Monuments and Historical Constructions. Guimaraes.
Roca, P. (2009-2010). Damage and Collapse Mechanisms - Part 2. Advanced Masters in Structural
Analysis of Monuments and Historical Constructions. Guimaraes.
Schram, W. D., & Passchier, C. W. (2005, March 25). Roman Aqueducts. Retrieved June 11, 2010,
from Tarragona (Spain): http://www.romanaqueducts.info/aquasite/tarragona/foto3.html
SIPA - Sistema de Informação para o Património Arquitectónico (IHRU, Instituto da Habitação e
Reabilitação Urbana, IP). (n.d.). Retrieved 2010, from Direcção-Geral dos Edifícios e Monumentos
Nacionais [DGEMN]: http://www.monumentos.pt/Monumentos/forms/002_B1.aspx
The History of the Spanish Architecture. (n.d.). Retrieved June 11, 2010, from Aqueduct of Las
Ferreras (Tarraco):
http://www.spanisharts.com/arquitectura/imagenes/roma/i_tarragona_acueducto.html
United Nations. (n.d.). UNESCO. Retrieved June 11, 2010, from World Heritage Centre:
http://whc.unesco.org/en/list/875/
United Nations. (n.d.). UNESCO. Retrieved June 11, 2010, from World Heritage Centre:
http://whc.unesco.org/en/news/184

Limit Analysis: Collection of examples of application
Erasmus Mundus Programme 102 ADVANCED MASTERS IN STRUCTURAL ANALYSIS OF MONUMENTS AND HISTORICAL CONSTRUCTIONS
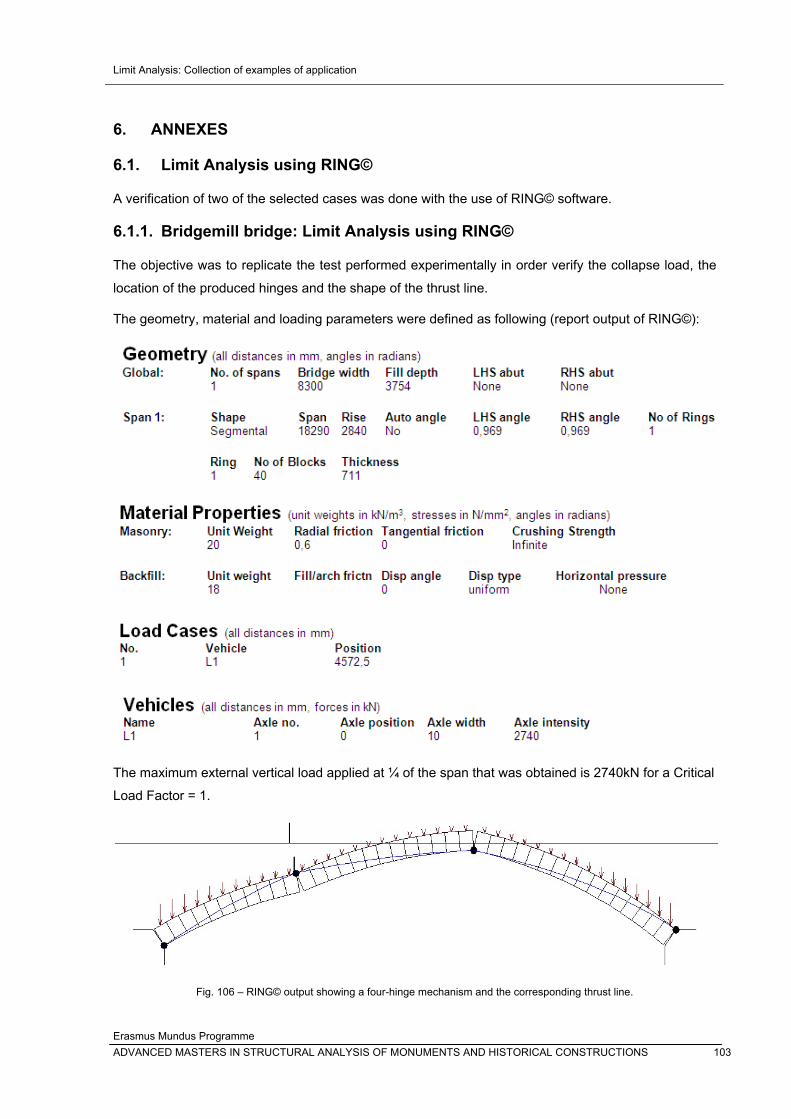
Limit Analysis: Collection of examples of application
Erasmus Mundus Programme ADVANCED MASTERS IN STRUCTURAL ANALYSIS OF MONUMENTS AND HISTORICAL CONSTRUCTIONS 103
6. ANNEXES
6.1. Limit Analysis using RING©
A verification of two of the selected cases was done with the use of RING© software.
6.1.1. Bridgemill bridge: Limit Analysis using RING©
The objective was to replicate the test performed experimentally in order verify the collapse load, the
location of the produced hinges and the shape of the thrust line.
The geometry, material and loading parameters were defined as following (report output of RING©):
The maximum external vertical load applied at ¼ of the span that was obtained is 2740kN for a Critical
Load Factor = 1.
Fig. 106 – RING© output showing a four-hinge mechanism and the corresponding thrust line.
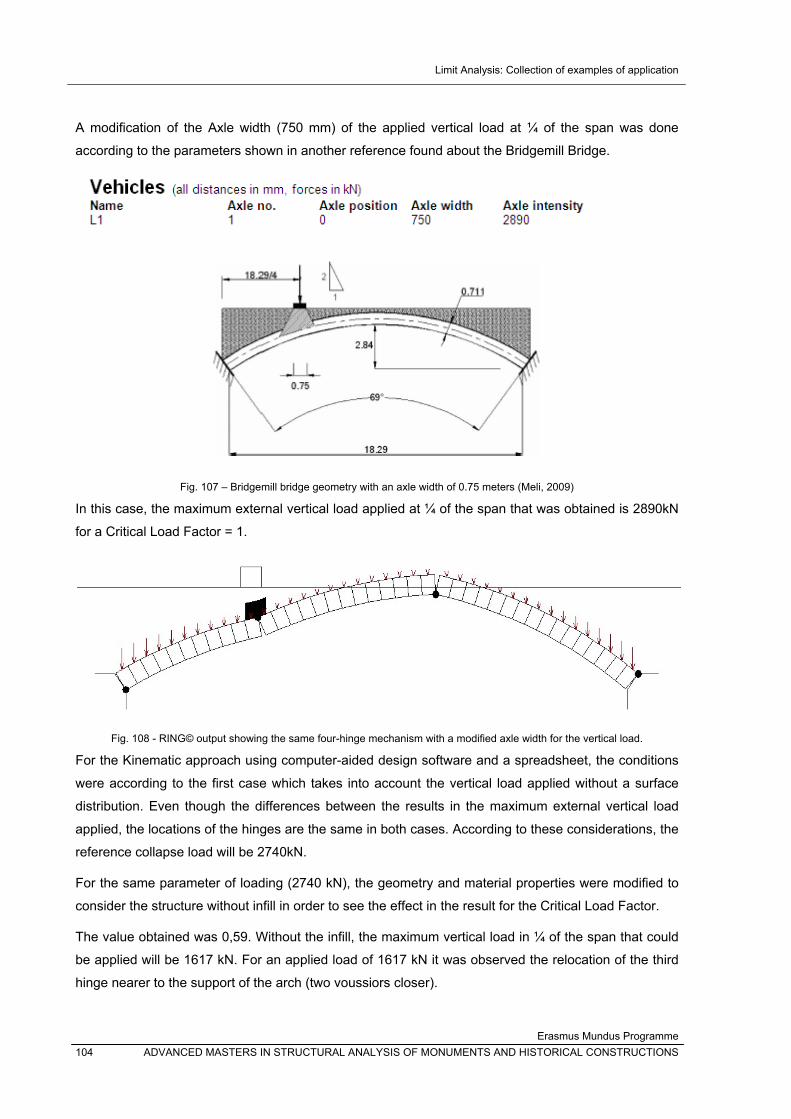
Limit Analysis: Collection of examples of application
Erasmus Mundus Programme 104 ADVANCED MASTERS IN STRUCTURAL ANALYSIS OF MONUMENTS AND HISTORICAL CONSTRUCTIONS
A modification of the Axle width (750 mm) of the applied vertical load at ¼ of the span was done
according to the parameters shown in another reference found about the Bridgemill Bridge.
Fig. 107 – Bridgemill bridge geometry with an axle width of 0.75 meters (Meli, 2009)
In this case, the maximum external vertical load applied at ¼ of the span that was obtained is 2890kN
for a Critical Load Factor = 1.
Fig. 108 - RING© output showing the same four-hinge mechanism with a modified axle width for the vertical load.
For the Kinematic approach using computer-aided design software and a spreadsheet, the conditions
were according to the first case which takes into account the vertical load applied without a surface
distribution. Even though the differences between the results in the maximum external vertical load
applied, the locations of the hinges are the same in both cases. According to these considerations, the
reference collapse load will be 2740kN.
For the same parameter of loading (2740 kN), the geometry and material properties were modified to
consider the structure without infill in order to see the effect in the result for the Critical Load Factor.
The value obtained was 0,59. Without the infill, the maximum vertical load in ¼ of the span that could
be applied will be 1617 kN. For an applied load of 1617 kN it was observed the relocation of the third
hinge nearer to the support of the arch (two voussiors closer).
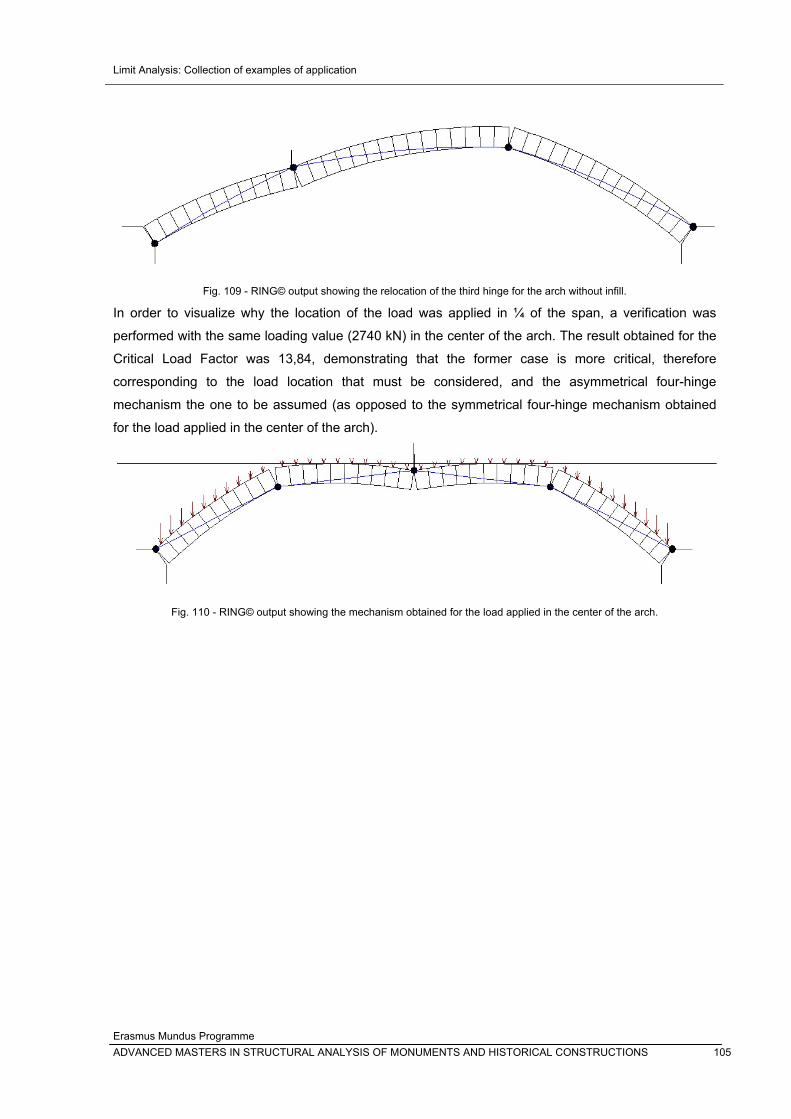
Limit Analysis: Collection of examples of application
Erasmus Mundus Programme ADVANCED MASTERS IN STRUCTURAL ANALYSIS OF MONUMENTS AND HISTORICAL CONSTRUCTIONS 105
Fig. 109 - RING© output showing the relocation of the third hinge for the arch without infill.
In order to visualize why the location of the load was applied in ¼ of the span, a verification was
performed with the same loading value (2740 kN) in the center of the arch. The result obtained for the
Critical Load Factor was 13,84, demonstrating that the former case is more critical, therefore
corresponding to the load location that must be considered, and the asymmetrical four-hinge
mechanism the one to be assumed (as opposed to the symmetrical four-hinge mechanism obtained
for the load applied in the center of the arch).
Fig. 110 - RING© output showing the mechanism obtained for the load applied in the center of the arch.
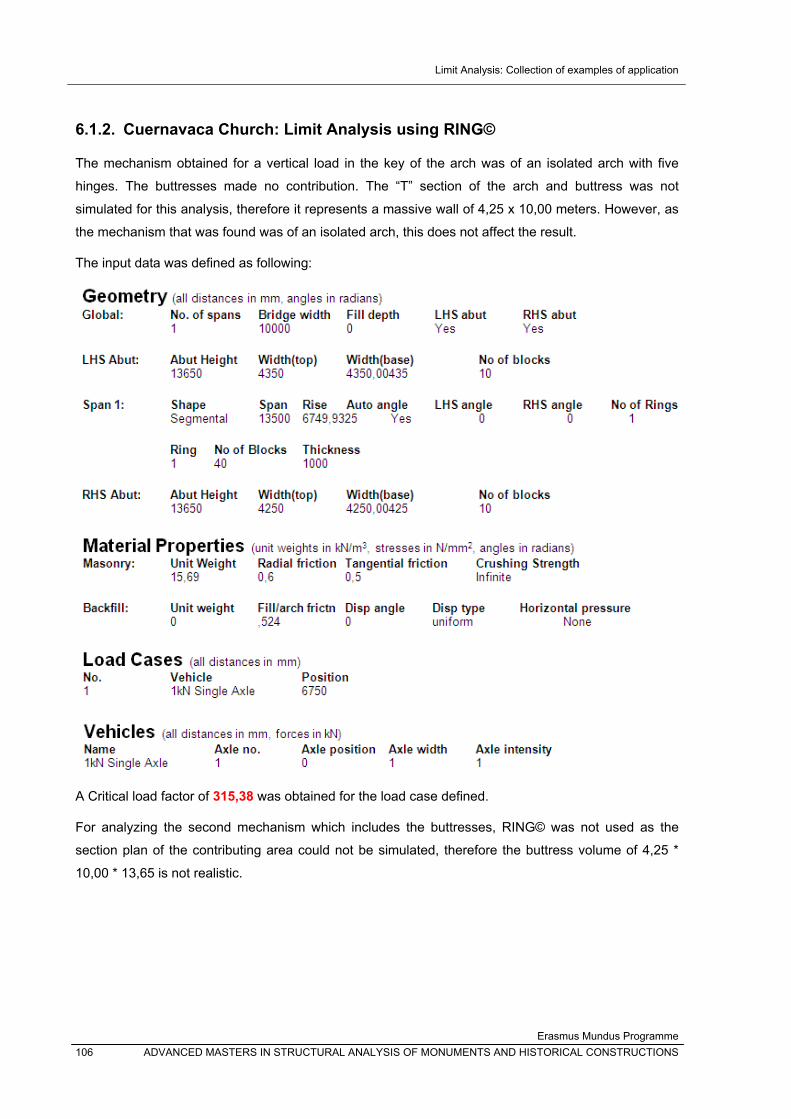
Limit Analysis: Collection of examples of application
Erasmus Mundus Programme 106 ADVANCED MASTERS IN STRUCTURAL ANALYSIS OF MONUMENTS AND HISTORICAL CONSTRUCTIONS
6.1.2. Cuernavaca Church: Limit Analysis using RING©
The mechanism obtained for a vertical load in the key of the arch was of an isolated arch with five
hinges. The buttresses made no contribution. The “T” section of the arch and buttress was not
simulated for this analysis, therefore it represents a massive wall of 4,25 x 10,00 meters. However, as
the mechanism that was found was of an isolated arch, this does not affect the result.
The input data was defined as following:
A Critical load factor of 315,38 was obtained for the load case defined.
For analyzing the second mechanism which includes the buttresses, RING© was not used as the
section plan of the contributing area could not be simulated, therefore the buttress volume of 4,25 *
10,00 * 13,65 is not realistic.
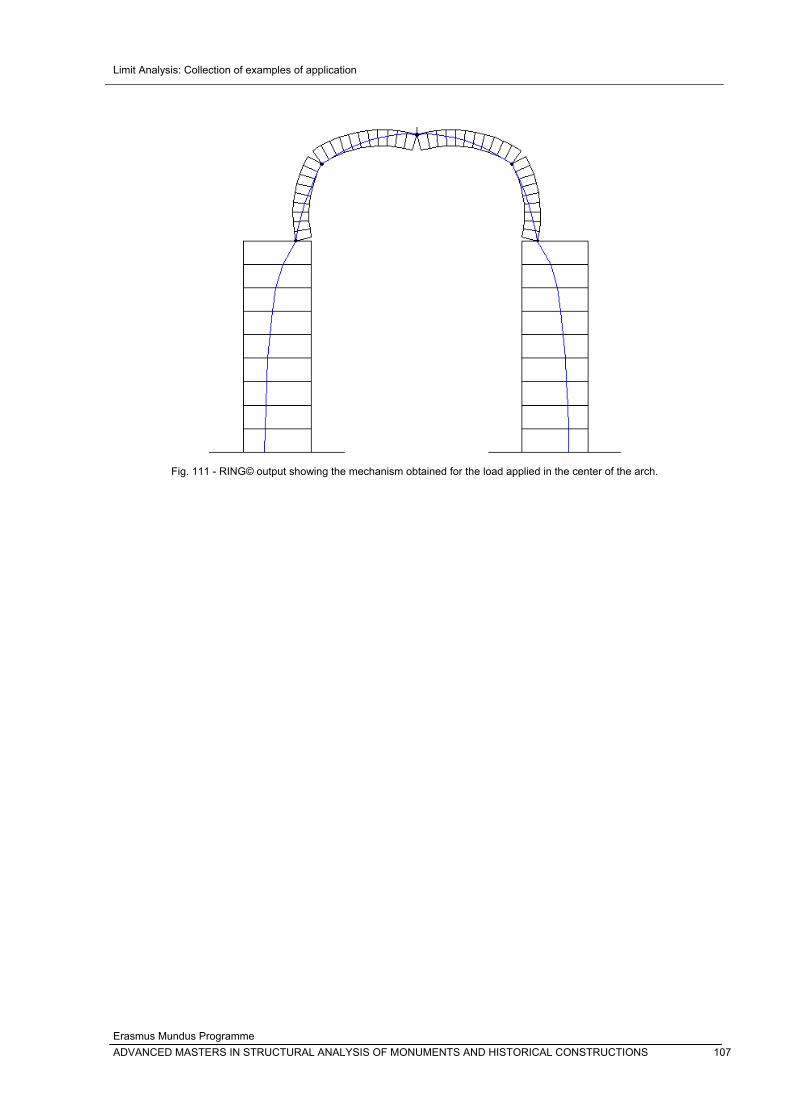
Limit Analysis: Collection of examples of application
Erasmus Mundus Programme ADVANCED MASTERS IN STRUCTURAL ANALYSIS OF MONUMENTS AND HISTORICAL CONSTRUCTIONS 107
Fig. 111 - RING© output showing the mechanism obtained for the load applied in the center of the arch.


![ip[ international],,,,,,,,,,,,mam manrique](https://img.pdfslide.us/doc/110x75/551ddb7849795955198b4fe8/ip-internationalmam-manrique.jpg)