Embed Size (px)
DESCRIPTION
Financial statement as at 30 September 2013
Citation preview

www.carlsberggroup.com
Page 1 of 30
Carlsberg A/S
100 Ny Carlsberg Vej
1799 Copenhagen V
CVR No. 61056416
Tel +45 3327 3300
www.carlsberggroup.com
Company announcement 11/2013
13 November 2013
Financial statement as at 30 September 2013 Solid performance across Western Europe and Asia while Eastern Europe remains difficult Unless otherwise stated, comments in this announcement refer to year-to-date performance.
Financial highlights
Organic net revenue up 1% to DKK 50.9bn (Q3: -1%).
Positive price/mix of +2% (Q3:+3%) with solid performance in Western Europe and Asia.
2% organic operating profit growth (Q3: 0%).
Reported operating profit of DKK 7,522m (Q3: DKK 3,426m) impacted by 4% negative currency
impact.
5% adjusted net profit growth to DKK 4,488m (Q3: +4%).
2013 outlook maintained.
Operational highlights
Western European markets improved in Q3 due to favourable weather. Continued challenging market environment in Eastern Europe with Russia continuing to be impacted by outlet closures and slower macro-economic growth.
Solid market share performance in all three regions.
Organic beer volume decline of 2% (Q3: -5%). Continued growth in Asia offset by volume decline
in Eastern and Western Europe, although Western Europe delivered strong growth in Q3.
The implementation of the supply chain integration and business standardisation project (BSP1) is running according to schedule with our second market, Norway, having gone live in early
November.
Tuborg and Somersby continued to perform well with volume growth of 12% and 80%,
respectively. The Carlsberg brand grew 5% in premium markets in Q3 following tough EURO 2012 comparisons in the first half of 2012.
We started construction of two breweries in Myanmar and China and launched the partial tender offer of Chongqing Brewery.
Commenting on the results, CEO Jørgen Buhl Rasmussen says: ‚I am satisfied that the Group
managed to deliver earnings growth for the nine months as well as maintaining its earnings outlook
for the year in light of challenging and uncertain market conditions and an adverse currency impact.
We have achieved this through ongoing tight cost control, underpinning the importance of our
continued efforts to make our business more efficient and lean. We maintain an appropriate
balance between becoming more efficient and ensuring that we continue to invest in our business
for the longer term. The Group’s solid market share performance clearly demonstrates that our
focus on strengthening our commercial execution capabilities, bringing innovations to the market
and investing in our strong brands is right.‛
Contacts
Investor Relations: Peter Kondrup +45 3327 1221 Iben Steiness +45 3327 1232
Media Relations: Jens Bekke +45 3327 1412 Ben Morton +45 3327 1417

www.carlsberggroup.com
Company announcement 11/2013
13 November 2013
Page 2 of 30
KEY FIGURES AND FINANCIAL RATIOS
DKK million Q3 Q3 9 mths 9 mths
2013 2012 2013 2012 2012
Total sales volumes (million hl)
Beer 38.6 39.7 108.4 109.7 140.9
Other beverages 5.8 5.9 16.4 16.7 22.0
Pro rata volumes (million hl)
Beer 32.7 34.1 92.8 93.3 120.4
Other beverages 5.3 5.2 15.0 14.6 19.1
Income statement
Net revenue 17,973 18,587 50,891 50,698 66,468
Operating profit before special items 3,426 3,596 7,522 7,641 9,793
Special items, net -45 -6 -198 1,391 85
Financial items, net -295 -442 -1,069 -1,320 -1,772
Profit before tax 3,086 3,148 6,255 7,712 8,106
Corporation tax -765 -787 -1,557 -1,776 -1,861
Consolidated profit 2,321 2,361 4,698 5,936 6,245
Attributable to:
Non-controlling interests 113 225 354 521 638
Shareholders in Carlsberg A/S 2,208 2,136 4,344 5,415 5,607
Shareholders in Carlsberg A/S (adjusted)* 2,241 2,146 4,488 4,288 5,504
Statement of financial position
Total assets - - 148,219 155,651 153,965
Invested capital - - 117,191 121,365 121,467
Interest-bearing debt, net - - 31,490 31,790 32,480
Equity, shareholders in Carlsberg A/S - - 68,264 71,372 70,261
Statement of cash flows
Cash flow from operating activities 3,502 3,430 6,752 6,713 9,871
Cash f low from investing activities -916 -901 -4,251 -1,567 -3,974
Free cash f low 2,586 2,529 2,501 5,146 5,897
Financial ratios
Operating margin % 19.1 19.3 14.8 15.1 14.6
Return on average invested capital (ROIC) % - - 8.0 7.8 8.0
Equity ratio % - - 46.1 45.9 45.6
Debt/equity ratio (f inancial gearing) x - - 0.44 0.42 0.44
Interest cover x - - 7.04 5.79 5.53
Stock market ratios
Earnings per share (EPS) DKK 14.5 14.0 28.5 35.5 36.8
Earnings per share (EPS) (adjusted)* DKK 14.7 14.1 29.4 28.1 36.1
Cash f low from operating activities per
share (CFPS) DKK 23.0 22.5 44.3 44.0 64.6
Free cash f low per share (FCFPS) DKK 16.9 16.5 16.4 33.7 38.6
Share price (B-shares) DKK - - 568 511 554
Number of shares (period-end, excl. Trasury
shares) 1,000 - - 152,547 152,555 152,555
Number of shares (average, excl. Treasury
shares) 1,000 152,550 152,553 152,550 152,545 152,543
* Adjusted for special items net of tax.
www.carlsberggroup.com
Company announcement 11/2013
13 November 2013
Page 3 of 30
BUSINESS DEVELOPMENT
Group financial highlights
Group beer volumes declined organically by 2% (Q3: -5%) with reported beer volumes being flat.
Growing volumes in Asia were not enough to offset the volume decline in Eastern and Western
Europe. Other beverages grew organically by 3% (Q3: +2%).
Net revenue was DKK 50,891m as a result of 1% organic growth (total beverage volume of -1%
and +2% price/mix), -2% from currencies and a net acquisition impact of +1%. The negative
currency impact was mainly due to weaker currencies in Russia, Malawi and the UK while the
acquisition impact mainly related to the Nordic Getränke distribution company in Germany.
Organic net revenue declined by 1% in Q3 due to the weak volume development in Eastern
Europe, while price/mix was a positive 3% for the quarter. The negative currency impact
accelerated in Q3, driven by currencies in Russia, the UK, Norway and Malawi and several Asian
currencies.
Cost of goods sold per hl increased organically by approximately 1% (Q3: +1%). However, due to
the positive price/mix, gross profit per hl grew organically by approximately 4% (Q3: +6%). Total
gross profit grew organically by 2% (Q3: +1%).
Operating expenses grew by 1% (Q3: -1%). In total, BSP1-related costs were approximately DKK
290m, in line with plans. Excluding the BSP1-related costs, operating expenses declined by 1%
(Q3: -2%).
Consequently, Group operating profit was DKK 7,522m with 2% organic growth (Q3: flat).
Adjusted for the BSP1-related costs, organic operating profit growth was 6%. All three regions
delivered organic operating profit growth with particularly strong growth in Asia.
Adjusted net profit (adjusted for post-tax impact of special items) grew 5% to DKK 4,488m
versus DKK 4,288m last year (Q3: +4%). Reported net profit was DKK 4,344m (2012: DKK
DKK million Change
2012 Organic Acq., net FX 2013 Reported
Q3
Beer (million hl) 34.1 -5% 1% 32.7 -4%
Other beverages (million hl) 5.2 2% 1% 5.3 3%
Net revenue 18,587 -1% 2% -4% 17,973 -3%
Operating profit 3,596 0% 0% -5% 3,426 -5%
Operating margin (%) 19.3 19.1 -20bp
9 mths
Beer (million hl) 93.3 -2% 2% 92.8 0%
Other beverages (million hl) 14.6 3% 0% 15.0 3%
Net revenue 50,698 1% 1% -2% 50,891 0%
Operating profit 7,641 2% 0% -4% 7,522 -2%
Operating margin (%) 15.1 14.8 -30bp
Change
www.carlsberggroup.com
Company announcement 11/2013
13 November 2013
Page 4 of 30
5,415m). Last year’s net profit was positively impacted by the disposal of the Copenhagen
brewery site.
Free operating cash flow was DKK 3,071m (2012: DKK 3,451m) as a slight increase in cash flow
from operating activities was off-set by higher operating investments. The efforts to reduce
average trade working capital continued and average trade working capital to net revenue
improved to 0.3% (MAT) end of Q3 2013 vs 1.3% at the end of Q3 2012. Free cash flow was DKK
2,501m versus DKK 5,146m last year. The main difference is last year’s proceeds from the
disposal of the Copenhagen brewery site.
Group operational highlights
The Group continued the positive market share trend across regions in spite of tough
comparables with last year’s strong performance during the EURO 2012. The solid market share
performance was achieved through a combination of further investments in and roll-out of our
international premium brands, good performance of our local power brands; a high level of
innovations; and the continued local deployment and application of our sales and marketing
tools.
In Q3, the Carlsberg brand grew 5% in its premium markets but declined 5% for the nine months,
cycling last year’s EURO 2012 activations where the brand grew 9%. The brand continued its
strong performance in Asia, particularly in China and India. During the year, we rolled out the
innovative music engagement programme ‚Where’s the Party‛ in 20 markets; renewed our long-
standing partnership with Liverpool FC; and started activation of our English Premier League
sponsorship.
The Tuborg brand continued its strong growth. The nine month growth was 12% which was
driven by a strong Asian performance, not least in China and India, The rejuvenation programme
continued with key initiatives being the launch of Tuborg Booster in India, the Tuborg 3G bottle
in the UK and the launch of ‘Skøll by Tuborg’ in France.
Somersby continued its strong progress and grew 80%. Major drivers behind the growth were
the on-going positive performance in Poland following last year’s launch; line extensions in
established markets; and the launch in the UK. The brand was launched in three new markets in
2013.
The Group’s Belgian Abbey Beer Grimbergen continued its successful expansion in 2013 and is
now available in 31 markets globally. During 2013, Grimbergen was launched in Denmark and
Poland and the brand has recently been launched in Russia.
The BSP1 project was implemented in Sweden in April. Norway went live in early November and
we are now entering the final preparations for implementation in the UK. The implementation
process is running according to schedule.
www.carlsberggroup.com
Company announcement 11/2013
13 November 2013
Page 5 of 30
Structural changes
In the first nine months of 2013, the Group took several steps to further strengthen the
company’s growth profile. All these initiatives took place in Asia.
In August, we started the construction of the first international brewery in Myanmar. The
brewery is expected to be operational in late 2014.
In October, we initiated the construction of a new brewery in the Yunnan province in
China. The brewery is expected to be operational in 2015.
We launched the partial take-over offer of up to 30.29% of the shares in Chongqing
Brewery Company Co. Ltd.
We increased our shareholdings in the Qinghai and Lanzhou joint ventures to 50% and
increased our shareholding in Lao Brewery by 10% to 61%.
Unchanged 2013 earnings expectations despite a continued Russian market decline
Due to tight cost control measures across all markets and functions, a solid performance by our
Western European and Asian businesses, and slightly lower financial items, we keep our earnings
outlook unchanged:
Operating profit before special items of around DKK 10bn.
Adjusted net profit1 to increase by a mid-single-digit percentage.
Based on the Russian beer market dynamics up until late October, we have adjusted our
expectations to this year’s Russian beer market. The disruption from the changed retail
landscape due to the closures of non-permanent outlets and the slower growth of the Russian
economy, which has deteriorated consumer sentiment further, continue to impact the beer
market negatively. Hence, we now assume the Russian beer market to decline by high-single
digit percentages this year.
For 2013, the Carlsberg Group expects beer market dynamics in Asia and Western Europe to be
similar to 2012.
Reported cost of goods sold per hl is expected to be flat with limited variation between the three
regions.
The Group will continue to drive a focused commercial agenda, balancing volume and value
share. For 2013, we expect sales and marketing investments to revenue to remain at the same
level as last year.
Costs associated with the roll-out of the integrated supply chain and business standardisation
project in Western Europe are now expected to impact Group operating profit in 2013 by close to
DKK 400m.
1 Adjusted for special items after tax.

www.carlsberggroup.com
Company announcement 11/2013
13 November 2013
Page 6 of 30
Average all-in cost of debt is now assumed to be 75-100bp lower than in 2012.
The tax rate is expected to be 24-25%.
Capital expenditures are now expected to be around 10% higher than in 2012.
The outlook is based on an average EUR/RUB exchange rate of 42 (YTD September average of
41.6; an EUR/RUB change of +/- 1 impacts Group operating profit by slightly less than +/- DKK
100m). Due to the strength of the DKK compared to most currencies, the negative translation
impact from weaker currencies is expected to be slightly higher than previously anticipated.
WESTERN EUROPE
The Western European beer market declined by an estimated 2% impacted by the continued
challenging macro and consumer environment and tough comparison with the EURO event in
2012. In Q3, the market grew by an estimated 1% due to favourable weather across the region,
except for Poland. Overall, our market share was slightly up with growing market share in
Sweden, Norway, Finland, Poland, Portugal and Greece.
Our commercial activities remained at a high level. In addition to the ongoing roll-out of our
international premium brands in new markets, there were a number of new product launches
and roll-out of innovations during the period. A few examples are the introduction of Carlsberg
Citrus and Somersby in the UK, Skøll by Tuborg in France, and the further geographical
expansion of Radler products, Garage Hard Lemonade and the DraughtMaster™ technology.
Beer volumes declined organically by 3%. Excluding the Q1 destocking in France, beer volumes
declined by an estimated 2%. Beer volumes were flat or grew in markets such as Finland,
Norway, Poland, Sweden, Italy and Greece, driven primarily by market share growth. In Q3, beer
volumes grew organically by 2% driven by strong execution and favourable weather. The
volume of other beverages grew organically by 2% (Q3: +3%).
DKK million Change
2012 Organic Acq., net FX 2013 Reported
Q3
Beer (million hl) 13.9 2% 0% 14.1 2%
Other beverages (million hl) 4.0 3% 1% 4.1 4%
Net revenue 10,361 4% 4% -2% 10,939 6%
Operating profit 1,807 12% 1% -2% 2,014 11%
Operating margin (%) 17.4 18.4 100bp
9 mths
Beer (million hl) 38.6 -3% 0% 37.6 -3%
Other beverages (million hl) 10.9 2% 1% 11.2 3%
Net revenue 28,552 1% 3% -1% 29,470 3%
Operating profit 4,083 3% 0% -1% 4,177 2%
Operating margin (%) 14.3 14.2 -10bp
Change

www.carlsberggroup.com
Company announcement 11/2013
13 November 2013
Page 7 of 30
In Poland, we grew our volumes by 4% driven by a strong market share gain. The overall market
declined due to tough EURO 2012 comparisons. Price/mix continued to improve slightly and our
volume and value market share improved strongly underpinned by a strong performance by the
Kasztelan, Okocim and Harnas brands. The launch of Somersby in the Polish market has been
very successful and Poland is now the brand’s largest market.
In France, we implemented an almost 15% price increase at the beginning of the year to recover
the 160% excise tax increase. Following a strong Q3 that was positively impacted by favourable
weather, the market decline year-to-date was an estimated 3% (-7% in H1). Adjusted for the
destocking impact in Q1, our volumes declined by an estimated 4% (11% including destocking).
For the first time in a long period, our market share improved in Q3 driven by good performances
by Kronenbourg 1664, Grimbergen and Skøll by Tuborg. Year-to-date market share declined
slightly.
The UK market declined by approximately 1%, positively impacted by favourable weather in Q3.
We continued to strengthen our market share in the on-trade while our off-trade market share
declined, mainly due to the impact from last year’s strong EURO 2012 performance in Q2.
Somersby and Carlsberg Citrus were launched nationally with promising initial results.
Volumes in the Nordics were flat in spite of slightly declining volumes in Denmark. We gained
market share in three out of the four Nordic markets. In particular Sweden and Norway delivered
very good results while introducing BSP1 into the businesses this year.
In the Baltic States, our volumes declined slightly, although we saw a strong improvement in Q3.
In Q3, we announced plans to close our main brewery in Latvia and focus on craft beer
production.
Net revenue grew organically by 1% to DKK 29,470m (Q3: +4%). Due to our successful value
management efforts and price increases across the markets, the region delivered a strong
price/mix of +2% (Q3: +2%).
Operating profit grew organically by 3% to DKK 4,177m (Q3: +12%) despite the negative earnings
impact from the French destocking in Q1 and the BSP1 implementation costs. Adjusted for the
French destocking impact and BSP1 costs, operating profit would have increased organically by
high single-digit percentages. The earnings improvement was driven by an overall tight cost
control, the positive price/mix and supply chain savings. Operating profit margin declined by 10bp
(Q3: +100bp) to 14.2% (Q3: 18.4%).

www.carlsberggroup.com
Company announcement 11/2013
13 November 2013
Page 8 of 30
EASTERN EUROPE
The difficult market environment in Russia continued in Q3. The Russian beer market declined by
an estimated 7% (Q3: estimated -9%), mainly driven by the outlet restrictions; very unfavourable
weather in September; and weaker economic growth and consumer sentiment. As a result of
these factors, the Group now expects the Russian beer market to decline by high-single-digit
percentages in 2013.
Our Russian volume market share grew by approximately 40bp to 38.7% for the nine months
with our value market share showing similar positive dynamics. The market share improvement
was broadly based in both modern and traditional trade, and across most regions, with
particularly strong performances in the super premium and mainstream segments. Brands such
as Holsten, Baltika 0, Baltika Cooler, Zatecky Gus and Zhigulevskoe did particularly well, while
Baltika 7 was impacted by outlet restrictions. In Q3, our value share grew despite our volume
share being flat, both versus Q3 2012 and previous quarter (39.0%) (source: Nielsen Retail Audit,
Urban & Rural Russia).
The Ukrainian market declined by an estimated 6-7% due to the macro-economic slow-down
and unfavourable weather. The market was particularly weak in June, mainly as a result of last
year’s EURO 2012, and in September, due to very poor weather.
Beer volumes declined organically by 4% to 32.9m hl. Our Q3 volumes declined by 15%, mainly
due to the expected destocking among our Russian distributors in Q3 and the underlying market
decline in Russia and Ukraine.
The level of commercial activities remained at a high level across the region. In Russia, several
line extensions of Baltika, such as Baltika Praha and Baltika Munich, were launched and we
introduced Grimbergen with good initial results. In addition, the sponsorships of the Sochi
Olympic Games and the Russian National Hockey League are being activated. The rejuvenated
Tuborg was launched in more markets in the region.
DKK million Change
2012 Organic Acq., net FX 2013 Reported
Q3
Beer (million hl) 13.0 -15% 0% 11.0 -15%
Other beverages (million hl) 0.5 -15% 0% 0.5 -15%
Net revenue 5,805 -14% 0% -7% 4,598 -21%
Operating profit 1,600 -12% 0% -7% 1,297 -19%
Operating margin (%) 27.6 28.2 60bp
9 mths
Beer (million hl) 34.3 -4% 0% 32.9 -4%
Other beverages (million hl) 1.6 -6% 0% 1.5 -6%
Net revenue 15,022 -5% 0% -4% 13,745 -9%
Operating profit 3,128 1% 0% -5% 2,988 -4%
Operating margin (%) 20.8 21.7 90bp
Change
www.carlsberggroup.com
Company announcement 11/2013
13 November 2013
Page 9 of 30
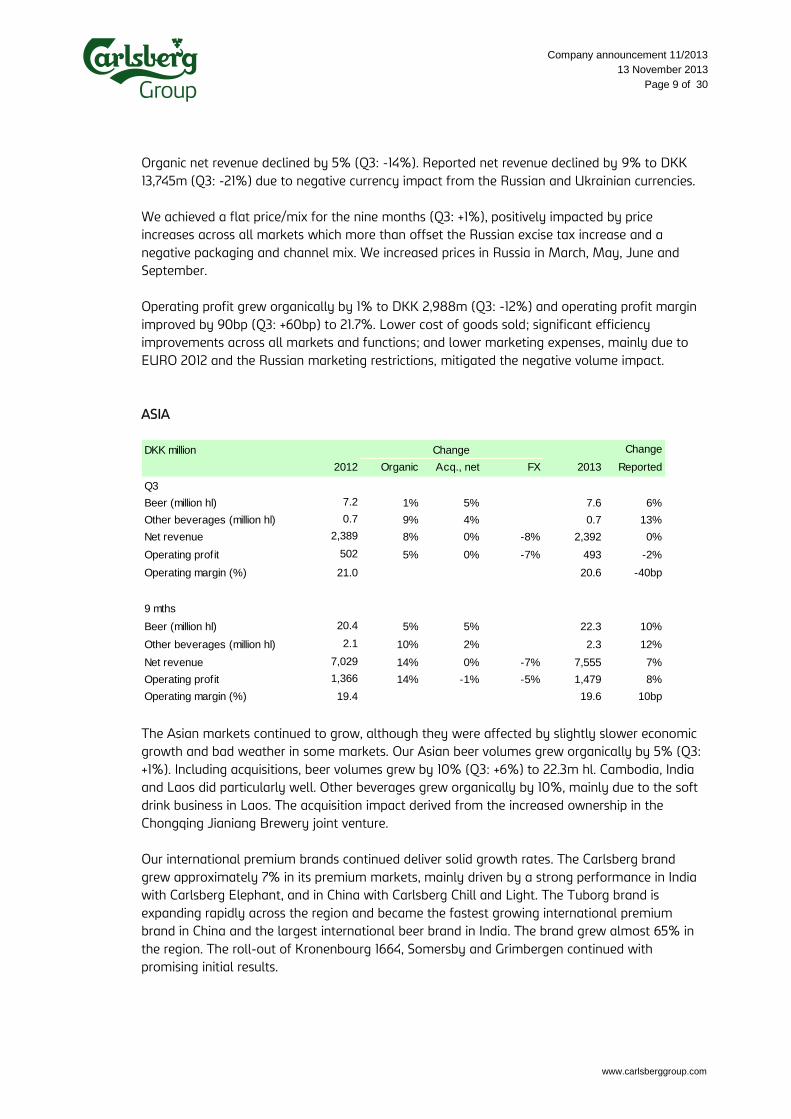
Organic net revenue declined by 5% (Q3: -14%). Reported net revenue declined by 9% to DKK
13,745m (Q3: -21%) due to negative currency impact from the Russian and Ukrainian currencies.
We achieved a flat price/mix for the nine months (Q3: +1%), positively impacted by price
increases across all markets which more than offset the Russian excise tax increase and a
negative packaging and channel mix. We increased prices in Russia in March, May, June and
September.
Operating profit grew organically by 1% to DKK 2,988m (Q3: -12%) and operating profit margin
improved by 90bp (Q3: +60bp) to 21.7%. Lower cost of goods sold; significant efficiency
improvements across all markets and functions; and lower marketing expenses, mainly due to
EURO 2012 and the Russian marketing restrictions, mitigated the negative volume impact.
ASIA
The Asian markets continued to grow, although they were affected by slightly slower economic
growth and bad weather in some markets. Our Asian beer volumes grew organically by 5% (Q3:
+1%). Including acquisitions, beer volumes grew by 10% (Q3: +6%) to 22.3m hl. Cambodia, India
and Laos did particularly well. Other beverages grew organically by 10%, mainly due to the soft
drink business in Laos. The acquisition impact derived from the increased ownership in the
Chongqing Jianiang Brewery joint venture.
Our international premium brands continued deliver solid growth rates. The Carlsberg brand
grew approximately 7% in its premium markets, mainly driven by a strong performance in India
with Carlsberg Elephant, and in China with Carlsberg Chill and Light. The Tuborg brand is
expanding rapidly across the region and became the fastest growing international premium
brand in China and the largest international beer brand in India. The brand grew almost 65% in
the region. The roll-out of Kronenbourg 1664, Somersby and Grimbergen continued with
promising initial results.
DKK million Change
2012 Organic Acq., net FX 2013 Reported
Q3
Beer (million hl) 7.2 1% 5% 7.6 6%
Other beverages (million hl) 0.7 9% 4% 0.7 13%
Net revenue 2,389 8% 0% -8% 2,392 0%
Operating profit 502 5% 0% -7% 493 -2%
Operating margin (%) 21.0 20.6 -40bp
9 mths
Beer (million hl) 20.4 5% 5% 22.3 10%
Other beverages (million hl) 2.1 10% 2% 2.3 12%
Net revenue 7,029 14% 0% -7% 7,555 7%
Operating profit 1,366 14% -1% -5% 1,479 8%
Operating margin (%) 19.4 19.6 10bp
Change
www.carlsberggroup.com
Company announcement 11/2013
13 November 2013
Page 10 of 30
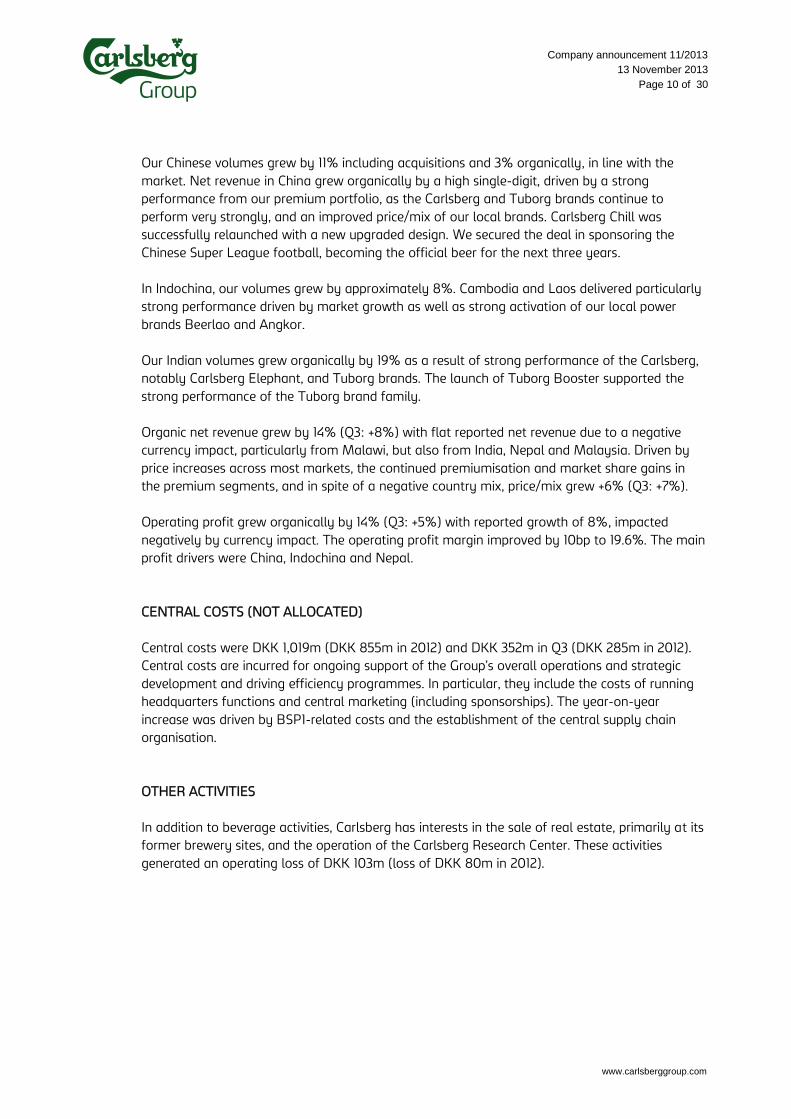
Our Chinese volumes grew by 11% including acquisitions and 3% organically, in line with the
market. Net revenue in China grew organically by a high single-digit, driven by a strong
performance from our premium portfolio, as the Carlsberg and Tuborg brands continue to
perform very strongly, and an improved price/mix of our local brands. Carlsberg Chill was
successfully relaunched with a new upgraded design. We secured the deal in sponsoring the
Chinese Super League football, becoming the official beer for the next three years.
In Indochina, our volumes grew by approximately 8%. Cambodia and Laos delivered particularly
strong performance driven by market growth as well as strong activation of our local power
brands Beerlao and Angkor.
Our Indian volumes grew organically by 19% as a result of strong performance of the Carlsberg,
notably Carlsberg Elephant, and Tuborg brands. The launch of Tuborg Booster supported the
strong performance of the Tuborg brand family.
Organic net revenue grew by 14% (Q3: +8%) with flat reported net revenue due to a negative
currency impact, particularly from Malawi, but also from India, Nepal and Malaysia. Driven by
price increases across most markets, the continued premiumisation and market share gains in
the premium segments, and in spite of a negative country mix, price/mix grew +6% (Q3: +7%).
Operating profit grew organically by 14% (Q3: +5%) with reported growth of 8%, impacted
negatively by currency impact. The operating profit margin improved by 10bp to 19.6%. The main
profit drivers were China, Indochina and Nepal.
CENTRAL COSTS (NOT ALLOCATED)
Central costs were DKK 1,019m (DKK 855m in 2012) and DKK 352m in Q3 (DKK 285m in 2012).
Central costs are incurred for ongoing support of the Group’s overall operations and strategic
development and driving efficiency programmes. In particular, they include the costs of running
headquarters functions and central marketing (including sponsorships). The year-on-year
increase was driven by BSP1-related costs and the establishment of the central supply chain
organisation.
OTHER ACTIVITIES
In addition to beverage activities, Carlsberg has interests in the sale of real estate, primarily at its
former brewery sites, and the operation of the Carlsberg Research Center. These activities
generated an operating loss of DKK 103m (loss of DKK 80m in 2012).
www.carlsberggroup.com
Company announcement 11/2013
13 November 2013
Page 11 of 30
COMMENTS ON THE FINANCIAL STATEMENTS
ACCOUNTING POLICIES
The present interim report has been prepared in accordance with IAS 34 Interim Financial
Reporting, as adopted by the EU, and Danish regulations governing presentation of interim
reports by listed companies.
Except for the below described changes, the interim report has been prepared using the same
accounting policies as the consolidated financial statements for 2012. The consolidated financial
statements for 2012, note 42, holds a complete description of the accounting policies.
As of 1 January 2013, the Carlsberg Group has changed the presentation of listing fees in Russia.
According to the Group’s accounting policies, specific listing fees closely related to the sale of
beer are presented as discounts reducing net revenue. Listing fees in Russia were previously
included in sales and distribution in line with the main nature of the activities in prior years, but
are now presented as discounts due to the changed nature of the activities, following the change
in cooperation with and services provided by retailers as a result of the changes in Russian
marketing regulation. Comparative figures for 2012 have been restated accordingly.
IFRS 13 ‚Fair Value Measurement‛ and the amendments to IAS 19 ‚Employee Benefits‛, IAS 1
‚Other Comprehensive Income‛, IFRS 7 ‚Disclosures – Offsetting Financial Assets and Financial
Liabilities‛ and IAS 32 ‚Offsetting Financial Assets and Financial Liabilities‛ have been
implemented from 1 January 2013. The new and amended standards have changed the
presentation of other comprehensive income and valuation of assets in employee benefits. The
changes have not had any significant impact on the quarterly financial statement.
IFRS 10-12 and the amendments to IAS 27-28 have not yet been implemented. The standards
will be implemented 1 January 2014, when they become applicable within the EU. This will
impact the Carlsberg Group’s pro-rata consolidated companies such as Unicer and Cambrew that
currently are pro-rata consolidated. From 1 January 2014 pro-rata consolidated entities will be
included as associated companies.
INCOME STATEMENT
Net special items (pre-tax) include costs related to restructuring measures across the Group and
amounted to DKK -198m against DKK 1,391m in 2012. In 2012, special items were positively
impacted by DKK 1.7bn related to the sale of the Copenhagen brewery site. A specification of
special items is included in note 4.
Net financial items amounted to DKK -1,069m against DKK -1,320m in 2012. Net interest costs
were DKK -1,123m, compared with DKK -1,184m in 2012 and other net financial items were DKK
54m against DKK -136m last year. Net financial items were in total impacted by lower average
funding costs.
Tax totalled DKK -1,557m against DKK -1,776m in 2012.

www.carlsberggroup.com
Company announcement 11/2013
13 November 2013
Page 12 of 30
Carlsberg’s share of net profit was DKK 4,344m. Adjusted net profit (adjusted for post-tax impact
of special items) was DKK 4,488m compared with DKK 4,288m in 2012.
STATEMENT OF FINANCIAL POSITION
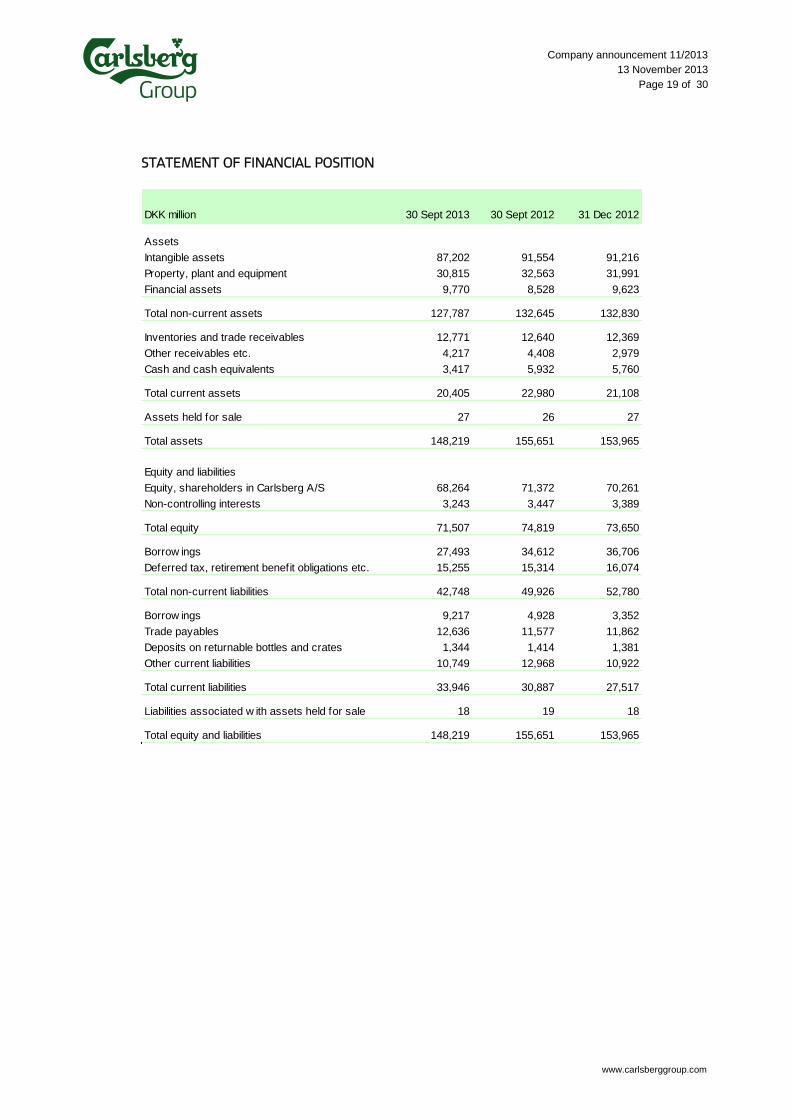
At 30 September 2013, Carlsberg had total assets of DKK 148.2bn against DKK 154.0bn at 31
December 2012.
Assets
Total assets decreased by DKK 5.8bn to DKK 148.2bn at 30 September 2013 (DKK 154.0bn at 31
December 2012).
Intangible assets decreased to DKK 87.2bn (DKK 91.2bn at 31 December 2012), mainly because of
foreign exchange adjustments of DKK -4.5bn, primarily related to Russia.
Property, plant and equipment decreased to DKK 30.8bn against DKK 32.0bn at 31 December
2012, mainly driven by net foreign exchange adjustments of DKK -1.3bn, primarily related to
Russia.
Cash decreased from DKK 5.8bn at 31 December 2012 to DKK 3.4bn at 30 September 2013,
mainly due to paid dividends.
Other receivables etc. totalled DKK 4.2bn against DKK 3.0bn at 31 December 2012. The change
was mainly due to prepayments in relation to the partial takeover offer of Chongqing and
prepayments in connection with the EURO 2016 and the English Premier League sponsorships.
Liabilities
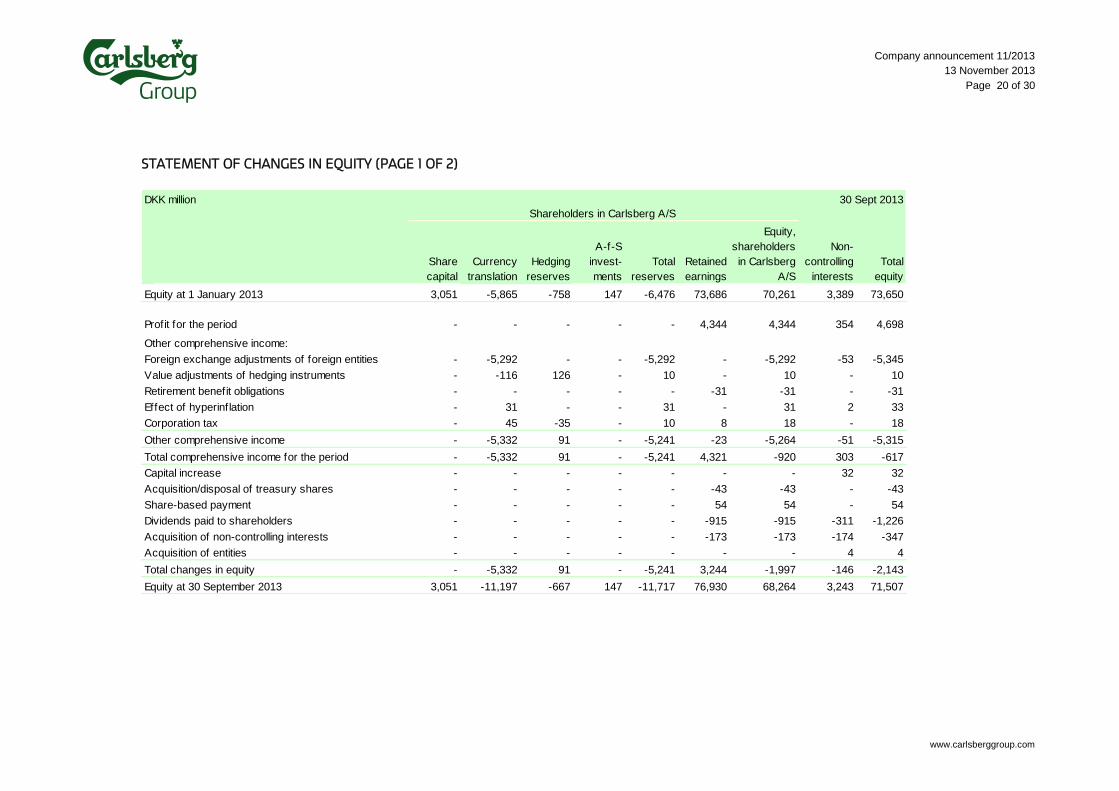
Equity decreased to DKK 71.5bn compared DKK 73.7bn at 31 December 2012. DKK 68.3bn were
attributed to shareholders in Carlsberg A/S and DKK 3.2bn to non-controlling interests.
The difference in equity of DKK -2.2bn was mainly due to profit for the period of DKK 4.7bn,
foreign exchange losses of DKK -5.3bn, payment of dividends to shareholders of DKK -1.2bn, and
acquisition of non-controlling interests of DKK -0.3bn.
Liabilities decreased to DKK 76.7bn compared to DKK 80.3bn at 31 December 2012. The decrease
was mainly due to lower borrowings. Lower deferred tax liabilities were off-set by an increase in
trade payables.
The increase in current borrowings to DKK 9.2bn from DKK 3.4bn was due to a GBP bond of 1bn
maturing in May 2014 and which has consequently moved from non-current to current
borrowings.

www.carlsberggroup.com
Company announcement 11/2013
13 November 2013
Page 13 of 30
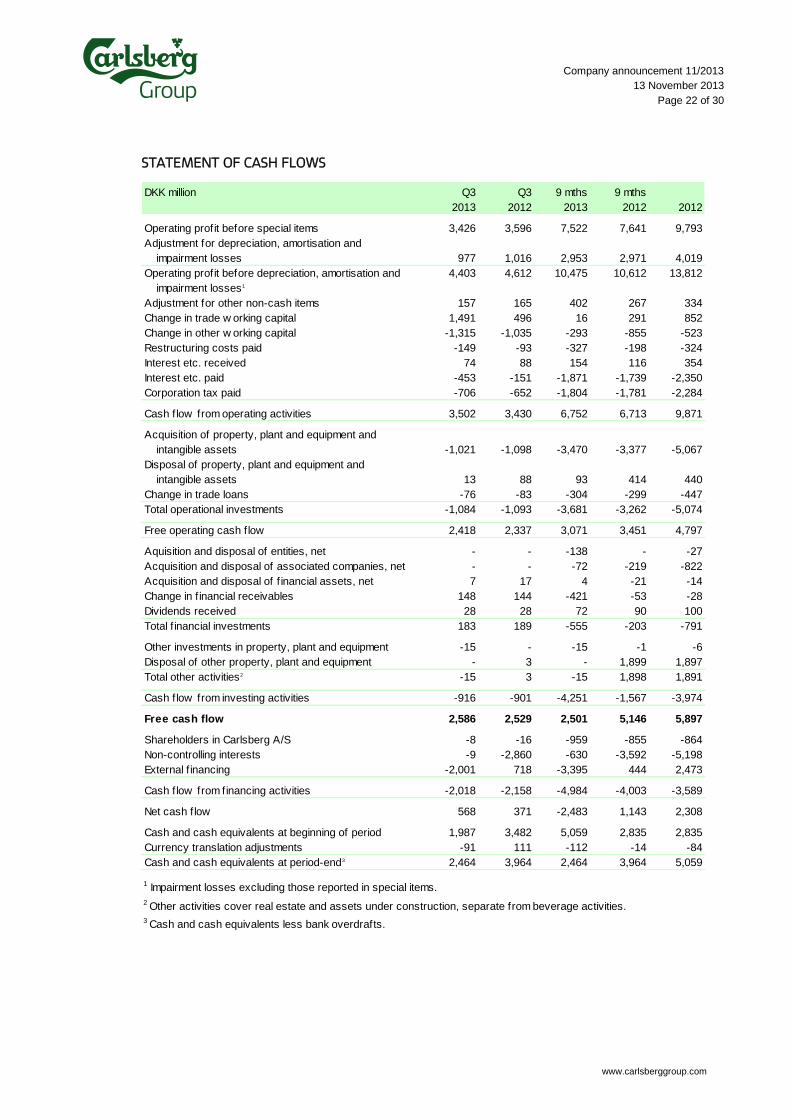
CASH FLOW
Operating profit before depreciation and amortisation was DKK 10,475m (DKK 10,612m in 2012).
The change in trade working capital was DKK 16m (DKK 291m in 2012), impacted by higher trade
receivables at the end of September than last year, primarily due to higher sales in Western
Europe. Other working capital was DKK -293m (DKK -855m in Q3 2012), impacted positively by
higher duties and VAT payables, also due to the higher sales. Trade working capital to net
revenue (MAT) was 0.3% at the end of Q3 2013 versus 1.3% at the end of Q3 2012 and 1.0% at
the end of 2012.
Paid net interest etc. amounted to DKK -1,717m (DKK -1,623m in 2012).
Cash flow from operating activities was DKK 6,752m, on par with last year (DKK 6,713m in 2012).
Cash flow from investing activities amounted to DKK -4,251m against DKK -1,567m in 2012. In
2012, cash flow from investing activities was positively impacted by the proceeds from the sale of
the Copenhagen brewery site of DKK 1.9bn. Financial investments were impacted by pre-
payments made in the spring of 2013 related to the acquisition of shares in Chongqing.
Free cash flow was DKK 2,501m against DKK 5,146m in 2012.
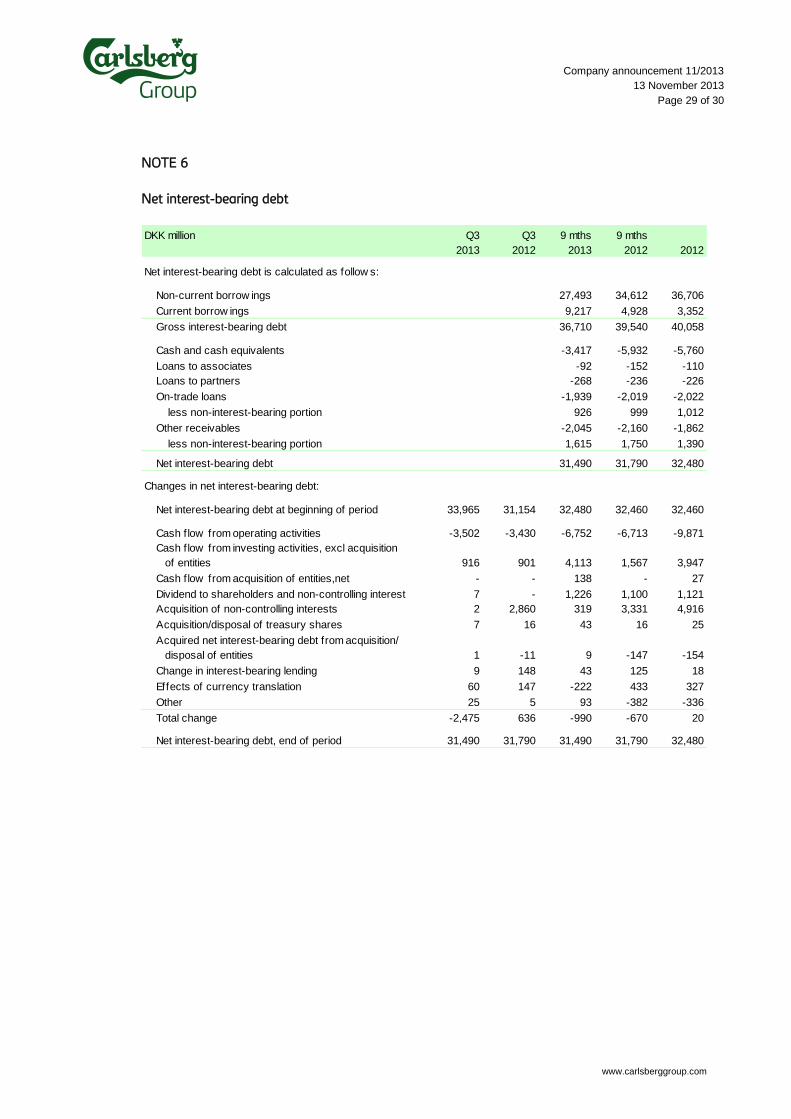
FINANCING
At 30 September 2013, the gross interest-bearing debt amounted to DKK 36.7bn and net interest-
bearing debt amounted to DKK 31.5bn. The difference of DKK 5.2bn was other interest-bearing
assets, including DKK 3.4bn in cash and cash equivalents.
Of the gross interest-bearing debt, 75% (DKK 27.5bn) was long term, i.e. with maturity more
than one year from 30 September 2013. The net interest-bearing debt consisted primarily of
facilities in EUR and approximately 66% was fixed interest (fixed-interest period exceeding one
year).
www.carlsberggroup.com
Company announcement 11/2013
13 November 2013
Page 14 of 30
AMENDMENT OF THE CARLSBERG FOUNDATION's CHARTER
The Danish Ministry of Justice/Civil Affairs Authority has approved the amendment of the
Carlsberg Foundation's charter.
Reference is made to the stock exchange announcement of 25 October 2013 presenting the
application to amend the charter in greater detail.
FINANCIAL CALENDAR
The financial year follows the calendar year, and the following schedule has been set for 2014:
2014
19 February 2014 Financial statement as at 31 December 2013
7 May 2014 Interim results for Q1 2014
20 August 2014 Interim results for Q2 2014
10 November 2014 Interim results for Q3 2014
Carlsberg’s communication with investors, analysts and the press is subject to special restrictions
during a four-week period prior to the publication of interim and annual financial statements.
DISCLAIMER
This Company Announcement contains forward-looking statements, including statements about
the Group’s sales, revenues, earnings, spending, margins, cash flow, inventory, products, actions,
plans, strategies, objectives and guidance with respect to the Group's future operating results.
Forward-looking statements include, without limitation, any statement that may predict,
forecast, indicate or imply future results, performance or achievements, and may contain the
words "believe", "anticipate", "expect", "estimate", "intend", "plan", "project", "will be", "will continue",
"will result", "could", "may", "might", or any variations of such words or other words with similar
meanings. Any such statements are subject to risks and uncertainties that could cause the
Group's actual results to differ materially from the results discussed in such forward-looking
statements. Prospective information is based on management’s then current expectations or
forecasts. Such information is subject to the risk that such expectations or forecasts, or the
assumptions underlying such expectations or forecasts, may change. The Group assumes no
obligation to update any such forward-looking statements to reflect actual results, changes in
assumptions or changes in other factors affecting such forward-looking statements.
Some important risk factors that could cause the Group's actual results to differ materially from
those expressed in its forward-looking statements include, but are not limited to: economic and
political uncertainty (including interest rates and exchange rates), financial and regulatory
developments, demand for the Group's products, increasing industry consolidation, competition
www.carlsberggroup.com
Company announcement 11/2013
13 November 2013
Page 15 of 30
from other breweries, the availability and pricing of raw materials and packaging materials, cost
of energy, production- and distribution-related issues, information technology failures, breach or
unexpected termination of contracts, price reductions resulting from market-driven price
reductions, market acceptance of new products, changes in consumer preferences, launches of
rival products, stipulation of market value in the opening balance sheet of acquired entities,
litigation, environmental issues and other unforeseen factors. New risk factors can arise, and it
may not be possible for management to predict all such risk factors, nor to assess the impact of
all such risk factors on the Group's business or the extent to which any individual risk factor, or
combination of factors, may cause results to differ materially from those contained in any
forward-looking statement. Accordingly, forward-looking statements should not be relied on as
a prediction of actual results.
MANAGEMENT STATEMENT
The Supervisory Board and the Executive Board have discussed and approved the interim report
of the Carlsberg Group for the period 1 January – 30 September 2013.
The interim report which has not been audited or reviewed by the Company's auditor has been
prepared in accordance with IAS 34 Interim Financial Reporting, as adopted by the EU, and
additional Danish interim reporting requirements for listed companies.
In our opinion, the interim report gives a true and fair view of the Carlsberg Group’s assets,
liabilities and financial position at 30 September 2013, and of the results of the Carlsberg Group’s
operations and cash flow for the period 1 January – 30 September 2013. Further, in our opinion
the management's review (p. 1-14) gives a true and fair review of the development in the Group's
operations and financial matters, the result of the Carlsberg Group for the period and the
financial position as a whole, and describes the significant risks and uncertainties pertaining to
the Group.
Copenhagen, 13 November 2013
Executive Board of Carlsberg A/S
Jørgen Buhl Rasmussen Jørn P. Jensen
President & CEO Deputy CEO & CFO
Supervisory Board of Carlsberg A/S
Flemming Besenbacher Jess Søderberg Hans Andersen
Chairman Deputy Chairman
Richard Burrows Donna Cordner Elisabeth Fleuriot
Kees van der Graaf Thomas Knudsen Søren-Peter Fuchs Olesen
Bent Ole Petersen Nina Smith Peter Petersen
Lars Stemmerik Per Øhrgaard

www.carlsberggroup.com
Company announcement 11/2013
13 November 2013
Page 16 of 30
FINANCIAL STATEMENT
Income statement
Statement of comprehensive income
Statement of financial position
Statement of changes in equity
Statement of cash flows
Note 1 Segment reporting by region (beverages)
Note 2 Segment reporting by activity
Note 3 Segment reporting by quarter
Note 4 Special items
Note 5 Debt and credit facilities
Note 6 Net interest-bearing debt
Note 7 Acquisition of entities
This statement is available in Danish and English. In the event of any discrepancy between the
two versions, the Danish version shall prevail.
The Carlsberg Group is one of the leading brewery groups in the world, with a large portfolio of beer and other beverage
brands. Our flagship brand – Carlsberg – is one of the best-known beer brands in the world and the Baltika, Carlsberg
and Tuborg brands are among the eight biggest brands in Europe. More than 41,000 people work for the Carlsberg
Group, and our products are sold in more than 150 markets. In 2012, the Carlsberg Group sold 120 million hectolitres of
beer, which is about 36 billion bottles of beer.
Find out more at www.carlsberggroup.com.
www.carlsberggroup.com
Company announcement 11/2013
13 November 2013
Page 17 of 30
INCOME STATEMENT
DKK million Q3 Q3 9 mths 9 mths
2013 2012 2013 2012 2012
Net revenue 17,973 18,587 50,891 50,698 66,468
Cost of sales -8,789 -9,195 -25,749 -25,720 -33,831
Gross profit 9,184 9,392 25,142 24,978 32,637
Sales and distribution expenses -4,738 -4,820 -14,354 -14,456 -18,912
Administrative expenses -1,074 -1,041 -3,404 -3,115 -4,185
Other operating income, net -16 26 14 140 145
Share of profit after tax, associates 70 39 124 94 108
Operating profit before special items 3,426 3,596 7,522 7,641 9,793
Special items, net -45 -6 -198 1,391 85
Financial income -96 441 716 832 900
Financial expenses -199 -883 -1,785 -2,152 -2,672
Profit before tax 3,086 3,148 6,255 7,712 8,106
Corporation tax -765 -787 -1,557 -1,776 -1,861
Consolidated profit 2,321 2,361 4,698 5,936 6,245
Attributable to:
Non-controlling interests 113 225 354 521 638
Shareholders in Carlsberg A/S 2,208 2,136 4,344 5,415 5,607
Earnings per share 14.5 14.0 28.5 35.5 36.8
Earnings per share, diluted 14.4 14.0 28.4 35.5 36.7
www.carlsberggroup.com
Company announcement 11/2013
13 November 2013
Page 18 of 30
STATEMENT OF COMPREHENSIVE INCOME
DKK million Q3 Q3 9 mths 9 mths
2013 2012 2013 2012 2012
Profit for the period 2,321 2,361 4,698 5,936 6,245
Other comprehensive income:
Retirement benefit obligations 3 -31 -31 -168 -741
Share of other comprehensive income in associates - - - - 4
Corporation tax relating to items that w ill not be reclassif ied -1 -20 8 11 131
Items that w ill not be reclassif ied to the income statement: 2 -51 -23 -157 -606
Foreign exchange adjustments of foreign entities -1,965 2,039 -5,345 2,731 1,904
Value adjustments of hedging instruments 1 -2 10 -26 111
Effect of hyperinflation 6 27 33 57 75
Other -21 -1 - -1 -2
Corporation tax relating to items that may be reclassif ied -2 16 10 18 -43
Items that may be reclassif ied to the income statement: -1,981 2,079 -5,292 2,779 2,045
Other comprehensive income -1,979 2,028 -5,315 2,622 1,439
Total comprehensive income 342 4,389 -617 8,558 7,684
Attributable to:
Non-controlling interests -35 230 303 554 582
Shareholders in Carlsberg A/S 377 4,159 -920 8,004 7,102
www.carlsberggroup.com
Company announcement 11/2013
13 November 2013
Page 19 of 30
STATEMENT OF FINANCIAL POSITION
DKK million 30 Sept 2013 30 Sept 2012 31 Dec 2012
Assets
Intangible assets 87,202 91,554 91,216
Property, plant and equipment 30,815 32,563 31,991
Financial assets 9,770 8,528 9,623
Total non-current assets 127,787 132,645 132,830
Inventories and trade receivables 12,771 12,640 12,369
Other receivables etc. 4,217 4,408 2,979
Cash and cash equivalents 3,417 5,932 5,760
Total current assets 20,405 22,980 21,108
Assets held for sale 27 26 27
Total assets 148,219 155,651 153,965
Equity and liabilities
Equity, shareholders in Carlsberg A/S 68,264 71,372 70,261
Non-controlling interests 3,243 3,447 3,389
Total equity 71,507 74,819 73,650
Borrow ings 27,493 34,612 36,706
Deferred tax, retirement benefit obligations etc. 15,255 15,314 16,074
Total non-current liabilities 42,748 49,926 52,780
Borrow ings 9,217 4,928 3,352
Trade payables 12,636 11,577 11,862
Deposits on returnable bottles and crates 1,344 1,414 1,381
Other current liabilities 10,749 12,968 10,922
Total current liabilities 33,946 30,887 27,517
Liabilities associated w ith assets held for sale 18 19 18
Total equity and liabilities 148,219 155,651 153,965
www.carlsberggroup.com
Company announcement 11/2013
13 November 2013
Page 20 of 30
STATEMENT OF CHANGES IN EQUITY (PAGE 1 OF 2)
DKK million 30 Sept 2013
Shareholders in Carlsberg A/S
Equity at 1 January 2013 3,051 -5,865 -758 147 -6,476 73,686 70,261 3,389 73,650
Profit for the period - - - - - 4,344 4,344 354 4,698
Other comprehensive income:
Foreign exchange adjustments of foreign entities - -5,292 - - -5,292 - -5,292 -53 -5,345
Value adjustments of hedging instruments - -116 126 - 10 - 10 - 10
Retirement benefit obligations - - - - - -31 -31 - -31
Effect of hyperinflation - 31 - - 31 - 31 2 33
Corporation tax - 45 -35 - 10 8 18 - 18
Other comprehensive income - -5,332 91 - -5,241 -23 -5,264 -51 -5,315
Total comprehensive income for the period - -5,332 91 - -5,241 4,321 -920 303 -617
Capital increase - - - - - - - 32 32
Acquisition/disposal of treasury shares - - - - - -43 -43 - -43
Share-based payment - - - - - 54 54 - 54
Dividends paid to shareholders - - - - - -915 -915 -311 -1,226
Acquisition of non-controlling interests - - - - - -173 -173 -174 -347
Acquisition of entities - - - - - - - 4 4
Total changes in equity - -5,332 91 - -5,241 3,244 -1,997 -146 -2,143
Equity at 30 September 2013 3,051 -11,197 -667 147 -11,717 76,930 68,264 3,243 71,507
Equity,
shareholders
in Carlsberg
A/S
Non-
controlling
interests
Total
equity
Retained
earnings
Share
capital
Currency
translation
Hedging
reserves
A-f-S
invest-
ments
Total
reserves

www.carlsberggroup.com
Company announcement 11/2013
13 November 2013
Page 21 of 30
STATEMENT OF CHANGES IN EQUITY (PAGE 2 OF 2)
DKK million 30 Sept 2012
Shareholders in Carlsberg A/S
Equity at 1 January 2012 3,051 -7,728 -1,159 147 -8,740 71,555 65,866 5,763 71,629
Profit for the period - - - - - 5,415 5,415 521 5,936
Other comprehensive income:
Foreign exchange adjustments of foreign entities - 2,690 - - 2,690 - 2,690 41 2,731
Value adjustments of hedging instruments - -209 183 - -26 - -26 - -26
Retirement benefit obligations - - - - - -157 -157 -11 -168
Effect of hyperinflation - - - - - 54 54 3 57
Other - - - - - -1 -1 - -1
Corporation tax - 62 -44 - 18 11 29 - 29
Other comprehensive income - 2,543 139 - 2,682 -93 2,589 33 2,622
Total comprehensive income for the period - 2,543 139 - 2,682 5,322 8,004 554 8,558
Acquisition/disposal of treasury shares - - - - - -16 -16 - -16
Share-based payment - - - - - 34 34 - 34
Dividends paid to shareholders - - - - - -839 -839 -261 -1,100
Acquisition of non-controlling interests - - - - - -1,677 -1,677 -2,609 -4,286
Total changes in equity - 2,543 139 - 2,682 2,824 5,506 -2,316 3,190
Equity at 30 September 2012 3,051 -5,185 -1,020 147 -6,058 74,379 71,372 3,447 74,819
Total
equity
Equity,
shareholders
in Carlsberg
A/S
Non-
controlling
interests
Share
capital
Currency
translation
Hedging
reserves
A-f-S
invest-
ments
Total
reserves
Retained
earnings
www.carlsberggroup.com
Company announcement 11/2013
13 November 2013
Page 22 of 30
STATEMENT OF CASH FLOWS
DKK million Q3 Q3 9 mths 9 mths
2013 2012 2013 2012 2012
Operating profit before special items 3,426 3,596 7,522 7,641 9,793
Adjustment for depreciation, amortisation and
impairment losses 977 1,016 2,953 2,971 4,019
Operating profit before depreciation, amortisation and 4,403 4,612 10,475 10,612 13,812
impairment losses1
Adjustment for other non-cash items 157 165 402 267 334
Change in trade w orking capital 1,491 496 16 291 852
Change in other w orking capital -1,315 -1,035 -293 -855 -523
Restructuring costs paid -149 -93 -327 -198 -324
Interest etc. received 74 88 154 116 354
Interest etc. paid -453 -151 -1,871 -1,739 -2,350
Corporation tax paid -706 -652 -1,804 -1,781 -2,284
Cash f low from operating activities 3,502 3,430 6,752 6,713 9,871
Acquisition of property, plant and equipment and
intangible assets -1,021 -1,098 -3,470 -3,377 -5,067
Disposal of property, plant and equipment and
intangible assets 13 88 93 414 440
Change in trade loans -76 -83 -304 -299 -447
Total operational investments -1,084 -1,093 -3,681 -3,262 -5,074
Free operating cash f low 2,418 2,337 3,071 3,451 4,797
Aquisition and disposal of entities, net - - -138 - -27
Acquisition and disposal of associated companies, net - - -72 -219 -822
7 17 4 -21 -14
Change in f inancial receivables 148 144 -421 -53 -28
Dividends received 28 28 72 90 100
Total f inancial investments 183 189 -555 -203 -791
Other investments in property, plant and equipment -15 - -15 -1 -6
Disposal of other property, plant and equipment - 3 - 1,899 1,897
Total other activities2 -15 3 -15 1,898 1,891
Cash f low from investing activities -916 -901 -4,251 -1,567 -3,974
Free cash flow 2,586 2,529 2,501 5,146 5,897
Shareholders in Carlsberg A/S -8 -16 -959 -855 -864
Non-controlling interests -9 -2,860 -630 -3,592 -5,198
External f inancing -2,001 718 -3,395 444 2,473 - -
Cash f low from financing activities -2,018 -2,158 -4,984 -4,003 -3,589
Net cash f low 568 371 -2,483 1,143 2,308
Cash and cash equivalents at beginning of period 1,987 3,482 5,059 2,835 2,835
Currency translation adjustments -91 111 -112 -14 -84
Cash and cash equivalents at period-end3 2,464 3,964 2,464 3,964 5,059
3 Cash and cash equivalents less bank overdrafts.
1 Impairment losses excluding those reported in special items.
2 Other activities cover real estate and assets under construction, separate from beverage activities.
Acquisition and disposal of f inancial assets, net

www.carlsberggroup.com
Company announcement 11/2013
13 November 2013
Page 23 of 30
NOTE 1
Segment reporting by region (beverages)
Q3 Q3 9 mths 9 mths
2013 2012 2013 2012 2012
Beer sales (pro rata, million hl)
Western Europe 14.1 13.9 37.6 38.6 50.3
Eastern Europe 11.0 13.0 32.9 34.3 44.7
Asia 7.6 7.2 22.3 20.4 25.4
Total 32.7 34.1 92.8 93.3 120.4
Other beverages (pro rata, million hl)
Western Europe 4.1 4.0 11.2 10.9 14.5
Eastern Europe 0.5 0.5 1.5 1.6 1.8
Asia 0.7 0.7 2.3 2.1 2.8
Total 5.3 5.2 15.0 14.6 19.1
Net revenue (DKK million)
Western Europe 10,939 10,361 29,470 28,552 37,727
Eastern Europe 4,598 5,805 13,745 15,022 19,502
Asia 2,392 2,389 7,555 7,029 9,114
Not allocated 44 32 121 95 125
Beverages, total 17,973 18,587 50,891 50,698 66,468
Western Europe 2,464 2,267 5,522 5,440 6,984
Eastern Europe 1,649 2,011 4,082 4,333 5,883
Asia 647 634 1,926 1,736 2,194
Not allocated -334 -275 -958 -824 -1,144
Beverages, total 4,426 4,637 10,572 10,685 13,917
Operating profit before special items (EBIT - DKK million)
Western Europe 2,014 1,807 4,177 4,083 5,121
Eastern Europe 1,297 1,600 2,988 3,128 4,302
Asia 493 502 1,479 1,366 1,685
Not allocated -352 -286 -1,019 -856 -1,199
Beverages, total 3,452 3,623 7,625 7,721 9,909
Operating profit margin (%)
Western Europe 18.4 17.4 14.2 14.3 13.6
Eastern Europe 28.2 27.6 21.7 20.8 22.1
Asia 20.6 21.0 19.6 19.4 18.5
Not allocated … … … … …
Beverages, total 19.2 19.5 15.0 15.2 14.9
Operating profit before depreciation, amortisation and special items (EBITDA - DKK million)

www.carlsberggroup.com
Company announcement 11/2013
13 November 2013
Page 24 of 30
NOTE 2
Segment reporting by activity
DKK million Q3 Q3
2013 2012
Other Other
activities Total activities Total
Net revenue 17,973 - 17,973 18,587 - 18,587
Operating profit before special items 3,452 -26 3,426 3,623 -27 3,596
Special items, net -45 - -45 -164 158 -6
Financial items, net -291 -4 -295 -438 -4 -442
Profit before tax 3,116 -30 3,086 3,021 127 3,148
Corporation tax -772 7 -765 -759 -28 -787
Consolidated profit 2,344 -23 2,321 2,262 99 2,361
Attributable to:
Non-controlling interests 113 - 113 225 - 225
Shareholders in Carlsberg A/S 2,231 -23 2,208 2,037 99 2,136
DKK million 9 mths 9 mths
2013 2012
Other Other
activities Total activities Total
Net revenue 50,891 - 50,891 50,698 - 50,698
Operating profit before special items 7,625 -103 7,522 7,721 -80 7,641
Special items, net -205 7 -198 -505 1,896 1,391
Financial items, net -1,054 -15 -1,069 -1,285 -35 -1,320
Profit before tax 6,366 -111 6,255 5,931 1,781 7,712
Corporation tax -1,736 179 -1,557 -1,470 -306 -1,776
Consolidated profit 4,630 68 4,698 4,461 1,475 5,936
Attributable to:
Non-controlling interests 354 - 354 521 - 521
Shareholders in Carlsberg A/S 4,276 68 4,344 3,940 1,475 5,415
Bever-
ages
Bever-
ages
Bever-
ages
Bever-
ages

www.carlsberggroup.com
Company announcement 11/2013
13 November 2013
Page 25 of 30
NOTE 3
Segment reporting by quarter
DKK million Q4 Q1 Q2 Q3 Q4 Q1 Q2 Q3
2011 2012 2012 2012 2012 2013 2013 2013
Net revenue
Western Europe 8,715 7,524 10,667 10,361 9,175 7,767 10,764 10,939
Eastern Europe 4,384 2,951 6,266 5,805 4,480 2,902 6,245 4,598
Asia 1,735 2,261 2,379 2,389 2,085 2,555 2,608 2,392
Not allocated 19 39 24 32 30 54 23 44
Beverages, total 14,853 12,775 19,336 18,587 15,770 13,278 19,640 17,973
Other activities - - - - - - - -
Total 14,853 12,775 19,336 18,587 15,770 13,278 19,640 17,973
Operating profit before special items
Western Europe 1,166 477 1,799 1,807 1,038 426 1,737 2,014
Eastern Europe 804 19 1,509 1,600 1,174 83 1,608 1,297
Asia 283 433 431 502 319 493 493 493
Not allocated -386 -332 -238 -286 -343 -290 -377 -352
Beverages, total 1,867 597 3,501 3,623 2,188 712 3,461 3,452
Other activities -33 -23 -30 -27 -36 -51 -26 -26
Total 1,834 574 3,471 3,596 2,152 661 3,435 3,426
Special items, net -1,074 -48 1,445 -6 -1,306 -60 -93 -45
Financial items, net -490 -467 -411 -442 -452 -360 -414 -295
Profit before tax 270 59 4,505 3,148 394 241 2,928 3,086
Corporation tax -272 -15 -974 -787 -85 -60 -732 -765
Consolidated profit -2 44 3,531 2,361 309 181 2,196 2,321
Attributable to:
Non-controlling interests 83 120 176 225 117 119 122 113
Shareholders in Carlsberg A/S -85 -76 3,355 2,136 192 62 2,074 2,208

www.carlsberggroup.com
Company announcement 11/2013
13 November 2013
Page 26 of 30
NOTE 4
Special items
DKK million 9 mths 9 mths
2013 2012 2012
Special items, income:
Gain on disposal of entities and adjustments to gain in prior year - 6 107
Gain on disposal of the Copenhagen Brew ery Site - 1,719 1,719
Income total - 1,725 1,826
Special items, cost:
Impairment and restructuring of Carlsberg Uzbekistan -4 -67 -290
Impairment of Nordic Getränke GmbH, Germany - - -118
Restructuring of Carlsberg Danmark -25 - -
Restructuring of Carlsberg Sverige -3 -55 -76
Impairment of Vena Brew ery, production and sales equipment in
connection w ith restrucuring, Baltika Brew eries, Russia - -200 -589
Restructuring of Ringnes AS, Norw ay -72 - -262
Impairment and restructuring in relation to optimisation and standardisation
in Western Europe -72 - -93
Termination benefits and impairment of non-current assets in connection
w ith new administration structure at Brasseries Kronenbourg, France -30 - -76
Termination benefits etc. in connection w ith Operational Excellence
Programmes - -20 -86
Other restructuring costs etc., other entities 8 8 -151
Cost total -198 -334 -1,741
Special items, net -198 1,391 85

www.carlsberggroup.com
Company announcement 11/2013
13 November 2013
Page 27 of 30
NOTE 5 (PAGE 1 OF 2)
Debt and credit facilities
DKK million 30 September 2013
Non-current borrow ings:
Issued bonds 21,443
Bank borrow ings 4,299
Mortgages 1,457
Lease liabilities 37
Other non-current borrow ings 257
Total 27,493
Current borrow ings:
Current portion of other non-current borrow ings 7,636
Bank borrow ings 1,469
Lease liabilities 7
Other current borrow ings 105
Total 9,217
Total non-current and current borrow ings 36,710
Cash and cash equivalents -3,417
Net f inancial debt 33,293
Other interest bearing assets net -1,803
Net interest bearing debt 31,490
All borrow ings are measured at amortised cost. How ever, EMTN £300m bond w ith
f ixed-rate sw apped to f loating rate, is measured at fair value. The carrying amount
of this bond is DKK 2,861m.

www.carlsberggroup.com
Company announcement 11/2013
13 November 2013
Page 28 of 30
NOTE 5 (PAGE 2 OF 2)
Debt and credit facilities
DKK million
Time to maturity for non-current borrow ings 30 September 2013
1-2 years 2-3 years 3-4 years 4-5 years > 5 years Total
Issued bonds - - 2,861 7,408 11,174 21,443
Bank borrow ings 272 3,856 30 28 113 4,299
Mortgages - - - - 1,457 1,457
Other non-current borrow ings and leases 139 57 65 21 12 294
Total 411 3,913 2,956 7,457 12,756 27,493
DKK million
Interest risk at 30 September 2013 Floating Fixed Floating % Fixed %
EUR 31,363 9,740 21,623 31% 69%
DKK 1,712 1,490 222 87% 13%
Other currencies 218 166 52 76% 24%
Total 33,293 11,396 21,897 34% 66%
* After interest rate and currency sw aps.
DKK million
Commited credit facilities* 30 September 2013
Less than 1 year 9,629
1 to 2 years 411
2 to 3 years 14,222
3 to 4 years 8,922
4 to 5 years 7,457
More than 5 years 12,756
Total 53,397
Short term 9,629
Long term 43,768
* Defined as short-term borrow ings and long-term committed credit facilities.
Net
f inancial
debt
Interest*
www.carlsberggroup.com
Company announcement 11/2013
13 November 2013
Page 29 of 30
NOTE 6
Net interest-bearing debt
DKK million Q3 Q3 9 mths 9 mths
2013 2012 2013 2012 2012
Net interest-bearing debt is calculated as follow s:
Non-current borrow ings 27,493 34,612 36,706
Current borrow ings 9,217 4,928 3,352
Gross interest-bearing debt 36,710 39,540 40,058
Cash and cash equivalents -3,417 -5,932 -5,760
Loans to associates -92 -152 -110
Loans to partners -268 -236 -226
On-trade loans -1,939 -2,019 -2,022
less non-interest-bearing portion 926 999 1,012
Other receivables -2,045 -2,160 -1,862
less non-interest-bearing portion 1,615 1,750 1,390
Net interest-bearing debt 31,490 31,790 32,480
Changes in net interest-bearing debt:
Net interest-bearing debt at beginning of period 33,965 31,154 32,480 32,460 32,460
Cash flow from operating activities -3,502 -3,430 -6,752 -6,713 -9,871
916 901 4,113 1,567 3,947
- - 138 - 27
Dividend to shareholders and non-controlling interest 7 - 1,226 1,100 1,121
2 2,860 319 3,331 4,916
Acquisition/disposal of treasury shares 7 16 43 16 25
1 -11 9 -147 -154
Change in interest-bearing lending 9 148 43 125 18
Effects of currency translation 60 147 -222 433 327
Other 25 5 93 -382 -336
Total change -2,475 636 -990 -670 20
Net interest-bearing debt, end of period 31,490 31,790 31,490 31,790 32,480
Cash flow from acquisition of entities,net
Acquired net interest-bearing debt from acquisition/
disposal of entities
Cash flow from investing activities, excl acquisition
of entities
Acquisition of non-controlling interests
www.carlsberggroup.com
Company announcement 11/2013
13 November 2013
Page 30 of 30
NOTE 7
Acquisition of entities
Acquisition and disposal of entities
In 2013, Carlsberg and its partner in Nordic Getränke GmbH agreed to cease cooperation and split the
entity between them. Hence, Carlsberg acquired the entity from Nordic Getränke GmbH through the
assumption of debt of Nordic Getränke GmbH. The entity has been fully consolidated as of 1 January. The
fair value of the consideration amounted to DKK 138m. Accounting for the acquisition will be completed
within the 12 month period required in IFRS 3.
The financial impact from the acquisition is not material.
The Group did not complete any acquisitions of entities in 2012.
Acquisition of proportionally consolidated entities
The Group has not completed any acquisitions of proportionally consolidated entities in 2013.
In Q2 2012, Carlsberg acquired 6% of the shares in the jointly controlled entity South Asian Breweries Pte.
Ltd., which is recognised by proportional consolidation. The purchase price allocation of the fair value of
identified assets, liabilities and contingent liabilities in the acquisition has been completed. The fair value of
identified assets, liabilities and contingent liabilities less the cost of the acquisition was recognised as
goodwill.