Embed Size (px)
Citation preview
Comparison of Clinical and Administrative Data Sourcesfor Hospital Coronary Artery Bypass Graft Surgery
Report CardsDavid M. Shahian, MD; Treacy Silverstein, BS; Ann F. Lovett, RN, MA;
Robert E. Wolf, MS; Sharon-Lise T. Normand, PhD
Background—Regardless of statistical methodology, public performance report cards must use the highest-qualityvalidated data, preferably from a prospectively maintained clinical database. Using logistic regression and hierarchicalmodels, we compared hospital cardiac surgery profiling results based on clinical data with those derived fromcontemporaneous administrative data.
Methods and Results—Fiscal year 2003 isolated coronary artery bypass grafting surgery results based on an audited andvalidated Massachusetts clinical registry were compared with those derived from a contemporaneous state administra-tive database, the latter using the inclusion/exclusion criteria and risk model of the Agency for Healthcare Research andQuality. There was a 27.4% disparity in isolated coronary artery bypass grafting surgery volume (4440 clinical, 5657administrative), a 0.83% difference in observed in-hospital mortality (2.05% versus 2.88%), corresponding differencesin risk-adjusted mortality calculated by various statistical methodologies, and 1 hospital classified as an outlier only withthe administrative data–based approach. The discrepancies in volumes and risk-adjusted mortality were most notable forhigher-volume programs that presumably perform a higher proportion of combined procedures that were misclassifiedas isolated coronary artery bypass grafting surgery in the administrative cohort. Subsequent analyses of a patient cohortcommon to both databases revealed the smoothing effect of hierarchical models, a 9% relative difference in mortality(2.21% versus 2.03%) resulting from nonstandardized mortality end points, and 1 hospital classified as an outlier usinglogistic regression but not using hierarchical regression.
Conclusions—Cardiac surgery report cards using administrative data are problematic compared with those derived fromaudited and validated clinical data, primarily because of case misclassification and nonstandardized end points.(Circulation. 2007;115:&NA;-.)
Key Words: coronary artery bypass surgery � databases � health policy � outcome assessment (health care) � statistics
Cardiac surgeons have consistently led the effort tocollect, analyze, and apply outcomes data for the benefit
of patients. Cardiac surgery also is the paradigm for publicperformance reporting.1–3 Its predominant procedure, coro-nary artery bypass grafting (CABG), is the most frequentlyperformed of all complex surgical operations, has well-defined and measurable end points, and has substantial publichealth and cost implications.
Editorial p ●●●Clinical Perspective p ●●●
Determining the optimal statistical methodology for riskadjustment and provider profiling has been controver-sial.1,3 No statistical technique, however, regardless of itssophistication, can compensate for flawed data, and it isthis concern that motivates the present study. Healthcare
data may be derived from administrative or clinical sourc-es,4,5 the latter including both retrospective chart abstrac-tion and prospectively maintained databases such as theSociety of Thoracic Surgeons National Adult CardiacDatabase. Administrative data, typically derived fromdischarge billing forms, are the most inexpensive andreadily available source of information regarding acutecare hospitalizations. Although not originally intended forthis purpose, such data also have been used to assesshealthcare provider performance and are currently thebasis for some public “report cards.”
Using administrative data to evaluate the quality ofprovider performance is plausible when they are the soleavailable source of information and when it has beendemonstrated that their use results in conclusions similar tothose derived from clinical data.6 However, are public
Received April 10, 2006; accepted December 22, 2006.From Tufts University School of Medicine (D.M.S.), Harvard Medical School (T.S., A.F.L., R.E.W., S.-L.T.N.), and Harvard School of Public Health
(S.T.N.), Boston, Mass.Correspondence to Sharon-Lise Normand, Department of Health Care Policy, Harvard Medical School, 180 Longwood Ave, Boston, MA 02115.
E-mail [email protected]© 2007 American Heart Association, Inc.
Circulation is available at http://www.circulationaha.org DOI: 10.1161/CIRCULATIONAHA.106.633008
1
Cardiovascular Surgery
by guest on July 9, 2018http://circ.ahajournals.org/
Dow
nloaded from
reports based on hospital discharge data an acceptablealternative when more accurate but also more costly andresource-intensive options are available, as in the case ofCABG surgery?
The present study, prompted by recent experience inMassachusetts, investigates the usefulness of a nationalalgorithm based on administrative data, compared withresults derived from prospectively maintained clinicaldata, in assessing hospital CABG outcomes. Beginning in2002, Massachusetts law mandated that data on all cardiacsurgical procedures be collected using the Society ofThoracic Surgeons National Adult Cardiac Database.These data are submitted to the Massachusetts Data Anal-ysis Center (Mass-DAC)7 based at the Department ofHealth Care Policy at Harvard Medical School, where theyare subjected to internal and external audit and valida-tion.8,9 Analyses are then performed using hierarchicallogistic regression in which random intercepts are includedfor each hospital.1,9 The first CABG report card waspublished in October 2004 and was based on calendar year2002 data.
Because of its desire to bring information to the publicmore quickly than was possible with audited clinical data, theMassachusetts Executive Office of Health and Human Ser-vices published its own fiscal year 2004 CABG results ontheir Internet site in 2006. They were based on hospitaldischarge billing data collected by the Massachusetts Divi-sion of Health Care Finance and Policy using a nationalmodel proposed by the Agency for Healthcare Research andQuality (AHRQ).10 The Massachusetts Executive Office ofHealth and Human Services also published the calendar year2003 Mass-DAC isolated CABG results. This afforded aside-by-side, although not strictly contemporaneous,comparison.
Notably, the CABG cohort based on AHRQ CABG criteriaas applied to Massachusetts administrative data consisted of5315 procedures for fiscal year 2004, whereas Mass-DACrecorded 4393 confirmed isolated CABG cases for calendaryear 2003. This 21% discrepancy in volume (as high as 40%at 1 hospital) cast doubt on the accuracy of the AHRQalgorithm, particularly because the volume of isolated CABGsurgery declined rather than increased in Massachusettsbetween 2003 and 2004.
Because we had access to both audited clinical data andadministrative data for fiscal year 2003, we conducted a com-prehensive, contemporaneous comparison of these 2 algorithmsand the hospital quality profiles derived from them.
MethodsCreation of CohortsTwo cohorts were created: 1 based on clinical data (Mass-DAC) and1 that used hospital discharge billing data (AHRQ). The AHRQCABG model includes patients on the basis of discharge dates; theMass-DAC model includes patients on the basis of surgery dates. Toobtain strictly contemporaneous groups, the Mass-DAC cohort forthe present study was selected on the basis of discharge date,including patients who were discharged from a nongovernmentalMassachusetts acute care hospital with a diagnosis of CABG surgerybetween October 1, 2002, and September 30, 2003.
Clinical Cohort (Mass-DAC)Hospitals submit clinical information to Mass-DAC for all adultpatients (age �18 years) having cardiac surgery in a Massachusettsnon–US governmental hospital. Isolated CABG cases are identifiedby excluding cases that combine CABG with other significantprocedures such as valve replacement or carotid endarterectomy. Forcertain procedures with problematic classification, additional exclu-sion criteria were used on the basis of clinical data submitted by thehospital.7 Cases coded by hospitals as “CABG�other” are reviewedby an adjudication committee of senior cardiac surgeons, and adetermination is made as to whether the case is legitimately in the“other” category. This review seeks to mitigate gaming of the systemin which cases with unfavorable outcomes are shifted into anunreported category.1
Administrative Cohort (AHRQ)Patients �40 years of age discharged with International Classifica-tion of Diseases, 9th revision, clinical modification (ICD-9-CM)codes 36.10 to 36.19 are selected. Thus, the total number ofdischarges invariably includes cases that are not isolated CABG suchas CABG plus cardiac valve replacement. Discharges with missingdischarge disposition or those involving transfer to a short-termgeneral hospital are excluded.
The gold standard for this comparison is the audited database andthe analytical methodology used by Mass-DAC.7–9
Definition of OutcomesMass-DAC uses 30-day all-cause mortality as the primary patientend point. Hospital-reported 30-day status is verified by linking allcardiac surgery cases reported to the Massachusetts Registry of VitalRecords and Statistics. The AHRQ model uses all-cause in-hospitalmortality reported in hospital billing data.
The primary hospital end point is standardized mortality incidencerate (SMIR), interpreted as the mortality at each hospital standard-ized to the overall mortality experience in the population of hospitalsunder study. Confidence intervals are constructed when estimatinglogistic regression models, and probability intervals are constructedwhen estimating hierarchical logistic regression models. For ease ofexposition, we use the terms interval estimates or confidenceintervals interchangeably.
Risk AdjustmentMass-DAC uses the Society of Thoracic Surgeons National AdultCardiac Database instrument and definitions, as well as a hierarchi-cal logistic regression model, to determine standardized mortalityrates. Risk factors for the model were selected by expert consensusfrom the best existing clinical models. A hospital-specific randomintercept was included for each hospital in the sample.
The AHRQ model uses standard logistic regression, and its riskfactors include demographic information and factors based on AllPatient Refined Diagnosis-Related Group codes.10
Statistical Analyses
Comparison of Cardiac Surgery Volumes With CABGVolumes and With Observed CABG Mortality RatesCABG volumes and observed mortality rates were examined overalland by hospital using graphical methods. We plotted ratios of CABGvolumes in the original AHRQ and Mass-DAC cohorts as a functionof total cardiac surgery procedures to determine whether the dispar-ities between cohorts varied by hospital program size. Total cardiacsurgery volume was obtained from the Mass-DAC database. Asimilar plot was constructed to examine the relationship of thedifference between observed in-hospital mortality in the originalAHRQ and Mass-DAC cohorts as a function of total cardiac programvolume. Scatterplot smoothers11 were constructed to illustrate theserelationships.
2 Circulation March 27, 2007
by guest on July 9, 2018http://circ.ahajournals.org/
Dow
nloaded from
Comparison of Discharges Included in the AHRQ andMass-DAC ModelsWe identified the number of discharges meeting inclusion criteria ofboth approaches, the number included in the AHRQ but not theMass-DAC model, and the number included in the Mass-DAC butnot in the AHRQ model. The administrative data and Mass-DACdata were merged using a combination of medical record number,discharge date, admission data, and date of birth. When possible, wedetermined the specific reason that discharges were included in 1model but not the other. Because we had in-hospital mortality for allpatients, we also calculated the observed inpatient mortality rate byexclusion category.
Comparison of Hospital Standardized Mortality andOutlier DeterminationIn addition to misclassification errors, we hypothesized other poten-tial reasons for differences in the AHRQ and Mass-DAC approaches,including risk models, mortality end points, and statistical method-ology. To isolate differences not attributable to classification errors,additional comparative analyses were performed using a commoncohort of patients who met both AHRQ and Mass-DAC inclusioncriteria.
For this common cohort, we estimated the predicted risk ofin-hospital mortality for each patient using simple logistic regressionmodels and the model-specific risk predictors and determined theareas under the receiver-operating characteristics curves. Second, wecomputed point and 95% CI estimates of in-hospital SMIRs usingAHRQ and Mass-DAC predictors, estimated by both standard andhierarchical logistic regressions. The standardized rate is obtained byrisk adjusting for the case mix of the hospital, indirectly standard-izing its risk to an expected risk, and then multiplying by the state
average. If the interval estimate for the hospital was below the stateaverage, we concluded that mortality was lower than expected. If theinterval estimate included the state average, then the mortality was asexpected. If the interval estimate was above the state average, thenmortality was higher than expected. Finally, we determined 30-daySMIRs using Mass-DAC predictors and both standard and hierar-chical logistic regression. Models were fitted using the WinBUGS(Medical Research Council Biostatistics Unit, Cambridge, UnitedKingdom), SAS (SAS Institute, Cary, NC), and S-Plus (InsightfulCorp, Seattle, Wash) software systems.
The authors had full access to and take full responsibility for theintegrity of the data. All authors have read and agree to themanuscript as written.
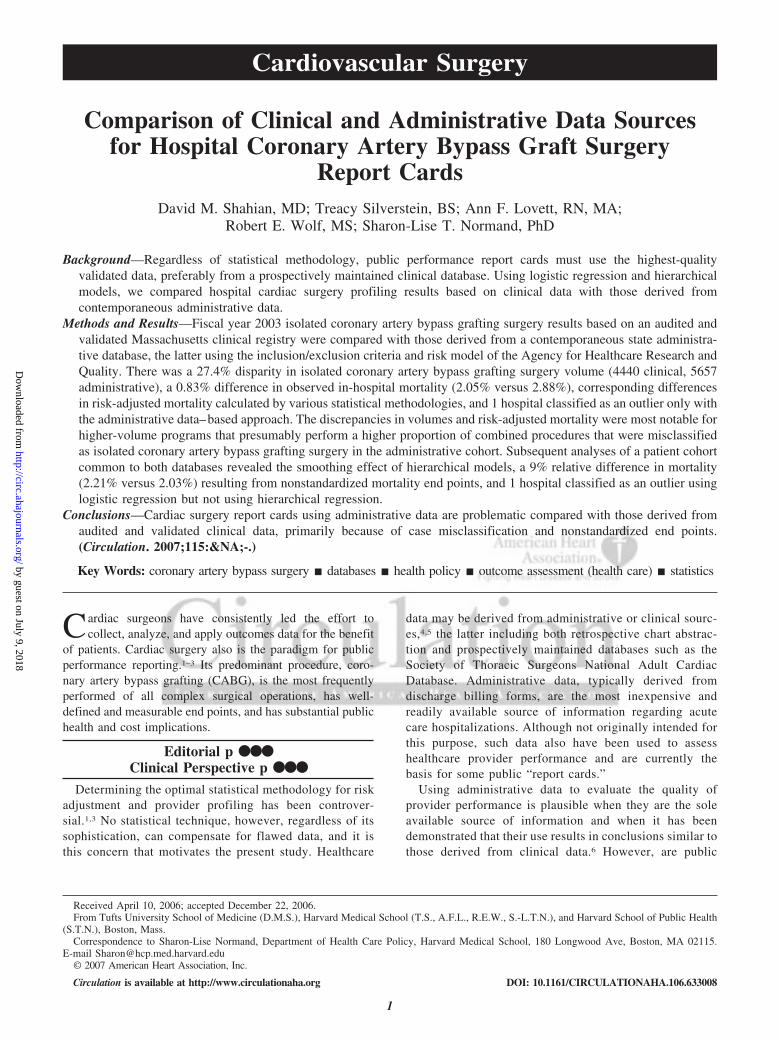
ResultsCABG Volumes (Original Cohorts)The fiscal year 2003 Mass-DAC cohort consisted of 4440isolated CABG patients who were discharged between Octo-ber 1, 2002, and September 30, 2003 (inclusive). In contrast,the contemporaneous AHRQ cohort consisted of 5657 pa-tients identified as CABG patients using the criteria notedabove, which represents a 27.4% disparity. Figure 1 (left)depicts the ratio of AHRQ CABG volume to Mass-DACCABG volume on the y axis and hospital total cardiac surgeryvolume (according to the Mass-DAC sample) on the x axis,along with a scatterplot smoother.11 The ratio increasesdirectly with total cardiac surgery volume (notwithstandingthe problematic results from the very lowest-volume startup
Figure 1. Left, Ratios of administrative CABG volume to Mass-DAC isolated CABG volume on the y axis vs hospital-specific total car-diac surgery volumes (Mass-DAC) on the x axis. Right, Observed in-hospital mortality rates using administrative data minus rates usingMass-DAC data on y axis vs hospital-specific total cardiac surgery volumes on x axis. Superimposed on both plots are scatterplotsmoothers.
Shahian et al Clinical Versus Administrative Data for Profiling 3
by guest on July 9, 2018http://circ.ahajournals.org/
Dow
nloaded from
program). Higher-volume hospitals presumably perform ahigher percentage of complex CABG cases (eg, CABG andvalve, CABG and aneurysm repair) that are excluded fromthe Mass-DAC cohort but inappropriately included in theAHRQ cohort.
Observed CABG Mortality (Original Cohorts)Overall observed in-hospital and 30-day mortality rates in theMass-DAC cohort were 2.05% (91 of 4440) and 2.27% (101of 4440). The in-hospital mortality observed in the AHRQcohort was 2.88%, exceeding the corresponding Mass-DACvalue by 0.83% (range, 0% to 1.63%). In-hospital mortalityfrom the AHRQ-defined cohort is always higher than thatfrom the Mass-DAC cohort, and the absolute differenceincreases directly with hospital total cardiac surgery volumes(Figure 1, right).
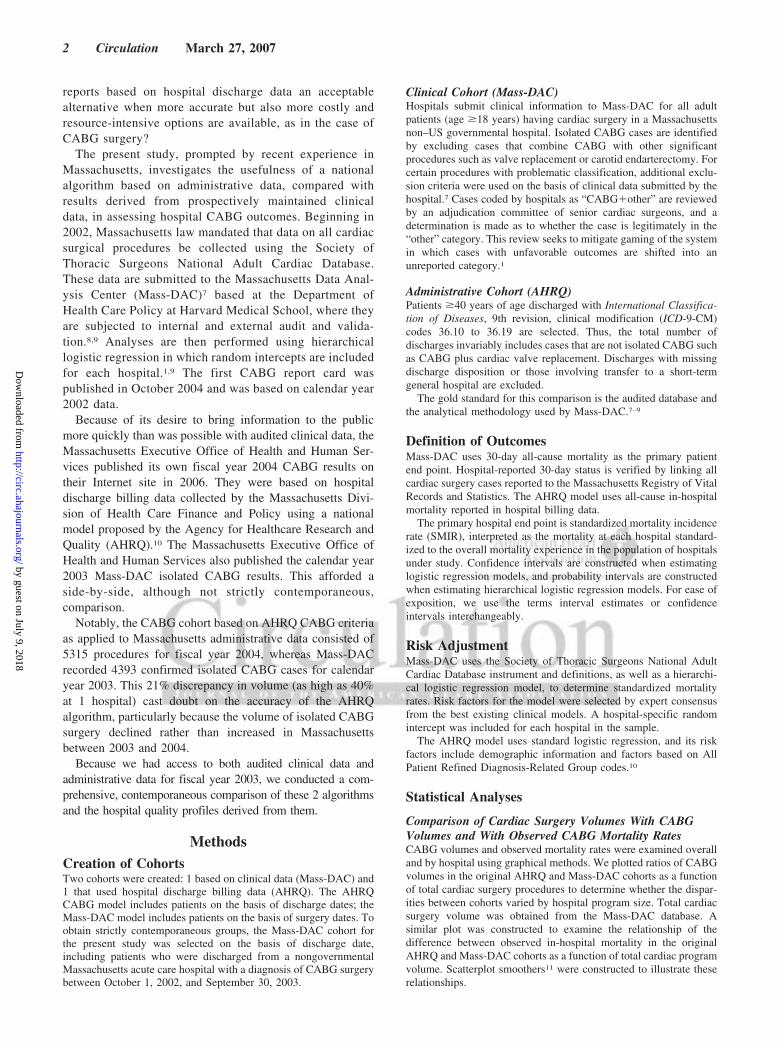
Risk-Adjusted and Standardized Mortality(Original Cohorts and Methodologies)Figure 2 depicts hospital-specific 30-day SMIRs (95%probability intervals) using hierarchical logistic regressionfor the original Mass-DAC cohort (n�4440) and hospital-specific SMIR point estimates (95% CIs) using logisticregression for the original administrative cohort (n�5657).The AHRQ cohort has generally higher mortality rates(overall, 2.88% versus 2.27%). The smoothing effect of theMass-DAC hierarchical model reduces interhospital vari-ability, as demonstrated by the narrower 95% CIs com-pared with the AHRQ model. Hospital 14 had no in-hospital mortalities, and the AHRQ model– estimatedSMIR is 0% (95% CI undefined), whereas the hierarchicalmodel estimate is 2.30% (95% CI, 1.24 to 3.71). Nohospital is identified as a statistical outlier based on theMass-DAC algorithm, whereas hospital 4 is identified as
having statistically higher-than-expected 30-day mortalityusing the AHRQ algorithm.
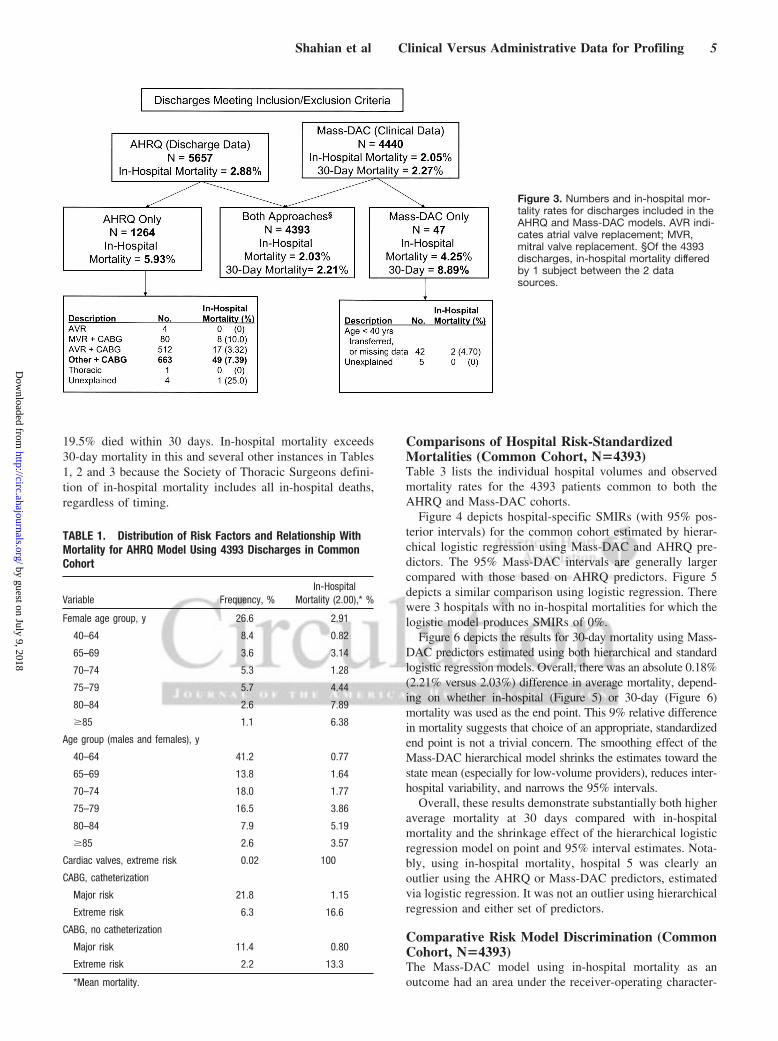
Comparison of AHRQ and Mass-DAC CohortsFigure 3 depicts 3 groups of patients: (1) 1264 patientsfound only in the AHRQ cohort having an in-hospitalobserved mortality of 5.93%, (2) 47 patients found only inthe Mass-DAC cohort having an observed mortality of4.25%; and (3) 4393 patients found in both cohorts, with2.03% mortality in the Mass-DAC cohort (confirmed asaccurate) and 2.00% in the AHRQ cohort. Most of thepatients (42 of 47) classified in group 2 met the age criteriafor Mass-DAC but not for AHRQ, had missing data, or hadbeen transferred. Among the 1264 patients in group 1,about half (n�596) had CABG combined with valveprocedures. This misclassification could be corrected witha more refined administrative algorithm. However, anadditional 663 cases, �10% of the original AHRQ cohort,were coded as CABG plus other. Even with a clinicaldatabase and well-defined exclusion criteria, adjudicationof such cases by an expert panel typically is required. Itwould be difficult, if not impossible, to correctly catego-rize such procedures (isolated versus nonisolated CABG)from administrative data using only discharge codes. Thissubset of CABG plus other cases was associated with highmortality (7.39%) and clearly had substantial impact on theoverall AHRQ mortality estimate.
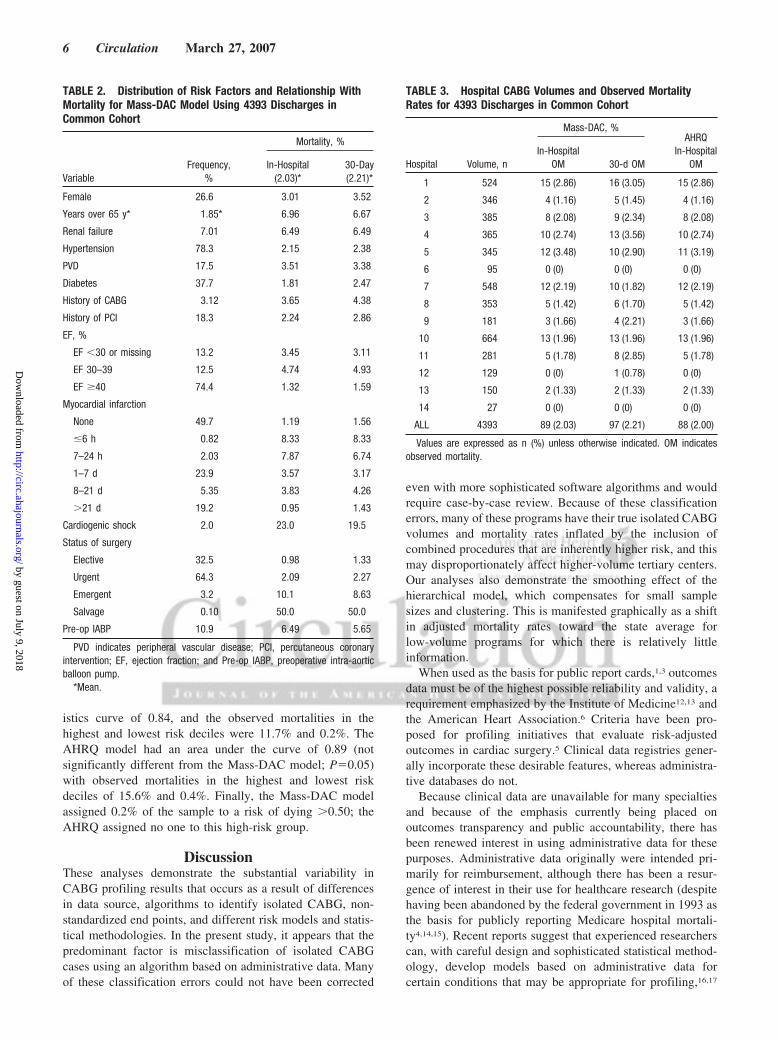
Risk Model Differences (Common Cohort,N�4393)Tables 1 and 2 list risk factors, frequencies, and associationswith in-hospital or 30-day mortality for 4393 patients meetingcriteria for both the AHRQ and Mass-DAC models. Forexample, 2.0% of patients in the Mass-DAC cohort presentedwith cardiogenic shock, of which 23% died in-hospital and
Figure 2. Thirty-day SMIRs using Mass-DAC predictors estimated by hierarchicallogistic regression (solid lines). Dashedlines are standardized in-hospital mortal-ity incidence rates using AHRQ modelestimated by logistic regression.
4 Circulation March 27, 2007
by guest on July 9, 2018http://circ.ahajournals.org/
Dow
nloaded from
19.5% died within 30 days. In-hospital mortality exceeds30-day mortality in this and several other instances in Tables1, 2 and 3 because the Society of Thoracic Surgeons defini-tion of in-hospital mortality includes all in-hospital deaths,regardless of timing.
Comparisons of Hospital Risk-StandardizedMortalities (Common Cohort, N�4393)Table 3 lists the individual hospital volumes and observedmortality rates for the 4393 patients common to both theAHRQ and Mass-DAC cohorts.
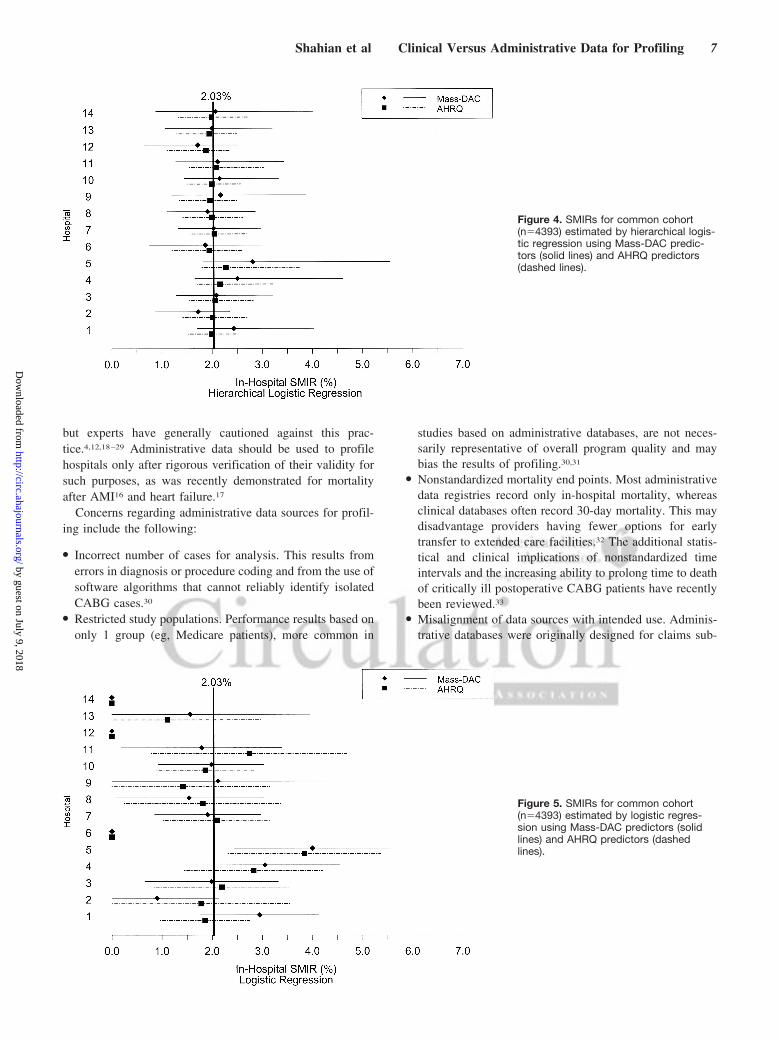
Figure 4 depicts hospital-specific SMIRs (with 95% pos-terior intervals) for the common cohort estimated by hierar-chical logistic regression using Mass-DAC and AHRQ pre-dictors. The 95% Mass-DAC intervals are generally largercompared with those based on AHRQ predictors. Figure 5depicts a similar comparison using logistic regression. Therewere 3 hospitals with no in-hospital mortalities for which thelogistic model produces SMIRs of 0%.
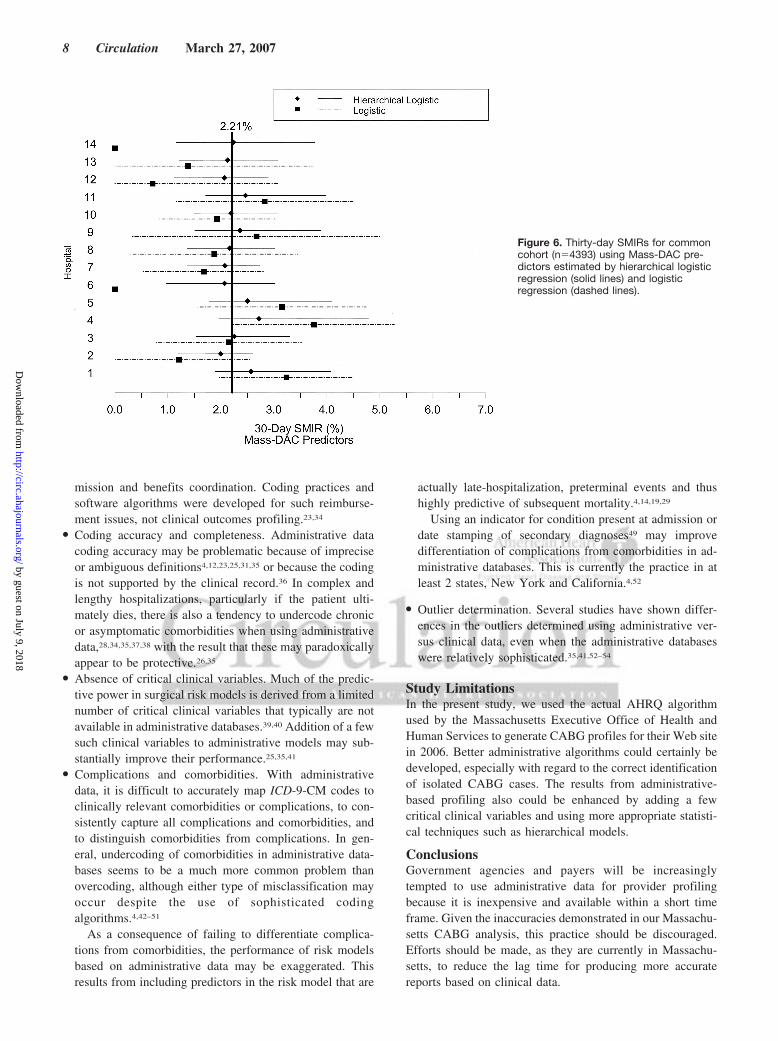
Figure 6 depicts the results for 30-day mortality using Mass-DAC predictors estimated using both hierarchical and standardlogistic regression models. Overall, there was an absolute 0.18%(2.21% versus 2.03%) difference in average mortality, depend-ing on whether in-hospital (Figure 5) or 30-day (Figure 6)mortality was used as the end point. This 9% relative differencein mortality suggests that choice of an appropriate, standardizedend point is not a trivial concern. The smoothing effect of theMass-DAC hierarchical model shrinks the estimates toward thestate mean (especially for low-volume providers), reduces inter-hospital variability, and narrows the 95% intervals.
Overall, these results demonstrate substantially both higheraverage mortality at 30 days compared with in-hospitalmortality and the shrinkage effect of the hierarchical logisticregression model on point and 95% interval estimates. Nota-bly, using in-hospital mortality, hospital 5 was clearly anoutlier using the AHRQ or Mass-DAC predictors, estimatedvia logistic regression. It was not an outlier using hierarchicalregression and either set of predictors.
Comparative Risk Model Discrimination (CommonCohort, N�4393)The Mass-DAC model using in-hospital mortality as anoutcome had an area under the receiver-operating character-
Figure 3. Numbers and in-hospital mor-tality rates for discharges included in theAHRQ and Mass-DAC models. AVR indi-cates atrial valve replacement; MVR,mitral valve replacement. §Of the 4393discharges, in-hospital mortality differedby 1 subject between the 2 datasources.
TABLE 1. Distribution of Risk Factors and Relationship WithMortality for AHRQ Model Using 4393 Discharges in CommonCohort
Variable Frequency, %In-Hospital
Mortality (2.00),* %
Female age group, y 26.6 2.91
40–64 8.4 0.82
65–69 3.6 3.14
70–74 5.3 1.28
75–79 5.7 4.44
80–84 2.6 7.89
�85 1.1 6.38
Age group (males and females), y
40–64 41.2 0.77
65–69 13.8 1.64
70–74 18.0 1.77
75–79 16.5 3.86
80–84 7.9 5.19
�85 2.6 3.57
Cardiac valves, extreme risk 0.02 100
CABG, catheterization
Major risk 21.8 1.15
Extreme risk 6.3 16.6
CABG, no catheterization
Major risk 11.4 0.80
Extreme risk 2.2 13.3
*Mean mortality.
Shahian et al Clinical Versus Administrative Data for Profiling 5
by guest on July 9, 2018http://circ.ahajournals.org/
Dow
nloaded from
istics curve of 0.84, and the observed mortalities in thehighest and lowest risk deciles were 11.7% and 0.2%. TheAHRQ model had an area under the curve of 0.89 (notsignificantly different from the Mass-DAC model; P�0.05)with observed mortalities in the highest and lowest riskdeciles of 15.6% and 0.4%. Finally, the Mass-DAC modelassigned 0.2% of the sample to a risk of dying �0.50; theAHRQ assigned no one to this high-risk group.
DiscussionThese analyses demonstrate the substantial variability inCABG profiling results that occurs as a result of differencesin data source, algorithms to identify isolated CABG, non-standardized end points, and different risk models and statis-tical methodologies. In the present study, it appears that thepredominant factor is misclassification of isolated CABGcases using an algorithm based on administrative data. Manyof these classification errors could not have been corrected
even with more sophisticated software algorithms and wouldrequire case-by-case review. Because of these classificationerrors, many of these programs have their true isolated CABGvolumes and mortality rates inflated by the inclusion ofcombined procedures that are inherently higher risk, and thismay disproportionately affect higher-volume tertiary centers.Our analyses also demonstrate the smoothing effect of thehierarchical model, which compensates for small samplesizes and clustering. This is manifested graphically as a shiftin adjusted mortality rates toward the state average forlow-volume programs for which there is relatively littleinformation.
When used as the basis for public report cards,1,3 outcomesdata must be of the highest possible reliability and validity, arequirement emphasized by the Institute of Medicine12,13 andthe American Heart Association.6 Criteria have been pro-posed for profiling initiatives that evaluate risk-adjustedoutcomes in cardiac surgery.5 Clinical data registries gener-ally incorporate these desirable features, whereas administra-tive databases do not.
Because clinical data are unavailable for many specialtiesand because of the emphasis currently being placed onoutcomes transparency and public accountability, there hasbeen renewed interest in using administrative data for thesepurposes. Administrative data originally were intended pri-marily for reimbursement, although there has been a resur-gence of interest in their use for healthcare research (despitehaving been abandoned by the federal government in 1993 asthe basis for publicly reporting Medicare hospital mortali-ty4,14,15). Recent reports suggest that experienced researcherscan, with careful design and sophisticated statistical method-ology, develop models based on administrative data forcertain conditions that may be appropriate for profiling,16,17
TABLE 2. Distribution of Risk Factors and Relationship WithMortality for Mass-DAC Model Using 4393 Discharges inCommon Cohort
Mortality, %
VariableFrequency,
%In-Hospital
(2.03)*30-Day(2.21)*
Female 26.6 3.01 3.52
Years over 65 y* 1.85* 6.96 6.67
Renal failure 7.01 6.49 6.49
Hypertension 78.3 2.15 2.38
PVD 17.5 3.51 3.38
Diabetes 37.7 1.81 2.47
History of CABG 3.12 3.65 4.38
History of PCI 18.3 2.24 2.86
EF, %
EF �30 or missing 13.2 3.45 3.11
EF 30–39 12.5 4.74 4.93
EF �40 74.4 1.32 1.59
Myocardial infarction
None 49.7 1.19 1.56
�6 h 0.82 8.33 8.33
7–24 h 2.03 7.87 6.74
1–7 d 23.9 3.57 3.17
8–21 d 5.35 3.83 4.26
�21 d 19.2 0.95 1.43
Cardiogenic shock 2.0 23.0 19.5
Status of surgery
Elective 32.5 0.98 1.33
Urgent 64.3 2.09 2.27
Emergent 3.2 10.1 8.63
Salvage 0.10 50.0 50.0
Pre-op IABP 10.9 6.49 5.65
PVD indicates peripheral vascular disease; PCI, percutaneous coronaryintervention; EF, ejection fraction; and Pre-op IABP, preoperative intra-aorticballoon pump.
*Mean.
TABLE 3. Hospital CABG Volumes and Observed MortalityRates for 4393 Discharges in Common Cohort
Hospital Volume, n
Mass-DAC, %AHRQ
In-HospitalOM
In-HospitalOM 30-d OM
1 524 15 (2.86) 16 (3.05) 15 (2.86)
2 346 4 (1.16) 5 (1.45) 4 (1.16)
3 385 8 (2.08) 9 (2.34) 8 (2.08)
4 365 10 (2.74) 13 (3.56) 10 (2.74)
5 345 12 (3.48) 10 (2.90) 11 (3.19)
6 95 0 (0) 0 (0) 0 (0)
7 548 12 (2.19) 10 (1.82) 12 (2.19)
8 353 5 (1.42) 6 (1.70) 5 (1.42)
9 181 3 (1.66) 4 (2.21) 3 (1.66)
10 664 13 (1.96) 13 (1.96) 13 (1.96)
11 281 5 (1.78) 8 (2.85) 5 (1.78)
12 129 0 (0) 1 (0.78) 0 (0)
13 150 2 (1.33) 2 (1.33) 2 (1.33)
14 27 0 (0) 0 (0) 0 (0)
ALL 4393 89 (2.03) 97 (2.21) 88 (2.00)
Values are expressed as n (%) unless otherwise indicated. OM indicatesobserved mortality.
6 Circulation March 27, 2007
by guest on July 9, 2018http://circ.ahajournals.org/
Dow
nloaded from
but experts have generally cautioned against this prac-tice.4,12,18–29 Administrative data should be used to profilehospitals only after rigorous verification of their validity forsuch purposes, as was recently demonstrated for mortalityafter AMI16 and heart failure.17
Concerns regarding administrative data sources for profil-ing include the following:
● Incorrect number of cases for analysis. This results fromerrors in diagnosis or procedure coding and from the use ofsoftware algorithms that cannot reliably identify isolatedCABG cases.30
● Restricted study populations. Performance results based ononly 1 group (eg, Medicare patients), more common in
studies based on administrative databases, are not neces-sarily representative of overall program quality and maybias the results of profiling.30,31
● Nonstandardized mortality end points. Most administrativedata registries record only in-hospital mortality, whereasclinical databases often record 30-day mortality. This maydisadvantage providers having fewer options for earlytransfer to extended care facilities.32 The additional statis-tical and clinical implications of nonstandardized timeintervals and the increasing ability to prolong time to deathof critically ill postoperative CABG patients have recentlybeen reviewed.33
● Misalignment of data sources with intended use. Adminis-trative databases were originally designed for claims sub-
Figure 4. SMIRs for common cohort(n�4393) estimated by hierarchical logis-tic regression using Mass-DAC predic-tors (solid lines) and AHRQ predictors(dashed lines).
Figure 5. SMIRs for common cohort(n�4393) estimated by logistic regres-sion using Mass-DAC predictors (solidlines) and AHRQ predictors (dashedlines).
Shahian et al Clinical Versus Administrative Data for Profiling 7
by guest on July 9, 2018http://circ.ahajournals.org/
Dow
nloaded from
mission and benefits coordination. Coding practices andsoftware algorithms were developed for such reimburse-ment issues, not clinical outcomes profiling.23,34
● Coding accuracy and completeness. Administrative datacoding accuracy may be problematic because of impreciseor ambiguous definitions4,12,23,25,31,35 or because the codingis not supported by the clinical record.36 In complex andlengthy hospitalizations, particularly if the patient ulti-mately dies, there is also a tendency to undercode chronicor asymptomatic comorbidities when using administrativedata,28,34,35,37,38 with the result that these may paradoxicallyappear to be protective.26,35
● Absence of critical clinical variables. Much of the predic-tive power in surgical risk models is derived from a limitednumber of critical clinical variables that typically are notavailable in administrative databases.39,40 Addition of a fewsuch clinical variables to administrative models may sub-stantially improve their performance.25,35,41
● Complications and comorbidities. With administrativedata, it is difficult to accurately map ICD-9-CM codes toclinically relevant comorbidities or complications, to con-sistently capture all complications and comorbidities, andto distinguish comorbidities from complications. In gen-eral, undercoding of comorbidities in administrative data-bases seems to be a much more common problem thanovercoding, although either type of misclassification mayoccur despite the use of sophisticated codingalgorithms.4,42–51
As a consequence of failing to differentiate complica-tions from comorbidities, the performance of risk modelsbased on administrative data may be exaggerated. Thisresults from including predictors in the risk model that are
actually late-hospitalization, preterminal events and thushighly predictive of subsequent mortality.4,14,19,29
Using an indicator for condition present at admission ordate stamping of secondary diagnoses49 may improvedifferentiation of complications from comorbidities in ad-ministrative databases. This is currently the practice in atleast 2 states, New York and California.4,52
● Outlier determination. Several studies have shown differ-ences in the outliers determined using administrative ver-sus clinical data, even when the administrative databaseswere relatively sophisticated.35,41,52–54
Study LimitationsIn the present study, we used the actual AHRQ algorithmused by the Massachusetts Executive Office of Health andHuman Services to generate CABG profiles for their Web sitein 2006. Better administrative algorithms could certainly bedeveloped, especially with regard to the correct identificationof isolated CABG cases. The results from administrative-based profiling also could be enhanced by adding a fewcritical clinical variables and using more appropriate statisti-cal techniques such as hierarchical models.
ConclusionsGovernment agencies and payers will be increasinglytempted to use administrative data for provider profilingbecause it is inexpensive and available within a short timeframe. Given the inaccuracies demonstrated in our Massachu-setts CABG analysis, this practice should be discouraged.Efforts should be made, as they are currently in Massachu-setts, to reduce the lag time for producing more accuratereports based on clinical data.
Figure 6. Thirty-day SMIRs for commoncohort (n�4393) using Mass-DAC pre-dictors estimated by hierarchical logisticregression (solid lines) and logisticregression (dashed lines).
8 Circulation March 27, 2007
by guest on July 9, 2018http://circ.ahajournals.org/
Dow
nloaded from
Source of FundingThis work was supported by a contract from the MassachusettsDepartment of Public Health (No. 620022A4PRE).
DisclosuresDr Shahian receives an honorarium for providing clinical advice toMass-DAC. T. Silverstein, A. Lovett, R. Wolf, and Dr Normandreceive salary support from a Massachusetts Department of PublicHealth contract.
References1. Shahian DM, Normand SL, Torchiana DF, Lewis SM, Pastore JO, Kuntz
RE, Dreyer PI. Cardiac surgery report cards: comprehensive review andstatistical critique. Ann Thorac Surg. 2001;72:2155–2168.
2. Shahian DM. Improving cardiac surgery quality: volume, outcome,process? JAMA. 2004;291:246–248.
3. Shahian DM, Blackstone EH, Edwards FH, Grover FL, Grunkemeier GL,Naftel DC, Nashef SA, Nugent WC, Peterson ED. Cardiac surgery riskmodels: a position article. Ann Thorac Surg. 2004;78:1868–1877.
4. Iezzoni LI. Risk Adjustment for Measuring Health Care Outcomes. 3rded. Chicago, Ill: Health Administration Press; 2003.
5. Daley J. Criteria by which to evaluate risk-adjusted outcomes programs incardiac surgery. Ann Thorac Surg. 1994;58:1827–1835.
6. Krumholz HM, Brindis RG, Brush JE, Cohen DJ, Epstein AJ, Furie K,Howard G, Peterson ED, Rathore SS, Smith SC Jr, Spertus JA, Wang Y,Normand SL. Standards for statistical models used for public reporting ofhealth outcomes: an American Heart Association Scientific Statement fromthe Quality of Care and Outcomes Research Interdisciplinary Writing Group:cosponsored by the Council on Epidemiology and Prevention and the StrokeCouncil: endorsed by the American College of Cardiology Foundation.Circulation. 2006;113:456–462.
7. Massachusetts Data Analysis Center. Available at: http://www.massdac.orgAccessed March 1, 2006.
8. Shahian DM, Torchiana DF, Normand SL. Implementation of a cardiacsurgery report card: lessons from the Massachusetts experience. AnnThorac Surg. 2005;80:1146–1150.
9. Shahian DM, Torchiana DF, Shemin RJ, Rawn JD, Normand SL. Mas-sachusetts cardiac surgery report card: implications of statistical meth-odology. Ann Thorac Surg. 2005;80:2106–2113.
10. US Department of Health and Human Services, Agency for HealthcareResearch and Quality. AHRQ Quality Indicators: Inpatient Quality Indi-cators: Technical Specifications. June 2002. Available at: http://www.qualityindicators.ahrq.gov/downloads/iqi/iqi_technical_specs_v30.pdf. Accessed March 1, 2006.
11. Cleveland WS. Robust locally weighted regression and smoothing scat-terplots. J Am Stat Assoc. 1979;74:829–836.
12. Iezzoni LI. Assessing quality using administrative data. Ann Intern Med.1997;127:666–674.
13. Institute of Medicine. Performance Measurement: AcceleratingImprovement. Washington, DC: National Academies Press; 2006.
14. Iezzoni LI. The risks of risk adjustment. JAMA. 1997;278:1600–1607.15. Krumholz HM, Rathore SS, Chen J, Wang Y, Radford MJ. Evaluation of
a consumer-oriented internet health care report card: the risk of qualityratings based on mortality data. JAMA. 2002;287:1277–1287.
16. Krumholz HM, Wang Y, Mattera JA, Wang Y, Han LF, Ingber MJ, RomanS, Normand SL. An administrative claims model suitable for profilinghospital performance based on 30-day mortality rates among patients with anacute myocardial infarction. Circulation. 2006;113:1683–1692.
17. Krumholz HM, Wang Y, Mattera JA, Wang Y, Han LF, Ingber MJ,Roman S, Normand SL. An administrative claims model suitable forprofiling hospital performance based on 30-day mortality rates amongpatients with heart failure. Circulation. 2006;113:1693–1701.
18. Iezzoni LI. How much are we willing to pay for information about qualityof care? Ann Intern Med. 1997;126:391–393.
19. Iezzoni LI, Ash AS, Shwartz M, Landon BE, Mackiernan YD. Predictingin-hospital deaths from coronary artery bypass graft surgery: do differentseverity measures give different predictions? Med Care. 1998;36:28–39.
20. Dans PE. Looking for answers in all the wrong places. Ann Intern Med.1993;119:855–857.
21. Torchiana DF, Meyer GS. Use of administrative data for clinical qualitymeasurement. J Thorac Cardiovasc Surg. 2005;129:1223–1225.
22. Romano PS. Asking too much of administrative data? J Am Coll Surg.2003;196:337–338.
23. Romano PS, Chan BK, Schembri ME, Rainwater JA. Can administrativedata be used to compare postoperative complication rates across hos-pitals? Med Care. 2002;40:856–867.
24. Romano PS, Mark DH. Bias in the coding of hospital discharge data andits implications for quality assessment. Med Care. 1994;32:81–90.
25. Best WR, Khuri SF, Phelan M, Hur K, Henderson WG, Demakis JG,Daley J. Identifying patient preoperative risk factors and postoperativeadverse events in administrative databases: results from the Departmentof Veterans Affairs National Surgical Quality Improvement Program.J Am Coll Surg. 2002;194:257–266.
26. Finlayson EV, Birkmeyer JD, Stukel TA, Siewers AE, Lucas FL,Wennberg DE. Adjusting surgical mortality rates for patient comor-bidities: more harm than good? Surgery. 2002;132:787–794.
27. Ghali WA, Rothwell DM, Quan H, Brant R, Tu JV. A Canadian com-parison of data sources for coronary artery bypass surgery outcome“report cards.” Am Heart J. 2000;140:402–408.
28. Hartz AJ, Kuhn EM. Comparing hospitals that perform coronary arterybypass surgery: the effect of outcome measures and data sources. Am JPublic Health. 1994;84:1609–1614.
29. Landon B, Iezzoni LI, Ash AS, Shwartz M, Daley J, Hughes JS,Mackiernan YD. Judging hospitals by severity-adjusted mortality rates:the case of CABG surgery. Inquiry. 1996;33:155–166.
30. Mack MJ, Herbert M, Prince S, Dewey TM, Magee MJ, Edgerton JR.Does reporting of coronary artery bypass grafting from administrativedatabases accurately reflect actual clinical outcomes? J Thorac Car-diovasc Surg. 2005;129:1309–1317.
31. Hannan EL, Racz MJ, Jollis JG, Peterson ED. Using Medicare claimsdata to assess provider quality for CABG surgery: does it work wellenough? Health Serv Res. 1997;31:659–678.
32. Green J, Wintfeld N. Report cards on cardiac surgeons: assessing NewYork State’s approach. N Engl J Med. 1995;332:1229–1232.
33. Osswald BR, Blackstone EH, Tochtermann U, Thomas G, Vahl CF, HaglS. The meaning of early mortality after CABG. Eur J Cardiothorac Surg.1999;15:401–407.
34. Jencks SF. Accuracy in recorded diagnoses. JAMA. 1992;267:2238–2239.
35. Hannan EL, Kilburn H Jr, Lindsey ML, Lewis R. Clinical versus admin-istrative data bases for CABG surgery: does it matter? Med Care. 1992;30:892–907.
36. McCarthy EP, Iezzoni LI, Davis RB, Palmer RH, Cahalane M, HamelMB, Mukamal K, Phillips RS, Davies DT, Jr. Does clinical evidencesupport ICD-9-CM diagnosis coding of complications? Med Care. 2000;38:868–876.
37. Romano PS, Roos LL, Luft HS, Jollis JG, Doliszny K. A comparison ofadministrative versus clinical data: coronary artery bypass surgery as anexample: Ischemic Heart Disease Patient Outcomes Research Team.J Clin Epidemiol. 1994;47:249–260.
38. Iezzoni LI, Foley SM, Daley J, Hughes J, Fisher ES, Heeren T. Comor-bidities, complications, and coding bias: does the number of diagnosiscodes matter in predicting in-hospital mortality? JAMA. 1992;267:2197–2203.
39. Tu JV, Sykora K, Naylor CD. Assessing the outcomes of coronary arterybypass graft surgery: how many risk factors are enough? Steering Com-mittee of the Cardiac Care Network of Ontario. J Am Coll Cardiol.1997;30:1317–1323.
40. Jones RH, Hannan EL, Hammermeister KE, Delong ER, O’Connor GT,Luepker RV, Parsonnet V, Pryor DB. Identification of preoperative vari-ables needed for risk adjustment of short-term mortality after coronaryartery bypass graft surgery: the Working Group Panel on the CooperativeCABG Database Project. J Am Coll Cardiol. 1996;28:1478–1487.
41. Geraci JM, Johnson ML, Gordon HS, Petersen NJ, Shroyer AL, GroverFL, Wray NP. Mortality after cardiac bypass surgery: prediction fromadministrative versus clinical data. Med Care. 2005;43:149–158.
42. Jollis JG, Ancukiewicz M, Delong ER, Pryor DB, Muhlbaier LH, MarkDB. Discordance of databases designed for claims payment versusclinical information systems: implications for outcomes research. AnnIntern Med. 1993;119:844–850.
43. Hawker GA, Coyte PC, Wright JG, Paul JE, Bombardier C. Accuracy ofadministrative data for assessing outcomes after knee replacementsurgery. J Clin Epidemiol. 1997;50:265–273.
44. Powell H, Lim LL, Heller RF. Accuracy of administrative data to assesscomorbidity in patients with heart disease: an Australian perspective.J Clin Epidemiol. 2001;54:687–693.
Shahian et al Clinical Versus Administrative Data for Profiling 9
by guest on July 9, 2018http://circ.ahajournals.org/
Dow
nloaded from

45. Iezzoni LI, Daley J, Heeren T, Foley SM, Fisher ES, Duncan C, HughesJS, Coffman GA. Identifying complications of care using administrativedata. Med Care. 1994;32:700–715.
46. Deyo RA, Cherkin DC, Ciol MA. Adapting a clinical comorbidity indexfor use with ICD-9-CM administrative databases. J Clin Epidemiol.1992;45:613–619.
47. Romano PS, Roos LL, Jollis JG. Adapting a clinical comorbidity indexfor use with ICD-9-CM administrative data: differing perspectives. J ClinEpidemiol. 1993;46:1075–1079.
48. Elixhauser A, Steiner C, Harris DR, Coffey RM. Comorbidity measuresfor use with administrative data. Med Care. 1998;36:8–27.
49. Glance LG, Dick AW, Osler TM, Mukamel DB. Does date stampingICD-9-CM codes increase the value of clinical information in adminis-trative data? Health Serv Res. 2006;41:231–251.
50. Lawthers AG, McCarthy EP, Davis RB, Peterson LE, Palmer RH, IezzoniLI. Identification of in-hospital complications from claims data: is itvalid? Med Care. 2000;38:785–795.
51. Quan H, Parsons GA, Ghali WA. Validity of information on comorbidity derivedfrom ICD-9-CCM administrative data. Med Care. 2002;40:675–685.
52. Parker JP, Li Z, Damberg CL, Danielsen B, Carlisle DM. Administrativeversus clinical data for coronary artery bypass graft surgery report cards:the view from California. Med Care. 2006;44:687–695.
53. Gordon HS, Johnson ML, Wray NP, Petersen NJ, Henderson WG, KhuriSF, Geraci JM. Mortality after noncardiac surgery: prediction fromadministrative versus clinical data. Med Care. 2005;43:159–167.
54. Jollis JG, Romano PS. Pennsylvania’s Focus on Heart Attack: grading thescorecard. N Engl J Med. 1998;338:983–987.
CLINICAL PERSPECTIVEDemand is increasing for public accountability in health care through the use of “report cards.” Numerous states haveimplemented coronary artery bypass grafting surgery (CABG) report cards. Hospitals are concerned that only the mostaccurate data and statistical methodologies are used for such purposes because their reported outcomes may substantiallyaffect referral practices. Ideally, public report cards should be based on prospectively collected, audited, and validatedclinical data, using the most appropriate risk-adjustment models and statistical approaches. The present study wasmotivated by the observation that results from a Massachusetts public CABG report card based on these principles differedsubstantially from those derived from a Massachusetts administrative database. Administrative data are widely accessibleat low cost, and analyses based on them are generally available more quickly than from audited clinical registries. Wedetermined that much of the difference between the 2 Massachusetts CABG report cards was attributable to casemisclassification, typically with some combined procedures categorized as isolated CABG. Because combined operationshave higher risk, their inclusion inflates the apparent mortality rate of a hospital. High-volume tertiary centers may beparticularly disadvantaged by procedure classification errors because of their larger proportion of combined procedures.About half of the misclassified cases could not have been correctly classified through the use of more sophisticated codingalgorithms and would require case-by-case adjudication. Administrative data are valuable for population-based studies, forquality improvement activities, and for profiling some diseases. When possible, however, audited data registries arepreferable for public profiling of CABG surgery outcomes.
10 Circulation March 27, 2007
by guest on July 9, 2018http://circ.ahajournals.org/
Dow
nloaded from
NormandDavid M. Shahian, Treacy Silverstein, Ann F. Lovett, Robert E. Wolf and Sharon-Lise T.
Bypass Graft Surgery Report CardsComparison of Clinical and Administrative Data Sources for Hospital Coronary Artery
Print ISSN: 0009-7322. Online ISSN: 1524-4539 Copyright © 2007 American Heart Association, Inc. All rights reserved.
is published by the American Heart Association, 7272 Greenville Avenue, Dallas, TX 75231Circulation published online March 12, 2007;Circulation.
http://circ.ahajournals.org/content/early/2007/03/12/CIRCULATIONAHA.106.633008.citationWorld Wide Web at:
The online version of this article, along with updated information and services, is located on the
http://circ.ahajournals.org//subscriptions/
is online at: Circulation Information about subscribing to Subscriptions:
http://www.lww.com/reprints Information about reprints can be found online at: Reprints:
document. Permissions and Rights Question and Answer this process is available in the
click Request Permissions in the middle column of the Web page under Services. Further information aboutOffice. Once the online version of the published article for which permission is being requested is located,
can be obtained via RightsLink, a service of the Copyright Clearance Center, not the EditorialCirculationin Requests for permissions to reproduce figures, tables, or portions of articles originally publishedPermissions:
by guest on July 9, 2018http://circ.ahajournals.org/
Dow
nloaded from