Embed Size (px)
Citation preview
Sage et al, CIRCULATIONAHA-2014-011090-R2
Sage et al., CIRCULATIONAHA-2014-011090-R1
MHC class II-restricted antigen presentation by plasmacytoid dendritic cells drives pro-atherogenic T cell immunity
Supplemental Material
Sage et al, CIRCULATIONAHA-2014-011090-R2 Supplemental Methods
Mice
All experiments were approved by the Home Office, UK and were performed under PPL 80/2426. Ldlr–/– and
µMT mice were purchased originally from Jackson labs and were on a C57Bl/6 background. CD11c-Cre x
Tcf4–/flox and CD11c-Cre x Tcf4+/flox control littermates were originally generated in the lab of Prof. B. Reizis 1,2.
Mice lacking the pIII and pIV promoter elements of Class II transactivator (CIITA) (pIII+IV–/–) 3,4 were
maintained on a µMT (B cell deficient) background and µMT mice were used as controls. MHCII-deficient
bone marrow was kindly provided by the lab of Sebastian Amigorena (INSERM U932, Institut Curie, Paris,
France). For atherosclerosis experiments, male 6-8 week old Ldlr–/– mice were lethally irradiated (9.5 Gy) then
injected i.v. with 1x10⁷ bone marrow cells from donor mice. After 4 weeks recovery, mice were fed a high fat
diet (21% Fat, 0.15% Cholesterol) for 6 or 8 weeks. In order to assess the effects of selective deficiency of
pIII+IV on pDCs but not B cells, lethally irradiated Ldlr–/– mice were reconstituted with a mixture of 80% bone
marrow from either µMT:pIII+IV–/– or control µMT mice and 20% bone marrow from WT C57BL6 mice. In
this case, all B cells derive from the WT cells whereas 80% of all other leukocytes derive from µMT or
µMT:pIII+IV–/– cells. In some experiments, 100 µg of anti-CD4 depleting antibody (clone YTS 191.1) 5 was
injected every 10 days starting coincident with the start of HFD feeding.
Cell preparation from aorta
Cell suspension from aorta was prepared by enzyme digestion as previously described 6,7. Briefly, Ldlr–/– mice
were placed under terminal anesthesia and perfused with 2 mmol/L EDTA (Sigma-Aldrich, Gillingham, UK) in
PBS via cardiac puncture to remove blood contamination from vascular tissue. After removal of aortas, a single
cell suspension was obtained by incubation of aortic segments in an enzymatic suspension containing 450
U/mL collagenase type I, 125 U/mL collagenase type XI, 60 U/mL hyaluronidase, and 60 U/mL DNase (all
from Sigma-Aldrich) in PBS containing 20 mmol/L Hepes at 37°C for 1 hour. Digested aortas were then
mechanically disrupted through a 40-µmol/L cell strainer to release a single cell suspension. All the Abs used
Sage et al, CIRCULATIONAHA-2014-011090-R2 for flow cytometry analysis of mouse aorta had been validated on cell suspensions from spleen/lymph nodes
untreated or treated with the enzyme digestion cocktail.
Flow cytometry
Single cell suspensions of bone marrow, spleen, lymph node, blood and aorta were stained with fluorophore-
conjugated antibodies (Supplemental Table 1) and analyzed using LSRII Fortessa (BD) or CyAN ADP
(Beckman Coulter) flow cytometers. For intracellular staining, cells were activated with leukocyte activation
cocktail (BD) for 4 h. Cells were fixed with IC fixation buffer (eBioscience) before intracellular staining. Cells
were processed with Foxp3 buffer set (eBioscience) before staining with Foxp3. Data was analysed using
FlowJo software (TreeStar, OR, USA). Dead cells were excluded based on FSc, SSc and positive staining for
Live/Dead Aqua (Life Technologies). pDCs were defined as CD11clo PDCA1hi B220+ CD11b–, cDC as
CD11chi MHCII+, B cells as B220+ IgM+ or CD19+ lymphocytes, T cells as CD4+ or CD8+ lymphocytes, Treg
as CD4+ CD25+ Foxp3+ GITR+, monocytes as CD11b+ Ly6G- and Ly6C low, intermediate or high, neutrophils
as CD11b+ Ly6G+ Ly6C+. Representative plots are shown in Supplemental Figure 1. In some experiments,
Siglec-H (Miltenyi) was used as an additional pDC marker.
Analysis of in vivo antigen uptake/processing
To study the ability of aortic pDCs to present systemic antigen, we used the Eα-GFP/Y-Ae system as described
previously 7,8,9. Briefly, Ldlr–/– mice fed chow or HFD were i.v. injected either with 1 mg of Eα antigen or PBS,
and were killed 4 hours later for FACS analysis. The APCs take up the Eα antigen, and the Eα peptide in the
context of MHC (I-Ab) can be recognized by the Y-Ae mAb.
To determine the anatomical location of the antigen processing pDCs, Ldlr–/– mice fed HFD for 28 days were
injected i.v. with 2.5 mg of DQ ovalbumin (DQ-OVA; Molecular Probes). After 1 h the aortic sinus was
harvested, embedded in Tissue-Tec OCT (Tissue Tek, Sakura Finetek Europe, Zoeterwoude, the Netherlands)
and snap frozen for immunohistochemical analysis. For staining, sections were fixed in acetone for 10 mins, air
dried, and rehydrated with PBS before incubation in serum-free Protein Block (DakoCytomation) for 30 mins.
pDCs were detected by staining for Siglec-H (440c, HyCult Biotech, Uden, The Netherlands). The primary
antibody was detected using a Texas Red conjugated donkey anti-rat IgG (Jackson ImmunoResearch). Images
Sage et al, CIRCULATIONAHA-2014-011090-R2 were taken by a Leica DFC340 FX video-camera (Leica Microsystems) connected to a fluorescence microscope
(Leica DMRB) using the LAS software (vers. 2.8.1, Leica). Dapi was used to identify nuclei.
For in vivo OT-II stimulation, C57BL6 mice (4/group) were injected with 5 x 10⁶ CFSE (Life Technologies)–
labeled OT-II T cells. After 24h mice were injected into the left footpad with 1 x 10⁵ µMT or µMT:pIII+IV-/-
pDCs pre-incubated with ovalbumin (100 µg/ml) for 3h. OT-II T cell proliferation (CFSE dilution) was
assessed after 3 days by flow cytometry in the popliteal lymph node, using spleen and the contralateral popliteal
lymph node as internal controls.
In vitro dendritic cell culture
Bone marrow pDCs and spleen CD11c+ cells were isolated by negative and positive magnetic selection,
respectively, according to the manufacturer’s instructions using an AutoMACS Pro separator (Miltenyi). For
cytokine production, purified pDCs (2 x 10⁴) were treated with type A or B CpG or control GpC
oligonucleotides (10 µg/ml; Invivogen). IFNα levels in supernatants were quantified by ELISA (eBioscience).
Antigen-specific T cell stimulation in vitro
OT-II CD4+ T cells were incubated with cDCs or pDCs preincubated with 100 µg/ml ovalbumin (Sigma) and
proliferation quantified after 3 days by 3H thymidine incorporation over the final 18h. An I-Ab restricted murine
T cell hybridoma (48-5T) recognising human ApoB100 10 was added to pDCs or CD11c+ cells preincubated for
4h with native human LDL (50 µg/ml; Intracel) in 0.5% serum-DMEM and incubated overnight. Supernatants
were analysed for IL-2 levels by ELISA (Peprotech).
Analysis of atherosclerotic lesions
Total plasma cholesterol was quantified using a Cholesterol RTU kit (Biomerieux).
Aortic root atherosclerotic lesions were analysed by Oil Red O and CD3 staining as previously described 11.
Images were captured and analysed using a Leica DM6000B microscope and accompanying software.
Statistics
Results were presented as mean ± S.E. They were analyzed in GraphPad Prism (La Jolla, CA, USA) using
unpaired t-test, non-parametric Mann Whitney U test, one way analysis of variance or two-way analysis of
variance, as appropriate. A P value (two-sided) of <0.05 was considered significant. For analysis of

Sage et al, CIRCULATIONAHA-2014-011090-R2 atherosclerotic lesions in the aortic root, the entire 10-section profile was analyzed by repeated measures two-
way analysis of variance and the p value for between groups displayed.
Sage et al, CIRCULATIONAHA-2014-011090-R2 Supplemental methods references
1. Ghosh, H. S., Cisse, B., Bunin, A., Lewis, K. L. & Reizis, B. Continuous expression of the transcription factor e2-2 maintains the cell fate of mature plasmacytoid dendritic cells. Immunity 33, 905–916 (2010).
2. Cisse, B. et al. Transcription factor E2-2 is an essential and specific regulator of plasmacytoid dendritic cell development. Cell. 2008;135:37–48.
3. LeibundGut-Landmann, S., Waldburger, J.-M., Reis e Sousa, C., Acha-Orbea, H. & Reith, W. MHC class II expression is differentially regulated in plasmacytoid and conventional dendritic cells. Nat. Immunol. 2004;5:899–908.
4. Irla, M. et al. MHC class II-restricted antigen presentation by plasmacytoid dendritic cells inhibits T cell-mediated autoimmunity. J. Exp. Med. 2010;207:1891–1905.
5. Cobbold, S. P., Jayasuriya, A., Nash, A., Prospero, T. D. & Waldmann, H. Therapy with monoclonal antibodies by elimination of T-cell subsets in vivo. Nature. 1984;312:548–551.
6. Galkina, E. et al. Lymphocyte recruitment into the aortic wall before and during development of atherosclerosis is partially L-selectin dependent. J. Exp. Med. 2006;203:1273–1282.
7. Macritchie, N. et al. Plasmacytoid dendritic cells play a key role in promoting atherosclerosis in apolipoprotein E-deficient mice. Arterioscler. Thromb. Vasc. Biol. 2012;32:2569–2579.
8. Itano, A. A. et al. Distinct dendritic cell populations sequentially present antigen to CD4 T cells and stimulate different aspects of cell-mediated immunity. Immunity. 2003;19:47–57.
9. Rush CM, Mitchell TJ, Garside P. A detailed characterisation of the distribution and presentation of DNA vaccine encoded antigen. Vaccine. 2010;28:1620-1634.
10. Hermansson, A. et al. Inhibition of T cell response to native low-density lipoprotein reduces atherosclerosis. J. Exp. Med. 2010;207:1081–1093.
11. Ait-Oufella, H. et al. B cell depletion reduces the development of atherosclerosis in mice. J. Exp. Med. 2010;207:1579–1587.
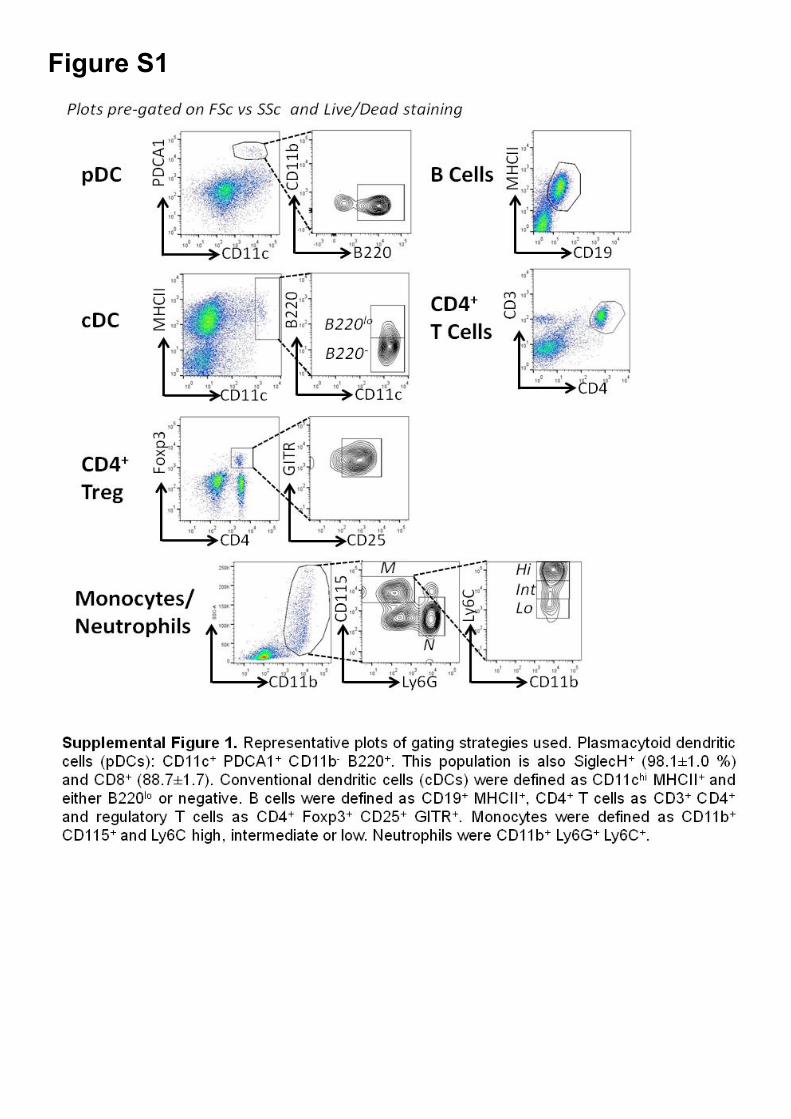
Figure S1
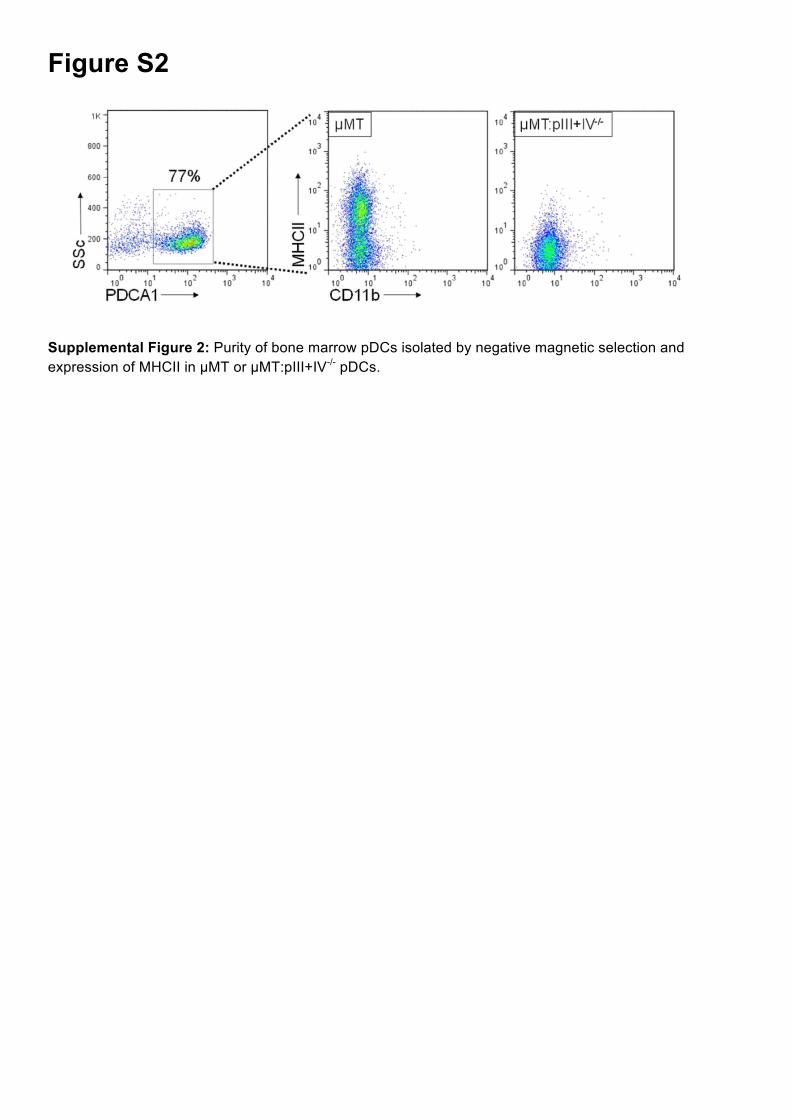
Figure S2
Supplemental Figure 2: Purity of bone marrow pDCs isolated by negative magnetic selection and expression of MHCII in µMT or µMT:pIII+IV-/- pDCs.
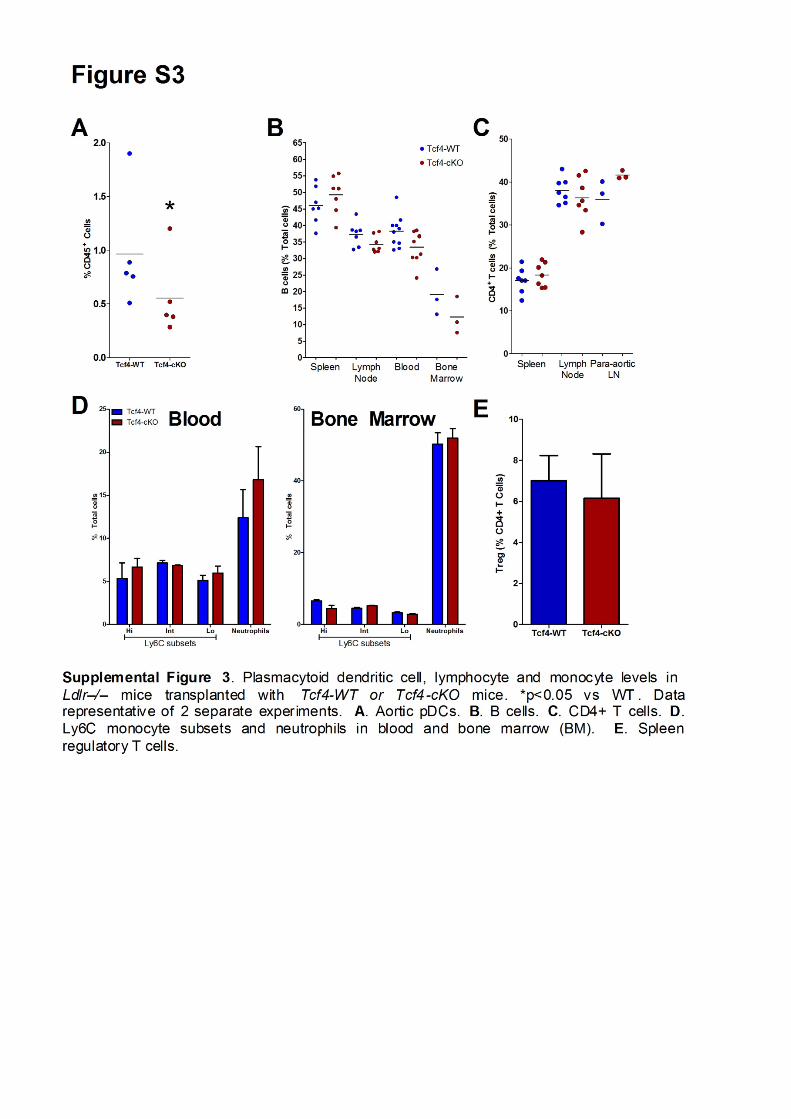
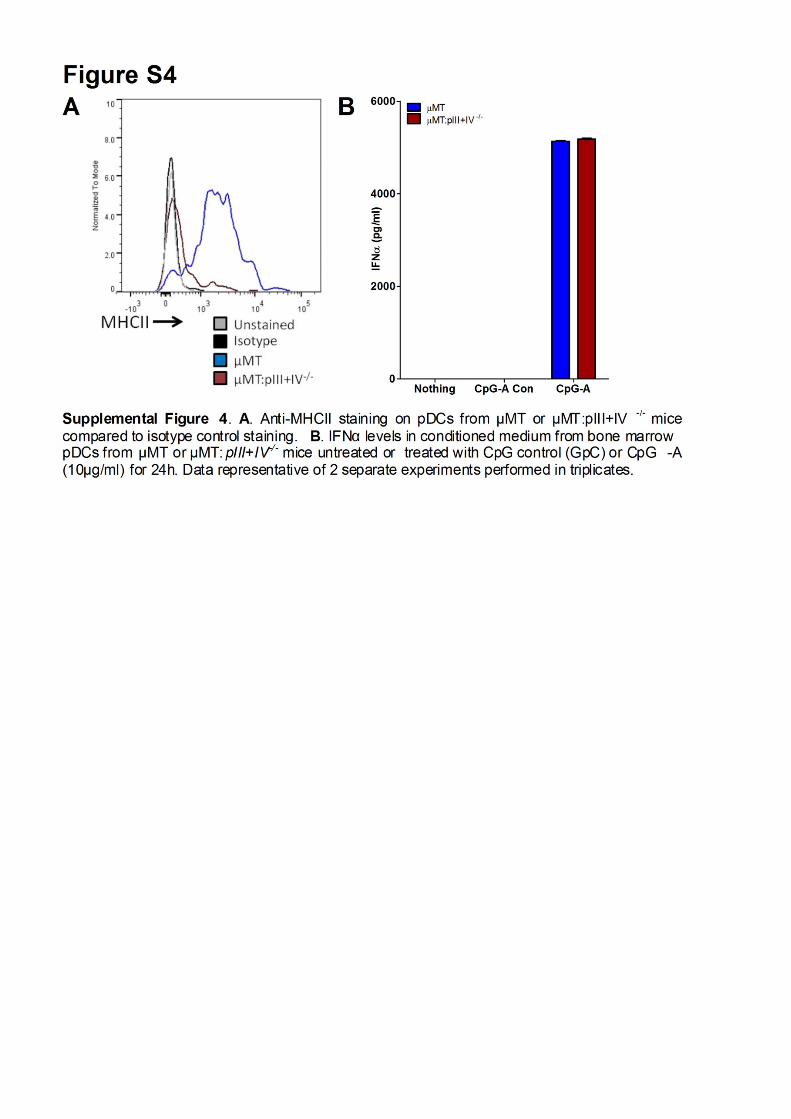
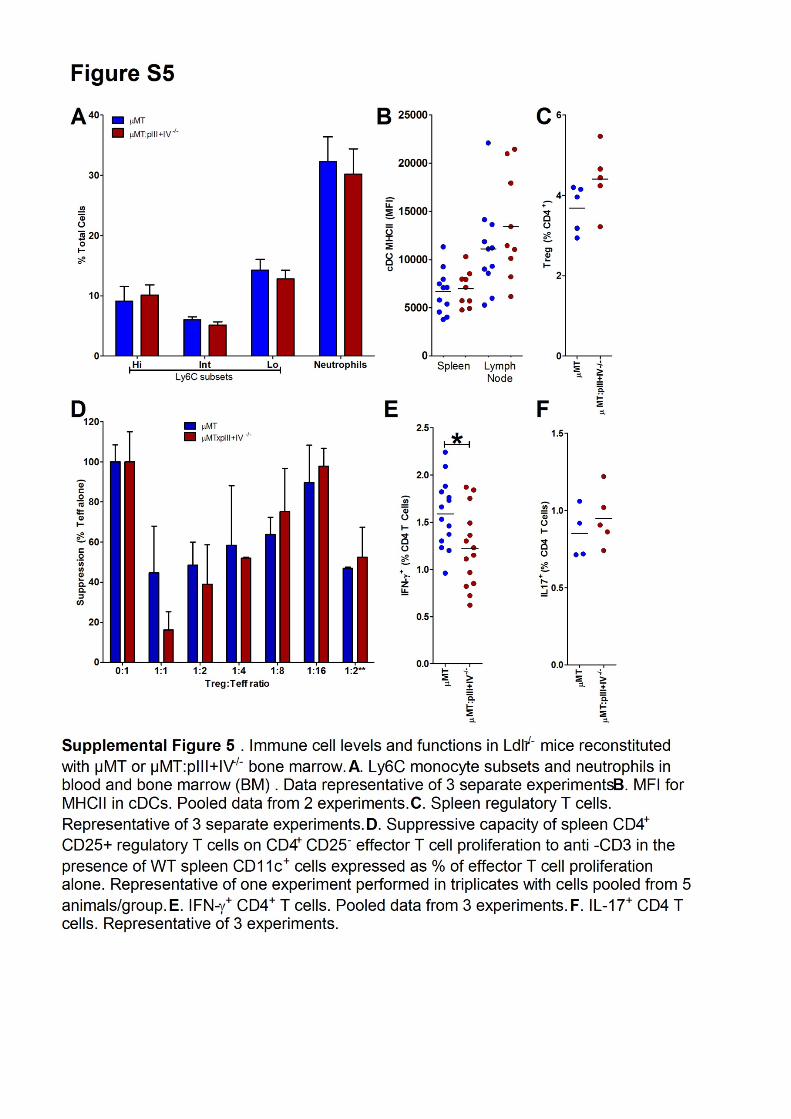
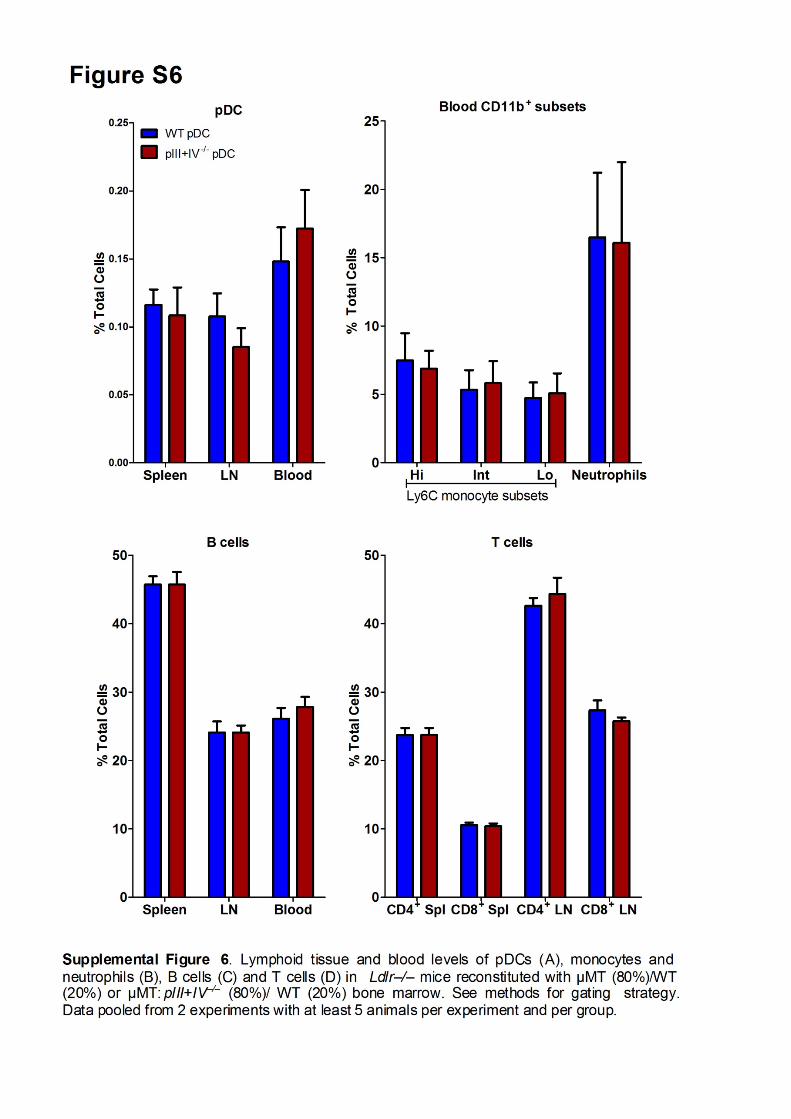
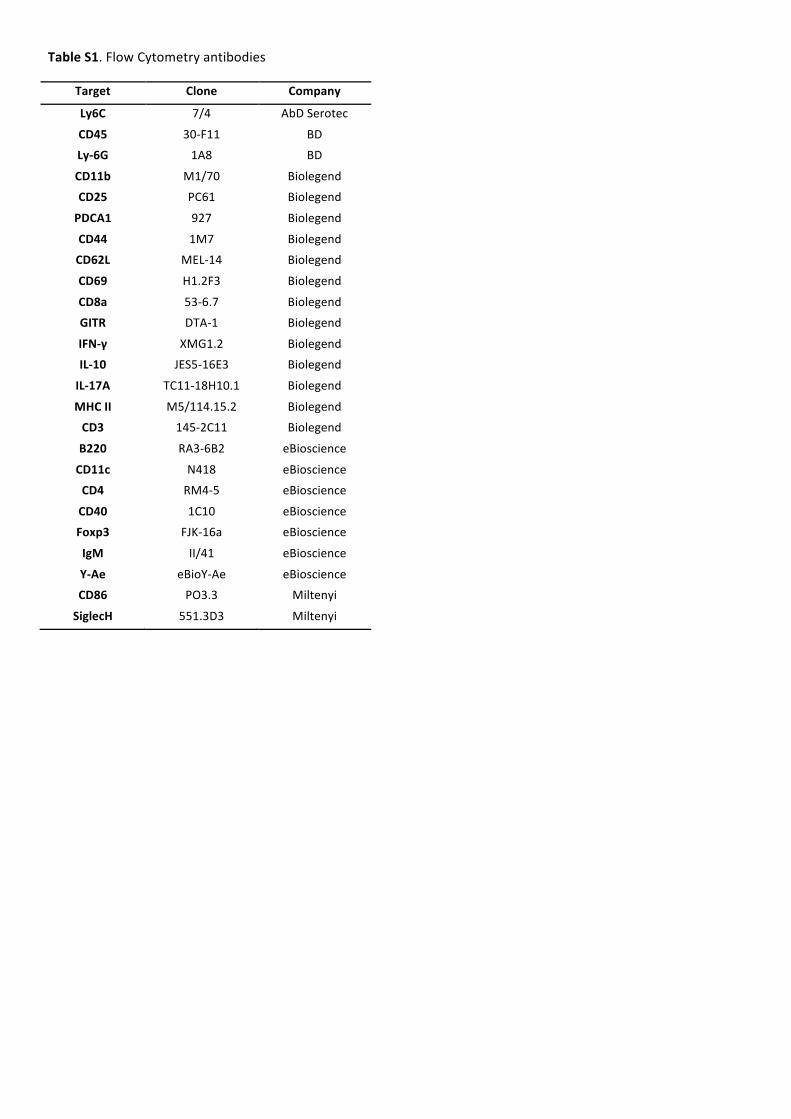
Table S1. Flow Cytometry antibodies
Target Clone Company
Ly6C 7/4 AbD Serotec
CD45 30-‐F11 BD Ly-‐6G 1A8 BD
CD11b M1/70 Biolegend CD25 PC61 Biolegend
PDCA1 927 Biolegend
CD44 1M7 Biolegend CD62L MEL-‐14 Biolegend
CD69 H1.2F3 Biolegend
CD8a 53-‐6.7 Biolegend GITR DTA-‐1 Biolegend
IFN-‐γ XMG1.2 Biolegend IL-‐10 JES5-‐16E3 Biolegend
IL-‐17A TC11-‐18H10.1 Biolegend
MHC II M5/114.15.2 Biolegend CD3 145-‐2C11 Biolegend
B220 RA3-‐6B2 eBioscience
CD11c N418 eBioscience CD4 RM4-‐5 eBioscience
CD40 1C10 eBioscience Foxp3 FJK-‐16a eBioscience
IgM II/41 eBioscience
Y-‐Ae eBioY-‐Ae eBioscience CD86 PO3.3 Miltenyi
SiglecH 551.3D3 Miltenyi


![FROM SCALE TO REVENUE€¦ · QuickBooks Yes Sage 50 – US Edition (formerly Sage Peachtree) Yes Sage 100 ]Contractor (formerly Sage Master Builder) Yes Sage 100 ERP (formerly Sage](https://img.pdfslide.us/doc/110x75/5f70586f8b6ad8086367e0a5/from-scale-to-revenue-quickbooks-yes-sage-50-a-us-edition-formerly-sage-peachtree.jpg)