Embed Size (px)
Citation preview
1
Cardiolipin and Electron Transport Chain Abnormalities in Mouse Brain Tumor
Mitochondria: Lipidomic Evidence Supporting the Warburg Theory of Cancer
Michael A. Kiebish,* Xianlin Han,
† Hua Cheng,
† Jeffrey H. Chuang,
* Thomas N. Seyfried
*
*Boston College, Biology Department, Chestnut Hill, MA, USA
†Washington University School of Medicine, Department of Internal Medicine, St. Louis, MO,
USA
Address Correspondence to:
Thomas N. Seyfried, Ph.D.
Biology Department
Boston College
Chestnut Hill, MA 02467
Phone: 617-552-3563
Fax: 617-552-2011
by guest, on August 23, 2018
ww
w.jlr.org
Dow
nloaded from
2
ABSTRACT
Otto Warburg first proposed that cancer originated from irreversible injury to mitochondrial
respiration, but the structural basis for this injury has remained elusive. Cardiolipin is a complex
phospholipid found almost exclusively in the inner mitochondrial membrane and is intimately
involved in maintaining mitochondrial functionality and membrane integrity. Abnormalities in
cardiolipin can impair mitochondrial function and bioenergetics. We used shotgun lipidomics to
analyze cardiolipin content and composition in highly purified brain mitochondria from the
C57BL/6J (B6) and VM/Dk (VM) inbred strains and from subcutaneously grown brain tumors
derived from these strains to include an astrocytoma and ependymoblastoma (B6 tumors), a stem
cell tumor, and two microgliomas (VM tumors). Major abnormalities in cardiolipin content or
composition were found in all tumors. The compositional abnormalities involved an abundance
of immature molecular species and deficiencies of mature molecular species suggesting major
defects in cardiolipin synthesis and remodeling. The tumor cardiolipin abnormalities were also
associated with significant reductions in both individual and linked electron transport chain
(ETC) activities. A mathematical model was developed to facilitate data interpretation. The
implications of our findings to the Warburg cancer theory are discussed.
Supplementary Keywords: metabolism, tumorigenesis, carcinogenesis, bioenergetics
by guest, on August 23, 2018
ww
w.jlr.org
Dow
nloaded from
3
INTRODUCTION
Otto Warburg first proposed that the prime cause of cancer was impaired energy
metabolism (1, 2). This impairment involved irreversible injury to cellular respiration that was
followed in time by a gradual dependence on fermentation (glycolytic) energy in order to
compensate for the lost energy from respiration. Cell viability requires a constant delta G’ of
ATP hydrolysis of approximately -57 kJ/mol (3, 4). Most normal mammalian cells achieve this
level of useable energy through respiration, whereas tumor cells achieve this level through a
combination of respiration and glycolysis (2, 5). Indeed, elevated glycolysis is the metabolic
hallmark of nearly all tumors including brain tumors and is the basis for tumor imaging using
labeled glucose analogues (5-8). Much controversy has surrounded the Warburg theory,
however, largely over issues regarding the Pasture effect and aerobic glycolysis (9-14).
Numerous structural and biochemical abnormalities occur in tumor cell mitochondria that could
compromise function thus forcing a reliance on glycolysis for cell survival (5, 6, 9, 15-17).
Although several prior studies have evaluated the lipid composition of tumor mitochondria (18-
25), no prior studies have evaluated both the content and the composition of cardiolipin in highly
purified mitochondria isolated from brain tumors and from their orthotopic host tissue.
Cardiolipin (1,3-diphosphatidyl-sn-glycerol, CL) is a complex mitochondrial specific
phospholipid that regulates numerous enzyme activities especially those related to oxidative
phosphorylation and coupled respiration (26-31). CL binds Complex I, III, IV, and V and
stabilizes the super complexes (I/III/IV and II/III/IV) demonstrating an absolute requirement of
CL for catalytic activity of these enzyme complexes (27, 29, 32, 33). CL restricts pumped
protons within its head group domain thus providing the structural basis for mitochondrial
membrane potential and in supplying protons to the ATP synthase (26, 30). The activity of
by guest, on August 23, 2018
ww
w.jlr.org
Dow
nloaded from
4
respiratory enzyme complex I and III and their linked activities are directly related to CL content
(29, 34, 35). The activities of the respiratory enzyme complexes are also dependent on CL
molecular species composition (30). Indeed, the degree of CL unsaturation is related to states 1-
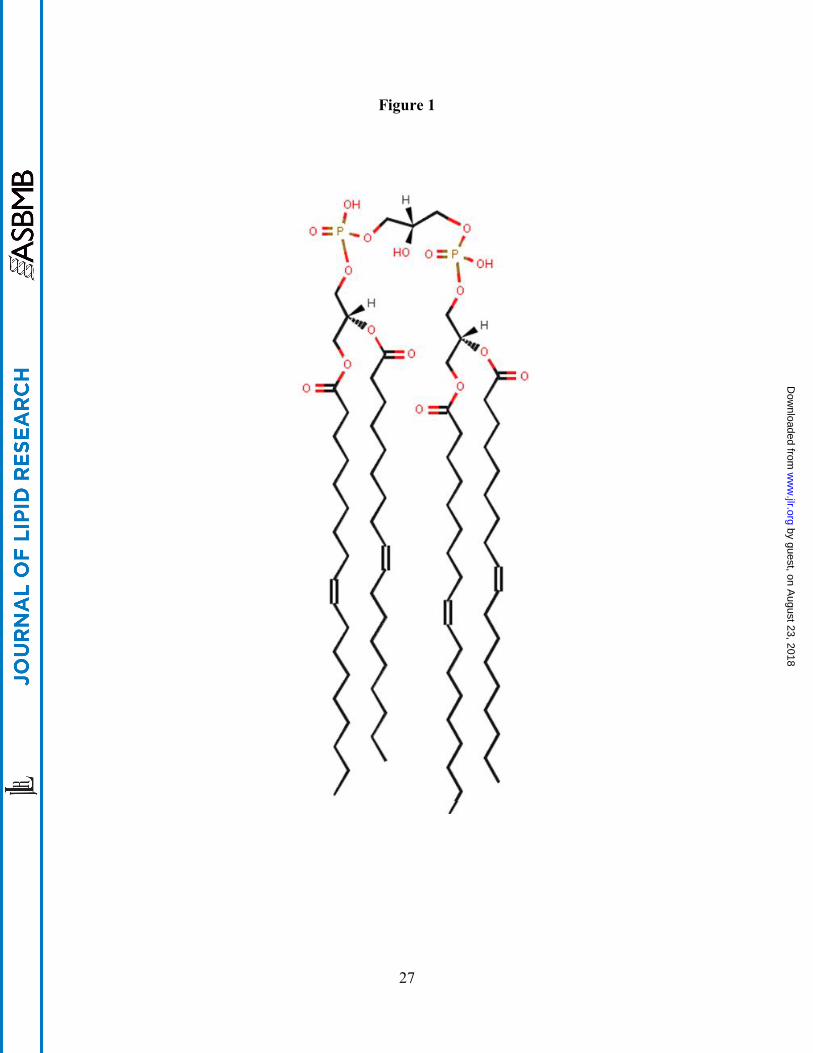
3 of respiration (31, 36). CL contains two phosphate head groups, three glycerol moieties, and
four fatty acyl chains (Fig. 1). Almost 100 molecular species of CL were recently detected in the
mitochondria from mammalian brain (37, 38). Moreover, these molecular species form a unique
pattern consisting of seven major groups when arranged according fatty acid chain length and
degree of unsaturation (38). Interestingly, the CL pattern in B6 brain mitochondria is conserved
across mammalian species (37). In contrast to B6 mice, VM mice have an unusual distribution
of brain CL molecular species that could relate to the high incidence of spontaneous gliomas in
this strain (39).
The complexity of CL molecular species is regulated through both synthesis and
remodeling. The condensation of phosphatidylglycerol and CDP-diacylglycerol produces
immature CL, which contains predominantly shorter chain saturated and monounsaturated fatty
acyl chains (palmitic and oleic acids). The immature CL is then remodeled to form mature CL
through the coordinated activities of specific lipases and acyltransferases, which remove and
transfer, respectively, longer chain unsaturated fatty acids from the sn-2 position of donor
choline and ethanolamine glycerophospholipids (39-41). We recently showed that the complex
pattern of brain CL molecular species arises from a simple remodeling process involving random
fatty acid incorporation (38).
Alterations in phospholipid and fatty acid composition were previously reported in neural
tumors (42-44). These alterations could influence the fatty acids available for CL remodeling.
In the present study, we used shotgun lipidomics to analyze CL content and composition in
by guest, on August 23, 2018
ww
w.jlr.org
Dow
nloaded from
5
highly purified brain mitochondria from the C57BL/6J (B6) and VM/Dk (VM) inbred strains and
from subcutaneously grown brain tumors derived from these strains. The syngeneic B6 brain
tumors were chemically induced and included an astrocytoma (CT-2A) and an
ependymoblastoma (EPEN) (45). The syngeneic VM brain tumors arose spontaneously and
included two microgliomas (VM-M2 and VM-M3) and a stem cell tumor (VM-NM1) (46). Our
results show that these mouse brain tumors contain CL abnormalities that are unique to each
tumor type and that these abnormalities are associated with deficiencies in ETC activities. Our
results suggest that abnormal CL can underlie the irreversible respiratory injury in tumors and
link mitochondrial lipid defects to the Warburg theory of cancer.
MATERIALS AND METHODS
Materials
Synthetic 1,1’,2,2’-tetramyristoyl cardiolipin (T14:0 CL) was purchased from Avanti
Polar Lipids, Inc. (Alabaster, AL, USA). Solvents for sample preparation and mass
spectrometric analysis were obtained from Burdick and Jackson (Honeywell International, Inc.,
Muskegon, MI, USA). All other chemical reagents were of at least analytical grade or the best
grade available and were obtained from either Fisher Scientific (Pittsburgh, PA, USA) or Sigma-
Aldrich (St. Louis, MO, USA).
Mice
The VM mice were obtained from Professor H. Fraser, University of Edinburgh. The B6
mice were obtained from the Jackson Laboratory (Bar Harbor, ME, USA). Mice of both strains
were matched for age (4 months) and sex (males) and were propagated under similar conditions
by guest, on August 23, 2018
ww
w.jlr.org
Dow
nloaded from
6
at the Boston College Animal Facility. Mice were housed in plastic cages with filter tops
containing Sani-Chip bedding (P.J. Murphy Forest Products Corp., Montville, NJ, USA). The
room was maintained at 22 ºC on a 12 hr light/dark cycle. Food (Prolab RMH 3000; PMI
LabDiet, Richmond, IN, USA) and water were provided ad libitum. This study was conducted
with the National Institutes of Health Guide for the Care and Use of Laboratory Animals and was
approved by the Institutional Animal Care Committee.
Tumors
The CT-2A and EPEN brain tumors were originally produced from the implantation of
20-methylcholanthrene into the brains of B6 mice as previously described (45, 47). The CT-2A
tumor was isolated initially from the cerebral cortex in 1985 and was characterized as a
malignant anaplastic astrocytoma, whereas the EPEN tumor was isolated from the cerebral
ventricle in 1949 and was characterized as an ependymoblastoma (45, 48). The VM-NM1, VM-
M2, and VM-M3 tumors arose spontaneously in the cerebrum of 3 different adult VM mice from
1993-2000, as previously described (46). VM-NM1 is a rapidly growing non-metastatic tumor
with characteristics of neural stem cells. The VM-M2 and VM-M3 are highly
invasive/metastatic tumors of microglial/macrophage origin with characteristics of glioblastoma
multiforme (46).
Male mice (8-12 weeks of age) were used as tumor recipients. Tumor pieces from donor
mice were diced and resuspended in cold phosphate buffered saline (PBS) at pH 7.4. Mice were
anesthetized with isoflurane (Halocarbon, NJ, USA) and 0.1 mL of diced tumor tissue suspended
in 0.2 mL PBS, was implanted subcutaneously in the right flank by injection using a 1 cc
tuberculin syringe and an 18-gauge needle.
by guest, on August 23, 2018
ww
w.jlr.org
Dow
nloaded from
7
Mitochondrial Isolation
Non-synaptic mouse brain or tumor mitochondria were isolated using discontinuous
Ficoll and sucrose gradients as previously described (38, 39). A highly enriched mitochondrial
fraction was obtained and used for lipidomics analysis as well as ETC enzyme activities.
Sample Preparation for Mass Spectrometric Analysis
An aliquot of purified mitochondria was transferred to a disposable culture borosilicate
glass tube (16 X 100mm). An internal standard, T14:0 CL (3 nmol/mg protein) was added to
each purified mitochondrial homogenate based on the protein concentration, thereby allowing the
final quantified lipid content to be normalized to the protein content to eliminate variability
between the samples. Lipids from each mitochondrial homogenate were extracted by a modified
Bligh and Dyer procedure as previously described (37, 49). Each lipid extract was reconstituted
with a volume of 500 L/mg protein in CHCl3/MeOH (1:1, v/v). The lipid extracts were flushed
with nitrogen, capped, and stored at -20 ºC for ESI/MS analysis. Each lipid solution was diluted
approximately 50-fold immediately prior to infusion and lipid analysis.
Instrumentation and Mass Spectrometry
High resolution based shotgun lipidomics analyses of CL was performed on a triple-stage
quadrupole (QqQ) mass spectrometer (Thermo Scientific, San Jose, USA) equipped with an
ionspray ion source as previously described (50). All electrospray ionization mass spectrometric
analyses were conducted by direct infusion, employing a Harvard syringe pump at a flow rate of
4 L/min. Typically, a 1 min or 2 min of signal averaging was employed for each mass
by guest, on August 23, 2018
ww
w.jlr.org
Dow
nloaded from
8
spectrum or tandem mass spectrum, respectively. For product ion analyses by the QqQ mass
spectrometer, the precursor ion was selected by the first quadrupole, with a mass window of 0.7
Th. All mass spectra and tandem mass spectra were automatically acquired by a customized
sequence of subroutine operated under Xcalibur software (51).
Electron Transport Chain Enzyme Activities
Purified mitochondrial samples were freeze-thawed three times before use in enzyme
analysis to give substrate access to the inner mitochondrial membrane. All assays were
performed on a temperature controlled SpectraMax M5 plate reader (Molecular Devices) and
were done in triplicate. Specific enzyme activities were calculated using ETC complex
inhibitors in order to subtract background activities.
Complex I (NADH-ubiquinone oxidoreductase) activity was determined by measuring
the decrease in the concentration of NADH at 340 nm as previously described (52, 53). The
assay was performed in buffer containing 50 mM potassium phosphate (pH 7.4), 2 mM KCN, 5
mM MgCl2, 2.5 mg/mL BSA, 2 M antimycin, 100 M decylubiquinone, and 0.3 mM
K2NADH. The reaction was initiated by adding purified mitochondria (20 g). The enzyme
activity was measured for 5 min and values were recorded 30 sec after the initiation of the
reaction. Specific activities were determined by calculating the slope of the reaction in the linear
range in the presence or absence of 1 M rotenone (Complex I inhibitor).
Complex I/III (NADH cytochrome c reductase) activity was determined by measuring the
reduction of oxidized cytochrome c at 550 nm. The Complex I/III assay was performed in buffer
(50 mM potassium phosphate (pH 7.4), 1 mM EDTA, 2 mM KCN, 32 M oxidized cytochrome
c, and 105 M K2NADH) and was initiated by adding purified mitochondria (10 g). The
by guest, on August 23, 2018
ww
w.jlr.org
Dow
nloaded from
9
reaction was measured for 30 sec with a linear slope in the presence or absence of 1 M rotenone
and 2 M antimycin (Complex I and III inhibitors) (52-54).
Complex II/III (succinate cytochrome c reductase) activity was measured following the
reduction of oxidized cytochrome c at 550 nm. The Complex II/III assay was performed in
buffer (25 mM potassium phosphate (pH 7.4), 20 mM succinate, 2 mM KCN, 2 g/mL rotenone)
using purified mitochondria (10 g). The reaction was initiated by adding 40 M oxidized
cytochrome c in the presence or absence of 2 M antimycin (Complex III inhibitor) (52, 53).
Association of Mitochondrial ETC Activities with Cardiolipin Content and Composition
As mitochondrial ETC activities depend on the content and the composition of CL, we
modeled ETC activities as a function of CL content and composition in the mouse brain tumors.
The two main variables included, 1) total CL content and 2) the distribution of CL molecular
species in mitochondria. The information about the molecular species distribution was simplified
into a single number, which described the degree of relationship of the CL composition of the
tumor mitochondria with that of brain mitochondria from the host mouse strain. This number
was generated as a Pearson product-moment correlation. Rather than using the correlation
coefficients as a statistical measure of significance, we used the correlation coefficient only to
assess the degree of “compositional similarity” of CL from the host mouse brain mitochondria
with that of tumor mitochondria. A low coefficient indicates that CL molecular species
composition is dissimilar between the host brain mitochondria and the tumor mitochondria. A
high correlation indicates that CL molecular species composition is similar between the host
brain mitochondria and the tumor mitochondria.
by guest, on August 23, 2018
ww
w.jlr.org
Dow
nloaded from
10
The following formula was used to associate each ETC activity (Complex I, Complex
I/III, and Complex II/III) with CL content and composition.
Activity = a1 content + a2 content · correlation + c
We modeled the activity of a given ETC enzyme complex as a sum of three terms. The first term
(a1 content) is based on the assumption that ETC activity will decrease with decreases in CL
content. The second term (a2 content · correlation) is based on the assumption that ETC activity
is related to both CL content and the distribution of molecular species. The third term (c) is a
constant indicating a basal level of enzymatic activity independent of CL. The best-fit values of
a1, a2, and c were calculated in the R statistical programming environment (55) for each Complex
using the B6 data. We then considered whether the B6 and the VM ETC activities had similar
biochemical dependences on the CL content and molecular distribution. We tested this by
plotting the VM data on the B6-fit quadratic surfaces. To plot the data concurrently, we shifted
the VM data vertically to best fit the B6 surfaces. In other words, optimal VM “c” values for
each Complex were fit to minimize the square deviation from the B6 surfaces. This shift is
necessary because the CL pattern of the VM brain is different from that of the B6 brain (39).
The relative c values in the B6 and VM strains for Complex I were -30.277 and -343.775,
respectively. The relative c values for Complex I/III were +1.306 and -115.125, respectively.
The relative c values for Complex II/III were +21.634 and -51.15, respectively. We found that
the VM data exhibited qualitative behavior consistent with the B6-fit surfaces.
RESULTS
We used multiple discontinuous gradients to obtain highly purified mitochondria from
normal brain and from brain tumor tissue. The length as well as choice of discontinuous
gradients employed was designed for the purpose of mitochondrial lipid analysis as well as for
by guest, on August 23, 2018
ww
w.jlr.org
Dow
nloaded from
11
assessment of ETC enzyme activities by standard biochemical procedures (38). We recently
showed that these isolation procedures provide precise information on the content and
composition of total mitochondrial lipids when analyzed using shotgun lipidomics (38, 39).
Mitochondria were isolated from the brain tumors grown subcutaneously in order to avoid
contamination from normal brain tissue surrounding the tumors. Since the tumors analyzed were
derived from either neural stem/progenitor cells or from glial cells (45, 46, 56), the CL in tumor
mitochondria was compared with that in non-synaptic mitochondria from syngeneic mouse brain.
Our analysis in purified mitochondria also eliminates issues regarding differences in
mitochondrial content between tumor tissue and normal tissue (57). As the B6 and VM mouse
strains differ in CL composition (39), our comparative analysis was between the host strain and
those syngeneic tumors arising in that strain.
CL Abnormalities in the CT-2A and the EPEN Tumors
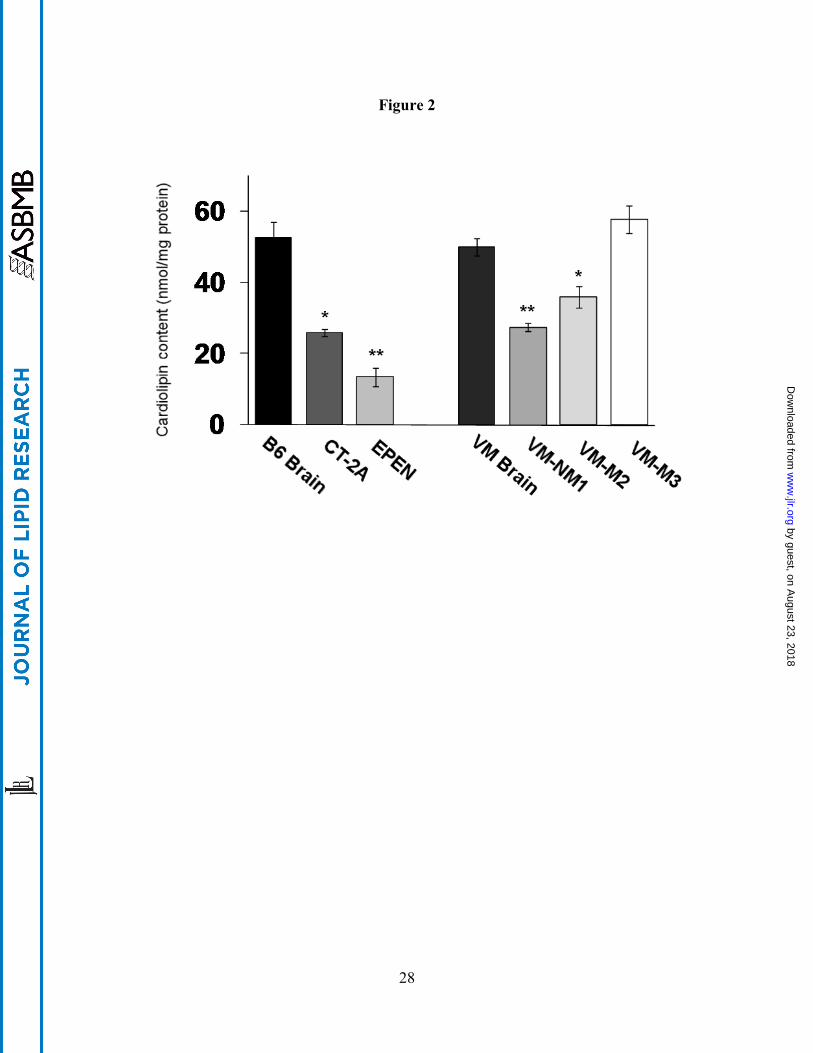
CL content was significantly lower in the mitochondria from the CT-2A and the EPEN
tumors than in the non-synaptic mitochondria from the control B6 mouse brain (Fig. 2). Almost
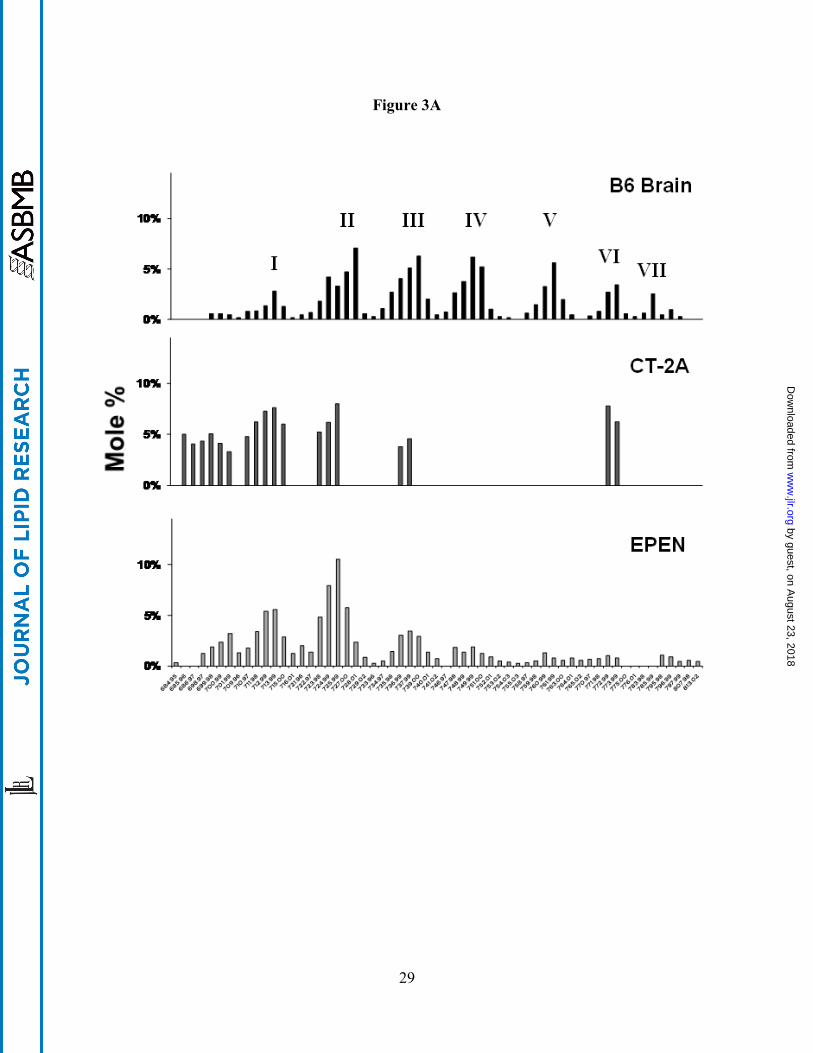
100 molecular species of CL occur in non-synaptic mitochondria from B6 mice (38). When
arranged according to mass to charge ratios, these molecular species form a unique pattern
consisting of seven major groups (Fig. 3A and Table 1). Group I contains predominantly shorter
chain saturated or monounsaturated fatty acids, whereas Groups V-VII contain predominantly
longer chain polyunsaturated fatty acids (38). The shorter chain saturated or monounsaturated
fatty acids are indicative of immature CL, while the longer chain polyunsaturated fatty acids are
indicative of mature CL. The distribution of CL molecular species in the CT-2A and the EPEN
mitochondria differed markedly from that of the B6 non-synaptic mitochondria (Fig. 3A). The
degree of relationship in CL molecular species distribution, expressed as a correlation
by guest, on August 23, 2018
ww
w.jlr.org
Dow
nloaded from
12
coefficient, between B6 non-synaptic mitochondria and CT-2A and EPEN tumor mitochondria
was 0.098 and 0.419, respectively. CT-2A was missing most molecular species in Groups IV, V,
and VII, while also expressing an abundance of species in and around Group I. The distribution
of CL molecular species was also abnormal in Groups II, III, and VI. As with the CL
distribution in CT-2A mitochondria, the CL distribution in the EPEN mitochondria also
contained an abundance of species in and around Group I and deficiency of species in Groups
III-VII. The overall distribution of molecular species also differed between the CT-2A and
EPEN tumors.
CL Abnormalities in the VM-M2, VM-M3, and VM-NM1 Tumors
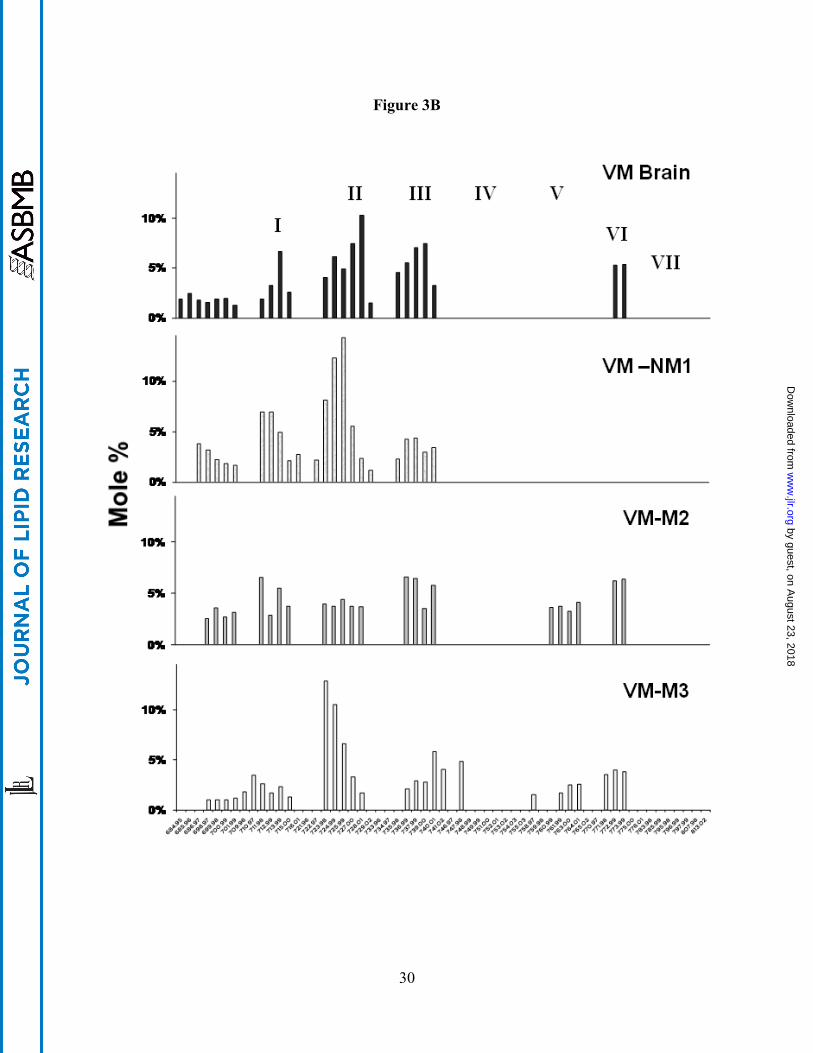
In contrast to the B6 mouse brain, which contains about 100 molecular species of CL
symmetrically distributed over seven major groups (Fig. 3A), the VM mouse brain is unique in
having only about 45 major CL molecular species and in missing molecular species in Groups
IV, V, and VII (Fig. 3B and Table 1). CL content was significantly lower in the mitochondria
from the VM-NM1 and the VM-M2 tumors than in the non-synaptic mitochondria from the
control VM mouse brain (Fig. 2). No significant difference in CL content was found between
the VM-M3 tumor and the VM brain. Each VM tumor differed from the VM brain with respect
to the distribution of CL molecular species (Fig. 3B). The degree of relationship in CL
molecular species distribution, expressed as a correlation coefficient, between VM non-synaptic
mitochondria and the VM-NM1, VM-M2, and VM-M3 tumor tissue was 0.601, 0.699, and
0.475, respectively. The CL molecular species also differed significantly among the VM tumors.
Electron Transport Abnormalities in Mouse Brain tumors
by guest, on August 23, 2018
ww
w.jlr.org
Dow
nloaded from
13
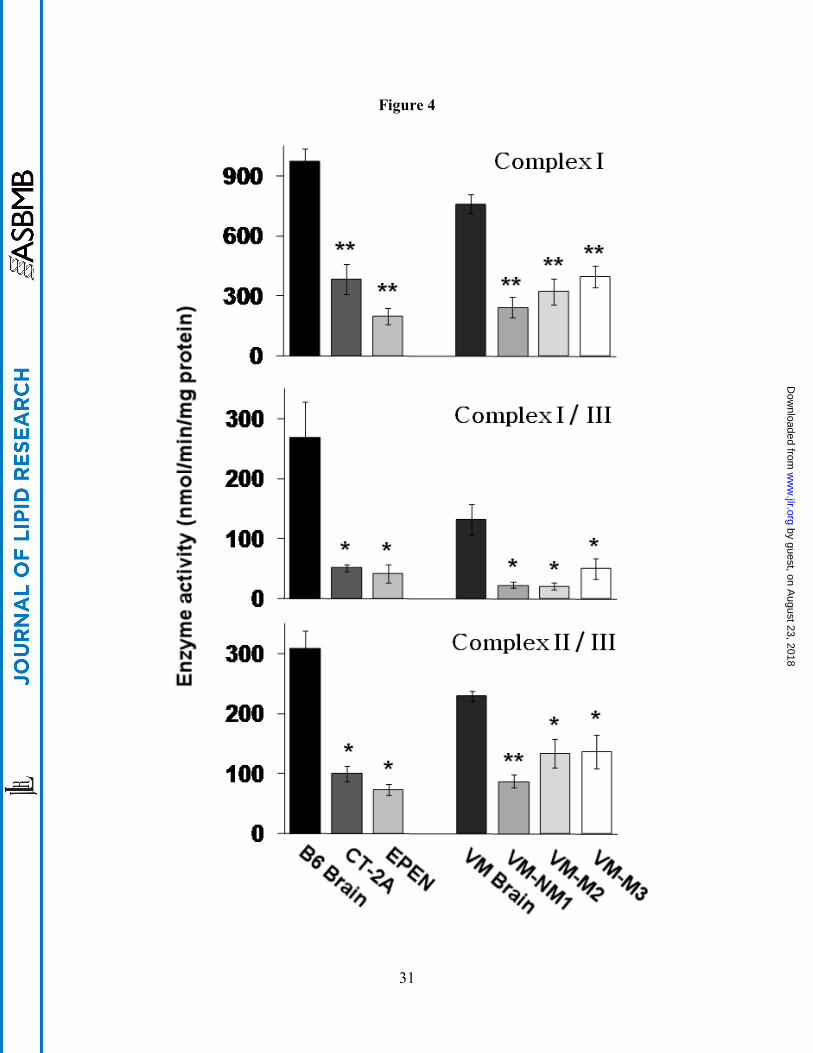
The activities of Complex I, I/III, and II/III were significantly lower in mitochondria
from the CT-2A and the EPEN tumors than in mitochondria from the syngeneic B6 brain.
Likewise, these ETC activities were significantly lower in mitochondria from the VM-NM1,
VM-M2, and VM-M3 brain tumors than in mitochondria from the syngeneic VM brain. The
unusual distribution of CL molecular species in the VM brain mitochondria could account for the
lower ETC activities in the VM mice compared to the B6 mice as we recently described (39).
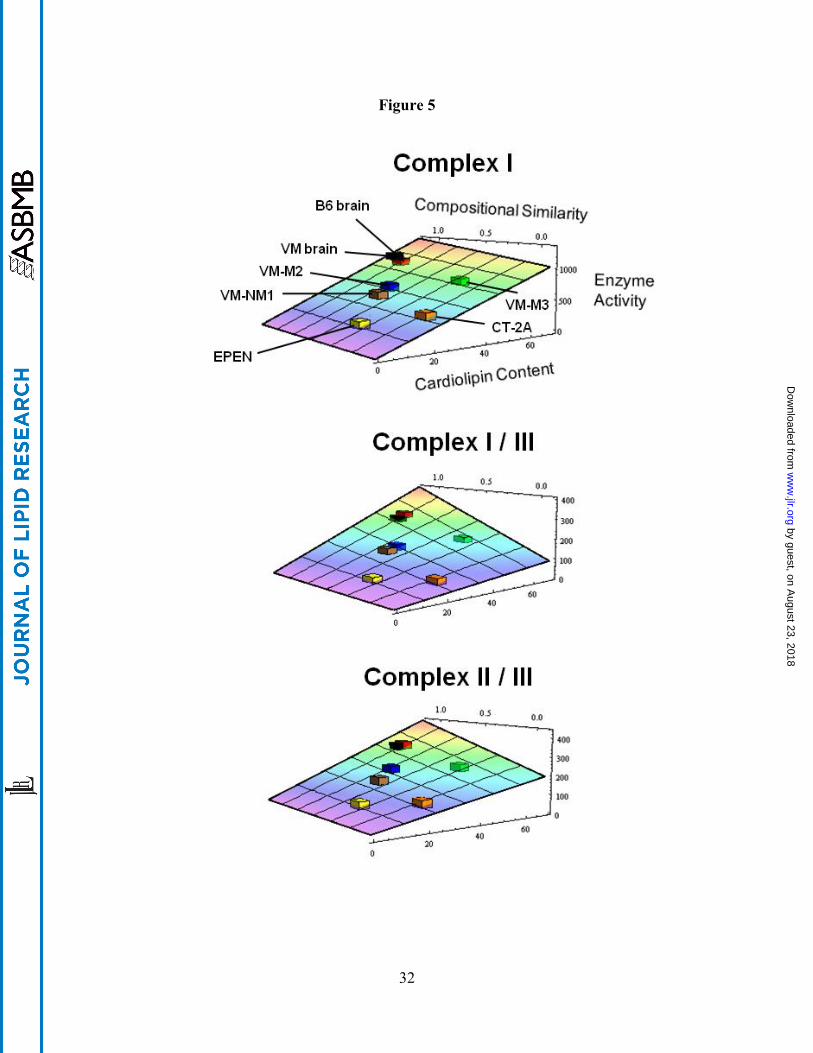
Relationship of CL Abnormalities with ETC Activities in the B6 and the VM Brain Tumors
To illustrate the relationship of ETC enzyme activities to CL content and composition,
we utilized a 2-dimensional linear regression to fit the measured activity values to a function of
the form: Activity = a1 content + a2 content · correlation + c (see Methods). The best-fit
relationship for each Complex was expressed as a quadratic surface. Our objective was to
compare the data for the CT-2A and the EPEN tumors with their B6 host strain and to compare
the VM-NM1, VM-M2, and VM-M3 tumors with their VM host strain. This analysis
demonstrated a direct relationship between ETC activity, CL content, and the distribution of
molecular species (Fig. 5). In comparing the B6 tumors with their host strain for Complex I, the
quadratic surface was calculated as; activity = 15.614 content + 3.443 content · correlation -
30.277. For Complex I/III, the quadratic surface was calculated as; activity = 1.599 content +
3.480 content · correlation + 1.306. For Complex II/III, the quadratic was calculated as; activity
= 2.768 content + 2.685 content · correlation + 21.634. For each Complex, the ETC activity
decreased with decreases in CL content relative to that in the B6 brain. However, the a1
component was greater for Complex I (15.614) than for Complex I/III (1.599) or Complex II/III
(2.768) indicating that Complex I activity is more dependent on CL content than is the activity
by guest, on August 23, 2018
ww
w.jlr.org
Dow
nloaded from
14
for the other two Complexes. Similar trends were also found for the relationship between ETC
activities and CL abnormalities in the VM brain tumors.
The various tumors cover a variety of cardiolipin contents and molecular species
compositions, suggesting that the enzymatic activity surfaces that we have modeled will be
useful for predicting Complex activities in other tumors using CL content and distribution. For
example, the EPEN tumor was positioned furthest from its control B6 host strain, whereas the
VM-M3 tumor was positioned closest to its VM host strain. These data demonstrate that the
difference between a tumor and its respective host strain for an ETC activity is directly related to
the difference between the tumor and host for CL content and composition.
DISCUSSION
The Warburg theory describes cancer as a metabolic disease of cellular respiration and
has generated considerable debate and controversy in the cancer field. Much of the controversy
surrounds the molecular mechanisms responsible for aerobic glycolysis, which involves defects
in the Pasture effect (13, 14, 58, 59). Indeed, the expression of aerobic glycolysis in tumor cells
has become generally known as the “Warburg effect” (10, 11, 60). Interestingly, Warburg
considered the phenomenon of aerobic glycolysis as too labile or too dependent on
environmental conditions to be a reliable indicator of tumor metabolism (1, 2). Rather he
emphasized the importance of structural defects in respiration as the more robust mechanism of
cancer. A greater dependence on glycolysis would naturally arise following irreversible
respiratory injury in order to maintain an adequate delta G’ of ATP hydrolysis for cell survival.
The emphasis on disturbances in aerobic glycolysis has diverted attention away from the key
aspect of Warburg’s theory on the underlying structural abnormalities responsible for injured
by guest, on August 23, 2018
ww
w.jlr.org
Dow
nloaded from
15
respiration in tumor cells (9, 12, 60). As CL is a major structural lipid of the mitochondrial inner
membrane that influences mitochondrial function and bioenergetics, we investigated for the first
time the content and composition of CL in highly purified mitochondria from a diverse group of
mouse brain tumors.
We found that CL composition and/or content in mouse brain tumor mitochondria
differed markedly from that in mitochondria derived from the normal syngeneic host brain tissue.
Moreover, we show that these CL abnormalities were associated with significant reductions in
ETC activities consistent with the pivotal role of CL in maintaining the structural integrity of the
inner mitochondrial membrane (31). We conducted our studies on mitochondria isolated from
the brain tumors grown in vivo rather than on mitochondria isolated from cultured brain tumor
cells as our preliminary studies showed that in vitro culture conditions produce CL
abnormalities, which would confound data interpretation (61). Our findings of CL abnormalities
in five diverse mouse brain tumor types are consistent with earlier studies in rat hepatomas
showing shorter chain saturated fatty acids (palmitic and stearic) characteristic of immature CL
(22, 62). Based on these and other observations, we suggest that most tumors regardless of cell
origin would contain abnormalities in CL composition and/or content.
As ETC complexes I, I/III, and II/III are necessary for maintaining the mitochondrial
proton gradient and respiratory energy production (26, 63), the CL abnormalities we found will
compromise respiratory energy metabolism in these brain tumors. Moreover, we consider it
highly unlikely that the CL abnormalities expressed in the various mouse brain tumors, or in any
tumor for that matter, are reversible. The correction of CL abnormalities in tumors would
require a cession of tumor growth coupled with multiple changes in CL synthesis and
remodeling. Due to the complex nature of CL remodeling as well as to the multiple components
by guest, on August 23, 2018
ww
w.jlr.org
Dow
nloaded from
16
involved (41), it seems unlikely that CL molecular speciation could be restored in any cancer
cell. Hence, our findings in the mouse brain tumors provide evidence linking abnormal CL to
irreversible respiratory injury.
Although Warburg emphasized that irreversible respiratory injury was the prime cause of
cancer, it is unclear whether the CL abnormalities we found in these mouse brain tumors arose as
a cause or as an effect of tumorigenesis or tumor progression. Originally, the CT-2A
astrocytoma and EPEN ependymoblastoma arose many months after 20-methylcholantherene
implantation into the B6 mouse brain, whereas the VM tumors arose spontaneously in the brains
of adult VM mice (45, 46). The brain tumors we studied were grown from clonal cell lines
established from each tumor. The high reproducibility of the CL abnormalities within
independent samples indicates that the CL abnormalities are a stable phenotype of each brain
tumor type. The CL abnormalities in these mouse brain tumors do not arise from mutations
within the mitochondrial genome since no pathogenic mutations were found in the sequenced
genome of each brain tumor (64). It is interesting, however, that abnormalities in CL molecular
species exist in brain of the inbred VM mice (39). These CL abnormalities might contribute to
the relatively high incidence of spontaneous gliomas in this strain. In light of these findings, we
suggest that inherited mutations within the nuclear genome could contribute either directly or
indirectly to abnormalities in CL synthesis or remodeling.
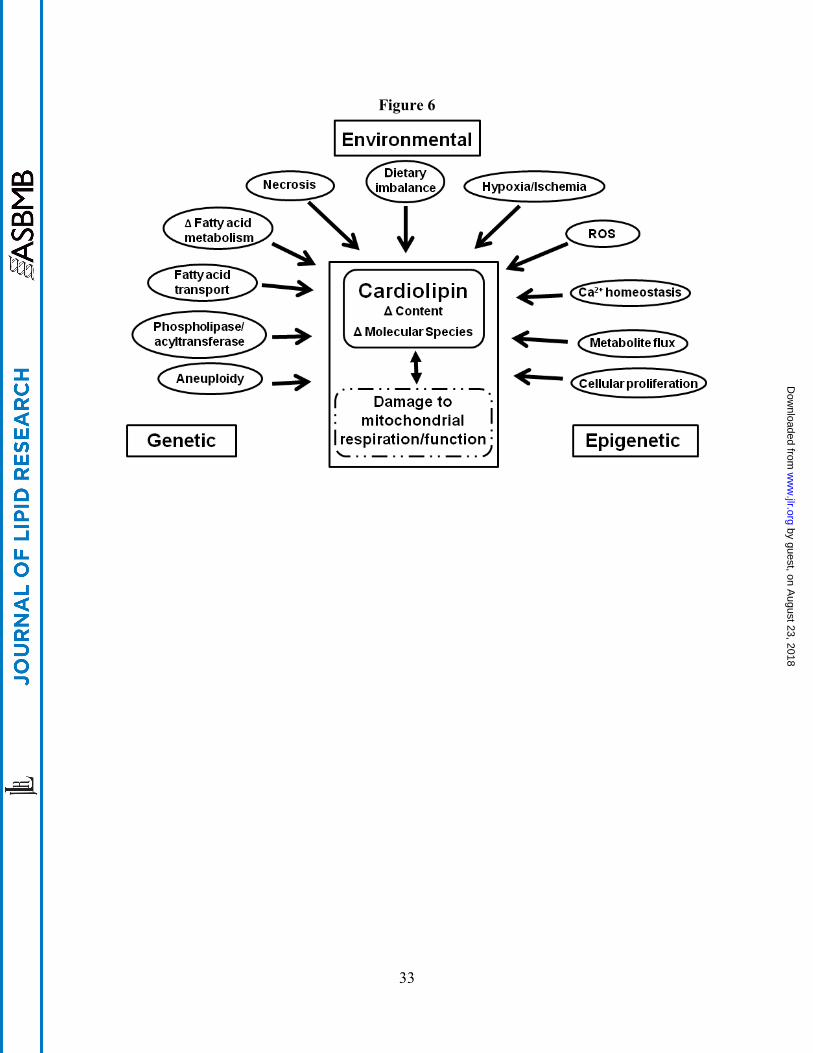
In addition to inherited mutations, somatic mutations in tumor suppressor/oncogenes or
aneuploidy could also produce mitochondrial defects thus causing CL abnormalities (65-67). CL
abnormalities could also arise from a variety of epigenetic causes involving abnormalities in
cellular proliferation, metabolic flux, and calcium homeostasis (68-70). A variety of
environmental insults including necrosis, hypoxia/ischemia, dietary imbalances, and reactive
by guest, on August 23, 2018
ww
w.jlr.org
Dow
nloaded from
17
oxygen species could also alter CL content and/or composition thus contributing to tumor
initiation or progression (71-75). Hence, respiratory injury in tumor cells can be linked to CL
abnormalities through numerous genetic, epigenetic, and environmental factors (Fig. 6).
The CL abnormalities we describe here could underlie in part the therapeutic response of
these and other tumors to dietary energy restriction and metabolic targeting (4, 76-82). By
impairing ETC efficiency, CL abnormalities would reduce the ability of tumor cells to obtain
energy from metabolic fuels other than glucose (3). Although our findings provide evidence
linking the Warburg cancer theory with abnormal CL, it is important to recognize that not all CL
abnormalities are associated with cancer. Indeed, CL abnormalities have been found in a variety
of non-neoplastic diseases to include diabetes, Barth syndrome, and several neurodegenerative
diseases (40, 73, 74). Nevertheless, our findings provide new evidence that abnormal CL can
underlie the irreversible respiratory injury in tumors thus linking Warburg’s cancer theory to
abnormal cardiolipin.
by guest, on August 23, 2018
ww
w.jlr.org
Dow
nloaded from
18
Acknowledgements
We would like to thank Mary Roberts, Daniel Kirschner, Rena Baek, Purna Mukherjee, and John
Mantis for helpful discussion. This work was supported by Grants from NIH (NS055195), NCI
(CA102135), and NIA (AG23168)
by guest, on August 23, 2018
ww
w.jlr.org
Dow
nloaded from
19
References
1. Warburg, O. 1931. The Metabolism of Tumours Richard R. Smith Inc., New York.
2. Warburg, O. 1956. On the origin of cancer cells. Science 123: 309-314.
3. Veech, R. L. 2004. The therapeutic implications of ketone bodies: the effects of ketone
bodies in pathological conditions: ketosis, ketogenic diet, redox states, insulin resistance, and
mitochondrial metabolism. Prostaglandins, leukotrienes, and essential fatty acids 70: 309-
319.
4. Seyfried, T. N., and P. Mukherjee. 2005. Targeting energy metabolism in brain cancer:
review and hypothesis. Nutr Metab (Lond) 2: 30.
5. Wu, M., A. Neilson, A. L. Swift, R. Moran, J. Tamagnine, D. Parslow, S. Armistead, K.
Lemire, J. Orrell, J. Teich, S. Chomicz, and D. A. Ferrick. 2007. Multiparameter metabolic
analysis reveals a close link between attenuated mitochondrial bioenergetic function and
enhanced glycolysis dependency in human tumor cells. Am J Physiol Cell Physiol 292:
C125-136.
6. Oudard, S., E. Boitier, L. Miccoli, S. Rousset, B. Dutrillaux, and M. F. Poupon. 1997.
Gliomas are driven by glycolysis: putative roles of hexokinase, oxidative phosphorylation
and mitochondrial ultrastructure. Anticancer research 17: 1903-1911.
7. Galarraga, J., D. J. Loreck, J. F. Graham, R. L. DeLaPaz, B. H. Smith, D. Hallgren, and C. J.
Cummins. 1986. Glucose metabolism in human gliomas: correspondence of in situ and in
vitro metabolic rates and altered energy metabolism. Metabolic brain disease 1: 279-291.
8. Kirsch, W. M., Q. Schulz, J. Van Buskirk, and P. Nakane. 1972. Anaerobic energy
metabolism in brain tumors. Progress in experimental tumor research 17: 163-191.
9. Colowick, S. P. 1961. The Status of Warburg's Theory of Glycolysis and Respiration in
Tumors. The Quarterly Review of Biology 36: 273-276.
10. Gatenby, R. A., and R. J. Gillies. 2004. Why do cancers have high aerobic glycolysis?
Nature reviews 4: 891-899.
11. Busk, M., M. R. Horsman, P. E. Kristjansen, A. J. van der Kogel, J. Bussink, and J.
Overgaard. 2008. Aerobic glycolysis in cancers: implications for the usability of oxygen-
responsive genes and fluorodeoxyglucose-PET as markers of tissue hypoxia. International
journal of cancer 122: 2726-2734.
12. Gogvadze, V., S. Orrenius, and B. Zhivotovsky. 2008. Mitochondria in cancer cells: what is
so special about them? Trends in cell biology 18: 165-173.
13. Weinhouse, S. 1976. The Warburg hypothesis fifty years later. Zeitschrift fur Krebsforschung
und klinische Onkologie 87: 115-126.
14. Aisenberg, A. C. 1961. The Glycolysis and Respiration of Tumors. Academic Press, New
York.
15. Foster, C. S., P. E. Spoerri, P. Glees, and O. Spoerri. 1978. The mode of mitochondrial
degeneration in gliomas. Acta neurochirurgica 43: 229-237.
16. Arismendi-Morillo, G. J., and A. V. Castellano-Ramirez. 2008. Ultrastructural mitochondrial
pathology in human astrocytic tumors: potentials implications pro-therapeutics strategies.
Journal of electron microscopy 57: 33-39.
17. Lopez-Rios, F., M. Sanchez-Arago, E. Garcia-Garcia, A. D. Ortega, J. R. Berrendero, F.
Pozo-Rodriguez, A. Lopez-Encuentra, C. Ballestin, and J. M. Cuezva. 2007. Loss of the
mitochondrial bioenergetic capacity underlies the glucose avidity of carcinomas. Cancer Res
67: 9013-9017.
by guest, on August 23, 2018
ww
w.jlr.org
Dow
nloaded from
20
18. Baggetto, L. G., E. Clottes, and C. Vial. 1992. Low mitochondrial proton leak due to high
membrane cholesterol content and cytosolic creatine kinase as two features of the deviant
bioenergetics of Ehrlich and AS30-D tumor cells. Cancer Res 52: 4935-4941.
19. Bergelson, L. D., E. V. Dyatlovitskaya, I. B. Sorokina, and N. P. Gorkova. 1974.
Phospholipid composition of mitochondria and microsomes from regenerating rat liver and
hepatomas of different growth rate. Biochim Biophys Acta 360: 361-365.
20. Bergelson, L. D., E. V. Dyatlovitskaya, T. I. Torkhovskaya, I. B. Sorokina, and N. P.
Gorkova. 1970. Phospholipid composition of membranes in the tumor cell. Biochim Biophys
Acta 210: 287-298.
21. Feo, F., R. A. Canuto, G. Bertone, R. Garcea, and P. Pani. 1973. Cholesterol and
phospholipid composition of mitochondria and microsomes isolated from morris hepatoma
5123 and rat liver. FEBS Lett 33: 229-232.
22. Canuto, R. A., M. E. Biocca, G. Muzio, and M. U. Dianzani. 1989. Fatty acid composition of
phospholipids in mitochondria and microsomes during diethylnitrosamine carcinogenesis in
rat liver. Cell biochemistry and function 7: 11-19.
23. Hostetler, K. Y., B. D. Zenner, and H. P. Morris. 1976. Abnormal membrane phospholipid
content in subcellular fractions from the Morris 7777 hepatoma. Biochim Biophys Acta 441:
231-238.
24. Hostetler, K. Y., B. D. Zenner, and H. P. Morris. 1979. Phospholipid content of
mitochondrial and microsomal membranes from Morris hepatomas of varying growth rates.
Cancer Res 39: 2978-2983.
25. Morton, R., C. Cunningham, R. Jester, M. Waite, N. Miller, and H. P. Morris. 1976.
Alteration of mitochondrial function and lipid composition in Morris 7777 hepatoma. Cancer
Res 36: 3246-3254.
26. Haines, T. H., and N. A. Dencher. 2002. Cardiolipin: a proton trap for oxidative
phosphorylation. FEBS Lett 528: 35-39.
27. Fry, M., and D. E. Green. 1980. Cardiolipin requirement by cytochrome oxidase and the
catalytic role of phospholipid. Biochemical and biophysical research communications 93:
1238-1246.
28. Fry, M., G. A. Blondin, and D. E. Green. 1980. The localization of tightly bound cardiolipin
in cytochrome oxidase. J Biol Chem 255: 9967-9970.
29. Fry, M., and D. E. Green. 1981. Cardiolipin requirement for electron transfer in complex I
and III of the mitochondrial respiratory chain. J Biol Chem 256: 1874-1880.
30. Chicco, A. J., and G. C. Sparagna. 2007. Role of cardiolipin alterations in mitochondrial
dysfunction and disease. American journal of physiology.Cell physiology 292: C33-44.
31. Hoch, F. L. 1992. Cardiolipins and biomembrane function. Biochimica et biophysica acta
1113: 71-133.
32. McKenzie, M., M. Lazarou, D. R. Thorburn, and M. T. Ryan. 2006. Mitochondrial
respiratory chain supercomplexes are destabilized in Barth Syndrome patients. Journal of
molecular biology 361: 462-469.
33. Shinzawa-Itoh, K., H. Aoyama, K. Muramoto, H. Terada, T. Kurauchi, Y. Tadehara, A.
Yamasaki, T. Sugimura, S. Kurono, K. Tsujimoto, T. Mizushima, E. Yamashita, T.
Tsukihara, and S. Yoshikawa. 2007. Structures and physiological roles of 13 integral lipids
of bovine heart cytochrome c oxidase. Embo J 26: 1713-1725.
by guest, on August 23, 2018
ww
w.jlr.org
Dow
nloaded from
21
34. Zhang, M., E. Mileykovskaya, and W. Dowhan. 2002. Gluing the respiratory chain together.
Cardiolipin is required for supercomplex formation in the inner mitochondrial membrane. J
Biol Chem 277: 43553-43556.
35. Pfeiffer, K., V. Gohil, R. A. Stuart, C. Hunte, U. Brandt, M. L. Greenberg, and H. Schagger.
2003. Cardiolipin stabilizes respiratory chain supercomplexes. J Biol Chem 278: 52873-
52880.
36. Hoch, F. L. 1998. Cardiolipins and mitochondrial proton-selective leakage. J Bioenerg
Biomembr 30: 511-532.
37. Cheng, H., D. J. Mancuso, X. Jiang, S. Guan, J. Yang, K. Yang, G. Sun, R. W. Gross, and X.
Han. 2008. Shotgun Lipidomics Reveals the Temporally Dependent, Highly Diversified
Cardiolipin Profile in the Mammalian Brain: Temporally Coordinated Postnatal
Diversification of Cardiolipin Molecular Species with Neuronal Remodeling. Biochemistry.
38. Kiebish, M. A., X. Han, H. Cheng, A. Lunceford, C. F. Clarke, H. Moon, J. H. Chuang, and
T. N. Seyfried. 2008. Lipidomic Analysis and Electron Transport Chain Activities in
C57BL/6J Mouse Brain Mitochondria. J Neurochem. 106: 299-312
39. Kiebish, M. A., X. Han, H. Cheng, J. H. Chuang, and T. N. Seyfried. 2008. Brain
Mitochondrial Lipid Abnormalities in Mice Susceptible to Spontaneous Gliomas. Lipids (in
press) DOI: 10.1007/s11745-008-3197-y.
40. Schlame, M., and M. Ren. 2006. Barth syndrome, a human disorder of cardiolipin
metabolism. FEBS letters 580: 5450-5455.
41. Hauff, K. D., and G. M. Hatch. 2006. Cardiolipin metabolism and Barth Syndrome. Progress
in lipid research 45: 91-101.
42. Campanella, R. 1992. Membrane lipids modifications in human gliomas of different degree
of malignancy. Journal of neurosurgical sciences 36: 11-25.
43. Yates, A. J., D. K. Thompson, C. P. Boesel, C. Albrightson, and R. W. Hart. 1979. Lipid
composition of human neural tumors. J Lipid Res 20: 428-436.
44. Murphy, E. J., and L. A. Horrocks. 1993. Effects of differentiation on the phospholipid and
phospholipid fatty acid composition of N1E-115 neuroblastoma cells. Biochim Biophys Acta
1167: 131-136.
45. Seyfried, T. N., M. el-Abbadi, and M. L. Roy. 1992. Ganglioside distribution in murine
neural tumors. Molecular and chemical neuropathology 17: 147-167.
46. Huysentruyt, L. C., P. Mukherjee, D. Banerjee, L. M. Shelton, and T. N. Seyfried. 2008.
Metastatic cancer cells with macrophage properties: evidence from a new murine tumor
model. International journal of cancer 123: 73-84.
47. Zimmerman, H. M., and H. Arnould. 1941. Experimental brain tumors: I. Tumors produced
with methylcholanthrene. Cancer Res 1: 919-938.
48. Rubin, R., and C. Sutton. 1968. The ultrastructure of the mouse ependymoblastoma and its
contained virus-like particles. Journal of neuropathology and experimental neurology 27:
136.
49. Bligh, E. G., and W. J. Dyer. 1959. A rapid method of total lipid extraction and purification.
Canadian journal of biochemistry and physiology 37: 911-917.
50. Han, X., K. Yang, J. Yang, H. Cheng, and R. W. Gross. 2006. Shotgun lipidomics of
cardiolipin molecular species in lipid extracts of biological samples. J Lipid Res 47: 864-879.
51. Han, X., J. Yang, H. Cheng, H. Ye, and R. W. Gross. 2004. Toward fingerprinting cellular
lipidomes directly from biological samples by two-dimensional electrospray ionization mass
spectrometry. Analytical biochemistry 330: 317-331.
by guest, on August 23, 2018
ww
w.jlr.org
Dow
nloaded from
22
52. Ellis, C. E., E. J. Murphy, D. C. Mitchell, M. Y. Golovko, F. Scaglia, G. C. Barcelo-Coblijn,
and R. L. Nussbaum. 2005. Mitochondrial lipid abnormality and electron transport chain
impairment in mice lacking alpha-synuclein. Mol Cell Biol 25: 10190-10201.
53. Birch-Machin, M. A., and D. M. Turnbull. 2001. Assaying mitochondrial respiratory
complex activity in mitochondria isolated from human cells and tissues. Methods in cell
biology 65: 97-117.
54. Degli Esposti, M. 2001. Assessing functional integrity of mitochondria in vitro and in vivo.
Methods in cell biology 65: 75-96.
55. R Development Core Team. 2005. R: A language and environment for
statistical computing. R Foundation for Statistical Computing, Vienna, Austria.
56. Seyfried, N. T., L. C. Huysentruyt, J. A. Atwood, 3rd, Q. Xia, T. N. Seyfried, and R.
Orlando. 2008. Up-regulation of NG2 proteoglycan and interferon-induced transmembrane
proteins 1 and 3 in mouse astrocytoma: A membrane proteomics approach. Cancer letters
263: 243-252.
57. Pedersen, P. L. 1978. Tumor mitochondria and the bioenergetics of cancer cells. Progress in
experimental tumor research. 22: 190-274.
58. Zu, X. L., and M. Guppy. 2004. Cancer metabolism: facts, fantasy, and fiction. Biochemical
and biophysical research communications 313: 459-465.
59. Elstrom, R. L., D. E. Bauer, M. Buzzai, R. Karnauskas, M. H. Harris, D. R. Plas, H. Zhuang,
R. M. Cinalli, A. Alavi, C. M. Rudin, and C. B. Thompson. 2004. Akt stimulates aerobic
glycolysis in cancer cells. Cancer Res 64: 3892-3899.
60. Pelicano, H., R. H. Xu, M. Du, L. Feng, R. Sasaki, J. S. Carew, Y. Hu, L. Ramdas, L. Hu, M.
J. Keating, W. Zhang, W. Plunkett, and P. Huang. 2006. Mitochondrial respiration defects in
cancer cells cause activation of Akt survival pathway through a redox-mediated mechanism.
The Journal of cell biology 175: 913-923.
61. Kiebish, M. A., X. Han, H. Cheng, and T. N. Seyfried. 2008. Mitochondrial Lipidome and
Electron Transport Chain Alterations in Non-metastatic and Metastatic Murine Brain
Tumors. J Neurochem 104 Supplement 1: 37-38.
62. Hartz, J. W., R. E. Morton, M. M. Waite, and H. P. Morris. 1982. Correlation of fatty acyl
composition of mitochondrial and microsomal phospholipid with growth rate of rat
hepatomas. Laboratory investigation; a journal of technical methods and pathology 46: 73-
78.
63. Genova, M. L., C. Bianchi, and G. Lenaz. 2003. Structural organization of the mitochondrial
respiratory chain. The Italian journal of biochemistry 52: 58-61.
64. Kiebish, M. A., and T. N. Seyfried. 2005. Absence of pathogenic mitochondrial DNA
mutations in mouse brain tumors. BMC cancer 5: 102.
65. Matoba, S., J. G. Kang, W. D. Patino, A. Wragg, M. Boehm, O. Gavrilova, P. J. Hurley, F.
Bunz, and P. M. Hwang. 2006. p53 regulates mitochondrial respiration. Science 312: 1650-
1653.
66. Limoli, C. L., E. Giedzinski, W. F. Morgan, S. G. Swarts, G. D. Jones, and W. Hyun. 2003.
Persistent oxidative stress in chromosomally unstable cells. Cancer Res 63: 3107-3111.
67. Shukkur, E. A., A. Shimohata, T. Akagi, W. Yu, M. Yamaguchi, M. Murayama, D. Chui, T.
Takeuchi, K. Amano, K. H. Subramhanya, T. Hashikawa, H. Sago, C. J. Epstein, A.
Takashima, and K. Yamakawa. 2006. Mitochondrial dysfunction and tau
hyperphosphorylation in Ts1Cje, a mouse model for Down syndrome. Human molecular
genetics 15: 2752-2762.
by guest, on August 23, 2018
ww
w.jlr.org
Dow
nloaded from
23
68. Hardy, S., W. El-Assaad, E. Przybytkowski, E. Joly, M. Prentki, and Y. Langelier. 2003.
Saturated fatty acid-induced apoptosis in MDA-MB-231 breast cancer cells. A role for
cardiolipin. J Biol Chem 278: 31861-31870.
69. Houtkooper, R. H., and F. M. Vaz. 2008. Cardiolipin, the heart of mitochondrial metabolism.
Cell Mol Life Sci. DOI 10.1007/s00018-008-8030-5
70. Petrosillo, G., F. M. Ruggiero, M. Pistolese, and G. Paradies. 2004. Ca2+-induced reactive
oxygen species production promotes cytochrome c release from rat liver mitochondria via
mitochondrial permeability transition (MPT)-dependent and MPT-independent mechanisms:
role of cardiolipin. J Biol Chem 279: 53103-53108.
71. McMillin, J. B., and W. Dowhan. 2002. Cardiolipin and apoptosis. Biochim Biophys Acta
1585: 97-107.
72. Cheng, P., and G. M. Hatch. 1995. Inhibition of cardiolipin biosynthesis in the hypoxic rat
heart. Lipids 30: 513-519.
73. Han, X., J. Yang, K. Yang, Z. Zhao, D. R. Abendschein, and R. W. Gross. 2007. Alterations
in myocardial cardiolipin content and composition occur at the very earliest stages of
diabetes: a shotgun lipidomics study. Biochemistry 46: 6417-6428.
74. Pope, S., J. M. Land, and S. J. Heales. 2008. Oxidative stress and mitochondrial dysfunction
in neurodegeneration; cardiolipin a critical target? Biochim Biophys Acta. 1777: 794-799.
75. Yamaoka, S., R. Urade, and M. Kito. 1990. Cardiolipin molecular species in rat heart
mitochondria are sensitive to essential fatty acid-deficient dietary lipids. J Nutr 120: 415-421.
76. Kritchevsky, D. 1999. Caloric restriction and experimental carcinogenesis. Toxicol Sci 52:
13-16.
77. Tannenbaum, A. 1959. Nutrition and cancer. In Physiopathology of cancer. F. Homburger.
Paul B. Hober., New York. 517-562
78. Nebeling, L. C., F. Miraldi, S. B. Shurin, and E. Lerner. 1995. Effects of a ketogenic diet on
tumor metabolism and nutritional status in pediatric oncology patients: two case reports.
Journal of the American College of Nutrition 14: 202-208.
79. Zhou, W., P. Mukherjee, M. A. Kiebish, W. T. Markis, J. G. Mantis, and T. N. Seyfried.
2007. The calorically restricted ketogenic diet, an effective alternative therapy for malignant
brain cancer. Nutr Metab (Lond) 4: 5.
80. Mukherjee, P., M. M. El-Abbadi, J. L. Kasperzyk, M. K. Ranes, and T. N. Seyfried. 2002.
Dietary restriction reduces angiogenesis and growth in an orthotopic mouse brain tumour
model. British journal of cancer 86: 1615-1621.
81. Mukherjee, P., L. E. Abate, and T. N. Seyfried. 2004. Antiangiogenic and proapoptotic
effects of dietary restriction on experimental mouse and human brain tumors. Clin Cancer
Res 10: 5622-5629.
82. Pan, J. G., and T. W. Mak. 2007. Metabolic targeting as an anticancer strategy: dawn of a
new era? Sci STKE 2007: pe14.
by guest, on August 23, 2018
ww
w.jlr.org
Dow
nloaded from
24
Figure Legends
Fig 1. Structure of cardiolipin (1, 1’, 2, 2’-tetraoleyl cardiolipin). This is one of the over 100
cardiolipin molecular species present in mouse brain mitochondria.
Fig 2. Cardiolipin content in mitochondria isolated from mouse brain and brain tumors.
Mitochondria were isolated as described in Methods. Values are represented as the mean + S.D.
of three independent mitochondrial preparations from brain or tumor tissue. Asterisks indicate
that the tumor values differ significantly from the B6 or the VM brain values at the * p < 0.01 or
** p < 0.001 levels as determined by the two-tailed t-test.
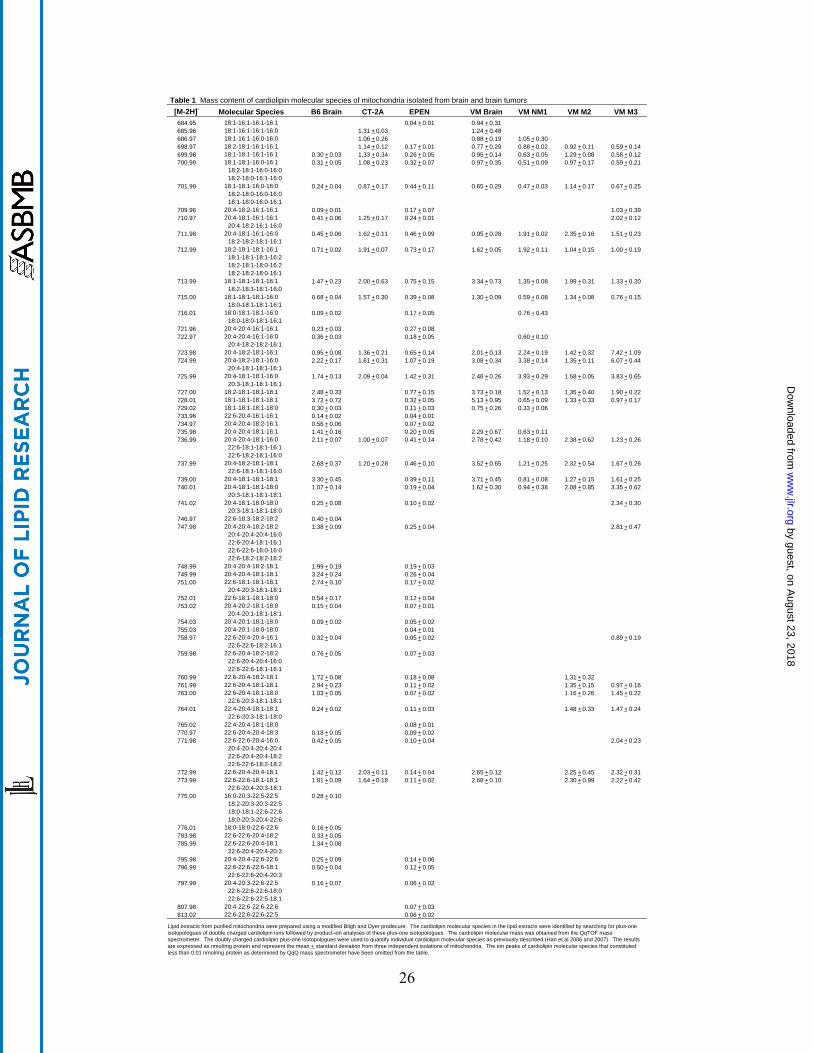
Fig. 3. Distribution of cardiolipin molecular species in mouse brain and brain tumor
mitochondria. (A) Distribution in B6 mouse brain and in the CT-2A and the EPEN tumors. (B)
Distribution in VM mouse brain and the VM-NM1, the VM-M2, and the VM-M3 tumors.
Cardiolipin molecular species are arranged according to the mass to charge ratio based on
percentage distribution and are subdivided into seven major groups as we previously described
(38). Corresponding mass content of molecular species in normal brain and tumor mitochondria
can be found in Table 1. All values are expressed as the mean of three independent
mitochondrial preparations, where six cortexes or tumors were pooled for each preparation.
Fig. 4. Electron transport chain enzyme activities of Complex I, I/III, and II/III in mouse brain
and brain tumor mitochondria. Enzyme activities are expressed as nmol/min/mg protein as
described in Methods. All values are expressed as the mean of three to four independent
mitochondrial preparations, where six cortexes or tumors were pooled for each preparation.
Asterisks indicate that the tumor values differ significantly from the B6 or the VM brain values
at the * p < 0.025 or ** p < 0.001 levels as determined by the two-tailed t-test.
Fig. 5. Relationship of cardiolipin abnormalities with electron transport chain activities in the
B6 and the VM mouse brain tumors. The data are expressed on the best-fit three-dimensional
quadratic surface for each electron transport chain Complex as described in Methods. In order to
illustrate the position of all tumors on the same graph relative to their host strain, the data for the
VM strain and tumors were fit to the B6-fit quadratic surface as described in Methods.
by guest, on August 23, 2018
ww
w.jlr.org
Dow
nloaded from
25
Fig. 6. Relationship of genetic, epigenetic, and environmental factors to dysfunctional
respiration associated with abnormalities in cardiolipin content and composition.
by guest, on August 23, 2018
ww
w.jlr.org
Dow
nloaded from
26
[M-2H]-
Molecular Species
684.95 18:1-16:1-16:1-16:1 0.04 + 0.01 0.94 + 0.31
685.96 18:1-16:1-16:1-16:0 1.31 + 0.03 1.24 + 0.48
686.97 18:1-16:1-16:0-16:0 1.06 + 0.26 0.88 + 0.19 1.05 + 0.30
698.97 18:2-18:1-16:1-16:1 1.14 + 0.12 0.17 + 0.01 0.77 + 0.29 0.88 + 0.02 0.92 + 0.11 0.59 + 0.14
699.98 18:1-18:1-16:1-16:1 0.30 + 0.03 1.33 + 0.34 0.26 + 0.05 0.95 + 0.14 0.63 + 0.05 1.29 + 0.08 0.58 + 0.12
700.99 18:1-18:1-16:0-16:1 0.31 + 0.05 1.08 + 0.23 0.32 + 0.07 0.97 + 0.35 0.51 + 0.09 0.97 + 0.17 0.59 + 0.21
18:2-18:1-16:0-16:0
18:2-18:0-16:1-16:0
701.99 18:1-18:1-16:0-16:0 0.24 + 0.04 0.87 + 0.17 0.44 + 0.11 0.65 + 0.29 0.47 + 0.03 1.14 + 0.17 0.67 + 0.25
18:2-18:0-16:0-16:0
18:1-18:0-16:0-16:1
709.96 20:4-18:2-16:1-16:1 0.09 + 0.01 0.17 + 0.07 1.03 + 0.39
710.97 20:4-18:1-16:1-16:1 0.41 + 0.06 1.25 + 0.17 0.24 + 0.01 2.02 + 0.12
20:4-18:2-16:1-16:0
711.98 20:4-18:1-16:1-16:0 0.45 + 0.06 1.62 + 0.11 0.46 + 0.09 0.95 + 0.28 1.91 + 0.02 2.35 + 0.16 1.51 + 0.23
18:2-18:2-18:1-16:1
712.99 18:2-18:1-18:1-16:1 0.71 + 0.02 1.91 + 0.07 0.73 + 0.17 1.62 + 0.05 1.92 + 0.11 1.04 + 0.15 1.00 + 0.19
18:1-18:1-18:1-16:2
18:2-18:1-18:0-16:2
18:2-18:2-18:0-16:1
713.99 18:1-18:1-18:1-16:1 1.47 + 0.23 2.00 + 0.63 0.75 + 0.15 3.34 + 0.73 1.35 + 0.08 1.99 + 0.31 1.33 + 0.20
18:2-18:1-18:1-16:0
715.00 18:1-18:1-18:1-16:0 0.68 + 0.04 1.57 + 0.30 0.39 + 0.08 1.30 + 0.09 0.59 + 0.08 1.34 + 0.08 0.76 + 0.15
18:0-18:1-18:1-16:1
716.01 18:0-18:1-18:1-16:0 0.09 + 0.02 0.17 + 0.05 0.76 + 0.43
18:0-18:0-18:1-16:1
721.96 20:4-20:4-16:1-16:1 0.23 + 0.03 0.27 + 0.08
722.97 20:4-20:4-16:1-16:0 0.36 + 0.03 0.18 + 0.05 0.60 + 0.10
20:4-18:2-18:2-16:1
723.98 20:4-18:2-18:1-16:1 0.95 + 0.08 1.36 + 0.21 0.65 + 0.14 2.01 + 0.13 2.24 + 0.19 1.42 + 0.32 7.42 + 1.09
724.99 20:4-18:2-18:1-16:0 2.22 + 0.17 1.61 + 0.31 1.07 + 0.19 3.08 + 0.34 3.38 + 0.14 1.35 + 0.11 6.07 + 0.44
20:4-18:1-18:1-16:1
725.99 20:4-18:1-18:1-16:0 1.74 + 0.13 2.09 + 0.04 1.42 + 0.31 2.46 + 0.26 3.93 + 0.29 1.58 + 0.05 3.83 + 0.65
20:3-18:1-18:1-16:1
727.00 18:2-18:1-18:1-18:1 2.48 + 0.33 0.77 + 0.15 3.73 + 0.18 1.52 + 0.13 1.35 + 0.40 1.90 + 0.22
728.01 18:1-18:1-18:1-18:1 3.72 + 0.72 0.32 + 0.05 5.13 + 0.95 0.65 + 0.09 1.33 + 0.33 0.97 + 0.17
729.02 18:1-18:1-18:1-18:0 0.30 + 0.03 0.11 + 0.03 0.75 + 0.26 0.33 + 0.06
733.96 22:6-20:4-16:1-16:1 0.14 + 0.02 0.04 + 0.01
734.97 20:4-20:4-18:2-16:1 0.56 + 0.06 0.07 + 0.02
735.98 20:4-20:4-18:1-16:1 1.41 + 0.16 0.20 + 0.05 2.29 + 0.67 0.63 + 0.11
736.99 20:4-20:4-18:1-16:0 2.11 + 0.07 1.00 + 0.07 0.41 + 0.14 2.78 + 0.42 1.18 + 0.10 2.38 + 0.62 1.23 + 0.26
22:6-18:1-18:1-16:1
22:6-18:2-18:1-16:0
737.99 20:4-18:2-18:1-18:1 2.68 + 0.37 1.20 + 0.28 0.46 + 0.10 3.52 + 0.65 1.21 + 0.25 2.32 + 0.54 1.67 + 0.26
22:6-18:1-18:1-16:0
739.00 20:4-18:1-18:1-18:1 3.30 + 0.45 0.39 + 0.11 3.71 + 0.45 0.81 + 0.08 1.27 + 0.15 1.61 + 0.25
740.01 20:4-18:1-18:1-18:0 1.07 + 0.14 0.19 + 0.04 1.62 + 0.30 0.94 + 0.38 2.08 + 0.85 3.35 + 0.62
20:3-18:1-18:1-18:1
741.02 20:4-18:1-18:0-18:0 0.25 + 0.08 0.10 + 0.02 2.34 + 0.30
20:3-18:1-18:1-18:0
746.97 22:6-18:3-18:2-18:2 0.40 + 0.04
747.98 20:4-20:4-18:2-18:2 1.38 + 0.09 0.25 + 0.04 2.81 + 0.47
20:4-20:4-20:4-16:0
22:6-20:4-18:1-16:1
22:6-22:6-16:0-16:0
22:6-18:2-18:2-18:2
748.99 20:4-20:4-18:2-18:1 1.99 + 0.19 0.19 + 0.03
749.99 20:4-20:4-18:1-18:1 3.24 + 0.24 0.26 + 0.04
751.00 22:6-18:1-18:1-18:1 2.74 + 0.10 0.17 + 0.02
20:4-20:3-18:1-18:1
752.01 22:6-18:1-18:1-18:0 0.54 + 0.17 0.12 + 0.04
753.02 20:4-20:2-18:1-18:0 0.15 + 0.04 0.07 + 0.01
20:4-20:1-18:1-18:1
754.03 20:4-20:1-18:1-18:0 0.09 + 0.02 0.05 + 0.02
755.03 20:4-20:1-18:0-18:0 0.04 + 0.01
758.97 22:6-20:4-20:4-16:1 0.32 + 0.04 0.05 + 0.02 0.89 + 0.19
22:6-22:6-18:2-16:1
759.98 22:6-20:4-18:2-18:2 0.76 + 0.05 0.07 + 0.03
22:6-20:4-20:4-16:0
22:6-22:6-18:1-16:1
760.99 22:6-20:4-18:2-18:1 1.72 + 0.08 0.18 + 0.08 1.31 + 0.32
761.99 22:6-20:4-18:1-18:1 2.94 + 0.23 0.11 + 0.02 1.35 + 0.15 0.97 + 0.16
763.00 22:6-20:4-18:1-18:0 1.03 + 0.05 0.07 + 0.02 1.16 + 0.26 1.45 + 0.22
22:6-20:3-18:1-18:1
764.01 22:4-20:4-18:1-18:1 0.24 + 0.02 0.11 + 0.03 1.48 + 0.33 1.47 + 0.24
22:6-20:3-18:1-18:0
765.02 22:4-20:4-18:1-18:0 0.08 + 0.01
770.97 22:6-20:4-20:4-18:3 0.18 + 0.05 0.09 + 0.02
771.98 22:6-22:6-20:4-16:0 0.42 + 0.05 0.10 + 0.04 2.04 + 0.23
20:4-20:4-20:4-20:4
22:6-20:4-20:4-18:2
22:6-22:6-18:2-18:2
772.99 22:6-20:4-20:4-18:1 1.42 + 0.12 2.03 + 0.11 0.14 + 0.04 2.65 + 0.12 2.25 + 0.45 2.32 + 0.31
773.99 22:6-22:6-18:1-18:1 1.81 + 0.09 1.64 + 0.18 0.11 + 0.02 2.68 + 0.10 2.30 + 0.99 2.22 + 0.42
22:6-20:4-20:3-18:1
775.00 16:0-20:3-22:5-22:5 0.28 + 0.10
18:2-20:3-20:3-22:5
18:0-18:1-22:6-22:6
18:0-20:3-20:4-22:6
776.01 18:0-18:0-22:6-22:6 0.16 + 0.05
783.98 22:6-22:6-20:4-18:2 0.33 + 0.05
785.99 22:6-22:6-20:4-18:1 1.34 + 0.08
22:6-20:4-20:4-20:3
795.98 20:4-20:4-22:6-22:6 0.25 + 0.09 0.14 + 0.06
796.99 22:6-22:6-22:6-18:1 0.50 + 0.04 0.12 + 0.05
22:6-22:6-20:4-20:3
797.99 20:4-20:3-22:6-22:5 0.16 + 0.07 0.06 + 0.02
22:6-22:6-22:6-18:0
22:6-22:6-22:5-18:1
807.98 20:4-22:6-22:6-22:6 0.07 + 0.03
813.02 22:6-22:6-22:6-22:5 0.06 + 0.02
Lipid extracts from purified mitochondria were prepared using a modified Bligh and Dyer prodecure. The cardiolipin molecular species in the lipid extracts were identified by searching for plus-one
isotopologues of double charged cardiolipin ions followed by product-ion analyses of these plus-one isotopologues. The cardiolipin molecular mass was obtained from the QqTOF mass
spectrometer. The doubly charged cardiolipin plus-one isotopologues were used to quantify individual cardiolipin molecular species as previously described (Han et al 2006 and 2007). The results
are expressed as nmol/mg protein and represent the mean + standard deviation from three independent isolations of mitochondria. The ion peaks of cardiolipin molecular species that constituted
less than 0.01 nmol/mg protein as determined by QqQ mass spectrometer have been omitted from the table.
VM M3
Table 1 Mass content of cardiolipin molecular species of mitochondria isolated from brain and brain tumors
B6 Brain CT-2A EPEN VM Brain VM NM1 VM M2
by guest, on August 23, 2018
ww
w.jlr.org
Dow
nloaded from


![Structural characterization of cardiolipin by tandem ......kingdom [4]. Cardiolipin is essential for the function of several enzymes of oxidative phosphorylation, and thus, for production](https://img.pdfslide.us/doc/110x75/5e9bda7953105a41956b711d/structural-characterization-of-cardiolipin-by-tandem-kingdom-4-cardiolipin.jpg)