Embed Size (px)
Citation preview
Estudo Geral repository of University of Coimbra
Title Carbon footprint of particleboard: a comparison between ISO/TS 14067, GHG Protocol,
PAS 2050 and Climate Declaration
Authors(s) Garcia, Rita
Publication date 2014-03-01
Publication information GARCIA, Rita; FREIRE, Fausto - Carbon footprint of particleboard: a comparison between
ISO/TS 14067, GHG Protocol, PAS 2050 and Climate Declaration. "Journal of Cleaner
Production". ISSN 0959-6526. Vol. 66 (2014) p. 199-209, :Downaloaded 2018-05-15T05:32:16Z
Some rights reserved. For more information, please see the item record link above.
Accepted Manuscript
Carbon footprint of particleboard: a comparison between ISO/TS 14067, GHGProtocol, PAS 2050 and Climate Declaration
Rita Garcia, Fausto Freire
PII: S0959-6526(13)00849-4
DOI: 10.1016/j.jclepro.2013.11.073
Reference: JCLP 3842
To appear in: Journal of Cleaner Production
Received Date: 11 March 2013
Revised Date: 25 November 2013
Accepted Date: 28 November 2013
Please cite this article as: Garcia R, Freire F, Carbon footprint of particleboard: a comparison betweenISO/TS 14067, GHG Protocol, PAS 2050 and Climate Declaration, Journal of Cleaner Production(2014), doi: 10.1016/j.jclepro.2013.11.073.
This is a PDF file of an unedited manuscript that has been accepted for publication. As a service toour customers we are providing this early version of the manuscript. The manuscript will undergocopyediting, typesetting, and review of the resulting proof before it is published in its final form. Pleasenote that during the production process errors may be discovered which could affect the content, and alllegal disclaimers that apply to the journal pertain.
MANUSCRIP
T
ACCEPTED
ACCEPTED MANUSCRIPT
Highlights:
• The influence of methodological issues in the particleboard CF calculation was
assessed.
• Biogenic C is addressed differently by the methodologies leading to different CFs.
• Accounting for delayed emissions may reduce the particleboard CF by 80-200%.
• The CF was very sensitive to different accounting of electricity from incineration.
• Capital goods accounted for 12-20% of the particleboard CF and should not be
neglected.
MANUSCRIP
T
ACCEPTED
ACCEPTED MANUSCRIPTNumWords: 10139
* Corresponding author. Tel.: +351 239 790 708/39 E-mail addresses: [email protected] (R. Garcia), [email protected] (F. Freire).
Carbon footprint of particleboard: a comparison between ISO/TS
14067, GHG Protocol, PAS 2050 and Climate Declaration
Rita Garciaa, Fausto Freirea,*
a ADAI-LAETA, Department of Mechanical Engineering, University of Coimbra, Polo II Campus, R. Luís Reis Santos, 3030-788 Coimbra, Portugal
Abstract
This article aims to assess: i) the carbon footprint (CF) of particleboard produced in Portugal, and ii) the
influence of different methodological issues in the particleboard CF calculation by comparing four CF
methodologies (ISO/TS 14067; GHG Protocol Product Standard; PAS 2050; Climate Declaration). A life-
cycle model was developed for particleboard (functional unit: 1 m3). Both cradle-to-gate and cradle-to-
grave (end-of-life scenarios: incineration and landfill) assessments were performed. Six methods to assess
delayed emissions were analyzed. The main methodological differences between the CF methodologies
are the treatment of biogenic CO2, multifunctionality, and unit process exclusions (e.g. capital goods). A
wide range of CFs was calculated: -939 to 188 kg CO2 eq/m3 (cradle-to-gate); 107 to 201 kg CO2 eq/m3
(cradle-to-grave; incineration) and -692 to 433 kg CO2 eq/m3 (cradle-to-grave; landfill). The inclusion
(negative CF) or exclusion (positive CF) of biogenic carbon storage in the reported CF dominated the
differences in results and the ranking of end-of-life scenarios strongly depended on that assumption.
ISO/TS 14067, the GHG Protocol and PAS 2050 explicitly include both emissions and removals of
biogenic CO2 in the CF calculation. On the other hand, the Climate Declaration does not account for
biogenic CO2 or carbon storage, which may bias the comparison with competing products that do not
store biogenic carbon (e.g. fossil-based materials). The CF of particleboard was also very sensitive to the
different approaches to deal with multifunctionality in the incineration process by the various CF
methodologies. Moreover, although not mandatory, delayed emission accounting significantly affected
the results for the incineration scenario. Capital goods accounted for 12-20% of the CF. Future guidelines
for wood-based panels, such as Product Category Rules, should, therefore, require that carbon storage is
assessed and reported, accounting of waste-to-energy burdens is harmonized and capital goods are
included.
Keywords: Biogenic CO2; carbon storage; delayed emissions; multifunctionality; wood-based panels.
Highlights:
• The influence of methodological issues in the particleboard CF calculation was assessed.
• Biogenic C is addressed differently by the methodologies leading to different CFs.
• Accounting for delayed emissions may reduce the particleboard CF by 80-200%.
• The CF was very sensitive to different accounting of electricity from incineration.
• Capital goods accounted for 12-20% of the particleboard CF and should not be neglected.
MANUSCRIP
T
ACCEPTED
ACCEPTED MANUSCRIPT
2
1. Introduction
Wood-based panels have been gaining increasing importance as an alternative to solid wood in the
furniture industry and the construction sector (FAO, 2012). Wood-based panels are produced using
processed wood and a synthetic binder and their properties (e.g. size, strength, fire resistance and bio-
resistance) can be engineered depending on the expected usage (e.g. structural applications in buildings,
or nonstructural applications, such as furniture, interior doors, and decorative paneling). Europe is one of
the largest worldwide producers and consumers of wood-based panels. The main types of wood-based
panels produced in Europe are particleboard and fiberboard (including medium density fiberboard, high
density fiberboard and hardboard).
There are a number of critical issues associated with the life cycle (LC) of wood-based panels,
particularly regarding the calculation of the carbon footprint (LC greenhouse gas emissions).Wood-based
panels are generally perceived as a potentially carbon-neutral material since they incorporate biogenic
carbon. Nevertheless, greenhouse gas (GHG) emissions related to its production, such as those associated
with ancillary materials or manufacturing processes, can have a high contribution to the carbon footprint
(CF) (Werner and Richter, 2007). Moreover, wood-based panels, in general, have a relatively long service
life (more than 10 years), therefore, understanding the dynamics related to storage and delayed carbon
emissions in both use and disposal phases is of key importance. There are several approaches to account
for temporary storage and delayed emission of biogenic carbon (e.g Fearnside et al., 2000; Moura-Costa
and Wilson, 2000; Levasseur et al., 2010, 2012; EC JRC, 2010; Mueller-Wenk and Brandão, 2010; BSI,
2011; Kendall, 2012). However, there is no consensus neither on whether temporary carbon storage
should be accounted for nor which is the best approach to assess it (Brandão and Levasseur, 2011;
Brandão et al., 2013). Another characteristic of wood production chains is its multifunctionality, which
introduces an important methodological question of how to allocate environmental burdens between the
different outputs (Jungmeier et al., 2002a).
Several methodological approaches for CF calculation have recently been developed, e.g. the Climate
Declaration (IEC, 2008a); BP X30-323 (AFNOR, 2009), PAS 2050 (BSI, 2011); the Japanese CFP
Communication Program (JEMAI, 2012); the GHG Protocol Product Standard (WRI and WBCSD,
2011); ISO/TS 14067 (ISO/TS, 2013). Different CF tools adopt different methodological approaches,
which can compromise comparisons between products (Draucker et al., 2011; Whittaker et al., 2011; Dias
and Arroja, 2012). Because of the methodological challenges associated with the wood-based panel
MANUSCRIP
T
ACCEPTED
ACCEPTED MANUSCRIPT
3
supply chain, understanding how different methodologies treat these issues and how important are those
to the results is of key importance for decision makers, companies and LCA researchers and practitioners.
Several LC-based studies assessed the environmental impacts of wood-based products (e.g. timber:
Cambria and Pierangeli, 2012; Eshun et al., 2012; wooden building products: Werner and Richter, 2007;
wood floor coverings: Nebel et al., 2006; paper: Lopes et al., 2003; Dias and Arroja, 2012; paper pulp:
González-García, 2009a). Regarding wood-based panels, particleboard was assessed by e.g. Rivela et al.
(2006), Wilson (2010a), Saravia-Cortez et al. (2013), Silva et al. (2013); medium density fiberboard by
e.g. Rivela et al. (2007); Wilson (2010b) and hardboard by e.g. González-García et al. (2009b, 2011).
However, the majority of these studies only assessed the cradle-to-gate impacts of wood-based products
and aspects like carbon storage and delayed emission dynamics were not addressed. Moreover, only a few
studies (e.g. Dias et al. 2012) compared different methodologies to estimate CFs, and a comprehensive
assessment of the influence of different methodological issues in the results is still lacking, namely
regarding wood-based panels.
The purpose of this article is twofold. Firstly, it aims at assessing the CF of particleboard produced in
Portugal. Secondly, it aims at assessing the influence of different methodological issues in the
particleboard CF calculation by comparing four different CF methodologies: i) ISO/TS 14067; ii) the
GHG Protocol Product Standard; iii) PAS 2050; iv) the Climate Declaration. In Portugal, there is an
important production of particleboard (more than 50% of the wood-based panel production) and the wood
industry as a whole represents about 14% of the industrial gross national product and 11% of exports
(AIMMP, 2010).
This article is structured in five sections including this introduction. Section 2 briefly presents the four CF
methodologies. Section 3 describes the life-cycle model developed as well as the main methodological
differences between the four methodologies. Section 4 presents and discusses the results, focusing on the
contribution of different methodological issues. Finally, Section 5 draws the conclusions together.
MANUSCRIP
T
ACCEPTED
ACCEPTED MANUSCRIPT
4
2. Carbon footprint methodologies
This section introduces the four CF methodologies used to assess the CF of particleboard: i) ISO/TS
14067; ii) the GHG Protocol Product Standard; iii) PAS 2050; iv) the Climate Declaration. The first three
are specific standards or specifications to calculate the CF of products, while the Climate Declaration is a
subset of an Environmental Product Declaration, which assesses several environmental impacts.
The recently published Technical Specification ISO/TS 14067 (ISO/TS, 2013) provides specific
requirements and guidelines for the quantification and communication of the CF of products, based on
existing ISO standards on life cycle assessment (ISO, 2006a, 2006b) and on environmental labels and
declarations (ISO, 2000, 2006c). In particular, it provides requirements for the treatment of specific GHG
emissions and removals (e.g. fossil and biogenic carbon, carbon storage in products, land-use change) and
additional requirements for the communication of the CF.
The GHG Protocol Product Standard, from the World Resources Institute (WRI) and the World Business
Council for Sustainable Development (WBCSD), was published in 2011 and provides requirements to
quantify the GHG inventories of products and also requirements for public reporting (WRI and WBCSD,
2011). It is based on a LC and attributional approach and builds on the ISO standards for LCA (ISO,
2006a, 2006b) and the first version of PAS 2050 (BSI, 2008). In order to enable meaningful comparisons
between products, the development and use of sector specific rules, termed ‘product rules’, is promoted.
Nevertheless, no product rules for particleboard were available and the general GHG Protocol Product
Standard was applied.
The Publicly Available Specifications (PAS) 2050, from the British Standard Institution, also builds on
the existing ISO 14040 and 14044 standards for LCA (ISO, 2006a, 2006b) and further specifies them for
the assessment of the LC GHG emissions of goods and services (BSI, 2011). It was first introduced in
2008 (BSI, 2008) and was revised in 2011 (BSI, 2011), in alignment with the GHG Protocol Product
Standard (WRI and WBCSD, 2011) regarding key topics (e.g. sector/product rules, biogenic carbon,
recycling, land-use change, delayed emissions) (for details, please refer to BSI et al., 2011). PAS 2050
sets directions on how to deal with several common methodological issues such as system boundary
definition and allocation as well as more specific issues, for example carbon storage and delayed
emissions. The latter are particularly important in the context of wood-based panels and are discussed in
Section 3.3. However, PAS 2050 does not give specific guidelines for products or sectors. Instead,
similarly to the GHG Protocol, it recommends the use and development of sector specific rules known as
MANUSCRIP
T
ACCEPTED
ACCEPTED MANUSCRIPT
5
‘supplementary requirements’. General PAS 2050 guidelines were applied to the particleboard case study,
since no supplementary requirements were available.
A Climate Declaration is a single-issue environmental product declaration (EPD) focused on GHG
emissions. This concept was first introduced by the International EPD system (IEC, 2008a). The Climate
Declaration builds on the same standards as a full EPD, namely ISO 14040 and 14044 standards for LCA
methodology and ISO 14025 standards for environmental declarations (ISO, 2006a, 2006b, 2006c). The
assessment is based on specific guidelines, termed Product Category Rules (PCR), developed for each
product category (i.e. group of products that can fulfill equivalent functions). In particular, PCRs define a
similar set of rules for calculating the environmental or climate impacts of products within the same
product category, e.g. functional unit, system boundary, allocation rules, cut-off criteria. There are
various EPD program operators which results in duplicate PCRs and lack of harmonization between them
(Ingwersen and Stevenson, 2012; Subramanian et al., 2012). The PCR for particleboard used to assess the
Climate Declaration in this article is the most recent one developed in the context of the International
EPD System, a well-known and internationally recognized EPD program (Environdec, 2012).
3. Methods
3.1 System boundary and functional unit
A LC model was developed for particleboard produced in Portugal, which served as the basis for the
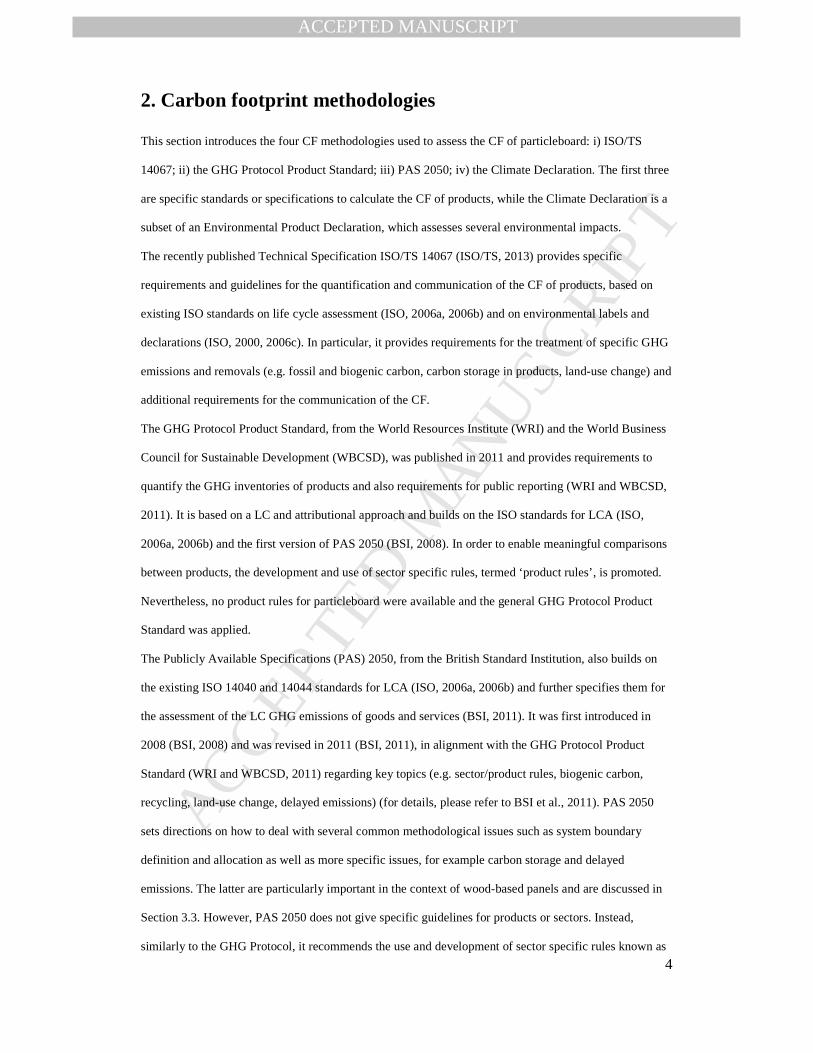
application of the different CF methodologies. Fig. 1 shows the LC model flowchart. A particleboard is a
wood-based panel made from wood particles, mainly wood residues from different sources, usually
aggregated using urea-formaldehyde (UF) resin. The wood used to produce particleboard is assumed to
come from four different sources: sawmill co-products (30%), post-consumer waste wood (30%), pine
(pinus pinaster) forest residues (25%) and eucalypt (eucalyptus globulus) forest residues (15%), which
represents the typical particleboard produced in Portugal (Garrido et al., 2010). A functional unit of 1 m3
of uncoated particleboard for non-structural use (density of 640 kg/m3) was defined based on the PCR for
the Climate Declaration, which is the only methodology assessed that establishes a specific functional
unit for this product.
MANUSCRIP
T
ACCEPTED
ACCEPTED MANUSCRIPT
6
Fig. 1 System boundary of the particleboard life-cycle model.
Both cradle-to-gate and cradle-to-grave models were developed to enable a more comprehensive
assessment. This is also consistent with the Climate Declaration, which clearly defines downstream
processes as optional and states that these must be defined separately. The cradle-to-gate model includes
the pine forest operations (site preparation, planting and logging, including harvesting and forwarding),
the eucalypt forest operations (logging), the sawmill process, the post-consumer waste wood recovery
process and the particleboard production. In addition, it takes into account the production of fuels,
electricity, urea-formaldehyde (UF) resin and other chemicals as well as transport of raw and ancillary
materials. No land-use change was considered since pine forest area in Portugal has been decreasing since
1970 (ICNF, 2013). The cradle-to-grave model also includes transport of particleboards to the distribution
platform and two alternative end-of-life (EoL) scenarios: incineration with energy recovery and landfill
disposal. The main simplifications and exclusions to these models due to the application of the various CF
methodologies are described in the next section.
3.1.1 Cut-off criteria, capital goods and other exclusions
Cut-off criteria are established to determine the input and output flows to be included in the assessment.
ISO/TS 14067 states that if cut-off criteria are used their effect on the outcome of the study shall be
assessed and refers to ISO 14044 for additional guidance (ISO, 2006b, 4.2.3.3.3). The GHG Protocol
allows exclusions based on significance when a data gap exists (the definition of insignificance is
MANUSCRIP
T
ACCEPTED
ACCEPTED MANUSCRIPT
7
established by the company). PAS 2050 and the Climate Declaration require the inclusion of all the
processes that contribute to more than 1% of the anticipated LC GHG emissions of the functional unit and
at least 95% of the total GHG emissions associated with the product. These cut-off criteria combined with
the different allocation approaches (see Section 3.4) result in the exclusion of different unit processes by
the four methodologies, as presented in Table 1. The cut-off in PAS 2050 was 98% and in the Climate
Declaration 99%.
Table 1 Unit processes excluded from the particleboard system boundary due to cut-off criteria.
Unit processes excluded due to cut-off criteriaa
PAS 2050 Climate Declaration
Biomassb Pine residue harvesting; Eucalypt residues harvesting; Chip and shaving production
Pine residue harvesting; Eucalypt residue harvesting
Chemicals Ammonium sulfate production Ammonium sulfate production a No cut-off criteria was applied in ISO/TS 14067 and the GHG Protocol. b GHG removals were included (only GHG emissions were excluded).
According to PAS 2050 and the PCR for the Climate Declaration, the production of capital goods (e.g.
building of site, infrastructure and equipment, their maintenance and decommissioning), transport of
workers to and from the place of work and transport of costumers to and from the point of purchase shall
be excluded from the system boundary. The GHG Protocol does not require “non-attributable” processes
(i.e. not directly connected to the studied product, such as capital goods) to be included, but encourages
their inclusion when relevant (WRI and WBCSD, 2011, pp. 42). On the other hand, ISO/TS 14067 only
allows exclusions if they do not significantly affect the overall conclusions. Capital goods, namely
infrastructure processes, were excluded from the system boundary in the GHG Protocol, PAS 2050 and
Climate Declaration assessments.
3.2 Data collection
Unit process data for the assessment of the particleboard CF is the same for all the methodologies.
Primary data for Portugal was collected in the context of research projects and thesis at the Center for
Industrial Ecology, University of Coimbra. Some of this data is available in Nunes (2008); Nunes and
Freire (2007); Garcia (2010); Garcia and Freire (2011); Freire and Marques (2012). Fuel consumption
(diesel and gasoline) in eucalypt and pine forest activities were estimated based on Nunes (2008) and
Dias et al. (2007), respectively. Electricity generation for the main processes was modeled with reference
to the 2010 Portuguese mix (Freire and Marques, 2012). Average transport distances for Portugal were
MANUSCRIP
T
ACCEPTED
ACCEPTED MANUSCRIPT
8
assumed for materials used in the main production processes and distribution of particleboards. Transport
of inputs was done by truck with a payload of 20-27 t.
The main sources of secondary data were peer-reviewed literature and databases (mainly Ecoinvent v.2,
Ecoinvent, 2012). Data regarding the sawmill process was collected from Milota et al. (2006) and the
production of UF resin was modeled based on Wilson (2010c). The main data source for the particleboard
manufacturing process was Rivela et al. (2006). Recovering of post-consumer waste wood was modeled
based on Merrild and Christensen (2009).
Regarding particleboard end-of-life, GHG emissions from incineration were assumed similar to those
from wood. Ecoinvent data for incineration with energy recovery of wood was considered (Doka, 2009).
GHG emissions from the decomposition of particleboard in landfill were calculated according to Wang et
al. (2011), which estimates the degradability of particleboard in landfill to be 1.3%. Emissions were
assumed to be released at a constant rate during the first 20 years after landfill disposal, according to
Micales and Skog (1997) (0.8% of carbon is released as methane and 0.5% as carbon dioxide).
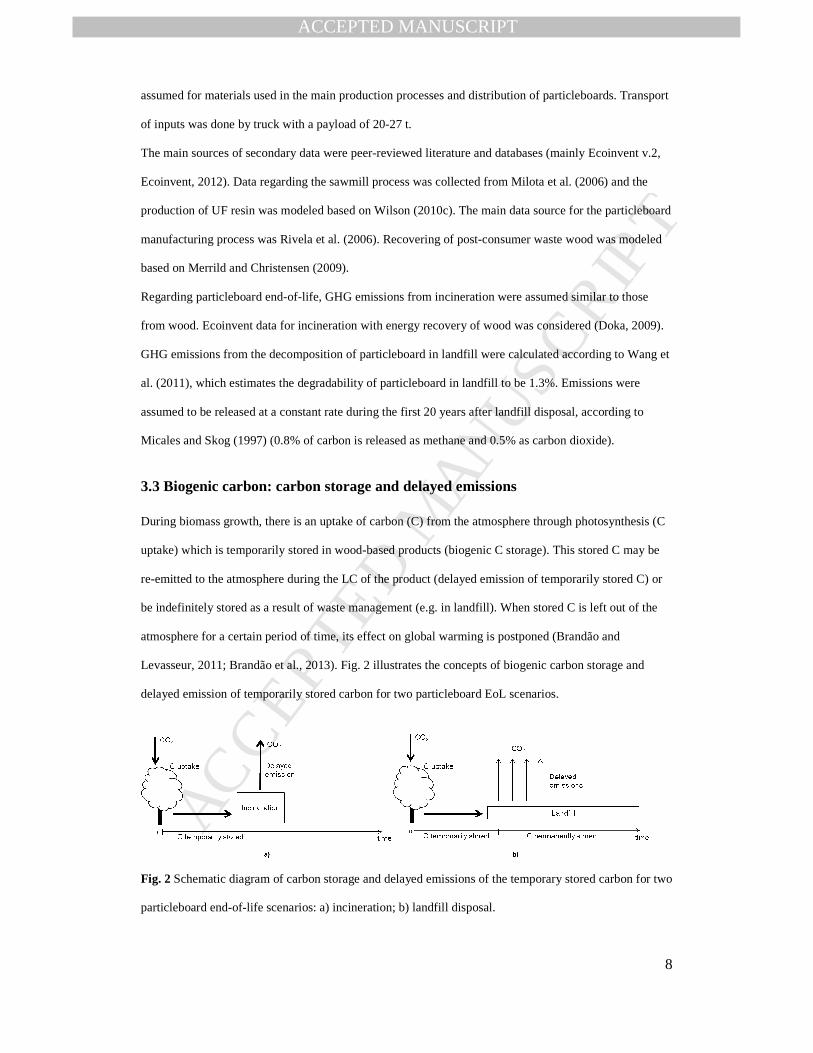
3.3 Biogenic carbon: carbon storage and delayed emissions
During biomass growth, there is an uptake of carbon (C) from the atmosphere through photosynthesis (C
uptake) which is temporarily stored in wood-based products (biogenic C storage). This stored C may be
re-emitted to the atmosphere during the LC of the product (delayed emission of temporarily stored C) or
be indefinitely stored as a result of waste management (e.g. in landfill). When stored C is left out of the
atmosphere for a certain period of time, its effect on global warming is postponed (Brandão and
Levasseur, 2011; Brandão et al., 2013). Fig. 2 illustrates the concepts of biogenic carbon storage and
delayed emission of temporarily stored carbon for two particleboard EoL scenarios.
Fig. 2 Schematic diagram of carbon storage and delayed emissions of the temporary stored carbon for two
particleboard end-of-life scenarios: a) incineration; b) landfill disposal.
MANUSCRIP
T
ACCEPTED
ACCEPTED MANUSCRIPT
9
The current approach to treat biogenic CO2 emissions (emissions of C temporarily stored in biomass) in
LCA and CF studies is often to exclude them from the assessment, as it is assumed that the same amount
of CO2 was previously sequestered by biomass, giving a net zero emission (Guinée et al., 2002; Hischier
et al., 2010). However, it is increasingly acknowledged that biogenic CO2 should be taken into account,
since not considering it could lead to accounting errors (Searchinger et al, 2009; Bird et al., 2010). On the
other hand, even when C uptake during biomass growth is accounted for (as a negative emission) as well
as the subsequent release (as a positive emission), the duration of storage is usually disregarded, i.e. the
effect of delaying the emission of the temporarily stored C is not taken into account (Brandão et al.,
2012). The different CF methodologies adopt different approaches to these issues.
The PCR for the Climate Declaration excludes both the uptake and the emission of biogenic CO2 from the
global warming calculations, and C storage in wood products is not taken into account. On the other hand,
ISO/TS 14067, the GHG Protocol and PAS 2050 explicitly include in the CF assessment both emissions
to and removals from the atmosphere from biogenic sources. Regarding C storage, the GHG Protocol
requires that the amount of C contained in the product in cradle-to-gate inventories is reported and that C
not released to the atmosphere during waste treatment, therefore considered permanently stored, is also
reported. In PAS 2050, the portion of removed C not emitted to the atmosphere during the 100-year
assessment period is treated as stored C and accounted for in the CF calculation. On the other hand, in
ISO/TS 14067, C storage in products shall be reported separately in the CF study report and not included
in the CF.
Due to the relatively long service life and/or end-of life time period of particleboard, the effect of delayed
emissions may be important to the particleboard CF calculation. The use of a weighting factor to calculate
the effect of delayed emissions is optional in ISO/TS 14067, the GHG Protocol and PAS 2050. If the
effect of delayed emissions is taken into account, it shall be documented separately. In ISO/TS 14067 and
the GHG Protocol no recommended method is provided for delayed emission assessment. Therefore, a
sensitivity analysis was performed using six approaches to understand the effect in the particleboard CF
of delayed emissions calculated by different methods: i) the fixed GWP approach; ii) the Lashof approach
iii) the Moura-Costa approach; iv) the ILCD handbook method; v) the dynamic LCA approach and vi) the
time-adjusted warming potential (TAWP) method. The fixed GWP approach does not take into account
the temporal distribution of emissions. It considers that the amount of C stored in biomass is added to the
amount of C released at the product end-of-life, i.e. the CO2 absorbed in photosynthesis is assigned a
MANUSCRIP
T
ACCEPTED
ACCEPTED MANUSCRIPT
10
GWP of -1, while the biogenic CO2 released at the end-of-life is assigned a GWP of 1 (Guinée et al.,
2009). All the other approaches account for the temporal distribution of emissions. The Moura-Costa
(Moura-Costa and Wilson, 2000) and Lashof (Fearnside et al., 2000) methods are explained in further
detail in Brandão and Levasseur (2011). Details on the ILCD handbook method can be found in EC JRC
(2010). The dynamic LCA method and its application are explained in detail in Levasseur et al. (2010,
2012). The TAWP method is detailed in Kendall (2012).
In PAS 2050, two methods for the calculation of the weighted average impact of delayed emissions based
on the Lashof approach (see Clift and Brandão, 2008) are suggested. For emissions delayed up to 25 years
from the formation of the product, the delayed single release method shall be used; for longer delay
periods, the delayed release method, similar to the ILCD handbook method, shall be used. The two
methods used in PAS 2050 apply to all delayed GHG emissions, as CO2 eq, although care should be taken
when a significant amount of non-CO2 emissions are involved, as these methods were developed
specifically for CO2 emissions and, therefore, the result would be less accurate, as detailed in BSI (2011,
Annex E).
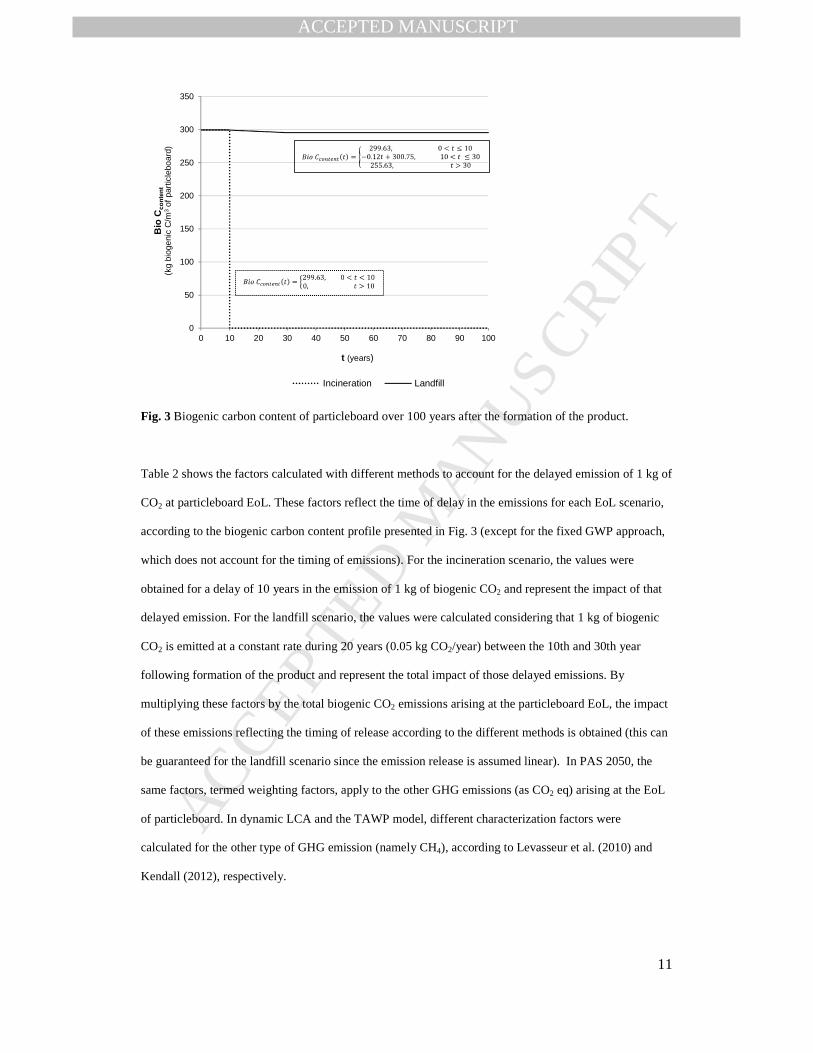
The particleboard is composed of about 90% of wood (576 kg/m3) with an average C content of 52%
(Wilson, 2010a), resulting in about 300 kg of stored C per m3 of particleboard. The particleboard service
life is assumed to be 10 years. The chosen time-horizon for the assessment of the particleboard CF is 100
years, which is consistent with all the CF methodologies analyzed and is the most common time horizon
used in LCA and CF (Levasseur et al., 2010; WRI and WBCSD, 2011; Brandão et al., 2013).
Nevertheless, a sensitivity analysis to the time-horizon was also performed, presented in Section 4.2. Fig.
3 shows the biogenic C content of the particleboard over 100 years following the formation of the product
for the two end-of-life scenarios: incineration (the biogenic C is released after the 10-year service life, i.e.
it is temporarily stored for 10 years) and landfill disposal (1.3% of the biogenic C is released after the 10-
year service life at a constant rate during the following 20 years, i.e. 98.7% of the C is permanently stored
and 1.3% is temporarily stored for 20 years on average). C is assumed to be taken up at year 0 of
formation of the product, i.e. the timing of C uptake in forest is not considered, which complies with
ISO/TS 14067 and PAS 2050. Although recent studies addressing this issue (e.g. Cherubini et al., 2011;
Levasseur et al., 2012) showed that results are sensitive to the temporal boundary, this is out of the scope
of this article.
MANUSCRIP
T
ACCEPTED
ACCEPTED MANUSCRIPT
11
0
50
100
150
200
250
300
350
0 10 20 30 40 50 60 70 80 90 100
Bio
Cco
nte
nt
(kg
biog
enic
C/m
3of
par
ticle
boar
d)
t (years)
Incineration Landfill
Fig. 3 Biogenic carbon content of particleboard over 100 years after the formation of the product.
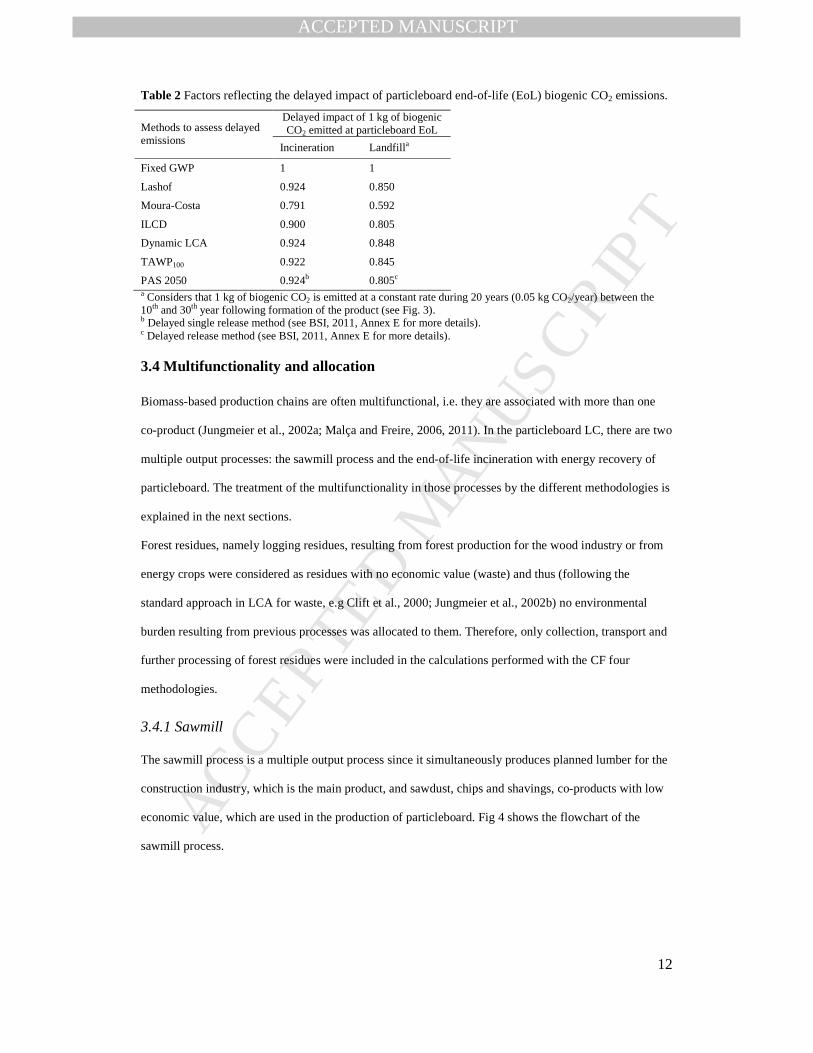
Table 2 shows the factors calculated with different methods to account for the delayed emission of 1 kg of
CO2 at particleboard EoL. These factors reflect the time of delay in the emissions for each EoL scenario,
according to the biogenic carbon content profile presented in Fig. 3 (except for the fixed GWP approach,
which does not account for the timing of emissions). For the incineration scenario, the values were
obtained for a delay of 10 years in the emission of 1 kg of biogenic CO2 and represent the impact of that
delayed emission. For the landfill scenario, the values were calculated considering that 1 kg of biogenic
CO2 is emitted at a constant rate during 20 years (0.05 kg CO2/year) between the 10th and 30th year
following formation of the product and represent the total impact of those delayed emissions. By
multiplying these factors by the total biogenic CO2 emissions arising at the particleboard EoL, the impact
of these emissions reflecting the timing of release according to the different methods is obtained (this can
be guaranteed for the landfill scenario since the emission release is assumed linear). In PAS 2050, the
same factors, termed weighting factors, apply to the other GHG emissions (as CO2 eq) arising at the EoL
of particleboard. In dynamic LCA and the TAWP model, different characterization factors were
calculated for the other type of GHG emission (namely CH4), according to Levasseur et al. (2010) and
Kendall (2012), respectively.
MANUSCRIP
T
ACCEPTED
ACCEPTED MANUSCRIPT
12
Table 2 Factors reflecting the delayed impact of particleboard end-of-life (EoL) biogenic CO2 emissions.
Delayed impact of 1 kg of biogenic CO2 emitted at particleboard EoL Methods to assess delayed
emissions Incineration Landfilla
Fixed GWP 1 1
Lashof 0.924 0.850
Moura-Costa 0.791 0.592
ILCD 0.900 0.805
Dynamic LCA 0.924 0.848
TAWP100 0.922 0.845
PAS 2050 0.924b 0.805c a Considers that 1 kg of biogenic CO2 is emitted at a constant rate during 20 years (0.05 kg CO2/year) between the 10th and 30th year following formation of the product (see Fig. 3). b Delayed single release method (see BSI, 2011, Annex E for more details). c Delayed release method (see BSI, 2011, Annex E for more details).
3.4 Multifunctionality and allocation
Biomass-based production chains are often multifunctional, i.e. they are associated with more than one
co-product (Jungmeier et al., 2002a; Malça and Freire, 2006, 2011). In the particleboard LC, there are two
multiple output processes: the sawmill process and the end-of-life incineration with energy recovery of
particleboard. The treatment of the multifunctionality in those processes by the different methodologies is
explained in the next sections.
Forest residues, namely logging residues, resulting from forest production for the wood industry or from
energy crops were considered as residues with no economic value (waste) and thus (following the
standard approach in LCA for waste, e.g Clift et al., 2000; Jungmeier et al., 2002b) no environmental
burden resulting from previous processes was allocated to them. Therefore, only collection, transport and
further processing of forest residues were included in the calculations performed with the CF four
methodologies.
3.4.1 Sawmill
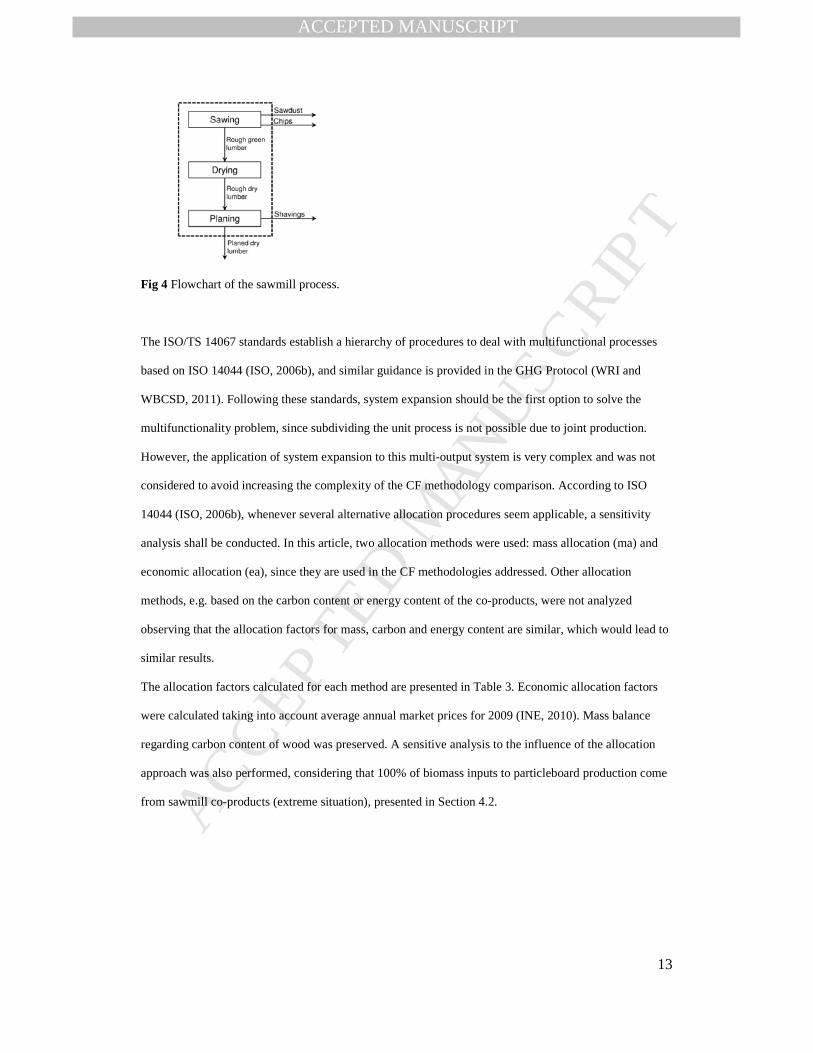
The sawmill process is a multiple output process since it simultaneously produces planned lumber for the
construction industry, which is the main product, and sawdust, chips and shavings, co-products with low
economic value, which are used in the production of particleboard. Fig 4 shows the flowchart of the
sawmill process.
MANUSCRIP
T
ACCEPTED
ACCEPTED MANUSCRIPT
13
Fig 4 Flowchart of the sawmill process.
The ISO/TS 14067 standards establish a hierarchy of procedures to deal with multifunctional processes
based on ISO 14044 (ISO, 2006b), and similar guidance is provided in the GHG Protocol (WRI and
WBCSD, 2011). Following these standards, system expansion should be the first option to solve the
multifunctionality problem, since subdividing the unit process is not possible due to joint production.
However, the application of system expansion to this multi-output system is very complex and was not
considered to avoid increasing the complexity of the CF methodology comparison. According to ISO
14044 (ISO, 2006b), whenever several alternative allocation procedures seem applicable, a sensitivity
analysis shall be conducted. In this article, two allocation methods were used: mass allocation (ma) and
economic allocation (ea), since they are used in the CF methodologies addressed. Other allocation
methods, e.g. based on the carbon content or energy content of the co-products, were not analyzed
observing that the allocation factors for mass, carbon and energy content are similar, which would lead to
similar results.
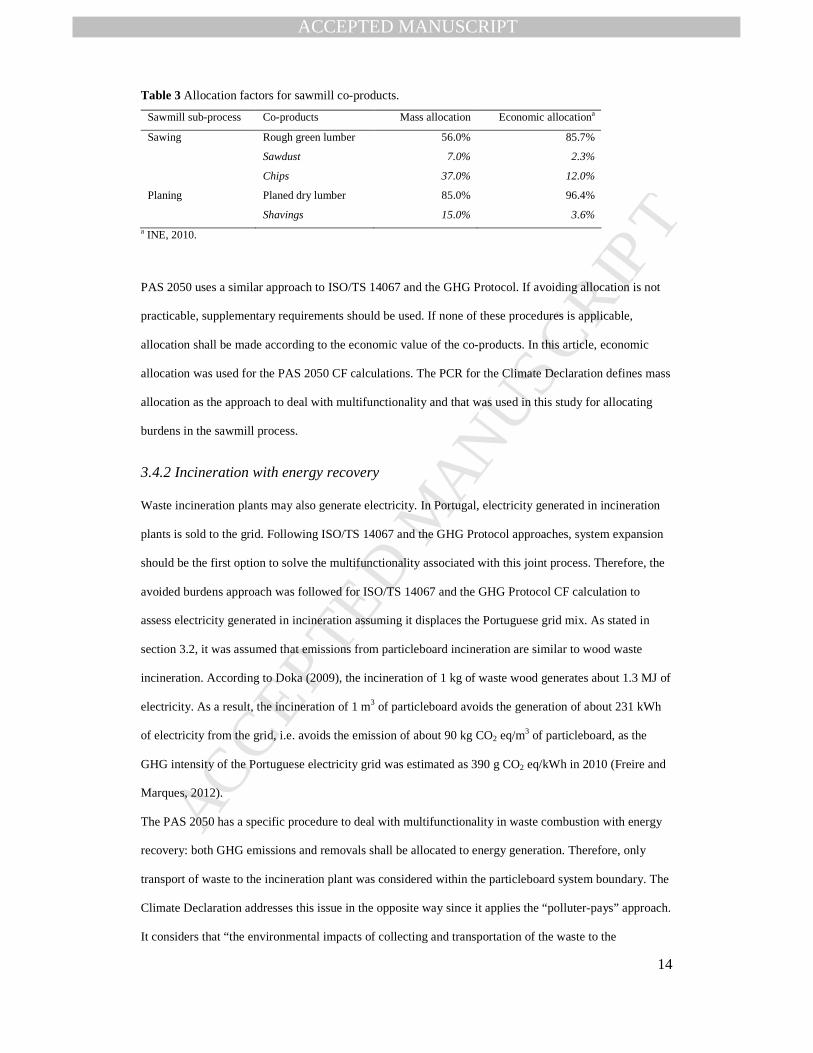
The allocation factors calculated for each method are presented in Table 3. Economic allocation factors
were calculated taking into account average annual market prices for 2009 (INE, 2010). Mass balance
regarding carbon content of wood was preserved. A sensitive analysis to the influence of the allocation
approach was also performed, considering that 100% of biomass inputs to particleboard production come
from sawmill co-products (extreme situation), presented in Section 4.2.
MANUSCRIP
T
ACCEPTED
ACCEPTED MANUSCRIPT
14
Table 3 Allocation factors for sawmill co-products.
Sawmill sub-process Co-products Mass allocation Economic allocationa
Sawing Rough green lumber 56.0% 85.7%
Sawdust 7.0% 2.3%
Chips 37.0% 12.0%
Planing Planed dry lumber 85.0% 96.4%
Shavings 15.0% 3.6% a INE, 2010.
PAS 2050 uses a similar approach to ISO/TS 14067 and the GHG Protocol. If avoiding allocation is not
practicable, supplementary requirements should be used. If none of these procedures is applicable,
allocation shall be made according to the economic value of the co-products. In this article, economic
allocation was used for the PAS 2050 CF calculations. The PCR for the Climate Declaration defines mass
allocation as the approach to deal with multifunctionality and that was used in this study for allocating
burdens in the sawmill process.
3.4.2 Incineration with energy recovery
Waste incineration plants may also generate electricity. In Portugal, electricity generated in incineration
plants is sold to the grid. Following ISO/TS 14067 and the GHG Protocol approaches, system expansion
should be the first option to solve the multifunctionality associated with this joint process. Therefore, the
avoided burdens approach was followed for ISO/TS 14067 and the GHG Protocol CF calculation to
assess electricity generated in incineration assuming it displaces the Portuguese grid mix. As stated in
section 3.2, it was assumed that emissions from particleboard incineration are similar to wood waste
incineration. According to Doka (2009), the incineration of 1 kg of waste wood generates about 1.3 MJ of
electricity. As a result, the incineration of 1 m3 of particleboard avoids the generation of about 231 kWh
of electricity from the grid, i.e. avoids the emission of about 90 kg CO2 eq/m3 of particleboard, as the
GHG intensity of the Portuguese electricity grid was estimated as 390 g CO2 eq/kWh in 2010 (Freire and
Marques, 2012).
The PAS 2050 has a specific procedure to deal with multifunctionality in waste combustion with energy
recovery: both GHG emissions and removals shall be allocated to energy generation. Therefore, only
transport of waste to the incineration plant was considered within the particleboard system boundary. The
Climate Declaration addresses this issue in the opposite way since it applies the “polluter-pays” approach.
It considers that “the environmental impacts of collecting and transportation of the waste to the
MANUSCRIP
T
ACCEPTED
ACCEPTED MANUSCRIPT
15
incineration plant as well as those impacts caused by the incineration process itself are allocated to the
waste generator” (IEC, 2008b, pp. 14). Following this approach, all the burdens from the incineration
process were allocated to the particleboard LC in the Climate Declaration CF calculation.
4. Results and discussion
This section presents and discusses the CF calculated by the four methodologies (ISO/TS 14067, GHG
Protocol, PAS 2050 and Climate Declaration). Firstly, the cradle-to-gate CF is assessed and the main
hotspots in the production of particleboard are identified. Secondly, a cradle-to-grave assessment is
presented considering two end-of-life (EoL) scenarios: incineration with energy recovery and landfill
disposal. The contribution of different methodological issues to the differences in results is discussed,
particularly the inclusion or exclusion of capital goods, the approaches used to deal with multifunctional
processes, the cut-off rules and the influence of using different methods to assess delayed GHG
emissions.
4.1 Cradle-to-gate assessment
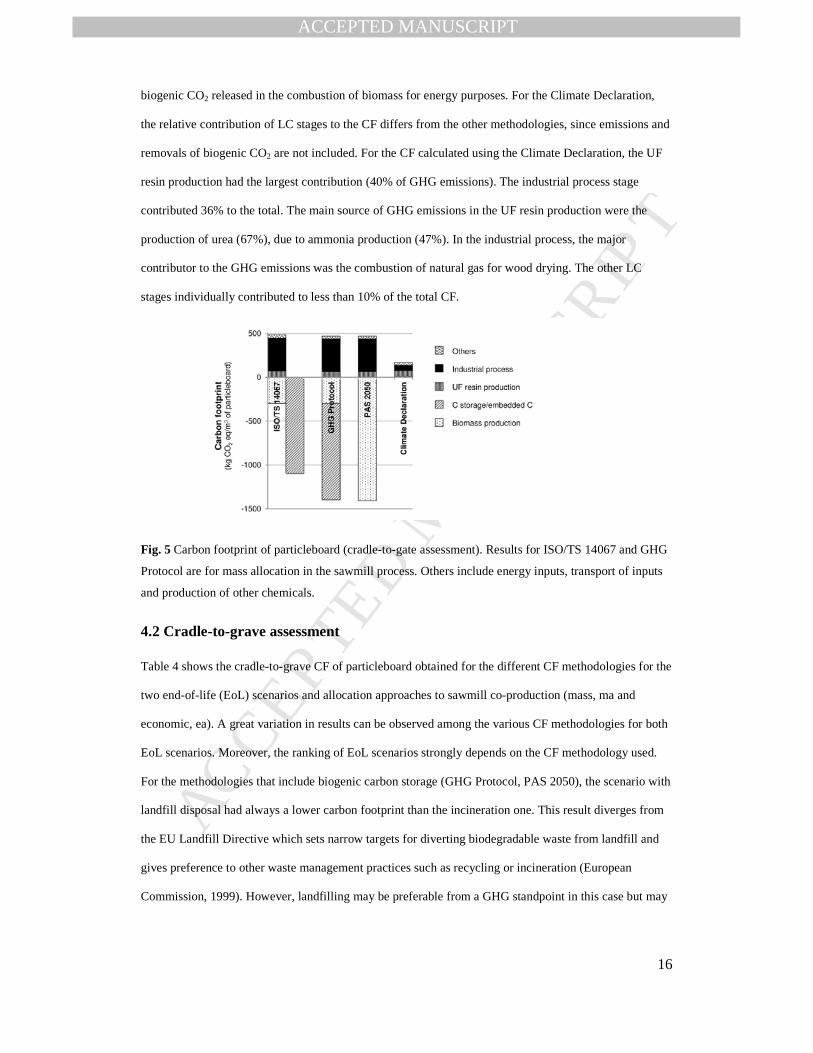
Fig. 5 compares the cradle-to-gate CF of particleboard calculated by the four CF methodologies and
shows the relative contribution of each LC stage. There is a major difference in the reported CF between
the methodologies that include (GHG Protocol, PAS 2050) and exclude (ISO/TS 14067, Climate
Declaration) biogenic carbon storage. The GHG Protocol (mass allocation, ma) and PAS 2050 calculated
negative CFs (-913 and -939 kg CO2 eq/m3, respectively) while ISO/TS 14067 (ma) and the Climate
Declaration calculated positive CFs (188 and 168 kg CO2 eq/m3). It should be noted that carbon stored in
particleboard (equivalent to 1098 kg CO2/m3) shall be reported separately in ISO/TS 14067 CF report and
is shown in a separate column in Fig. 5. The GHG Protocol also requires that the amount of carbon
embedded in the product is reported when performing a cradle-to-gate assessment (highlighted in Fig. 5).
Reporting the amount of C stored in the product is particularly important in cradle-to-gate assessments in
order to avoid misleading comparisons with other products, since the embodied carbon at gate may be
released later during use or end-of-life phase (i.e. may be only temporarily stored).
For the ISO/TS 14067, GHG Protocol and PAS 2050 CF, the biomass production stage had a high
contribution to GHG removals, due to the uptake of CO2 from the atmosphere during tree growth. On the
other hand, the industrial process was the one contributing the most to GHG emissions due to the
MANUSCRIP
T
ACCEPTED
ACCEPTED MANUSCRIPT
16
biogenic CO2 released in the combustion of biomass for energy purposes. For the Climate Declaration,
the relative contribution of LC stages to the CF differs from the other methodologies, since emissions and
removals of biogenic CO2 are not included. For the CF calculated using the Climate Declaration, the UF
resin production had the largest contribution (40% of GHG emissions). The industrial process stage
contributed 36% to the total. The main source of GHG emissions in the UF resin production were the
production of urea (67%), due to ammonia production (47%). In the industrial process, the major
contributor to the GHG emissions was the combustion of natural gas for wood drying. The other LC
stages individually contributed to less than 10% of the total CF.
Fig. 5 Carbon footprint of particleboard (cradle-to-gate assessment). Results for ISO/TS 14067 and GHG
Protocol are for mass allocation in the sawmill process. Others include energy inputs, transport of inputs
and production of other chemicals.
4.2 Cradle-to-grave assessment
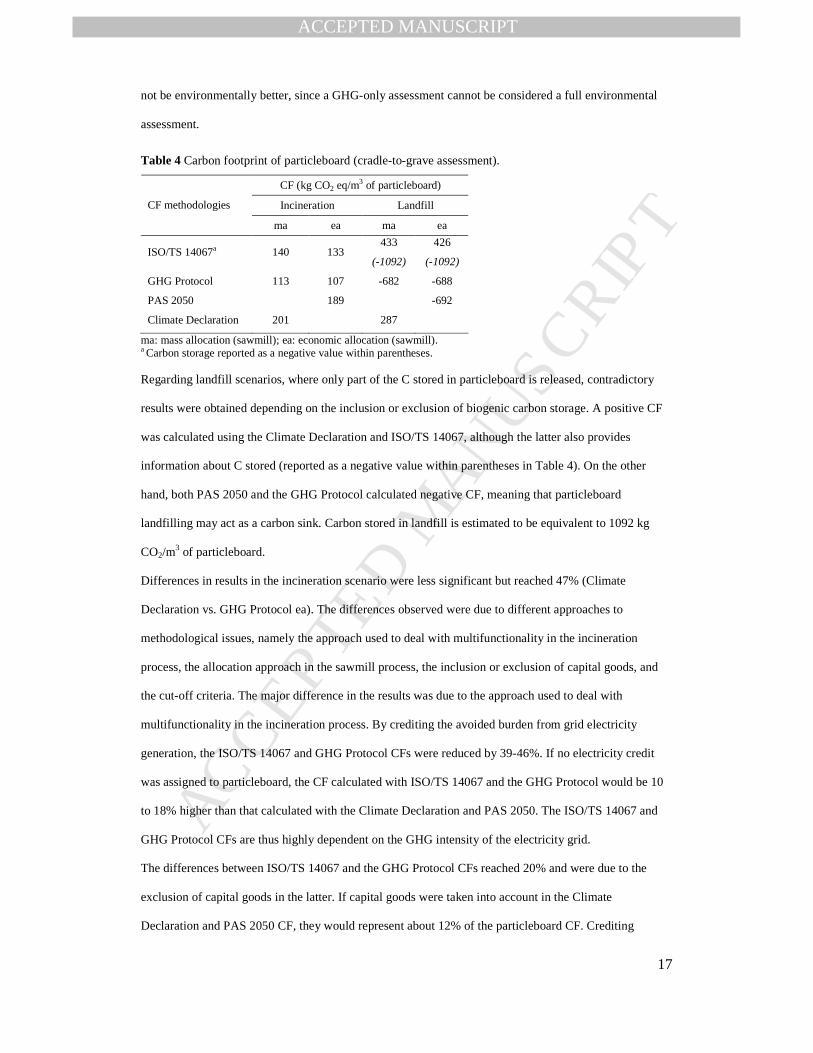
Table 4 shows the cradle-to-grave CF of particleboard obtained for the different CF methodologies for the
two end-of-life (EoL) scenarios and allocation approaches to sawmill co-production (mass, ma and
economic, ea). A great variation in results can be observed among the various CF methodologies for both
EoL scenarios. Moreover, the ranking of EoL scenarios strongly depends on the CF methodology used.
For the methodologies that include biogenic carbon storage (GHG Protocol, PAS 2050), the scenario with
landfill disposal had always a lower carbon footprint than the incineration one. This result diverges from
the EU Landfill Directive which sets narrow targets for diverting biodegradable waste from landfill and
gives preference to other waste management practices such as recycling or incineration (European
Commission, 1999). However, landfilling may be preferable from a GHG standpoint in this case but may
MANUSCRIP
T
ACCEPTED
ACCEPTED MANUSCRIPT
17
not be environmentally better, since a GHG-only assessment cannot be considered a full environmental
assessment.
Table 4 Carbon footprint of particleboard (cradle-to-grave assessment).
CF (kg CO2 eq/m3 of particleboard)
Incineration Landfill CF methodologies
ma ea ma ea
ISO/TS 14067a 140 133 433
(-1092)
426
(-1092)
GHG Protocol 113 107 -682 -688
PAS 2050 189 -692
Climate Declaration 201 287
ma: mass allocation (sawmill); ea: economic allocation (sawmill). a Carbon storage reported as a negative value within parentheses. Regarding landfill scenarios, where only part of the C stored in particleboard is released, contradictory
results were obtained depending on the inclusion or exclusion of biogenic carbon storage. A positive CF
was calculated using the Climate Declaration and ISO/TS 14067, although the latter also provides
information about C stored (reported as a negative value within parentheses in Table 4). On the other
hand, both PAS 2050 and the GHG Protocol calculated negative CF, meaning that particleboard
landfilling may act as a carbon sink. Carbon stored in landfill is estimated to be equivalent to 1092 kg
CO2/m3 of particleboard.
Differences in results in the incineration scenario were less significant but reached 47% (Climate
Declaration vs. GHG Protocol ea). The differences observed were due to different approaches to
methodological issues, namely the approach used to deal with multifunctionality in the incineration
process, the allocation approach in the sawmill process, the inclusion or exclusion of capital goods, and
the cut-off criteria. The major difference in the results was due to the approach used to deal with
multifunctionality in the incineration process. By crediting the avoided burden from grid electricity
generation, the ISO/TS 14067 and GHG Protocol CFs were reduced by 39-46%. If no electricity credit
was assigned to particleboard, the CF calculated with ISO/TS 14067 and the GHG Protocol would be 10
to 18% higher than that calculated with the Climate Declaration and PAS 2050. The ISO/TS 14067 and
GHG Protocol CFs are thus highly dependent on the GHG intensity of the electricity grid.
The differences between ISO/TS 14067 and the GHG Protocol CFs reached 20% and were due to the
exclusion of capital goods in the latter. If capital goods were taken into account in the Climate
Declaration and PAS 2050 CF, they would represent about 12% of the particleboard CF. Crediting
MANUSCRIP
T
ACCEPTED
ACCEPTED MANUSCRIPT
18
avoided burdens in ISO/TS 14067 and the GHG Protocol CFs enlarged the relative share from capital
goods. The contribution of capital goods in the particleboard CF is in line with the findings of other
authors that addressed the environmental relevance of capital goods in LCA of wooden construction
materials (Frischknecht et al., 2007). This contribution was calculated relatively to the CF of
particleboard (incineration scenario) in which most of the GHG emissions are biogenic CO2 (neutral due
to the uptake of CO2). Thus, there is a higher relative contribution of capital goods comparatively to
fossil-energy-based industrial processes. Despite the exclusion of capital goods being a common practice
in LCA studies (Frischknecht et al., 2007), results show that they have a significant impact for
particleboard and should not be neglected. Although not mandatory, the GHG Protocol encourages the
inclusion of capital goods if relevant and the PAS 2050 refers to supplementary requirements for
guidance on this issue. Therefore, the development of supplementary requirements or product rules for
particleboard could have an important role here.
The cut-off criteria, on the other hand, had a negligible contribution to the differences in results.
Regarding the allocation approach in the sawmill process, small differences in results can be observed
between mass and economic allocation results (about 5%) since sawmill co-products represent less than
30% of the mass input to particleboard production and biomass production has a small contribution to the
overall GHG emissions of particleboard. Nevertheless, as wood raw material is becoming scarce, there is
a tendency to use more recovered wood in particleboard production, e.g. sawmill co-products (Irle and
Barbu, 2010). The importance of the allocation approach increases as the share of sawmill co-products in
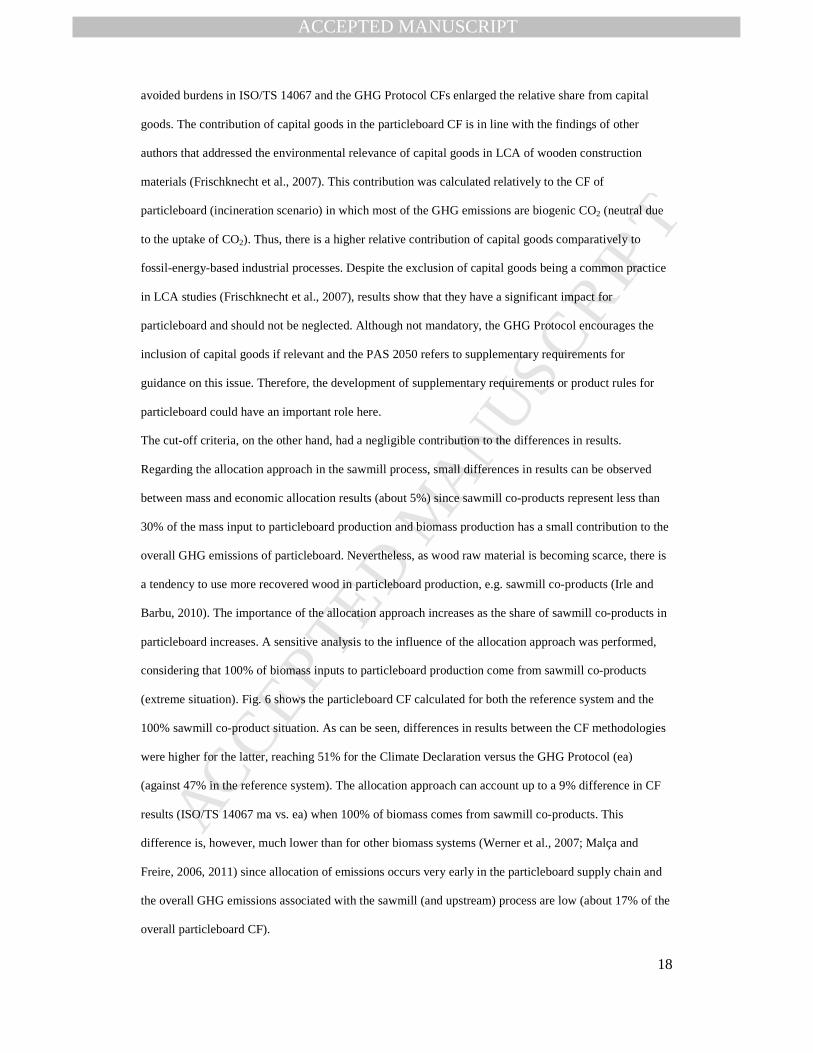
particleboard increases. A sensitive analysis to the influence of the allocation approach was performed,
considering that 100% of biomass inputs to particleboard production come from sawmill co-products
(extreme situation). Fig. 6 shows the particleboard CF calculated for both the reference system and the
100% sawmill co-product situation. As can be seen, differences in results between the CF methodologies
were higher for the latter, reaching 51% for the Climate Declaration versus the GHG Protocol (ea)
(against 47% in the reference system). The allocation approach can account up to a 9% difference in CF
results (ISO/TS 14067 ma vs. ea) when 100% of biomass comes from sawmill co-products. This
difference is, however, much lower than for other biomass systems (Werner et al., 2007; Malça and
Freire, 2006, 2011) since allocation of emissions occurs very early in the particleboard supply chain and
the overall GHG emissions associated with the sawmill (and upstream) process are low (about 17% of the
overall particleboard CF).
MANUSCRIP
T
ACCEPTED
ACCEPTED MANUSCRIPT
19
0
50
100
150
200
250
Reference 100% sawmill co-products
Car
bon
Fo
otpr
int
(kg
CO
2eq
/m3
part
icle
boar
d)
ISO/TS 14067 (ma)ISO/TS 14067 (ea)GHG Protocol (ma)GHG Protocol (ea)PAS 2050Climate Declaration
ISO/TS 14067 (ma)
ISO/TS 14067 (ea)
GHG Protocol (ma)
GHG Protocol (ea)
PAS 2050
Climate Declaration
Fig. 6 Comparison of the CF of the reference particleboard and of the particleboard with 100% sawmill
co-products, for the incineration EoL scenario.
4.2.1 Delayed emissions
Although not mandatory in any of the CF methodologies analyzed, accounting for the effect of timing of
emissions may be performed. Only PAS 2050 prescribes a specific method for assessing delayed
emissions. For both ISO/TS 14067 and the GHG Protocol, six alternative methods were assessed. It
should be noted that, in ISO/TS 14067, if emissions occur within ten years after the production of the
product, as in the incineration scenario, they shall be assessed as occurring at the beginning of the
assessment period. As a result, the effect of timing of emissions was not assessed in ISO/TS 14067 for the
incineration scenario and, for that reason, the GHG Protocol results were chosen to be presented. Table 5
shows the GHG Protocol CF of particleboard for the two EoL scenarios calculated taking into account the
effect of timing of emissions according to the six methods and the PAS 2050 CF calculated using its
specific method. The effect of timing of emissions was also taken into account when calculating the
avoided burden credit in the incineration scenario.
The method used to assess delayed emissions had a significant influence in the particleboard CF results
for the incineration scenario, where all the stored C is released. Using the Moura-Costa and the ILCD
approaches to account for delayed emissions of the stored C lead to a negative CF, since the credit for
these emissions is higher than the cradle-to-gate GHG emissions including the avoided burdens credit.
However, the reduction was lower with the Moura-Costa approach, since a yearly delayed GHG emission
in ILCD is considered to have a higher relative impact. The Lashof, dynamic LCA and TAWP
approaches gave similar results and the CF was reduced by 81-82% compared to the fixed GWP
approach. In absolute terms, similar time adjusted emissions were calculated for the Lashof, dynamic
MANUSCRIP
T
ACCEPTED
ACCEPTED MANUSCRIPT
20
LCA and TAWP100 approaches (less than 0.2% difference), as emissions occur within 25 years and non-
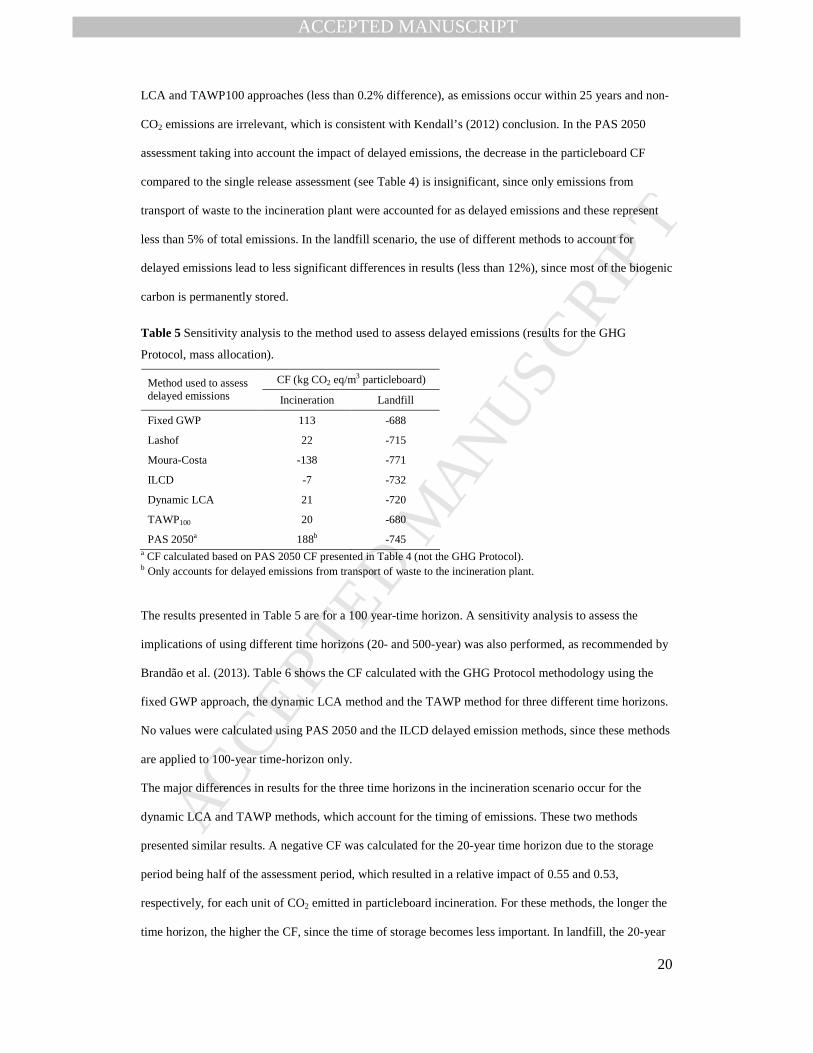
CO2 emissions are irrelevant, which is consistent with Kendall’s (2012) conclusion. In the PAS 2050
assessment taking into account the impact of delayed emissions, the decrease in the particleboard CF
compared to the single release assessment (see Table 4) is insignificant, since only emissions from
transport of waste to the incineration plant were accounted for as delayed emissions and these represent
less than 5% of total emissions. In the landfill scenario, the use of different methods to account for
delayed emissions lead to less significant differences in results (less than 12%), since most of the biogenic
carbon is permanently stored.
Table 5 Sensitivity analysis to the method used to assess delayed emissions (results for the GHG
Protocol, mass allocation).
CF (kg CO2 eq/m3 particleboard) Method used to assess delayed emissions Incineration Landfill
Fixed GWP 113 -688
Lashof 22 -715
Moura-Costa -138 -771
ILCD -7 -732
Dynamic LCA 21 -720
TAWP100 20 -680
PAS 2050a 188b -745 a CF calculated based on PAS 2050 CF presented in Table 4 (not the GHG Protocol). b Only accounts for delayed emissions from transport of waste to the incineration plant.
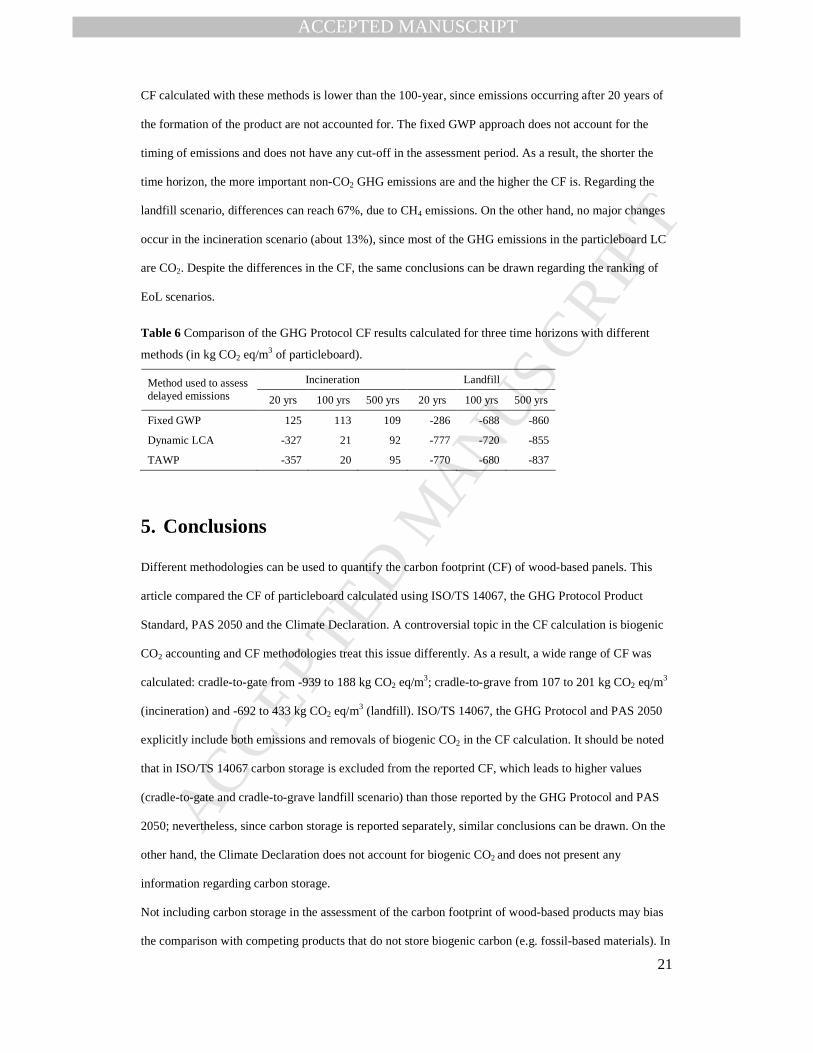
The results presented in Table 5 are for a 100 year-time horizon. A sensitivity analysis to assess the
implications of using different time horizons (20- and 500-year) was also performed, as recommended by
Brandão et al. (2013). Table 6 shows the CF calculated with the GHG Protocol methodology using the
fixed GWP approach, the dynamic LCA method and the TAWP method for three different time horizons.
No values were calculated using PAS 2050 and the ILCD delayed emission methods, since these methods
are applied to 100-year time-horizon only.
The major differences in results for the three time horizons in the incineration scenario occur for the
dynamic LCA and TAWP methods, which account for the timing of emissions. These two methods
presented similar results. A negative CF was calculated for the 20-year time horizon due to the storage
period being half of the assessment period, which resulted in a relative impact of 0.55 and 0.53,
respectively, for each unit of CO2 emitted in particleboard incineration. For these methods, the longer the
time horizon, the higher the CF, since the time of storage becomes less important. In landfill, the 20-year
MANUSCRIP
T
ACCEPTED
ACCEPTED MANUSCRIPT
21
CF calculated with these methods is lower than the 100-year, since emissions occurring after 20 years of
the formation of the product are not accounted for. The fixed GWP approach does not account for the
timing of emissions and does not have any cut-off in the assessment period. As a result, the shorter the
time horizon, the more important non-CO2 GHG emissions are and the higher the CF is. Regarding the
landfill scenario, differences can reach 67%, due to CH4 emissions. On the other hand, no major changes
occur in the incineration scenario (about 13%), since most of the GHG emissions in the particleboard LC
are CO2. Despite the differences in the CF, the same conclusions can be drawn regarding the ranking of
EoL scenarios.
Table 6 Comparison of the GHG Protocol CF results calculated for three time horizons with different
methods (in kg CO2 eq/m3 of particleboard).
Incineration Landfill Method used to assess delayed emissions 20 yrs 100 yrs 500 yrs 20 yrs 100 yrs 500 yrs
Fixed GWP 125 113 109 -286 -688 -860
Dynamic LCA -327 21 92 -777 -720 -855
TAWP -357 20 95 -770 -680 -837
5. Conclusions
Different methodologies can be used to quantify the carbon footprint (CF) of wood-based panels. This
article compared the CF of particleboard calculated using ISO/TS 14067, the GHG Protocol Product
Standard, PAS 2050 and the Climate Declaration. A controversial topic in the CF calculation is biogenic
CO2 accounting and CF methodologies treat this issue differently. As a result, a wide range of CF was
calculated: cradle-to-gate from -939 to 188 kg CO2 eq/m3; cradle-to-grave from 107 to 201 kg CO2 eq/m3
(incineration) and -692 to 433 kg CO2 eq/m3 (landfill). ISO/TS 14067, the GHG Protocol and PAS 2050
explicitly include both emissions and removals of biogenic CO2 in the CF calculation. It should be noted
that in ISO/TS 14067 carbon storage is excluded from the reported CF, which leads to higher values
(cradle-to-gate and cradle-to-grave landfill scenario) than those reported by the GHG Protocol and PAS
2050; nevertheless, since carbon storage is reported separately, similar conclusions can be drawn. On the
other hand, the Climate Declaration does not account for biogenic CO2 and does not present any
information regarding carbon storage.
Not including carbon storage in the assessment of the carbon footprint of wood-based products may bias
the comparison with competing products that do not store biogenic carbon (e.g. fossil-based materials). In
MANUSCRIP
T
ACCEPTED
ACCEPTED MANUSCRIPT
22
fact, when a fraction of the biogenic C is permanently stored, as in landfill, the notion of carbon neutrality
frequently attributed to biogenic CO2 emissions is misleading, as discussed in Levasseur et al. (2012). On
the other hand, when presenting cradle-to-gate results, the embedded carbon should be reported, in order
to avoid misleading comparisons with other products, since the embodied carbon at gate may be released
later during use or end-of-life phase (e.g. through incineration). Therefore, in future guidelines for wood-
based panels, such as Product Category Rules and Supplementary Requirements, transparent accounting
for biogenic CO2 emissions and removals, including reporting of carbon storage, should be required so
that the implications of these issues to the overall CF are comprehensively understood.
The CF of particleboard for the incineration scenario was very sensitive to the treatment of
multifunctionality in the incineration process. Although ISO/TS 14067, the GHG Protocol and PAS 2050
have a similar procedure to deal with multifunctional processes in general (based on ISO 14044), PAS
2050 has specific guidelines for allocation of burdens from energy recovery from waste which do not
comply with the standard ISO 14044 approach. The Climate Declaration also deals with this issue
differently. The treatment of multifunctionality in energy recovery from waste should thus be aligned
between CF methodologies.
Other controversial topic in the CF calculation is delayed emissions accounting, which may significantly
affect CF results, especially if long-living products are being assessed (80-200% reduction in
particleboard CF). The different CF methodologies do not require that the effect of delaying emissions is
reported and if delayed emissions are calculated, they are required to be reported separately. The Climate
Declaration is the exception, since no reference to delayed emission accounting is made. Despite the
consensus in delayed emission reporting between ISO/TS 14067, the GHG Protocol and PAS 2050, no
consistent methodology is defined. If companies wish to report the effect of delayed emissions, a
sensitivity analysis to the method chosen should be performed since it can lead to very distinct results.
Regarding other methodological issues addressed, attention should be paid to the inclusion of capital
goods since these may be important. In fact, CF methodologies, in particular the GHG Protocol, PAS
2050 and the Climate Declaration, tend to ignore capital goods as a general rule. However, in wood-based
products the relative contribution of capital goods is higher comparatively to fossil-energy-based
industrial processes since biogenic CO2 emissions resulting from energy requirements are neutral due to
C uptake. Product Category Rules and Supplementary Requirements to be developed for wood-based
panels should take this into account.
MANUSCRIP
T
ACCEPTED
ACCEPTED MANUSCRIPT
23
Acknowledgments The authors would like to thank four anonymous reviewers for their useful
comments. This research was supported by the Portuguese Foundation for Science and Technology
("Fundação para a Ciência e a Tecnologia", FCT) under the projects MIT/SET/0014/2009,
MIT/MCA/0066/2009, and PTDC/SEN-TRA/117251/2010. This work was also framed under the Energy
for Sustainability Initiative of the University of Coimbra and supported by the R&D Project EMSURE
(CENTRO-07-0224-FEDER-002004). Rita Garcia gratefully acknowledges financial support from FCT
through grant SFRH/BD/51299/2010.
References
AFNOR, 2009. Affichage-environnemental: BPX 30-323, available at: http://affichage-environnemental.afnor.org/bpx30-323 (accessed 12.07.12).
AIMMP, 2010. Boletim informativo: Indústrias da Madeira e do Mobiliário, available at: http://aimmp.pt. (accessed 12.01.12).
Bird, D.N., Cowie, A., Frieden, D., Gustavsson, L., Pena, N., Pingoud, K., Rueter, S., Sathre, R., Soimakallio, S., Tuerk, A., Woess-Gallasch, S., Zanchi, G., 2010. Emissions from Bioenergy: Improved Accounting Options and New Policy Needs, in: Proceedings of 18th European Biomass Conference and Exhibition, pp. 98-102.
BSI, 2008. PAS 2050:2008 Specification for the assessment of the life cycle greenhouse gas emissions of goods and services. British Standards Institution, London.
BSI, 2011. PAS 2050:2011 Specification for the assessment of the life cycle greenhouse gas emissions of goods and services. British Standards Institution, London.
BSI, WRI, WBCSD, 2011. Quantifying the greenhouse gas emissions of products – PAS 2050 & the GHG Protocol Product Standard – A short guide to their purpose, similarities and differences, available at: http://www.ghgprotocol.org/files/ghgp/public/GHG%20Protocol%20PAS%20 2050%20Factsheet.pdf (accessed 30.11.2012).
Brandão, M., Levasseur, A., 2011. Assessing Temporary Carbon Storage in Life Cycle Assessment and Carbon Footprinting: Outcomes of an expert workshop. Publications Office of the European Union, Luxembourg.
Brandão, M., Levasseur, A., Kirschbaum, M.U.F., Weidema, B.P., Cowie, A.L., Jørgensen, S.V., Hauschild, M.Z., Pennington, D.W., Chomkhamsri, K., 2013. Key issues and options in accounting for carbon sequestration and temporary storage in life cycle assessment and carbon footprinting. Int J. Life Cycle Assess. 18, 230–240.
Cambria, D., Pierangeli, D., 2012. Application of a life cycle assessment to walnut tree (Juglans regia L.) high quality wood production: a case study in southern Italy. J. Clean. Prod. 23, 37–46.
Cherubini, F., Strømman, A.H., Hertwich, E., 2011. Effects of boreal forest management practices on the climate impact of CO2 emissions from bioenergy. Ecol. Model. 223, 59–66.
Clift, R., Doig, A., Finnveden, G., 2000. The application of Life Cycle Assessment to integrated solid waste management, Part 1 – Methodology. Process Safety and Environmental Protection 78(4), 279-287.
MANUSCRIP
T
ACCEPTED
ACCEPTED MANUSCRIPT
24
Clift, R., Brandão, M., 2008. Carbon storage and timing of emissions. University of Surrey. Centre for Environmental Strategy Working Paper Number 02/08. Guildford.
Dias, A.C., Arroja, L., Capela, I., 2007. Carbon dioxide emissions from forest operations in Portuguese eucalypt and maritime pine stands. Scand. J. For. Res. 22, 422–432.
Dias, A.C., Arroja, L., 2012. Comparison of methodologies for estimating the carbon footprint – case study of office paper. J. Clean. Prod. 24, 30–35.
Doka, G., 2009. Life Cycle Inventories of Waste Treatment Services. Ecoinvent report No. 13. Swiss Centre for LCI, St. Gallen.
Draucker, L., Kaufman, S., ter Kuile, R., Meinrenken, C., 2011. Moving Forward on Product Carbon Footprint Standards. J. Ind. Ecol. 15,169–171.
Ecoinvent, 2012. Ecoinvent Database v2.2, available at: http://www.ecoinvent.ch/ (accessed 03.05.12).
Environdec, 2012. PCR 2012:05 Particle and Fibreboard, available at: http://www.environdec.com/en/Product-Category-Rules/Detail/?Pcr=7843#.UE4CW438t1c (accessed 20.04.12).
Eshun, J.F., Potting, J., Leemans, R., 2012. Wood waste minimization in the timber sector of Ghana: a systems approach to reduce environmental impact. J. Clean. Prod. 26, 67–78.
European Commission, 1999. Council Directive 1999/31/EC of 26 April 1999 on the landfill of waste. Off J Eur Communities.
EC JRC, 2010. International Reference Life Cycle Data System Handbook. European Commission Joint Research Centre and the Institute for Environment and Sustainability, available at: http://lct.jrc.ec.europa.eu/assessment/publications.
FAO, 2012. FAOSTAT – FAO’s online statistical database, available at: http://faostat.fao.org/ (accessed 20.07.12).
Fearnside, P., Lashof, D., Moura-Costa, P., 2000. Accounting for time in mitigating global warming through land-use change and forestry. Mitig. Adapt. Strat. Glob. Chang. 239–270.
Freire, F., Marques, P., 2012. Electric vehicles in Portugal: An integrated energy, greenhouse gas and cost life-cycle analysis, in: Sustainable Systems and Technology (ISSST) 2012 IEEE International Symposium on Sustainable Systems and Technology, pp 1–6.
Frischknecht, R., Althaus, H., Bauer, C., Doka, G., Heck, T., Jungbluth, N., Kellenberger, D., Nemecek, T., 2007. The Environmental Relevance of Capital Goods in Life Cycle Assessments of Products and Services. Int. J. Life Cycle Assess. 12, 7–17.
Garcia, R., 2010. Avaliação comparativa de instrumentos de ciclo de vida aplicados a dois sistemas com biomassa: painéis e electricidade. Dissertation, University of Coimbra.
Garcia, R., Freire, F., 2011. Modelação Energética e Ambiental do Ciclo de Vida de Painéis Aglomerados de Partículas. Construlink. 28, 22–33.
Garrido, N., Martins, J., Pereira, J., Carvalho, L., Mendes, J., Costa, C., 2010. Effect of recycled wood and alternative species on particleboard machining, in: Teischinger, A., Barbu, M.C., Dunky, M., Harper, D., Jungmeier, G., Militz, H., Musso, M., Petutschnigg, A., Pizzi, A., Wieland, S., Young, T.M., (Eds.), Processing Technologies for the Forest and Bio-based Products Industries, pp. 201-204.
MANUSCRIP
T
ACCEPTED
ACCEPTED MANUSCRIPT
25
González-García, S., Feijoo, G., Heathcote, C., Kandelbauer, A., Moreira, M.T., 2011. Environmental assessment of green hardboard production coupled with a laccase activated system. J. Clean. Prod. 19, 445–453.
González-García, S., Hospido, A., Moreira, M.T., Romero, J., Feijoo, G., 2009a. Environmental impact assessment of total chlorine free pulp from Eucalyptus globulus in Spain. J. Clean. Prod. 17, 1010–1016.
González-García, S., Feijoo, G., Widsten, P., Kandelbauer, A., Zikulnig-Rusch, E., Moreira, M.T., 2009b. Environmental performance assessment of hardboard manufacture. Int. J. Life Cycle Assess. 14, 456–466.
Guinée, J. B., Gorree, M., Heijungs, R., Huppes, G., Kleijn, R., de Koning, A., van Oers, L., Sleeswijk, A.W., Suh, S., de Haes, H.A.U., Bruijn, H., van Duin, R., Huijbregts, M.A.J., 2002. Handbook on life cycle assessment: Operational guide to the ISO standards. Kluwer Academic Publishers, Dordrecht, the Netherlands.
Guinée, J.B., Heijungs, R., Voet, E., 2009. A greenhouse gas indicator for bioenergy: some theoretical issues with practical implications. Int. J. Life Cycle Assess. 14, 328–339.
Hischier, R., Weidema, B., Althaus, H.-J., Bauer, C., Doka, G., Dones, R., Frischknecht, R., Hellweg, S., Humbert, S., Jungbluth, N., Köllner, T., Loerincik, Y., Margni, M., Nemecek, T., 2010. Implementation of Life Cycle Impact Assessment Methods. Final report ecoinvent v2.2 No. 3. Swiss Centre for Life Cycle Inventories, Dübendorf, CH.ICNF, 2013. Inventário Florestal Nacional. Instituto da Conservação da Natureza e das Florestas, available at: http://www.icnf.pt/portal/florestas/ifn/.
IEC, 2008a. General Programme Instructions for Environmental Product Declarations, available at: http://www.environdec.com/en/The-EPD-system/Programme-Instructions/ (accessed 20.04.12).
IEC, 2008b. Suppportin Annexes for an international EPD®system for environmental product declarations, available at: http://www.environdec.com/en/The-EPD-system/Programme-Instructions/ (accessed 20.04.12).INE, 2010. Estatísticas da Produção Industrial 2009. Instituto Nacional de Estatística IP, Lisboa.
ISO, 2000. ISO 14020: Environmental labels and declarations – General principles. International Organization for Standardization, Geneve.
ISO, 2006a. ISO 14040: Environmental management – life cycle assessment – principles and framework. International Organization for Standardization, Geneve.
ISO, 2006b. ISO 14044: Environmental management - Life cycle assessment - Requirements and guidelines. International Organization for Standardization, Geneve.
ISO, 2006c. ISO 14025: Environmental labels and declarations – environmental labeling type III – principles and procedures. International Organization for Standardization, Geneve.
ISO/TS, 2013. ISO/TS 14067: Greenhouse gases – Carbon footprint of products – Requirements and guidelines for quantification and communication (Technical Specifications). International Organization for Standardization, Geneve.
Ingwersen, W.W., Stevenson, M.J., 2012. Can we compare the environmental performance of this product to that one? An update on the development of product category rules and future challenges toward alignment. J. Clean. Prod. 24, 102–108.
Irle, M., Barbu, M.C., 2010. Wood-based Panel Technology, in: Thoemen, H., Irle, M., Sernek, M. (Eds.), Wood-based Panels: An Introduction for Specialists. Brunel University Press, London, pp 1–90.
MANUSCRIP
T
ACCEPTED
ACCEPTED MANUSCRIPT
26
JEMAI, 2012. CFP Communication Program. Basic instructions, available at: http://www.cfp-japan.jp/english/rules/index.html.
Jungmeier, G., Werner, F., Jarnehammar, A.C., 2002a. Allocation in LCA of wood-based products, Experiences of cost action E9, Part I. Methodology. Int. J. Life Cycle Assess. 7(5), 290 – 294.
Jungmeier, G., Werner, F., Jarnehammar, A.C., Hohenthal, C., Richter, K., 2002b. Allocation in LCA of wood-based products, Experiences of cost action E9, Part II. Examples. Int. J. Life Cycle Assess. 7(6), 369 – 375.
Kendall, A., 2012. Time-adjusted global warming potentials for LCA and carbon footprints. Int. J. Life Cycle Assess. 17 (8), 1042–1049.
Levasseur, A., Lesage, P., Margni, M., Deschênes, L., Samson, R., 2010. Considering time in LCA: dynamic LCA and its application to global warming impact assessments. Environ. Sci. Technol. 44, 3169–74.
Levasseur, A., Lesage, P., Margni, M., Samson, R., 2012. Biogenic Carbon and Temporary Storage Addressed with Dynamic Life Cycle Assessment. J. Ind. Ecol. 17 (1), 117–128.
Lopes, E., Dias, A., Arroja, L., Capela, I., Pereira, F., 2003. Application of life cycle assessment to the Portuguese pulp and paper industry. J. Clean. Prod. 11 (1), 51–59.
Malça, J., Freire, F., 2006. Renewability and life-cycle energy efficiency of bioethanol and bio-ethyl tertiary butyl ether (bioETBE): Assessing the implications of allocation. Energ. 31, 3362–3380.
Malça, J., Freire, F., 2011. Life-cycle studies of biodiesel in Europe: A review addressing the variability of results and modeling issues. Renew. Sustain. Energ. Rev. 15, 338–351.
Merrild, H., Christensen, T.H., 2009. Recycling of wood for particle board production: accounting of greenhouse gases and global warming contributions. Waste Manag. Res., 27(8), 781–788.
Micales, J., Skog, K.E., 1997. The decomposition of forest products in landfills. Int Biodeterior Biodegrad, 39, 145–158.
Milota, M., West, C., Hartley, I., 2006. Gate-to-gate life-cycle inventory of softwood lumber production. Wood Fiber Sci. 37, 47–57.
Moura-Costa, P., Wilson, C., 2000. An equivalence factor between CO2 avoided emissions and sequestration–description and applications in forestry. Mitig. Adapt. Strat. Glob. Chang. 5, 51–60.
Müller-Wenk, R., Brandão, M., 2010. Climatic impact of land use in LCA—carbon transfers between vegetation/soil and air. Int J. Life Cycle Assess. 15(2), 172–182.
Nebel, B., Zimmer, B., Wegener, Z., 2006. Life Cycle Assessment of wood floor coverings. A representative study for the German flooring Industry. Int. J. Life Cycle Assess. 11(3), 172–182.
Nunes, J., 2008. Avaliação Integrada da produção de electricidade com base em biomassa lenho-celulósica em Portugal: emissões de GEE, análise tecnológica e energética de ciclo de vida. Dissertation, University of Coimbra.
Nunes, J., Freire, F., 2007. Tecnologias avançadas para a produção de electricidade com base em biomassa lenho-celulósica. Jornal de Engenharia Química. 6, 34–41.
Rivela, B., Hospido, A., Moreira, M.T., Feijoo, G., 2006. Life Cycle Inventory of Particleboard: A Case Study in the Wood Sector. Int. J. Life Cycle Assess. 11, 106–113.
MANUSCRIP
T
ACCEPTED
ACCEPTED MANUSCRIPT
27
Rivela, B., Moreira, M.T., Feijoo, G., 2007. Life Cycle Inventory of Medium Density Fibreboard. Int. J. Life Cycle Assess. 12, 143–150.
Saravia-Cortez, A.M., Herva, M., García-Diéguez, C., Roca, E., 2013. Assessing environmental sustainability of particleboard production process by ecological footprint. J. Clean. Prod., doi: 10.1016/j.jclepro.2013.02.006.
Searchinger, T.D., Hamburg, S.P., Melillo, J., Chameides, W., Havlik, P., Kammen, D.M., Likens, G.E., Lubowski, R.N., Obersteiner, M., Oppenheimer, M., Robertson, G.P., Schlesinger, W.H., Tilman, G.D., 2009. Fixing a Critical Climate Accounting Error. Science 326 (5952), 527-528.
Silva, D., Lahr, F., Garcia, R., Freire, F., Ometto, A., 2013. Life cycle assessment of medium density particleboard (MDP) produced in Brazil. Int J Life Cycle Assess. http://dx.doi.org/10.1007/s11367-013-0583-3.
Subramanian, V., Ingwersen, W., Hensler, C., Collie, H., 2012. Comparing product category rules from different programs: learned outcomes towards global alignment. Int. J. Life Cycle Assess. 17, 892–903.
Wang, X., Padgett, J.M., De la Cruz, F.B., Barlaz, M.A., 2011. Wood biodegradation in laboratory-scale landfills. Environ. Sci. Technol. 45(16), 6864–71.
Werner, F., Althaus, H-J., Richter, K., Scholz, R.W., 2007. Post-consumer waste wood in attributive product LCA; context-specific evaluation of allocation procedures in a functionalistic conception of LCA. Int J . Life Cycle Assess. 12 (3), 160–172.
Werner, F., Richter, K., 2007. Wooden building products in comparative LCA. Int. J. Life Cycle Assess. 12, 470–479.
Whittaker, C., McManus, M.C., Hammond, G.P., 2011. Greenhouse gas reporting for biofuels: A comparison between the RED, RTFO and PAS 2050 methodologies. Energ. Policy. 39:5950–5960.
Wilson, J.B., 2010a. Life-cycle inventory of particleboard in terms of resources, emissions, energy and carbon. Wood Fiber Sci., 42, 90–106.
Wilson, J.B., 2010b. Life-cycle inventory of medium density fiberboard in terms of resources, emissions, energy and carbon. Wood Fiber Sci. 42, 107–124.
Wilson, J.B., 2010c. Life-cycle inventory of formaldehyde-based resins used in wood composites in terms of resources, emissions, energy and carbon. Wood Fiber Sci. 42, 125–143.
WRI, WBCSD, 2011. Product Life Cycle Accounting and Reporting Standard. World Resources Institute and World Business Council for Sustainable Development, available at: http://www.ghgprotocol.org/.