Embed Size (px)
Citation preview

Carbon Dioxide and Climate
Pieter TansNOAA Earth System Research Laboratory
Boulder, Colorado
National Science Teachers AssociationNational Conference
New Orleans, 19 March 2009
You can use slides from my presentation if you acknowledge the author

Carbon Dioxide
CO2
O=C=O
Carbonic Acid
CO2
H2O
O2
Photosynthesis

THE GREENHOUSE EFFECT

THE GREENHOUSE EFFECT
What is infrared radiation?
Nat
ure
, 20
08

water vapor (H2O) 0 - 4 % (average 0.4 %) from 1800: to today:carbon dioxide (CO2) 0.028 % 0.038 %
methane (CH4) 0.00008 % 0.00017 %
nitrous oxide (N2O) 0.000028 % 0.000032 %
THE GREENHOUSE EFFECT

THE GREENHOUSE GAS INCREASES ARE DUE TO US

THE GREENHOUSE GAS INCREASES ARE DUE TO US

Gton CCumulative fossil fuel emissions (Jan. 2008) 340 ± 25
(source: CDIAC) Observed atmospheric increase (Jan. 2008) 217 ± 8
(source: ESRL)
WE CAUSED IT: DECADAL MASS BALANCE OF CARBON

GtCCumulative fossil fuel emissions (Jan. 2008) 340 ± 25
(source: CDIAC) Observed atmospheric increase (Jan. 2008) 217 ± 8
(source: ESRL) Observed ocean increase through 1994 118 ± 19
(Sabine et al., Science 2004)
oceans, extrapolated through 2007 151
WE CAUSED IT: DECADAL MASS BALANCE OF CARBON
fossil fuel emissions + terrestrial sources = atmospheric increase + ocean increase

Conclusions:
The observed increase in atmospheric carbon dioxidesince pre-industrial times is entirely due to human activities. The measured increases in the atmosphereand oceans add up approximately to the cumulative fossil fuel emissions.
The relative contribution of NET changes in terrestrial biomass and organic matter has dwindled over timeand is now relatively small.
THE GREENHOUSE GAS INCREASES ARE DUE TO US

FURTHER EVIDENCE: ISOTOPIC RATIO SIGNATURES
Use isotopic ratios to distinguish different sources of carbon.
In the atmosphere we have 12CO2 13CO2 14CO2

13C/12Csample – 13C/12Creference 14C/Csample
13C/12Creference 14C/Creference
δ13C 13C/12C ratio δ14C (approximate) (approximate)
Atmosphere -8 ‰ 0.011147 1.06
From oceans -8 ‰ 0.011147 1.08
Terrestrial biosphere -26 ‰ 0.010945 1.10
Coal -24 ‰ 0.010967 0
Oil -28 ‰ 0.010923 0
Natural gas -45 ‰ 0.010732 0
FURTHER EVIDENCE: ISOTOPIC RATIO SIGNATURES
δ13C ≡
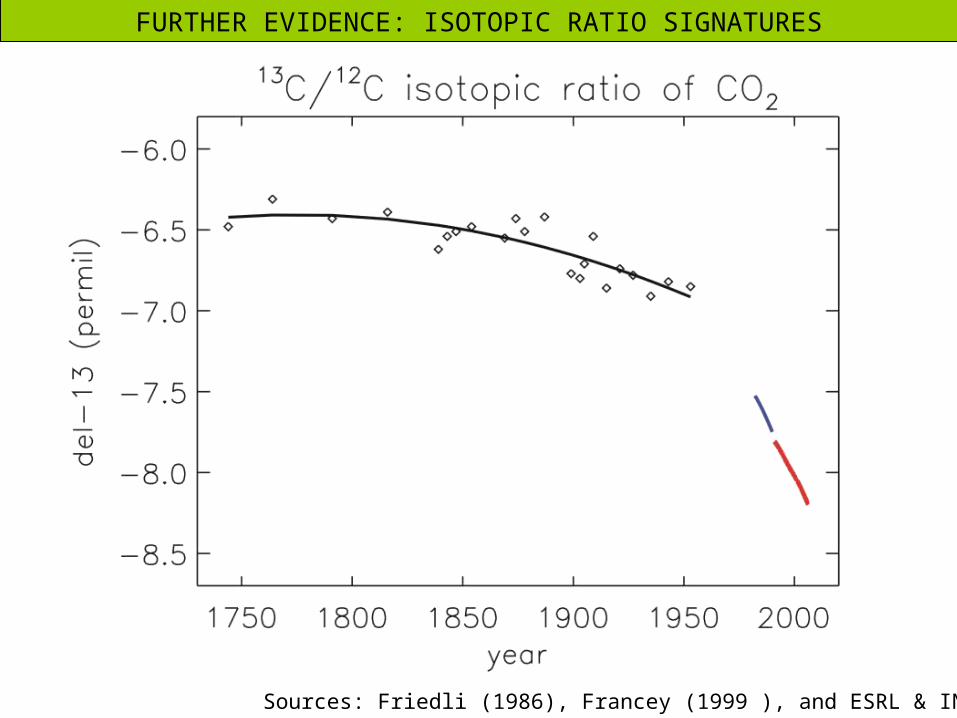
Sources: Friedli (1986), Francey (1999 ), and ESRL & INSTAAR
FURTHER EVIDENCE: ISOTOPIC RATIO SIGNATURES

FURTHER EVIDENCE: ISOTOPIC RATIO SIGNATURES
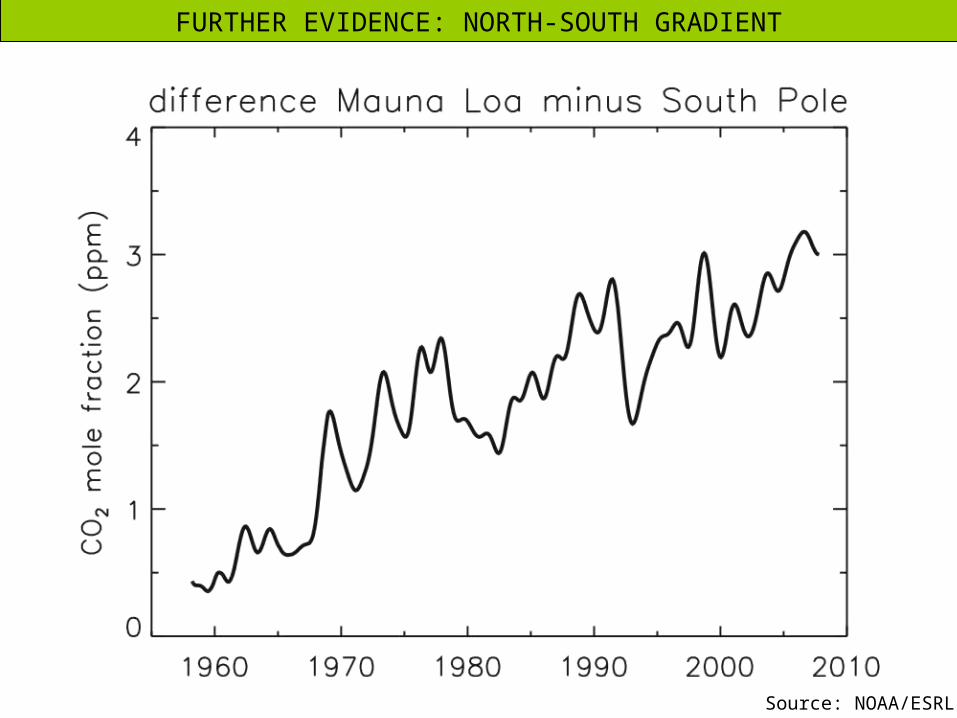
FURTHER EVIDENCE: NORTH-SOUTH GRADIENT
Source: NOAA/ESRL

Conclusions:
The evidence from 13C and 14C demonstrates that the atmospheric increase is caused by organic material,or something derived from organic material, and thatthe source is very old, 50,000 years or more.
Furthermore, the source is concentrated in the northernhemisphere, and has increased roughly in proportion to the global rate of consumption of fossil fuels.
THE GREENHOUSE GAS INCREASES ARE DUE TO US

WE CANNOT AFFORD TO WAIT

Potential feedback effect: permafrostsoils in the Arctic store 500-900 Gton Cthat could be converted to CH4 and CO2 as the Arctic warms.
WE CANNOT AFFORD TO WAIT

WE CANNOT AFFORD TO WAIT
When the earth’s radiation balance is disturbed, the climate will be forced to change. “Climate sensitivity” is defined as the temperature change produced by a given amount of radiation change, like absorption by greenhouse gases.
Why is climate sensitivity so unpredictable?
Climate sensitivity (called “λ”) to greenhouse gas forcing alone, without any feedbacks, equals: λo = 1.2 K (2.2 deg F) per doubling of CO2
ΔF ΔT
FT o
λo
water vapor (f1)
snow & ice melt (f2)
CH4 & CO2 from permafrost melt (f3)
Ff
T o
1

WE CANNOT AFFORD TO WAIT
Alexander McDonald, adapted from Roe & Baker, Science 2007

WE CANNOT AFFORD TO WAIT
R. Feely et al., 2006
Ocean acidification and threat to coral reefs

WE KNOW HOW TO DECREASE OUR EMISSIONS
Source: CDIAC

WE KNOW HOW TO DECREASE OUR EMISSIONS
Nat
ure
, 20
08
Energy efficiency and conservation
Product labeling with estimates of embedded energy, carbon and water
Renewable energy sources
Electric cars? Fuel cell motors?
Carbon capture and sequestration
Biochar
Nuclear electric power


carbontracker.noaa.gov

Net ecosystem flux for North Americafor 2002: -0.17 Gton C
Net ecosystem flux for North Americafor 2005: -0.76 Gton C
carbontracker.noaa.gov


Data: NASA GISS

Glacier Bay, AK, in 1940 and in 2004
Record melting of Arctic sea ice in 2007
Mountain PineBeetle outbreaks
Photos: USGS
Photos: Forest Serviceof Canada
Picture: NASA

sea level rise
or 6 m ?1 m ?


Fossil fuel proved reserves and rate of use.
global United States reserves P R/P reserves P R/P
hard coal 311 2.62 119 83 0.40 208soft coal 135 0.47 287 47 0.19 247
oil 122 3.32 37 3.1 0.72* 4.3* natural gas 97 1.52 64 3.2 0.31* 10*
Proved reserves are the amount that can be recovered with existing availabletechnology under present and expected local economic conditions.

R = dQ/dt = k Q(1-Q/N)
N total resource
Q cumulative extractionR rate of extractionk initial rate of growth


Source: U.S. Energy Information Administration
Population(millions)
U.S.
China World
13001450
300365
6500
820020062030

Primary energy consumption per capita
Source of energy data: U.S. Energy Information Administration
20062030
U.S.
China
World
0.4% / yr
3.6 % / yr
1.3 % / yr
11,200 W12,300 W
1,340 W3,200 W
3,000 W2,300 W
Global energy demand is expected to grow 60% from 2006 to 2030.
If met by fossil fuels, atmospheric CO2 increase isexpected to accelerate from 2.0 to 3.2 ppm/yr