Embed Size (px)
Citation preview

American Journal of Plant Sciences, 2015, 6, 1126-1137 Published Online May 2015 in SciRes. http://www.scirp.org/journal/ajps http://dx.doi.org/10.4236/ajps.2015.68117
How to cite this paper: de Souza, M.E., Leonel, S., da Silva, A.C., de Souza, A.P., Martin, R.L. and Tanaka, A.A. (2015) Car-bohydrates, Growth and Production of “Roxo de Valinhos” Fig Tree in Initial Development under Irrigation Management. American Journal of Plant Sciences, 6, 1126-1137. http://dx.doi.org/10.4236/ajps.2015.68117
Carbohydrates, Growth and Production of “Roxo de Valinhos” Fig Tree in Initial Development under Irrigation Management Manoel Euzébio de Souza1, Sarita Leonel2, Andréa Carvalho da Silva3, Adilson Pacheco de Souza3, Rafaela Lopes Martin2, Adriana Aki Tanaka3 1Department of Agronomy, University of the Mato Grosso State, Nova Xavantina, Brazil 2Department of Plant Production, School of Agronomic Sciences, State University of Sao Paulo, Botucatu, Brazil 3Institute of Agricultural and Environmental Sciences, Federal University of Mato Grosso, Sinop, Brazil Email: [email protected], [email protected], [email protected], [email protected] Received 18 February 2015; accepted 9 May 2015; published 13 May 2015
Copyright © 2015 by authors and Scientific Research Publishing Inc. This work is licensed under the Creative Commons Attribution International License (CC BY). http://creativecommons.org/licenses/by/4.0/
Abstract The carbohydrates translocation and consequently growth and production of fig tree (Ficuscarica L.) vary according to the different management on cultivation conditions. The aim of this study was to evaluate the changes in the levels and total carbohydrates accumulation together with growth and “Roxo de Valinhos” fig trees production onimplementation of orchards in initial phase, cultivated with and without irrigation. We adopted a factorial arrangement (2 x 7) with four repe-titions distributed in installments (with and without irrigation) subdivided in time (collect time). Destructive analyzes were performed at 40, 80, 120, 160, 200, 240 and 280 days after pruning (DAP) and are measured: stem diameter and branch, stem length and branch, number of leaves, internodes and fruit. Subsequently, the plant parts were sectioned to obtain the leaf area, length and roots volume, fresh and dry matter weight. The number, weight and total productivity of fruits were evaluated. The media of all growth attributes and production characteristics were higher in treatments with water irrigation. The total carbohydrate content was higher at 120 and 160 DAP and the carbohydrates accumulation was increasing for most institutions over the plants devel-opment, except for the leaves that showed a decrease in the levels at 160 DAP. The fruits showed greater carbohydrates accumulation in relation to the other evaluated organs.
Keywords Ficus carica L., Water Management, Growth Analysis

M. E. de Souza et al.
1127
1. Introduction The fig tree culture in Brazil has presented a significant advancement in recent years, increasing at 45.72% in the produced volume, 116.16% and 404.03% on the amount in export value [1]. The main importing countries of the Brazilian figs are the Netherlands, France, Germany and England [2]. In commercial terms, the “Roxo de Valinhos” fig tree is the only variety grown in Brazil. This variety excels due to high economic value, hardiness, high vigor and productivity, good adaptation to drastic pruning and with fruits can be used for both fresh con-sumption and industry [3] [4].
In Brazilian conditions, according to the cultural techniques of the fig tree production, the annual pruning to canopy training and/or fruiting is carried out during the winter, followed by thinning of shoots in the autumn, setting so the number of branches in each plant per production cycle [5]. Subsequent to the drastic pruning starts an intense assimilates translocation to root system for the new branches and fruits formation, however, environ-mental changes and phenological characteristics provides variations on carbohydrates translocation dynamics to the different partitions of plant. Among the various climatic factors, the availability of air temperature and water promotes the greatest influences in carbohydrates levels on plant, and furthermore, can cause reductions in their growth by affecting the development and production [6] [7].
The carbohydrate storage by plant is critical to sustain development in stress periods, vegetative dormancy, emission and formation of branches and fruiting [8]. The metabolic interactions study involving the carbohy-drates interconversion provides an understanding of assimilates flow and consumption both in whole plants as in separate plant organs. The determination of carbohydrates availability in storage structures has great importance for planning the time of pruning, defoliation, breaking the dormancy control, vegetative growth, fertilization management and production [9].
Together with the evaluation of carbohydrates, dynamics is necessary to relate it with the fig tree growth cha-racteristics. According to Larcher [7] and Benincasa [10], the growth analysis is expressed to morphophysiolog-ical conditions of plants and then quantifies at production derived from the photosynthetic process, that is, which is the result of assimilatory system performance. Thus, each stage of development and plant growth is strongly limited by the environment through edaphic and climatic factors, plus the cultural techniques that can have ma-jor effects on survival and plants productivity [11].
Given that most research on the carbohydrates flow in fruit only restricts the seedlings stage and/or isolated parts of adult plants are fundamental studies that report the dynamics of carbohydrates and growth characteris-tics during a cycle full of perennial crops, mainly for the different scenarios of Brazilian fruit production. Therefore, this study aimed to evaluate the changes in the levels and total carbohydrates accumulation in differ-ent phenological stages (plant partitions) of “Roxo de Valinhos” fig tree with and without irrigation, at soil and weather conditions of Botucatu, São Paulo State, Brazil.
2. Material e Methods The research was conducted at Fruit Cultivation Experimental Sector (Orchard) of the Department of Horticul-ture, Faculty of Agricultural Sciences (FCA), São Paulo State University (UNESP), Botucatu, Brazil. The local geographic coordinates are 22˚52'47"S, 48˚25'12"W and altitude of 810 m above sea level. The predominant climate type on region, based on the Köppen Classification System is CFa, characterized as warm temperate (mesothermal) with rainfall in summer and dryin winter; precipitation and annual temperature of 1530 mm and 21˚C, respectively [12]. The soil in this area was classified as Red Nitossol [13], whose the results of soil chem-ical analysis on the initial experimentare presented in Table 1.
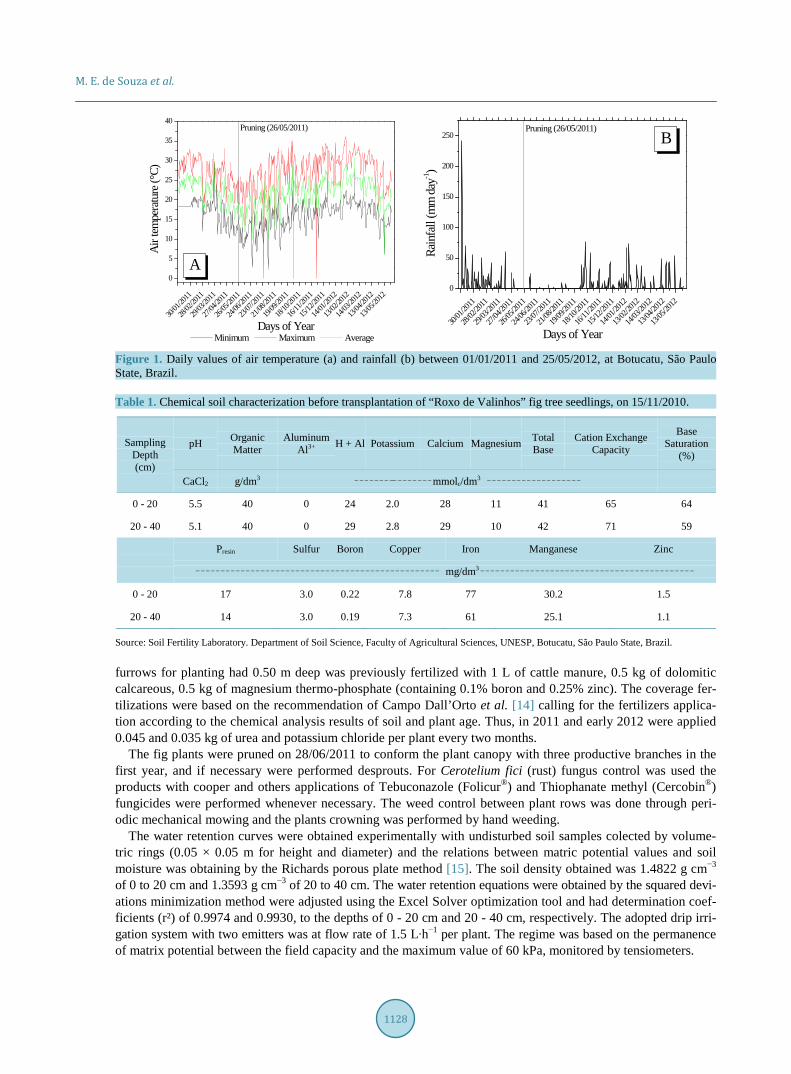
During the experimental period, the rainfall variation and average, minimum and maximum air temperature in data daily were monitored by the Weather Station of Natural Resources Department in the Faculty of Agricul-tural Sciences, UNESP, as shown in Figure 1. The monthly average air temperatures ranged from 16.40 (June) and 24.63˚C (January) for the year 2011. I n 2011 the rainfall was 1984 mm, with 37.61% accumulated only in January, however, between May and September of 2011 were registered only 98.2 mm, thus indicating the im-portance of irrigation in the regional context.
The seedlings transplanting of “Roxo de Valinhos” fig tree was conducted in December 2010 when the seedl-ings had heithg of 0.30 m. The seedlings were obtained with the Coordination of Integral Technical Assistance (CATI)-unit of Botucatu-SP, and in general, the propagating cuttings are from certified producers of the center of origin at Valinhos-SP. We adopted a spacing of 2.5 m between planting rows and 2.5 m between plants. The
M. E. de Souza et al.
1128
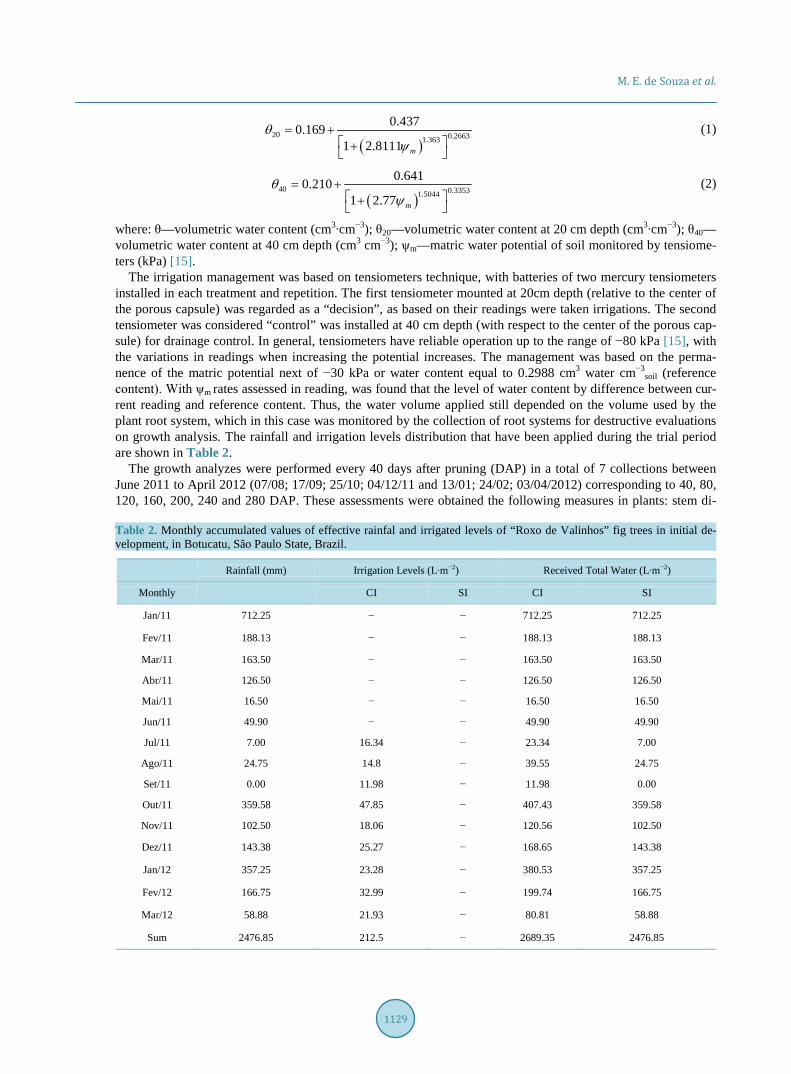
Figure 1. Daily values of air temperature (a) and rainfall (b) between 01/01/2011 and 25/05/2012, at Botucatu, São Paulo State, Brazil. Table 1. Chemical soil characterization before transplantation of “Roxo de Valinhos” fig tree seedlings, on 15/11/2010.
Sampling Depth (cm)
pH Organic Matter
Aluminum Al3+ H + Al Potassium Calcium Magnesium Total
Base Cation Exchange
Capacity
Base Saturation
(%)
CaCl2 g/dm3 _ _ _ _ _ _ _ __ _ _ _ _ _ _ _ mmolc/dm3 _ _ _ _ _ _ _ _ _ _ _ _ _ _ _ _ _ _ _
0 - 20 5.5 40 0 24 2.0 28 11 41 65 64
20 - 40 5.1 40 0 29 2.8 29 10 42 71 59
Presin Sulfur Boron Copper Iron Manganese Zinc
_ _ _ _ _ _ _ _ _ _ _ _ _ _ _ _ _ _ _ _ _ _ _ _ _ _ _ _ _ _ _ _ _ _ _ _ _ _ _ _ _ _ _ _ _ _ _ _ _ mg/dm3 _ _ _ _ _ _ _ _ _ _ _ _ _ _ _ _ _ _ _ _ _ _ _ _ _ _ _ _ _ _ _ _ _ _ _ _ _ _ _ _ _ _ _
0 - 20 17 3.0 0.22 7.8 77 30.2 1.5
20 - 40 14 3.0 0.19 7.3 61 25.1 1.1
Source: Soil Fertility Laboratory. Department of Soil Science, Faculty of Agricultural Sciences, UNESP, Botucatu, São Paulo State, Brazil. furrows for planting had 0.50 m deep was previously fertilized with 1 L of cattle manure, 0.5 kg of dolomitic calcareous, 0.5 kg of magnesium thermo-phosphate (containing 0.1% boron and 0.25% zinc). The coverage fer-tilizations were based on the recommendation of Campo Dall’Orto et al. [14] calling for the fertilizers applica-tion according to the chemical analysis results of soil and plant age. Thus, in 2011 and early 2012 were applied 0.045 and 0.035 kg of urea and potassium chloride per plant every two months.
The fig plants were pruned on 28/06/2011 to conform the plant canopy with three productive branches in the first year, and if necessary were performed desprouts. For Cerotelium fici (rust) fungus control was used the products with cooper and others applications of Tebuconazole (Folicur®) and Thiophanate methyl (Cercobin®) fungicides were performed whenever necessary. The weed control between plant rows was done through peri- odic mechanical mowing and the plants crowning was performed by hand weeding.
The water retention curves were obtained experimentally with undisturbed soil samples colected by volume-tric rings (0.05 × 0.05 m for height and diameter) and the relations between matric potential values and soil moisture was obtaining by the Richards porous plate method [15]. The soil density obtained was 1.4822 g cm−3
of 0 to 20 cm and 1.3593 g cm−3 of 20 to 40 cm. The water retention equations were obtained by the squared devi- ations minimization method were adjusted using the Excel Solver optimization tool and had determination coef- ficients (r²) of 0.9974 and 0.9930, to the depths of 0 - 20 cm and 20 - 40 cm, respectively. The adopted drip irri- gation system with two emitters was at flow rate of 1.5 L∙h−1 per plant. The regime was based on the permanence of matrix potential between the field capacity and the maximum value of 60 kPa, monitored by tensiometers.
30/01/
2011
28/02/
2011
29/03/
2011
27/04/
2011
26/05/
2011
24/06/
2011
23/07/
2011
21/08/
2011
19/09/
2011
18/10/
2011
16/11/
2011
15/12/
2011
14/01/
2012
13/02/
2012
14/03/
2012
13/04/
2012
13/05/
2012
0
5
10
15
20
25
30
35
40Pruning (26/05/2011)
A
Air t
empe
ratu
re (°
C)
Days of Year Minimum Maximum Average
30/01/
2011
28/02/
2011
29/03/
2011
27/04/
2011
26/05/
2011
24/06/
2011
23/07/
2011
21/08/
2011
19/09/
2011
18/10/
2011
16/11/
2011
15/12/
2011
14/01/
2012
13/02/
2012
14/03/
2012
13/04/
2012
13/05/
2012
0
50
100
150
200
250Pruning (26/05/2011)
B
Rain
fall
(mm
day
-1)
Days of Year
M. E. de Souza et al.
1129
( )20 0.26631.363
0.4370.1691 2.8111 m
θψ
= + +
(1)
( )40 0.33531.5044
0.6410.2101 2.77 m
θψ
= + +
(2)
where: θ—volumetric water content (cm3∙cm−3); θ20—volumetric water content at 20 cm depth (cm3∙cm−3); θ40— volumetric water content at 40 cm depth (cm3 cm−3); ψm—matric water potential of soil monitored by tensiome-ters (kPa) [15].
The irrigation management was based on tensiometers technique, with batteries of two mercury tensiometers installed in each treatment and repetition. The first tensiometer mounted at 20cm depth (relative to the center of the porous capsule) was regarded as a “decision”, as based on their readings were taken irrigations. The second tensiometer was considered “control” was installed at 40 cm depth (with respect to the center of the porous cap-sule) for drainage control. In general, tensiometers have reliable operation up to the range of −80 kPa [15], with the variations in readings when increasing the potential increases. The management was based on the perma-nence of the matric potential next of −30 kPa or water content equal to 0.2988 cm3 water cm−3
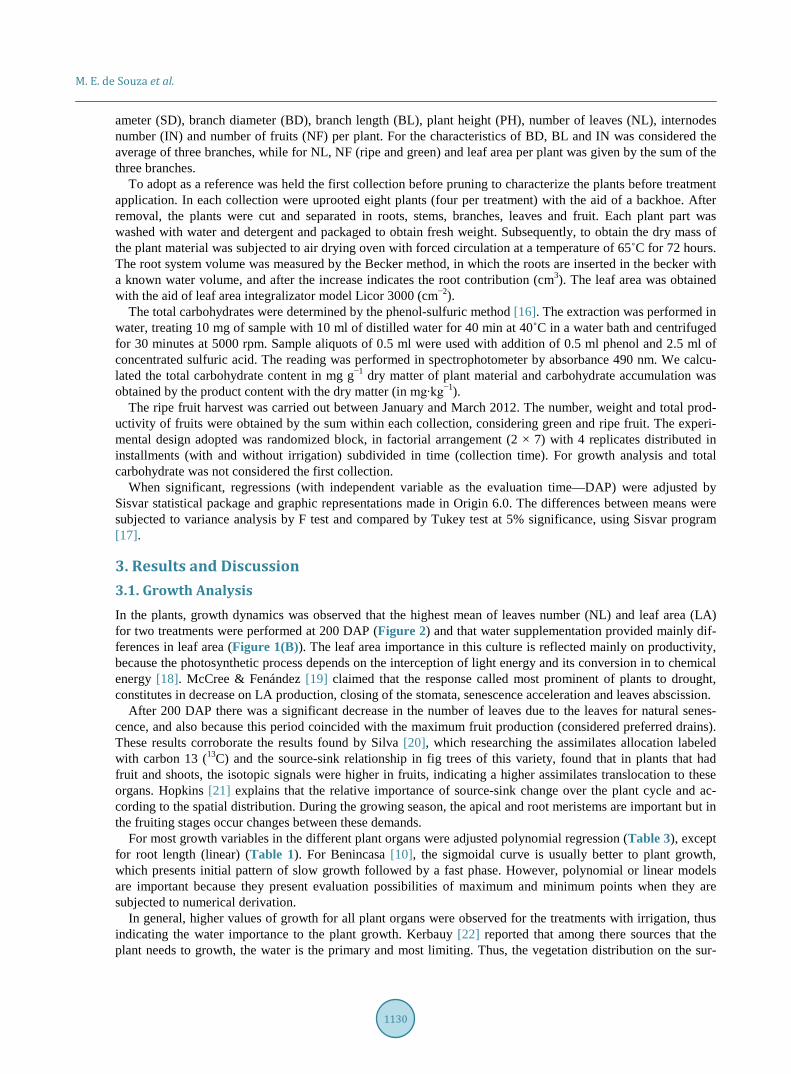
soil (reference content). With ψm rates assessed in reading, was found that the level of water content by difference between cur-rent reading and reference content. Thus, the water volume applied still depended on the volume used by the plant root system, which in this case was monitored by the collection of root systems for destructive evaluations on growth analysis. The rainfall and irrigation levels distribution that have been applied during the trial period are shown in Table 2.
The growth analyzes were performed every 40 days after pruning (DAP) in a total of 7 collections between June 2011 to April 2012 (07/08; 17/09; 25/10; 04/12/11 and 13/01; 24/02; 03/04/2012) corresponding to 40, 80, 120, 160, 200, 240 and 280 DAP. These assessments were obtained the following measures in plants: stem di- Table 2. Monthly accumulated values of effective rainfal and irrigated levels of “Roxo de Valinhos” fig trees in initial de-velopment, in Botucatu, São Paulo State, Brazil.
Rainfall (mm) Irrigation Levels (L∙m−2) Received Total Water (L∙m−2)
Monthly CI SI CI SI
Jan/11 712.25 − − 712.25 712.25
Fev/11 188.13 − − 188.13 188.13
Mar/11 163.50 − − 163.50 163.50
Abr/11 126.50 − − 126.50 126.50
Mai/11 16.50 − − 16.50 16.50
Jun/11 49.90 − − 49.90 49.90
Jul/11 7.00 16.34 − 23.34 7.00
Ago/11 24.75 14.8 − 39.55 24.75
Set/11 0.00 11.98 − 11.98 0.00
Out/11 359.58 47.85 − 407.43 359.58
Nov/11 102.50 18.06 − 120.56 102.50
Dez/11 143.38 25.27 − 168.65 143.38
Jan/12 357.25 23.28 − 380.53 357.25
Fev/12 166.75 32.99 − 199.74 166.75
Mar/12 58.88 21.93 − 80.81 58.88
Sum 2476.85 212.5 − 2689.35 2476.85
M. E. de Souza et al.
1130
ameter (SD), branch diameter (BD), branch length (BL), plant height (PH), number of leaves (NL), internodes number (IN) and number of fruits (NF) per plant. For the characteristics of BD, BL and IN was considered the average of three branches, while for NL, NF (ripe and green) and leaf area per plant was given by the sum of the three branches.
To adopt as a reference was held the first collection before pruning to characterize the plants before treatment application. In each collection were uprooted eight plants (four per treatment) with the aid of a backhoe. After removal, the plants were cut and separated in roots, stems, branches, leaves and fruit. Each plant part was washed with water and detergent and packaged to obtain fresh weight. Subsequently, to obtain the dry mass of the plant material was subjected to air drying oven with forced circulation at a temperature of 65˚C for 72 hours. The root system volume was measured by the Becker method, in which the roots are inserted in the becker with a known water volume, and after the increase indicates the root contribution (cm3). The leaf area was obtained with the aid of leaf area integralizator model Licor 3000 (cm−2).
The total carbohydrates were determined by the phenol-sulfuric method [16]. The extraction was performed in water, treating 10 mg of sample with 10 ml of distilled water for 40 min at 40˚C in a water bath and centrifuged for 30 minutes at 5000 rpm. Sample aliquots of 0.5 ml were used with addition of 0.5 ml phenol and 2.5 ml of concentrated sulfuric acid. The reading was performed in spectrophotometer by absorbance 490 nm. We calcu-lated the total carbohydrate content in mg g−1 dry matter of plant material and carbohydrate accumulation was obtained by the product content with the dry matter (in mg∙kg−1).
The ripe fruit harvest was carried out between January and March 2012. The number, weight and total prod-uctivity of fruits were obtained by the sum within each collection, considering green and ripe fruit. The experi-mental design adopted was randomized block, in factorial arrangement (2 × 7) with 4 replicates distributed in installments (with and without irrigation) subdivided in time (collection time). For growth analysis and total carbohydrate was not considered the first collection.
When significant, regressions (with independent variable as the evaluation time—DAP) were adjusted by Sisvar statistical package and graphic representations made in Origin 6.0. The differences between means were subjected to variance analysis by F test and compared by Tukey test at 5% significance, using Sisvar program [17].
3. Results and Discussion 3.1. Growth Analysis In the plants, growth dynamics was observed that the highest mean of leaves number (NL) and leaf area (LA) for two treatments were performed at 200 DAP (Figure 2) and that water supplementation provided mainly dif-ferences in leaf area (Figure 1(B)). The leaf area importance in this culture is reflected mainly on productivity, because the photosynthetic process depends on the interception of light energy and its conversion in to chemical energy [18]. McCree & Fenández [19] claimed that the response called most prominent of plants to drought, constitutes in decrease on LA production, closing of the stomata, senescence acceleration and leaves abscission.
After 200 DAP there was a significant decrease in the number of leaves due to the leaves for natural senes-cence, and also because this period coincided with the maximum fruit production (considered preferred drains). These results corroborate the results found by Silva [20], which researching the assimilates allocation labeled with carbon 13 (13C) and the source-sink relationship in fig trees of this variety, found that in plants that had fruit and shoots, the isotopic signals were higher in fruits, indicating a higher assimilates translocation to these organs. Hopkins [21] explains that the relative importance of source-sink change over the plant cycle and ac-cording to the spatial distribution. During the growing season, the apical and root meristems are important but in the fruiting stages occur changes between these demands.
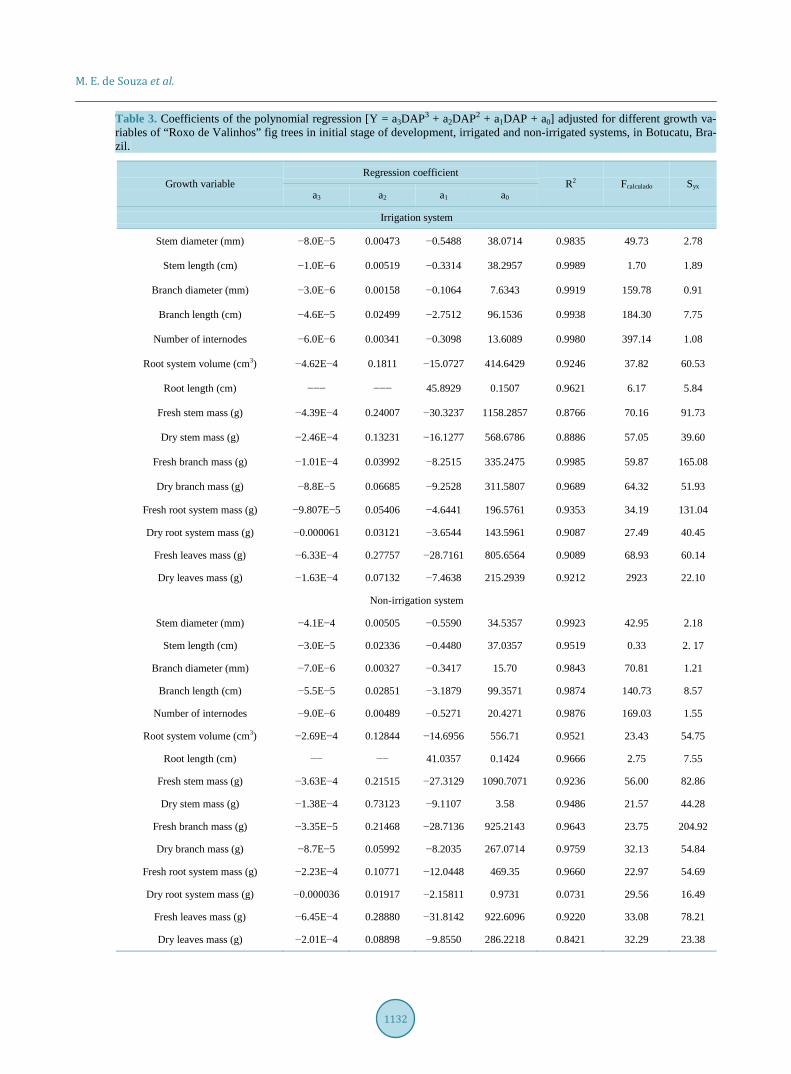
For most growth variables in the different plant organs were adjusted polynomial regression (Table 3), except for root length (linear) (Table 1). For Benincasa [10], the sigmoidal curve is usually better to plant growth, which presents initial pattern of slow growth followed by a fast phase. However, polynomial or linear models are important because they present evaluation possibilities of maximum and minimum points when they are subjected to numerical derivation.
In general, higher values of growth for all plant organs were observed for the treatments with irrigation, thus indicating the water importance to the plant growth. Kerbauy [22] reported that among there sources that the plant needs to growth, the water is the primary and most limiting. Thus, the vegetation distribution on the sur-

M. E. de Souza et al.
1131
Figure 2. Regressions of number of leaves and leaf areaof “Roxo de Valinhos” fig tree grown inirrigated (I) and non-irri- gated (NI) system in Botucatu, São Paulo State, Brazil, 2013. face as to agricultural productivity is mainly controlled by the water availability.
The diameter, length, fresh weight and dry matter of the stem were moderately higher in treatments with wa-ter irrigation. The increase in branch diameter is due to the vascular activity, which is strongly influenced by factors such as photoperiod, rainfall and availability of physical space [23]. These results differ from those found by Silva [24] for the Roxo de Valinhos fig tree grown in the presence or absence of mulch and irrigated and non-irrigated systems, as the initial stage of development was not observed differences on stem diameter between plants irrigated and non-irrigated.
The growth attributes evaluated for the branch (length, diameter, number of internodes, fresh weight and dry matter) showed maximum values at 270 DAP. The irrigated system resulted in higher means when compared with the non-irrigated systems because of the constant water supply throughout the plants cycle. Benincasa [10] reports that one of the essential water roles is to maintain turgor, which is essential for cell growth and elonga-tion. Taiz & Zeiger [18] confirmed this information when reporting that the largest component of the plant cell growth is governed by expanding turgor pressure, which is controlled by the water.
The root system had linear response for the length, both the irrigation system and the non-irrigated system. On the other hand, the volume, fresh weight and dry matter of roots was adjusted by polynomial model, reaching maximum values at 240 DAP. The highest rates were observed for the treatments with water irrigation, mainly for the volume root had maximum values of (935 cm3) in relation (679.5 cm3) non-irrigated plants. This result shows that the water availability favors the root volume increase.
In Botucatu-SP, Silva [11] evaluating the explored volume and the depth reached by the root system of fig Roxo de Valinhos subjected to treatments with the presence or absence of mulch (sugarcane bagasse) and the supply or no supplemental irrigation, found that in treatments with irrigation, the root system reached greated depths and explored greater volume of soil.
In general, the maximum growth values for the roots, branches, stems and leaves coincided with the highest daily average of temperature and rainfall (January, February and March) (Figure 1). This reinforces the idea that the plant expresses the greatest potential for growth when is in ideal conditions of temperature and water availa-bility.
3.2. Evaluation of Production Figure 3 shows the fig tree “Roxo de Valinhos” irrigated. The harvest for the two cultivation systems occurred in the samples 5, 6, 7 and 8, which correspond to 160, 200, 240 and 280 DAP, respectively (Table 4). The av-erage number of fruits, production and productivity were lower in non-irrigated system to 160 DAP, due to low rainfall occurred in the months before fruiting have promoted delay in fruit formation. This also highlights the irrigation importance to the antecipation of the production plant cycle. There was no difference between the
0 30 60 90 120 150 180 210 240 270 300 330
0
20
40
60
80
100
A
SI - LA = -0.0118 DAP3 +5.1590 DAP2 -5.2816 DAP +14453.3596 R2 = 0.9171 Fcalc =77.83 Syx = 1053.28
CI - LA = -0.0125 DAP3 +5.2894 DAP2 -511.5162 DAP +13856.1186 R2 = 0.8745 Fcalc = 72.69 Syx = 1185.53
SI - NL = -2.8E-5 DAP3 +0.0107 DAP2 -0.7509 DAP +24.3571 R2 = 0.9067 Fcalc = 77.30 Syx = 3.07
CI - NL = -2.5E-5DAP3 +0.0089 DAP2 -0.4929 DAP +19.0714 R2 = 0.8835 Fcalc = 64.89 Syx = 3.34
With Irrigation Without Irrigation
Num
ber o
f Lea
ves -
NL
Days after Pruning (DAP)0 30 60 90 120 150 180 210 240 270 300 330
0
5000
10000
15000
20000
25000
30000
35000
B With Irrigation Without Irrigation
Leaf
Are
a - L
A (
cm2 )
Days after Pruning (DAP)
M. E. de Souza et al.
1132
Table 3. Coefficients of the polynomial regression [Y = a3DAP3 + a2DAP2 + a1DAP + a0] adjusted for different growth va-riables of “Roxo de Valinhos” fig trees in initial stage of development, irrigated and non-irrigated systems, in Botucatu, Bra-zil.
Growth variable Regression coefficient
R2 Fcalculado Syx a3 a2 a1 a0
Irrigation system
Stem diameter (mm) −8.0E−5 0.00473 −0.5488 38.0714 0.9835 49.73 2.78
Stem length (cm) −1.0E−6 0.00519 −0.3314 38.2957 0.9989 1.70 1.89
Branch diameter (mm) −3.0E−6 0.00158 −0.1064 7.6343 0.9919 159.78 0.91
Branch length (cm) −4.6E−5 0.02499 −2.7512 96.1536 0.9938 184.30 7.75
Number of internodes −6.0E−6 0.00341 −0.3098 13.6089 0.9980 397.14 1.08
Root system volume (cm3) −4.62E−4 0.1811 −15.0727 414.6429 0.9246 37.82 60.53
Root length (cm) −−− −−− 45.8929 0.1507 0.9621 6.17 5.84
Fresh stem mass (g) −4.39E−4 0.24007 −30.3237 1158.2857 0.8766 70.16 91.73
Dry stem mass (g) −2.46E−4 0.13231 −16.1277 568.6786 0.8886 57.05 39.60
Fresh branch mass (g) −1.01E−4 0.03992 −8.2515 335.2475 0.9985 59.87 165.08
Dry branch mass (g) −8.8E−5 0.06685 −9.2528 311.5807 0.9689 64.32 51.93
Fresh root system mass (g) −9.807E−5 0.05406 −4.6441 196.5761 0.9353 34.19 131.04
Dry root system mass (g) −0.000061 0.03121 −3.6544 143.5961 0.9087 27.49 40.45
Fresh leaves mass (g) −6.33E−4 0.27757 −28.7161 805.6564 0.9089 68.93 60.14
Dry leaves mass (g) −1.63E−4 0.07132 −7.4638 215.2939 0.9212 2923 22.10
Non-irrigation system
Stem diameter (mm) −4.1E−4 0.00505 −0.5590 34.5357 0.9923 42.95 2.18
Stem length (cm) −3.0E−5 0.02336 −0.4480 37.0357 0.9519 0.33 2. 17
Branch diameter (mm) −7.0E−6 0.00327 −0.3417 15.70 0.9843 70.81 1.21
Branch length (cm) −5.5E−5 0.02851 −3.1879 99.3571 0.9874 140.73 8.57
Number of internodes −9.0E−6 0.00489 −0.5271 20.4271 0.9876 169.03 1.55
Root system volume (cm3) −2.69E−4 0.12844 −14.6956 556.71 0.9521 23.43 54.75
Root length (cm) −− −− 41.0357 0.1424 0.9666 2.75 7.55
Fresh stem mass (g) −3.63E−4 0.21515 −27.3129 1090.7071 0.9236 56.00 82.86
Dry stem mass (g) −1.38E−4 0.73123 −9.1107 3.58 0.9486 21.57 44.28
Fresh branch mass (g) −3.35E−5 0.21468 −28.7136 925.2143 0.9643 23.75 204.92
Dry branch mass (g) −8.7E−5 0.05992 −8.2035 267.0714 0.9759 32.13 54.84
Fresh root system mass (g) −2.23E−4 0.10771 −12.0448 469.35 0.9660 22.97 54.69
Dry root system mass (g) −0.000036 0.01917 −2.15811 0.9731 0.0731 29.56 16.49
Fresh leaves mass (g) −6.45E−4 0.28880 −31.8142 922.6096 0.9220 33.08 78.21
Dry leaves mass (g) −2.01E−4 0.08898 −9.8550 286.2218 0.8421 32.29 23.38

M. E. de Souza et al.
1133
Table 4. Number of fruits, total production and productivity of Roxo de Valinhos fig tree in the early stage of development, under irrigation and non-irrigation system, in Botucatu-SP, Brazil, 2013.
Systems of Management 160 DAP 200 DAP 240 DAP 280 DAP
Fruit Number
Irrigated 24.00 A 45.25 A 52.25 A 51.25 A
Non-Irrigated 0.50 B 44.00A 51.50 A 53.25 A
CV% 7.45 24.87 34.57 25.88
Fruit Weight (g)
Irrigated 120.30 A 539.25 A 1.655.00 A 2.104.50 A
Non-Irrigated 4.87 B 534.75 A 909.75 B 1.522.00 B
CV% 12.11 26.47 28.60 41.39
Productivity (kg ha−1)
Irrigated 192.50 A 863.25 A 2.648.25 A 3.367.50 A
Non-Irrigated 7.75 B 855.50 A 1.455.25 B 2.435.50 B
CV% 12.24 26.50 28.62 21.38
Means followed by uppercase letters in the column do not differ by Tukey test t 5% probability.
Figure 3. Pictures of “Roxo de Valinhos” plants employed in the research, in Botucatu, São Paulo State, Brazil, 2013.

M. E. de Souza et al.
1134
systems to 200 DAP in any production variables assessed, however, after 240 DAP the average fruit weight and plants productivity subjected to water supplementation were higher.
Addressing the irrigation influence on the yield characteristics of Roxo de Valinhos fig tree, Silva [24] found that fig plants in the early development stages (first production cycle) treated with irrigation showed an increase of 350 kg∙ha−1 in total productivity when compared with trees that non-irrigated. Also in this sense, Leonel & Damatto Junior [25] evaluated the effect of cattle manure doses in nutrition on Roxo de Valinhos fig production under irrigation, found that after four years of cultivation, the fig trees showed a productivity of 6.3t ha−1, higher than that found in this work.
3.3. Accumulation and Levels of Total Carbohydrates The total carbohydrates levels to each plant organ were present in Table 5. It had no significant difference to carbohydrates levels among irrigation systems in most of all collection dates and evaluated organs, except for the branch partition, where there was a higher concentration in the irrigation system, at 120 DAP. In simple terms, the carbohydrates levels present in plant reserves bodies before pruning and treatments (with and without irrigation) were enough to keep the plants metabolic activities that did not receive water irrigation. These results corroborate with Cruz [26], which did not detect differences in starch content in acid lime “Tahiti” treated with different doses of paclobutrazol in irrigated plants and plants subjected to water stress.
All organs were detected higher levels of total carbohydrates at 120 and 160 DAP, regardless of the water re-gime (Table 5). This increase may be due to high air temperature observed during the same period (September and October 2011) (Figure 1(A)), and also by the fact that the plants were in full vegetative growth in the two water management systems. Temperature is one of the climatic elements which is directly connected with the carbohydrates mobilization present in woody plant organs [27]. Rodrigues [28] elucidate that the temperature is Table 5. Total carbohydrates level on dry matter mass (mg∙g−1) in roots, stems, branches, leaves and fruits of Roxo de Valinhos fig plants under irrigated and non irrigated system in Botucatu-SP, 2013.
40 80 120 160 200 240 280
Roots
I 41.33 Ab 78.00 Aab 86.67 Aa 89.00 Aa 68.33 Aab 41.30 Ab 59.67 Aab
NI 52.67 Ab 98.67 Aa 70.67 Aab 77.00 Aab 63.67 Aab 53.67 Ab 67.00 Aab
Stems
I 51.66 Abc 47.00 abc 74.67 Aab 80.33 Aa 36.67 Ac 29.33 Ac 42.67 Ac
NI 53.33 Aabc 57.67 Aab 78.33 Aa 63.33 Aab 38.67 Abc 27.00 Ac 47.33 Abc
Branches
I 61.33 Aab 81.00 Aab 96.33 Aa 62.66 Aabc 54.33 Abc 32.67 Ac 48.00 Abc
NI 73.67 Aa 93.00 Aa 63.33 Bab 82.33 Aa 64.67 Aab 29.67 Ab 64.33 Aab
Leaves
I 61.33 Ac 81.00 Aabc 111.0 Aab 108.33 Aab 120.33 Aa 73.00 Abc 69.00 Abc
NI 73.67 Aab 93.00 Aab 101.33 Aab 93.33 Aab 115.00 Aa 62.67 Ab 68.33 Ab
Fruits
I *nd Nd Nd 124.00 Ab 281.33 Aab 323.33 Aa 280.33 Aab
NI Nd Nd Nd 11.00 Bb 290.33 Aa 325.33 Aa 271.00 Aab
Means followed by lowercase in line and uppercase letters in the column do not differ by Tukey test t 5% probability. *nd: not determined.
M. E. de Souza et al.
1135
an important factor on adaptation of temperate climate fruits plants. Larcher [7] also reports that the intensity of mobilization of carbohydrates influences the branch growth, flowering and fruit production.
The results of this study are in agreement with those found by Corsato [29], which evaluated the carbohy-drates variation in the root and branch persimmon variety Rama Fort, observed higher total soluble carbohy-drates in roots and branches in the months of September and October (spring) due to the air temperature in-crease.
Rodrigues et al. [28], studying the changes in starch and soluble sugars in two pear cultivars gems from Feb-ruary to September, found higher levels of total soluble sugars in September. The authors explain that the ele-vated total sugars levels occurred during this period due to starch degradation process of soluble carbohydrates (sorbitol, sucrose, glucose and fructose) which have been translocated from bud basis for developing floral structure.
It is worth emphasizing that for the two water regimes, most of the evaluated plant organs showed increasing trend for the total carbohydrate content up to 160 DAP, showing intense carbohydrates partition to the organs growing. However, the fruit was noted that the increase on total carbohydrates increased up to 240 DAP, and the body more carbohydrate accumulated in this period, indicating a possible translocation of these reserves in ma-ture leaves (sources) for fruit (drains). This can be confirmed when analyzing the carbohydrates levels in leaves, which decreases while the increase in the fruit content. The mature leaves are photosynthetically active, and the carbohydrate production of these plant organs is greater than the need for maintenance and growth [30]. There-fore, the surplus is translocated to the organs with little or no photosynthetic activity, as young leaves, branches, buds, flowers and fruits.
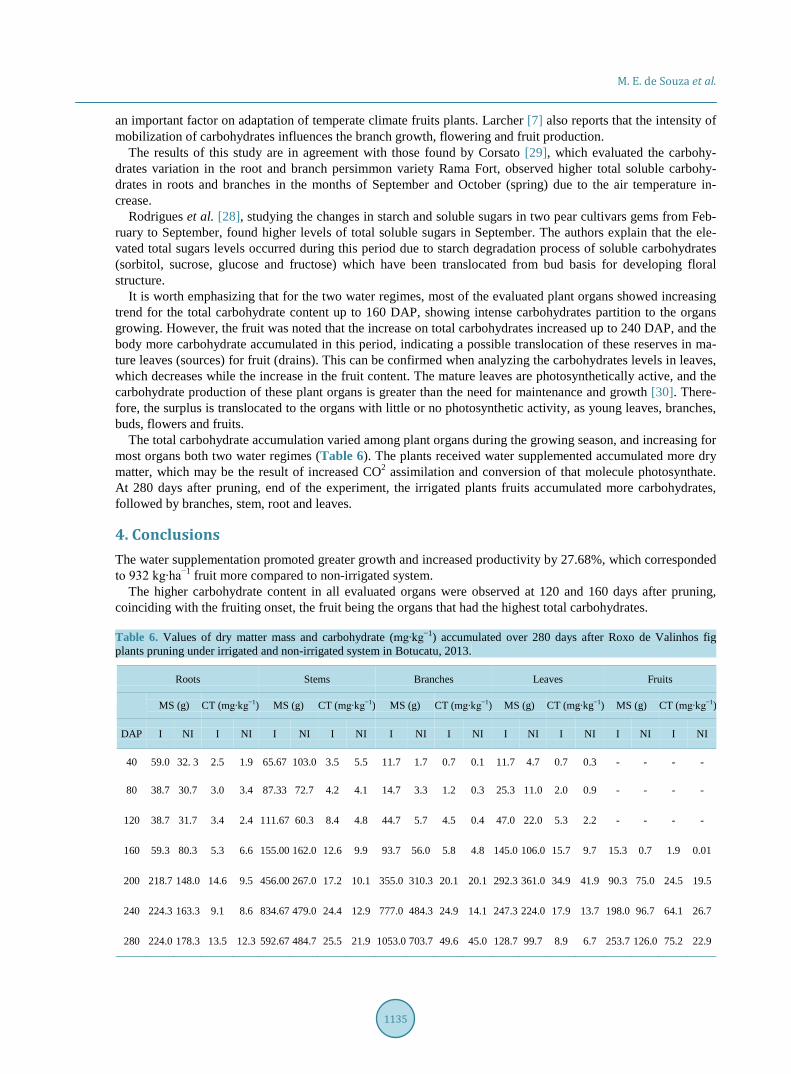
The total carbohydrate accumulation varied among plant organs during the growing season, and increasing for most organs both two water regimes (Table 6). The plants received water supplemented accumulated more dry matter, which may be the result of increased CO2 assimilation and conversion of that molecule photosynthate. At 280 days after pruning, end of the experiment, the irrigated plants fruits accumulated more carbohydrates, followed by branches, stem, root and leaves.
4. Conclusions The water supplementation promoted greater growth and increased productivity by 27.68%, which corresponded to 932 kg∙ha−1 fruit more compared to non-irrigated system.
The higher carbohydrate content in all evaluated organs were observed at 120 and 160 days after pruning, coinciding with the fruiting onset, the fruit being the organs that had the highest total carbohydrates. Table 6. Values of dry matter mass and carbohydrate (mg∙kg−1) accumulated over 280 days after Roxo de Valinhos fig plants pruning under irrigated and non-irrigated system in Botucatu, 2013.
Roots Stems Branches Leaves Fruits
MS (g) CT (mg∙kg−1) MS (g) CT (mg∙kg−1) MS (g) CT (mg∙kg−1) MS (g) CT (mg∙kg−1) MS (g) CT (mg∙kg−1)
DAP I NI I NI I NI I NI I NI I NI I NI I NI I NI I NI
40 59.0 32. 3 2.5 1.9 65.67 103.0 3.5 5.5 11.7 1.7 0.7 0.1 11.7 4.7 0.7 0.3 - - - -
80 38.7 30.7 3.0 3.4 87.33 72.7 4.2 4.1 14.7 3.3 1.2 0.3 25.3 11.0 2.0 0.9 - - - -
120 38.7 31.7 3.4 2.4 111.67 60.3 8.4 4.8 44.7 5.7 4.5 0.4 47.0 22.0 5.3 2.2 - - - -
160 59.3 80.3 5.3 6.6 155.00 162.0 12.6 9.9 93.7 56.0 5.8 4.8 145.0 106.0 15.7 9.7 15.3 0.7 1.9 0.01
200 218.7 148.0 14.6 9.5 456.00 267.0 17.2 10.1 355.0 310.3 20.1 20.1 292.3 361.0 34.9 41.9 90.3 75.0 24.5 19.5
240 224.3 163.3 9.1 8.6 834.67 479.0 24.4 12.9 777.0 484.3 24.9 14.1 247.3 224.0 17.9 13.7 198.0 96.7 64.1 26.7
280 224.0 178.3 13.5 12.3 592.67 484.7 25.5 21.9 1053.0 703.7 49.6 45.0 128.7 99.7 8.9 6.7 253.7 126.0 75.2 22.9

M. E. de Souza et al.
1136
The total carbohydrates accumulation at 280 days after pruning was higher in the fruits under irrigation sys-tem presenting 75.20 mg∙kg−1.
References [1] Fachinello, J.C., Nachtigal, J.C. and Kersten, E. (1996) Fruit Growing: Fundamentals and Practice. Editora Univer-
sitária, Universidade Federal de Pelotas, Pelotas, 31. [2] FAO.FAOSTAT (2011) Production-Crops. http://faostat.fao.org/site/567/DesktopDefault. aspx?PageID=567#ancor [3] Maiorano, J.A., Antunes, L.E.C., Regina, M.A., Abrahão, E. and Pereira, A.F. (1997) Botany and Characterization of
Fig Cultivars. Informe Agropecuário, 18, 22-24. [4] Penteado, S.R. (1999) The Fig Tree Cultivation in Brazil and in the World. In: Corrêa, L.S. and Boliani, A.C., Eds.,
Fig Culture-from Planting to Marketing, FAPESP, Ilha Solteira, 1-16. [5] Silva, A.C. (2011) Growth, Productivity and Allocation of the Fig Tree Reserves Indifferent Conditions. Thesis (PhD
in Agronomy/Horticulture), Faculty of Agricultural Sciences, State University of São Paulo, Botucatu, 126f. [6] Gupta, U.C. (2001) Micronutrients and Toxic Elements in Plants and Animals. In: Ferreira, M.E., Pessôa, M.C., Raij,
B.V. and Abreu, C.A.A., Eds., Micronutrients and Toxic Elements in Agriculture, POTAFOS, CNPq, FAPESP, Jabo-ticabal, 13-41.
[7] Larcher, W. (2000) Plant Ecophysiology. Rima, São Carlos, 531. [8] Borba, M.R.C., ScarpareFilho, J.A. and Kluge, R.A. (2005) Levels of Carbohydrates in Peaches Submitted to Different
Intensity of Green Pruning in Tropical Climate. Revista Brasileira de Fruticultura, Jaboticabal, 27, 68-72. http://dx.doi.org/10.1590/S0100-29452005000100019
[9] Gonçalves, B.H.L. (2014) Carbohydrate Content in Peach Grown in Subtropical. Thesis (PhD in Agronomy/Horticul- ture). Faculty of Agricultural Sciences, State University of São Paulo, Botucatu, 70f.
[10] Benincasa, M.M.P. (2003) Plant Growth Analysis: Basic Knowledge. 2nd Edition, Funep, Jaboticabal, 41 p. [11] Flore, J.A. (1994) Stone Fruit. In: Schaffer, B. and Andersen, P.C., Eds., Handbook of Environmental Physiology of
Fruit Crops, CRC Press, Boca Raton, 467. [12] Cunha, A.R., et al. (1999) Climate Classificationfor the City of Botucatu, SP, According to Köppen. In: FEPAF, Sim-
pósio em Energia na Agricultura, 1999, Botucatu, SP. Anais... Faculdade de Ciências Agronômicas, Botucatu, 490- 491.
[13] EMBRAPA, Centro Nacional de Pesquisa de Solos (2006) Brazilian System of Soil Classification. 2nd Edition, EMBRAPA SOLOS, Rio de Janeiro, 306.
[14] Campo-Dall’Orto, F.A., et al. (1996) Temperate Fruits: II. Fig, Apple, Quince, Pearand Peachorchard System. In: Van Raij, B., et al., Eds., Recommendations Fertilization and Liming to the State of Sao Paulo, 2nd Edition, Instituto Agro- nômico, Fundação, Instituto Agronômico de Campinas, Campinas, 139-140.
[15] Klar, A.E. (1988) The Water in the System Soil-Plant-Atmosphere. 2nd Edition, Nobel, São Paulo. [16] Dubois, M., Gilles, K.A., Hamilton, J.K., Rebers, P.A. and Smith, F. (1956) Colorimetric Method for Determination of
Sugars and Related Substances. Analytical Chemistry, 28, 350-356. http://dx.doi.org/10.1021/ac60111a017 [17] Pimentel Gomes, F. (2009) Experimental Statistics Course. 15th Edition, Fealq, Piracicaba, 451. [18] Taiz, L. and Zeiger, E. (2004) Plant Physiology. Artmed, Porto Alegre, 719. [19] McCree, K.J. and Fernández, C.J. (1989) Simulation Model for Studying Physiological Water Stress Responses of
Whole Plants. Crop Science, 29, 353-360. http://dx.doi.org/10.2135/cropsci1989.0011183X002900020025x [20] Silva, A.C., Souza, A.P., Ducatti, C. and Leonel, S. (2011) Carbon-13 Turnover in Fig Trees “Roxo de Valinhos”. Re-
vista Brasileira de Fruticultura, 33, 660-665. [21] Hopkins, W.G. (1995) Introduction to Plant Physiology. John Wiley e Sons, New York, 464. [22] Kerbauy, G.B. (2004) Plant Physiology. Guanabara Koogan S.A, Rio de Janeiro, 452. [23] Lojan, L. (1968) Tendências del crecimiento radial de 23 especies forestales del trópico. Turrialba, 18, 275-281. [24] Silva, A.C., Leonel, S., Souza, A.P., Souza, M.E. and Tanaka, A.A. (2011) Fig Tree Growth under Different Crop Con-
ditions. Pesquisa Agropecuária Tropical, 41, 539-551. [25] Leonel, S. and Damatto Junior, E.R. (2008) Effects of Coat Manure in the Soil Fertility, Plants Nutrition and Yield of
Fig Orchards. Revista Brasileira de Fruticultura, 30, 534-539. http://dx.doi.org/10.1590/S0100-29452008000200046
[26] Cruz, M.C.M., Siqueira, D.L., Salomão, L.C.C., Cecon, P.R. and Santos, D. (2007) Levels of Carbohydrates in Acid

M. E. de Souza et al.
1137
Lime Tree “Tahiti” Treated with Paclobutrazol. Revista Brasileira de Fruticultura, 29, 42-47. [27] Herter, F.G., Veríssimo, V., Camelatto, D., Gardin, J.P. and Trevisan, R. (2011) Flower Bud Abortion of Pear in Brazil.
In: Seminário de Fruticultura de Clima Temperado no Brasil, Anais, Florianópolis, 106-114. [28] Rodrigues, A.C., Herter, F.G., Veríssimo, V., Campos, A.D., Leite, G.B. and Silva, J.B. (2006) Balance of Carbohy-
drates in Flower Bud of Two Pear Tree Genotypes under Mild Winter Conditions. Revista Brasileira de Fruticultura, 28, 1-4. http://dx.doi.org/10.1590/S0100-29452006000100003
[29] Corsato, C.E., Scarpare Filho, J.A. and Junquiera de Sales, E.C. (2008) Carbohydrate Content in Persimmon Tree Woody Organs in Tropical Climate. Revista Brasileira de Fruticultura, 30, 414-418. http://dx.doi.org/10.1590/S0100-29452008000200025
[30] Dantas, B.F., Ribeiro, L.S. and Pereira, M.S. (2007) Soluble and Insoluble Sugars Content in cv. Syrah Grapevine Leaves in Different Positions of the Branch and Seasons. Revista Brasileira de Fruticultura, 29, 42-47.