Embed Size (px)
Citation preview
mmmll
Final Report Bruegel FISMA/2016/032/B1/ST/OP
Analysis of developments in EU capital flows in the global
context
Taking the perspective of the Capital Markets Union
Grégory Claeys, Maria Demertzis, Konstantinos Efstathiou, Inês Gonçalves Raposo, Pia Hüttl,
Alexander Lehmann
November 2017

European Commission - Analysis of developments in EU capital flows in the global context
November 2017 2
European Commission - Analysis of developments in EU capital flows in the global context
November 2017 3
DISCLAIMER The information and views set out in this study are those of the authors and do not necessarily reflect the official opinion of the European Commission. The European Commission does not guarantee the accuracy of the data included in this study. Neither the European Commission nor any person acting on the European Commission’s behalf may be held responsible for the use which may be made of the information contained therein.
doi: 10.2874/047340 ISBN 978-92-79-66502-8 © European Union, (2017)1.
Reproduction is authorised provided the source is acknowledged2.
1 Check IPRs. 2 Please check, in each case at hand, if the IP pre-existing rights are owned by the European Commission.
European Commission - Analysis of developments in EU capital flows in the global context
November 2017 4
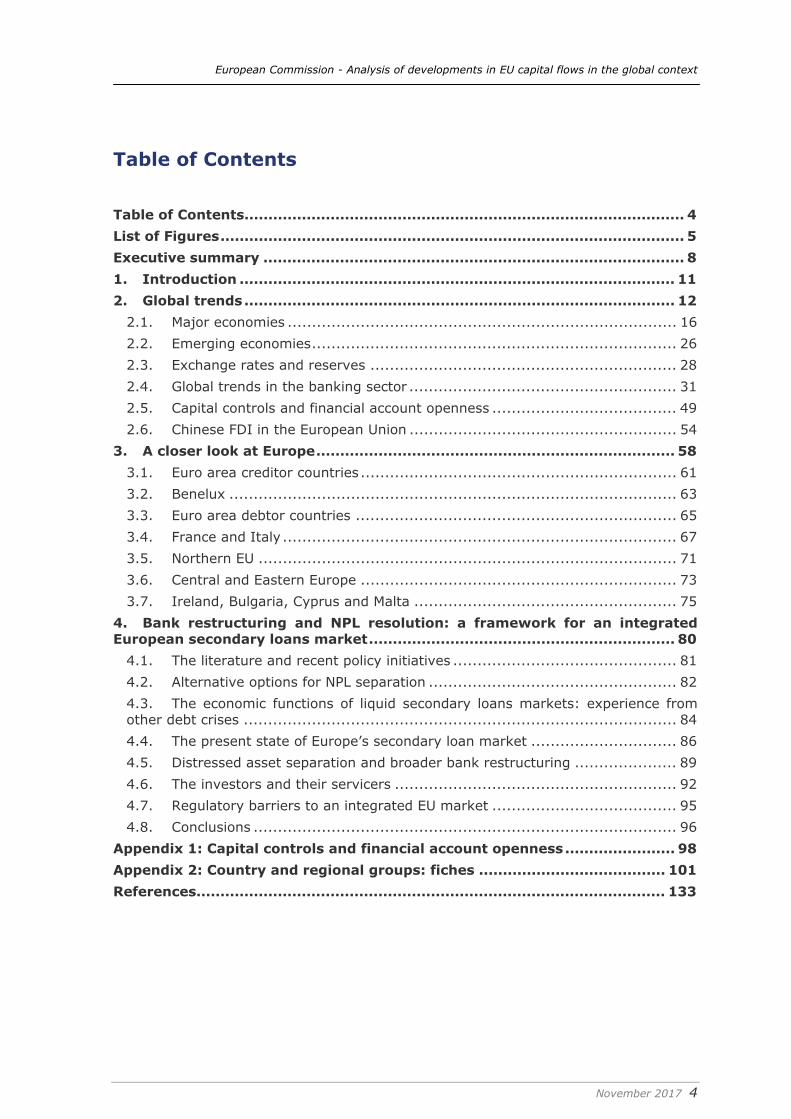
Table of Contents Table of Contents ............................................................................................ 4 List of Figures ................................................................................................. 5 Executive summary ........................................................................................ 8 1. Introduction ........................................................................................... 11 2. Global trends .......................................................................................... 12
2.1. Major economies ................................................................................ 16 2.2. Emerging economies ........................................................................... 26 2.3. Exchange rates and reserves ............................................................... 28 2.4. Global trends in the banking sector ....................................................... 31 2.5. Capital controls and financial account openness ...................................... 49 2.6. Chinese FDI in the European Union ....................................................... 54
3. A closer look at Europe ........................................................................... 58 3.1. Euro area creditor countries ................................................................. 61 3.2. Benelux ............................................................................................ 63 3.3. Euro area debtor countries .................................................................. 65 3.4. France and Italy ................................................................................. 67 3.5. Northern EU ...................................................................................... 71 3.6. Central and Eastern Europe ................................................................. 73 3.7. Ireland, Bulgaria, Cyprus and Malta ...................................................... 75
4. Bank restructuring and NPL resolution: a framework for an integrated European secondary loans market ................................................................ 80
4.1. The literature and recent policy initiatives .............................................. 81 4.2. Alternative options for NPL separation ................................................... 82 4.3. The economic functions of liquid secondary loans markets: experience from other debt crises ......................................................................................... 84 4.4. The present state of Europe’s secondary loan market .............................. 86 4.5. Distressed asset separation and broader bank restructuring ..................... 89 4.6. The investors and their servicers .......................................................... 92 4.7. Regulatory barriers to an integrated EU market ...................................... 95 4.8. Conclusions ....................................................................................... 96
Appendix 1: Capital controls and financial account openness ....................... 98 Appendix 2: Country and regional groups: fiches ....................................... 101 References.................................................................................................. 133
European Commission - Analysis of developments in EU capital flows in the global context
November 2017 5
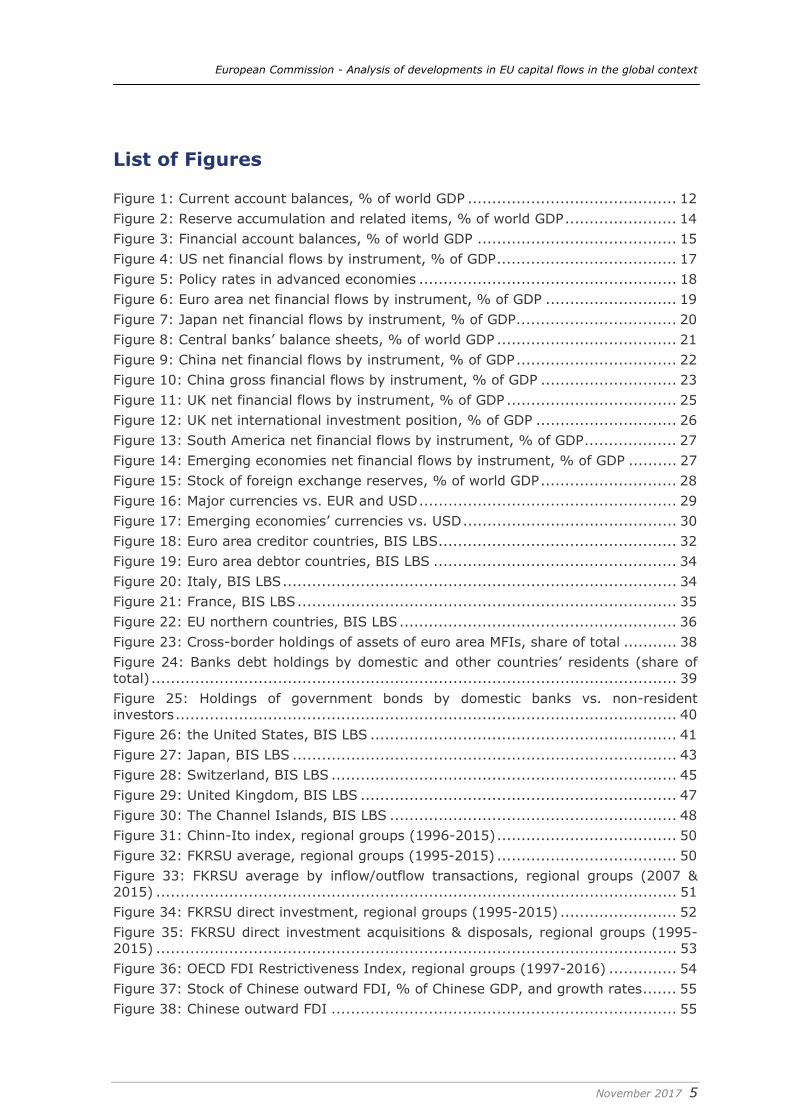
List of Figures Figure 1: Current account balances, % of world GDP ........................................... 12 Figure 2: Reserve accumulation and related items, % of world GDP ....................... 14 Figure 3: Financial account balances, % of world GDP ......................................... 15 Figure 4: US net financial flows by instrument, % of GDP ..................................... 17 Figure 5: Policy rates in advanced economies ..................................................... 18 Figure 6: Euro area net financial flows by instrument, % of GDP ........................... 19 Figure 7: Japan net financial flows by instrument, % of GDP ................................. 20 Figure 8: Central banks’ balance sheets, % of world GDP ..................................... 21 Figure 9: China net financial flows by instrument, % of GDP ................................. 22 Figure 10: China gross financial flows by instrument, % of GDP ............................ 23 Figure 11: UK net financial flows by instrument, % of GDP ................................... 25 Figure 12: UK net international investment position, % of GDP ............................. 26 Figure 13: South America net financial flows by instrument, % of GDP ................... 27 Figure 14: Emerging economies net financial flows by instrument, % of GDP .......... 27 Figure 15: Stock of foreign exchange reserves, % of world GDP ............................ 28 Figure 16: Major currencies vs. EUR and USD ..................................................... 29 Figure 17: Emerging economies’ currencies vs. USD ............................................ 30 Figure 18: Euro area creditor countries, BIS LBS ................................................. 32 Figure 19: Euro area debtor countries, BIS LBS .................................................. 34 Figure 20: Italy, BIS LBS ................................................................................. 34 Figure 21: France, BIS LBS .............................................................................. 35 Figure 22: EU northern countries, BIS LBS ......................................................... 36 Figure 23: Cross-border holdings of assets of euro area MFIs, share of total ........... 38 Figure 24: Banks debt holdings by domestic and other countries’ residents (share of total) ............................................................................................................ 39 Figure 25: Holdings of government bonds by domestic banks vs. non-resident investors ....................................................................................................... 40 Figure 26: the United States, BIS LBS ............................................................... 41 Figure 27: Japan, BIS LBS ............................................................................... 43 Figure 28: Switzerland, BIS LBS ....................................................................... 45 Figure 29: United Kingdom, BIS LBS ................................................................. 47 Figure 30: The Channel Islands, BIS LBS ........................................................... 48 Figure 31: Chinn-Ito index, regional groups (1996-2015) ..................................... 50 Figure 32: FKRSU average, regional groups (1995-2015) ..................................... 50 Figure 33: FKRSU average by inflow/outflow transactions, regional groups (2007 & 2015) ........................................................................................................... 51 Figure 34: FKRSU direct investment, regional groups (1995-2015) ........................ 52 Figure 35: FKRSU direct investment acquisitions & disposals, regional groups (1995-2015) ........................................................................................................... 53 Figure 36: OECD FDI Restrictiveness Index, regional groups (1997-2016) .............. 54 Figure 37: Stock of Chinese outward FDI, % of Chinese GDP, and growth rates ....... 55 Figure 38: Chinese outward FDI ....................................................................... 55
European Commission - Analysis of developments in EU capital flows in the global context
November 2017 6
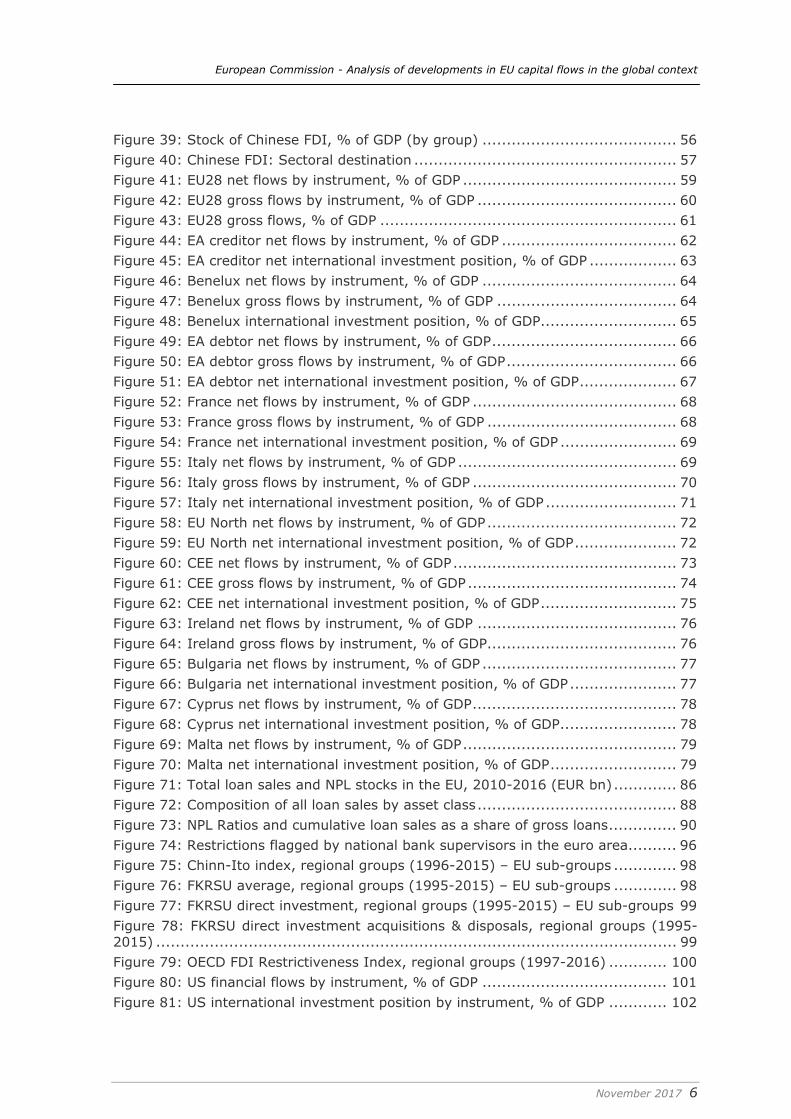
Figure 39: Stock of Chinese FDI, % of GDP (by group) ........................................ 56 Figure 40: Chinese FDI: Sectoral destination ...................................................... 57 Figure 41: EU28 net flows by instrument, % of GDP ............................................ 59 Figure 42: EU28 gross flows by instrument, % of GDP ......................................... 60 Figure 43: EU28 gross flows, % of GDP ............................................................. 61 Figure 44: EA creditor net flows by instrument, % of GDP .................................... 62 Figure 45: EA creditor net international investment position, % of GDP .................. 63 Figure 46: Benelux net flows by instrument, % of GDP ........................................ 64 Figure 47: Benelux gross flows by instrument, % of GDP ..................................... 64 Figure 48: Benelux international investment position, % of GDP ............................ 65 Figure 49: EA debtor net flows by instrument, % of GDP ...................................... 66 Figure 50: EA debtor gross flows by instrument, % of GDP ................................... 66 Figure 51: EA debtor net international investment position, % of GDP .................... 67 Figure 52: France net flows by instrument, % of GDP .......................................... 68 Figure 53: France gross flows by instrument, % of GDP ....................................... 68 Figure 54: France net international investment position, % of GDP ........................ 69 Figure 55: Italy net flows by instrument, % of GDP ............................................. 69 Figure 56: Italy gross flows by instrument, % of GDP .......................................... 70 Figure 57: Italy net international investment position, % of GDP ........................... 71 Figure 58: EU North net flows by instrument, % of GDP ....................................... 72 Figure 59: EU North net international investment position, % of GDP ..................... 72 Figure 60: CEE net flows by instrument, % of GDP .............................................. 73 Figure 61: CEE gross flows by instrument, % of GDP ........................................... 74 Figure 62: CEE net international investment position, % of GDP ............................ 75 Figure 63: Ireland net flows by instrument, % of GDP ......................................... 76 Figure 64: Ireland gross flows by instrument, % of GDP....................................... 76 Figure 65: Bulgaria net flows by instrument, % of GDP ........................................ 77 Figure 66: Bulgaria net international investment position, % of GDP ...................... 77 Figure 67: Cyprus net flows by instrument, % of GDP .......................................... 78 Figure 68: Cyprus net international investment position, % of GDP ........................ 78 Figure 69: Malta net flows by instrument, % of GDP ............................................ 79 Figure 70: Malta net international investment position, % of GDP .......................... 79 Figure 71: Total loan sales and NPL stocks in the EU, 2010-2016 (EUR bn) ............. 86 Figure 72: Composition of all loan sales by asset class ......................................... 88 Figure 73: NPL Ratios and cumulative loan sales as a share of gross loans .............. 90 Figure 74: Restrictions flagged by national bank supervisors in the euro area .......... 96 Figure 75: Chinn-Ito index, regional groups (1996-2015) – EU sub-groups ............. 98 Figure 76: FKRSU average, regional groups (1995-2015) – EU sub-groups ............. 98 Figure 77: FKRSU direct investment, regional groups (1995-2015) – EU sub-groups 99 Figure 78: FKRSU direct investment acquisitions & disposals, regional groups (1995-2015) ........................................................................................................... 99 Figure 79: OECD FDI Restrictiveness Index, regional groups (1997-2016) ............ 100 Figure 80: US financial flows by instrument, % of GDP ...................................... 101 Figure 81: US international investment position by instrument, % of GDP ............ 102
European Commission - Analysis of developments in EU capital flows in the global context
November 2017 7
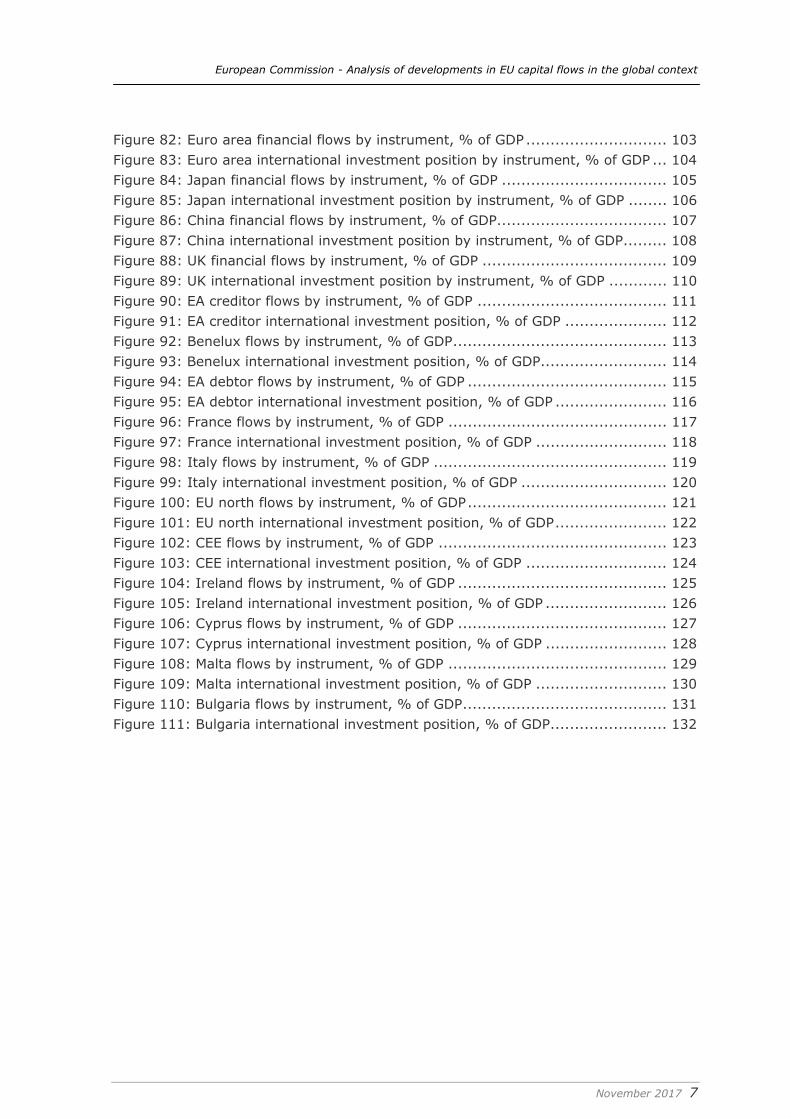
Figure 82: Euro area financial flows by instrument, % of GDP ............................. 103 Figure 83: Euro area international investment position by instrument, % of GDP ... 104 Figure 84: Japan financial flows by instrument, % of GDP .................................. 105 Figure 85: Japan international investment position by instrument, % of GDP ........ 106 Figure 86: China financial flows by instrument, % of GDP................................... 107 Figure 87: China international investment position by instrument, % of GDP ......... 108 Figure 88: UK financial flows by instrument, % of GDP ...................................... 109 Figure 89: UK international investment position by instrument, % of GDP ............ 110 Figure 90: EA creditor flows by instrument, % of GDP ....................................... 111 Figure 91: EA creditor international investment position, % of GDP ..................... 112 Figure 92: Benelux flows by instrument, % of GDP ............................................ 113 Figure 93: Benelux international investment position, % of GDP .......................... 114 Figure 94: EA debtor flows by instrument, % of GDP ......................................... 115 Figure 95: EA debtor international investment position, % of GDP ....................... 116 Figure 96: France flows by instrument, % of GDP ............................................. 117 Figure 97: France international investment position, % of GDP ........................... 118 Figure 98: Italy flows by instrument, % of GDP ................................................ 119 Figure 99: Italy international investment position, % of GDP .............................. 120 Figure 100: EU north flows by instrument, % of GDP ......................................... 121 Figure 101: EU north international investment position, % of GDP ....................... 122 Figure 102: CEE flows by instrument, % of GDP ............................................... 123 Figure 103: CEE international investment position, % of GDP ............................. 124 Figure 104: Ireland flows by instrument, % of GDP ........................................... 125 Figure 105: Ireland international investment position, % of GDP ......................... 126 Figure 106: Cyprus flows by instrument, % of GDP ........................................... 127 Figure 107: Cyprus international investment position, % of GDP ......................... 128 Figure 108: Malta flows by instrument, % of GDP ............................................. 129 Figure 109: Malta international investment position, % of GDP ........................... 130 Figure 110: Bulgaria flows by instrument, % of GDP .......................................... 131 Figure 111: Bulgaria international investment position, % of GDP ........................ 132
European Commission - Analysis of developments in EU capital flows in the global context
November 2017 8
Executive summary
Since the crisis, there have been major changes in current account imbalances: whereas the global surplus was concentrated in China and oil exporters in the pre-crisis period, capital is today mainly exported from the euro area, Japan and a few other advanced economies. Moreover, although in the aftermath of the financial crisis imbalances shrank rapidly and then remained contained for a few years thereafter, since 2014 they are on the rise once again.
In absolute terms, the euro area is now the world’s largest exporter of capital. The euro area plus China and Japan – two countries that have consistently generated current account (CA) surpluses – now represent 75 percent of global net savings.
On the flip side, in the last two years, the US, together with the UK and some other advanced economies (Canada, Australia), have absorbed the vast majority of these savings. Inflows to emerging market economies, which attracted a high share of global surpluses up to 2012-13, have receded without resulting in major turbulence. Finally, since oil prices plummeted, oil-exporting economies have decreased their external supply of capital.
Firstly, this rotation of current account imbalances reflects in part differences in the paths of recovery and the corresponding policy responses in surplus and deficit economies. Between 2015 and November 2017, there were four rate hikes in the US on the back of the US recovery, while the UK saw its first rate hike since 2007. On the other hand, with the economic recovery of the euro area lagging that of the US, monetary policy in the euro area has become more accommodating. In particular, the introduction of the public sector asset purchase programme (PSPP) by the European Central Bank in early 2015 has had an impact on the overall capital flows in and out of the euro area. Monetary policy was also further eased in Japan during the same period.
Secondly, the transition in China from an investment-driven growth model to a consumption-based model also accounts for the change in the global picture. Crucially, China has moved from being a net receiver of foreign direct investment to becoming a net exporter. Moreover, in 2015-16, China made extensive use of its vast foreign-exchange reserves to mitigate strong outflows and prevent depreciation of the yuan (which could have damaging consequences in terms of financial stability in case of currency mismatches in its banking and corporate sectors). This significant reversal in the balance of China’s reserves has driven the trend of the overall reduction of the global stocks of foreign exchange reserves.
Thirdly, the current situation also reflects sustained low commodity prices, in particular oil prices. Accentuating the decline in reserves, oil-exporting countries are no longer generating excess savings that are recycled through international investment.
The concentration of imbalances in advanced economies has three main implications. First, global imbalances might be more sustainable than before because the advanced economies with CA deficits (mainly the US and the UK) can, in principle, finance their deficits more easily because their liabilities are mainly labelled in their own currencies, which are global reserve currencies. This was not the case when many emerging markets ran excessive CA deficits, which were generally financed in foreign currencies. Second, increased concentration and persisting deficits in a few economies could heighten the risk of protectionist responses. Third, the persistence of large excess imbalances in several advanced economies (where market forces are dominant and there are no foreign exchange interventions and/or foreign exchange reserve
European Commission - Analysis of developments in EU capital flows in the global context
November 2017 9
accumulation) suggests that global adjustment mechanisms such as exchange rates are not that effective in the short term.
Turning to stock positions, valuation effects arising from capital gains and exchange rate movements are making substantial contributions to the net international investment positions (NIIP), often exceeding those of the financial flows.
In particular, owing to sterling’s loss of value relative to major currencies in the aftermath of the UK’s Brexit referendum, the UK’s NIIP has markedly improved despite a high financial account deficit.
Global imbalances in stocks (i.e. net international investment positions) have also grown in recent years, again among advanced economies, with Japanese and euro-area creditors increasing their net asset positions at the expense of US liabilities.
In this year’s report, we compare countries in terms of their openness to capital flows using established indicators of financial restrictions. In recent years, emerging market economies have either reversed the advances achieved in capital account liberalisation, or progress has stalled. Foreign exchange rate movements, concerns about overheating of the domestic economy and potential spill-overs from monetary policy shifts in advanced economies have been the three main motives for the (re-) introduction and persistence of capital controls. This shift has been further amplified by the growing role of emerging economies in the global economy. Thus, there is a risk of inefficient international capital allocation in a growing share of the global economy.
In the banking sector, the process of down-sizing cross-border balance sheets has come to a halt with the exception of the euro area. In both euro-area creditor and debtor countries, cross-border positions are still shrinking. One exception is French banks, which have expanded exposures and funding from outside of Europe, in particular from the US and Japan. Among the largest economies, Japan is the only other major country where the banks have expanded their foreign exposures.
Coming back to cross-border capital flows in general, recent trends in the euro area have become entrenched. Euro area debtor economies, which in the aftermath of the crisis transitioned from recipients to providers of capital to the rest of the world, continue to experience small net capital outflows in net terms. In addition, inflows of foreign direct investment (FDI), as well as the corresponding positions, remain low. At the same time, euro area creditor countries continue to generate persistently high capital exports. As a result, their net international investment position has reached a historical maximum.
The countries of central and eastern Europe share many similarities with euro-area debtors: large net liability international positions and substantial capital inflows that dried up in the aftermath of the Great Financial Crisis. However, central and eastern European countries have seen a re-emergence of inflows in recent quarters, including in non-FDI flows. This has clashed to some extent with the objective of maintaining exchange rate stability with the euro, leading to an accumulation of reserves by central banks.
Turning the in-depth section of the report, in Europe’s emerging strategy to tackle the legacy of non-performing loans the market for distressed debt will need to play a more prominent role. This market could speed up NPL resolution, and offer capital relief to European banks, but also allow greater flexibility in banks’ balance sheet management, and efficiency in the workout of distressed loans.
All but two of the euro area countries describe their NPL markets as underdeveloped. Market demand is not directed at the bulk of unsecured assets
European Commission - Analysis of developments in EU capital flows in the global context
November 2017 10
among SMEs and other corporate borrowers, at smaller banks with their higher NPL ratios, or at exposures to larger enterprises that could benefit from comprehensive debt restructuring and additional finance. Turnover remains limited relative to the total stock of EUR 870 billion in non-performing loans, and the additional stock of EUR 1.1 trillion of so-called non-core banking assets which banks also seek to divest in this market.
Significant further supply may now come into the market as stricter supervisory guidelines are implemented, as improved national restructuring and insolvency regimes reassure potential investors, and as new accounting guidelines force higher provisioning levels.
The loan sale process potentially suffers from three market imperfections: (i) the high fixed costs related to individual markets, banks and loan portfolios discourage investor entry and lead to a concentration on the buyer side; (ii) information asymmetry leads to sellers selecting inferior portfolios and failure of the market to clear; (iii) externalities once the investor begins to restructure or foreclose on the borrower. These market imperfections manifest themselves in high valuation gaps, and the market failing to clear in certain asset types.
This study could not identify significant or widespread regulatory barriers to investors entering the distressed loan market. Licensing requirements still restrict transfers of title, and the ability of non-bank investors seeking to provide additional credit to companies undergoing restructuring appears to be restricted. The initiative of the EU Council to implement improved standards in banks’ loan documentation and greater liquidity through transaction platforms may lower transaction-specific fixed costs somewhat, and most investors interviewed for this study welcomed this.
As a significant share of Europe’s banking assets may move into the hands of little known investors, the benefits of relationship banking are lost, and the conduct of the loan servicers as the main interface with borrowers becomes more difficult to assess. It is in the interest of both the investor community as well as the banking sector that investor and servicer conduct be circumscribed clearly, though such rules will inevitably be specific to national markets.
European Commission - Analysis of developments in EU capital flows in the global context
November 2017 11
1. Introduction The aim of this report, like the three reports that preceded it, is to analyse capital movements in the European Union in a global context. The monitoring and analysis of capital movements is essential for policymakers, given that capital flows can have welfare implications. Free movement of capital can enhance welfare if it channels savings towards productive use, but in crisis times, reliance on capital flows can also be a source of vulnerability if those flows transmit shocks across borders and disrupt local financial systems, with far-reaching spillovers into the real economy. The first two sections are devoted to the monitoring of developments in international capital flows, cross-border financial positions and exchange rates. We do not repeat our reviews of the key theoretical aspects around capital flows from previous reports (Darvas et al, 2014; Darvas et al, 2015; Darvas et al, 2016), but start directly with an analysis of global capital flows. Section 2 presents trends from a global perspective, focusing on the large economies and groups of countries that are decisive for the overall picture. We combine up-to-date evidence from balance-of-payments statistics concerning transactions and stocks of financial assets with an analysis of policy developments and current events. Special attention is paid to potential repercussions from major recent political events, such as the UK’s Brexit referendum and the US presidential election, and to the effects of monetary policy in various jurisdictions. We also examine patterns in the banking sector. This year, we complement this section of the report with a comparison of countries in terms of their openness to capital flows. For this, we use established indicators of financial restrictions and focus on the evolution of Chinese FDI in the EU in recent years. Section 3 focuses on Europe. While we continue to focus on the euro area because of its unique characteristics, we also pay more attention to non-euro area EU countries. However, instead of reporting data for all 28 EU Member States, we combine countries into five groups (euro-area creditors, the Benelux countries, euro-area debtors, northern Europe, and central and eastern Europe) to facilitate the recognition of key tendencies across the EU. We also show data separately for France and Italy, which have specific characteristics that make them difficult to group with other countries. We analyse the different capital flow patterns and developments in international investment positions, including their compositions. Finally, section 4 presents the results of our in-depth analysis, which this year focuses on the resolution of non-performing loans (NPLs), in particular on the development of secondary markets for distressed assets in the EU. The main motive behind this study is the fact that the EU banking sector currently needs to address a €1 trillion stock of NPLs. This type of secondary market for loans is currently under-developed compared to the size of the NPL problem in Europe, and also compared to other jurisdictions. Developing a market for asset transfers is therefore essential to respond to this immediate priority of working out distressed loans. Such an initiative would also contribute to a broader re-balancing between banks and capital markets that is necessary in Europe (see for instance Claeys, 2016). The objective of the study is therefore to understand how this type of market works and how it can be developed in the EU.
European Commission - Analysis of developments in EU capital flows in the global context
November 2017 12
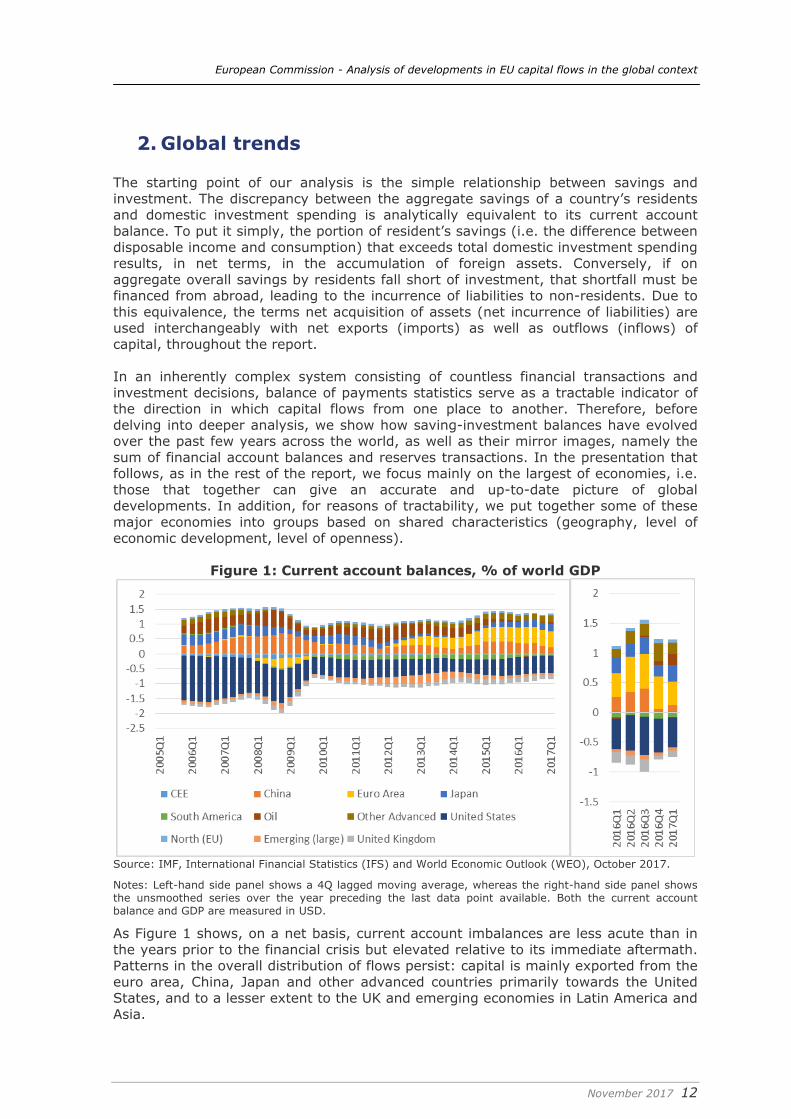
2. Global trends The starting point of our analysis is the simple relationship between savings and investment. The discrepancy between the aggregate savings of a country’s residents and domestic investment spending is analytically equivalent to its current account balance. To put it simply, the portion of resident’s savings (i.e. the difference between disposable income and consumption) that exceeds total domestic investment spending results, in net terms, in the accumulation of foreign assets. Conversely, if on aggregate overall savings by residents fall short of investment, that shortfall must be financed from abroad, leading to the incurrence of liabilities to non-residents. Due to this equivalence, the terms net acquisition of assets (net incurrence of liabilities) are used interchangeably with net exports (imports) as well as outflows (inflows) of capital, throughout the report. In an inherently complex system consisting of countless financial transactions and investment decisions, balance of payments statistics serve as a tractable indicator of the direction in which capital flows from one place to another. Therefore, before delving into deeper analysis, we show how saving-investment balances have evolved over the past few years across the world, as well as their mirror images, namely the sum of financial account balances and reserves transactions. In the presentation that follows, as in the rest of the report, we focus mainly on the largest of economies, i.e. those that together can give an accurate and up-to-date picture of global developments. In addition, for reasons of tractability, we put together some of these major economies into groups based on shared characteristics (geography, level of economic development, level of openness).
Figure 1: Current account balances, % of world GDP
Source: IMF, International Financial Statistics (IFS) and World Economic Outlook (WEO), October 2017.
Notes: Left-hand side panel shows a 4Q lagged moving average, whereas the right-hand side panel shows the unsmoothed series over the year preceding the last data point available. Both the current account balance and GDP are measured in USD.
As Figure 1 shows, on a net basis, current account imbalances are less acute than in the years prior to the financial crisis but elevated relative to its immediate aftermath. Patterns in the overall distribution of flows persist: capital is mainly exported from the euro area, China, Japan and other advanced countries primarily towards the United States, and to a lesser extent to the UK and emerging economies in Latin America and Asia.
European Commission - Analysis of developments in EU capital flows in the global context
November 2017 13
Box 1: Country groups To make the analysis tractable, we divide countries into groups based on common characteristics. Our choice of countries depends on their importance in terms of GDP (i.e. we concentrate on large economies), conditional on reporting their most recent quarters’ data. The baseline groups are the following ones: South America: Argentina, Bolivia, Brazil, Chile, Colombia, Ecuador, Uruguay Other emerging economies: India, Indonesia, Mexico, Philippines, South Africa, Thailand,
Turkey, Ukraine Central and Eastern Europe (CEE): Bulgaria, Czech Republic, Hungary, Poland, Romania Other advanced economies: Australia, Canada, Hong Kong, Iceland, Israel, New Zealand,
Singapore, South Korea, Switzerland EU north: Denmark, Sweden. Oil exporters: Norway, Russia, Saudi Arabia
Some changes to these categories are carried out for reasons of convenience in the banking section. Specifically, in our counterparty groups, we introduce an additional group called ‘tax havens’ consisting of those countries included in the OECD’s list of ‘Jurisdictions Committed to Improving Transparency and Establishing Effective Exchange of Information in Tax Matters’3. In that section only, we also group all counterparties not included in the EU, major economies (US and Japan) and other advanced countries (as shown above) into one group called ‘emerging economies’, with the exception of Norway that is inserted in advanced economies. Switzerland, on the other hand, is separated from other advanced economies and presented on its own. Finally, the EU groups of the banking section are the same as in the breakdown presented in sections 3 (i.e. CEE contains the Baltic countries, Slovakia and Slovenia).
There is also a rotation of imbalances towards advanced economies (as also noted by the IMF, 2017). Importantly, the euro area’s current account has switched from balanced or slightly positive to significantly positive, as the balance of saving and investment gave place to a significant increase in net outflows of capital to the rest of the world in recent years. In absolute terms, the euro area now is the largest exporter of capital. Together with China and Japan, two countries that have consistently been generating current account surpluses, these three economies represent 75% of global net savings, while oil-exporting economies decreased their external supply of capital since oil prices plummeted. On the flip side, in the last couple of years, the US, together with the UK (and Canada and Australia) have been absorbing the vast majority of these savings at the expense of emerging markets, which previously managed to attract a high share of global surpluses throughout 2012-13. This reflects: (i) asymmetries in recovery speed and the corresponding policy responses between surplus and deficit economies, (ii) the transition in China from an investment to a consumption-driven growth model and (iii) the sustained low commodity prices. Furthermore, the concentration of imbalances among advanced economies has three main implications: the first implication is that global imbalances might be more sustainable than before since the advanced economies with CA deficits (mainly the US and the UK) can, in principle, finance their deficits more easily as their liabilities are mainly labelled in their own currencies, which are global reserve currencies. This was not the case when many emerging markets run excessive CA deficits financed in foreign currencies. The second implication is that increased concentration and persisting deficits in a few economies could heighten the risk of protectionist responses (and this is already the case in the US and UK). Thus, although sustainable, it is key to address persistent CA deficits in AEs in order to alleviate the protectionist
3http://www.oecd.org/countries/monaco/jurisdictionscommittedtoimprovingtransparencyandestablishingeffectiveexchangeofinformationintaxmatters.htm
European Commission - Analysis of developments in EU capital flows in the global context
November 2017 14
pressures. And last but not least, the persistence of large excess imbalances in several advanced economies (where market forces are dominant and there are no FX interventions and/or FX reserve accumulation) shows that the adjustment mechanisms in the global economy are weak.
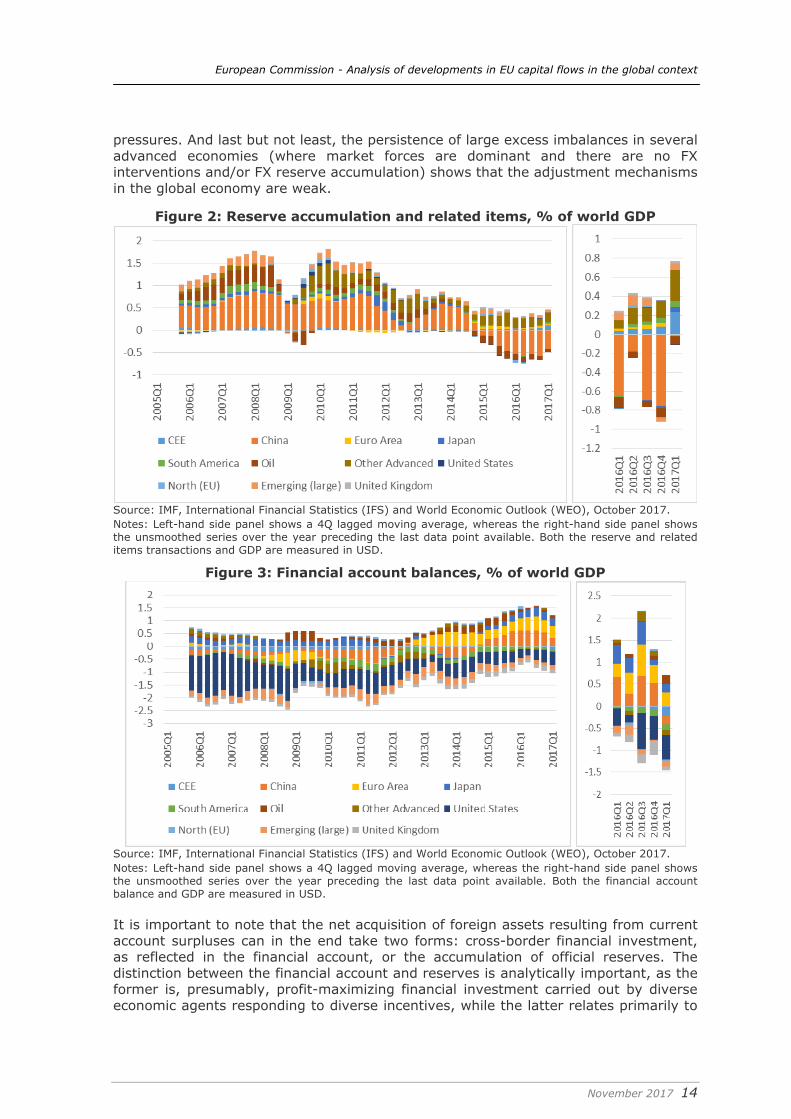
Figure 2: Reserve accumulation and related items, % of world GDP
Source: IMF, International Financial Statistics (IFS) and World Economic Outlook (WEO), October 2017. Notes: Left-hand side panel shows a 4Q lagged moving average, whereas the right-hand side panel shows the unsmoothed series over the year preceding the last data point available. Both the reserve and related items transactions and GDP are measured in USD.
Figure 3: Financial account balances, % of world GDP
Source: IMF, International Financial Statistics (IFS) and World Economic Outlook (WEO), October 2017. Notes: Left-hand side panel shows a 4Q lagged moving average, whereas the right-hand side panel shows the unsmoothed series over the year preceding the last data point available. Both the financial account balance and GDP are measured in USD. It is important to note that the net acquisition of foreign assets resulting from current account surpluses can in the end take two forms: cross-border financial investment, as reflected in the financial account, or the accumulation of official reserves. The distinction between the financial account and reserves is analytically important, as the former is, presumably, profit-maximizing financial investment carried out by diverse economic agents responding to diverse incentives, while the latter relates primarily to
European Commission - Analysis of developments in EU capital flows in the global context
November 2017 15
the government/monetary authority and reflects primarily policy choices with other objectives than profits. Concerning their evolution, after increasing continuously since the beginning of the 1990s, reserves have finally started decreasing in the last few years (Figure 2). Reserve accumulation has been a significant parallel development to the excess savings generated by some countries and in particular by China. The significant reversal in the net balance of China’s vast reserves that has taken place in the past couple of years drives the global trend in the recent period. This change is related to the fact that, in order to support its currency and avoid its depreciation (which could have damaging consequences in terms of financial stability if there were currency mismatches in the Chinese financial or corporate sectors), China has used its reserves to mitigate capital outflows observed during the same period (see Figure 3), coinciding with problems faced by the country’s financial institutions and associated concerns. Contrarily to China, for other large economies such as the US, euro area and Japan, in the absence of significant reserve accumulation, shifts in the current account are mirrored almost one-to-one in the financial account.
Box 2: Components of capital flows Capital flows are defined as cross-border financial transaction recorded in a country’s external financial accounts, which produce a change in the assets and liabilities of residents’ vis-á-vis non-residents and can be broken down into the following components: Foreign direct investment: records financial flows between resident and non-resident firms
that are under a direct investment relationship. A direct investment relationship is established when a resident firm holds at least 10% in the share capital of a non-resident firm, or vice versa.
Portfolio investment: records financial flows related to transactions between residents and non-residents that affect their assets and liabilities vis-à-vis each other related to securities and derivatives. Securities are distinguished between equities and debt securities, namely bonds and money market instruments. Residents’ net investment in securities issued by non-residents are recorded under ‘Assets’, whereas non-residents’ net investment in securities issued by residents are recorded under ‘Liabilities’.
Other investment: records financial flows stemming from transactions between residents and non-residents related mainly to cross-border loans and deposits. Financial flows related to loans granted by residents to non-residents, as well as residents’ deposits with non-resident monetary financial institutions are recorded under “Assets”. Financial flows related to loans granted by non-residents to residents, as well as non-residents’ deposits with resident monetary financial institutions are recorded under “Liabilities”.
Financial derivatives: records financial flows stemming from financial derivative contracts, which is a financial instrument that is linked to another specific financial instrument/indicator or commodity and is traded in their own right in financial markets. These transactions are treated as separate transaction rather than as integral parts of the values of the underlying transactions to which they are linked.
Reserve assets: are those external assets that are readily available to and controlled by the monetary authorities for meeting balance of payments financing needs, for intervention in exchange markets to affect the currency exchange rate, and for other related purposes.
Until now, we have focused on overall net flows. While a useful point of departure to understand the global context, in order to acquire a more granular view of global developments, we will look into the decomposition of the financial account balance by type of investment (in line with the BPM6 manual (IMF, 2009): direct investment, portfolio, other investment). Analysing the financial accounts and its underlying components is essential as it offers a simple picture of the composition of group’s net balances vis-à-vis the rest of the world. The net financial account in particular is an essential variable to look at in order to understand countries’ external borrowing requirements. The net flows for each of the financial account components can give an
European Commission - Analysis of developments in EU capital flows in the global context
November 2017 16
indication of where potential financing problems could come from. We will zoom into recent developments separately from longer-term trends. We will also break down the financial account balance by transactions in assets and liabilities. Additionally, we will examine the international investment position, both in net and gross basis. Moreover, we will describe developments in exchange rates and exchange rate reserves. Finally, we include a section assessing developments in the banking sector alone. We primarily focus on the five largest economies representing two thirds of the world GDP in 2016: the US, the euro area considered as a single block, Japan, China and the UK. The full set of charts for these economies as well as all of the other regional groups analysed in the report can be found in Appendix 2. We also briefly discuss developments in a set of large emerging economies, bundled together in two separate regional aggregates (South America and the rest).
2.1. Major economies The United States
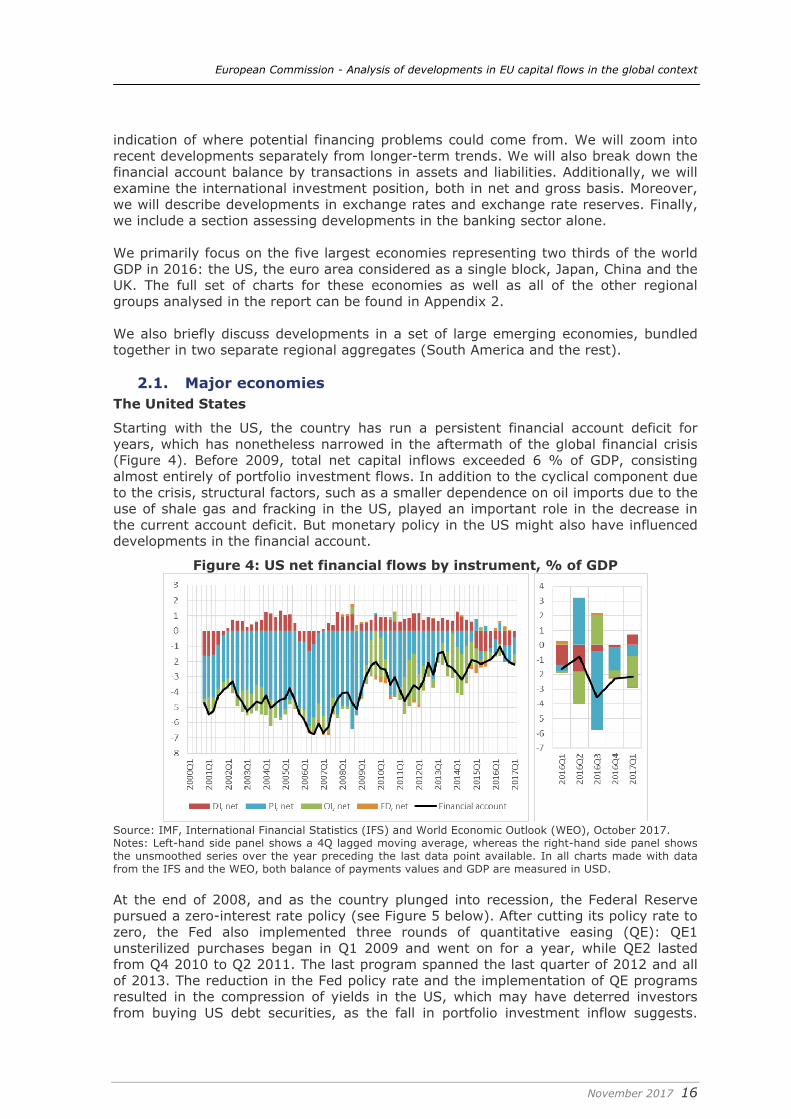
Starting with the US, the country has run a persistent financial account deficit for years, which has nonetheless narrowed in the aftermath of the global financial crisis (Figure 4). Before 2009, total net capital inflows exceeded 6 % of GDP, consisting almost entirely of portfolio investment flows. In addition to the cyclical component due to the crisis, structural factors, such as a smaller dependence on oil imports due to the use of shale gas and fracking in the US, played an important role in the decrease in the current account deficit. But monetary policy in the US might also have influenced developments in the financial account.
Figure 4: US net financial flows by instrument, % of GDP
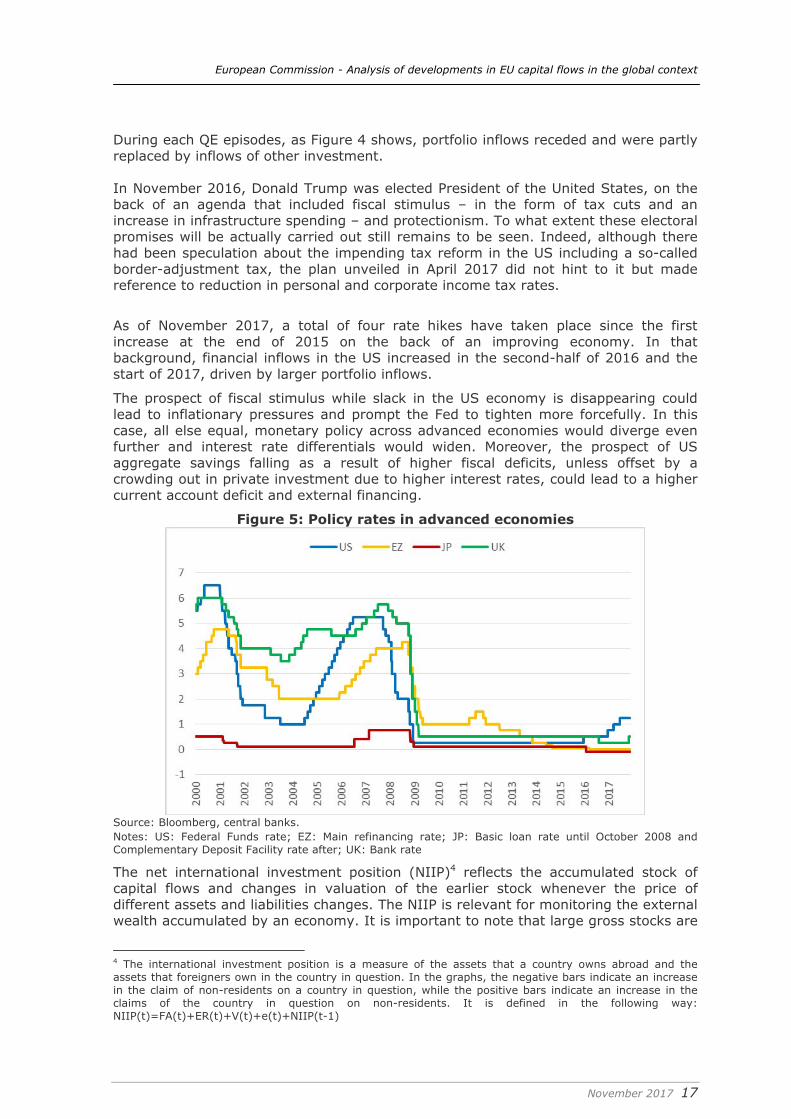
Source: IMF, International Financial Statistics (IFS) and World Economic Outlook (WEO), October 2017. Notes: Left-hand side panel shows a 4Q lagged moving average, whereas the right-hand side panel shows the unsmoothed series over the year preceding the last data point available. In all charts made with data from the IFS and the WEO, both balance of payments values and GDP are measured in USD. At the end of 2008, and as the country plunged into recession, the Federal Reserve pursued a zero-interest rate policy (see Figure 5 below). After cutting its policy rate to zero, the Fed also implemented three rounds of quantitative easing (QE): QE1 unsterilized purchases began in Q1 2009 and went on for a year, while QE2 lasted from Q4 2010 to Q2 2011. The last program spanned the last quarter of 2012 and all of 2013. The reduction in the Fed policy rate and the implementation of QE programs resulted in the compression of yields in the US, which may have deterred investors from buying US debt securities, as the fall in portfolio investment inflow suggests.
European Commission - Analysis of developments in EU capital flows in the global context
November 2017 17
During each QE episodes, as Figure 4 shows, portfolio inflows receded and were partly replaced by inflows of other investment. In November 2016, Donald Trump was elected President of the United States, on the back of an agenda that included fiscal stimulus – in the form of tax cuts and an increase in infrastructure spending – and protectionism. To what extent these electoral promises will be actually carried out still remains to be seen. Indeed, although there had been speculation about the impending tax reform in the US including a so-called border-adjustment tax, the plan unveiled in April 2017 did not hint to it but made reference to reduction in personal and corporate income tax rates.
As of November 2017, a total of four rate hikes have taken place since the first increase at the end of 2015 on the back of an improving economy. In that background, financial inflows in the US increased in the second-half of 2016 and the start of 2017, driven by larger portfolio inflows.
The prospect of fiscal stimulus while slack in the US economy is disappearing could lead to inflationary pressures and prompt the Fed to tighten more forcefully. In this case, all else equal, monetary policy across advanced economies would diverge even further and interest rate differentials would widen. Moreover, the prospect of US aggregate savings falling as a result of higher fiscal deficits, unless offset by a crowding out in private investment due to higher interest rates, could lead to a higher current account deficit and external financing.
Figure 5: Policy rates in advanced economies
Source: Bloomberg, central banks. Notes: US: Federal Funds rate; EZ: Main refinancing rate; JP: Basic loan rate until October 2008 and Complementary Deposit Facility rate after; UK: Bank rate
The net international investment position (NIIP)4 reflects the accumulated stock of capital flows and changes in valuation of the earlier stock whenever the price of different assets and liabilities changes. The NIIP is relevant for monitoring the external wealth accumulated by an economy. It is important to note that large gross stocks are
4 The international investment position is a measure of the assets that a country owns abroad and the assets that foreigners own in the country in question. In the graphs, the negative bars indicate an increase in the claim of non-residents on a country in question, while the positive bars indicate an increase in the claims of the country in question on non-residents. It is defined in the following way: NIIP(t)=FA(t)+ER(t)+V(t)+e(t)+NIIP(t-1)
European Commission - Analysis of developments in EU capital flows in the global context
November 2017 18
prone to major valuation changes, which can lead to significant shifts in the net stock position even if net flows are small. As an example, net valuation losses for Germany amounted to 20% of German GDP in 2011. Large parts of these losses were already being realised in 2007-08 as a result of the US subprime mortgage market crisis, reflecting the previously high exposure of German banks to US securities (European Commission, 2012). The net international investment position of the US is substantially negative, to the tune of 45% of its GDP. Excluding reserves of course, the US is a net debtor in every type of investment but its negative NIIP is almost entirely due to the discrepancy between its portfolio assets and the much larger portfolio liabilities to non-residents. In gross terms, portfolio liabilities constitute more than half of the total liabilities. Whereas the portfolio transactions between the US and the rest of the world have been broadly balanced in the last two years, the net portfolio investment position has clearly deteriorated, implying large valuation effects. Euro Area
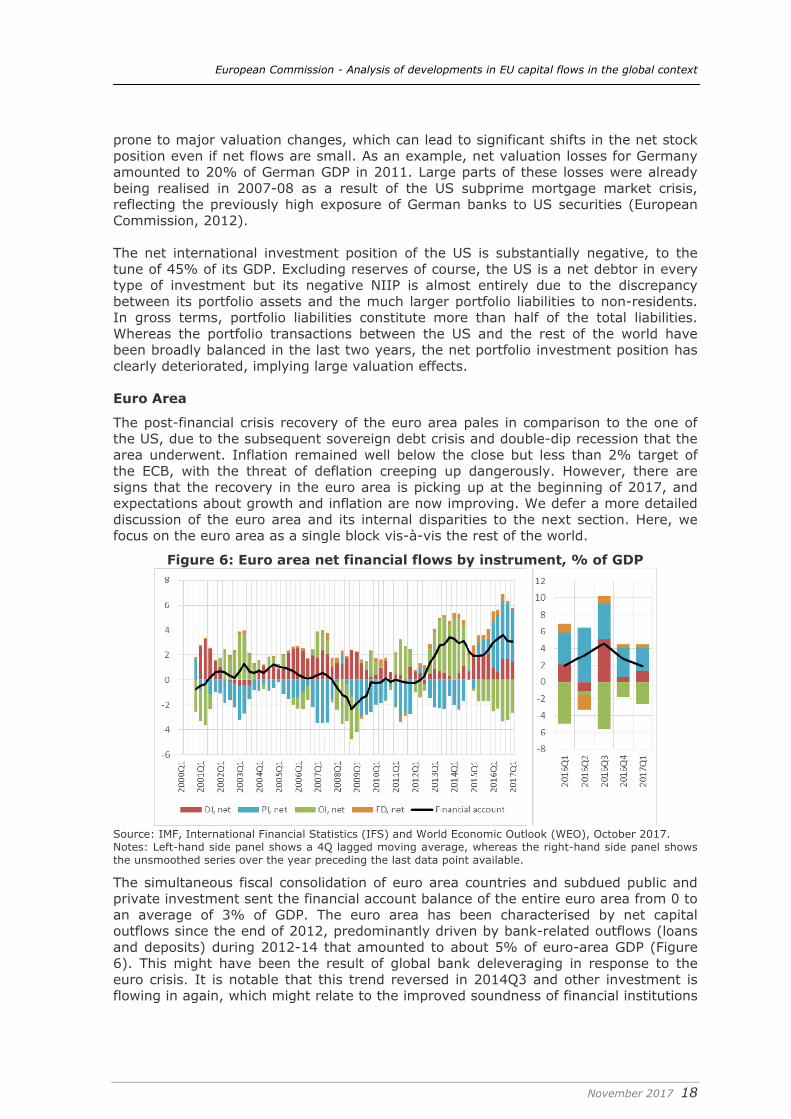
The post-financial crisis recovery of the euro area pales in comparison to the one of the US, due to the subsequent sovereign debt crisis and double-dip recession that the area underwent. Inflation remained well below the close but less than 2% target of the ECB, with the threat of deflation creeping up dangerously. However, there are signs that the recovery in the euro area is picking up at the beginning of 2017, and expectations about growth and inflation are now improving. We defer a more detailed discussion of the euro area and its internal disparities to the next section. Here, we focus on the euro area as a single block vis-à-vis the rest of the world.
Figure 6: Euro area net financial flows by instrument, % of GDP
Source: IMF, International Financial Statistics (IFS) and World Economic Outlook (WEO), October 2017. Notes: Left-hand side panel shows a 4Q lagged moving average, whereas the right-hand side panel shows the unsmoothed series over the year preceding the last data point available.
The simultaneous fiscal consolidation of euro area countries and subdued public and private investment sent the financial account balance of the entire euro area from 0 to an average of 3% of GDP. The euro area has been characterised by net capital outflows since the end of 2012, predominantly driven by bank-related outflows (loans and deposits) during 2012-14 that amounted to about 5% of euro-area GDP (Figure 6). This might have been the result of global bank deleveraging in response to the euro crisis. It is notable that this trend reversed in 2014Q3 and other investment is flowing in again, which might relate to the improved soundness of financial institutions
European Commission - Analysis of developments in EU capital flows in the global context
November 2017 19
as a result of the preparation for, and the actual take-over by the European Central Bank of the single supervisory role in the euro area. At the same time, the net outflow of capital from the euro area overall persists, on the back of the portfolio investment. In 2015, the euro area experienced net portfolio investment outflows practically for the first time since 2001, reflecting to some extent the impact of the ECB’s asset purchase programme. These outflows have intensified in 2016 to reach 6% of euro area GDP, thus more than compensating for the resumption of other investment inflows. Foreign investors might have lost interest in euro-area debt markets because euro-area government and corporate bond yields were compressed. In this context, Hüttl and Merler (2016) look at the impact of quantitative easing on sovereign debt holdings in the euro area. They find that increases in central banks holdings of sovereign debt are offset by decreases in holdings of other institutional sectors. In Germany and France in particular, non-resident holdings are diminishing.
Figure 7: Japan net financial flows by instrument, % of GDP
Source: IMF, International Financial Statistics (IFS) and World Economic Outlook (WEO), October 2017. Notes: Left-hand side panel shows a 4Q lagged moving average, whereas the right-hand side panel shows the unsmoothed series over the year preceding the last data point available. In gross terms, the euro area is more “open” than the US. Both foreign assets and liabilities represent a larger share of GDP, especially as the result of higher direct and other investment exposures. The relative composition of assets and liabilities, however, does not match: a greater part of the euro area’s foreign assets are in the form of direct investment, whereas most of its foreign liabilities fall under portfolio investment. Te overall net position of the euro area was relatively stable in 2008-13 at about minus 10% of GDP. In the course of 2016, the NIIP edged closer to a balance on the back of continued outflows of capital. The components of gross positions highlight that the reported negative net position is largely due to accumulated portfolio liabilities while the euro area is a net investor in the rest of the world in terms of foreign direct investment (FDI). The increasing share of net FDI claims on the rest of the world (including other EU countries, such as central and eastern European Member States) was a clear trend from the mid-2000s up to 2013, as euro-area firms used FDI to penetrate new markets or to achieve efficiency gains by splitting the value chain of production across countries (European Commission, 2012). However, the net FDI
European Commission - Analysis of developments in EU capital flows in the global context
November 2017 20
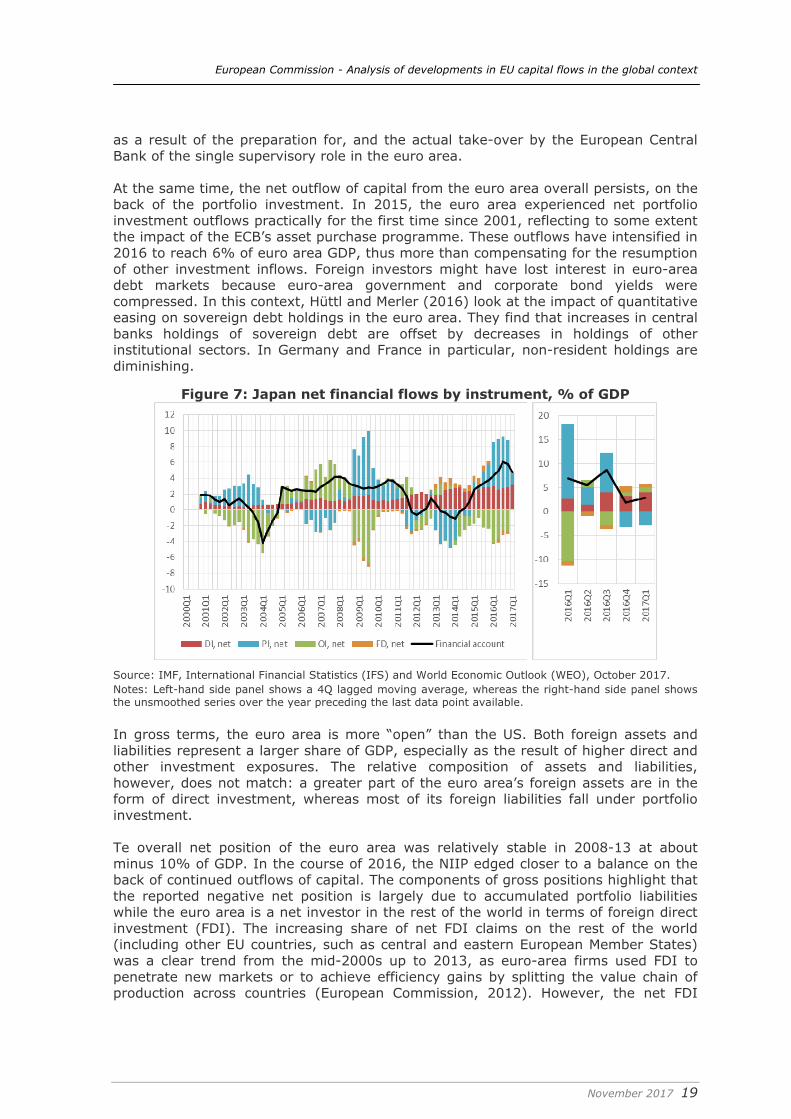
claims of the euro area remained relatively stable up to 2016Q4, until a slight uptick in 2017Q1 further improved the overall NIIP. Finally, it is worth noting that, according to the estimates of Zucman (2013), around 8 percent of the global financial wealth of households is held in tax havens, three-quarters of which goes unrecorded. If unrecorded assets were correctly accounted for, the euro area could turn into a net creditor and not a net debtor to the rest of the world as indicated by official statistics. Therefore, we should interpret cautiously the reported net position of the euro area. Japan A similar dynamic to that of the euro area also emerged in Japan (Figure 7). Portfolio investment inflows turned into outflows during the same period, and drove the financial account balance above 5% of GDP for the first time in more than fifteen years. Meanwhile, the direct investment balance, while historically positive, have risen further over the last few years to reach new highs.
Figure 8: Central banks’ balance sheets, % of world GDP
0
5
10
15
20
25
30
2006
2007
2008
2009
2010
2011
2012
2013
2014
2015
2016
2017
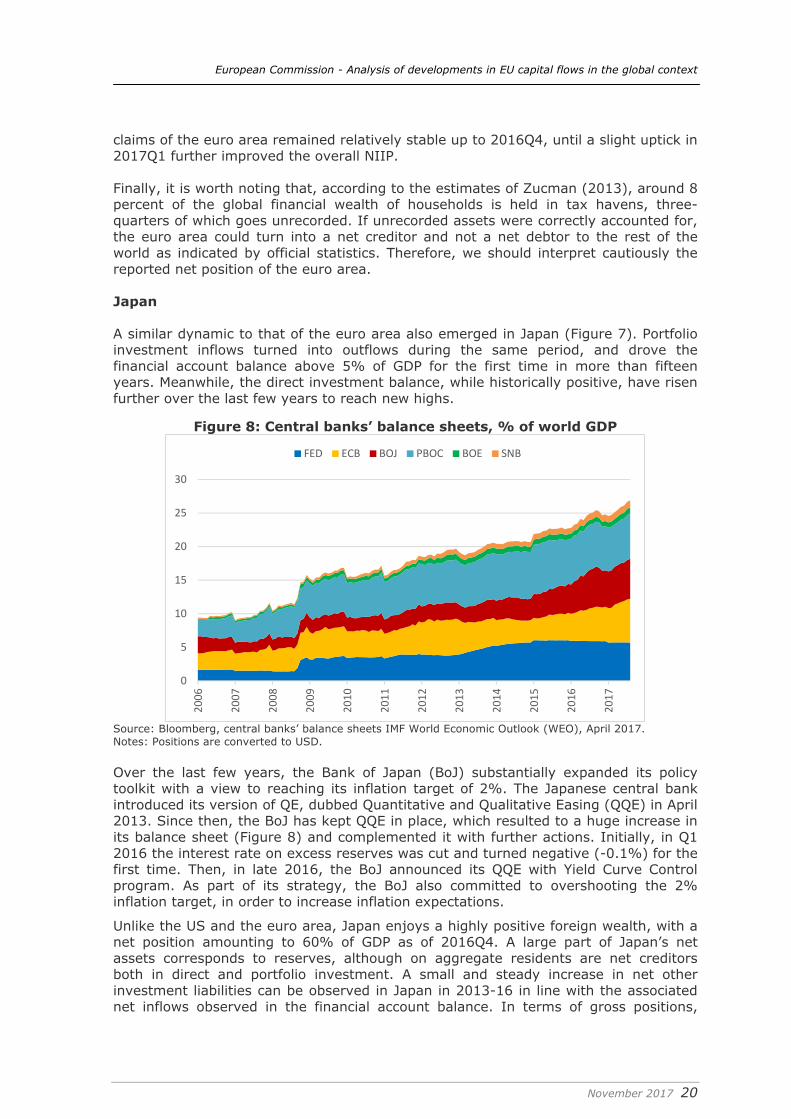
FED ECB BOJ PBOC BOE SNB
Source: Bloomberg, central banks’ balance sheets IMF World Economic Outlook (WEO), April 2017. Notes: Positions are converted to USD. Over the last few years, the Bank of Japan (BoJ) substantially expanded its policy toolkit with a view to reaching its inflation target of 2%. The Japanese central bank introduced its version of QE, dubbed Quantitative and Qualitative Easing (QQE) in April 2013. Since then, the BoJ has kept QQE in place, which resulted to a huge increase in its balance sheet (Figure 8) and complemented it with further actions. Initially, in Q1 2016 the interest rate on excess reserves was cut and turned negative (-0.1%) for the first time. Then, in late 2016, the BoJ announced its QQE with Yield Curve Control program. As part of its strategy, the BoJ also committed to overshooting the 2% inflation target, in order to increase inflation expectations.
Unlike the US and the euro area, Japan enjoys a highly positive foreign wealth, with a net position amounting to 60% of GDP as of 2016Q4. A large part of Japan’s net assets corresponds to reserves, although on aggregate residents are net creditors both in direct and portfolio investment. A small and steady increase in net other investment liabilities can be observed in Japan in 2013-16 in line with the associated net inflows observed in the financial account balance. In terms of gross positions,
European Commission - Analysis of developments in EU capital flows in the global context
November 2017 21
foreign assets and liabilities are mostly composed of portfolio investment. Despite overall strong capital outflows, little change can be observed in Japan in recent years, This stability can be attributed to portfolio investment positions, as outflows have not translated into larger net positions suggesting valuation losses. The exchange rate could have played a role, as the Japanese yen (JPY) gained value relative to the USD, thus inflating the dollar value of JPY-denominated liabilities. China
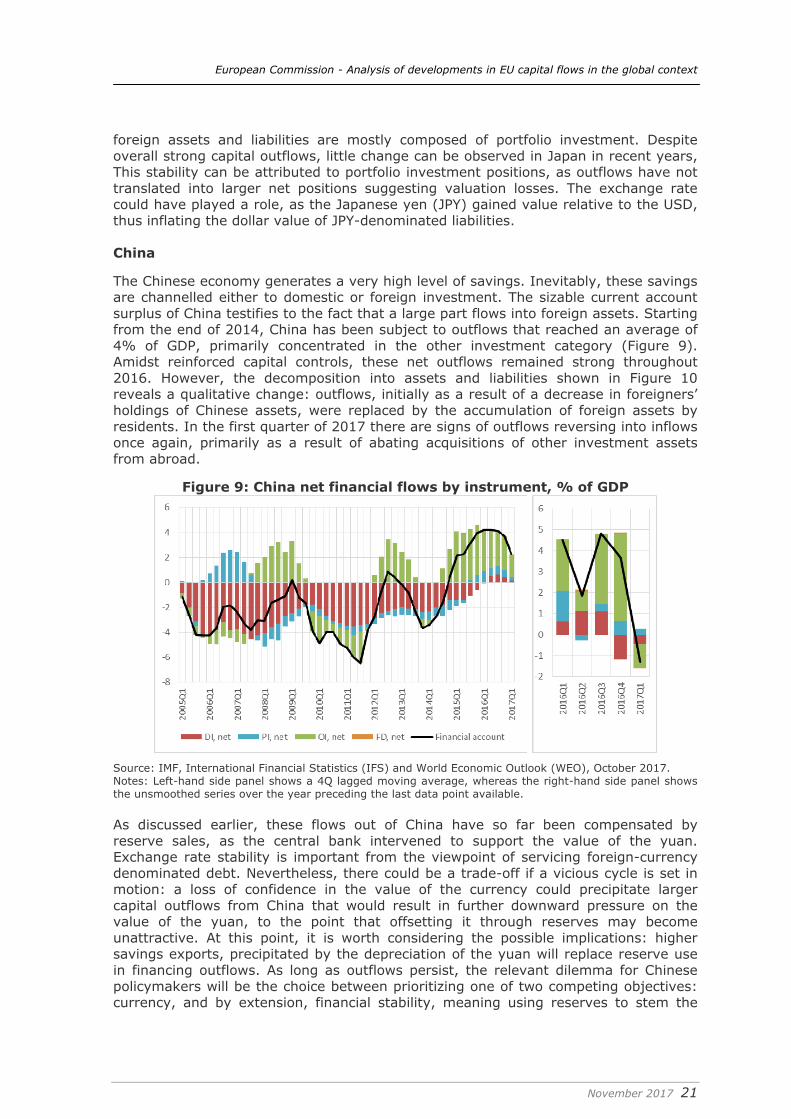
The Chinese economy generates a very high level of savings. Inevitably, these savings are channelled either to domestic or foreign investment. The sizable current account surplus of China testifies to the fact that a large part flows into foreign assets. Starting from the end of 2014, China has been subject to outflows that reached an average of 4% of GDP, primarily concentrated in the other investment category (Figure 9). Amidst reinforced capital controls, these net outflows remained strong throughout 2016. However, the decomposition into assets and liabilities shown in Figure 10 reveals a qualitative change: outflows, initially as a result of a decrease in foreigners’ holdings of Chinese assets, were replaced by the accumulation of foreign assets by residents. In the first quarter of 2017 there are signs of outflows reversing into inflows once again, primarily as a result of abating acquisitions of other investment assets from abroad.
Figure 9: China net financial flows by instrument, % of GDP
Source: IMF, International Financial Statistics (IFS) and World Economic Outlook (WEO), October 2017. Notes: Left-hand side panel shows a 4Q lagged moving average, whereas the right-hand side panel shows the unsmoothed series over the year preceding the last data point available. As discussed earlier, these flows out of China have so far been compensated by reserve sales, as the central bank intervened to support the value of the yuan. Exchange rate stability is important from the viewpoint of servicing foreign-currency denominated debt. Nevertheless, there could be a trade-off if a vicious cycle is set in motion: a loss of confidence in the value of the currency could precipitate larger capital outflows from China that would result in further downward pressure on the value of the yuan, to the point that offsetting it through reserves may become unattractive. At this point, it is worth considering the possible implications: higher savings exports, precipitated by the depreciation of the yuan will replace reserve use in financing outflows. As long as outflows persist, the relevant dilemma for Chinese policymakers will be the choice between prioritizing one of two competing objectives: currency, and by extension, financial stability, meaning using reserves to stem the
European Commission - Analysis of developments in EU capital flows in the global context
November 2017 22
depreciation of the yuan, or preservation (and later rebuilding) of its reserves, in exchange for loss of value for the currency, capital outflows and a larger current account.
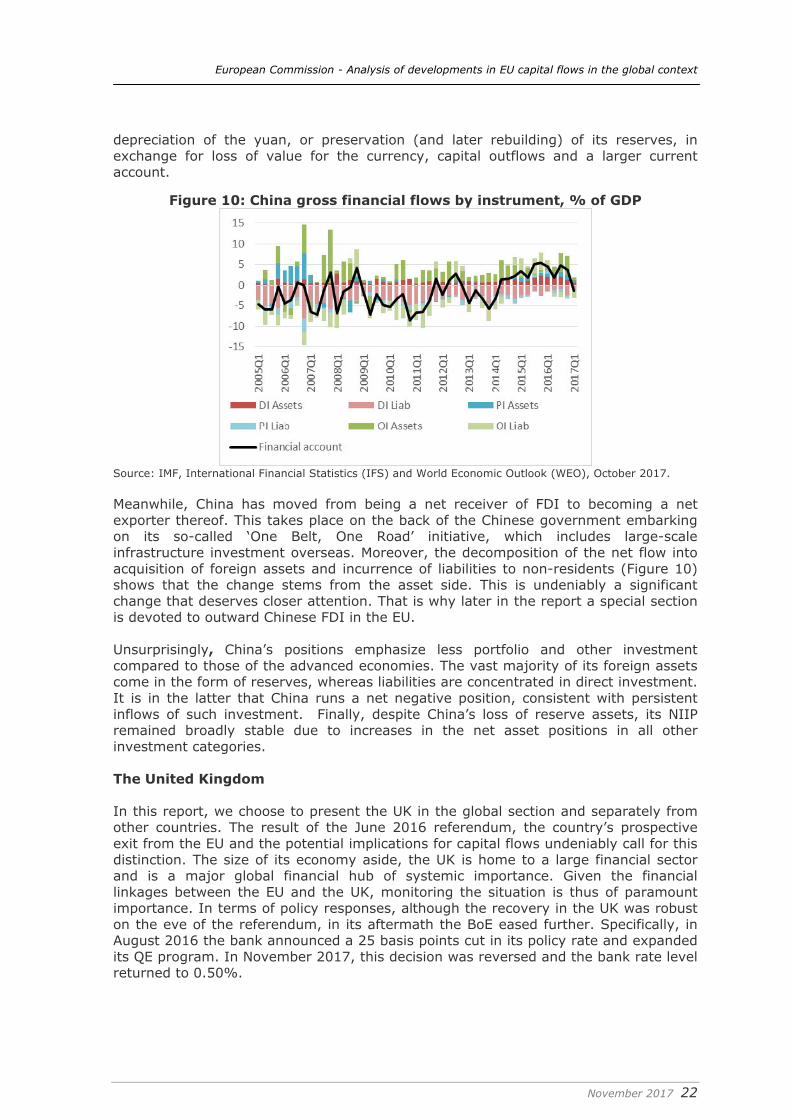
Figure 10: China gross financial flows by instrument, % of GDP
Source: IMF, International Financial Statistics (IFS) and World Economic Outlook (WEO), October 2017. Meanwhile, China has moved from being a net receiver of FDI to becoming a net exporter thereof. This takes place on the back of the Chinese government embarking on its so-called ‘One Belt, One Road’ initiative, which includes large-scale infrastructure investment overseas. Moreover, the decomposition of the net flow into acquisition of foreign assets and incurrence of liabilities to non-residents (Figure 10) shows that the change stems from the asset side. This is undeniably a significant change that deserves closer attention. That is why later in the report a special section is devoted to outward Chinese FDI in the EU. Unsurprisingly, China’s positions emphasize less portfolio and other investment compared to those of the advanced economies. The vast majority of its foreign assets come in the form of reserves, whereas liabilities are concentrated in direct investment. It is in the latter that China runs a net negative position, consistent with persistent inflows of such investment. Finally, despite China’s loss of reserve assets, its NIIP remained broadly stable due to increases in the net asset positions in all other investment categories. The United Kingdom In this report, we choose to present the UK in the global section and separately from other countries. The result of the June 2016 referendum, the country’s prospective exit from the EU and the potential implications for capital flows undeniably call for this distinction. The size of its economy aside, the UK is home to a large financial sector and is a major global financial hub of systemic importance. Given the financial linkages between the EU and the UK, monitoring the situation is thus of paramount importance. In terms of policy responses, although the recovery in the UK was robust on the eve of the referendum, in its aftermath the BoE eased further. Specifically, in August 2016 the bank announced a 25 basis points cut in its policy rate and expanded its QE program. In November 2017, this decision was reversed and the bank rate level returned to 0.50%.
European Commission - Analysis of developments in EU capital flows in the global context
November 2017 23
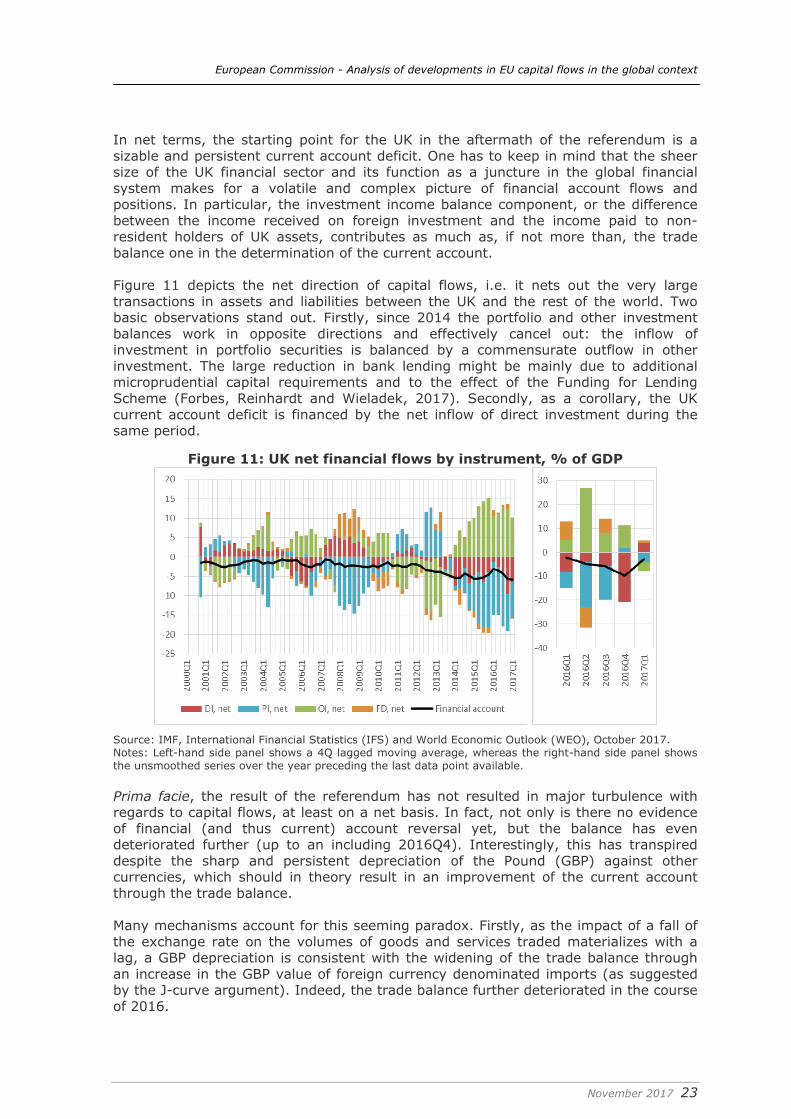
In net terms, the starting point for the UK in the aftermath of the referendum is a sizable and persistent current account deficit. One has to keep in mind that the sheer size of the UK financial sector and its function as a juncture in the global financial system makes for a volatile and complex picture of financial account flows and positions. In particular, the investment income balance component, or the difference between the income received on foreign investment and the income paid to non-resident holders of UK assets, contributes as much as, if not more than, the trade balance one in the determination of the current account. Figure 11 depicts the net direction of capital flows, i.e. it nets out the very large transactions in assets and liabilities between the UK and the rest of the world. Two basic observations stand out. Firstly, since 2014 the portfolio and other investment balances work in opposite directions and effectively cancel out: the inflow of investment in portfolio securities is balanced by a commensurate outflow in other investment. The large reduction in bank lending might be mainly due to additional microprudential capital requirements and to the effect of the Funding for Lending Scheme (Forbes, Reinhardt and Wieladek, 2017). Secondly, as a corollary, the UK current account deficit is financed by the net inflow of direct investment during the same period.
Figure 11: UK net financial flows by instrument, % of GDP
Source: IMF, International Financial Statistics (IFS) and World Economic Outlook (WEO), October 2017. Notes: Left-hand side panel shows a 4Q lagged moving average, whereas the right-hand side panel shows the unsmoothed series over the year preceding the last data point available.
Prima facie, the result of the referendum has not resulted in major turbulence with regards to capital flows, at least on a net basis. In fact, not only is there no evidence of financial (and thus current) account reversal yet, but the balance has even deteriorated further (up to an including 2016Q4). Interestingly, this has transpired despite the sharp and persistent depreciation of the Pound (GBP) against other currencies, which should in theory result in an improvement of the current account through the trade balance. Many mechanisms account for this seeming paradox. Firstly, as the impact of a fall of the exchange rate on the volumes of goods and services traded materializes with a lag, a GBP depreciation is consistent with the widening of the trade balance through an increase in the GBP value of foreign currency denominated imports (as suggested by the J-curve argument). Indeed, the trade balance further deteriorated in the course of 2016.
European Commission - Analysis of developments in EU capital flows in the global context
November 2017 24
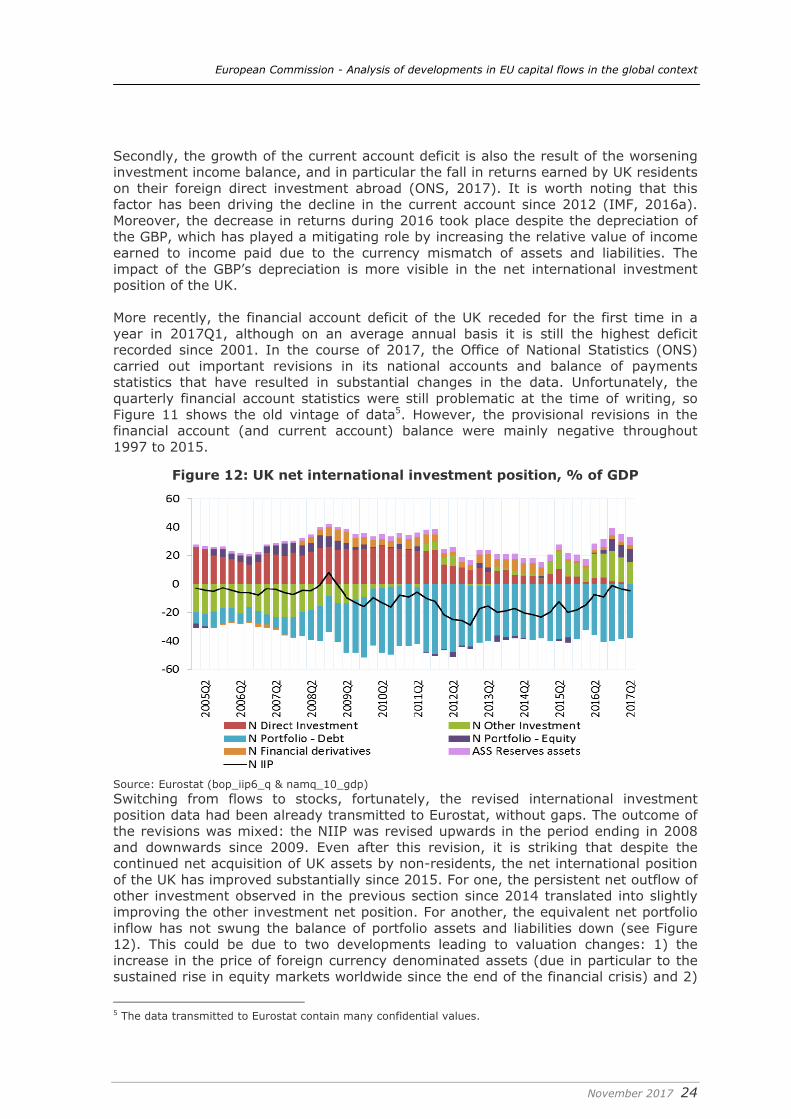
Secondly, the growth of the current account deficit is also the result of the worsening investment income balance, and in particular the fall in returns earned by UK residents on their foreign direct investment abroad (ONS, 2017). It is worth noting that this factor has been driving the decline in the current account since 2012 (IMF, 2016a). Moreover, the decrease in returns during 2016 took place despite the depreciation of the GBP, which has played a mitigating role by increasing the relative value of income earned to income paid due to the currency mismatch of assets and liabilities. The impact of the GBP’s depreciation is more visible in the net international investment position of the UK. More recently, the financial account deficit of the UK receded for the first time in a year in 2017Q1, although on an average annual basis it is still the highest deficit recorded since 2001. In the course of 2017, the Office of National Statistics (ONS) carried out important revisions in its national accounts and balance of payments statistics that have resulted in substantial changes in the data. Unfortunately, the quarterly financial account statistics were still problematic at the time of writing, so Figure 11 shows the old vintage of data5. However, the provisional revisions in the financial account (and current account) balance were mainly negative throughout 1997 to 2015.
Figure 12: UK net international investment position, % of GDP
Source: Eurostat (bop_iip6_q & namq_10_gdp) Switching from flows to stocks, fortunately, the revised international investment position data had been already transmitted to Eurostat, without gaps. The outcome of the revisions was mixed: the NIIP was revised upwards in the period ending in 2008 and downwards since 2009. Even after this revision, it is striking that despite the continued net acquisition of UK assets by non-residents, the net international position of the UK has improved substantially since 2015. For one, the persistent net outflow of other investment observed in the previous section since 2014 translated into slightly improving the other investment net position. For another, the equivalent net portfolio inflow has not swung the balance of portfolio assets and liabilities down (see Figure 12). This could be due to two developments leading to valuation changes: 1) the increase in the price of foreign currency denominated assets (due in particular to the sustained rise in equity markets worldwide since the end of the financial crisis) and 2)
5 The data transmitted to Eurostat contain many confidential values.
European Commission - Analysis of developments in EU capital flows in the global context
November 2017 25
the effect of the significant depreciation of the GBP vis-à-vis other currencies (see Figure 16). By consequence, GBP-denominated domestic portfolio assets held by non-residents have lost value in dollar terms due to the exchange rate, while foreign portfolio assets held by residents, denominated in USD and other foreign currencies have not – at least not to the same extent. In fact, the ONS (2017) identifies the GBP depreciation as the main driver behind the dramatic improvement of the NIIP during 2016.
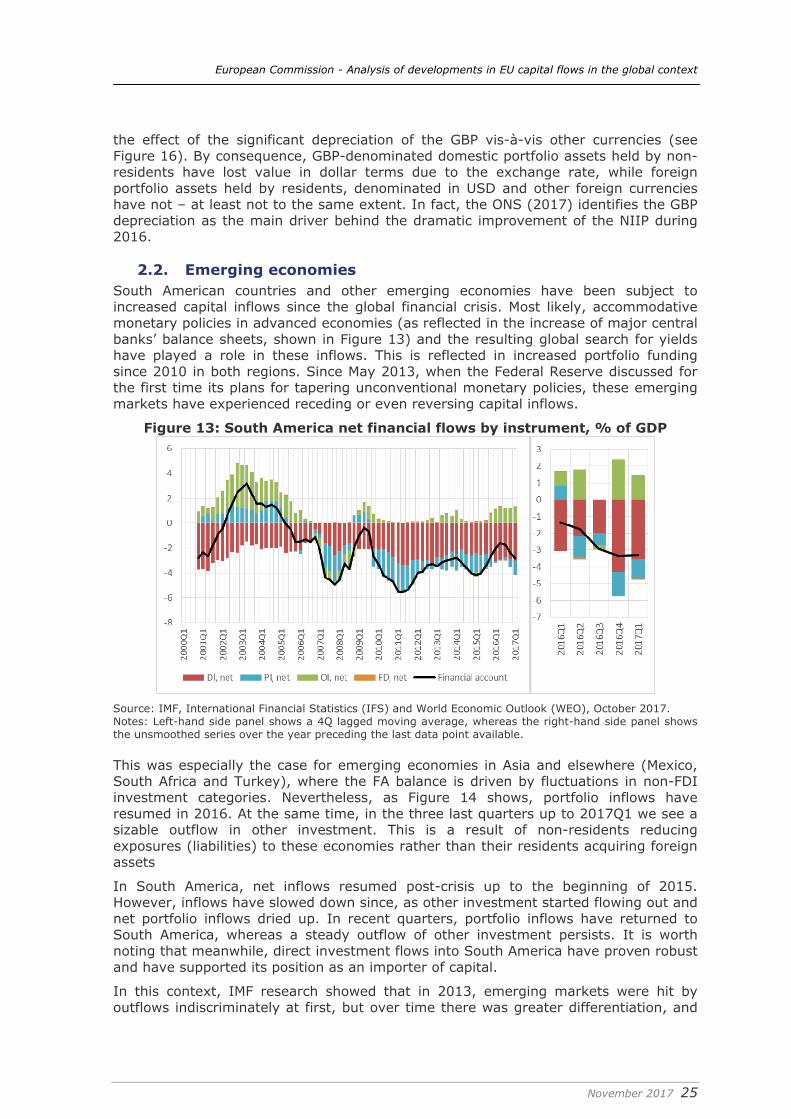
2.2. Emerging economies South American countries and other emerging economies have been subject to increased capital inflows since the global financial crisis. Most likely, accommodative monetary policies in advanced economies (as reflected in the increase of major central banks’ balance sheets, shown in Figure 13) and the resulting global search for yields have played a role in these inflows. This is reflected in increased portfolio funding since 2010 in both regions. Since May 2013, when the Federal Reserve discussed for the first time its plans for tapering unconventional monetary policies, these emerging markets have experienced receding or even reversing capital inflows.
Figure 13: South America net financial flows by instrument, % of GDP
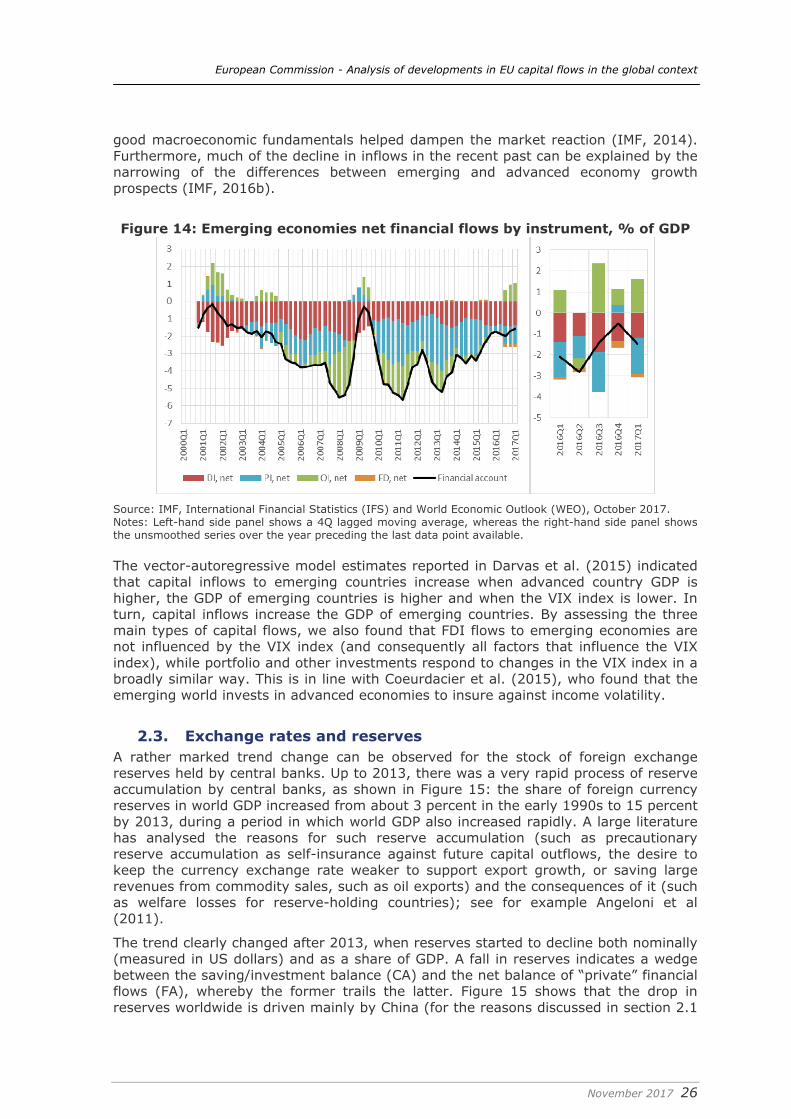
Source: IMF, International Financial Statistics (IFS) and World Economic Outlook (WEO), October 2017. Notes: Left-hand side panel shows a 4Q lagged moving average, whereas the right-hand side panel shows the unsmoothed series over the year preceding the last data point available. This was especially the case for emerging economies in Asia and elsewhere (Mexico, South Africa and Turkey), where the FA balance is driven by fluctuations in non-FDI investment categories. Nevertheless, as Figure 14 shows, portfolio inflows have resumed in 2016. At the same time, in the three last quarters up to 2017Q1 we see a sizable outflow in other investment. This is a result of non-residents reducing exposures (liabilities) to these economies rather than their residents acquiring foreign assets
In South America, net inflows resumed post-crisis up to the beginning of 2015. However, inflows have slowed down since, as other investment started flowing out and net portfolio inflows dried up. In recent quarters, portfolio inflows have returned to South America, whereas a steady outflow of other investment persists. It is worth noting that meanwhile, direct investment flows into South America have proven robust and have supported its position as an importer of capital.
In this context, IMF research showed that in 2013, emerging markets were hit by outflows indiscriminately at first, but over time there was greater differentiation, and
European Commission - Analysis of developments in EU capital flows in the global context
November 2017 26
good macroeconomic fundamentals helped dampen the market reaction (IMF, 2014). Furthermore, much of the decline in inflows in the recent past can be explained by the narrowing of the differences between emerging and advanced economy growth prospects (IMF, 2016b).
Figure 14: Emerging economies net financial flows by instrument, % of GDP
Source: IMF, International Financial Statistics (IFS) and World Economic Outlook (WEO), October 2017. Notes: Left-hand side panel shows a 4Q lagged moving average, whereas the right-hand side panel shows the unsmoothed series over the year preceding the last data point available. The vector-autoregressive model estimates reported in Darvas et al. (2015) indicated that capital inflows to emerging countries increase when advanced country GDP is higher, the GDP of emerging countries is higher and when the VIX index is lower. In turn, capital inflows increase the GDP of emerging countries. By assessing the three main types of capital flows, we also found that FDI flows to emerging economies are not influenced by the VIX index (and consequently all factors that influence the VIX index), while portfolio and other investments respond to changes in the VIX index in a broadly similar way. This is in line with Coeurdacier et al. (2015), who found that the emerging world invests in advanced economies to insure against income volatility.
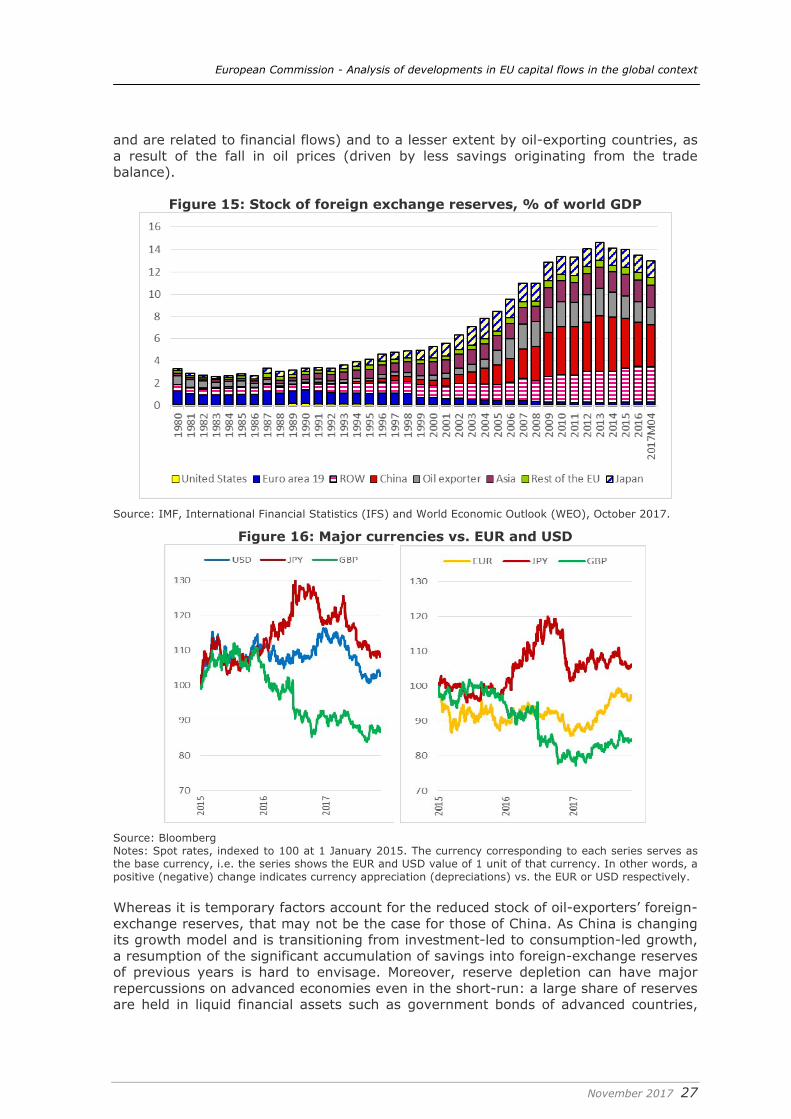
2.3. Exchange rates and reserves A rather marked trend change can be observed for the stock of foreign exchange reserves held by central banks. Up to 2013, there was a very rapid process of reserve accumulation by central banks, as shown in Figure 15: the share of foreign currency reserves in world GDP increased from about 3 percent in the early 1990s to 15 percent by 2013, during a period in which world GDP also increased rapidly. A large literature has analysed the reasons for such reserve accumulation (such as precautionary reserve accumulation as self-insurance against future capital outflows, the desire to keep the currency exchange rate weaker to support export growth, or saving large revenues from commodity sales, such as oil exports) and the consequences of it (such as welfare losses for reserve-holding countries); see for example Angeloni et al (2011).
The trend clearly changed after 2013, when reserves started to decline both nominally (measured in US dollars) and as a share of GDP. A fall in reserves indicates a wedge between the saving/investment balance (CA) and the net balance of “private” financial flows (FA), whereby the former trails the latter. Figure 15 shows that the drop in reserves worldwide is driven mainly by China (for the reasons discussed in section 2.1
European Commission - Analysis of developments in EU capital flows in the global context
November 2017 27
and are related to financial flows) and to a lesser extent by oil-exporting countries, as a result of the fall in oil prices (driven by less savings originating from the trade balance).
Figure 15: Stock of foreign exchange reserves, % of world GDP
Source: IMF, International Financial Statistics (IFS) and World Economic Outlook (WEO), October 2017.
Figure 16: Major currencies vs. EUR and USD
Source: Bloomberg Notes: Spot rates, indexed to 100 at 1 January 2015. The currency corresponding to each series serves as the base currency, i.e. the series shows the EUR and USD value of 1 unit of that currency. In other words, a positive (negative) change indicates currency appreciation (depreciations) vs. the EUR or USD respectively. Whereas it is temporary factors account for the reduced stock of oil-exporters’ foreign-exchange reserves, that may not be the case for those of China. As China is changing its growth model and is transitioning from investment-led to consumption-led growth, a resumption of the significant accumulation of savings into foreign-exchange reserves of previous years is hard to envisage. Moreover, reserve depletion can have major repercussions on advanced economies even in the short-run: a large share of reserves are held in liquid financial assets such as government bonds of advanced countries,
European Commission - Analysis of developments in EU capital flows in the global context
November 2017 28
and to reduce reserves, those government bonds should be sold first. This in turn can lead to interest rate increases in advanced countries6.
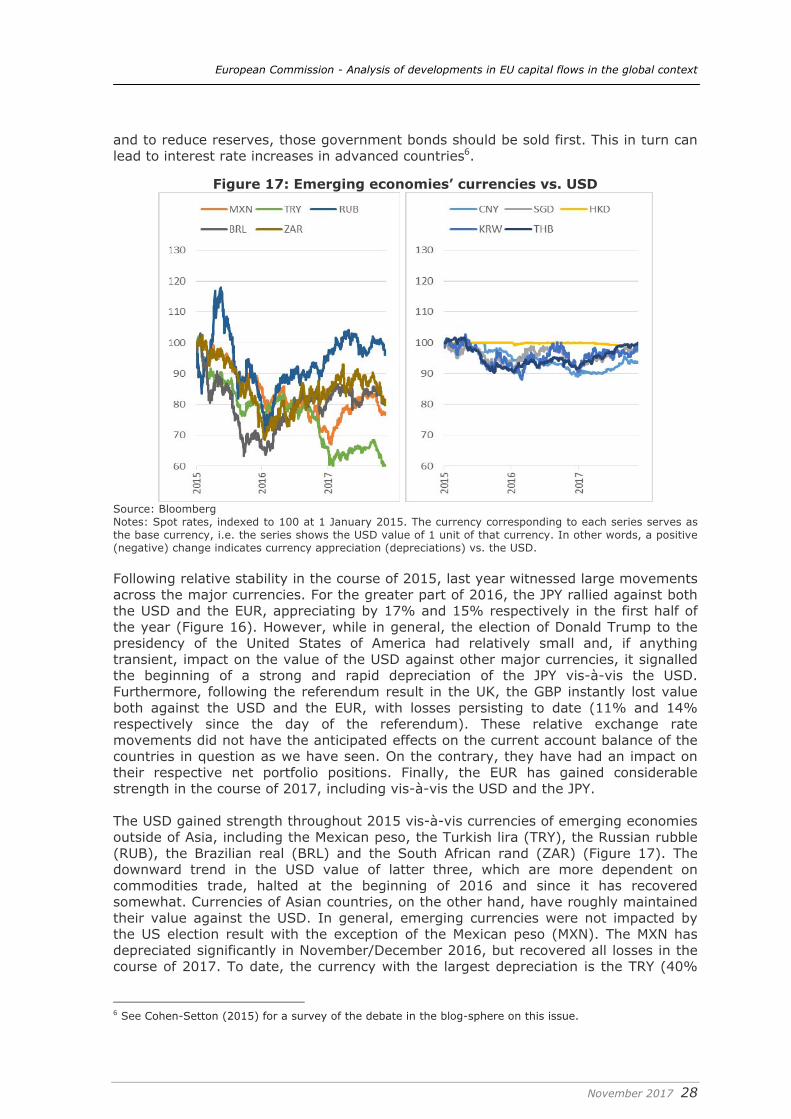
Figure 17: Emerging economies’ currencies vs. USD
Source: Bloomberg Notes: Spot rates, indexed to 100 at 1 January 2015. The currency corresponding to each series serves as the base currency, i.e. the series shows the USD value of 1 unit of that currency. In other words, a positive (negative) change indicates currency appreciation (depreciations) vs. the USD.
Following relative stability in the course of 2015, last year witnessed large movements across the major currencies. For the greater part of 2016, the JPY rallied against both the USD and the EUR, appreciating by 17% and 15% respectively in the first half of the year (Figure 16). However, while in general, the election of Donald Trump to the presidency of the United States of America had relatively small and, if anything transient, impact on the value of the USD against other major currencies, it signalled the beginning of a strong and rapid depreciation of the JPY vis-à-vis the USD. Furthermore, following the referendum result in the UK, the GBP instantly lost value both against the USD and the EUR, with losses persisting to date (11% and 14% respectively since the day of the referendum). These relative exchange rate movements did not have the anticipated effects on the current account balance of the countries in question as we have seen. On the contrary, they have had an impact on their respective net portfolio positions. Finally, the EUR has gained considerable strength in the course of 2017, including vis-à-vis the USD and the JPY. The USD gained strength throughout 2015 vis-à-vis currencies of emerging economies outside of Asia, including the Mexican peso, the Turkish lira (TRY), the Russian rubble (RUB), the Brazilian real (BRL) and the South African rand (ZAR) (Figure 17). The downward trend in the USD value of latter three, which are more dependent on commodities trade, halted at the beginning of 2016 and since it has recovered somewhat. Currencies of Asian countries, on the other hand, have roughly maintained their value against the USD. In general, emerging currencies were not impacted by the US election result with the exception of the Mexican peso (MXN). The MXN has depreciated significantly in November/December 2016, but recovered all losses in the course of 2017. To date, the currency with the largest depreciation is the TRY (40%
6 See Cohen-Setton (2015) for a survey of the debate in the blog-sphere on this issue.
European Commission - Analysis of developments in EU capital flows in the global context
November 2017 29
since January 2015), the bulk of which transpired in the aftermath of the July 2016 failed coup.
2.4. Global trends in the banking sector In much of the preceding, general, analysis of capital flows, we commented on the role of banks in the determination of international capital flows. In this section, we exclusively look into indicators of cross-border banking flows and positions. Across the world, the first half of the 2000s was a period of strong expansion of cross-border banking. However, the global financial crisis of 2008/09 at first and then the euro crisis that followed heralded a period of cross-border deleveraging and contraction of flows. Given that in Europe banks play an outsized role in the financing of companies and households compared to other advanced economies, monitoring banking flows in the context of the more general discussion about international capital flows is of paramount importance. We start from a global perspective. The Bank of International Settlements (BIS) locational banking statistics (LBS) cover the cross-border activity of banks based on the balance of payments concept of residence for a large set of countries. These ‘reporting countries’ are required to report statistics once their banking sectors become relevant for international flows. Therefore, evidence from BIS LBS database is both consistent with a discussion based on balance of payments statistics and allows users to obtain a comprehensive and accurate picture of the role of cross-border bank flows. It should be noted that based on the BoP definition of residence, positions and flows between the head office and foreign affiliates, such as subsidiaries and branches, are included in the BIS LBS. Moreover, cross-border positions (i.e. claims of resident banks in the reporting countries on and liabilities to non-residents in general, including, but not limited to banks) are disaggregated by the country of residence of the counterparty. So, in addition to BoP point of view of aggregate cross-border exposures and funding of banks, the BIS LBS database facilitates the identification of patterns on a bilateral basis. To sum up, in what follows, we primarily focus on gross positions (assets and liabilities) vis-à-vis non-residents and the resulting net cross-border asset position of resident banks, first on an aggregate and then on a bilateral basis. We do the same for the BIS-calculated foreign exchange adjusted change in the stock of assets and liabilities, which approximates cross-border flows (even if contrarily to BoP data flows include valuation changes). To make the analysis tractable, we use the same regional aggregation that is used in rest of the report (see Box 1). A weakness of this aggregation, as we have noted, is that strong intra-group gross flows and positions may distort the interpretation as they inflate numbers, though they are neutral for the net outcome. Luckily, the country counterparty dimension is known in the case of BIS LBS and the decomposition by region that we show exposes such distortions. However, we find little reason to exclude them because the regional aggregation is often partly artificial and in reality these flows remain cross-border. The European Union We begin with the EU, and specifically with euro area creditor countries. Before the great financial crisis, euro area creditor banks were massively accumulating foreign assets. The overall net outflows peaked at 10% of GDP in 2007. Correspondingly, the net asset position of creditor countries’ banks increased fast in the run-up to the crisis and plateaued at about 50% of GDP in 2007-10. Between 2009 and 2012, banks in the creditor euro area countries reduced foreign exposures substantially. Initially, in 2008-09 the retrenchment took place with the UK. The flight of banks from euro area debtor countries and Italy is also evident in 2010-12. The reduction of cross-border
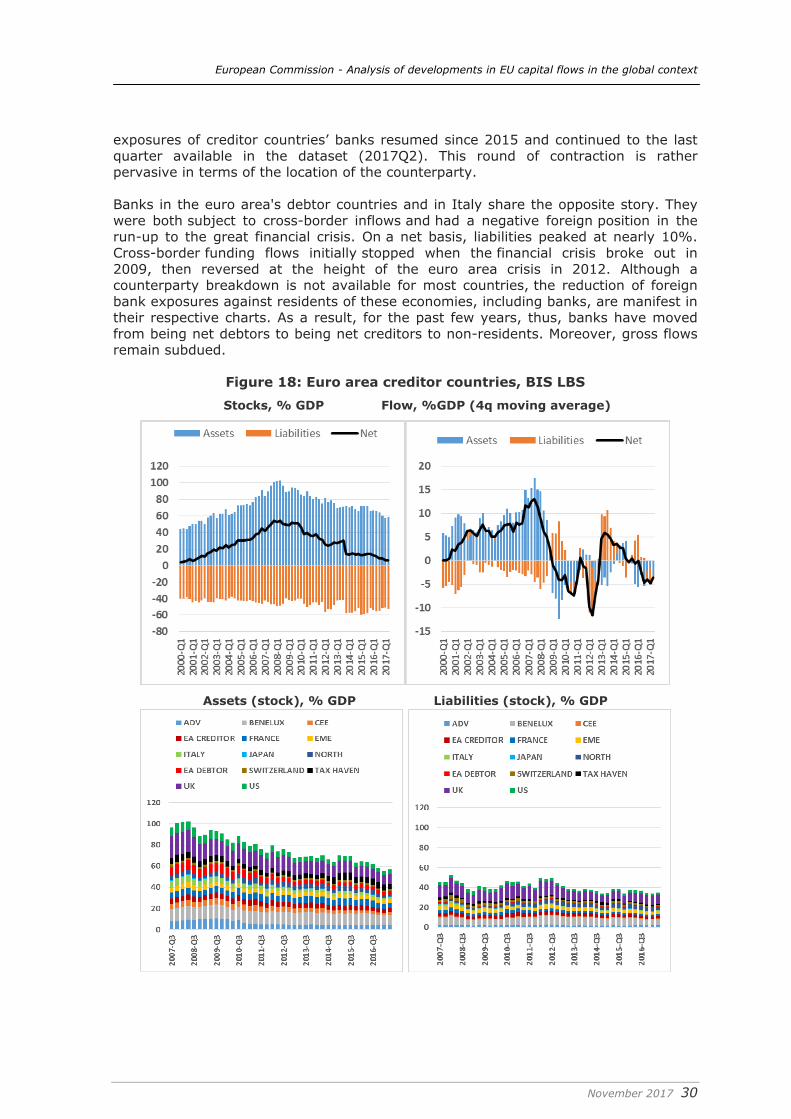
European Commission - Analysis of developments in EU capital flows in the global context
November 2017 30
exposures of creditor countries’ banks resumed since 2015 and continued to the last quarter available in the dataset (2017Q2). This round of contraction is rather pervasive in terms of the location of the counterparty. Banks in the euro area's debtor countries and in Italy share the opposite story. They were both subject to cross-border inflows and had a negative foreign position in the run-up to the great financial crisis. On a net basis, liabilities peaked at nearly 10%. Cross-border funding flows initially stopped when the financial crisis broke out in 2009, then reversed at the height of the euro area crisis in 2012. Although a counterparty breakdown is not available for most countries, the reduction of foreign bank exposures against residents of these economies, including banks, are manifest in their respective charts. As a result, for the past few years, thus, banks have moved from being net debtors to being net creditors to non-residents. Moreover, gross flows remain subdued.
Figure 18: Euro area creditor countries, BIS LBS Stocks, % GDP Flow, %GDP (4q moving average)
Assets (stock), % GDP Liabilities (stock), % GDP
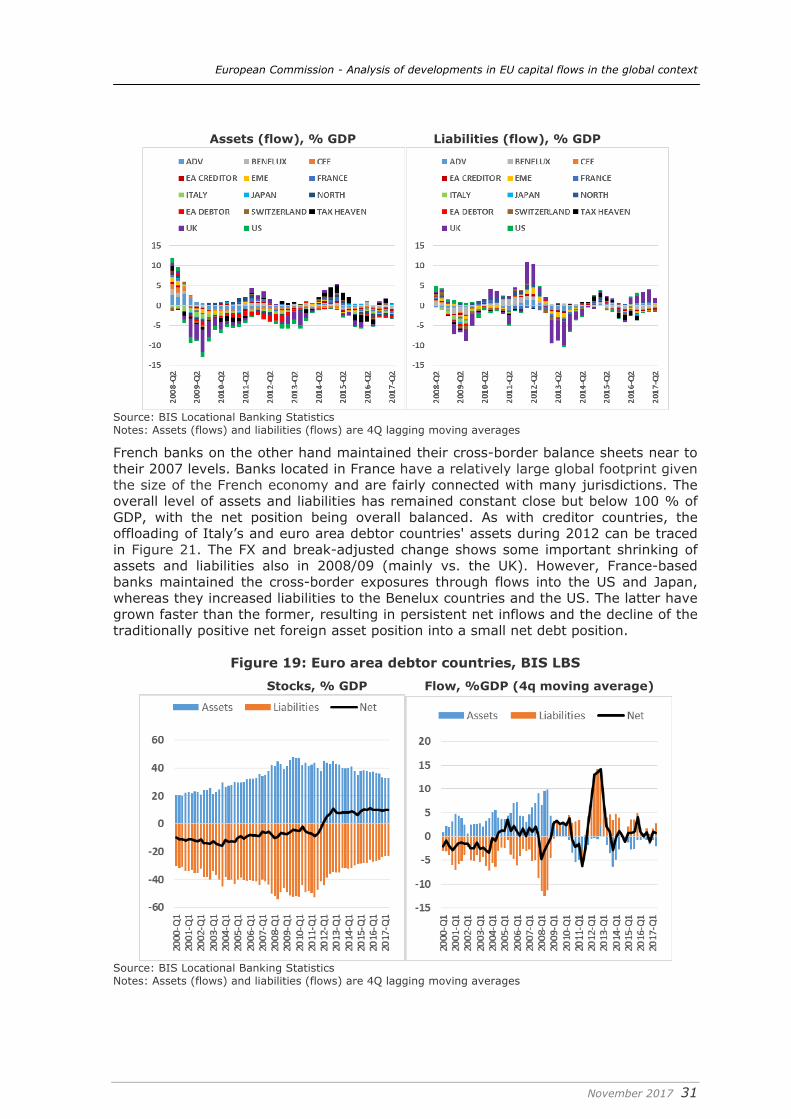
European Commission - Analysis of developments in EU capital flows in the global context
November 2017 31
Assets (flow), % GDP Liabilities (flow), % GDP
Source: BIS Locational Banking Statistics Notes: Assets (flows) and liabilities (flows) are 4Q lagging moving averages
French banks on the other hand maintained their cross-border balance sheets near to their 2007 levels. Banks located in France have a relatively large global footprint given the size of the French economy and are fairly connected with many jurisdictions. The overall level of assets and liabilities has remained constant close but below 100 % of GDP, with the net position being overall balanced. As with creditor countries, the offloading of Italy’s and euro area debtor countries' assets during 2012 can be traced in Figure 21. The FX and break-adjusted change shows some important shrinking of assets and liabilities also in 2008/09 (mainly vs. the UK). However, France-based banks maintained the cross-border exposures through flows into the US and Japan, whereas they increased liabilities to the Benelux countries and the US. The latter have grown faster than the former, resulting in persistent net inflows and the decline of the traditionally positive net foreign asset position into a small net debt position.
Figure 19: Euro area debtor countries, BIS LBS Stocks, % GDP Flow, %GDP (4q moving average)
Source: BIS Locational Banking Statistics Notes: Assets (flows) and liabilities (flows) are 4Q lagging moving averages
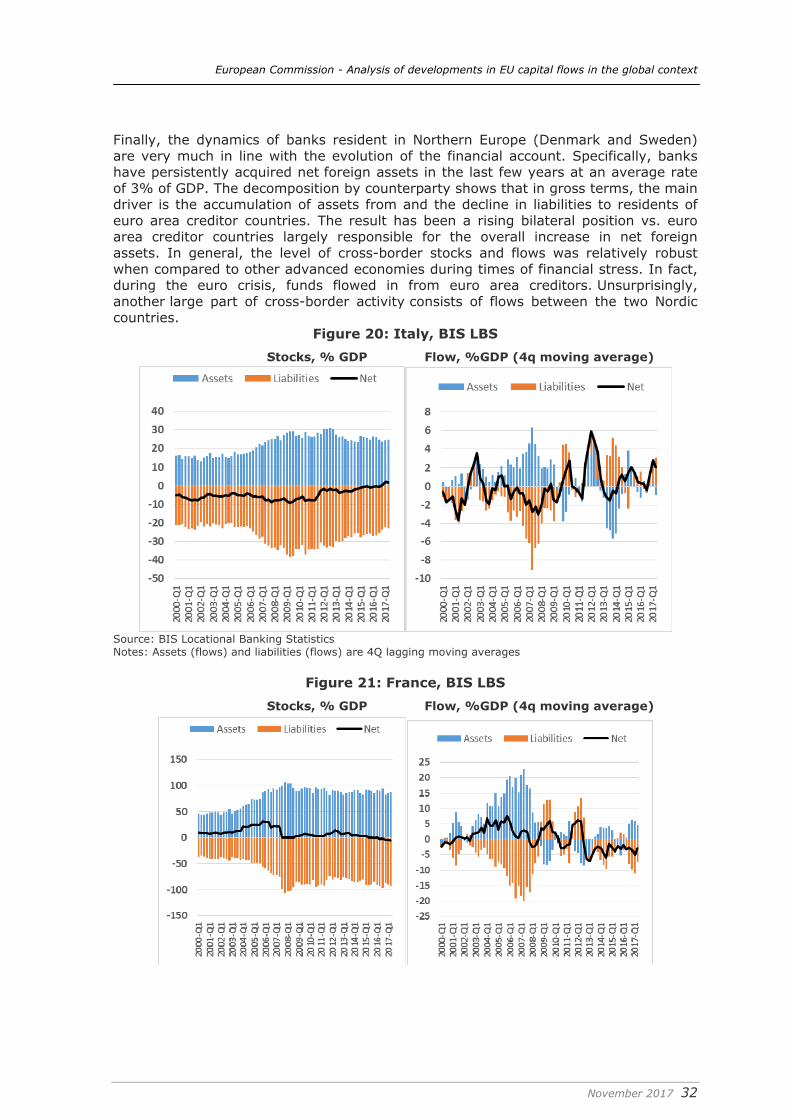
European Commission - Analysis of developments in EU capital flows in the global context
November 2017 32
Finally, the dynamics of banks resident in Northern Europe (Denmark and Sweden) are very much in line with the evolution of the financial account. Specifically, banks have persistently acquired net foreign assets in the last few years at an average rate of 3% of GDP. The decomposition by counterparty shows that in gross terms, the main driver is the accumulation of assets from and the decline in liabilities to residents of euro area creditor countries. The result has been a rising bilateral position vs. euro area creditor countries largely responsible for the overall increase in net foreign assets. In general, the level of cross-border stocks and flows was relatively robust when compared to other advanced economies during times of financial stress. In fact, during the euro crisis, funds flowed in from euro area creditors. Unsurprisingly, another large part of cross-border activity consists of flows between the two Nordic countries.
Figure 20: Italy, BIS LBS Stocks, % GDP Flow, %GDP (4q moving average)
Source: BIS Locational Banking Statistics Notes: Assets (flows) and liabilities (flows) are 4Q lagging moving averages
Figure 21: France, BIS LBS
Stocks, % GDP Flow, %GDP (4q moving average)
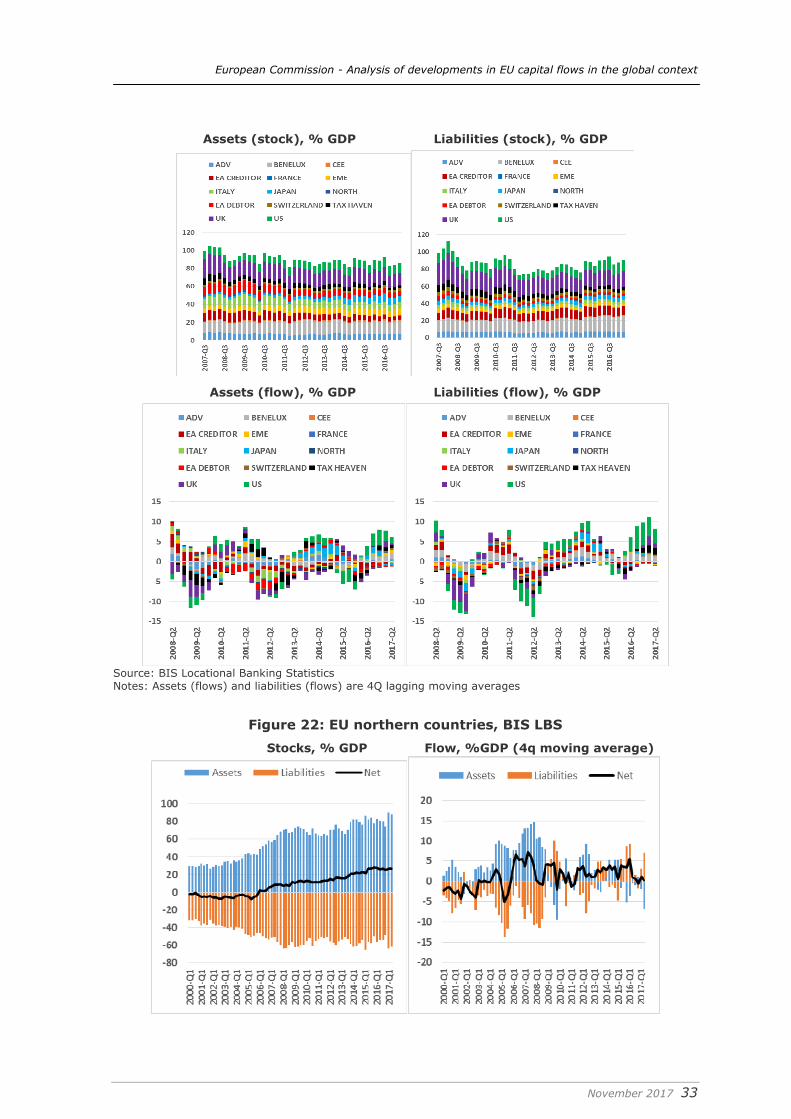
European Commission - Analysis of developments in EU capital flows in the global context
November 2017 33
Assets (stock), % GDP Liabilities (stock), % GDP
Assets (flow), % GDP Liabilities (flow), % GDP
Source: BIS Locational Banking Statistics Notes: Assets (flows) and liabilities (flows) are 4Q lagging moving averages
Figure 22: EU northern countries, BIS LBS
Stocks, % GDP Flow, %GDP (4q moving average)
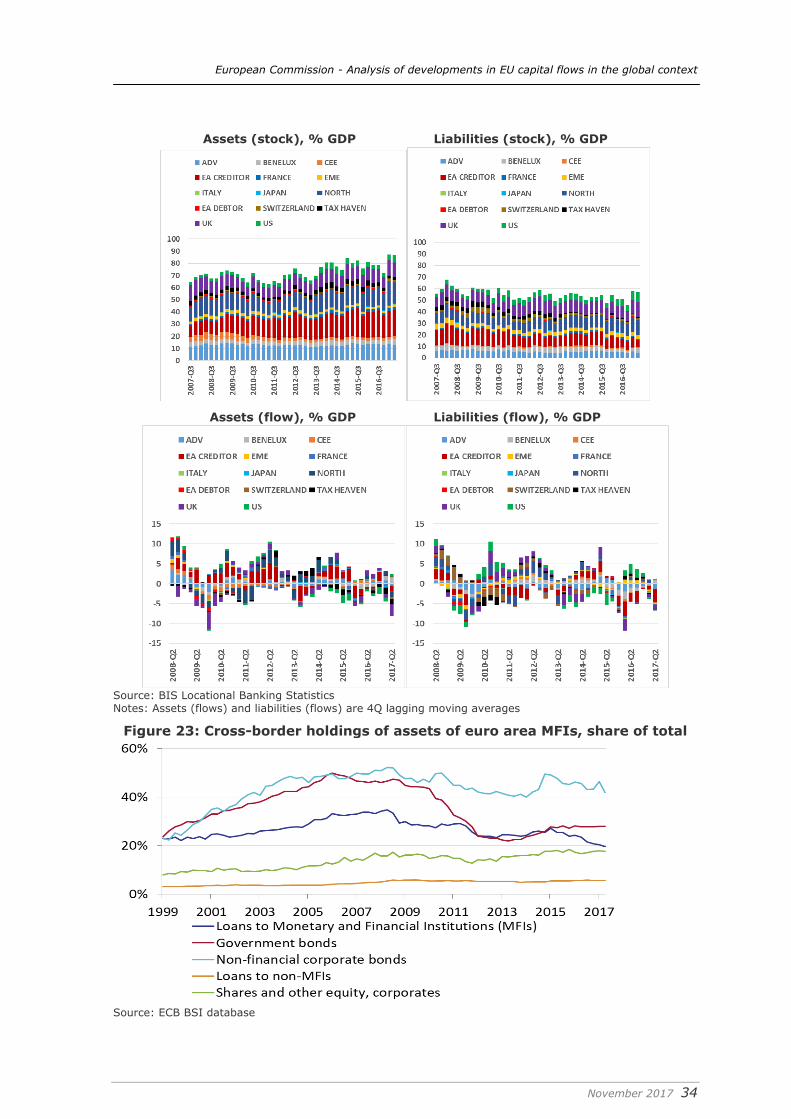
European Commission - Analysis of developments in EU capital flows in the global context
November 2017 34
Assets (stock), % GDP Liabilities (stock), % GDP
Assets (flow), % GDP Liabilities (flow), % GDP
Source: BIS Locational Banking Statistics Notes: Assets (flows) and liabilities (flows) are 4Q lagging moving averages
Figure 23: Cross-border holdings of assets of euro area MFIs, share of total
Source: ECB BSI database
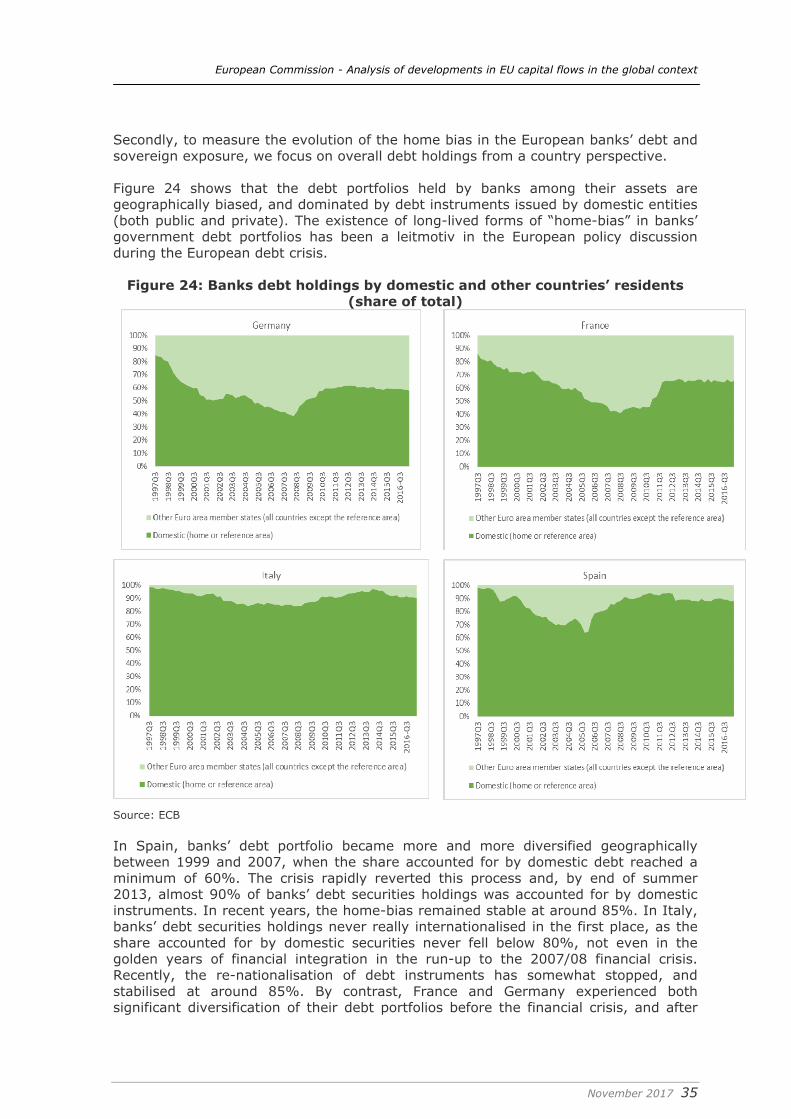
European Commission - Analysis of developments in EU capital flows in the global context
November 2017 35
Secondly, to measure the evolution of the home bias in the European banks’ debt and sovereign exposure, we focus on overall debt holdings from a country perspective. Figure 24 shows that the debt portfolios held by banks among their assets are geographically biased, and dominated by debt instruments issued by domestic entities (both public and private). The existence of long-lived forms of “home-bias” in banks’ government debt portfolios has been a leitmotiv in the European policy discussion during the European debt crisis.
Figure 24: Banks debt holdings by domestic and other countries’ residents (share of total)
Source: ECB In Spain, banks’ debt portfolio became more and more diversified geographically between 1999 and 2007, when the share accounted for by domestic debt reached a minimum of 60%. The crisis rapidly reverted this process and, by end of summer 2013, almost 90% of banks’ debt securities holdings was accounted for by domestic instruments. In recent years, the home-bias remained stable at around 85%. In Italy, banks’ debt securities holdings never really internationalised in the first place, as the share accounted for by domestic securities never fell below 80%, not even in the golden years of financial integration in the run-up to the 2007/08 financial crisis. Recently, the re-nationalisation of debt instruments has somewhat stopped, and stabilised at around 85%. By contrast, France and Germany experienced both significant diversification of their debt portfolios before the financial crisis, and after
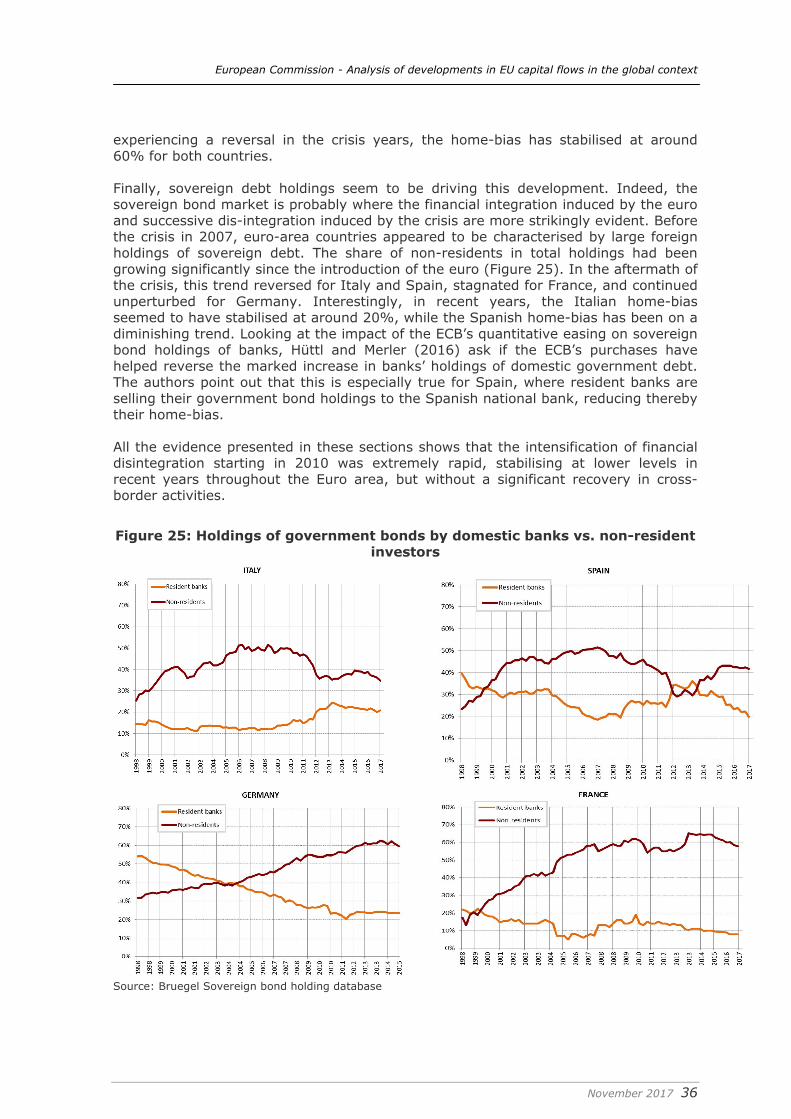
European Commission - Analysis of developments in EU capital flows in the global context
November 2017 36
experiencing a reversal in the crisis years, the home-bias has stabilised at around 60% for both countries. Finally, sovereign debt holdings seem to be driving this development. Indeed, the sovereign bond market is probably where the financial integration induced by the euro and successive dis-integration induced by the crisis are more strikingly evident. Before the crisis in 2007, euro-area countries appeared to be characterised by large foreign holdings of sovereign debt. The share of non-residents in total holdings had been growing significantly since the introduction of the euro (Figure 25). In the aftermath of the crisis, this trend reversed for Italy and Spain, stagnated for France, and continued unperturbed for Germany. Interestingly, in recent years, the Italian home-bias seemed to have stabilised at around 20%, while the Spanish home-bias has been on a diminishing trend. Looking at the impact of the ECB’s quantitative easing on sovereign bond holdings of banks, Hüttl and Merler (2016) ask if the ECB’s purchases have helped reverse the marked increase in banks’ holdings of domestic government debt. The authors point out that this is especially true for Spain, where resident banks are selling their government bond holdings to the Spanish national bank, reducing thereby their home-bias. All the evidence presented in these sections shows that the intensification of financial disintegration starting in 2010 was extremely rapid, stabilising at lower levels in recent years throughout the Euro area, but without a significant recovery in cross-border activities.
Figure 25: Holdings of government bonds by domestic banks vs. non-resident investors
Source: Bruegel Sovereign bond holding database
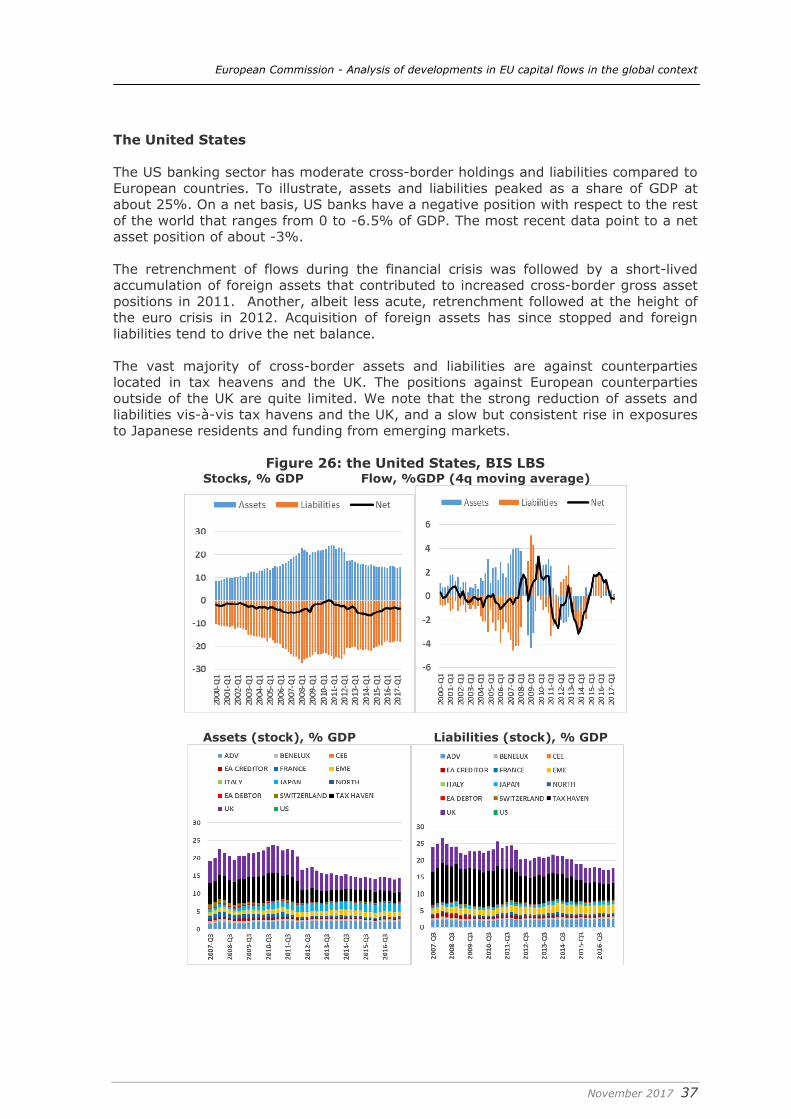
European Commission - Analysis of developments in EU capital flows in the global context
November 2017 37
The United States The US banking sector has moderate cross-border holdings and liabilities compared to European countries. To illustrate, assets and liabilities peaked as a share of GDP at about 25%. On a net basis, US banks have a negative position with respect to the rest of the world that ranges from 0 to -6.5% of GDP. The most recent data point to a net asset position of about -3%. The retrenchment of flows during the financial crisis was followed by a short-lived accumulation of foreign assets that contributed to increased cross-border gross asset positions in 2011. Another, albeit less acute, retrenchment followed at the height of the euro crisis in 2012. Acquisition of foreign assets has since stopped and foreign liabilities tend to drive the net balance. The vast majority of cross-border assets and liabilities are against counterparties located in tax heavens and the UK. The positions against European counterparties outside of the UK are quite limited. We note that the strong reduction of assets and liabilities vis-à-vis tax havens and the UK, and a slow but consistent rise in exposures to Japanese residents and funding from emerging markets.
Figure 26: the United States, BIS LBS Stocks, % GDP Flow, %GDP (4q moving average)
Assets (stock), % GDP Liabilities (stock), % GDP
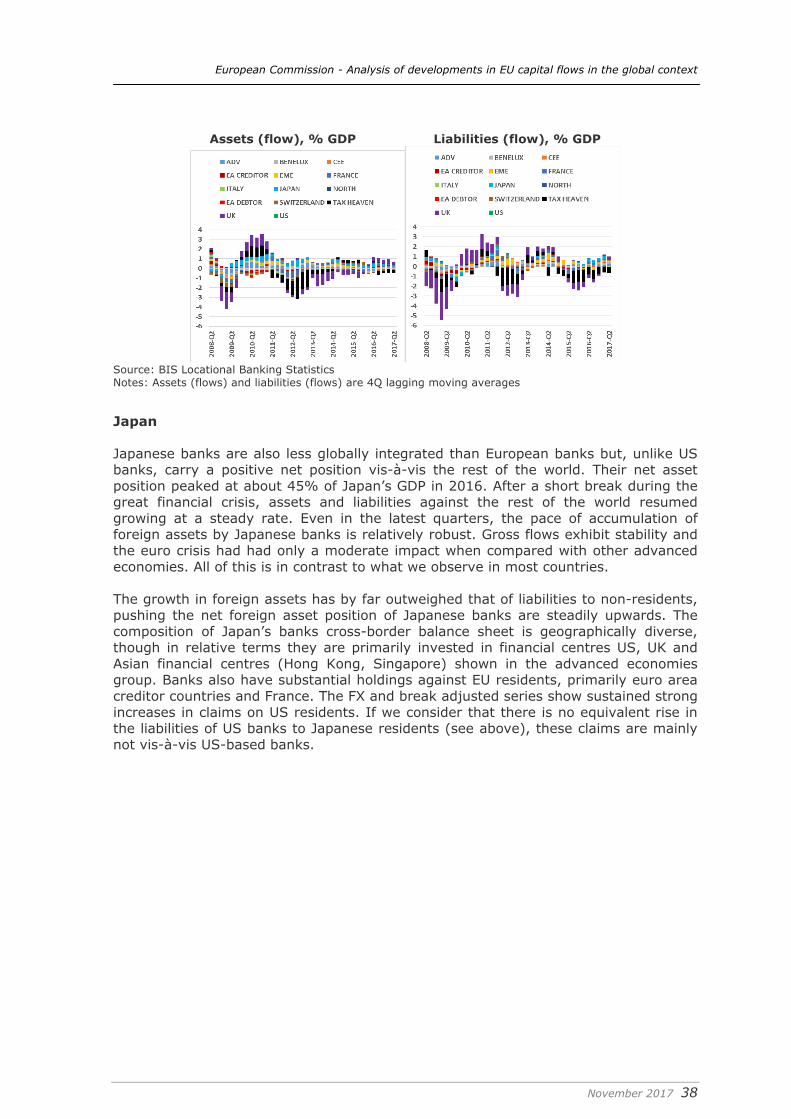
European Commission - Analysis of developments in EU capital flows in the global context
November 2017 38
Assets (flow), % GDP Liabilities (flow), % GDP
Source: BIS Locational Banking Statistics Notes: Assets (flows) and liabilities (flows) are 4Q lagging moving averages
Japan Japanese banks are also less globally integrated than European banks but, unlike US banks, carry a positive net position vis-à-vis the rest of the world. Their net asset position peaked at about 45% of Japan’s GDP in 2016. After a short break during the great financial crisis, assets and liabilities against the rest of the world resumed growing at a steady rate. Even in the latest quarters, the pace of accumulation of foreign assets by Japanese banks is relatively robust. Gross flows exhibit stability and the euro crisis had had only a moderate impact when compared with other advanced economies. All of this is in contrast to what we observe in most countries. The growth in foreign assets has by far outweighed that of liabilities to non-residents, pushing the net foreign asset position of Japanese banks are steadily upwards. The composition of Japan’s banks cross-border balance sheet is geographically diverse, though in relative terms they are primarily invested in financial centres US, UK and Asian financial centres (Hong Kong, Singapore) shown in the advanced economies group. Banks also have substantial holdings against EU residents, primarily euro area creditor countries and France. The FX and break adjusted series show sustained strong increases in claims on US residents. If we consider that there is no equivalent rise in the liabilities of US banks to Japanese residents (see above), these claims are mainly not vis-à-vis US-based banks.
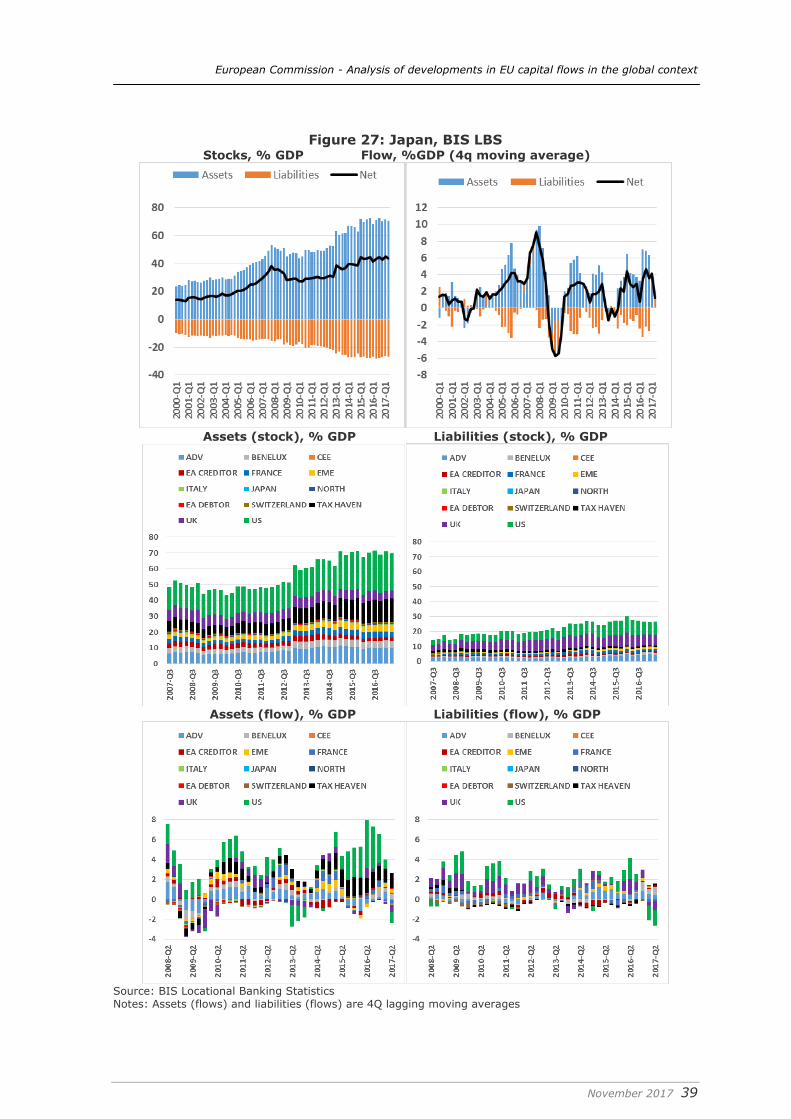
European Commission - Analysis of developments in EU capital flows in the global context
November 2017 39
Figure 27: Japan, BIS LBS Stocks, % GDP Flow, %GDP (4q moving average)
Assets (stock), % GDP Liabilities (stock), % GDP
Assets (flow), % GDP Liabilities (flow), % GDP
Source: BIS Locational Banking Statistics Notes: Assets (flows) and liabilities (flows) are 4Q lagging moving averages
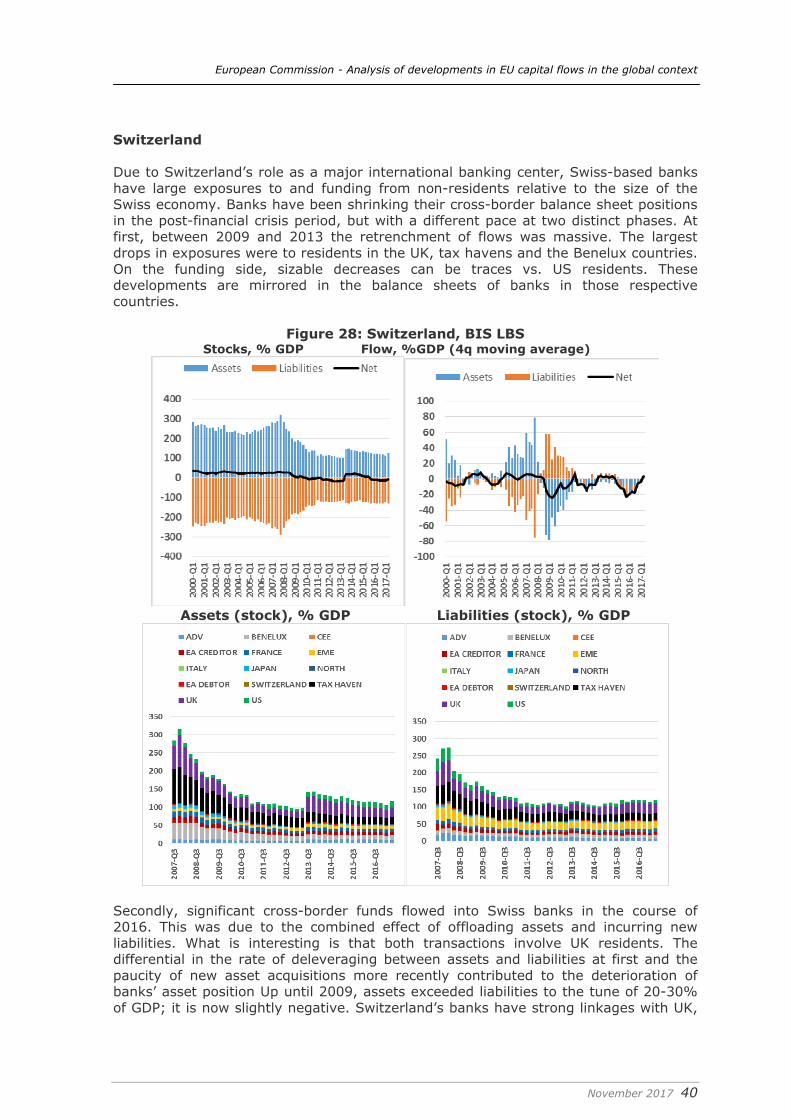
European Commission - Analysis of developments in EU capital flows in the global context
November 2017 40
Switzerland Due to Switzerland’s role as a major international banking center, Swiss-based banks have large exposures to and funding from non-residents relative to the size of the Swiss economy. Banks have been shrinking their cross-border balance sheet positions in the post-financial crisis period, but with a different pace at two distinct phases. At first, between 2009 and 2013 the retrenchment of flows was massive. The largest drops in exposures were to residents in the UK, tax havens and the Benelux countries. On the funding side, sizable decreases can be traces vs. US residents. These developments are mirrored in the balance sheets of banks in those respective countries.
Figure 28: Switzerland, BIS LBS Stocks, % GDP Flow, %GDP (4q moving average)
Assets (stock), % GDP Liabilities (stock), % GDP
Secondly, significant cross-border funds flowed into Swiss banks in the course of 2016. This was due to the combined effect of offloading assets and incurring new liabilities. What is interesting is that both transactions involve UK residents. The differential in the rate of deleveraging between assets and liabilities at first and the paucity of new asset acquisitions more recently contributed to the deterioration of banks’ asset position Up until 2009, assets exceeded liabilities to the tune of 20-30% of GDP; it is now slightly negative. Switzerland’s banks have strong linkages with UK,
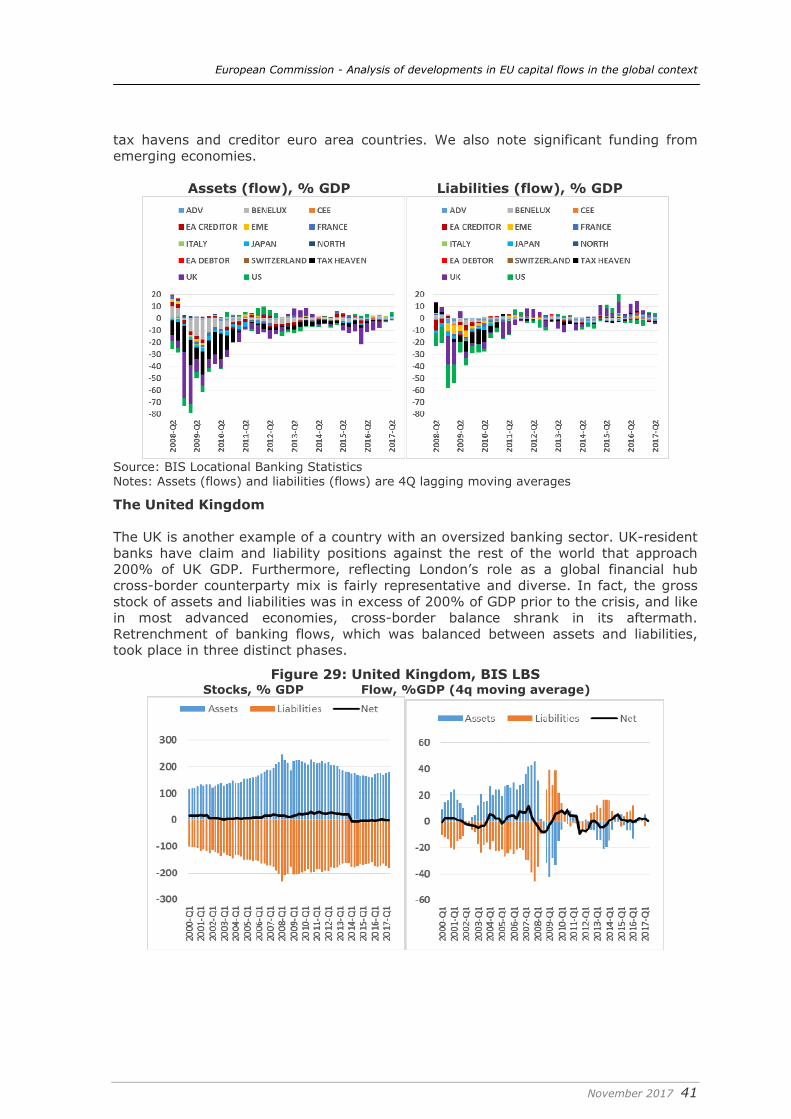
European Commission - Analysis of developments in EU capital flows in the global context
November 2017 41
tax havens and creditor euro area countries. We also note significant funding from emerging economies.
Assets (flow), % GDP Liabilities (flow), % GDP
Source: BIS Locational Banking Statistics Notes: Assets (flows) and liabilities (flows) are 4Q lagging moving averages
The United Kingdom The UK is another example of a country with an oversized banking sector. UK-resident banks have claim and liability positions against the rest of the world that approach 200% of UK GDP. Furthermore, reflecting London’s role as a global financial hub cross-border counterparty mix is fairly representative and diverse. In fact, the gross stock of assets and liabilities was in excess of 200% of GDP prior to the crisis, and like in most advanced economies, cross-border balance shrank in its aftermath. Retrenchment of banking flows, which was balanced between assets and liabilities, took place in three distinct phases.
Figure 29: United Kingdom, BIS LBS Stocks, % GDP Flow, %GDP (4q moving average)
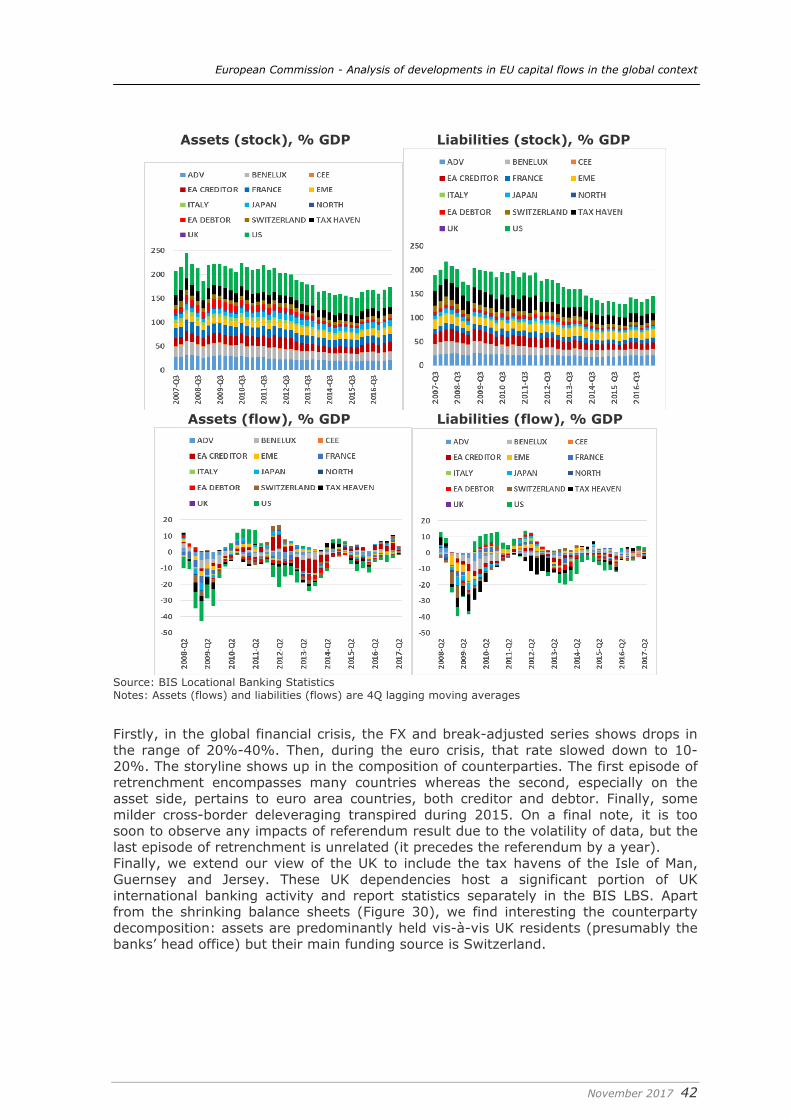
European Commission - Analysis of developments in EU capital flows in the global context
November 2017 42
Assets (stock), % GDP Liabilities (stock), % GDP
Assets (flow), % GDP Liabilities (flow), % GDP
Source: BIS Locational Banking Statistics Notes: Assets (flows) and liabilities (flows) are 4Q lagging moving averages
Firstly, in the global financial crisis, the FX and break-adjusted series shows drops in the range of 20%-40%. Then, during the euro crisis, that rate slowed down to 10-20%. The storyline shows up in the composition of counterparties. The first episode of retrenchment encompasses many countries whereas the second, especially on the asset side, pertains to euro area countries, both creditor and debtor. Finally, some milder cross-border deleveraging transpired during 2015. On a final note, it is too soon to observe any impacts of referendum result due to the volatility of data, but the last episode of retrenchment is unrelated (it precedes the referendum by a year). Finally, we extend our view of the UK to include the tax havens of the Isle of Man, Guernsey and Jersey. These UK dependencies host a significant portion of UK international banking activity and report statistics separately in the BIS LBS. Apart from the shrinking balance sheets (Figure 30), we find interesting the counterparty decomposition: assets are predominantly held vis-à-vis UK residents (presumably the banks’ head office) but their main funding source is Switzerland.
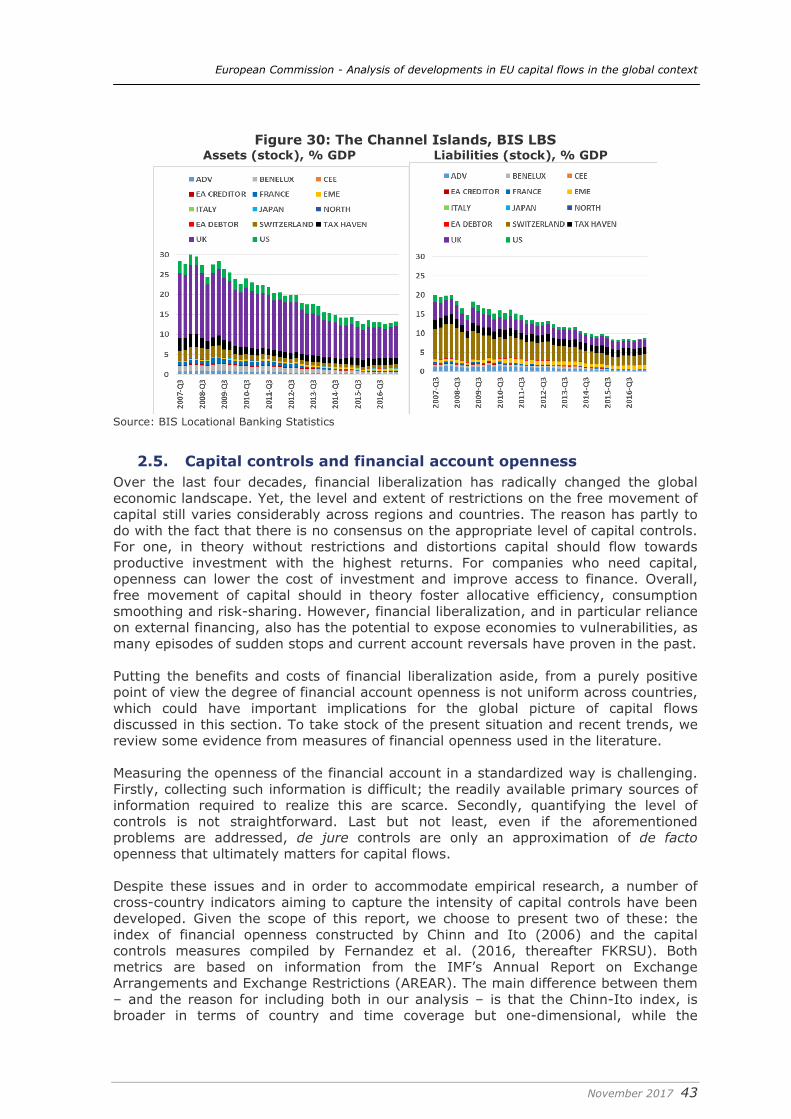
European Commission - Analysis of developments in EU capital flows in the global context
November 2017 43
Figure 30: The Channel Islands, BIS LBS Assets (stock), % GDP Liabilities (stock), % GDP
Source: BIS Locational Banking Statistics
2.5. Capital controls and financial account openness Over the last four decades, financial liberalization has radically changed the global economic landscape. Yet, the level and extent of restrictions on the free movement of capital still varies considerably across regions and countries. The reason has partly to do with the fact that there is no consensus on the appropriate level of capital controls. For one, in theory without restrictions and distortions capital should flow towards productive investment with the highest returns. For companies who need capital, openness can lower the cost of investment and improve access to finance. Overall, free movement of capital should in theory foster allocative efficiency, consumption smoothing and risk-sharing. However, financial liberalization, and in particular reliance on external financing, also has the potential to expose economies to vulnerabilities, as many episodes of sudden stops and current account reversals have proven in the past. Putting the benefits and costs of financial liberalization aside, from a purely positive point of view the degree of financial account openness is not uniform across countries, which could have important implications for the global picture of capital flows discussed in this section. To take stock of the present situation and recent trends, we review some evidence from measures of financial openness used in the literature. Measuring the openness of the financial account in a standardized way is challenging. Firstly, collecting such information is difficult; the readily available primary sources of information required to realize this are scarce. Secondly, quantifying the level of controls is not straightforward. Last but not least, even if the aforementioned problems are addressed, de jure controls are only an approximation of de facto openness that ultimately matters for capital flows. Despite these issues and in order to accommodate empirical research, a number of cross-country indicators aiming to capture the intensity of capital controls have been developed. Given the scope of this report, we choose to present two of these: the index of financial openness constructed by Chinn and Ito (2006) and the capital controls measures compiled by Fernandez et al. (2016, thereafter FKRSU). Both metrics are based on information from the IMF’s Annual Report on Exchange Arrangements and Exchange Restrictions (AREAR). The main difference between them – and the reason for including both in our analysis – is that the Chinn-Ito index, is broader in terms of country and time coverage but one-dimensional, while the
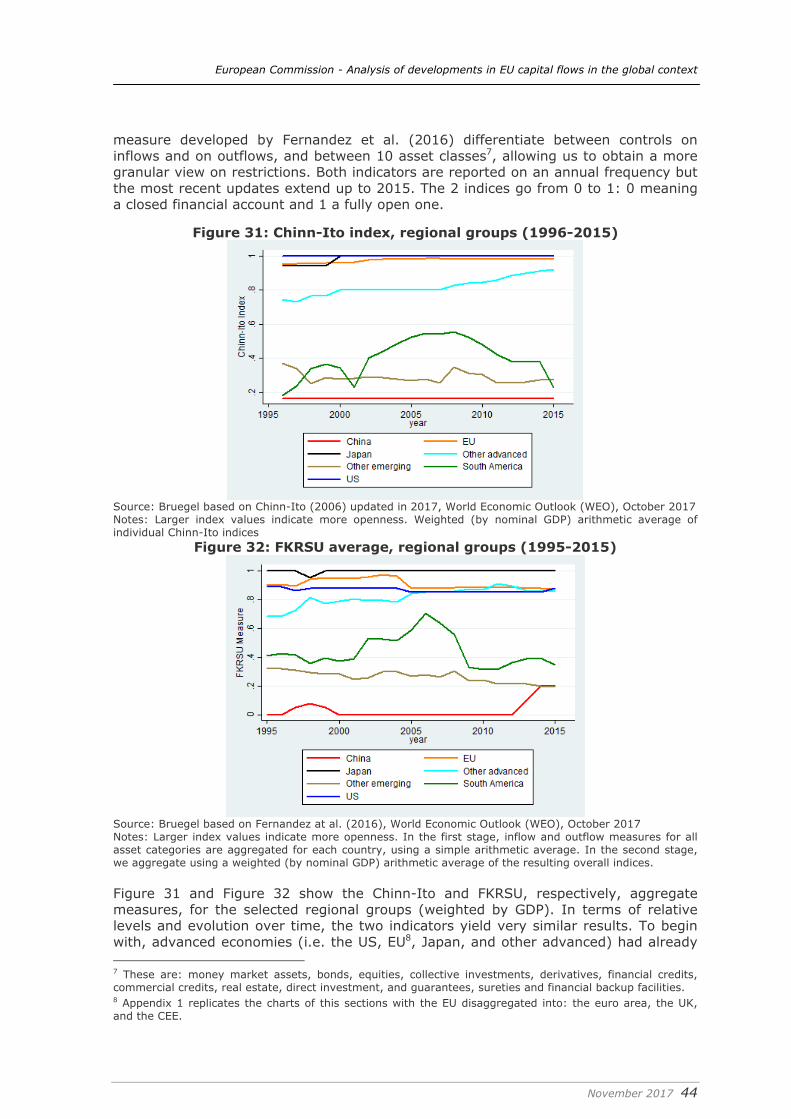
European Commission - Analysis of developments in EU capital flows in the global context
November 2017 44
measure developed by Fernandez et al. (2016) differentiate between controls on inflows and on outflows, and between 10 asset classes7, allowing us to obtain a more granular view on restrictions. Both indicators are reported on an annual frequency but the most recent updates extend up to 2015. The 2 indices go from 0 to 1: 0 meaning a closed financial account and 1 a fully open one.
Figure 31: Chinn-Ito index, regional groups (1996-2015)
Source: Bruegel based on Chinn-Ito (2006) updated in 2017, World Economic Outlook (WEO), October 2017 Notes: Larger index values indicate more openness. Weighted (by nominal GDP) arithmetic average of individual Chinn-Ito indices
Figure 32: FKRSU average, regional groups (1995-2015)
Source: Bruegel based on Fernandez at al. (2016), World Economic Outlook (WEO), October 2017 Notes: Larger index values indicate more openness. In the first stage, inflow and outflow measures for all asset categories are aggregated for each country, using a simple arithmetic average. In the second stage, we aggregate using a weighted (by nominal GDP) arithmetic average of the resulting overall indices. Figure 31 and Figure 32 show the Chinn-Ito and FKRSU, respectively, aggregate measures, for the selected regional groups (weighted by GDP). In terms of relative levels and evolution over time, the two indicators yield very similar results. To begin with, advanced economies (i.e. the US, EU8, Japan, and other advanced) had already 7 These are: money market assets, bonds, equities, collective investments, derivatives, financial credits, commercial credits, real estate, direct investment, and guarantees, sureties and financial backup facilities. 8 Appendix 1 replicates the charts of this sections with the EU disaggregated into: the euro area, the UK, and the CEE.
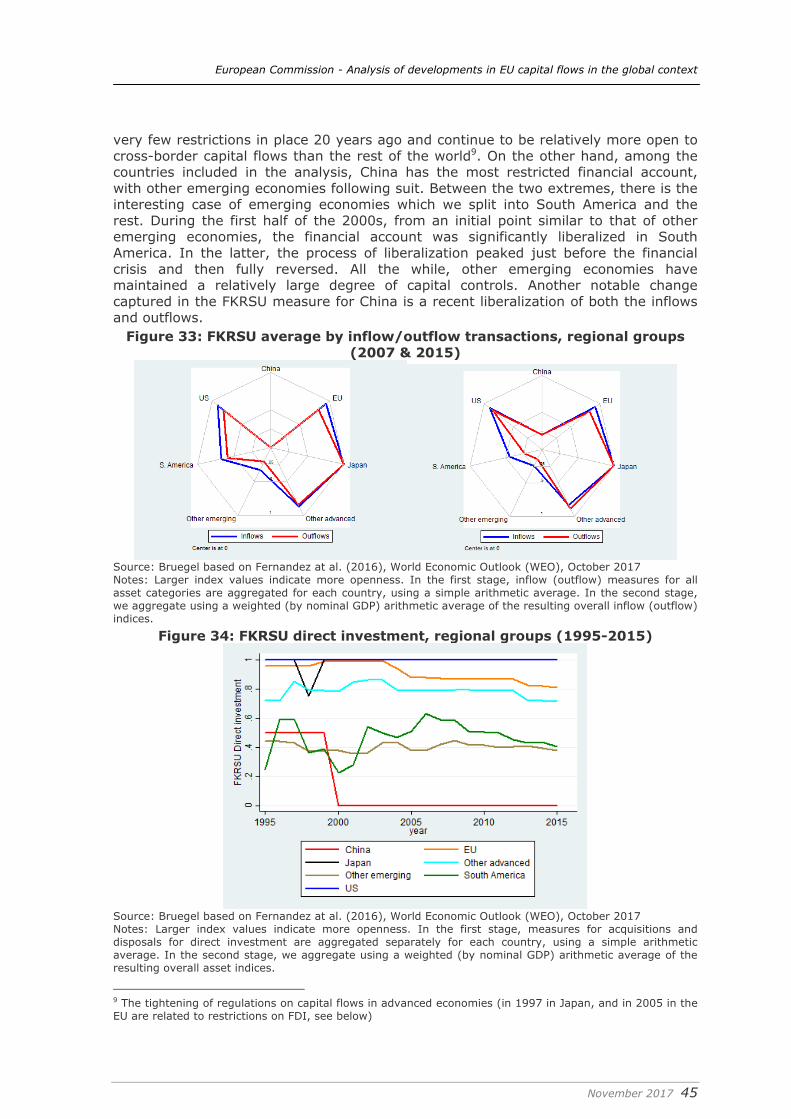
European Commission - Analysis of developments in EU capital flows in the global context
November 2017 45
very few restrictions in place 20 years ago and continue to be relatively more open to cross-border capital flows than the rest of the world9. On the other hand, among the countries included in the analysis, China has the most restricted financial account, with other emerging economies following suit. Between the two extremes, there is the interesting case of emerging economies which we split into South America and the rest. During the first half of the 2000s, from an initial point similar to that of other emerging economies, the financial account was significantly liberalized in South America. In the latter, the process of liberalization peaked just before the financial crisis and then fully reversed. All the while, other emerging economies have maintained a relatively large degree of capital controls. Another notable change captured in the FKRSU measure for China is a recent liberalization of both the inflows and outflows.
Figure 33: FKRSU average by inflow/outflow transactions, regional groups (2007 & 2015)
Source: Bruegel based on Fernandez at al. (2016), World Economic Outlook (WEO), October 2017 Notes: Larger index values indicate more openness. In the first stage, inflow (outflow) measures for all asset categories are aggregated for each country, using a simple arithmetic average. In the second stage, we aggregate using a weighted (by nominal GDP) arithmetic average of the resulting overall inflow (outflow) indices.
Figure 34: FKRSU direct investment, regional groups (1995-2015)
Source: Bruegel based on Fernandez at al. (2016), World Economic Outlook (WEO), October 2017 Notes: Larger index values indicate more openness. In the first stage, measures for acquisitions and disposals for direct investment are aggregated separately for each country, using a simple arithmetic average. In the second stage, we aggregate using a weighted (by nominal GDP) arithmetic average of the resulting overall asset indices.
9 The tightening of regulations on capital flows in advanced economies (in 1997 in Japan, and in 2005 in the EU are related to restrictions on FDI, see below)
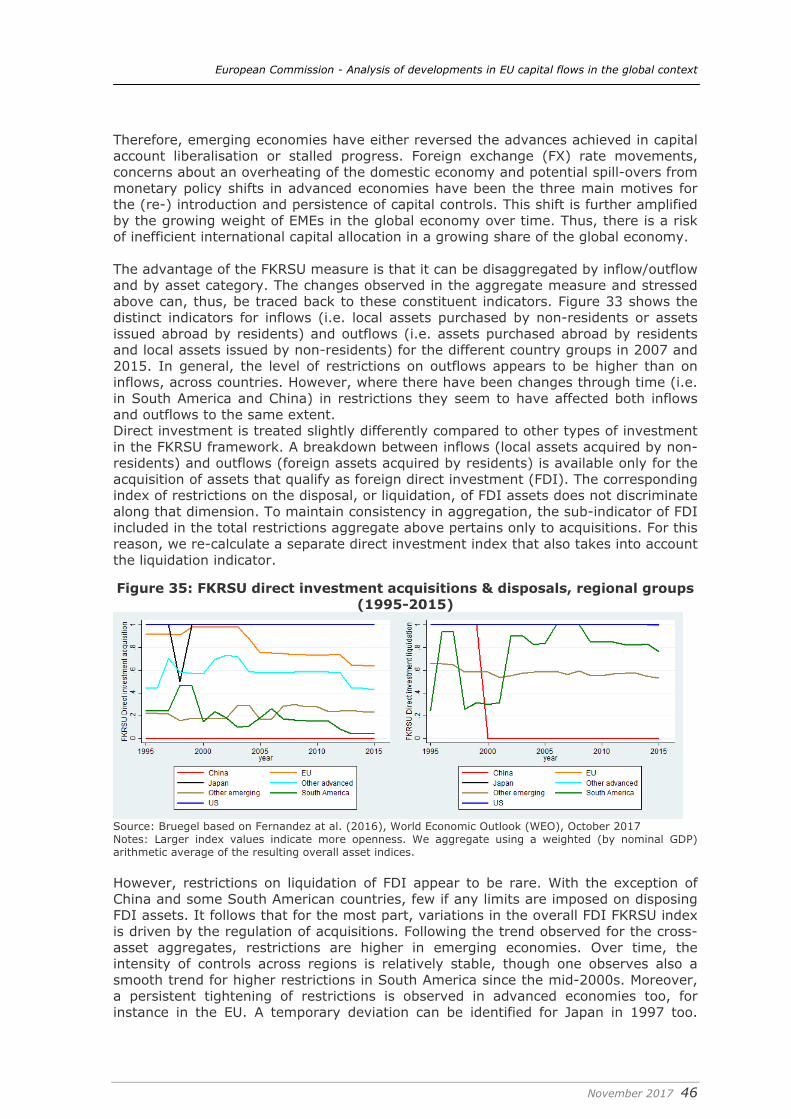
European Commission - Analysis of developments in EU capital flows in the global context
November 2017 46
Therefore, emerging economies have either reversed the advances achieved in capital account liberalisation or stalled progress. Foreign exchange (FX) rate movements, concerns about an overheating of the domestic economy and potential spill-overs from monetary policy shifts in advanced economies have been the three main motives for the (re-) introduction and persistence of capital controls. This shift is further amplified by the growing weight of EMEs in the global economy over time. Thus, there is a risk of inefficient international capital allocation in a growing share of the global economy. The advantage of the FKRSU measure is that it can be disaggregated by inflow/outflow and by asset category. The changes observed in the aggregate measure and stressed above can, thus, be traced back to these constituent indicators. Figure 33 shows the distinct indicators for inflows (i.e. local assets purchased by non-residents or assets issued abroad by residents) and outflows (i.e. assets purchased abroad by residents and local assets issued by non-residents) for the different country groups in 2007 and 2015. In general, the level of restrictions on outflows appears to be higher than on inflows, across countries. However, where there have been changes through time (i.e. in South America and China) in restrictions they seem to have affected both inflows and outflows to the same extent. Direct investment is treated slightly differently compared to other types of investment in the FKRSU framework. A breakdown between inflows (local assets acquired by non-residents) and outflows (foreign assets acquired by residents) is available only for the acquisition of assets that qualify as foreign direct investment (FDI). The corresponding index of restrictions on the disposal, or liquidation, of FDI assets does not discriminate along that dimension. To maintain consistency in aggregation, the sub-indicator of FDI included in the total restrictions aggregate above pertains only to acquisitions. For this reason, we re-calculate a separate direct investment index that also takes into account the liquidation indicator.
Figure 35: FKRSU direct investment acquisitions & disposals, regional groups (1995-2015)
Source: Bruegel based on Fernandez at al. (2016), World Economic Outlook (WEO), October 2017 Notes: Larger index values indicate more openness. We aggregate using a weighted (by nominal GDP) arithmetic average of the resulting overall asset indices. However, restrictions on liquidation of FDI appear to be rare. With the exception of China and some South American countries, few if any limits are imposed on disposing FDI assets. It follows that for the most part, variations in the overall FDI FKRSU index is driven by the regulation of acquisitions. Following the trend observed for the cross-asset aggregates, restrictions are higher in emerging economies. Over time, the intensity of controls across regions is relatively stable, though one observes also a smooth trend for higher restrictions in South America since the mid-2000s. Moreover, a persistent tightening of restrictions is observed in advanced economies too, for instance in the EU. A temporary deviation can be identified for Japan in 1997 too.
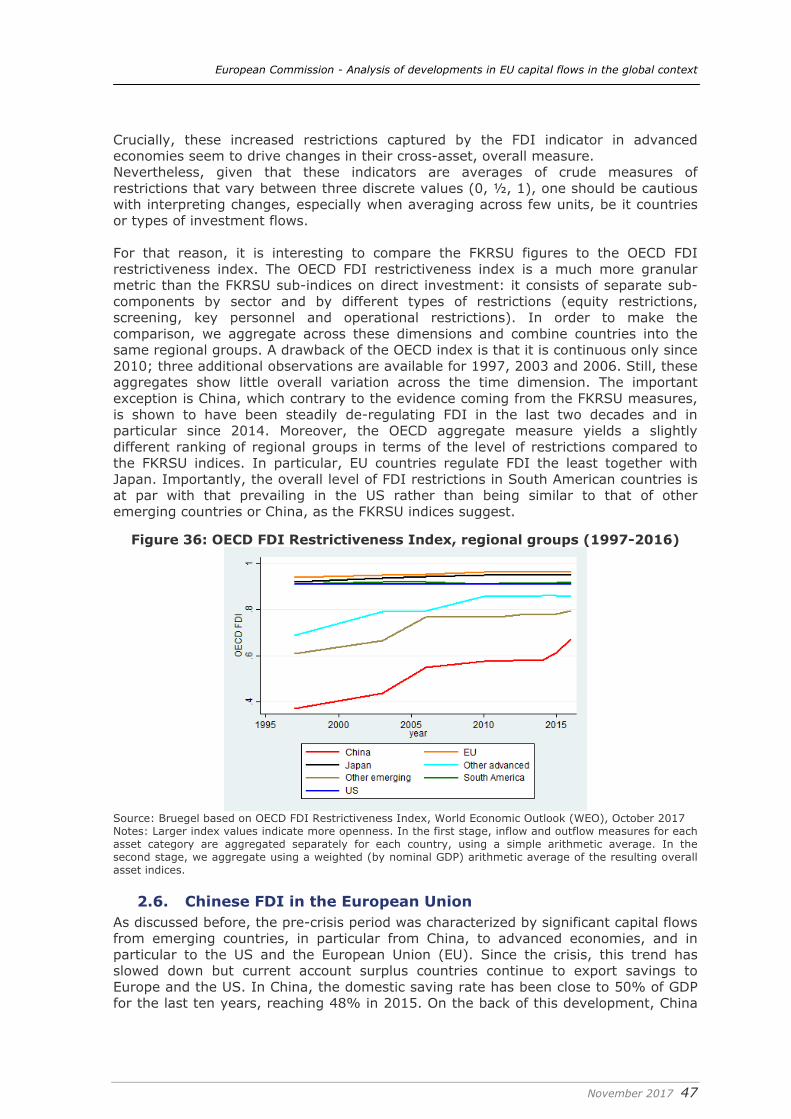
European Commission - Analysis of developments in EU capital flows in the global context
November 2017 47
Crucially, these increased restrictions captured by the FDI indicator in advanced economies seem to drive changes in their cross-asset, overall measure. Nevertheless, given that these indicators are averages of crude measures of restrictions that vary between three discrete values (0, ½, 1), one should be cautious with interpreting changes, especially when averaging across few units, be it countries or types of investment flows. For that reason, it is interesting to compare the FKRSU figures to the OECD FDI restrictiveness index. The OECD FDI restrictiveness index is a much more granular metric than the FKRSU sub-indices on direct investment: it consists of separate sub-components by sector and by different types of restrictions (equity restrictions, screening, key personnel and operational restrictions). In order to make the comparison, we aggregate across these dimensions and combine countries into the same regional groups. A drawback of the OECD index is that it is continuous only since 2010; three additional observations are available for 1997, 2003 and 2006. Still, these aggregates show little overall variation across the time dimension. The important exception is China, which contrary to the evidence coming from the FKRSU measures, is shown to have been steadily de-regulating FDI in the last two decades and in particular since 2014. Moreover, the OECD aggregate measure yields a slightly different ranking of regional groups in terms of the level of restrictions compared to the FKRSU indices. In particular, EU countries regulate FDI the least together with Japan. Importantly, the overall level of FDI restrictions in South American countries is at par with that prevailing in the US rather than being similar to that of other emerging countries or China, as the FKRSU indices suggest.
Figure 36: OECD FDI Restrictiveness Index, regional groups (1997-2016)
Source: Bruegel based on OECD FDI Restrictiveness Index, World Economic Outlook (WEO), October 2017 Notes: Larger index values indicate more openness. In the first stage, inflow and outflow measures for each asset category are aggregated separately for each country, using a simple arithmetic average. In the second stage, we aggregate using a weighted (by nominal GDP) arithmetic average of the resulting overall asset indices.
2.6. Chinese FDI in the European Union As discussed before, the pre-crisis period was characterized by significant capital flows from emerging countries, in particular from China, to advanced economies, and in particular to the US and the European Union (EU). Since the crisis, this trend has slowed down but current account surplus countries continue to export savings to Europe and the US. In China, the domestic saving rate has been close to 50% of GDP for the last ten years, reaching 48% in 2015. On the back of this development, China
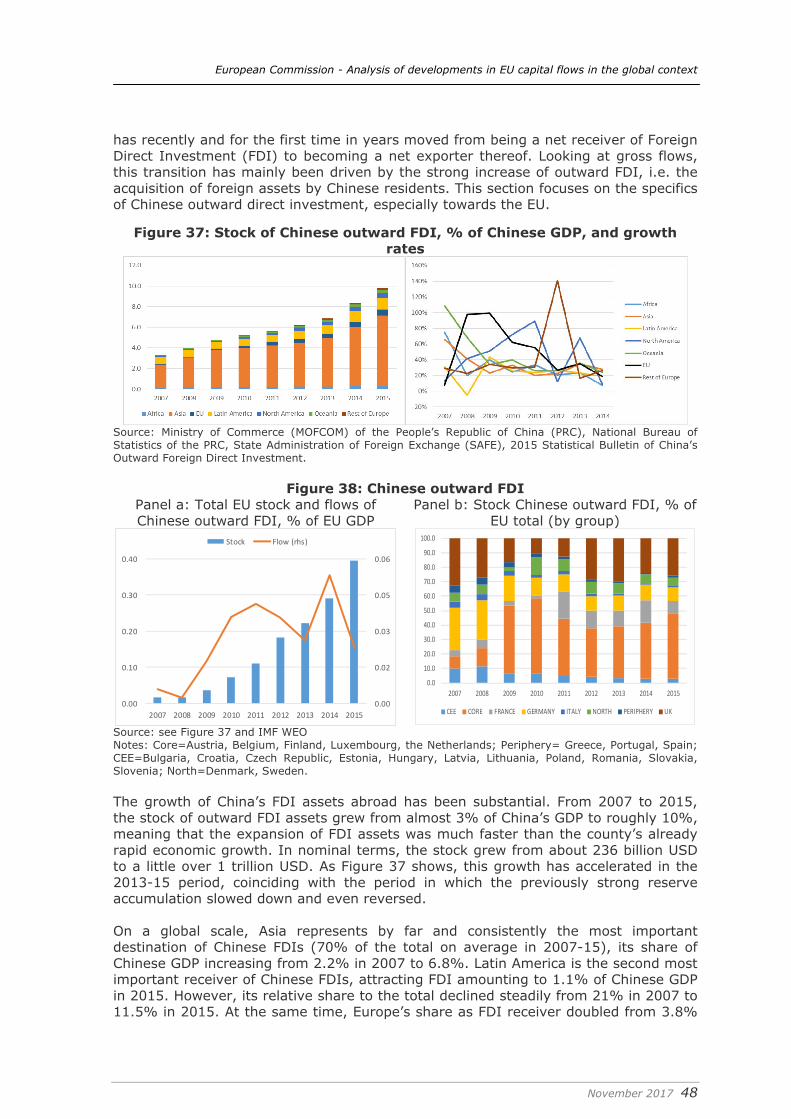
European Commission - Analysis of developments in EU capital flows in the global context
November 2017 48
has recently and for the first time in years moved from being a net receiver of Foreign Direct Investment (FDI) to becoming a net exporter thereof. Looking at gross flows, this transition has mainly been driven by the strong increase of outward FDI, i.e. the acquisition of foreign assets by Chinese residents. This section focuses on the specifics of Chinese outward direct investment, especially towards the EU.
Figure 37: Stock of Chinese outward FDI, % of Chinese GDP, and growth rates
Source: Ministry of Commerce (MOFCOM) of the People’s Republic of China (PRC), National Bureau of Statistics of the PRC, State Administration of Foreign Exchange (SAFE), 2015 Statistical Bulletin of China’s Outward Foreign Direct Investment.
Figure 38: Chinese outward FDI Panel a: Total EU stock and flows of Chinese outward FDI, % of EU GDP
Panel b: Stock Chinese outward FDI, % of EU total (by group)
0.00
0.02
0.03
0.05
0.06
0.00
0.10
0.20
0.30
0.40
2007 2008 2009 2010 2011 2012 2013 2014 2015
Stock Flow (rhs)
0.0
10.0
20.0
30.0
40.0
50.0
60.0
70.0
80.0
90.0
100.0
2007 2008 2009 2010 2011 2012 2013 2014 2015
CEE CORE FRANCE GERMANY ITALY NORTH PERIPHERY UK
Source: see Figure 37 and IMF WEO Notes: Core=Austria, Belgium, Finland, Luxembourg, the Netherlands; Periphery= Greece, Portugal, Spain; CEE=Bulgaria, Croatia, Czech Republic, Estonia, Hungary, Latvia, Lithuania, Poland, Romania, Slovakia, Slovenia; North=Denmark, Sweden. The growth of China’s FDI assets abroad has been substantial. From 2007 to 2015, the stock of outward FDI assets grew from almost 3% of China’s GDP to roughly 10%, meaning that the expansion of FDI assets was much faster than the county’s already rapid economic growth. In nominal terms, the stock grew from about 236 billion USD to a little over 1 trillion USD. As Figure 37 shows, this growth has accelerated in the 2013-15 period, coinciding with the period in which the previously strong reserve accumulation slowed down and even reversed. On a global scale, Asia represents by far and consistently the most important destination of Chinese FDIs (70% of the total on average in 2007-15), its share of Chinese GDP increasing from 2.2% in 2007 to 6.8%. Latin America is the second most important receiver of Chinese FDIs, attracting FDI amounting to 1.1% of Chinese GDP in 2015. However, its relative share to the total declined steadily from 21% in 2007 to 11.5% in 2015. At the same time, Europe’s share as FDI receiver doubled from 3.8%
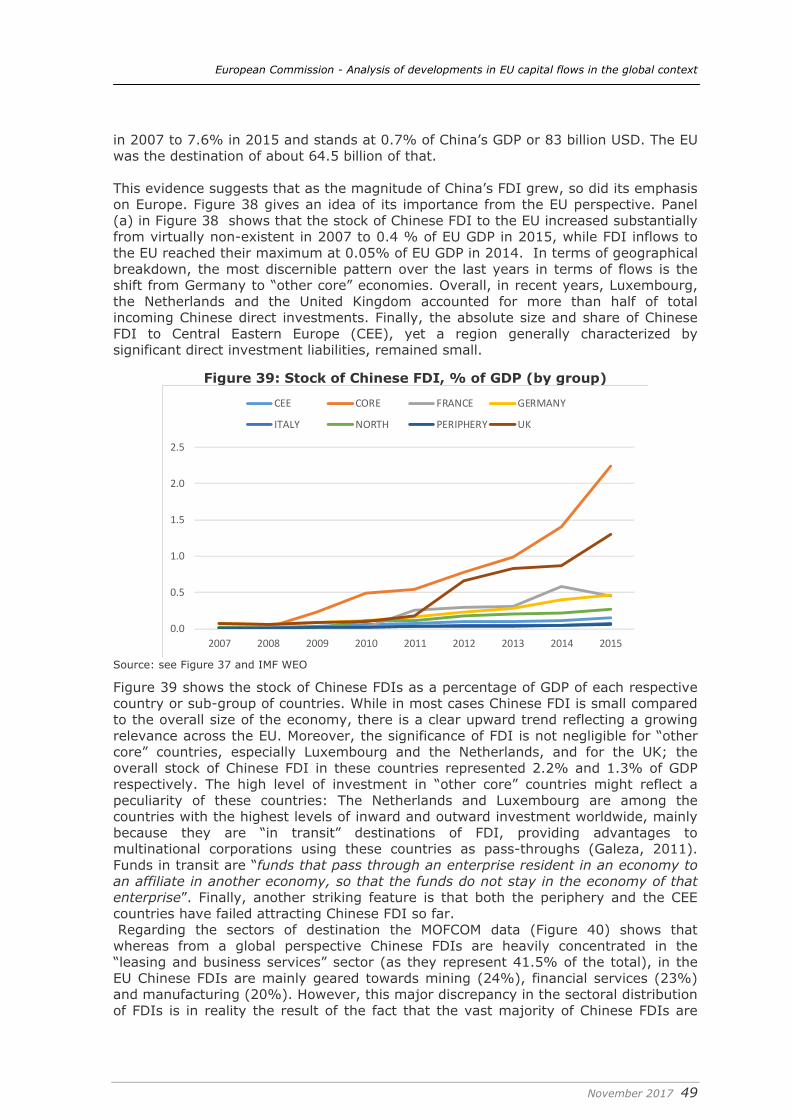
European Commission - Analysis of developments in EU capital flows in the global context
November 2017 49
in 2007 to 7.6% in 2015 and stands at 0.7% of China’s GDP or 83 billion USD. The EU was the destination of about 64.5 billion of that. This evidence suggests that as the magnitude of China’s FDI grew, so did its emphasis on Europe. Figure 38 gives an idea of its importance from the EU perspective. Panel (a) in Figure 38 shows that the stock of Chinese FDI to the EU increased substantially from virtually non-existent in 2007 to 0.4 % of EU GDP in 2015, while FDI inflows to the EU reached their maximum at 0.05% of EU GDP in 2014. In terms of geographical breakdown, the most discernible pattern over the last years in terms of flows is the shift from Germany to “other core” economies. Overall, in recent years, Luxembourg, the Netherlands and the United Kingdom accounted for more than half of total incoming Chinese direct investments. Finally, the absolute size and share of Chinese FDI to Central Eastern Europe (CEE), yet a region generally characterized by significant direct investment liabilities, remained small.
Figure 39: Stock of Chinese FDI, % of GDP (by group)
0.0
0.5
1.0
1.5
2.0
2.5
2007 2008 2009 2010 2011 2012 2013 2014 2015
CEE CORE FRANCE GERMANY
ITALY NORTH PERIPHERY UK
Source: see Figure 37 and IMF WEO
Figure 39 shows the stock of Chinese FDIs as a percentage of GDP of each respective country or sub-group of countries. While in most cases Chinese FDI is small compared to the overall size of the economy, there is a clear upward trend reflecting a growing relevance across the EU. Moreover, the significance of FDI is not negligible for “other core” countries, especially Luxembourg and the Netherlands, and for the UK; the overall stock of Chinese FDI in these countries represented 2.2% and 1.3% of GDP respectively. The high level of investment in “other core” countries might reflect a peculiarity of these countries: The Netherlands and Luxembourg are among the countries with the highest levels of inward and outward investment worldwide, mainly because they are “in transit” destinations of FDI, providing advantages to multinational corporations using these countries as pass-throughs (Galeza, 2011). Funds in transit are “funds that pass through an enterprise resident in an economy to an affiliate in another economy, so that the funds do not stay in the economy of that enterprise”. Finally, another striking feature is that both the periphery and the CEE countries have failed attracting Chinese FDI so far. Regarding the sectors of destination the MOFCOM data (Figure 40) shows that whereas from a global perspective Chinese FDIs are heavily concentrated in the “leasing and business services” sector (as they represent 41.5% of the total), in the EU Chinese FDIs are mainly geared towards mining (24%), financial services (23%) and manufacturing (20%). However, this major discrepancy in the sectoral distribution of FDIs is in reality the result of the fact that the vast majority of Chinese FDIs are
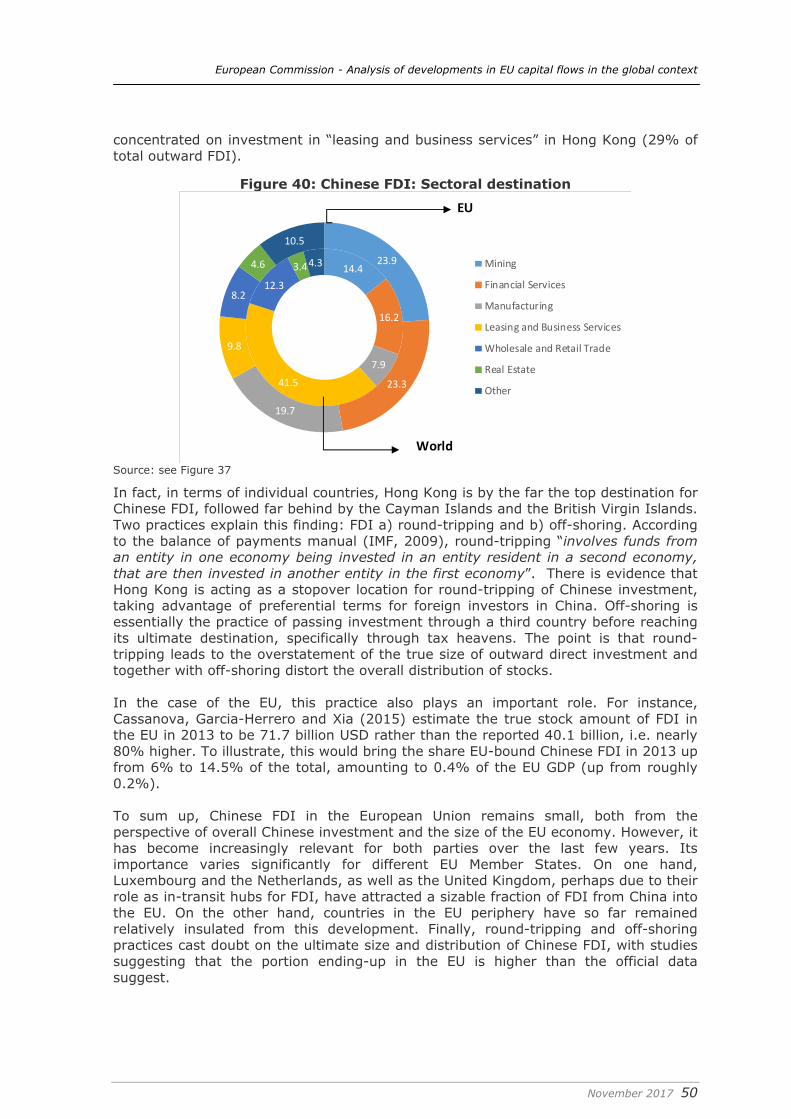
European Commission - Analysis of developments in EU capital flows in the global context
November 2017 50
concentrated on investment in “leasing and business services” in Hong Kong (29% of total outward FDI).
Figure 40: Chinese FDI: Sectoral destination
14.4
16.2
7.941.5
12.3
3.44.3 23.9
23.3
19.7
9.8
8.2
4.6
10.5
Mining
Financial Services
Manufacturing
Leasing and Business Services
Wholesale and Retail Trade
Real Estate
Other
EU
World
Source: see Figure 37
In fact, in terms of individual countries, Hong Kong is by the far the top destination for Chinese FDI, followed far behind by the Cayman Islands and the British Virgin Islands. Two practices explain this finding: FDI a) round-tripping and b) off-shoring. According to the balance of payments manual (IMF, 2009), round-tripping “involves funds from an entity in one economy being invested in an entity resident in a second economy, that are then invested in another entity in the first economy”. There is evidence that Hong Kong is acting as a stopover location for round-tripping of Chinese investment, taking advantage of preferential terms for foreign investors in China. Off-shoring is essentially the practice of passing investment through a third country before reaching its ultimate destination, specifically through tax heavens. The point is that round-tripping leads to the overstatement of the true size of outward direct investment and together with off-shoring distort the overall distribution of stocks. In the case of the EU, this practice also plays an important role. For instance, Cassanova, Garcia-Herrero and Xia (2015) estimate the true stock amount of FDI in the EU in 2013 to be 71.7 billion USD rather than the reported 40.1 billion, i.e. nearly 80% higher. To illustrate, this would bring the share EU-bound Chinese FDI in 2013 up from 6% to 14.5% of the total, amounting to 0.4% of the EU GDP (up from roughly 0.2%). To sum up, Chinese FDI in the European Union remains small, both from the perspective of overall Chinese investment and the size of the EU economy. However, it has become increasingly relevant for both parties over the last few years. Its importance varies significantly for different EU Member States. On one hand, Luxembourg and the Netherlands, as well as the United Kingdom, perhaps due to their role as in-transit hubs for FDI, have attracted a sizable fraction of FDI from China into the EU. On the other hand, countries in the EU periphery have so far remained relatively insulated from this development. Finally, round-tripping and off-shoring practices cast doubt on the ultimate size and distribution of Chinese FDI, with studies suggesting that the portion ending-up in the EU is higher than the official data suggest.
European Commission - Analysis of developments in EU capital flows in the global context
November 2017 51
3. A closer look at Europe The previous section assessed capital flows and international investment positions from a global perspective, presenting data on the euro area as a whole and on some non-euro area country aggregates. However, Europe is heterogeneous and it is important to analyse the different patterns within the Union. In this section, we take a closer look at the euro area and the European Union. Instead of reporting data for all 28 EU Member States, we define some country groups to facilitate the recognition of key tendencies across countries. We also show data separately for two large EU countries, France and Italy, which are difficult to combine with other countries. We group the first twelve euro-area countries based on their net international investment position (NIIP) in “other investments”, which primarily includes banking claims and Target2. Countries with a positive NIIP in other investment are regarded as “creditors”, while countries with a large negative NIIP in other investments are called “debtors” (i.e. lower than 25% of GDP). We note that these groups perfectly coincide with a grouping based on pre-crisis (2000-2008) current account developments: “deficit countries”, where the current account balance as a share of GDP was on average below -2 percent of GDP are the same as “debtor countries” as defined above, while “surplus countries”, where the current account balance was on average was over 2 percent of GDP are the same as “creditor countries”. Such correspondence between pre-crisis deficit/surplus countries and current debtor/creditor countries is logical, given that current NIIPs are to a large extent the legacy of pre-crisis capital flows. Both possible classifications leave two countries in between: France and Italy. Since capital flow developments in France and Italy were rather different from each other, as highlighted by for example Hobza and Zeugner (2014a, 2014b), and also different from both creditor and debtor countries, we show data on both of these large countries separately. Therefore, we consider the following country groups and countries: • Euro area (EA) creditor countries: Austria, Finland and Germany; • Benelux: Belgium, Luxembourg and the Netherlands; • Euro area (EA) debtor countries: Greece, Portugal and Spain; • France is considered individually in light of its small negative NIIP and its
difference from creditor and debtor countries and also from Italy; • Italy is considered individually in light of its small negative NIIP and its difference
from creditor and debtor countries and also from France; • Northern Europe10: Denmark and Sweden; • Central and Eastern Europe11 (CEE): Czech Republic, Croatia, Estonia, Hungary,
Latvia, Lithuania, Poland, Romania, Slovakia and Slovenia. • Bulgaria, Cyprus, Ireland and Malta are presented separately at the end of the
section, partly because of limited data availability and partly because they face very idiosyncratic financial flows and it is difficult to justify merging them into groups.
While countries included in a particular group have major similarities, there is still a large degree of heterogeneity within most of the groups. However, increasing the
10 The UK is treated in the previous global section 11 We also note that five CEE countries and Cyprus and Malta joined the euro area: Slovenia in 2007, Cyprus and Malta in 2008, Slovakia in 2009, Estonia in 2011, Latvia in 2014 and Lithuania in 2015. We include these countries in the CEE group, and not in the euro-area debtor or creditor groups, because the first twelve euro-area members were characterised by special developments since their early entry to the euro area.
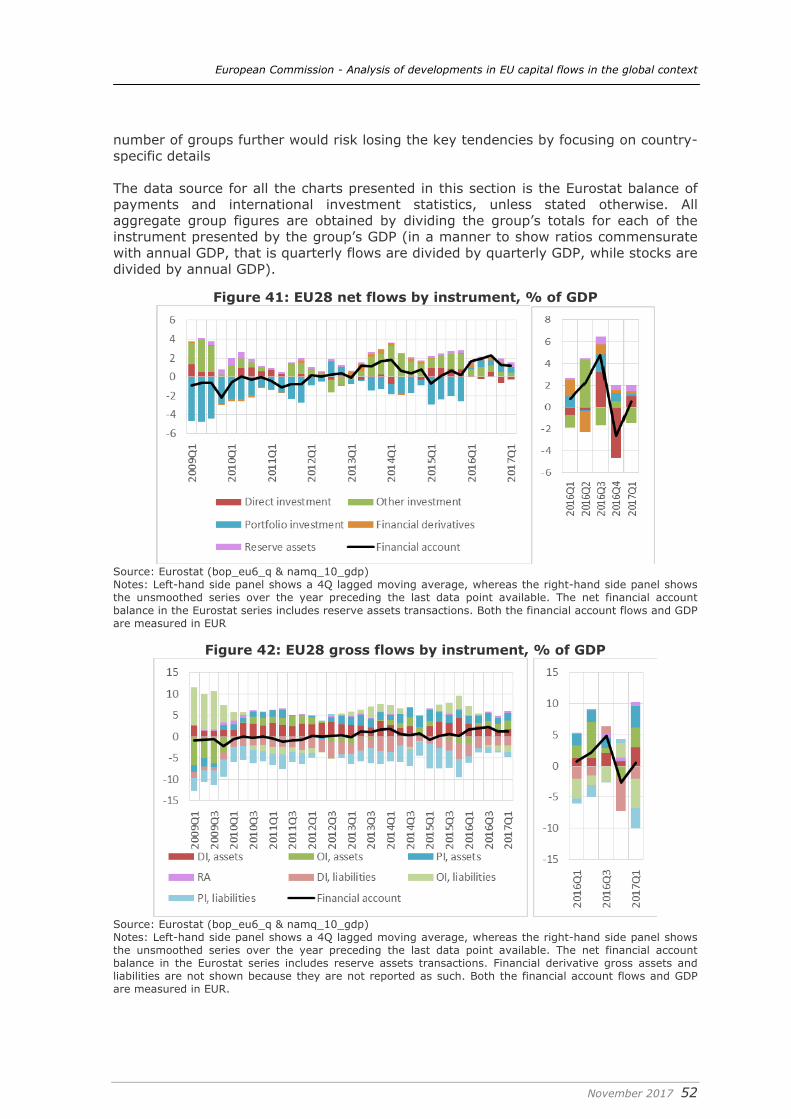
European Commission - Analysis of developments in EU capital flows in the global context
November 2017 52
number of groups further would risk losing the key tendencies by focusing on country-specific details The data source for all the charts presented in this section is the Eurostat balance of payments and international investment statistics, unless stated otherwise. All aggregate group figures are obtained by dividing the group’s totals for each of the instrument presented by the group’s GDP (in a manner to show ratios commensurate with annual GDP, that is quarterly flows are divided by quarterly GDP, while stocks are divided by annual GDP).
Figure 41: EU28 net flows by instrument, % of GDP
Source: Eurostat (bop_eu6_q & namq_10_gdp) Notes: Left-hand side panel shows a 4Q lagged moving average, whereas the right-hand side panel shows the unsmoothed series over the year preceding the last data point available. The net financial account balance in the Eurostat series includes reserve assets transactions. Both the financial account flows and GDP are measured in EUR
Figure 42: EU28 gross flows by instrument, % of GDP
Source: Eurostat (bop_eu6_q & namq_10_gdp) Notes: Left-hand side panel shows a 4Q lagged moving average, whereas the right-hand side panel shows the unsmoothed series over the year preceding the last data point available. The net financial account balance in the Eurostat series includes reserve assets transactions. Financial derivative gross assets and liabilities are not shown because they are not reported as such. Both the financial account flows and GDP are measured in EUR.
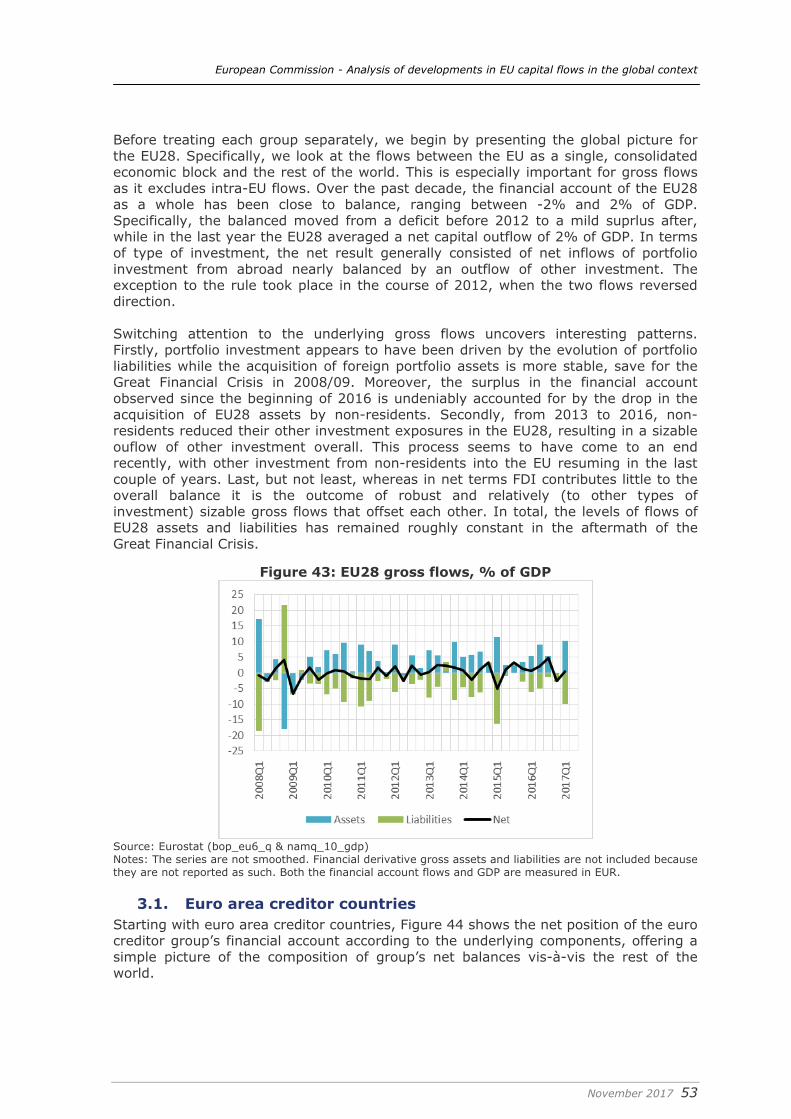
European Commission - Analysis of developments in EU capital flows in the global context
November 2017 53
Before treating each group separately, we begin by presenting the global picture for the EU28. Specifically, we look at the flows between the EU as a single, consolidated economic block and the rest of the world. This is especially important for gross flows as it excludes intra-EU flows. Over the past decade, the financial account of the EU28 as a whole has been close to balance, ranging between -2% and 2% of GDP. Specifically, the balanced moved from a deficit before 2012 to a mild suprlus after, while in the last year the EU28 averaged a net capital outflow of 2% of GDP. In terms of type of investment, the net result generally consisted of net inflows of portfolio investment from abroad nearly balanced by an outflow of other investment. The exception to the rule took place in the course of 2012, when the two flows reversed direction. Switching attention to the underlying gross flows uncovers interesting patterns. Firstly, portfolio investment appears to have been driven by the evolution of portfolio liabilities while the acquisition of foreign portfolio assets is more stable, save for the Great Financial Crisis in 2008/09. Moreover, the surplus in the financial account observed since the beginning of 2016 is undeniably accounted for by the drop in the acquisition of EU28 assets by non-residents. Secondly, from 2013 to 2016, non-residents reduced their other investment exposures in the EU28, resulting in a sizable ouflow of other investment overall. This process seems to have come to an end recently, with other investment from non-residents into the EU resuming in the last couple of years. Last, but not least, whereas in net terms FDI contributes little to the overall balance it is the outcome of robust and relatively (to other types of investment) sizable gross flows that offset each other. In total, the levels of flows of EU28 assets and liabilities has remained roughly constant in the aftermath of the Great Financial Crisis.
Figure 43: EU28 gross flows, % of GDP
Source: Eurostat (bop_eu6_q & namq_10_gdp) Notes: The series are not smoothed. Financial derivative gross assets and liabilities are not included because they are not reported as such. Both the financial account flows and GDP are measured in EUR.
3.1. Euro area creditor countries Starting with euro area creditor countries, Figure 44 shows the net position of the euro creditor group’s financial account according to the underlying components, offering a simple picture of the composition of group’s net balances vis-à-vis the rest of the world.
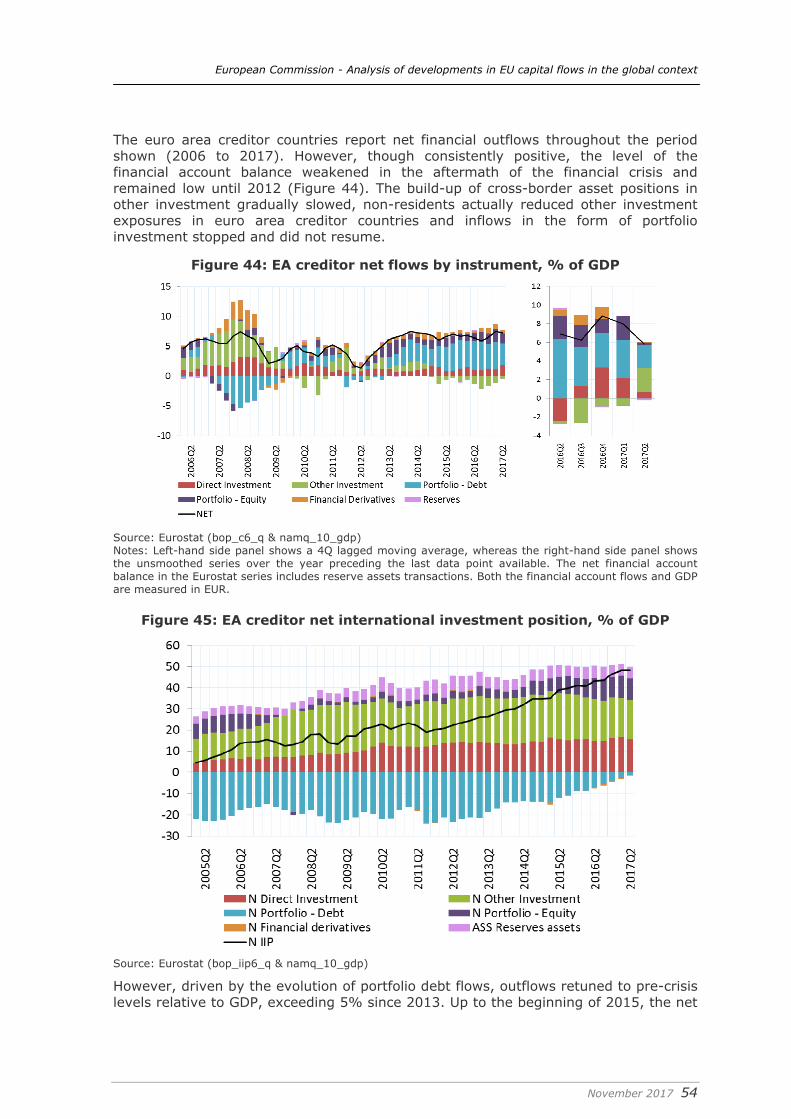
European Commission - Analysis of developments in EU capital flows in the global context
November 2017 54
The euro area creditor countries report net financial outflows throughout the period shown (2006 to 2017). However, though consistently positive, the level of the financial account balance weakened in the aftermath of the financial crisis and remained low until 2012 (Figure 44). The build-up of cross-border asset positions in other investment gradually slowed, non-residents actually reduced other investment exposures in euro area creditor countries and inflows in the form of portfolio investment stopped and did not resume.
Figure 44: EA creditor net flows by instrument, % of GDP
Source: Eurostat (bop_c6_q & namq_10_gdp) Notes: Left-hand side panel shows a 4Q lagged moving average, whereas the right-hand side panel shows the unsmoothed series over the year preceding the last data point available. The net financial account balance in the Eurostat series includes reserve assets transactions. Both the financial account flows and GDP are measured in EUR.
Figure 45: EA creditor net international investment position, % of GDP
Source: Eurostat (bop_iip6_q & namq_10_gdp)
However, driven by the evolution of portfolio debt flows, outflows retuned to pre-crisis levels relative to GDP, exceeding 5% since 2013. Up to the beginning of 2015, the net

European Commission - Analysis of developments in EU capital flows in the global context
November 2017 55
outflow of portfolio debt investment was the result of euro area creditor countries residents’ acquiring substantial amounts of foreign debt securities while incurring virtually no new liabilities. Coinciding with the introduction of the asset purchasing programme of the ECB is a reversal in relative contributions: the positive balance in portfolio net transactions is driven by the reduction in portfolio debt securities held by non-residents. Turning to net international investment positions (NIIPs), which are depicted in Figure 45, it is evident the prolonged period of current account surpluses both before and after the crisis has resulted in the significant accumulation of a large stock of external assets. In terms of composition, the euro area creditor countries net asset stock is mostly accounted for by other investment (the most important part of it being cross-border bank loans and Target2) and direct investment. The portfolio position has switched from negative to positive in recent years, driven by the contribution of both equity and debt securities (detailed in Figure 45). The sustained net outflow of portfolio debt noted above eliminated the associated net negative position, which had previously bottomed in 2012Q2 at the height of the euro crisis.
3.2. Benelux Balance of payments statstics for the Benelux countries, especially as regards gross transactions and positions, need to be interpreted with caution due to the operation of Special Purpose Entities (SPEs) in these countries. Eurostat defines SPEs as a) legal entity ultimately controlled, directly or indirectly, by a parent not resident in the reporting economy, which b) has no or few employees and c) its core business frequently consists of group financing or holding activities and usually do not undertake significant production. (Eurostat, 2016). According to Eurostat, in 2014 virtually all FDI assets and liabilities in Luxembourg (92.3%-95.6% respectively) and Malta (95.3%-98.7%), as well as the outstanding majority (83%-78.6%) in the Netherlands and a significant part in Hungary (54.8%-77%), are parked in SPEs.
Figure 46: Benelux net flows by instrument, % of GDP
The role of the Netherlands and Luxembourg as transit countries for FDI is reflected in the charts that follow. The three Benelux countries combined are persistent capital exporters, as shown in Figure 46. We note the sizable cross-border net inflow of other investment between 2010 and 2014, stemming for the most part from acquisitions of assets but also a reduction in cross-border funding in 2012-13. In the portfolio category, equity plays a larger role than, specifically in the form of inflows from non-resident invesmtent, which have been pronounced in the last three years. In all other
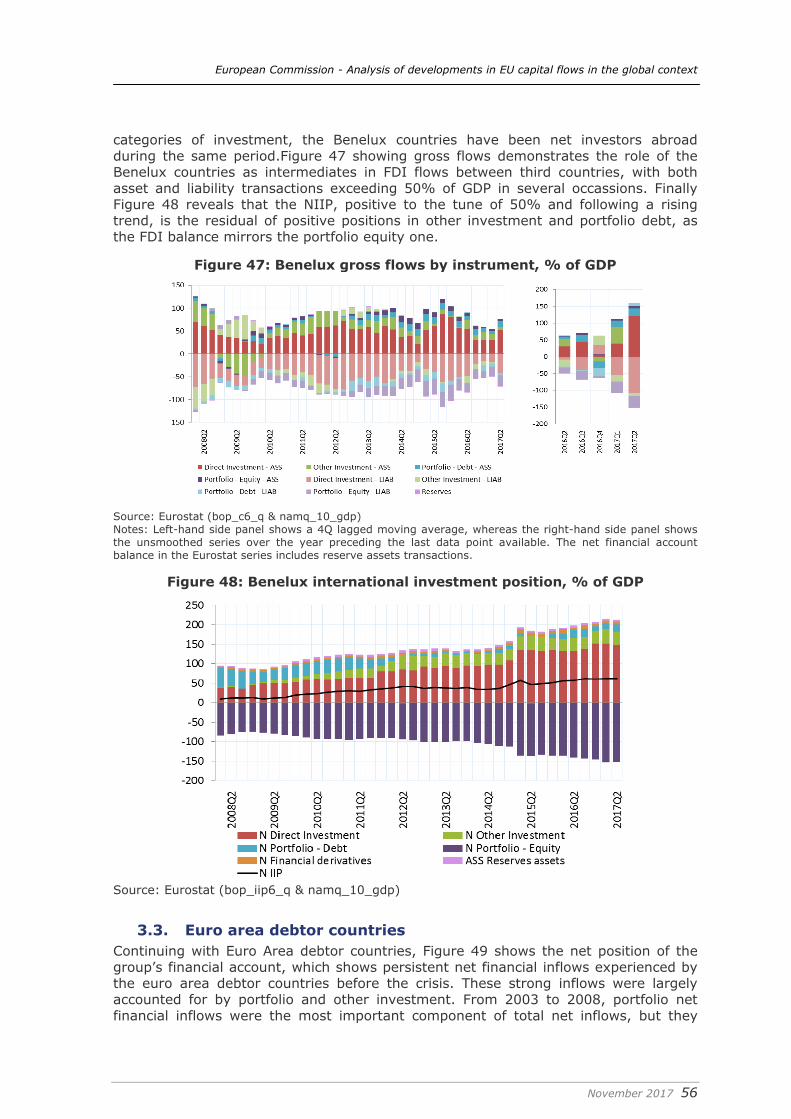
European Commission - Analysis of developments in EU capital flows in the global context
November 2017 56
categories of investment, the Benelux countries have been net investors abroad during the same period.Figure 47 showing gross flows demonstrates the role of the Benelux countries as intermediates in FDI flows between third countries, with both asset and liability transactions exceeding 50% of GDP in several occassions. Finally Figure 48 reveals that the NIIP, positive to the tune of 50% and following a rising trend, is the residual of positive positions in other investment and portfolio debt, as the FDI balance mirrors the portfolio equity one.
Figure 47: Benelux gross flows by instrument, % of GDP
Source: Eurostat (bop_c6_q & namq_10_gdp) Notes: Left-hand side panel shows a 4Q lagged moving average, whereas the right-hand side panel shows the unsmoothed series over the year preceding the last data point available. The net financial account balance in the Eurostat series includes reserve assets transactions.
Figure 48: Benelux international investment position, % of GDP
Source: Eurostat (bop_iip6_q & namq_10_gdp)
3.3. Euro area debtor countries Continuing with Euro Area debtor countries, Figure 49 shows the net position of the group’s financial account, which shows persistent net financial inflows experienced by the euro area debtor countries before the crisis. These strong inflows were largely accounted for by portfolio and other investment. From 2003 to 2008, portfolio net financial inflows were the most important component of total net inflows, but they
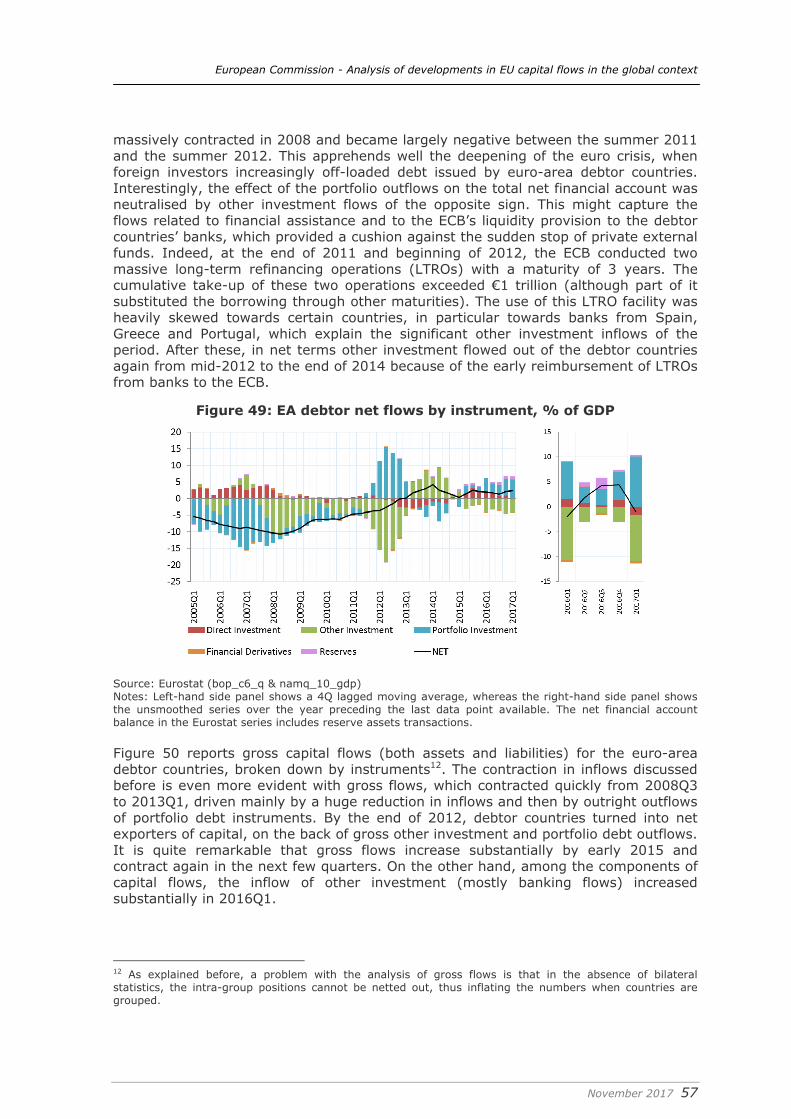
European Commission - Analysis of developments in EU capital flows in the global context
November 2017 57
massively contracted in 2008 and became largely negative between the summer 2011 and the summer 2012. This apprehends well the deepening of the euro crisis, when foreign investors increasingly off-loaded debt issued by euro-area debtor countries. Interestingly, the effect of the portfolio outflows on the total net financial account was neutralised by other investment flows of the opposite sign. This might capture the flows related to financial assistance and to the ECB’s liquidity provision to the debtor countries’ banks, which provided a cushion against the sudden stop of private external funds. Indeed, at the end of 2011 and beginning of 2012, the ECB conducted two massive long-term refinancing operations (LTROs) with a maturity of 3 years. The cumulative take-up of these two operations exceeded €1 trillion (although part of it substituted the borrowing through other maturities). The use of this LTRO facility was heavily skewed towards certain countries, in particular towards banks from Spain, Greece and Portugal, which explain the significant other investment inflows of the period. After these, in net terms other investment flowed out of the debtor countries again from mid-2012 to the end of 2014 because of the early reimbursement of LTROs from banks to the ECB.
Figure 49: EA debtor net flows by instrument, % of GDP
Source: Eurostat (bop_c6_q & namq_10_gdp) Notes: Left-hand side panel shows a 4Q lagged moving average, whereas the right-hand side panel shows the unsmoothed series over the year preceding the last data point available. The net financial account balance in the Eurostat series includes reserve assets transactions. Figure 50 reports gross capital flows (both assets and liabilities) for the euro-area debtor countries, broken down by instruments12. The contraction in inflows discussed before is even more evident with gross flows, which contracted quickly from 2008Q3 to 2013Q1, driven mainly by a huge reduction in inflows and then by outright outflows of portfolio debt instruments. By the end of 2012, debtor countries turned into net exporters of capital, on the back of gross other investment and portfolio debt outflows. It is quite remarkable that gross flows increase substantially by early 2015 and contract again in the next few quarters. On the other hand, among the components of capital flows, the inflow of other investment (mostly banking flows) increased substantially in 2016Q1.
12 As explained before, a problem with the analysis of gross flows is that in the absence of bilateral statistics, the intra-group positions cannot be netted out, thus inflating the numbers when countries are grouped.
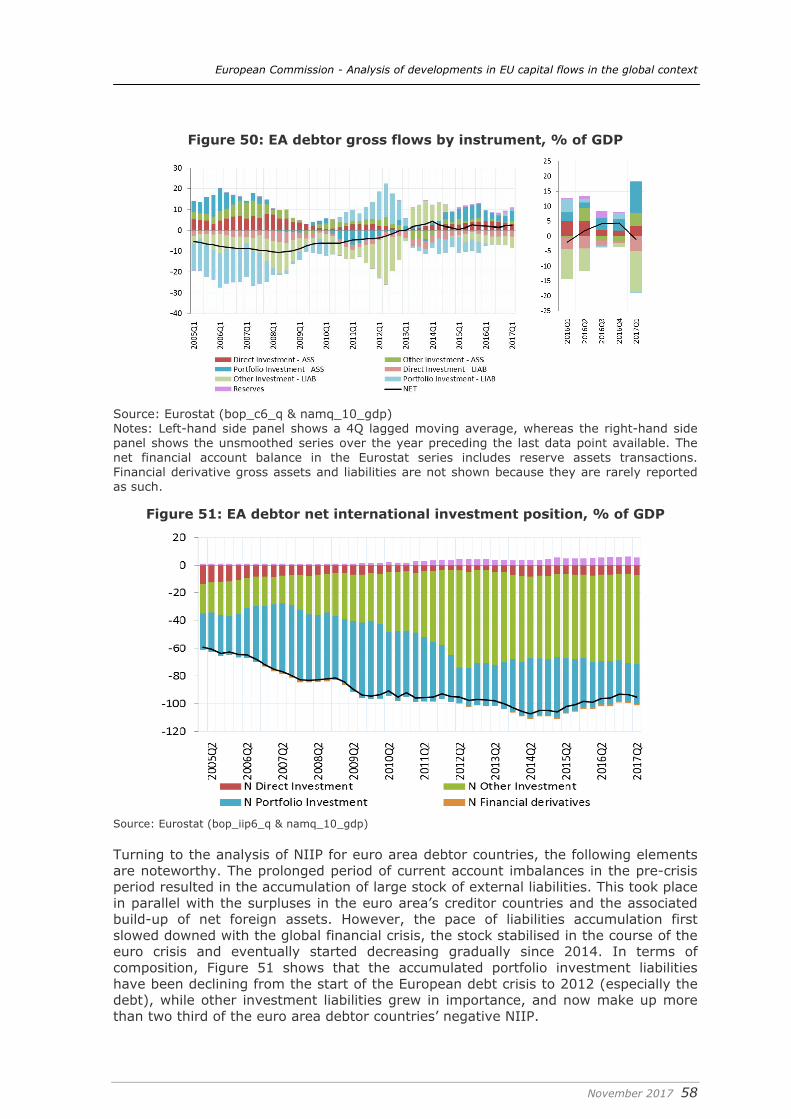
European Commission - Analysis of developments in EU capital flows in the global context
November 2017 58
Figure 50: EA debtor gross flows by instrument, % of GDP
Source: Eurostat (bop_c6_q & namq_10_gdp) Notes: Left-hand side panel shows a 4Q lagged moving average, whereas the right-hand side panel shows the unsmoothed series over the year preceding the last data point available. The net financial account balance in the Eurostat series includes reserve assets transactions. Financial derivative gross assets and liabilities are not shown because they are rarely reported as such.
Figure 51: EA debtor net international investment position, % of GDP
Source: Eurostat (bop_iip6_q & namq_10_gdp) Turning to the analysis of NIIP for euro area debtor countries, the following elements are noteworthy. The prolonged period of current account imbalances in the pre-crisis period resulted in the accumulation of large stock of external liabilities. This took place in parallel with the surpluses in the euro area’s creditor countries and the associated build-up of net foreign assets. However, the pace of liabilities accumulation first slowed downed with the global financial crisis, the stock stabilised in the course of the euro crisis and eventually started decreasing gradually since 2014. In terms of composition, Figure 51 shows that the accumulated portfolio investment liabilities have been declining from the start of the European debt crisis to 2012 (especially the debt), while other investment liabilities grew in importance, and now make up more than two third of the euro area debtor countries’ negative NIIP.
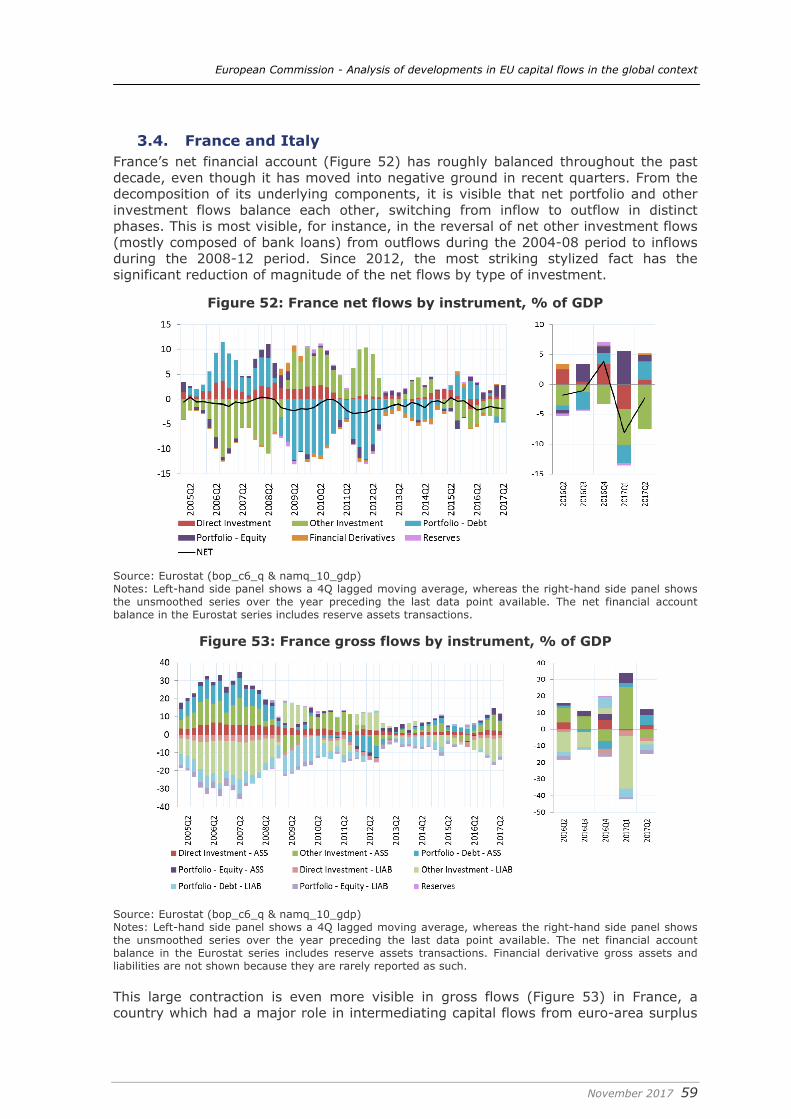
European Commission - Analysis of developments in EU capital flows in the global context
November 2017 59
3.4. France and Italy France’s net financial account (Figure 52) has roughly balanced throughout the past decade, even though it has moved into negative ground in recent quarters. From the decomposition of its underlying components, it is visible that net portfolio and other investment flows balance each other, switching from inflow to outflow in distinct phases. This is most visible, for instance, in the reversal of net other investment flows (mostly composed of bank loans) from outflows during the 2004-08 period to inflows during the 2008-12 period. Since 2012, the most striking stylized fact has the significant reduction of magnitude of the net flows by type of investment.
Figure 52: France net flows by instrument, % of GDP
Source: Eurostat (bop_c6_q & namq_10_gdp) Notes: Left-hand side panel shows a 4Q lagged moving average, whereas the right-hand side panel shows the unsmoothed series over the year preceding the last data point available. The net financial account balance in the Eurostat series includes reserve assets transactions.
Figure 53: France gross flows by instrument, % of GDP
Source: Eurostat (bop_c6_q & namq_10_gdp) Notes: Left-hand side panel shows a 4Q lagged moving average, whereas the right-hand side panel shows the unsmoothed series over the year preceding the last data point available. The net financial account balance in the Eurostat series includes reserve assets transactions. Financial derivative gross assets and liabilities are not shown because they are rarely reported as such. This large contraction is even more visible in gross flows (Figure 53) in France, a country which had a major role in intermediating capital flows from euro-area surplus
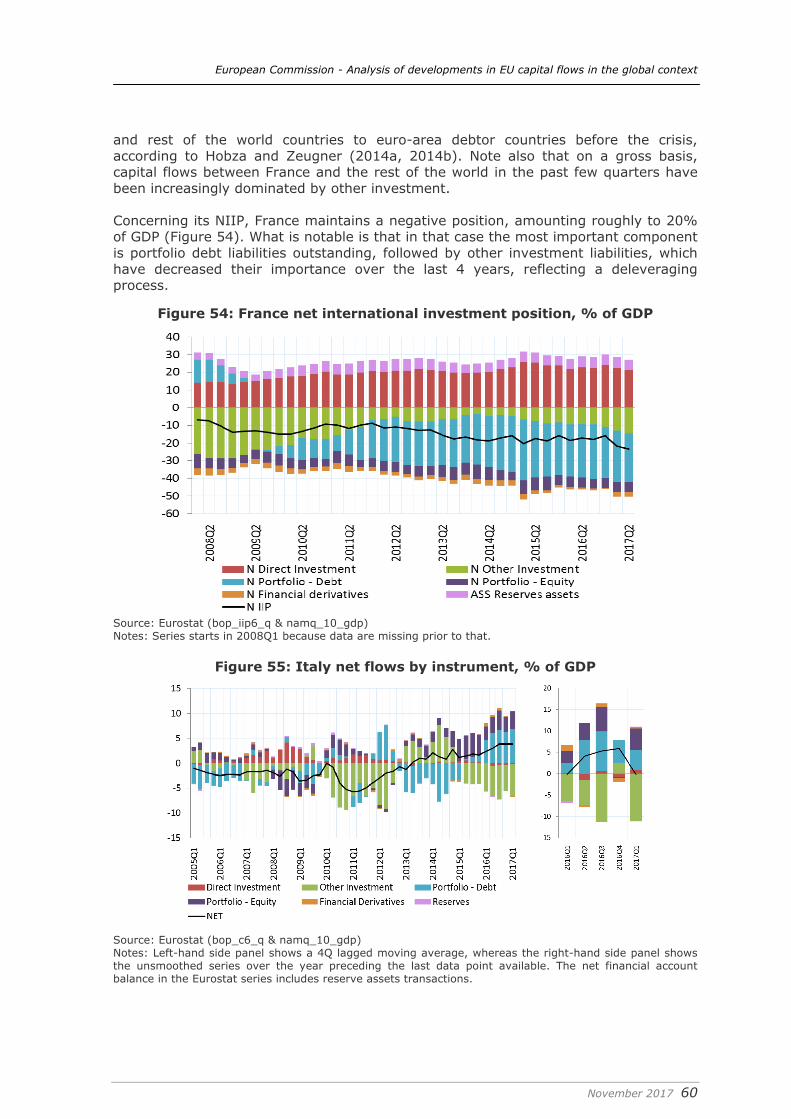
European Commission - Analysis of developments in EU capital flows in the global context
November 2017 60
and rest of the world countries to euro-area debtor countries before the crisis, according to Hobza and Zeugner (2014a, 2014b). Note also that on a gross basis, capital flows between France and the rest of the world in the past few quarters have been increasingly dominated by other investment. Concerning its NIIP, France maintains a negative position, amounting roughly to 20% of GDP (Figure 54). What is notable is that in that case the most important component is portfolio debt liabilities outstanding, followed by other investment liabilities, which have decreased their importance over the last 4 years, reflecting a deleveraging process.
Figure 54: France net international investment position, % of GDP
Source: Eurostat (bop_iip6_q & namq_10_gdp) Notes: Series starts in 2008Q1 because data are missing prior to that.
Figure 55: Italy net flows by instrument, % of GDP
Source: Eurostat (bop_c6_q & namq_10_gdp) Notes: Left-hand side panel shows a 4Q lagged moving average, whereas the right-hand side panel shows the unsmoothed series over the year preceding the last data point available. The net financial account balance in the Eurostat series includes reserve assets transactions.
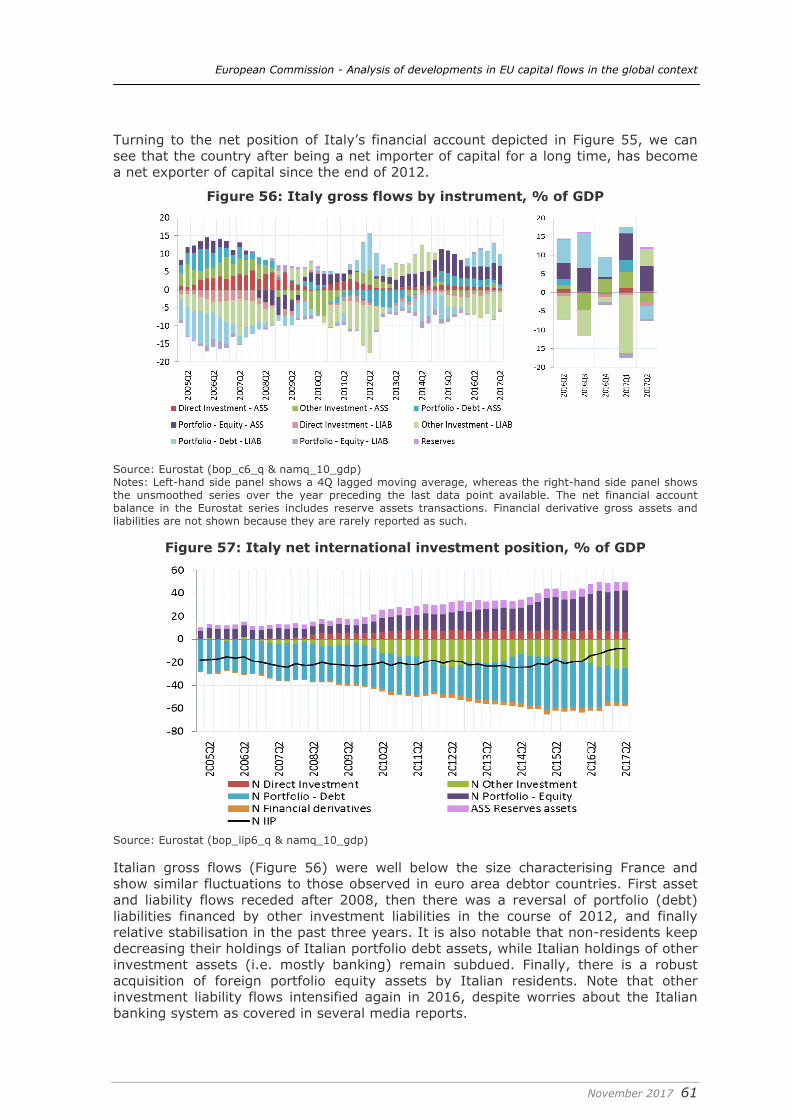
European Commission - Analysis of developments in EU capital flows in the global context
November 2017 61
Turning to the net position of Italy’s financial account depicted in Figure 55, we can see that the country after being a net importer of capital for a long time, has become a net exporter of capital since the end of 2012.
Figure 56: Italy gross flows by instrument, % of GDP
Source: Eurostat (bop_c6_q & namq_10_gdp) Notes: Left-hand side panel shows a 4Q lagged moving average, whereas the right-hand side panel shows the unsmoothed series over the year preceding the last data point available. The net financial account balance in the Eurostat series includes reserve assets transactions. Financial derivative gross assets and liabilities are not shown because they are rarely reported as such.
Figure 57: Italy net international investment position, % of GDP
Source: Eurostat (bop_iip6_q & namq_10_gdp) Italian gross flows (Figure 56) were well below the size characterising France and show similar fluctuations to those observed in euro area debtor countries. First asset and liability flows receded after 2008, then there was a reversal of portfolio (debt) liabilities financed by other investment liabilities in the course of 2012, and finally relative stabilisation in the past three years. It is also notable that non-residents keep decreasing their holdings of Italian portfolio debt assets, while Italian holdings of other investment assets (i.e. mostly banking) remain subdued. Finally, there is a robust acquisition of foreign portfolio equity assets by Italian residents. Note that other investment liability flows intensified again in 2016, despite worries about the Italian banking system as covered in several media reports.
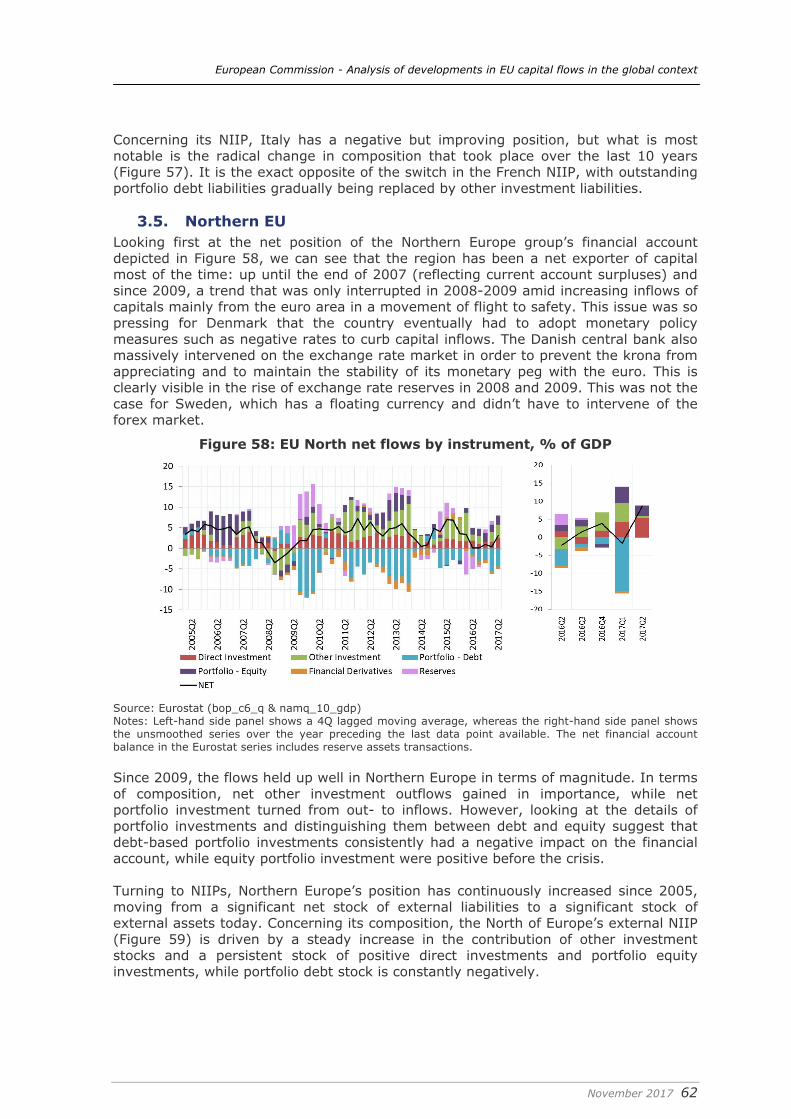
European Commission - Analysis of developments in EU capital flows in the global context
November 2017 62
Concerning its NIIP, Italy has a negative but improving position, but what is most notable is the radical change in composition that took place over the last 10 years (Figure 57). It is the exact opposite of the switch in the French NIIP, with outstanding portfolio debt liabilities gradually being replaced by other investment liabilities.
3.5. Northern EU Looking first at the net position of the Northern Europe group’s financial account depicted in Figure 58, we can see that the region has been a net exporter of capital most of the time: up until the end of 2007 (reflecting current account surpluses) and since 2009, a trend that was only interrupted in 2008-2009 amid increasing inflows of capitals mainly from the euro area in a movement of flight to safety. This issue was so pressing for Denmark that the country eventually had to adopt monetary policy measures such as negative rates to curb capital inflows. The Danish central bank also massively intervened on the exchange rate market in order to prevent the krona from appreciating and to maintain the stability of its monetary peg with the euro. This is clearly visible in the rise of exchange rate reserves in 2008 and 2009. This was not the case for Sweden, which has a floating currency and didn’t have to intervene of the forex market.
Figure 58: EU North net flows by instrument, % of GDP
Source: Eurostat (bop_c6_q & namq_10_gdp) Notes: Left-hand side panel shows a 4Q lagged moving average, whereas the right-hand side panel shows the unsmoothed series over the year preceding the last data point available. The net financial account balance in the Eurostat series includes reserve assets transactions. Since 2009, the flows held up well in Northern Europe in terms of magnitude. In terms of composition, net other investment outflows gained in importance, while net portfolio investment turned from out- to inflows. However, looking at the details of portfolio investments and distinguishing them between debt and equity suggest that debt-based portfolio investments consistently had a negative impact on the financial account, while equity portfolio investment were positive before the crisis. Turning to NIIPs, Northern Europe’s position has continuously increased since 2005, moving from a significant net stock of external liabilities to a significant stock of external assets today. Concerning its composition, the North of Europe’s external NIIP (Figure 59) is driven by a steady increase in the contribution of other investment stocks and a persistent stock of positive direct investments and portfolio equity investments, while portfolio debt stock is constantly negatively.
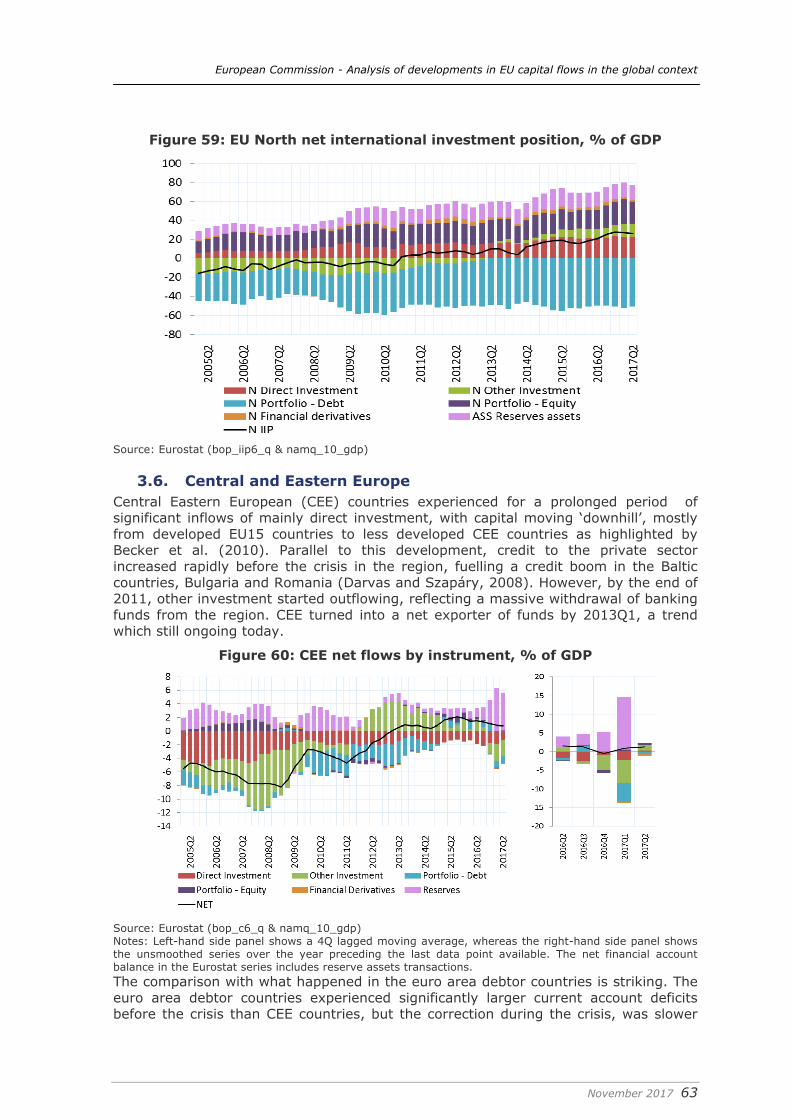
European Commission - Analysis of developments in EU capital flows in the global context
November 2017 63
Figure 59: EU North net international investment position, % of GDP
Source: Eurostat (bop_iip6_q & namq_10_gdp)
3.6. Central and Eastern Europe Central Eastern European (CEE) countries experienced for a prolonged period of significant inflows of mainly direct investment, with capital moving ‘downhill’, mostly from developed EU15 countries to less developed CEE countries as highlighted by Becker et al. (2010). Parallel to this development, credit to the private sector increased rapidly before the crisis in the region, fuelling a credit boom in the Baltic countries, Bulgaria and Romania (Darvas and Szapáry, 2008). However, by the end of 2011, other investment started outflowing, reflecting a massive withdrawal of banking funds from the region. CEE turned into a net exporter of funds by 2013Q1, a trend which still ongoing today.
Figure 60: CEE net flows by instrument, % of GDP
Source: Eurostat (bop_c6_q & namq_10_gdp) Notes: Left-hand side panel shows a 4Q lagged moving average, whereas the right-hand side panel shows the unsmoothed series over the year preceding the last data point available. The net financial account balance in the Eurostat series includes reserve assets transactions. The comparison with what happened in the euro area debtor countries is striking. The euro area debtor countries experienced significantly larger current account deficits before the crisis than CEE countries, but the correction during the crisis, was slower
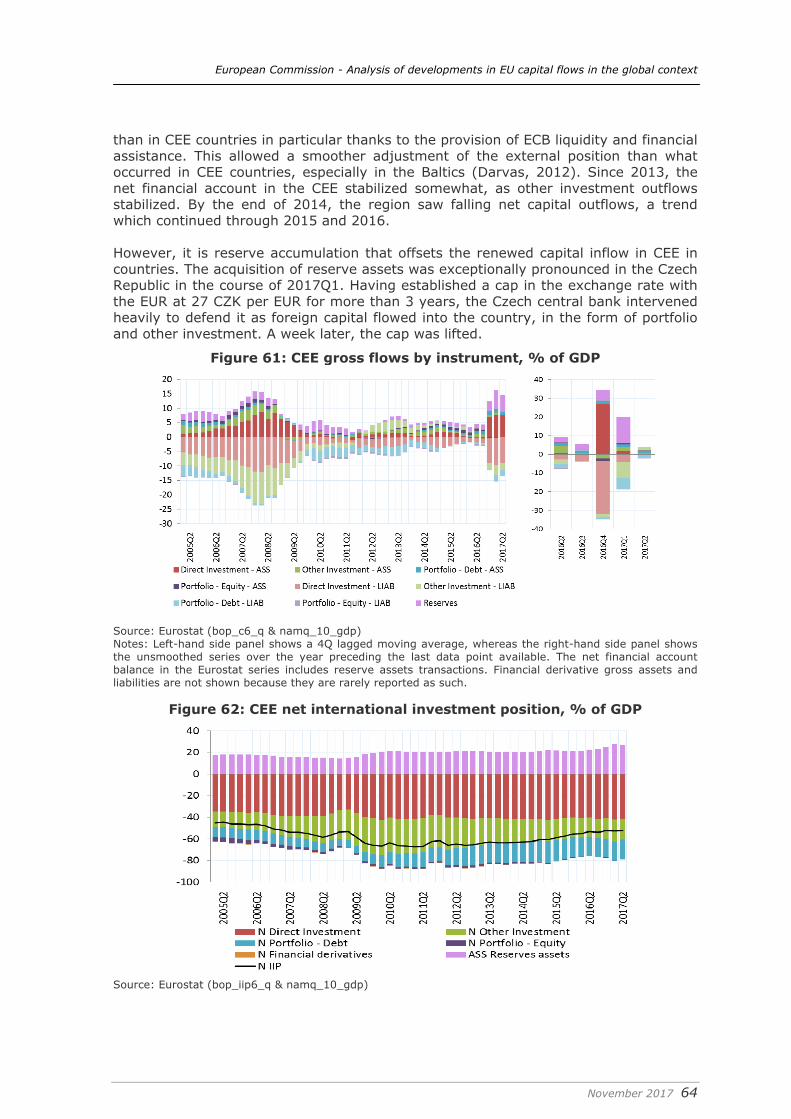
European Commission - Analysis of developments in EU capital flows in the global context
November 2017 64
than in CEE countries in particular thanks to the provision of ECB liquidity and financial assistance. This allowed a smoother adjustment of the external position than what occurred in CEE countries, especially in the Baltics (Darvas, 2012). Since 2013, the net financial account in the CEE stabilized somewhat, as other investment outflows stabilized. By the end of 2014, the region saw falling net capital outflows, a trend which continued through 2015 and 2016. However, it is reserve accumulation that offsets the renewed capital inflow in CEE in countries. The acquisition of reserve assets was exceptionally pronounced in the Czech Republic in the course of 2017Q1. Having established a cap in the exchange rate with the EUR at 27 CZK per EUR for more than 3 years, the Czech central bank intervened heavily to defend it as foreign capital flowed into the country, in the form of portfolio and other investment. A week later, the cap was lifted.
Figure 61: CEE gross flows by instrument, % of GDP
Source: Eurostat (bop_c6_q & namq_10_gdp) Notes: Left-hand side panel shows a 4Q lagged moving average, whereas the right-hand side panel shows the unsmoothed series over the year preceding the last data point available. The net financial account balance in the Eurostat series includes reserve assets transactions. Financial derivative gross assets and liabilities are not shown because they are rarely reported as such.
Figure 62: CEE net international investment position, % of GDP
Source: Eurostat (bop_iip6_q & namq_10_gdp)
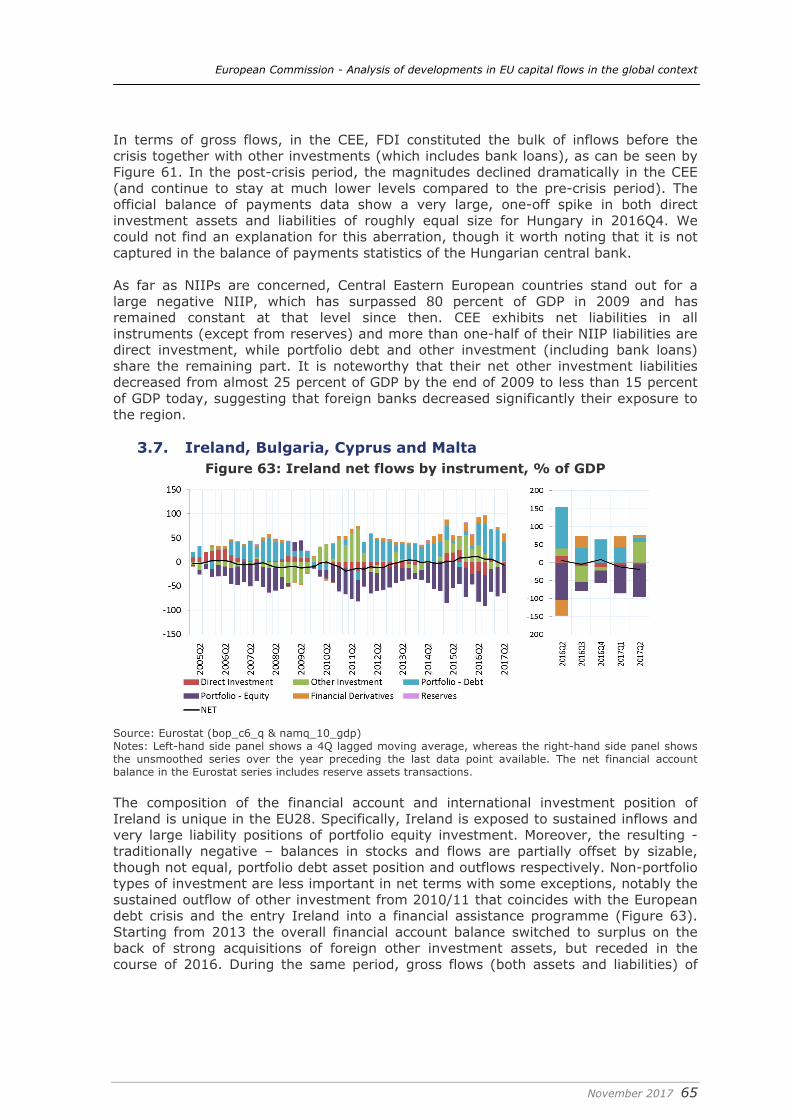
European Commission - Analysis of developments in EU capital flows in the global context
November 2017 65
In terms of gross flows, in the CEE, FDI constituted the bulk of inflows before the crisis together with other investments (which includes bank loans), as can be seen by Figure 61. In the post-crisis period, the magnitudes declined dramatically in the CEE (and continue to stay at much lower levels compared to the pre-crisis period). The official balance of payments data show a very large, one-off spike in both direct investment assets and liabilities of roughly equal size for Hungary in 2016Q4. We could not find an explanation for this aberration, though it worth noting that it is not captured in the balance of payments statistics of the Hungarian central bank. As far as NIIPs are concerned, Central Eastern European countries stand out for a large negative NIIP, which has surpassed 80 percent of GDP in 2009 and has remained constant at that level since then. CEE exhibits net liabilities in all instruments (except from reserves) and more than one-half of their NIIP liabilities are direct investment, while portfolio debt and other investment (including bank loans) share the remaining part. It is noteworthy that their net other investment liabilities decreased from almost 25 percent of GDP by the end of 2009 to less than 15 percent of GDP today, suggesting that foreign banks decreased significantly their exposure to the region.
3.7. Ireland, Bulgaria, Cyprus and Malta Figure 63: Ireland net flows by instrument, % of GDP
Source: Eurostat (bop_c6_q & namq_10_gdp) Notes: Left-hand side panel shows a 4Q lagged moving average, whereas the right-hand side panel shows the unsmoothed series over the year preceding the last data point available. The net financial account balance in the Eurostat series includes reserve assets transactions. The composition of the financial account and international investment position of Ireland is unique in the EU28. Specifically, Ireland is exposed to sustained inflows and very large liability positions of portfolio equity investment. Moreover, the resulting - traditionally negative – balances in stocks and flows are partially offset by sizable, though not equal, portfolio debt asset position and outflows respectively. Non-portfolio types of investment are less important in net terms with some exceptions, notably the sustained outflow of other investment from 2010/11 that coincides with the European debt crisis and the entry Ireland into a financial assistance programme (Figure 63). Starting from 2013 the overall financial account balance switched to surplus on the back of strong acquisitions of foreign other investment assets, but receded in the course of 2016. During the same period, gross flows (both assets and liabilities) of
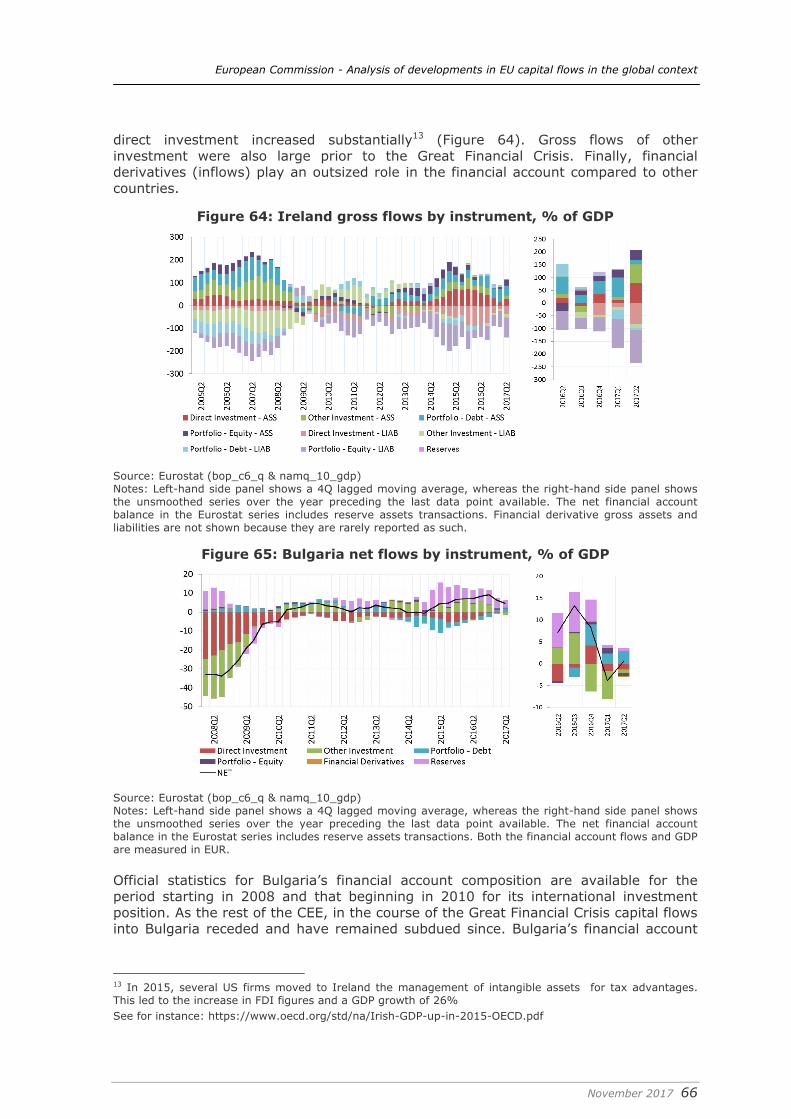
European Commission - Analysis of developments in EU capital flows in the global context
November 2017 66
direct investment increased substantially13 (Figure 64). Gross flows of other investment were also large prior to the Great Financial Crisis. Finally, financial derivatives (inflows) play an outsized role in the financial account compared to other countries.
Figure 64: Ireland gross flows by instrument, % of GDP
Source: Eurostat (bop_c6_q & namq_10_gdp) Notes: Left-hand side panel shows a 4Q lagged moving average, whereas the right-hand side panel shows the unsmoothed series over the year preceding the last data point available. The net financial account balance in the Eurostat series includes reserve assets transactions. Financial derivative gross assets and liabilities are not shown because they are rarely reported as such.
Figure 65: Bulgaria net flows by instrument, % of GDP
Source: Eurostat (bop_c6_q & namq_10_gdp) Notes: Left-hand side panel shows a 4Q lagged moving average, whereas the right-hand side panel shows the unsmoothed series over the year preceding the last data point available. The net financial account balance in the Eurostat series includes reserve assets transactions. Both the financial account flows and GDP are measured in EUR. Official statistics for Bulgaria’s financial account composition are available for the period starting in 2008 and that beginning in 2010 for its international investment position. As the rest of the CEE, in the course of the Great Financial Crisis capital flows into Bulgaria receded and have remained subdued since. Bulgaria’s financial account
13 In 2015, several US firms moved to Ireland the management of intangible assets for tax advantages. This led to the increase in FDI figures and a GDP growth of 26% See for instance: https://www.oecd.org/std/na/Irish-GDP-up-in-2015-OECD.pdf
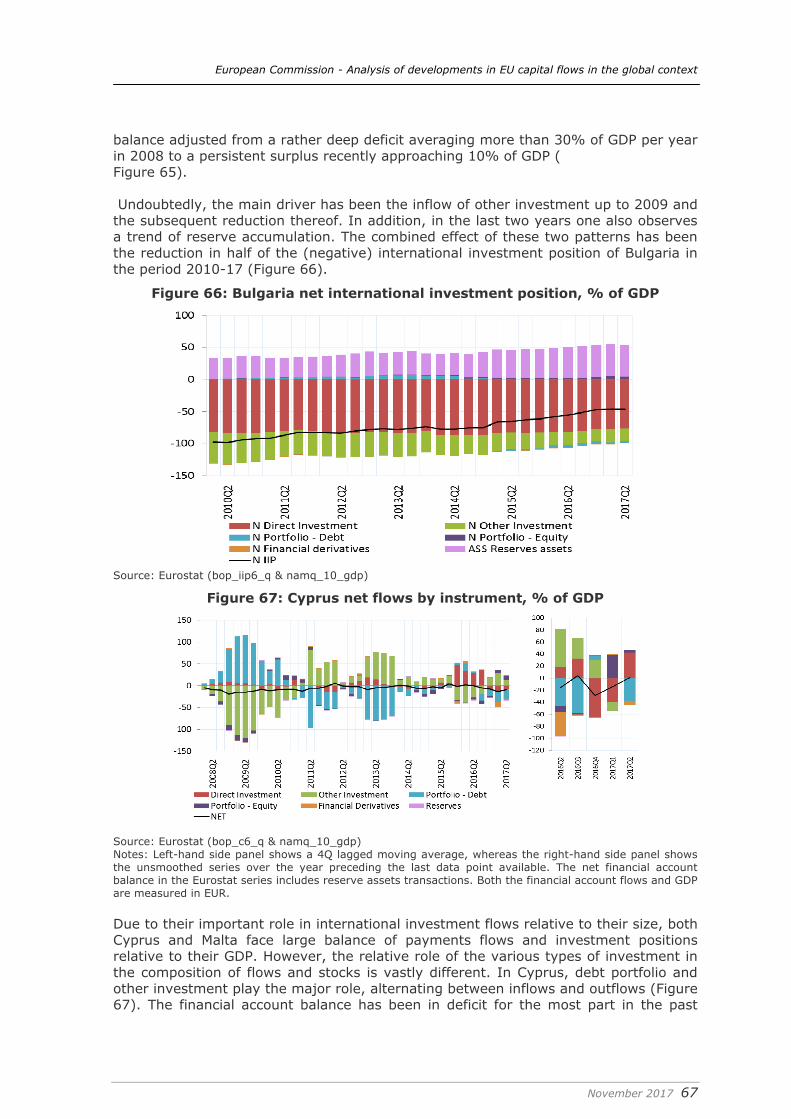
European Commission - Analysis of developments in EU capital flows in the global context
November 2017 67
balance adjusted from a rather deep deficit averaging more than 30% of GDP per year in 2008 to a persistent surplus recently approaching 10% of GDP ( Figure 65). Undoubtedly, the main driver has been the inflow of other investment up to 2009 and the subsequent reduction thereof. In addition, in the last two years one also observes a trend of reserve accumulation. The combined effect of these two patterns has been the reduction in half of the (negative) international investment position of Bulgaria in the period 2010-17 (Figure 66).
Figure 66: Bulgaria net international investment position, % of GDP
Source: Eurostat (bop_iip6_q & namq_10_gdp)
Figure 67: Cyprus net flows by instrument, % of GDP
Source: Eurostat (bop_c6_q & namq_10_gdp) Notes: Left-hand side panel shows a 4Q lagged moving average, whereas the right-hand side panel shows the unsmoothed series over the year preceding the last data point available. The net financial account balance in the Eurostat series includes reserve assets transactions. Both the financial account flows and GDP are measured in EUR. Due to their important role in international investment flows relative to their size, both Cyprus and Malta face large balance of payments flows and investment positions relative to their GDP. However, the relative role of the various types of investment in the composition of flows and stocks is vastly different. In Cyprus, debt portfolio and other investment play the major role, alternating between inflows and outflows (Figure 67). The financial account balance has been in deficit for the most part in the past
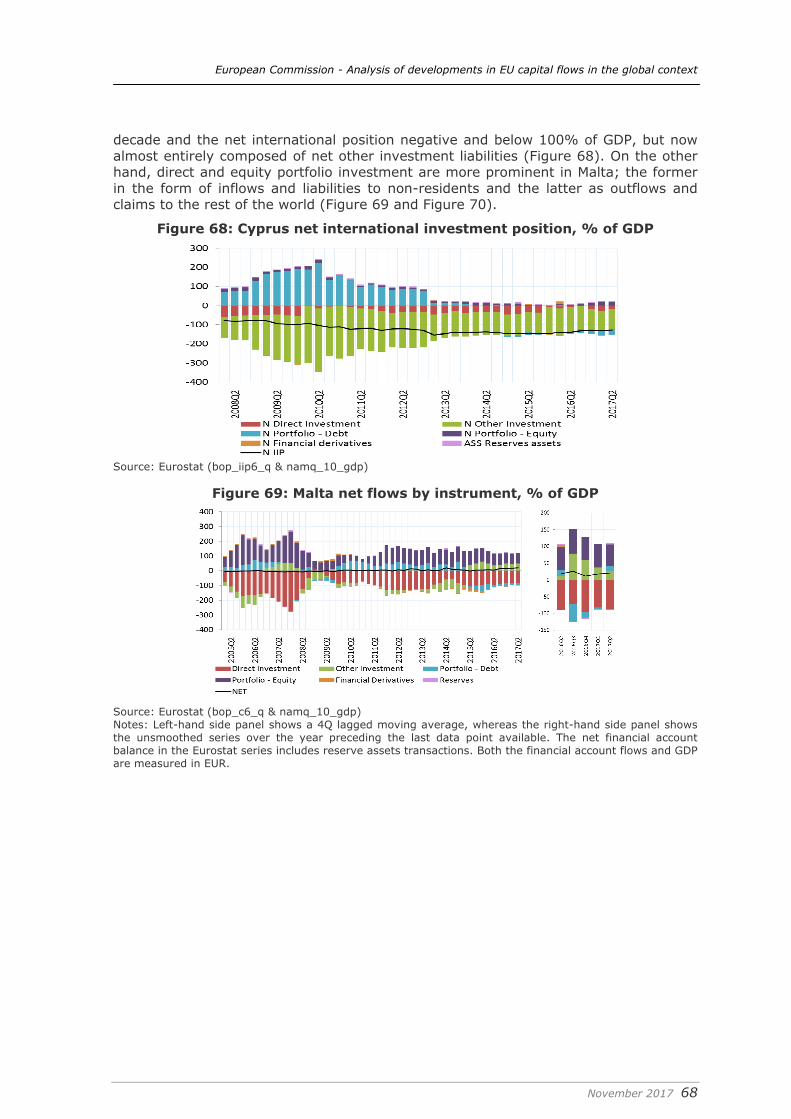
European Commission - Analysis of developments in EU capital flows in the global context
November 2017 68
decade and the net international position negative and below 100% of GDP, but now almost entirely composed of net other investment liabilities (Figure 68). On the other hand, direct and equity portfolio investment are more prominent in Malta; the former in the form of inflows and liabilities to non-residents and the latter as outflows and claims to the rest of the world (Figure 69 and Figure 70).
Figure 68: Cyprus net international investment position, % of GDP
Source: Eurostat (bop_iip6_q & namq_10_gdp)
Figure 69: Malta net flows by instrument, % of GDP
Source: Eurostat (bop_c6_q & namq_10_gdp) Notes: Left-hand side panel shows a 4Q lagged moving average, whereas the right-hand side panel shows the unsmoothed series over the year preceding the last data point available. The net financial account balance in the Eurostat series includes reserve assets transactions. Both the financial account flows and GDP are measured in EUR.
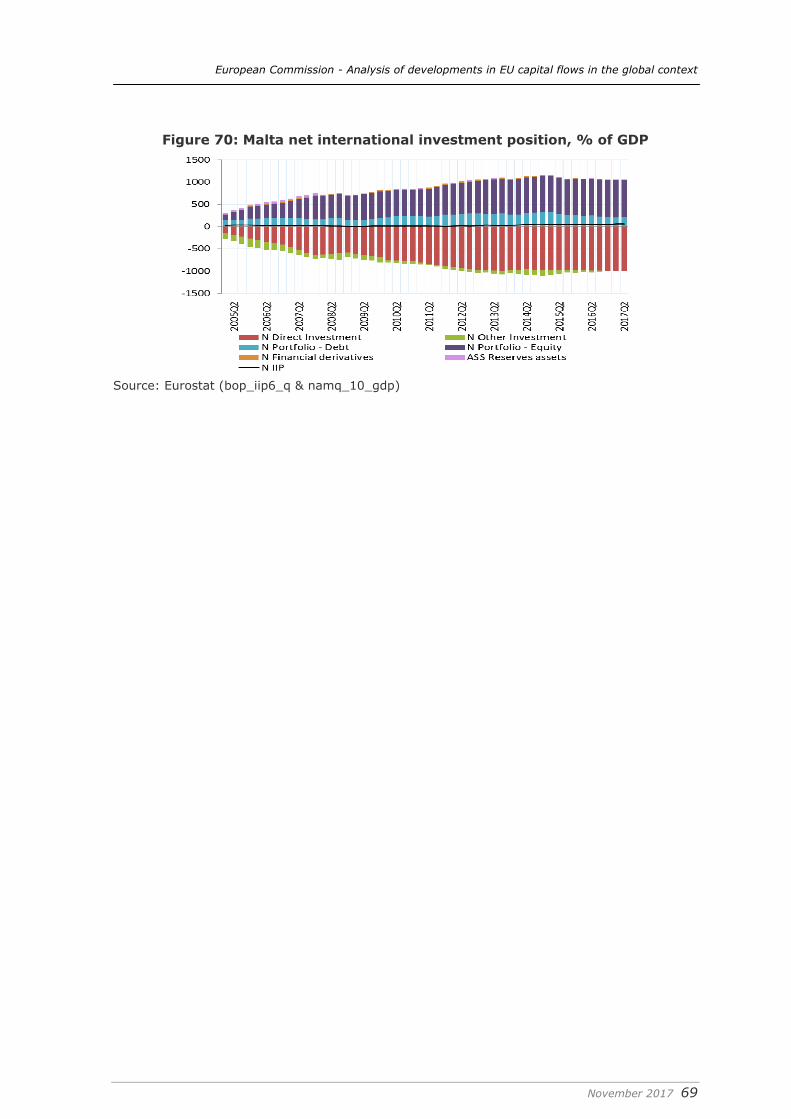
European Commission - Analysis of developments in EU capital flows in the global context
November 2017 69
Figure 70: Malta net international investment position, % of GDP
Source: Eurostat (bop_iip6_q & namq_10_gdp)
European Commission - Analysis of developments in EU capital flows in the global context
November 2017 70
4. Bank restructuring and NPL resolution: a framework for an integrated European secondary loans market14
The resolution of non-performing loans (NPLs) is central to the recovery of Europe’s banking sector and the restructuring of the excess debt owed by private sector borrowers. To date, banks have typically sought to deal with distressed loans within their own dedicated workout units. The view has prevailed that debt distress is temporary, that valuable client relationships need to be preserved and that knowledge of the client and its industry means that the bank that originated the loan is best placed to oversee a restructuring solution. However, it is increasingly clear that the EU banking industry on the whole is poorly placed to address the roughly €870 billion stock of NPLs15. This is because inherently, banks do not have the governance structures to oversee combined financial and operational restructurings that will typically require substantial write-downs of claims and an engagement that is more akin to the management of an equity position. The skills required are very different from those needed when extending new credit to financially sound businesses, and will be in short supply within many banks, if not the entire industry. This realisation explains the heightened interest in engaging in loan workout investors who can contribute specialist skills, long term capital and economies of scale. At the same time, the ongoing restructuring of Europe’s banking systems has resulted in banks seeking to divest substantial portfolios that no longer fit with their re-focused business strategies and their efforts to sustainably raise profitability. This is a process that has only just begun and can be seen as a broader rebalancing between bank–based and capital market finance in Europe. Collectively, non-performing loans and other performing but ‘non-core’ portfolios are estimated to amount to over €2 trillion in gross value. Within the euro area, the gross value of the stock of NPLs amounts to about 8.8 per cent of GDP, and including other non-core assets for sale would likely yield twice that as potential supply in this market. This is a substantial stock of assets, even compared to other asset types in the European debt market. Developing the market for asset transfers is therefore a significant objective, well beyond the immediate priority of working out distressed loans, because it would underpin a broader re-balancing between banks and capital markets. It is clear that the European secondary loans market is as yet under-developed. Relative to the stock of NPLs and other performing but non-core assets, which are admittedly hard to estimate, secondary loan transactions of about €146 billion gross value in 2016 represents a turnover ratio of no more than seven per cent. Liquidity in EU distressed and secondary loan markets pales in comparison to that seen in episodes of combined debt and NPL resolution in other countries, where the transfer of assets from the banking system to investors accelerated immediately after crisis episodes. Moreover, liquidity in EU secondary loan markets is concentrated in just a handful of EU countries, and is not necessarily available to countries with the highest NPL stocks, or to the most problematic asset types. The market continues to function
14 This study has drawn extensively on interviews with the EU Commission, ECB, EBA, a number of national institutions (central bank and ministry of finance in Ireland, Banca d’Italia) and numerous market participants. Input from these individuals is gratefully acknowledged, though all errors of course remain the authors’. 15 In this and other aggregate figures for the EU we refer to the EBA banking data.
European Commission - Analysis of developments in EU capital flows in the global context
November 2017 71
on a country-by-country basis as no cross-country portfolios have been issued, and few loan-servicing companies have expanded beyond their home markets.
4.1. The literature and recent policy initiatives So far, almost all analysis of market functioning appears to have depended on data from advisory firms, and has been largely conducted by these firms. While such analysis points to considerable dynamism in individual EU countries, it is difficult to gauge market development in comparison to other episodes of debt distress, or to assess the conduct of investors and their engagement with the underlying borrowers. Assessments of the pace and quality of distressed asset investment, as in, for instance, Ohashi et al (2004) or He (2004) for Japan and Korea, do not exist for the EU market. There are more in-depth analyses of individual markets, though these typically are limited to the regulatory framework (see Ernst and Young, 2017, for Italy), or to spelling out policy priorities (for instance Jassaud and Kang, 2015, again for Italy).
The IMF (2015) was among the first to draw attention to the underdevelopment of European NPL markets, and called for their further development. This study drew on a survey of 12 EU jurisdictions, and identified few restrictions on the sale of NPLs. Most European countries allowed banks and institutional investors to acquire NPLs from local banks. The Fund explained the underdevelopment of the NPL market by pointing to incomplete information on borrowers and their payment histories; inadequate licensing regimes to enable non-banks to own and manage NPLs; poor collateral valuation processes; lengthy and uncertain court procedures; and the broader problem of valuation gaps evident in bid-offer spreads, which are in good measure because of inadequate provisioning. Many of the impediments related to the supervision of banks, and the functioning of the legal system. Other factors are specific to the NPL market and the licensing of non-bank investors. The study also pointed to the catalytic effect of European asset management companies, such as Sareb in Spain, in establishing uniform valuation principles and in fostering a market for servicing.
The ECB has addressed NPL resolution in several publications, and in ECB (2016) focused on the market failures inherent in sales of distressed assets. NPL markets suffer from asymmetric information between the banks that originated loans and are familiar with delinquent borrowers’ characteristics and payment histories, and potential investors. This is a familiar problem in all markets that depend on asset quality.
Given the much greater focus on workout and asset separation by supervisors, various institutions have now come forward with proposals to support greater market liquidity and integration. These proposals address the following aspects:
• Data disclosure, standardised data templates and centralised platforms for transactions, as in FSC (2017) and Mersch (2017);
• The introduction of harmonised rules on asset transfers, ownership of non-performing loans and the conduct of servicing companies (also in FSC, 2017);
• The prudential treatment of securitisation and of other public-private investment structures that facilitate risk sharing and help bridge valuation gaps (ECB, 2017b);
• Bridging the problems in information sharing between selling banks and investors, importantly through the establishment of public and centralised asset management companies, either at national level (Constâncio, 2017, and Fell et al, 2017) or at EU level (Haben and Quagliariello, 2017).
European Commission - Analysis of developments in EU capital flows in the global context
November 2017 72
The European Commission’s mid-term review of the capital market action plan also envisages further measures to support secondary markets, possibly through a strengthened framework for collateral recovery, and by building on its previous initiative to simplify insolvency regimes and restructuring frameworks (European Commission, 2017).
Several of these proposals were taken up by the Council of the EU in July 2017. Ministers accepted that the present pace of NPL reduction appears inadequate, and that even though NPL stocks were concentrated in a number of countries, an integrated EU strategy was required. The Council conclusions endorsed several of the proposals on market functioning (for instance through the development of a standardised data template for NPLs, and possibly a single transaction platform), better supervision (in terms of strengthened provisioning guidelines and better scrutiny by the ESRB), and also called for a “blueprint for national asset management companies” (Council of the EU, 2017).
These proposals will require a deeper understanding of the investor base, their mandates and operational modalities. National regulators are understandably concerned that principles of lender conduct and consumer protection should be safeguarded because significant shares of assets are moved from regulated banks to an as yet relatively unfamiliar investor class.
4.2. Alternative options for NPL separation As regulators and investors in banks have sought greater clarity on NPL reductions, the limitations of a strategy that is primarily based on internal workout have become apparent. Constraints arise in terms of inadequate management attention and a lack of skills and human resources in banks’ workout departments, which in any case are rarely separated clearly from loan origination. These constraints can in principle be addressed by relying on subcontracted loan servicers, which banks are already utilising to a greater extent. More fundamentally, the banks that originated the loans do not have sufficient incentives to impose restructuring. Such a restructuring will normally involve the write down of established equity in the borrower, which will undermine the bank’s capacity to create future business with that same enterprise. Any write down of claims will give rise to moral hazard and possibly strategic defaults among banks’ other established borrowers.
These inherent problems, together with the slow progress in European NPL resolution until about 2014, explain the greater attention paid to direct sales of impaired assets in the secondary loans market. The ECB’s 2017 guidelines on banks’ management of NPL portfolios (ECB, 2017a) presented this option as an equally important element of NPL reduction strategies. While a greater emphasis on market-based solutions is essential in an effort to redress long-lingering asset quality problems, the benefits of relationship banking might be compromised in the process (Schäfer, 2016).
It should be borne in mind that the preparation of a more substantial volume of loan sales will require considerable resources within banks. The selection and preparation of loan portfolios for external investors is inevitably protracted, because loans will have been managed based on each bank’s specific documentation standards and IT systems. Much information might not be available in digital form, and standards of public credit registries will vary. The preparation of loans for sale is normally outsourced to specialist advisory firms. Crucially, bank management needs to engage with investors, and demonstrate commitment to a sale process with an uncertain outcome.
Investors, for their part, will engage in an extended due diligence process. Once potential investors have been selected, and have signed non-disclosure agreements,
European Commission - Analysis of developments in EU capital flows in the global context
November 2017 73
they will be given access to detailed information. In this phase investors will incur substantial fees for legal advice, valuation of collateral and further engagement with the originating bank. There is uncertainty about the outcome of the bidding process and over how the quality of the portfolio will change during the due diligence process (Rocha, 2016). In the end, the selling bank might still withdraw parts of the portfolio, or not go ahead with the sale. This problem of questionable commitment on the part of the seller has been evident in the younger markets in central Europe at certain times.
More fundamentally, in asset sales, at least three potential market failures arise:
• A concentrated investor base. Investors in certain asset types incur considerable sunk costs specific to each transaction, while the outcome of the bidding process is highly uncertain. Only a few investors have the capacity to bid repeatedly, and across a number of European markets. This might result in pricing power.
• Information asymmetry. The inability of the originating bank to portray asset quality fully and credibly leads to an adverse selection problem. The investor will bid based on what he suspects is inferior quality, while the originating bank will hold on to higher-quality assets.
• Externalities from the investor’s restructuring work. Once the investor has acquired the loan he will render services by maintaining the asset, by imposing a restructuring solution or by processing a foreclosure in the court system. Other creditors will benefit from these solutions, and the investor will therefore demand an additional return which will reduce bid prices (ECB, 2016 and 2017b).
Each of these might have contributed to significant differences between the valuations demanded by banks and those offered by investors, and to the failure of the market to clear fully, though we show in section 4.6 that these problems have become less relevant recently.
A key policy intervention that could help overcome market failures could be a wider use of asset management companies (AMCs), building on the relative successes in Spain and Ireland. AMCs have established transparent valuation principles and loan quality standards, and have acted as a single counterparty to investors. As they bought up exposures from several institutions they were also able to internalise the gains of any restructuring prior to a sale. This work in preparing and restructuring and refinancing of exposures becomes more difficult as the range of assets bought up by the AMC expands.
An alternative could be securitisation structures in which the public sector is exposed, alongside private investors, to some risks. While this would overcome problems around discerning the true quality of loans sold, these structures would further fragment the investor base, diluting incentives for restructuring. Valuations are highly dependent on the recovery rate and the time required to arrive at a court-sanctioned workout of a delinquent borrower. The fact that the state takes on some risk by acquiring assets whose value depends on public reform in this area would therefore reassure investors, though public sector risk exposures would only be justified by significant market failures.
4.3. The economic functions of liquid secondary loans markets: experience from other debt crises
As banks lend to households and enterprises they generate borrower-specific information that cannot be easily traded in financial markets. The fact that the
European Commission - Analysis of developments in EU capital flows in the global context
November 2017 74
secondary loans market has nevertheless grown rapidly in Europe underlines a number of benefits of secondary loans markets.
• Efficiencies in loan servicing and workout. These result from economies of scale as the assets of several lenders are combined, and economies of scope as different asset types are handled. These benefits can in principle be reaped when the lender retains ownership of the asset and merely subcontracts loan servicing, though preparing loans for external servicing has facilitated the engagement of external investors who then acquire ownership without direct operational interaction with the borrower.
• Some investors will engage in financial and operational restructuring of borrowers who are debt-distressed but viable. These borrowers will require specialist restructuring expertise and additional equity and senior debt which banks would be unable to provide. Such restructuring expertise is generally inadequate within banks. Restructuring is a specialist and cyclical activity and there are few incentives for banks to develop and retain such skills.
• The sale of a loan overcomes the inherent incentive problem of a bank seeking to restructure a loan while developing new business. As the relationship between the original lender and borrower is broken, moral hazard among other borrowers is contained, because those who might be viable will not benefit from restructuring solutions or would contemplate ‘strategic defaults’.
• The benefits to the divesting banks result primarily from relief from risk-weighted assets for which any additional write-down upon sale is less than the capital required had the NPL been managed internally. More broadly, the banking system will benefit because a well-developed secondary loans market will define a price for distressed and other non-core assets, helping guide balance sheet optimisation. Principles for collateral valuation and more transparent practices in enforcement and restructuring will provide a benchmark that banks will use to judge the prospects of their own restructuring efforts. In addition, banks will take advantage of greater liquidity in balance sheet management.
Investors in secondary loans markets are often said to display a higher risk appetite, and therefore demand higher returns, which are evident in the low valuations of portfolios for sale. It might be argued that this shift of a significant share of EU banking sector assets to investors with higher required rates of return represents a loss in terms of social welfare.
The differences between banks and investors in the secondary loans market in terms of cost of capital have been persistent and have not been arbitraged away. These differences arise from the regulatory barriers between investors in bank equity and investors in investment companies, and also differences in the respective accounting treatment of assets. More fundamentally, investors appear to apply a more realistic assessment of the uncertain and protracted timeline needed for the workout process. Improvements in the legal environment are designed with the aim of narrowing the bid-offer spreads, as for instance in recent reforms in Italy (Ernst and Young, 2017). The experience from other financial markets underlines that a good part of bank assets can indeed be made fungible, and that investors can play a valuable role in the more specific tasks of loan workout and restructuring. Two significant debt and NPL crises illustrate this (Box 3).
European Commission - Analysis of developments in EU capital flows in the global context
November 2017 75
Box 3: Two case studies of successful market development From 1999 the Japanese government focused on a rapid recognition of loan quality and made funds available for bank recapitalisation, recognising that the previous strategy of engineering mergers between private banks had delayed long-needed restructuring. Two entities were set up to acquire NPLs from failed banks, and were later merged into a single public asset management company. These asset management companies were mandated to sell the acquired loans relatively quickly (within three years in the case of one of the two entities, which wound up by 2007) (Hallerberg and Gandrud, 2017). At first, the market was limited to real estate collateral. Foreign investors dominated initially, though additional buyers soon emerged. Valuations rose as a more competitive auctioning mechanism was used. At one stage the annual uptake by investors of NPLs at market values was between ¥3-4 trillion; the gross reduction in the book value of NPLs in 2002 amounted to ¥15 trillion, compared to a stock of ¥42 trillion at the beginning of that year, underlining the substantial capacity of the market (Ohashi and Sing, 2004). Emerging markets of course are more affected by information problems in credit markets, and hence turned more readily to asset management companies in the aftermath of debt crises. These AMCs often catalysed the development of distressed loan markets, which did not previously exist. The development of the distressed asset market in Korea is seen as critical in overcoming the country’s NPL crisis from 1997. Between 1998 and 2002, KAMCO, the newly established bad bank, took over about 60 percent of the banking system NPL stock, and nearly the entirety of the NPL stock in the non-bank sector. KAMCO put in place some clear criteria for the quality of loan documentation and collateral rights, which subsequently allowed a swift transfer to investors. He (2004) underlines that KAMCO actively marketed distressed assets, and encouraged the participation of foreign investors. This in turn led to the development of a domestic investor base. On the back of this success, individual banks were able to approach these same investors, and the AMC was closed down in 2002. At the same time, a market for distressed debt has not been necessary for successful restructuring in all instances. For instance, the much-cited Swedish asset management companies in the late 1980s relied largely on internal restructuring, including through the injection of additional capital and active engagement in the management of borrowers (Ergungor, 2007).
4.4. The present state of Europe’s secondary loan market Judged against this experience and given the substantial loan distress in the wake of the European debt crisis, the EU secondary loans market is clearly underdeveloped. In 2016, the European market transacted loans with a gross value of about €146 billion, comprising a significant share of performing loans. The market was miniscule only seven years ago. At that point, the various national banking crises were well under way, and the NPL stock reached its peak in 2014 (Figure 71).
Figure 71: Total loan sales and NPL stocks in the EU, 2010-2016
(EUR bn)
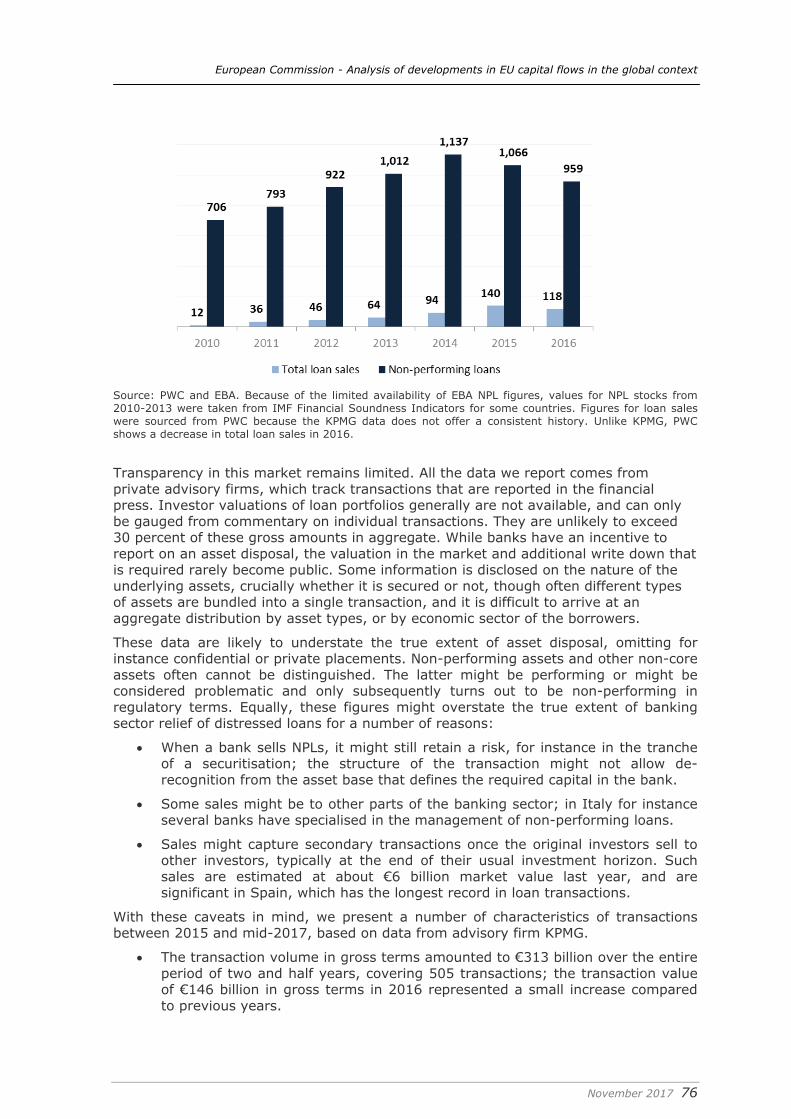
European Commission - Analysis of developments in EU capital flows in the global context
November 2017 76
Source: PWC and EBA. Because of the limited availability of EBA NPL figures, values for NPL stocks from 2010-2013 were taken from IMF Financial Soundness Indicators for some countries. Figures for loan sales were sourced from PWC because the KPMG data does not offer a consistent history. Unlike KPMG, PWC shows a decrease in total loan sales in 2016.
Transparency in this market remains limited. All the data we report comes from private advisory firms, which track transactions that are reported in the financial press. Investor valuations of loan portfolios generally are not available, and can only be gauged from commentary on individual transactions. They are unlikely to exceed 30 percent of these gross amounts in aggregate. While banks have an incentive to report on an asset disposal, the valuation in the market and additional write down that is required rarely become public. Some information is disclosed on the nature of the underlying assets, crucially whether it is secured or not, though often different types of assets are bundled into a single transaction, and it is difficult to arrive at an aggregate distribution by asset types, or by economic sector of the borrowers.
These data are likely to understate the true extent of asset disposal, omitting for instance confidential or private placements. Non-performing assets and other non-core assets often cannot be distinguished. The latter might be performing or might be considered problematic and only subsequently turns out to be non-performing in regulatory terms. Equally, these figures might overstate the true extent of banking sector relief of distressed loans for a number of reasons:
• When a bank sells NPLs, it might still retain a risk, for instance in the tranche of a securitisation; the structure of the transaction might not allow de-recognition from the asset base that defines the required capital in the bank.
• Some sales might be to other parts of the banking sector; in Italy for instance several banks have specialised in the management of non-performing loans.
• Sales might capture secondary transactions once the original investors sell to other investors, typically at the end of their usual investment horizon. Such sales are estimated at about €6 billion market value last year, and are significant in Spain, which has the longest record in loan transactions.
With these caveats in mind, we present a number of characteristics of transactions between 2015 and mid-2017, based on data from advisory firm KPMG.
• The transaction volume in gross terms amounted to €313 billion over the entire period of two and half years, covering 505 transactions; the transaction value of €146 billion in gross terms in 2016 represented a small increase compared to previous years.
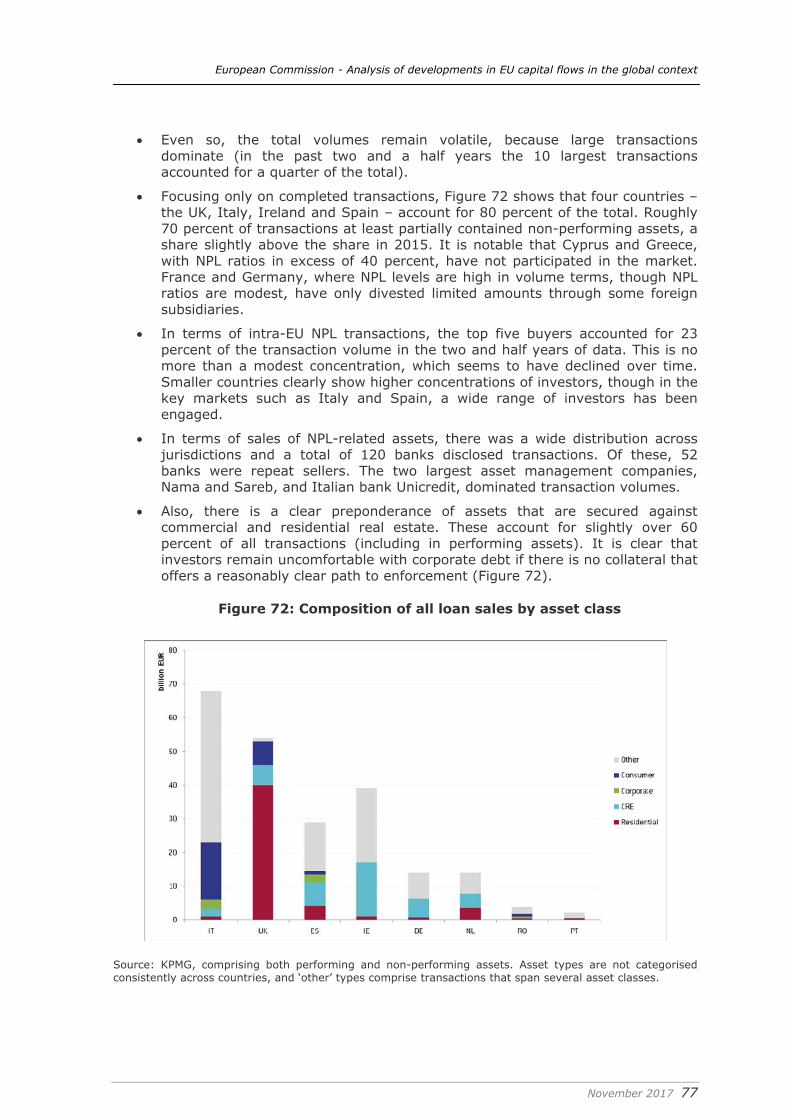
European Commission - Analysis of developments in EU capital flows in the global context
November 2017 77
• Even so, the total volumes remain volatile, because large transactions dominate (in the past two and a half years the 10 largest transactions accounted for a quarter of the total).
• Focusing only on completed transactions, Figure 72 shows that four countries – the UK, Italy, Ireland and Spain – account for 80 percent of the total. Roughly 70 percent of transactions at least partially contained non-performing assets, a share slightly above the share in 2015. It is notable that Cyprus and Greece, with NPL ratios in excess of 40 percent, have not participated in the market. France and Germany, where NPL levels are high in volume terms, though NPL ratios are modest, have only divested limited amounts through some foreign subsidiaries.
• In terms of intra-EU NPL transactions, the top five buyers accounted for 23 percent of the transaction volume in the two and half years of data. This is no more than a modest concentration, which seems to have declined over time. Smaller countries clearly show higher concentrations of investors, though in the key markets such as Italy and Spain, a wide range of investors has been engaged.
• In terms of sales of NPL-related assets, there was a wide distribution across jurisdictions and a total of 120 banks disclosed transactions. Of these, 52 banks were repeat sellers. The two largest asset management companies, Nama and Sareb, and Italian bank Unicredit, dominated transaction volumes.
• Also, there is a clear preponderance of assets that are secured against commercial and residential real estate. These account for slightly over 60 percent of all transactions (including in performing assets). It is clear that investors remain uncomfortable with corporate debt if there is no collateral that offers a reasonably clear path to enforcement (Figure 72).
Source: KPMG, comprising both performing and non-performing assets. Asset types are not categorised consistently across countries, and ‘other’ types comprise transactions that span several asset classes.
Figure 72: Composition of all loan sales by asset class
European Commission - Analysis of developments in EU capital flows in the global context
November 2017 78
Italy recorded about a third of total European transactions in 2016. Traditionally, transaction sizes have been small, and largely related to unsecured consumer portfolios, for which there is a well-developed servicing market. A larger number of secured portfolios are now expected to come to the market, as a number of banks have announced sales that could expand the total transaction volumes to €50 billion in 2017. Valuation gaps for secured portfolios are still large, which advisory firms attribute to the different valuation techniques used by these investors, and also to uncertainty over the foreclosure process (Ernst and Young, 2017, and Ciavoliello et al, 2016). In Ireland, Nama, the national asset management company, appears to have been instrumental in catalysing the market, having rapidly moved to sell some of the €74 billion in real estate assets that it acquired from five Irish banks in 2010. Several of the original investors are now coming to the end of their normal investment periods and some have begun to sell restructured portfolios to other investors, including to banks. In the central and south-eastern EU countries, transactions have risen quickly to over €6.5 billion. Romania accounted for the bulk of these transactions, following the aggressive provisioning policies initiated in 2014, and more active asset disposal strategies by the network banks and their subsidiaries. This is noteworthy because these are small markets with limited servicing capacities (EBRD, 2017). The growth in these markets underlines that investors operate in a number of distinct and parallel national markets, rather than an integrated European market. There are a number of large investment funds, of which many are from the US, that operate across all key jurisdictions (we examine their funding and mandates in more detail in section 4.6). In total, only about a fifth of the roughly 100 investors were active in more than one market, and these investors accounted for nearly half of the total sales volume. The remainder is accounted for by local investors that have participated in smaller local transactions, in particular in Spain and Italy, though not in cross-border investment. Given the very different workout procedures and legal environments, is not surprising that no multi-country portfolios have emerged. Also, the NPL portfolios that transact appear to be those where servicers largely work on recovery of collateral and enforcement with household and corporate borrowers. Commercial real estate is the predominant collateral. By contrast, the acquisition of sub-performing loans to enterprises that require restructuring is rare. This imbalance is similar to what was observed in the early stages of the Japanese market for secondary loans in the early 2000s (see section 4.6).
4.5. Distressed asset separation and broader bank restructuring NPL stocks in Europe are concentrated in a small number of countries that experienced sharp contractions and where bank restructuring and stricter supervision have not been implemented swiftly. Seven countries account for the bulk of the aggregate NPL stock (Demertzis and Lehmann, 2017). As yet, loan sales in Greece and Cyprus, each with NPL ratios above 40 percent, remain miniscule. By contrast, growth in transactions in 2016 in Italy, which still accounts for about 30 percent of euro-area NPL stocks, and more recently in Portugal and Spain are encouraging. On the whole the share of bank assets sold within national banking systems shows little correlation with the share of distressed loans (Figure 73) This is not surprising, because of course in several respects market activity does not match the incidence of loan distress:
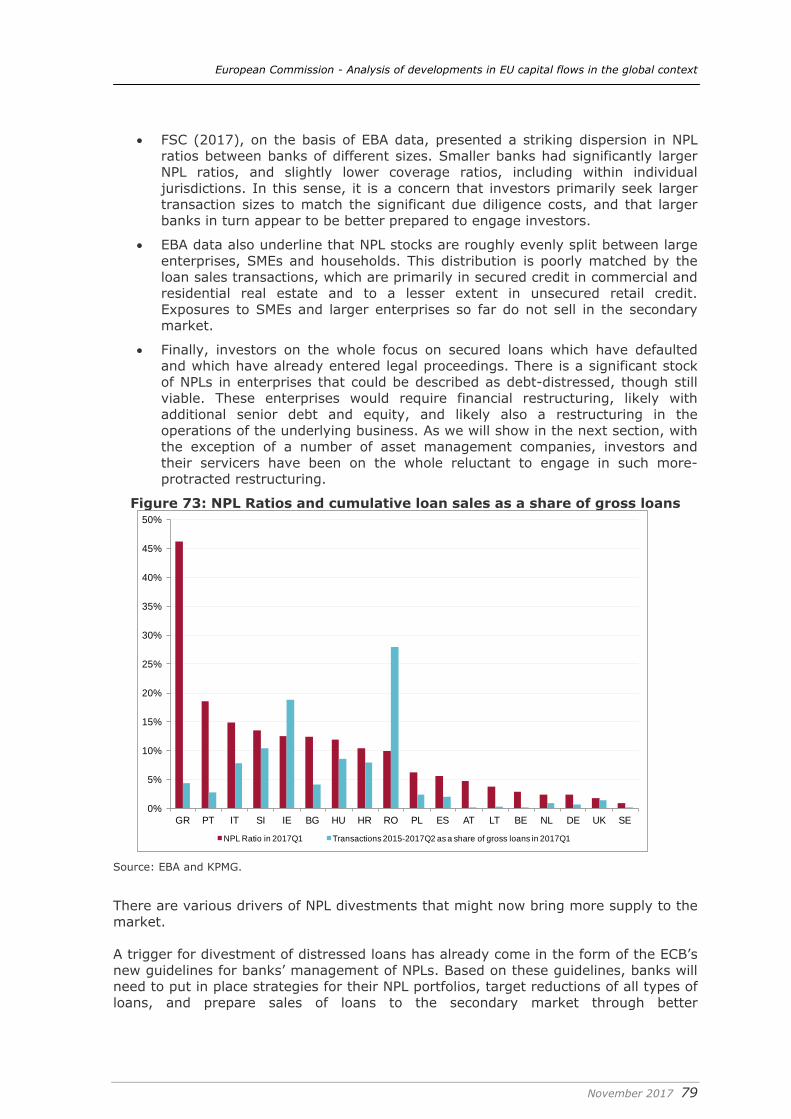
European Commission - Analysis of developments in EU capital flows in the global context
November 2017 79
• FSC (2017), on the basis of EBA data, presented a striking dispersion in NPL ratios between banks of different sizes. Smaller banks had significantly larger NPL ratios, and slightly lower coverage ratios, including within individual jurisdictions. In this sense, it is a concern that investors primarily seek larger transaction sizes to match the significant due diligence costs, and that larger banks in turn appear to be better prepared to engage investors.
• EBA data also underline that NPL stocks are roughly evenly split between large enterprises, SMEs and households. This distribution is poorly matched by the loan sales transactions, which are primarily in secured credit in commercial and residential real estate and to a lesser extent in unsecured retail credit. Exposures to SMEs and larger enterprises so far do not sell in the secondary market.
• Finally, investors on the whole focus on secured loans which have defaulted and which have already entered legal proceedings. There is a significant stock of NPLs in enterprises that could be described as debt-distressed, though still viable. These enterprises would require financial restructuring, likely with additional senior debt and equity, and likely also a restructuring in the operations of the underlying business. As we will show in the next section, with the exception of a number of asset management companies, investors and their servicers have been on the whole reluctant to engage in such more-protracted restructuring.
Figure 73: NPL Ratios and cumulative loan sales as a share of gross loans
0%
5%
10%
15%
20%
25%
30%
35%
40%
45%
50%
GR PT IT SI IE BG HU HR RO PL ES AT LT BE NL DE UK SE
NPL Ratio in 2017Q1 Transactions 2015-2017Q2 as a share of gross loans in 2017Q1
Source: EBA and KPMG.
There are various drivers of NPL divestments that might now bring more supply to the market. A trigger for divestment of distressed loans has already come in the form of the ECB’s new guidelines for banks’ management of NPLs. Based on these guidelines, banks will need to put in place strategies for their NPL portfolios, target reductions of all types of loans, and prepare sales of loans to the secondary market through better
European Commission - Analysis of developments in EU capital flows in the global context
November 2017 80
documentation and by engaging investors. While these guidelines have initially been implemented with the significant euro-area banks that have high NPL stocks, they will in principle apply to all banks under ECB supervision and, according to the July decision of the Council, should be rolled out to all banks in the banking union (Council of the EU, 2017). It is likely that over time these guidelines will help with the preparation for future sale of the distressed loan portfolios in a large number of EU banks. Greater liquidity in loan markets and scrutiny of NPL reduction strategies by investors and rating agencies could then lead to a self-sustaining growth in supply. Measures by supervisors are of course backed by reforms of national restructuring frameworks and insolvency regimes. The observed bid-ask valuation gaps in loan sales markets are related to the recovery rate, the expected cash flow in recovery and the uncertainty over the evolution of the recovery process. To the extent that national reforms speed up this process and make it more predictable, valuations will converge. A further impetus to divestment of distressed assets could come from the implementation of IFRS9 accounting standards in 2018. To date the provisions for individual loans were triggered by actual credit events, such as the loan becoming past due for more than 90 days. By contrast under the new standard that will come into effect in 2018, once there is a significant increase in credit risk, the credit loss that is expected over the entire lifetime of the loan will need to be provisioned. The need to reflect future conditions will require considerable judgement and there might well be sharp differences between institutions and fluctuations in provisions over time. The new accounting framework delivers on the commitment made by G20 governments in 2009 to dampen pro-cyclical lending behaviour and to put in place at an early stage more substantial provisions against credit losses. European regulators have welcomed this framework as encouraging a more timely recognition of credit losses, and a bolstering of loan loss reserves well ahead of actual credit events (ESRB, 2017b). In the near term provisions in EU banks could rise by about 13 percent (EBA, 2017). The need for additional provisioning under IFRS9 is most likely to arise for loans that have been performing but for which a future credit event can be anticipated. In addition, provisions will be more cyclical. In the transition to the new regime, net book values of loans are likely to decline, and thereby come more into line with investors’ valuations as the macroeconomic outlook deteriorates. This trend will be further reinforced if the ECB further tightens its guidance to banks on NPL management. Under a recent ECB proposal, NPLs newly emerging from 2018 would be subject to tighter provisioning, including through full provisioning of the unsecured component after two years. Performing but non-core assets For most banks the sale of non-performing loans is part of a broader process of divestment of so-called non-core assets. These are typically defined as assets that no longer fit a more focused business strategy that envisages a withdrawal from certain business lines, asset types or geographical markets. Banks are now scaling back their universal banking ambitions, based on which they offered not just traditional intermediation services but also investment banking or insurance services (ESRB, 2014). Moreover, the international financial crisis has led to a withdrawal from foreign markets, including within the EU, where equity stakes or entire subsidiaries are for sale. This is a consequence of regulatory ring-fencing by home-country authorities, or has been mandated by restructuring strategies applied as a remedy under EU competition rules.
European Commission - Analysis of developments in EU capital flows in the global context
November 2017 81
This process of so-called balance sheet optimisation is still in the early stages. Estimates of non-core loans are compiled by advisory firms that survey key European banks and compile figures from their published statements. Deloitte (2017) for instance, estimates loans that are performing but designated non-core at €1 trillion, an amount that has not declined significantly over recent years. This stock of assets is hence roughly as large as that of non-performing loans. The sale of this substantial stock of non-core assets has been broadly welcomed by regulators (Nouy, 2017). There is a consensus that Europe is ‘over-banked’, and that this is evident in the imbalance between bank assets and relatively under-developed capital markets, in the slow progress in bank consolidation and in often unfocused business models that have contributed to low profitability (ESRB, 2014). Several empirical studies have identified a threshold for financial depth beyond which the growth effect of additional financial development turns negative (eg Arcand, Berkes and Panizza, 2012). While these studies generally relate to total credit, some have also identified a positive growth effect in which credit shifts from bank to capital market sources (Cournède and Denk, 2015). A report by the ESRB (2016) expects that the low interest rate environment in the EU has accelerated a shift from bank to capital market-based finance, but also flags a number of stability risks in this transition. The substantial stock of other non-core assets will need to be reflected in any policy on the secondary loans market. In addition to NPLs a substantial stock of other assets will be offered in the capital markets as the process of bank restructuring gathers pace. Banks generally support the divestment of both performing non-core and NPL assets through the same internal organisational structure, and appeal to the same investors.
4.6. The investors and their servicers A more rapid pace of asset divestment would move a substantial share of EU bank assets into the hands of investors and their loan servicers. These investors are on the whole lightly regulated, and entered EU capital markets only recently. It is natural, therefore, that the attention of regulators has now focused on the composition of investors in the secondary loans market, on their business models and on the conduct of their servicers. The analysis of the transactions between 2015 and mid-2017 (including performing assets) shows that 100 investors have been active in the European market over this period, of which 35 were involved in more than one transaction. Just five investors account for about 23 percent of the gross value of transactions. These investors operate across all key European loans markets16. Three of these five investors were US-owned institutions, albeit with significant subsidiaries in the UK, and their share of the market appears to have gone down. In addition, there are a large number of smaller investors and some specialist banks active in the market, many of which are solely invested in their respective home countries, and market participants suggested that competition has intensified. The investment mandates that guide investors can be characterised in a number of ways. Individual fund companies might run several distressed debt funds, though each of these funds would be quite narrowly delimited.
16 KPMG transactions database.
European Commission - Analysis of developments in EU capital flows in the global context
November 2017 82
• Firstly, investors are engaged either in secured assets, typically commercial and residential real estate, or in unsecured loans. Unsecured retail credit in particular lends itself to more standardised workout procedures; statistical methods yield predictable valuations for these granular portfolios.
• Secondly, investors in corporate loans primarily engage in workout, that is either a restructuring or foreclosure and subsequent enforcement of collateral. Very few have the capacity to provide additional debt and equity in the process of this restructuring. This type of investment in distressed but still viable enterprises would typically entail operational and financial restructuring. It is typically done by investors with expertise in private equity investments, and is limited to larger corporate loans. The investor may initially only take a partial risk share.
Several studies have suggested that the relatively concentrated investor base points to potential buyers having market power and that this in turn has led to the persistently wide spreads between book values of assets and valuations offered by investors (ESRB, 2017). It is clear that a potential investor in the secondary loan market confronts a number of barriers to entry. These result from fixed costs specific to the market and its legal regime, and from the need to establish a local servicing capacity. In addition, there are significant sunk costs inherent in conducting due diligence on individual transactions. The bidding process will have an uncertain outcome, not least as the commitment of the seller and the nature of the portfolio for sale might change over the course of the sale process. These characteristics of the loan sale market will therefore result in only larger portfolios transacting. Market participants highlighted that investor concentration appears to have declined as more investors with different risk appetites have entered the market. That the problems of transaction size are not insurmountable is underlined by the relatively brisk pace of loan sales in emerging Europe with its typically smaller portfolios and markets (EBRD, 2017). Problems in sharing information about asset quality do not seem to be prominent where large banks interact with investors repeatedly, and therefore seek to establish a reputation for portraying loan-quality data accurately. Higher quality loan portfolios are selected for early transactions. This is not in line with what adverse selection models, for instance in ECB (2016), would suggest. Investors will confront such information barriers with smaller banks or first-time sales. Banks expend significant resources through advisory services to prepare portfolios and complete data coverage. Loans to large enterprises and SMEs have not accounted for a large share of transactions to date. Investors therefore showed little concern that resources expended on maintenance of assets or the benefits of restructuring solutions could benefit other creditors. The high spreads between the book value of a portfolio on a bank’s balance sheet, and the bids by the potential investors are also attributed to investors applying higher discount rates in valuing portfolios, given their higher costs of capital. However, it can be shown that the bid-ask spreads can be almost entirely explained by the lower leverage within the funding of investment vehicles. Moreover, unlike banks, investors deduct immediately from the price the costs related to managing NPLs over the entire workout process (Ciavoliello et al, 2016).
European Commission - Analysis of developments in EU capital flows in the global context
November 2017 83
The European loan servicing sector A final barrier on the demand side of the loan sales market might lay in the difficulty in establishing a local servicing capacity because few investors will manage the acquired loans independently. Servicers provide portfolio management and debt collection. In many instances, in-house servicers work exclusively for a single investor. Larger loan servicing firms have begun to act as investors in their own right, or commit to acquiring a certain volume of distressed assets. More complex transactions with banks have involved the acquisition of an entire servicing platform including its employees together with a portfolio. Given the typically long track records in their home markets, loan servicers will have developed the efficiency and skills in the management of portfolios, and in workout and enforcement. Evidence from US mortgage servicers suggests there are significant economies of scale in this industry. Debt collection and servicing in the unsecured retail segment is a fragmented industry that is largely separated along national lines (FSC, 2017). By contrast, NPL servicers with a capacity to handle corporate loans are more concentrated, and are expanding across Europe. In central and south-eastern Europe, for instance, several major western European companies are now offering services in all principal asset classes, and across all key markets (EBRD, 2017). Industry observers expect that the trend towards consolidation and diversification within Europe will continue in this segment. Ultimately, these companies do not have the capacity to bear major risks on their balance sheets and the more stable and less capital-intensive fee-based servicing of portfolios financed by investors and banks is likely to grow more strongly than businesses based on direct debt purchases (S&P, 2016)17. A small number of independent servicers have begun to extend operations from loan sale markets that developed early, such as Spain, to those that are about to develop, such as Greece. The prominent role of servicers in loan workout has given rise to a number of incentive problems:
• Investors might bid for portfolios that their established servicer has already handled on behalf of another institution.
• A second problem arises if the fee paid by the investor to the servicer is based on value recovery. Clearly the servicer’s incentives to ensure early disposal and minimisation of costs might not coincide with those of the investor, which will aim at value recovery over the long term and observance of its principles of conduct in relation to borrowers.
• Where the investor acquires a securitised portfolio of distressed assets but leaves the servicing function with the bank that originated the loan, a number of moral hazard problems arise (ESRB, 2017).
17 S&P (2016) rated six debt collection companies (DCCs) in Europe and observed solid performance in 2016, with amounts of gross debt growing from €4.5 billion in September 2015 to about €7 billion in September 2016, with this trend expected to continue in 2017. The DCCs manage mostly commercial real estate, but S&P reports a rise in the consumer debt and secured sectors in the last year. This, in their view, reflects the “increasing propensity of financial institutions to sell off their consumer NPLs and the growing presence of corporate non-financial vendors in the consumer debt space”. The report also noted the market trend of consolidation.
European Commission - Analysis of developments in EU capital flows in the global context
November 2017 84
Investors on the whole do not seem to be concerned about the management of incentives of servicers acting on their behalf. On the other hand, a number of EU member states, such as Ireland, have now restricted potential conflict of interest situations. A reputation for sound interaction with borrowers is paramount for the standing of the investor in each market. Normally, they would guide their servicers through detailed codes of conduct, and servicers that have been acquired by, or work exclusively for, a particular investor will be under very close supervision. AMCs can play an important role in defining such standards, and developing the servicing industry, as appears to have happened in Ireland and Spain.
4.7. Regulatory barriers to an integrated EU market To what extent do national barriers inhibit the development of secondary loan markets and their integration across the EU? The stocktake of national legal frameworks by the ECB (2017c) finds most NPL markets in the euro area are underdeveloped, with modest development only in the Ireland and Spain. However, the survey does not identify formal restrictions in the legal and regulatory frameworks that would impede the entry of NPL investors, and their acquisition of assets. All 19 euro-area jurisdictions allow the transfer of loans without the borrower’s consent, and all countries allow their banks to sell NPL assets to foreign investors and non-banking institutions. While some of the seven euro-area countries with high NPL ratios indicated restrictions in the first survey published in late 2016, these appear to have been lifted since. Investors are of course discouraged from entering certain markets by the range of obstacles in relation to loan enforcement and liquidation. The ECB survey flags some familiar shortcomings. The judicial regime, debt enforcement and the lack of liquidity of local debt sales markets were seen as the main obstacles in the entire group of 19 euro-area countries. Most of these responses came from the subset of seven jurisdictions with high NPL levels (Figure 74). Gaps between the valuations of distressed assets by investors and the divesting banks result to a great extent from the lengthy recovery procedures and uncertainty about their evolution, and the costs of these procedures. More efficiently functioning national workout procedures and judicial systems would therefore help to narrow valuation gaps and lead to greater liquidity in loans markets. From the results of the ECB survey it appears that explicit national supervisory practices on loan transfers no longer represent a meaningful obstacle to the development of secondary loan markets in the euro area. EU countries outside the currency union are likely to have more restrictions on asset transfers, in particular in central and south eastern Europe. A constraint flagged up by a number of investors is restrictions on their ability to provide additional credit to investee companies. Such funding would need to be protected in a more senior status in a restructuring. Also, under an EU Directive, asset managers remain unable to sponsor securitisations. In addition, some investors also saw the present rules on de-recognition as overly restrictive. These rules stipulate to what extent a bank that retains a share of risk in a loan that has been transferred still needs to provide capital coverage for that loan. This is particularly relevant for securitisations and other risk transfers. Similarly, few restrictions appear to restrain the activities of loan servicers, including in cross-border service provision. Several euro-area countries have liberalised this sector in recent years (ECB, 2017c). Some countries have introduced regulation to
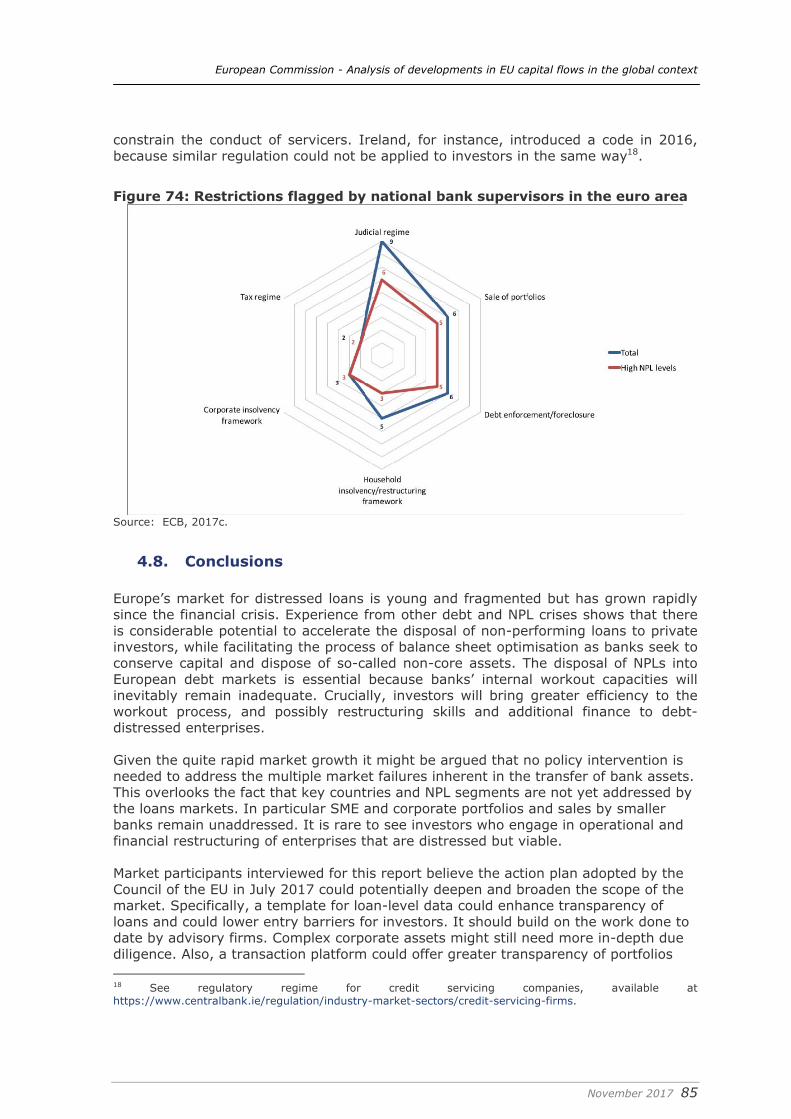
European Commission - Analysis of developments in EU capital flows in the global context
November 2017 85
constrain the conduct of servicers. Ireland, for instance, introduced a code in 2016, because similar regulation could not be applied to investors in the same way18.
Figure 74: Restrictions flagged by national bank supervisors in the euro area
Source: ECB, 2017c.
4.8. Conclusions Europe’s market for distressed loans is young and fragmented but has grown rapidly since the financial crisis. Experience from other debt and NPL crises shows that there is considerable potential to accelerate the disposal of non-performing loans to private investors, while facilitating the process of balance sheet optimisation as banks seek to conserve capital and dispose of so-called non-core assets. The disposal of NPLs into European debt markets is essential because banks’ internal workout capacities will inevitably remain inadequate. Crucially, investors will bring greater efficiency to the workout process, and possibly restructuring skills and additional finance to debt-distressed enterprises. Given the quite rapid market growth it might be argued that no policy intervention is needed to address the multiple market failures inherent in the transfer of bank assets. This overlooks the fact that key countries and NPL segments are not yet addressed by the loans markets. In particular SME and corporate portfolios and sales by smaller banks remain unaddressed. It is rare to see investors who engage in operational and financial restructuring of enterprises that are distressed but viable. Market participants interviewed for this report believe the action plan adopted by the Council of the EU in July 2017 could potentially deepen and broaden the scope of the market. Specifically, a template for loan-level data could enhance transparency of loans and could lower entry barriers for investors. It should build on the work done to date by advisory firms. Complex corporate assets might still need more in-depth due diligence. Also, a transaction platform could offer greater transparency of portfolios 18 See regulatory regime for credit servicing companies, available at https://www.centralbank.ie/regulation/industry-market-sectors/credit-servicing-firms.
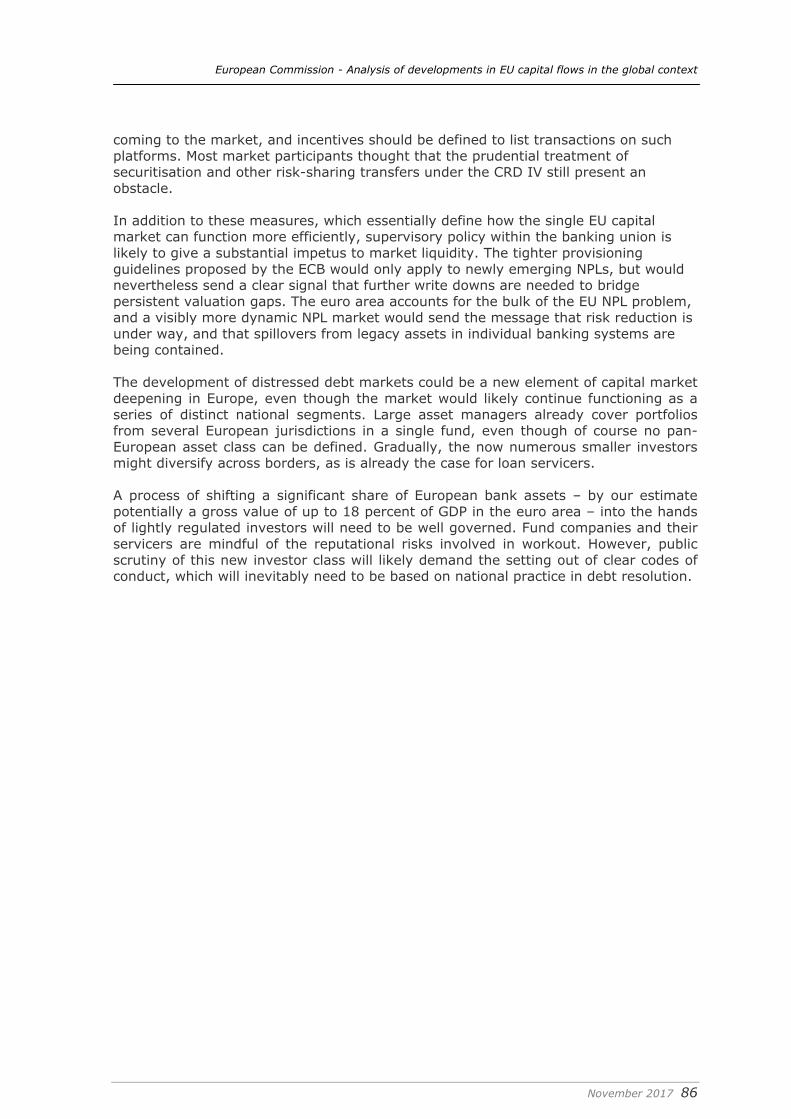
European Commission - Analysis of developments in EU capital flows in the global context
November 2017 86
coming to the market, and incentives should be defined to list transactions on such platforms. Most market participants thought that the prudential treatment of securitisation and other risk-sharing transfers under the CRD IV still present an obstacle. In addition to these measures, which essentially define how the single EU capital market can function more efficiently, supervisory policy within the banking union is likely to give a substantial impetus to market liquidity. The tighter provisioning guidelines proposed by the ECB would only apply to newly emerging NPLs, but would nevertheless send a clear signal that further write downs are needed to bridge persistent valuation gaps. The euro area accounts for the bulk of the EU NPL problem, and a visibly more dynamic NPL market would send the message that risk reduction is under way, and that spillovers from legacy assets in individual banking systems are being contained. The development of distressed debt markets could be a new element of capital market deepening in Europe, even though the market would likely continue functioning as a series of distinct national segments. Large asset managers already cover portfolios from several European jurisdictions in a single fund, even though of course no pan-European asset class can be defined. Gradually, the now numerous smaller investors might diversify across borders, as is already the case for loan servicers. A process of shifting a significant share of European bank assets – by our estimate potentially a gross value of up to 18 percent of GDP in the euro area – into the hands of lightly regulated investors will need to be well governed. Fund companies and their servicers are mindful of the reputational risks involved in workout. However, public scrutiny of this new investor class will likely demand the setting out of clear codes of conduct, which will inevitably need to be based on national practice in debt resolution.
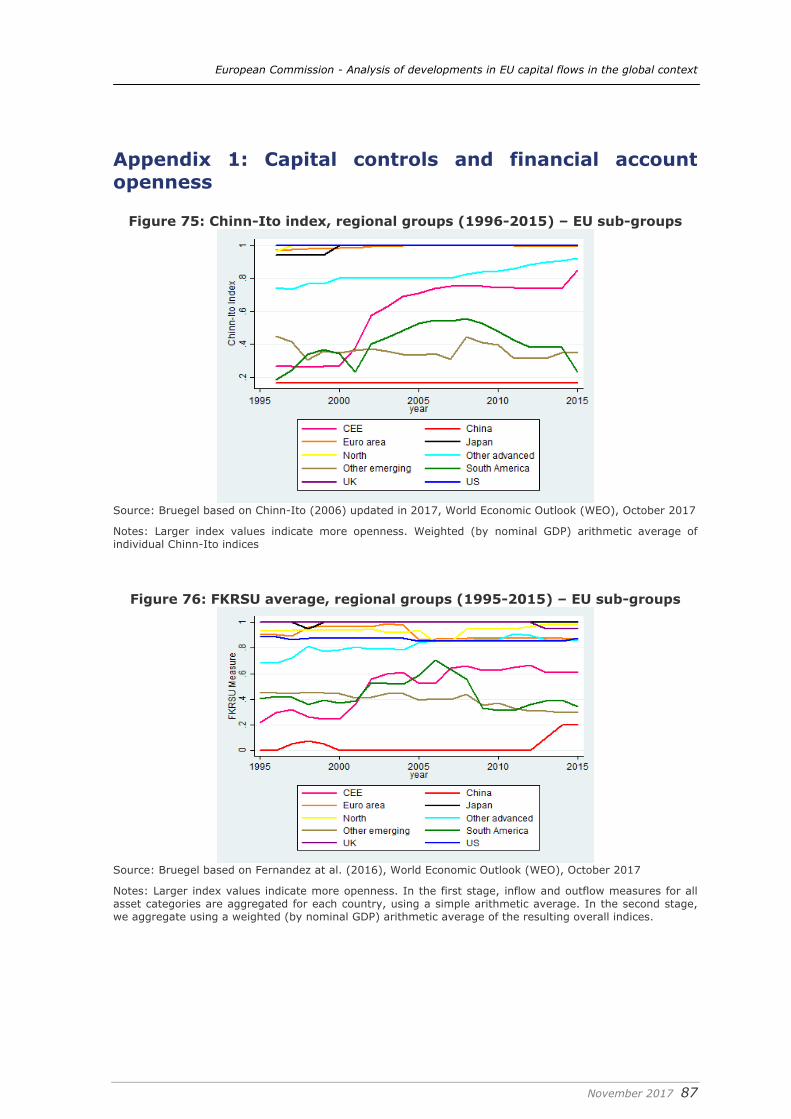
European Commission - Analysis of developments in EU capital flows in the global context
November 2017 87
Appendix 1: Capital controls and financial account openness
Figure 75: Chinn-Ito index, regional groups (1996-2015) – EU sub-groups
Source: Bruegel based on Chinn-Ito (2006) updated in 2017, World Economic Outlook (WEO), October 2017
Notes: Larger index values indicate more openness. Weighted (by nominal GDP) arithmetic average of individual Chinn-Ito indices
Figure 76: FKRSU average, regional groups (1995-2015) – EU sub-groups
Source: Bruegel based on Fernandez at al. (2016), World Economic Outlook (WEO), October 2017
Notes: Larger index values indicate more openness. In the first stage, inflow and outflow measures for all asset categories are aggregated for each country, using a simple arithmetic average. In the second stage, we aggregate using a weighted (by nominal GDP) arithmetic average of the resulting overall indices.
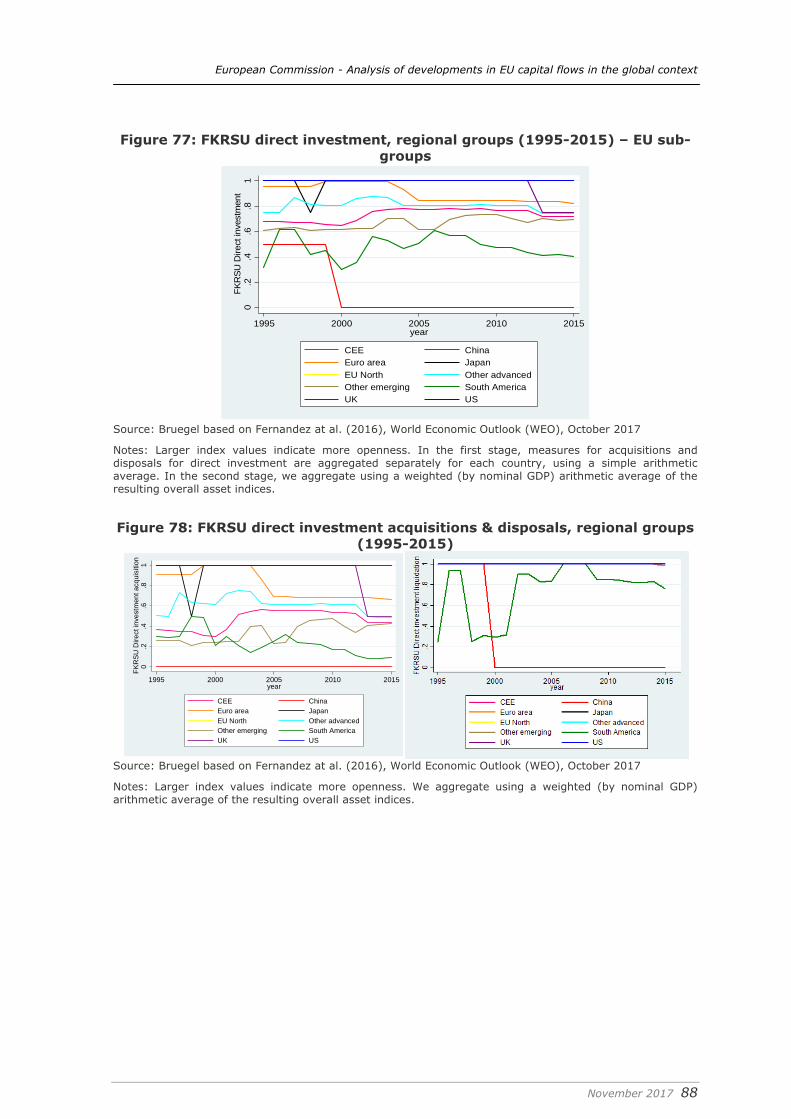
European Commission - Analysis of developments in EU capital flows in the global context
November 2017 88
Figure 77: FKRSU direct investment, regional groups (1995-2015) – EU sub-groups
0.2
.4.6
.81
FKR
SU D
irect
inve
stm
ent
1995 2000 2005 2010 2015year
CEE ChinaEuro area JapanEU North Other advancedOther emerging South AmericaUK US
Source: Bruegel based on Fernandez at al. (2016), World Economic Outlook (WEO), October 2017
Notes: Larger index values indicate more openness. In the first stage, measures for acquisitions and disposals for direct investment are aggregated separately for each country, using a simple arithmetic average. In the second stage, we aggregate using a weighted (by nominal GDP) arithmetic average of the resulting overall asset indices.
Figure 78: FKRSU direct investment acquisitions & disposals, regional groups
(1995-2015)
0.2
.4.6
.81
FKR
SU D
irect
inve
stm
ent a
cqui
sitio
n
1995 2000 2005 2010 2015year
CEE ChinaEuro area JapanEU North Other advancedOther emerging South AmericaUK US
Source: Bruegel based on Fernandez at al. (2016), World Economic Outlook (WEO), October 2017
Notes: Larger index values indicate more openness. We aggregate using a weighted (by nominal GDP) arithmetic average of the resulting overall asset indices.
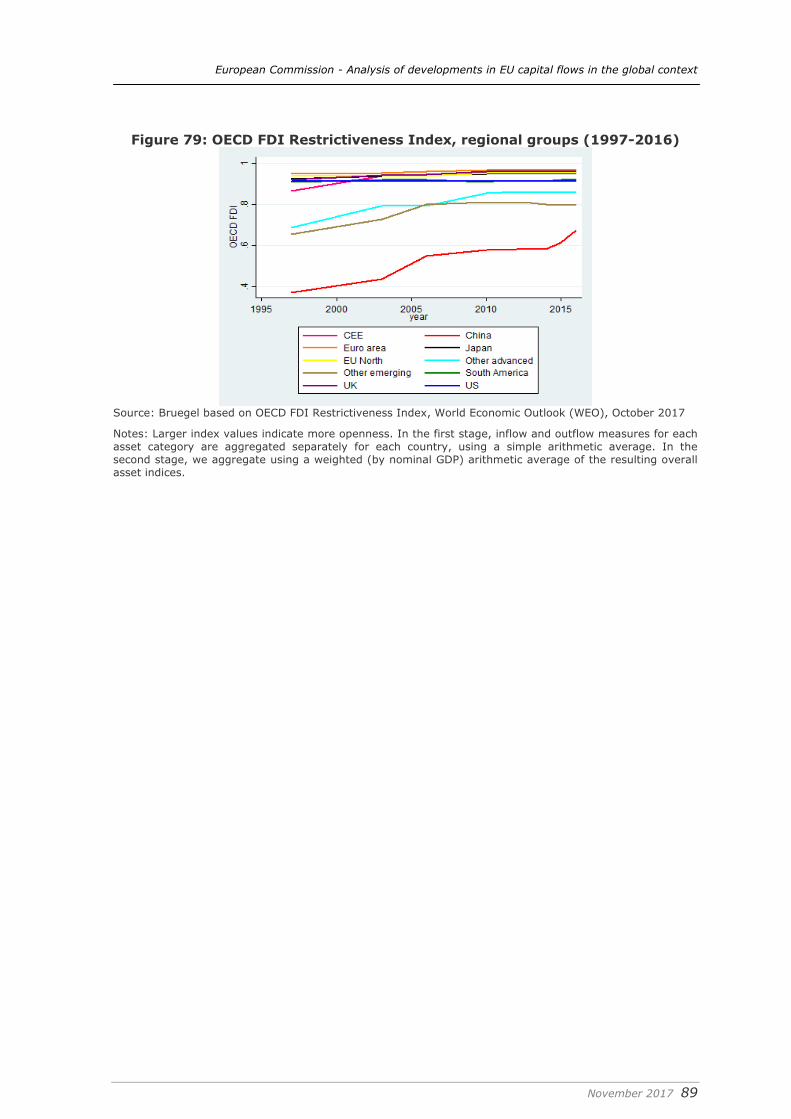
European Commission - Analysis of developments in EU capital flows in the global context
November 2017 89
Figure 79: OECD FDI Restrictiveness Index, regional groups (1997-2016)
Source: Bruegel based on OECD FDI Restrictiveness Index, World Economic Outlook (WEO), October 2017
Notes: Larger index values indicate more openness. In the first stage, inflow and outflow measures for each asset category are aggregated separately for each country, using a simple arithmetic average. In the second stage, we aggregate using a weighted (by nominal GDP) arithmetic average of the resulting overall asset indices.
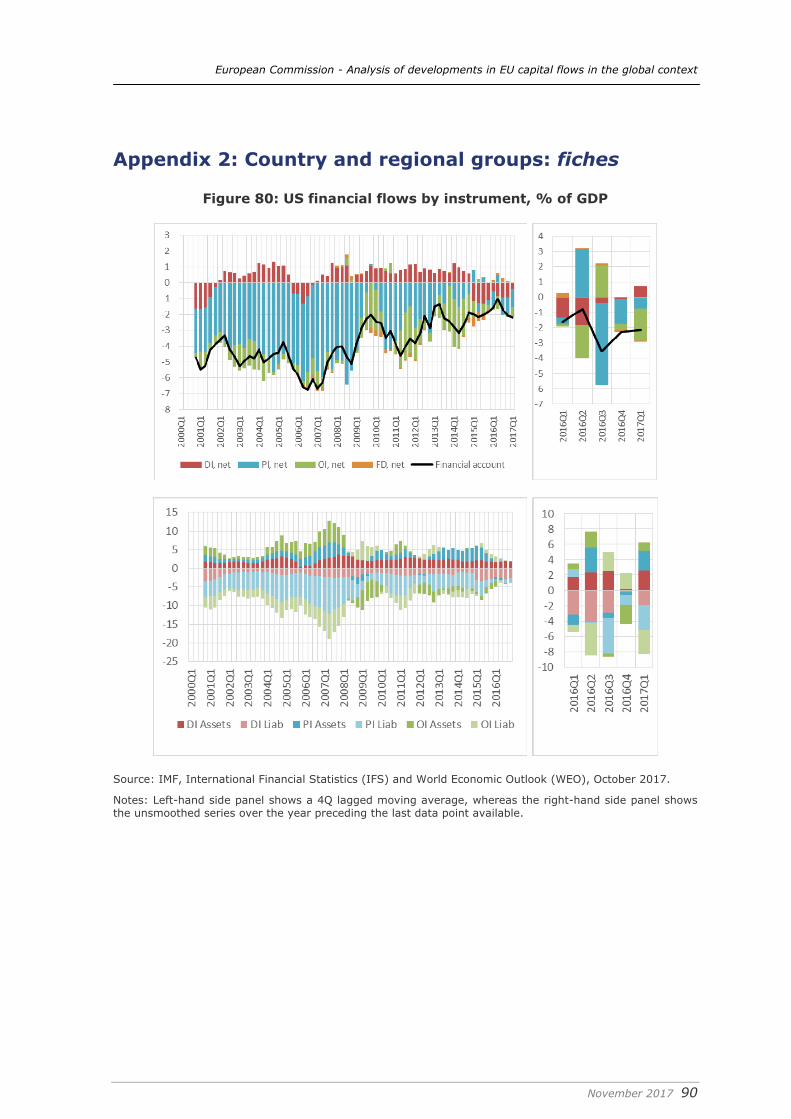
European Commission - Analysis of developments in EU capital flows in the global context
November 2017 90
Appendix 2: Country and regional groups: fiches
Figure 80: US financial flows by instrument, % of GDP
Source: IMF, International Financial Statistics (IFS) and World Economic Outlook (WEO), October 2017.
Notes: Left-hand side panel shows a 4Q lagged moving average, whereas the right-hand side panel shows the unsmoothed series over the year preceding the last data point available.
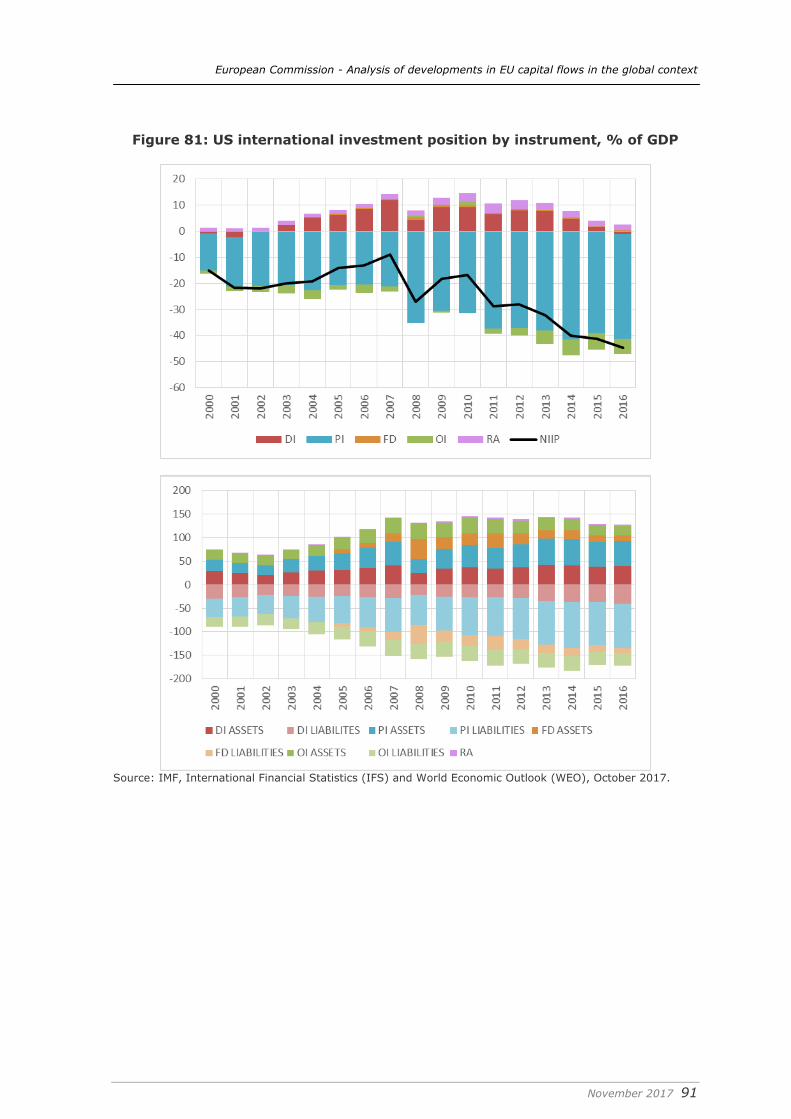
European Commission - Analysis of developments in EU capital flows in the global context
November 2017 91
Figure 81: US international investment position by instrument, % of GDP
Source: IMF, International Financial Statistics (IFS) and World Economic Outlook (WEO), October 2017.
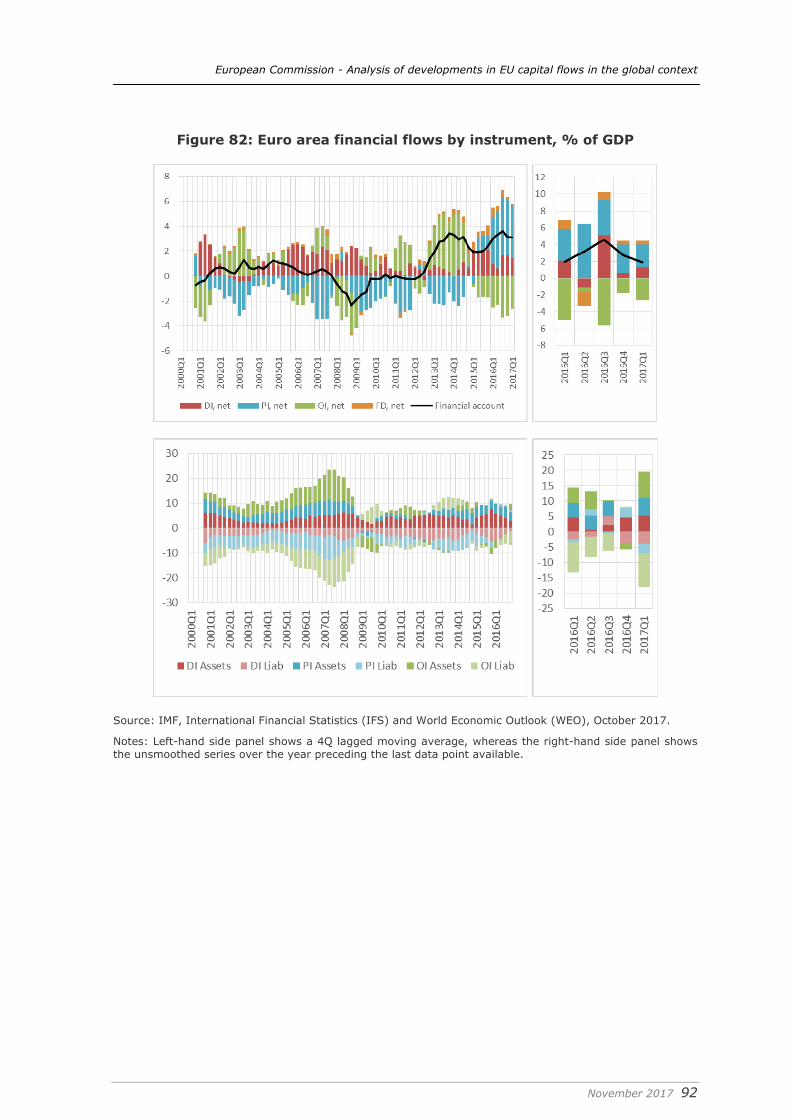
European Commission - Analysis of developments in EU capital flows in the global context
November 2017 92
Figure 82: Euro area financial flows by instrument, % of GDP
Source: IMF, International Financial Statistics (IFS) and World Economic Outlook (WEO), October 2017.
Notes: Left-hand side panel shows a 4Q lagged moving average, whereas the right-hand side panel shows the unsmoothed series over the year preceding the last data point available.
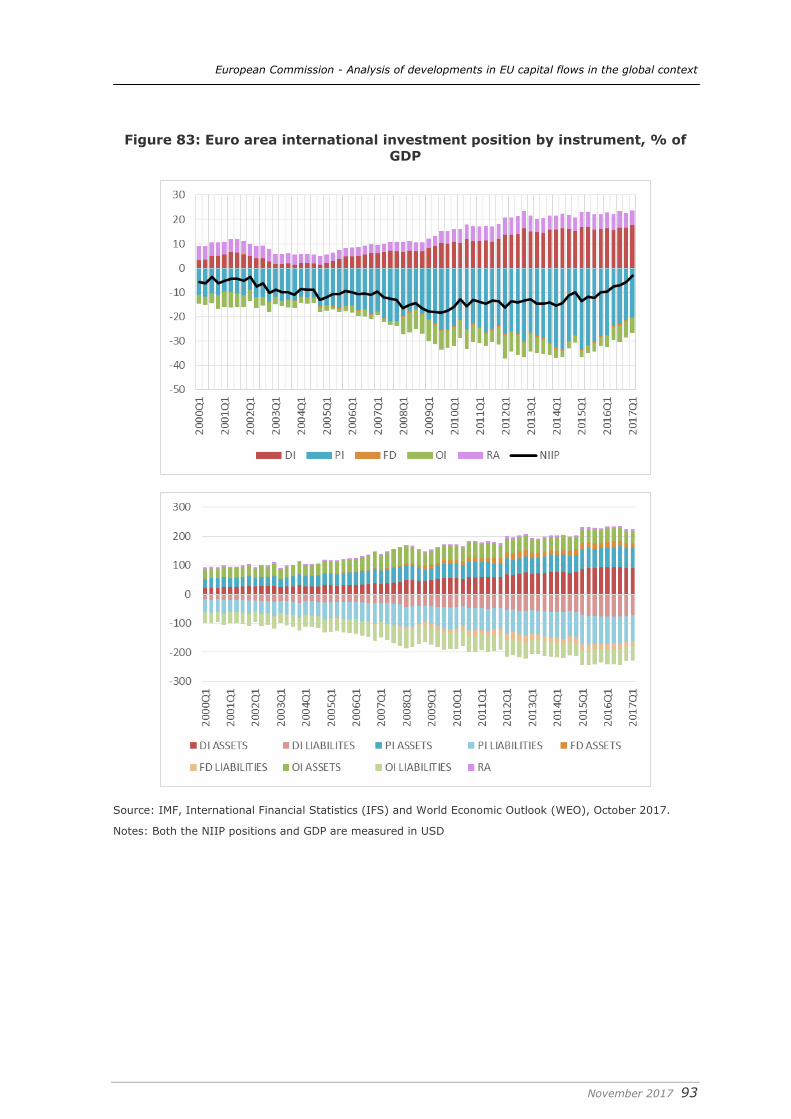
European Commission - Analysis of developments in EU capital flows in the global context
November 2017 93
Figure 83: Euro area international investment position by instrument, % of GDP
Source: IMF, International Financial Statistics (IFS) and World Economic Outlook (WEO), October 2017.
Notes: Both the NIIP positions and GDP are measured in USD
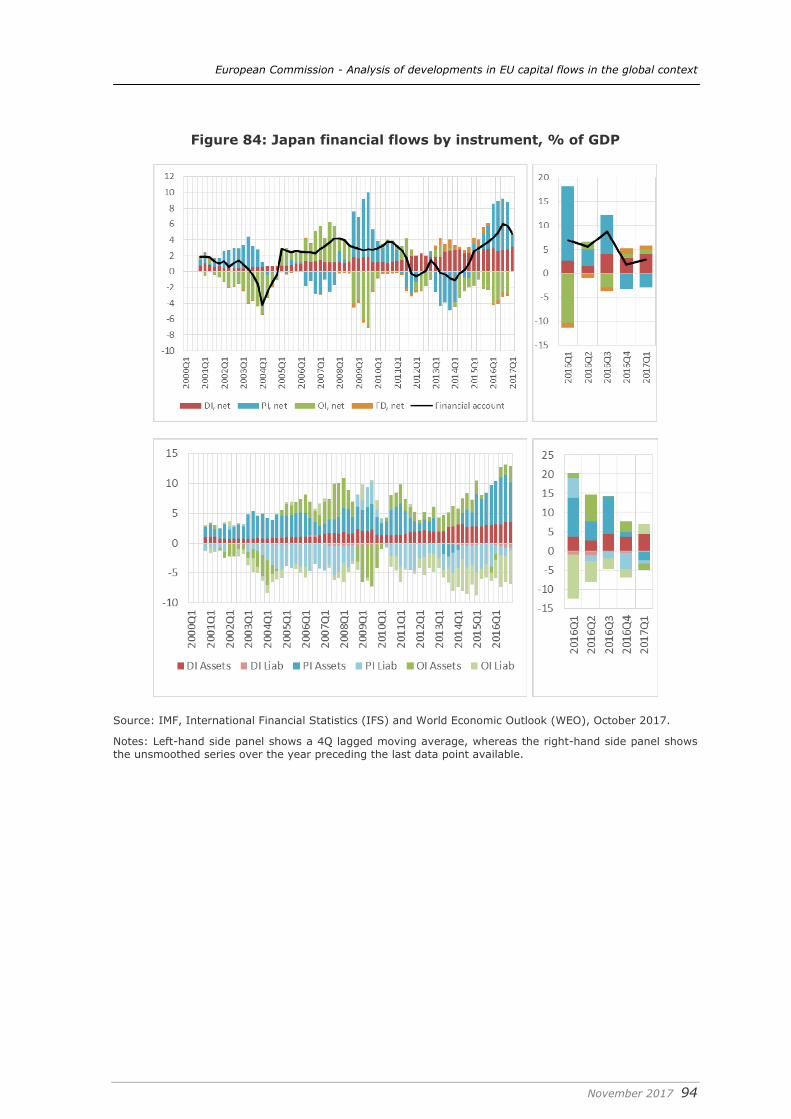
European Commission - Analysis of developments in EU capital flows in the global context
November 2017 94
Figure 84: Japan financial flows by instrument, % of GDP
Source: IMF, International Financial Statistics (IFS) and World Economic Outlook (WEO), October 2017.
Notes: Left-hand side panel shows a 4Q lagged moving average, whereas the right-hand side panel shows the unsmoothed series over the year preceding the last data point available.
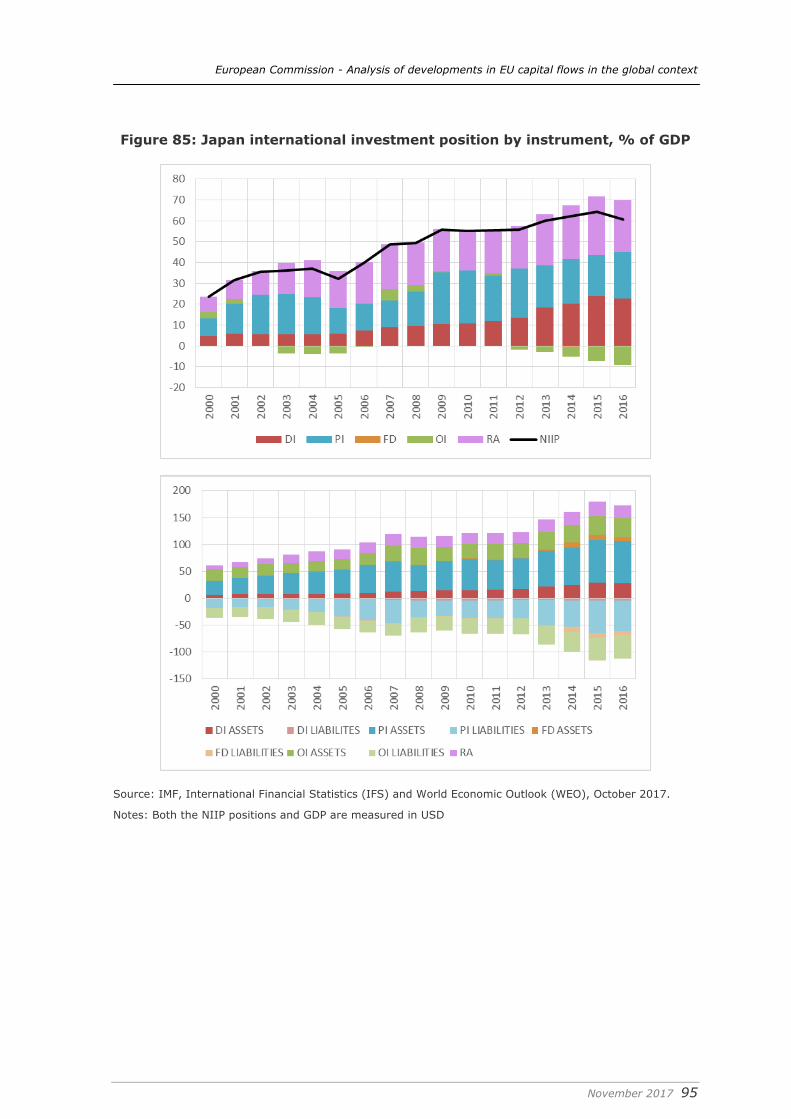
European Commission - Analysis of developments in EU capital flows in the global context
November 2017 95
Figure 85: Japan international investment position by instrument, % of GDP
Source: IMF, International Financial Statistics (IFS) and World Economic Outlook (WEO), October 2017.
Notes: Both the NIIP positions and GDP are measured in USD
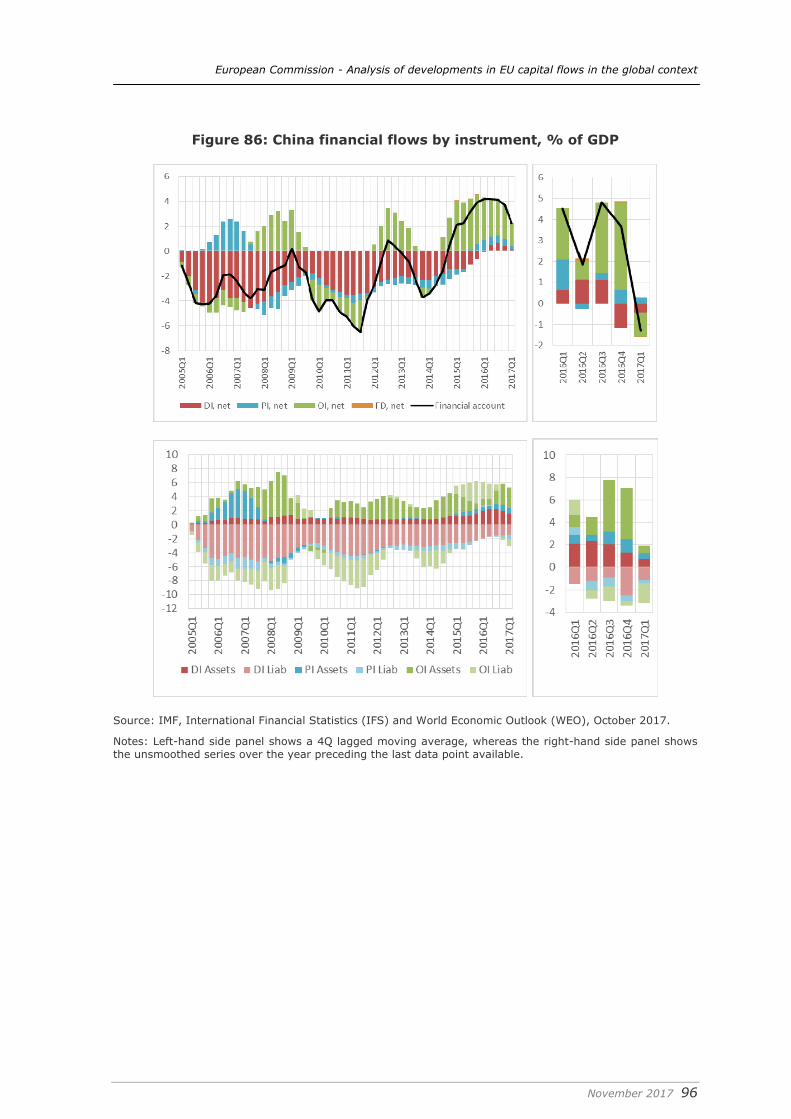
European Commission - Analysis of developments in EU capital flows in the global context
November 2017 96
Figure 86: China financial flows by instrument, % of GDP
Source: IMF, International Financial Statistics (IFS) and World Economic Outlook (WEO), October 2017.
Notes: Left-hand side panel shows a 4Q lagged moving average, whereas the right-hand side panel shows the unsmoothed series over the year preceding the last data point available.
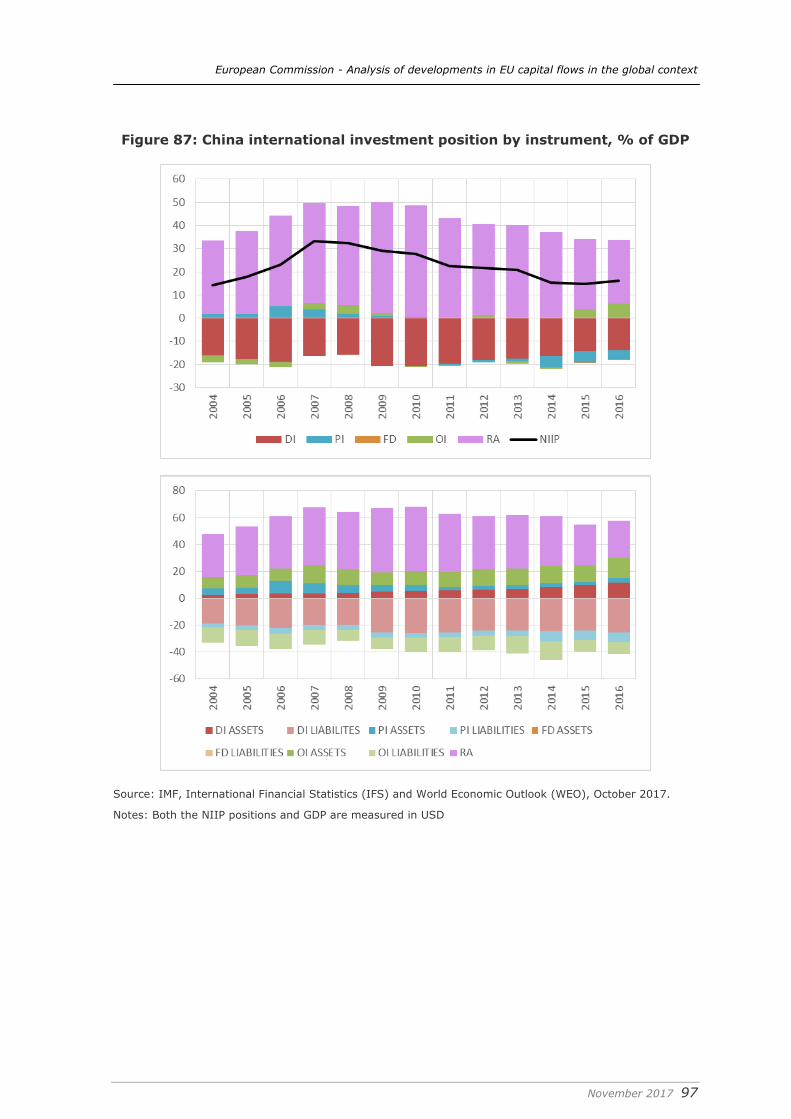
European Commission - Analysis of developments in EU capital flows in the global context
November 2017 97
Figure 87: China international investment position by instrument, % of GDP
Source: IMF, International Financial Statistics (IFS) and World Economic Outlook (WEO), October 2017.
Notes: Both the NIIP positions and GDP are measured in USD
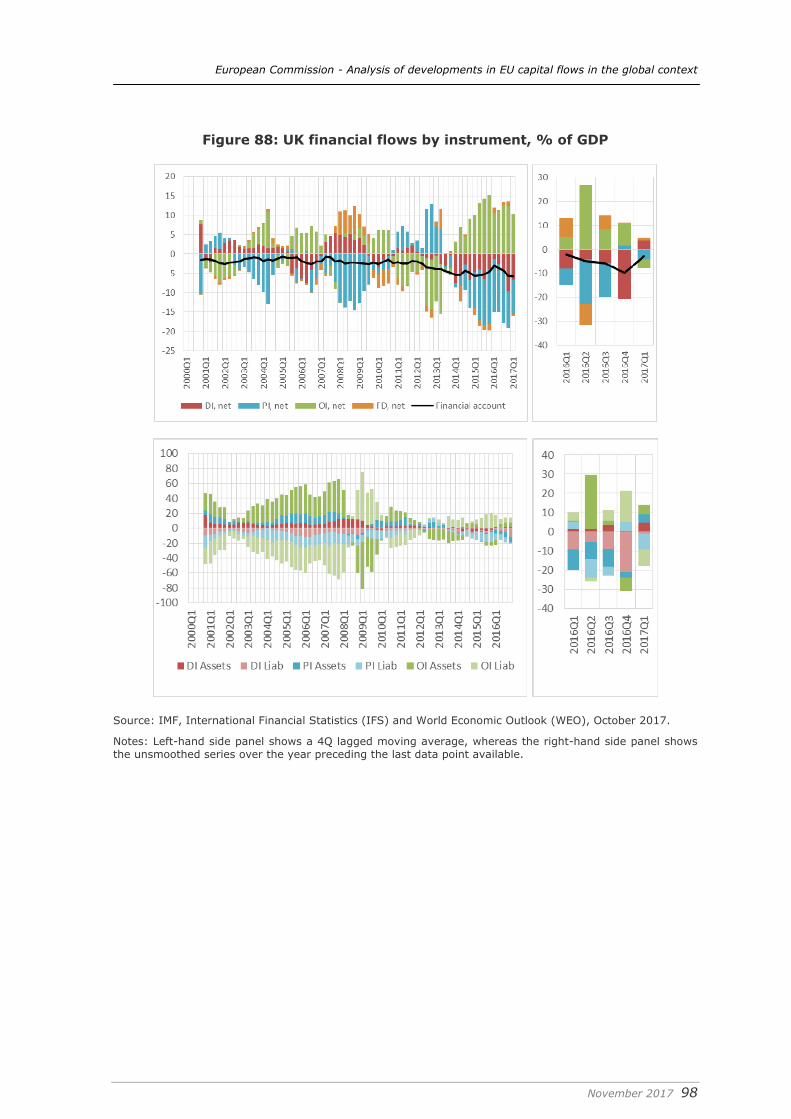
European Commission - Analysis of developments in EU capital flows in the global context
November 2017 98
Figure 88: UK financial flows by instrument, % of GDP
Source: IMF, International Financial Statistics (IFS) and World Economic Outlook (WEO), October 2017.
Notes: Left-hand side panel shows a 4Q lagged moving average, whereas the right-hand side panel shows the unsmoothed series over the year preceding the last data point available.
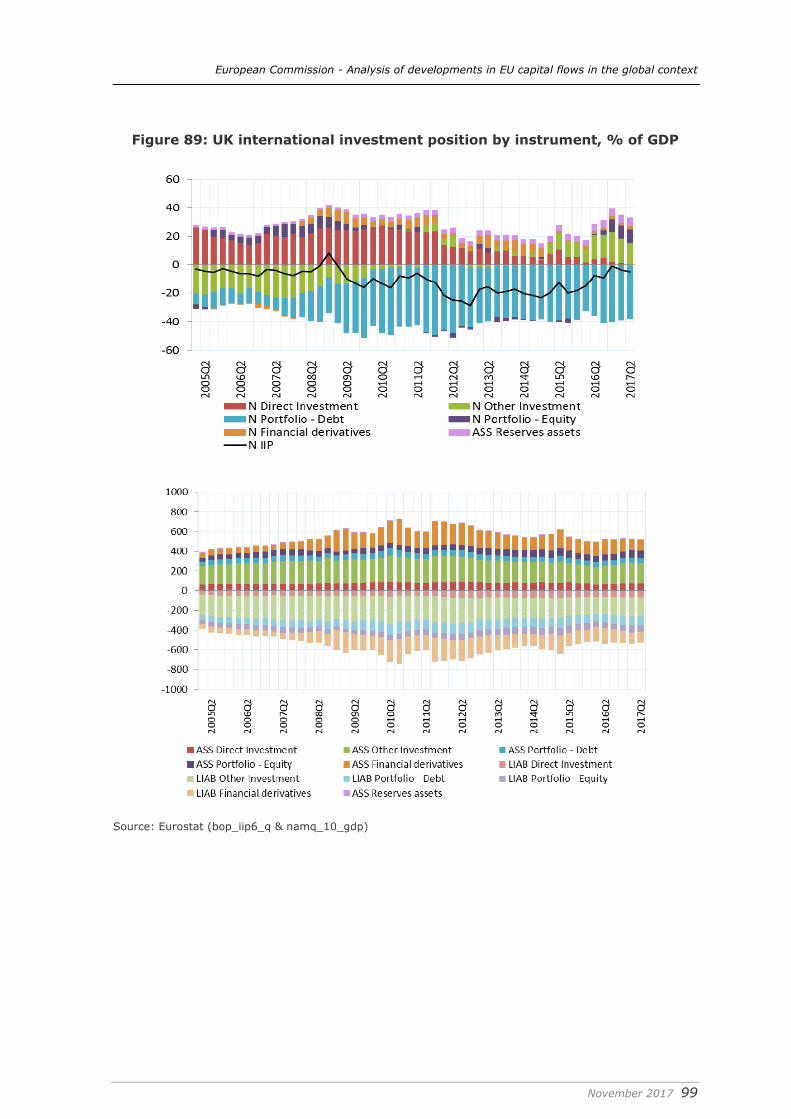
European Commission - Analysis of developments in EU capital flows in the global context
November 2017 99
Figure 89: UK international investment position by instrument, % of GDP
Source: Eurostat (bop_iip6_q & namq_10_gdp)
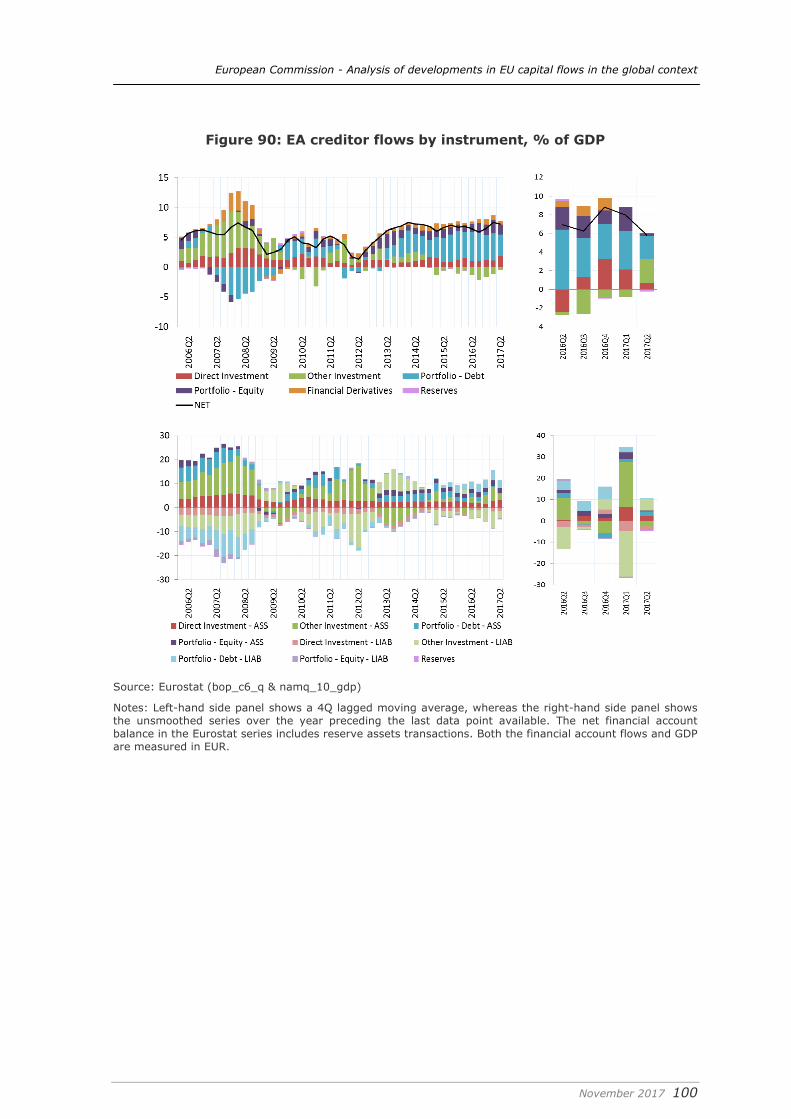
European Commission - Analysis of developments in EU capital flows in the global context
November 2017 100
Figure 90: EA creditor flows by instrument, % of GDP
Source: Eurostat (bop_c6_q & namq_10_gdp)
Notes: Left-hand side panel shows a 4Q lagged moving average, whereas the right-hand side panel shows the unsmoothed series over the year preceding the last data point available. The net financial account balance in the Eurostat series includes reserve assets transactions. Both the financial account flows and GDP are measured in EUR.
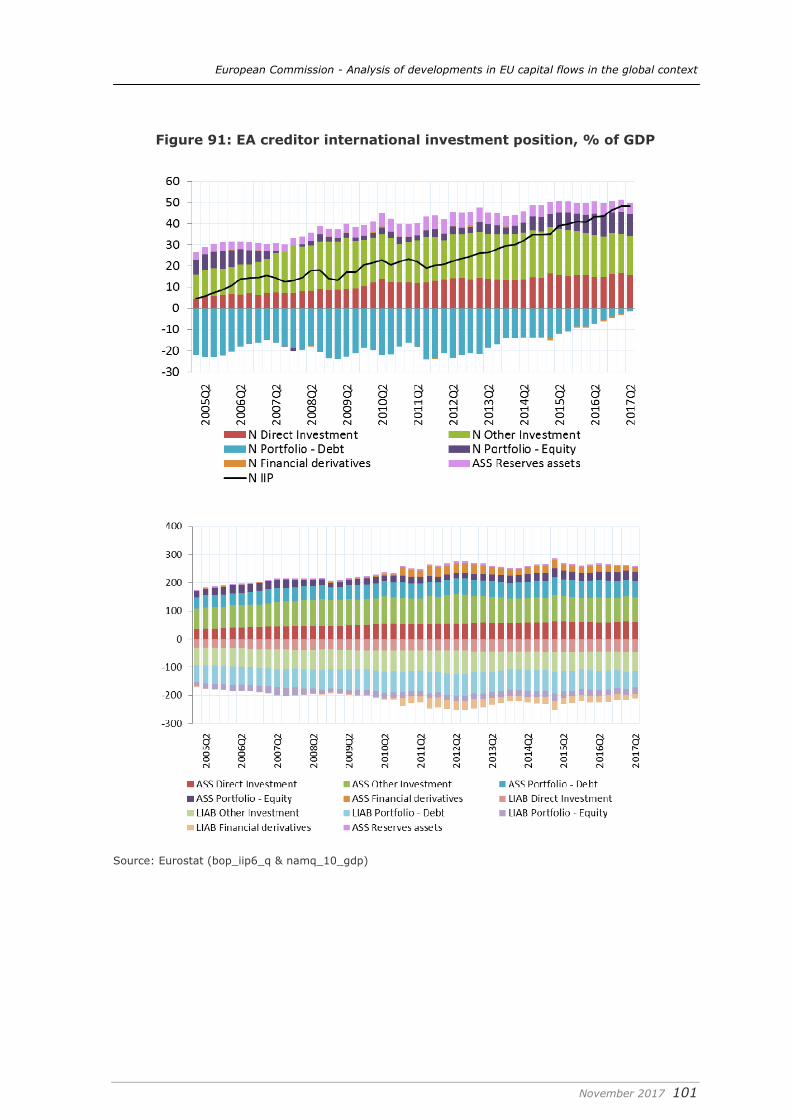
European Commission - Analysis of developments in EU capital flows in the global context
November 2017 101
Figure 91: EA creditor international investment position, % of GDP
Source: Eurostat (bop_iip6_q & namq_10_gdp)
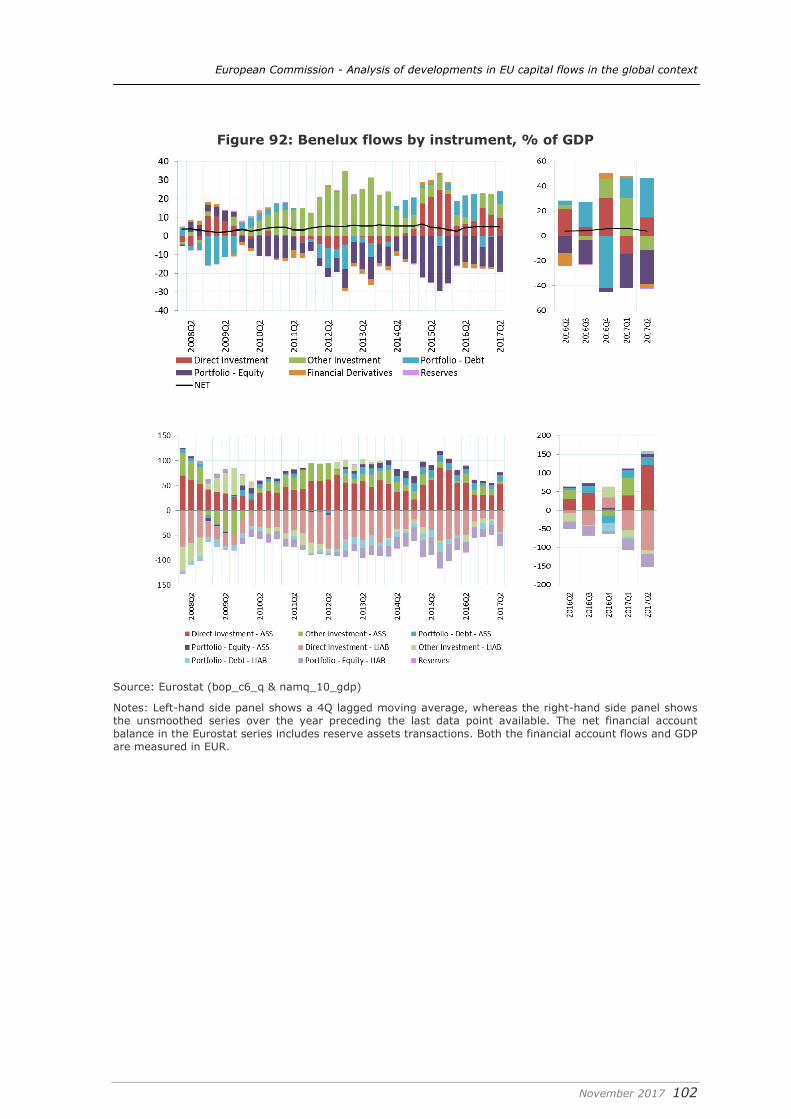
European Commission - Analysis of developments in EU capital flows in the global context
November 2017 102
Figure 92: Benelux flows by instrument, % of GDP
Source: Eurostat (bop_c6_q & namq_10_gdp)
Notes: Left-hand side panel shows a 4Q lagged moving average, whereas the right-hand side panel shows the unsmoothed series over the year preceding the last data point available. The net financial account balance in the Eurostat series includes reserve assets transactions. Both the financial account flows and GDP are measured in EUR.
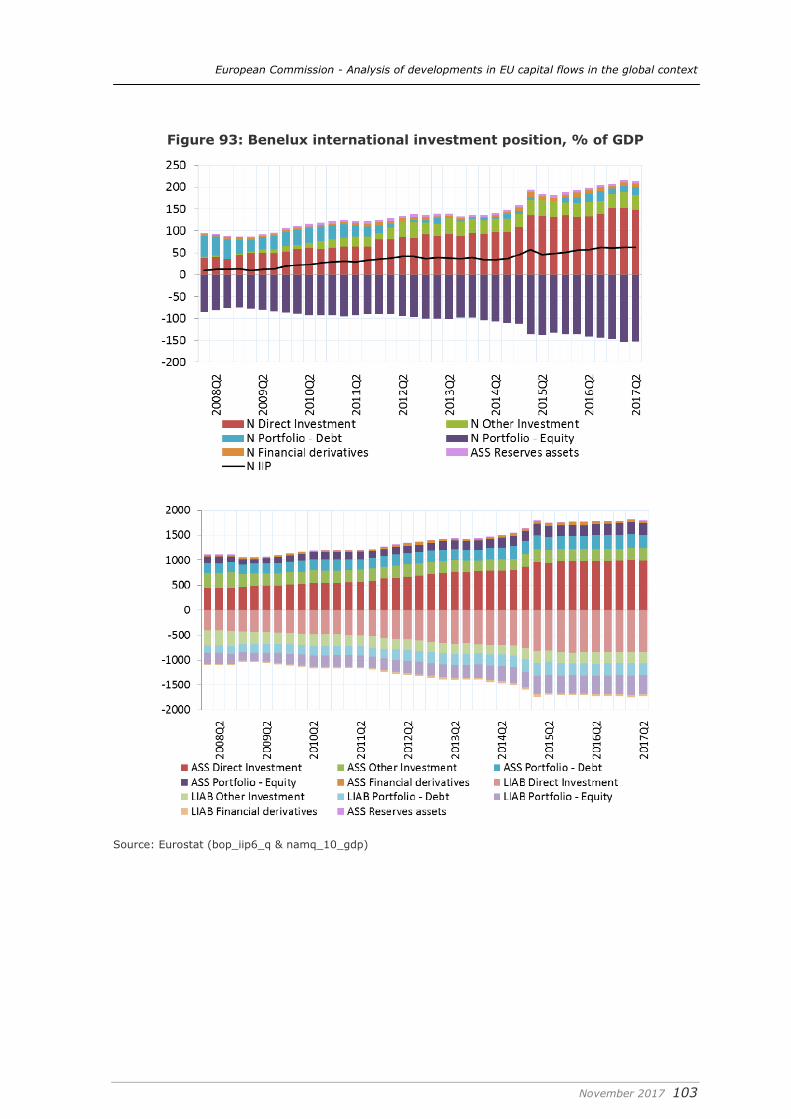
European Commission - Analysis of developments in EU capital flows in the global context
November 2017 103
Figure 93: Benelux international investment position, % of GDP
Source: Eurostat (bop_iip6_q & namq_10_gdp)
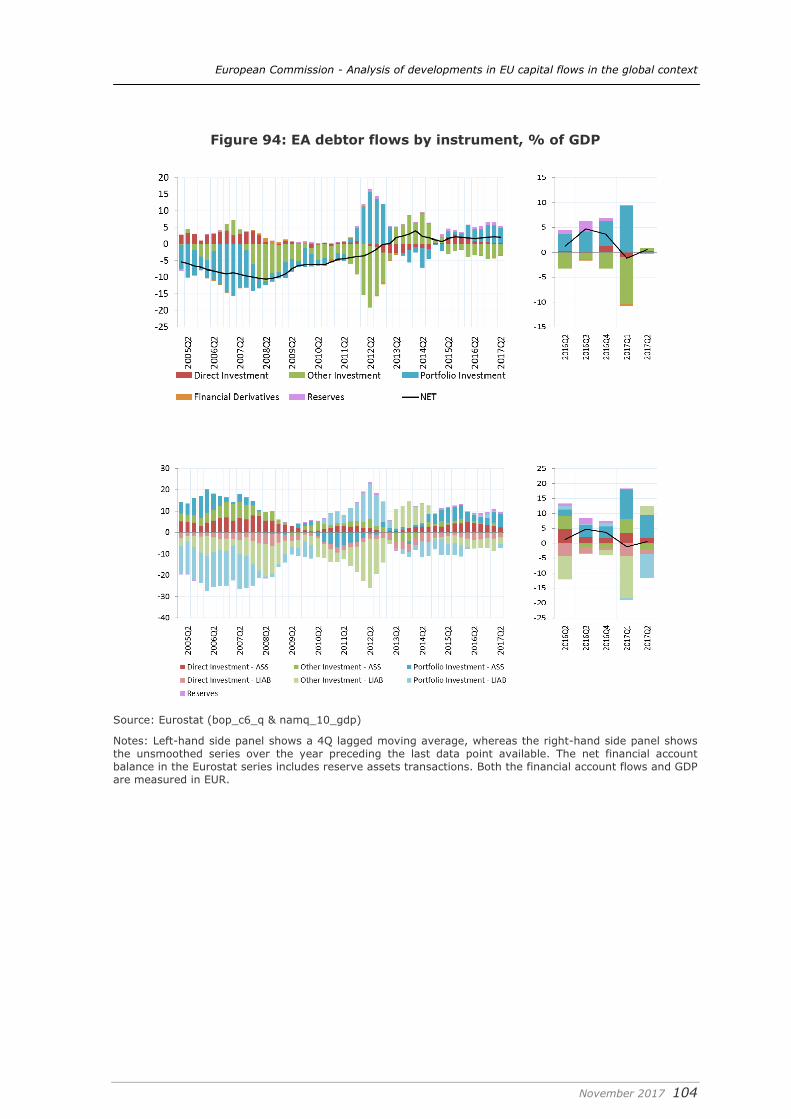
European Commission - Analysis of developments in EU capital flows in the global context
November 2017 104
Figure 94: EA debtor flows by instrument, % of GDP
Source: Eurostat (bop_c6_q & namq_10_gdp)
Notes: Left-hand side panel shows a 4Q lagged moving average, whereas the right-hand side panel shows the unsmoothed series over the year preceding the last data point available. The net financial account balance in the Eurostat series includes reserve assets transactions. Both the financial account flows and GDP are measured in EUR.
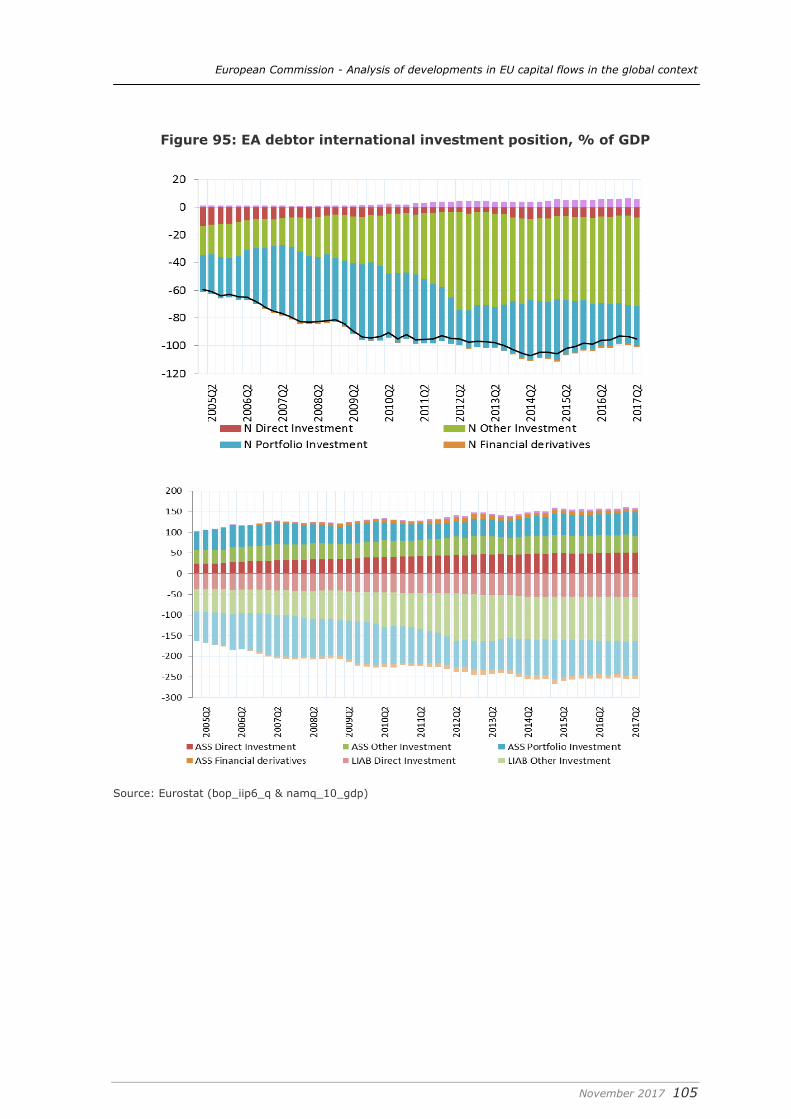
European Commission - Analysis of developments in EU capital flows in the global context
November 2017 105
Figure 95: EA debtor international investment position, % of GDP
Source: Eurostat (bop_iip6_q & namq_10_gdp)
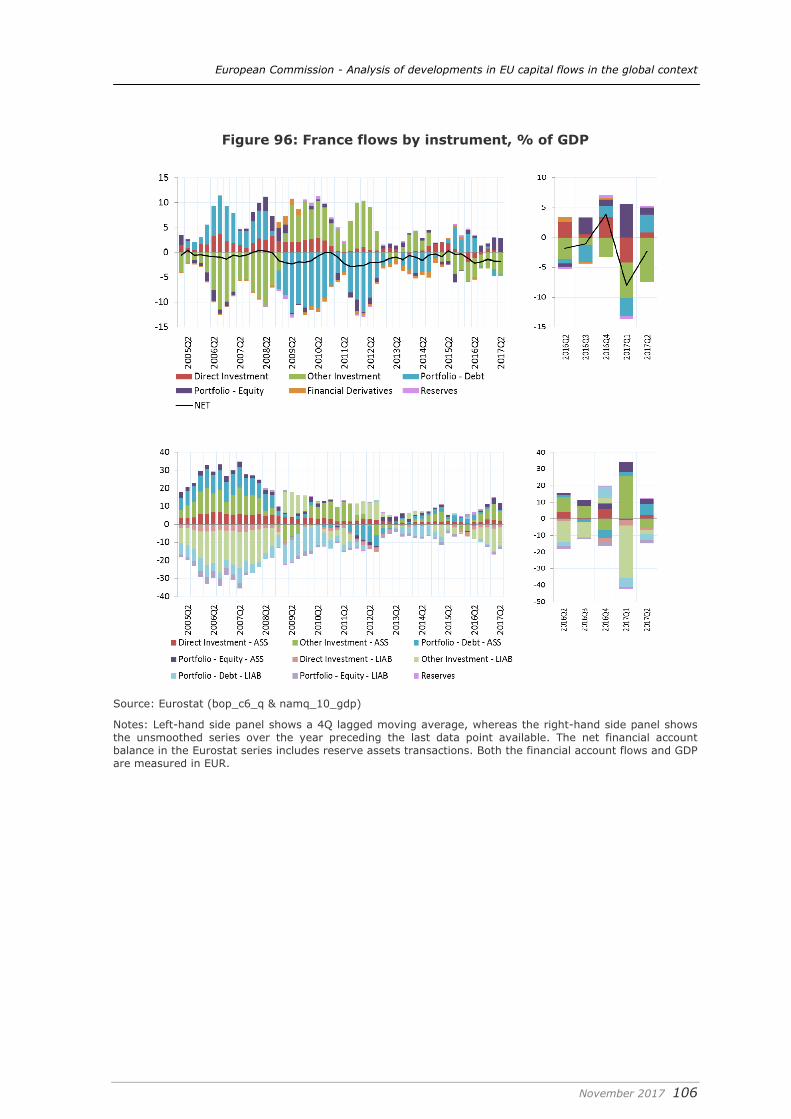
European Commission - Analysis of developments in EU capital flows in the global context
November 2017 106
Figure 96: France flows by instrument, % of GDP
Source: Eurostat (bop_c6_q & namq_10_gdp)
Notes: Left-hand side panel shows a 4Q lagged moving average, whereas the right-hand side panel shows the unsmoothed series over the year preceding the last data point available. The net financial account balance in the Eurostat series includes reserve assets transactions. Both the financial account flows and GDP are measured in EUR.
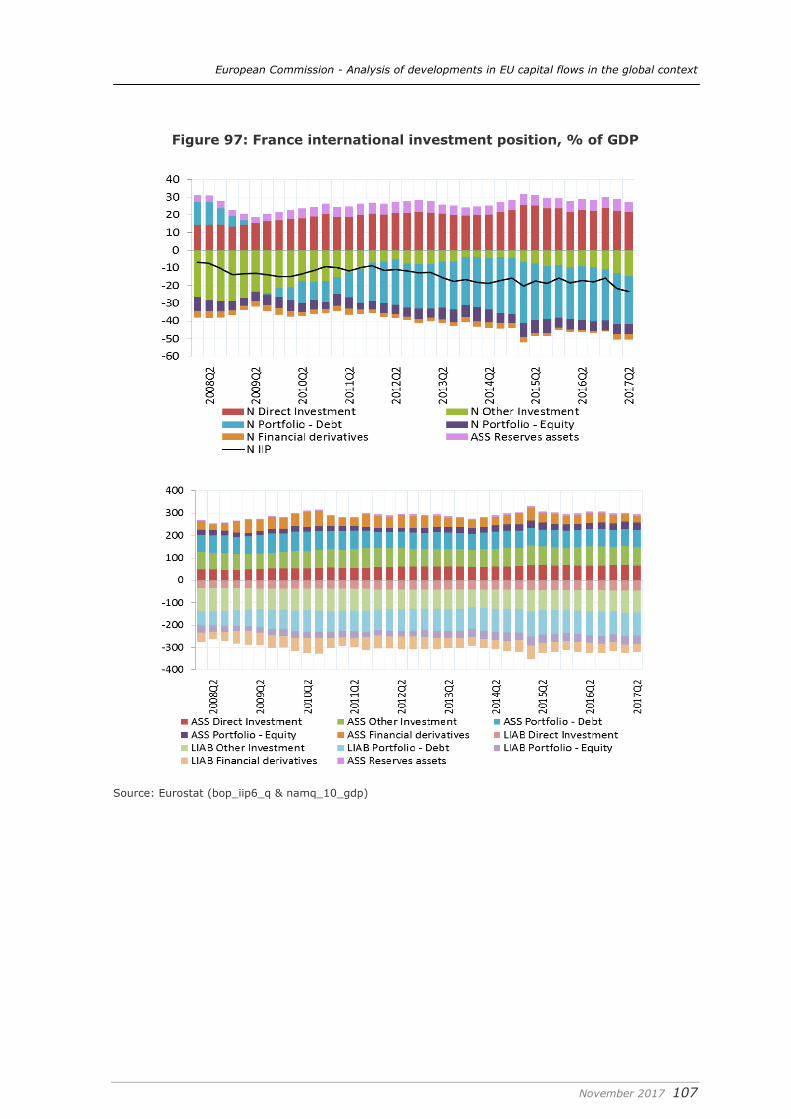
European Commission - Analysis of developments in EU capital flows in the global context
November 2017 107
Figure 97: France international investment position, % of GDP
Source: Eurostat (bop_iip6_q & namq_10_gdp)
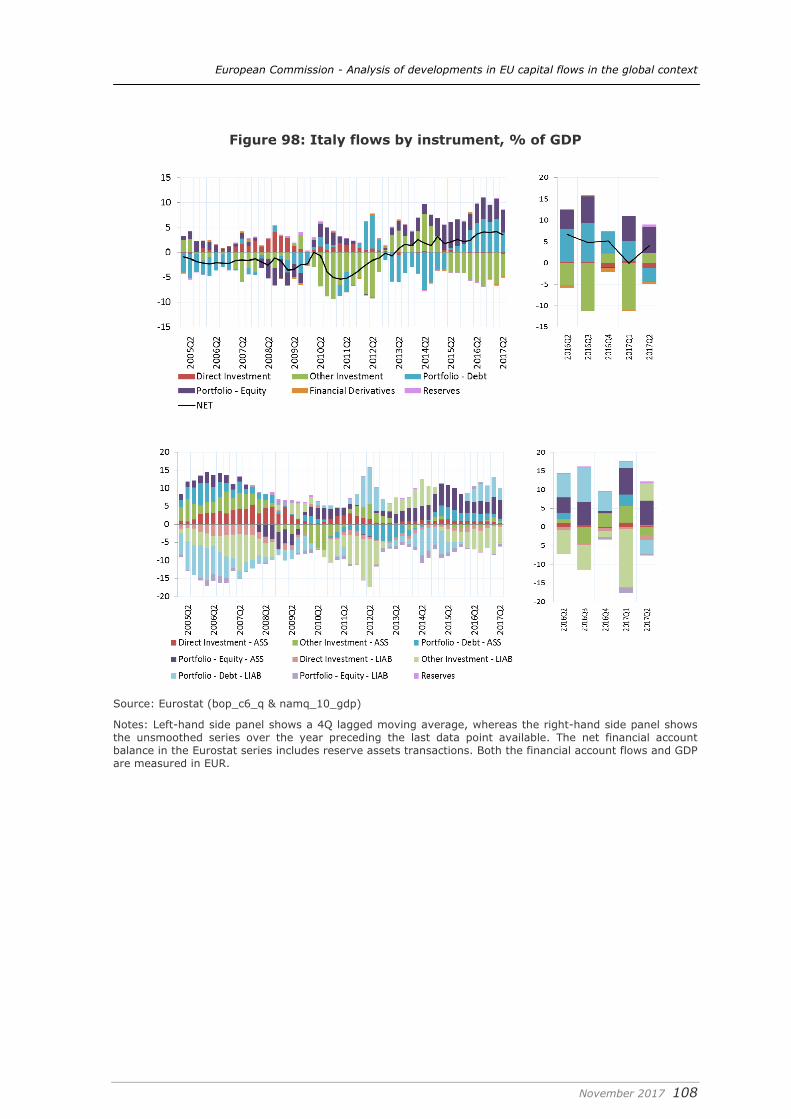
European Commission - Analysis of developments in EU capital flows in the global context
November 2017 108
Figure 98: Italy flows by instrument, % of GDP
Source: Eurostat (bop_c6_q & namq_10_gdp)
Notes: Left-hand side panel shows a 4Q lagged moving average, whereas the right-hand side panel shows the unsmoothed series over the year preceding the last data point available. The net financial account balance in the Eurostat series includes reserve assets transactions. Both the financial account flows and GDP are measured in EUR.
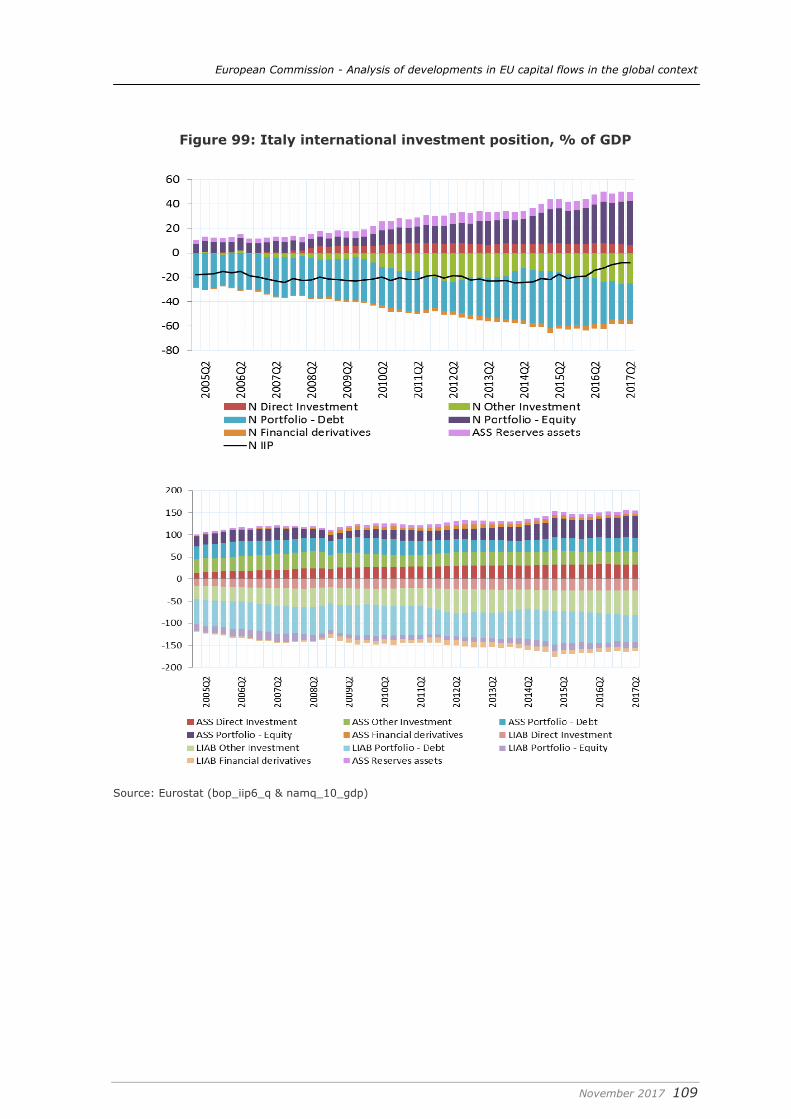
European Commission - Analysis of developments in EU capital flows in the global context
November 2017 109
Figure 99: Italy international investment position, % of GDP
Source: Eurostat (bop_iip6_q & namq_10_gdp)
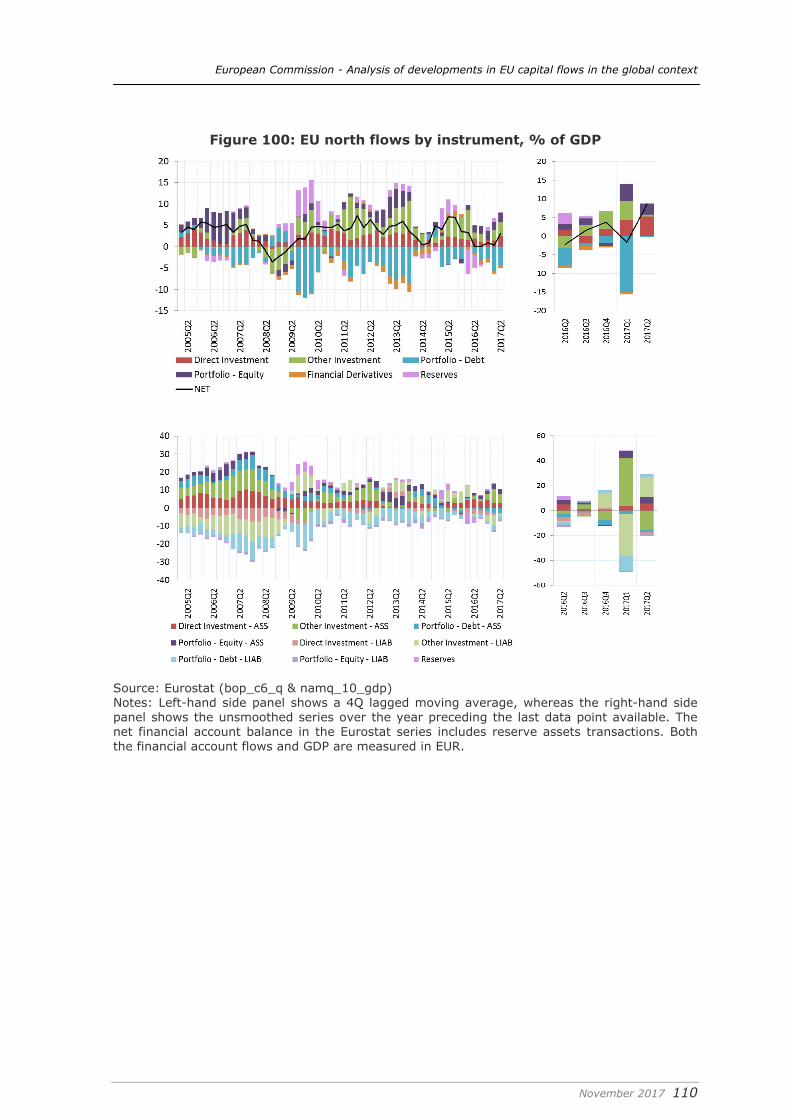
European Commission - Analysis of developments in EU capital flows in the global context
November 2017 110
Figure 100: EU north flows by instrument, % of GDP
Source: Eurostat (bop_c6_q & namq_10_gdp) Notes: Left-hand side panel shows a 4Q lagged moving average, whereas the right-hand side panel shows the unsmoothed series over the year preceding the last data point available. The net financial account balance in the Eurostat series includes reserve assets transactions. Both the financial account flows and GDP are measured in EUR.
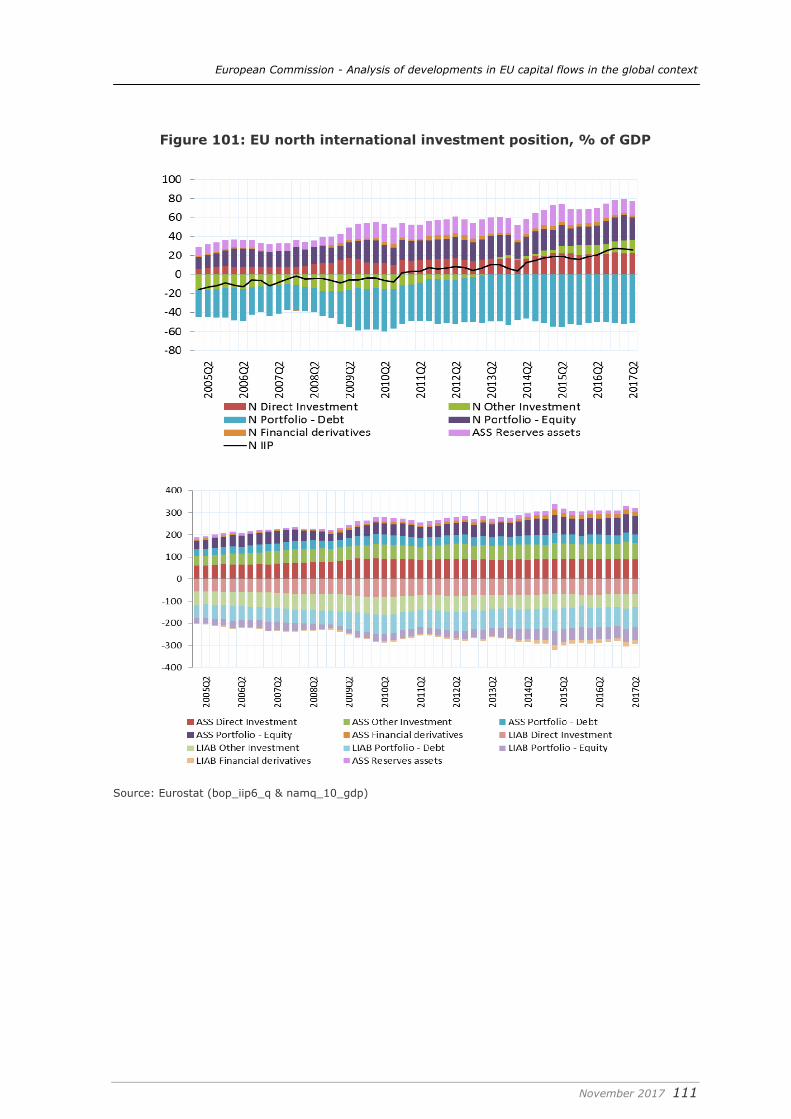
European Commission - Analysis of developments in EU capital flows in the global context
November 2017 111
Figure 101: EU north international investment position, % of GDP
Source: Eurostat (bop_iip6_q & namq_10_gdp)
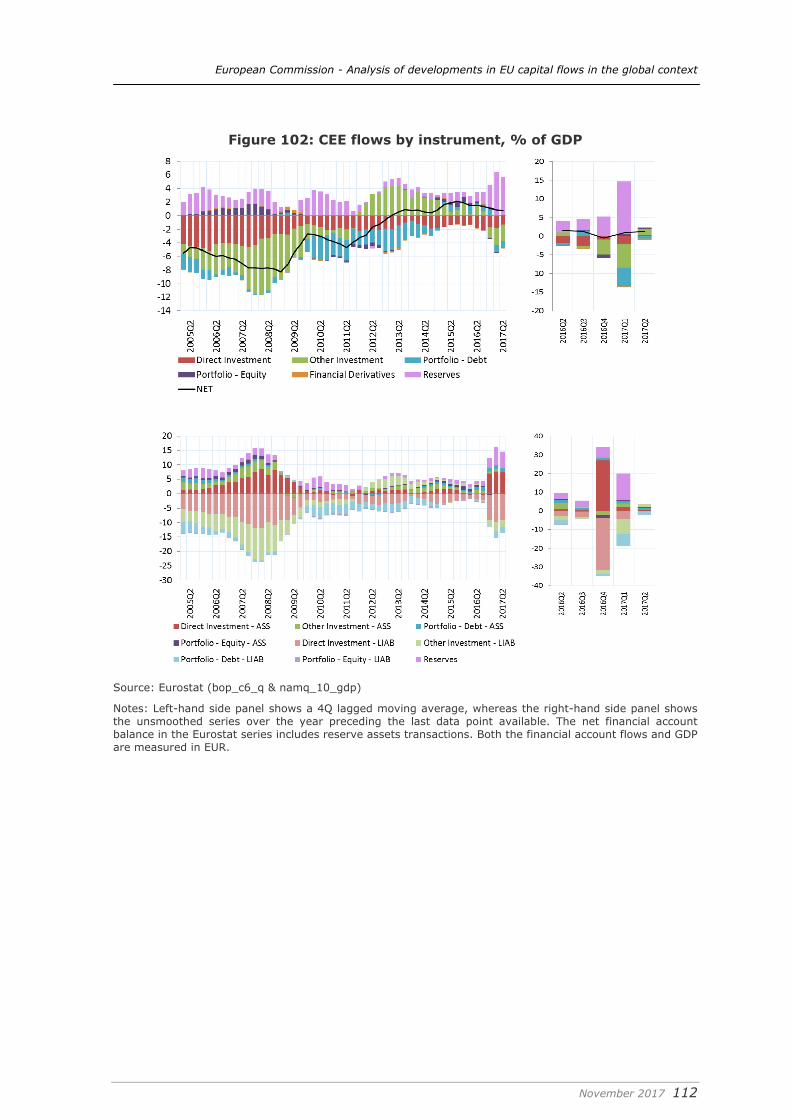
European Commission - Analysis of developments in EU capital flows in the global context
November 2017 112
Figure 102: CEE flows by instrument, % of GDP
Source: Eurostat (bop_c6_q & namq_10_gdp)
Notes: Left-hand side panel shows a 4Q lagged moving average, whereas the right-hand side panel shows the unsmoothed series over the year preceding the last data point available. The net financial account balance in the Eurostat series includes reserve assets transactions. Both the financial account flows and GDP are measured in EUR.
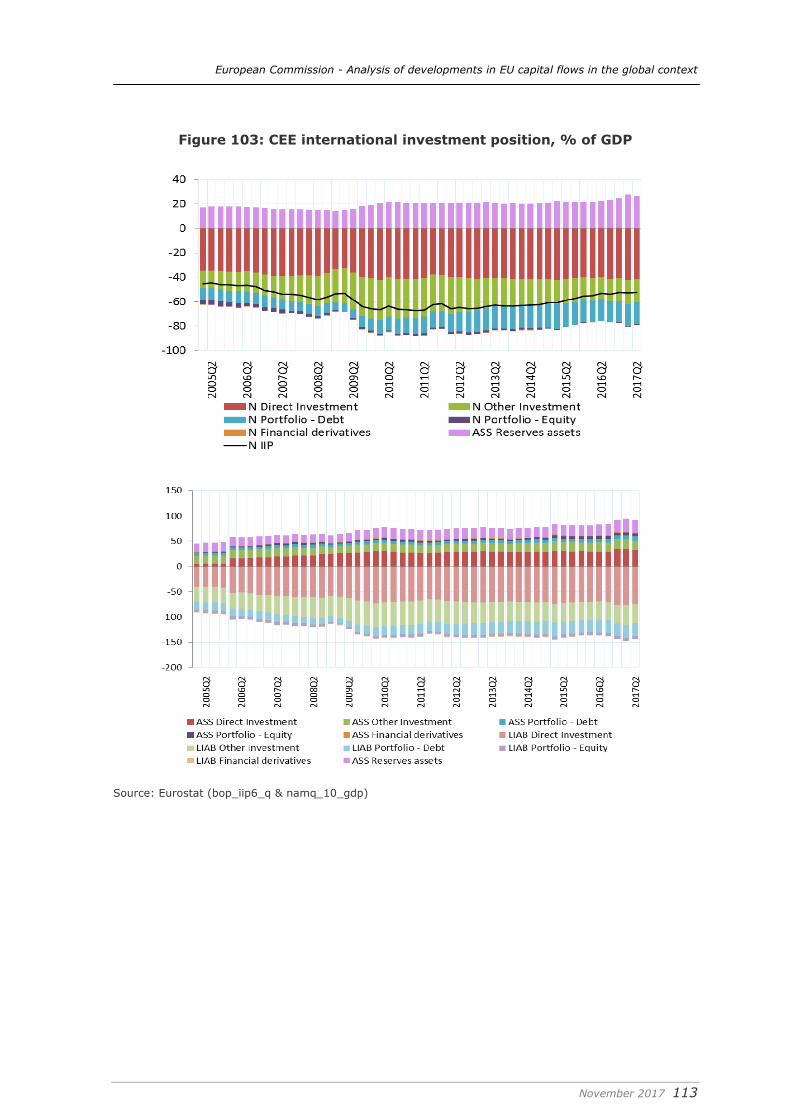
European Commission - Analysis of developments in EU capital flows in the global context
November 2017 113
Figure 103: CEE international investment position, % of GDP
Source: Eurostat (bop_iip6_q & namq_10_gdp)
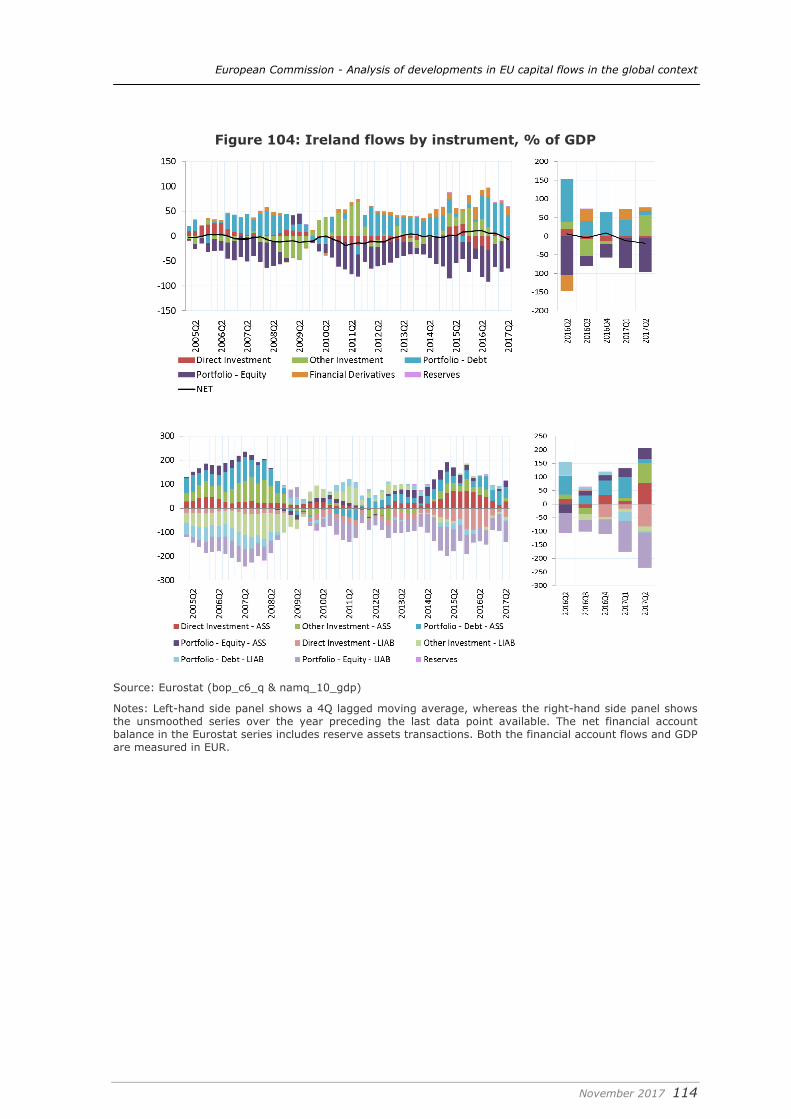
European Commission - Analysis of developments in EU capital flows in the global context
November 2017 114
Figure 104: Ireland flows by instrument, % of GDP
Source: Eurostat (bop_c6_q & namq_10_gdp)
Notes: Left-hand side panel shows a 4Q lagged moving average, whereas the right-hand side panel shows the unsmoothed series over the year preceding the last data point available. The net financial account balance in the Eurostat series includes reserve assets transactions. Both the financial account flows and GDP are measured in EUR.
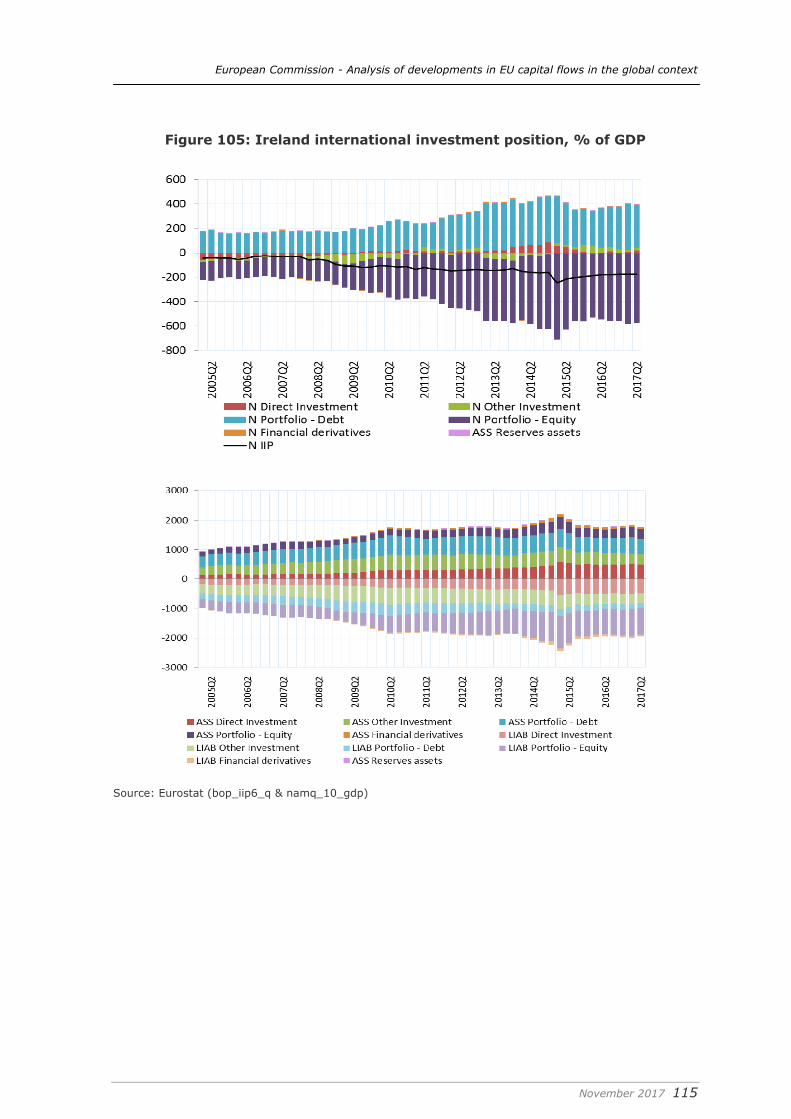
European Commission - Analysis of developments in EU capital flows in the global context
November 2017 115
Figure 105: Ireland international investment position, % of GDP
Source: Eurostat (bop_iip6_q & namq_10_gdp)
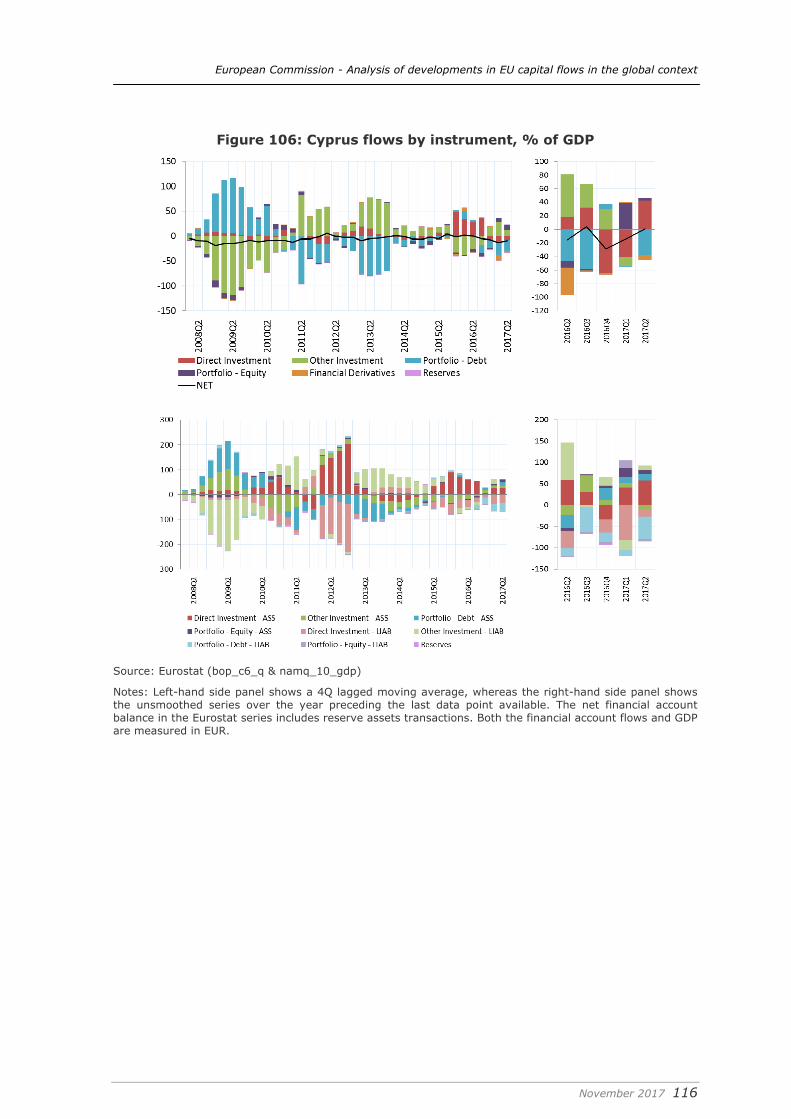
European Commission - Analysis of developments in EU capital flows in the global context
November 2017 116
Figure 106: Cyprus flows by instrument, % of GDP
Source: Eurostat (bop_c6_q & namq_10_gdp)
Notes: Left-hand side panel shows a 4Q lagged moving average, whereas the right-hand side panel shows the unsmoothed series over the year preceding the last data point available. The net financial account balance in the Eurostat series includes reserve assets transactions. Both the financial account flows and GDP are measured in EUR.
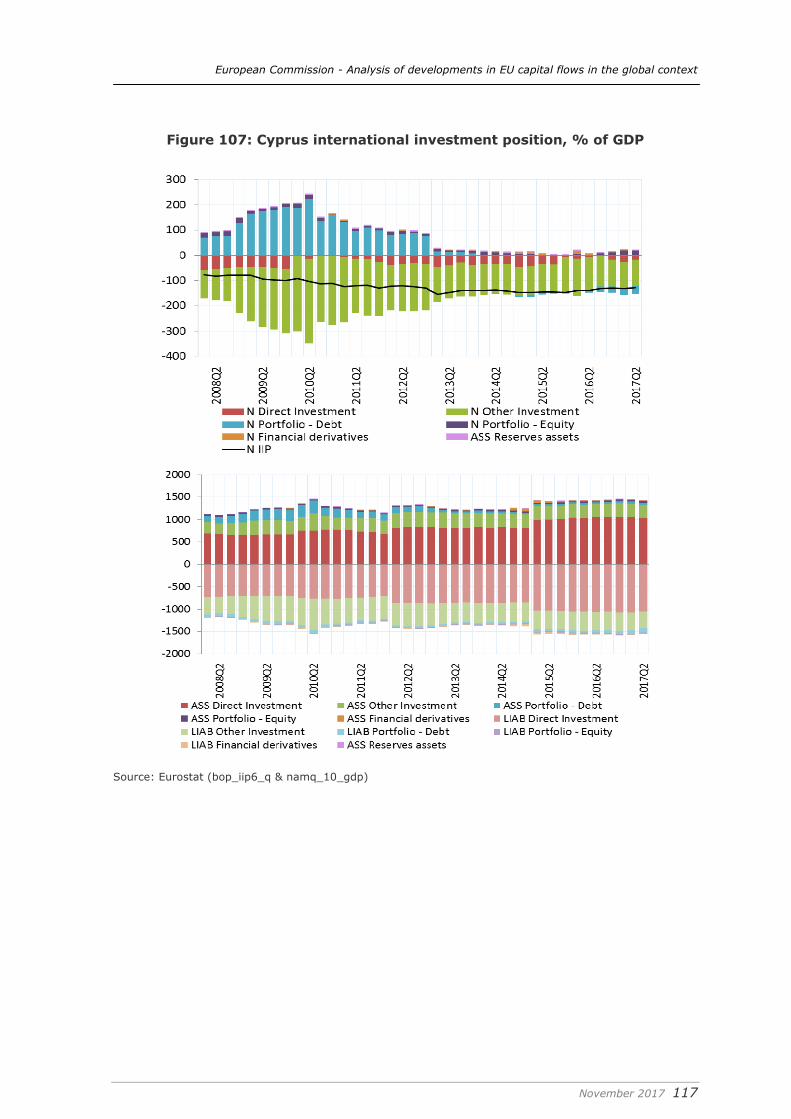
European Commission - Analysis of developments in EU capital flows in the global context
November 2017 117
Figure 107: Cyprus international investment position, % of GDP
Source: Eurostat (bop_iip6_q & namq_10_gdp)
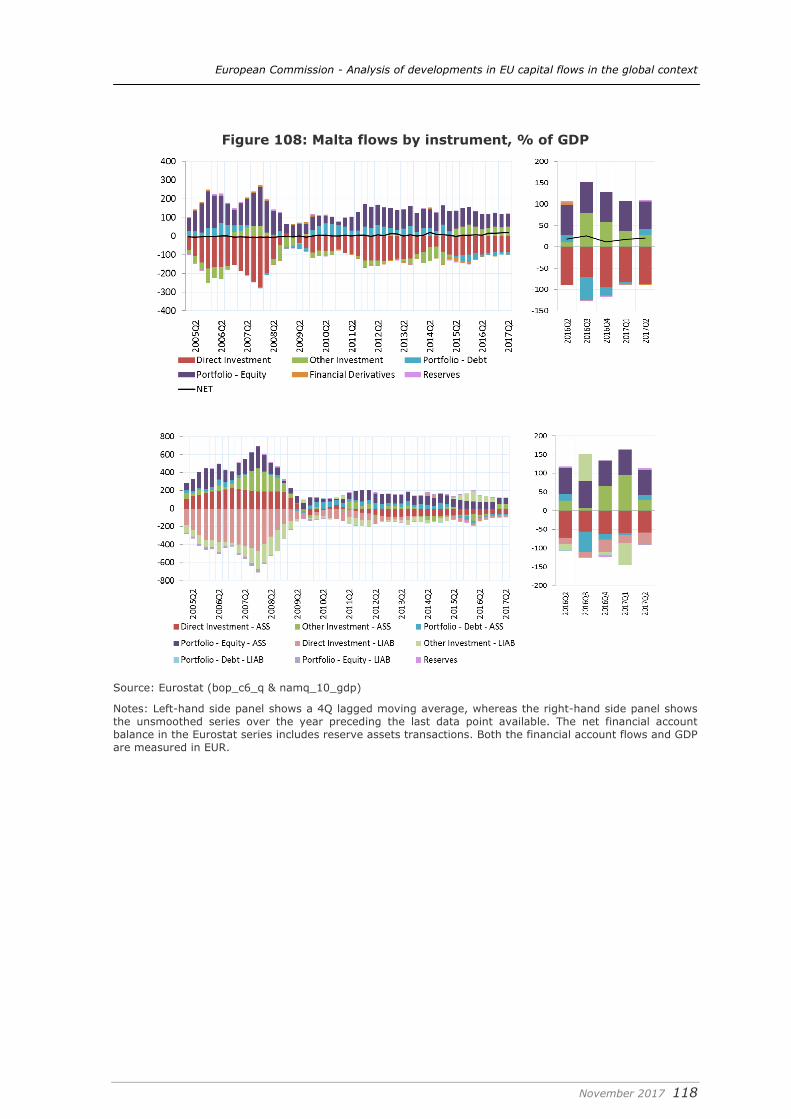
European Commission - Analysis of developments in EU capital flows in the global context
November 2017 118
Figure 108: Malta flows by instrument, % of GDP
Source: Eurostat (bop_c6_q & namq_10_gdp)
Notes: Left-hand side panel shows a 4Q lagged moving average, whereas the right-hand side panel shows the unsmoothed series over the year preceding the last data point available. The net financial account balance in the Eurostat series includes reserve assets transactions. Both the financial account flows and GDP are measured in EUR.
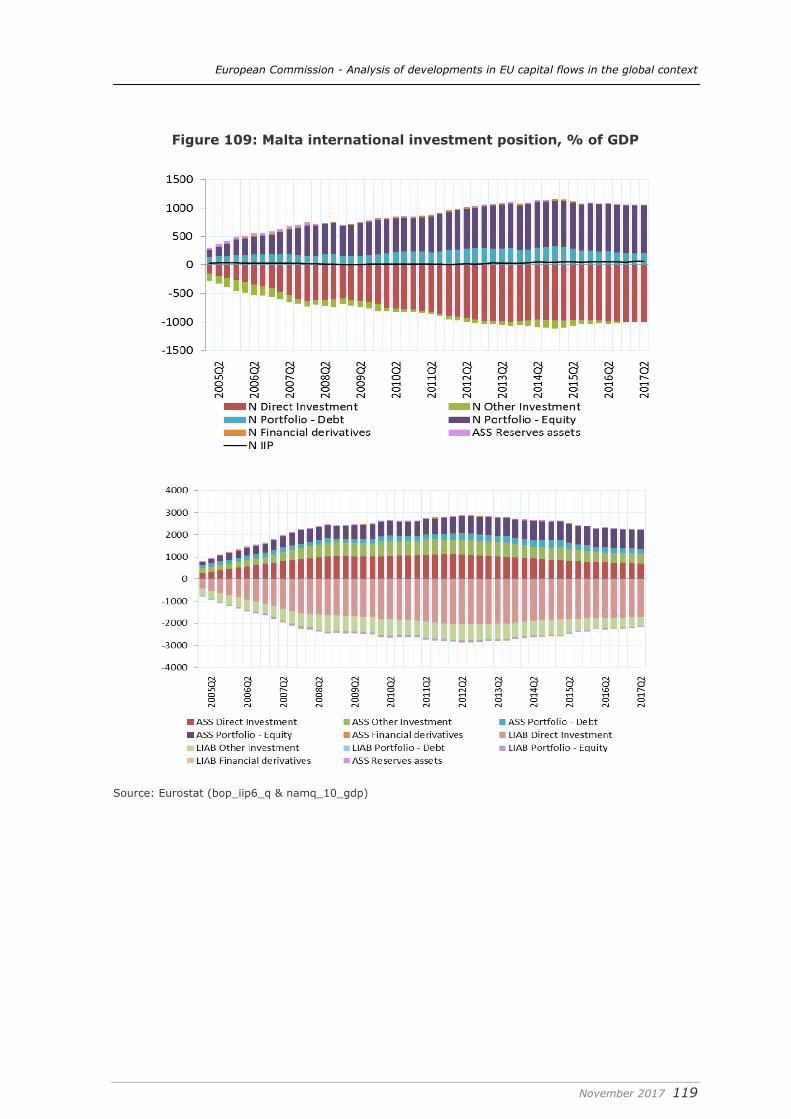
European Commission - Analysis of developments in EU capital flows in the global context
November 2017 119
Figure 109: Malta international investment position, % of GDP
Source: Eurostat (bop_iip6_q & namq_10_gdp)
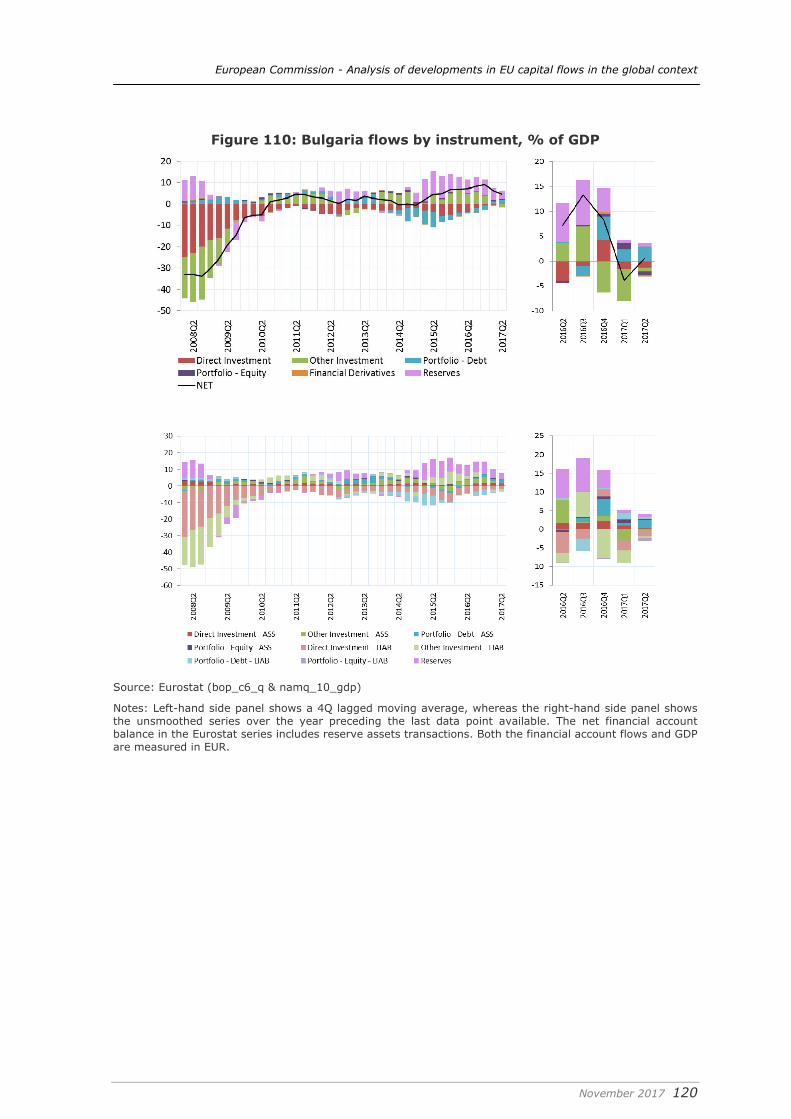
European Commission - Analysis of developments in EU capital flows in the global context
November 2017 120
Figure 110: Bulgaria flows by instrument, % of GDP
Source: Eurostat (bop_c6_q & namq_10_gdp)
Notes: Left-hand side panel shows a 4Q lagged moving average, whereas the right-hand side panel shows the unsmoothed series over the year preceding the last data point available. The net financial account balance in the Eurostat series includes reserve assets transactions. Both the financial account flows and GDP are measured in EUR.
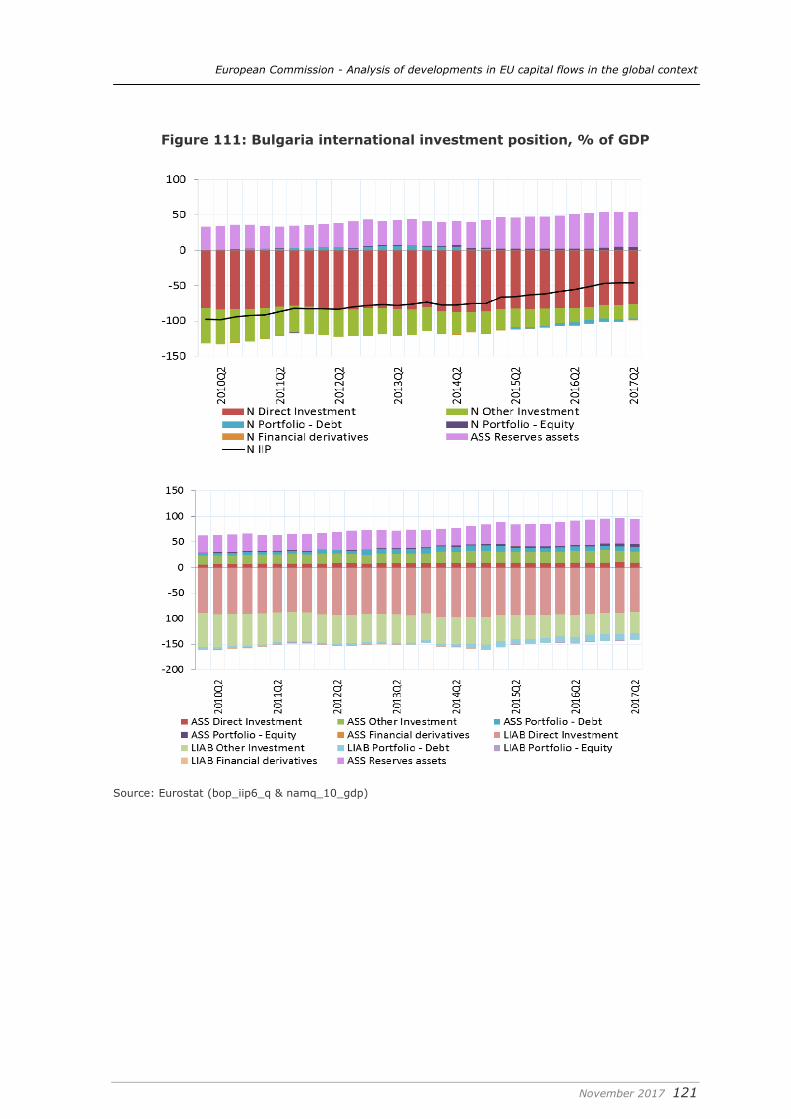
European Commission - Analysis of developments in EU capital flows in the global context
November 2017 121
Figure 111: Bulgaria international investment position, % of GDP
Source: Eurostat (bop_iip6_q & namq_10_gdp)
European Commission - Analysis of developments in EU capital flows in the global context
November 2017 122
References
Angeloni, Ignazio, Agnès Bénassy-Quéré, Benjamin Carton, Christophe Destais, Zsolt Darvas, Jean Pisani-Ferry, André Sapir, and Shahin Vallée (2011) ‘Global currencies for tomorrow: a European perspective’, July 2011, Bruegel Blueprint Volume XIII
Arcand, Berkes and Panizza (2012) ‘Too much finance?’, IMF Working Paper no. 12/161
Garcia-Herrero, A., Xia, L., & Casanova, C. (2015) Chinese Outbound Foreign Direct Investment: How Much Goes Where After Round-Tripping and Off-Shoring. BBVA, Working Paper, 15, 17
Becker, Torbjorn, Daniel Daianu, Zsolt Darvas, Vladimir Gligorov, Michael Landesmann, Pavle Petrovic, Jean Pisani-Ferry, Darius Rosati, André Sapir and Beatrice Weder Di Mauro (2010) ‘Whither growth in central and eastern Europe? Policy lessons for an integrated Europe’, Bruegel Blueprint Series, Volume XI
Chinn, Menzie D. and Hiro Ito (2006) ‘What Matters for Financial Development? Capital Controls, Institutions, and Interactions’ Journal of Development Economics, Volume 81, Issue 1, Pages 163-192 (October)
Ciavoliello, L., F. Ciocchetta, F. Conti, I. Guida, A. Rendina, and G. Santini (2016) ‘What’s the value of NPLs?’, Banca d’Italia Notes on Financial Stability and Supervision, no. 3, April 2016
Claeys, G. (2016) ‘Quelle place pour les marchés financiers en Europe?’ Revue d'Économie Financière, vol. 123, pp. 124-145, 2016
Coeurdacier, Nicolas, Hélène Rey and Pablo Winant (2015) ‘Financial Integration and Growth in a Risky World’, NBER Working Paper No. 21817
Constâncio, V. (2017) Resolving Europe’s NPLs: challenges and benefits, speech given by Vice President at a Bruegel conference, 3 February 2017
Council of the EU (2017) Council Conclusions on action plan to tackle non-performing loans in Europe, Press Release 459/17, July
Cournède, B. and O. Denk (2015) Finance and economic growth in OECD and G20 countries, OECD Economics Department Working Papers no. 1223
Darvas, Z. (2012) ‘Intra-Euro rebalancing is inevitable, but insufficient’, Bruegel Policy Contribution, 2012/15
Darvas, Z. and G. Szapáry (2008) ‘Euro Area Enlargement and Euro Adoption Strategies’, European Economy, Economic Papers 304, February
Darvas, Z., C. De Sousa, Huettl, P., S. Merler and Walsh, T. (2014) ‘Analysis of developments in EU capital flows in the global context’, Study for the DG MARKT of the European Commission, http://bruegel.org/wp-content/uploads/imported/publications/Analysis_of_developments_in_EU.pdf
European Commission - Analysis of developments in EU capital flows in the global context
November 2017 123
Darvas, Zsolt, Pia Hüttl, Silvia Merler and Thomas Walsh (2015) ‘Analysis of developments in EU capital flows in the global context – second annual report’, Study for the DG FISMA of the European Commission, http://bruegel.org/wp-content/uploads/2016/01/151103-study_en.pdf
Darvas, Zsolt, Konstantinos Efstathiou, Pia Hüttl, Dirk Schoenmaker (2016) ‘Analysis of developments in EU capital flows in the global context – third annual report’, Study for the DG FISMA of the European Commission, http://bruegel.org/2017/01/analysis-of-developments-in-eu-capital-flows-in-the-global-context-3rd-annual-report/
Deloitte (2017) ‘Deleveraging Europe’, available at: https://www2.deloitte.com/uk/en/pages/financial-advisory/articles/deleveraging-europe-market-update.html
Demertzis and Lehmann (2017) Tackling Europe’s crisis legacy: a comprehensive strategy for bad loans and debt restructuring, Bruegel Policy Contribution 11/2017
EBA (2017) Report on results from the 2nd EBA IFRS9 impact assessment
EBRD (2017) NPL Monitor, H1 2017, available at: http://npl.vienna-initiative.com/
ECB (2016) ‘Addressing market failures in the resolution of non-performing loans in the euro area’, Financial Stability Review, November
ECB (2017a) ‘Guidance to banks on tackling non-performing loans’, available at: www.bankingsupervision.europa.eu.
ECB (2017b) Resolving non-performing loans: a role for securitisation and other financial structures?, in ECB Financial Stability Review, May 2017
ECB (2017c) Stocktake of national supervisory practices and legal frameworks related to NPLs
Eller, M., Huber, F. And H. Schuberth (2016) ‘Understanding the drivers of caital flows into the CESEE countries’, Focus on European Economic Integration Q2/16
ESRB (2014) Is Europe overbanked?
ESRB (2016) Macroprudential policy issues arising from the low interest rates and structural changes in the EU financial system
ESRB (2017) Resolving NPLs in Europe
ESRB (2017b) Financial stability implications of IFRS9.
Ergungor (2007) On the resolution of financial crises: the Swedish experience, Federal Reserve Bank of Cleveland Policy Discussion Papers
Ernst and Young (2017) Navigating the Italian credit opportunity – non-performing loans and new credit tools, available on the internet.
European Commission (2012) ‘Current account surpluses in the EU’, European Economy 9/2012
European Commission (2017) Mid-term review of the capital markets union action plan
European Commission - Analysis of developments in EU capital flows in the global context
November 2017 124
Eurostat (2016): Special Purpose Entities within EU Direct Investment Statistics, BOPCOM-16/05
Fell, John, M. Grodzicki, R. Martin and E. O’Brien (2017) A role for systemic asset management companies in solving Europe’s non-performing loan problems, European Economy – Banks, Regulation and the Real sector, no. 17.1
Fernandez, Andres, Michael Klein, Alessandro Rebucci, Martin Schindler, and Martin Uribe (2016) “Capital Control Measures: A New Dataset,” IMF Economic Review 64, 548-574
Financial Services Committee (2017) “Report of the FSC Subgroup on Non-Performing Loans”, Council of the European Union, Brussels, 31 May. Available at http://data.consilium.europa.eu/doc/document/ST-9854-2017-INIT/en/pdf
Forbes, Kristin & Reinhardt, Dennis & Wieladek, Tomasz, 2017. "The spillovers, interactions, and (un)intended consequences of monetary and regulatory policies," Journal of Monetary Economics, Elsevier, vol. 85(C), pages 1-22.
Galeza, T. (2011) Where Investment Goes. IMF: FINANCE & DEVELOPMENT, September 2011, Vol. 48, No. 3 http://www.imf.org/external/pubs/ft/fandd/2011/09/dataspot.htm
Haben, P. and M. Quagliariello (2017) ‘Why the EU needs an asset management company’, Central Banking, available at: http://www.centralbanking.com/central-banking-journal/opinion/2481794/why-the-eu-needs-an-asset-management-company
Hallerberg, M. and C. Gandrud (2017) How not to create zombie banks: lessons for Italy from Japan, Bruegel Policy Contribution 6/2017
He, Dong (2004) The role of KAMCO in Resolving Nonperforming Loans in the Republic of Korea, IMF Working Paper no. 04/172, September
Hobza, Alexandr and Stefan Zeugner (2014a) ‘The ‘imbalanced balance’ and its unravelling: current accounts and bilateral financial flows in the euro area‘, European Economy- Economic Papers 520, July 2014, Directorate-General for Economic and Financial Affairs, European Commission
Hobza, Alexandr and Stefan Zeugner (2014b) ‘Current accounts and financial flows in the euro area’, Journal of International Money and Finance 48, 291-313
Hüttl & Merler (2016) An update sovereign bond holdings in the euro area the impact of QE, Bruegel blog accessible here http://bruegel.org/2016/11/an-update-sovereign-bond-holdings-in-the-euro-area-the-impact-of-qe/
IMF (2009) Balance of payments and international investment position manual. Sixth Edition, Washington, D.C.: International Monetary Fund
IMF (2014) ‘Request for a stand-by arrangement – staff report, supplement, staff statement, press release, and statement by the executive director for Ukraine’, IMF Country Report No. 14/106, April
IMF (2015) ‘A strategy for Europe’s NPLs, IMF Staff Discussion Note, 15/09
European Commission - Analysis of developments in EU capital flows in the global context
November 2017 125
IMF (2016a) ‘United Kingdom: Selected Issues’, IMF Country Report No. 16/58 February
IMF (2016b) ‘Understanding the slowdown in capital flows to emerging markets’, Chapter 2 in ‘World Economic Outlook: too slow for too long’, April
IMF (2017) ‘IMF Policy Paper: 2017 External Sector Report’, July
Jassaud, N. and K. Kang (2015) A strategy for developing a market for nonperforming loans in Italy, IMF Working Paper no. 15/24
KPMG (2016) European debt sales, available on the internet.
Mersch, Yves (2017) Loan-level data transparency: achievements and future prospects
Nouy, D. (2017) Too much of a good thing? The need for consolidation in the European banking sector, speech given at the VIII Financial Forum, Madrid, Sept. 2017
Office for National Statistics (2017) ‘UK Balance of Payments, The Pink Book: 2017’, October
Ohashi, Kazunari and Manmohan Singh (2004): Japan’s distressed debt market, IMF Working Paper no. 04/86
PWC (2017) European Bank restructuring, available on the internet.
Rocha, I. (2016) NPL resolution: prerequisites for loan portfolio sales in the CESEE region, available at http://npl.vienna-initiative.com/best-practices/
Schäfer, L. (2016) Forgive but not forget: the behaviour of relationship banks when firms are in distress, EBRD Working Paper no. 186.
Standard & Poor’s (2016): ‘Consolidation wave among European debt collection companies set to continue in 2017’
Taylor C. (2016) ‘Analysis of the UK’s international investment position: 2016.’, Office for National Statistics Article. Available at: https://www.ons.gov.uk/economy/nationalaccounts/balanceofpayments/articles/analysisoftheuksinternationalinvestmentposition/2016
Zucman, Gabriel (2013) ‘The Missing Wealth of Nations: Are Europe and the U.S. net Debtors or net Creditors?’, The Quarterly Journal of Economics, Oxford University Press, vol. 128(3), pages 1321-1364

European Commission - Analysis of developments in EU capital flows in the global context
November 2017 126
DOI : 10.2874/047340 ISBN : 978-92-79-66502-8
EV-0
2-1
7-2
56
-EN-N