Embed Size (px)
Citation preview
11/13/06 22.39 Lecture 18Professor Neil Todreas
1
Nuclear Energy Systems Economic Evaluations:
Capital CostOperations & Maintenance Cost
Course 22.39, Lecture 1811/13/06
Professor Neil Todreas
11/13/06 22.39 Lecture 18Professor Neil Todreas
2
How to Think about Economics(and deal with economists)
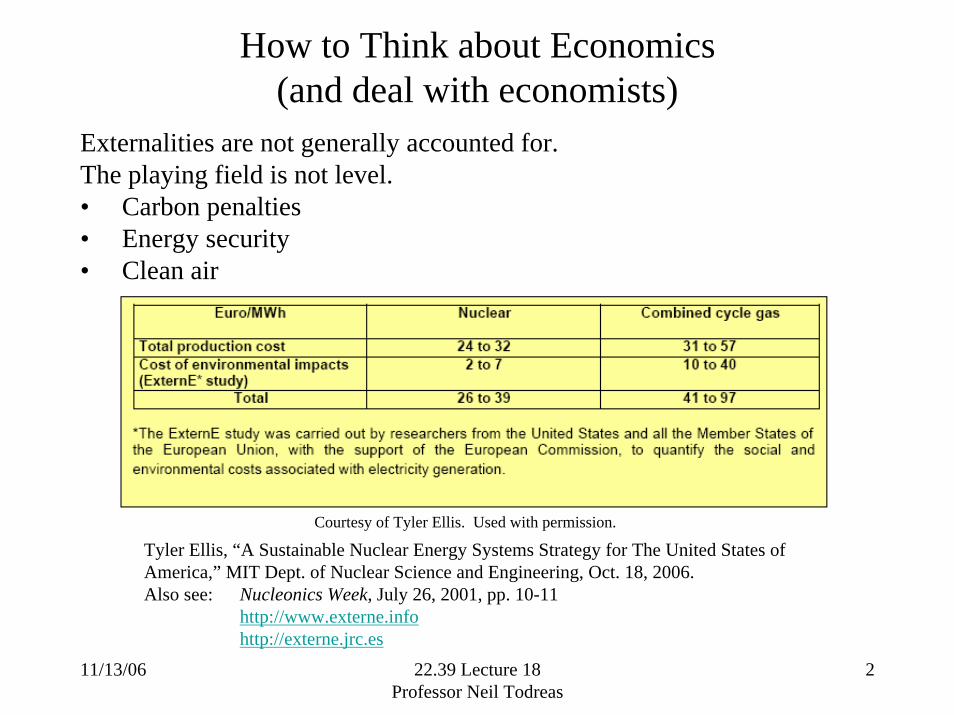
Externalities are not generally accounted for. The playing field is not level.• Carbon penalties• Energy security• Clean air
Tyler Ellis, “A Sustainable Nuclear Energy Systems Strategy for The United States of America,” MIT Dept. of Nuclear Science and Engineering, Oct. 18, 2006.Also see: Nucleonics Week, July 26, 2001, pp. 10-11
http://www.externe.infohttp://externe.jrc.es
Courtesy of Tyler Ellis. Used with permission.
11/13/06 22.39 Lecture 18Professor Neil Todreas
3
Dealing with economists (cont.)
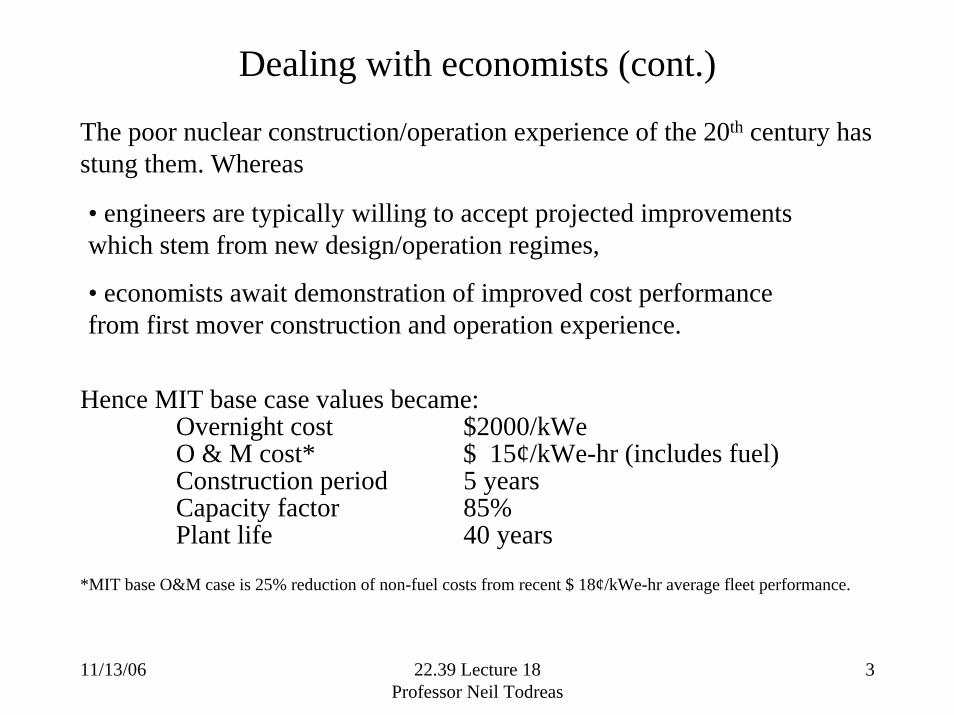
The poor nuclear construction/operation experience of the 20th century has stung them. Whereas
• engineers are typically willing to accept projected improvements which stem from new design/operation regimes,
• economists await demonstration of improved cost performance from first mover construction and operation experience.
Hence MIT base case values became:Overnight cost $2000/kWeO & M cost* $ 15¢/kWe-hr (includes fuel)Construction period 5 yearsCapacity factor 85%Plant life 40 years
*MIT base O&M case is 25% reduction of non-fuel costs from recent $ 18¢/kWe-hr average fleet performance.
11/13/06 22.39 Lecture 18Professor Neil Todreas
4
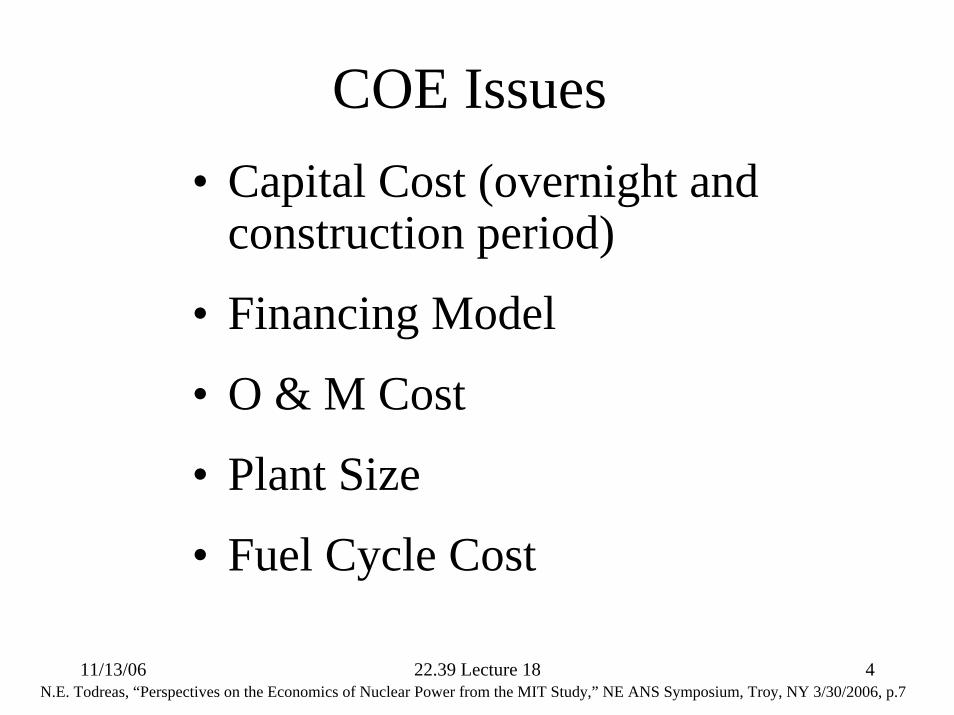
COE Issues• Capital Cost (overnight and
construction period)
• Financing Model
• O & M Cost
• Plant Size
• Fuel Cycle Cost
N.E. Todreas, “Perspectives on the Economics of Nuclear Power from the MIT Study,” NE ANS Symposium, Troy, NY 3/30/2006, p.7
11/13/06 22.39 Lecture 18Professor Neil Todreas
5
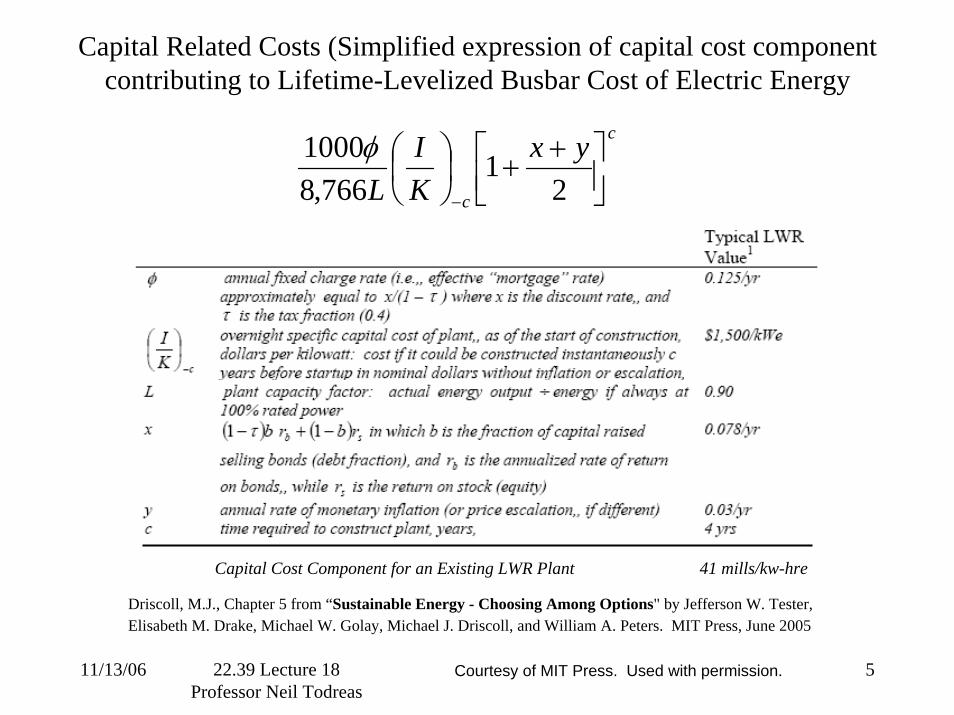
Capital Related Costs (Simplified expression of capital cost component contributing to Lifetime-Levelized Busbar Cost of Electric Energy
c
c
yxKI
L ⎥⎦⎤
⎢⎣⎡ ++⎟
⎠⎞
⎜⎝⎛
− 21
766,81000φ
Driscoll, M.J., Chapter 5 from “Sustainable Energy - Choosing Among Options" by Jefferson W. Tester, Elisabeth M. Drake, Michael W. Golay, Michael J. Driscoll, and William A. Peters. MIT Press, June 2005
Capital Cost Component for an Existing LWR Plant 41 mills/kw-hre
Courtesy of MIT Press. Used with permission.
11/13/06 22.39 Lecture 18Professor Neil Todreas
6
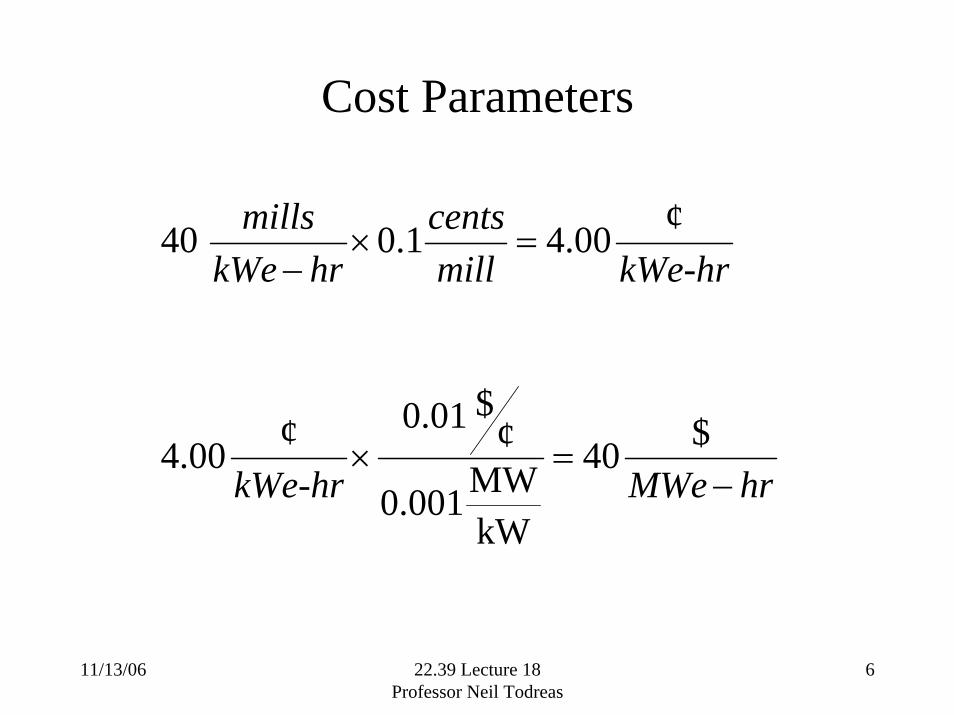
Cost Parameters
hrMWekWe-hr
kWe-hrmillcents
hrkWemills
−=×
=×−
$40
kWMW0.001
¢$01.0¢00.4
¢00.41.040
11/13/06 22.39 Lecture 18Professor Neil Todreas
7
2
4
5
6
7
8
9
1
3
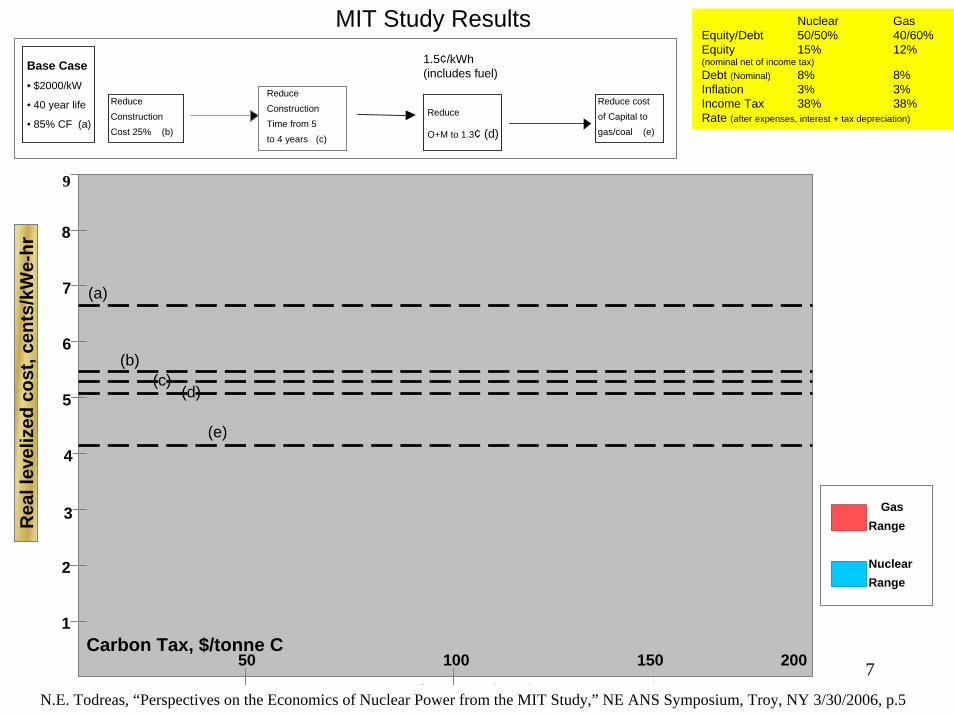
Reduce Construction Cost 25% (b)
1.5¢/kWh(includes fuel)
Reduce
O+M to 1.3¢ (d)
Nuclear GasEquity/Debt 50/50% 40/60%Equity 15% 12%(nominal net of income tax)Debt (Nominal) 8% 8%Inflation 3% 3%Income Tax 38% 38%Rate (after expenses, interest + tax depreciation)
Reduce cost of Capital to gas/coal (e)
50 100 150 200
Rea
l lev
eliz
edco
st, c
ents
/kW
e-hr
Carbon Tax, $/tonne C
Time from 5
Reduce Construction
to 4 years (c)
Gas Range
Nuclear Range
MIT Study Results
Base Case• $2000/kW
• 40 year life
• 85% CF (a)
(a)
(b)(c)
(d)
(e)
N.E. Todreas, “Perspectives on the Economics of Nuclear Power from the MIT Study,” NE ANS Symposium, Troy, NY 3/30/2006, p.5
11/13/06 22.39 Lecture 18Professor Neil Todreas
8
2
4
5
6
7
8
1
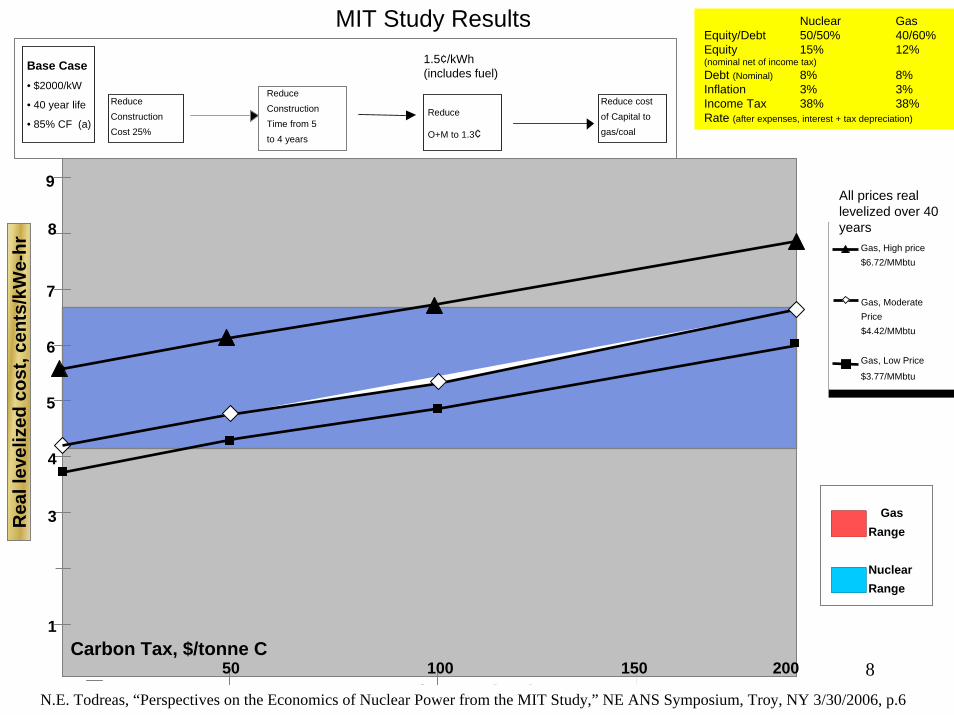
3 Gas Range
Nuclear Range
Gas, ModeratePrice$4.42/MMbtu
Gas, Low Price
$3.77/MMbtu
9
Nuclear GasEquity/Debt 50/50% 40/60%Equity 15% 12%(nominal net of income tax)Debt (Nominal) 8% 8%Inflation 3% 3%Income Tax 38% 38%Rate (after expenses, interest + tax depreciation)
Reduce cost of Capital to gas/coal
Reduce Construction Cost 25%
1.5¢/kWh(includes fuel)
Reduce
O+M to 1.3¢Time from 5
ReduceConstruction
to 4 years
Rea
l lev
eliz
edco
st, c
ents
/kW
e-hr
Carbon Tax, $/tonne C50 100 150 200
Gas, High price$6.72/MMbtu
MIT Study Results
All prices real levelized over 40 years
Base Case• $2000/kW
• 40 year life
• 85% CF (a)
N.E. Todreas, “Perspectives on the Economics of Nuclear Power from the MIT Study,” NE ANS Symposium, Troy, NY 3/30/2006, p.6
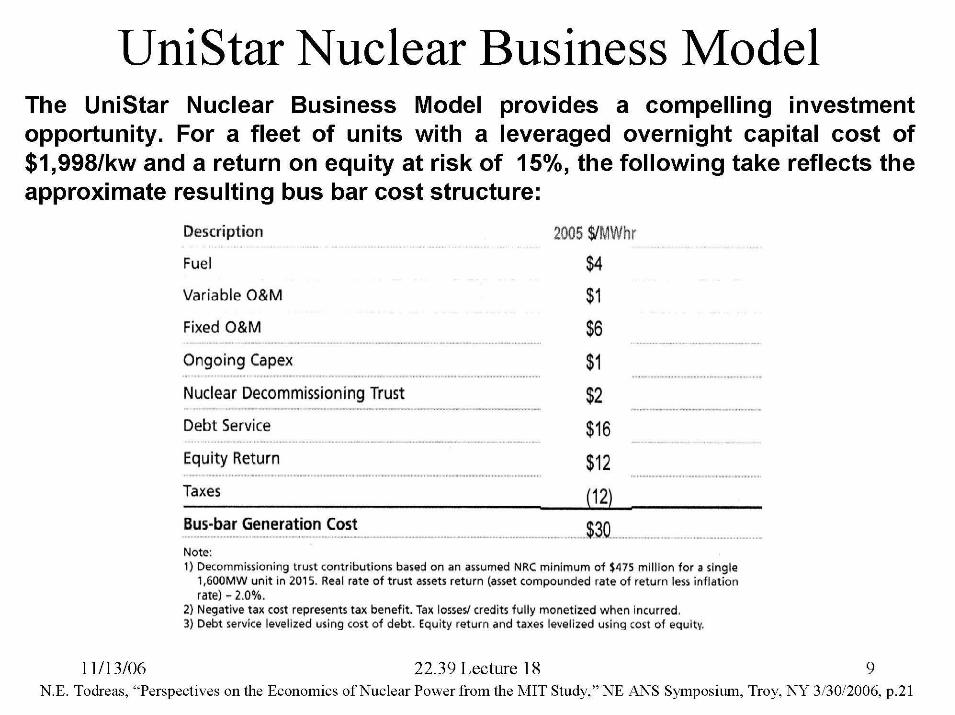
UniStar Nuclear Business Model The UniStar Nuclear Business Model provides a compelling investment opportunity. For a fleet of units with a leveraged overnight capital cost of $1,998/kw and a return on equity at risk of 15%, the following take reflects the approximate resulting bus bar cost structure:
Description
Fuel
Variable O&M
Fixed O&M $6
$1 Nuclear Decommissioning Trust ,, , .", ,,, , ,,, ,,,", .,., ,.,,,,, . " ,,,, .,...,,,
$2
$16 Equity Return
Note: 1) Decommissioning trust contributions based on an assumed NRC minimum of $475 million for a single
1,600MW unit in 2015. Real rate of trust arrets return (asset compounded rate of return less inflation rate) - 2.0%.
2) Negative tax cost represents tax benefit. Tax losserlcredits fully monetized when incurred. 3) Debt service levelired using cost of debt. Equity return and taxes levelired using cost of eauitv.
1111 3/06 22.39 Lecture 18 9 N.E. Todreas, "Perspectives on the Economics of Nuclear Power from the MIT Study," NE ANS Symposium, Troy, NY 313012006, p.21
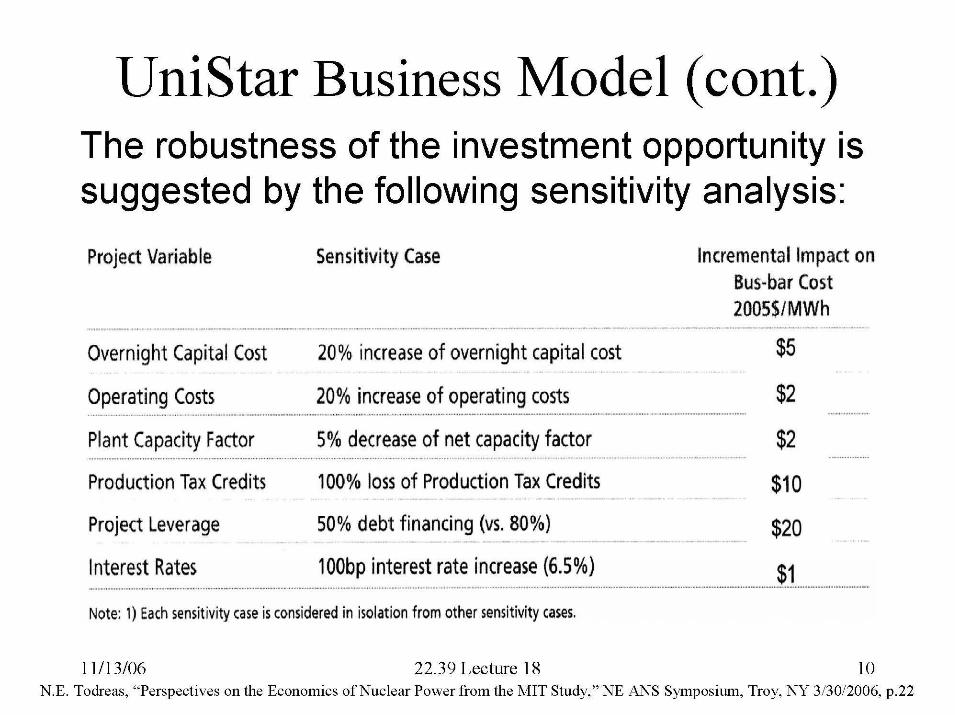
UniStar Business Model (cont.) The robustness of the investment opportunity is suggested by the following sensitivity analysis:
Project Variable Sensitivity Case Incremental Impact on Bus-bar Cost 20055lMWh
Overnight Capital Cast 20% increase of overnight capital cost $5
Operating Costs 20% increase of operating costs $2
Plant Capacity Factor 5% decrease of net capacity factor $2 .........................
Production Tax Credits 100% loss of Production Tax Credits ... . . $1 0
Project Leverage . . . - . . . . . . . . . . . . . . . . . . . . . . . . . . -
50% debt financing (vs. 80%) . . . . . . . . . $20
Interest Rates 100bp interest rate increase (6.5%) $1 Note: 1) Each sensitivity case is considered in isolation from other sensitivity cases.
1111 3/06 22.39 Lecture 18 10 N.E. Todreas, "Perspectives on the Economics of Nuclear Power from the MIT Study," NE ANS Symposium, Troy, NY 313012006, p.22

11/13/06 22.39 Lecture 18Professor Neil Todreas
11
$ Year
Construction Time Years
Financing
Income Tax
Contingen-
cy
USEIA (Jan 03) Reference $2044/kWe in 2010Case $1906/kWe in 2025 Advanced $1535/kWe in 2012Cost Case $1228/kWe in 2025
2001 2001
5
5
DOE – 2010 Roadmap (Oct 01)
$1000 - 1600/kWe
2000
4.5
NEA (2001) USA $1831/kWe OECD $1831 - 2737/kWe
2002 2001
4
4-9
FINLAND $1600/kWe
2002
5
100% Debt at 5% Real Interest
None
JAPAN Onagawa 3 (BWR) - $2409/kWe K-K 6 (ABWR) - $2020/kWe K-K 7 (ABWR) - $1790/kWe
2002
KOREA Yonggwang 5 + 6 - $1800/kWe (KSNP-PWRs)
2002
100% Debt
BROWN’S FERRY (Restart)
$1280/kWe
2002
100% Debt at 80 basis points above 10 yr Treasury
None
SEABROOK (Sale) $730/kWe
2002
Plus $25.6MM for components and $61.9MM for fuel
Overnight Capital Cost(From Appendix to Chapter 5, MIT Study)
N.E. Todreas, “Perspectives on the Economics of Nuclear Power from the MIT Study,” NE ANS Symposium, Troy, NY 3/30/2006, p.8
11/13/06 22.39 Lecture 18Professor Neil Todreas
12
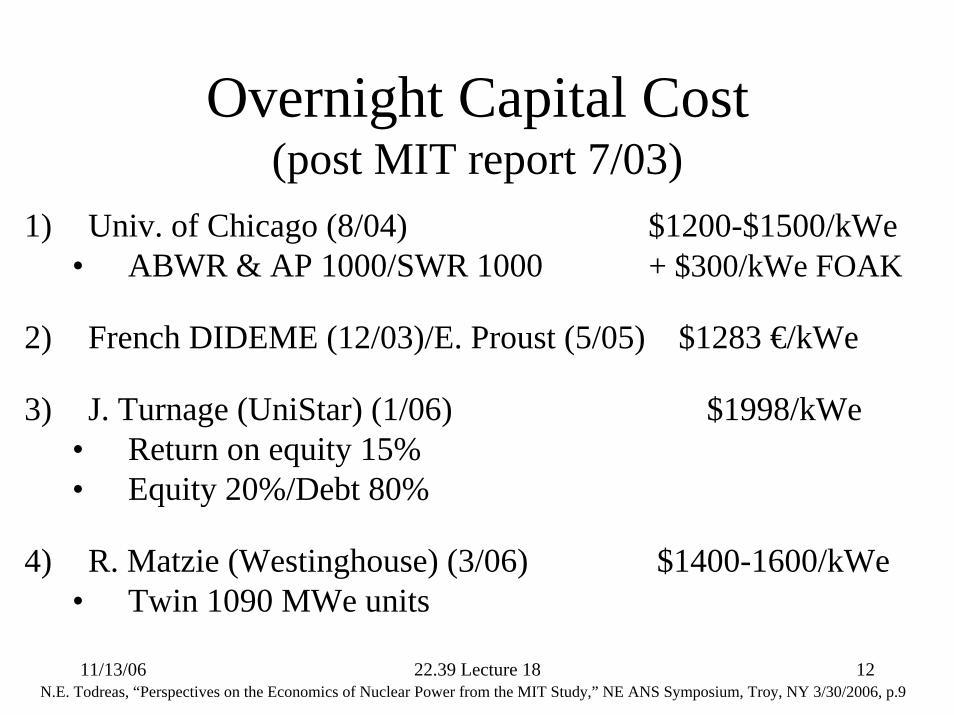
Overnight Capital Cost(post MIT report 7/03)
1) Univ. of Chicago (8/04) $1200-$1500/kWe• ABWR & AP 1000/SWR 1000 + $300/kWe FOAK
2) French DIDEME (12/03)/E. Proust (5/05) $1283 €/kWe
3) J. Turnage (UniStar) (1/06) $1998/kWe• Return on equity 15%• Equity 20%/Debt 80%
4) R. Matzie (Westinghouse) (3/06) $1400-1600/kWe• Twin 1090 MWe units
N.E. Todreas, “Perspectives on the Economics of Nuclear Power from the MIT Study,” NE ANS Symposium, Troy, NY 3/30/2006, p.9
11/13/06 22.39 Lecture 18Professor Neil Todreas
13
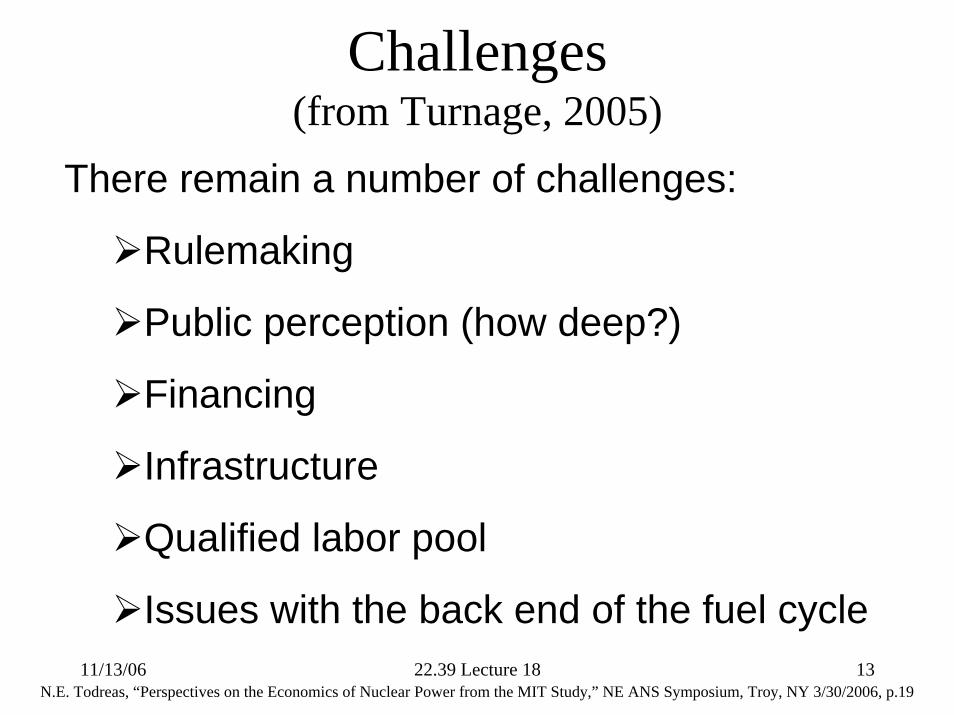
Challenges (from Turnage, 2005)
There remain a number of challenges:
Rulemaking
Public perception (how deep?)
Financing
Infrastructure
Qualified labor pool
Issues with the back end of the fuel cycle
N.E. Todreas, “Perspectives on the Economics of Nuclear Power from the MIT Study,” NE ANS Symposium, Troy, NY 3/30/2006, p.19
11/13/06 22.39 Lecture 18Professor Neil Todreas
14
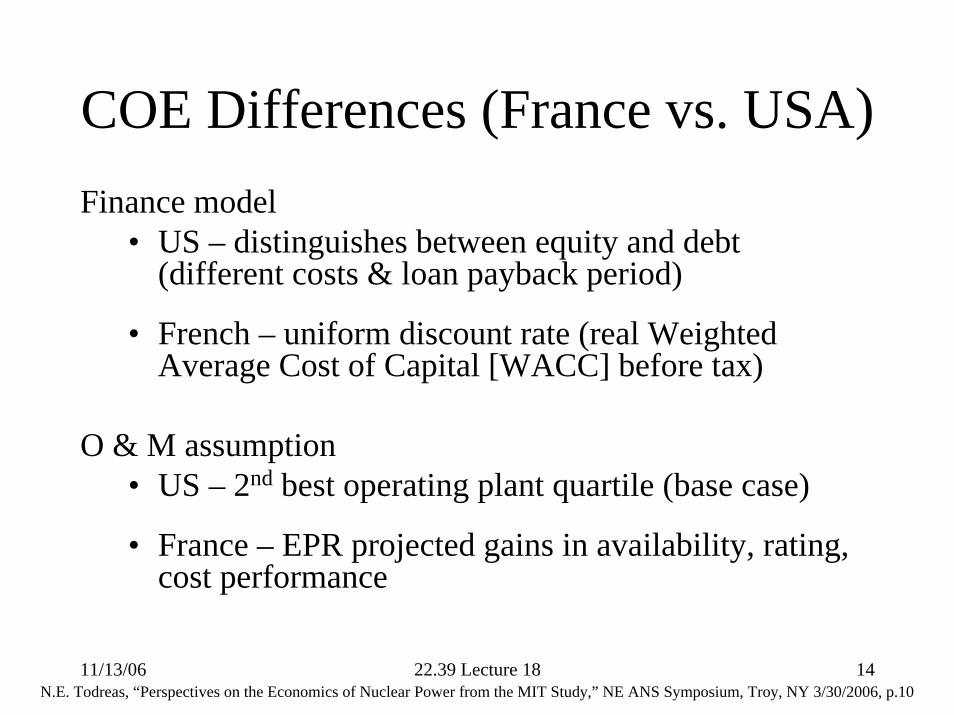
COE Differences (France vs. USA)Finance model
• US – distinguishes between equity and debt (different costs & loan payback period)
• French – uniform discount rate (real Weighted Average Cost of Capital [WACC] before tax)
O & M assumption• US – 2nd best operating plant quartile (base case)
• France – EPR projected gains in availability, rating, cost performance
N.E. Todreas, “Perspectives on the Economics of Nuclear Power from the MIT Study,” NE ANS Symposium, Troy, NY 3/30/2006, p.10
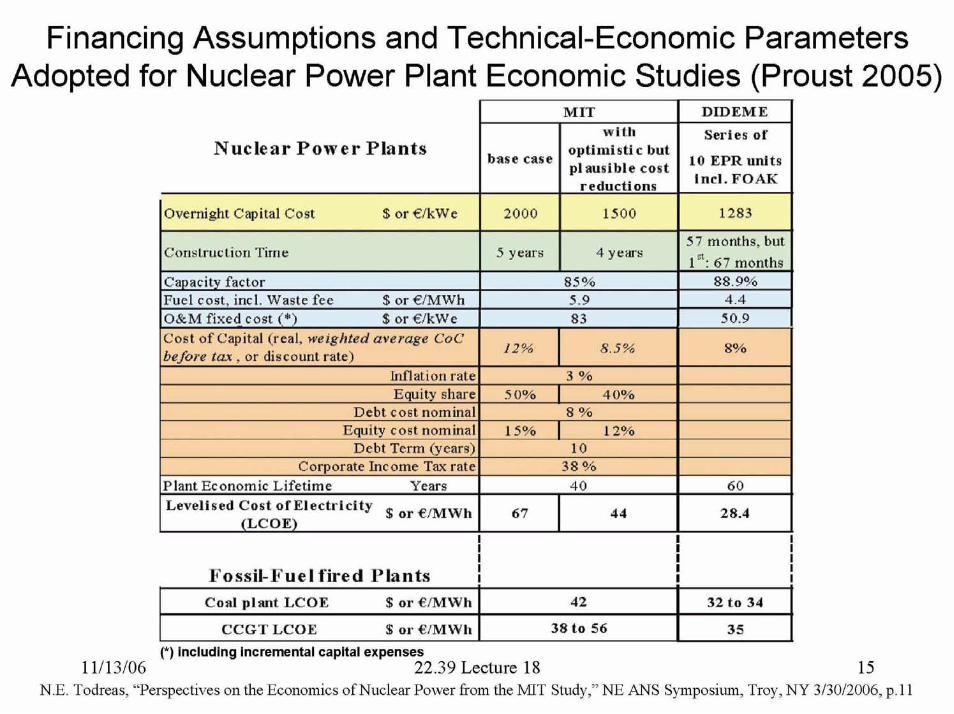
Financing Assumptions and Technical-Economic Parameters Adopted for Nuclear Power Plant Economic Studies (Proust 2005)
I MIT I DLDEME I with Series of
Nuclear Power Plants ...+ a- isti c but ble cost 10 EPR units
I I . ~ ~ ~ c t i o n s incl. FOAK -
1 7 - 1 lovernight Capital Cost $ or WkWe 2000 1500 1283
".I, AYllr" .
,---. cost, incl. Waste
I I I
Fossi&FueI fired Plants I I I I I I
Coal plant LCOE % or e N W h
CCGT LCOE % or eMWh (*) including incremental capital expenses
11/13/06 22.39 Lecture 18 15 N.E. Todreas, "Perspectives on the Economics ofNuclear Power hom the MIT Study," NE ANS Symposium, Troy, NY 313012006, p. 11
42
38 ta 56
32 to 34
35
11/13/06 22.39 Lecture 18Professor Neil Todreas
16
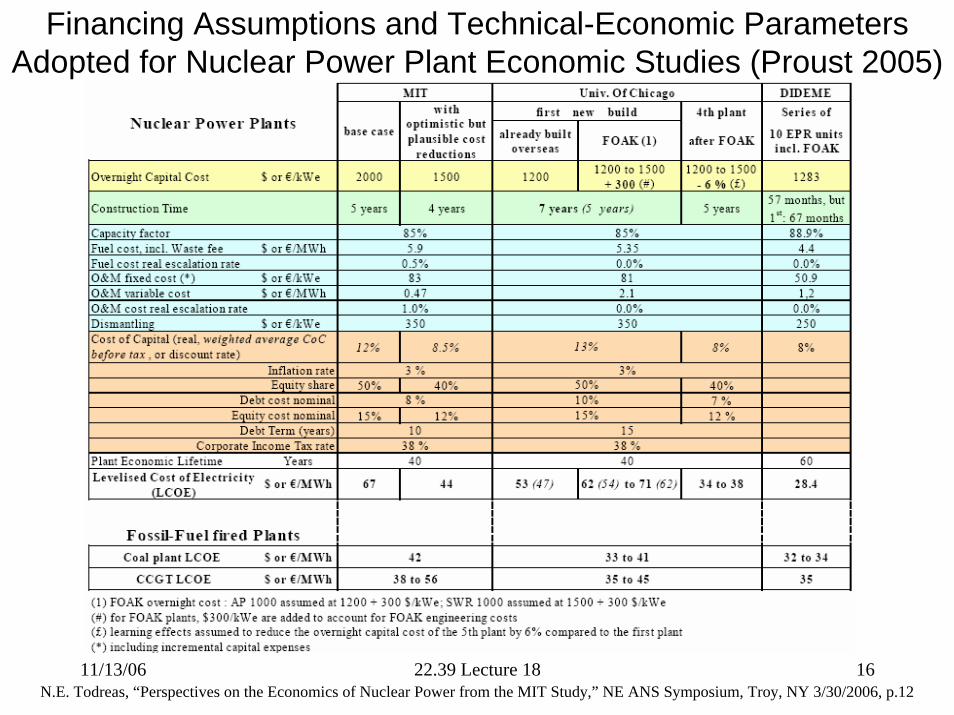
Financing Assumptions and Technical-Economic Parameters Adopted for Nuclear Power Plant Economic Studies (Proust 2005)
N.E. Todreas, “Perspectives on the Economics of Nuclear Power from the MIT Study,” NE ANS Symposium, Troy, NY 3/30/2006, p.12
11/13/06 22.39 Lecture 18Professor Neil Todreas
17
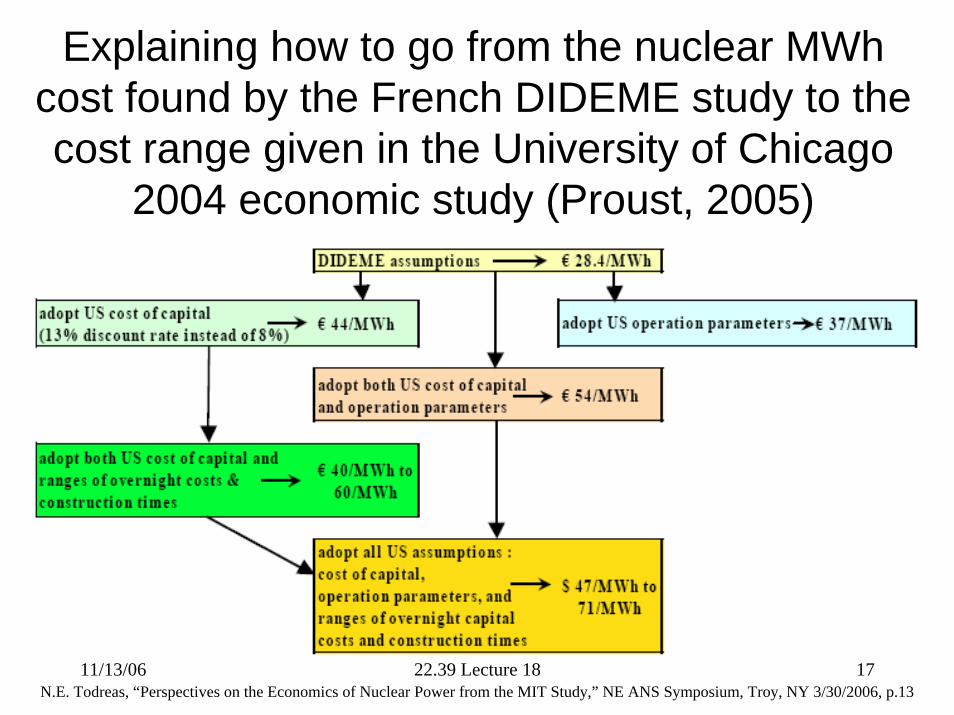
Explaining how to go from the nuclear MWhcost found by the French DIDEME study to the cost range given in the University of Chicago
2004 economic study (Proust, 2005)
N.E. Todreas, “Perspectives on the Economics of Nuclear Power from the MIT Study,” NE ANS Symposium, Troy, NY 3/30/2006, p.13
11/13/06 22.39 Lecture 18Professor Neil Todreas
18
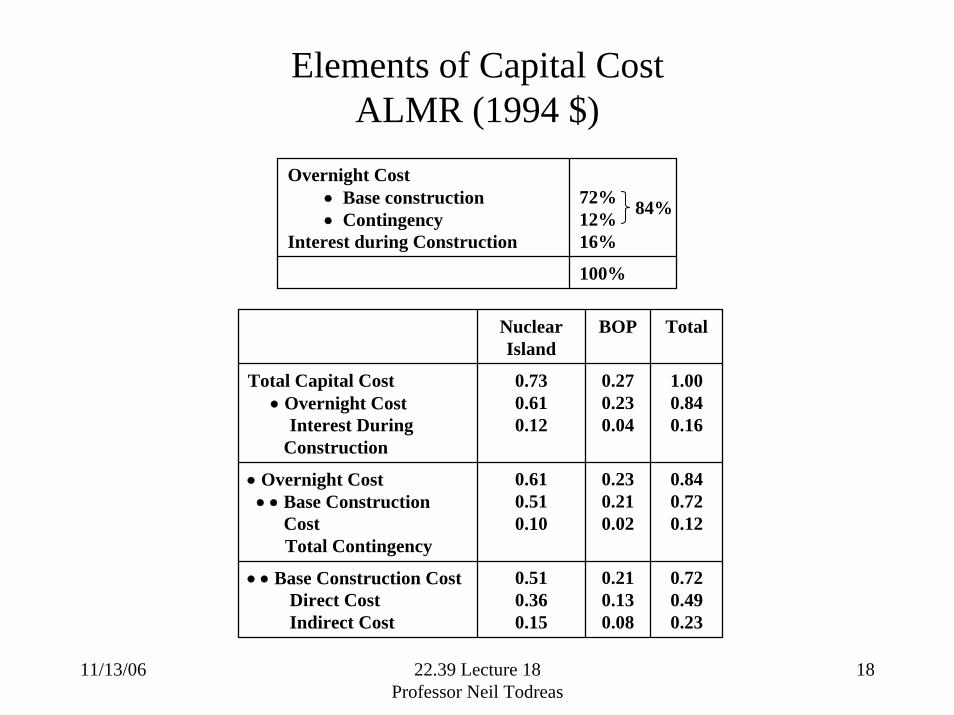
Elements of Capital CostALMR (1994 $)
Overnight Cost• Base construction• Contingency
Interest during Construction
72%12%16%
100%
84%
NuclearIsland
BOP Total
Total Capital Cost• Overnight Cost
Interest During Construction
0.730.610.12
0.270.230.04
1.000.840.16
• Overnight Cost• • Base Construction
CostTotal Contingency
0.610.510.10
0.230.210.02
0.840.720.12
• • Base Construction CostDirect CostIndirect Cost
0.510.360.15
0.210.130.08
0.720.490.23
11/13/06 22.39 Lecture 18Professor Neil Todreas
19
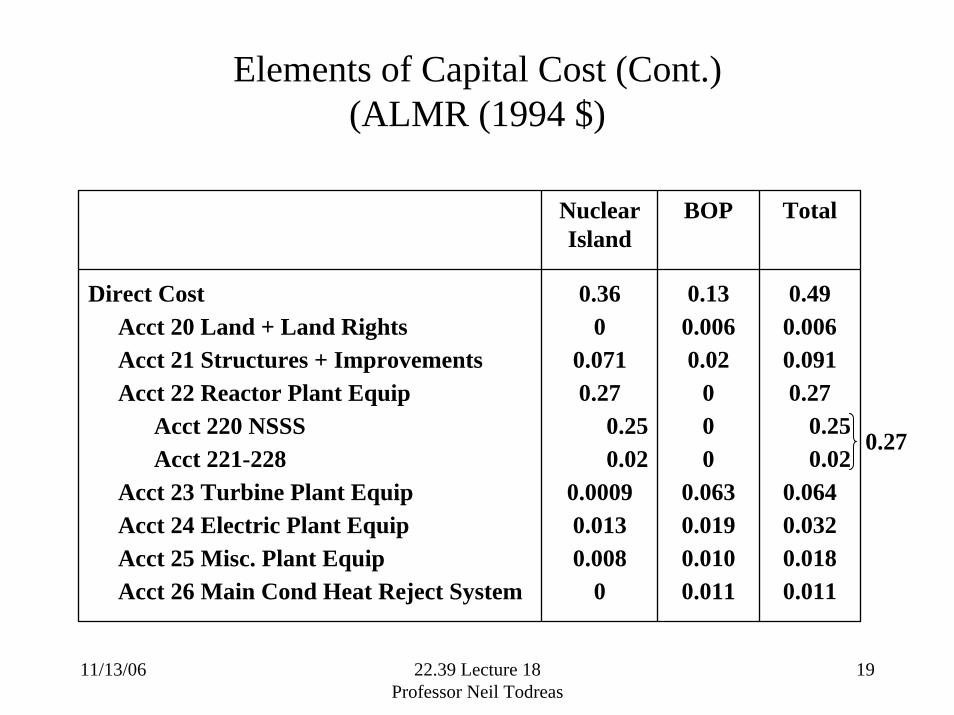
Elements of Capital Cost (Cont.) (ALMR (1994 $)
NuclearIsland
BOP Total
Direct CostAcct 20 Land + Land RightsAcct 21 Structures + ImprovementsAcct 22 Reactor Plant Equip
Acct 220 NSSSAcct 221-228
Acct 23 Turbine Plant EquipAcct 24 Electric Plant EquipAcct 25 Misc. Plant EquipAcct 26 Main Cond Heat Reject System
0.360
0.0710.27
0.250.02
0.00090.0130.008
0
0.130.0060.02
000
0.0630.0190.0100.011
0.490.0060.0910.27
0.250.02
0.0640.0320.0180.011
0.27
11/13/06 22.39 Lecture 18Professor Neil Todreas
20
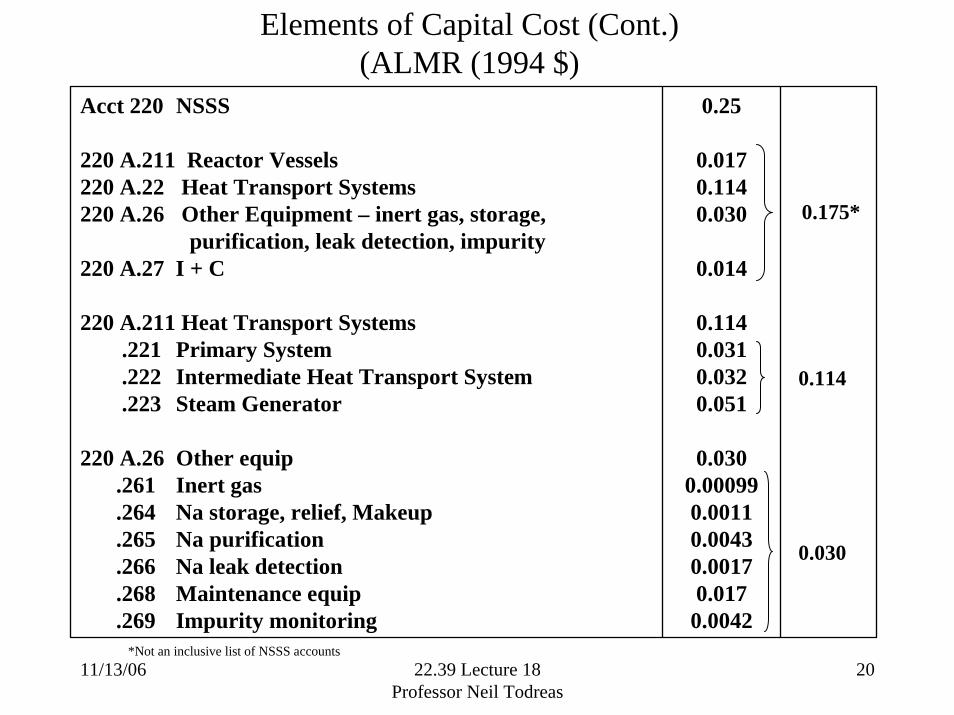
Elements of Capital Cost (Cont.) (ALMR (1994 $)
Acct 220 NSSS
220 A.211 Reactor Vessels220 A.22 Heat Transport Systems220 A.26 Other Equipment – inert gas, storage,
purification, leak detection, impurity220 A.27 I + C
220 A.211 Heat Transport Systems.221 Primary System.222 Intermediate Heat Transport System.223 Steam Generator
220 A.26 Other equip.261 Inert gas.264 Na storage, relief, Makeup.265 Na purification.266 Na leak detection.268 Maintenance equip.269 Impurity monitoring
0.25
0.0170.1140.030
0.014
0.1140.0310.0320.051
0.0300.000990.00110.00430.00170.017
0.0042*Not an inclusive list of NSSS accounts
0.175*
0.114
0.030
11/13/06 22.39 Lecture 18Professor Neil Todreas
21
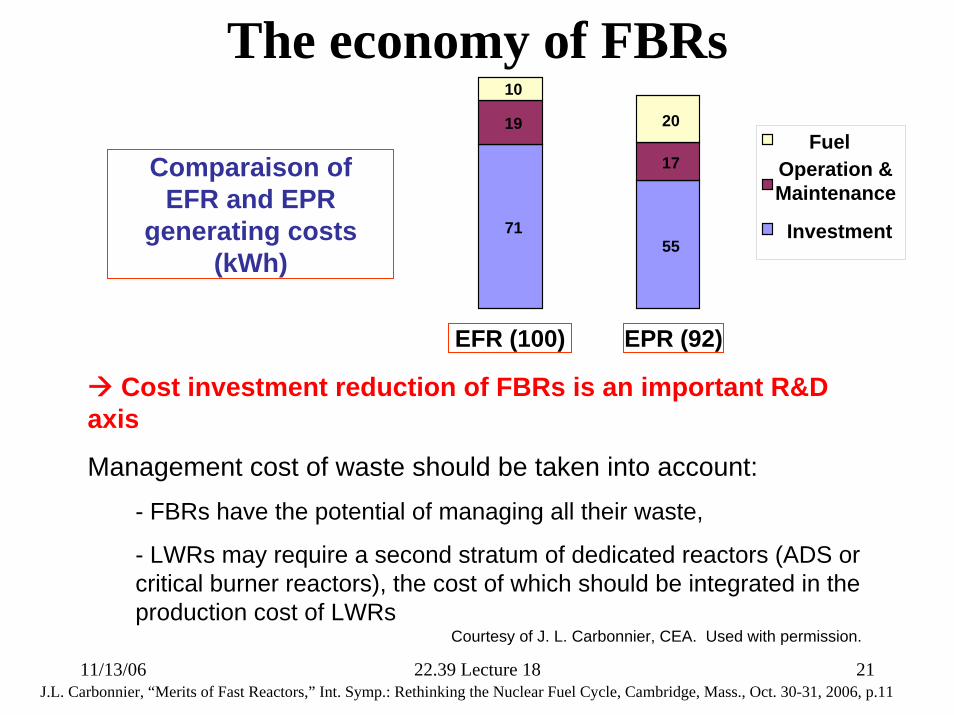
The economy of FBRs
Cost investment reduction of FBRs is an important R&D axis
Management cost of waste should be taken into account: - FBRs have the potential of managing all their waste,
- LWRs may require a second stratum of dedicated reactors (ADS or critical burner reactors), the cost of which should be integrated in the production cost of LWRs
Comparaison of EFR and EPR
generating costs(kWh)
7155
19
17
10
20
EFR (100) EPR (92)
FuelOperation & Maintenance
Investment
J.L. Carbonnier, “Merits of Fast Reactors,” Int. Symp.: Rethinking the Nuclear Fuel Cycle, Cambridge, Mass., Oct. 30-31, 2006, p.11
Courtesy of J. L. Carbonnier, CEA. Used with permission.
11/13/06 22.39 Lecture 18Professor Neil Todreas
22
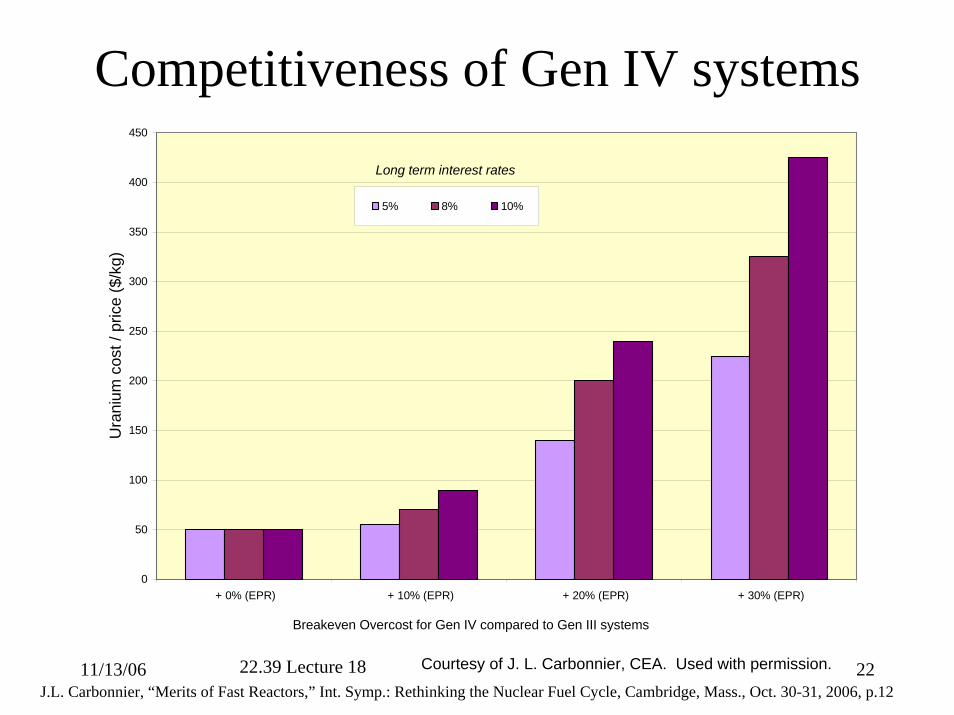
Competitiveness of Gen IV systems
0
50
100
150
200
250
300
350
400
450
+ 0% (EPR) + 10% (EPR) + 20% (EPR) + 30% (EPR)
coût
de
l'ura
nium
($/k
g)
5% 8% 10%
Ura
nium
cos
t / p
rice
($/k
g)
Breakeven Overcost for Gen IV compared to Gen III systems
Long term interest rates
J.L. Carbonnier, “Merits of Fast Reactors,” Int. Symp.: Rethinking the Nuclear Fuel Cycle, Cambridge, Mass., Oct. 30-31, 2006, p.12
Courtesy of J. L. Carbonnier, CEA. Used with permission.
11/13/06 22.39 Lecture 18Professor Neil Todreas
23
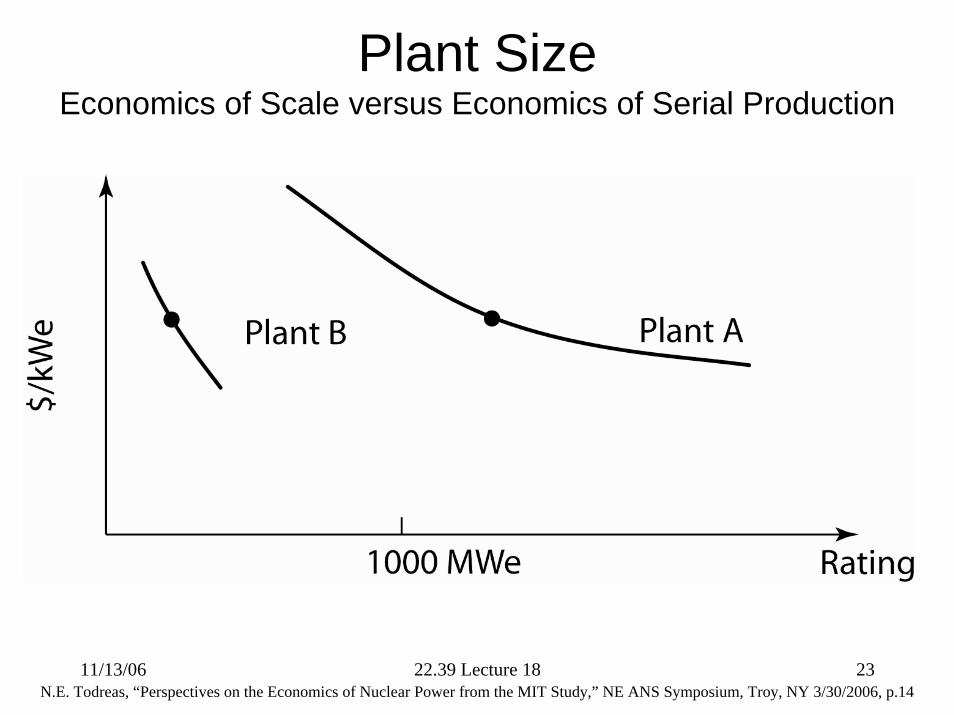
Plant SizeEconomics of Scale versus Economics of Serial Production
N.E. Todreas, “Perspectives on the Economics of Nuclear Power from the MIT Study,” NE ANS Symposium, Troy, NY 3/30/2006, p.14
11/13/06 22.39 Lecture 18Professor Neil Todreas
24
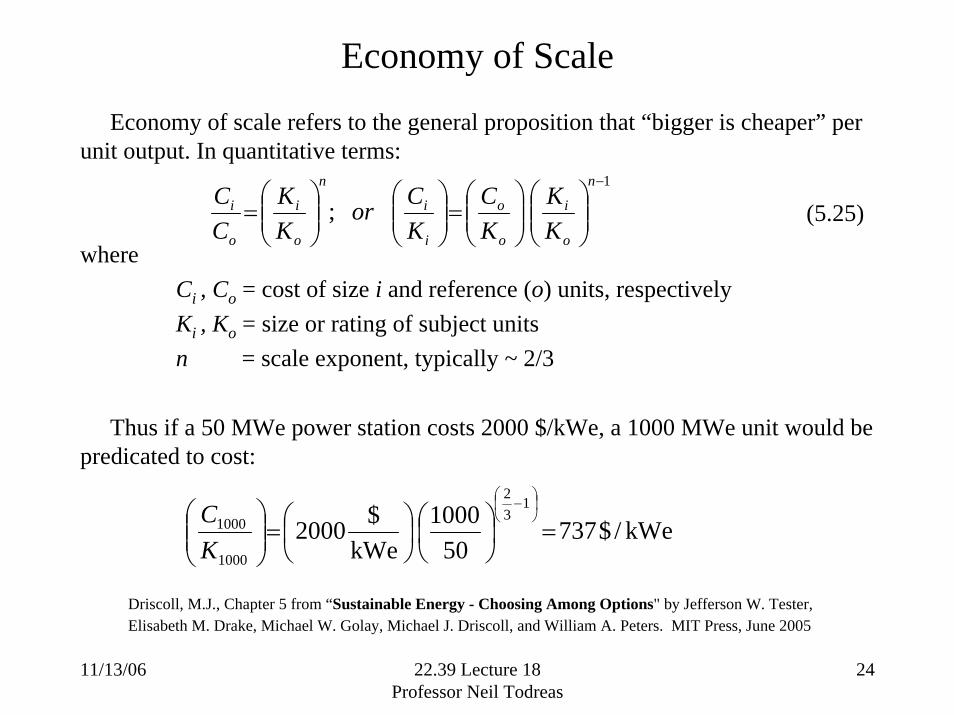
Economy of Scale
Economy of scale refers to the general proposition that “bigger is cheaper” per unit output. In quantitative terms:
whereCi , Co = cost of size i and reference (o) units, respectivelyKi , Ko = size or rating of subject unitsn = scale exponent, typically ~ 2/3
Thus if a 50 MWe power station costs 2000 $/kWe, a 1000 MWe unit would be predicated to cost:
1
;−
⎟⎟⎠
⎞⎜⎜⎝
⎛⎟⎟⎠
⎞⎜⎜⎝
⎛=⎟⎟⎠
⎞⎜⎜⎝
⎛⎟⎟⎠
⎞⎜⎜⎝
⎛=
n
o
i
o
o
i
i
n
o
i
o
i
KK
KC
KCor
KK
CC
kWe/$73750
1000kWe
$20001
32
1000
1000 =⎟⎠⎞
⎜⎝⎛
⎟⎠⎞
⎜⎝⎛=⎟⎟
⎠
⎞⎜⎜⎝
⎛ ⎟⎠⎞
⎜⎝⎛ −
KC
Driscoll, M.J., Chapter 5 from “Sustainable Energy - Choosing Among Options" by Jefferson W. Tester, Elisabeth M. Drake, Michael W. Golay, Michael J. Driscoll, and William A. Peters. MIT Press, June 2005
(5.25)
11/13/06 22.39 Lecture 18Professor Neil Todreas
25
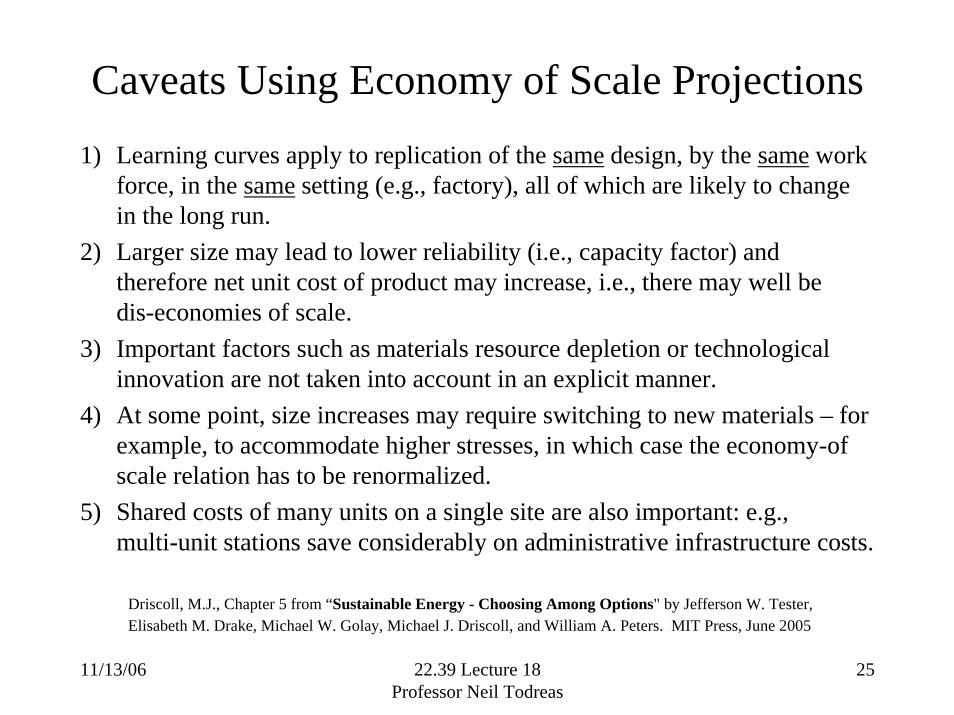
Caveats Using Economy of Scale Projections1) Learning curves apply to replication of the same design, by the same work
force, in the same setting (e.g., factory), all of which are likely to change in the long run.
2) Larger size may lead to lower reliability (i.e., capacity factor) and therefore net unit cost of product may increase, i.e., there may well be dis-economies of scale.
3) Important factors such as materials resource depletion or technological innovation are not taken into account in an explicit manner.
4) At some point, size increases may require switching to new materials – for example, to accommodate higher stresses, in which case the economy-of scale relation has to be renormalized.
5) Shared costs of many units on a single site are also important: e.g., multi-unit stations save considerably on administrative infrastructure costs.
Driscoll, M.J., Chapter 5 from “Sustainable Energy - Choosing Among Options" by Jefferson W. Tester, Elisabeth M. Drake, Michael W. Golay, Michael J. Driscoll, and William A. Peters. MIT Press, June 2005
11/13/06 22.39 Lecture 18Professor Neil Todreas
26
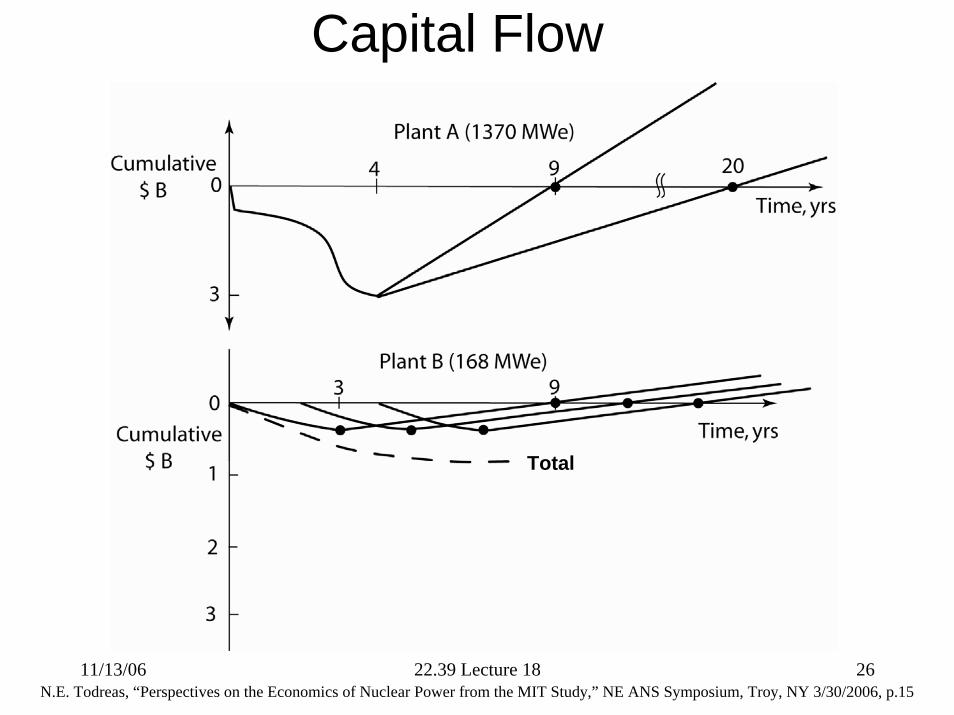
Capital Flow
N.E. Todreas, “Perspectives on the Economics of Nuclear Power from the MIT Study,” NE ANS Symposium, Troy, NY 3/30/2006, p.15
Total
11/13/06 22.39 Lecture 18Professor Neil Todreas
27
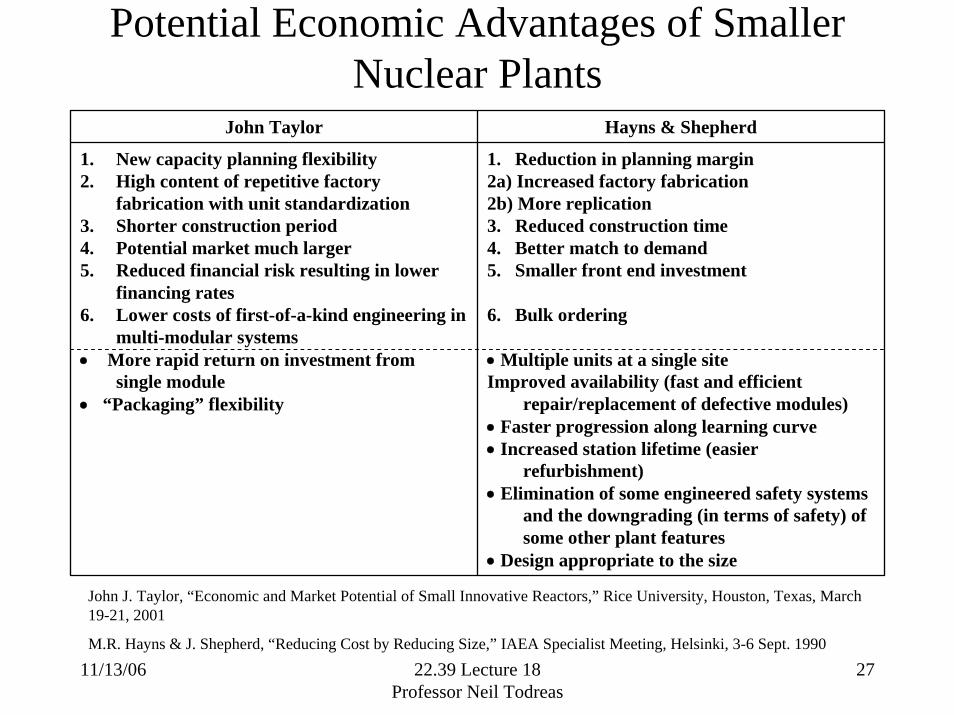
Potential Economic Advantages of Smaller Nuclear Plants
John J. Taylor, “Economic and Market Potential of Small Innovative Reactors,” Rice University, Houston, Texas, March 19-21, 2001
M.R. Hayns & J. Shepherd, “Reducing Cost by Reducing Size,” IAEA Specialist Meeting, Helsinki, 3-6 Sept. 1990
John Taylor Hayns & Shepherd
1. New capacity planning flexibility2. High content of repetitive factory
fabrication with unit standardization3. Shorter construction period4. Potential market much larger5. Reduced financial risk resulting in lower
financing rates6. Lower costs of first-of-a-kind engineering in
multi-modular systems• More rapid return on investment from
single module• “Packaging” flexibility
1. Reduction in planning margin2a) Increased factory fabrication2b) More replication3. Reduced construction time4. Better match to demand5. Smaller front end investment
6. Bulk ordering
• Multiple units at a single siteImproved availability (fast and efficient
repair/replacement of defective modules)• Faster progression along learning curve• Increased station lifetime (easier
refurbishment)• Elimination of some engineered safety systems
and the downgrading (in terms of safety) of some other plant features
• Design appropriate to the size
11/13/06 22.39 Lecture 18Professor Neil Todreas
28
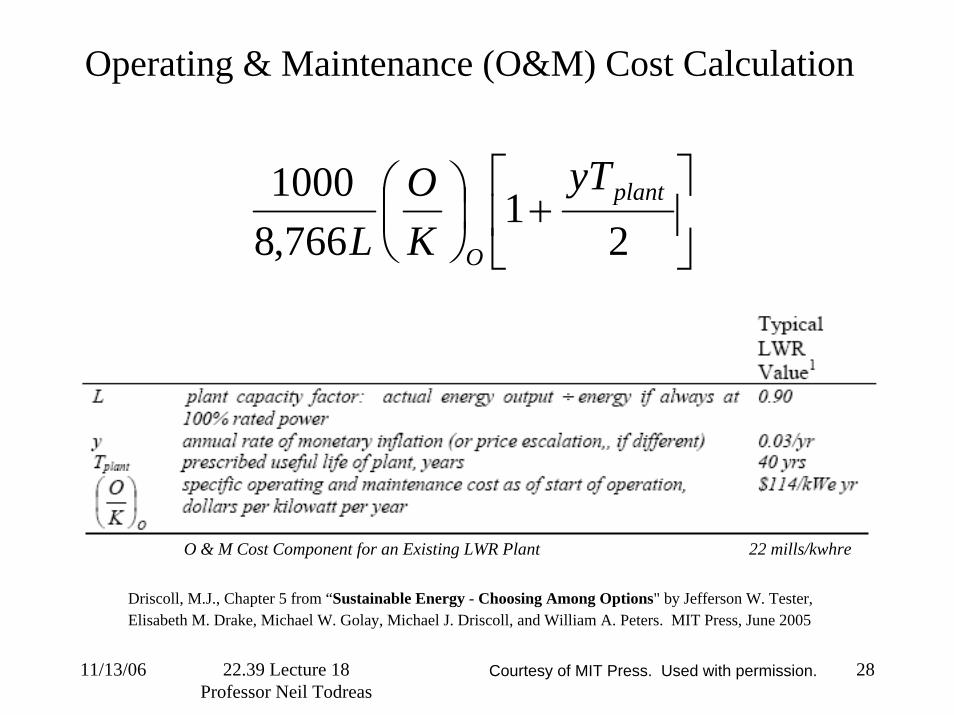
Operating & Maintenance (O&M) Cost Calculation
⎥⎦
⎤⎢⎣
⎡+⎟
⎠⎞
⎜⎝⎛
21
766,81000 plant
O
yTKO
L
Driscoll, M.J., Chapter 5 from “Sustainable Energy - Choosing Among Options" by Jefferson W. Tester, Elisabeth M. Drake, Michael W. Golay, Michael J. Driscoll, and William A. Peters. MIT Press, June 2005
O & M Cost Component for an Existing LWR Plant 22 mills/kwhre
Courtesy of MIT Press. Used with permission.
11/13/06 22.39 Lecture 18Professor Neil Todreas
29
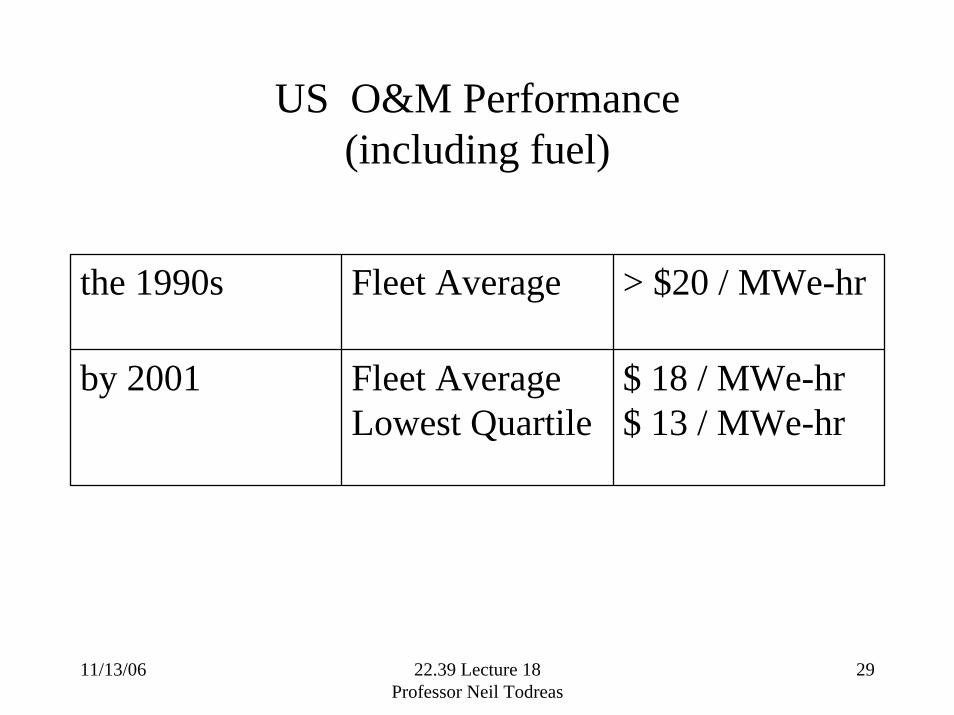
US O&M Performance (including fuel)
the 1990s Fleet Average > $20 / MWe-hr
by 2001 Fleet AverageLowest Quartile
$ 18 / MWe-hr$ 13 / MWe-hr
11/13/06 22.39 Lecture 18Professor Neil Todreas
30
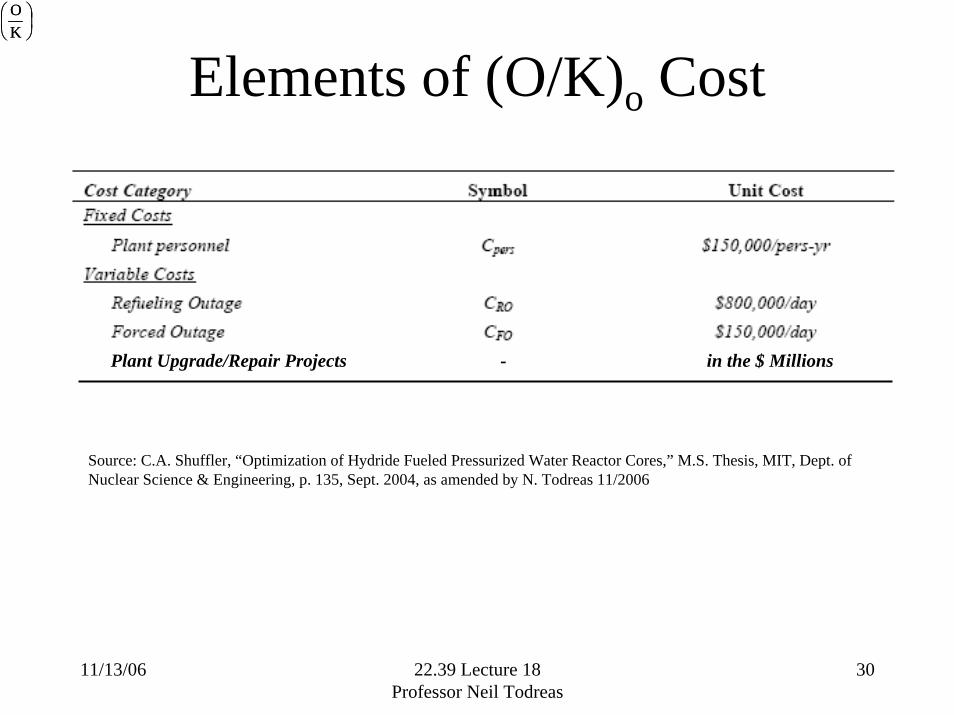
Elements of (O/K)o Cost⎟⎠⎞
⎜⎝⎛
KO⎟⎠⎞
⎜⎝⎛
KO
Source: C.A. Shuffler, “Optimization of Hydride Fueled Pressurized Water Reactor Cores,” M.S. Thesis, MIT, Dept. of Nuclear Science & Engineering, p. 135, Sept. 2004, as amended by N. Todreas 11/2006
Plant Upgrade/Repair Projects - in the $ Millions
11/13/06 22.39 Lecture 18Professor Neil Todreas
31
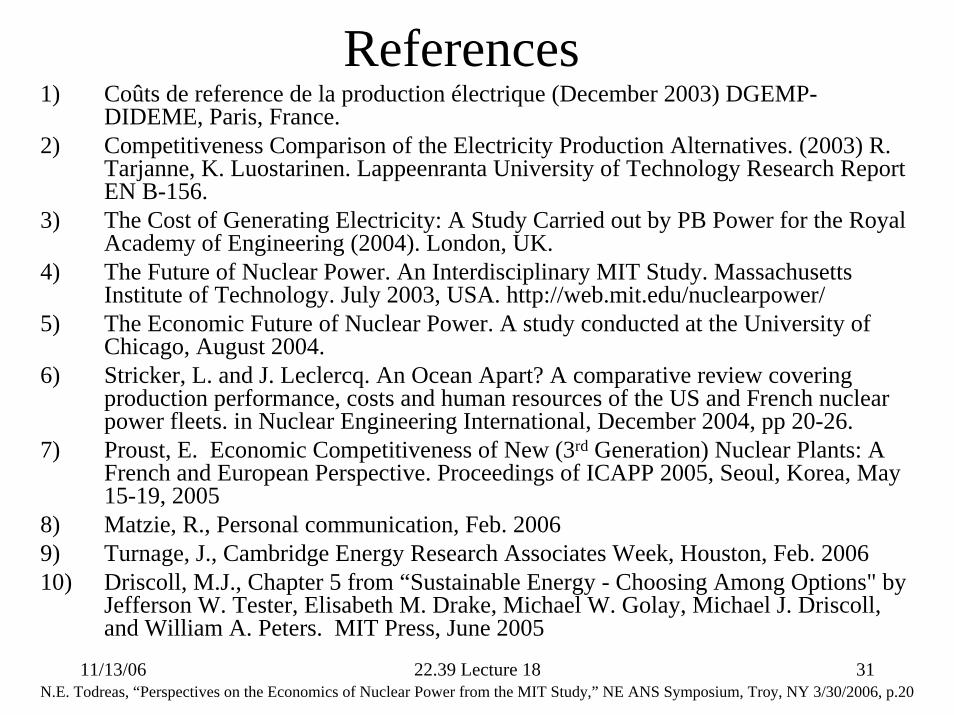
References1) Coûts de reference de la production électrique (December 2003) DGEMP-
DIDEME, Paris, France. 2) Competitiveness Comparison of the Electricity Production Alternatives. (2003) R.
Tarjanne, K. Luostarinen. Lappeenranta University of Technology Research Report EN B-156.
3) The Cost of Generating Electricity: A Study Carried out by PB Power for the Royal Academy of Engineering (2004). London, UK.
4) The Future of Nuclear Power. An Interdisciplinary MIT Study. Massachusetts Institute of Technology. July 2003, USA. http://web.mit.edu/nuclearpower/
5) The Economic Future of Nuclear Power. A study conducted at the University of Chicago, August 2004.
6) Stricker, L. and J. Leclercq. An Ocean Apart? A comparative review covering production performance, costs and human resources of the US and French nuclear power fleets. in Nuclear Engineering International, December 2004, pp 20-26.
7) Proust, E. Economic Competitiveness of New (3rd Generation) Nuclear Plants: A French and European Perspective. Proceedings of ICAPP 2005, Seoul, Korea, May 15-19, 2005
8) Matzie, R., Personal communication, Feb. 20069) Turnage, J., Cambridge Energy Research Associates Week, Houston, Feb. 200610) Driscoll, M.J., Chapter 5 from “Sustainable Energy - Choosing Among Options" by
Jefferson W. Tester, Elisabeth M. Drake, Michael W. Golay, Michael J. Driscoll, and William A. Peters. MIT Press, June 2005
N.E. Todreas, “Perspectives on the Economics of Nuclear Power from the MIT Study,” NE ANS Symposium, Troy, NY 3/30/2006, p.20


![Uranium Resource Availability Fuel Cycle Cost Resource Availability Fuel Cycle Cost Course 22.39, ... Western World Production against Reactor ... FCC FLEET = FCC UOX [% Fleet UOX]](https://img.pdfslide.us/doc/110x75/5b3fae907f8b9a51528c5547/uranium-resource-availability-fuel-cycle-cost-resource-availability-fuel-cycle-cost.jpg)