Embed Size (px)
Citation preview

Gloria Thomas1*Rondedrick Sinville1
Shelby Sutton1
Hannah Farquar1
Robert P. Hammer1
Steven A. Soper1
Yu-Wei Cheng2
Francis Barany2
1Department of Chemistry,Louisiana State University,Baton Rouge, LA, USA
2Department ofMolecular Biology,Joan and Sanford I. Weill MedicalCollege of Cornell University,New York, NY, USA
Capillary and microelectrophoretic separations ofligase detection reaction products produced fromlow-abundant point mutations in genomic DNA
Capillary gel electrophoresis (CGE) and polymer-based microelectrophoretic platformswere investigated to analyze low-abundant point mutations in certain gene fragmentswith high diagnostic value for colorectal cancers. The electrophoretic separations werecarried out on single-stranded DNA (ssDNA) products generated from an allele-specif-ic ligation assay (ligase detection reaction, LDR), which was used to screen for a singlebase mutation at codon 12 in the K-ras oncogene. The presence of the mutation gen-erated a ssDNA fragment that was .40 base pairs (bp) in length, while the primersused for the ligation assay were ,30 bp in length. Various separation matrices wereinvestigated, with the success of the matrix assessed by its ability to resolve the liga-tion product from the large molar excess of unligated primers when the mutant allelewas lower in copy number compared to the wild-type allele. Using CGE, LDR productmodels (44 and 51 bp) could be analyzed in a cross-linked polyacrylamide gel with a1000-fold molar excess of LDR primers (25 bp) in ,45 min. However, when using linearpolyacrylamide gels, these same fragments could not be detected due to significantelectrokinetic biasing during injection. A poly(methylmethacrylate) (PMMA) microchipof 3.5 cm effective column length was used with a 4% linear polyacrylamide gel toanalyze the products generated from an LDR. When the reaction contained a 100-foldmolar excess of wild-type DNA compared to a G12.2D mutant allele, the 44 bp ligationproduct could be effectively resolved from unligated primers in under 120 s, nearly17 times faster than the CGE format. In addition, sample cleanup was simplified usingthe microchip format by not requiring desalting of the LDR prior to loading.
Keywords: Capillary gel electrophoresis / Ligase detection / Microelectrophoresis / Miniaturiza-tion / Mutation analysis DOI 10.1002/elps.200405886
1 Introduction
Electrophoresis can be utilized in screening assays for thediagnosis of presymptomatic disease states, such as theearly detection of cancers, which can arise from the accu-mulation of mutations in certain gene fragments that maybe inherited or somatic caused either from exposure toenvironmental factors or from malfunctions in DNA repli-cation or repair machinery. These mutations can then be
used as markers in a variety of different electrophoresisformats, such as heteroduplex analysis, single-strandconformational polymorphism analysis, denaturing gradi-ent gel electrophoresis, or DNA sequencing.
One example where electrophoresis can potentially pro-vide diagnostic information is the early detection of color-ectal cancers using the identification of point mutations inthe human K-ras oncogene, which manifest themselvesprimarily as single base substitutions located at twobases in codon 12, two bases in codon 13 and three incodon 61. These particular mutations occur in 35–50%of all colorectal adenomas and can manifest themselvesearly in the development of colorectal neoplasms [1–4].Once acquired, these mutations are preserved through-out disease development and thus, have great utility fordiagnostic testing.
Correspondence: Steven A. Soper, PhD, Department of Chem-istry, Louisiana State University, Baton Rouge, LA 70803-1804,USAE-mail: [email protected]: 1225-578-1527
Abbreviations: CGE, capillary gel elctrophoresis; eCAP, ssDNA100-R gel; 5T5C, 5% total acrylamide, 5% cross-linking poly-acrylamide gel; LDR, ligase detection reaction; LPA, linear poly-acrylamide; PMMA, poly(methylmethacrylate); POP5, perfor-mance-optimized polymer gel
1668 Electrophoresis 2004, 25, 1668–1677
* Present address: Department of Chemistry, Mississippi StateUniversity, Starkville, MS, USA
2004 WILEY-VCH Verlag GmbH & Co. KGaA, Weinheim
Electrophoresis 2004, 25, 1668–1677 Separation of DNA mutations 1669
Unfortunately, the detection of these mutations is compli-cated by the fact that often their presence is masked bysignificant amounts of wild-type sequences even at theprimary tumor site, which can contain a majority of wild-type stroma. The frequency of the mutated allele at theprimary tumor site can be as little as 15% for heterozy-gous samples and this number goes down precipitouslyif the sampling is done away from this site. Therefore,improvements in early detection and treatment of cancerpatients depends intimately on rapid and accurate high-throughput methodologies capable of identifying low-abundant mutations with high selectivity.
K-ras mutations may be detected by direct DNA se-quencing, allele-specific oligonucleotide hybridization orrestriction digestion techniques [5–8]. Others have usedhigh-sensitivity techniques such as phage cloning, allele-specific PCR or repetitive restriction digestion to detectK-ras mutations in stool or lymph nodes of cancerpatients as indicators of micrometastases [9–15]. Unfor-tunately, these techniques have intrinsic limitations, suchas low sensitivity (DNA sequencing) or the inability todetect the full spectrum of K-ras mutations (restrictiondigestion or allele-specific PCR). Furthermore, allele-spe-cific amplification techniques are prone to false positivesgenerated from minute contamination or from the intro-duction of point mutations by polymerase errors duringextension.
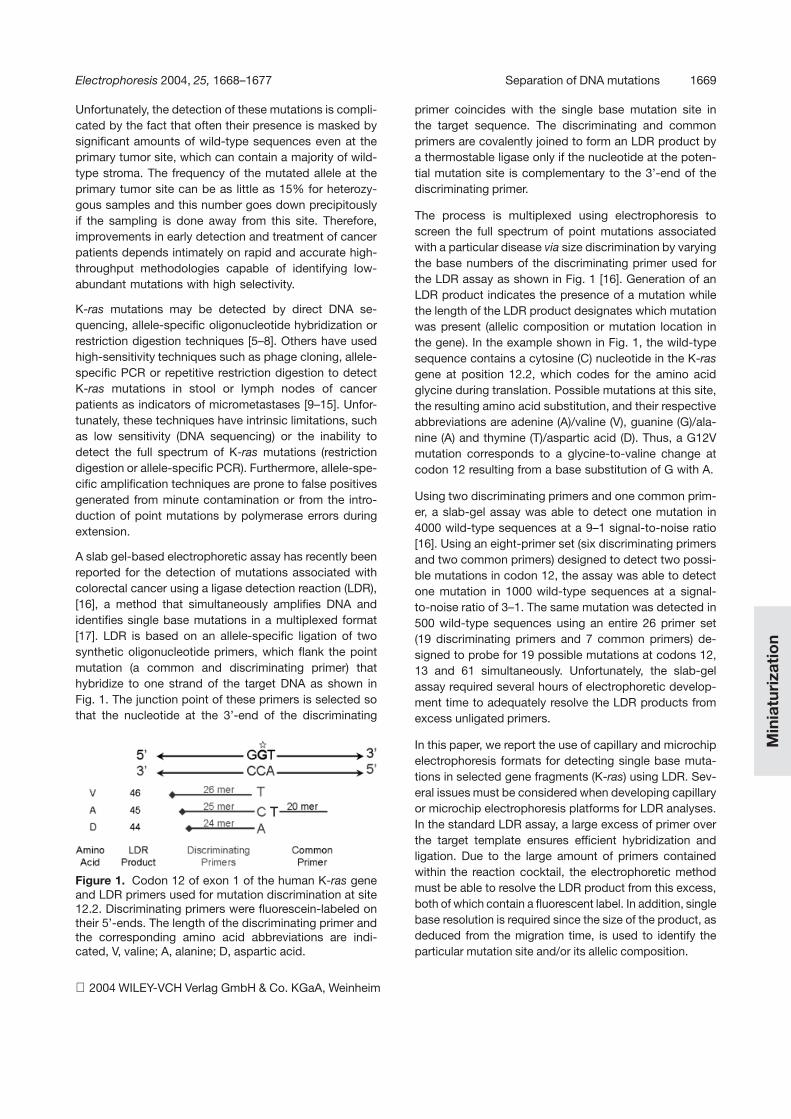
A slab gel-based electrophoretic assay has recently beenreported for the detection of mutations associated withcolorectal cancer using a ligase detection reaction (LDR),[16], a method that simultaneously amplifies DNA andidentifies single base mutations in a multiplexed format[17]. LDR is based on an allele-specific ligation of twosynthetic oligonucleotide primers, which flank the pointmutation (a common and discriminating primer) thathybridize to one strand of the target DNA as shown inFig. 1. The junction point of these primers is selected sothat the nucleotide at the 3’-end of the discriminating
Figure 1. Codon 12 of exon 1 of the human K-ras geneand LDR primers used for mutation discrimination at site12.2. Discriminating primers were fluorescein-labeled ontheir 5’-ends. The length of the discriminating primer andthe corresponding amino acid abbreviations are indi-cated, V, valine; A, alanine; D, aspartic acid.
primer coincides with the single base mutation site inthe target sequence. The discriminating and commonprimers are covalently joined to form an LDR product bya thermostable ligase only if the nucleotide at the poten-tial mutation site is complementary to the 3’-end of thediscriminating primer.
The process is multiplexed using electrophoresis toscreen the full spectrum of point mutations associatedwith a particular disease via size discrimination by varyingthe base numbers of the discriminating primer used forthe LDR assay as shown in Fig. 1 [16]. Generation of anLDR product indicates the presence of a mutation whilethe length of the LDR product designates which mutationwas present (allelic composition or mutation location inthe gene). In the example shown in Fig. 1, the wild-typesequence contains a cytosine (C) nucleotide in the K-rasgene at position 12.2, which codes for the amino acidglycine during translation. Possible mutations at this site,the resulting amino acid substitution, and their respectiveabbreviations are adenine (A)/valine (V), guanine (G)/ala-nine (A) and thymine (T)/aspartic acid (D). Thus, a G12Vmutation corresponds to a glycine-to-valine change atcodon 12 resulting from a base substitution of G with A.
Using two discriminating primers and one common prim-er, a slab-gel assay was able to detect one mutation in4000 wild-type sequences at a 9–1 signal-to-noise ratio[16]. Using an eight-primer set (six discriminating primersand two common primers) designed to detect two possi-ble mutations in codon 12, the assay was able to detectone mutation in 1000 wild-type sequences at a signal-to-noise ratio of 3–1. The same mutation was detected in500 wild-type sequences using an entire 26 primer set(19 discriminating primers and 7 common primers) de-signed to probe for 19 possible mutations at codons 12,13 and 61 simultaneously. Unfortunately, the slab-gelassay required several hours of electrophoretic develop-ment time to adequately resolve the LDR products fromexcess unligated primers.
In this paper, we report the use of capillary and microchipelectrophoresis formats for detecting single base muta-tions in selected gene fragments (K-ras) using LDR. Sev-eral issues must be considered when developing capillaryor microchip electrophoresis platforms for LDR analyses.In the standard LDR assay, a large excess of primer overthe target template ensures efficient hybridization andligation. Due to the large amount of primers containedwithin the reaction cocktail, the electrophoretic methodmust be able to resolve the LDR product from this excess,both of which contain a fluorescent label. In addition, singlebase resolution is required since the size of the product, asdeduced from the migration time, is used to identify theparticular mutation site and/or its allelic composition.
2004 WILEY-VCH Verlag GmbH & Co. KGaA, Weinheim
Min
iatu
riza
tio
n

1670 G. Thomas et al. Electrophoresis 2004, 25, 1668–1677
CGE can provide a method for the rapid analyses forLDR-based assays using a variety of different separationmatrices to provide sufficient resolution to detect the LDRproduct, even at low abundance. However, a concernassociated with this method is the well-characterizedinjection bias, in which high-mobility species, such asshort primers and salts, are loaded preferentially com-pared to slower migrating components. Therefore, highresolution must be achieved so as not to mask the LDRproducts in the large band generated from unligated prim-ers when these are much higher in concentration [18].In addition, injection biases can severely limit the loadingof the LDR products, demanding high sensitivity detec-tion as well. A final concern is the oligonucleotides thatmust be separated, which are single-stranded DNAs(ssDNAs) with a size range ,100 bp and as such, specialrequirements are demanded for the sieving matrix to pro-vide the necessary selectivity.
The microdevice format can potentially allow rapid analy-ses and reduced consumption of reagents, issues thatare important for high-throughput screening applications[19]. Compared to CGE, microelectrophoresis can pro-vide more representative loading of all fragment sizesthrough unbiased volume-based injections [20]. However,these devices also contain shorter separation lengths thathave the potential to limit resolution unless high-resolvingpower gels are used.
Using a K-ras mutation in codon 12 as a model, capillaryand microdevice electrophoresis methods were devel-oped to demonstrate the ability for analyzing point muta-tions in K-ras genes of low abundance with electropho-resis. Several ssDNA separation matrices in the capillaryand microdevice format were evaluated in a modelingstudy using synthetic dye-labeled oligonucleotides fortheir ability to analyze low copy numbers of long oligo-nucleotides (LDR products) in an excess of shorter oligo-nucleotides (unligated primers). Using the optimized con-ditions and separation matrices in both electrophoreticformats, PCR products generated from cell lines of knownK-ras genotype were used as templates for LDR to detectsingle base mutations in codon 12.
2 Materials and methods
2.1 Capillary electrophoresis instrumentation
CGE separations were performed using a Beckman P/ACESystem 5510 (Beckman Instruments, Fullerton, CA, USA).Data acquisition was performed using the Beckman P/ACEsoftware. Detection was accomplished using the appro-priate laser-induced fluorescence (LIF) module fitted intothe CE instrument, which contained an argon-ion laser(lex = 488 nm) and a 520 nm emission filter placed in front
of the photomultiplier tube. In all cases, the electropho-resis was performed in a reversed mode, with the detec-tion end anodic and the injection end cathodic.
2.2 Capillaries and sieving matrices
mPAGE-5 (5%T, 5%C) polyacrylamide gel-filled capillaries(referred to herein as 5T5C) and buffer were purchasedfrom Agilent Technologies (Palo Alto, CA, USA). The totalcapillary length was 36 cm while the effective length was30 cm; however, this length varied slightly from run to rundue to clipping of the inlet end of the capillary prior toeach run to restore column performance. The electric fieldstrength was set to 250 V/cm at an operating temperatureof 257C. A water preinjection of 10 s at 10 kV was used toincrease sample loading. Typical injection times rangedfrom 10 s to several minutes as indicated in each electro-phoretic trace. The eCap ssDNA 100-R gel (herein re-ferred to as eCap), buffer and neutrally coated capillary(75 mm ID) were purchased from Beckman Coulter (Fuller-ton, CA, USA). The optimized separation conditions forthe eCap were found to be 308 V/cm at 307C. The matrixwas replaced in the capillary (30 cm effective length,36 cm total length) prior to each run at approximately800 psi using a pressure vessel designed in-house. Theperformance-optimized polymer (herein referred to asPOP5) and buffer were obtained from Applied Biosystems(ABI, Foster City, CA, USA). The optimized field strengthfor this gel was determined to be 215 V/cm while thecapillary temperature was set to 507C. A bare fused-silicacapillary (75 mm ID, 30 cm effective length, 36 cm totallength) was filled with POP5 using approximately 1000 psipressure before each run.
2.3 Microdevice fabrication and assembly
The microdevice consisted of a 10 cm separation chan-nel with 0.5 cm side channels to the sample, buffer andwaste reservoirs as shown in Fig. 2A. The microchannelwas hot-embossed in poly(methylmethacrylate) (PMMA;MSC, Melville, NY, USA) using a Ni mold master contain-ing microstructures 80 mm tall and 20 mm wide (channeldimensions) that were produced by a lithography/electro-plating/molding (LIGA) process as described elsewhere[21]. The final device was assembled by annealing aPMMA cover plate to the open face of the device at1097C in a circulating air oven for 15 min.
2.4 LIF instrumentation
The LIF microdevice detection system was constructedin-house with an epillumination configuration, as shownin Fig. 2B. The system consisted of a 488 nm air-cool-
2004 WILEY-VCH Verlag GmbH & Co. KGaA, Weinheim

Electrophoresis 2004, 25, 1668–1677 Separation of DNA mutations 1671
Figure 2. (A) Geometrical lay-out of the microelectrophoresischip, which was fabricatedusing hot embossing from a Nimaster in PMMA. The chip con-tains four reservoirs, A = sam-ple, B = waste, C = buffer andD = buffer waste. The separationchannel was 10 cm in totallength with a channel widthof 20 mm and depth of 80 mm.(B) Picture of the LIF detectorfor the microchips.
ed argon-ion laser (Omnichrome, Chino, CA, USA; model532), which was directed to the focusing objective usinga multimode fiber optic and a dichroic mirror. The excita-tion beam was focused using a 166 microscope objec-tive (Melles Griot, Zevenaar, The Netherlands) onto themicrodevice, which was situated on an X-Y-Z micro-translational stage in order to position the microchannelwith respect to the focused laser beam. The fluorescenceemission was filtered through a stack of optical filters andfocused onto a single-photon avalanche diode (SPAD,model SPCM-AQ-141; EG&G Optoelectronics Canada,Vaudreuil, Canada). The filter stack consisted of a 520 nmbandpass filter (Oriel, Stratford, CT, USA) and a 520 nmlong-pass filter (Edmund Scientific, Barrington, NJ, USA).The LIF signals were acquired on a personal computerusing a 16-bit counter/timer board (model AT-MIO-16XE-50; National Instruments, Austin, TX, USA).
2.5 Microelectrophoresis operation
Labview software and an electrophoretic “switch box”constructed in-house were used to control voltages dur-ing the microelectrophoresis. The device included threeinternal high-voltage power supplies (EMCO, SutterCreek, CA, USA) capable of receiving input of 0 or 15 Vfrom DAC (digital-to-analog converter) outputs of a PCI-MIO-16XE-50 board (National Instruments). These powersupplies delivered 0 to 12 kV to wells (A) and (B) (EMCO;model C20); and 10.3 to 15 kV to well (D) (EMCO; model
G50) (see Fig. 2A). During injection, a positive voltage wasapplied to the waste well (B) (see Fig. 2A) while the samplewell (A) was grounded. During separation, a positive volt-age was applied to well (D), (C) was grounded and “pull-back voltages” were applied to the sample (A) and waste(B) reservoirs to prevent leakage of extraneous materialinto the separation channel. The microdevice was firstmanually filled with separation matrix. Following filling,the buffer and sample reservoirs were filled with the ap-propriate material. Once filled with the sieving matrix, thegel was preconditioned by electrophoresing for 5 minat 100 V/cm (voltage applied between reservoirs (C) and(D), see Fig. 2A). For the electrophoretic separation, theoptimized field strength for the appropriate sieving gelwas used as well as the appropriate pull-back voltageson the sample and waste reservoirs. In all cases, theelectrophoresis was performed in a reversed mode withthe injection end cathodic and the detection end anodic.
2.6 LDR primers, models, and DNA sizing ladder
All oligonucleotides used in this work were obtained fromIntegrated DNA Technologies (IDT, Coralville, IA, USA)with PAGE purification. Discriminating primers and LDRmodels contained fluorescein labeling at the 5’-end. LDRprimers were designed for identification of single basesubstitutions in codon 12.2 by altering the length of eachprimer as shown in Fig. 1. The discriminating primer forG12D was included in order to monitor commonly ob-
2004 WILEY-VCH Verlag GmbH & Co. KGaA, Weinheim
1672 G. Thomas et al. Electrophoresis 2004, 25, 1668–1677
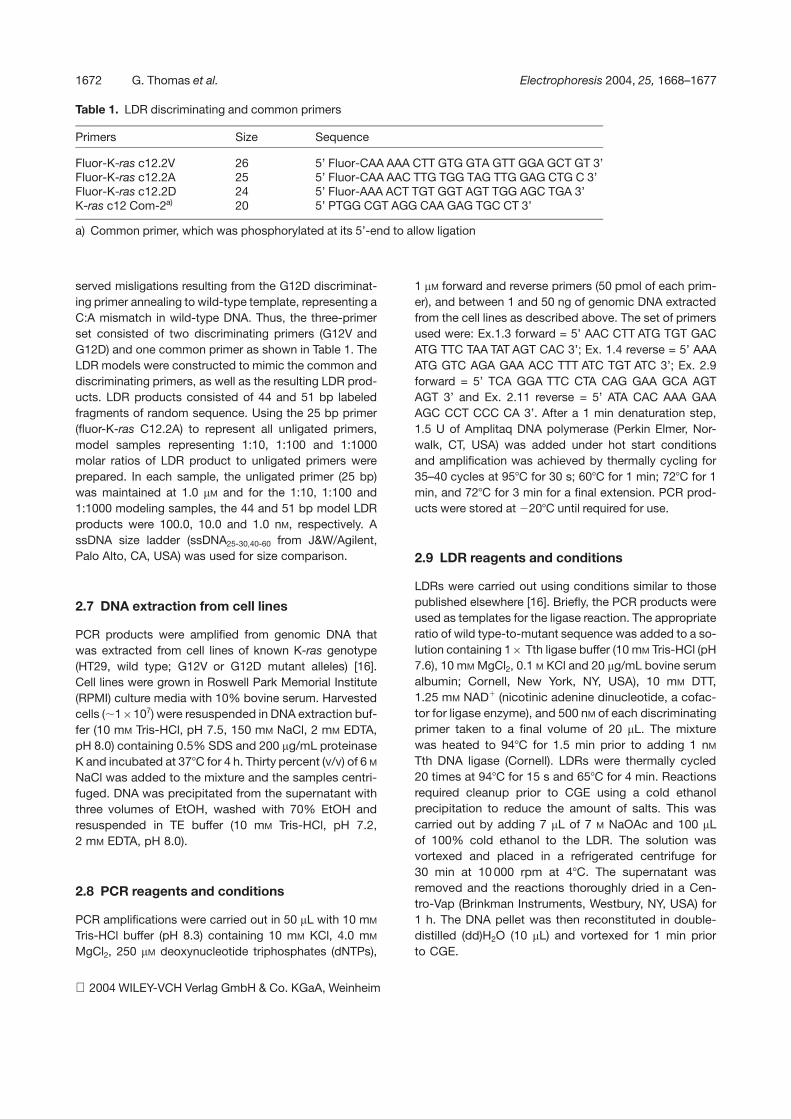
Table 1. LDR discriminating and common primers
Primers Size Sequence
Fluor-K-ras c12.2V 26 5’ Fluor-CAA AAA CTT GTG GTA GTT GGA GCT GT 3’Fluor-K-ras c12.2A 25 5’ Fluor-CAA AAC TTG TGG TAG TTG GAG CTG C 3’Fluor-K-ras c12.2D 24 5’ Fluor-AAA ACT TGT GGT AGT TGG AGC TGA 3’K-ras c12 Com-2a) 20 5’ PTGG CGT AGG CAA GAG TGC CT 3’
a) Common primer, which was phosphorylated at its 5’-end to allow ligation
served misligations resulting from the G12D discriminat-ing primer annealing to wild-type template, representing aC:A mismatch in wild-type DNA. Thus, the three-primerset consisted of two discriminating primers (G12V andG12D) and one common primer as shown in Table 1. TheLDR models were constructed to mimic the common anddiscriminating primers, as well as the resulting LDR prod-ucts. LDR products consisted of 44 and 51 bp labeledfragments of random sequence. Using the 25 bp primer(fluor-K-ras C12.2A) to represent all unligated primers,model samples representing 1:10, 1:100 and 1:1000molar ratios of LDR product to unligated primers wereprepared. In each sample, the unligated primer (25 bp)was maintained at 1.0 mM and for the 1:10, 1:100 and1:1000 modeling samples, the 44 and 51 bp model LDRproducts were 100.0, 10.0 and 1.0 nM, respectively. AssDNA size ladder (ssDNA25-30,40-60 from J&W/Agilent,Palo Alto, CA, USA) was used for size comparison.
2.7 DNA extraction from cell lines
PCR products were amplified from genomic DNA thatwas extracted from cell lines of known K-ras genotype(HT29, wild type; G12V or G12D mutant alleles) [16].Cell lines were grown in Roswell Park Memorial Institute(RPMI) culture media with 10% bovine serum. Harvestedcells (,16107) were resuspended in DNA extraction buf-fer (10 mM Tris-HCl, pH 7.5, 150 mM NaCl, 2 mM EDTA,pH 8.0) containing 0.5% SDS and 200 mg/mL proteinaseK and incubated at 377C for 4 h. Thirty percent (v/v) of 6 M
NaCl was added to the mixture and the samples centri-fuged. DNA was precipitated from the supernatant withthree volumes of EtOH, washed with 70% EtOH andresuspended in TE buffer (10 mM Tris-HCl, pH 7.2,2 mM EDTA, pH 8.0).
2.8 PCR reagents and conditions
PCR amplifications were carried out in 50 mL with 10 mM
Tris-HCl buffer (pH 8.3) containing 10 mM KCl, 4.0 mM
MgCl2, 250 mM deoxynucleotide triphosphates (dNTPs),
1 mM forward and reverse primers (50 pmol of each prim-er), and between 1 and 50 ng of genomic DNA extractedfrom the cell lines as described above. The set of primersused were: Ex.1.3 forward = 5’ AAC CTT ATG TGT GACATG TTC TAA TAT AGT CAC 3’; Ex. 1.4 reverse = 5’ AAAATG GTC AGA GAA ACC TTT ATC TGT ATC 3’; Ex. 2.9forward = 5’ TCA GGA TTC CTA CAG GAA GCA AGTAGT 3’ and Ex. 2.11 reverse = 5’ ATA CAC AAA GAAAGC CCT CCC CA 3’. After a 1 min denaturation step,1.5 U of Amplitaq DNA polymerase (Perkin Elmer, Nor-walk, CT, USA) was added under hot start conditionsand amplification was achieved by thermally cycling for35–40 cycles at 957C for 30 s; 607C for 1 min; 727C for 1min, and 727C for 3 min for a final extension. PCR prod-ucts were stored at 2207C until required for use.
2.9 LDR reagents and conditions
LDRs were carried out using conditions similar to thosepublished elsewhere [16]. Briefly, the PCR products wereused as templates for the ligase reaction. The appropriateratio of wild type-to-mutant sequence was added to a so-lution containing 16 Tth ligase buffer (10 mM Tris-HCl (pH7.6), 10 mM MgCl2, 0.1 M KCl and 20 mg/mL bovine serumalbumin; Cornell, New York, NY, USA), 10 mM DTT,1.25 mM NAD1 (nicotinic adenine dinucleotide, a cofac-tor for ligase enzyme), and 500 nM of each discriminatingprimer taken to a final volume of 20 mL. The mixturewas heated to 947C for 1.5 min prior to adding 1 nM
Tth DNA ligase (Cornell). LDRs were thermally cycled20 times at 947C for 15 s and 657C for 4 min. Reactionsrequired cleanup prior to CGE using a cold ethanolprecipitation to reduce the amount of salts. This wascarried out by adding 7 mL of 7 M NaOAc and 100 mLof 100% cold ethanol to the LDR. The solution wasvortexed and placed in a refrigerated centrifuge for30 min at 10 000 rpm at 47C. The supernatant wasremoved and the reactions thoroughly dried in a Cen-tro-Vap (Brinkman Instruments, Westbury, NY, USA) for1 h. The DNA pellet was then reconstituted in double-distilled (dd)H2O (10 mL) and vortexed for 1 min priorto CGE.
2004 WILEY-VCH Verlag GmbH & Co. KGaA, Weinheim

Electrophoresis 2004, 25, 1668–1677 Separation of DNA mutations 1673
3 Results and discussion
As described, modeling samples were made usingsynthetically generated DNA fragments labeled on their5’-ends with fluorescein to mimic LDR-generated prod-ucts in the presence of excess LDR primers. The fluor-K-ras C12.2A (25 bp) oligonucleotide was used at 10, 100and 1000 times molar excesses of the synthetic LDRproducts (44 and 51 bp oligonucleotides). Considering asample of one mutated DNA for every 20 wild-typesequences and an LDR cocktail consisting of three discri-minating primers (500 fmol each – 1500 fmol total), in20 thermocycles the enzymatic reaction can potentiallyyield 500 fmol of LDR product if 100% ligase efficiency isachieved using optimal conditions. Because 500 fmol ofdiscriminating primer (one allele) are consumed in thereaction, this results in a 1:2 ratio of LDR product to dis-criminating primer (500 fmol LDR product to 1000 fmoldiscriminating primer). In an 1:1000 (mutant:wild-type)sample, LDR should produce ,1:150 molar excess ofdiscriminating primer. If the ligation efficiency per cycle islower than 100%, the ratio of LDR product to unligatedprimers is much lower than that calculated here. In furtherimplementations, inclusion of a primer at known concen-tration as an internal standard, which corresponds towild-type sequence and results in a longer product thanthose expected here, would allow quantitation of the liga-tion efficiency and also an evaluation of injection biases.
Modeling samples were analyzed under optimized condi-tions for CGE using the 5T5C capillary, the POP5 separa-tion matrix and the eCap matrix. Efficiencies (plate num-bers) were calculated for the 25 bp discriminating primeras well as the 44 and 51 bp LDR models. Resolution wascalculated between the discriminating primer and the44 bp model, as well as between the 44 and 51 bpmodels. These results are summarized in Table 2.
3.1 Capillary 5T5C analysis of LDR models
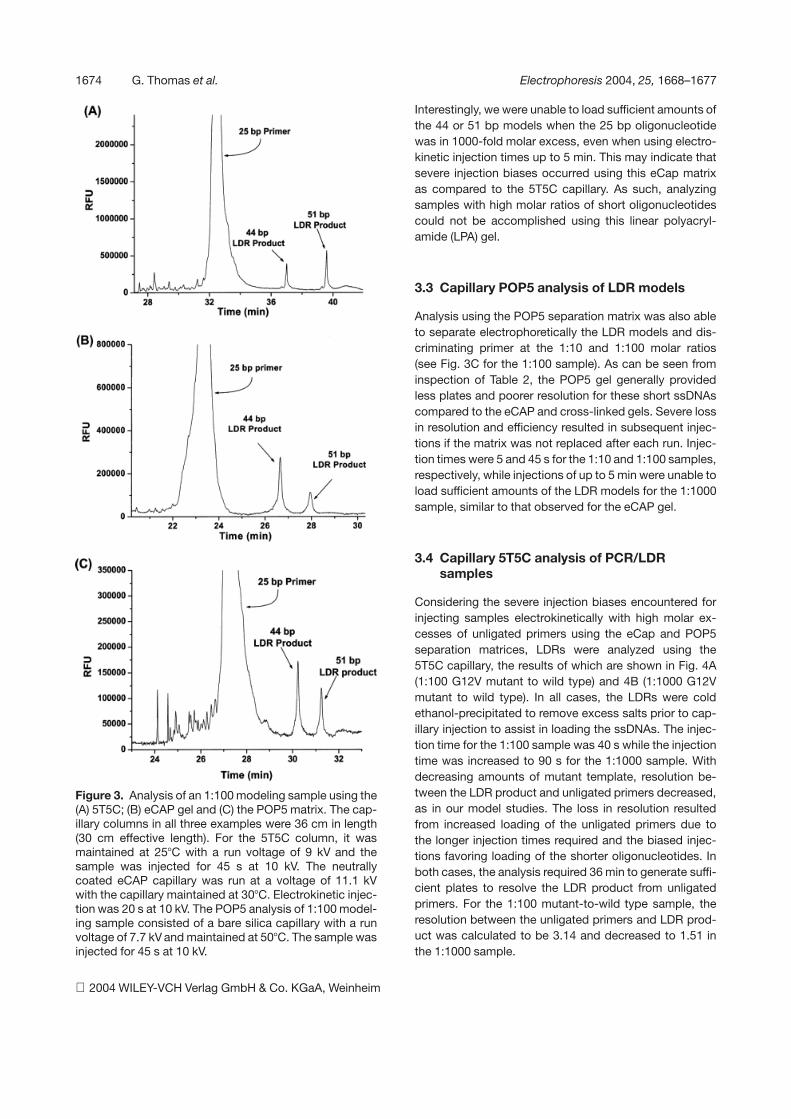
Using the 5T5C capillary, injection times required to loadsufficient amounts of the 44 and 51 bp models were 20,45 and 75 s for the 1:10, 1:100 and 1:1000 LDR productmodel-to-discriminating primer (25 bp) molar ratio, re-spectively. Baseline separation of all fragments wasachieved in less than 45 min as shown in Fig. 3A for the1:100 modeling sample. Efficiencies ranged from 16106
to 16105 plates m21. Inspection of the results shown inTable 2 indicate that the plate numbers decreased forthe 25 bp oligonucleotide with decreasing amounts ofthe 44 and 51 bp models due to longer injection timesused. This resulted in reduced resolution between the25 and 44 bp models. However, the opposite trend wasgenerally observed for the 44 and 51 bp models, with
Table 2. Results from model studies of an LDR assayusing 5T5C, eCap and POP5 matrices with CGE
N (6106) (plates/m) R
Disc LDR 44 LDR 51 Disc/44 LDR 44/51
5T5C1:10 0.54 0.97 1.01 18.04 10.031:100 0.35 1.12 1.21 16.29 12.061:1000 0.17 1.65 1.75 15.64 17.05
eCap1:10 0.58 0.56 0.43 18.78 4.561:100 0.45 0.69 0.92 13.06 7.40
POP51:10 0.13 0.10 0.14 9.44 1.871:100 0.05 0.73 1.08 5.46 5.57
Efficiency (plate numbers, N) was calculated for the 25(unligated primer model), and the 44 and 51 bp fragments(ligation product models). Resolution was calculated be-tween the 25 bp and 44 bp oligonucleotides as well as forthe 44 and 51 bp LDR product models
higher plate numbers observed as the molar ratio of25 bp oligonucleotide to the 44/51 bp models was in-creased.
A difficulty encountered when using this gel was therapid rate of column degradation, which appeared to bea result of longer injection times required to load sufficientamounts of the longer models of lower concentration fordetection. In addition, since the gel could not be removedfrom the capillary, the entire capillary needed to be re-placed following column failure. Manufacturer-suppliedinformation reported lifetimes greater than 20 h. However,in our case, we found that we could perform only 10 sepa-rations before the capillary displayed significant degrada-tion in performance (,10 h of operation).
3.2 Capillary eCap analysis of LDR models
Analysis using the eCap gel column provided baselineresolution of all fragments in less than 30 min. Similartrends in plate numbers and resolution were observedfor this gel matrix as that found with the 5T5C gel (seeTable 2), with higher excesses of the 25 bp oligonucleo-tide-producing reductions in the resolution between the25mer and 44 bp models as well as smaller plate numbersfor the 25 bp primer. The model LDR products were wellresolved in the 1:10 and 1:100 samples (R = 4.56 and7.40, respectively) and discrimination was possible fromthe excess primer as shown in Fig. 3B for the 1:100sample.
2004 WILEY-VCH Verlag GmbH & Co. KGaA, Weinheim
1674 G. Thomas et al. Electrophoresis 2004, 25, 1668–1677
Figure 3. Analysis of an 1:100 modeling sample using the(A) 5T5C; (B) eCAP gel and (C) the POP5 matrix. The cap-illary columns in all three examples were 36 cm in length(30 cm effective length). For the 5T5C column, it wasmaintained at 257C with a run voltage of 9 kV and thesample was injected for 45 s at 10 kV. The neutrallycoated eCAP capillary was run at a voltage of 11.1 kVwith the capillary maintained at 307C. Electrokinetic injec-tion was 20 s at 10 kV. The POP5 analysis of 1:100 model-ing sample consisted of a bare silica capillary with a runvoltage of 7.7 kV and maintained at 507C. The sample wasinjected for 45 s at 10 kV.
Interestingly, we were unable to load sufficient amounts ofthe 44 or 51 bp models when the 25 bp oligonucleotidewas in 1000-fold molar excess, even when using electro-kinetic injection times up to 5 min. This may indicate thatsevere injection biases occurred using this eCap matrixas compared to the 5T5C capillary. As such, analyzingsamples with high molar ratios of short oligonucleotidescould not be accomplished using this linear polyacryl-amide (LPA) gel.
3.3 Capillary POP5 analysis of LDR models
Analysis using the POP5 separation matrix was also ableto separate electrophoretically the LDR models and dis-criminating primer at the 1:10 and 1:100 molar ratios(see Fig. 3C for the 1:100 sample). As can be seen frominspection of Table 2, the POP5 gel generally providedless plates and poorer resolution for these short ssDNAscompared to the eCAP and cross-linked gels. Severe lossin resolution and efficiency resulted in subsequent injec-tions if the matrix was not replaced after each run. Injec-tion times were 5 and 45 s for the 1:10 and 1:100 samples,respectively, while injections of up to 5 min were unable toload sufficient amounts of the LDR models for the 1:1000sample, similar to that observed for the eCAP gel.
3.4 Capillary 5T5C analysis of PCR/LDRsamples
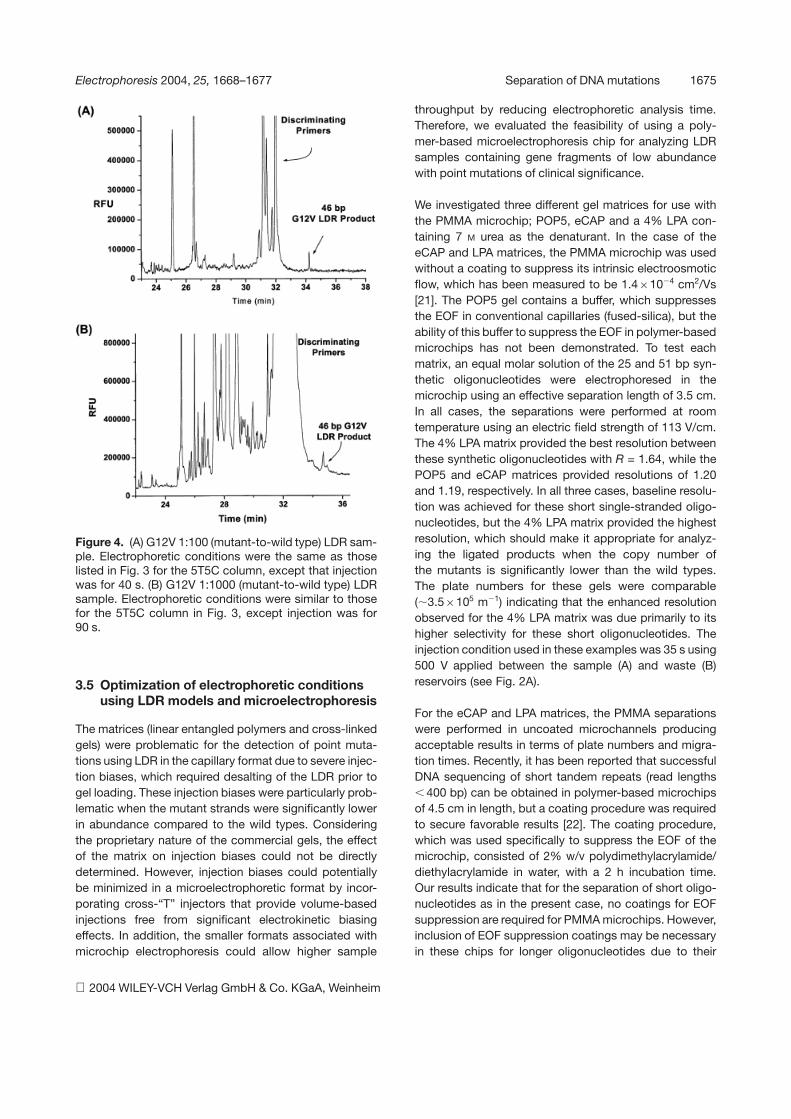
Considering the severe injection biases encountered forinjecting samples electrokinetically with high molar ex-cesses of unligated primers using the eCap and POP5separation matrices, LDRs were analyzed using the5T5C capillary, the results of which are shown in Fig. 4A(1:100 G12V mutant to wild type) and 4B (1:1000 G12Vmutant to wild type). In all cases, the LDRs were coldethanol-precipitated to remove excess salts prior to cap-illary injection to assist in loading the ssDNAs. The injec-tion time for the 1:100 sample was 40 s while the injectiontime was increased to 90 s for the 1:1000 sample. Withdecreasing amounts of mutant template, resolution be-tween the LDR product and unligated primers decreased,as in our model studies. The loss in resolution resultedfrom increased loading of the unligated primers due tothe longer injection times required and the biased injec-tions favoring loading of the shorter oligonucleotides. Inboth cases, the analysis required 36 min to generate suffi-cient plates to resolve the LDR product from unligatedprimers. For the 1:100 mutant-to-wild type sample, theresolution between the unligated primers and LDR prod-uct was calculated to be 3.14 and decreased to 1.51 inthe 1:1000 sample.
2004 WILEY-VCH Verlag GmbH & Co. KGaA, Weinheim
Electrophoresis 2004, 25, 1668–1677 Separation of DNA mutations 1675
Figure 4. (A) G12V 1:100 (mutant-to-wild type) LDR sam-ple. Electrophoretic conditions were the same as thoselisted in Fig. 3 for the 5T5C column, except that injectionwas for 40 s. (B) G12V 1:1000 (mutant-to-wild type) LDRsample. Electrophoretic conditions were similar to thosefor the 5T5C column in Fig. 3, except injection was for90 s.
3.5 Optimization of electrophoretic conditionsusing LDR models and microelectrophoresis
The matrices (linear entangled polymers and cross-linkedgels) were problematic for the detection of point muta-tions using LDR in the capillary format due to severe injec-tion biases, which required desalting of the LDR prior togel loading. These injection biases were particularly prob-lematic when the mutant strands were significantly lowerin abundance compared to the wild types. Consideringthe proprietary nature of the commercial gels, the effectof the matrix on injection biases could not be directlydetermined. However, injection biases could potentiallybe minimized in a microelectrophoretic format by incor-porating cross-“T” injectors that provide volume-basedinjections free from significant electrokinetic biasingeffects. In addition, the smaller formats associated withmicrochip electrophoresis could allow higher sample
throughput by reducing electrophoretic analysis time.Therefore, we evaluated the feasibility of using a poly-mer-based microelectrophoresis chip for analyzing LDRsamples containing gene fragments of low abundancewith point mutations of clinical significance.
We investigated three different gel matrices for use withthe PMMA microchip; POP5, eCAP and a 4% LPA con-taining 7 M urea as the denaturant. In the case of theeCAP and LPA matrices, the PMMA microchip was usedwithout a coating to suppress its intrinsic electroosmoticflow, which has been measured to be 1.461024 cm2/Vs[21]. The POP5 gel contains a buffer, which suppressesthe EOF in conventional capillaries (fused-silica), but theability of this buffer to suppress the EOF in polymer-basedmicrochips has not been demonstrated. To test eachmatrix, an equal molar solution of the 25 and 51 bp syn-thetic oligonucleotides were electrophoresed in themicrochip using an effective separation length of 3.5 cm.In all cases, the separations were performed at roomtemperature using an electric field strength of 113 V/cm.The 4% LPA matrix provided the best resolution betweenthese synthetic oligonucleotides with R = 1.64, while thePOP5 and eCAP matrices provided resolutions of 1.20and 1.19, respectively. In all three cases, baseline resolu-tion was achieved for these short single-stranded oligo-nucleotides, but the 4% LPA matrix provided the highestresolution, which should make it appropriate for analyz-ing the ligated products when the copy number ofthe mutants is significantly lower than the wild types.The plate numbers for these gels were comparable(,3.56105 m21) indicating that the enhanced resolutionobserved for the 4% LPA matrix was due primarily to itshigher selectivity for these short oligonucleotides. Theinjection condition used in these examples was 35 s using500 V applied between the sample (A) and waste (B)reservoirs (see Fig. 2A).
For the eCAP and LPA matrices, the PMMA separationswere performed in uncoated microchannels producingacceptable results in terms of plate numbers and migra-tion times. Recently, it has been reported that successfulDNA sequencing of short tandem repeats (read lengths,400 bp) can be obtained in polymer-based microchipsof 4.5 cm in length, but a coating procedure was requiredto secure favorable results [22]. The coating procedure,which was used specifically to suppress the EOF of themicrochip, consisted of 2% w/v polydimethylacrylamide/diethylacrylamide in water, with a 2 h incubation time.Our results indicate that for the separation of short oligo-nucleotides as in the present case, no coatings for EOFsuppression are required for PMMA microchips. However,inclusion of EOF suppression coatings may be necessaryin these chips for longer oligonucleotides due to their
2004 WILEY-VCH Verlag GmbH & Co. KGaA, Weinheim
1676 G. Thomas et al. Electrophoresis 2004, 25, 1668–1677
smaller apparent electrophoretic mobilities. In addition,the results obtained by the eCAP and POP5 gels weresimilar to each other in terms of their plate numbers andmigration times indicating that the POP5 gel and its buffersystem may not possess dynamic coating capabilities inpolymer microchips as they do for fused-silica capillaries.This conclusion is not too surprising given the differencesin surface chemistries between these materials.
Care was taken to optimize the injection conditions aswell to prevent significant band broadening resulting fromsample leakage into the separation channel while at thesame time allowing complete filling of the fixed volumeinjector of the shorter oligonucleotide (i.e., LDR product).It was found that injections less than 15 s (using a 500 Vinjection voltage) were insufficient for entirely filling theinjection cross with the sample while injections longerthan 25 s resulted in excessive band broadening asnoticed by reductions in plate numbers. Using optimizedinjection conditions (tinj = 20 s; V = 500 V), an effectiveseparation length of only 3.5 cm provided sufficient effi-ciencies (N = 1.516106 and 1.676106 plates m21, forthe 25 and 51 bp oligonucleotides, respectively) to ade-quately resolve the generated LDR product from unligat-ed primers even when the mutant allele was in low copynumber compared to the wild type.
3.6 Microchip electrophoresis of LDR samples
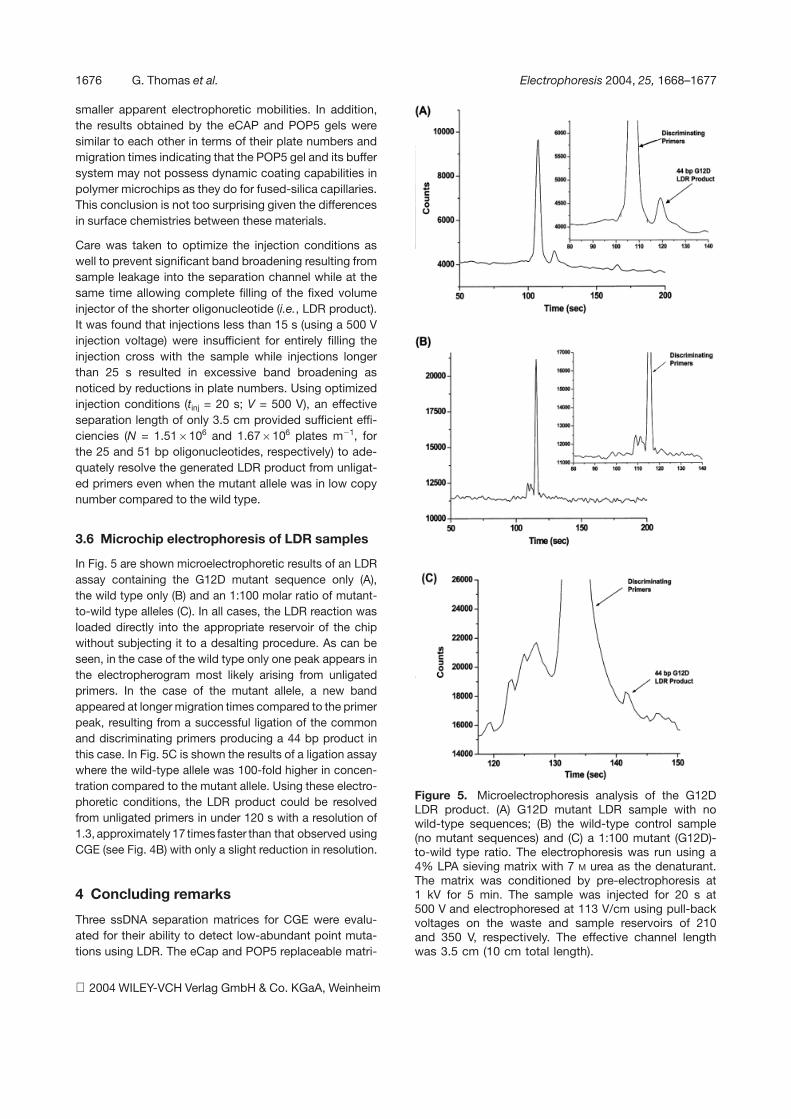
In Fig. 5 are shown microelectrophoretic results of an LDRassay containing the G12D mutant sequence only (A),the wild type only (B) and an 1:100 molar ratio of mutant-to-wild type alleles (C). In all cases, the LDR reaction wasloaded directly into the appropriate reservoir of the chipwithout subjecting it to a desalting procedure. As can beseen, in the case of the wild type only one peak appears inthe electropherogram most likely arising from unligatedprimers. In the case of the mutant allele, a new bandappeared at longer migration times compared to the primerpeak, resulting from a successful ligation of the commonand discriminating primers producing a 44 bp product inthis case. In Fig. 5C is shown the results of a ligation assaywhere the wild-type allele was 100-fold higher in concen-tration compared to the mutant allele. Using these electro-phoretic conditions, the LDR product could be resolvedfrom unligated primers in under 120 s with a resolution of1.3, approximately 17 times faster than that observed usingCGE (see Fig. 4B) with only a slight reduction in resolution.
4 Concluding remarks
Three ssDNA separation matrices for CGE were evalu-ated for their ability to detect low-abundant point muta-tions using LDR. The eCap and POP5 replaceable matri-
Figure 5. Microelectrophoresis analysis of the G12DLDR product. (A) G12D mutant LDR sample with nowild-type sequences; (B) the wild-type control sample(no mutant sequences) and (C) a 1:100 mutant (G12D)-to-wild type ratio. The electrophoresis was run using a4% LPA sieving matrix with 7 M urea as the denaturant.The matrix was conditioned by pre-electrophoresis at1 kV for 5 min. The sample was injected for 20 s at500 V and electrophoresed at 113 V/cm using pull-backvoltages on the waste and sample reservoirs of 210and 350 V, respectively. The effective channel lengthwas 3.5 cm (10 cm total length).
2004 WILEY-VCH Verlag GmbH & Co. KGaA, Weinheim

Electrophoresis 2004, 25, 1668–1677 Separation of DNA mutations 1677
ces provided successful separation of model LDR prod-ucts at 1:10 and 1:100 molar ratios to the synthetic unli-gated model primers with sufficient resolution in less than35 min, but with lower resolution compared to the 5T5Ccross-linked gels. The eCap matrix required a neutrallycoated capillary to suppress the EOF or prevent solute-wall interactions, which would adversely affect electro-phoretic efficiency. The POP5 gel provided dynamic coat-ing capabilities of the capillary that permitted use of abare fused-silica capillary with no pretreatment neces-sary. While these gels provided baseline resolution forthese model LDR samples of relatively low molar excessof unligated model primers, they suffered from severeinjection biases and appeared inadequate for the detec-tion of samples containing a 1000-fold molar excess ofunligated primer. Under the conditions listed here, suffi-cient loading of the LDR products was not possible.
The 5T5C cross-linked capillary provided analysis ofmolar ratios up to 1:1000 of LDR product to unligatedprimers with better resolution and efficiency as comparedto the eCap and POP5 matrices; however, increased col-umn deterioration resulted from unusually long injectionsrequired to sufficiently load LDR products. The covalentbonding of the polyacrylamide to the capillary wall pre-vented matrix replacement.
Microchip electrophoresis using uncoated polymer sub-strates demonstrated potential for providing rapid analy-ses of LDR products. The volume-based injection asso-ciated with these formats have been shown to providerepresentative loading of various-sized DNA fragmentswhere electrokinetic injection in capillaries are subjectto biases favoring high-mobility fragments and salts [20].Initial microdevice separations using a 4% LPA separa-tion matrix were favorable in providing high-efficiencyseparations with adequate resolution in the size range ofinterest in as little as 120 s, nearly 17 times faster thancapillary gel formats. In addition, sample processing priorto the electrophoresis was simplified by eliminating theneed of desalting using ethanol precipitation or othersimilar techniques.
The authors would like to thank the National Institutes ofHealth (R24-CA068425), the Louisiana Board of Regents(doctoral fellowship – G. Thomas) and the American Asso-ciation of University Women (American dissertation fel-lowship – G. Thomas) for financial support of this work.The authors would also like to thank Prof. Isiah Warner(LSU) for the loan of the Beckman electrophoresis instru-ment used in this work.
Received December 22, 2003
5 References
[1] Capella, G., Cronauermitra, S., Peinado, M. A., Perucho, M.,Environ. Health Perspect. 1991, 93, 125–131.
[2] Finkelstein, S. D., Sayegh, R., Bakker, A., Swalsky, P.,Steele, G. D., Foster, R. S., McKhann, C. F., Butsch, D. W.,Arch. Surg. 1993, 128, 526–532.
[3] Bos, J. L., Mutat. Res. 1988, 195, 255–271.
[4] Breivik, J., Meling, G. I., Spurkland, A., Rognum, T. O., Gau-dernack, G., Brit. J. Cancer 1994, 69, 367–371.
[5] Chen, J., Thilly, W., Anal. Biochem. 1991, 195, 51–56.
[6] Kahn, S., Jiang, W., Culbertson, T., Weinstein, B., Williams,G., Tomita, N., Ronai, Z., Oncogene 1991, 6, 1079–1083.
[7] DiGiuseppe, J. D., Hruban, R., Offerhaus, G., Clement, M.,van den Berg, R., Cameron, J., von Mansfeld, A., Am. J.Pathol. 1994, 144, 889–895.
[8] Levi, S., Urbano-Ispizua, A., Gill, R., Thomas, D., Gilbertson,J., Foster, C., Marshall, C., Cancer Res. 1991, 51, 3497–3502.
[9] Sidransky, D., Tokino, T., Hamilton, S., Kinzler, K., Levin, B.,Frost, P., Vogelstein, B., Science 1992, 256, 102–105.
[10] Haliassos, A., Chomel, J., Grandjouan, S., Kruh, J., Kaplan,J., Kitzis, A., Nucleic Acids Res. 1989, 17, 8093–8099.
[11] Hayashi, N., Arakawa, H., Nagase, H., Yanagisawa, A., Kato,Y., Ohta, H., Takano, S., Ogawa, M., Nakamura, Y., CancerRes. 1994, 54, 3850–3856.
[12] Jacobson, D., Moskovits, T., PCR Methods Appl. 1992, 1,299.
[13] Hayashi, N., Ito, I., Yanagisawa, A., Kato, Y., Nakamori, S.,Imaoka, S., Watanabe, H., Ogawa, M., Nakamura, Y., Lancet1995, 345, 1257–1259.
[14] Caldas, C., Hahn, S., Hruban, R., Redston, M., Yeo, C.,Kern, S., Cancer Res. 1994, 54, 3568–3573.
[15] Cha, R., Zarbl, H., Keohavong, P., Thilly, W., PCR MethodsAppl. 1992, 2, 14–20.
[16] Khanna, M., Park, P., Zirvi, M., Cao, W. G., Picon, A., Day, J.,Paty, P., Barany, F., Oncogene 1999, 18, 27–38.
[17] Barany, F., PCR Methods Appl. 1991, 1, 5–16.
[18] Ruiz-Martinez, M. C., Salas-Solano, O., Carrilho, E., Kotler,L., Karger, B. L., Anal. Chem. 1998, 70, 1516–1527.
[19] Singh, S. M., Rodenhiser, D. I., Ott, R. N., Jung, J. H., Ains-worth, P. J., Biotechnol. Annu. Rev. 1996, 2, 409–437.
[20] Ehrlich, D. J., Matsudaira, P., Trends Biotechnol. 1999, 17,315–319.
[21] Ford, S. M., Kar, B., McWhorter, S., Davies, J., Soper, S. A.,Klopf, M., Calderon, G., Saile, V., J. Microcol. Sep. 1998, 10,413–422.
[22] Bae, Y. C., Soane, D., J. Chromatogr. 1993, 652, 17–22.
[23] Salas-Solano, O., Ruiz-Martinez, M. C., Carrilho, E., Kotler,L., Karger, B. L., Anal. Chem. 1998, 70, 1528–1535.
2004 WILEY-VCH Verlag GmbH & Co. KGaA, Weinheim