Embed Size (px)
DESCRIPTION
http://www.santacruzcountycap.org/pdfs/CAP%2017/CAP%2017%20RESULTS%20BY%20ETHNICITY.pdf
Citation preview
1
CAP 17 RESULTS BY ETHNICITY
1. Which of the following areas do you live in or live closest to?
CAUCASIAN LATINO OTHER
Aptos 9.7% 1.5% 6.3%
49 2 4
Capitola 5.7% 4.0% 7.4%
29 6 4
City of Santa Cruz 36.2% 18.4% 35.3%
182 30 20
City of Watsonville 9.6% 51.6% 17.1%
49 84 10
Corralitos 2.5% 5.7% 2.8%
13 9 2
Davenport/Bonny Doon 0.3% 0.0% 0.0%
2 0 0
Freedom 1.1% 9.1% 0.0%
5 15 0
La Selva 2.2% 0.0% 0.0%
11 0 0
Live Oak 5.3% 1.3% 10.6%
27 2 6
Pajaro 0.0% 2.7% 0.9%
0 4 1
San Lorenzo Valley 16.1% 3.0% 9.9%
81 5 5
Scotts Valley 6.4% 1.3% 3.7%
32 2 2
Soquel 4.8% 1.3% 6.1%
24 2 3
Other 0.0% 0.0% 0.0%
0 0 0
Total 100.0% 100.0% 100.0%
504 162 56
2
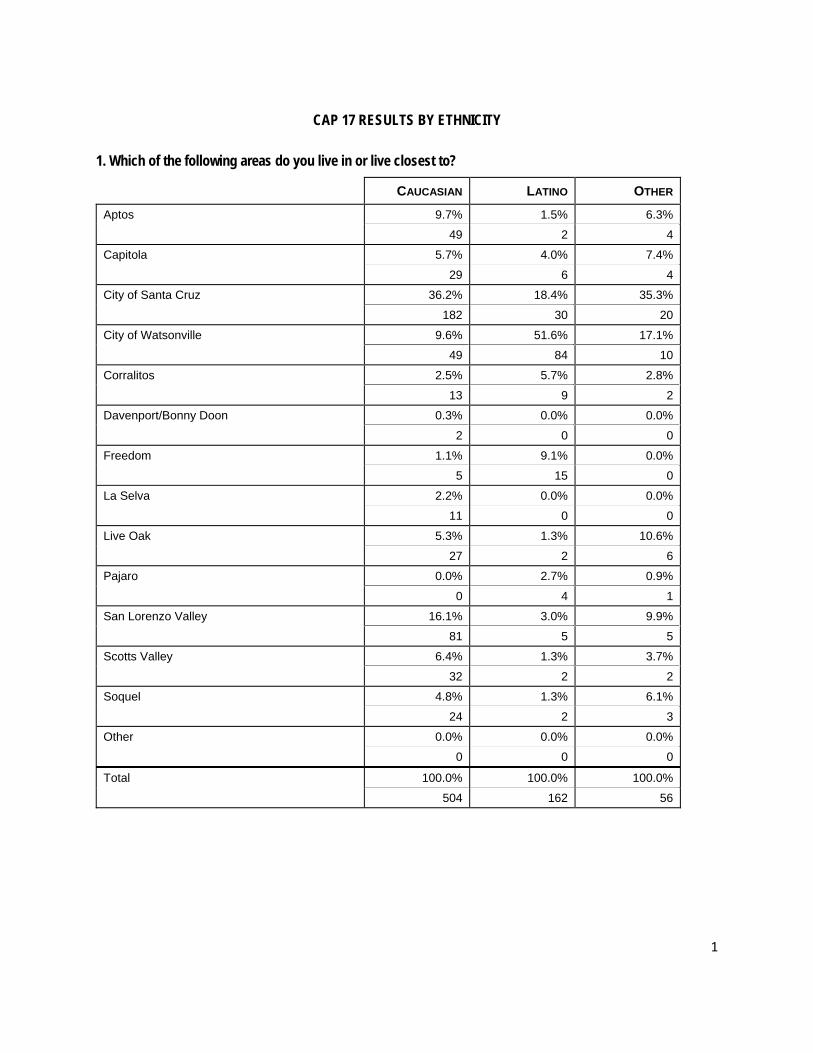
2 What is your zip code?
CAUCASIAN LATINO OTHER
95003 9.7% 1.5% 6.3%
49 2 4
95005 3.4% 0.0% 3.1%
17 0 2
95006 5.7% 1.9% 4.2%
29 3 2
95007 0.3% 0.0% 0.0%
2 0 0
95010 4.4% 1.3% 2.1%
22 2 1
95018 7.4% 1.1% 3.3%
37 2 2
95019 0.9% 4.9% 0.0%
4 8 0
95060 24.4% 13.2% 24.0%
123 21 13
95062 14.6% 5.2% 20.1%
74 8 11
95064 0.5% 0.0% 0.0%
3 0 0
95065 3.1% 4.0% 6.9%
15 6 4
95066 6.4% 1.3% 2.9%
32 2 2
95073 4.8% 1.3% 6.1%
24 2 3
95076 14.5% 64.3% 19.6%
73 104 11
95077 0.0% 0.0% 1.2%
0 0 1
Total 100.0% 100.0% 100.0%
504 162 56
3
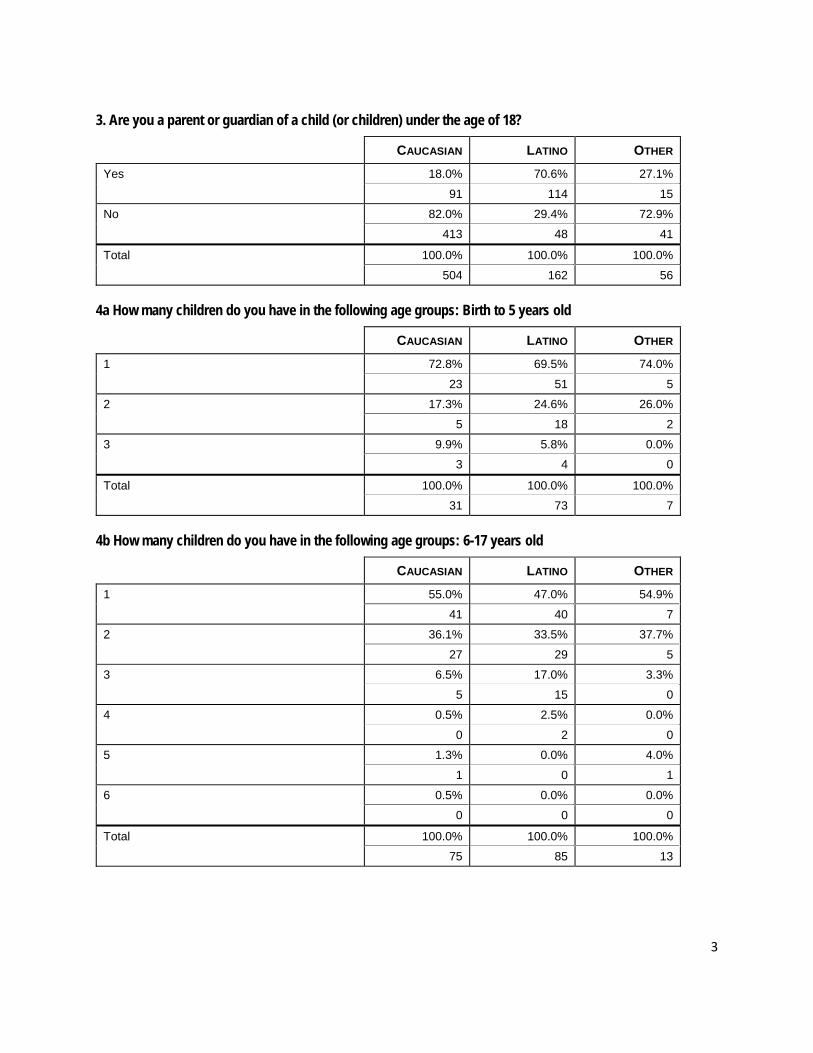
3. Are you a parent or guardian of a child (or children) under the age of 18?
CAUCASIAN LATINO OTHER
Yes 18.0% 70.6% 27.1%
91 114 15
No 82.0% 29.4% 72.9%
413 48 41
Total 100.0% 100.0% 100.0%
504 162 56
4a How many children do you have in the following age groups: Birth to 5 years old
CAUCASIAN LATINO OTHER
1 72.8% 69.5% 74.0%
23 51 5
2 17.3% 24.6% 26.0%
5 18 2
3 9.9% 5.8% 0.0%
3 4 0
Total 100.0% 100.0% 100.0%
31 73 7
4b How many children do you have in the following age groups: 6-17 years old
CAUCASIAN LATINO OTHER
1 55.0% 47.0% 54.9%
41 40 7
2 36.1% 33.5% 37.7%
27 29 5
3 6.5% 17.0% 3.3%
5 15 0
4 0.5% 2.5% 0.0%
0 2 0
5 1.3% 0.0% 4.0%
1 0 1
6 0.5% 0.0% 0.0%
0 0 0
Total 100.0% 100.0% 100.0%
75 85 13
4
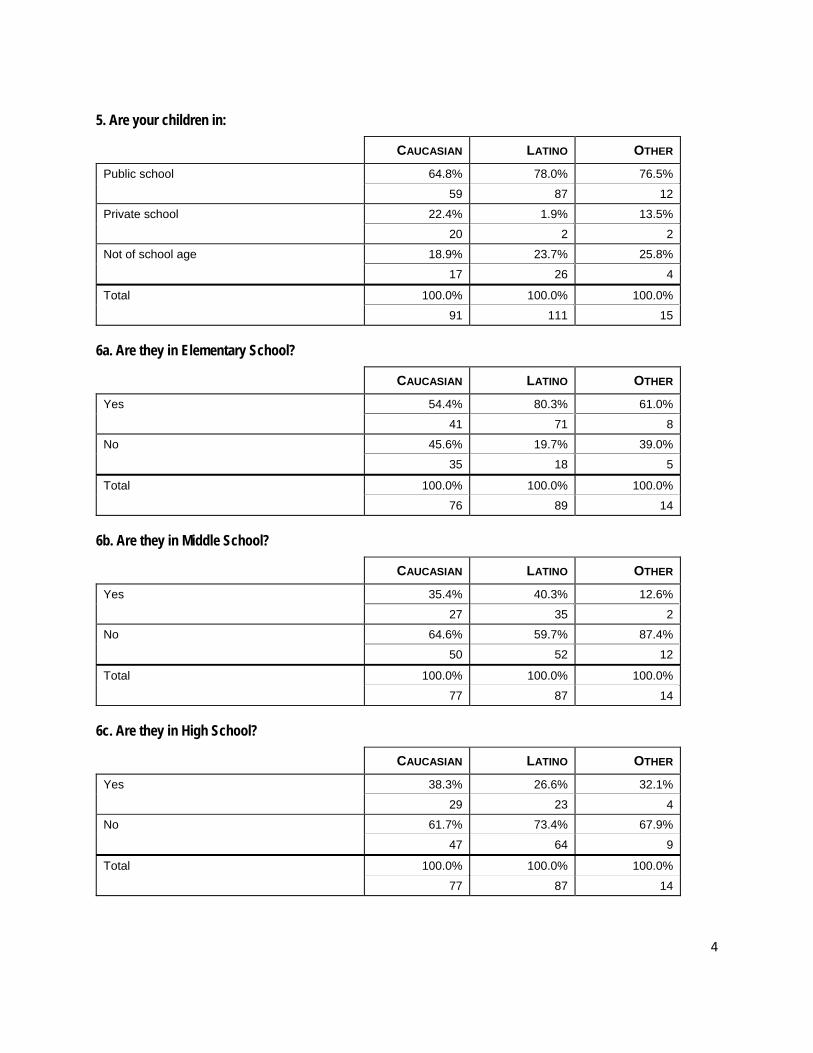
5. Are your children in:
CAUCASIAN LATINO OTHER
Public school 64.8% 78.0% 76.5%
59 87 12
Private school 22.4% 1.9% 13.5%
20 2 2
Not of school age 18.9% 23.7% 25.8%
17 26 4
Total 100.0% 100.0% 100.0%
91 111 15
6a. Are they in Elementary School?
CAUCASIAN LATINO OTHER
Yes 54.4% 80.3% 61.0%
41 71 8
No 45.6% 19.7% 39.0%
35 18 5
Total 100.0% 100.0% 100.0%
76 89 14
6b. Are they in Middle School?
CAUCASIAN LATINO OTHER
Yes 35.4% 40.3% 12.6%
27 35 2
No 64.6% 59.7% 87.4%
50 52 12
Total 100.0% 100.0% 100.0%
77 87 14
6c. Are they in High School?
CAUCASIAN LATINO OTHER
Yes 38.3% 26.6% 32.1%
29 23 4
No 61.7% 73.4% 67.9%
47 64 9
Total 100.0% 100.0% 100.0%
77 87 14
5
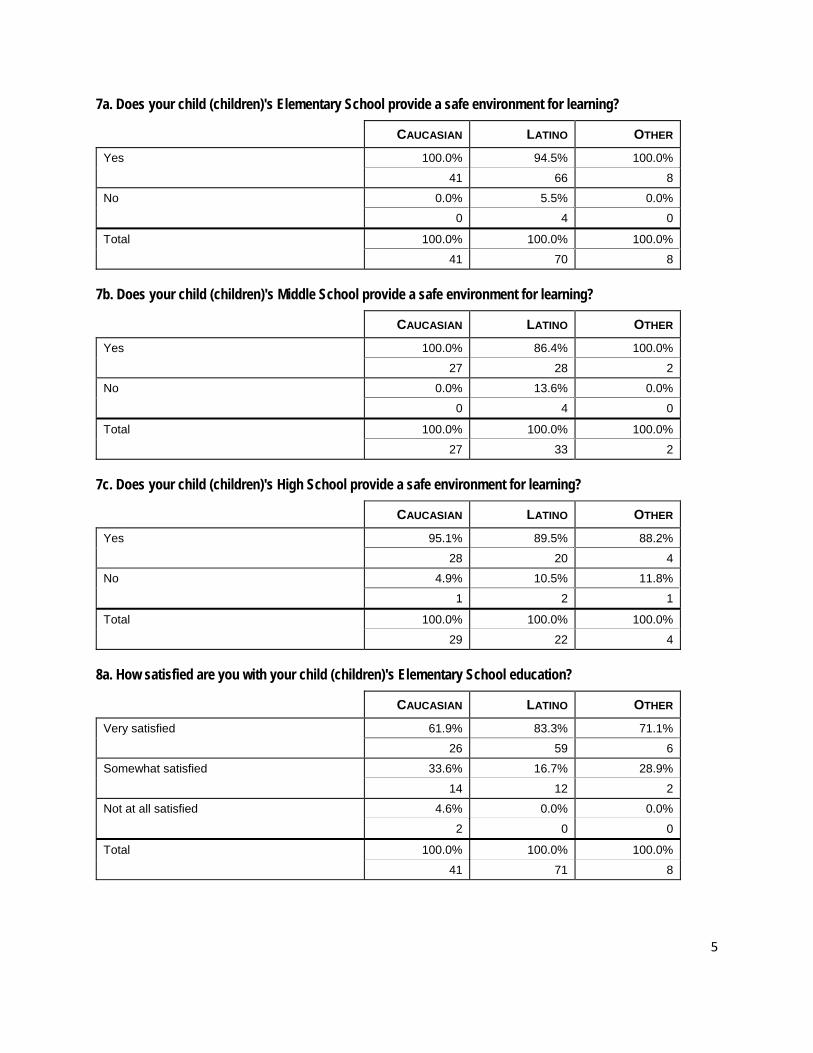
7a. Does your child (children)'s Elementary School provide a safe environment for learning?
CAUCASIAN LATINO OTHER
Yes 100.0% 94.5% 100.0%
41 66 8
No 0.0% 5.5% 0.0%
0 4 0
Total 100.0% 100.0% 100.0%
41 70 8
7b. Does your child (children)'s Middle School provide a safe environment for learning?
CAUCASIAN LATINO OTHER
Yes 100.0% 86.4% 100.0%
27 28 2
No 0.0% 13.6% 0.0%
0 4 0
Total 100.0% 100.0% 100.0%
27 33 2
7c. Does your child (children)'s High School provide a safe environment for learning?
CAUCASIAN LATINO OTHER
Yes 95.1% 89.5% 88.2%
28 20 4
No 4.9% 10.5% 11.8%
1 2 1
Total 100.0% 100.0% 100.0%
29 22 4
8a. How satisfied are you with your child (children)'s Elementary School education?
CAUCASIAN LATINO OTHER
Very satisfied 61.9% 83.3% 71.1%
26 59 6
Somewhat satisfied 33.6% 16.7% 28.9%
14 12 2
Not at all satisfied 4.6% 0.0% 0.0%
2 0 0
Total 100.0% 100.0% 100.0%
41 71 8
6
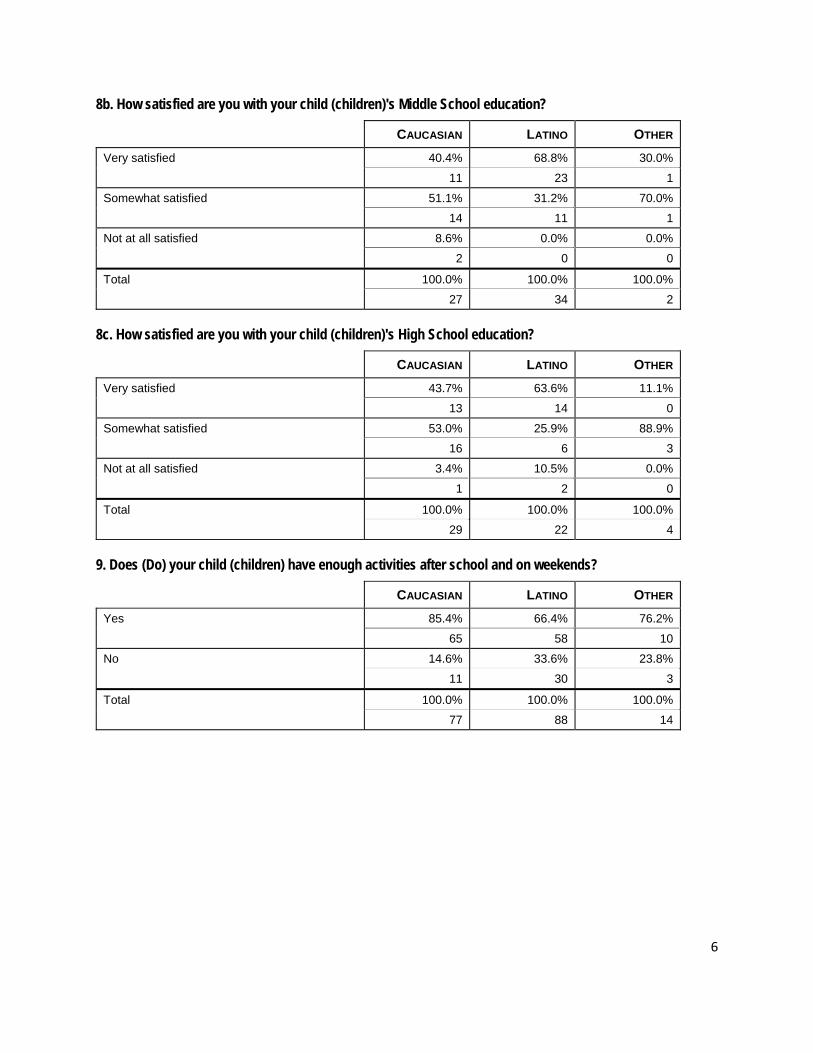
8b. How satisfied are you with your child (children)'s Middle School education?
CAUCASIAN LATINO OTHER
Very satisfied 40.4% 68.8% 30.0%
11 23 1
Somewhat satisfied 51.1% 31.2% 70.0%
14 11 1
Not at all satisfied 8.6% 0.0% 0.0%
2 0 0
Total 100.0% 100.0% 100.0%
27 34 2
8c. How satisfied are you with your child (children)'s High School education?
CAUCASIAN LATINO OTHER
Very satisfied 43.7% 63.6% 11.1%
13 14 0
Somewhat satisfied 53.0% 25.9% 88.9%
16 6 3
Not at all satisfied 3.4% 10.5% 0.0%
1 2 0
Total 100.0% 100.0% 100.0%
29 22 4
9. Does (Do) your child (children) have enough activities after school and on weekends?
CAUCASIAN LATINO OTHER
Yes 85.4% 66.4% 76.2%
65 58 10
No 14.6% 33.6% 23.8%
11 30 3
Total 100.0% 100.0% 100.0%
77 88 14
7
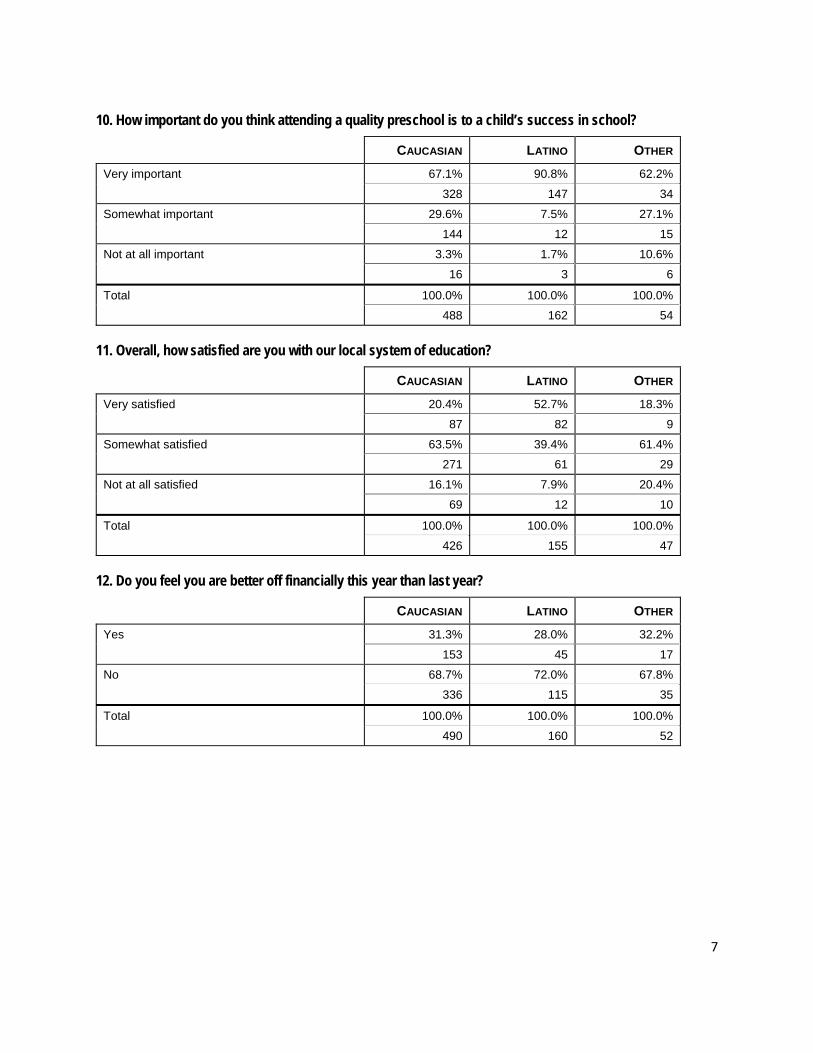
10. How important do you think attending a quality preschool is to a child’s success in school?
CAUCASIAN LATINO OTHER
Very important 67.1% 90.8% 62.2%
328 147 34
Somewhat important 29.6% 7.5% 27.1%
144 12 15
Not at all important 3.3% 1.7% 10.6%
16 3 6
Total 100.0% 100.0% 100.0%
488 162 54
11. Overall, how satisfied are you with our local system of education?
CAUCASIAN LATINO OTHER
Very satisfied 20.4% 52.7% 18.3%
87 82 9
Somewhat satisfied 63.5% 39.4% 61.4%
271 61 29
Not at all satisfied 16.1% 7.9% 20.4%
69 12 10
Total 100.0% 100.0% 100.0%
426 155 47
12. Do you feel you are better off financially this year than last year?
CAUCASIAN LATINO OTHER
Yes 31.3% 28.0% 32.2%
153 45 17
No 68.7% 72.0% 67.8%
336 115 35
Total 100.0% 100.0% 100.0%
490 160 52
8
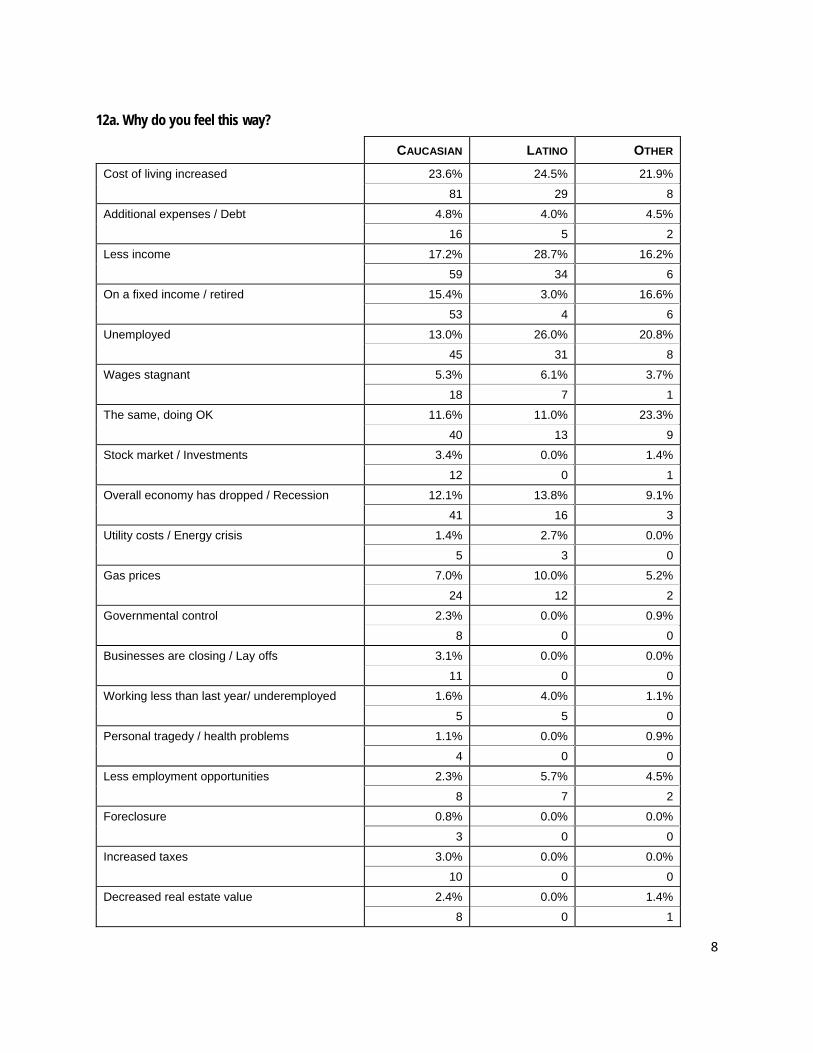
12a. Why do you feel this way?
CAUCASIAN LATINO OTHER
Cost of living increased 23.6% 24.5% 21.9%
81 29 8
Additional expenses / Debt 4.8% 4.0% 4.5%
16 5 2
Less income 17.2% 28.7% 16.2%
59 34 6
On a fixed income / retired 15.4% 3.0% 16.6%
53 4 6
Unemployed 13.0% 26.0% 20.8%
45 31 8
Wages stagnant 5.3% 6.1% 3.7%
18 7 1
The same, doing OK 11.6% 11.0% 23.3%
40 13 9
Stock market / Investments 3.4% 0.0% 1.4%
12 0 1
Overall economy has dropped / Recession 12.1% 13.8% 9.1%
41 16 3
Utility costs / Energy crisis 1.4% 2.7% 0.0%
5 3 0
Gas prices 7.0% 10.0% 5.2%
24 12 2
Governmental control 2.3% 0.0% 0.9%
8 0 0
Businesses are closing / Lay offs 3.1% 0.0% 0.0%
11 0 0
Working less than last year/ underemployed 1.6% 4.0% 1.1%
5 5 0
Personal tragedy / health problems 1.1% 0.0% 0.9%
4 0 0
Less employment opportunities 2.3% 5.7% 4.5%
8 7 2
Foreclosure 0.8% 0.0% 0.0%
3 0 0
Increased taxes 3.0% 0.0% 0.0%
10 0 0
Decreased real estate value 2.4% 0.0% 1.4%
8 0 1
9
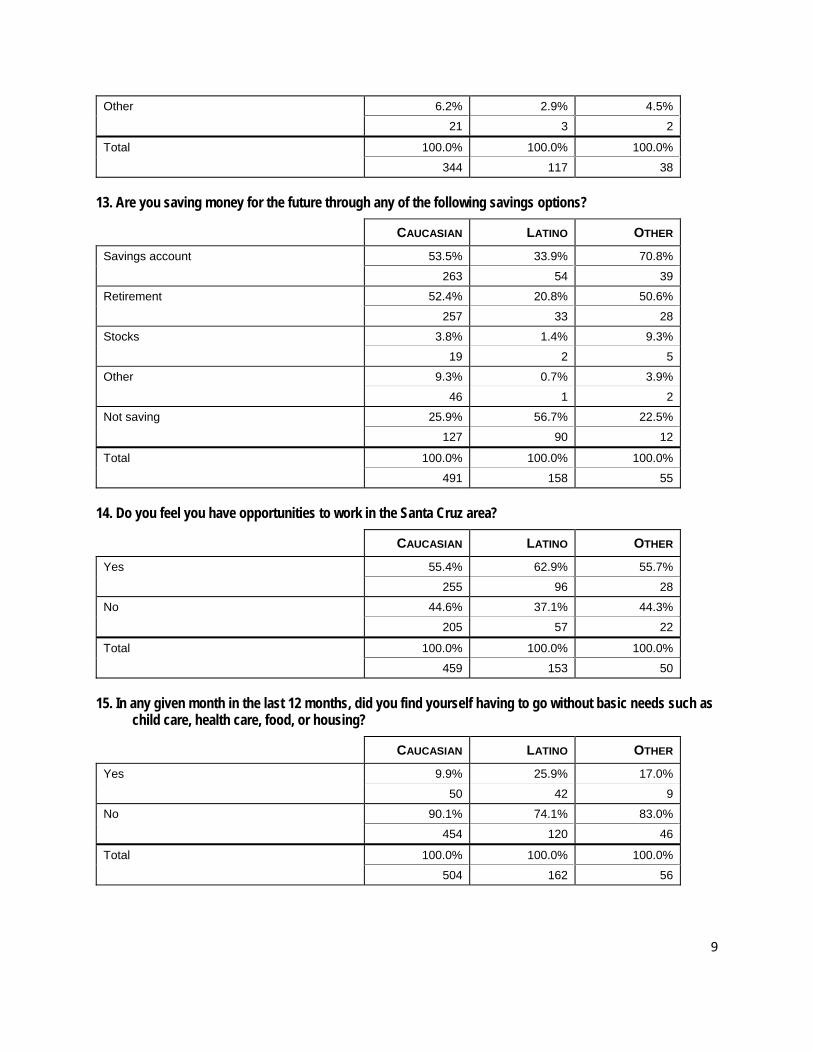
Other 6.2% 2.9% 4.5%
21 3 2
Total 100.0% 100.0% 100.0%
344 117 38
13. Are you saving money for the future through any of the following savings options?
CAUCASIAN LATINO OTHER
Savings account 53.5% 33.9% 70.8%
263 54 39
Retirement 52.4% 20.8% 50.6%
257 33 28
Stocks 3.8% 1.4% 9.3%
19 2 5
Other 9.3% 0.7% 3.9%
46 1 2
Not saving 25.9% 56.7% 22.5%
127 90 12
Total 100.0% 100.0% 100.0%
491 158 55
14. Do you feel you have opportunities to work in the Santa Cruz area?
CAUCASIAN LATINO OTHER
Yes 55.4% 62.9% 55.7%
255 96 28
No 44.6% 37.1% 44.3%
205 57 22
Total 100.0% 100.0% 100.0%
459 153 50
15. In any given month in the last 12 months, did you find yourself having to go without basic needs such as child care, health care, food, or housing?
CAUCASIAN LATINO OTHER
Yes 9.9% 25.9% 17.0%
50 42 9
No 90.1% 74.1% 83.0%
454 120 46
Total 100.0% 100.0% 100.0%
504 162 56
10
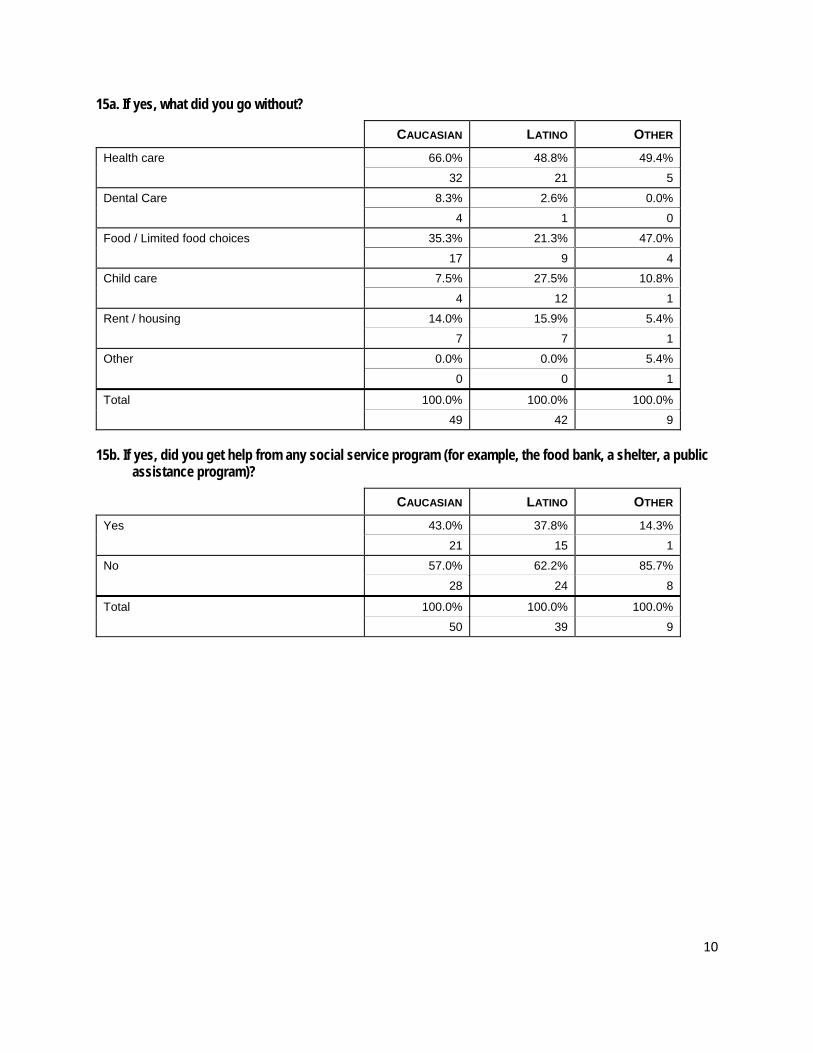
15a. If yes, what did you go without?
CAUCASIAN LATINO OTHER
Health care 66.0% 48.8% 49.4%
32 21 5
Dental Care 8.3% 2.6% 0.0%
4 1 0
Food / Limited food choices 35.3% 21.3% 47.0%
17 9 4
Child care 7.5% 27.5% 10.8%
4 12 1
Rent / housing 14.0% 15.9% 5.4%
7 7 1
Other 0.0% 0.0% 5.4%
0 0 1
Total 100.0% 100.0% 100.0%
49 42 9
15b. If yes, did you get help from any social service program (for example, the food bank, a shelter, a public assistance program)?
CAUCASIAN LATINO OTHER
Yes 43.0% 37.8% 14.3%
21 15 1
No 57.0% 62.2% 85.7%
28 24 8
Total 100.0% 100.0% 100.0%
50 39 9
11
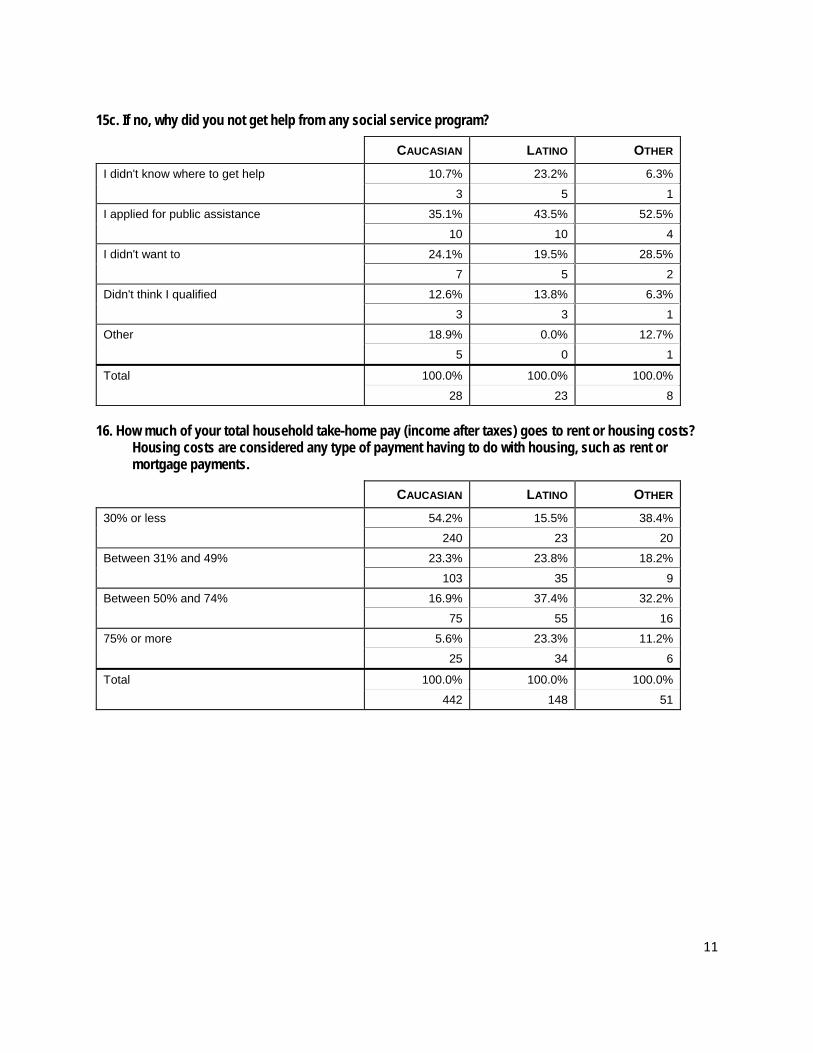
15c. If no, why did you not get help from any social service program?
CAUCASIAN LATINO OTHER
I didn't know where to get help 10.7% 23.2% 6.3%
3 5 1
I applied for public assistance 35.1% 43.5% 52.5%
10 10 4
I didn't want to 24.1% 19.5% 28.5%
7 5 2
Didn't think I qualified 12.6% 13.8% 6.3%
3 3 1
Other 18.9% 0.0% 12.7%
5 0 1
Total 100.0% 100.0% 100.0%
28 23 8
16. How much of your total household take-home pay (income after taxes) goes to rent or housing costs? Housing costs are considered any type of payment having to do with housing, such as rent or mortgage payments.
CAUCASIAN LATINO OTHER
30% or less 54.2% 15.5% 38.4%
240 23 20
Between 31% and 49% 23.3% 23.8% 18.2%
103 35 9
Between 50% and 74% 16.9% 37.4% 32.2%
75 55 16
75% or more 5.6% 23.3% 11.2%
25 34 6
Total 100.0% 100.0% 100.0%
442 148 51
12
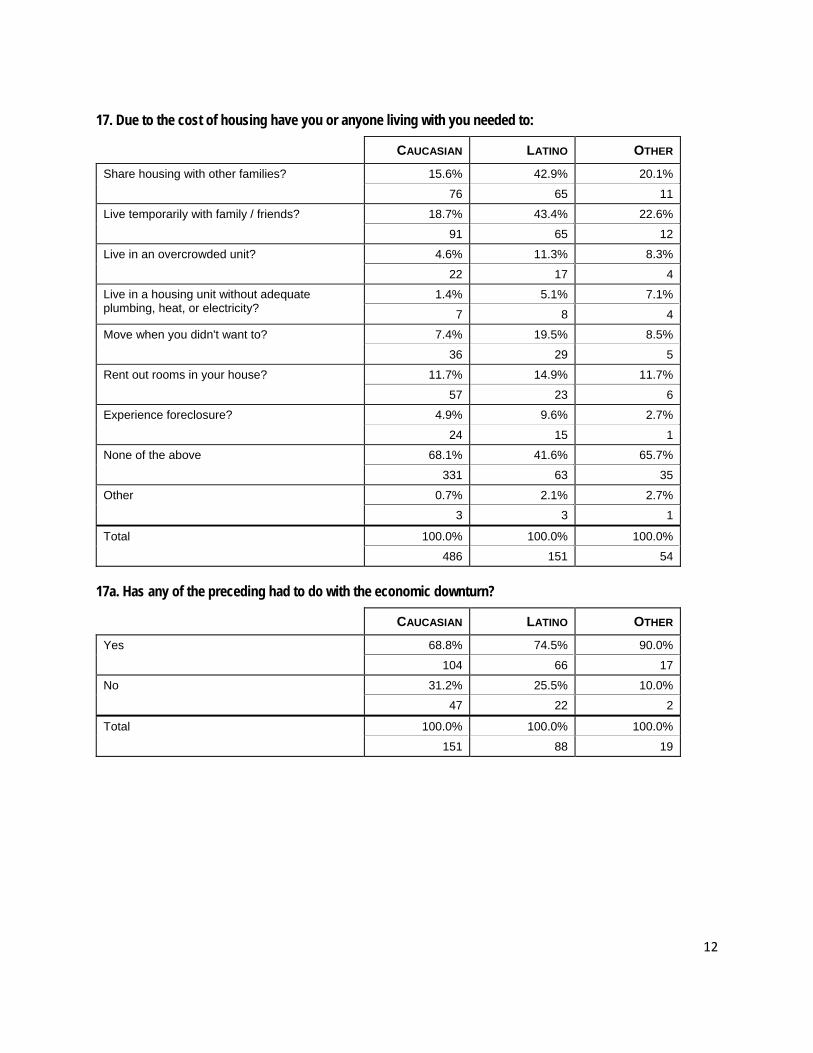
17. Due to the cost of housing have you or anyone living with you needed to:
CAUCASIAN LATINO OTHER
Share housing with other families? 15.6% 42.9% 20.1%
76 65 11
Live temporarily with family / friends? 18.7% 43.4% 22.6%
91 65 12
Live in an overcrowded unit? 4.6% 11.3% 8.3%
22 17 4
Live in a housing unit without adequate plumbing, heat, or electricity?
1.4% 5.1% 7.1%
7 8 4
Move when you didn't want to? 7.4% 19.5% 8.5%
36 29 5
Rent out rooms in your house? 11.7% 14.9% 11.7%
57 23 6
Experience foreclosure? 4.9% 9.6% 2.7%
24 15 1
None of the above 68.1% 41.6% 65.7%
331 63 35
Other 0.7% 2.1% 2.7%
3 3 1
Total 100.0% 100.0% 100.0%
486 151 54
17a. Has any of the preceding had to do with the economic downturn?
CAUCASIAN LATINO OTHER
Yes 68.8% 74.5% 90.0%
104 66 17
No 31.2% 25.5% 10.0%
47 22 2
Total 100.0% 100.0% 100.0%
151 88 19
13
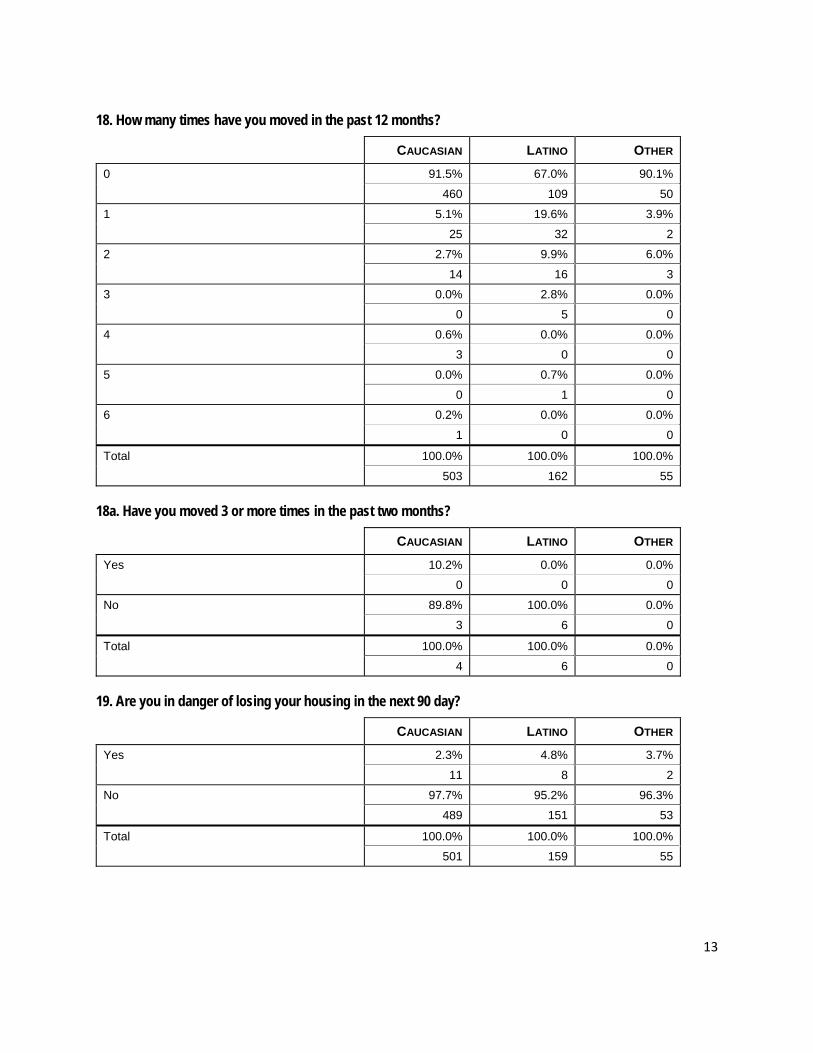
18. How many times have you moved in the past 12 months?
CAUCASIAN LATINO OTHER
0 91.5% 67.0% 90.1%
460 109 50
1 5.1% 19.6% 3.9%
25 32 2
2 2.7% 9.9% 6.0%
14 16 3
3 0.0% 2.8% 0.0%
0 5 0
4 0.6% 0.0% 0.0%
3 0 0
5 0.0% 0.7% 0.0%
0 1 0
6 0.2% 0.0% 0.0%
1 0 0
Total 100.0% 100.0% 100.0%
503 162 55
18a. Have you moved 3 or more times in the past two months?
CAUCASIAN LATINO OTHER
Yes 10.2% 0.0% 0.0%
0 0 0
No 89.8% 100.0% 0.0%
3 6 0
Total 100.0% 100.0% 0.0%
4 6 0
19. Are you in danger of losing your housing in the next 90 day?
CAUCASIAN LATINO OTHER
Yes 2.3% 4.8% 3.7%
11 8 2
No 97.7% 95.2% 96.3%
489 151 53
Total 100.0% 100.0% 100.0%
501 159 55
14
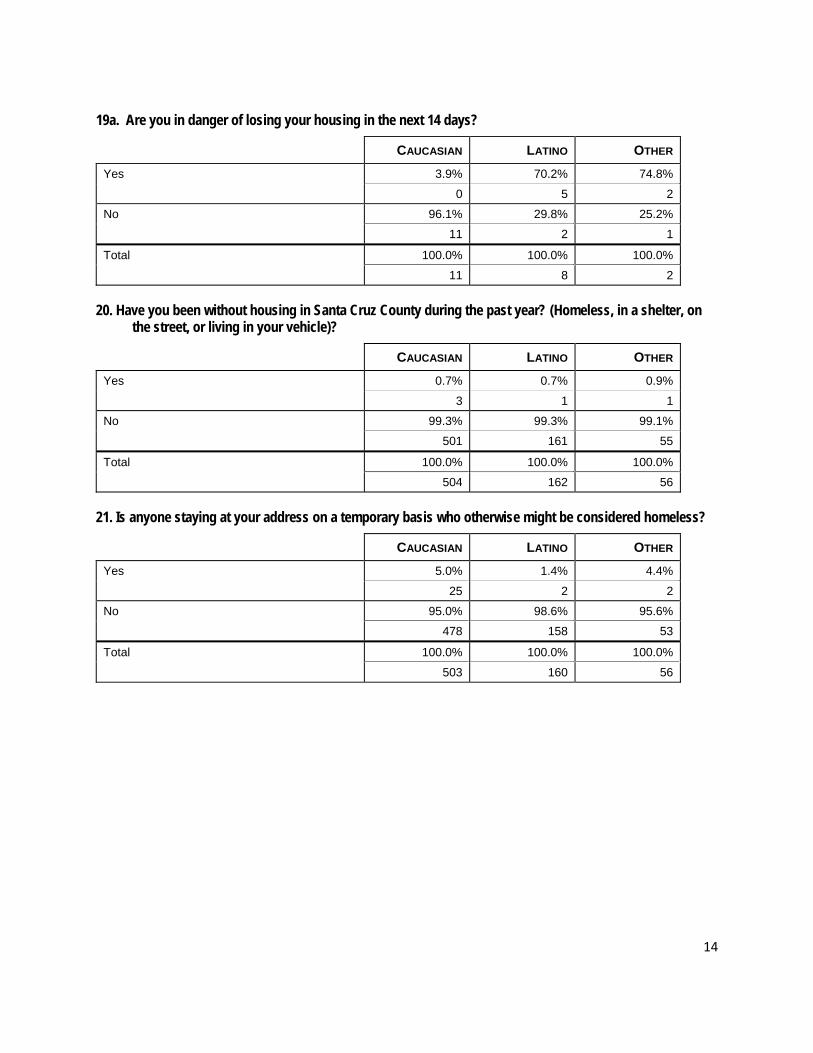
19a. Are you in danger of losing your housing in the next 14 days?
CAUCASIAN LATINO OTHER
Yes 3.9% 70.2% 74.8%
0 5 2
No 96.1% 29.8% 25.2%
11 2 1
Total 100.0% 100.0% 100.0%
11 8 2
20. Have you been without housing in Santa Cruz County during the past year? (Homeless, in a shelter, on the street, or living in your vehicle)?
CAUCASIAN LATINO OTHER
Yes 0.7% 0.7% 0.9%
3 1 1
No 99.3% 99.3% 99.1%
501 161 55
Total 100.0% 100.0% 100.0%
504 162 56
21. Is anyone staying at your address on a temporary basis who otherwise might be considered homeless?
CAUCASIAN LATINO OTHER
Yes 5.0% 1.4% 4.4%
25 2 2
No 95.0% 98.6% 95.6%
478 158 53
Total 100.0% 100.0% 100.0%
503 160 56
15
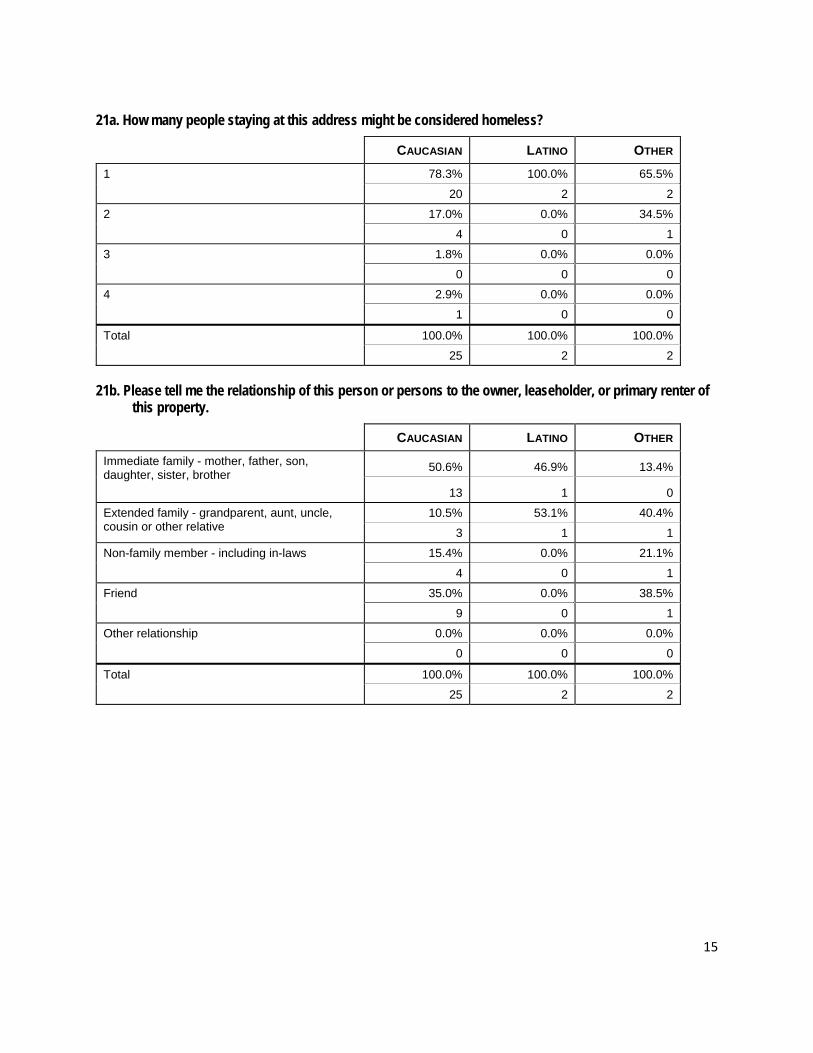
21a. How many people staying at this address might be considered homeless?
CAUCASIAN LATINO OTHER
1 78.3% 100.0% 65.5%
20 2 2
2 17.0% 0.0% 34.5%
4 0 1
3 1.8% 0.0% 0.0%
0 0 0
4 2.9% 0.0% 0.0%
1 0 0
Total 100.0% 100.0% 100.0%
25 2 2
21b. Please tell me the relationship of this person or persons to the owner, leaseholder, or primary renter of this property.
CAUCASIAN LATINO OTHER
Immediate family - mother, father, son, daughter, sister, brother
50.6% 46.9% 13.4%
13 1 0
Extended family - grandparent, aunt, uncle, cousin or other relative
10.5% 53.1% 40.4%
3 1 1
Non-family member - including in-laws 15.4% 0.0% 21.1%
4 0 1
Friend 35.0% 0.0% 38.5%
9 0 1
Other relationship 0.0% 0.0% 0.0%
0 0 0
Total 100.0% 100.0% 100.0%
25 2 2
16
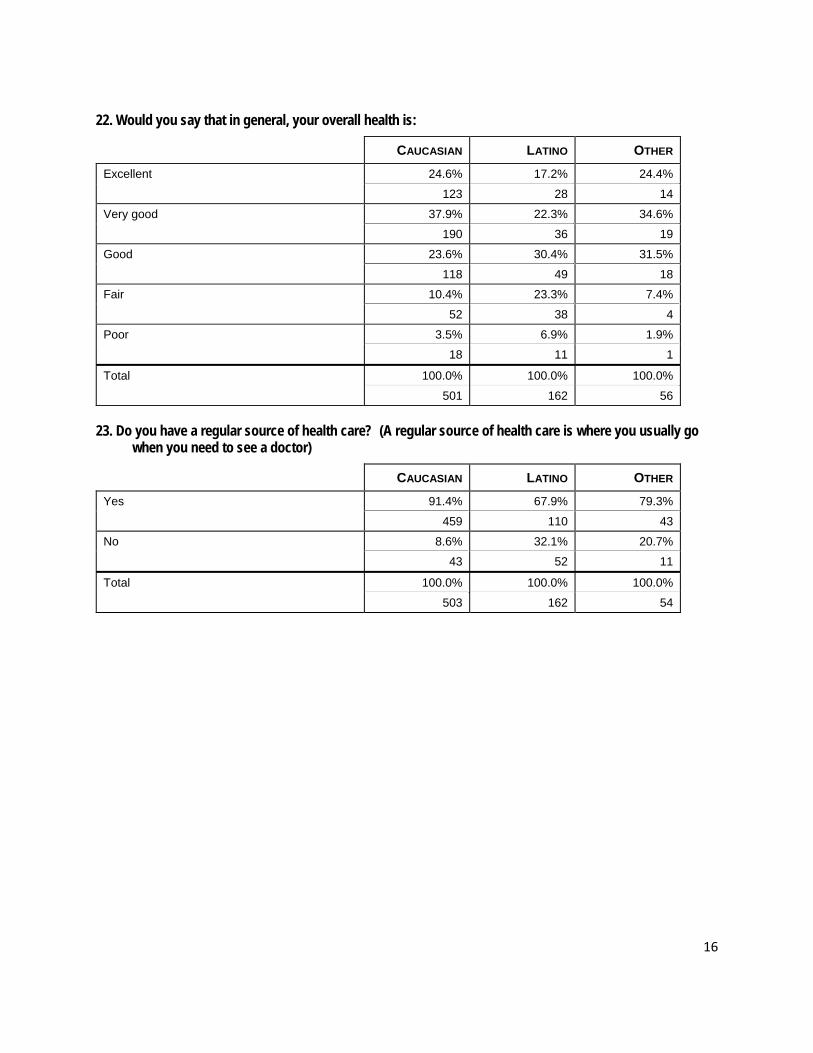
22. Would you say that in general, your overall health is:
CAUCASIAN LATINO OTHER
Excellent 24.6% 17.2% 24.4%
123 28 14
Very good 37.9% 22.3% 34.6%
190 36 19
Good 23.6% 30.4% 31.5%
118 49 18
Fair 10.4% 23.3% 7.4%
52 38 4
Poor 3.5% 6.9% 1.9%
18 11 1
Total 100.0% 100.0% 100.0%
501 162 56
23. Do you have a regular source of health care? (A regular source of health care is where you usually go when you need to see a doctor)
CAUCASIAN LATINO OTHER
Yes 91.4% 67.9% 79.3%
459 110 43
No 8.6% 32.1% 20.7%
43 52 11
Total 100.0% 100.0% 100.0%
503 162 54
17
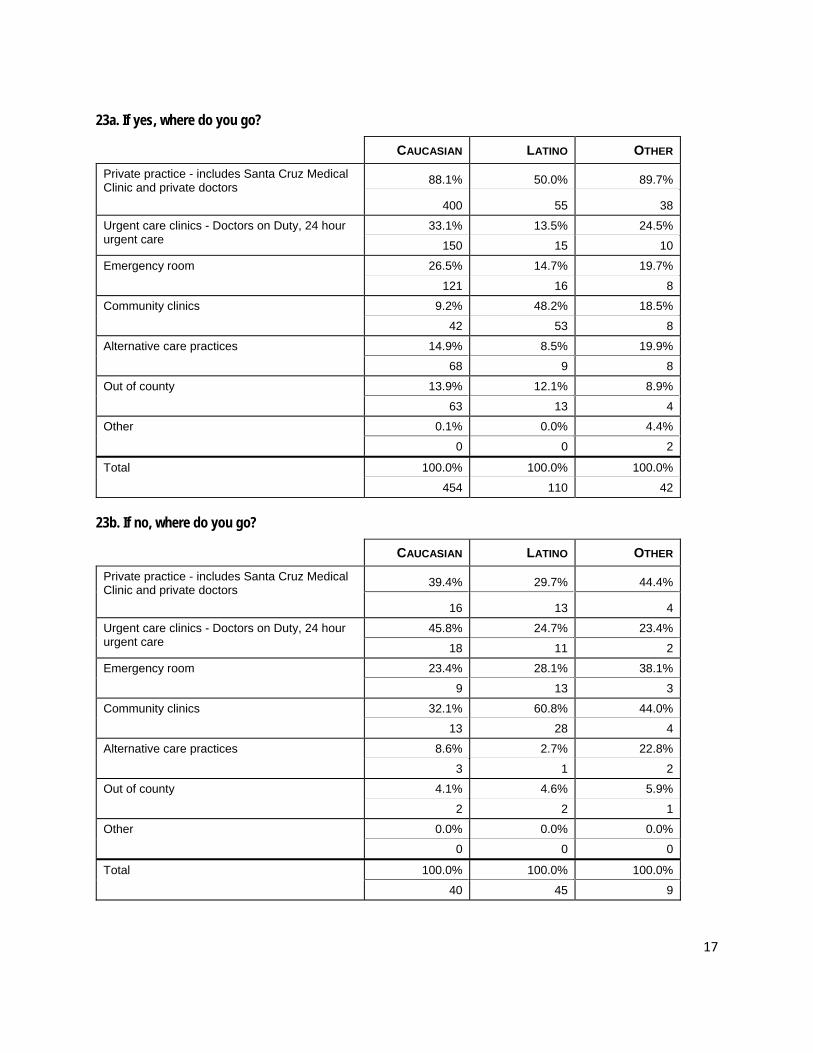
23a. If yes, where do you go?
CAUCASIAN LATINO OTHER
Private practice - includes Santa Cruz Medical Clinic and private doctors
88.1% 50.0% 89.7%
400 55 38
Urgent care clinics - Doctors on Duty, 24 hour urgent care
33.1% 13.5% 24.5%
150 15 10
Emergency room 26.5% 14.7% 19.7%
121 16 8
Community clinics 9.2% 48.2% 18.5%
42 53 8
Alternative care practices 14.9% 8.5% 19.9%
68 9 8
Out of county 13.9% 12.1% 8.9%
63 13 4
Other 0.1% 0.0% 4.4%
0 0 2
Total 100.0% 100.0% 100.0%
454 110 42
23b. If no, where do you go?
CAUCASIAN LATINO OTHER
Private practice - includes Santa Cruz Medical Clinic and private doctors
39.4% 29.7% 44.4%
16 13 4
Urgent care clinics - Doctors on Duty, 24 hour urgent care
45.8% 24.7% 23.4%
18 11 2
Emergency room 23.4% 28.1% 38.1%
9 13 3
Community clinics 32.1% 60.8% 44.0%
13 28 4
Alternative care practices 8.6% 2.7% 22.8%
3 1 2
Out of county 4.1% 4.6% 5.9%
2 2 1
Other 0.0% 0.0% 0.0%
0 0 0
Total 100.0% 100.0% 100.0%
40 45 9
18
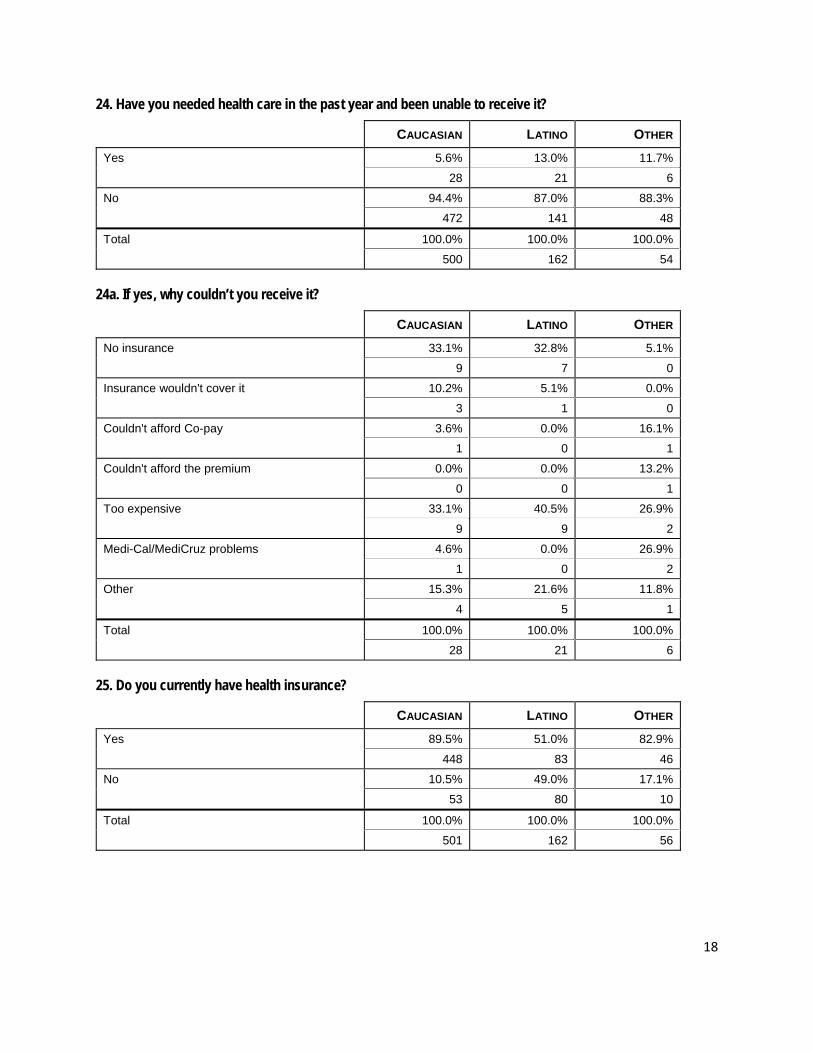
24. Have you needed health care in the past year and been unable to receive it?
CAUCASIAN LATINO OTHER
Yes 5.6% 13.0% 11.7%
28 21 6
No 94.4% 87.0% 88.3%
472 141 48
Total 100.0% 100.0% 100.0%
500 162 54
24a. If yes, why couldn’t you receive it?
CAUCASIAN LATINO OTHER
No insurance 33.1% 32.8% 5.1%
9 7 0
Insurance wouldn't cover it 10.2% 5.1% 0.0%
3 1 0
Couldn't afford Co-pay 3.6% 0.0% 16.1%
1 0 1
Couldn't afford the premium 0.0% 0.0% 13.2%
0 0 1
Too expensive 33.1% 40.5% 26.9%
9 9 2
Medi-Cal/MediCruz problems 4.6% 0.0% 26.9%
1 0 2
Other 15.3% 21.6% 11.8%
4 5 1
Total 100.0% 100.0% 100.0%
28 21 6
25. Do you currently have health insurance?
CAUCASIAN LATINO OTHER
Yes 89.5% 51.0% 82.9%
448 83 46
No 10.5% 49.0% 17.1%
53 80 10
Total 100.0% 100.0% 100.0%
501 162 56
19
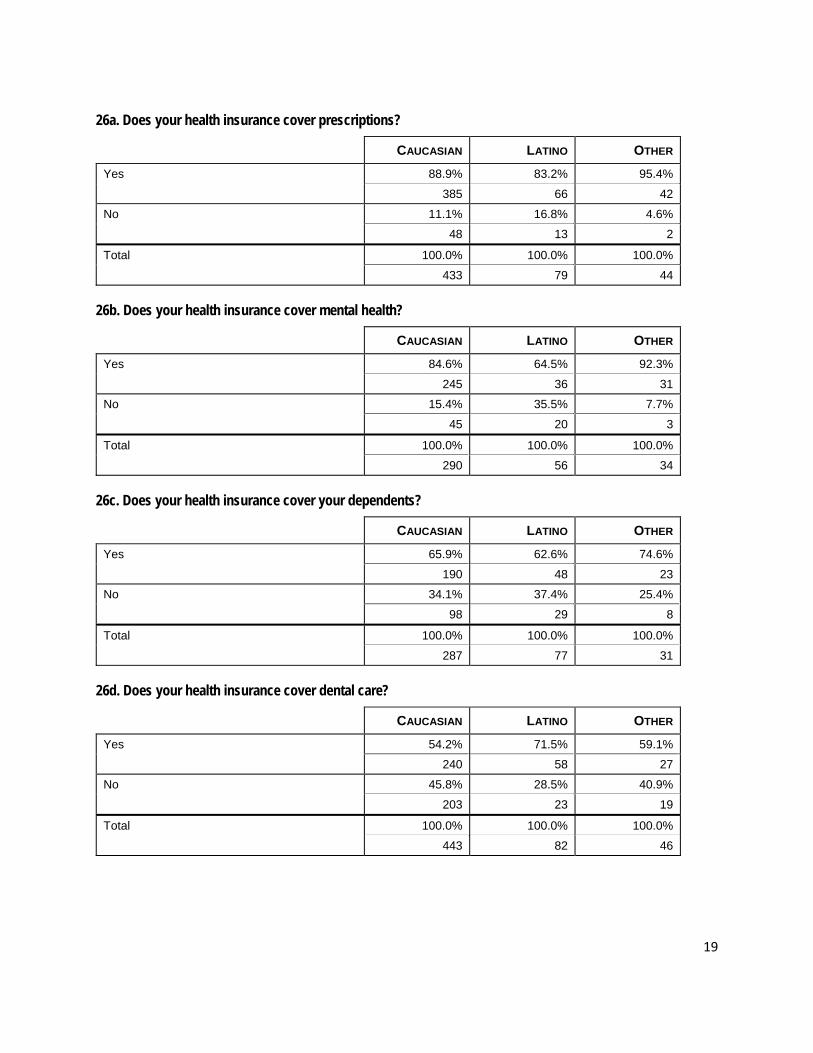
26a. Does your health insurance cover prescriptions?
CAUCASIAN LATINO OTHER
Yes 88.9% 83.2% 95.4%
385 66 42
No 11.1% 16.8% 4.6%
48 13 2
Total 100.0% 100.0% 100.0%
433 79 44
26b. Does your health insurance cover mental health?
CAUCASIAN LATINO OTHER
Yes 84.6% 64.5% 92.3%
245 36 31
No 15.4% 35.5% 7.7%
45 20 3
Total 100.0% 100.0% 100.0%
290 56 34
26c. Does your health insurance cover your dependents?
CAUCASIAN LATINO OTHER
Yes 65.9% 62.6% 74.6%
190 48 23
No 34.1% 37.4% 25.4%
98 29 8
Total 100.0% 100.0% 100.0%
287 77 31
26d. Does your health insurance cover dental care?
CAUCASIAN LATINO OTHER
Yes 54.2% 71.5% 59.1%
240 58 27
No 45.8% 28.5% 40.9%
203 23 19
Total 100.0% 100.0% 100.0%
443 82 46
20
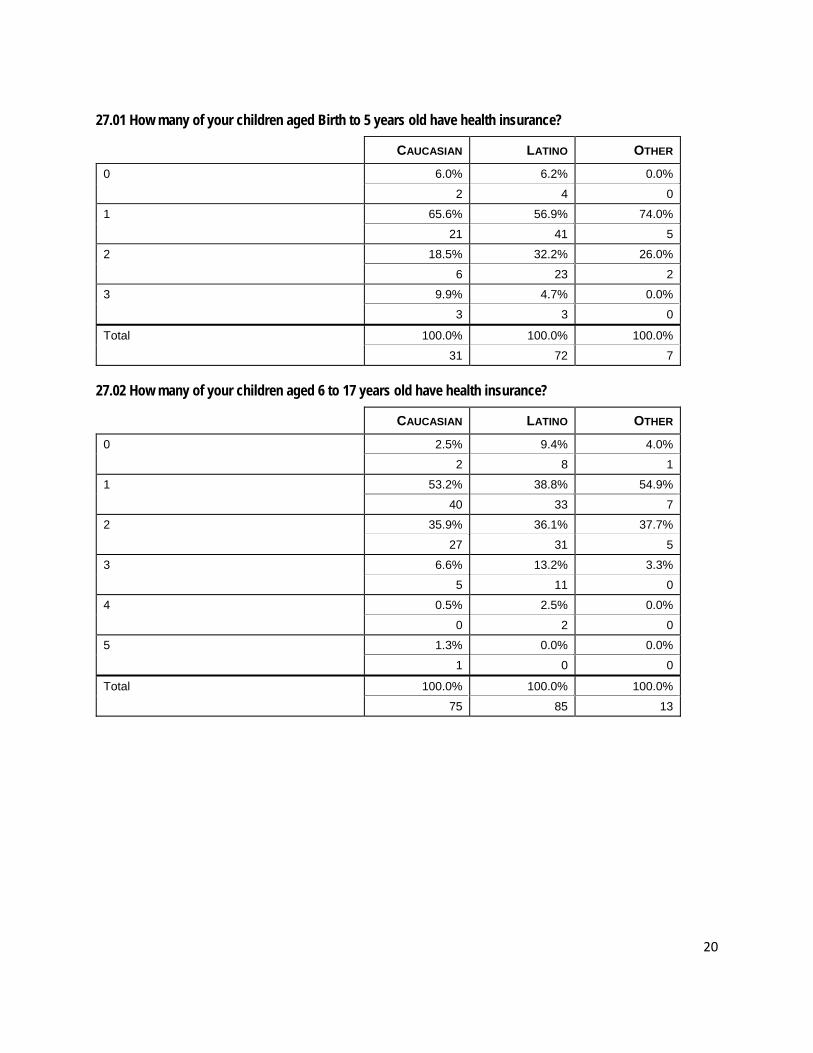
27.01 How many of your children aged Birth to 5 years old have health insurance?
CAUCASIAN LATINO OTHER
0 6.0% 6.2% 0.0%
2 4 0
1 65.6% 56.9% 74.0%
21 41 5
2 18.5% 32.2% 26.0%
6 23 2
3 9.9% 4.7% 0.0%
3 3 0
Total 100.0% 100.0% 100.0%
31 72 7
27.02 How many of your children aged 6 to 17 years old have health insurance?
CAUCASIAN LATINO OTHER
0 2.5% 9.4% 4.0%
2 8 1
1 53.2% 38.8% 54.9%
40 33 7
2 35.9% 36.1% 37.7%
27 31 5
3 6.6% 13.2% 3.3%
5 11 0
4 0.5% 2.5% 0.0%
0 2 0
5 1.3% 0.0% 0.0%
1 0 0
Total 100.0% 100.0% 100.0%
75 85 13
21
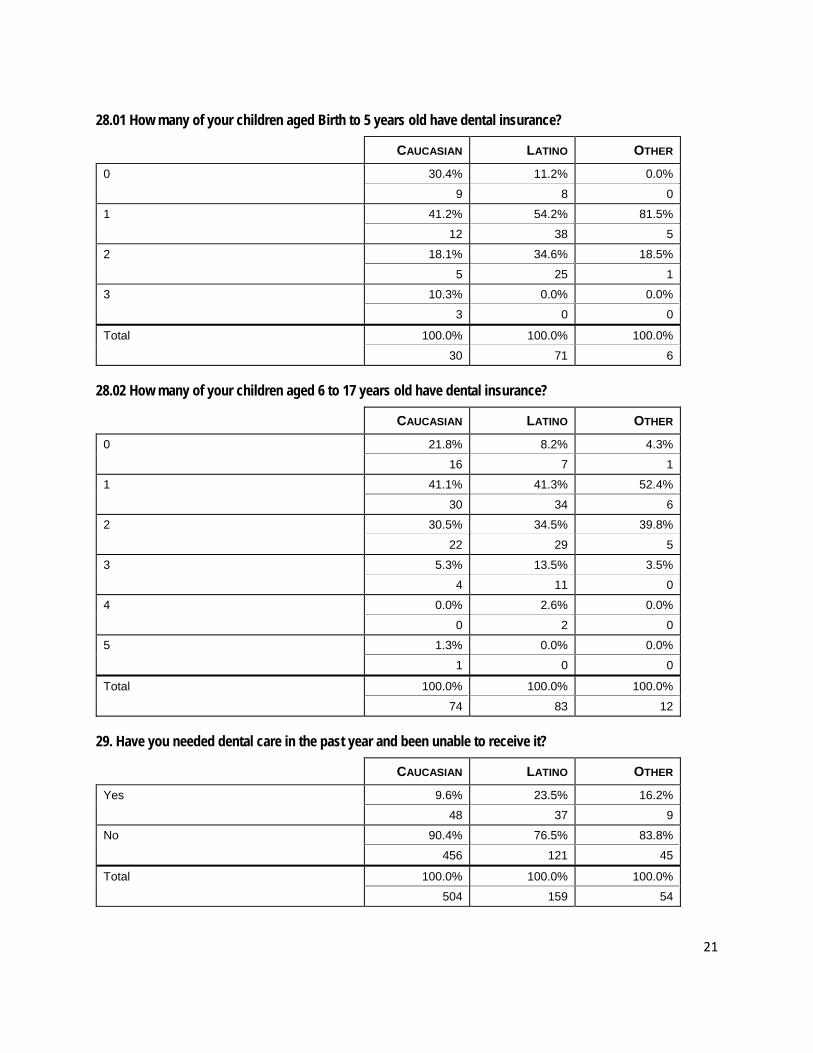
28.01 How many of your children aged Birth to 5 years old have dental insurance?
CAUCASIAN LATINO OTHER
0 30.4% 11.2% 0.0%
9 8 0
1 41.2% 54.2% 81.5%
12 38 5
2 18.1% 34.6% 18.5%
5 25 1
3 10.3% 0.0% 0.0%
3 0 0
Total 100.0% 100.0% 100.0%
30 71 6
28.02 How many of your children aged 6 to 17 years old have dental insurance?
CAUCASIAN LATINO OTHER
0 21.8% 8.2% 4.3%
16 7 1
1 41.1% 41.3% 52.4%
30 34 6
2 30.5% 34.5% 39.8%
22 29 5
3 5.3% 13.5% 3.5%
4 11 0
4 0.0% 2.6% 0.0%
0 2 0
5 1.3% 0.0% 0.0%
1 0 0
Total 100.0% 100.0% 100.0%
74 83 12
29. Have you needed dental care in the past year and been unable to receive it?
CAUCASIAN LATINO OTHER
Yes 9.6% 23.5% 16.2%
48 37 9
No 90.4% 76.5% 83.8%
456 121 45
Total 100.0% 100.0% 100.0%
504 159 54
22
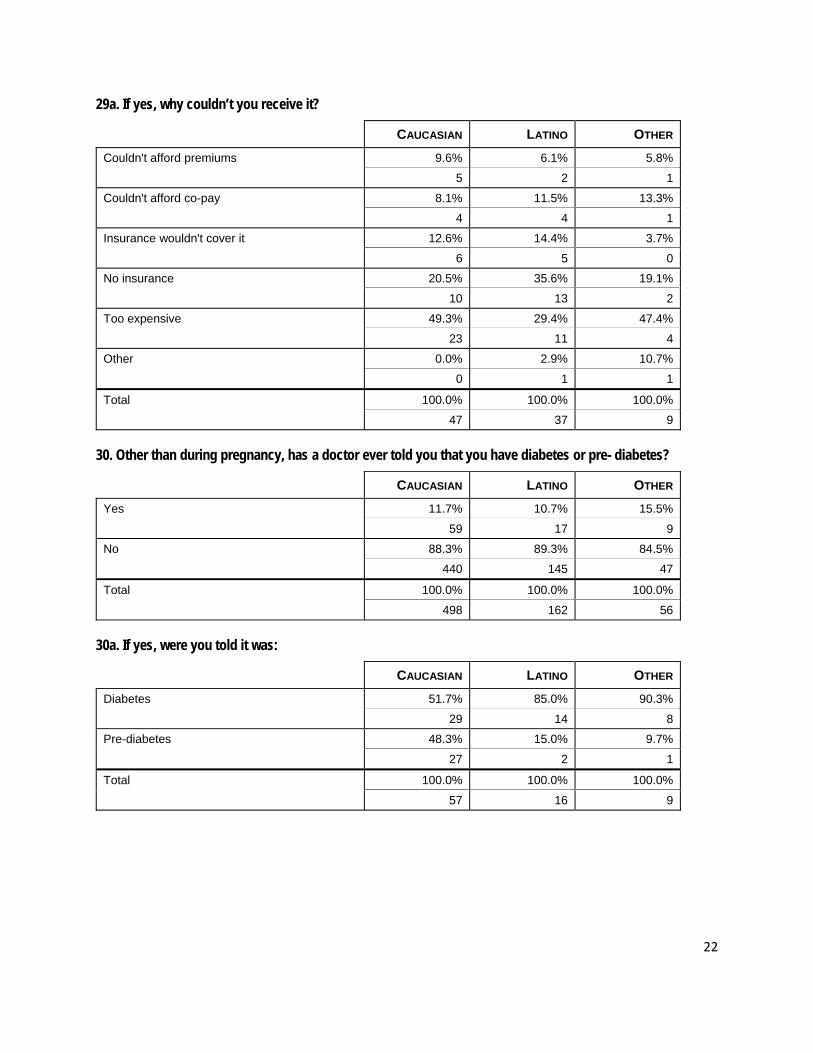
29a. If yes, why couldn’t you receive it?
CAUCASIAN LATINO OTHER
Couldn't afford premiums 9.6% 6.1% 5.8%
5 2 1
Couldn't afford co-pay 8.1% 11.5% 13.3%
4 4 1
Insurance wouldn't cover it 12.6% 14.4% 3.7%
6 5 0
No insurance 20.5% 35.6% 19.1%
10 13 2
Too expensive 49.3% 29.4% 47.4%
23 11 4
Other 0.0% 2.9% 10.7%
0 1 1
Total 100.0% 100.0% 100.0%
47 37 9
30. Other than during pregnancy, has a doctor ever told you that you have diabetes or pre- diabetes?
CAUCASIAN LATINO OTHER
Yes 11.7% 10.7% 15.5%
59 17 9
No 88.3% 89.3% 84.5%
440 145 47
Total 100.0% 100.0% 100.0%
498 162 56
30a. If yes, were you told it was:
CAUCASIAN LATINO OTHER
Diabetes 51.7% 85.0% 90.3%
29 14 8
Pre-diabetes 48.3% 15.0% 9.7%
27 2 1
Total 100.0% 100.0% 100.0%
57 16 9
23
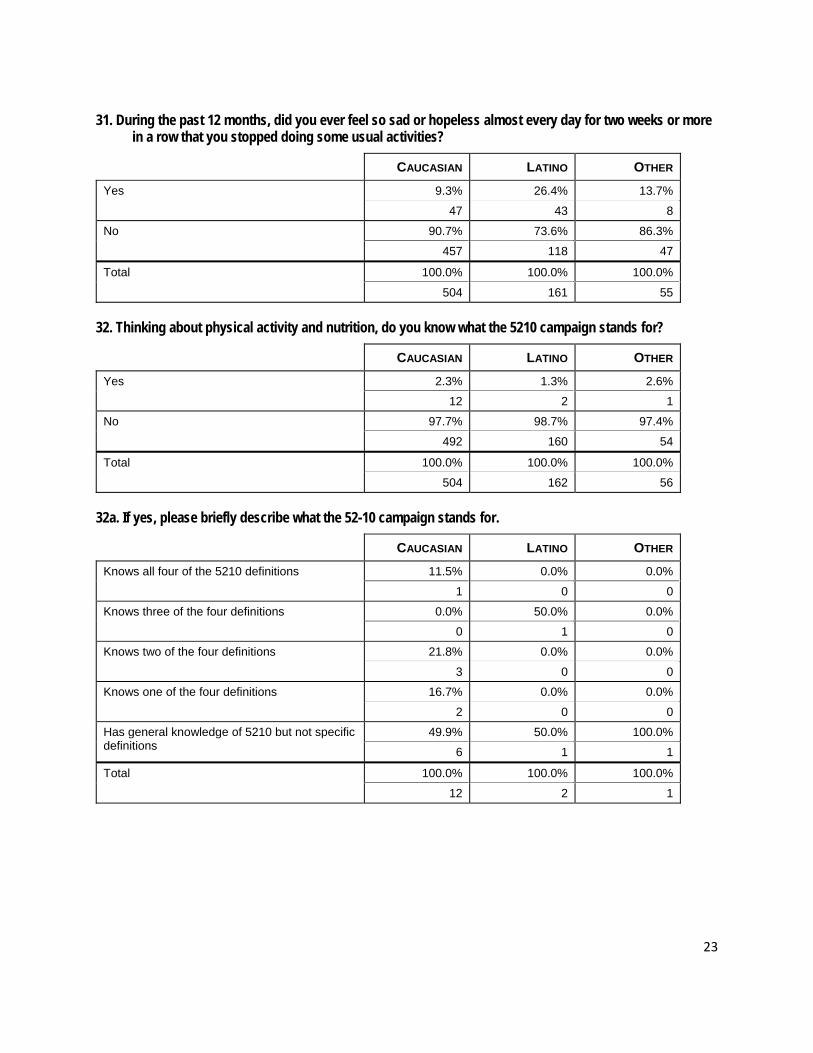
31. During the past 12 months, did you ever feel so sad or hopeless almost every day for two weeks or more in a row that you stopped doing some usual activities?
CAUCASIAN LATINO OTHER
Yes 9.3% 26.4% 13.7%
47 43 8
No 90.7% 73.6% 86.3%
457 118 47
Total 100.0% 100.0% 100.0%
504 161 55
32. Thinking about physical activity and nutrition, do you know what the 5210 campaign stands for?
CAUCASIAN LATINO OTHER
Yes 2.3% 1.3% 2.6%
12 2 1
No 97.7% 98.7% 97.4%
492 160 54
Total 100.0% 100.0% 100.0%
504 162 56
32a. If yes, please briefly describe what the 52-10 campaign stands for.
CAUCASIAN LATINO OTHER
Knows all four of the 5210 definitions 11.5% 0.0% 0.0%
1 0 0
Knows three of the four definitions 0.0% 50.0% 0.0%
0 1 0
Knows two of the four definitions 21.8% 0.0% 0.0%
3 0 0
Knows one of the four definitions 16.7% 0.0% 0.0%
2 0 0
Has general knowledge of 5210 but not specific definitions
49.9% 50.0% 100.0%
6 1 1
Total 100.0% 100.0% 100.0%
12 2 1
24
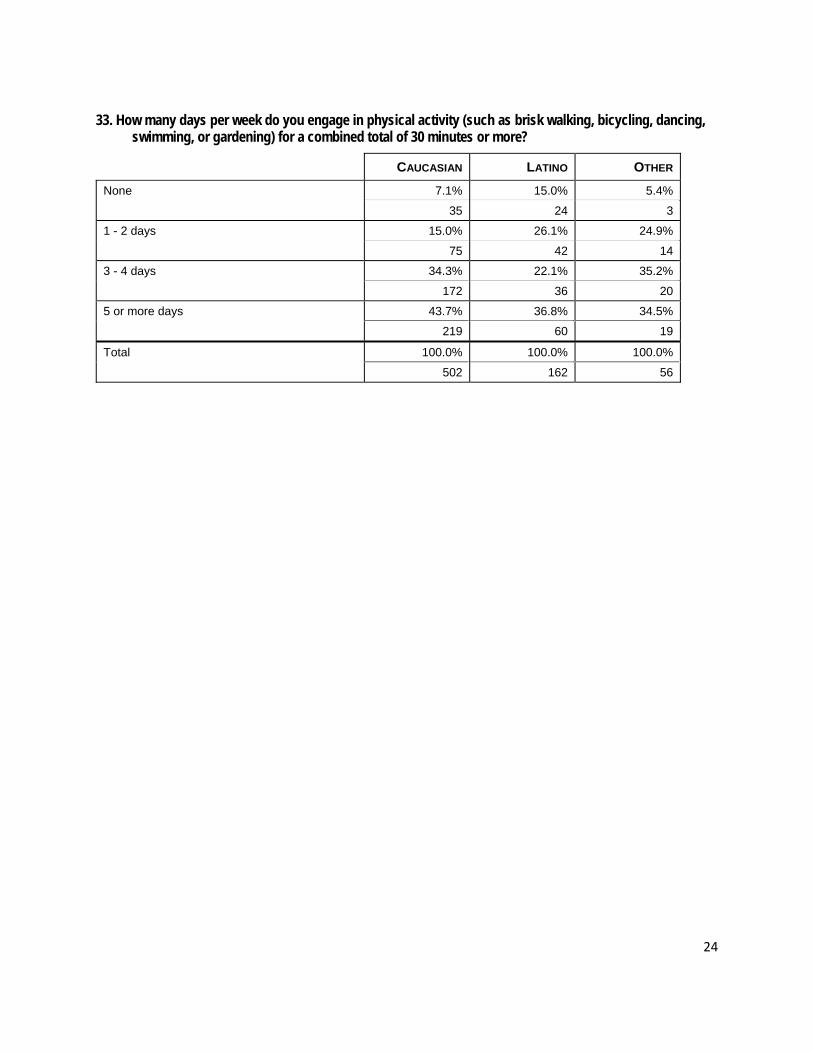
33. How many days per week do you engage in physical activity (such as brisk walking, bicycling, dancing, swimming, or gardening) for a combined total of 30 minutes or more?
CAUCASIAN LATINO OTHER
None 7.1% 15.0% 5.4%
35 24 3
1 - 2 days 15.0% 26.1% 24.9%
75 42 14
3 - 4 days 34.3% 22.1% 35.2%
172 36 20
5 or more days 43.7% 36.8% 34.5%
219 60 19
Total 100.0% 100.0% 100.0%
502 162 56
25
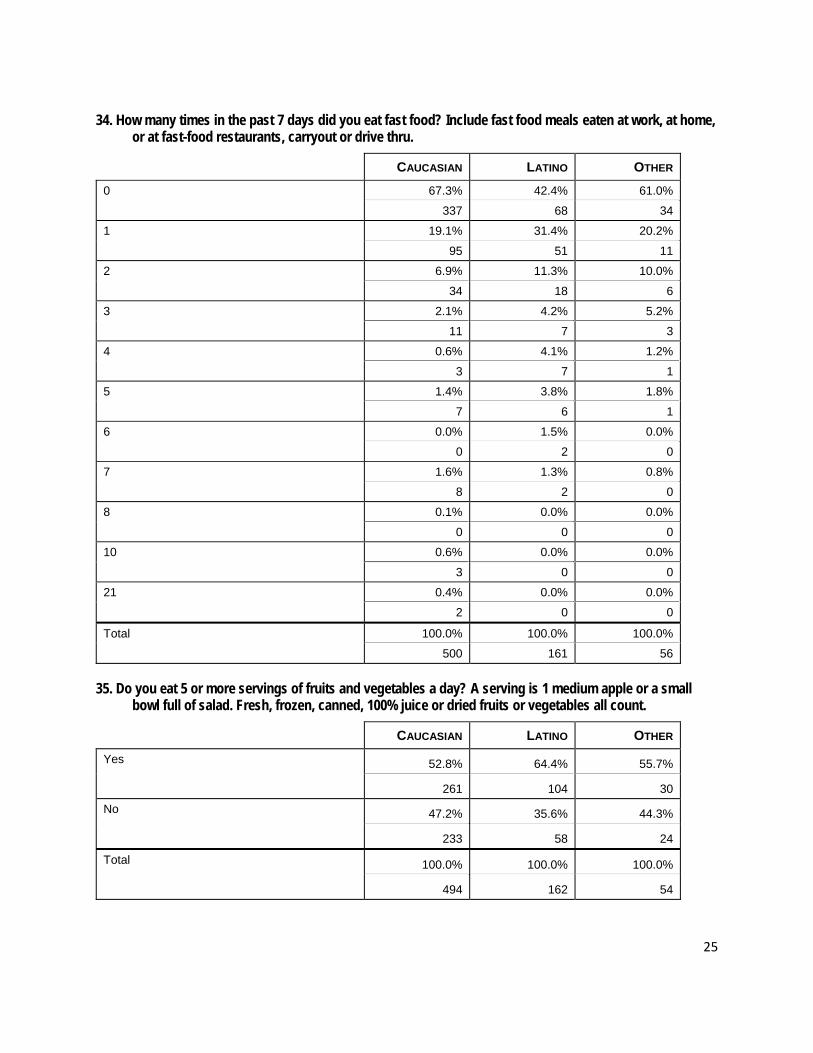
34. How many times in the past 7 days did you eat fast food? Include fast food meals eaten at work, at home, or at fast-food restaurants, carryout or drive thru.
CAUCASIAN LATINO OTHER
0 67.3% 42.4% 61.0%
337 68 34
1 19.1% 31.4% 20.2%
95 51 11
2 6.9% 11.3% 10.0%
34 18 6
3 2.1% 4.2% 5.2%
11 7 3
4 0.6% 4.1% 1.2%
3 7 1
5 1.4% 3.8% 1.8%
7 6 1
6 0.0% 1.5% 0.0%
0 2 0
7 1.6% 1.3% 0.8%
8 2 0
8 0.1% 0.0% 0.0%
0 0 0
10 0.6% 0.0% 0.0%
3 0 0
21 0.4% 0.0% 0.0%
2 0 0
Total 100.0% 100.0% 100.0%
500 161 56
35. Do you eat 5 or more servings of fruits and vegetables a day? A serving is 1 medium apple or a small bowl full of salad. Fresh, frozen, canned, 100% juice or dried fruits or vegetables all count.
CAUCASIAN LATINO OTHER
Yes 52.8% 64.4% 55.7%
261 104 30
No 47.2% 35.6% 44.3%
233 58 24
Total 100.0% 100.0% 100.0%
494 162 54
26
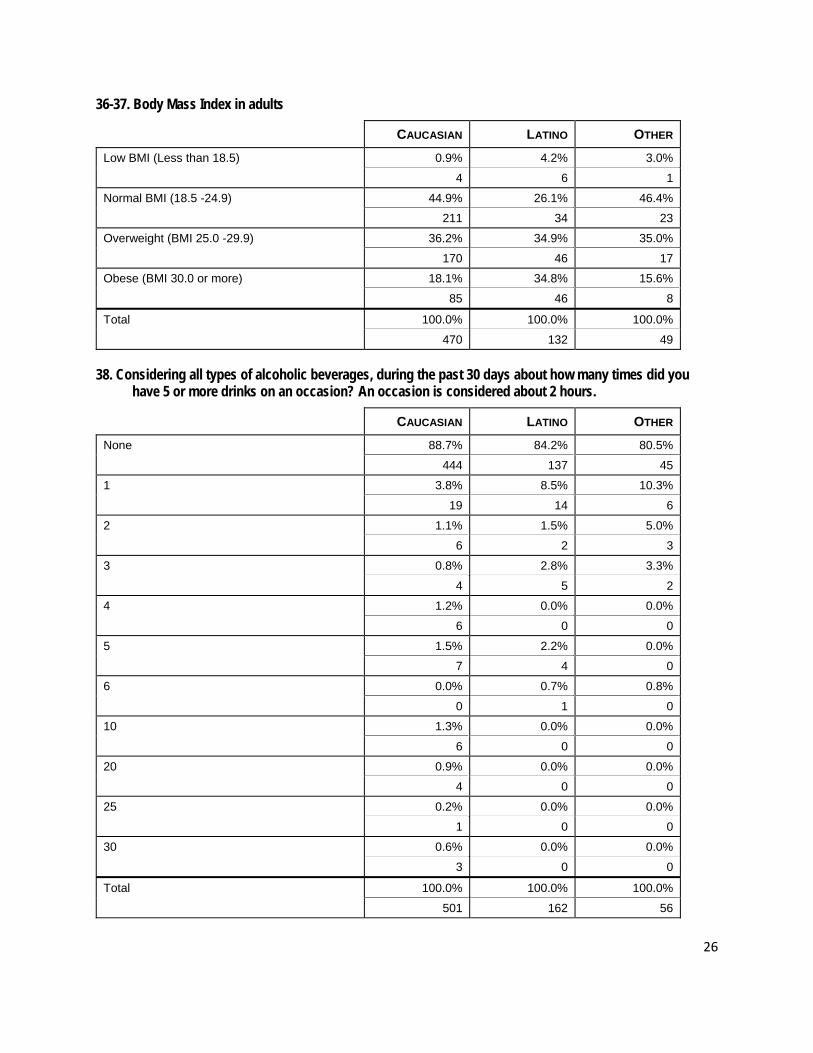
36-37. Body Mass Index in adults
CAUCASIAN LATINO OTHER
Low BMI (Less than 18.5) 0.9% 4.2% 3.0%
4 6 1
Normal BMI (18.5 -24.9) 44.9% 26.1% 46.4%
211 34 23
Overweight (BMI 25.0 -29.9) 36.2% 34.9% 35.0%
170 46 17
Obese (BMI 30.0 or more) 18.1% 34.8% 15.6%
85 46 8
Total 100.0% 100.0% 100.0%
470 132 49
38. Considering all types of alcoholic beverages, during the past 30 days about how many times did you have 5 or more drinks on an occasion? An occasion is considered about 2 hours.
CAUCASIAN LATINO OTHER
None 88.7% 84.2% 80.5%
444 137 45
1 3.8% 8.5% 10.3%
19 14 6
2 1.1% 1.5% 5.0%
6 2 3
3 0.8% 2.8% 3.3%
4 5 2
4 1.2% 0.0% 0.0%
6 0 0
5 1.5% 2.2% 0.0%
7 4 0
6 0.0% 0.7% 0.8%
0 1 0
10 1.3% 0.0% 0.0%
6 0 0
20 0.9% 0.0% 0.0%
4 0 0
25 0.2% 0.0% 0.0%
1 0 0
30 0.6% 0.0% 0.0%
3 0 0
Total 100.0% 100.0% 100.0%
501 162 56

27
39. During the past 30 days, on how many days have you taken a prescription drug (such as OxyContin, Percocet, Vicodin, codeine, Adderall, Ritalin, or Xanax) without a doctor's prescription?
CAUCASIAN LATINO OTHER
None 98.2% 95.9% 100.0%
493 155 56
1 0.7% 2.7% 0.0%
4 4 0
2 0.6% 0.0% 0.0%
3 0 0
3 0.3% 0.0% 0.0%
1 0 0
4 0.0% 0.7% 0.0%
0 1 0
6 0.0% 0.7% 0.0%
0 1 0
30 0.2% 0.0% 0.0%
1 0 0
Total 100.0% 100.0% 100.0%
502 162 56
40. How acceptable do you think it is for adults to provide alcohol to underage youth in their home?
CAUCASIAN LATINO OTHER
Very Acceptable 2.8% 4.7% 2.5%
14 8 1
Somewhat acceptable 21.2% 6.7% 23.9%
102 11 13
Not at all acceptable 76.0% 88.6% 73.5%
366 144 41
Total 100.0% 100.0% 100.0%
482 162 56
28
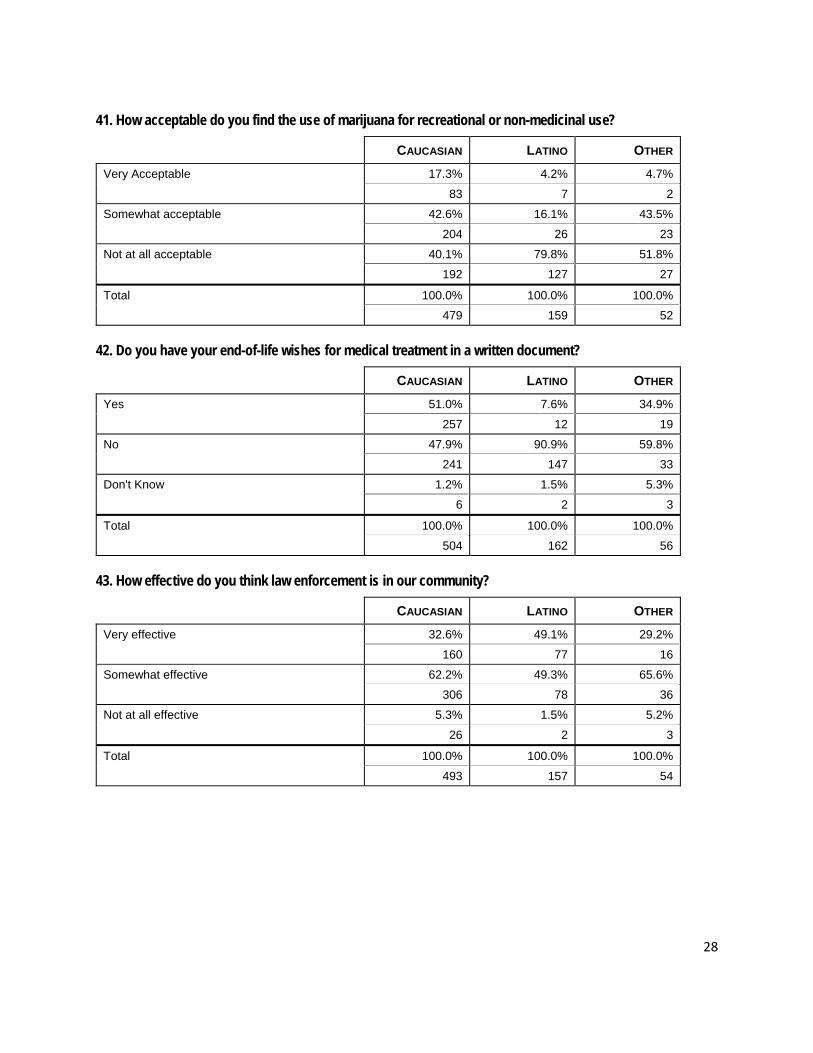
41. How acceptable do you find the use of marijuana for recreational or non-medicinal use?
CAUCASIAN LATINO OTHER
Very Acceptable 17.3% 4.2% 4.7%
83 7 2
Somewhat acceptable 42.6% 16.1% 43.5%
204 26 23
Not at all acceptable 40.1% 79.8% 51.8%
192 127 27
Total 100.0% 100.0% 100.0%
479 159 52
42. Do you have your end-of-life wishes for medical treatment in a written document?
CAUCASIAN LATINO OTHER
Yes 51.0% 7.6% 34.9%
257 12 19
No 47.9% 90.9% 59.8%
241 147 33
Don't Know 1.2% 1.5% 5.3%
6 2 3
Total 100.0% 100.0% 100.0%
504 162 56
43. How effective do you think law enforcement is in our community?
CAUCASIAN LATINO OTHER
Very effective 32.6% 49.1% 29.2%
160 77 16
Somewhat effective 62.2% 49.3% 65.6%
306 78 36
Not at all effective 5.3% 1.5% 5.2%
26 2 3
Total 100.0% 100.0% 100.0%
493 157 54
29
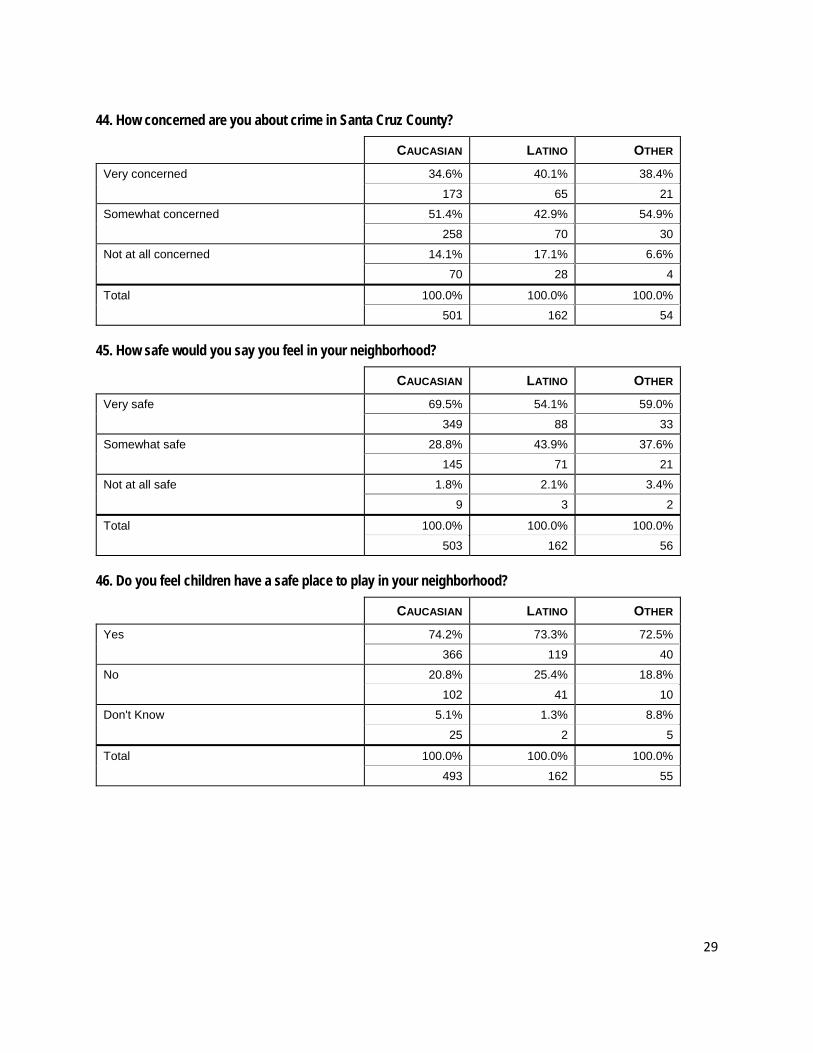
44. How concerned are you about crime in Santa Cruz County?
CAUCASIAN LATINO OTHER
Very concerned 34.6% 40.1% 38.4%
173 65 21
Somewhat concerned 51.4% 42.9% 54.9%
258 70 30
Not at all concerned 14.1% 17.1% 6.6%
70 28 4
Total 100.0% 100.0% 100.0%
501 162 54
45. How safe would you say you feel in your neighborhood?
CAUCASIAN LATINO OTHER
Very safe 69.5% 54.1% 59.0%
349 88 33
Somewhat safe 28.8% 43.9% 37.6%
145 71 21
Not at all safe 1.8% 2.1% 3.4%
9 3 2
Total 100.0% 100.0% 100.0%
503 162 56
46. Do you feel children have a safe place to play in your neighborhood?
CAUCASIAN LATINO OTHER
Yes 74.2% 73.3% 72.5%
366 119 40
No 20.8% 25.4% 18.8%
102 41 10
Don't Know 5.1% 1.3% 8.8%
25 2 5
Total 100.0% 100.0% 100.0%
493 162 55
30
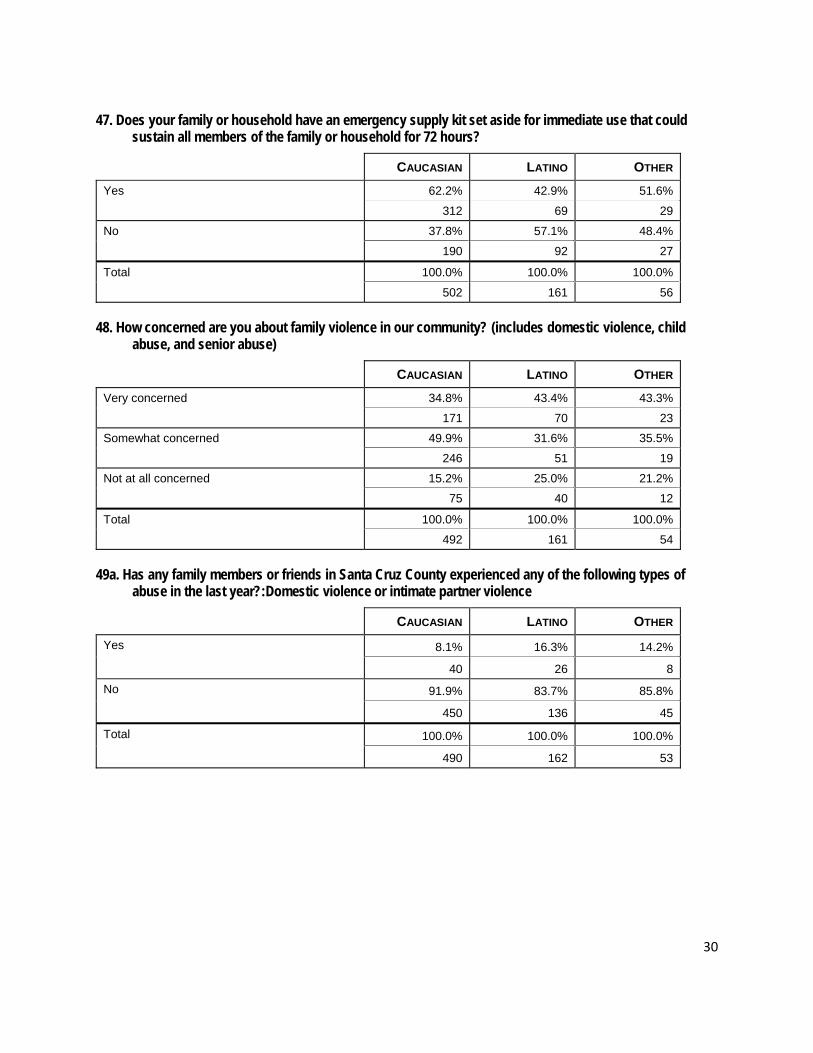
47. Does your family or household have an emergency supply kit set aside for immediate use that could sustain all members of the family or household for 72 hours?
CAUCASIAN LATINO OTHER
Yes 62.2% 42.9% 51.6%
312 69 29
No 37.8% 57.1% 48.4%
190 92 27
Total 100.0% 100.0% 100.0%
502 161 56
48. How concerned are you about family violence in our community? (includes domestic violence, child abuse, and senior abuse)
CAUCASIAN LATINO OTHER
Very concerned 34.8% 43.4% 43.3%
171 70 23
Somewhat concerned 49.9% 31.6% 35.5%
246 51 19
Not at all concerned 15.2% 25.0% 21.2%
75 40 12
Total 100.0% 100.0% 100.0%
492 161 54
49a. Has any family members or friends in Santa Cruz County experienced any of the following types of abuse in the last year?:Domestic violence or intimate partner violence
CAUCASIAN LATINO OTHER
Yes 8.1% 16.3% 14.2%
40 26 8
No 91.9% 83.7% 85.8%
450 136 45
Total 100.0% 100.0% 100.0%
490 162 53
31
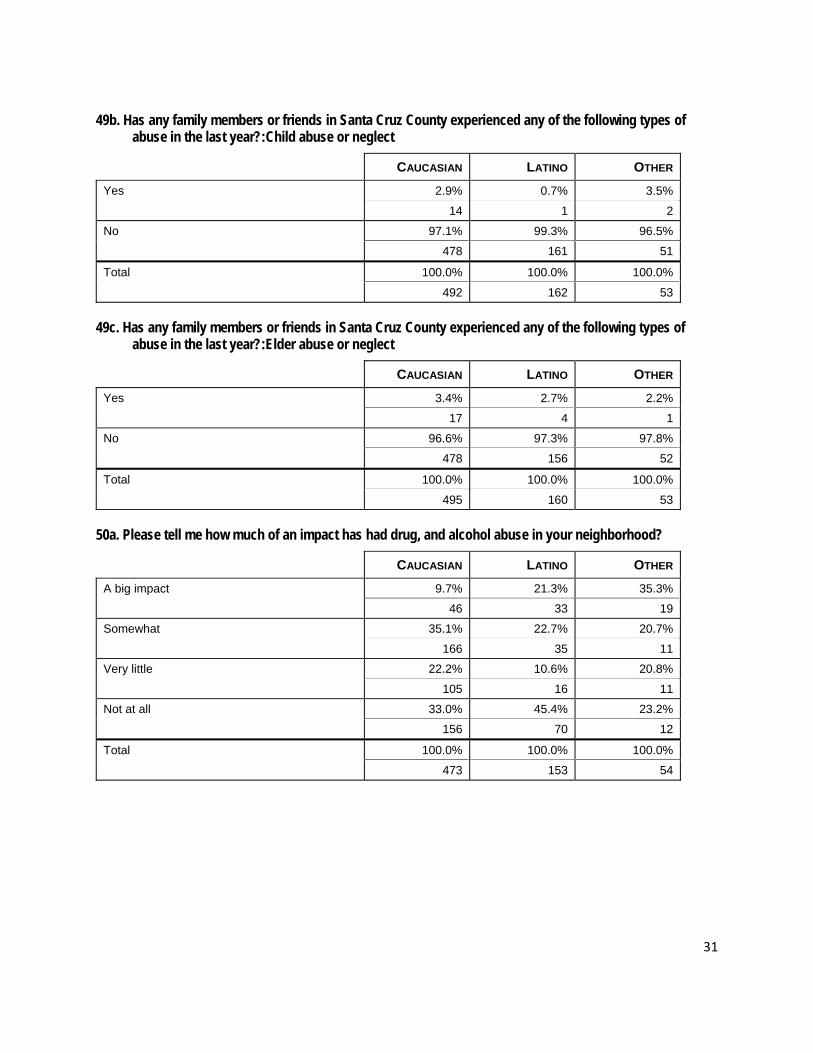
49b. Has any family members or friends in Santa Cruz County experienced any of the following types of abuse in the last year?:Child abuse or neglect
CAUCASIAN LATINO OTHER
Yes 2.9% 0.7% 3.5%
14 1 2
No 97.1% 99.3% 96.5%
478 161 51
Total 100.0% 100.0% 100.0%
492 162 53
49c. Has any family members or friends in Santa Cruz County experienced any of the following types of abuse in the last year?:Elder abuse or neglect
CAUCASIAN LATINO OTHER
Yes 3.4% 2.7% 2.2%
17 4 1
No 96.6% 97.3% 97.8%
478 156 52
Total 100.0% 100.0% 100.0%
495 160 53
50a. Please tell me how much of an impact has had drug, and alcohol abuse in your neighborhood?
CAUCASIAN LATINO OTHER
A big impact 9.7% 21.3% 35.3%
46 33 19
Somewhat 35.1% 22.7% 20.7%
166 35 11
Very little 22.2% 10.6% 20.8%
105 16 11
Not at all 33.0% 45.4% 23.2%
156 70 12
Total 100.0% 100.0% 100.0%
473 153 54
32
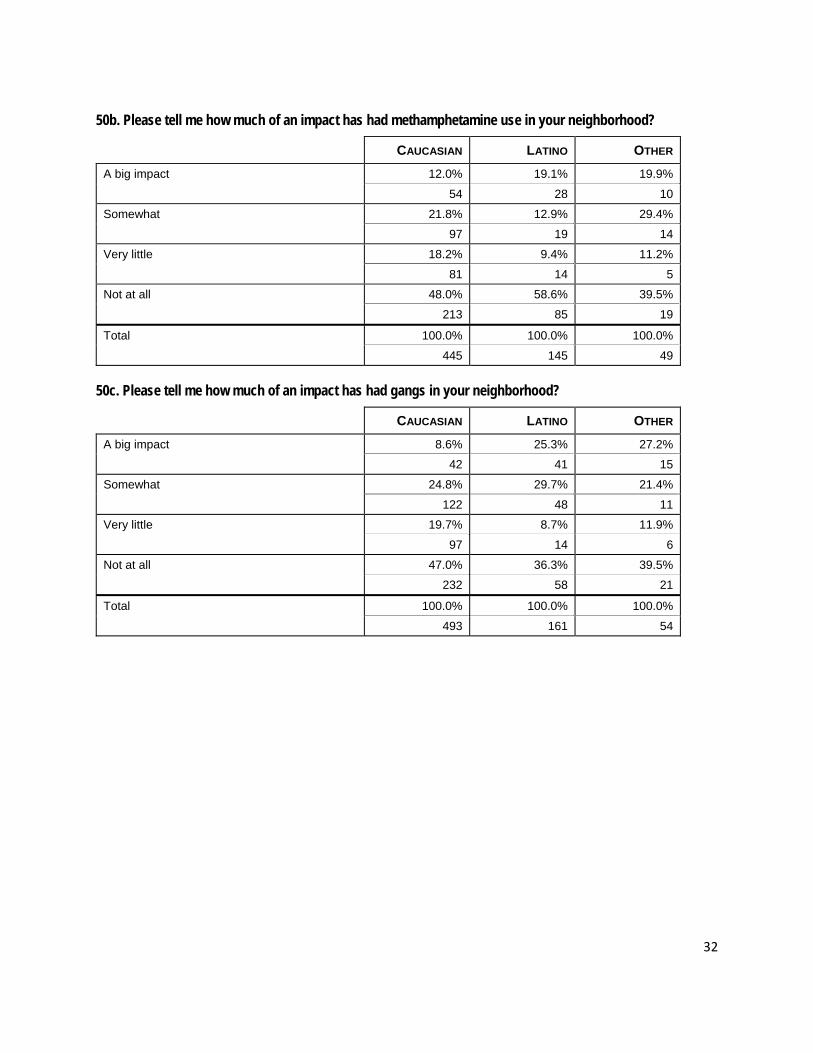
50b. Please tell me how much of an impact has had methamphetamine use in your neighborhood?
CAUCASIAN LATINO OTHER
A big impact 12.0% 19.1% 19.9%
54 28 10
Somewhat 21.8% 12.9% 29.4%
97 19 14
Very little 18.2% 9.4% 11.2%
81 14 5
Not at all 48.0% 58.6% 39.5%
213 85 19
Total 100.0% 100.0% 100.0%
445 145 49
50c. Please tell me how much of an impact has had gangs in your neighborhood?
CAUCASIAN LATINO OTHER
A big impact 8.6% 25.3% 27.2%
42 41 15
Somewhat 24.8% 29.7% 21.4%
122 48 11
Very little 19.7% 8.7% 11.9%
97 14 6
Not at all 47.0% 36.3% 39.5%
232 58 21
Total 100.0% 100.0% 100.0%
493 161 54
33
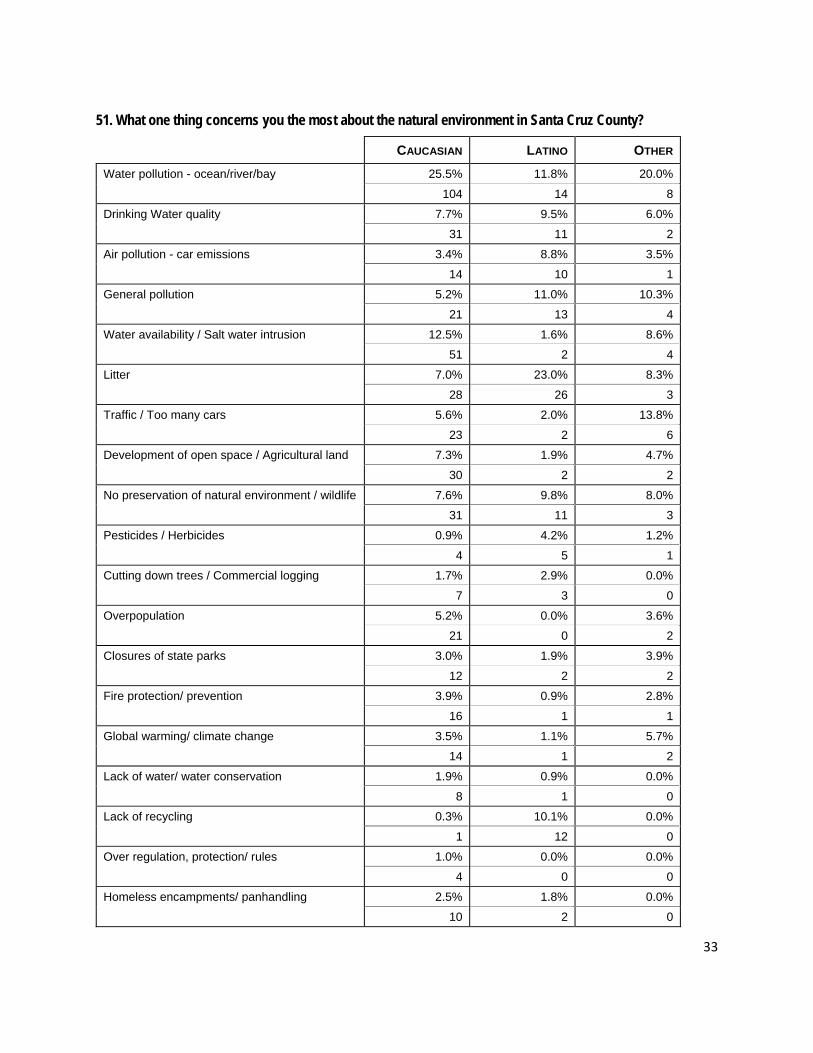
51. What one thing concerns you the most about the natural environment in Santa Cruz County?
CAUCASIAN LATINO OTHER
Water pollution - ocean/river/bay 25.5% 11.8% 20.0%
104 14 8
Drinking Water quality 7.7% 9.5% 6.0%
31 11 2
Air pollution - car emissions 3.4% 8.8% 3.5%
14 10 1
General pollution 5.2% 11.0% 10.3%
21 13 4
Water availability / Salt water intrusion 12.5% 1.6% 8.6%
51 2 4
Litter 7.0% 23.0% 8.3%
28 26 3
Traffic / Too many cars 5.6% 2.0% 13.8%
23 2 6
Development of open space / Agricultural land 7.3% 1.9% 4.7%
30 2 2
No preservation of natural environment / wildlife 7.6% 9.8% 8.0%
31 11 3
Pesticides / Herbicides 0.9% 4.2% 1.2%
4 5 1
Cutting down trees / Commercial logging 1.7% 2.9% 0.0%
7 3 0
Overpopulation 5.2% 0.0% 3.6%
21 0 2
Closures of state parks 3.0% 1.9% 3.9%
12 2 2
Fire protection/ prevention 3.9% 0.9% 2.8%
16 1 1
Global warming/ climate change 3.5% 1.1% 5.7%
14 1 2
Lack of water/ water conservation 1.9% 0.9% 0.0%
8 1 0
Lack of recycling 0.3% 10.1% 0.0%
1 12 0
Over regulation, protection/ rules 1.0% 0.0% 0.0%
4 0 0
Homeless encampments/ panhandling 2.5% 1.8% 0.0%
10 2 0
34
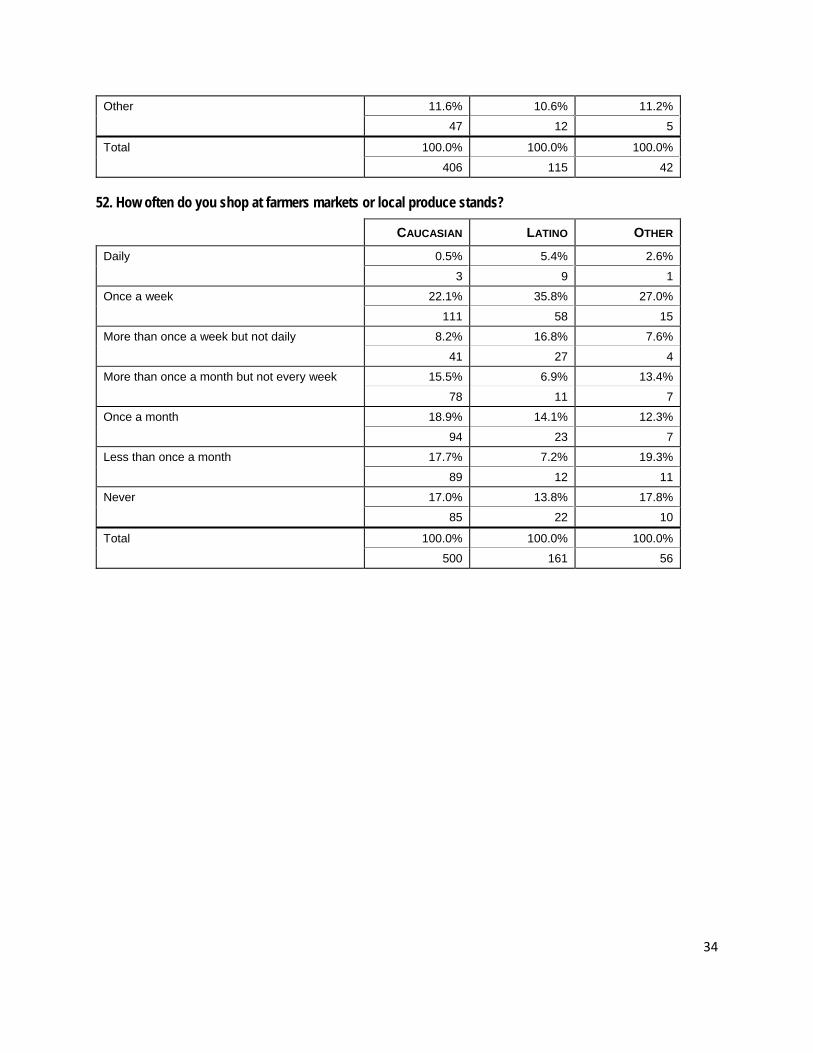
Other 11.6% 10.6% 11.2%
47 12 5
Total 100.0% 100.0% 100.0%
406 115 42
52. How often do you shop at farmers markets or local produce stands?
CAUCASIAN LATINO OTHER
Daily 0.5% 5.4% 2.6%
3 9 1
Once a week 22.1% 35.8% 27.0%
111 58 15
More than once a week but not daily 8.2% 16.8% 7.6%
41 27 4
More than once a month but not every week 15.5% 6.9% 13.4%
78 11 7
Once a month 18.9% 14.1% 12.3%
94 23 7
Less than once a month 17.7% 7.2% 19.3%
89 12 11
Never 17.0% 13.8% 17.8%
85 22 10
Total 100.0% 100.0% 100.0%
500 161 56
35
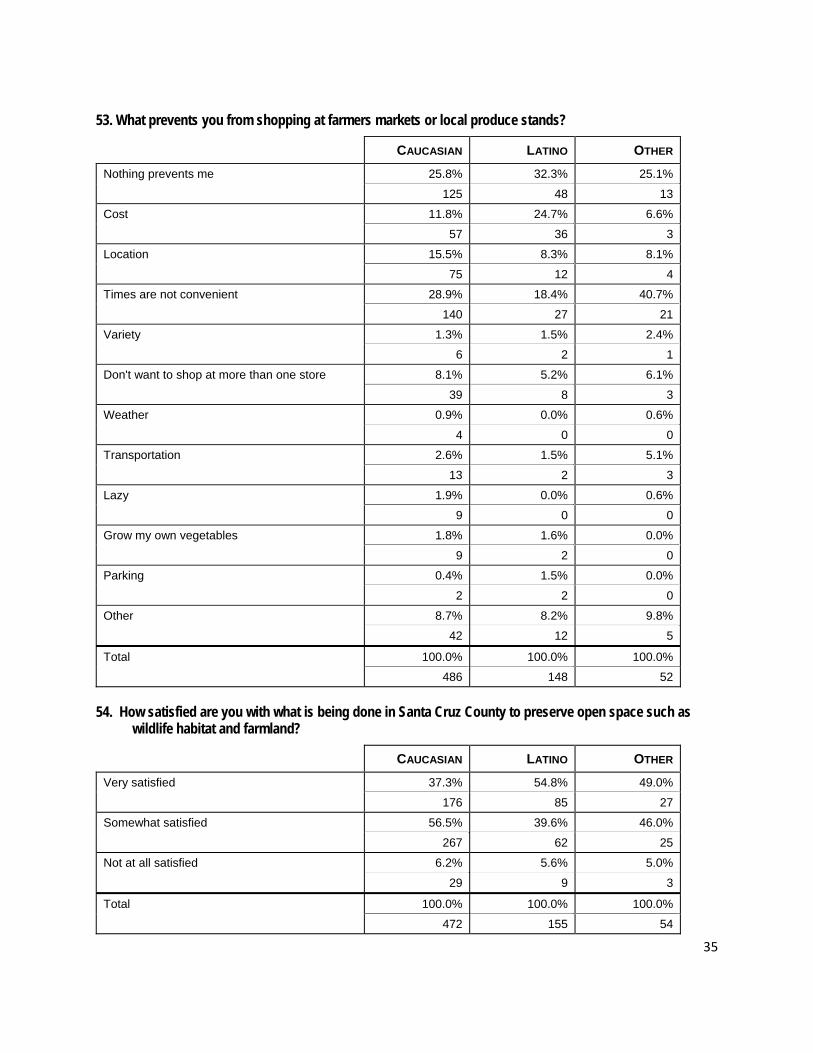
53. What prevents you from shopping at farmers markets or local produce stands?
CAUCASIAN LATINO OTHER
Nothing prevents me 25.8% 32.3% 25.1%
125 48 13
Cost 11.8% 24.7% 6.6%
57 36 3
Location 15.5% 8.3% 8.1%
75 12 4
Times are not convenient 28.9% 18.4% 40.7%
140 27 21
Variety 1.3% 1.5% 2.4%
6 2 1
Don't want to shop at more than one store 8.1% 5.2% 6.1%
39 8 3
Weather 0.9% 0.0% 0.6%
4 0 0
Transportation 2.6% 1.5% 5.1%
13 2 3
Lazy 1.9% 0.0% 0.6%
9 0 0
Grow my own vegetables 1.8% 1.6% 0.0%
9 2 0
Parking 0.4% 1.5% 0.0%
2 2 0
Other 8.7% 8.2% 9.8%
42 12 5
Total 100.0% 100.0% 100.0%
486 148 52
54. How satisfied are you with what is being done in Santa Cruz County to preserve open space such as wildlife habitat and farmland?
CAUCASIAN LATINO OTHER
Very satisfied 37.3% 54.8% 49.0%
176 85 27
Somewhat satisfied 56.5% 39.6% 46.0%
267 62 25
Not at all satisfied 6.2% 5.6% 5.0%
29 9 3
Total 100.0% 100.0% 100.0%
472 155 54
36
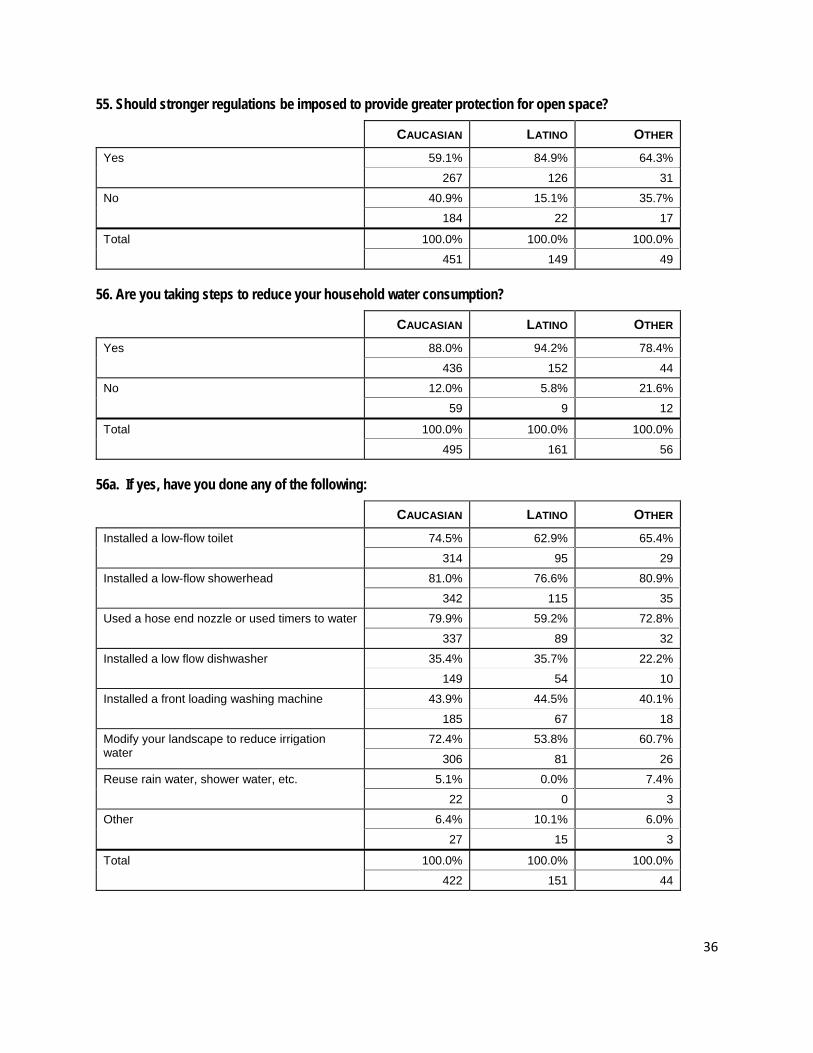
55. Should stronger regulations be imposed to provide greater protection for open space?
CAUCASIAN LATINO OTHER
Yes 59.1% 84.9% 64.3%
267 126 31
No 40.9% 15.1% 35.7%
184 22 17
Total 100.0% 100.0% 100.0%
451 149 49
56. Are you taking steps to reduce your household water consumption?
CAUCASIAN LATINO OTHER
Yes 88.0% 94.2% 78.4%
436 152 44
No 12.0% 5.8% 21.6%
59 9 12
Total 100.0% 100.0% 100.0%
495 161 56
56a. If yes, have you done any of the following:
CAUCASIAN LATINO OTHER
Installed a low-flow toilet 74.5% 62.9% 65.4%
314 95 29
Installed a low-flow showerhead 81.0% 76.6% 80.9%
342 115 35
Used a hose end nozzle or used timers to water 79.9% 59.2% 72.8%
337 89 32
Installed a low flow dishwasher 35.4% 35.7% 22.2%
149 54 10
Installed a front loading washing machine 43.9% 44.5% 40.1%
185 67 18
Modify your landscape to reduce irrigation water
72.4% 53.8% 60.7%
306 81 26
Reuse rain water, shower water, etc. 5.1% 0.0% 7.4%
22 0 3
Other 6.4% 10.1% 6.0%
27 15 3
Total 100.0% 100.0% 100.0%
422 151 44
37
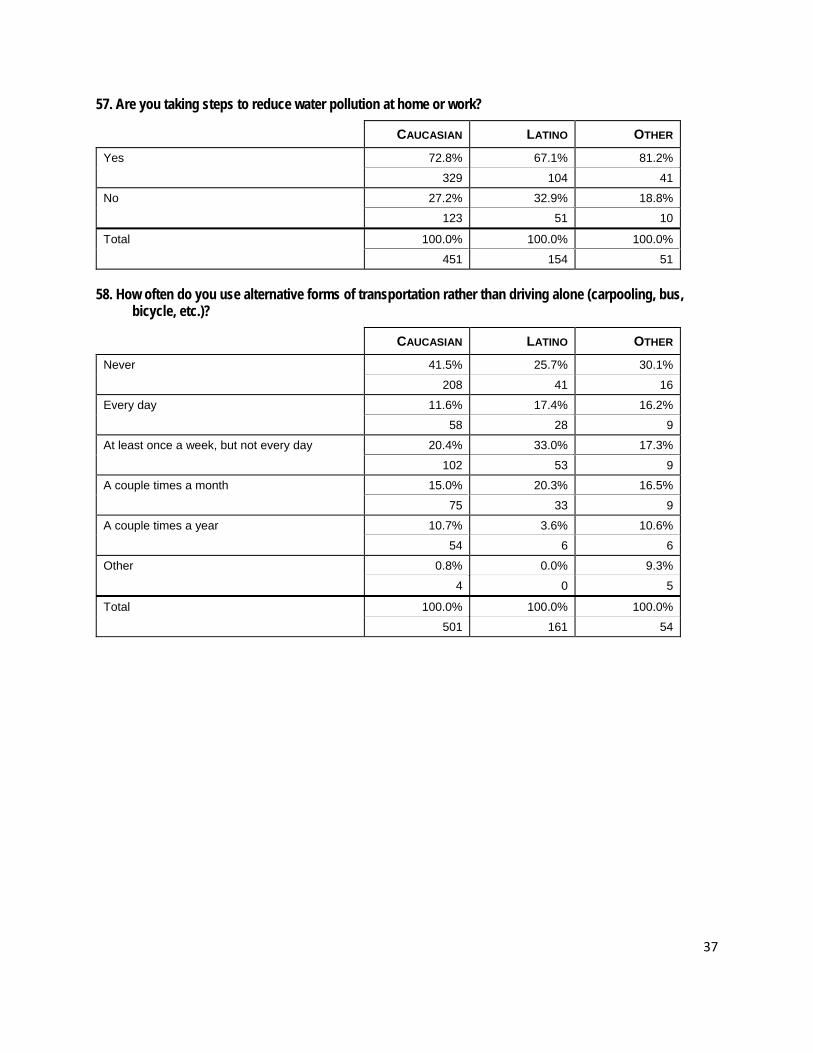
57. Are you taking steps to reduce water pollution at home or work?
CAUCASIAN LATINO OTHER
Yes 72.8% 67.1% 81.2%
329 104 41
No 27.2% 32.9% 18.8%
123 51 10
Total 100.0% 100.0% 100.0%
451 154 51
58. How often do you use alternative forms of transportation rather than driving alone (carpooling, bus, bicycle, etc.)?
CAUCASIAN LATINO OTHER
Never 41.5% 25.7% 30.1%
208 41 16
Every day 11.6% 17.4% 16.2%
58 28 9
At least once a week, but not every day 20.4% 33.0% 17.3%
102 53 9
A couple times a month 15.0% 20.3% 16.5%
75 33 9
A couple times a year 10.7% 3.6% 10.6%
54 6 6
Other 0.8% 0.0% 9.3%
4 0 5
Total 100.0% 100.0% 100.0%
501 161 54
38
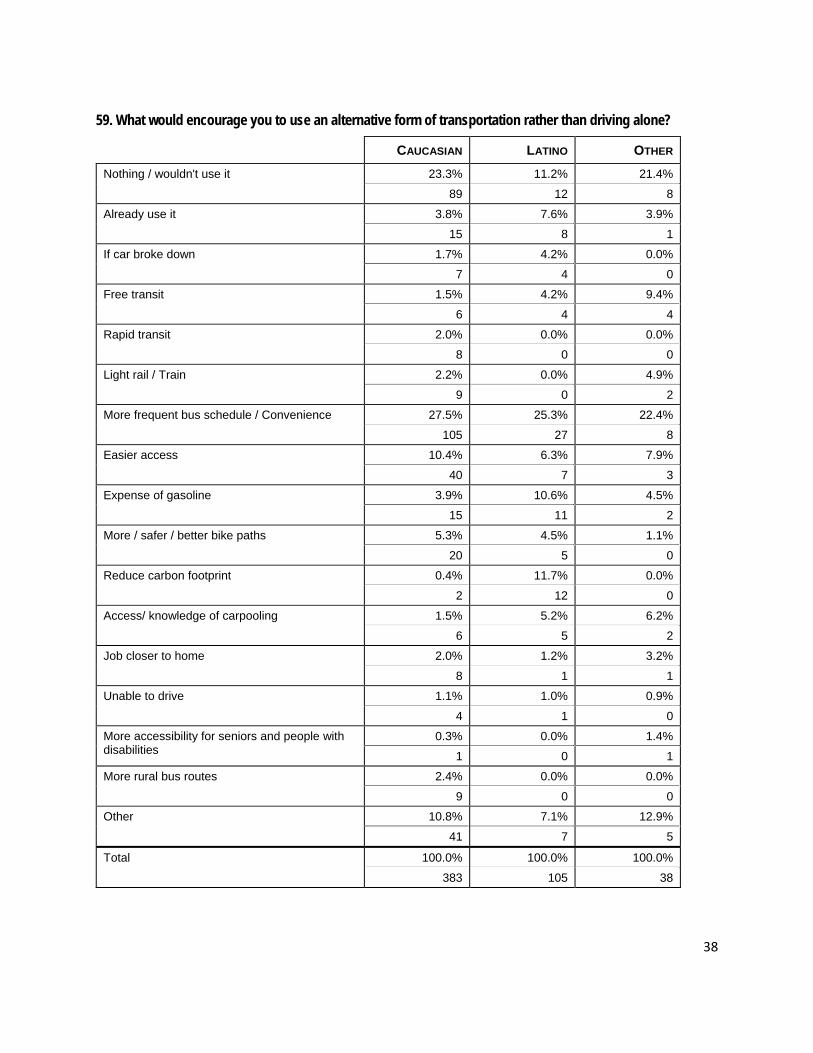
59. What would encourage you to use an alternative form of transportation rather than driving alone?
CAUCASIAN LATINO OTHER
Nothing / wouldn't use it 23.3% 11.2% 21.4%
89 12 8
Already use it 3.8% 7.6% 3.9%
15 8 1
If car broke down 1.7% 4.2% 0.0%
7 4 0
Free transit 1.5% 4.2% 9.4%
6 4 4
Rapid transit 2.0% 0.0% 0.0%
8 0 0
Light rail / Train 2.2% 0.0% 4.9%
9 0 2
More frequent bus schedule / Convenience 27.5% 25.3% 22.4%
105 27 8
Easier access 10.4% 6.3% 7.9%
40 7 3
Expense of gasoline 3.9% 10.6% 4.5%
15 11 2
More / safer / better bike paths 5.3% 4.5% 1.1%
20 5 0
Reduce carbon footprint 0.4% 11.7% 0.0%
2 12 0
Access/ knowledge of carpooling 1.5% 5.2% 6.2%
6 5 2
Job closer to home 2.0% 1.2% 3.2%
8 1 1
Unable to drive 1.1% 1.0% 0.9%
4 1 0
More accessibility for seniors and people with disabilities
0.3% 0.0% 1.4%
1 0 1
More rural bus routes 2.4% 0.0% 0.0%
9 0 0
Other 10.8% 7.1% 12.9%
41 7 5
Total 100.0% 100.0% 100.0%
383 105 38
39
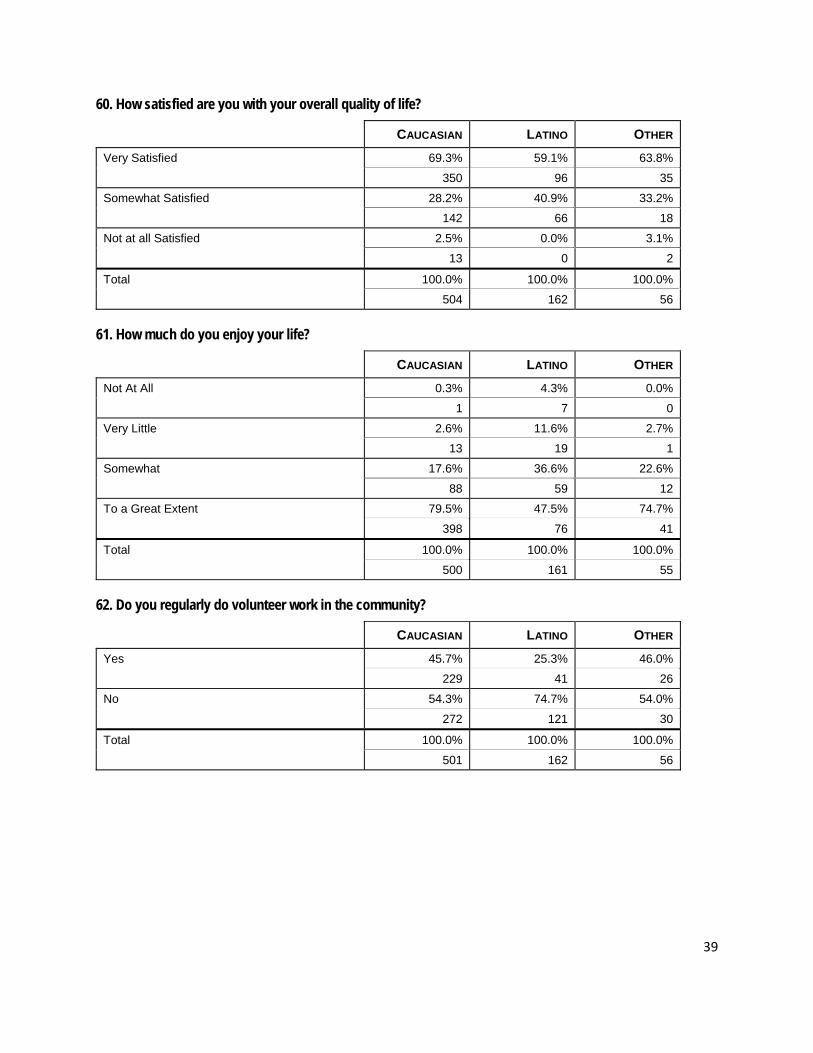
60. How satisfied are you with your overall quality of life?
CAUCASIAN LATINO OTHER
Very Satisfied 69.3% 59.1% 63.8%
350 96 35
Somewhat Satisfied 28.2% 40.9% 33.2%
142 66 18
Not at all Satisfied 2.5% 0.0% 3.1%
13 0 2
Total 100.0% 100.0% 100.0%
504 162 56
61. How much do you enjoy your life?
CAUCASIAN LATINO OTHER
Not At All 0.3% 4.3% 0.0%
1 7 0
Very Little 2.6% 11.6% 2.7%
13 19 1
Somewhat 17.6% 36.6% 22.6%
88 59 12
To a Great Extent 79.5% 47.5% 74.7%
398 76 41
Total 100.0% 100.0% 100.0%
500 161 55
62. Do you regularly do volunteer work in the community?
CAUCASIAN LATINO OTHER
Yes 45.7% 25.3% 46.0%
229 41 26
No 54.3% 74.7% 54.0%
272 121 30
Total 100.0% 100.0% 100.0%
501 162 56
40
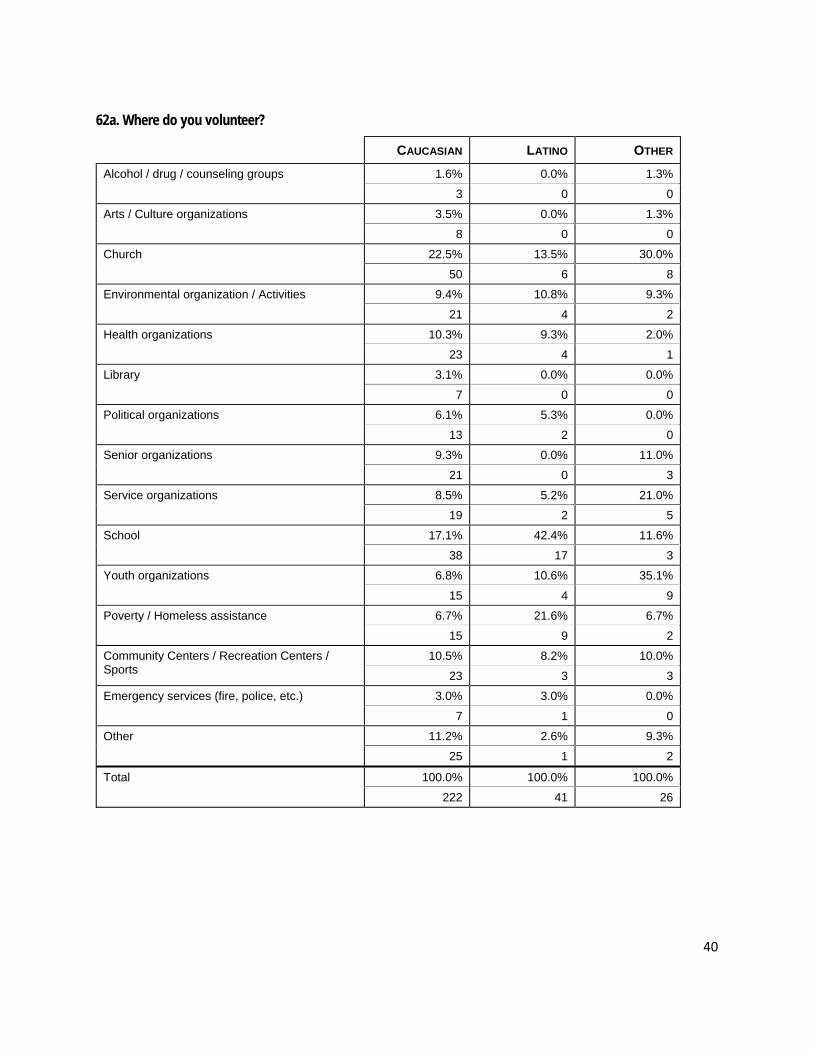
62a. Where do you volunteer?
CAUCASIAN LATINO OTHER
Alcohol / drug / counseling groups 1.6% 0.0% 1.3%
3 0 0
Arts / Culture organizations 3.5% 0.0% 1.3%
8 0 0
Church 22.5% 13.5% 30.0%
50 6 8
Environmental organization / Activities 9.4% 10.8% 9.3%
21 4 2
Health organizations 10.3% 9.3% 2.0%
23 4 1
Library 3.1% 0.0% 0.0%
7 0 0
Political organizations 6.1% 5.3% 0.0%
13 2 0
Senior organizations 9.3% 0.0% 11.0%
21 0 3
Service organizations 8.5% 5.2% 21.0%
19 2 5
School 17.1% 42.4% 11.6%
38 17 3
Youth organizations 6.8% 10.6% 35.1%
15 4 9
Poverty / Homeless assistance 6.7% 21.6% 6.7%
15 9 2
Community Centers / Recreation Centers / Sports
10.5% 8.2% 10.0%
23 3 3
Emergency services (fire, police, etc.) 3.0% 3.0% 0.0%
7 1 0
Other 11.2% 2.6% 9.3%
25 1 2
Total 100.0% 100.0% 100.0%
222 41 26
41
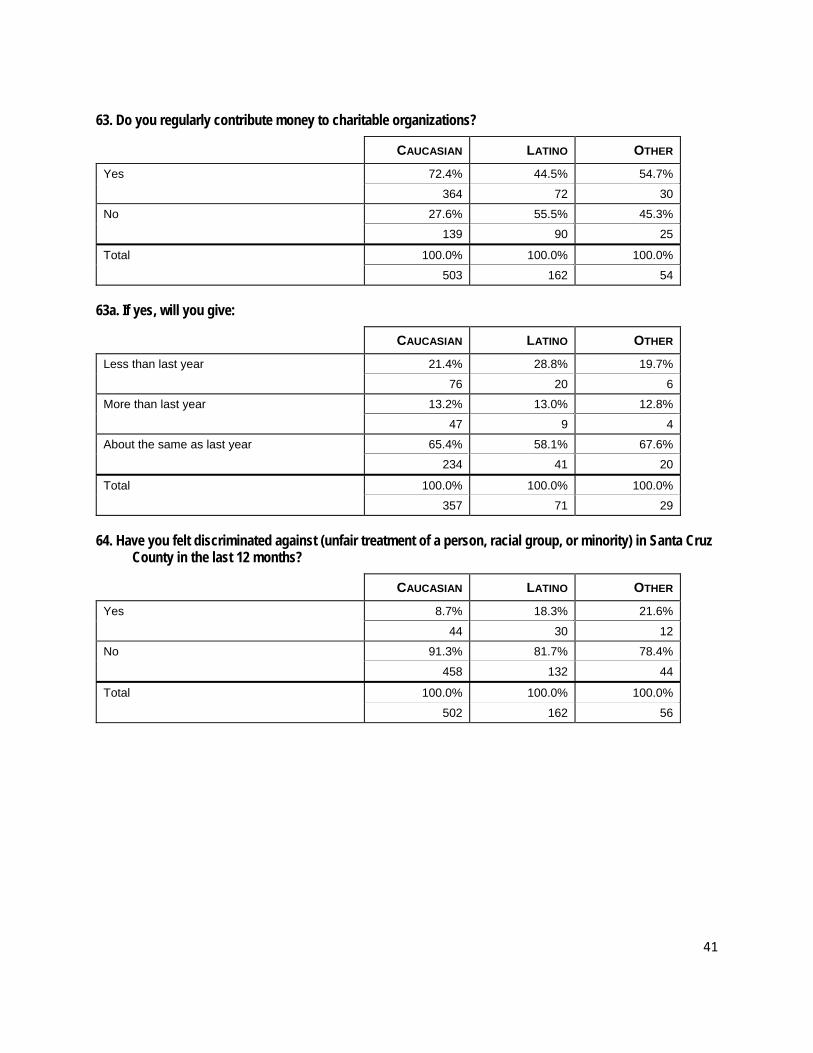
63. Do you regularly contribute money to charitable organizations?
CAUCASIAN LATINO OTHER
Yes 72.4% 44.5% 54.7%
364 72 30
No 27.6% 55.5% 45.3%
139 90 25
Total 100.0% 100.0% 100.0%
503 162 54
63a. If yes, will you give:
CAUCASIAN LATINO OTHER
Less than last year 21.4% 28.8% 19.7%
76 20 6
More than last year 13.2% 13.0% 12.8%
47 9 4
About the same as last year 65.4% 58.1% 67.6%
234 41 20
Total 100.0% 100.0% 100.0%
357 71 29
64. Have you felt discriminated against (unfair treatment of a person, racial group, or minority) in Santa Cruz County in the last 12 months?
CAUCASIAN LATINO OTHER
Yes 8.7% 18.3% 21.6%
44 30 12
No 91.3% 81.7% 78.4%
458 132 44
Total 100.0% 100.0% 100.0%
502 162 56
42
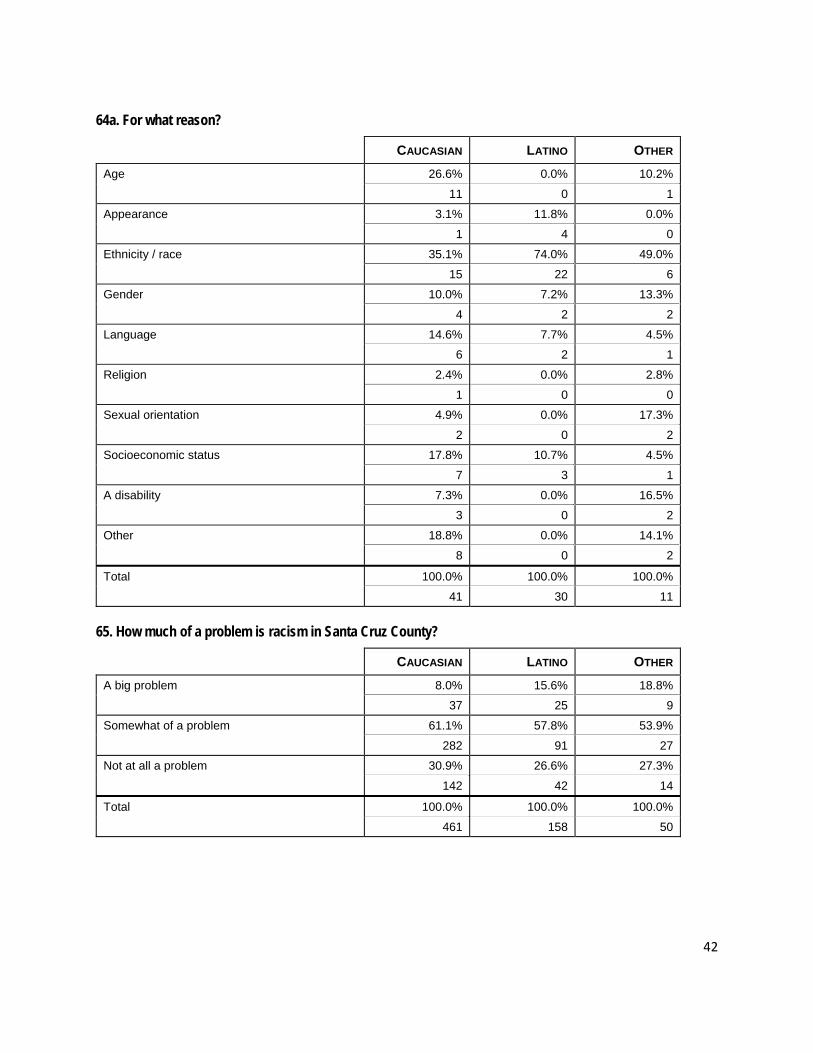
64a. For what reason?
CAUCASIAN LATINO OTHER
Age 26.6% 0.0% 10.2%
11 0 1
Appearance 3.1% 11.8% 0.0%
1 4 0
Ethnicity / race 35.1% 74.0% 49.0%
15 22 6
Gender 10.0% 7.2% 13.3%
4 2 2
Language 14.6% 7.7% 4.5%
6 2 1
Religion 2.4% 0.0% 2.8%
1 0 0
Sexual orientation 4.9% 0.0% 17.3%
2 0 2
Socioeconomic status 17.8% 10.7% 4.5%
7 3 1
A disability 7.3% 0.0% 16.5%
3 0 2
Other 18.8% 0.0% 14.1%
8 0 2
Total 100.0% 100.0% 100.0%
41 30 11
65. How much of a problem is racism in Santa Cruz County?
CAUCASIAN LATINO OTHER
A big problem 8.0% 15.6% 18.8%
37 25 9
Somewhat of a problem 61.1% 57.8% 53.9%
282 91 27
Not at all a problem 30.9% 26.6% 27.3%
142 42 14
Total 100.0% 100.0% 100.0%
461 158 50
43
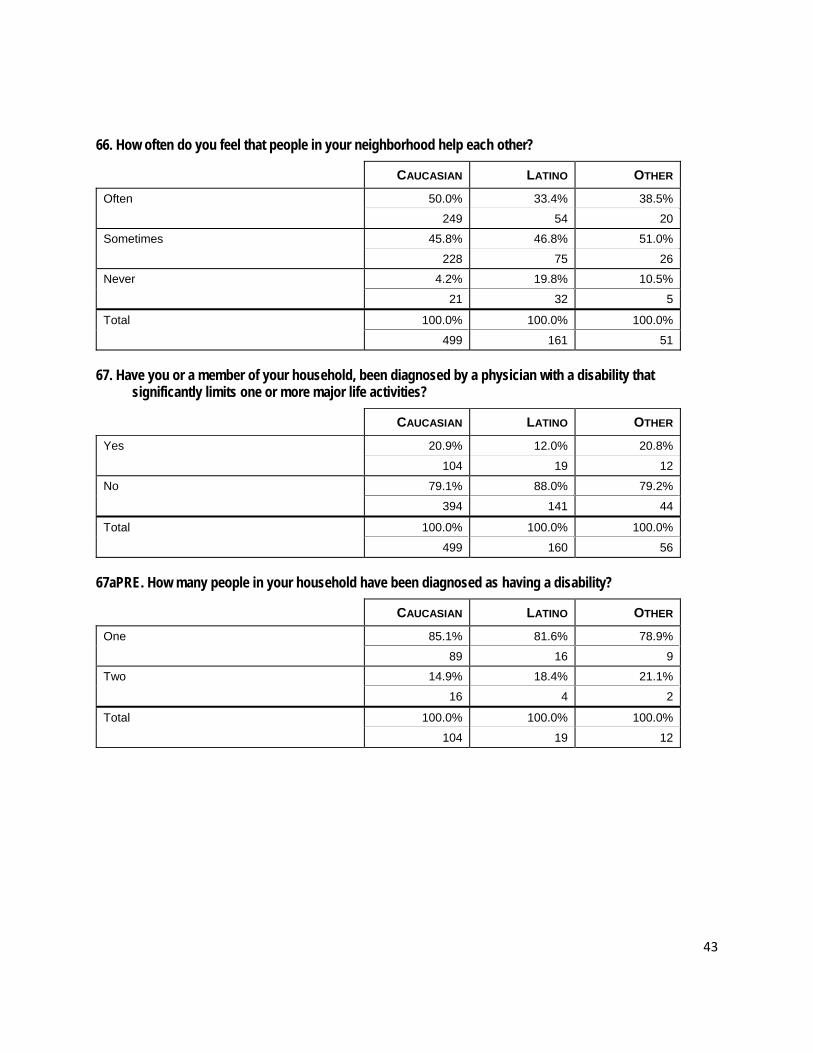
66. How often do you feel that people in your neighborhood help each other?
CAUCASIAN LATINO OTHER
Often 50.0% 33.4% 38.5%
249 54 20
Sometimes 45.8% 46.8% 51.0%
228 75 26
Never 4.2% 19.8% 10.5%
21 32 5
Total 100.0% 100.0% 100.0%
499 161 51
67. Have you or a member of your household, been diagnosed by a physician with a disability that significantly limits one or more major life activities?
CAUCASIAN LATINO OTHER
Yes 20.9% 12.0% 20.8%
104 19 12
No 79.1% 88.0% 79.2%
394 141 44
Total 100.0% 100.0% 100.0%
499 160 56
67aPRE. How many people in your household have been diagnosed as having a disability?
CAUCASIAN LATINO OTHER
One 85.1% 81.6% 78.9%
89 16 9
Two 14.9% 18.4% 21.1%
16 4 2
Total 100.0% 100.0% 100.0%
104 19 12
44
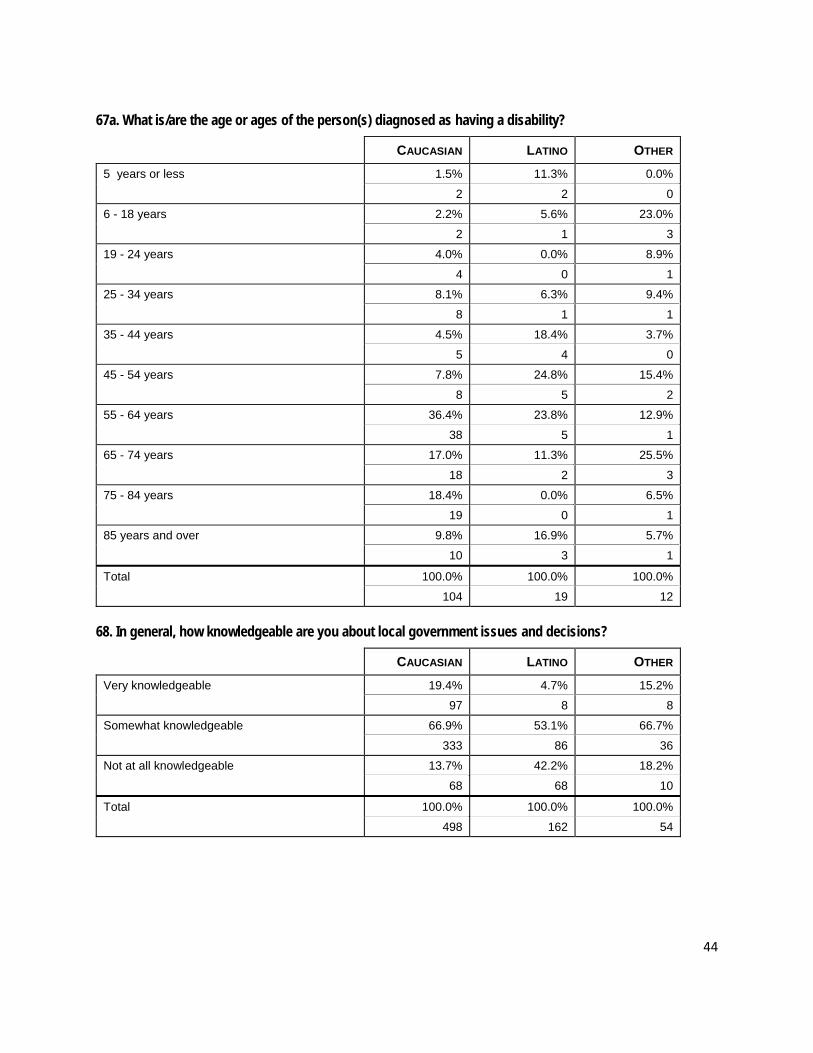
67a. What is/are the age or ages of the person(s) diagnosed as having a disability?
CAUCASIAN LATINO OTHER
5 years or less 1.5% 11.3% 0.0%
2 2 0
6 - 18 years 2.2% 5.6% 23.0%
2 1 3
19 - 24 years 4.0% 0.0% 8.9%
4 0 1
25 - 34 years 8.1% 6.3% 9.4%
8 1 1
35 - 44 years 4.5% 18.4% 3.7%
5 4 0
45 - 54 years 7.8% 24.8% 15.4%
8 5 2
55 - 64 years 36.4% 23.8% 12.9%
38 5 1
65 - 74 years 17.0% 11.3% 25.5%
18 2 3
75 - 84 years 18.4% 0.0% 6.5%
19 0 1
85 years and over 9.8% 16.9% 5.7%
10 3 1
Total 100.0% 100.0% 100.0%
104 19 12
68. In general, how knowledgeable are you about local government issues and decisions?
CAUCASIAN LATINO OTHER
Very knowledgeable 19.4% 4.7% 15.2%
97 8 8
Somewhat knowledgeable 66.9% 53.1% 66.7%
333 86 36
Not at all knowledgeable 13.7% 42.2% 18.2%
68 68 10
Total 100.0% 100.0% 100.0%
498 162 54
45
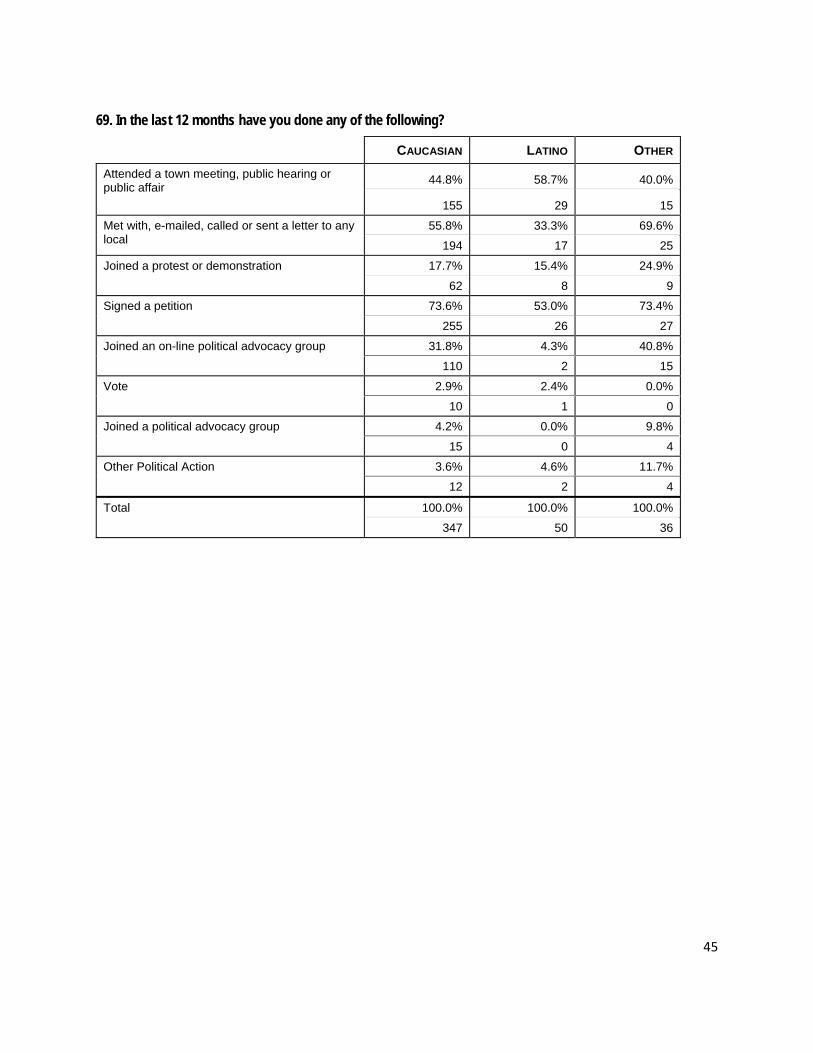
69. In the last 12 months have you done any of the following?
CAUCASIAN LATINO OTHER
Attended a town meeting, public hearing or public affair
44.8% 58.7% 40.0%
155 29 15
Met with, e-mailed, called or sent a letter to any local
55.8% 33.3% 69.6%
194 17 25
Joined a protest or demonstration 17.7% 15.4% 24.9%
62 8 9
Signed a petition 73.6% 53.0% 73.4%
255 26 27
Joined an on-line political advocacy group 31.8% 4.3% 40.8%
110 2 15
Vote 2.9% 2.4% 0.0%
10 1 0
Joined a political advocacy group 4.2% 0.0% 9.8%
15 0 4
Other Political Action 3.6% 4.6% 11.7%
12 2 4
Total 100.0% 100.0% 100.0%
347 50 36
46
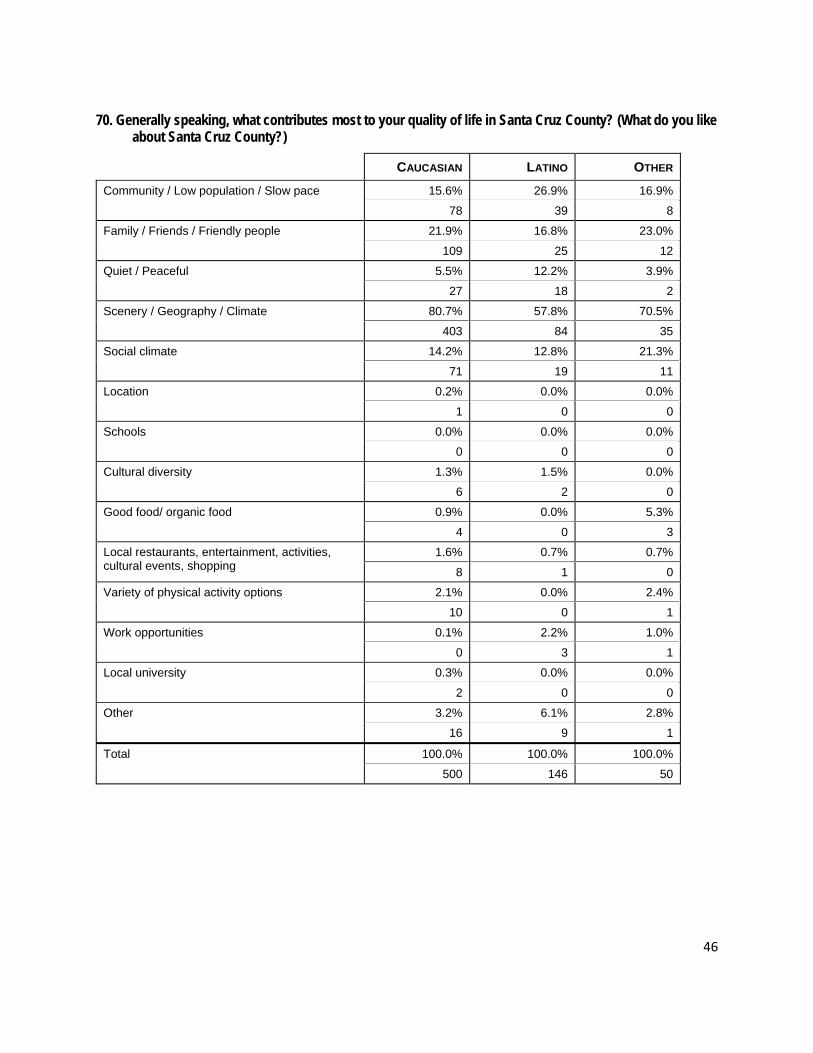
70. Generally speaking, what contributes most to your quality of life in Santa Cruz County? (What do you like about Santa Cruz County?)
CAUCASIAN LATINO OTHER
Community / Low population / Slow pace 15.6% 26.9% 16.9%
78 39 8
Family / Friends / Friendly people 21.9% 16.8% 23.0%
109 25 12
Quiet / Peaceful 5.5% 12.2% 3.9%
27 18 2
Scenery / Geography / Climate 80.7% 57.8% 70.5%
403 84 35
Social climate 14.2% 12.8% 21.3%
71 19 11
Location 0.2% 0.0% 0.0%
1 0 0
Schools 0.0% 0.0% 0.0%
0 0 0
Cultural diversity 1.3% 1.5% 0.0%
6 2 0
Good food/ organic food 0.9% 0.0% 5.3%
4 0 3
Local restaurants, entertainment, activities, cultural events, shopping
1.6% 0.7% 0.7%
8 1 0
Variety of physical activity options 2.1% 0.0% 2.4%
10 0 1
Work opportunities 0.1% 2.2% 1.0%
0 3 1
Local university 0.3% 0.0% 0.0%
2 0 0
Other 3.2% 6.1% 2.8%
16 9 1
Total 100.0% 100.0% 100.0%
500 146 50
47
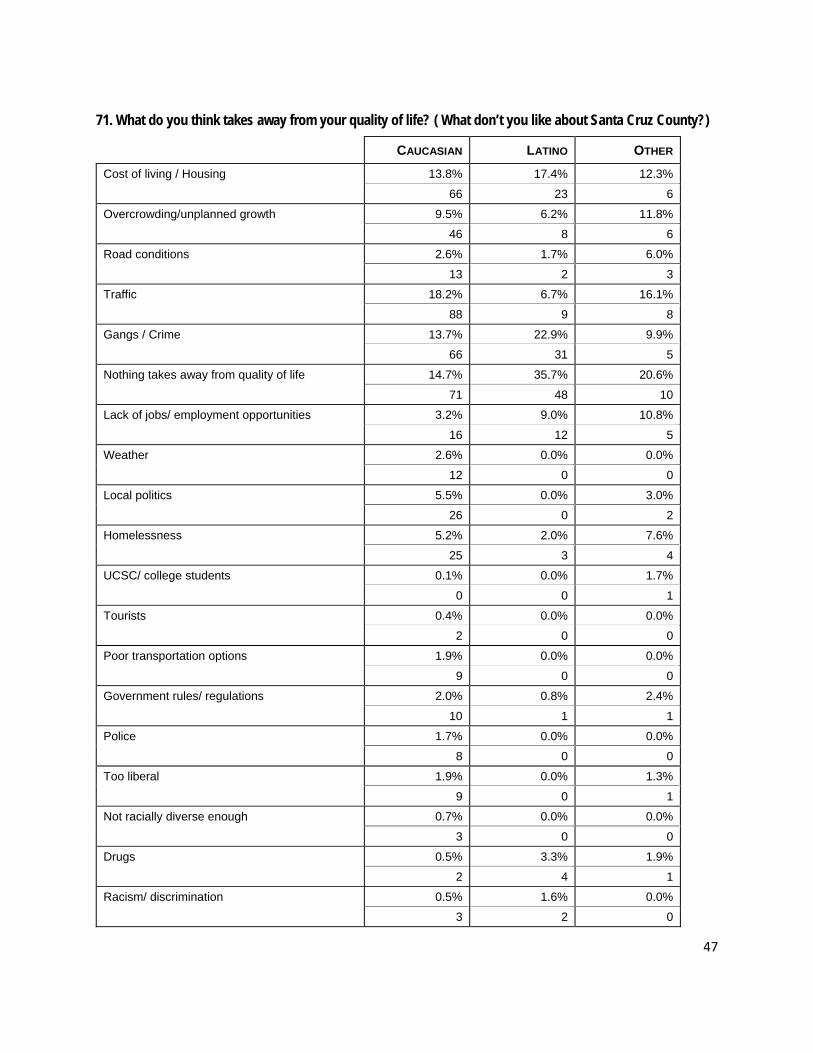
71. What do you think takes away from your quality of life? ( What don’t you like about Santa Cruz County?)
CAUCASIAN LATINO OTHER
Cost of living / Housing 13.8% 17.4% 12.3%
66 23 6
Overcrowding/unplanned growth 9.5% 6.2% 11.8%
46 8 6
Road conditions 2.6% 1.7% 6.0%
13 2 3
Traffic 18.2% 6.7% 16.1%
88 9 8
Gangs / Crime 13.7% 22.9% 9.9%
66 31 5
Nothing takes away from quality of life 14.7% 35.7% 20.6%
71 48 10
Lack of jobs/ employment opportunities 3.2% 9.0% 10.8%
16 12 5
Weather 2.6% 0.0% 0.0%
12 0 0
Local politics 5.5% 0.0% 3.0%
26 0 2
Homelessness 5.2% 2.0% 7.6%
25 3 4
UCSC/ college students 0.1% 0.0% 1.7%
0 0 1
Tourists 0.4% 0.0% 0.0%
2 0 0
Poor transportation options 1.9% 0.0% 0.0%
9 0 0
Government rules/ regulations 2.0% 0.8% 2.4%
10 1 1
Police 1.7% 0.0% 0.0%
8 0 0
Too liberal 1.9% 0.0% 1.3%
9 0 1
Not racially diverse enough 0.7% 0.0% 0.0%
3 0 0
Drugs 0.5% 3.3% 1.9%
2 4 1
Racism/ discrimination 0.5% 1.6% 0.0%
3 2 0
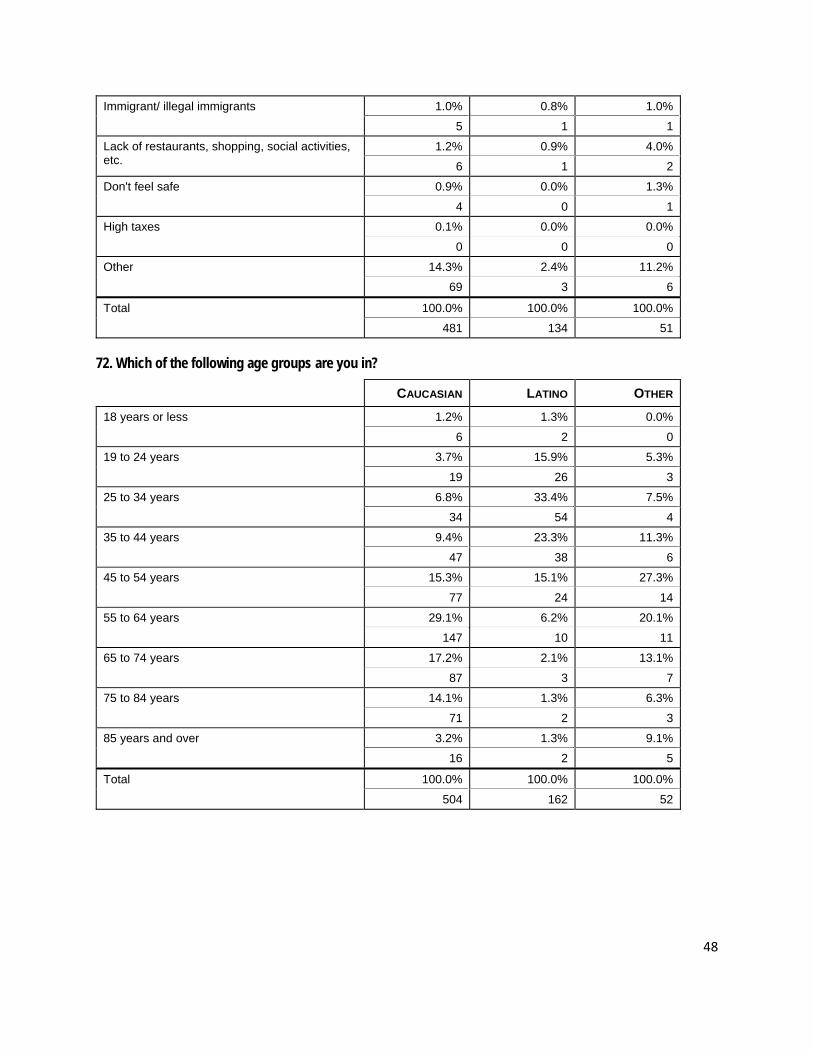
48
Immigrant/ illegal immigrants 1.0% 0.8% 1.0%
5 1 1
Lack of restaurants, shopping, social activities, etc.
1.2% 0.9% 4.0%
6 1 2
Don't feel safe 0.9% 0.0% 1.3%
4 0 1
High taxes 0.1% 0.0% 0.0%
0 0 0
Other 14.3% 2.4% 11.2%
69 3 6
Total 100.0% 100.0% 100.0%
481 134 51
72. Which of the following age groups are you in?
CAUCASIAN LATINO OTHER
18 years or less 1.2% 1.3% 0.0%
6 2 0
19 to 24 years 3.7% 15.9% 5.3%
19 26 3
25 to 34 years 6.8% 33.4% 7.5%
34 54 4
35 to 44 years 9.4% 23.3% 11.3%
47 38 6
45 to 54 years 15.3% 15.1% 27.3%
77 24 14
55 to 64 years 29.1% 6.2% 20.1%
147 10 11
65 to 74 years 17.2% 2.1% 13.1%
87 3 7
75 to 84 years 14.1% 1.3% 6.3%
71 2 3
85 years and over 3.2% 1.3% 9.1%
16 2 5
Total 100.0% 100.0% 100.0%
504 162 52
49
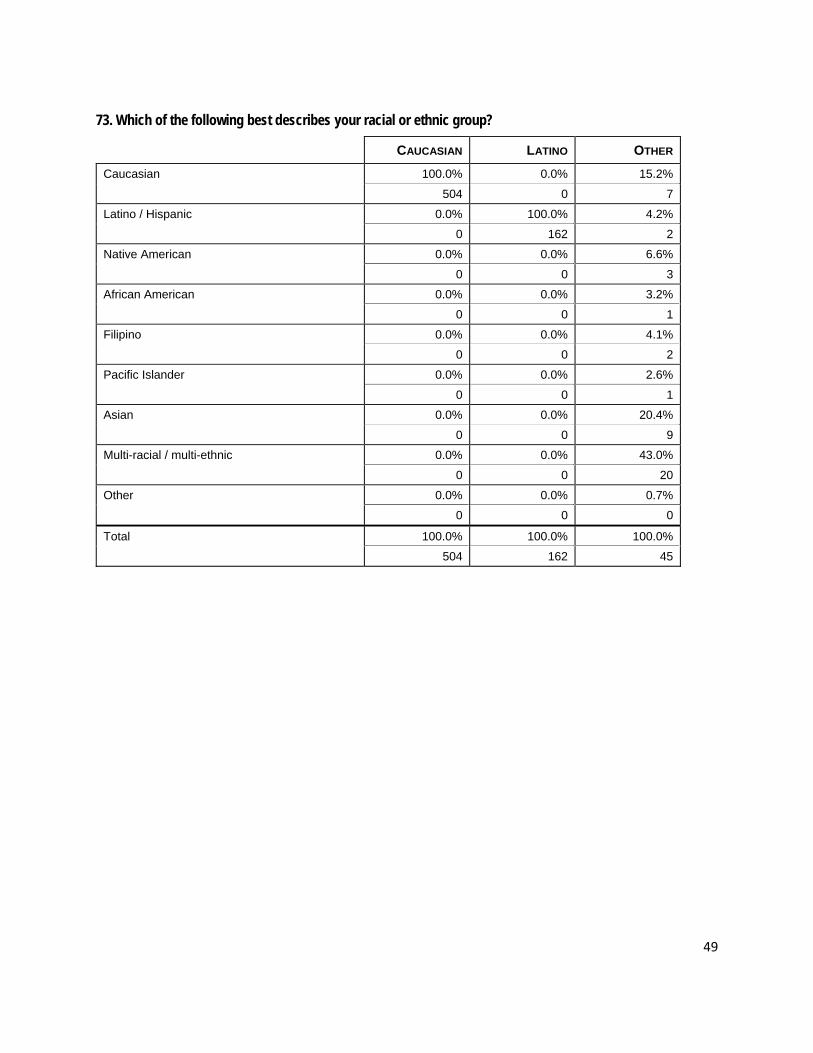
73. Which of the following best describes your racial or ethnic group?
CAUCASIAN LATINO OTHER
Caucasian 100.0% 0.0% 15.2%
504 0 7
Latino / Hispanic 0.0% 100.0% 4.2%
0 162 2
Native American 0.0% 0.0% 6.6%
0 0 3
African American 0.0% 0.0% 3.2%
0 0 1
Filipino 0.0% 0.0% 4.1%
0 0 2
Pacific Islander 0.0% 0.0% 2.6%
0 0 1
Asian 0.0% 0.0% 20.4%
0 0 9
Multi-racial / multi-ethnic 0.0% 0.0% 43.0%
0 0 20
Other 0.0% 0.0% 0.7%
0 0 0
Total 100.0% 100.0% 100.0%
504 162 45
50
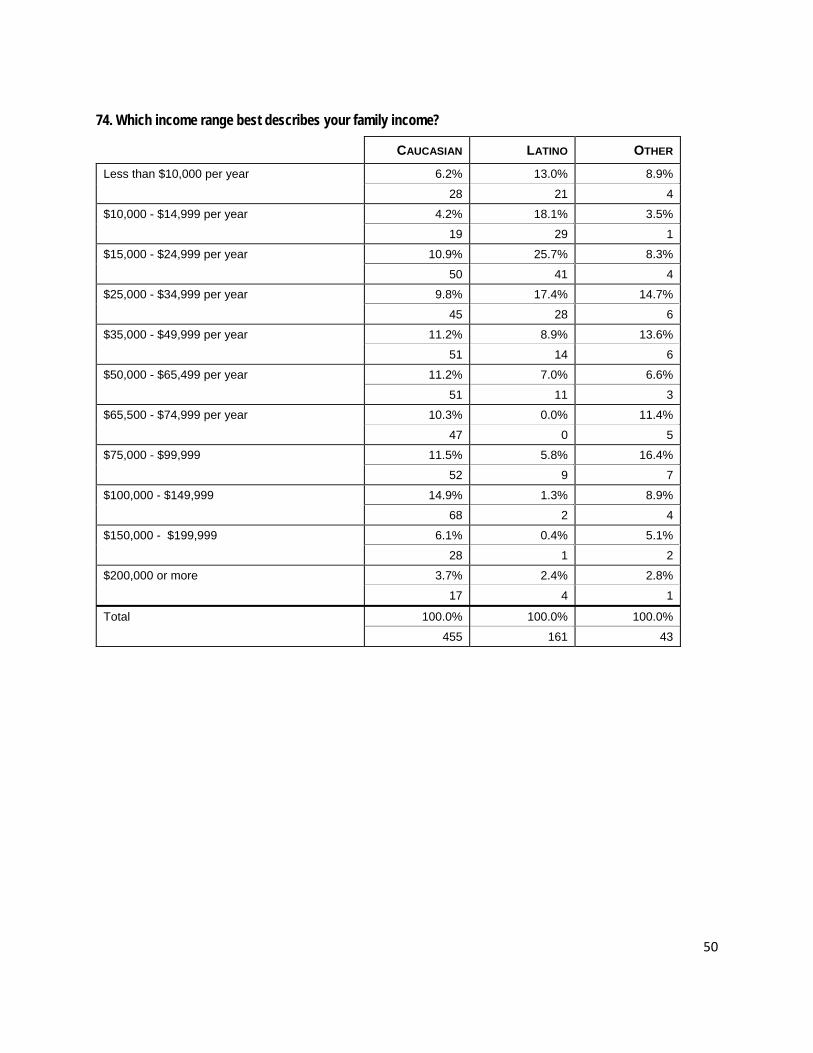
74. Which income range best describes your family income?
CAUCASIAN LATINO OTHER
Less than $10,000 per year 6.2% 13.0% 8.9%
28 21 4
$10,000 - $14,999 per year 4.2% 18.1% 3.5%
19 29 1
$15,000 - $24,999 per year 10.9% 25.7% 8.3%
50 41 4
$25,000 - $34,999 per year 9.8% 17.4% 14.7%
45 28 6
$35,000 - $49,999 per year 11.2% 8.9% 13.6%
51 14 6
$50,000 - $65,499 per year 11.2% 7.0% 6.6%
51 11 3
$65,500 - $74,999 per year 10.3% 0.0% 11.4%
47 0 5
$75,000 - $99,999 11.5% 5.8% 16.4%
52 9 7
$100,000 - $149,999 14.9% 1.3% 8.9%
68 2 4
$150,000 - $199,999 6.1% 0.4% 5.1%
28 1 2
$200,000 or more 3.7% 2.4% 2.8%
17 4 1
Total 100.0% 100.0% 100.0%
455 161 43
51
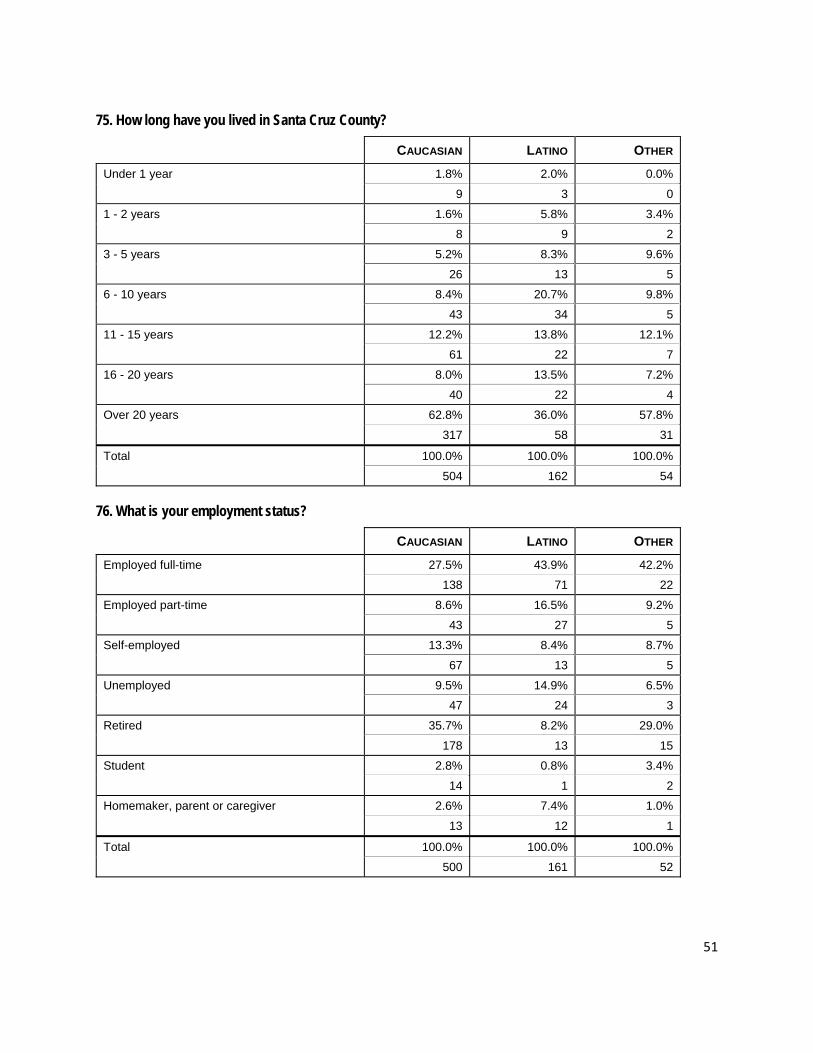
75. How long have you lived in Santa Cruz County?
CAUCASIAN LATINO OTHER
Under 1 year 1.8% 2.0% 0.0%
9 3 0
1 - 2 years 1.6% 5.8% 3.4%
8 9 2
3 - 5 years 5.2% 8.3% 9.6%
26 13 5
6 - 10 years 8.4% 20.7% 9.8%
43 34 5
11 - 15 years 12.2% 13.8% 12.1%
61 22 7
16 - 20 years 8.0% 13.5% 7.2%
40 22 4
Over 20 years 62.8% 36.0% 57.8%
317 58 31
Total 100.0% 100.0% 100.0%
504 162 54
76. What is your employment status?
CAUCASIAN LATINO OTHER
Employed full-time 27.5% 43.9% 42.2%
138 71 22
Employed part-time 8.6% 16.5% 9.2%
43 27 5
Self-employed 13.3% 8.4% 8.7%
67 13 5
Unemployed 9.5% 14.9% 6.5%
47 24 3
Retired 35.7% 8.2% 29.0%
178 13 15
Student 2.8% 0.8% 3.4%
14 1 2
Homemaker, parent or caregiver 2.6% 7.4% 1.0%
13 12 1
Total 100.0% 100.0% 100.0%
500 161 52
52
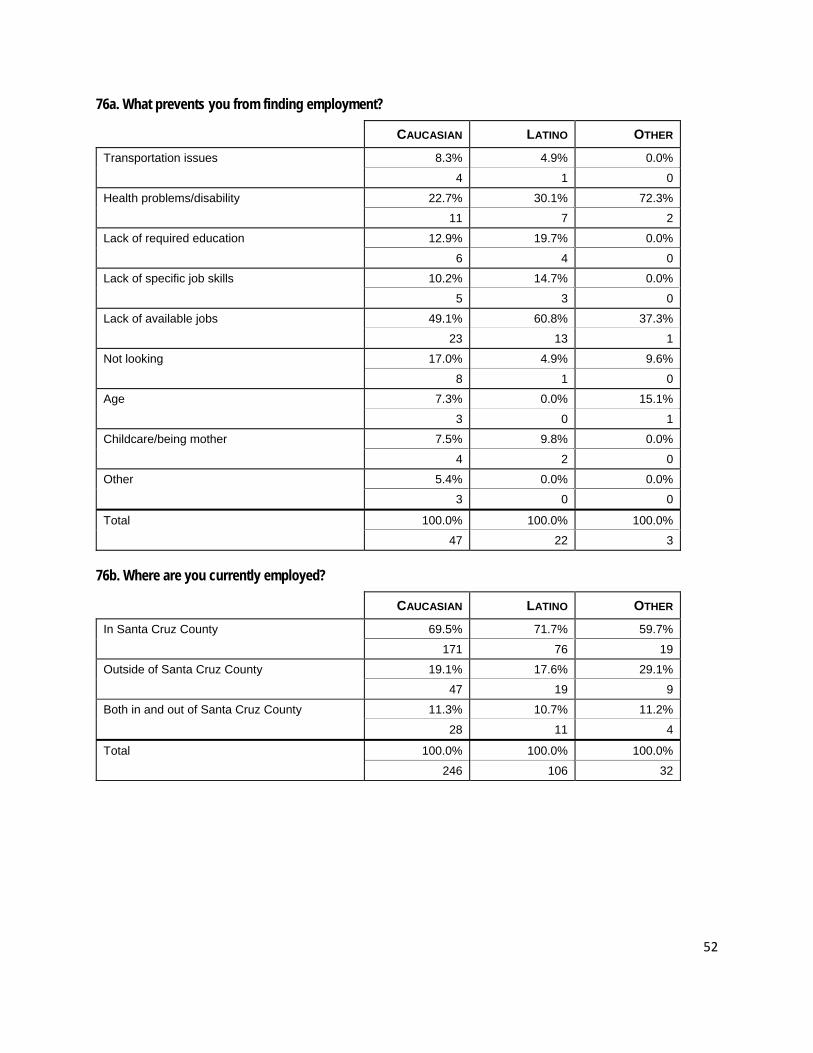
76a. What prevents you from finding employment?
CAUCASIAN LATINO OTHER
Transportation issues 8.3% 4.9% 0.0%
4 1 0
Health problems/disability 22.7% 30.1% 72.3%
11 7 2
Lack of required education 12.9% 19.7% 0.0%
6 4 0
Lack of specific job skills 10.2% 14.7% 0.0%
5 3 0
Lack of available jobs 49.1% 60.8% 37.3%
23 13 1
Not looking 17.0% 4.9% 9.6%
8 1 0
Age 7.3% 0.0% 15.1%
3 0 1
Childcare/being mother 7.5% 9.8% 0.0%
4 2 0
Other 5.4% 0.0% 0.0%
3 0 0
Total 100.0% 100.0% 100.0%
47 22 3
76b. Where are you currently employed?
CAUCASIAN LATINO OTHER
In Santa Cruz County 69.5% 71.7% 59.7%
171 76 19
Outside of Santa Cruz County 19.1% 17.6% 29.1%
47 19 9
Both in and out of Santa Cruz County 11.3% 10.7% 11.2%
28 11 4
Total 100.0% 100.0% 100.0%
246 106 32
53
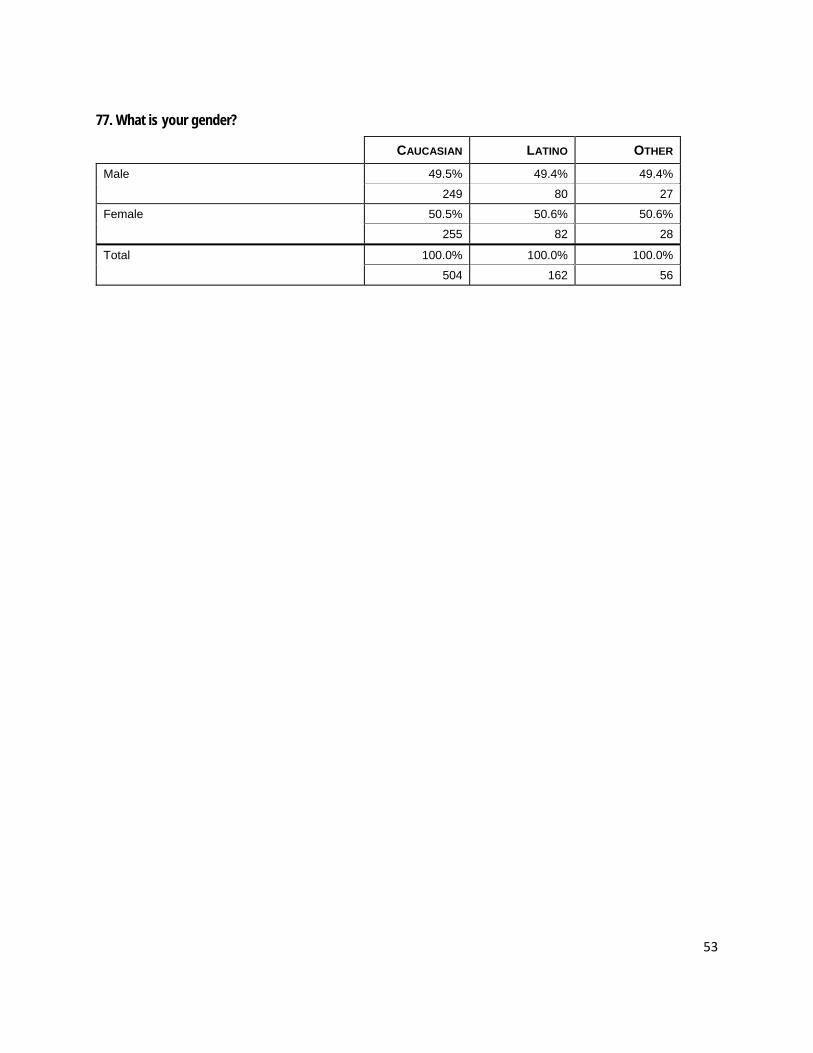
77. What is your gender?
CAUCASIAN LATINO OTHER
Male 49.5% 49.4% 49.4%
249 80 27
Female 50.5% 50.6% 50.6%
255 82 28
Total 100.0% 100.0% 100.0%
504 162 56