Embed Size (px)
Citation preview
80°W 79°W 78°W 77°W 76°W 75°W
80°W79°W
78°W77°W
76°W 75°W
–7°
–6°
–5°
–4°
–3°
–7°
–6°
–5°
–4°
–3°
MC–17
MC–2
MC–3
MC–4
MC–8 MC–9 MC–10 MC–11
MC–1
MC–16 MC–18 MC–19
MC–24
MC–25
MC–26
MC–30
120°
120° 60°
60°
30°
65°
180° 135° 90° 45° 0°
–30°
–65°
30°
65°
–30°
–65°
280°E
–2.5°
281°E 282°E 283°E 284°E 285°E
280°E281°E
282°E283°E
284°E 285°E
–7.5°
–7°
–6°
–5°
–4°
–3°
–2.5°
–7.5°
–7°
–6°
–5°
–4°
–3°
0
3000
2000
–1000
–2000
1000
–2000
4000
3000
0
0
3000
2000
3000
4000
2000
0
1000
4000
0
1000
–1000
Cet i
Mensa
C a n d o r L a b e s
C A N D O R
C H A S M A
T i t h o n i a e
C a t e n a e
P e r r o t i n
T i t h o n i a e
F o s s a e
I U S C H A S M A
I u s L a b e s
0
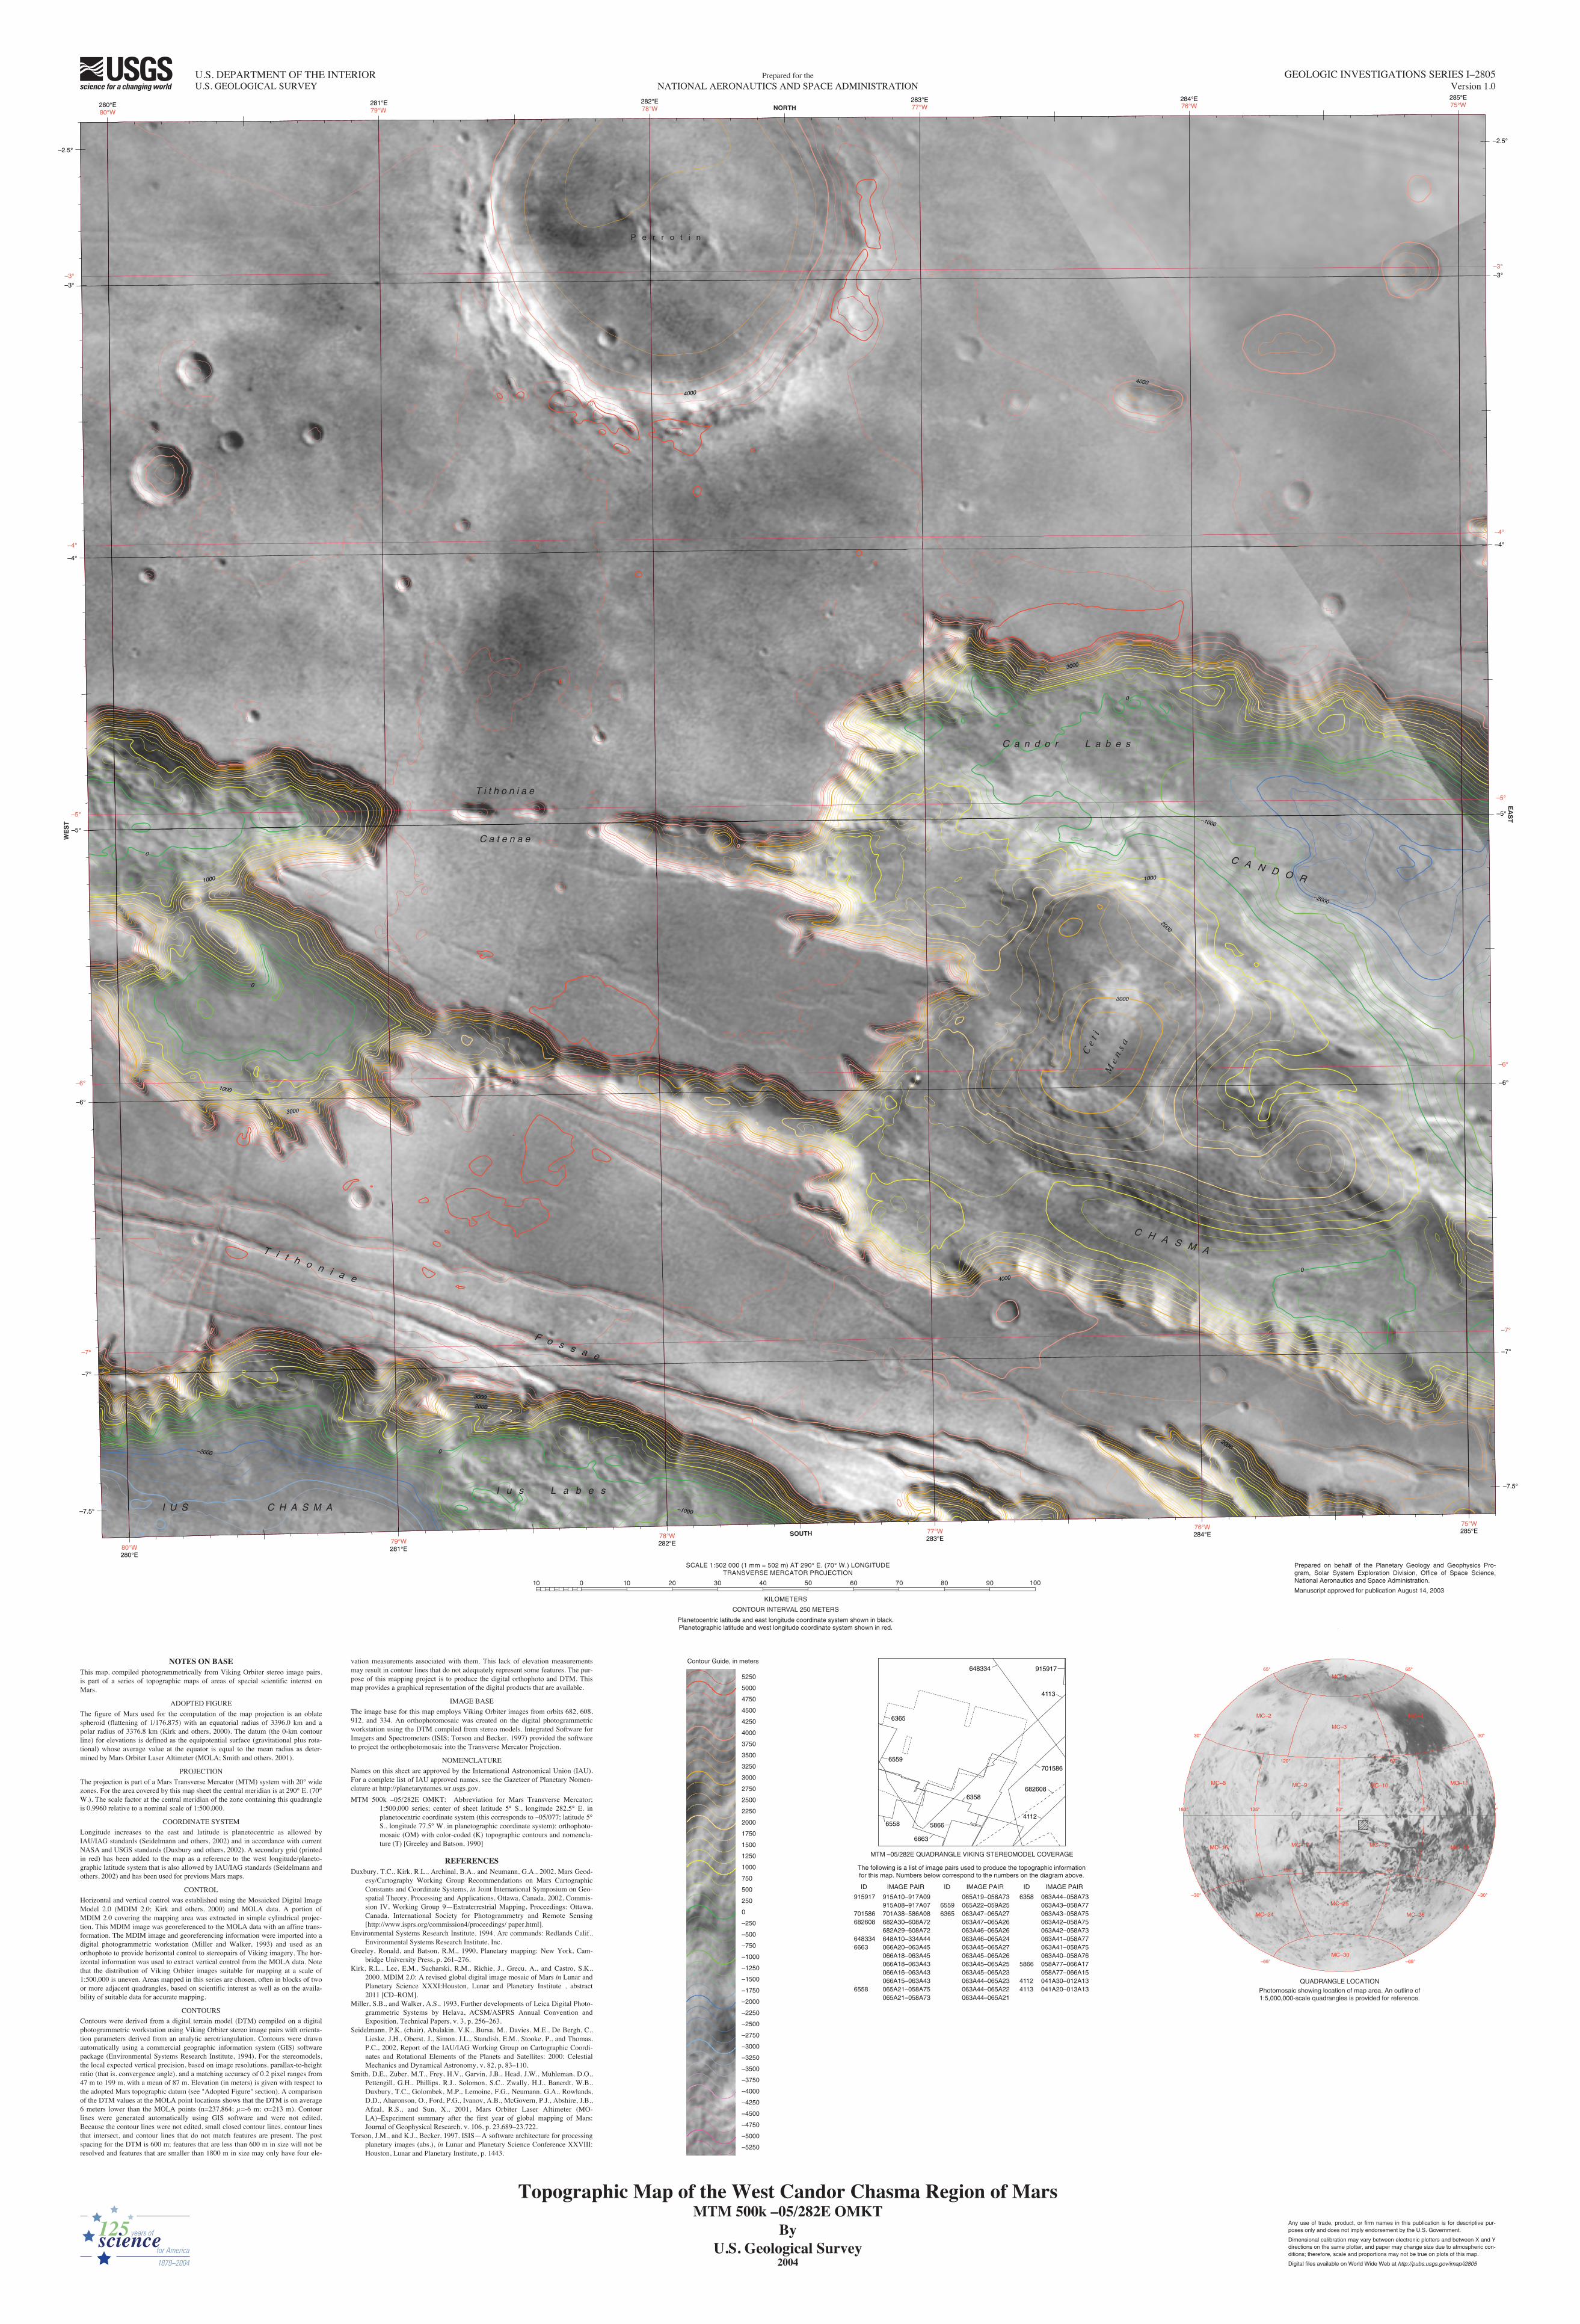
NOTES ON BASEThis map, compiled photogrammetrically from Viking Orbiter stereo image pairs, is part of a series of topographic maps of areas of special scientific interest on Mars.
ADOPTED FIGURE
The figure of Mars used for the computation of the map projection is an oblate spheroid (flattening of 1/176.875) with an equatorial radius of 3396.0 km and a polar radius of 3376.8 km (Kirk and others, 2000). The datum (the 0-km contour line) for elevations is defined as the equipotential surface (gravitational plus rota-tional) whose average value at the equator is equal to the mean radius as deter-mined by Mars Orbiter Laser Altimeter (MOLA; Smith and others, 2001).
PROJECTION
The projection is part of a Mars Transverse Mercator (MTM) system with 20° wide zones. For the area covered by this map sheet the central meridian is at 290° E. (70° W.). The scale factor at the central meridian of the zone containing this quadrangle is 0.9960 relative to a nominal scale of 1:500,000.
COORDINATE SYSTEM
Longitude increases to the east and latitude is planetocentric as allowed by IAU/IAG standards (Seidelmann and others, 2002) and in accordance with current NASA and USGS standards (Duxbury and others, 2002). A secondary grid (printed in red) has been added to the map as a reference to the west longitude/planeto-graphic latitude system that is also allowed by IAU/IAG standards (Seidelmann and others, 2002) and has been used for previous Mars maps.
CONTROL
Horizontal and vertical control was established using the Mosaicked Digital Image Model 2.0 (MDIM 2.0; Kirk and others, 2000) and MOLA data. A portion of MDIM 2.0 covering the mapping area was extracted in simple cylindrical projec-tion. This MDIM image was georeferenced to the MOLA data with an affine trans-formation. The MDIM image and georeferencing information were imported into a digital photogrammetric workstation (Miller and Walker, 1993) and used as an orthophoto to provide horizontal control to stereopairs of Viking imagery. The hor-izontal information was used to extract vertical control from the MOLA data. Note that the distribution of Viking Orbiter images suitable for mapping at a scale of 1:500,000 is uneven. Areas mapped in this series are chosen, often in blocks of two or more adjacent quadrangles, based on scientific interest as well as on the availa-bility of suitable data for accurate mapping.
CONTOURS
Contours were derived from a digital terrain model (DTM) compiled on a digital photogrammetric workstation using Viking Orbiter stereo image pairs with orienta-tion parameters derived from an analytic aerotriangulation. Contours were drawn automatically using a commercial geographic information system (GIS) software package (Environmental Systems Research Institute, 1994). For the stereomodels, the local expected vertical precision, based on image resolutions, parallax-to-height ratio (that is, convergence angle), and a matching accuracy of 0.2 pixel ranges from 47 m to 199 m, with a mean of 87 m. Elevation (in meters) is given with respect to the adopted Mars topographic datum (see "Adopted Figure" section). A comparison of the DTM values at the MOLA point locations shows that the DTM is on average 6 meters lower than the MOLA points (n=237,864; µ=-6 m; σ=213 m). Contour lines were generated automatically using GIS software and were not edited. Because the contour lines were not edited, small closed contour lines, contour lines that intersect, and contour lines that do not match features are present. The post spacing for the DTM is 600 m; features that are less than 600 m in size will not be resolved and features that are smaller than 1800 m in size may only have four ele-
vation measurements associated with them. This lack of elevation measurements may result in contour lines that do not adequately represent some features. The pur-pose of this mapping project is to produce the digital orthophoto and DTM. This map provides a graphical representation of the digital products that are available.
IMAGE BASE
The image base for this map employs Viking Orbiter images from orbits 682, 608, 912, and 334. An orthophotomosaic was created on the digital photogrammetric workstation using the DTM compiled from stereo models. Integrated Software for Imagers and Spectrometers (ISIS; Torson and Becker, 1997) provided the software to project the orthophotomosaic into the Transverse Mercator Projection.
NOMENCLATURE
Names on this sheet are approved by the International Astronomical Union (IAU). For a complete list of IAU approved names, see the Gazeteer of Planetary Nomen-clature at http://planetarynames.wr.usgs.gov.
MTM 500k –05/282E OMKT: Abbreviation for Mars Transverse Mercator; 1:500,000 series; center of sheet latitude 5° S., longitude 282.5° E. in planetocentric coordinate system (this corresponds to –05/077; latitude 5° S., longitude 77.5° W. in planetographic coordinate system); orthophoto-mosaic (OM) with color-coded (K) topographic contours and nomencla-ture (T) [Greeley and Batson, 1990]
REFERENCESDuxbury, T.C., Kirk, R.L., Archinal, B.A., and Neumann, G.A., 2002, Mars Geod-
esy/Cartography Working Group Recommendations on Mars Cartographic Constants and Coordinate Systems, in Joint International Symposium on Geo-spatial Theory, Processing and Applications, Ottawa, Canada, 2002, Commis-sion IV, Working Group 9—Extraterrestrial Mapping, Proceedings: Ottawa, Canada, International Society for Photogrammetry and Remote Sensing [http://www.isprs.org/commission4/proceedings/ paper.html].
Environmental Systems Research Institute, 1994, Arc commands: Redlands Calif., Environmental Systems Research Institute, Inc.
Greeley, Ronald, and Batson, R.M., 1990, Planetary mapping: New York, Cam-bridge University Press, p. 261–276.
Kirk, R.L., Lee, E.M., Sucharski, R.M., Richie, J., Grecu, A., and Castro, S.K., 2000, MDIM 2.0: A revised global digital image mosaic of Mars in Lunar and Planetary Science XXXI:Houston, Lunar and Planetary Institute , abstract 2011 [CD–ROM].
Miller, S.B., and Walker, A.S., 1993, Further developments of Leica Digital Photo-grammetric Systems by Helava, ACSM/ASPRS Annual Convention and Exposition, Technical Papers, v. 3, p. 256–263.
Seidelmann, P.K. (chair), Abalakin, V.K., Bursa, M., Davies, M.E., De Bergh, C., Lieske, J.H., Oberst, J., Simon, J.L., Standish, E.M., Stooke, P., and Thomas, P.C., 2002, Report of the IAU/IAG Working Group on Cartographic Coordi-nates and Rotational Elements of the Planets and Satellites: 2000: Celestial Mechanics and Dynamical Astronomy, v. 82, p. 83–110.
Smith, D.E., Zuber, M.T., Frey, H.V., Garvin, J.B., Head, J.W., Muhleman, D.O., Pettengill, G.H., Phillips, R.J., Solomon, S.C., Zwally, H.J., Banerdt, W.B., Duxbury, T.C., Golombek, M.P., Lemoine, F.G., Neumann, G.A., Rowlands, D.D., Aharonson, O., Ford, P.G., Ivanov, A.B., McGovern, P.J., Abshire, J.B., Afzal, R.S., and Sun, X., 2001, Mars Orbiter Laser Altimeter (MO-LA)–Experiment summary after the first year of global mapping of Mars: Journal of Geophysical Research, v. 106, p. 23,689–23,722.
Torson, J.M., and K.J., Becker, 1997, ISIS—A software architecture for processing planetary images (abs.), in Lunar and Planetary Science Conference XXVIII: Houston, Lunar and Planetary Institute, p. 1443.
NORTH
SOUTH
WEST
EAST
U.S. DEPARTMENT OF THE INTERIORU.S. GEOLOGICAL SURVEY
GEOLOGIC INVESTIGATIONS SERIES I–2805Version 1.0
Prepared for the
NATIONAL AERONAUTICS AND SPACE ADMINISTRATION
Prepared on behalf of the Planetary Geology and Geophysics Pro-gram, Solar System Exploration Division, Office of Space Science, National Aeronautics and Space Administration.
Manuscript approved for publication August 14, 2003
SCALE 1:502 000 (1 mm = 502 m) AT 290° E. (70° W.) LONGITUDETRANSVERSE MERCATOR PROJECTION
10 20 30 40 60 80 90 100 70
KILOMETERS
CONTOUR INTERVAL 250 METERS
Planetocentric latitude and east longitude coordinate system shown in black.Planetographic latitude and west longitude coordinate system shown in red.
10 50
QUADRANGLE LOCATIONPhotomosaic showing location of map area. An outline of 1:5,000,000-scale quadrangles is provided for reference.
6558
682608
4112
6663
6358
915917
4113
5866
648334
7015866559
6365
5250
5000
4750
4500
4250
4000
3750
3500
3250
3000
2750
2500
2250
2000
1750
1500
1250
1000
750
500
250
0
–250
–500
–750
–1000
–1250
–1500
–1750
–2000
–2250
–2500
–2750
–3000
–3250
–3500
–3750
–4000
–4250
–4500
–4750
–5000
–5250
Contour Guide, in meters
The following is a list of image pairs used to produce the topographic information for this map. Numbers below correspond to the numbers on the diagram above.
ID IMAGE PAIR ID IMAGE PAIR ID IMAGE PAIR
915917 915A10–917A09 065A19–058A73 6358 063A44–058A73 915A08–917A07 6559 065A22–059A25 063A43–058A77701586 701A38–586A08 6365 063A47–065A27 063A43–058A75682608 682A30–608A72 063A47–065A26 063A42–058A75 682A29–608A72 063A46–065A26 063A42–058A73648334 648A10–334A44 063A46–065A24 063A41–058A776663 066A20–063A45 063A45–065A27 063A41–058A75 066A18–063A45 063A45–065A26 063A40–058A76 066A18–063A43 063A45–065A25 5866 058A77–066A17 066A16–063A43 063A45–065A23 058A77–066A15 066A15–063A43 063A44–065A23 4112 041A30–012A136558 065A21–058A75 063A44–065A22 4113 041A20–013A13 065A21–058A73 063A44–065A21
MTM –05/282E QUADRANGLE VIKING STEREOMODEL COVERAGE
Topographic Map of the West Candor Chasma Region of MarsMTM 500k –05/282E OMKT
ByU.S. Geological Survey
2004
Any use of trade, product, or firm names in this publication is for descriptive pur-poses only and does not imply endorsement by the U.S. Government.
Dimensional calibration may vary between electronic plotters and between X and Y directions on the same plotter, and paper may change size due to atmospheric con-ditions; therefore, scale and proportions may not be true on plots of this map.
Digital files available on World Wide Web at http://pubs.usgs.gov/imap/i2805

![Chasma - J. López-Montes€¦ · Chasma [plural, chasmata]: Astrogeology. A deep, elongated, steep-sided valley or gorge on a planet's rocky surface. This term is regulated by the](https://img.pdfslide.us/doc/110x75/5f0a4ce77e708231d42afb28/chasma-j-lpez-montes-chasma-plural-chasmata-astrogeology-a-deep-elongated.jpg)