Embed Size (px)
Citation preview

Volume 52 • Number 1 • January/February 2002 23
CA Cancer J Clin 2002;52:23-47
ABSTRACT Every year the American Cancer Society estimates the number of new cancer
cases and deaths expected in the United States in the current year and compiles the most
recent data on cancer incidence, mortality, and survival, using National Cancer Institute (NCI)
incidence and National Center for Health Statistics (NCHS) mortality data. Incidence and
death rates are age adjusted to the 1970 US standard population. It is estimated that
1,284,900 new cases of cancer will be diagnosed and 555,500 people will die from cancer in
the United States in the year 2002. From 1992 to 1998, cancer death rates declined in males
and females, while cancer incidence rates decreased among males and increased slightly
among females. Most notably, African-American men showed the largest decline for both
incidence and mortality. Nevertheless, African Americans still carry the highest burden of
cancer with later-stage cancer diagnosis and poorer survival compared with whites. Despite
the continued decline in cancer death rates, the total number of recorded cancer deaths in
the United States continues to increase slightly due to the aging and expanding population.
(CA Cancer J Clin 2002;52:23-47.)
INTRODUCTION
At present, cancer remains a major public health problem in the United States andin other developed countries as well. One in four deaths in the United States iscaused by cancer. In order to provide an up-to-date perspective on the occurrenceof cancer, the American Cancer Society presents this overview of cancer frequency,incidence, mortality, and survival statistics for the year 2002.
MATERIALS AND METHODS
Data Sources
Mortality data were obtained from the National Center for Health Statistics (NCHS).1 Incidencedata, including five-year relative survival rate data and data on lifetime probability of developingcancer, were obtained from the Surveillance, Epidemiology, and End Results (SEER) program of theNational Cancer Institute (NCI) covering about 10 percent of the US population.2 Population datawere obtained from the US Census Bureau.3 For 1999 mortality data, causes of death were codedand classified according to the Tenth Revision of the International Classification of Diseases (ICD-10),4
replacing ICD-95 used in the United States for deaths occurring during 1979 through 1998. Cancercases were classified according to the International Classification of Diseases for Oncology.6
Cancer Statistics, 2002Ahmedin Jemal, DVM, PhD;Andrea Thomas, MPH;Taylor Murray; Michael Thun, MD, MS
Dr. Jemal is Program Director forCancer Occurrence, Department ofEpidemiology and SurveillanceResearch, American Cancer Society,Atlanta, GA.
Ms. Thomas is Manager,Surveillance Information Services,Department of Epidemiology andSurveillance Research, AmericanCancer Society, Atlanta, GA.
Mr. Murray is Manager,Surveillance Data Systems,Department of Epidemiology andSurveillance Research, AmericanCancer Society, Atlanta, GA.
Dr. Thun is Vice President forEpidemiology and SurveillanceResearch, American Cancer Society,Atlanta, GA.
The authors thank Cheryll Cardinez,Vilma Cokkinides, PhD, April Harris,and Emmanuel Ntekop for theirassistance in preparation of thismanuscript.
This article is also available atwww.cancer.org.
Estimated New Cancer Cases
Because the United States has no nationwidecancer registry, precisely how many new casesof cancer are diagnosed each year in the UnitedStates and in all individual states is unknown.Consequently, we first estimated the number ofnew cancer cases occurring annually in theUnited States from 1979 through 1998 by usingage-specific cancer incidence rates collected by NCI’s SEER program2 coupled withpopulation data reported by the US CensusBureau.3 We then forecasted the number ofcancer cases expected to be diagnosed in theUnited States in the year 2002 using anautoregressive quadratic model fitted to theannual cancer case estimates.7
The observed trend in prostate cancerincidence was not compatible with the selectedforecasting model, as rates increased greatlybetween 1988 and 1992, declined sharplybetween 1992 and 1995, and leveled off from1995 to 1998.8,9 This trend likely reflectsextensive use of prostate-specific antigen (PSA)screening in a previously unscreenedpopulation and the subsequent increase incancer diagnoses at an early stage.10,11 Wetherefore assumed that the number of prostatecancer cases is approaching the pattern in effectprior to widespread use of PSA screening; andthen estimated the number of new cases ofprostate cancer for 2002 using a linearprojection based on data from 1979 to 1989and 1995 to 1998 only.
We could not use the methods mentionedabove to estimate new cancer cases forindividual states because complete cancerincidence and case counts are not available formany states.To derive these estimates, we reliedon state cancer death statistical data andassumed that the ratio of cancer deaths tocancer cases was the same in each state as in theUnited States on the whole.
Estimated Cancer Deaths
We estimated the number of cancer deathsexpected to occur in the United States and in
each state in the year 2002 using underlyingcause-of-death data from death certificates asreported to the National Center for HealthStatistics.1 The recorded numbers of cancerdeaths occurring annually from 1979 to 1999in the United States and in each state werefitted with autoregressive quadratic models7 inorder to forecast the number of cancer deathsexpected to occur in 2002.
Other Statistics
We provide mortality statistics for theleading causes of deaths and deaths from cancerfor 1999. Causes of death for 1999 mortalitydata were coded and classified according toICD-10 rulings, replacing ICD-9 coding usedfor deaths that occurred from 1979 through1998. Comparisons between the recordednumber of deaths between 1998 and 1999 wereadjusted for the change in ICD coding rulesusing a comparability ratio.12
This report also provides updated statisticson the probability of developing cancer,13 trendsin cancer mortality and incidence, and five-yearrelative survival rates for selected cancer sitesbased on data from 1973 through 1998.2
Cancer incidence and death rates arestandardized to the 1970 US standardpopulation and expressed per 100,000 person-years. Death rates for 1999 are presented usingboth 1970 and 2000 US standard populationfor age standardization to illustrate the impactof the 2000 standard population on death rates.
SELECTED FINDINGS
Expected Numbers of New Cancer Cases
The estimated number of new cancer casesexpected in 2002 is indicated for men, women,and for both sexes combined in Table 1. Theestimate of about 1,284,900 new cases ofinvasive cancer does not include carcinoma insitu of any site except urinary bladder, nor doesit include basal and squamous cell cancers ofthe skin. More than one million cases of basal
24 CA A Cancer Journal for Clinicians
Cancer Statistics, 2002

Estimated New Cancer Cases and Deaths by Gender, US, 2002*Estimated New Cases Estimated Deaths
Both Sexes Male Female Both Sexes Male Female
All Sites 1,284,900 637,500 647,400 555,500 288,200 267,300
Oral cavity and pharynx 28,900 18,900 10,000 7,400 4,900 2,500Tongue 7,100 4,700 2,400 1,700 1,100 600Mouth 9,800 5,200 4,600 2,000 1,100 900Pharynx 8,600 6,500 2,100 2,100 1,500 600Other oral cavity 3,400 2,500 900 1,600 1,200 400
Digestive system 250,600 130,300 120,300 132,300 70,800 61,500Esophagus 13,100 9,800 3,300 12,600 9,600 3,000Stomach 21,600 13,300 8,300 12,400 7,200 5,200Small intestine 5,300 2,500 2,800 1,100 600 500Colon 107,300 50,000 57,300 48,100 23,100 25,000Rectum 41,000 22,600 18,400 8,500 4,700 3,800Anus, anal canal, and anorectum 3,900 1,700 2,200 500 200 300Liver and intrahepatic bile duct 16,600 11,000 5,600 14,100 8,900 5,200Gallbladder and other biliary 7,100 3,400 3,700 3,500 1,300 2,200Pancreas 30,300 14,700 15,600 29,700 14,500 15,200Other digestive organs 4,400 1,300 3,100 1,800 700 1,100
Respiratory system 183,200 100,700 82,500 161,400 94,100 67,300Larynx 8,900 6,900 2,000 3,700 2,900 800Lung and bronchus 169,400 90,200 79,200 154,900 89,200 65,700Other respiratory organs 4,900 3,600 1,300 2,800 2,000 800
Bones and joints 2,400 1,300 1,100 1,300 700 600
Soft tissue (including heart) 8,300 4,400 3,900 3,900 2,000 1,900
Skin (excluding basal and squamous) 58,300 32,500 25,800 9,600 6,200 3,400Melanoma-skin 53,600 30,100 23,500 7,400 4,700 2,700Other non-epithelial skin 4,700 2,400 2,300 2,200 1,500 700
Breast 205,000 1,500 203,500 40,000 400 39,600
Genital system 279,100 197,700 81,400 57,100 30,900 26,200Uterine cervix 13,000 13,000 4,100 4,100Uterine corpus 39,300 39,300 6,600 6,600Ovary 23,300 23,300 13,900 13,900Vulva 3,800 3,800 800 800Vagina and other genital, female 2,000 2,000 800 800Prostate 189,000 189,000 30,200 30,200Testis 7,500 7,500 400 400Penis and other genital, male 1,200 1,200 200 200
Urinary system 90,700 62,200 28,500 24,900 16,200 8,700Urinary bladder 56,500 41,500 15,000 12,600 8,600 4,000Kidney and renal pelvis 31,800 19,100 12,700 11,600 7,200 4,400Ureter and other urinary organs 2,400 1,600 800 700 400 300
Eye and orbit 2,200 1,100 1,100 200 100 100
Brain and other nervous system 17,000 9,600 7,400 13,100 7,200 5,900
Endocrine system 22,700 6,000 16,700 2,300 1,000 1,300Thyroid 20,700 4,900 15,800 1,300 500 800Other endocrine 2,000 1,100 900 1,000 500 500
Lymphoma 60,900 31,900 29,000 25,800 13,500 12,300Hodgkin’s disease 7,000 3,700 3,300 1,400 800 600Non-Hodgkin’s lymphoma 53,900 28,200 25,700 24,400 12,700 11,700
Multiple myeloma 14,600 7,800 6,800 10,800 5,500 5,300
Leukemia 30,800 17,600 13,200 21,700 12,100 9,600Acute lymphocytic leukemia 3,800 2,200 1,600 1,400 800 600Chronic lymphocytic leukemia 7,000 4,100 2,900 4,500 2,600 1,900Acute myeloid leukemia 10,600 5,900 4,700 7,400 4,000 3,400Chronic myeloid leukemia 4,400 2,500 1,900 2,000 1,100 900Other leukemia 5,000 2,900 2,100 6,400 3,600 2,800
Other and unspecified primary sites 30,200 14,000 16,200 43,700 22,600 21,100
*Excludes basal and squamous cell skin cancers and in situ carcinomas except urinary bladder. Carcinoma in situ of the breast accountsfor about 54,300 new cases annually and melanoma in situ accounts for about 34,300 new cases annually.Estimates of new cases are based on incidence rates from the NCI Surveillance, Epidemiology, and End Results program, 1979 to 1998.
TABLE 1
Volume 52 • Number 1 • January/February 2002 25
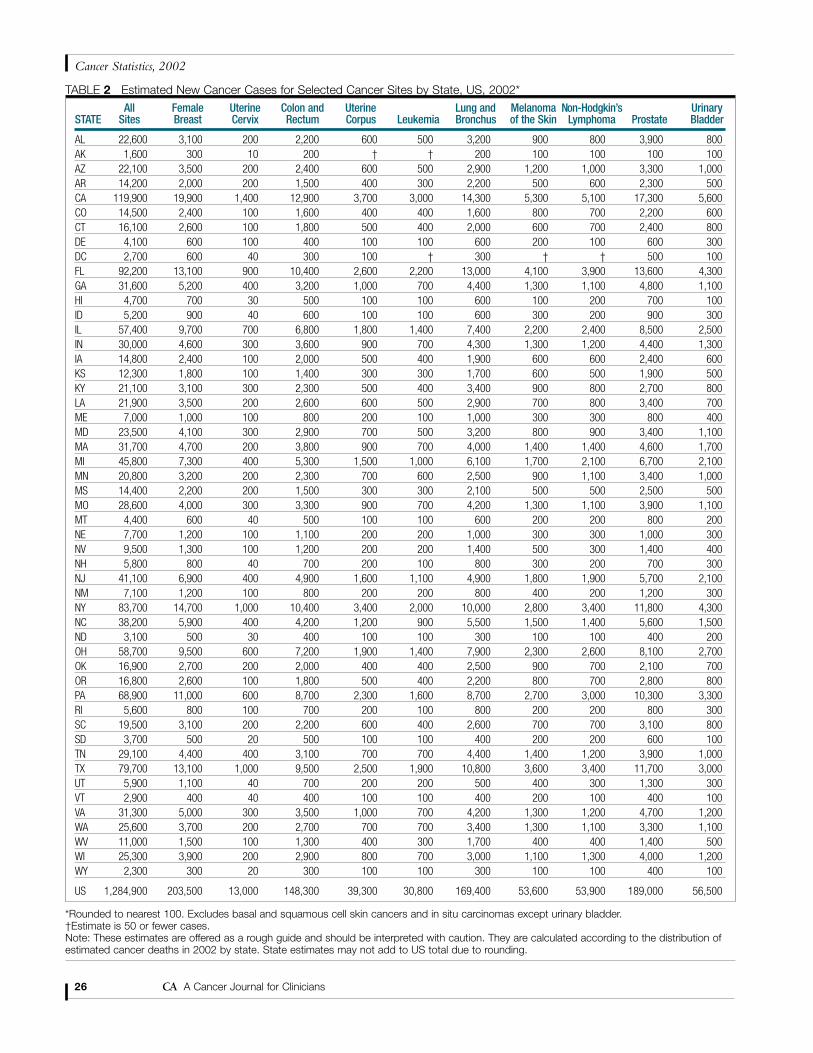
*Rounded to nearest 100. Excludes basal and squamous cell skin cancers and in situ carcinomas except urinary bladder. †Estimate is 50 or fewer cases. Note: These estimates are offered as a rough guide and should be interpreted with caution. They are calculated according to the distribution ofestimated cancer deaths in 2002 by state. State estimates may not add to US total due to rounding.
All Female Uterine Colon and Uterine Lung and Melanoma Non-Hodgkin’s UrinarySTATE Sites Breast Cervix Rectum Corpus Leukemia Bronchus of the Skin Lymphoma Prostate Bladder
AL 22,600 3,100 200 2,200 600 500 3,200 900 800 3,900 800AK 1,600 300 10 200 † † 200 100 100 100 100AZ 22,100 3,500 200 2,400 600 500 2,900 1,200 1,000 3,300 1,000AR 14,200 2,000 200 1,500 400 300 2,200 500 600 2,300 500CA 119,900 19,900 1,400 12,900 3,700 3,000 14,300 5,300 5,100 17,300 5,600CO 14,500 2,400 100 1,600 400 400 1,600 800 700 2,200 600CT 16,100 2,600 100 1,800 500 400 2,000 600 700 2,400 800DE 4,100 600 100 400 100 100 600 200 100 600 300DC 2,700 600 40 300 100 † 300 † † 500 100FL 92,200 13,100 900 10,400 2,600 2,200 13,000 4,100 3,900 13,600 4,300GA 31,600 5,200 400 3,200 1,000 700 4,400 1,300 1,100 4,800 1,100HI 4,700 700 30 500 100 100 600 100 200 700 100ID 5,200 900 40 600 100 100 600 300 200 900 300IL 57,400 9,700 700 6,800 1,800 1,400 7,400 2,200 2,400 8,500 2,500IN 30,000 4,600 300 3,600 900 700 4,300 1,300 1,200 4,400 1,300IA 14,800 2,400 100 2,000 500 400 1,900 600 600 2,400 600KS 12,300 1,800 100 1,400 300 300 1,700 600 500 1,900 500KY 21,100 3,100 300 2,300 500 400 3,400 900 800 2,700 800LA 21,900 3,500 200 2,600 600 500 2,900 700 800 3,400 700ME 7,000 1,000 100 800 200 100 1,000 300 300 800 400MD 23,500 4,100 300 2,900 700 500 3,200 800 900 3,400 1,100MA 31,700 4,700 200 3,800 900 700 4,000 1,400 1,400 4,600 1,700MI 45,800 7,300 400 5,300 1,500 1,000 6,100 1,700 2,100 6,700 2,100MN 20,800 3,200 200 2,300 700 600 2,500 900 1,100 3,400 1,000MS 14,400 2,200 200 1,500 300 300 2,100 500 500 2,500 500MO 28,600 4,000 300 3,300 900 700 4,200 1,300 1,100 3,900 1,100MT 4,400 600 40 500 100 100 600 200 200 800 200NE 7,700 1,200 100 1,100 200 200 1,000 300 300 1,000 300NV 9,500 1,300 100 1,200 200 200 1,400 500 300 1,400 400NH 5,800 800 40 700 200 100 800 300 200 700 300NJ 41,100 6,900 400 4,900 1,600 1,100 4,900 1,800 1,900 5,700 2,100NM 7,100 1,200 100 800 200 200 800 400 200 1,200 300NY 83,700 14,700 1,000 10,400 3,400 2,000 10,000 2,800 3,400 11,800 4,300NC 38,200 5,900 400 4,200 1,200 900 5,500 1,500 1,400 5,600 1,500ND 3,100 500 30 400 100 100 300 100 100 400 200OH 58,700 9,500 600 7,200 1,900 1,400 7,900 2,300 2,600 8,100 2,700OK 16,900 2,700 200 2,000 400 400 2,500 900 700 2,100 700OR 16,800 2,600 100 1,800 500 400 2,200 800 700 2,800 800PA 68,900 11,000 600 8,700 2,300 1,600 8,700 2,700 3,000 10,300 3,300RI 5,600 800 100 700 200 100 800 200 200 800 300SC 19,500 3,100 200 2,200 600 400 2,600 700 700 3,100 800SD 3,700 500 20 500 100 100 400 200 200 600 100TN 29,100 4,400 400 3,100 700 700 4,400 1,400 1,200 3,900 1,000TX 79,700 13,100 1,000 9,500 2,500 1,900 10,800 3,600 3,400 11,700 3,000UT 5,900 1,100 40 700 200 200 500 400 300 1,300 300VT 2,900 400 40 400 100 100 400 200 100 400 100VA 31,300 5,000 300 3,500 1,000 700 4,200 1,300 1,200 4,700 1,200WA 25,600 3,700 200 2,700 700 700 3,400 1,300 1,100 3,300 1,100WV 11,000 1,500 100 1,300 400 300 1,700 400 400 1,400 500WI 25,300 3,900 200 2,900 800 700 3,000 1,100 1,300 4,000 1,200WY 2,300 300 20 300 100 100 300 100 100 400 100
US 1,284,900 203,500 13,000 148,300 39,300 30,800 169,400 53,600 53,900 189,000 56,500
TABLE 2 Estimated New Cancer Cases for Selected Cancer Sites by State, US, 2002*
26 CA A Cancer Journal for Clinicians
Cancer Statistics, 2002
and squamous cell skin cancers, 54,300 cases ofbreast carcinoma in situ, and 34,300 cases of insitu melanoma are expected to be newlydiagnosed in 2002. The estimated number ofnew cancer cases by state and cancer site areshown in Table 2.
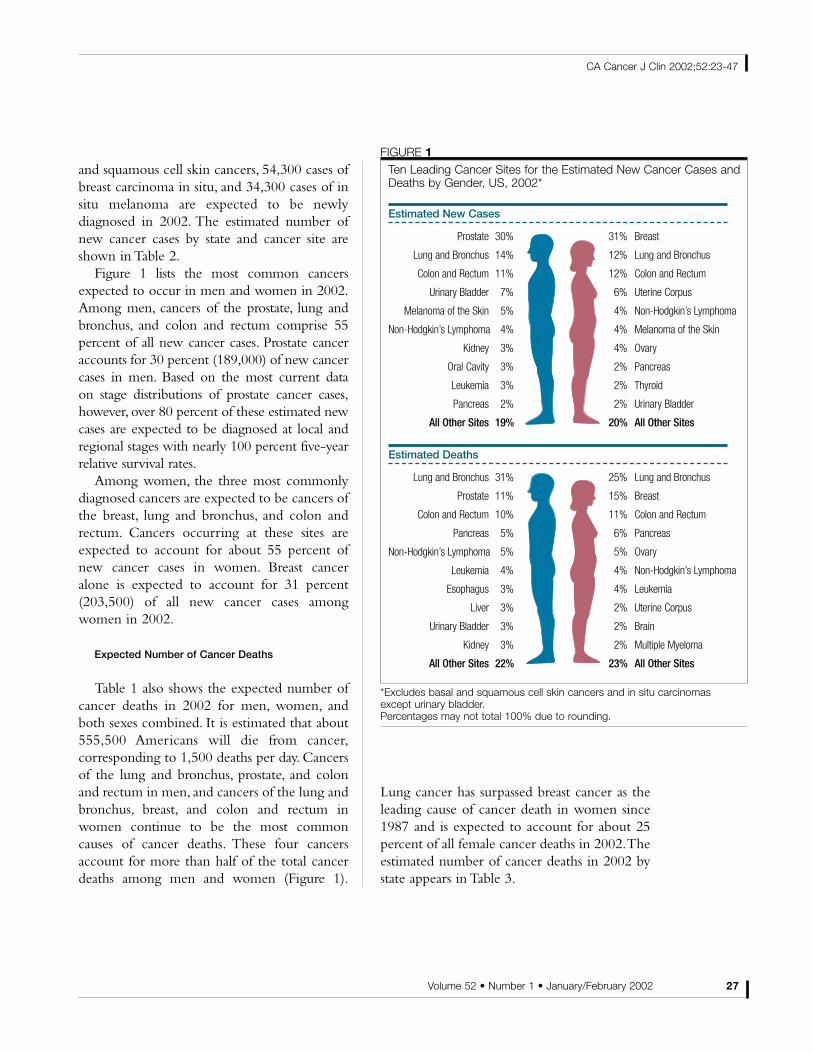
Figure 1 lists the most common cancersexpected to occur in men and women in 2002.Among men, cancers of the prostate, lung andbronchus, and colon and rectum comprise 55percent of all new cancer cases. Prostate canceraccounts for 30 percent (189,000) of new cancercases in men. Based on the most current data on stage distributions of prostate cancer cases,however, over 80 percent of these estimated newcases are expected to be diagnosed at local andregional stages with nearly 100 percent five-yearrelative survival rates.
Among women, the three most commonlydiagnosed cancers are expected to be cancers ofthe breast, lung and bronchus, and colon andrectum. Cancers occurring at these sites areexpected to account for about 55 percent ofnew cancer cases in women. Breast canceralone is expected to account for 31 percent(203,500) of all new cancer cases amongwomen in 2002.
Expected Number of Cancer Deaths
Table 1 also shows the expected number ofcancer deaths in 2002 for men, women, andboth sexes combined. It is estimated that about555,500 Americans will die from cancer,corresponding to 1,500 deaths per day. Cancersof the lung and bronchus, prostate, and colonand rectum in men, and cancers of the lung andbronchus, breast, and colon and rectum inwomen continue to be the most commoncauses of cancer deaths. These four cancersaccount for more than half of the total cancerdeaths among men and women (Figure 1).
Lung cancer has surpassed breast cancer as theleading cause of cancer death in women since1987 and is expected to account for about 25percent of all female cancer deaths in 2002.Theestimated number of cancer deaths in 2002 bystate appears in Table 3.
Volume 52 • Number 1 • January/February 2002 27
CA Cancer J Clin 2002;52:23-47
FIGURE 1Ten Leading Cancer Sites for the Estimated New Cancer Cases andDeaths by Gender, US, 2002*
*Excludes basal and squamous cell skin cancers and in situ carcinomas except urinary bladder.Percentages may not total 100% due to rounding.
Estimated New Cases
Prostate 30% 31% Breast
Lung and Bronchus 14% 12% Lung and Bronchus
Colon and Rectum 11% 12% Colon and Rectum
Urinary Bladder 7% 6% Uterine Corpus
Melanoma of the Skin 5% 4% Non-Hodgkin’s Lymphoma
Non-Hodgkin’s Lymphoma 4% 4% Melanoma of the Skin
Kidney 3% 4% Ovary
Oral Cavity 3% 2% Pancreas
Leukemia 3% 2% Thyroid
Pancreas 2% 2% Urinary Bladder
All Other Sites 19% 20% All Other Sites
Estimated Deaths
Lung and Bronchus 31% 25% Lung and Bronchus
Prostate 11% 15% Breast
Colon and Rectum 10% 11% Colon and Rectum
Pancreas 5% 6% Pancreas
Non-Hodgkin’s Lymphoma 5% 5% Ovary
Leukemia 4% 4% Non-Hodgkin’s Lymphoma
Esophagus 3% 4% Leukemia
Liver 3% 2% Uterine Corpus
Urinary Bladder 3% 2% Brain
Kidney 3% 2% Multiple Myeloma
All Other Sites 22% 23% All Other Sites
Male Incidence
Male and Female Incidence
Female Incidence
Male Mortality
Male and Female Mortality
Female Mortality
Rate
per
100
,000
Per
son-
Year
s
550 —
525 —
500 —
475 —
450 —
425 —
400 —
375 —
350 —
325 —
300 —
275 —
250 —
225 —
200 —
175 —
150 —
125 —
100 —
75 —
50 —
25 —
0
1972
1973
—
1974
—
1975
—
1976
—
1977
—
1978
—
1979
—
1980
—
1981
—
1982
—
1983
—
1984
—
1985
—
1986
—
1987
—
1988
—
1989
—
1990
—
1991
—
1992
—
1993
—
1994
—
1995
—
1996
—
1997
—
1998
—
1999
—
Year of Diagnosis/Death
FIGURE 2
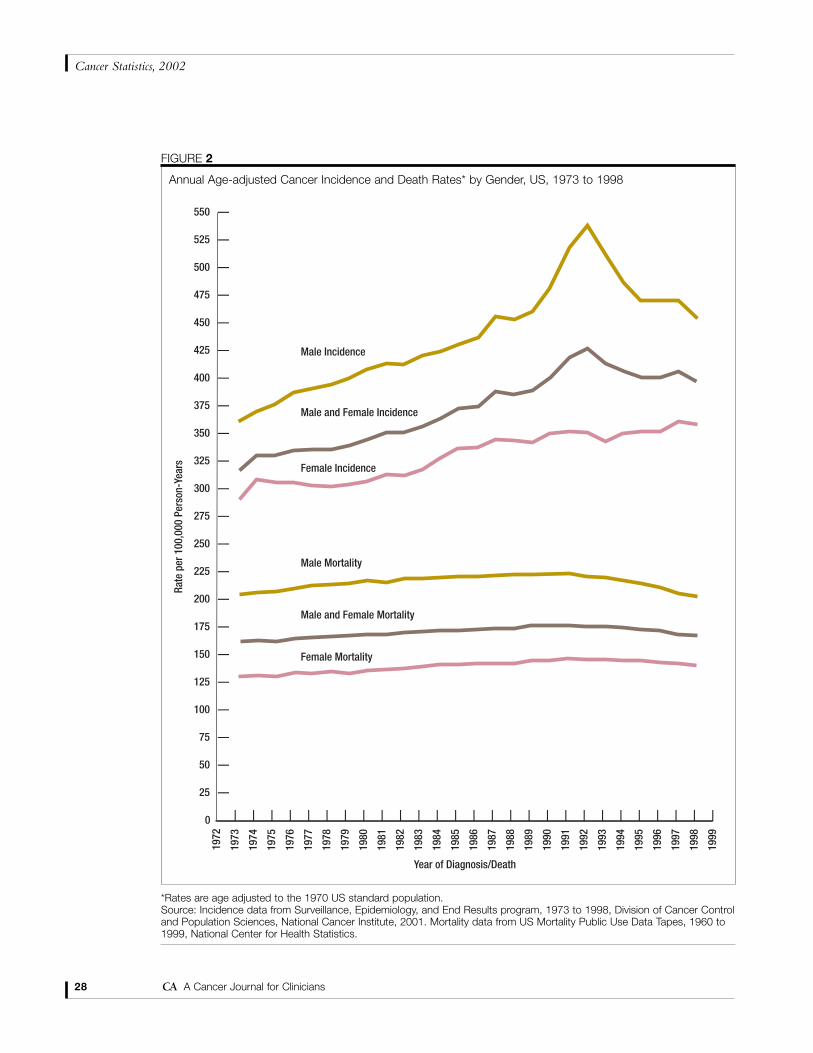
Annual Age-adjusted Cancer Incidence and Death Rates* by Gender, US, 1973 to 1998
*Rates are age adjusted to the 1970 US standard population.Source: Incidence data from Surveillance, Epidemiology, and End Results program, 1973 to 1998, Division of Cancer Controland Population Sciences, National Cancer Institute, 2001. Mortality data from US Mortality Public Use Data Tapes, 1960 to1999, National Center for Health Statistics.
28 CA A Cancer Journal for Clinicians
Cancer Statistics, 2002
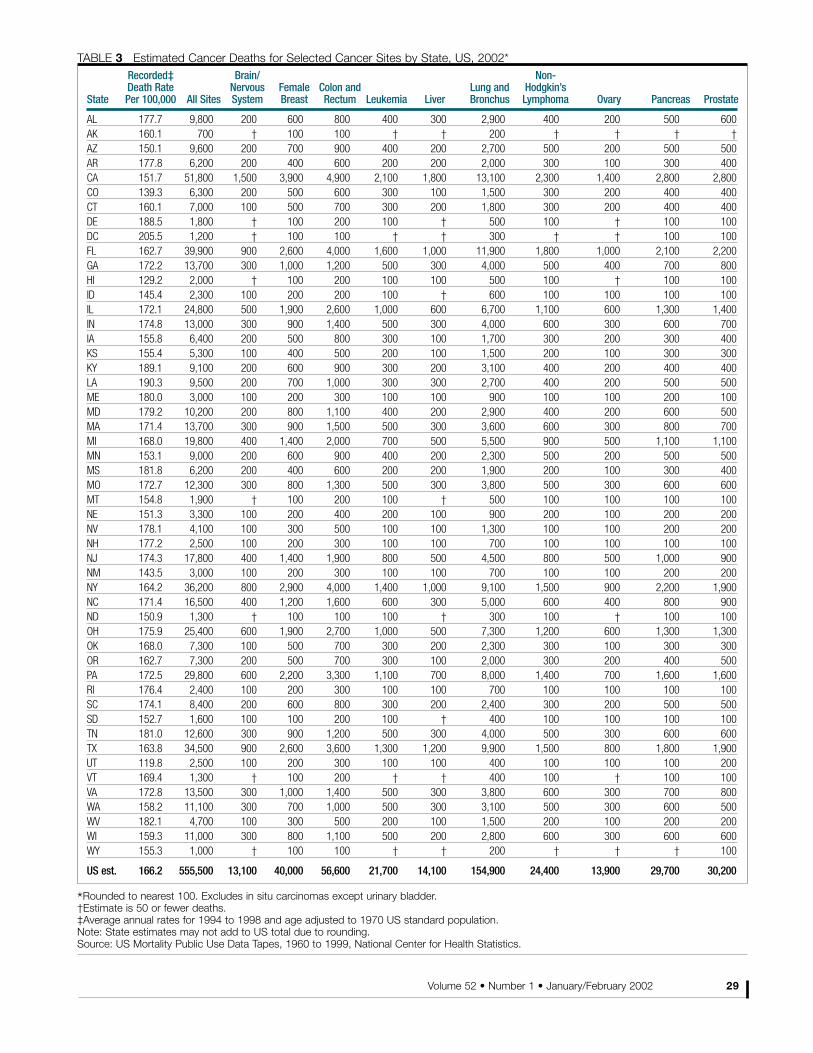
*Rounded to nearest 100. Excludes in situ carcinomas except urinary bladder. †Estimate is 50 or fewer deaths. ‡Average annual rates for 1994 to 1998 and age adjusted to 1970 US standard population.Note: State estimates may not add to US total due to rounding.Source: US Mortality Public Use Data Tapes, 1960 to 1999, National Center for Health Statistics.
Recorded‡ Brain/ Non-Death Rate Nervous Female Colon and Lung and Hodgkin’s
State Per 100,000 All Sites System Breast Rectum Leukemia Liver Bronchus Lymphoma Ovary Pancreas Prostate
AL 177.7 9,800 200 600 800 400 300 2,900 400 200 500 600AK 160.1 700 † 100 100 † † 200 † † † †AZ 150.1 9,600 200 700 900 400 200 2,700 500 200 500 500AR 177.8 6,200 200 400 600 200 200 2,000 300 100 300 400CA 151.7 51,800 1,500 3,900 4,900 2,100 1,800 13,100 2,300 1,400 2,800 2,800CO 139.3 6,300 200 500 600 300 100 1,500 300 200 400 400CT 160.1 7,000 100 500 700 300 200 1,800 300 200 400 400DE 188.5 1,800 † 100 200 100 † 500 100 † 100 100DC 205.5 1,200 † 100 100 † † 300 † † 100 100FL 162.7 39,900 900 2,600 4,000 1,600 1,000 11,900 1,800 1,000 2,100 2,200GA 172.2 13,700 300 1,000 1,200 500 300 4,000 500 400 700 800HI 129.2 2,000 † 100 200 100 100 500 100 † 100 100ID 145.4 2,300 100 200 200 100 † 600 100 100 100 100IL 172.1 24,800 500 1,900 2,600 1,000 600 6,700 1,100 600 1,300 1,400IN 174.8 13,000 300 900 1,400 500 300 4,000 600 300 600 700IA 155.8 6,400 200 500 800 300 100 1,700 300 200 300 400KS 155.4 5,300 100 400 500 200 100 1,500 200 100 300 300KY 189.1 9,100 200 600 900 300 200 3,100 400 200 400 400LA 190.3 9,500 200 700 1,000 300 300 2,700 400 200 500 500ME 180.0 3,000 100 200 300 100 100 900 100 100 200 100MD 179.2 10,200 200 800 1,100 400 200 2,900 400 200 600 500MA 171.4 13,700 300 900 1,500 500 300 3,600 600 300 800 700MI 168.0 19,800 400 1,400 2,000 700 500 5,500 900 500 1,100 1,100MN 153.1 9,000 200 600 900 400 200 2,300 500 200 500 500MS 181.8 6,200 200 400 600 200 200 1,900 200 100 300 400MO 172.7 12,300 300 800 1,300 500 300 3,800 500 300 600 600MT 154.8 1,900 † 100 200 100 † 500 100 100 100 100NE 151.3 3,300 100 200 400 200 100 900 200 100 200 200NV 178.1 4,100 100 300 500 100 100 1,300 100 100 200 200NH 177.2 2,500 100 200 300 100 100 700 100 100 100 100NJ 174.3 17,800 400 1,400 1,900 800 500 4,500 800 500 1,000 900NM 143.5 3,000 100 200 300 100 100 700 100 100 200 200NY 164.2 36,200 800 2,900 4,000 1,400 1,000 9,100 1,500 900 2,200 1,900NC 171.4 16,500 400 1,200 1,600 600 300 5,000 600 400 800 900ND 150.9 1,300 † 100 100 100 † 300 100 † 100 100OH 175.9 25,400 600 1,900 2,700 1,000 500 7,300 1,200 600 1,300 1,300OK 168.0 7,300 100 500 700 300 200 2,300 300 100 300 300OR 162.7 7,300 200 500 700 300 100 2,000 300 200 400 500PA 172.5 29,800 600 2,200 3,300 1,100 700 8,000 1,400 700 1,600 1,600RI 176.4 2,400 100 200 300 100 100 700 100 100 100 100SC 174.1 8,400 200 600 800 300 200 2,400 300 200 500 500SD 152.7 1,600 100 100 200 100 † 400 100 100 100 100TN 181.0 12,600 300 900 1,200 500 300 4,000 500 300 600 600TX 163.8 34,500 900 2,600 3,600 1,300 1,200 9,900 1,500 800 1,800 1,900UT 119.8 2,500 100 200 300 100 100 400 100 100 100 200VT 169.4 1,300 † 100 200 † † 400 100 † 100 100VA 172.8 13,500 300 1,000 1,400 500 300 3,800 600 300 700 800WA 158.2 11,100 300 700 1,000 500 300 3,100 500 300 600 500WV 182.1 4,700 100 300 500 200 100 1,500 200 100 200 200WI 159.3 11,000 300 800 1,100 500 200 2,800 600 300 600 600WY 155.3 1,000 † 100 100 † † 200 † † † 100
US est. 166.2 555,500 13,100 40,000 56,600 21,700 14,100 154,900 24,400 13,900 29,700 30,200
TABLE 3 Estimated Cancer Deaths for Selected Cancer Sites by State, US, 2002*
Volume 52 • Number 1 • January/February 2002 29
Trends in Cancer Incidence and Mortality
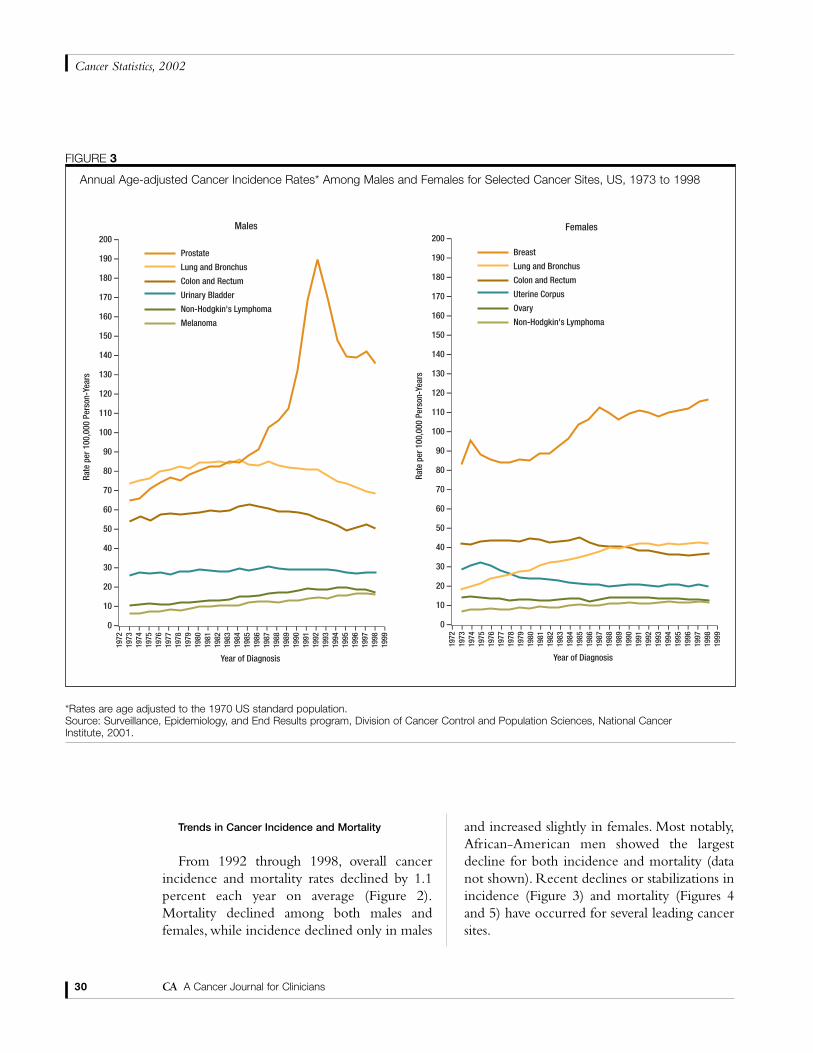
From 1992 through 1998, overall cancerincidence and mortality rates declined by 1.1percent each year on average (Figure 2).Mortality declined among both males andfemales, while incidence declined only in males
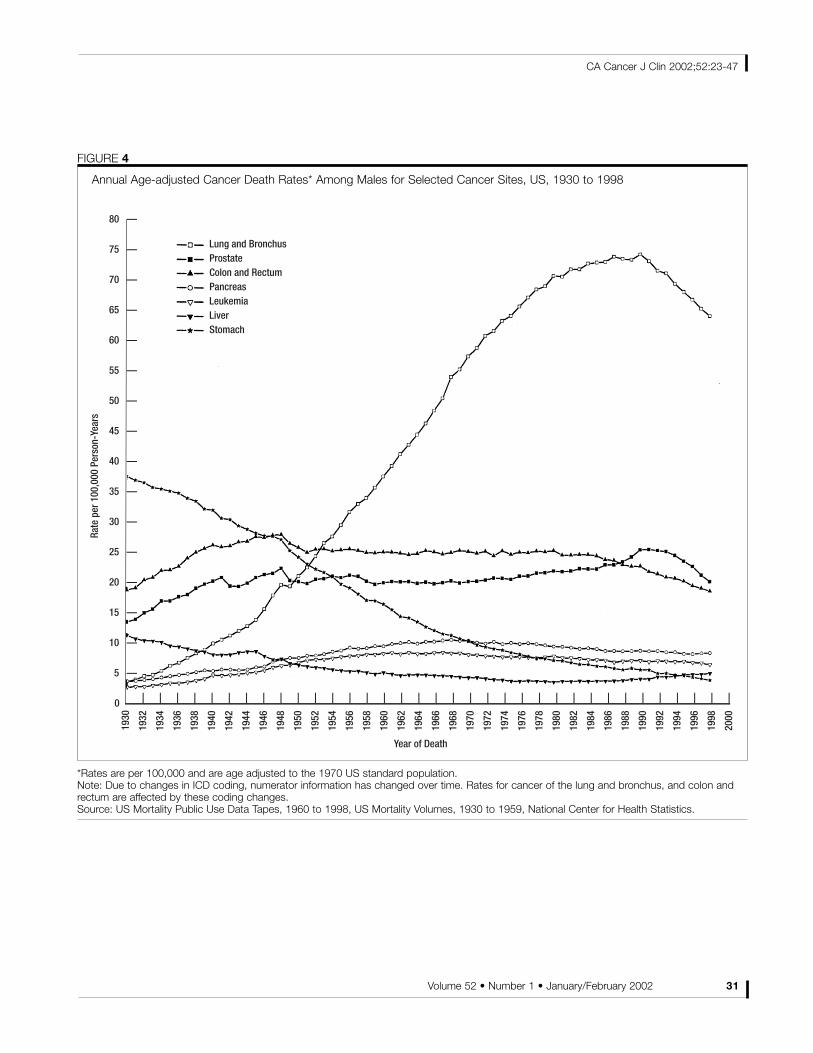
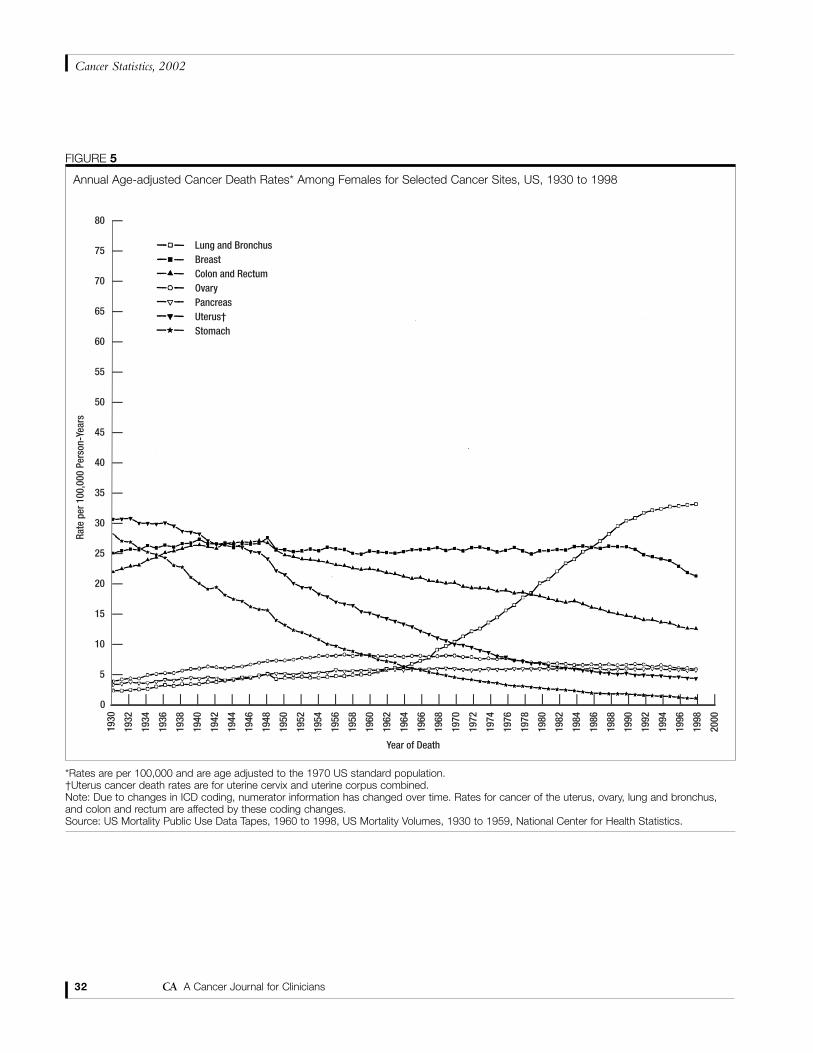
and increased slightly in females. Most notably,African-American men showed the largestdecline for both incidence and mortality (datanot shown). Recent declines or stabilizations inincidence (Figure 3) and mortality (Figures 4and 5) have occurred for several leading cancersites.
30 CA A Cancer Journal for Clinicians
Cancer Statistics, 2002
FIGURE 3
Annual Age-adjusted Cancer Incidence Rates* Among Males and Females for Selected Cancer Sites, US, 1973 to 1998
*Rates are age adjusted to the 1970 US standard population.Source: Surveillance, Epidemiology, and End Results program, Division of Cancer Control and Population Sciences, National Cancer Institute, 2001.
200 –
190 –
180 –
170 –
160 –
150 –
140 –
130 –
120 –
110 –
100 –
90 –
80 –
70 –
60 –
50 –
40 –
30 –
20 –
10 –
0 –
Rate
per
100
,000
Per
son-
Year
s
Year of Diagnosis
197
2 –
1973
–19
74 –
1975
–19
76 –
1977
–19
78 –
1979
–19
80 –
1981
–19
82 –
1983
–19
84 –
1985
–19
86 –
1987
–19
88 –
1989
–19
90 –
1991
–19
92 –
1993
–19
94 –
1995
–19
96 –
1997
–19
98 –
1999
–
Prostate
Lung and Bronchus
Colon and Rectum
Urinary Bladder
Non-Hodgkin's Lymphoma
Melanoma
Males200 –
190 –
180 –
170 –
160 –
150 –
140 –
130 –
120 –
110 –
100 –
90 –
80 –
70 –
60 –
50 –
40 –
30 –
20 –
10 –
0 –
Rate
per
100
,000
Per
son-
Year
s
Year of Diagnosis
197
2 –
1973
–19
74 –
1975
–19
76 –
1977
–19
78 –
1979
–19
80 –
1981
–19
82 –
1983
–19
84 –
1985
–19
86 –
1987
–19
88 –
1989
–19
90 –
1991
–19
92 –
1993
–19
94 –
1995
–19
96 –
1997
–19
98 –
1999
–
Breast
Lung and Bronchus
Colon and Rectum
Uterine Corpus
Ovary
Non-Hodgkin's Lymphoma
Females
Volume 52 • Number 1 • January/February 2002 31
CA Cancer J Clin 2002;52:23-47
1930
1932
—
1934
—
1936
—
1938
—
1940
—
1942
—
1944
—
1946
—
1948
—
1950
—
1952
—
1954
—
1956
—
1958
—
1960
—
1962
—
1964
—
1966
—
1968
—
1970
—
1972
—
1974
—
1976
—
1978
—
1980
—
1982
—
1984
—
1986
—
1988
—
1990
—
1992
—
1994
—
1996
—
1998
—
2000
—
Rate
per
100
,000
Per
son-
Year
s
80 —
75 —
70 —
65 —
60 —
55 —
50 —
45 —
40 —
35 —
30 —
25 —
20 —
15 —
10 —
5 —
0
Year of Death
Lung and BronchusProstateColon and RectumPancreasLeukemiaLiverStomach
FIGURE 4
Annual Age-adjusted Cancer Death Rates* Among Males for Selected Cancer Sites, US, 1930 to 1998
*Rates are per 100,000 and are age adjusted to the 1970 US standard population.Note: Due to changes in ICD coding, numerator information has changed over time. Rates for cancer of the lung and bronchus, and colon andrectum are affected by these coding changes.Source: US Mortality Public Use Data Tapes, 1960 to 1998, US Mortality Volumes, 1930 to 1959, National Center for Health Statistics.
1930
1932
—
1934
—
1936
—
1938
—
1940
—
1942
—
1944
—
1946
—
1948
—
1950
—
1952
—
1954
—
1956
—
1958
—
1960
—
1962
—
1964
—
1966
—
1968
—
1970
—
1972
—
1974
—
1976
—
1978
—
1980
—
1982
—
1984
—
1986
—
1988
—
1990
—
1992
—
1994
—
1996
—
1998
—
2000
—
Rate
per
100
,000
Per
son-
Year
s
80 —
75 —
70 —
65 —
60 —
55 —
50 —
45 —
40 —
35 —
30 —
25 —
20 —
15 —
10 —
5 —
0
Year of Death
Lung and BronchusBreastColon and RectumOvaryPancreasUterus† Stomach
FIGURE 5
Annual Age-adjusted Cancer Death Rates* Among Females for Selected Cancer Sites, US, 1930 to 1998
*Rates are per 100,000 and are age adjusted to the 1970 US standard population.†Uterus cancer death rates are for uterine cervix and uterine corpus combined.Note: Due to changes in ICD coding, numerator information has changed over time. Rates for cancer of the uterus, ovary, lung and bronchus,and colon and rectum are affected by these coding changes.Source: US Mortality Public Use Data Tapes, 1960 to 1998, US Mortality Volumes, 1930 to 1959, National Center for Health Statistics.
32 CA A Cancer Journal for Clinicians
Cancer Statistics, 2002
Female breast cancer incidence for all racescombined increased by 3.8 percent per yearbetween 1980 and 1987, and stabilized through1998 (Figure 3). A significant downturn in theincidence of lung and bronchus cancer in malesbegan in the early 1980s; between 1992 and1998, incidence rates decreased 2.4 percent peryear. Overall incidence rates of female lung andbronchus cancer have been stable since 1991,but rates have begun to decline in womenunder 65 years of age from 28.3 percent per
100,000 women in 1991 to 22.7 percent per100,000 women in 1998. In both men andwomen, colon and rectum cancer incidencedeclined between the mid-1980s and the mid-1990s and stabilized thereafter. Prostate cancerincidence rates have generally leveled offduring the years 1995 to 1998, following largeannual increases of 17.5 percent from 1988 to1992 and a sharp decline of 10.0 percent peryear from 1992 to 1995.8,9
Similar to trends in incidence, significant
Volume 52 • Number 1 • January/February 2002 33
CA Cancer J Clin 2002;52:23-47
Age-adjusted Age-adjustedNumber Percent Rate Rate
of Total (1970 US Standard (2000 US StandardRank Cause of Death Deaths Deaths Population) Population)
All Causes 2,391,399 647.4 882.1
1 Heart Diseases 725,192 30.3 184.7 267.92 Cancer 549,838 23.0 161.2 202.73 Cerebrovascular Diseases 167,366 7.0 40.4 61.94 Chronic Lower Respiratory
Diseases 124,181 5.2 33.5 45.75 Accidents (Unintentional Injuries) 97,860 4.1 31.2 35.96 Diabetes Mellitus 68,399 2.9 19.2 25.27 Influenza and Pneumonia 63,730 2.7 14.8 23.68 Alzheimer’s Disease 44,536 1.9 9.5 16.5
9 Nephritis, Nephrotic Syndrome,and Nephrosis 35,525 1.5 9.2 13.1
10 Septicemia 30,680 1.3 8.1 11.311 Intentional Self-harm (Suicide) 29,199 1.2 9.5 10.7
12 Chronic Liver Disease and Cirrhosis 26,259 1.1 8.3 9.7
13 Hypertension and Hypertensive Renal Disease 16,968 0.7 4.2 6.3
14 Assault (Homicide) 16,889 0.7 6.1 6.115 Atherosclerosis 14,979 0.6 3.3 5.5
All Other and Ill-defined Causes 379,798
Note: Percentages may not total 100% due to rounding.Source: US Mortality Public Use Data Tape, 1999, National Center for Health Statistics, Centers forDisease Control and Prevention, 2001.
TABLE 4Fifteen Leading Causes of Death, US, 1999
Source: US Mortality Public Use Data Tape, 1999, National Center for Health Statistics, Centers for Disease Control and Prevention, 2001.
Reported Deaths for the Ten Leading Causes of Death by Age and Gender, US, 1999
All Ages Ages 1 to 19 Ages 20 to 39 Ages 40 to 59 Ages 60 to 79 Ages 80+Male Female Male Female Male Female Male Female Male Female Male Female
All Causes All Causes All Causes All Causes All Causes All Causes All Causes All Causes All Causes All Causes All Causes All Causes1,175,460 1,215,939 17,247 9,375 64,591 30,157 192,537 117,773 509,056 415,988 376,106 630,276
1 Heart Heart Accidents Accidents Accidents Accidents Heart Cancer Cancer Cancer Heart Heart Diseases Diseases (Unintentional (Unintentional (Unintentional (Unintentional Diseases 46,757 160,670 131,972 Diseases Diseases351,617 373,575 Injuries) Injuries) Injuries) Injuries) 51,247 134,592 238,579
7,725 3,952 19,924 6,300
2 Cancer Cancer Assault Cancer Intentional Cancer Cancer Heart Heart Heart Cancer Cancer285,832 264,006 (Homicide) 945 Self-harm 5,747 49,529 Diseases Diseases Diseases 69,360 78,550
2,192 (Suicide) 20,249 159,306 111,350 8,763
3 Cerebro- Cerebro- Intentional Assault Assault Heart Accidents Accidents Chronic Chronic Cerebro- Cerebro-vascular vascular Self-harm (Homicide) (Homicide) Diseases (Unintentional (Unintentional Lower Lower vascular vascularDiseases Diseases (Suicide) 709 7,046 2,768 Injuries) Injuries) Respiratory Respiratory Diseases Diseases64,485 102,881 1,541 17,192 6,256 Diseases Diseases 30,791 68,709
34,287 30,453
4 Accidents Chronic Cancer Congenital Heart Intentional Chronic Liver Cerebro- Cerebro- Cerebro- Chronic Chronic(Unintentional Lower 1,230 Anomalies Diseases Self-harm Disease & vascular vascular vascular Lower Lower
Injuries) Respiratory 535 5,607 (Suicide) Cirrhosis Diseases Diseases Diseases Respiratory Respiratory63,535 Diseases 1,915 8,478 5,262 26,618 27,981 Diseases Diseases
61,766 23,578 26,912
5 Chronic Diabetes Congenital Heart Cancer Assault Intentional Diabetes Diabetes Diabetes Pneumonia PneumoniaLower Mellitus Anomalies Diseases 5,001 (Homicide) Self-harm Mellitus Mellitus Mellitus & Influenza & Influenza
Respiratory 37,249 664 365 1,841 (Suicide) 4,199 16,205 17,204 16,114 26,531Diseases 7,56762,415
6 Diabetes Influenza & Heart Intentional HIV HIV HIV Chronic Accidents Pneumonia Alzheimer’s Alzheimer’sMellitus Pneumonia Diseases Self-harm Disease Disease Disease Lower (Unintentional & Influenza Disease Disease31,150 36,012 558 (Suicide) 4,218 1,659 6,262 Respiratory Injuries) 7,400 9,368 25,679
318 Diseases 10,3503,889
7 Influenza & Accidents Chronic Pneumonia Chronic Liver Cerebro- Cerebro- Chronic Liver Pneumonia Accidents Diabetes DiabetesPneumonia (Unintentional Lower & Influenza Disease & vascular vascular Disease & & Influenza (Unintentional Mellitus Mellitus
27,718 Injuries) Respiratory 143 Cirrhosis Diseases Diseases Cirrhosis 8,764 Injuries) 8,474 15,19234,325 Diseases 981 804 6,111 2,892 6,971
183
8 Intentional Alzheimer’s Influenza & Chronic Diabetes Diabetes Diabetes Intentional Nephritis, Nephritis, Accidents AccidentsSelf-harm Disease Pneumonia Lower Mellitus Mellitus Mellitus Self-harm Nephrotic Nephrotic (Unintentional (Unintentional(Suicide) 31,145 153 Respiratory 811 605 5,613 (Suicide) Syndrome, & Syndrome, & Injuries) Injuries)23,458 Diseases 2,372 Nephrosis Nephrosis 7,756 10,483
117 7,393 6,843
9 Chronic Nephritis, Septicemia Septicemia Cerebro- Chronic Chronic HIV Chronic Septicemia Nephritis, Nephritis,Liver Disease Nephrotic 101 95 vascular Liver Disease Lower Disease Liver Disease 6,002 Nephrotic Nephrotic& Cirrhosis Syndrome, & Diseases & Cirrhosis Respiratory 1,673 & Cirrhosis Syndrome, & Syndrome, &
17,115 Nephrosis 807 546 Diseases 6,554 Nephrosis Nephrosis18,509 3,988 7,473 9,917
10 Nephritis, Septicemia Cerebro- Cerebro- Congenital Congenital Assault Septicemia Septicemia Alzheimer’s Septicemia SepticemiaNephrotic 17,285 vascular vascular Anomalies Anomalies (Homicide) 1,539 5,970 Disease 4,960 9,230
Syndrome, & Diseases Diseases 517 439 2,602 5,373Nephrosis 92 8617,016
TABLE 5
34 CA A Cancer Journal for Clinicians
Cancer Statistics, 2002
decreases in death rates for lung and bronchuscancer have occurred only among males (onaverage 1.8 percent per year during 1990 to1998) (Figure 4); the increase in lung cancerdeath rates among females has begun to slowrecently (Figure 5).
Breast cancer death rates among femalesdeclined annually by 1.6 percent from 1989 to1995, and by 3.4 percent since then. Age-specific analysis revealed that breast cancermortality declined in every age group except inAfrican-American women, age 75 and older;the decline was more pronounced in femalesyounger than 50 years old in both whites andAfrican Americans.9 Colon and rectum cancerdeath rates have been decreasing by about 2percent per year since 1984 in females and 1987in males.8,9 Prostate cancer deaths peaked in1991, and have decreased an average of 4.5percent per year from 1994 through 1998.8,9
The Recorded Number of Deaths from Cancer
and Other Causes in 1999
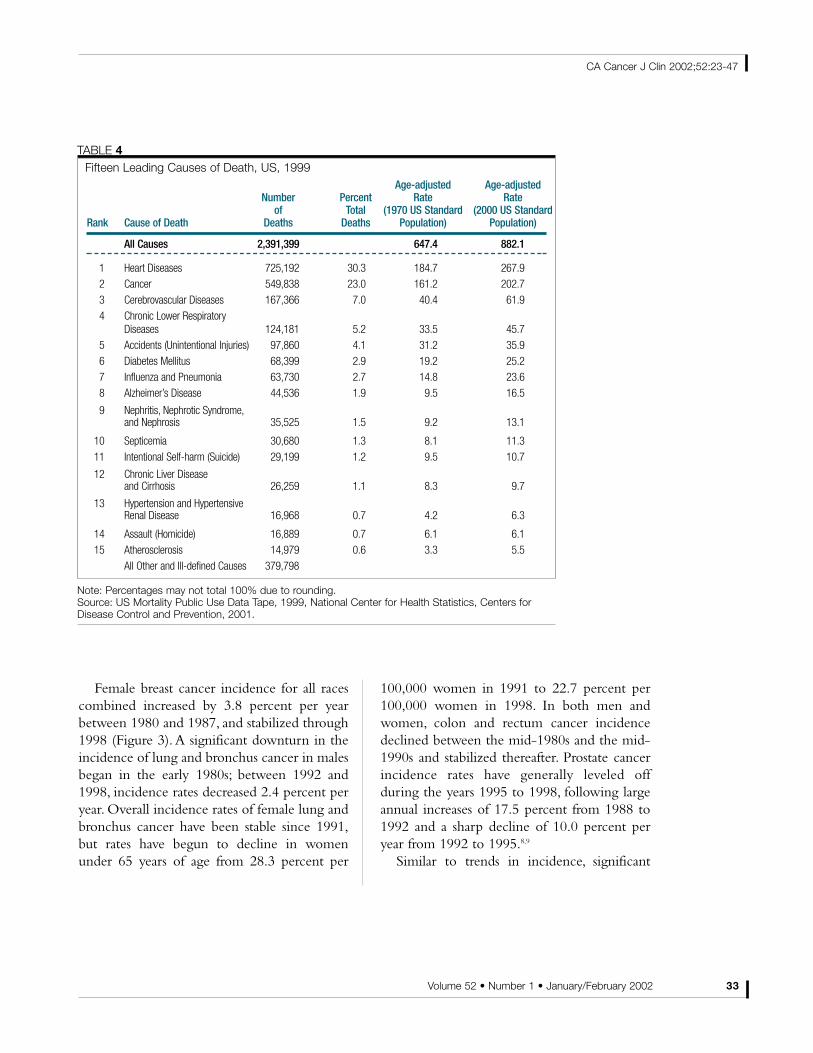
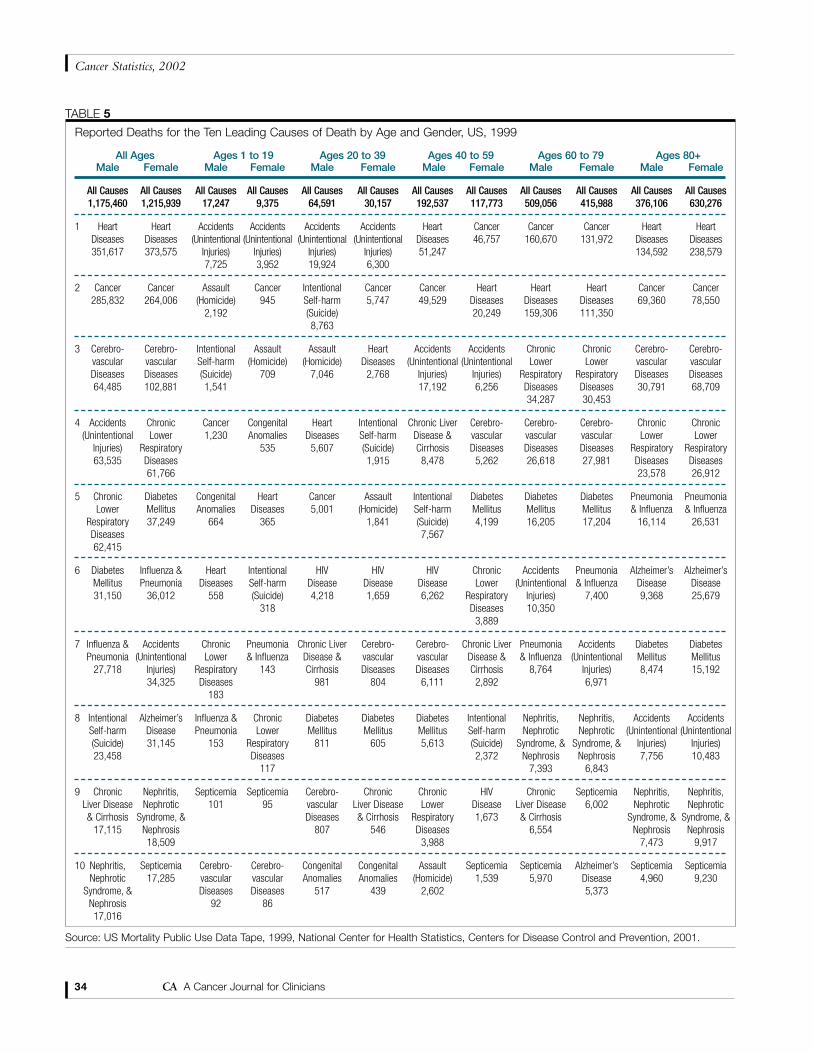
A total of 549,838 cancer deaths wererecorded in 1999 in the United States, up by8,306 deaths compared with 1998. Adjustingfor changes in rules for selecting underlyingcause of death reduced the increase in thenumber of cancer deaths to 4,624. Cancerdeaths accounted for 23 percent of all deaths,ranking second only to death from heart disease(Table 4).When deaths are categorized by ageand sex, cancer is by far the leading cause ofdeath among women aged 40 to 79 and amongmen aged 60 to 79 (Table 5). In contrast, cancerranks fifth as a cause of death among men aged20 to 39.
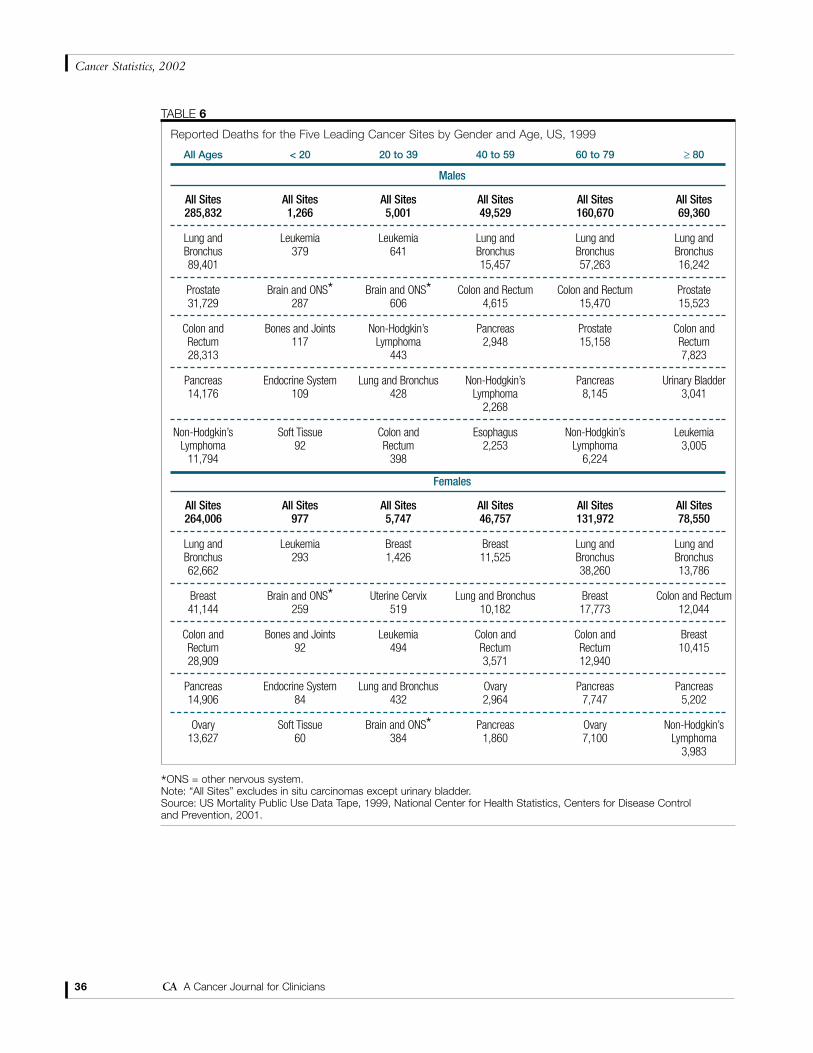
Table 6 describes the leading site-specificcauses of cancer death by age for males andfemales.Among men under age 40, leukemia isthe most common fatal cancer, while lung andbronchus cancer ranks first for men aged 40years and older. Colorectal cancer is the secondmost common site causing death among men
40 to 79 years old. Among women under age20, leukemia is the leading cause of cancerdeath; breast cancer ranks first as the cause ofcancer death for women between age 20 to 59years, and lung cancer is the leading cause ofcancer death for women aged 60 years andabove.
The number of recorded cancer deathsamong men increased by 3,767 from 1998 to1999 (Table 7). Accounting for the change inICD coding rules diminished the increase to1,849. The recorded number of deaths fromlung cancer continued to decrease among men.The decrease in lung cancer death wasaccentuated by the change in ICD code fromICD-9 to ICD-10. The new ICD code morerigorously excluded cancers metastatic to thelung, causing a decline of 1.6 percent of totallung cancer deaths.12 Accounting for this changesubstantially reduced the decline in the numberof lung cancer deaths (from 1,998 deaths to 508deaths). The number of prostate cancer deathshas continued to decline since 1995. From 1998to 1999, the recorded number of prostate cancerdeaths decreased by 474 and 906 with andwithout adjustment for the change in ICDcodes and coding rules, respectively. Colon andrectum cancer deaths among men increased byabout 300 from 1998 to 1999, and were affectedvery little by the new ICD version.
Among women, the total number of cancerdeaths recorded increased from 259,467 in1998 to 264,006 in 1999 (Table 7). Adjustingfor changes in ICD coding rules reduced theincrease from 4,539 to 2,775 cancer deaths.There were 413 fewer female lung cancerdeaths in 1999, compared with the year before,due to a decrease of 1.6 percent of lung cancerdeaths resulting from the implementation ofICD-10.Accounting for this change resulted in615 more lung cancer deaths in 1999 comparedwith 1998, consistent with the long-termincreasing trend. Female breast cancer deathsdecreased by 593, and decreased even more(827 deaths) when accounting for changes in
Volume 52 • Number 1 • January/February 2002 35
CA Cancer J Clin 2002;52:23-47
Reported Deaths for the Five Leading Cancer Sites by Gender and Age, US, 1999
All Ages < 20 20 to 39 40 to 59 60 to 79 ≥ 80
Males
All Sites All Sites All Sites All Sites All Sites All Sites285,832 1,266 5,001 49,529 160,670 69,360
Lung and Leukemia Leukemia Lung and Lung and Lung and Bronchus 379 641 Bronchus Bronchus Bronchus89,401 15,457 57,263 16,242
Prostate Brain and ONS* Brain and ONS* Colon and Rectum Colon and Rectum Prostate31,729 287 606 4,615 15,470 15,523
Colon and Bones and Joints Non-Hodgkin’s Pancreas Prostate Colon and Rectum 117 Lymphoma 2,948 15,158 Rectum28,313 443 7,823
Pancreas Endocrine System Lung and Bronchus Non-Hodgkin’s Pancreas Urinary Bladder14,176 109 428 Lymphoma 8,145 3,041
2,268
Non-Hodgkin’s Soft Tissue Colon and Esophagus Non-Hodgkin’s LeukemiaLymphoma 92 Rectum 2,253 Lymphoma 3,005
11,794 398 6,224
Females
All Sites All Sites All Sites All Sites All Sites All Sites264,006 977 5,747 46,757 131,972 78,550
Lung and Leukemia Breast Breast Lung and Lung and Bronchus 293 1,426 11,525 Bronchus Bronchus62,662 38,260 13,786
Breast Brain and ONS* Uterine Cervix Lung and Bronchus Breast Colon and Rectum41,144 259 519 10,182 17,773 12,044
Colon and Bones and Joints Leukemia Colon and Colon and BreastRectum 92 494 Rectum Rectum 10,41528,909 3,571 12,940
Pancreas Endocrine System Lung and Bronchus Ovary Pancreas Pancreas14,906 84 432 2,964 7,747 5,202
Ovary Soft Tissue Brain and ONS* Pancreas Ovary Non-Hodgkin’s13,627 60 384 1,860 7,100 Lymphoma
3,983
*ONS = other nervous system.Note: “All Sites” excludes in situ carcinomas except urinary bladder.Source: US Mortality Public Use Data Tape, 1999, National Center for Health Statistics, Centers for Disease Control and Prevention, 2001.
TABLE 6
36 CA A Cancer Journal for Clinicians
Cancer Statistics, 2002
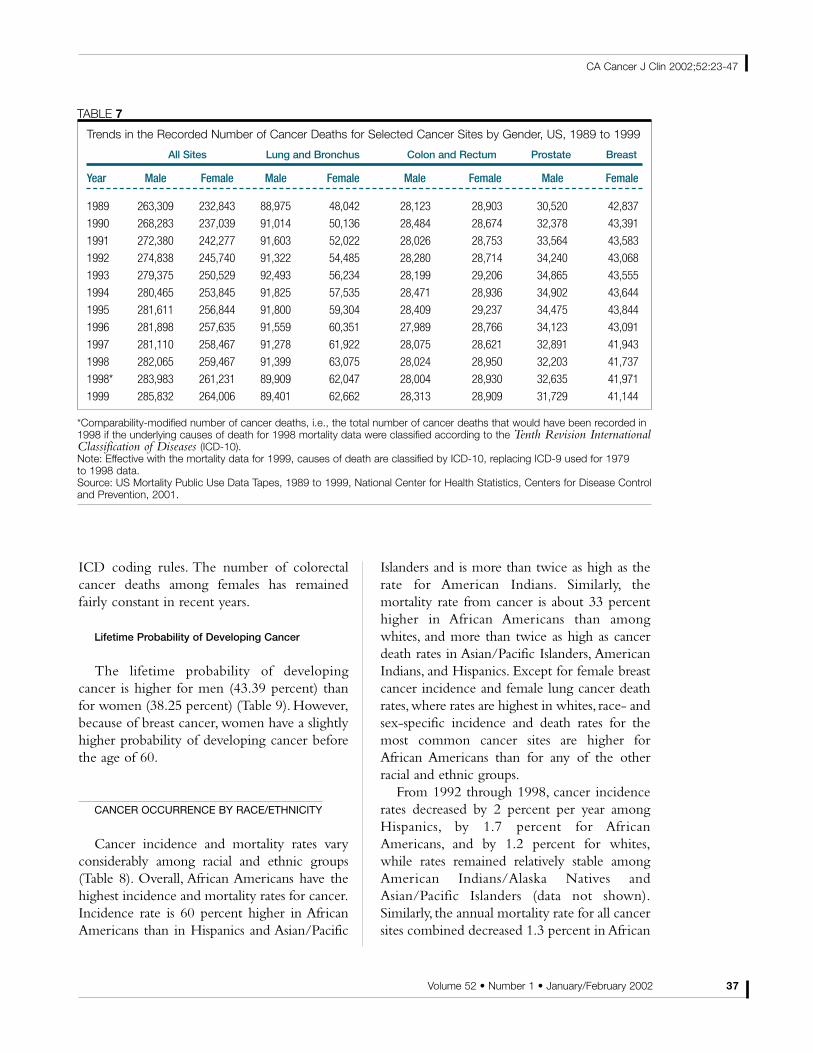
ICD coding rules. The number of colorectalcancer deaths among females has remainedfairly constant in recent years.
Lifetime Probability of Developing Cancer
The lifetime probability of developingcancer is higher for men (43.39 percent) thanfor women (38.25 percent) (Table 9). However,because of breast cancer, women have a slightlyhigher probability of developing cancer beforethe age of 60.
CANCER OCCURRENCE BY RACE/ETHNICITY
Cancer incidence and mortality rates varyconsiderably among racial and ethnic groups(Table 8). Overall, African Americans have thehighest incidence and mortality rates for cancer.Incidence rate is 60 percent higher in AfricanAmericans than in Hispanics and Asian/Pacific
Islanders and is more than twice as high as therate for American Indians. Similarly, themortality rate from cancer is about 33 percenthigher in African Americans than amongwhites, and more than twice as high as cancerdeath rates in Asian/Pacific Islanders, AmericanIndians, and Hispanics. Except for female breastcancer incidence and female lung cancer deathrates,where rates are highest in whites, race- andsex-specific incidence and death rates for themost common cancer sites are higher forAfrican Americans than for any of the otherracial and ethnic groups.
From 1992 through 1998, cancer incidencerates decreased by 2 percent per year amongHispanics, by 1.7 percent for AfricanAmericans, and by 1.2 percent for whites,while rates remained relatively stable amongAmerican Indians/Alaska Natives andAsian/Pacific Islanders (data not shown).Similarly, the annual mortality rate for all cancersites combined decreased 1.3 percent in African
Volume 52 • Number 1 • January/February 2002 37
CA Cancer J Clin 2002;52:23-47
Trends in the Recorded Number of Cancer Deaths for Selected Cancer Sites by Gender, US, 1989 to 1999
All Sites Lung and Bronchus Colon and Rectum Prostate Breast
Year Male Female Male Female Male Female Male Female
1989 263,309 232,843 88,975 48,042 28,123 28,903 30,520 42,837
1990 268,283 237,039 91,014 50,136 28,484 28,674 32,378 43,391
1991 272,380 242,277 91,603 52,022 28,026 28,753 33,564 43,583
1992 274,838 245,740 91,322 54,485 28,280 28,714 34,240 43,068
1993 279,375 250,529 92,493 56,234 28,199 29,206 34,865 43,555
1994 280,465 253,845 91,825 57,535 28,471 28,936 34,902 43,644
1995 281,611 256,844 91,800 59,304 28,409 29,237 34,475 43,844
1996 281,898 257,635 91,559 60,351 27,989 28,766 34,123 43,091
1997 281,110 258,467 91,278 61,922 28,075 28,621 32,891 41,943
1998 282,065 259,467 91,399 63,075 28,024 28,950 32,203 41,737
1998* 283,983 261,231 89,909 62,047 28,004 28,930 32,635 41,971
1999 285,832 264,006 89,401 62,662 28,313 28,909 31,729 41,144
*Comparability-modified number of cancer deaths, i.e., the total number of cancer deaths that would have been recorded in1998 if the underlying causes of death for 1998 mortality data were classified according to the Tenth Revision InternationalClassification of Diseases (ICD-10). Note: Effective with the mortality data for 1999, causes of death are classified by ICD-10, replacing ICD-9 used for 1979 to 1998 data.Source: US Mortality Public Use Data Tapes, 1989 to 1999, National Center for Health Statistics, Centers for Disease Controland Prevention, 2001.
TABLE 7
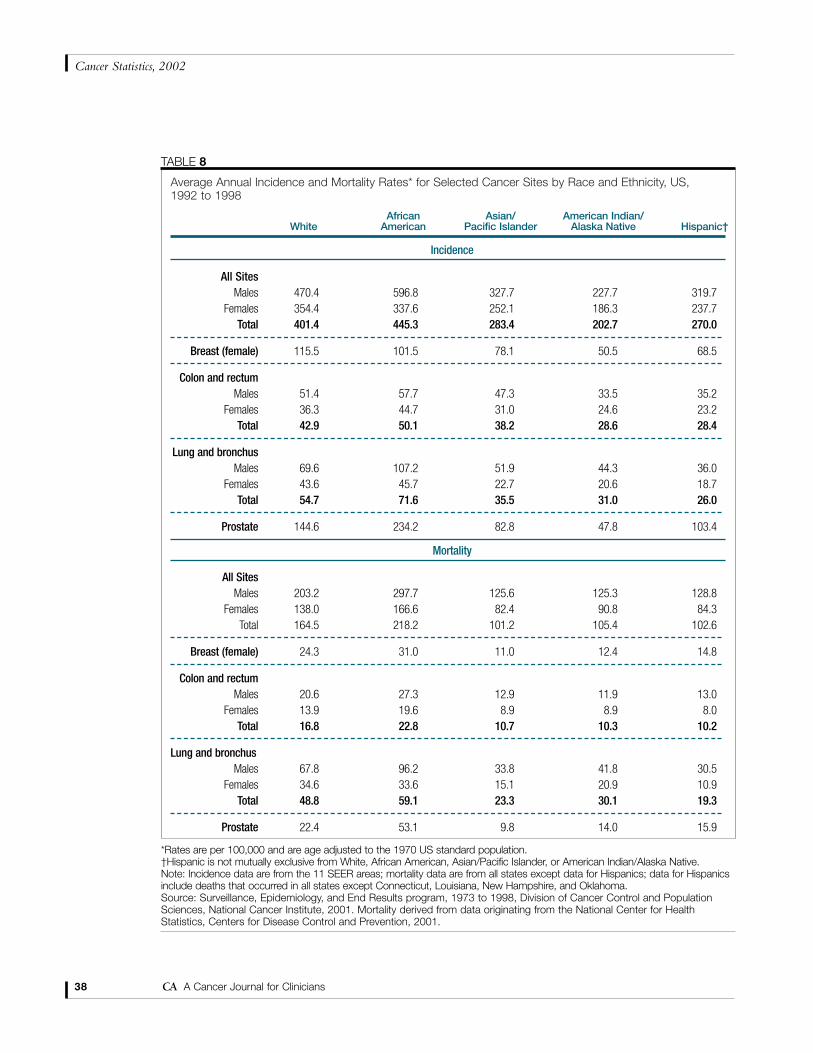
Average Annual Incidence and Mortality Rates* for Selected Cancer Sites by Race and Ethnicity, US, 1992 to 1998
African Asian/ American Indian/White American Pacific Islander Alaska Native Hispanic†
Incidence
All SitesMales 470.4 596.8 327.7 227.7 319.7
Females 354.4 337.6 252.1 186.3 237.7Total 401.4 445.3 283.4 202.7 270.0
Breast (female) 115.5 101.5 78.1 50.5 68.5
Colon and rectumMales 51.4 57.7 47.3 33.5 35.2
Females 36.3 44.7 31.0 24.6 23.2Total 42.9 50.1 38.2 28.6 28.4
Lung and bronchusMales 69.6 107.2 51.9 44.3 36.0
Females 43.6 45.7 22.7 20.6 18.7Total 54.7 71.6 35.5 31.0 26.0
Prostate 144.6 234.2 82.8 47.8 103.4
Mortality
All SitesMales 203.2 297.7 125.6 125.3 128.8
Females 138.0 166.6 82.4 90.8 84.3Total 164.5 218.2 101.2 105.4 102.6
Breast (female) 24.3 31.0 11.0 12.4 14.8
Colon and rectumMales 20.6 27.3 12.9 11.9 13.0
Females 13.9 19.6 8.9 8.9 8.0Total 16.8 22.8 10.7 10.3 10.2
Lung and bronchusMales 67.8 96.2 33.8 41.8 30.5
Females 34.6 33.6 15.1 20.9 10.9Total 48.8 59.1 23.3 30.1 19.3
Prostate 22.4 53.1 9.8 14.0 15.9
*Rates are per 100,000 and are age adjusted to the 1970 US standard population.†Hispanic is not mutually exclusive from White, African American, Asian/Pacific Islander, or American Indian/Alaska Native.Note: Incidence data are from the 11 SEER areas; mortality data are from all states except data for Hispanics; data for Hispanicsinclude deaths that occurred in all states except Connecticut, Louisiana, New Hampshire, and Oklahoma.Source: Surveillance, Epidemiology, and End Results program, 1973 to 1998, Division of Cancer Control and PopulationSciences, National Cancer Institute, 2001. Mortality derived from data originating from the National Center for HealthStatistics, Centers for Disease Control and Prevention, 2001.
TABLE 8
38 CA A Cancer Journal for Clinicians
Cancer Statistics, 2002

Americans, 1.2 percent in Asian/PacificIslanders, 1.1 percent among whites, and 0.9percent among Hispanics; and it leveled off inAmerican Indians/Alaska Natives. For race-and sex-specific trends, African-American menshowed the largest decrease in both incidenceand mortality during the same calendar years.
Cancer Survival By Race
A poorer probability of survival once acancer diagnosis is made contributes to thehigher death rates among African-Americanmen and women. African Americans are lesslikely than whites to be diagnosed with cancer
Volume 52 • Number 1 • January/February 2002 39
CA Cancer J Clin 2002;52:23-47
*For those free of cancer at beginning of age interval. Based on cancer cases diagnosed during 1996 to 1998.The “1 in” statistic and the inverse of the percentage may not be equivalent due to rounding. †All sites exclude basal and squamous cell skin cancers and in situ cancers except urinary bladder. ‡Includes invasive and in situ cancer cases.Source: DEVCAN Software, Version 4.1, Surveillance, Epidemiology, and End Results program, 1973 to 1998, Division of Cancer Control andPopulation Sciences, National Cancer Institute, 2001.
Probability of Developing Invasive Cancers within Selected Age Intervals, by Gender, US, 1996 to 1998*
Birth to 39 40 to 59 60 to 79 Birth to Death
(%) (%) (%) (%)
All Sites † Male 1.45 (1 in 69) 8.33 (1 in 12) 33.3 (1 in 3) 43.48 (1 in 2)Female 1.92 (1 in 52) 9.09 (1 in 11) 20.0 (1 in 5) 33.3 (1 in 3)
Bladder ‡ Male 0.024 (1 in 4,234) 0.42 (1 in 236) 2.38 (1 in 42) 3.45 (1 in 29)Female (Less than 1 in 10,000) 0.13 (1 in 760) 0.64 (1 in 156) 1.12 (1 in 89)
Breast Female 0.44 (1 in 229) 4.17 (1 in 24) 7.14 (1 in 14) 12.5 (1 in 8)
Colon and Male 0.07 (1 in 1,508) 0.87 (1 in 115) 4.00 (1 in 25) 5.88 (1 in 17)Rectum Female 0.06 (1 in 1,719) 0.69 (1 in 145) 3.03 (1 in 33) 5.55 (1 in 18)
Leukemia Male 0.16 (1 in 627) 0.21 (1 in 483) 0.81 (1 in 124) 1.43 (1 in 70)Female 0.12 (1 in 810) 0.15 (1 in 671) 0.47 (1 in 212) 1.04 (1 in 96)
Lung and Male 0.03 (1 in 3,060) 1.12 (1 in 89) 5.88 (1 in 17) 7.69 (1 in 13)Bronchus Female 0.03 (1 in 3,099) 0.86 (1 in 116) 4.00 (1 in 25) 5.88 (1 in 17)
Melanoma Male 0.13 (1 in 769) 0.50 (1 in 199) 0.97 (1 in 103) 1.72 (1 in 58)of the Skin Female 0.19 (1 in 508) 0.38 (1 in 261) 0.49 (1 in 201) 1.22 (1 in 82)
Non-Hodgkin’s Male 0.17 (1 in 591) 0.48 (1 in 208) 1.23 (1 in 81) 2.08 (1 in 48)Lymphoma Female 0.08 (1 in 1,311) 0.32 (1 in 317) 0.98 (1 in 102) 1.75 (1 in 57)
Prostate Male (Less than 1 in 10,000) 2.08 (1 in 48) 12.5 (1 in 8) 16.67 (1 in 6)
Uterine Cervix Female 0.18 (1 in 567) 0.35 (1 in 288) 0.28 (1 in 354) 0.85 (1 in 117)
Uterine Corpus Female 0.05 (1 in 2,097) 0.72 (1 in 138) 1.64 (1 in 61) 2.70 (1 in 37)
TABLE 9

0 20 40 60 80 100
Breast
Colon and Rectum
Esophagus
Lung and Bronchus
Melanoma of the Skin
Oral Cavity and Pharynx
Ovary
Pancreas
Prostate*
Stomach
Urinary Bladder
Uterine Cervix
Uterine Corpus
White Localized •White Regional •
White Distant •
African American Localized •African American Regional •
African American Distant •
All Races Localized •All Races Regional •
All Races Distant •
FIGURE 6
Distribution of Cancer Cases by Race and Stage at Diagnosis, US, 1992 to 1997
*The rate for local stage represents local and regional stages combined.Note: Staging according to Surveillance, Epidemiology, and End Results (SEER) historic stage categories rather than the American JointCommittee on Cancer (AJCC) staging system.For each site and race, stage categories do not total 100% because sufficient information is not available to assign a stage to all cancer cases.Source: Surveillance, Epidemiology, and End Results program, 1973 to 1998, Division of Cancer Control and Population Sciences, NationalCancer Institute, 2001.
40 CA A Cancer Journal for Clinicians
Cancer Statistics, 2002
0 20 40 60 80 100
Breast
Colon and Rectum
Esophagus
Lung and Bronchus
Melanoma of the Skin
Oral Cavity and Pharynx
Ovary
Pancreas
Prostate‡
Stomach
Urinary Bladder
Uterine Cervix
Uterine Corpus
White All Stages •White Localized •White Regional •
White Distant •
African American All Stages •African American Localized •African American Regional •
African American Distant •
All Races All Stages •All Races Localized •All Races Regional •
All Races Distant •
* †
*
FIGURE 7
Five-Year Relative Survival Rates by Race and Stage at Diagnosis, US, 1992 to 1997
*The standard error is between five and 10 percentage points.†The standard error is greater than 10 percentage points.‡The rate for local stage represents local and regional stages combined.Note: Staging according to Surveillance, Epidemiology, and End Results (SEER) historic stage categories rather than the American JointCommittee on Cancer (AJCC) staging system.Source: Surveillance, Epidemiology, and End Results program, 1973 to 1998, Division of Cancer Control and Population Sciences, NationalCancer Institute, 2001.
Volume 52 • Number 1 • January/February 2002 41
CA Cancer J Clin 2002;52:23-47
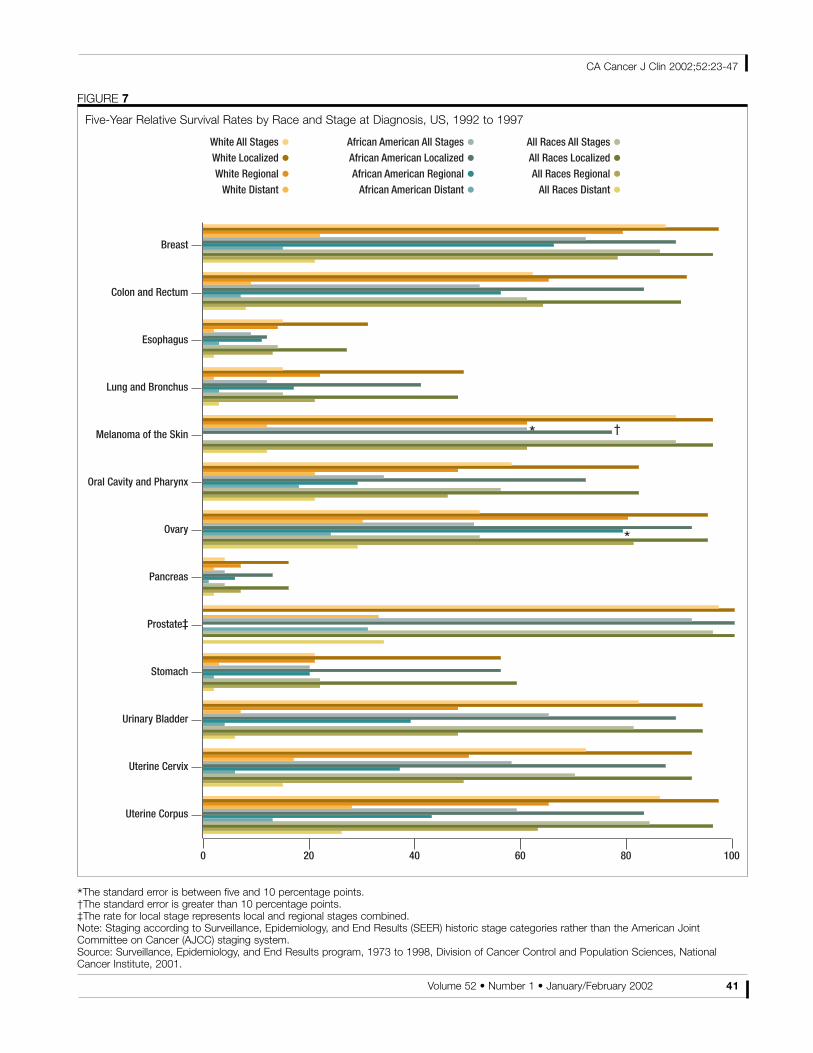
at a localized stage, when the disease may bemore easily and successfully treated, and aremore likely to be diagnosed with cancer at aregional or distant stage of disease.This is truefor most of the common cancer sites (Figure 6).Furthermore, for nearly every cancer site,African Americans have lower five-year relative
survival rates than whites at each stage ofdiagnosis (Figure 7), suggesting the possibleinfluences of differences in treatment, tumorpathology, and comorbid conditions.
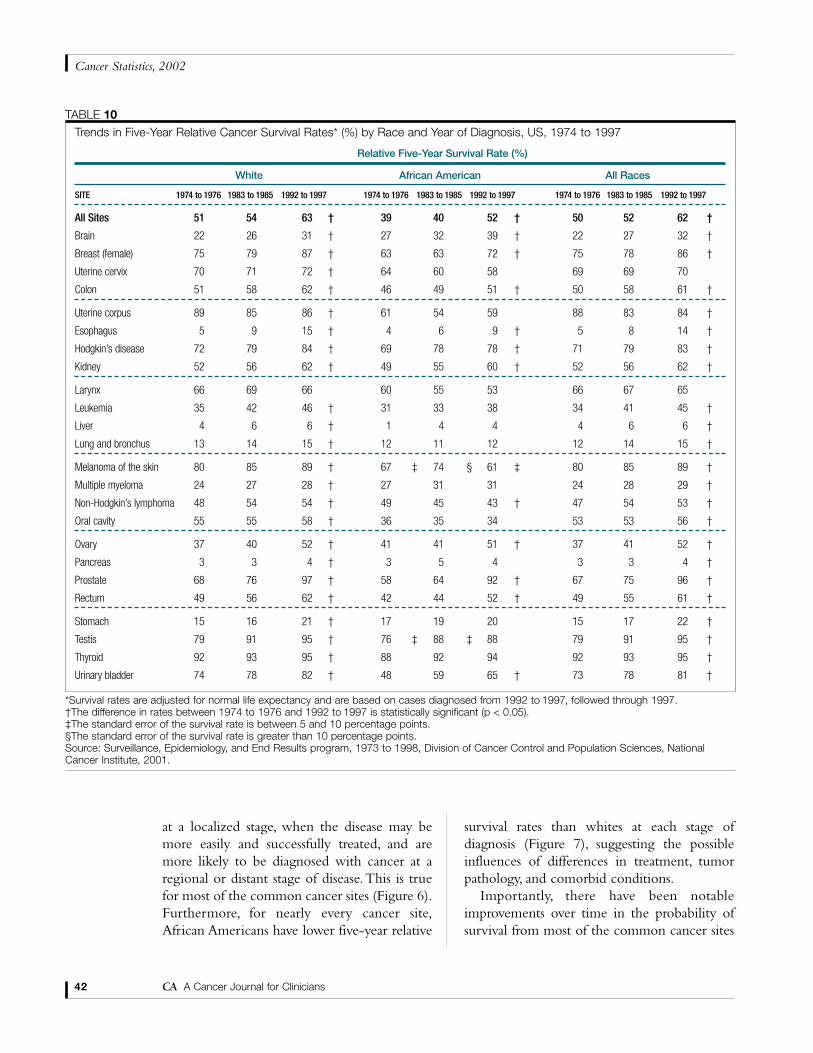
Importantly, there have been notableimprovements over time in the probability ofsurvival from most of the common cancer sites
42 CA A Cancer Journal for Clinicians
Cancer Statistics, 2002
*Survival rates are adjusted for normal life expectancy and are based on cases diagnosed from 1992 to 1997, followed through 1997.†The difference in rates between 1974 to 1976 and 1992 to 1997 is statistically significant (p < 0.05).‡The standard error of the survival rate is between 5 and 10 percentage points.§The standard error of the survival rate is greater than 10 percentage points.Source: Surveillance, Epidemiology, and End Results program, 1973 to 1998, Division of Cancer Control and Population Sciences, NationalCancer Institute, 2001.
Trends in Five-Year Relative Cancer Survival Rates* (%) by Race and Year of Diagnosis, US, 1974 to 1997
Relative Five-Year Survival Rate (%)
White African American All Races
SITE 1974 to 1976 1983 to 1985 1992 to 1997 1974 to 1976 1983 to 1985 1992 to 1997 1974 to 1976 1983 to 1985 1992 to 1997
All Sites 51 54 63 † 39 40 52 † 50 52 62 †
Brain 22 26 31 † 27 32 39 † 22 27 32 †
Breast (female) 75 79 87 † 63 63 72 † 75 78 86 †
Uterine cervix 70 71 72 † 64 60 58 69 69 70
Colon 51 58 62 † 46 49 51 † 50 58 61 †
Uterine corpus 89 85 86 † 61 54 59 88 83 84 †
Esophagus 5 9 15 † 4 6 9 † 5 8 14 †
Hodgkin’s disease 72 79 84 † 69 78 78 † 71 79 83 †
Kidney 52 56 62 † 49 55 60 † 52 56 62 †
Larynx 66 69 66 60 55 53 66 67 65
Leukemia 35 42 46 † 31 33 38 34 41 45 †
Liver 4 6 6 † 1 4 4 4 6 6 †
Lung and bronchus 13 14 15 † 12 11 12 12 14 15 †
Melanoma of the skin 80 85 89 † 67 ‡ 74 § 61 ‡ 80 85 89 †
Multiple myeloma 24 27 28 † 27 31 31 24 28 29 †
Non-Hodgkin’s lymphoma 48 54 54 † 49 45 43 † 47 54 53 †
Oral cavity 55 55 58 † 36 35 34 53 53 56 †
Ovary 37 40 52 † 41 41 51 † 37 41 52 †
Pancreas 3 3 4 † 3 5 4 3 3 4 †
Prostate 68 76 97 † 58 64 92 † 67 75 96 †
Rectum 49 56 62 † 42 44 52 † 49 55 61 †
Stomach 15 16 21 † 17 19 20 15 17 22 †
Testis 79 91 95 † 76 ‡ 88 ‡ 88 79 91 95 †
Thyroid 92 93 95 † 88 92 94 92 93 95 †
Urinary bladder 74 78 82 † 48 59 65 † 73 78 81 †
TABLE 10
and from all cancers combined (Table 10).Thisis true for both whites and African Americans.Cancer sites without significant improvementsin survival in the past 25 years include uterinecervix, larynx, and oral cavity.
CANCER IN CHILDREN
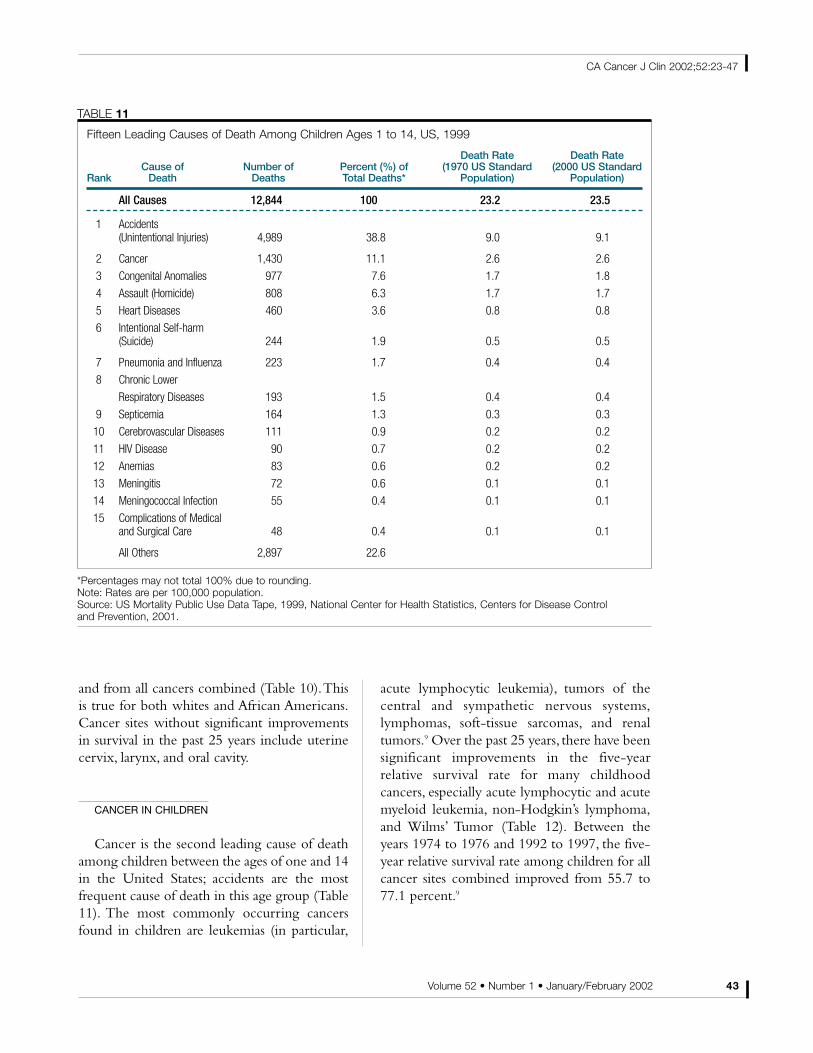
Cancer is the second leading cause of deathamong children between the ages of one and 14in the United States; accidents are the mostfrequent cause of death in this age group (Table11). The most commonly occurring cancersfound in children are leukemias (in particular,
acute lymphocytic leukemia), tumors of thecentral and sympathetic nervous systems,lymphomas, soft-tissue sarcomas, and renaltumors.9 Over the past 25 years, there have beensignificant improvements in the five-yearrelative survival rate for many childhoodcancers, especially acute lymphocytic and acutemyeloid leukemia, non-Hodgkin’s lymphoma,and Wilms’ Tumor (Table 12). Between theyears 1974 to 1976 and 1992 to 1997, the five-year relative survival rate among children for allcancer sites combined improved from 55.7 to77.1 percent.9
Volume 52 • Number 1 • January/February 2002 43
CA Cancer J Clin 2002;52:23-47
Fifteen Leading Causes of Death Among Children Ages 1 to 14, US, 1999
Death Rate Death RateCause of Number of Percent (%) of (1970 US Standard (2000 US Standard
Rank Death Deaths Total Deaths* Population) Population)
All Causes 12,844 100 23.2 23.5
1 Accidents (Unintentional Injuries) 4,989 38.8 9.0 9.1
2 Cancer 1,430 11.1 2.6 2.6
3 Congenital Anomalies 977 7.6 1.7 1.8
4 Assault (Homicide) 808 6.3 1.7 1.7
5 Heart Diseases 460 3.6 0.8 0.8
6 Intentional Self-harm (Suicide) 244 1.9 0.5 0.5
7 Pneumonia and Influenza 223 1.7 0.4 0.4
8 Chronic Lower
Respiratory Diseases 193 1.5 0.4 0.4
9 Septicemia 164 1.3 0.3 0.3
10 Cerebrovascular Diseases 111 0.9 0.2 0.2
11 HIV Disease 90 0.7 0.2 0.2
12 Anemias 83 0.6 0.2 0.2
13 Meningitis 72 0.6 0.1 0.1
14 Meningococcal Infection 55 0.4 0.1 0.1
15 Complications of Medical and Surgical Care 48 0.4 0.1 0.1
All Others 2,897 22.6
*Percentages may not total 100% due to rounding.Note: Rates are per 100,000 population.Source: US Mortality Public Use Data Tape, 1999, National Center for Health Statistics, Centers for Disease Control and Prevention, 2001.
TABLE 11

LIMITATIONS AND FUTURE CHALLENGES
When tracking trends over time, estimates ofthe expected numbers of new cancer cases andcancer deaths should be interpreted withcaution.These estimates may vary considerablyfrom year to year, particularly for less commoncancers and for states with smaller populations.For this reason, we discourage the use of theseestimates to track year-to-year changes incancer occurrence and death. The recordednumber of cancer deaths and cancer death ratesfrom the NCHS, and SEER cancer incidencerates are generally more informative fortracking cancer trends. For example, breastcancer incidence rates stabilized between 1973and 1980, increased by 3.8 percent per yearbetween 1980 and 1987, and by 1.1 percent peryear between 1992 and 1998, due to increasingutilization of mammography.
Our estimates are based on the mostcurrently available cancer mortality andincidence data; however, these data are three
and four years old, respectively, at the time thatthe estimates are calculated. Unanticipatedchanges that may have occurred in the three-orfour-year interval between 1998 or 1999 and2002 are not captured by our modeling efforts.Finally, our estimates of new cancer cases arebased on incidence rates for the geographiclocations that participate in the SEER programand, therefore, may not be representative of theentire United States.
For the 1999 mortality data, the underlyingcauses of deaths were coded and classified usingICD-10 coding rules, replacing ICD-9 codingdesignations used for deaths occurring between1979 and 1998. Several important changes havetaken place in selection and coding of primarysites of malignant neoplasm in ICD-10 codes,including the following two changes:
(1) Order of entry in the medical certificateof death is not used to identify neoplasms asprimary or secondary. For example, when twoor more cancer sites, which are not listed ascommon sites of metastasis, appear together in
44 CA A Cancer Journal for Clinicians
Cancer Statistics, 2002
Trends in Five-Year Relative Cancer Survival Rates* (%) for Children Under Age 15, US, 1974 to 1997
Five-Year Relative Survival Rates (%)
Year of Diagnosis
Site 1974 to 1976 1977 to 1979 1980 to 1982 1983 to 1985 1986 to 1988 1989 to 1991 1992 to 1997
All Sites 56 62 65 67 70 73 77†Acute Lymphocytic Leukemia 53 67 71 69 78 80 85†Acute Myeloid Leukemia 14 30‡ 21‡ 32‡ 32‡ 35‡ 45†Bones and Joints 53‡ 53‡ 55‡ 57 63‡ 62 73†Brain and Other Nervous System 55 56 56 62 63 62 69†Hodgkin’s Disease 78 83 91 90 90 94 92†Neuroblastoma 53 54 53 55 60 68 71†Non-Hodgkin’s Lymphoma 44 50 62 71 70 75 80†Soft Tissue 61 68 65 76 67 78 74†Wilm’s Tumor 74 78 87 87 91 93 92†
TABLE 12
*Survival rates are adjusted for normal life expectancy and are based on follow-up of patients through 1998.†The difference in rates between 1974 to 1976 and 1992 to 1997 is statistically significant (p < 0.05).‡The standard error of the survival rate is between 5 and 10 percentage points.Note: “All Sites” excludes basal and squamous cell skin cancers and in situ carcinomas except urinary bladder.Source: Surveillance, Epidemiology, and End Results program, 1973 to 1998, Division of Cancer Control and Population Sciences, NationalCancer Institute, 2001.
Part I of a medical certificate of death, theunderlying cause of death is assigned tomalignant neoplasms of independent (primary)multiple sites.
(2) Lung cancer has been added to the list ofcommon sites of metastasis and is consideredsecondary whenever it appears in Part I of themedical death certification with any othercancer site not on the list.
These coding changes will undoubtedlyaffect the temporal trends of various cancermortalities. For the changes in the number of
deaths from the most common cancer sitesbetween 1998 and 1999, we have accounted forthe change in ICD coding rules using acomparability ratio conversion method, andassumed that they are not influenced by sex.12
Despite these limitations, the AmericanCancer Society estimates do provide evidenceof current patterns of cancer incidence andmortality in the United States. Such estimateswill assist us in our continuing effort to reducethe public health burden of cancer. CA
Volume 52 • Number 1 • January/February 2002 45
CA Cancer J Clin 2002;52:23-47
REFERENCES
1. National Center for Health Statistics, Divisionof Vital Statistics, Centers for Disease Control.Available at: www.cdc.gov/nchs/nvss.htm.Accessed October, 2001.
2. National Cancer Institute, DCCPS,Surveillance Research Program, Cancer StatisticsBranch. SEER Program Public-Use Data Tapes1973-1998, August 2000 Submission. ReleasedApril 2001.
3. US Census Bureau. Available at: www.census.gov.Accessed October, 2001.
4. Manual of the international statistical classifica-tion of diseases, injuries, and causes of death.Vol1, tenth revision. World Health Organization,Geneva, 1992.
5. Manual of the international statistical classifica-tion of diseases, injuries, and causes of death:Vol1, ninth revision. World Health Organization,Geneva, 1975.
6. Percy C, Van Holten V, Muir C (eds).International classification of diseases for oncolo-gy, ed 2. World Health Organization, Geneva,1990.
7.Wingo PA, Landis S, Parker S, et al. Using can-cer registry and vital statistics data to estimate thenumber of new cancer cases and deaths in the US
for the upcoming year. J Reg Management1998;25:43-51.
8. Howe HL,Wingo PA,Thun MJ, et al. Annualreport to the nation on the status of cancer (1973through 1998), featuring cancers with recentincreasing trends. J Natl Cancer Inst2001;93:824-842.
9. Ries LAG, Eisner MP, Kosary CL, et al. (eds).SEER Cancer Statistics Review, 1973-1998.National Cancer Institute, Bethesda, MD, 2001.
10.Wingo PA, Landis S, Ries LAG.An adjustmentto the 1997 estimate for new prostate cancercases. CA Cancer J Clin 1997;47:239-242.
11. Hankey BF, Feuer EJ, Clegg LX, et al. Cancersurveillance series: Interpreting trends in prostatecancer-part I: Evidence of the effects of screeningin recent prostate cancer incidence, mortality, andsurvival rates. J Natl Cancer Inst 1999;91:1017-1024.
12. Anderson RN, Minino AM, Hoyet DL,Rosenberg HM.Comparability of causes of deathbetween ICD-9 and ICD-10: Preliminary esti-mates. National Vital Statistics Reports2001;49:1-32.
13.Feuer EJ,Wun LM. DEVCAN: Probability ofDeveloping or Dying of Cancer (Software), ver-sion 4. National Cancer Institute, Bethesda, MD,2000.

Can
cer
Aro
und
the
Wor
ld, D
eath
Rat
es*
per
100,
000
Pop
ulat
ion
for
45 C
ount
ries,
200
0
COUN
TRY
All S
ites
Oral
Colo
n an
d Re
ctum
Brea
stPr
osta
teLu
ng a
nd B
ronc
hus
Uter
usSt
omac
hLe
ukem
ia
Mal
eFe
mal
eM
ale
Fem
ale
Mal
eFe
mal
eFe
mal
eM
ale
Mal
eFe
mal
eCe
rvix
Othe
rM
ale
Fem
ale
Mal
eFe
mal
e
Unite
d St
ates
161.
8 (2
2)11
6.4
(10)
1.8
(34)
0.8
(17)
15.9
(27)
12.0
(20)
21.2
(12)
17.9
(18)
53.2
(13)
27.2
(1)
3.3
(33)
2.0
(32)
4.5
(45)
2.3
(45)
6.6
(4)
4.2
(5)
Aust
ralia
150.
9 (2
8)10
3.2
(25)
2.2
(27)
0.9
(10)
20.1
(12)
14.4
(12)
19.7
(18)
18.0
(17)
36.2
(31)
14.0
(10)
2.4
(41)
1.6
(38)
6.1
(44)
3.0
(44)
5.7
(14)
3.8
(14)
Aust
ria16
8.6
(20)
113.
8 (1
2)3.
7 (1
5)0.
8 (1
8)23
.0 (8
)14
.9 (1
0)23
.3 (9
)18
.9 (1
2)41
.8 (2
5)10
.8 (1
6)4.
7 (2
6)2.
8 (1
9)14
.1 (2
4)8.
6 (2
2)5.
0 (2
5)3.
6 (1
8)Az
erba
ijan
114.
2 (4
1)61
.8 (4
5)1.
3 (4
1)0.
5 (4
2)6.
4 (4
0)4.
8 (4
2)8.
8 (4
3)4.
3 (4
3)25
.5 (3
7)4.
5 (4
2)1.
9 (4
4)3.
9 (1
0)24
.7 (8
)10
.5 (1
0)4.
0 (3
8)2.
7 (3
9)Bu
lgar
ia15
0.3
(29)
89.4
(35)
2.9
(21)
0.5
(43)
17.8
(20)
12.0
(21)
16.7
(31)
9.0
(34)
43.7
(22)
7.1
(32)
7.4
(15)
3.2
(14)
17.8
(20)
9.0
(20)
5.2
(21)
3.3
(24)
Cana
da16
0.5
(23)
116.
7 (9
)2.
3 (2
5)0.
8 (1
9)16
.4 (2
6)11
.6 (2
3)22
.7 (1
0)17
.1 (2
1)50
.4 (1
4)25
.0 (3
)2.
8 (3
9)1.
8 (3
5)6.
4 (4
3)3.
2 (4
3)6.
2 (8
)3.
9 (8
)Ch
ile14
1.2
(34)
108.
7 (1
8)1.
1 (4
5)0.
4 (4
5)7.
0 (3
9)7.
1 (3
7)12
.7 (3
7)19
.9 (9
)20
.3 (4
0)7.
0 (3
3)10
.6 (8
)1.
4 (4
0)30
.1 (5
)12
.7 (7
)4.
0 (3
9)3.
0 (3
7)Ch
ina
143.
3 (3
3)76
.9 (4
3)2.
2 (2
8)1.
0 (6
)7.
2 (3
8)5.
3 (4
1)4.
5 (4
5)1.
0 (4
5)33
.2 (3
2)13
.5 (1
1)3.
1 (3
5)0.
4 (4
4)27
.0 (6
)13
.0 (6
)2.
8 (4
4)2.
0 (4
4)Co
lom
bia
116.
1 (4
0)10
6.5
(19)
1.4
(39)
1.0
(7)
5.8
(41)
6.1
(39)
10.6
(40)
15.1
(27)
17.0
(43)
8.5
(24)
13.7
(4)
3.5
(13)
26.4
(7)
16.4
(2)
4.7
(31)
3.9
(9)
Croa
tia23
0.1
(2)
105.
4 (2
1)7.
2 (3
)0.
8 (2
0)24
.8 (6
)13
.0 (1
6)19
.9 (1
7)15
.3 (2
5)70
.3 (3
)9.
4 (2
0)5.
7 (2
1)1.
9 (3
4)21
.7 (1
4)9.
1 (1
9)5.
8 (1
2)3.
5 (2
0)
Cuba
141.
0 (3
5)10
4.0
(23)
4.0
(12)
1.6
(1)
11.4
(32)
12.4
(18)
15.6
(35)
22.1
(5)
42.8
(23)
15.6
(8)
10.6
(9)
4.0
(9)
8.4
(38)
4.3
(38)
4.8
(30)
3.6
(19)
Czec
h Re
publ
ic22
2.2
(3)
127.
6 (6
)4.
4 (9
)0.
8 (2
1)34
.2 (1
)18
.5 (3
)21
.0 (1
3)15
.7 (2
3)65
.3 (5
)11
.5 (1
4)6.
2 (2
0)4.
4 (4
)13
.5 (2
5)7.
5 (2
4)6.
7 (3
)4.
4 (3
)De
nmar
k18
4.9
(14)
144.
0 (2
)3.
0 (2
0)1.
2 (3
)23
.8 (7
)18
.5 (4
)29
.2 (1
)23
.1 (4
)50
.0 (1
5)26
.7 (2
)4.
1 (2
8)2.
4 (2
2)7.
5 (4
0)3.
6 (4
1)5.
8 (1
3)3.
9 (1
0)Es
toni
a20
1.5
(9)
104.
8 (2
2)5.
3 (5
)1.
0 (8
)16
.7 (2
4)12
.0 (2
2)19
.3 (1
9)15
.3 (2
6)64
.5 (6
)8.
6 (2
3)9.
7 (1
0)2.
9 (1
7)24
.2 (1
1)10
.4 (1
1)5.
7 (1
5)3.
9 (1
1)Fi
nlan
d14
5.8
(32)
92.5
(32)
1.7
(36)
0.9
(11)
12.5
(30)
9.5
(32)
17.9
(26)
19.1
(11)
41.2
(26)
7.4
(28)
1.3
(45)
2.5
(21)
10.3
(30)
5.6
(31)
4.7
(32)
3.3
(25)
Fran
ce20
1.5
(10)
98.0
(30)
4.4
(10)
0.8
(22)
18.3
(17)
12.1
(19)
21.4
(11)
19.2
(10)
48.5
(19)
6.7
(35)
3.5
(32)
2.1
(30)
8.0
(39)
3.6
(42)
6.1
(9)
3.9
(12)
Germ
any
176.
6 (1
6)11
6.9
(8)
3.2
(19)
0.8
(23)
21.7
(11)
17.0
(6)
23.7
(8)
18.4
(15)
46.2
(20)
9.6
(18)
4.2
(27)
2.1
(31)
12.9
(27)
7.8
(23)
5.7
(16)
3.9
(13)
Gree
ce14
9.5
(31)
81.8
(42)
1.5
(37)
0.5
(44)
8.4
(37)
6.7
(38)
16.7
(32)
10.7
(33)
50.0
(16)
7.4
(29)
2.2
(42)
1.1
(43)
8.5
(37)
4.7
(36)
6.3
(6)
3.8
(15)
Hung
ary
272.
3 (1
)14
7.4
(1)
10.9
(1)
1.6
(2)
33.5
(2)
20.9
(1)
25.3
(7)
17.9
(19)
86.2
(1)
20.0
(5)
7.7
(14)
4.1
(8)
21.0
(16)
10.1
(13)
7.6
(1)
4.9
(1)
Irela
nd17
0.2
(19)
127.
8 (5
)3.
4 (1
7)0.
8 (2
4)22
.6 (9
)15
.4 (8
)25
.8 (6
)21
.6 (6
)38
.3 (3
0)17
.3 (7
)3.
9 (2
9)1.
5 (3
9)10
.1 (3
1)5.
0 (3
4)5.
4 (1
9)3.
3 (2
6)
Isra
el13
5.1
(38)
111.
4 (1
5)1.
3 (4
2)0.
7 (3
3)19
.7 (1
3)15
.3 (9
)26
.2 (4
)14
.2 (3
0)27
.5 (3
6)9.
3 (2
1)3.
1 (3
6)1.
8 (3
6)9.
3 (3
5)5.
6 (3
2)6.
5 (5
)4.
5 (2
)Ja
pan
159.
5 (2
4)83
.1 (4
1)2.
0 (3
3)0.
8 (2
5)17
.6 (2
1)11
.0 (2
8)7.
7 (4
4)5.
5 (4
0)33
.1 (3
3)9.
6 (1
9)3.
0 (3
7)1.
2 (4
2)31
.2 (4
)13
.8 (4
)4.
1 (3
6)2.
6 (4
1)Ka
zakh
stan
201.
9 (8
)10
2.6
(27)
2.5
(22)
1.2
(4)
12.2
(31)
8.6
(33)
13.3
(36)
5.2
(41)
59.5
(9)
8.3
(25)
8.1
(12)
2.4
(23)
32.0
(3)
13.8
(5)
3.3
(43)
2.5
(42)
Kyrg
yzst
an18
5.6
(13)
112.
6 (1
4)2.
1 (3
1)0.
7 (3
4)10
.9 (3
5)7.
9 (3
5)17
.0 (2
9)6.
4 (3
9)40
.7 (2
7)7.
3 (3
0)11
.3 (6
)4.
9 (2
)47
.0 (1
)18
.9 (1
)4.
1 (3
7)3.
2 (3
0)La
tvia
196.
7 (1
1)10
2.8
(26)
4.8
(8)
0.7
(35)
17.9
(19)
13.3
(15)
18.1
(24)
13.0
(31)
59.1
(10)
6.3
(37)
6.6
(17)
4.3
(6)
24.4
(10)
10.4
(12)
6.0
(10)
4.0
(6)
Lith
uani
a19
5.9
(12)
97.0
(31)
5.0
(7)
0.8
(26)
18.0
(18)
10.7
(29)
19.0
(20)
15.6
(24)
56.5
(11)
5.5
(39)
8.8
(11)
3.9
(11)
24.5
(9)
9.5
(17)
5.7
(17)
3.8
(16)
Mac
edon
ia14
0.1
(36)
85.5
(38)
2.1
(32)
0.7
(36)
11.2
(34)
7.8
(36)
17.2
(28)
6.8
(37)
39.8
(28)
6.6
(36)
6.3
(18)
3.0
(15)
21.9
(13)
9.5
(18)
4.3
(35)
2.7
(40)
Mau
ritiu
s79
.6 (4
5)66
.3 (4
4)2.
2 (2
9)0.
7 (3
7)5.
8 (4
2)3.
9 (4
5)9.
2 (4
1)7.
3 (3
6)16
.7 (4
4)4.
2 (4
4)13
.6 (5
)0.
2 (4
5)10
.6 (2
9)5.
7 (3
0)3.
4 (4
1)2.
0 (4
5)M
exic
o11
2.5
(42)
106.
3 (2
0)1.
4 (4
0)0.
7 (3
8)4.
7 (4
4)4.
6 (4
3)12
.2 (3
8)16
.6 (2
2)22
.1 (3
9)8.
2 (2
6)17
.1 (1
)4.
5 (3
)13
.2 (2
6)9.
8 (1
5)4.
9 (2
7)4.
0 (7
)Ne
ther
land
s18
2.0
(15)
120.
0 (7
)1.
5 (3
8)0.
8 (2
7)19
.0 (1
4)14
.0 (1
3)27
.8 (2
)20
.0 (8
)59
.7 (8
)14
.8 (9
)2.
2 (4
3)2.
2 (2
6)9.
4 (3
4)4.
6 (3
7)4.
9 (2
8)3.
2 (3
1)
New
Zea
land
167.
2 (2
1)13
1.1
(3)
2.3
(26)
0.9
(12)
25.7
(4)
20.2
(2)
25.9
(5)
21.2
(7)
39.3
(29)
18.7
(6)
3.9
(30)
2.2
(27)
6.8
(42)
4.0
(39)
6.3
(7)
4.4
(4)
Norw
ay15
5.7
(27)
113.
1 (1
3)2.
4 (2
4)0.
9 (1
3)22
.0 (1
0)18
.0 (5
)20
.7 (1
4)26
.8 (3
)31
.7 (3
4)12
.8 (1
2)3.
3 (3
4)3.
0 (1
6)9.
6 (3
3)5.
5 (3
3)4.
6 (3
3)3.
2 (3
2)Po
land
205.
2 (6
)11
1.4
(16)
3.7
(16)
0.8
(28)
16.6
(25)
11.6
(24)
16.8
(30)
11.2
(32)
71.5
(2)
11.3
(15)
7.8
(13)
2.9
(18)
19.2
(19)
7.3
(25)
5.6
(18)
3.5
(21)
Portu
gal
157.
1 (2
6)89
.1 (3
7)3.
9 (1
3)0.
6 (4
1)18
.5 (1
6)11
.3 (2
6)18
.4 (2
2)17
.9 (2
0)29
.5 (3
5)4.
8 (4
0)4.
8 (2
5)2.
3 (2
5)22
.2 (1
2)10
.9 (8
)5.
1 (2
3)3.
4 (2
2)Re
p.of
Mol
dova
157.
8 (2
5)89
.4 (3
6)6.
7 (4
)0.
8 (2
9)15
.8 (2
8)10
.6 (3
0)18
.5 (2
1)5.
0 (4
2)42
.1 (2
4)6.
2 (3
8)7.
0 (1
6)2.
2 (2
8)20
.4 (1
7)9.
0 (2
1)5.
2 (2
2)3.
3 (2
7)
TAB
LE 1
3
46 CA A Cancer Journal for Clinicians
Cancer Statistics, 2002
Volume 52 • Number 1 • January/February 2002 47
CA Cancer J Clin 2002;52:23-47
*Rat
es a
re a
ge a
djus
ted
to t
he W
orld
Hea
lth O
rgan
izat
ion
wor
ld s
tand
ard
popu
latio
n.N
ote:
Fig
ures
in p
aren
thes
es r
epre
sent
ord
er o
f ran
k w
ithin
site
and
gen
der.
Sou
rce:
GLO
BO
CA
N 2
000,
Can
cer
Inci
denc
e, M
orta
lity,
and
Pre
vale
nce
Wor
ldw
ide,
Ver
sion
1.0
.
Rom
ania
150.
0 (3
0)90
.0 (3
4)4.
2 (1
1)0.
9 (1
4)11
.4 (3
3)8.
2 (3
4)16
.2 (3
4)8.
3 (3
5)45
.1 (2
1)7.
3 (3
1)10
.9 (7
)2.
2 (2
9)17
.6 (2
1)7.
0 (2
7)4.
5 (3
4)3.
0 (3
8)Ru
ssia
n Fe
d.21
1.2
(5)
100.
6 (2
9)5.
3 (6
)0.
8 (3
0)17
.5 (2
2)12
.7 (1
7)16
.7 (3
3)6.
8 (3
8)68
.2 (4
)6.
8 (3
4)5.
2 (2
4)2.
6 (2
0)35
.6 (2
)15
.2 (3
)5.
0 (2
6)3.
4 (2
3)Sl
ovak
ia21
7.8
(4)
108.
8 (1
7)9.
5 (2
)1.
0 (9
)28
.0 (3
)16
.1 (7
)18
.4 (2
3)14
.3 (2
9)60
.7 (7
)7.
8 (2
7)5.
4 (2
3)5.
2 (1
)16
.9 (2
3)7.
3 (2
6)7.
1 (2
)3.
7 (1
7)Sl
oven
ia20
3.1
(7)
115.
9 (1
1)3.
4 (1
8)0.
7 (3
9)25
.1 (5
)14
.6 (1
1)20
.3 (1
6)18
.8 (1
3)55
.3 (1
2)10
.1 (1
7)5.
6 (2
2)4.
4 (5
)20
.2 (1
8)9.
6 (1
6)5.
9 (1
1)3.
2 (3
3)Sp
ain
176.
1 (1
7)85
.0 (4
0)3.
9 (1
4)0.
8 (3
1)17
.3 (2
3)11
.1 (2
7)18
.1 (2
5)15
.0 (2
8)49
.4 (1
7)4.
2 (4
5)2.
7 (4
0)2.
4 (2
4)12
.6 (2
8)6.
2 (2
9)5.
4 (2
0)3.
2 (3
4)
Swed
en13
7.9
(37)
104.
0 (2
4)1.
3 (4
3)0.
7 (4
0)14
.4 (2
9)11
.5 (2
5)17
.5 (2
7)27
.3 (2
)22
.6 (3
8)12
.6 (1
3)2.
9 (3
8)2.
0 (3
3)7.
4 (4
1)4.
0 (4
0)5.
1 (2
4)3.
3 (2
8)Tr
inid
ad a
ndTo
bago
103.
5 (4
4)10
1.9
(28)
2.5
(23)
1.1
(5)
8.5
(36)
9.7
(31)
20.6
(15)
32.3
(1)
13.2
(45)
4.3
(43)
15.0
(3)
4.3
(7)
8.7
(36)
6.9
(28)
3.4
(42)
3.1
(36)
Turk
men
ista
n11
7.7
(39)
85.2
(39)
2.2
(30)
0.9
(15)
4.7
(45)
4.1
(44)
9.2
(42)
1.8
(44)
18.9
(42)
4.6
(41)
6.3
(19)
1.4
(41)
21.1
(15)
10.8
(9)
2.6
(45)
2.4
(43)
Unite
d Ki
ngdo
m17
1.0
(18)
128.
0 (4
)1.
8 (3
5)0.
8 (3
2)18
.7 (1
5)13
.8 (1
4)26
.8 (3
)18
.5 (1
4)48
.6 (1
8)21
.1 (4
)3.
9 (3
1)1.
7 (3
7)10
.1 (3
2)4.
8 (3
5)4.
9 (2
9)3.
3 (2
9)Ve
nezu
ela
104.
1 (4
3)91
.8 (3
3)1.
3 (4
4)0.
9 (1
6)5.
8 (4
3)6.
1 (4
0)11
.6 (3
9)18
.2 (1
6)19
.4 (4
1)9.
2 (2
2)15
.2 (2
)3.
7 (1
2)17
.5 (2
2)10
.0 (1
4)3.
9 (4
0)3.
2 (3
5)


![A Cancer Journal for Clinicians [ Cancer Statistics, 2010]](https://img.pdfslide.us/doc/110x75/5447f486b1af9f65618b46dc/a-cancer-journal-for-clinicians-cancer-statistics-2010.jpg)