Embed Size (px)
Citation preview

Cancer incidence and mortality worldwide: sources,
methods and major patterns in GLOBOCAN 2012
1J. Ferlay,
1I. Soerjomataram I,
2R. Dikshit,
3S. Eser,
4C. Mathers,
5M. Rebelo,
6D.M. Parkin,
1D. Forman
D, 1F. Bray.
1 Section of Cancer Surveillance, International Agency for Research on Cancer, 150 cours Albert
Thomas, 69372 Lyon Cedex 08, France.
2Tata Memorial Hospital, Mumbai, India.
3Izmir Cancer Registry, Izmir Hub, Izmir & Hacettepe University Institute of Public Health, Ankara,
Turkey.
4Department of Measurement and Health Information Systems, WHO, Geneva, Switzerland.
5Department of Surveillance and Cancer Information, Brazilian National Cancer Institute, Ministry of
Health, Rio de Janeiro, Brazil.
6Clinical Trial Service Unit & Epidemiological Studies Unit, University of Oxford, Oxford, U.K.
Any correspondence should be addressed to:
Mr Jacques Ferlay, Section of Cancer Information International Agency for Research on Cancer, 150
Cours Albert Thomas, 69372 Lyon Cedex 08 - FRANCE
Phone: +33 (0)4 72 73 84 90 - Fax: +33 (0)4 72 73 86 96 - Email: [email protected]
Keywords:
Incidence, mortality, cancer, global estimates, GLOBOCAN
Article category:
Epidemiology
Abstract
Estimates of the worldwide incidence and mortality from 27 major cancers and for all cancers
combined for 2012 are now available in the GLOBOCAN series of the International Agency for
Research on Cancer. We review the sources and methods used in compiling the national cancer
incidence and mortality estimates, and briefly describe the key results by cancer site and in 20 large
This article has been accepted for publication and undergone full peer review but has not beenthrough the copyediting, typesetting, pagination and proofreading process which may lead todifferences between this version and the Version of Record. Please cite this article as an‘Accepted Article’, doi: 10.1002/ijc.29210

“areas” of the world. Overall, there were 14.1 million new cases and 8.2 million deaths in 2012. The
most commonly diagnosed cancers were lung (1.82 million), breast (1.67 million), and colorectal
(1.36 million); the most common causes of cancer death were lung cancer (1.6 million deaths), liver
cancer (745,000 deaths), and stomach cancer (723,000 deaths).
Introduction
According to WHO estimates for 2011, cancer now causes more deaths than all coronary heart
disease or all stroke [1]. The continuing global demographic and epidemiologic transitions signal an
ever-increasing cancer burden over the next decades, particularly in low and middle income
countries (LMIC), with over 20 million new cancer cases expected annually as early as 2025 [2]. The
GLOBOCAN estimates for 2012 [3] aim to provide the evidence and impetus for developing resource-
contingent strategies to reduce the cancer burden worldwide.
We review here the fifth version of GLOBOCAN, the sources and methods used in compiling cancer
incidence and mortality estimates for 2012 in 184 countries worldwide, and briefly describe the key
results by cancer site. The basic units for estimation are countries, although we present the results
globally, by level of development and for aggregated regions, as defined by the United Nations [4].
Such estimates have been prepared for 27 major cancers and for all cancers combined and by sex.
While the methods of estimation have been refined over time, they still rely upon the best available
data on cancer incidence and mortality at the national level in assembling regional and global
profiles. Facilities for the tabulation and graphical visualisation of the full dataset of 184 countries
and 30 world regions by sex can be accessed via the GLOBOCAN homepage (http://globocan.iarc.fr).
To document the methods used in compiling the estimates and guide users as to their validity, we
introduce an alphanumeric scoring system that provides information on the availability and quality of
the incidence and mortality sources at the country level.
Data
Incidence data derive from population-based cancer registries (PBCR). Although PBCR may cover
national populations, more often they cover smaller, subnational areas, and, particularly in countries
undergoing development, only selected urban areas. In 2006, about 21% of the world population was
covered by PBCR, with sparse registration in Asia (8% of the total population) and in Africa (11%) [5].
In terms of what is considered data of high quality (for example, those included in the latest volume
(X) of the IARC Cancer Incidence in Five Continents (CI5) series [6]), these percentages are even
lower: only 14% of the world population is covered by PBCR that match the CI5 inclusion criteria,
with the figures 5% and 2% in Asia and Africa respectively. While cancer registries in lower resource
settings may find it difficult to match the strict criteria of data quality set for inclusion in CI5, the
information generated by such PBCR remains of critical importance to cancer control as a unique and
relatively unbiased source of information on the profile of cancer. Population-based cancer registries
can produce survival statistics by following up the vital status of cancer patients. In the absence of
information on national mortality, it can be estimated using incidence and survival probabilities [7]
and vice versa.
Mortality statistics are collected and made available by the WHO [8]. Their great advantage is
national coverage and long-term availability in higher income settings, although not all datasets are
Page 2 of 76
John Wiley & Sons, Inc.
International Journal of Cancer

of the same quality. For some countries, coverage of the population is incomplete, so that the
mortality rates produced are implausibly low, and in others, the quality of cause of death information
is poor. By 2005, around one-third of the world population was covered by mortality statistics [9].
While almost all the European and American countries have comprehensive death registration
systems, most African and Asian countries (including the populous countries of Nigeria, India and
Indonesia) do not. The mortality data used to estimate the burden of cancer in China was obtained
from a sample survey based on the “disease surveillance points” (DSP) project for the period 2004-
2010 covering around 6% of the total Chinese population [10]. These statistics are considered
nationally representative given the samples include both urban and rural areas. As the figures were
available for a limited number of cancers, they were supplemented by cancer registry mortality files
for certain sites.
National population estimates for 2012 were extracted from the United Nations website [4]. The
geographical definition of the regions follows the rules as defined by the UN, except for Cyprus,
which is included in Southern Europe instead of Western Asia (Figure 1).
An alphanumeric scoring system has been introduced with the release of GLOBOCAN 2012 that
independently classifies the source availability and estimation methods for incidence and mortality
by country. These scores are provided together with the results online, and the classification of
sources and methods is described below.
Sources
Incidence data
Depending on the availability and quality of the information, the countries have been classified as
follows (Figure 2a):
A. High quality* national data or high quality regional (coverage greater than 50% of the
population): 37 countries
B. High quality* regional data (coverage between 10% and 50%): 11 countries.
C. High quality* regional data (coverage lower than 10%): 19 countries.
D. National data (PBCR): 24 countries.
E. Regional data (PBCR): 18 countries.
F. Frequency data (hospital-based or pathological –based series): 13 countries.
G. No data: 62 countries.
*Data included in Cancer Incidence in Five Continents (CI5) volume IX [11] and/or X [6].
Mortality data
Similar to incidence data, the following schema has been defined (Figure 2b):
1. High quality complete vital registration**: 24 countries.
2. Medium quality complete vital registration**: 47 countries.
3. Low quality complete vital registration**: 24 countries.
4. Incomplete or sample vital registration: 2 countries.
5. Other sources (cancer registries, verbal autopsy surveys etc.): 7 countries.
6. No data: 80 countries.
**The criteria defined in points 1.-3. are taken from Mathers et al. [9].
Page 3 of 76
John Wiley & Sons, Inc.
International Journal of Cancer

Methods of estimation
Cancer incidence and mortality rates for 2012 by sex and for 10 age groups (0-14, 15-39, 40-44, 45-
49,. . ., 75 and over) are estimated for the 184 countries or territories of the world having a total
population greater than 200,000 [4]. Results are presented for the following cancer sites or cancer
types as defined by the 10th edition of the International Classification of Diseases (ICD-10)[12]: lip,
oral cavity (ICD-10 C00–08), nasopharynx (C11), other pharynx (C09-10, C12-14), oesophagus (C15),
stomach (C16), colon and rectum (including anus C18–21), liver (C22), gallbladder (C23–24), pancreas
(C25), larynx (C32), lung (including trachea, C33–34), melanoma of skin (C43), Kaposi sarcoma (C46),
female breast (C50), cervix uteri (C53), corpus uteri (C54), ovary (C56), prostate (C61), testis (C62),
kidney (including renal pelvis and ureter, C64–66), bladder (C67), brain and central nervous system
(C70–72), thyroid (C73), Hodgkin lymphoma (C81), non-Hodgkin lymphoma (C82–85, C96), multiple
myeloma (C88+C90), leukaemia (C91–95) and all cancers combined, excluding non-melanoma skin
cancer (C00–97, except C44). This last category was calculated by summing the estimated counts for
each individual cancer site, and the residual category “other and unspecified cancers”. Further details
of the criteria for inclusion are provided in Annex A.
The methods of incidence and mortality estimation described below are undertaken at the national
level and hence their validity depends upon the representativeness and quality of the source
information from the country itself. The methods are largely those developed previously [13],
although one improvement in in the 2012 estimation of both incidence and mortality is the
utilisation of the Human Development Index (HDI) [14] to predict survival in countries lacking the
requisite data, as described in detail in Annex B. The methods are summarized below, ranked in
descending order of the probable accuracy of the derived estimates:
Estimates of cancer incidence by country
1. When incidence data were available historically with sufficient numbers of cases, recorded
incidence rates were projected to 2012 using models and the 2012 national population
applied to the fitted rates (38 countries)
2. When recent incidence data were available from a national registry, the 2012 national
population was applied to the most recently recorded incidence rates (20 countries)
3. When registries were regional and where national mortality data were available, national
incidence was estimated from national mortality using statistical models, with the fitted
mortality to incidence (M:I) ratios derived from recorded data from one or more cancer
registries within the country (13 countries)
4. For Europe, when registries were regional rather than national, and where national mortality
data were available, method (3) was used but with the fitted M:I ratios derived from
recorded data in cancer registries in neighbouring countries (9 European countries, [15])
5. When national or regional registries were not available, but where national mortality data
were available, national incidence was estimated from national mortality estimates and
modelled survival (32 countries, see Annex B for method)
6. When national or regional registries were available, but where national mortality data was
not available, national incidence was estimated as the weighted average of the recorded
incidence rates obtained from multiple cancer registries within the country (16 countries)
Page 4 of 76
John Wiley & Sons, Inc.
International Journal of Cancer

7. When incidence data were available from a single registry, but national mortality data were
not available, national incidence was estimated from the recorded incidence rates obtained
from one cancer registry within the country (11 countries)
8. When neither national or regional registries, nor national mortality data were available, and
the within-country source information was considered to lack the necessary level of
accuracy, a set of age- and sex-specific national incidence rates for all cancers combined
were obtained averaging overall rates from selected neighbouring countries. These rates
were then partitioned to obtain the national incidence for specific sites using available
cancer-specific relative frequency data (by age and sex, 12 countries).
9. When neither national or regional registries, nor national mortality data were available, and
the within-country source information was either unavailable or useable, average incidence
rates from selected neighbouring countries in the same region were used to derive national
incidence within the country (33 countries).
Kaposi sarcoma (KS) incidence estimation in Sub-Saharan Africa
Estimates of the incidence of KS were derived using one of the methods described above, with the
exception of Sub-Saharan Africa, where in certain regions the rates are correlated with the HIV
epidemic and the prevalence of HIV/AIDS:
• We first estimated the number of endemic (pre-AIDS) KS cases using the percentage frequency of
the disease, by sex and age, based on data from Uganda, Kampala (1961-1980) and Nigeria,
Ibadan (1971-1990). These percentages were applied to countries in Eastern and Western Africa
respectively. For countries in Middle and Southern Africa, we applied a simple average of these
frequencies.
• We calculated the number of epidemic (AIDS-related) KS cases, both sexes, for the year 2011,
using estimates of AIDS deaths by country in 2011 (source UNAIDS, http://www.unaids.org/), and
an estimate of the ratio of deaths from AIDS to incident cases of KS. This ratio was based on
observed KS rates in several countries (from the sentinel registries listed below, minus the
endemic KS), and was specific by region (varying from 0.7% in Western Africa to 6% in Eastern
Africa). This total number of AIDS-related KS was partitioned by sex and age using sex- and age-
specific proportions in sentinel registries of Malawi, Blantyre, Uganda, Kampala and Zimbabwe,
Harare (Eastern Africa), Congo, Brazzaville (Middle Africa), Botswana and Namibia (Southern
Africa), Mali, Bamako and Niger, Niamey (Western Africa).
Estimates of cancer mortality by country
National statistics from vital registration sources are known to be of variable quality and some
corrections were made before they were used for estimation purposes:
• Where necessary, the overall number of deaths was corrected for under-reporting or
incompleteness using the percentages provided by the WHO [8].
• The category “ill-defined cause of deaths” (ICD-9 codes 780–799 and ICD-10 codes R00–R99) was
partitioned, by sex and age into “cancer deaths” and “other” specific causes of death. The
corrected “cancer deaths” category was then partitioned into cancer-specific categories using
proportions from the uncorrected data.
Page 5 of 76
John Wiley & Sons, Inc.
International Journal of Cancer
• Given the large variations in the accuracy of death certificates related to cancer of the uterus,
with many deaths recorded as “uterus cancer, not otherwise specified” (ICD-10 C55), these
proportions were relocated to specified sites. By default, the number of cancer deaths coded as
“uterus unspecified” was reallocated to either cervix (C53) or corpus (C54) uterine cancer
according to age-specific proportions in the same population [16]. For the countries for which
country-specific incidence and survival data were available, mortality for cervix uteri (C53) and
corpus uteri (C54) cancers was estimated from incidence and 5-year relative survival
probabilities.
Depending on the coverage, completeness and degree of detail of the mortality data available, six
methods were utilised, ranked in descending order of the probable accuracy of the derived
estimates:
1. When mortality data were available historically from national sources and a sufficient number
of recorded cancer deaths were available, mortality rates were projected to 2012 using
models and applied to 2012 national population (69 countries)
2. When recent mortality data were available from national sources, the most recent mortality
rates were applied to 2012 national population (27 countries)
3. When recent mortality data were available from regional sources, national mortality was
estimated as the weighted average of the local mortality rates (1 country)
4. When recent mortality data were not available from national sources but country-specific
survival estimates were available, national mortality was estimated from national incidence
estimates and country-specific survival (2 countries)
5. When recent mortality data were not available from national sources, national mortality was
estimated from national incidence estimates using modelled survival as described in Annex B
(82 countries)
6. When recent mortality data were not available from national sources, and survival estimates
could not be derived using the previous method, the country-specific rates represent simply
those of neighbouring countries in the same region (3 countries).
Random fluctuations in the predicted age-specific incidence and mortality rates were smoothed
using a loess function, a locally weighted regression, by country, sex and cancer site. Estimates for
the 20 world regions (Figure 1) obtained by the population-weighted average of the incidence and
mortality rates of the component countries. These rates were applied to the corresponding
population for the region for 2012 to obtain the estimated numbers of new cancer cases and deaths
in 2012. The rates were age-standardized (ASRs per 100,000 person-years) using the direct method
and the World standard population as proposed by Segi [17] and modified by Doll [18]. The
cumulative risk of developing or dying from cancer before the age of 75 in the absence of competing
causes of death was also calculated using the age-specific rates and expressed as a percentage. Both
of these indicators allow comparisons between populations that are not influenced by differences in
their age structures.
The list of the 184 countries or territories together with their corresponding indicators of data
availability and methods of estimation is given in Annex C. The full description of GLOBOCAN 2012 in
terms of the data sources and methods used for each country and further details of the estimations
Page 6 of 76
John Wiley & Sons, Inc.
International Journal of Cancer

are available online (http://globocan.iarc.fr). Similar information for Europe has also been described
for 40 countries [15] and the results are available online at the European Cancer Observatory (ECO)
(http://eco.iarc.fr). The overall and cancer-specific results are described and presented here by world
region, and for historical reference, according to the dichotomy of ‘developed’ and ‘developing’
regions: the former comprising Northern America, Europe, Australia/New Zealand and Japan, the
latter, the remaining regions and countries.
Results
Global burden of cancer
We estimated that 14.1 million new cancer cases and 8.2 million cancer deaths occurred in 2012
worldwide. Tables 1 and 2 show the estimated number of cases and deaths (in thousands) for all
cancers combined (excluding non-melanoma skin cancers) and for 27 specific cancers in men, women
and both sexes, together with the corresponding ASRs and the cumulative risk. Lung cancer remains
the most common cancer in the world, both in term of new cases (1.8 million cases, 12.9% of total)
and deaths (1.6 million deaths, 19.4%) because of the high case fatality. Breast cancer is the second
most common cancer overall (1.7 million cases, 11.9%) but ranks 5th as cause of death (522,000,
6.4%) because of the relatively favourable prognosis; these are followed, in terms of incidence, by
colorectal cancer (1.4 million cases, 693,000 deaths), prostate cancer (1.1 million cases, 307,000
deaths), stomach cancer (951,000 cases, 723,000 deaths) and liver cancer (782,000 cases and
745,000 deaths). These six cancers represent 55% of the global incidence burden in 2012; in more
developed regions, just four cancers – female breast, prostate, lung and colorectum (Figure 3a).–
comprise half of the total incidence, whereas lung, female breast, stomach and colorectal cancers
combined with liver and cervical cancers explain over half the incidence burden (54%) in less
developed regions (Figure 3b).
The ranking of the 15 most common cancers are shown for men (Figure 4a) and women (Figure 4b),
as numbers of new cases and deaths in more and less developed regions of the world. Although lung
cancer is the most common cancer worldwide among men, it ranks second in more developed
regions (490,000 cases) after prostate cancer (758,000 cases). Cancers of the lung (751,000 cases,
682,000 deaths), liver (462,000 cases, 440,000 deaths) and stomach (456,000 cases, 362,000 deaths)
predominate among males in less developed regions, representing 40% of the new cancer cases and
48% of the total cancer deaths. In women, breast cancer is the most common cancer diagnosed in
more and less developed regions, with more cases occurring in less developed (883,000 cases) than
more developed regions (794,000). Cervical cancer, the second most common cancer in less
developed regions (444,000 cases), ranks only 11th in more developed regions (83,000 cases). Lung
cancer is now the leading cause of cancer death among women in more developed regions (209,000
deaths) followed by breast cancer (197,000 deaths) which ranks as the most frequent in women in
less developed regions (324,000 deaths) followed by cancers of the lung (281,000 deaths) and cervix
(230,000 deaths).
Figure 5 shows the distribution of the global cancer cases and deaths (all types of cancer, both sexes
combined) by world region. Most cases (4.1 million, 29.4% of the total) and deaths (2.75 million,
33.6%) occurred in Eastern Asia with its vast population (1.6 billion, 22% of the global population in
2012). Northern America ranks second in terms of number of new cases (1.78 million, 12.7%) but
third (691,000, 6.4%) in terms of cancer deaths after South-Central Asia (1.0 million deaths, 12.5%).
Page 7 of 76
John Wiley & Sons, Inc.
International Journal of Cancer

Almost a quarter of the new cases (3.44 million) and one fifth of the deaths (1.75 million) occurred in
the four European regions, despite containing 10% of the global population.
Tables 3a and 3b show the estimated incidence and mortality ASRs (world standard) respectively, by
sex and cancer site for the 20 regions of the world, and for more developed and less developed
regions. Tables 4a and 4b portray the estimates of the numbers of cancer cases and deaths, and
tables 5a and 5b the estimates of cumulative risk (ages 0-74, percent) for the same categories. A brief
description of the patterns for each cancer site follows.
All sites combined (excluding non-melanoma skin cancer)
Overall incidence rates are almost 25% higher in men (ASR 205 per 100,000) than in women (165 per
100,000), with male incidence rates varying almost five-fold across the different regions of the world,
from 79 per 100,000 in Western Africa to 365 per 100,000 in Australia/New Zealand, with high rates
of prostate cancer making a significant contribution to the latter (Table 3a). There is less variation in
female incidence, rates ranging from 103 per 100,000 in South-Central Asia to 295 per 100,000 in
Northern America (table 3a). In terms of mortality, the cumulative risk of dying from cancer is 20%
higher in more developed than less developed regions in men, and 10% higher in women (table 3b).
The risk of dying from cancer among men is highest in Central and Eastern Europe (19%) and lowest
in Western Africa (7%) (table 5b). In contrast, the highest risk of cancer death in women is in
Melanesia and Eastern Africa (both 12%), and the lowest in Eastern Asia (8%) and South-Central Asia
(7%).
Lung cancer
Lung cancer emerged as the most common cancer worldwide several decades ago: with 660,000 new
cases estimated in 1980, it had risen to equal stomach cancer [19]. Of the estimated 1.8 million new
cases in 2012 (12.9% of the total)(table 1), 58% occurred in less developed regions. It is the most
common cancer in men worldwide (1.2 million, 16.7% of the total), with the highest rates in Central
and Eastern Europe (53.5 per 100,000) and Eastern Asia (50.4 per 100,000). Incidence rates are very
low in Middle and Western Africa (2.0 and 1.7 per 100,000 respectively)(table 3a). In women, the
incidence rates are generally lower and the geographical pattern somewhat different, reflecting in
part variations in the uptake and consumption of tobacco. The highest estimated rates are in
Northern America (33.8) and Northern Europe (23.7) compared with low rates in Western and
Middle Africa (1.1 and 0.8 respectively)(table 3a). The relatively high rate in women in Eastern Asia
(19.2) has been of particular interest, since tobacco smoking is generally very rare in these
populations; The disease is the most common cause of death from cancer worldwide, responsible for
nearly one cancer death in five (1.59 million deaths, 19.4% of the total). Because of the high fatality
associated with the disease, the geographical patterns in mortality closely follow those of incidence.
Breast cancer
Breast cancer is the second most common cancer in the world and, by far the most frequent cancer
among women with an estimated 1.67 million new cancer cases diagnosed in 2012 (25% of all
cancers)(table 1). A slight majority of cases occur in women in less developed regions (Table 4a).
Incidence rates vary nearly four-fold across the world regions, with rates ranging from 27 per
100,000 in Middle Africa and Eastern Asia to 96 in Western Europe (table 3a).
Page 8 of 76
John Wiley & Sons, Inc.
International Journal of Cancer

Breast cancer ranks as the fifth cause of death from cancer overall (522,000 deaths) and while it is
the most frequent cause of cancer death in women in less developed regions (324,000 deaths, 14.3%
of total), it is now the second cause of cancer death in more developed regions (198,000 deaths,
15.4%) after lung cancer (table 4b). The range in mortality rates between world regions is less than
that for incidence because of the more favourable survival from breast cancer in (high-incidence)
developed regions.
Colorectal cancer
Colorectal cancer is the third most common cancer in men (746,000 cases, 10.0% of the total) and
the second in women (614,000 cases, 9.2% of the total) worldwide (table 1). Almost 55% of the cases
occur in more developed regions (table 4a). There is a ten-fold variation in incidence across the world
and the patterns are very similar in men and women, with the highest rates in Australia/New Zealand
(ASR 44.8 and 32.2 per 100,000 in men and women respectively), and lowest in Western Africa (4.5
and 3.8 per 100,000) (table 3a).
Mortality is considerably lower (694,000 deaths in both sexes, 8.5% of the total) with more deaths
(52%) in less developed regions of the world, reflecting poorer prognosis in these regions (table 4b).
There is less variability in mortality rates worldwide (six-fold in men, four-fold in women), with rates
highest in Central and Eastern Europe (20.3 per 100,000 for men, 11.7 per 100,000 for women), and
lowest in Western Africa (3.5 and 3.0, respectively)(table 3b).
Prostate cancer
Prostate cancer is the fourth most common cancer in both sexes combined and the second most
common cancer in men. An estimated 1.1 million cases were diagnosed worldwide with prostate
cancer in 2012, accounting for 15% of the cancers diagnosed in men, with almost 70% of them
(759,000) occurring in more developed regions (table 4a). Prostate cancer incidence varies more
than 25-fold worldwide; the rates are highest in Australia/New Zealand and Northern America (ASR
111.6 and 97.2 per 100,000, respectively), and in Western and Northern Europe (ASR 94.9 and 85 per
100,000), largely because the widespread practice of prostate specific antigen (PSA) testing and
subsequent biopsy in those regions (table 3a). Incidence rates are also relatively high in certain less
developed regions such as the Caribbean (79.8), Southern Africa (61.7) and South America (60.1), but
remain low in Asian populations, with estimated rates of 10.5 and 4.5 in Eastern and South-Central
Asia. Prostate cancer is the fifth leading cause of death from cancer in men, with an estimated
307,000 deaths representing 6.6% of the total male cancer mortality (table 2). Unlike incidence,
there is relatively less variation in mortality rates worldwide (ten-fold from approximately 3 to 30 per
100,000) than is observed for incidence, with the number of deaths from prostate cancer larger in
less than developed regions (166,000 and 142,000, respectively)(table 4b). Mortality rates are
generally high in populations of African descent (Caribbean, 29 per 100,000 and Sub-Saharan Africa,
ASRs 19-24 per 100,000), intermediate in the Americas and Oceania, and very low in Asia (2.9 per
100,000 in South-Central Asia, for example)(table 3b).
Stomach cancer
Almost one million new cases of stomach cancer were estimated to have occurred in 2012 (952,000
cases, 6.8% of the total), making it the fifth most common malignancy in the world, after cancers of
Page 9 of 76
John Wiley & Sons, Inc.
International Journal of Cancer

the lung, breast, colorectum and prostate (table 1). This represents a substantial change since the
very first estimates in 1975 [20], when stomach cancer was the most common neoplasm. More than
70% of cases (677,000 cases) occur in developing countries (456,000 in men, 221,000 in women), and
half the world total occurs in Eastern Asia (mainly in China) (table 4a). Age-standardized incidence
rates are two-fold greater in men than women, with male incidence rates ranging from 3.3 in
Western Africa to 35.4 in Eastern Asia (table 3a). Stomach cancer is the third leading cause of cancer
death in both sexes worldwide (723,000 deaths, 8.8% of the total) (table 2). The highest estimated
mortality rates are in Eastern Asia (14.0 per 100,000 in men, 9.8 per 100,000 in women), the lowest
in Northern America (2.8 and 1.5, respectively). High mortality rates are also seen in Central and
Eastern Europe, and in Central and South America (table 3b).
Liver cancer
Liver cancer is a major cancer in less developed regions where 83% of the estimated 782,000 new
cancer cases worldwide occurred in 2012 (table 4a) (50% in China alone). It is the fifth most common
cancer in men (554,000 cases, 7.5% of the total) and the ninth in women (228,000 cases, 3.4%) (table
1). In men, the regions of high incidence are Eastern and South-Eastern Asia (ASRs 31.9 and 22.2
respectively). Intermediate rates are seen in Southern Europe (9.5) and Northern America (9.3), while
the lowest rates are in Northern Europe (4.6) and South-Central Asia (3.7). In women, the rates are
generally much lower, with the highest rates in Eastern Asia and Western Africa (10.2 and 8.1
respectively) (table 3a). Liver cancer is the second most common cause of death from cancer
worldwide, estimated to be responsible for nearly 746,000 deaths in 2012 (9.1% of the total) (table
2). Given the very poor prognosis for liver cancer (the ratio of mortality to incidence is 0.95), the
geographical patterns in incidence and mortality are quite similar.
Cancer of the cervix uteri
Cervical cancer is the fourth most common cancer in women, and the seventh overall, with an
estimated 528,000 new cases in 2012 (table 1). Although the annual number of cases has increased,
cancer of the cervix has declined in relative importance: it was the second most common cancer of
women in 1975 [20]. As with liver cancer, a large majority (around 85%) of the global burden occurs
in the less developed regions, where it accounts for almost 12% of all female cancers (table 4a). High-
risk regions, with estimated ASRs over 30 per 100,000, include Eastern Africa (42.7), Melanesia
(33.3), Southern (31.5) and Middle Africa (30.6). Rates are lowest in Australia/New Zealand (5.5) and
Western Asia (4.4). Cervical cancer remains the most common cancer in women in Eastern and
Middle Africa (table 3a).
There were an estimated 266,000 deaths from cervical cancer worldwide in 2012, accounting for
7.5% of all female cancer deaths (table 2). Almost nine in ten (87%) cervical cancer deaths occur in
less developed regions (table 4b). The average risk of dying from cervical cancer before age 75 is
three times higher in the less than in more developed regions (table 5b). Mortality varies 18-fold
between the different regions of the world, ranging from less than 2 per 100,000 in Western Asia,
Western Europe and Australia/New Zealand to above 20 per 100,000 in Melanesia (20.6), Middle
(22.2) and Eastern (27.6) Africa (table 3b).
Oesophageal cancer
Page 10 of 76
John Wiley & Sons, Inc.
International Journal of Cancer

Oesophageal cancer is the eighth most common cancer worldwide, with an estimated 456,000 new
cases in 2012 (3.2% of the total), and the sixth most common cause of death from cancer with an
estimated 400,000 deaths (4.9% of the total) (tables 1 and 2). These figures include both
adenocarcinoma and squamous cell carcinoma sub-types. Around 80% of the cases worldwide occur
in less developed regions (table 4a), with global incidence rates threefold higher in men compared
with women (table 1). In both sexes there are more than 20-fold differences in incidence between
world regions, with rates ranging from 0.8 per 100,000 in Western Africa to 17.0 per 100,000 in
Eastern Asia in men, and 0.2 per 100,000 in Micronesia/Polynesia to 7.8 per 100,000 in Eastern Africa
in women (table 3a).
Cancer of the oesophagus has a very poor survival (M:I ratio is 0.88), and the geographical patterns
of mortality closely follows those of incidence. Mortality rates are elevated in Eastern Asia (14.1 per
100,000) and Southern Africa (12.8) in men, and in Eastern Africa (7.3) and Southern Africa (6.2) in
women (table 3b).
Bladder cancer
An estimated 430,000 bladder cancer cases occurred in 2012, making the disease the ninth most
common cause of cancer for both sexes combined (table 1). Bladder cancer is relatively common in
more developed regions, where 60% of all incident cases occur, and occurs among men more than in
women (sex ratio worldwide of 3.5:1) (table 4a). Male rates are high in Southern and Western
Europe (ASRs 21.8 and 19.7 per 100,000 respectively) and in Western Asia (19.0) and Northern Africa
(15.1) where bladder cancer is linked to chronic schistosomal infection. Female rates are much lower,
with the highest in Northern America (5.1) and Western Europe (4.3). In both sexes, low incidence
rates are seen in South-Eastern and South-Central Asia, and in sub-Saharan Africa (table 3a).
There were an estimated 165,000 deaths from bladder cancer worldwide, with similar numbers in
less (85,000) and more (80,000) developed regions (table 4b). Mortality rates are much lower than
the incidence rates, with the highest ASR estimated in Western Asia in men (8.4 per 100,000) and in
Northern Africa (1.6) in women (table 3b).
Non-Hodgkin lymphoma
An estimated 386,000 cases of non-Hodgkin Lymphoma (NHL) occurred in 2012 (2.7% of all cancers).
NHL is slightly more common in less developed regions (50.5% of cases worldwide, table 4a) although
the rates are highest in Northern America (ASR 14.6 and 10.2 per 100,000 in men and women
respectively), in Australia/New Zealand (14.3 and 10.1) and in Europe (except Central and Eastern
Europe). The lowest rates are estimated in South-Central Asia (3.3 in male and 1.8 in female) (table
3a). About 200,000 deaths from NHL were estimated worldwide (2.4% of all deaths), two-third
125,000 occuring in the less developed regions of the world, reflecting a poorer survival in those
regions (table 4b).
Leukaemia
Leukaemia accounted for some 352,000 new cases (2.5% of all new cancer cases) and for 265,000
deaths (3.2% of all deaths)(tables 1 and 2). The rather high M:I ratio (0.75) reflects the poor
prognosis of leukaemia in many parts of the lower-resource world. The range of incidence rates is
about six - to eightfold in women and men respectively, with the lowest rates in Middle and Western
Page 11 of 76
John Wiley & Sons, Inc.
International Journal of Cancer

Africa (less than 3 per 100,000 in men and less than 2 per 100,000 in women) and the highest in
Northern America and Australia/New Zealand (over 10 per 100,000 in men and 7 per 100,000 in
women) (table 3a). Variations in mortality are less than for incidence, due to better survival (and
hence lower mortality) in more developed regions. Mortality rates range between 1.3 per 100,000
and 6.3 per 100,000 in males, and 1.1 and 3.8 in females (table 3b). The low incidence (and hence
mortality) rates estimated in Sub-Saharan Africa may be partly due to failure to diagnose the disease,
especially in the elderly or very young.
Pancreatic cancer
Pancreatic cancer is responsible for 330,000 deaths per year, and is the seventh most common cause
of death from cancer in both sexes combined (table 2), a higher relative position than seen for
incidence (12th) given the very poor prognosis (M:I ratio is 0.98) (table 1). The sex ratio is close to
one, and the majority of cases and deaths (55%) occur in the more developed regions (table 4a), with
rates varying between 7 and 9 per 100,000 in men and 5 and 6.5 per 100,000 in women, with lower
rates in the less developed regions (table 3a). Part of the variation in both incidence and mortality
patterns worldwide may relate to under diagnosis (particularly among elderly patients), or to
imperfect mortality data.
Kidney cancer
The highest rates of kidney cancer incidence (338,000 new cases, 2.4% of the world total) are
estimated in Northern America, Australia/New Zealand and Europe, where rates were over 10 per
100,000 in men and over 5 per 100,000 in women (except Southern Europe). Incidence rates are
lowest (below 1.5 per 100,000) in Africa and in the Pacific Islands (table 3a). Of the 143,000 deaths
from kidney cancer (1.7% of all deaths) estimated in 2012, 75,000 (52%) were in more developed
regions (table 4b).
Corpus uteri cancer
Cancer of the corpus uteri appears more important as a cause of new cases (320,000 or 4.8% of
cancers in women and 2.3% of the total, table 1) than in terms of mortality (76,000 deaths or 2.1% of
cancer deaths in women, table 2) because of the reasonable prognosis associated with the disease.
The highest incidence rates were estimated in Northern America (19.1 per 100,000) and Northern
and Western Europe (12.9 to 15.6). Rates are low in South-Central Asia (2.7) and most of Africa (less
than 5 per 100,000) (table 3a). Mortality rates ranged between 0.9 per 100,000 in Northern Africa
and 3.8 per 100,000 in Melanesia (table 3b).
Cancer of the lip and oral cavity
These cancers accounted for 300,000 cases in 2012 (2.1% of the world total), with two-thirds
occurring in men (table 1). The region with the highest incidence among both males and females was
by far Melanesia (22.9 per 100,000 and 16.0 per 100,000 respectively). Rates were also relatively
high in men in South-Central Asia (9.9) and in Central and Eastern Europe (9.1) (table 3a). Worldwide,
145,000 deaths occurred (1.8% of the world total), of which 77% were in the less developed regions
(table 4b).
Thyroid cancer
Page 12 of 76
John Wiley & Sons, Inc.
International Journal of Cancer

Cancer of the thyroid (298,000 new cases, 2.1% of the total) is considerably more common among
females than among males (Female:Male sex ratio 3), comprising 3.5% of cancers in women (table 1).
Elevated rates are estimated in Northern America (6.3 per 100,000 in males and 20.0 per 100,000 in
females) and in Oceania (3.4 and 11.3 respectively)(table 3a). Relative to incidence, thyroid cancer
accounted for rather few deaths (40,000 or 0.5% of all cancer deaths, table 2), with mortality rates
lower than 1 per 100,000 in men and 2 in per 100,000 in women (except in Melanesia) (table 3b).
Cancers of brain and central nervous system
Cancers of the brain and central nervous system accounted for 256,000 new cases and 189,000
deaths in 2012 (1.8% of new cancers; 2.3% of cancer deaths) (tables 1 and 2). The highest incidence
and mortality rates are in more developed regions (Australia/New Zealand, Europe, and Northern
America) and are lowest in Africa and the Pacific (tables 3a and 3b). As for pancreatic cancer, the
variation in both mortality and incidence patterns worldwide may be in part due to variations in the
availability of diagnostic facilities or due to inaccuracy in assigning the underlying cause of death.
Ovarian cancer
Ovarian cancer (239,000 cases and 152,000 deaths) is the seventh most common cancer and the
eighth cause of death from cancer in women (3.6% of cases and 4.3% deaths) (tables 1 and 2).
Incidence rates are highest in more developed regions, with rates in these areas exceeding 7.5 per
100,000 and lowest in Sub-Saharan Africa with rates below 5 per 100,000 (table 3a). The average risk
of dying from ovarian cancer before age 75 is twice as high in more than in less developed regions
(table 5b), with deaths from the disease ranking as 5th most common among women (table 4b).
Malignant melanoma of skin
Malignant melanoma of skin accounted for 232,000 new cases (1.6% of new cancers) (table 1). The
regions affected are largely those with white populations (of European origin), with by far the highest
incidence in both males and females in Australia/New Zealand (40.3 per 100,000 and 30.5 per
100,000 respectively) followed by Northern America and by Northern and Western Europe (rates
over 10 per 100,000 in both sexes). Very low incidence rates (below 0.5 per 100,000 in both males
and females) are estimated in South-Eastern Asia and South-Central Asia (table 3a).
Mortality rates ranged from 0.1 in women of South-Central Asia to almost 6 per 100,000 in
Australia/New Zealand men (table 3b). There were an estimated 55,000 deaths in 2012 worldwide
(0.7% of cancer deaths), with almost two of three deaths occurring in more developed regions, and
among men (sex ratio of 1.3) (table 4b).
Cancer of gallbladder
Gallbladder cancer (178,000 new cases, 1.3% of the total) is one of the few malignancies that are
more common in females than males (sex ratio of 0.76) (table 1). About 65% of the cases were seen
in less developed regions (mainly in Eastern and South-Central Asia), with the highest incidence rates
estimated in South America (particularly among females of around 3.5 per 100,000) and Eastern Asia
(3.4 per 100,000 in males, 3.2 per 100,000 in females) (table 3a). Gallbladder cancer accounted for
143,000 deaths (1.7% of all cancer deaths), of which 45,000 are in the more developed regions (table
4b).
Page 13 of 76
John Wiley & Sons, Inc.
International Journal of Cancer

Larynx cancer
Larynx cancer (157,000 new cases, 1.1% of new cancers) is a cancer that is notably frequent among
men, where it comprises 1.9% of male cancer cases. The sex ratio (7:1) is greater than for any other
site. It is a rare cancer in women with only 19,000 new cases estimated in 2012 (table 1). In men, the
regions of high-risk were the Caribbean and Central and Eastern Europe (7.9 per 100,000), Southern
Europe (7.2) and Western Asia (6.5) (table 3a). Cancer of the larynx is responsible for 83,000 deaths
in 2012 (1.0% of cancer deaths), of which 73,000 occurred in men (1.6% of deaths) (table 2).
Other pharyngeal cancers
Cancer of the pharynx (excluding nasopharynx) accounted for 142,000 new cases in 2012 (1% of the
world total), and was much more common among males than among females (sex ratio of 4:1) (table
1). The region with the highest incidence for both sexes was Western Europe (7.5 per 100,000 and
1.6 per 100,000 respectively, with the lowest rates (below 1.0) in Northern and Western Africa and
Western Asia (table 3a). Worldwide, 96,000 deaths from “other pharyngeal” cancers occurred (1.2%
of the world total), three-quarters in less developed regions (table 4b).
Multiple myeloma
Multiple myeloma constituted 0.8% of all cancers worldwide (114,000 new cases) (table 1). Incidence
rates varied from 0.4 to almost 5 per 100,000, with rates highest in more developed regions of
Northern America, Australia/New Zealand and Europe (but Central and Eastern). Low rates (below
1.0 per 100,000) were seen in Asia (except Western Asia) (table 3a). Multiple myeloma accounted for
80,000 deaths worldwide (1.0% of cancer deaths), the majority in more developed regions (table 4b).
Nasopharyngeal cancer
Nasopharyngeal cancer (NPC) is a relatively rare tumour (87,000 new cases, 0.6% of all cancers),
more common in males (sex ratio of 2.3:1) with very distinct geographic areas of high risk (table 1).
The highest rates are in populations in South-Eastern Asia (ASR 6.4 in men, 2.4 in women), and in
Micronesia/Polynesia, Eastern Asia and Northern Africa, where rates are above 2 and 1 in men and
women respectively (table 3a). An estimated 51,000 deaths from NPC were estimated in 2012,
representing 0.6% of all cancer deaths (table 2).
Hodgkin lymphoma
An estimated 66,000 cases of Hodgkin Lymphoma occurred in 2012 (0.5% of all cancers) (table 1).
Similar to NHL, the incidence rates are high in more developed regions (Northern America,
Australia/New Zealand and Europe) but also in Western Asia where the ASR is over 2.0 in men and
1.5 in women. Incidence rates are particularly low (below 0.5) in Eastern and South-Eastern Asia
where the disease is very rare (table 3a). Survival for Hodgkin lymphoma is reasonable in more
developed regions so that of the estimated 25,000 deaths worldwide (0.5% of all cancer deaths), only
about one-quarter (6,300) occurred in more developed regions (table 4b).
Testicular cancer
Testicular cancer is relatively rare, with 55,000 new cases estimated in 2012 (0.7% of cancers in men,
table 1), but common in younger men (ages 15-39) of white Caucasian origin. The highest incidence
Page 14 of 76
John Wiley & Sons, Inc.
International Journal of Cancer

rates are in more developed regions and particularly in Europe (7.2 and 8.7 in Northern and Western
Europe respectively), with rates low in Asia and Africa (rates lower than 1.0) (table 3a). As a
consequence of the very favourable survival from testicular cancer in more developed regions,
around 10,000 deaths from testicular cancer were estimated in 2012 worldwide, only 2,200 deaths
occurring in more developed regions (table 4b).
Kaposi sarcoma
Kaposi sarcoma (KS) is an extremely rare form of cancer in most regions of the world, but it is one of
the most common in certain regions of Sub-Saharan Africa, where 84% of the estimated 44,000 cases
occurred (29,000 in men, 15,000 in women) (table 4a), the great majority occurring in subjects with
HIV-AIDS. About 70% of cases occurred in Eastern Africa, where the highest incidence rates are
observed (15.1 in men, 7.6 in women) (table 3a) and where the disease is the leading cancer in men
and third ranking in women (after cervical and breast cancer) (table 4a). KS is extremely rare in Asian
populations with only 1,500 cases estimated in its population of 4.3 billion in 2012. Of the 27,000
estimated deaths from KS (0.3% of all cancer deaths, table 2), 25,000 were in sub-Saharan Africa, of
which 21,000 deaths (84%) were seen in Eastern Africa (table 4b).
Discussion
The global and region-specific estimates presented here and in more detail online
(http://globocan.iarc.fr) provide a key resource for cancer researchers, policy-makers and the media
on the burden of cancer in 2012, and the cancer-specific patterns in 184 countries worldwide. The
primary aim of this paper is to clearly document the methods used to build up these global figures.
While IARC’s estimation methods have been refined in the last decades to account for the increasing
availability and quality of source information, the underlying methodological principle has remained
a constant: wherever possible, the country-specific estimates are based upon local sources of cancer
incidence (from cancer registries) and mortality (mainly from vital registration systems). The results
are of course more or less accurate for different countries, depending on the extent and accuracy of
the locally available data.
To guide users in the validity of the national estimates and to aid interpretation of the results, an
alphanumeric scoring system has been introduced for the 2012 estimates that describes the
availability of incidence and mortality data at the country level, and the quality of sources ranging
from A1 for the highest (16 countries such as Australia, Finland or Singapore) to G6 for the lowest (34
countries such as Afghanistan, Central African Republic or Honduras). For the incidence data, results
from population-based cancer registries are regularly published through the CI5 series and inclusion
in one of the last two volumes sets the standard of high quality incidence data. Beyond the criterion
of CI5 inclusion, the cancer registries are classified according to their ability to either produce
reasonably accurate incidence rates per 100,000 (e.g. population-based) or simple tabulations by
cancer type and sex (hospital or pathology-based). The extent of coverage of the catchment
population (national or sub-national) is also taken into consideration, since subnational coverage
requires extrapolations from often limited sample populations. For national mortality data available
through the WHO mortality database, the percentages of completeness and coverage by country are
provided alongside the datasets online; the proportions of ill-defined causes of deaths, and of
Page 15 of 76
John Wiley & Sons, Inc.
International Journal of Cancer

unknown and ill-defined cancer deaths are also used as recognised indicators of the quality of vital
registration systems [9].
The use of site-, sex- and age-specific M:I ratios from cancer registries to estimate national incidence
rates from national mortality has been used extensively over several decades [21]. Using data within
a country, the method assumes greater representativeness and lesser variation in case fatality than
in incidence rates between registry populations, and is robust to the quality of the mortality data,
provided any deficiencies are equally present in both national and registry mortality sources. In the
absence of cancer registry data within the country of interest, M:I ratios from cancer registries in
neighbouring countries were used previously (described as method 2B in GLOBOCAN 2008, [22]) and
for some European countries for these 2012 estimates [23]. With this methodology, the national and
the regional mortality are not from the same vital statistics systems, the resulting national incidence
could be distorted, for example when the national mortality data is over-estimated for some cancer
sites (such as liver and brain tumours due to the inclusion of metastatic or unknown behaviour
diagnoses). In addition, regional M:I ratios may be lower than the true national survival if there is
under-reporting of cancer deaths, while using regional M:I ratios for a group of countries with
possibly different profiles of cancer survival is evidently problematic. For these reasons, and for the
countries outside Europe, we instead employed a different method, which scales the M:I ratios
between countries according to levels of HDI. As in the vast majority of LMIC there are no survival
estimates available, we created proxies based on SURVCAN [24] and historical data from two Nordic
countries (Finland and Denmark), assuming that survival is linked to a country’s level of human
development.
Under-reporting and failure of diagnosis could be sources of bias in cancer registration particularly in
the less developed countries where most of the data do not qualify for CI5, and therefore some of
the national estimates based on regional cancer registries may be underestimates for leukaemia,
brain, lung, liver and pancreas depending on the local facilities available. Conversely, estimates based
on a single cancer registry in an urban setting might result in an overestimation of the final estimates
for some lower income countries with substantial rural populations. Recent data from rural settings
in Sub-Saharan Africa or India [6] indicate that incidence rates for most cancers may be much lower
than those reported by cancer registries covering urban populations. Contrarily to failure of
diagnosis, the high cancer incidence estimated in some developed regions is partly due to over-
diagnosis of cancers detected by intense sensitive investigations, such as prostate cancer in Northern
American and Western European countries as well as thyroid cancer in Eastern Asia, especially South
Korea [6]. This does not affect the corresponding mortality estimates which are more comparable
across regions at those sites.
Other possible sources of bias related to the prediction of cancer rates using the M:I ratio method
have been described elsewhere [23]. Of the 34 countries representing 5.6% of the world population
for which no information is available (indexed G6), 19 are located in Sub-Saharan Africa, representing
23% of this population. Incidence estimates were computed simply as the average of the rates from
neighbouring countries.
Evidently the inclusion of uncertainty intervals for country-specific estimates would be useful aid
were they truly able to capture the uncertainty in the source information. Collaborative work is
underway to take into account not only the inherent statistical uncertainty in the modelling exercises
Page 16 of 76
John Wiley & Sons, Inc.
International Journal of Cancer

but also the more qualitative relative deficiencies in the quality and availability of the source
information at the national level.
While comparisons of estimates compiled in this and previous versions of GLOBOCAN seem an
instinctively reasonable and valid exercise, we would warn again such temporal analyses: the
changes in the incidence and mortality counts or rates may in part be due to an increasing availability
and quality of the incidence data from cancer registries worldwide and correspondingly, a more
robust set of estimation methods. As an example, the estimates of cancer incidence in Germany in
2008 were based on national mortality data and modelling of local M:I ratios, while those from 2012
were derived from the projection of regional incidence rates.
As well as providing a global snapshot of the cancer burden in 2012, these GLOBOCAN estimates
bring to a focus the need for regional and national prioritisation of cancer control efforts given the
cancer patterns observed today. Of the predicted 20 million new cancer cases by 2025 [25], the
greatest increases are anticipated in the low income countries and longer-term planning is needed to
reduce the future cancer burden through resource-appropriate interventions. They include the
generally applicable targeting of lifestyle factors amenable to reduction with proven actions that lead
to tobacco avoidance or cessation, the reduction of alcohol consumption and obesity, and increased
levels of physical activity. In the less-developed regions, infectious agents are the most important
causes of cancer [26], so that the introduction of appropriate vaccination and treatment programmes
into existing national systems would make a major contribution to future cancer control. There are
many critical observations among these results that can serve to provide the evidence base and
impetus for developing such resource-contingent strategies to reduce the cancer burden worldwide
in the decades that follow.
Finally, estimation of the cancer incidence worldwide would not be possible without population-
based cancer registries (PBCR), yet many LMICs have limited or no such surveillance systems in place.
The agreed collection by WHO Member States of “cancer incidence, by type of cancer, per 100,000
population” – as one of 25 indicators of progress in reducing NCDs –should compel countries to
commit appropriate levels of investment to the planning and developing of PBCR. Linking in with this,
the IARC-led the Global Initiative for Cancer Registry Development (GICR, http://gicr.iarc.fr), a
concerted, multi-partner international action aims to markedly increase the coverage of populations
in LMIC by such high quality institutions, thus supporting cancer surveillance and cancer control
where it is needed most.
Acknowledgements
The authors gratefully acknowledge the many cancer registries worldwide and their staff for their
willingness to contribute their data to this exercise. We would like to particularly thank the Members
of the African Cancer Registry Network in this respect.
Page 17 of 76
John Wiley & Sons, Inc.
International Journal of Cancer

References
1. World Health Organization. Global Health Observatory Data Repository, 2011. Number of deaths
(World) by cause. Available from: http://apps.who.int/gho/data/node.main.CODWORLD?lang=en
accessed 31.10.2013
2. Bray F. Transitions in human development and the global cancer burden. In: Wild CP, Stewart B
(Eds) World Cancer Report 2014 Lyon: International Agency for Research on Cancer, 2014.
3. Ferlay J, Soerjomataram I, Ervik M, Dikshit R, Eser S, Mathers C, Rebelo M, Parkin DM, Forman D,
Bray F. GLOBOCAN 2012 Cancer Incidence and Mortality Worldwide: IARC CancerBase No. 11
[Internet]. Lyon, France: International Agency for Research on Cancer 2013.
4. United Nations Population Division (UNPD). World Population Prospects, the 2010 revision
[Internet]. New York: United Nations. Available from: http://esa.un.org/wpp/index.htm.
5. Parkin DM. The evolution of the population-based cancer registry. Nat Rev Cancer. 2006
Aug;6(8):603-12.
6. Forman D, Bray F, Brewster DH, Gombe Mbalawa C, Kohler B, Piñeros M, Steliarova-Foucher E,
Swaminathan R and Ferlay J eds (2013). Cancer Incidence in Five Continents, Vol. X (electronic
version) Lyon, IARC. http://ci5.iarc.fr last accessed on [02-12-2014].
7. Pisani P, Parkin DM, Ferlay J. Estimates of the worldwide mortality from eighteen major cancers
in 1985. Implications for prevention, and projections of future burden. Int J Cancer 1993;55: 891-
903.
8. World Health Organisation (WHO) Databank, Geneva, Switzerland. Health statistics and
information systems, http://www.who.int/healthinfo/statistics/mortality_rawdata/en/
9. Mathers C, Ma Fat D, Inoue M, Rao C and Lopez A. Counting the dead and what they died from:
an assessment of the global status of cause of death data. Bulletin of the World Health
Organization : the International Journal of Public Health 2005; 83(3) : 171-177
10. National Disease Surveillance System monitoring causes of death 2010, Chinese Center for
Disease Control and Prevention, published by Military Medical Science Press, Beijing, 2012, ISBN
978-7-80245-827-7.
11. Curado MP, Edwards B, Shin HR, Storm H, Ferlay J, Heanue M and Boyle P, eds (2007) Cancer
Incidence in Five Continents, Vol. IX. IARC Scientific Publications No. 160, Lyon, IARC.
12. WHO International Statistical Classification of Diseases and Related Health Problems. Tenth
Revision, vol. 2. Geneva, Switzerland: WHO; 1993.
13. Ferlay J, Shin HR, Bray F, Forman D, Mathers C, Parkin DM. Estimates of worldwide burden of
cancer in 2008: GLOBOCAN 2008. Int J Cancer. 2010; 127(12):2893-2917.
14. United Nations Development Programme. Human Development Report 2013.
http://hdr.undp.org/en
15. Ferlay J, Steliarova-Foucher E, Lortet-Tieulent J, Rosso S, Coebergh JWW, Comber H, Forman D,
Bray F. Cancer incidence and mortality patterns in Europe: estimates for 40 countries in 2012. Eur
J Cancer. 2013 Apr;49(6):1374-403. doi: 10.1016/j.ejca.2012.12.027.
16. Loos AH, Bray F, McCarron P, Weiderpass E, Hakama M, Parkin DM. Sheep and goats: separating
cervix and corpus uteri from imprecisely coded uterine cancer deaths, for studies of geographical
and temporal variations in mortality. Eur J Cancer 2004;40: 2794-803.
17. Segi, M. (1960) Cancer Mortality for Selected Sites in 24 Countries (1950–57). Department of
Public Health, Tohoku University of Medicine, Sendai, Japan.
Page 18 of 76
John Wiley & Sons, Inc.
International Journal of Cancer

18. Doll R, Payne P, Waterhouse JAH, eds (1966). Cancer Incidence in Five Continents, Vol. I. Union
Internationale Contre le Cancer, Geneva.
19. Parkin DM, Läärä E and Muir CS. Estimates of the worldwide frequency of sixteen major cancers
in 1980. Int. J. Cancer, 41,184-197 (1988).
20. Parkin DM, Stjernswärd J and Muir CS. Estimates of the worldwide frequency of twelve major
cancers. Bull. WHO, 62, 163–182 (1984).
21. Jensen OM, Estève J, Møller H, Renard H. Cancer in the European Community and its member
states. Eur J Cancer 1990;26:1167–256.
22. Ferlay J, Shin HR, Bray F, Forman D, Mathers C, Parkin DM. Estimates of worldwide burden of
cancer in 2008: GLOBOCAN 2008. Int J Cancer. 2010; 127(12):2893-2917.
23. Ferlay J, Steliarova-Foucher E, Lortet-Tieulent J, Rosso S, Coebergh JWW, Comber H, Forman D,
Bray F. Cancer incidence and mortality patterns in Europe: estimates for 40 countries in 2012. Eur
J Cancer. 2013 Apr;49(6):1374-403. doi: 10.1016/j.ejca.2012.12.027.
24. Sankaranarayanan R, Swaminathan R, Lucas E. Cancer survival in Africa, Asia, the Caribbean and
Central America (SurvCan). IARC Scientific Publications volume 162, ISBN 978-92-832-2162-3,
Lyon, International Agency for Research on Cancer, 2011.
25. Bray F. Transitions in human development and the global cancer burden. In: Wild CP, Stewart B
(Eds) World Cancer Report 2014 Lyon: International Agency for Research on Cancer. 2014.
26. de Martel C, Ferlay J, Franceschi S, Vignat J, Bray F, Forman D, Plummer M. Global burden of
cancers attributable to infections in 2008: a review and synthetic analysis. Lancet Oncology. 2012
Jun;13(6):607-15.
27. Hamdi Cherif M, Zaidi Z, Abdellouche D, Hamdi S, Lakhdari N, Djema Bendjazia A, Laouamri S,
Mahnane A, Moussaoui H, Kadri L, Guerra D. Registre du cancer de Sétif (Algérie): incidence,
tendance et survie, 1986–2005. Journal Africain du Cancer / African Journal of Cancer. November
2010, Volume 2, Issue 4, pp 245-258.
Page 19 of 76
John Wiley & Sons, Inc.
International Journal of Cancer

List of figures and tables
Table 1. Estimated new cancer cases (thousands), age-standardised rates (ASRs per 100,000) and
cumulative risks to age 75 (percent) by sex and cancer site worldwide, 2012.
Table 2. Estimated cancer deaths (thousands), age-standardised rates (ASRs per 100,000) and
cumulative risks to age 75 (percent) by sex and cancer site worldwide, 2012.
Table 3a. Estimated age-standardised rates (ASRs, World standard) of cancer incidence by sex, cancer
site and regions, 2012
Table 3b. Estimated age-standardised rates (ASRs, World standard) of cancer mortality by sex, cancer
site and regions, 2012
Table 4a. Estimated numbers of new cancer cases (thousands) by sex, cancer site and regions, 2012
Table 4b. Estimated numbers of cancer deaths (thousands) by sex, cancer site and regions, 2012
Table 5a. Estimated cumulative risk to age 75 (percent) by sex, cancer site and regions, 2012 –
Incidence
Table 5b. Estimated cumulative risk to age 75 (percent) by sex, cancer site and regions, 2012 –
Mortality
Figure 1. Map showing the 20 world regions
Figure 2a. Map showing the availability of incidence data
Figure 2b. Map showing the availability of mortality data
Figure 3. Estimated global numbers of new cases (thousands) with proportions for a) more developed
and b) less developed regions, both sexes combined, 2012. The area of the pie is proportional to the
number of new cases.
Figure 4a. Estimated numbers (thousands) of new cancer cases (incidence) and deaths (mortality) in
men in more developed and less developing regions of the world in 2012.
Figure 4b. Estimated numbers (thousands) of new cancer cases (incidence) and deaths (mortality) in
women in more developed and less developing regions of the world in 2012.
Figure 5. Estimated global numbers of new cases and deaths with proportions by world regions, both
sexes combined, 2012. The area of the pie is proportional to the number of new cases or deaths.
Figure B1. (a–c) Relationship between HDI and 5-year relative survival: lung (both sexes), cervical and
testicular cancers.
Figure B2. Estimated mortality from incidence in two countries (colorectal cancer, men)
Page 20 of 76
John Wiley & Sons, Inc.
International Journal of Cancer
Annex A. Criteria for including and allocating certain malignancies
The 28 individual cancer sites estimated in GLOBOCAN 2012 include malignant neoplasms only,
except for bladder cancer which may include some carcinoma in situ cases or tumours of uncertain or
unknown behaviour (ICD-10 categories D09.0 and D41.4 respectively) in incidence (but not in
mortality) depending on the definition of malignancy in each cancer registry [6,11]. The categories
“Kaposi sarcoma”, “non-Hodgkin lymphoma” and “all cancers excluding non-melanoma skin cancer”
include some disease entities that might have been coded in mortality (but not incidence) statistics
to the ICD-10 category B21 (HIV disease resulting in neoplasms). We did not estimate incidence and
mortality from non-melanoma skin cancer (NMSC) although there is a small but non-negligible
number of deaths due to NMSC recorded in vital registration systems. But many such cancers
(particularly basal cell tumours) will never be diagnosed, and are certainly under-recorded in most
cancer registries.
Equally no attempt was made to re-allocate ill-defined cancer sites (“garbage” codes ICD-10 C14.8,
C26, C39, C57.8-9, C63.8-9, C68.8-9, C75.8-9, C76 and C80) into cancer-specific categories. The
correct redistribution requires that the data are available at the fourth digit level of detail which is
not always the case, particularly in mortality datasets. The possible inclusion of metastatic cancers
along with primary neoplasms in vital statistics information increases the mortality rates at some
sites such as liver, lung and brain. Therefore, the redistribution of the two garbage codes C76 and
C80 over specific cancer sites would likely inflate the national mortality estimates for these sites, and
possibly the incidence.
Although the information is usually available in the cancer registry files, we did not attempt to
estimate incidence and mortality for particular sub-sites of histological sub-types because of the lack
of information in the corresponding mortality and survival datasets.
Page 21 of 76
John Wiley & Sons, Inc.
International Journal of Cancer
Annex B. Modelled survival
For a given cancer, mortality (M) is the product of the incidence (I) and the fatality. Fatality, the
inverse of survival, is the proportion of cancer cases who die:
M = I [1-survival]
In a previous study [22] and for the 86 countries for which no vital statistics were available, mortality
was estimated from incidence using country-specific 5-year relative survival wherever possible
(China, India and Thailand) or using models predicting site-specific 5-year relative survival (both sexes
combined and all ages) from per capita national Gross Domestic Product (GDP). For the GLOBOCAN
2012 exercise, we used Human Development Index (HDI), as this indicator is expected to predict
survival better than GDP, because it is a composite measure of various factors including GDP,
investment in health structure and level of education.
HDI estimates are available between 1980 and 2005 by 5-year intervals and yearly from 2006 to 2012
[14]. Survival data are available for 26 cancer sites for Denmark and Finland [13] and, for selected
sites and around 1995, for Algeria [27], Costa Rica, Cuba, India, Philippines, Thailand, Turkey, Uganda
and Zimbabwe [24]. We used the historical survival data prior to 1980 from Denmark and Finland to
improve the prediction as the very early years correspond to a level of survival achieved before the
availability of powerful radiotherapy and successful chemotherapeutic treatments.
The corresponding HDI values were predicted using the observed relationship of the GDP and the HDI
in these two countries. This was done by fitting and plotting 33 different regression models. We
selected the first most parsimonious model that significantly improves the fit of a simple linear
model, and selected the following three relationships:
1. For the cancers with poor prognosis (oesophagus, liver, gallbladder, pancreas and lung) HDI was
not predictive of survival and a constant value was used based on the simple average of the
countries data points (Figure B1a).
2. Logarithmic relationship (Figure B1b): survival improves quickly with a little increase in national
level of development before levelling off (cancers of the lip and oral cavity, nasopharynx, larynx,
cervix uteri and melanoma of skin).
3. Exponential relationship between HDI and survival (Figure B1c), all other cancers: survival
improves exponentially only after a certain national development level (in term of HDI).
We also expanded the use of the formula (1) to derive incidence from mortality estimates using
modelled survival for those countries (mainly in Central and South America and Central Asia) with
national mortality data available but for which no incidence data exist.
Practically, mortality was estimated from incidence (or incidence from mortality) by a two-step
process:
1. We applied a set of sex-, site- and age-specific M:I ratios obtained from the aggregation of 132
cancer registries worldwide for the period 2003-2007 to the estimated country incidence (or
mortality) to derive the corresponding mortality (or incidence).
2. For each cancer site, we scaled the age-specific M:I ratios so that the all age mortality (or
incidence) corresponds to the survival predicted by the country level of HDI (Figure B2).
Page 22 of 76
John Wiley & Sons, Inc.
International Journal of Cancer

Annex C. List of the 184 countries or territories and corresponding indicators of data availability and
methods of estimation
Country Data source Methods
Incidence Mortality Incidence Mortality
Afghanistan G 6 9 5
Albania G 3 4 1
Algeria C 6 6 5
Angola G 6 9 5
Argentina B 3 3 1
Armenia G 3 5 2
Australia A 1 1 1
Austria A 1 1 1
Azerbaijan G 2 5 2
Bahamas G 1 5 2
Bahrain A 3 1 1
Bangladesh F 6 8 5
Barbados G 2 5 2
Belarus A 2 1 2
Belgium A 2 2 2
Belize G 2 5 1
Benin F 6 9 5
Bhutan D 6 2 5
Bolivia G 6 8 5
Bosnia Herzegovina D 5 2 2
Botswana D 6 2 5
Brazil B 2 3 1
Brunei F 5 5 2
Bulgaria A 2 1 1
Burkina Faso F 6 8 5
Burundi G 6 9 5
Cambodia G 6 9 5
Cameroon E 6 7 5
Canada A 1 1 1
Cape Verde G 6 9 5
Central African Republic G 6 9 5
Chad G 6 9 5
Chile C 2 3 1
China C 4 3 1
Colombia C 2 3 1
Comoros G 6 9 5
Congo, Democratic Republic of G 6 9 5
Congo, Republic of E 6 7 5
Costa Rica A 2 1 1
Cote d’Ivoire F 6 8 5
Croatia A 2 1 1
Cuba C 1 3 1
Cyprus A 3 2 2
Czech Republic A 2 1 1
Page 23 of 76
John Wiley & Sons, Inc.
International Journal of Cancer

Denmark A 2 1 1
Djibouti G 6 9 5
Dominican Republic G 3 5 2
Ecuador C 3 3 1
Egypt C 3 6 5
El Salvador G 2 5 1
Equatorial Guinea G 6 9 5
Eritrea G 6 9 5
Estonia A 1 1 1
Ethiopia E 6 7 5
Fiji D 3 5 2
Finland A 1 1 1
France (metropolitan) B 2 3 1
France, Guadeloupe G 2 5 2
France, La Reunion D 2 1 5
France, Martinique A 2 1 1
French Guyana G 2 5 1
French Polynesia D 5 1 2
FYR Macedonia G 3 4 1
Gabon F 6 8 5
Georgia G 2 5 2
Germany B 2 1 1
Ghana F 6 8 5
Greece G 3 4 1
Guam D 6 2 5
Guatemala G 2 5 2
Guinea E 6 7 5
Guinea-Bissau G 6 9 5
Guyana G 2 5 1
Haiti G 3 5 2
Honduras G 6 5 6
Hungary G 1 4 1
Iceland A 1 1 1
India C 5 6 4
Indonesia F 6 6 5
Iran, Islamic Republic of C 6 6 5
Iraq F 6 8 5
Ireland A 1 1 1
Israel A 2 1 1
Italy B 2 3 1
Jamaica C 3 5 2
Japan B 1 3 1
Jordan D 5 1 5
Kazakhstan G 2 5 2
Kenya E 6 6 5
Korea, Democratic Republic of G 6 9 6
Korea, Republic of A 2 1 1
Kuwait A 2 1 1
Page 24 of 76
John Wiley & Sons, Inc.
International Journal of Cancer

Kyrgyzstan G 2 5 1
Lao PDR G 6 9 5
Latvia A 1 1 1
Lebanon D 6 2 5
Lesotho G 6 9 5
Liberia G 6 9 5
Libya C 6 7 5
Lithuania A 1 1 1
Luxembourg D 2 4 1
Madagascar G 6 9 5
Malawi C 6 7 5
Malaysia C 2 6 5
Maldives G 6 9 5
Mali E 6 7 5
Malta A 1 1 1
Mauritania G 6 9 5
Mauritius D 2 2 2
Mexico E 1 5 1
Mongolia D 5 2 2
Montenegro G 6 9 6
Morocco E 6 6 5
Mozambique E 6 8 5
Myanmar G 6 9 5
Namibia D 6 2 5
Nepal G 6 9 5
New Caledonia D 5 2 2
New Zealand A 1 1 1
Nicaragua G 3 5 1
Niger E 6 7 5
Nigeria E 6 6 5
Norway A 2 1 1
Oman A 3 2 5
Pakistan E 6 6 5
Panama G 2 5 1
Papua New Guinea G 6 8 5
Paraguay G 3 5 1
Peru E 3 5 1
Philippines B 2 6 2
Poland C 3 3 1
Portugal C 3 4 1
Puerto Rico A 2 1 1
Qatar A 3 2 5
Republic of Moldova G 1 4 1
Romania E 1 4 1
Russian Federation D 2 1 1
Rwanda F 6 9 5
Samoa D 6 2 5
Saudi Arabia D 6 1 5
Page 25 of 76
John Wiley & Sons, Inc.
International Journal of Cancer

Senegal G 6 9 5
Serbia B 2 4 1
Sierra Leone G 6 9 5
Singapore A 1 1 1
Slovakia A 1 1 1
Slovenia A 1 1 1
Solomon Islands G 6 9 5
Somalia G 6 9 5
South African Republic D 3 1 1
South Sudan G 6 9 5
Spain B 2 3 1
Sri Lanka D 6 2 5
State of Palestine F 6 8 5
Sudan F 6 8 5
Suriname G 3 5 1
Swaziland D 6 2 5
Sweden A 2 1 1
Switzerland B 2 3 1
Syrian Arab Republic G 6 9 5
Tajikistan G 3 5 2
Tanzania E 6 6 5
Thailand B 3 6 4
The Gambia D 6 2 5
The Netherlands A 2 1 1
Timor-Leste G 6 9 5
Togo F 6 8 5
Trinidad and Tobago D 2 5 1
Tunisia C 6 6 5
Turkey C 6 6 5
Turkmenistan G 2 5 1
Uganda C 6 7 5
Ukraine A 2 2 2
United Arab Emirates D 6 2 5
United Kingdom A 1 1 1
United States of America A 1 1 1
Uruguay A 2 2 2
Uzbekistan G 2 5 2
Vanuatu D 6 5 2
Venezuela G 1 5 1
Viet Nam E 4 5 3
Western Sahara G 6 9 5
Yemen E 6 7 5
Zambia E 6 7 5
Zimbabwe C 6 6 5
Page 26 of 76
John Wiley & Sons, Inc.
International Journal of Cancer

Cum. Cum. Cum.
ASR risk ASR risk ASR risk
Cancer site Cases (%) (World) (0-74) Cases (%) (World) (0-74) Cases (%) (World) (0-74)
Lip, oral cavity 300 2.1 4.0 0.5 199 2.7 5.5 0.6 101 1.5 2.5 0.3
Nasopharynx 87 0.6 1.2 0.1 61 0.8 1.7 0.2 26 0.4 0.7 0.1
Other pharynx 142 1.0 1.9 0.2 115 1.5 3.2 0.4 27 0.4 0.7 0.1
Oesophagus 456 3.2 5.9 0.7 323 4.3 9.0 1.1 133 2.0 3.1 0.4
Stomach 952 6.8 12.1 1.4 631 8.5 17.4 2.0 320 4.8 7.5 0.8
Colorectum 1361 9.7 17.2 2.0 746 10.0 20.6 2.4 614 9.2 14.3 1.6
Liver 782 5.6 10.1 1.1 554 7.5 15.3 1.7 228 3.4 5.4 0.6
Gallbladder 178 1.3 2.2 0.2 77 1.0 2.1 0.2 101 1.5 2.3 0.3
Pancreas 338 2.4 4.2 0.5 178 2.4 4.9 0.6 160 2.4 3.6 0.4
Larynx 157 1.1 2.1 0.3 138 1.9 3.9 0.5 19 0.3 0.5 0.1
Lung 1825 13.0 23.1 2.7 1242 16.7 34.2 3.9 583 8.7 13.6 1.6
Melanoma of skin 232 1.6 3.0 0.3 121 1.6 3.3 0.4 111 1.7 2.8 0.3
Kaposi sarcoma 44 0.3 0.6 0.1 29 0.4 0.8 0.1 15 0.2 0.4 0.0
Breast 1677 11.9 43.3 4.6 1677 25.2 43.3 4.6
Cervix uteri 528 3.7 14.0 1.4 528 7.9 14.0 1.4
Corpus uteri 320 2.3 8.3 1.0 320 4.8 8.3 1.0
Ovary 239 1.7 6.1 0.7 239 3.6 6.1 0.7
Prostate 1112 7.9 31.1 3.8 1112 15.0 31.1 3.8
Testis 55 0.4 1.5 0.1 55 0.7 1.5 0.1
Kidney 338 2.4 4.4 0.5 214 2.9 6.0 0.7 124 1.9 3.1 0.3
Bladder 430 3.1 5.3 0.6 330 4.4 9.0 1.0 99 1.5 2.2 0.2
Brain, nervous system 256 1.8 3.4 0.3 140 1.9 3.9 0.4 117 1.8 3.0 0.3
Thyroid 298 2.1 4.0 0.4 68 0.9 1.9 0.2 230 3.5 6.1 0.6
Hodgkin lymphoma 66 0.5 0.9 0.1 39 0.5 1.1 0.1 27 0.4 0.7 0.1
Non-Hodgkin lymphoma 386 2.7 5.1 0.5 218 2.9 6.0 0.6 168 2.5 4.1 0.4
Multiple myeloma 114 0.8 1.5 0.2 62 0.8 1.7 0.2 52 0.8 1.2 0.2
Leukaemia 352 2.5 4.7 0.4 201 2.7 5.6 0.5 151 2.3 3.9 0.4
All cancers excl. non-melanoma skin cancer 14090 100.0 182.3 18.5 7427 100.0 205.4 21.0 6663 100.0 165.3 16.4
Both sexes Male Female
Table 1 Estimated new cancer cases (thousands), ASRs (per 100,000) and cumulative risks to age 75 (percent) by sex and cancer site worldwide, 2012
Page 27 of 76
John Wiley & Sons, Inc.
International Journal of Cancer
5051525354555657585960

Cum. Cum. Cum.
ASR risk ASR risk ASR risk
Cancer site Deaths (%) (World) (0-74) Deaths (%) (World) (0-74) Deaths (%) (World) (0-74)
Lip, oral cavity 145 1.8 1.9 0.2 98 2.1 2.7 0.3 47 1.3 1.2 0.1
Nasopharynx 51 0.6 0.7 0.1 36 0.8 1.0 0.1 15 0.4 0.4 0.0
Other pharynx 96 1.2 1.3 0.2 78 1.7 2.2 0.3 19 0.5 0.5 0.1
Oesophagus 400 4.9 5.0 0.6 281 6.0 7.7 0.9 119 3.4 2.7 0.3
Stomach 723 8.8 8.9 1.0 469 10.1 12.8 1.4 254 7.2 5.7 0.6
Colorectum 694 8.5 8.4 0.9 374 8.0 10.0 1.0 320 9.0 6.9 0.7
Liver 746 9.1 9.5 1.0 521 11.2 14.3 1.6 224 6.3 5.1 0.6
Gallbladder 143 1.7 1.7 0.2 60 1.3 1.6 0.2 82 2.3 1.8 0.2
Pancreas 330 4.0 4.1 0.4 174 3.7 4.8 0.5 157 4.4 3.4 0.4
Larynx 83 1.0 1.1 0.1 73 1.6 2.0 0.2 10 0.3 0.2 0.0
Lung 1590 19.4 19.7 2.2 1099 23.6 30.0 3.3 491 13.8 11.1 1.2
Melanoma of skin 55 0.7 0.7 0.1 31 0.7 0.9 0.1 24 0.7 0.6 0.1
Kaposi sarcoma 27 0.3 0.4 0.0 17 0.4 0.5 0.1 10 0.3 0.3 0.0
Breast 522 6.4 12.9 1.4 522 14.7 12.9 1.4
Cervix uteri 266 3.2 6.8 0.8 266 7.5 6.8 0.8
Corpus uteri 76 0.9 1.8 0.2 76 2.1 1.8 0.2
Ovary 152 1.9 3.8 0.4 152 4.3 3.8 0.4
Prostate 307 3.7 7.8 0.6 307 6.6 7.8 0.6
Testis 10 0.1 0.3 0.0 10 0.2 0.3 0.0
Kidney 143 1.7 1.8 0.2 91 2.0 2.5 0.3 53 1.5 1.2 0.1
Bladder 165 2.0 1.9 0.2 123 2.6 3.2 0.3 42 1.2 0.9 0.1
Brain, nervous system 189 2.3 2.5 0.3 106 2.3 3.0 0.3 83 2.3 2.1 0.2
Thyroid 40 0.5 0.5 0.1 13 0.3 0.4 0.0 27 0.8 0.6 0.1
Hodgkin lymphoma 25 0.3 0.3 0.0 15 0.3 0.4 0.0 10 0.3 0.3 0.0
Non-Hodgkin lymphoma 200 2.4 2.5 0.3 115 2.5 3.2 0.3 84 2.4 2.0 0.2
Multiple myeloma 80 1.0 1.0 0.1 43 0.9 1.2 0.1 37 1.0 0.8 0.1
Leukaemia 265 3.2 3.4 0.3 151 3.2 4.2 0.4 114 3.2 2.8 0.3
All cancers excl. non-melanoma skin cancer 8201 100.0 102.4 10.5 4653 100.0 126.3 12.7 3548 100.0 82.9 8.4
Both sexes Male Female
Table 2 Estimated cancer deaths (thousands), ASRs (per 100,000) and cumulative risks to age 75 (percent) by sex and cancer site worldwide, 2012.
Page 28 of 76
John Wiley & Sons, Inc.
International Journal of Cancer
5051525354555657585960

Estimated age-standardised rates (ASRs, World standard) of cancer incidence by sex, cancer site and regions, 2012
Oral cavity Nasopharynx Other pharynx Oesophagus
(C00-08) (C11) (C09-10,C12-14) (C15)
M F M F M F M
World 5.5 2.5 1.7 0.7 3.2 0.7 9.0
More developed regions 7.0 2.6 0.6 0.2 4.7 0.8 6.4
Less developed regions 5.0 2.5 2.0 0.8 2.8 0.6 10.1
Africa 3.3 2.0 1.5 0.8 1.1 0.6 5.6
Eastern Africa 4.5 2.8 1.9 1.1 1.0 0.6 11.9
Middle Africa 3.5 1.8 1.3 0.6 1.8 0.6 4.2
Northern Africa 2.8 1.8 2.3 1.0 0.8 0.7 2.4
Southern Africa 6.3 2.3 0.4 0.2 3.9 1.5 13.7
Western Africa 1.7 1.4 0.7 0.4 0.6 0.1 0.8
The Americas 5.9 2.6 0.5 0.2 3.3 0.7 5.5
Caribbean 4.8 1.8 0.4 0.2 3.6 0.9 4.6
Central America 2.6 1.7 0.2 0.1 1.0 0.3 1.7
South America 5.3 2.4 0.5 0.2 3.0 0.5 7.0
Northern America 7.3 3.2 0.7 0.3 4.2 0.9 5.4
Asia 5.2 2.5 2.3 0.9 3.1 0.7 11.4
Eastern Asia 2.4 1.1 2.5 1.0 1.3 0.2 17.0
South-Eastern Asia 4.0 2.5 6.4 2.4 2.6 0.7 3.6
South-Central Asia 9.9 4.7 0.6 0.2 6.2 1.4 6.5
Western Asia 2.7 1.6 1.3 0.6 0.8 0.4 2.9
Europe 7.5 2.5 0.6 0.2 5.2 0.9 5.8
Central and Eastern Europe 9.1 2.0 0.6 0.2 5.3 0.5 5.6
Northern Europe 5.9 3.1 0.4 0.2 3.3 1.0 8.1
Southern Europe 5.8 2.1 0.8 0.3 3.4 0.5 3.2
Western Europe 7.9 3.2 0.5 0.2 7.5 1.6 6.8
Oceania 9.6 5.3 0.7 0.3 3.0 0.6 5.2
Australia/New Zealand 8.3 3.7 0.7 0.3 3.2 0.7 5.4
Melanesia 22.9 16.0 0.4 0.1 3.4 0.4 3.6
Micronesia/Polynesia 4.3 1.0 2.6 1.3 2.0 0.0 3.1
Breast Cervix uteriCorpus uteriOvary Prostate Testis Kidney
(C50) (C53) (C54) (C56) (C61) (C62) (C64-66)
F F F F M M M
World 43.3 14.0 8.3 6.1 31.1 1.5 6.0
More developed regions 74.1 9.9 14.7 9.1 69.5 5.2 12.6
Less developed regions 31.3 15.7 5.5 4.9 14.5 0.7 3.4
Africa 36.2 27.6 3.5 4.8 23.2 0.4 1.4
Eastern Africa 30.4 42.7 3.4 5.5 23.3 0.3 1.1
Middle Africa 26.8 30.6 3.4 4.1 27.0 0.2 0.7
Northern Africa 43.2 6.6 3.1 5.6 10.6 0.6 2.5
Southern Africa 38.9 31.5 6.5 5.2 61.8 0.6 1.6
Western Africa 38.6 29.3 3.3 3.6 25.1 0.3 0.8
The Americas 67.6 14.9 12.3 6.8 75.0 3.2 9.8
Caribbean 46.1 21.0 10.4 5.0 79.8 1.0 2.9
Central America 32.8 23.5 6.6 5.0 28.4 2.3 4.1
South America 52.2 20.4 5.5 5.8 60.1 2.3 5.1
Northern America 91.6 6.6 19.1 8.1 97.2 5.0 15.5
Asia 29.1 12.7 5.9 5.0 9.4 0.6 3.8
Page 29 of 76
John Wiley & Sons, Inc.
International Journal of Cancer

Eastern Asia 27.0 7.9 8.6 4.7 10.5 0.5 5.8
South-Eastern Asia 34.8 16.3 5.1 6.5 11.2 0.9 1.9
South-Central Asia 28.2 19.3 2.7 4.9 4.5 0.6 1.4
Western Asia 42.8 4.4 7.6 5.3 28.0 1.7 5.0
Europe 71.1 11.4 13.9 9.9 64.0 5.6 12.3
Central and Eastern Europe 47.7 16.3 15.6 11.4 31.3 3.2 12.4
Northern Europe 89.4 8.7 14.1 11.0 85.0 7.2 11.1
Southern Europe 74.5 8.5 12.9 9.1 58.6 5.9 11.2
Western Europe 96.0 7.3 11.6 7.5 94.9 8.7 13.4
Oceania 79.2 10.2 12.4 8.0 101.9 5.0 11.0
Australia/New Zealand 85.8 5.5 12.4 7.6 111.6 6.8 12.6
Melanesia 41.0 33.3 10.3 8.1 22.7 0.4 1.4
Micronesia/Polynesia 59.7 9.9 12.3 5.2 72.3 0.4 3.6
Page 30 of 76
John Wiley & Sons, Inc.
International Journal of Cancer

Estimated age-standardised rates (ASRs, World standard) of cancer incidence by sex, cancer site and regions, 2012
Oesophagus Stomach Colorectum Liver Gallbladder
(C16) (C18-21) (C22) (C23-24)
F M F M F M F M F
3.1 17.4 7.5 20.6 14.3 15.3 5.3 2.1 2.3
1.2 15.6 6.7 36.3 23.6 8.6 2.7 2.3 2.0
4.1 18.1 7.8 13.6 9.8 17.8 6.6 2.0 2.4
3.5 4.5 3.2 7.0 5.8 12.4 5.8 0.6 0.9
7.8 5.2 3.9 7.1 6.1 4.8 3.3 0.4 1.0
2.0 4.1 3.9 4.7 4.8 10.5 5.7 0.1 0.1
1.5 4.3 2.7 8.5 6.9 18.0 7.0 1.2 1.9
6.7 7.2 2.9 14.2 8.8 6.7 3.3 0.5 0.5
0.4 3.3 2.6 4.5 3.8 16.4 8.1 0.3 0.3
1.4 9.2 5.0 22.3 17.6 7.4 3.4 1.7 2.3
1.3 8.1 5.1 16.3 16.6 6.1 4.5 0.8 1.2
0.6 10.6 8.2 8.8 7.2 6.9 6.6 1.1 2.3
2.0 14.2 7.0 17.1 14.6 5.2 3.4 2.1 3.5
1.1 5.5 2.8 30.1 22.7 9.3 2.7 1.6 1.6
4.3 22.8 9.3 16.5 11.1 20.0 6.9 2.5 2.7
5.4 35.4 13.8 22.4 14.6 31.9 10.2 3.4 3.2
1.0 8.2 4.1 15.2 10.2 22.2 7.2 1.4 1.2
3.9 9.2 4.2 7.0 5.2 3.7 2.1 1.4 2.3
2.1 11.9 7.3 17.6 12.4 5.0 2.6 1.5 1.4
1.2 13.2 6.4 37.3 23.6 6.8 2.2 1.7 1.8
0.8 20.3 8.9 34.5 21.7 4.8 2.0 1.6 1.9
2.7 7.4 3.7 36.5 25.3 4.6 1.9 0.8 1.1
0.6 11.7 5.9 39.5 24.0 9.5 2.9 2.1 2.0
1.6 8.8 4.3 39.1 24.9 8.0 2.2 2.0 1.9
1.7 6.8 3.5 41.0 29.2 7.8 3.1 1.5 1.5
1.7 6.7 3.3 44.8 32.2 6.4 2.1 1.5 1.5
1.4 7.2 5.2 11.1 6.9 14.8 7.6 1.8 0.6
0.2 7.5 2.8 18.5 11.8 9.1 1.4 0.4 1.3
Bladder Brain, cns Thyroid Hodgkin
(C67) (C70-72) (C73) (C81)
F M F M F M F M F
3.0 9.0 2.2 3.9 3.0 1.9 6.1 1.1 0.7
6.2 16.9 3.7 5.9 4.4 3.6 11.1 2.3 1.9
1.8 5.3 1.5 3.3 2.7 1.4 4.7 0.8 0.5
1.1 6.3 2.0 2.1 1.6 0.9 2.4 1.0 0.7
1.3 3.3 2.0 1.3 1.1 1.1 2.7 0.9 0.7
0.6 2.2 1.3 0.5 0.5 0.7 1.2 0.6 0.4
1.6 15.1 3.2 5.6 4.4 1.4 4.4 1.8 1.3
0.8 7.5 1.9 2.0 1.2 0.6 1.6 1.2 0.5
0.7 2.1 1.3 0.4 0.3 0.3 1.0 0.7 0.4
5.2 12.9 3.6 5.5 4.2 3.7 12.1 1.8 1.3
1.5 7.6 1.8 3.3 3.3 1.3 4.2 1.0 0.9
2.3 3.4 1.8 4.5 3.4 1.2 3.8 1.3 0.9
2.7 6.9 2.1 5.4 4.3 1.9 8.4 1.1 0.8
8.3 19.5 5.2 6.1 4.6 6.3 20.0 2.7 2.2
1.9 5.5 1.4 3.3 2.7 1.5 5.0 0.7 0.4
Page 31 of 76
John Wiley & Sons, Inc.
International Journal of Cancer

2.7 5.8 1.6 4.0 3.5 2.0 7.6 0.2 0.2
0.9 4.3 1.0 2.6 2.1 1.8 4.5 0.5 0.3
0.7 3.6 0.8 2.4 1.5 0.7 1.8 1.0 0.5
3.0 19.0 3.1 5.3 5.0 2.4 9.8 2.4 1.5
5.9 17.7 3.5 6.3 4.6 2.5 7.8 2.3 2.0
6.1 15.1 2.7 5.8 4.5 1.8 7.4 1.9 1.9
5.8 12.4 3.6 7.0 5.1 1.7 5.6 2.6 1.9
4.6 21.8 3.8 6.8 4.8 3.8 8.6 2.5 2.1
6.5 19.7 4.3 6.1 4.4 3.1 8.8 2.5 2.3
5.3 10.6 2.7 5.3 3.4 3.4 11.3 2.0 1.7
6.1 11.3 2.9 6.4 4.3 3.8 11.8 2.5 2.2
0.5 3.5 0.7 0.9 0.2 2.3 10.6 0.6 0.2
0.9 6.4 0.9 0.8 0.3 3.0 12.3 0.4 0.0
Page 32 of 76
John Wiley & Sons, Inc.
International Journal of Cancer

Pancreas Larynx Lung Melanoma Kaposi sarcoma
(C25) (C32) (C33-34) (C43) (C46)
M F M F M F M F M
4.9 3.6 3.9 0.5 34.2 13.6 3.3 2.8 0.8
8.6 5.9 5.1 0.6 44.7 19.6 10.2 9.3 0.3
3.3 2.4 3.5 0.4 30.0 11.1 0.8 0.7 0.9
2.3 1.7 2.7 0.3 7.7 2.6 0.9 1.1 5.5
1.5 1.7 2.3 0.3 3.8 2.2 0.8 1.3 15.1
1.4 0.8 1.4 0.2 2.0 0.8 1.4 2.0 1.2
3.3 1.8 4.2 0.4 15.6 3.1 0.3 0.4 0.3
5.3 3.5 5.0 0.9 26.1 10.2 5.0 3.7 7.6
2.0 1.3 1.4 0.1 1.7 1.1 0.6 0.6 0.9
6.6 5.3 4.6 0.8 31.4 21.6 9.0 6.2 0.5
4.2 3.6 7.9 0.9 25.8 13.5 0.8 0.7 0.5
3.7 3.7 4.0 0.6 10.1 4.9 1.9 1.3 0.1
5.0 4.4 5.2 0.7 20.8 10.7 2.9 2.2 0.6
8.5 6.4 4.0 0.9 44.0 33.8 16.1 12.2 0.5
3.8 2.6 3.3 0.4 35.2 12.7 0.5 0.4 0.1
5.5 3.6 2.2 0.2 50.4 19.2 0.6 0.5 0.0
2.5 2.0 2.7 0.5 29.6 10.5 0.5 0.3 0.1
1.3 1.0 4.6 0.6 11.9 3.4 0.3 0.2 0.0
4.7 3.1 6.5 0.9 37.6 7.1 1.8 1.6 0.5
8.3 5.5 6.3 0.6 46.6 15.1 8.6 8.9 0.3
8.9 5.0 7.8 0.4 53.5 10.4 4.5 4.7 0.1
7.3 5.9 3.4 0.6 34.6 23.7 14.0 15.4 0.3
7.6 5.3 7.2 0.6 46.4 12.8 8.1 8.3 0.8
8.3 6.3 4.8 0.7 44.0 20.0 11.5 12.8 0.2
7.0 5.0 2.9 0.3 31.3 20.0 34.7 25.5 0.3
7.5 5.4 3.0 0.3 32.7 21.7 40.3 30.5 0.3
2.5 1.1 2.7 0.6 14.3 5.8 3.4 3.8 0.1
3.1 1.4 1.7 0.3 42.7 17.5 4.1 2.4 0.0
NHL Multiple myeloma Leukaemia All sites but C44
(C82-85,C96) (C88+C90) (C91-95) (C00-97/C44)
M F M F M F M F
6.0 4.1 1.7 1.2 5.6 3.9 205.4 165.3
10.3 7.1 3.3 2.2 8.8 5.8 308.7 240.6
4.3 2.8 1.0 0.8 4.3 3.2 163.0 135.8
5.5 3.8 1.1 0.9 3.3 2.6 115.6 132.4
5.6 3.5 1.1 1.0 3.8 3.4 120.7 154.8
4.4 3.2 1.1 0.9 2.6 1.8 91.8 110.7
7.6 5.4 1.4 1.0 5.6 3.9 133.5 127.7
5.2 4.1 2.0 1.7 3.6 2.6 210.3 161.1
3.7 2.5 0.4 0.4 1.4 1.2 78.7 112.4
9.9 7.0 3.1 2.2 7.8 5.6 263.0 228.2
4.9 3.6 2.1 1.7 4.7 3.7 207.7 168.0
4.2 3.3 1.3 1.0 5.8 4.9 125.8 141.9
6.0 4.3 1.9 1.5 5.3 4.1 206.7 180.6
14.6 10.2 4.3 3.0 10.4 7.2 344.2 295.4
4.2 2.7 1.0 0.7 4.6 3.3 174.1 134.3
Page 33 of 76
John Wiley & Sons, Inc.
International Journal of Cancer

4.0 2.8 1.0 0.6 5.1 3.8 225.4 151.9
5.7 3.8 0.9 0.8 4.9 4.0 147.6 132.6
3.3 1.8 0.8 0.5 3.4 2.3 98.4 103.3
7.8 5.6 2.3 1.7 6.8 4.8 192.8 150.2
8.8 5.9 3.2 2.1 8.7 5.6 298.9 226.7
4.8 3.6 1.6 1.3 7.7 5.1 260.0 193.5
11.5 8.1 4.1 2.7 9.2 6.0 298.4 263.9
10.3 6.6 3.3 2.3 8.7 5.6 297.6 220.4
10.9 7.7 4.3 2.8 9.6 6.0 343.7 263.7
13.3 9.4 4.2 2.7 10.4 6.4 338.5 264.8
14.3 10.1 4.6 3.0 11.3 7.2 365.3 277.9
6.9 4.8 1.1 0.7 5.3 3.3 152.1 182.1
6.3 3.4 1.6 0.4 5.9 2.1 215.2 165.3
Page 34 of 76
John Wiley & Sons, Inc.
International Journal of Cancer

Kaposi sarcoma
F
0.4
0.1
0.5
2.9
7.6
0.4
0.1
4.7
0.6
0.1
0.1
0.0
0.1
0.1
0.0
0.0
0.0
0.0
0.2
0.1
0.1
0.1
0.2
0.0
0.0
0.0
0.0
0.0
Page 35 of 76
John Wiley & Sons, Inc.
International Journal of Cancer

Estimated age-standardised rates (ASRs, World standard) of cancer mortality by sex, cancer site and regions, 2012
Oral cavity Nasopharynx Other pharynx Oesophagus
(C00-08) (C11) (C09-10,C12-14) (C15)
M F M F M F M F
World 2.7 1.2 1.0 0.4 2.2 0.5 7.7 2.7
More developed regions2.3 0.6 0.2 0.1 2.2 0.3 5.2 0.9
Less developed regions2.8 1.4 1.3 0.5 2.2 0.5 9.0 3.6
Africa 2.1 1.3 1.1 0.6 0.9 0.4 5.3 3.3
Eastern Africa 3.2 1.9 1.4 0.9 0.9 0.5 11.2 7.3
Middle Africa 2.9 1.4 1.1 0.6 1.6 0.6 4.0 1.9
Northern Africa 1.3 0.8 1.4 0.6 0.6 0.6 2.3 1.4
Southern Africa 2.8 1.0 0.2 0.1 2.2 0.6 12.8 6.2
Western Africa 1.2 1.0 0.6 0.3 0.5 0.1 0.8 0.4
The Americas 1.5 0.6 0.2 0.1 1.5 0.3 4.8 1.1
Caribbean 2.0 0.6 0.3 0.1 2.5 0.6 4.1 1.0
Central America 0.8 0.5 0.1 0.0 0.7 0.2 1.6 0.5
South America 2.2 0.7 0.2 0.1 2.2 0.4 5.6 1.5
Northern America 1.2 0.5 0.2 0.1 1.2 0.3 5.1 1.0
Asia 3.0 1.4 1.4 0.5 2.4 0.5 9.9 3.8
Eastern Asia 1.1 0.5 1.5 0.6 0.7 0.1 14.1 4.5
South-Eastern Asia1.9 1.2 3.8 1.4 2.1 0.5 3.3 0.9
South-Central Asia 6.3 3.0 0.4 0.1 5.3 1.2 6.0 3.6
Western Asia 1.0 0.6 0.7 0.3 0.6 0.3 2.7 1.9
Europe 3.0 0.7 0.3 0.1 2.7 0.3 4.9 0.9
Central and Eastern Europe5.1 0.7 0.3 0.2 3.8 0.3 5.0 0.6
Northern Europe 1.6 0.7 0.2 0.1 1.4 0.3 7.2 2.3
Southern Europe 1.9 0.6 0.3 0.1 1.8 0.3 2.8 0.5
Western Europe 2.0 0.6 0.2 0.1 2.7 0.5 5.0 1.2
Oceania 2.7 1.9 0.3 0.1 1.3 0.3 4.5 1.4
Australia/New Zealand1.4 0.6 0.2 0.1 1.2 0.3 4.7 1.3
Melanesia 14.4 10.2 0.3 0.1 2.8 0.4 3.4 1.4
Micronesia/Polynesia1.7 0.0 0.9 0.4 1.1 0.2 3.2 0.2
Breast Cervix uteriCorpus uteriOvary Prostate Testis Kidney
(C50) (C53) (C54) (C56) (C61) (C62) (C64-66)
F F F F M M M F
World 12.9 6.8 1.8 3.8 7.8 0.3 2.5 1.2
More developed regions14.9 3.3 2.3 5.0 10.0 0.3 4.2 1.7
Less developed regions11.5 8.3 1.5 3.1 6.6 0.3 1.7 0.9
Africa 17.3 17.5 1.3 3.8 17.0 0.3 1.1 0.9
Eastern Africa 15.6 27.6 1.3 4.4 18.7 0.2 1.0 1.1
Middle Africa 14.9 22.2 1.5 3.3 24.2 0.2 0.6 0.5
Northern Africa 17.4 3.2 0.9 4.1 7.0 0.3 1.9 1.2
Southern Africa 15.5 17.9 1.8 3.8 24.4 0.3 1.5 0.6
Western Africa 20.1 18.5 1.4 3.0 21.2 0.2 0.6 0.6
The Americas 14.0 5.9 2.0 4.3 13.1 0.4 3.1 1.4
Caribbean 15.1 8.6 3.3 3.0 29.3 0.2 1.4 0.7
Central America 9.5 8.9 1.7 3.3 12.1 0.6 2.3 1.3
Page 36 of 76
John Wiley & Sons, Inc.
International Journal of Cancer

South America 14.0 8.6 1.5 3.6 16.6 0.4 2.8 1.3
Northern America14.8 2.6 2.2 5.0 9.8 0.3 3.7 1.6
Asia 10.2 6.4 1.5 3.0 3.8 0.3 1.7 0.9
Eastern Asia 6.2 3.3 1.9 2.0 3.1 0.1 2.1 1.0
South-Eastern Asia14.1 7.9 1.5 4.4 6.7 0.5 1.3 0.7
South-Central Asia13.5 10.9 1.0 3.7 2.9 0.3 1.0 0.4
Western Asia 15.1 2.0 1.9 3.7 13.1 0.7 3.2 1.9
Europe 16.1 3.8 2.6 5.3 11.3 0.4 4.8 1.9
Central and Eastern Europe16.5 6.2 3.4 6.0 11.6 0.5 5.8 2.1
Northern Europe 16.3 2.2 2.3 5.9 14.4 0.2 4.2 2.0
Southern Europe 14.9 2.4 2.1 4.4 9.1 0.3 3.6 1.3
Western Europe 16.1 1.8 1.9 4.7 10.7 0.3 4.6 1.8
Oceania 15.6 4.5 1.9 4.9 13.0 0.2 2.8 1.3
Australia/New Zealand14.5 1.5 1.5 4.5 12.9 0.2 3.0 1.4
Melanesia 19.8 20.6 3.8 6.5 13.3 0.3 1.1 0.4
Micronesia/Polynesia13.1 3.9 2.5 3.2 13.7 0.0 1.0 0.2
Page 37 of 76
John Wiley & Sons, Inc.
International Journal of Cancer

Estimated age-standardised rates (ASRs, World standard) of cancer mortality by sex, cancer site and regions, 2012
Stomach Colorectum Liver Gallbladder Pancreas
(C16) (C18-21) (C22) (C23-24) (C25)
M F M F M F M F M
12.8 5.7 10.0 6.9 14.3 5.1 1.6 1.8 4.8
9.1 4.2 14.7 9.3 7.1 2.5 1.5 1.4 8.3
14.4 6.5 7.8 5.6 17.0 6.4 1.6 2.0 3.2
4.1 3.0 5.1 4.2 11.9 5.6 0.5 0.9 2.3
5.0 3.7 5.5 4.6 4.6 3.1 0.4 0.9 1.5
4.0 3.8 3.8 3.9 9.9 5.4 0.1 0.1 1.3
3.9 2.4 5.6 4.5 17.4 6.7 1.1 1.8 3.2
5.2 2.5 10.0 5.8 6.7 3.2 0.5 0.5 5.2
3.2 2.5 3.5 3.0 15.6 7.7 0.3 0.3 1.9
6.8 3.7 9.8 7.4 6.2 3.3 1.0 1.6 6.4
6.8 4.0 9.1 9.1 6.0 4.3 0.5 0.9 4.1
8.8 6.7 4.8 3.8 6.6 6.1 1.0 2.1 3.5
12.0 5.7 9.4 7.7 5.4 3.7 1.7 2.9 5.2
2.8 1.5 11.3 7.8 6.8 2.3 0.6 0.7 8.0
16.7 7.2 8.6 6.0 18.9 6.7 2.1 2.3 3.6
24.0 9.8 10.2 6.8 29.9 9.6 2.8 2.6 5.2
7.3 3.5 9.7 6.4 21.4 6.8 1.3 1.1 2.5
8.5 3.9 5.1 3.8 3.6 2.1 1.3 2.1 1.2
10.2 6.2 10.0 7.1 4.9 2.5 1.4 1.2 4.7
9.7 4.6 16.2 9.9 6.1 2.2 1.1 1.3 8.2
16.8 7.1 20.3 11.7 5.4 2.2 1.3 1.5 9.0
4.8 2.4 13.4 9.1 4.0 1.8 0.6 0.8 7.1
8.3 4.0 15.4 8.7 7.5 2.5 1.5 1.5 7.4
5.1 2.5 13.3 8.3 6.5 2.1 0.9 1.0 8.0
3.9 2.1 11.4 8.2 6.9 2.9 0.6 0.7 5.9
3.6 1.7 11.6 8.5 5.4 2.0 0.5 0.7 6.3
6.6 4.7 7.7 4.9 14.4 7.3 1.6 0.6 2.3
6.2 3.0 8.2 5.1 10.1 2.2 0.0 1.1 3.9
Bladder Brain, cns Thyroid Hodgkin NHL
(C67) (C70-72) (C73) (C81) (C82-85,C96)
M F M F M F M F M
3.2 0.9 3.0 2.1 0.3 0.6 0.4 0.3 3.2
4.5 1.1 4.0 2.7 0.3 0.4 0.4 0.3 3.5
2.6 0.7 2.6 1.9 0.4 0.7 0.4 0.3 2.8
3.5 1.2 1.6 1.3 0.6 1.3 0.8 0.5 4.3
2.2 1.3 1.1 0.9 0.8 1.8 0.9 0.6 4.6
1.6 0.9 0.5 0.5 0.5 0.8 0.5 0.4 3.8
7.6 1.6 4.0 3.1 0.7 1.8 1.2 0.8 5.4
3.0 0.9 1.9 1.1 0.3 0.4 0.4 0.2 4.0
1.5 0.9 0.4 0.3 0.3 0.7 0.6 0.4 3.0
3.2 1.0 3.8 2.8 0.3 0.5 0.4 0.3 3.8
3.0 0.9 2.5 2.3 0.2 0.3 0.5 0.3 2.8
1.2 0.6 2.5 1.9 0.4 0.8 0.6 0.4 2.4
Page 38 of 76
John Wiley & Sons, Inc.
International Journal of Cancer

2.7 0.9 4.0 3.2 0.3 0.6 0.4 0.2 3.2
4.0 1.2 4.1 2.6 0.3 0.3 0.3 0.2 4.5
2.5 0.6 2.5 1.8 0.3 0.7 0.4 0.2 2.7
2.3 0.7 3.2 2.3 0.3 0.4 0.1 0.1 2.3
2.2 0.5 1.9 1.5 0.8 1.6 0.3 0.2 4.0
2.0 0.5 1.9 1.1 0.2 0.6 0.6 0.3 2.3
8.4 1.3 3.6 3.3 0.7 1.7 1.3 0.8 4.9
5.2 1.1 4.6 3.0 0.3 0.4 0.5 0.3 3.1
6.1 0.9 4.7 3.2 0.4 0.6 0.7 0.5 2.7
4.4 1.5 4.7 3.0 0.2 0.3 0.3 0.2 3.5
6.0 1.0 4.7 3.1 0.3 0.3 0.5 0.3 3.2
4.0 1.1 4.2 2.7 0.3 0.3 0.3 0.2 3.2
3.2 1.0 4.0 2.6 0.3 0.8 0.3 0.2 4.1
3.3 1.0 4.6 3.0 0.2 0.3 0.3 0.2 3.8
2.0 0.4 0.9 0.3 1.5 5.7 0.5 0.2 5.9
1.2 0.9 0.3 0.7 0.9 0.7 0.0 0.0 2.9
Page 39 of 76
John Wiley & Sons, Inc.
International Journal of Cancer

Larynx Lung Melanoma Kaposi sarcoma
(C32) (C33-34) (C43) (C46)
F M F M F M F M F
3.4 2.0 0.2 30.0 11.1 0.9 0.6 0.5 0.3
5.5 2.2 0.2 36.8 14.3 2.0 1.2 0.0 0.0
2.3 2.0 0.3 27.2 9.8 0.4 0.3 0.6 0.3
1.6 1.5 0.2 7.0 2.4 0.5 0.6 4.9 2.2
1.6 1.5 0.2 3.5 2.0 0.6 0.9 14.2 6.2
0.8 1.1 0.2 1.8 0.8 1.0 1.5 1.0 0.4
1.8 2.0 0.2 14.0 2.8 0.2 0.2 0.2 0.1
3.4 2.5 0.4 23.8 9.1 1.6 0.8 4.3 2.8
1.2 0.9 0.1 1.5 0.9 0.5 0.4 0.9 0.5
5.0 2.1 0.3 25.9 15.9 1.7 0.9 0.1 0.0
3.6 4.0 0.5 23.7 12.1 0.3 0.2 0.1 0.0
3.5 1.5 0.2 9.0 4.3 0.6 0.4 0.1 0.0
4.4 3.3 0.4 18.5 8.9 1.0 0.6 0.1 0.0
5.9 1.2 0.3 34.8 23.5 2.6 1.2 0.0 0.0
2.5 1.9 0.2 31.6 11.0 0.3 0.2 0.0 0.0
3.4 1.1 0.2 44.8 16.2 0.4 0.3 0.0 0.0
1.9 1.3 0.2 26.6 9.4 0.3 0.2 0.0 0.0
0.9 3.0 0.4 10.7 3.0 0.2 0.1 0.0 0.0
3.0 2.9 0.4 34.0 6.2 0.6 0.5 0.2 0.1
5.3 3.0 0.2 39.8 11.8 2.0 1.3 0.0 0.0
4.9 4.9 0.2 47.6 8.3 2.0 1.4 0.0 0.0
5.6 1.3 0.2 29.6 19.0 2.5 1.6 0.0 0.0
4.9 2.9 0.2 39.1 10.0 1.6 1.0 0.0 0.0
5.8 1.5 0.2 35.3 14.8 2.0 1.3 0.0 0.0
4.6 1.0 0.2 23.1 14.1 5.4 2.3 0.0 0.0
4.9 0.9 0.1 23.5 14.9 5.9 2.4 0.0 0.0
1.2 1.9 0.4 13.3 5.0 2.1 2.3 0.1 0.0
1.1 1.1 0.4 38.4 17.3 1.0 0.4 0.0 0.0
Multiple myeloma Leukaemia All sites but C44
(C82-85,C96) (C88+C90) (C91-95) (C00-97/C44)
F M F M F M F
2.0 1.2 0.8 4.2 2.8 126.3 82.9
2.0 1.8 1.2 4.6 2.8 138.0 86.2
1.8 0.8 0.6 3.7 2.6 120.1 79.8
2.9 0.9 0.8 3.1 2.5 92.9 88.7
2.9 1.0 0.9 3.7 3.3 103.8 110.5
2.7 1.0 0.8 2.5 1.7 82.3 82.3
3.7 1.2 0.8 4.9 3.4 99.9 75.7
2.9 1.8 1.4 3.4 2.3 136.5 98.7
2.0 0.4 0.4 1.3 1.1 68.5 75.7
2.4 2.0 1.3 5.0 3.4 116.4 89.2
1.9 1.7 1.3 3.7 2.7 119.8 87.7
1.9 1.0 0.7 4.2 3.5 76.6 72.1
Page 40 of 76
John Wiley & Sons, Inc.
International Journal of Cancer

2.1 1.6 1.1 4.2 3.1 118.0 88.4
2.6 2.4 1.5 5.3 3.2 123.2 91.7
1.6 0.8 0.5 3.8 2.6 126.3 77.0
1.4 0.7 0.5 4.2 2.9 159.3 80.2
2.5 0.8 0.6 4.3 3.4 114.1 79.5
1.3 0.7 0.5 2.9 2.0 74.8 64.7
3.3 1.7 1.3 5.6 3.8 129.3 81.3
1.8 1.7 1.2 4.6 2.8 147.5 87.6
1.5 1.2 0.9 4.6 2.8 173.4 91.6
2.2 2.3 1.5 4.1 2.5 125.9 94.2
1.9 1.7 1.3 4.7 2.8 137.9 78.9
1.9 1.9 1.3 4.4 2.7 131.3 83.6
2.6 2.1 1.4 4.9 2.9 117.8 90.0
2.3 2.3 1.5 4.4 2.7 115.3 82.6
3.7 0.8 0.6 4.8 2.9 117.9 118.5
1.6 1.0 0.5 4.6 1.5 116.9 76.2
Page 41 of 76
John Wiley & Sons, Inc.
International Journal of Cancer

Estimated numbers of new cancer cases (thousands) by sex, cancer site and regions, 2012
Oral cavity Nasopharynx Other pharynx Oesophagus
(C00-08) (C11) (C09-10,C12-14) (C15)
M F M F M F M
World 199.0 101.4 60.9 25.8 115.1 27.3 323.0
More developed regions 68.0 32.8 5.1 2.1 44.4 9.2 67.7
Less developed regions 130.9 68.6 55.8 23.7 70.7 18.1 255.3
Africa 10.2 7.0 5.3 3.0 3.4 1.9 16.1
Eastern Africa 4.1 2.9 1.9 1.3 0.9 0.6 9.8
Middle Africa 1.1 0.6 0.5 0.3 0.6 0.2 1.2
Northern Africa 2.2 1.6 2.0 0.9 0.6 0.6 1.9
Southern Africa 1.3 0.6 0.1 0.0 0.8 0.4 2.5
Western Africa 1.5 1.4 0.8 0.5 0.5 0.2 0.7
The Americas 31.9 17.3 2.7 1.2 17.6 4.5 30.4
Caribbean 1.1 0.5 0.1 0.0 0.8 0.2 1.1
Central America 1.8 1.4 0.1 0.1 0.7 0.2 1.1
South America 10.1 5.8 0.9 0.4 5.6 1.3 13.3
Northern America 18.9 9.7 1.6 0.7 10.5 2.8 14.9
Asia 112.0 56.9 49.8 20.3 65.0 15.0 240.1
Eastern Asia 25.5 12.6 25.9 10.5 13.4 1.9 183.0
South-Eastern Asia 10.5 7.6 18.0 7.6 6.9 2.0 9.4
South-Central Asia 73.6 35.1 4.5 1.7 43.9 10.8 45.3
Western Asia 2.4 1.6 1.3 0.6 0.7 0.4 2.4
Europe 42.6 18.8 2.9 1.2 28.4 5.7 35.1
Central and Eastern Europe 17.7 6.0 1.1 0.5 10.2 1.4 11.0
Northern Europe 4.8 3.0 0.3 0.1 2.6 0.8 7.6
Southern Europe 7.7 3.8 0.8 0.3 4.1 0.7 4.5
Western Europe 12.3 6.0 0.7 0.3 11.5 2.7 11.9
Oceania 2.3 1.4 0.1 0.1 0.7 0.2 1.4
Australia/New Zealand 1.7 0.9 0.1 0.0 0.6 0.1 1.3
Melanesia 0.6 0.5 0.0 0.0 0.1 0.0 0.1
Micronesia/Polynesia 0.0 0.0 0.0 0.0 0.0 0.0 0.0
Breast Cervix uteriCorpus uteriOvary Prostate Testis Kidney
(C50) (C53) (C54) (C56) (C61) (C62) (C64-66)
F F F F M M M
World 1676.6 527.6 319.6 238.7 1111.7 55.3 213.9
More developed regions 793.7 83.1 167.9 99.8 758.7 32.7 125.4
Less developed regions 882.9 444.5 151.7 139.0 353.0 22.5 88.5
Africa 133.9 99.0 11.4 17.8 59.5 1.5 5.1
Eastern Africa 33.5 45.7 3.1 5.9 17.2 0.4 1.4
Middle Africa 10.9 11.5 1.1 1.6 6.9 0.1 0.4
Northern Africa 39.5 5.8 2.6 5.1 7.5 0.6 2.0
Southern Africa 10.3 8.7 1.7 1.4 10.3 0.2 0.3
Western Africa 39.7 27.3 2.8 3.8 17.6 0.3 1.0
The Americas 408.3 83.2 74.3 41.5 412.7 16.2 52.9
Caribbean 11.3 5.0 2.6 1.2 18.7 0.2 0.7
Central America 24.9 18.8 4.8 3.9 19.0 2.0 2.8
South America 115.9 45.0 12.2 12.8 114.7 5.0 9.7
Northern America 256.2 14.4 54.7 23.5 260.3 9.0 39.8
Asia 651.0 284.8 131.8 111.9 196.2 15.1 81.4
Page 42 of 76
John Wiley & Sons, Inc.
International Journal of Cancer

Eastern Asia 277.1 78.0 89.4 48.3 118.6 4.3 61.5
South-Eastern Asia 107.5 50.6 15.3 19.9 26.5 2.6 4.9
South-Central Asia 223.9 151.8 20.0 38.4 29.3 5.9 10.4
Western Asia 42.5 4.5 7.1 5.2 21.8 2.3 4.6
Europe 464.2 58.4 99.0 65.6 417.1 21.5 71.8
Central and Eastern Europe 123.6 33.9 42.0 28.3 65.4 4.9 23.8
Northern Europe 78.2 5.4 13.8 10.0 81.7 3.6 9.5
Southern Europe 100.8 9.3 19.5 12.9 91.4 4.8 15.4
Western Europe 161.5 9.8 23.6 14.4 178.7 8.2 23.0
Oceania 19.3 2.2 3.1 2.0 26.1 1.0 2.7
Australia/New Zealand 17.6 0.9 2.8 1.7 25.3 1.0 2.7
Melanesia 1.4 1.2 0.3 0.3 0.5 0.0 0.0
Micronesia/Polynesia 0.4 0.1 0.1 0.0 0.4 0.0 0.0
Page 43 of 76
John Wiley & Sons, Inc.
International Journal of Cancer

Oesophagus Stomach Colorectum Liver Gallbladder
(C16) (C18-21) (C22) (C23-24)
F M F M F M F M F
132.8 631.3 320.3 746.3 614.3 554.4 228.1 76.8 101.3
18.4 175.1 99.4 398.9 338.0 92.0 42.3 27.8 34.8
114.4 456.2 220.9 347.4 276.3 462.4 185.8 49.1 66.5
11.5 13.2 10.6 21.2 19.9 38.7 20.0 1.6 3.0
7.5 4.4 3.7 6.2 6.2 4.6 3.4 0.4 1.0
0.7 1.4 1.4 1.5 1.8 3.7 2.1 0.0 0.0
1.2 3.4 2.3 6.8 6.1 13.8 5.9 0.9 1.6
1.7 1.4 0.7 2.6 2.3 1.4 0.9 0.1 0.1
0.3 2.8 2.4 4.0 3.6 15.4 7.7 0.2 0.3
9.6 51.7 33.6 125.1 120.6 40.3 22.9 9.7 16.1
0.3 1.9 1.4 3.9 4.6 1.4 1.2 0.2 0.3
0.5 7.2 6.4 6.0 5.6 4.7 5.1 0.8 1.8
4.9 27.2 16.7 33.0 34.5 10.0 8.0 4.1 8.2
3.9 15.3 9.2 82.3 75.9 24.2 8.6 4.7 5.9
100.3 480.4 219.6 347.5 259.7 430.7 163.7 53.2 63.8
66.9 384.3 168.6 243.2 178.2 342.2 124.2 38.2 41.7
2.9 21.3 12.3 38.5 30.5 58.5 21.5 3.6 3.6
28.5 64.6 31.7 50.7 39.0 25.8 15.6 10.2 17.2
2.0 10.1 7.0 15.1 12.0 4.3 2.5 1.3 1.3
10.8 84.2 55.4 241.8 205.3 42.8 20.6 11.9 17.9
2.6 41.1 28.6 70.3 69.5 9.5 6.5 3.4 6.6
3.5 7.2 4.5 35.3 29.9 4.2 2.3 0.8 1.4
1.1 18.3 12.1 60.0 45.0 14.1 6.4 3.6 4.5
3.6 17.6 10.3 76.2 60.9 15.0 5.5 4.1 5.4
0.6 1.8 1.0 10.7 8.8 1.9 0.8 0.4 0.5
0.5 1.6 0.9 10.3 8.5 1.4 0.6 0.4 0.4
0.0 0.2 0.2 0.3 0.2 0.5 0.3 0.0 0.0
0.0 0.0 0.0 0.1 0.1 0.0 0.0 0.0 0.0
Bladder Brain, cns Thyroid Hodgkin
(C67) (C70-72) (C73) (C81)
F M F M F M F M F
123.9 330.4 99.4 139.6 116.6 68.2 229.9 38.5 27.4
74.6 196.1 57.8 48.2 40.7 29.7 93.1 15.6 13.3
49.3 134.3 41.6 91.4 75.9 38.5 136.8 23.0 14.1
4.9 17.7 6.8 7.6 6.3 2.9 9.1 4.7 3.2
1.8 2.8 2.0 1.5 1.3 1.1 2.8 1.4 1.0
0.3 0.6 0.4 0.3 0.2 0.2 0.5 0.3 0.2
1.5 11.2 2.7 4.8 4.1 1.2 4.3 1.8 1.3
0.2 1.3 0.5 0.5 0.3 0.1 0.4 0.3 0.2
1.0 1.7 1.2 0.5 0.4 0.3 1.1 1.0 0.5
32.1 75.7 25.9 28.0 23.7 19.4 66.1 8.8 6.9
0.4 1.8 0.5 0.7 0.8 0.3 1.0 0.2 0.2
1.7 2.3 1.4 3.3 2.7 0.9 3.0 1.0 0.7
6.0 13.4 5.3 10.5 9.4 3.9 18.5 2.2 1.7
24.0 58.1 18.7 13.4 10.9 14.3 43.6 5.3 4.2
42.0 115.6 32.9 72.1 59.4 32.9 111.6 15.3 8.7
Page 44 of 76
John Wiley & Sons, Inc.
International Journal of Cancer

31.2 64.7 20.8 39.6 35.7 19.9 72.2 2.1 1.5
2.8 10.8 3.0 7.5 6.3 5.0 14.3 1.5 0.9
5.1 24.4 6.2 19.5 12.2 5.5 14.7 8.9 4.6
2.9 15.8 2.9 5.5 5.1 2.5 10.5 2.8 1.8
43.5 118.4 32.9 30.7 26.4 12.3 40.7 9.3 8.3
16.6 30.9 8.9 9.9 9.7 3.2 16.0 3.0 3.1
5.9 12.7 4.6 4.7 3.8 1.2 3.8 1.4 1.1
7.6 34.8 8.0 7.7 6.3 3.8 9.9 2.2 1.8
13.4 40.0 11.3 8.4 6.6 4.1 11.0 2.6 2.3
1.4 3.0 0.9 1.2 0.8 0.8 2.5 0.4 0.3
1.4 2.9 0.9 1.2 0.8 0.7 2.0 0.4 0.3
0.0 0.1 0.0 0.0 0.0 0.1 0.4 0.0 0.0
0.0 0.0 0.0 0.0 0.0 0.0 0.1 0.0 0.0
Page 45 of 76
John Wiley & Sons, Inc.
International Journal of Cancer
Pancreas Larynx Lung Melanoma Kaposi sarcoma
(C25) (C32) (C33-34) (C43) (C46)
M F M F M F M F M
178.2 159.7 138.1 18.8 1241.6 583.1 120.6 111.5 29.0
94.7 92.8 50.7 7.0 490.3 267.9 99.4 91.7 2.6
83.5 66.9 87.4 11.8 751.3 315.2 21.3 19.8 26.4
6.6 5.5 7.6 1.1 21.8 8.6 2.8 3.8 23.8
1.2 1.6 1.9 0.3 3.1 2.0 0.7 1.3 19.8
0.4 0.3 0.4 0.1 0.6 0.3 0.4 0.7 0.5
2.5 1.5 3.2 0.3 11.9 2.6 0.2 0.3 0.2
1.0 0.9 1.0 0.2 4.8 2.6 0.9 1.0 2.2
1.5 1.2 1.1 0.1 1.4 1.0 0.5 0.6 1.1
37.0 38.1 25.0 5.0 177.9 146.4 50.3 38.0 2.6
1.0 1.0 1.8 0.2 6.0 3.5 0.2 0.2 0.1
2.5 2.9 2.7 0.4 6.9 3.9 1.4 1.1 0.1
9.5 10.7 9.8 1.5 39.5 24.7 5.7 5.3 1.3
23.9 23.4 10.7 2.8 125.5 114.2 43.0 31.5 1.0
80.7 62.7 68.8 8.7 742.7 303.0 11.6 10.2 1.0
61.0 46.4 23.9 2.2 556.1 240.4 6.4 5.7 0.3
6.4 5.9 6.9 1.4 74.0 31.0 1.3 1.0 0.1
9.3 7.5 32.4 4.4 80.9 24.8 2.3 1.8 0.2
4.0 2.9 5.6 0.8 31.7 6.7 1.6 1.6 0.4
52.0 51.9 36.0 3.9 290.9 119.3 47.3 53.2 1.5
17.8 16.9 15.3 1.2 107.0 31.7 8.6 11.8 0.2
6.9 7.3 2.9 0.6 33.5 26.7 11.2 12.1 0.2
11.5 11.5 9.6 0.9 69.9 21.8 9.3 10.0 0.9
15.7 16.2 8.1 1.3 80.6 39.2 18.2 19.3 0.2
1.9 1.6 0.7 0.1 8.4 5.8 8.6 6.4 0.1
1.8 1.6 0.7 0.1 7.8 5.5 8.5 6.2 0.1
0.1 0.0 0.1 0.0 0.3 0.2 0.1 0.1 0.0
0.0 0.0 0.0 0.0 0.2 0.1 0.0 0.0 0.0
NHL Multiple myeloma Leukaemia All sites but C44
(C82-85,C96) (C88+C90) (C91-95) (C00-97/C44)
M F M F M F M F
217.6 168.1 62.5 51.8 200.7 151.3 7427.1 6663.0
101.9 88.5 36.5 31.5 80.3 61.0 3243.5 2832.4
115.8 79.6 26.0 20.3 120.4 90.3 4183.6 3830.6
21.1 15.7 3.0 2.9 13.3 10.7 362.0 484.9
7.0 4.8 0.9 1.0 4.9 4.1 116.8 170.5
2.2 1.8 0.3 0.3 1.1 0.8 30.3 43.8
6.4 4.8 1.1 0.9 5.0 3.7 105.8 114.8
1.3 1.2 0.4 0.4 0.8 0.7 39.9 43.0
4.2 3.0 0.3 0.3 1.5 1.3 69.2 112.9
54.3 45.3 17.2 14.4 41.2 32.9 1453.7 1428.7
1.1 0.9 0.5 0.5 1.1 0.9 48.3 42.5
3.1 2.5 0.9 0.7 4.4 3.9 87.3 110.3
11.8 9.7 3.7 3.3 10.3 8.7 397.5 410.2
38.3 32.1 12.2 9.9 25.5 19.5 920.6 865.7
89.4 60.6 20.6 15.2 97.3 70.2 3694.9 3068.2
Page 46 of 76
John Wiley & Sons, Inc.
International Journal of Cancer

41.5 30.1 10.5 7.4 47.6 34.0 2431.5 1713.5
15.3 11.3 2.3 2.2 13.8 12.0 382.9 403.5
25.2 13.6 5.9 4.0 28.9 19.2 711.8 802.3
7.5 5.6 2.0 1.6 7.0 5.0 168.7 148.9
49.6 43.9 20.5 18.4 46.4 35.9 1830.5 1611.7
8.8 9.3 3.2 4.0 13.2 11.7 513.8 523.1
9.8 8.3 3.9 3.1 7.3 5.2 271.6 254.2
12.7 10.4 5.1 4.6 11.2 8.1 430.5 338.7
18.3 15.9 8.4 6.7 14.8 10.8 614.7 495.7
3.3 2.6 1.1 0.8 2.5 1.7 86.0 69.4
3.0 2.4 1.1 0.8 2.3 1.5 81.0 62.4
0.2 0.2 0.0 0.0 0.2 0.1 4.0 6.1
0.0 0.0 0.0 0.0 0.0 0.0 1.1 1.0
Page 47 of 76
John Wiley & Sons, Inc.
International Journal of Cancer

Kaposi sarcoma
F
15.2
0.7
14.5
13.7
11.1
0.2
0.1
1.4
0.9
0.5
0.0
0.0
0.3
0.2
0.5
0.1
0.1
0.1
0.2
0.6
0.2
0.0
0.3
0.1
0.0
0.0
0.0
0.0
Page 48 of 76
John Wiley & Sons, Inc.
International Journal of Cancer

Estimated numbers of cancer deaths (thousands) by sex, cancer site and regions, 2012
Oral cavity Nasopharynx Other pharynx
(C00-08) (C11) (C09-10,C12-14)
M F M F M F
World 97.9 47.4 35.8 15.1 77.6 18.5
More developed regions 23.4 9.9 2.3 1.1 21.4 4.1
Less developed regions 74.5 37.5 33.5 14.0 56.2 14.4
Africa 6.1 4.3 3.5 2.1 2.6 1.5
Eastern Africa 2.8 1.9 1.3 0.9 0.8 0.5
Middle Africa 0.9 0.5 0.4 0.2 0.5 0.2
Northern Africa 1.0 0.7 1.2 0.5 0.5 0.5
Southern Africa 0.5 0.2 0.0 0.0 0.4 0.1
Western Africa 1.0 0.9 0.6 0.3 0.4 0.1
The Americas 8.5 4.3 1.1 0.5 8.4 2.2
Caribbean 0.5 0.2 0.1 0.0 0.6 0.2
Central America 0.5 0.4 0.1 0.0 0.5 0.2
South America 4.2 1.8 0.4 0.2 4.2 0.9
Northern America 3.3 1.9 0.6 0.3 3.1 1.0
Asia 65.0 32.4 29.7 11.7 51.0 12.1
Eastern Asia 12.2 6.2 15.9 6.1 7.9 1.4
South-Eastern Asia 5.0 3.5 10.0 4.2 5.4 1.5
South-Central Asia 46.9 22.0 3.1 1.1 37.2 8.9
Western Asia 0.9 0.6 0.7 0.3 0.5 0.3
Europe 17.6 6.0 1.4 0.7 15.2 2.7
Central and Eastern Europe 10.1 2.4 0.6 0.4 7.3 0.9
Northern Europe 1.4 0.8 0.1 0.1 1.1 0.4
Southern Europe 2.7 1.3 0.4 0.2 2.3 0.4
Western Europe 3.4 1.5 0.3 0.1 4.5 1.0
Oceania 0.7 0.5 0.1 0.0 0.3 0.1
Australia/New Zealand 0.3 0.2 0.0 0.0 0.3 0.1
Melanesia 0.3 0.3 0.0 0.0 0.1 0.0
Micronesia/Polynesia 0.0 0.0 0.0 0.0 0.0 0.0
Breast Cervix uteriCorpus uteriOvary Prostate Testis
(C50) (C53) (C54) (C56) (C61) (C62)
F F F F M M
World 521.8 265.7 76.2 151.9 307.5 10.4
More developed regions 197.5 35.5 34.7 65.9 142.0 2.2
Less developed regions 324.3 230.2 41.4 86.0 165.5 8.1
Africa 63.2 60.1 4.0 13.1 42.8 0.9
Eastern Africa 17.0 28.2 1.2 4.5 13.9 0.3
Middle Africa 6.0 7.9 0.5 1.2 5.9 0.1
Northern Africa 15.6 2.7 0.8 3.5 5.0 0.3
Southern Africa 4.0 4.7 0.5 1.0 3.8 0.1
Western Africa 20.5 16.5 1.1 2.9 14.3 0.2
The Americas 92.1 35.7 13.6 28.5 85.4 2.0
Caribbean 3.9 2.3 0.9 0.8 8.0 0.0
Central America 7.3 6.9 1.3 2.6 9.0 0.5
Page 49 of 76
John Wiley & Sons, Inc.
International Journal of Cancer

South America 32.0 19.4 3.7 8.1 34.4 0.9
Northern America 48.9 7.1 7.8 17.0 34.1 0.5
Asia 231.0 144.4 34.2 66.2 82.7 5.8
Eastern Asia 68.5 36.3 20.8 21.9 37.6 1.0
South-Eastern Asia 43.0 24.0 4.4 13.0 15.8 1.2
South-Central Asia 104.7 82.2 7.2 27.8 18.9 2.8
Western Asia 14.8 1.9 1.8 3.5 10.4 0.8
Europe 131.3 24.4 23.7 42.7 92.3 1.6
Central and Eastern Europe 48.7 15.4 10.7 16.8 25.9 0.9
Northern Europe 17.8 1.9 2.9 6.6 18.1 0.1
Southern Europe 27.5 3.5 4.6 7.8 20.2 0.3
Western Europe 37.2 3.5 5.5 11.5 28.1 0.3
Oceania 4.3 1.1 0.6 1.4 4.3 0.0
Australia/New Zealand 3.6 0.4 0.4 1.2 3.9 0.0
Melanesia 0.6 0.7 0.1 0.2 0.3 0.0
Micronesia/Polynesia 0.1 0.0 0.0 0.0 0.1 0.0
Page 50 of 76
John Wiley & Sons, Inc.
International Journal of Cancer

Oesophagus Stomach Colorectum Liver Gallbladder
(C15) (C16) (C18-21) (C22) (C23-24)
M F M F M F M F M
281.2 118.9 468.9 254.1 373.6 320.3 521.0 224.5 60.3
56.1 15.2 106.7 68.0 175.4 157.7 80.4 42.6 19.0
225.1 103.7 362.3 186.1 198.2 162.5 440.6 181.8 41.3
14.7 10.5 12.0 9.8 15.1 14.3 37.0 19.0 1.5
8.9 6.9 4.1 3.5 4.6 4.6 4.3 3.2 0.3
1.1 0.6 1.3 1.3 1.2 1.4 3.5 2.0 0.0
1.7 1.2 3.0 2.1 4.4 3.9 13.1 5.6 0.8
2.3 1.6 0.9 0.7 1.8 1.5 1.3 0.8 0.1
0.6 0.3 2.6 2.3 3.1 2.8 14.8 7.4 0.2
27.0 8.0 39.1 26.0 57.1 55.1 34.7 23.2 5.9
1.0 0.3 1.6 1.1 2.2 2.7 1.4 1.2 0.1
1.1 0.4 6.1 5.4 3.3 3.1 4.5 4.8 0.7
10.8 3.7 23.2 14.0 18.3 19.0 10.4 8.9 3.4
14.2 3.6 8.2 5.5 33.2 30.3 18.4 8.2 1.7
208.0 90.7 353.1 174.0 185.0 146.6 407.7 159.2 44.9
155.3 59.9 266.3 128.3 115.5 92.2 322.9 121.0 31.8
8.5 2.7 18.6 10.6 24.1 19.1 55.8 20.5 3.1
41.9 26.4 59.6 29.0 37.0 28.4 24.9 15.2 8.9
2.3 1.8 8.6 6.0 8.4 6.9 4.0 2.5 1.1
30.3 9.2 63.6 43.7 113.2 101.6 39.9 22.3 7.9
9.9 2.1 34.3 24.0 42.5 41.9 10.8 7.6 2.7
6.9 3.1 4.9 3.2 14.2 12.6 3.9 2.4 0.6
4.1 1.0 13.8 9.3 27.1 21.0 12.2 6.4 2.6
9.4 2.9 10.6 7.3 29.4 26.1 13.0 5.9 2.0
1.2 0.5 1.1 0.6 3.2 2.7 1.7 0.8 0.2
1.1 0.4 0.9 0.5 2.9 2.5 1.2 0.6 0.1
0.1 0.0 0.1 0.1 0.2 0.1 0.4 0.2 0.0
0.0 0.0 0.0 0.0 0.0 0.0 0.1 0.0 0.0
Kidney Bladder Brain, cns Thyroid Hodgkin
(C64-66) (C67) (C70-72) (C73) (C81)
M F M F M F M F M
90.8 52.6 123.0 42.0 106.4 83.0 12.6 27.1 15.5
47.9 27.0 58.9 21.0 36.8 29.8 3.7 6.7 3.6
42.9 25.6 64.1 21.0 69.6 53.2 9.0 20.4 11.9
4.2 4.0 9.4 3.9 5.4 4.6 1.5 4.0 2.8
1.2 1.6 1.8 1.3 1.2 1.0 0.6 1.5 0.9
0.3 0.3 0.4 0.3 0.2 0.2 0.1 0.3 0.2
1.5 1.1 5.5 1.3 3.2 2.7 0.5 1.5 1.0
0.3 0.2 0.5 0.2 0.4 0.3 0.0 0.1 0.1
0.8 0.9 1.1 0.8 0.4 0.3 0.2 0.6 0.6
17.8 10.2 20.4 8.4 20.2 16.8 1.9 3.4 2.1
0.3 0.2 0.8 0.3 0.6 0.6 0.1 0.1 0.1
1.5 1.0 0.9 0.5 1.8 1.5 0.3 0.6 0.4
Page 51 of 76
John Wiley & Sons, Inc.
International Journal of Cancer

5.3 3.0 5.4 2.3 7.8 7.0 0.6 1.5 0.7
10.7 6.0 13.3 5.3 10.1 7.7 0.9 1.2 0.8
36.8 20.3 52.8 16.5 55.2 40.5 7.1 15.3 7.9
23.7 13.1 27.3 10.2 31.5 23.7 3.1 4.9 0.8
3.4 1.9 5.4 1.5 5.2 4.3 1.8 4.7 0.8
6.9 3.5 13.4 3.4 15.0 9.3 1.6 4.2 5.0
2.8 1.8 6.8 1.3 3.5 3.3 0.6 1.5 1.3
31.3 17.7 39.5 12.9 24.6 20.4 2.1 4.3 2.6
11.7 6.9 13.2 3.5 8.5 7.9 0.8 2.3 1.3
4.1 2.6 5.2 2.4 3.6 2.7 0.2 0.4 0.3
5.9 3.0 11.7 3.0 5.9 4.8 0.5 0.8 0.6
9.6 5.3 9.5 4.0 6.5 5.1 0.5 0.8 0.5
0.8 0.4 1.0 0.4 1.0 0.7 0.1 0.2 0.1
0.7 0.4 0.9 0.4 0.9 0.7 0.1 0.1 0.1
0.0 0.0 0.0 0.0 0.0 0.0 0.0 0.1 0.0
0.0 0.0 0.0 0.0 0.0 0.0 0.0 0.0 0.0
Page 52 of 76
John Wiley & Sons, Inc.
International Journal of Cancer

Gallbladder Pancreas Larynx Lung Melanoma
(C25) (C32) (C33-34) (C43)
F M F M F M F M F
82.5 173.8 156.6 73.3 10.1 1098.6 491.2 31.4 24.1
25.8 93.1 91.3 22.7 2.7 416.6 209.8 21.3 15.0
56.6 80.7 65.3 50.6 7.5 682.0 281.4 10.1 9.1
2.8 6.4 5.3 4.3 0.6 19.4 7.7 1.5 2.1
0.9 1.2 1.5 1.2 0.2 2.8 1.8 0.5 0.8
0.0 0.4 0.3 0.3 0.1 0.5 0.3 0.3 0.5
1.5 2.4 1.5 1.5 0.1 10.6 2.4 0.1 0.2
0.1 0.9 0.9 0.5 0.1 4.3 2.3 0.3 0.2
0.3 1.5 1.1 0.8 0.1 1.2 0.9 0.4 0.4
11.3 36.5 37.3 11.7 2.1 149.5 112.9 9.9 5.8
0.2 1.0 1.0 0.9 0.1 5.6 3.3 0.1 0.1
1.6 2.4 2.8 1.0 0.2 6.2 3.5 0.4 0.3
6.9 9.9 10.8 6.2 1.0 35.3 20.8 2.0 1.5
2.6 23.2 22.7 3.5 0.8 102.4 85.3 7.4 3.9
55.1 76.7 60.6 39.0 5.7 668.8 267.3 6.4 5.4
35.7 58.0 45.1 12.4 1.9 501.7 211.1 4.0 3.4
3.2 6.2 5.7 3.3 0.7 65.8 27.8 0.7 0.5
15.1 8.6 7.0 20.8 2.7 73.0 22.5 1.1 0.9
1.2 3.9 2.8 2.4 0.4 28.4 5.9 0.6 0.5
13.0 52.6 51.9 18.1 1.7 254.6 99.1 12.1 10.2
5.3 18.1 17.0 9.8 0.6 95.7 26.3 3.9 4.0
1.1 7.0 7.3 1.2 0.2 29.5 22.8 2.3 1.7
3.6 11.5 11.2 4.4 0.4 61.3 18.3 2.3 1.7
3.0 16.1 16.4 2.8 0.5 68.1 31.7 3.6 2.8
0.2 1.6 1.5 0.3 0.1 6.3 4.3 1.5 0.7
0.2 1.5 1.5 0.2 0.0 5.8 4.1 1.4 0.6
0.0 0.1 0.0 0.0 0.0 0.3 0.1 0.1 0.1
0.0 0.0 0.0 0.0 0.0 0.2 0.1 0.0 0.0
NHL Multiple myeloma Leukaemia All sites but C44
(C82-85,C96) (C88+C90) (C91-95) (C00-97/C44)
F M F M F M F M F
10.0 115.4 84.2 43.1 36.9 151.3 114.1 4653.1 3547.9
2.7 40.8 34.3 22.3 20.7 51.3 40.3 1591.2 1286.7
7.3 74.5 50.0 20.8 16.2 100.0 73.8 3061.9 2261.2
2.0 15.0 11.4 2.6 2.5 11.6 9.5 277.8 313.3
0.7 5.1 3.7 0.8 0.9 4.4 3.7 92.4 116.1
0.1 1.7 1.4 0.3 0.3 1.0 0.8 25.6 31.2
0.7 4.3 3.2 0.9 0.7 4.2 3.1 77.0 66.5
0.1 0.9 0.8 0.3 0.4 0.7 0.6 25.1 25.9
0.4 3.1 2.3 0.3 0.3 1.3 1.2 57.8 73.6
1.6 22.0 17.8 11.4 9.6 27.8 22.1 676.6 618.2
0.1 0.6 0.5 0.4 0.4 0.8 0.7 29.5 23.7
0.3 1.7 1.5 0.7 0.6 3.1 2.8 53.9 56.8
Page 53 of 76
John Wiley & Sons, Inc.
International Journal of Cancer

0.5 6.2 5.0 3.0 2.7 8.2 6.9 230.5 209.0
0.6 13.5 10.9 7.3 6.0 15.6 11.7 362.8 328.7
4.4 56.9 36.6 16.3 12.2 81.0 57.3 2689.5 1810.1
0.6 24.6 16.3 8.0 5.9 39.8 27.1 1756.1 1002.2
0.5 10.4 7.6 1.8 1.8 11.7 10.2 290.2 238.3
2.5 17.6 9.5 5.1 3.4 24.0 16.0 533.0 490.4
0.8 4.4 3.2 1.4 1.2 5.5 3.9 110.1 79.2
2.0 20.3 17.5 12.2 12.1 29.5 24.3 976.6 779.2
1.0 5.1 4.6 2.4 2.9 8.6 7.9 351.2 287.0
0.2 3.5 3.0 2.4 2.1 4.1 3.1 129.0 115.5
0.4 5.0 4.2 3.1 3.1 7.6 5.8 227.6 162.8
0.3 6.7 5.8 4.3 4.0 9.2 7.5 268.7 213.9
0.1 1.1 0.9 0.6 0.5 1.3 0.9 32.5 27.1
0.0 0.9 0.7 0.6 0.5 1.1 0.8 29.0 23.0
0.0 0.2 0.1 0.0 0.0 0.2 0.1 2.9 3.7
0.0 0.0 0.0 0.0 0.0 0.0 0.0 0.6 0.4
Page 54 of 76
John Wiley & Sons, Inc.
International Journal of Cancer

Kaposi sarcoma
(C46)
M F
17.4 9.6
0.3 0.1
17.1 9.5
16.3 9.2
13.9 7.5
0.4 0.2
0.1 0.1
1.2 0.9
0.8 0.6
0.4 0.1
0.0 0.0
0.0 0.0
0.2 0.1
0.1 0.0
0.5 0.3
0.1 0.1
0.1 0.1
0.1 0.1
0.2 0.1
0.2 0.1
0.1 0.0
0.0 0.0
0.1 0.1
0.0 0.0
0.0 0.0
0.0 0.0
0.0 0.0
0.0 0.0
Page 55 of 76
John Wiley & Sons, Inc.
International Journal of Cancer

Estimated cumulative risk to age 75 (percent) by sex, cancer site and regions, 2012 – Incidence
Oral cavity Nasopharynx Other pharynx Oesophagus
(C00-08) (C11) (C09-10,C12-14) (C15)
M F M F M F M
World 0.6 0.3 0.2 0.1 0.4 0.1 1.1
More developed regions 0.8 0.3 0.1 0.0 0.6 0.1 0.8
Less developed regions 0.6 0.3 0.2 0.1 0.3 0.1 1.2
Africa 0.4 0.2 0.2 0.1 0.1 0.1 0.7
Eastern Africa 0.5 0.3 0.2 0.1 0.1 0.1 1.4
Middle Africa 0.4 0.2 0.1 0.1 0.2 0.1 0.5
Northern Africa 0.3 0.2 0.2 0.1 0.1 0.1 0.3
Southern Africa 0.7 0.3 0.0 0.0 0.4 0.2 1.6
Western Africa 0.2 0.2 0.1 0.0 0.1 0.0 0.1
The Americas 0.7 0.3 0.1 0.0 0.4 0.1 0.7
Caribbean 0.6 0.2 0.1 0.0 0.4 0.1 0.5
Central America 0.3 0.2 0.0 0.0 0.1 0.0 0.2
South America 0.6 0.3 0.1 0.0 0.3 0.1 0.8
Northern America 0.9 0.3 0.1 0.0 0.5 0.1 0.7
Asia 0.6 0.3 0.2 0.1 0.4 0.1 1.3
Eastern Asia 0.3 0.1 0.3 0.1 0.2 0.0 2.0
South-Eastern Asia 0.4 0.3 0.7 0.3 0.3 0.1 0.4
South-Central Asia 1.1 0.6 0.1 0.0 0.8 0.2 0.8
Western Asia 0.3 0.2 0.1 0.1 0.1 0.0 0.3
Europe 0.9 0.3 0.1 0.0 0.6 0.1 0.7
Central and Eastern Europe 1.1 0.2 0.1 0.0 0.6 0.1 0.7
Northern Europe 0.7 0.3 0.1 0.0 0.4 0.1 1.0
Southern Europe 0.7 0.2 0.1 0.0 0.4 0.1 0.4
Western Europe 0.9 0.4 0.1 0.0 0.9 0.2 0.8
Oceania 1.1 0.6 0.1 0.0 0.4 0.1 0.6
Australia/New Zealand 0.9 0.4 0.1 0.0 0.4 0.1 0.6
Melanesia 2.8 1.9 0.0 0.0 0.6 0.0 0.5
Micronesia/Polynesia 0.6 0.1 0.3 0.2 0.3 0.0 0.3
Breast Cervix uteriCorpus uteriOvary Prostate Testis Kidney
(C50) (C53) (C54) (C56) (C61) (C62) (C64-66)
F F F F M M M
World 4.6 1.4 1.0 0.7 3.8 0.1 0.7
More developed regions 8.0 0.9 1.8 1.0 8.8 0.4 1.5
Less developed regions 3.3 1.6 0.6 0.5 1.6 0.1 0.4
Africa 3.7 3.0 0.4 0.5 2.8 0.0 0.1
Eastern Africa 3.2 4.6 0.4 0.6 2.8 0.0 0.1
Middle Africa 2.8 3.4 0.4 0.4 3.5 0.0 0.1
Northern Africa 4.4 0.7 0.4 0.6 1.2 0.1 0.3
Southern Africa 4.1 3.1 0.8 0.5 7.3 0.1 0.2
Western Africa 3.9 3.2 0.4 0.4 2.9 0.0 0.1
The Americas 7.4 1.4 1.5 0.8 9.4 0.2 1.1
Caribbean 4.9 2.0 1.3 0.5 9.4 0.1 0.3
Central America 3.5 2.3 0.8 0.5 3.3 0.2 0.5
South America 5.6 2.0 0.7 0.6 7.1 0.2 0.6
Northern America 10.0 0.6 2.3 0.9 12.3 0.4 1.8
Asia 3.0 1.3 0.7 0.5 1.0 0.1 0.4
Page 56 of 76
John Wiley & Sons, Inc.
International Journal of Cancer

Eastern Asia 2.8 0.7 0.9 0.5 1.1 0.0 0.6
South-Eastern Asia 3.7 1.7 0.6 0.7 1.3 0.1 0.2
South-Central Asia 2.9 2.1 0.3 0.5 0.5 0.1 0.2
Western Asia 4.5 0.5 0.9 0.6 3.5 0.1 0.6
Europe 7.6 1.1 1.7 1.1 8.2 0.4 1.4
Central and Eastern Europe 5.3 1.5 1.9 1.3 3.9 0.2 1.5
Northern Europe 9.6 0.8 1.8 1.2 10.6 0.5 1.3
Southern Europe 7.7 0.8 1.6 1.0 7.6 0.4 1.3
Western Europe 10.2 0.7 1.5 0.9 12.1 0.6 1.6
Oceania 8.4 0.9 1.5 0.9 12.4 0.4 1.3
Australia/New Zealand 9.1 0.5 1.5 0.9 13.6 0.5 1.5
Melanesia 4.1 3.2 1.2 0.8 2.7 0.0 0.1
Micronesia/Polynesia 6.2 1.0 1.4 0.6 8.5 0.0 0.4
Page 57 of 76
John Wiley & Sons, Inc.
International Journal of Cancer

Oesophagus Stomach Colorectum Liver Gallbladder
(C16) (C18-21) (C22) (C23-24)
F M F M F M F M F
0.3 2.0 0.8 2.4 1.6 1.7 0.6 0.2 0.3
0.1 1.9 0.8 4.3 2.7 1.0 0.3 0.3 0.2
0.4 2.0 0.9 1.5 1.1 2.0 0.7 0.2 0.3
0.4 0.5 0.4 0.8 0.7 1.4 0.7 0.1 0.1
0.9 0.6 0.5 0.9 0.7 0.5 0.4 0.0 0.1
0.2 0.5 0.5 0.6 0.6 1.2 0.6 0.0 0.0
0.2 0.5 0.3 1.0 0.8 2.2 0.8 0.1 0.2
0.8 0.8 0.3 1.6 1.0 0.7 0.4 0.1 0.1
0.0 0.4 0.3 0.5 0.4 1.8 0.9 0.0 0.0
0.2 1.1 0.6 2.6 2.0 0.9 0.4 0.2 0.3
0.2 0.9 0.6 1.9 1.9 0.7 0.5 0.1 0.1
0.1 1.2 0.9 1.0 0.8 0.8 0.8 0.1 0.3
0.2 1.7 0.8 2.0 1.6 0.6 0.4 0.3 0.4
0.1 0.6 0.3 3.4 2.5 1.1 0.3 0.2 0.2
0.5 2.6 1.0 1.9 1.2 2.2 0.7 0.3 0.3
0.6 4.0 1.5 2.5 1.6 3.4 1.1 0.3 0.3
0.1 1.0 0.5 1.8 1.2 2.5 0.8 0.2 0.2
0.5 1.1 0.5 0.8 0.6 0.4 0.2 0.2 0.3
0.2 1.4 0.9 2.1 1.4 0.6 0.3 0.2 0.2
0.1 1.6 0.7 4.5 2.7 0.8 0.3 0.2 0.2
0.1 2.5 1.1 4.3 2.6 0.6 0.2 0.2 0.2
0.3 0.9 0.4 4.2 2.9 0.5 0.2 0.1 0.1
0.1 1.4 0.6 4.7 2.8 1.1 0.3 0.2 0.2
0.2 1.0 0.5 4.7 2.8 1.0 0.3 0.2 0.2
0.2 0.8 0.4 4.8 3.3 0.9 0.3 0.2 0.2
0.2 0.8 0.3 5.2 3.6 0.8 0.2 0.2 0.2
0.2 0.9 0.6 1.4 0.7 1.6 0.8 0.2 0.1
0.0 1.1 0.3 2.3 1.5 1.3 0.1 0.1 0.1
Bladder Brain, cns Thyroid Hodgkin
(C67) (C70-72) (C73) (C81)
F M F M F M F M F
0.3 1.0 0.2 0.4 0.3 0.2 0.6 0.1 0.1
0.7 2.0 0.4 0.6 0.4 0.4 1.1 0.2 0.2
0.2 0.6 0.2 0.3 0.3 0.1 0.4 0.1 0.0
0.1 0.8 0.2 0.2 0.2 0.1 0.3 0.1 0.1
0.1 0.4 0.2 0.1 0.1 0.1 0.3 0.1 0.1
0.1 0.3 0.2 0.1 0.1 0.1 0.1 0.1 0.0
0.2 1.8 0.4 0.6 0.4 0.2 0.4 0.2 0.1
0.1 0.8 0.2 0.2 0.1 0.1 0.2 0.1 0.1
0.1 0.3 0.1 0.0 0.0 0.0 0.1 0.1 0.0
0.6 1.5 0.4 0.5 0.4 0.4 1.2 0.2 0.1
0.2 0.9 0.2 0.3 0.3 0.1 0.4 0.1 0.1
0.3 0.4 0.2 0.4 0.3 0.1 0.4 0.1 0.1
0.3 0.8 0.2 0.6 0.4 0.2 0.8 0.1 0.1
0.9 2.2 0.6 0.6 0.4 0.7 1.9 0.2 0.2
0.2 0.6 0.1 0.3 0.3 0.2 0.5 0.1 0.0
Page 58 of 76
John Wiley & Sons, Inc.
International Journal of Cancer

0.3 0.6 0.2 0.4 0.3 0.2 0.7 0.0 0.0
0.1 0.5 0.1 0.3 0.2 0.2 0.4 0.1 0.0
0.1 0.4 0.1 0.2 0.1 0.1 0.2 0.1 0.1
0.3 2.3 0.4 0.6 0.5 0.3 0.9 0.2 0.1
0.7 2.1 0.4 0.6 0.4 0.3 0.8 0.2 0.2
0.7 1.9 0.3 0.6 0.4 0.2 0.7 0.2 0.1
0.7 1.4 0.4 0.7 0.5 0.2 0.5 0.2 0.2
0.5 2.5 0.4 0.7 0.5 0.4 0.9 0.2 0.2
0.8 2.3 0.5 0.6 0.4 0.3 0.8 0.2 0.2
0.6 1.1 0.3 0.6 0.3 0.4 1.1 0.2 0.1
0.7 1.2 0.3 0.7 0.4 0.4 1.1 0.2 0.2
0.1 0.4 0.1 0.1 0.0 0.2 1.1 0.1 0.0
0.1 0.7 0.1 0.1 0.0 0.3 1.2 0.0 0.0
Page 59 of 76
John Wiley & Sons, Inc.
International Journal of Cancer

Pancreas Larynx Lung Melanoma Kaposi sarcoma
(C25) (C32) (C33-34) (C43) (C46)
M F M F M F M F M
0.6 0.4 0.5 0.1 3.9 1.5 0.4 0.3 0.1
1.0 0.7 0.6 0.1 5.4 2.4 1.1 0.9 0.0
0.4 0.3 0.4 0.1 3.3 1.2 0.1 0.1 0.1
0.3 0.2 0.3 0.0 0.9 0.3 0.1 0.1 0.5
0.2 0.2 0.3 0.1 0.5 0.3 0.1 0.2 1.4
0.2 0.1 0.2 0.0 0.2 0.1 0.2 0.3 0.1
0.4 0.2 0.5 0.1 1.9 0.4 0.0 0.1 0.0
0.6 0.4 0.6 0.1 3.1 1.2 0.6 0.4 0.6
0.3 0.1 0.2 0.0 0.2 0.1 0.1 0.1 0.1
0.8 0.6 0.6 0.1 3.8 2.7 1.0 0.6 0.0
0.5 0.4 1.0 0.1 3.1 1.6 0.1 0.1 0.0
0.4 0.4 0.5 0.1 1.2 0.6 0.2 0.1 0.0
0.6 0.5 0.6 0.1 2.5 1.3 0.3 0.2 0.1
1.0 0.8 0.5 0.1 5.4 4.3 1.8 1.2 0.0
0.4 0.3 0.4 0.1 3.8 1.3 0.1 0.0 0.0
0.6 0.4 0.3 0.0 5.3 2.0 0.1 0.1 0.0
0.3 0.2 0.3 0.1 3.5 1.3 0.1 0.0 0.0
0.2 0.1 0.6 0.1 1.5 0.4 0.0 0.0 0.0
0.6 0.4 0.8 0.1 4.6 0.9 0.2 0.2 0.1
1.0 0.6 0.8 0.1 5.7 1.8 0.9 0.9 0.0
1.1 0.6 1.0 0.1 6.7 1.3 0.5 0.5 0.0
0.9 0.7 0.4 0.1 4.2 3.0 1.5 1.5 0.0
0.9 0.6 0.9 0.1 5.6 1.5 0.8 0.8 0.1
1.0 0.7 0.6 0.1 5.4 2.4 1.3 1.3 0.0
0.8 0.5 0.4 0.0 3.7 2.5 3.8 2.7 0.0
0.9 0.6 0.4 0.0 3.8 2.7 4.4 3.1 0.0
0.3 0.1 0.4 0.1 1.9 0.7 0.3 0.5 0.0
0.4 0.2 0.2 0.0 5.4 2.3 0.5 0.2 0.0
NHL Multiple myeloma Leukaemia All sites but C44
(C82-85,C96) (C88+C90) (C91-95) (C00-97/C44)
M F M F M F M F
0.6 0.4 0.2 0.2 0.5 0.4 21.0 16.4
1.1 0.8 0.4 0.3 0.9 0.5 30.9 23.3
0.4 0.3 0.1 0.1 0.4 0.3 16.6 13.4
0.6 0.4 0.1 0.1 0.3 0.3 12.3 13.4
0.6 0.3 0.2 0.1 0.4 0.3 12.6 15.6
0.4 0.3 0.2 0.1 0.3 0.2 10.3 11.6
0.8 0.6 0.2 0.1 0.5 0.4 14.2 12.8
0.5 0.4 0.2 0.2 0.4 0.3 21.6 15.8
0.4 0.2 0.1 0.1 0.1 0.1 8.3 11.3
1.1 0.8 0.4 0.3 0.7 0.5 26.8 22.5
0.5 0.4 0.3 0.2 0.4 0.3 21.9 16.8
0.4 0.3 0.2 0.1 0.5 0.4 13.0 14.2
0.6 0.5 0.2 0.2 0.5 0.4 21.3 17.8
1.6 1.1 0.5 0.4 1.0 0.7 33.9 28.3
0.4 0.3 0.1 0.1 0.4 0.3 17.5 13.2
Page 60 of 76
John Wiley & Sons, Inc.
International Journal of Cancer

0.4 0.3 0.1 0.1 0.5 0.3 21.8 14.5
0.6 0.4 0.1 0.1 0.4 0.3 15.6 13.5
0.3 0.2 0.1 0.1 0.3 0.2 10.8 10.7
0.8 0.6 0.3 0.2 0.6 0.4 20.5 15.2
1.0 0.6 0.4 0.3 0.9 0.5 30.3 22.3
0.5 0.4 0.2 0.2 0.8 0.5 27.2 19.6
1.3 0.9 0.5 0.3 0.9 0.6 29.8 25.5
1.1 0.7 0.4 0.3 0.8 0.5 29.8 21.2
1.2 0.9 0.5 0.3 0.9 0.6 34.1 25.4
1.5 1.1 0.5 0.3 1.0 0.6 32.9 25.2
1.6 1.1 0.5 0.3 1.1 0.7 35.0 26.3
0.8 0.5 0.2 0.1 0.5 0.3 16.5 17.4
0.7 0.3 0.2 0.1 0.6 0.2 23.4 16.6
Page 61 of 76
John Wiley & Sons, Inc.
International Journal of Cancer

Kaposi sarcoma
F
0.0
0.0
0.0
0.2
0.7
0.1
0.0
0.4
0.0
0.0
0.0
0.0
0.0
0.0
0.0
0.0
0.0
0.0
0.0
0.0
0.0
0.0
0.0
0.0
0.0
0.0
0.0
0.0
Page 62 of 76
John Wiley & Sons, Inc.
International Journal of Cancer

Estimated cumulative risk to age 75 (percent) by sex, cancer site and regions, 2012 – Mortality
Oral cavity Nasopharynx Other pharynx
(C00-08) (C11) (C09-10,C12-14)
M F M F M F
World 0.3 0.1 0.1 0.0 0.3 0.1
More developed regions 0.3 0.1 0.0 0.0 0.3 0.0
Less developed regions 0.3 0.2 0.2 0.1 0.3 0.1
Africa 0.2 0.2 0.1 0.1 0.1 0.1
Eastern Africa 0.4 0.2 0.2 0.1 0.1 0.1
Middle Africa 0.3 0.2 0.1 0.1 0.2 0.1
Northern Africa 0.2 0.1 0.2 0.1 0.1 0.1
Southern Africa 0.3 0.1 0.0 0.0 0.3 0.1
Western Africa 0.1 0.1 0.1 0.0 0.1 0.0
The Americas 0.2 0.1 0.0 0.0 0.2 0.0
Caribbean 0.2 0.1 0.0 0.0 0.3 0.1
Central America 0.1 0.1 0.0 0.0 0.1 0.0
South America 0.3 0.1 0.0 0.0 0.3 0.0
Northern America 0.1 0.1 0.0 0.0 0.1 0.0
Asia 0.3 0.2 0.2 0.1 0.3 0.1
Eastern Asia 0.1 0.1 0.2 0.1 0.1 0.0
South-Eastern Asia 0.2 0.1 0.4 0.2 0.2 0.1
South-Central Asia 0.7 0.4 0.1 0.0 0.6 0.1
Western Asia 0.1 0.1 0.1 0.0 0.1 0.0
Europe 0.4 0.1 0.0 0.0 0.3 0.0
Central and Eastern Europe 0.6 0.1 0.0 0.0 0.5 0.0
Northern Europe 0.2 0.1 0.0 0.0 0.2 0.0
Southern Europe 0.2 0.1 0.0 0.0 0.2 0.0
Western Europe 0.2 0.1 0.0 0.0 0.3 0.1
Oceania 0.3 0.2 0.0 0.0 0.2 0.0
Australia/New Zealand 0.2 0.1 0.0 0.0 0.2 0.0
Melanesia 1.8 1.2 0.0 0.0 0.5 0.0
Micronesia/Polynesia 0.2 0.0 0.1 0.1 0.1 0.0
Breast Cervix uteriCorpus uteriOvary Prostate Testis
(C50) (C53) (C54) (C56) (C61) (C62)
F F F F M M
World 1.4 0.8 0.2 0.4 0.6 0.0
More developed regions 1.6 0.3 0.3 0.6 0.8 0.0
Less developed regions 1.2 0.9 0.2 0.3 0.6 0.0
Africa 1.8 2.0 0.2 0.4 1.5 0.0
Eastern Africa 1.7 3.1 0.2 0.5 1.7 0.0
Middle Africa 1.6 2.6 0.2 0.4 2.5 0.0
Northern Africa 1.9 0.4 0.1 0.5 0.6 0.0
Southern Africa 1.7 1.9 0.2 0.4 2.2 0.0
Western Africa 2.1 2.1 0.2 0.3 1.7 0.0
The Americas 1.5 0.6 0.2 0.5 1.1 0.0
Caribbean 1.7 0.9 0.4 0.3 2.7 0.0
Central America 1.1 1.0 0.2 0.4 1.0 0.1
Page 63 of 76
John Wiley & Sons, Inc.
International Journal of Cancer

South America 1.5 0.9 0.2 0.4 1.4 0.0
Northern America 1.6 0.3 0.3 0.6 0.8 0.0
Asia 1.1 0.7 0.2 0.3 0.3 0.0
Eastern Asia 0.6 0.3 0.2 0.2 0.2 0.0
South-Eastern Asia 1.6 0.9 0.2 0.5 0.6 0.0
South-Central Asia 1.5 1.2 0.1 0.4 0.3 0.0
Western Asia 1.7 0.2 0.2 0.4 1.3 0.1
Europe 1.8 0.4 0.3 0.6 1.0 0.0
Central and Eastern Europe 1.9 0.6 0.4 0.7 1.3 0.1
Northern Europe 1.7 0.2 0.3 0.7 1.1 0.0
Southern Europe 1.6 0.3 0.3 0.5 0.7 0.0
Western Europe 1.8 0.2 0.2 0.6 0.9 0.0
Oceania 1.6 0.5 0.2 0.6 1.0 0.0
Australia/New Zealand 1.5 0.2 0.2 0.5 0.9 0.0
Melanesia 2.1 2.2 0.4 0.7 1.4 0.0
Micronesia/Polynesia 1.5 0.5 0.3 0.3 1.5 0.0
Page 64 of 76
John Wiley & Sons, Inc.
International Journal of Cancer

Oesophagus Stomach Colorectum Liver Gallbladder
(C15) (C16) (C18-21) (C22) (C23-24)
M F M F M F M F M
0.9 0.3 1.4 0.6 1.0 0.7 1.6 0.6 0.2
0.6 0.1 1.0 0.4 1.6 0.9 0.8 0.3 0.2
1.0 0.4 1.5 0.7 0.8 0.6 1.8 0.7 0.2
0.6 0.4 0.5 0.3 0.6 0.5 1.3 0.6 0.1
1.3 0.9 0.6 0.4 0.6 0.5 0.5 0.3 0.0
0.5 0.2 0.5 0.4 0.4 0.4 1.1 0.6 0.0
0.3 0.2 0.4 0.3 0.6 0.5 2.1 0.8 0.1
1.5 0.7 0.6 0.3 1.1 0.6 0.7 0.3 0.1
0.1 0.0 0.4 0.3 0.4 0.3 1.6 0.8 0.0
0.6 0.1 0.8 0.4 1.1 0.8 0.7 0.4 0.1
0.5 0.1 0.8 0.4 1.0 1.0 0.7 0.5 0.1
0.2 0.1 1.0 0.7 0.6 0.4 0.7 0.7 0.1
0.7 0.2 1.4 0.6 1.1 0.8 0.6 0.4 0.2
0.6 0.1 0.3 0.2 1.2 0.8 0.8 0.3 0.1
1.1 0.4 1.8 0.7 0.9 0.6 2.0 0.7 0.2
1.5 0.4 2.5 0.9 0.9 0.6 3.1 1.0 0.3
0.4 0.1 0.8 0.4 1.1 0.7 2.4 0.8 0.2
0.7 0.4 1.0 0.4 0.6 0.4 0.4 0.2 0.2
0.3 0.2 1.2 0.7 1.2 0.8 0.6 0.3 0.2
0.6 0.1 1.1 0.5 1.8 1.0 0.7 0.2 0.1
0.6 0.1 2.0 0.8 2.4 1.4 0.7 0.3 0.2
0.8 0.2 0.5 0.2 1.4 0.9 0.5 0.2 0.1
0.3 0.1 0.9 0.4 1.7 0.9 0.9 0.3 0.2
0.6 0.1 0.5 0.3 1.4 0.8 0.8 0.2 0.1
0.5 0.1 0.4 0.2 1.2 0.8 0.8 0.3 0.1
0.6 0.1 0.4 0.2 1.3 0.9 0.6 0.2 0.1
0.4 0.2 0.8 0.5 0.9 0.6 1.5 0.8 0.2
0.3 0.0 0.9 0.3 1.0 0.6 1.3 0.2 0.0
Kidney Bladder Brain, cns Thyroid Hodgkin
(C64-66) (C67) (C70-72) (C73) (C81)
M F M F M F M F M
0.3 0.1 0.3 0.1 0.3 0.2 0.0 0.1 0.0
0.5 0.2 0.4 0.1 0.4 0.3 0.0 0.0 0.0
0.2 0.1 0.3 0.1 0.3 0.2 0.0 0.1 0.0
0.1 0.1 0.4 0.1 0.2 0.1 0.1 0.2 0.1
0.1 0.1 0.3 0.2 0.1 0.1 0.1 0.3 0.1
0.1 0.1 0.2 0.1 0.1 0.1 0.1 0.1 0.1
0.2 0.1 0.9 0.2 0.4 0.3 0.1 0.2 0.1
0.2 0.1 0.3 0.1 0.2 0.1 0.0 0.1 0.0
0.1 0.1 0.2 0.1 0.0 0.0 0.0 0.1 0.1
0.4 0.2 0.3 0.1 0.4 0.3 0.0 0.1 0.0
0.2 0.1 0.3 0.1 0.3 0.3 0.0 0.0 0.0
0.3 0.2 0.1 0.1 0.3 0.2 0.1 0.1 0.1
Page 65 of 76
John Wiley & Sons, Inc.
International Journal of Cancer

0.3 0.1 0.3 0.1 0.4 0.3 0.0 0.1 0.0
0.4 0.2 0.3 0.1 0.4 0.3 0.0 0.0 0.0
0.2 0.1 0.2 0.1 0.3 0.2 0.0 0.1 0.0
0.2 0.1 0.2 0.1 0.3 0.2 0.0 0.0 0.0
0.2 0.1 0.2 0.1 0.2 0.2 0.1 0.2 0.0
0.1 0.1 0.2 0.1 0.2 0.1 0.0 0.1 0.1
0.4 0.2 1.0 0.2 0.4 0.3 0.1 0.2 0.2
0.6 0.2 0.5 0.1 0.5 0.3 0.0 0.1 0.1
0.7 0.3 0.7 0.1 0.5 0.3 0.1 0.1 0.1
0.5 0.2 0.4 0.1 0.5 0.3 0.0 0.0 0.0
0.4 0.1 0.6 0.1 0.5 0.3 0.0 0.0 0.1
0.5 0.2 0.4 0.1 0.5 0.3 0.0 0.0 0.0
0.3 0.1 0.3 0.1 0.4 0.3 0.0 0.1 0.0
0.3 0.2 0.3 0.1 0.5 0.3 0.0 0.0 0.0
0.1 0.1 0.2 0.1 0.1 0.0 0.2 0.7 0.1
0.1 0.1 0.1 0.1 0.0 0.1 0.0 0.0 0.0
Page 66 of 76
John Wiley & Sons, Inc.
International Journal of Cancer

Gallbladder Pancreas Larynx Lung Melanoma
(C25) (C32) (C33-34) (C43)
F M F M F M F M F
0.2 0.5 0.4 0.2 0.0 3.3 1.2 0.1 0.1
0.1 1.0 0.6 0.3 0.0 4.3 1.7 0.2 0.1
0.2 0.3 0.3 0.2 0.0 2.9 1.0 0.0 0.0
0.1 0.3 0.2 0.2 0.0 0.8 0.3 0.1 0.1
0.1 0.2 0.2 0.2 0.0 0.4 0.2 0.1 0.1
0.0 0.2 0.1 0.2 0.0 0.2 0.1 0.1 0.2
0.2 0.4 0.2 0.2 0.0 1.7 0.3 0.0 0.0
0.1 0.6 0.4 0.3 0.1 2.8 1.1 0.2 0.1
0.0 0.3 0.1 0.1 0.0 0.2 0.1 0.1 0.1
0.2 0.7 0.6 0.3 0.0 3.0 1.9 0.2 0.1
0.1 0.5 0.4 0.5 0.1 2.8 1.4 0.0 0.0
0.3 0.4 0.4 0.2 0.0 1.0 0.5 0.1 0.0
0.3 0.6 0.5 0.4 0.1 2.2 1.0 0.1 0.1
0.1 0.9 0.7 0.2 0.0 4.1 2.9 0.3 0.1
0.2 0.4 0.3 0.2 0.0 3.3 1.1 0.0 0.0
0.2 0.5 0.3 0.1 0.0 4.5 1.6 0.0 0.0
0.1 0.3 0.2 0.2 0.0 3.2 1.1 0.0 0.0
0.3 0.2 0.1 0.4 0.0 1.3 0.4 0.0 0.0
0.2 0.6 0.4 0.4 0.1 4.2 0.7 0.1 0.1
0.1 1.0 0.6 0.4 0.0 4.8 1.4 0.2 0.1
0.2 1.1 0.6 0.6 0.0 6.0 1.0 0.2 0.2
0.1 0.9 0.6 0.2 0.0 3.5 2.3 0.3 0.2
0.2 0.9 0.5 0.3 0.0 4.7 1.1 0.2 0.1
0.1 0.9 0.6 0.2 0.0 4.2 1.8 0.2 0.1
0.1 0.7 0.5 0.1 0.0 2.7 1.7 0.6 0.2
0.1 0.7 0.5 0.1 0.0 2.7 1.8 0.6 0.2
0.1 0.3 0.1 0.3 0.0 1.8 0.6 0.2 0.3
0.1 0.4 0.1 0.1 0.1 4.7 2.2 0.1 0.1
NHL Multiple myeloma Leukaemia All sites but C44
(C82-85,C96) (C88+C90) (C91-95) (C00-97/C44)
F M F M F M F M F
0.0 0.3 0.2 0.1 0.1 0.4 0.3 12.7 8.4
0.0 0.4 0.2 0.2 0.1 0.5 0.3 14.3 9.0
0.0 0.3 0.2 0.1 0.1 0.3 0.3 12.0 8.1
0.1 0.4 0.3 0.1 0.1 0.3 0.3 9.5 9.4
0.1 0.5 0.3 0.1 0.1 0.4 0.3 10.6 11.8
0.0 0.4 0.3 0.2 0.1 0.3 0.2 8.7 9.0
0.1 0.6 0.4 0.1 0.1 0.5 0.3 10.7 8.0
0.0 0.4 0.3 0.2 0.2 0.3 0.2 13.5 10.0
0.0 0.3 0.2 0.1 0.1 0.1 0.1 6.5 8.0
0.0 0.4 0.2 0.2 0.2 0.5 0.3 12.0 9.4
0.0 0.3 0.2 0.2 0.2 0.4 0.3 12.1 9.2
0.0 0.3 0.2 0.1 0.1 0.4 0.3 7.8 7.7
Page 67 of 76
John Wiley & Sons, Inc.
International Journal of Cancer
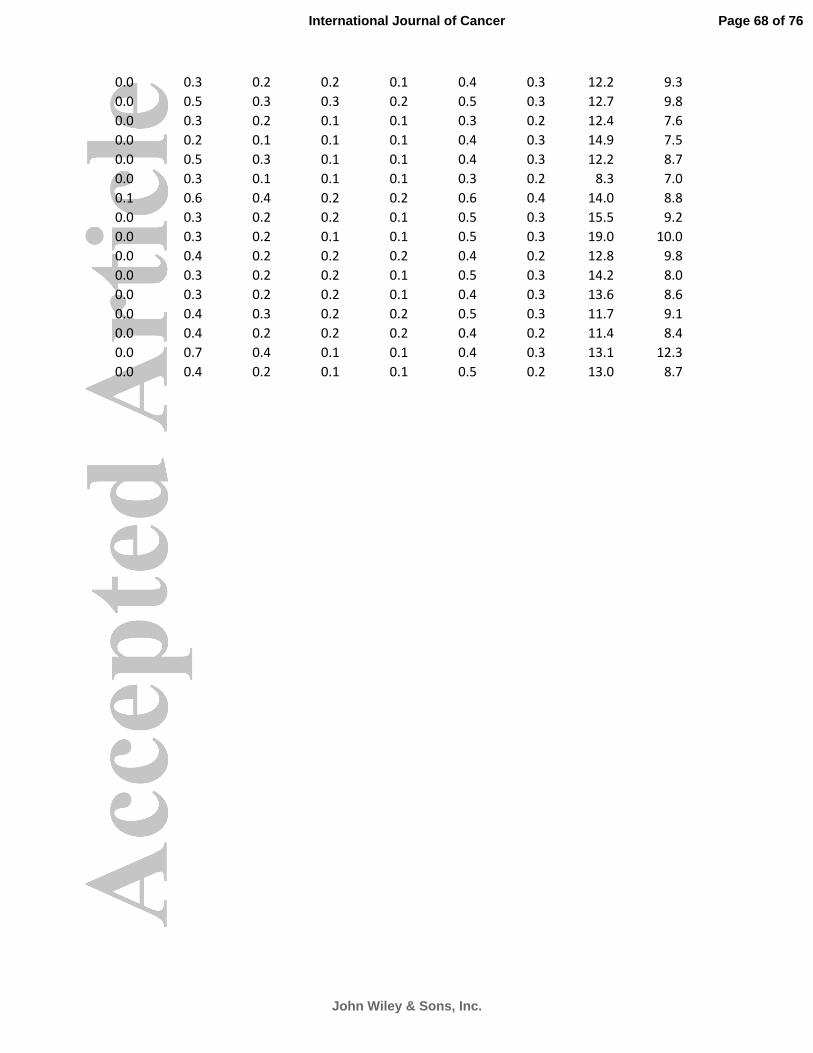
0.0 0.3 0.2 0.2 0.1 0.4 0.3 12.2 9.3
0.0 0.5 0.3 0.3 0.2 0.5 0.3 12.7 9.8
0.0 0.3 0.2 0.1 0.1 0.3 0.2 12.4 7.6
0.0 0.2 0.1 0.1 0.1 0.4 0.3 14.9 7.5
0.0 0.5 0.3 0.1 0.1 0.4 0.3 12.2 8.7
0.0 0.3 0.1 0.1 0.1 0.3 0.2 8.3 7.0
0.1 0.6 0.4 0.2 0.2 0.6 0.4 14.0 8.8
0.0 0.3 0.2 0.2 0.1 0.5 0.3 15.5 9.2
0.0 0.3 0.2 0.1 0.1 0.5 0.3 19.0 10.0
0.0 0.4 0.2 0.2 0.2 0.4 0.2 12.8 9.8
0.0 0.3 0.2 0.2 0.1 0.5 0.3 14.2 8.0
0.0 0.3 0.2 0.2 0.1 0.4 0.3 13.6 8.6
0.0 0.4 0.3 0.2 0.2 0.5 0.3 11.7 9.1
0.0 0.4 0.2 0.2 0.2 0.4 0.2 11.4 8.4
0.0 0.7 0.4 0.1 0.1 0.4 0.3 13.1 12.3
0.0 0.4 0.2 0.1 0.1 0.5 0.2 13.0 8.7
Page 68 of 76
John Wiley & Sons, Inc.
International Journal of Cancer

Kaposi sarcoma
(C46)
M F
0.1 0.0
0.0 0.0
0.1 0.0
0.5 0.2
1.5 0.6
0.1 0.1
0.0 0.0
0.4 0.2
0.0 0.0
0.0 0.0
0.0 0.0
0.0 0.0
0.0 0.0
0.0 0.0
0.0 0.0
0.0 0.0
0.0 0.0
0.0 0.0
0.0 0.0
0.0 0.0
0.0 0.0
0.0 0.0
0.0 0.0
0.0 0.0
0.0 0.0
0.0 0.0
0.0 0.0
0.0 0.0
Page 69 of 76
John Wiley & Sons, Inc.
International Journal of Cancer

Map showing the 20 world regions
226x176mm (115 x 115 DPI)
Page 70 of 76
John Wiley & Sons, Inc.
International Journal of Cancer

Map showing the availability of incidence data 226x176mm (115 x 115 DPI)
Page 71 of 76
John Wiley & Sons, Inc.
International Journal of Cancer

Map showing the availability of mortality data 226x176mm (115 x 115 DPI)
Page 72 of 76
John Wiley & Sons, Inc.
International Journal of Cancer

Estimated global numbers of new cases (thousands) with proportions for a) more developed and b) less developed regions, both sexes combined, 2012. The area of the pie is proportional to the number of new
cases.
247x288mm (115 x 115 DPI)
Page 73 of 76
John Wiley & Sons, Inc.
International Journal of Cancer

Estimated numbers (thousands) of new cancer cases (incidence) and deaths (mortality) in men in more developed and less developing regions of the world in 2012.
247x192mm (115 x 115 DPI)
Page 74 of 76
John Wiley & Sons, Inc.
International Journal of Cancer

Estimated numbers (thousands) of new cancer cases (incidence) and deaths (mortality) in women in more developed and less developing regions of the world in 2012.
249x193mm (115 x 115 DPI)
Page 75 of 76
John Wiley & Sons, Inc.
International Journal of Cancer

Estimated global numbers of new cases and deaths with proportions by world regions, both sexes combined,
2012. The area of the pie is proportional to the number of new cases or deaths. 163x91mm (106 x 106 DPI)
Page 76 of 76
John Wiley & Sons, Inc.
International Journal of Cancer

Figure B1. (a–c) Relationship between HDI and 5‐year relative survival: lung (both sexes), cervical and testicular cancers.
Figure B2. Estimated mortality from incidence in two countries (colorectal cancer, men)


![UvA-DARE (Digital Academic Repository) Biological modeling ... file184 References [1] Ferlay J, Soerjomataram I, Ervik M, et al. GLOBOCAN 2012 v1.0, Cancer Incidence and Mortality](https://img.pdfslide.us/doc/110x75/5d60f61a88c99356158b789a/uva-dare-digital-academic-repository-biological-modeling-references-1-ferlay.jpg)