Embed Size (px)
Citation preview
CANCER INCIDENCE AND MORTALITY DELAWARE, 2012‐2016
___________________________
Diane Ng, MPH, Research AnalystWilhelmina Ross, PA, MPH, CTR, Manager of DCR Operations
Delaware Cancer Registry, Division of Public Health Monday, October 12th 2020

Overview• All‐site cancer rates• Eight site‐specific cancers• Special section on Cancer Survivorship• Census tract analyses
o All‐site cancer incidence rates for Delaware’s 214 census tractso 18 census tracts with all‐site cancer incidence rates that were statistically
significantly higher than the statewide all‐site cancer incidence rateso Analysis and findings published in a separate report (available on the DPH
website)
2

ALL‐SITE CANCER INCIDENCE
3

2012‐2016 Incidence Facts• Total of 28,581 cases (average of 5,716 per year)• By sex
o Male – 51%o Female – 49%
• By race/ethnicityo Non‐Hispanic Caucasian – 78%o Non‐Hispanic African American – 17%o Hispanic – 3%
• By countyo New Castle County – 53%o Kent County – 18%o Sussex County – 29%
4

All‐Site Cancer Incidence; Delaware vs. U.S., 2012‐2016
• Delaware remained ranked 2nd highest nationally for cancer incidence (statistically significantly higher than the U.S. incidence rate)
o Delaware: 491.5 per 100,000o U.S.: 435.1 per 100,000
• Delaware males ranked 3rd highest for cancer incidence (statistically significantly higher than the male U.S. incidence rate)
o Delaware males: 542.9 per 100,000o U.S. males: 474.3 per 100,000
• Delaware females ranked 5th highest for cancer incidence (statistically significantly higher than the female U.S. incidence rate)
o Delaware females: 455.4 per 100,000o U.S. females: 409.6 per 100,000
5

Most Commonly Diagnosed Cancers in Delaware, 2012‐2016
MALES FEMALES
1. Prostate 3,749 26% 1. Breast 4,146 30%
2. Lung 2,103 14% 2. Lung 2,065 15%
3. Colorectal 1,135 8% 3. Colorectal 1,019 7%
4. Urinary bladder 1,125 8% 4. Uterine 972 7%
5. Melanoma 1,043 7% 5. Thyroid+ 645 5%
6. NHL 649 4% 6. Melanoma+ 665 5%
7. Kidney 639 4% 7. NHL 558 4%
8. Oral 529 4% 8. Pancreas 402 3%
9. Leukemia 483 3% 9. Kidney 351 3%
10. Pancreas 455 3% 10. Ovary 343 2%
6
+Thyroid cancer incidence rate is higher than melanoma incidence rate
0
100
200
300
400
500
600
700
80080
‐84
81‐85
82‐86
83‐87
84‐88
85‐89
86‐90
87‐91
88‐92
89‐93
90‐94
91‐95
92‐96
93‐97
94‐98
95‐99
96‐00
97‐01
98‐02
99‐03
00‐04
01‐05
02‐06
03‐07
04‐08
05‐09
06‐10
07‐11
08‐12
09‐13
10‐14
11‐15
12‐16
Rate/100
,000
of P
opulation
Year of Diagnosis
DE Male DE Female U.S. Male U.S. Female
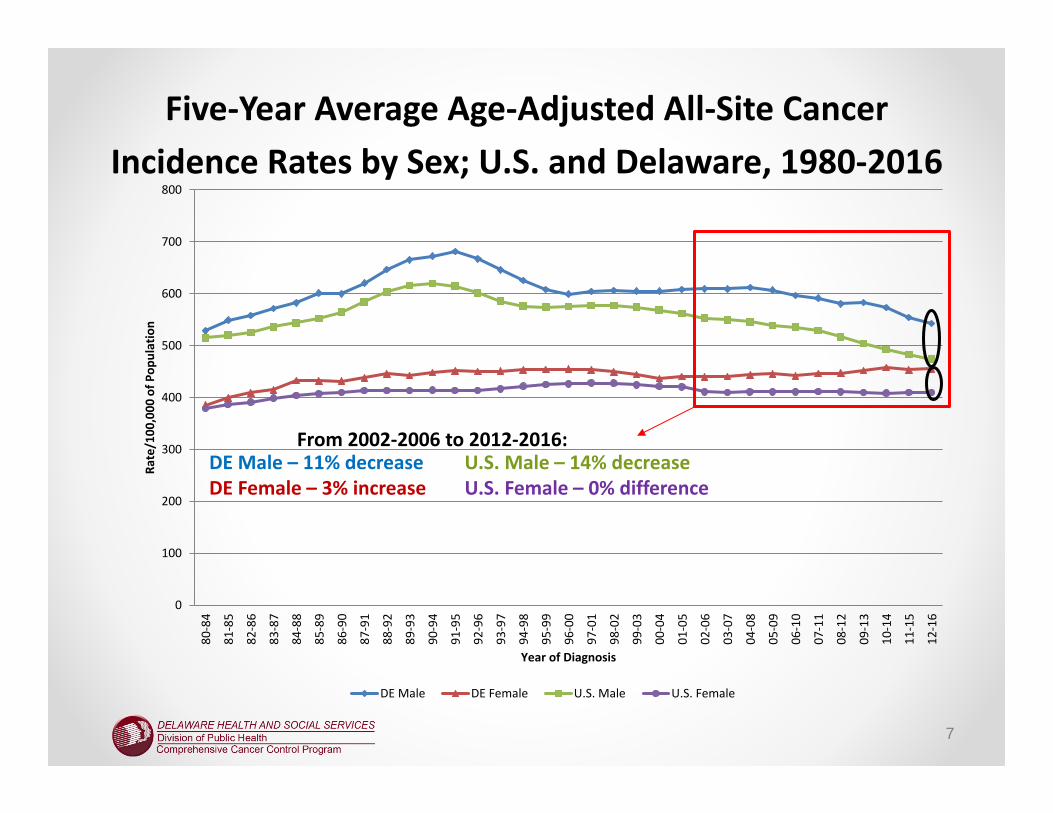
Five‐Year Average Age‐Adjusted All‐Site Cancer Incidence Rates by Sex; U.S. and Delaware, 1980‐2016
7
DE Male – 11% decreaseDE Female – 3% increase
U.S. Male – 14% decreaseU.S. Female – 0% difference
From 2002‐2006 to 2012‐2016:

Five‐Year Average Age‐Adjusted All‐Site Cancer Incidence Rates by Sex and Race/Ethnicity;
Delaware, 2002‐2016
8
0
100
200
300
400
500
600
700
80002
‐06
03‐07
04‐08
05‐09
06‐10
07‐11
08‐12
09‐13
10‐14
11‐15
12‐16
Rate/100
,000
of P
opulation
Year of Diagnosis
Non‐Hispanic Caucasian Male Non‐Hispanic Caucasian Female
Non‐Hispanic African American Male Non‐Hispanic African American Female
Hispanic Male Hispanic Female

ALL‐SITE CANCER MORTALITY
9

2012‐2016 Mortality Facts• Total of 9,945 deaths from cancer (average of 1,989 per year)• By sex
o Male – 52%o Female – 48%
• By race/ethnicityo Non‐Hispanic Caucasian – 80%o Non‐Hispanic African American – 17%o Hispanic – 2%
• By countyo New Castle County – 52%o Kent County – 19%o Sussex County – 29%
10

All‐Site Cancer Mortality; Delaware vs. U.S., 2012‐2016
• DE ranked 15th highest nationally for cancer mortality (statistically significantly higher than the U.S. mortality rate)
o Delaware: 174.0 per 100,000o U.S.: 161.1 per 100,000
• DE males ranked 18th highest for cancer mortality (statistically significantly higher than the male U.S. mortality rate)
o Delaware males: 206.8 per 100,000o U.S. males: 193.3 per 100,000
• DE females ranked 14th highest for cancer mortality (statistically significantly higher than the female U.S. mortality rate)
o Delaware females: 150.1 per 100,000o U.S. females: 137.8 per 100,000
• Non‐Hispanic Caucasians in DE had a statistically significantly highermortality rate than non‐Hispanic Caucasians in the U.S.
11

0
50
100
150
200
250
300
35080
‐84
81‐85
82‐86
83‐87
84‐88
85‐89
86‐90
87‐91
88‐92
89‐93
90‐94
91‐95
92‐96
93‐97
94‐98
95‐99
96‐00
97‐01
98‐02
99‐03
00‐04
01‐05
02‐06
03‐07
04‐08
05‐09
06‐10
07‐11
08‐12
09‐13
10‐14
11‐15
12‐16
Rate/100
,000
of P
opulation
Year of Death
DE Male DE Female U.S. Male U.S. Female
Five‐Year Average Age‐Adjusted All‐Site Cancer Mortality Rates by Sex; U.S. and Delaware, 1980‐2016
12
DE Male ‐ 15% decrease DE Female ‐ 7% decrease
U.S. Male – 16% decreaseU.S. Female – 13% decrease

Five‐Year Average Age‐Adjusted All‐Site Cancer Mortality Rates by Sex and Race/Ethnicity;
Delaware, 2002‐2016
13
0
50
100
150
200
250
300
35002
‐06
03‐07
04‐08
05‐09
06‐10
07‐11
08‐12
09‐13
10‐14
11‐15
12‐16
Rate/100
,000
of P
opulation
Year of Death
Non‐Hispanic Caucasian Male Non‐Hispanic Caucasian Female Non‐Hispanic African American Male
Non‐Hispanic African American Female Hispanic Male Hispanic Female

NOTABLE SITE‐SPECIFIC CANCER DETAILS
14

Improvements by Cancer Site• Breast
o Between 2002‐2006 and 2012‐2016, mortality rates for female breast cancer decreased by 6% in Delaware and 16% in the U.S.
o The difference in female breast cancer mortality rates between Delaware (ranked 20th nationally; 22.1 per 100,000) and the U.S. (20.6 per 100,000) was not statistically significant.
o The percent difference in mortality rate between non‐Hispanic African American (AA) women and non‐Hispanic Caucasians 40‐64 years of age decreased from 56% higher in non‐Hispanic AA women in 2010‐2014 to 29% higher in 2012‐2016.
• Colorectalo Between 2002‐2006 and 2012‐2016, incidence rates for colorectal cancer
decreased by 28% in Delaware and 22% in the U.S.o Between 2002‐2006 and 2012‐2016, mortality rates for colorectal cancer
decreased by 26% in Delaware and 22% in the U.S.o The percentage of colorectal cancer cases diagnosed at local stage has
increased from 36% in 2002‐2006 to 40% in 2012‐2016.
15

Improvements by Cancer Site
• Lungo A larger percentage of lung cancers were diagnosed at local stage in Delaware
(24%) than in the U.S. (20%).o Between 2011‐2015 and 2012‐2016, there was a decrease in percentage of
lung cancers diagnosed at distant stage from 52% to 50%.
• Melanomao Delaware's ranking in the U.S. for malignant melanoma mortality decreased
from 15th in 2011‐2015 to 18th in 2012‐2016. For males, the ranking decreased from 21st in 2011‐2015 to 25th in 2012‐2016.
• Prostateo Between 2002‐2006 and 2012‐2016, mortality rates for prostate cancer
decreased by 34% in Delaware and 26% in the U.S.
16

Cancers Sites with Statistically Significant Differences from the U.S.
Delaware Incidence Rate Statistically Significantly
Higher than U.S.
Delaware Incidence Rate Not Statistically Significantly Different
from U.S.All‐site Colorectal
Breast
Lung
Prostate
Melanoma
Non‐Hodgkin Lymphoma
Uterine
Thyroid
17

Cancer Sites with Dramatic Increases in Incidence from 2002‐2006 to 2012‐2016
Cancer SiteDelaware
Percent change 2002‐2006 to 2012‐2016
U.S. Percent change
2002‐2006 to 2012‐2016Melanoma +35% +17%
Thyroid +55% +51%
18
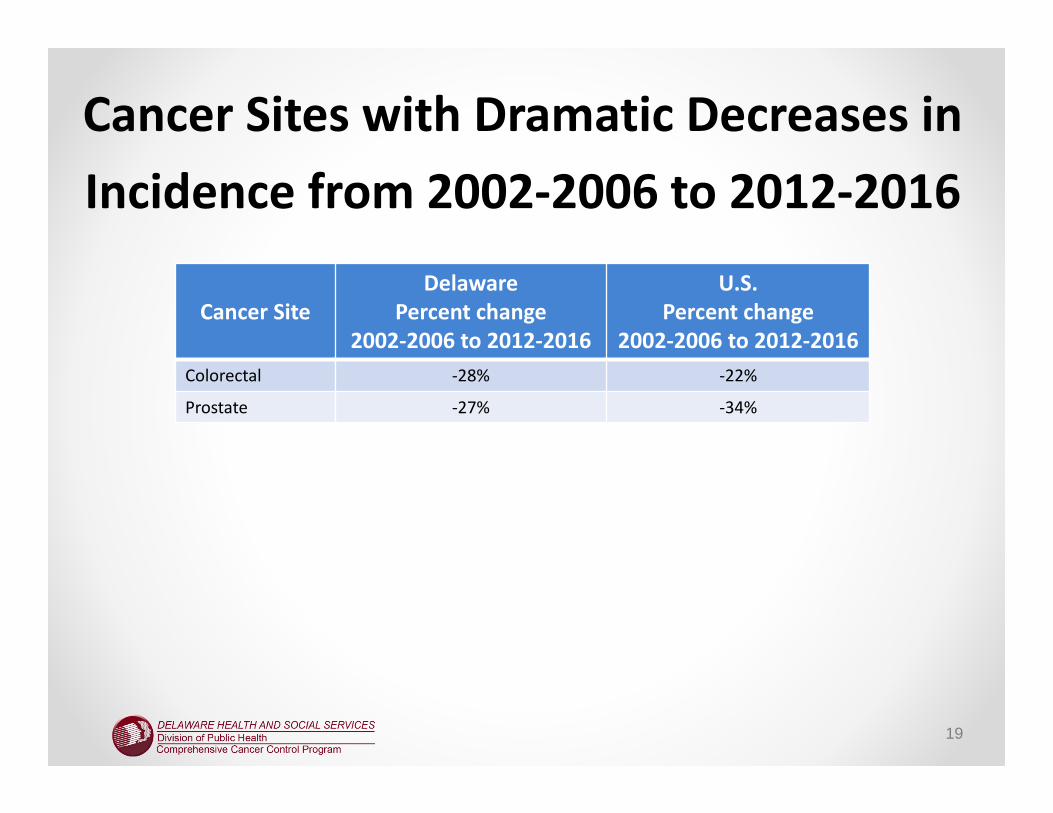
Cancer Sites with Dramatic Decreases in Incidence from 2002‐2006 to 2012‐2016
Cancer SiteDelaware
Percent change 2002‐2006 to 2012‐2016
U.S. Percent change
2002‐2006 to 2012‐2016Colorectal ‐28% ‐22%
Prostate ‐27% ‐34%
19

Cancer Sites with Dramatic Increases in Mortality from 2002‐2006 to 2012‐2016
Cancer SiteDelaware
Percent change 2002‐2006 to 2012‐2016
U.S. Percent change
2002‐2006 to 2012‐2016Uterine +32% +12%
20

Cancer Sites with Dramatic Decreases in Mortality from 2002‐2006 to 2012‐2016
Cancer SiteDelaware
Percent change 2002‐2006 to 2012‐2016
U.S. Percent change
2002‐2006 to 2012‐2016Colorectal ‐26% ‐22%
Lung ‐19% ‐22%
Prostate ‐34% ‐26%
Non‐Hodgkin Lymphoma ‐6% ‐21%
21

Cancer Survivorship in Delaware
• As of January 1, 2016, there were an estimated 50,760 cancer survivors in Delaware1
• According to the 2018 BRFSS, about 21% of the cancer survivors have more than one type of cancer2
• 50.5% of the survivors received a written summary of all their cancer treatment2
• 58% of the survivors received their survivorship health care through primary care physicians or internist2
• 98.6% of the survivors had health insurance (includes Medicare, Medicaid, or other types of state health programs) that paid for all or part of their cancer treatment2
1 American Cancer society. Cancer Treatment and Survivorship facts & figures 2016‐2017. Atlanta: American Cancer Society.2 Delaware Department of Health and Social Services, Division of Public Health, Delaware Behavioral Risk Factor Survey
(BRFS) Module, 2018.
22

Cancer Survivorship in Delaware
• Delaware continues to provide services and access to care to cancer survivors via the programs in the following areas:
o Cancer Screening and Prevention • Screening for Life• Delaware Tobacco Prevention and Control Programs
o Insurance and Treatment • The Health Care Connection (HCC)• Delaware's Cancer Treatment Program
o Follow‐up and Maintenance • Care coordinators• Cancer: Thriving and Surviving (CTS) program• Live Strong at the YMCA
23

Cancer Screening• The Behavioral Risk Factor Survey (BRFS) collects information
on cancer screening• Breast cancer – Delaware ranks 3rd nationally for
mammographyo 79% of Delaware females 40 and older were screened for breast cancer in the previous 2
years compared to 72% nationally
• Colorectal cancer – Delaware ranks 11th nationally for meeting USPSTF colorectal cancer screening
o 73% of Delawareans met the USPSTF recommendations compared to 70% nationally
• Prostate cancer – Delaware ranks 8th for PSA testso 38% of Delaware males 40 and older has a PSA test in the past 2 years compared to 33%
nationally
24

Cancer Prevention• Tobacco use is the leading risk factor
o In 2018, 17% of Delawareans were current smokers, almost the same as nationally (16%)o Contributes to many cancers including lung, esophagus, kidney, urinary bladder,
stomach, and pancreas
• Lack of physical activity and unhealthy eating are associated with increased risk of multiple cancers
• Alcohol abuse is a risk factor for many cancers• Excessive sun exposure is a risk factor for melanoma
25

26
Kent
Sussex
NewCastle
Kent
Sussex
NewCastle
Kent
Sussex
NewCastle
% Late Stage Disease0% ‐ 20%
21% ‐ 40%
41% ‐ 60%
61% ‐ 80%
81% ‐ 100%
OVERALL BREAST LUNGCOLORECTAL
*Note: maps for % late stage are not from 2012‐2016, but are used as an example

Summary• Delaware continues to have the second highest cancer incidence in
the nation even though incidence rates are declining.• Delaware mortality rates are decreasing even though Delaware
ranks 15th nationally for cancer mortality.• Cancer screening rates continue to be high in Delaware with an
increasing number of cancers being diagnosed at earlier, more treatable stages.
• Delaware cancer survivorship is increasing due to proper coordination and care between cancer specialists and primary care physicians.
o Delaware has available cancer programs and services that focus on the needs of cancer survivors that include screening and prevention, insurance, treatments, and survivorship programs that have goals in improving the cancer survivor’s health and quality of life.
• There need to be continued efforts to improve and enhance not only cancer screening, but also cancer prevention in Delaware by addressing behavioral risk factors and social determinants of health.
27

The full report can be found at
http://dhss.delaware.gov/dph/dpc/cancer.html
28

Discussion/Wrap Up
Helen Arthur, MHA
Section Chief, Health Promotion and Disease
Prevention, Division of Public Health
29

ADVANCING HEALTHY LIFESTYLES
• Healthy Lifestyles Subcommittee Update• Prevention work continues in DPH• COVID‐19 & Cancer Screenings• Achieving Health Equity• My Healthy Community Portal
30

31
HEALTHY LIFESTYLES SUBCOMMITTEE
Goals: To focus on impact and equity and stay focused on priority areas
Priority: Birth to age 18
Charge: Responsible for developing actionable policy recommendations to positively influence healthy lifestyles
Priority:Workplace Wellness
Priority: Broader policy approaches
For more information visit HealthyDelaware.org

PREVENTION EFFORTSPhysical Activity, Nutrition, Obesity Prevention (PANO) Program
Request For Proposal (RFP)ADVANCING HEALTHY LIFESTYLES: CHRONIC DISEASE, HEALTH EQUITY &
COVID‐19
• Goal: to reduce the prevalence of obesity and other chronic diseases by promoting healthy lifestyles and improving health outcomes for Delawareans
• Objectives: develop & Implement evidence‐based PSE strategies that will help Delawareans engage in regular physical activity, better nutrition, and make intentional lifestyle changes, lowering the risk of developing heart disease, cancer, chronic lower respiratory disease, diabetes, and other chronic diseases
32For more information visit bids.delaware.gov

33
COVID‐19 & CANCER SCREENINGS
0
50
100
150
200
250
300
350
400
Breast Cervical Colorectal
Screening for Life Cancer Screening Rates 2019 vs 2020
March ‐ June 2019 March‐ June 2020

ACHIEVING HEALTH EQUITYNational Stakeholder Strategy Goals
• Awareness• Leadership• Healthy System and Life
Experience• Cultural and Linguistic
Competency• Data, Research and Evaluation
34
Causes of Health Disparities
• Social determinants of health• Behavioral determinants of
health• Environmental determinants of
health• Biological and genetic
determinant of health
Community engagement Partnerships
Cultural & linguistic competency
Non‐discrimination

35
MY HEALTHY COMMUNITY PORTAL