Embed Size (px)
Citation preview

Cancer Incidence and Mortality in New Plymouth
Deborah Read Craig Wright
October 2005

Acknowledgements The authors would like to thank Dr Barry Borman, Public Health Intelligence, Ministry of Health and Professor Philip Weinstein, School of Population Health, University of Western Australia for their review of this report.
2
Contents Acknowledgements ...............................................................................................2 Executive Summary ..............................................................................................4 Study Aim ..................................................................................................................6 Introduction ...............................................................................................................6 Methods......................................................................................................................9 Results ......................................................................................................................12 Discussion ...............................................................................................................14 Appendix 1: New Plymouth urban area and Taranaki hospital board district 1974-1978 cancer mortality .................................................17 Appendix 2: Review of cancer mortality and incidence in relation to dioxin exposure................................................................................................18 Appendix 3: Summary of the results of Seveso studies - estimated risk (95% CI) .....................................................................................22 References..............................................................................................................23
3
Executive Summary From 1962 to 1987 the former agrichemical company Ivon Watkins-Dow Limited (IWD) manufactured the herbicide 2,4,5-trichlorophenoxyacetic acid (2,4,5-T) in Paritutu, New Plymouth. The carcinogen 2,3,7,8-tetrachlorodibenzo-p-dioxin (TCDD)1 is formed during the manufacture of trichlorophenol (TCP), an intermediate in 2,4,5-T manufacture, and remains as a contaminant in 2,4,5-T. In 2004 the mean serum TCDD level of non-occupationally exposed residents who lived in Paritutu during the manufacturing years was found to be significantly above the background level for the New Zealand population (Fowles et al, 2005). Given the potential residential exposure to TCDD, an epidemiological study was carried out to investigate whether the rates of four cancers (Hodgkin�s disease (HD), non-Hodgkin�s lymphoma (NHL), soft tissue sarcoma (STS), and chronic lymphocytic leukaemia (CLL)) associated with TCDD exposure, and all cancers are higher in New Plymouth than for the rest of New Zealand. The strongest evidence for the carcinogenicity of TCDD from overseas studies is for all cancers combined rather than for any specific site. From 1970 to 2001 there were 4,235 cancer deaths and 8,013 cancer registrations in New Plymouth and 192,379 cancer deaths and 367,570 cancer registrations in the rest of New Zealand. Non-Hodgkin�s lymphoma was the most common of the four specific cancers studied in New Plymouth with 138 deaths and 223 registrations. An 11% excess all cancer incidence, 75% excess NHL incidence and a 2.5 fold increase in CLL incidence was found for 1970-1974. This is the only time period that shows an elevated cancer risk for all cancers and at least one of the four specific cancers. Assuming a 10-year minimum latency period and the cause was TCDD, the period of exposure would have been 1960-1964, which is partially outside of the 2,4,5-T manufacturing period and before TCP was manufactured on site. Annual 2,4,5-T production was also low during 1962-1964 compared to other years when the level of TCDD in 2,4,5-T was the same. However the possibility of high levels of fugitive TCDD emissions during this time cannot be excluded. Whilst TCDD exposure in the first few years of 2,4,5-T manufacture may have had a role, unknown exposure(s) before the start of 2,4,5-T manufacture and chance are also possible explanations. The results do not suggest an increased cancer risk among the New Plymouth population related to the entire period of 2,4,5-T manufacture although the study�s limitations mean the possibility of an undetectable small elevation in cancer risk cannot be excluded. Over the 32 years covered by the study there is a slight downward trend for all cancer incidence and mortality among the New Plymouth population relative to the rest of New Zealand. Definite trends could not be observed for the specific cancers but the population size is small and few events were observed. Although increases were seen for CLL and NHL in two time periods the large confidence intervals resulting from a small number of cases makes it difficult to draw conclusions from the data. Misclassification bias is
1 TCDD is commonly known as dioxin.
4
also likely and pathological review of a subset of cases of the four specific cancers would be necessary to clarify its extent. The consequence of reclassification of a few cases is important in instances where results are based on small numbers. The ability to interpret these findings will be assisted by the findings of the current study of IWD workers, particularly the serum TCDD results, which will clarify the historic exposure of workers compared to that of nearby long term Paritutu residents.
5

Study Aim To investigate whether the rates of four cancers (STS, NHL, HD and CLL) associated with TCDD exposure and all cancers are higher in New Plymouth than for the rest of New Zealand. Introduction A cancer mortality atlas published in 1982 by the Department of Health using 1974-1978 mortality data found a higher rate of NHL (p<0.01) and suggestive higher rate of HD (p<0.1) among males in New Plymouth compared to the national average (Borman, 1982) (Appendix 1). At that time there was no scientific consensus of an association between lymphatic cancer and TCDD, nor was TCDD classified as a human carcinogen. Potential dioxin exposure in New Plymouth
The former agrichemical company, IWD, was located in New Plymouth from 1948. At its original site in Buller St, IWD formulated rather than manufactured products. In 1962 it transferred its activities to Paritutu Road (Figure 1). Figure 1: Location of the IWD plant
N
5.0 10.0
New Plymouth
Buller StreetPort Taranaki
345IWD Plant Paritutu Rd
New Zealand
Kilometres
6
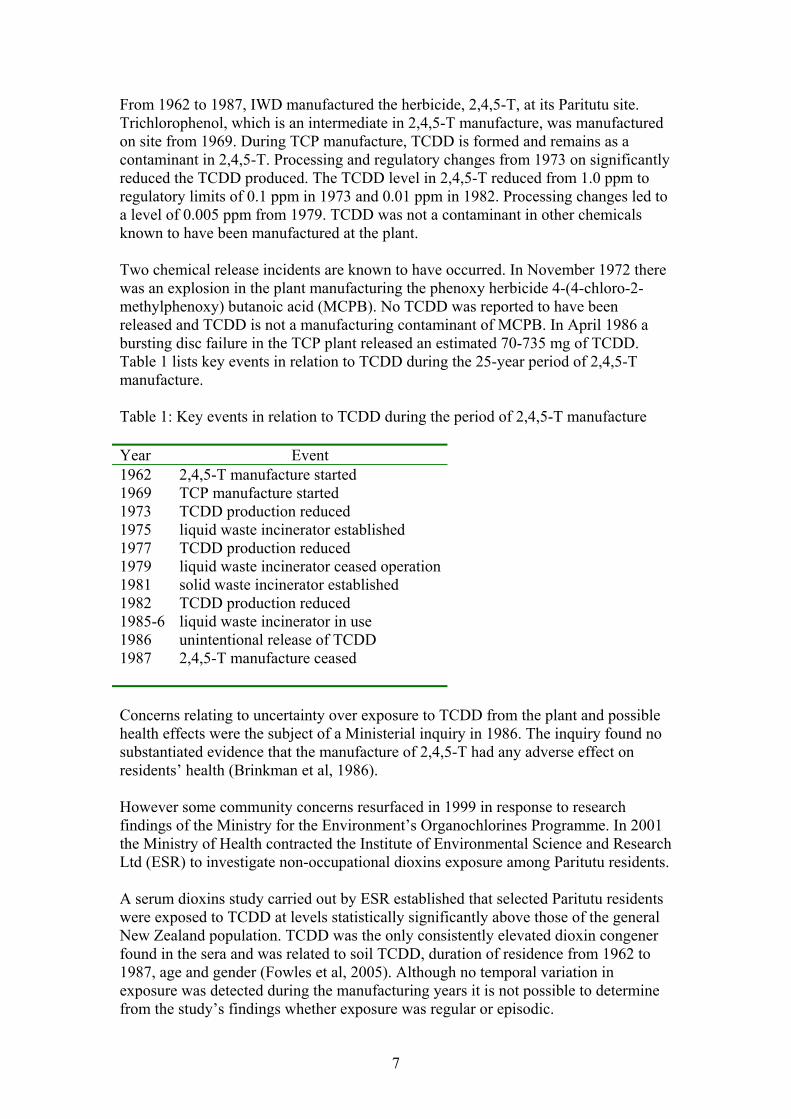
From 1962 to 1987, IWD manufactured the herbicide, 2,4,5-T, at its Paritutu site. Trichlorophenol, which is an intermediate in 2,4,5-T manufacture, was manufactured on site from 1969. During TCP manufacture, TCDD is formed and remains as a contaminant in 2,4,5-T. Processing and regulatory changes from 1973 on significantly reduced the TCDD produced. The TCDD level in 2,4,5-T reduced from 1.0 ppm to regulatory limits of 0.1 ppm in 1973 and 0.01 ppm in 1982. Processing changes led to a level of 0.005 ppm from 1979. TCDD was not a contaminant in other chemicals known to have been manufactured at the plant. Two chemical release incidents are known to have occurred. In November 1972 there was an explosion in the plant manufacturing the phenoxy herbicide 4-(4-chloro-2-methylphenoxy) butanoic acid (MCPB). No TCDD was reported to have been released and TCDD is not a manufacturing contaminant of MCPB. In April 1986 a bursting disc failure in the TCP plant released an estimated 70-735 mg of TCDD. Table 1 lists key events in relation to TCDD during the 25-year period of 2,4,5-T manufacture. Table 1: Key events in relation to TCDD during the period of 2,4,5-T manufacture Year Event 1962 1969 1973 1975 1977 1979 1981 1982 1985-6 1986 1987
2,4,5-T manufacture started TCP manufacture started TCDD production reduced liquid waste incinerator established TCDD production reduced liquid waste incinerator ceased operationsolid waste incinerator established TCDD production reduced liquid waste incinerator in use unintentional release of TCDD 2,4,5-T manufacture ceased
Concerns relating to uncertainty over exposure to TCDD from the plant and possible health effects were the subject of a Ministerial inquiry in 1986. The inquiry found no substantiated evidence that the manufacture of 2,4,5-T had any adverse effect on residents� health (Brinkman et al, 1986). However some community concerns resurfaced in 1999 in response to research findings of the Ministry for the Environment�s Organochlorines Programme. In 2001 the Ministry of Health contracted the Institute of Environmental Science and Research Ltd (ESR) to investigate non-occupational dioxins exposure among Paritutu residents. A serum dioxins study carried out by ESR established that selected Paritutu residents were exposed to TCDD at levels statistically significantly above those of the general New Zealand population. TCDD was the only consistently elevated dioxin congener found in the sera and was related to soil TCDD, duration of residence from 1962 to 1987, age and gender (Fowles et al, 2005). Although no temporal variation in exposure was detected during the manufacturing years it is not possible to determine from the study�s findings whether exposure was regular or episodic.
7

Peak production of 2,4,5-T with the highest TCDD contaminant level occurred from 1969 to 1972. Based on annual 2,4,5-T production volumes, the amount of TCDD in 2,4,5-T until 1973, the amount of TCDD in waste from 1969 to 1977, and introduction of the Clean Air Act 1972 in 1974 it had previously been assumed that the peak potential exposure would have been from 1962 to 1975, or from 1969, when on site TCP manufacture started, to 1975. Incineration of liquid waste occurred on site from 1975 to 1979, and in 1985 and 1986. In 1981 a solid waste incinerator was established and has operated intermittently since 1986. The highest TCDD emissions recorded for the plant were from the liquid waste incinerator. Whilst the incinerator would have contributed to residents� exposure from incineration of TCDD contaminated waste or from TCDD formation and release during incineration, historic fugitive aerial emissions are considered to be the primary source as TCDD concentrations are typically low in relation to other dioxin congeners when combustion is the primary source of dioxin (Fowles et al, 2005). Paritutu soil results (Pattle Delamore Partners, 2002) also support this conclusion. Disease associations with dioxin exposure
Large-scale human exposure to dioxin-contaminated herbicides occurred during the Vietnam War where Agent Orange, a 50-50 mix of 2,4,5-T and 2,4-dichlorophenoxyacetic acid (2,4-D), was sprayed between 1962 and 1971 to defoliate forest in South Vietnam. In 1976 an industrial incident exposed about 44,700 residents of Seveso, Italy to an estimated 34 kg of TCDD. This is the highest known non-occupational exposure to TCDD. Subsequently epidemiological studies of Vietnam veterans and Seveso residents have been carried out. As a result of the (US) Agent Orange Act of 1991, the Institute of Medicine (IOM) of the National Academy of Sciences has carried out reviews of scientific evidence about health effects of exposure to TCDD and other chemical compounds in herbicides used in Vietnam and has assigned each disease outcome to one of four categories based on statistical association. The reviews include information about Vietnam veterans, occupationally exposed and environmentally exposed study populations. Since the first review, published in 1994, the IOM accepted HD, NHL, STS and chloracne in the sufficient evidence category. Chronic lymphocytic leukaemia was added in 2002 (IOM, 2005). Overall, the strongest evidence for carcinogenicity of TCDD is for all cancers combined rather than for any specific site. Large cohort studies of chemical workers and workers involved in production or spraying of phenoxy herbicides and chlorophenols from many sites by the International Agency for Research on Cancer (IARC) and the US National Institute for Occupational Safety and Health (NIOSH) have shown excess all cancer mortality (Koveginas et al, 1997; Steenland et al, 1999). The size of the increase is small and higher in occupational sub-cohorts with highest exposure (IARC, 1997). The IARC classified TCDD as a human carcinogen in 1997, primarily on the basis of the findings of these occupational studies (IARC, 1997).
8

The Seveso cohort study is also important for evaluation of TCDD�s carcinogenicity although Seveso exposures were lower than occupational exposures that have been studied and the follow up period is shorter. Given the potential exposure in Paritutu to TCDD, which has been demonstrated to be carcinogenic in overseas studies, an epidemiological study of the New Plymouth population was felt to be appropriate. The following is a description of that study. Methods The study focused on cancer mortality and incidence within the New Plymouth Territorial Authority (TA) boundary for the period 1970-2001. Prior to 1972 the Cancer Registry data were incomplete as private hospital, death certificate and incidental autopsy findings were not included. Difficulties with matching earlier coding of the specific cancers and obtaining denominator data also contributed to the decision not to include data prior to 1970. The TA was assigned based upon the health domicile code or where unavailable the hospital facility health domicile code. The exposed and reference status of outcomes was based upon the individual�s recorded TA for usual place of residence at death or cancer registration, as exposure data were unavailable. Between health domicile TA and facility TA, the concordance was 0.87 for people domiciled in New Plymouth TA and 0.99 for people domiciled in other parts of New Zealand. The outcome data were obtained from the New Zealand Health Information Service�s Mortality Collection and Cancer Registry. The denominator used was based on a linear interpolation of data for all censuses between 1971 and 2001 and then adjusted for census undercount. The census data were obtained from Statistics New Zealand. The deaths and cancer registration events for persons recorded as non-residents were excluded from the study (499 deaths, 2,315 cancer registrations), as were those with no recorded domicile (247 deaths, 14 cancer registrations) (Table 2). Exclusion of those with no recorded domicile from the total cancer registrations and deaths for New Zealand is unlikely to have caused any bias as the number is small. No deaths or registrations were excluded for other reasons.
9

Table 2: Mortality and cancer registrations by cancer diagnosis and domicile New
Plymouth Resident
Other New Zealand Resident
Non-resident
Unknown Domicile
Case Reference Excluded Excluded Registrations 1970-2001
HD, STS, NHL & CCL
432 18,966 179 -
Other Cancers 7,581 348,604 2,136 14
All Cancers 8,013 367,570 2,315 14
Deaths 1970-2001
HD, STS, NHL & CCL
227 9,084 35 16
Other Cancers 4,008 183,295 464 231
All Cancers 4,235 192,379 499 247
The mortality and cancer registrations for the 2000 and 2001 years were coded under the International Classification of Diseases, Tenth Revision (ICD-10) and the data for earlier years were coded under a combination of ICD-8 and ICD-9. The codes in Table 3 were used to select the following five groups: all cancers, STS, HD, NHL and CLL.
10
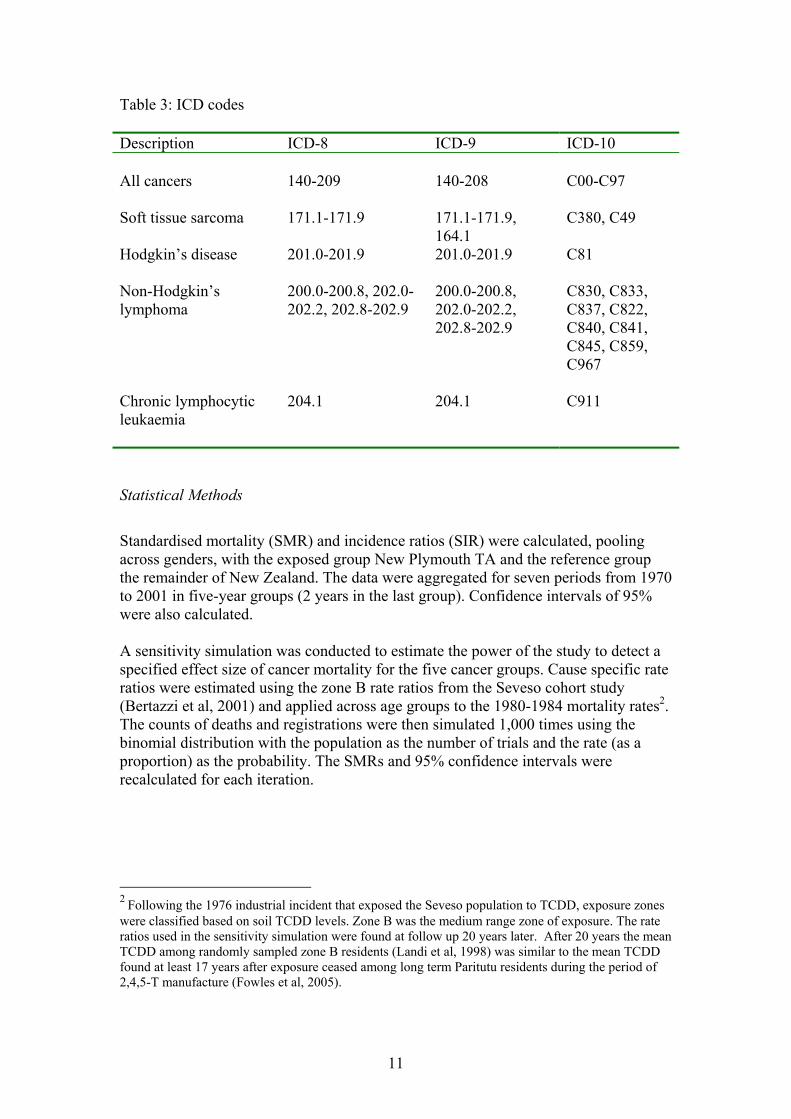
Table 3: ICD codes Description ICD-8 ICD-9 ICD-10 All cancers 140-209 140-208 C00-C97 Soft tissue sarcoma 171.1-171.9 171.1-171.9,
164.1 C380, C49
Hodgkin�s disease 201.0-201.9 201.0-201.9 C81 Non-Hodgkin�s lymphoma
200.0-200.8, 202.0-202.2, 202.8-202.9
200.0-200.8, 202.0-202.2, 202.8-202.9
C830, C833, C837, C822, C840, C841, C845, C859, C967
Chronic lymphocytic leukaemia
204.1
204.1
C911
Statistical Methods
Standardised mortality (SMR) and incidence ratios (SIR) were calculated, pooling across genders, with the exposed group New Plymouth TA and the reference group the remainder of New Zealand. The data were aggregated for seven periods from 1970 to 2001 in five-year groups (2 years in the last group). Confidence intervals of 95% were also calculated. A sensitivity simulation was conducted to estimate the power of the study to detect a specified effect size of cancer mortality for the five cancer groups. Cause specific rate ratios were estimated using the zone B rate ratios from the Seveso cohort study (Bertazzi et al, 2001) and applied across age groups to the 1980-1984 mortality rates2. The counts of deaths and registrations were then simulated 1,000 times using the binomial distribution with the population as the number of trials and the rate (as a proportion) as the probability. The SMRs and 95% confidence intervals were recalculated for each iteration.
2 Following the 1976 industrial incident that exposed the Seveso population to TCDD, exposure zones were classified based on soil TCDD levels. Zone B was the medium range zone of exposure. The rate ratios used in the sensitivity simulation were found at follow up 20 years later. After 20 years the mean TCDD among randomly sampled zone B residents (Landi et al, 1998) was similar to the mean TCDD found at least 17 years after exposure ceased among long term Paritutu residents during the period of 2,4,5-T manufacture (Fowles et al, 2005).
11
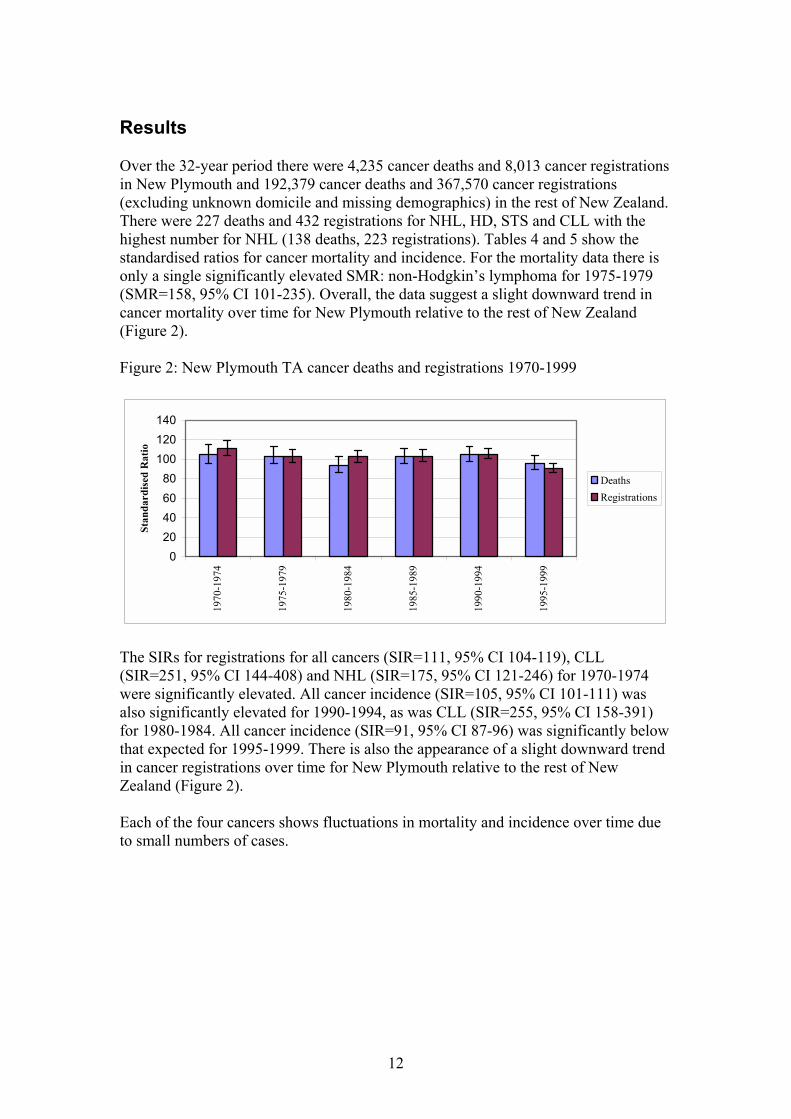
Results Over the 32-year period there were 4,235 cancer deaths and 8,013 cancer registrations in New Plymouth and 192,379 cancer deaths and 367,570 cancer registrations (excluding unknown domicile and missing demographics) in the rest of New Zealand. There were 227 deaths and 432 registrations for NHL, HD, STS and CLL with the highest number for NHL (138 deaths, 223 registrations). Tables 4 and 5 show the standardised ratios for cancer mortality and incidence. For the mortality data there is only a single significantly elevated SMR: non-Hodgkin�s lymphoma for 1975-1979 (SMR=158, 95% CI 101-235). Overall, the data suggest a slight downward trend in cancer mortality over time for New Plymouth relative to the rest of New Zealand (Figure 2). Figure 2: New Plymouth TA cancer deaths and registrations 1970-1999
020406080
100120140
1970
-197
4
1975
-197
9
1980
-198
4
1985
-198
9
1990
-199
4
1995
-199
9
Stan
dard
ised
Rat
io
DeathsRegistrations
The SIRs for registrations for all cancers (SIR=111, 95% CI 104-119), CLL (SIR=251, 95% CI 144-408) and NHL (SIR=175, 95% CI 121-246) for 1970-1974 were significantly elevated. All cancer incidence (SIR=105, 95% CI 101-111) was also significantly elevated for 1990-1994, as was CLL (SIR=255, 95% CI 158-391) for 1980-1984. All cancer incidence (SIR=91, 95% CI 87-96) was significantly below that expected for 1995-1999. There is also the appearance of a slight downward trend in cancer registrations over time for New Plymouth relative to the rest of New Zealand (Figure 2). Each of the four cancers shows fluctuations in mortality and incidence over time due to small numbers of cases.
12
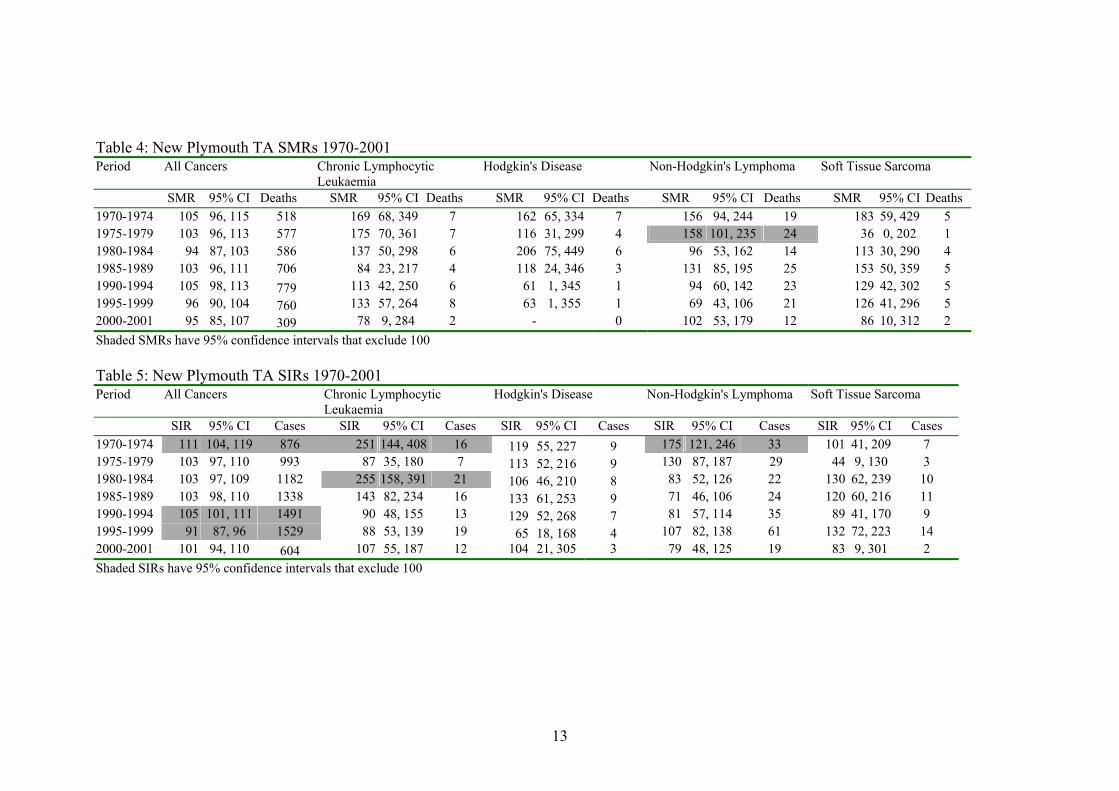
Table 4: New Plymouth TA SMRs 1970-2001
Period All Cancers Chronic LymphocyticLeukaemia
Hodgkin's Disease Non-Hodgkin's Lymphoma Soft Tissue Sarcoma
SMR 95% CI Deaths SMR 95% CI Deaths SMR 95% CI Deaths SMR 95% CI Deaths SMR 95% CI Deaths1970-1974 105 96, 115 518 169 68, 349 7 162 65, 334 7 156 94, 244 19 183 59, 429 5 1975-1979 103 96, 113 577 175 70, 361 7 116 31, 299 4 158 101, 235 24 36 0, 202 1 1980-1984 94 87, 103 586 137 50, 298 6 206 75, 449 6 96 53, 162 14 113 30, 290 4 1985-1989 103 96, 111 706 84 23, 217 4 118 24, 346 3 131 85, 195 25 153 50, 359 5 1990-1994
105 98, 113 779 113 42, 250 6 61 1, 345 1 94 60, 142 23 129 42, 302 5 1995-1999 96 90, 104 760 133 57, 264 8 63 1, 355 1 69 43, 106 21 126 41, 296 5 2000-2001 95 85, 107 309 78 9, 284 2 - 0 102 53, 179 12 86 10, 312 2 Shaded SMRs have 95% confidence intervals that exclude 100 Table 5: New Plymouth TA SIRs 1970-2001
Period All Cancers Chronic LymphocyticLeukaemia
Hodgkin's Disease Non-Hodgkin's Lymphoma Soft Tissue Sarcoma
SIR 95% CI Cases SIR 95% CI Cases SIR 95% CI Cases SIR 95% CI Cases SIR 95% CI Cases 1970-1974 111 104, 119 876 251 144, 408 16 119 55, 227 9 175 121, 246 33 101 41, 209 7 1975-1979 103 97, 110 993 87 35, 180 7 113 52, 216 9 130 87, 187 29 44 9, 130 3 1980-1984 103 97, 109 1182 255 158, 391 21 106 46, 210 8 83 52, 126 22 130 62, 239 10 1985-1989 103 98, 110 1338 143 82, 234 16 133 61, 253 9 71 46, 106 24 120 60, 216 11 1990-1994 105 101, 111 1491 90 48, 155 13 129 52, 268 7 81 57, 114 35 89 41, 170 9 1995-1999 91 87, 96 1529 88 53, 139 19 65 18, 168 4 107 82, 138 61 132 72, 223 14 2000-2001 101 94, 110 604 107 55, 187 12 104 21, 305 3 79 48, 125 19 83 9, 301 2 Shaded SIRs have 95% confidence intervals that exclude 100
13
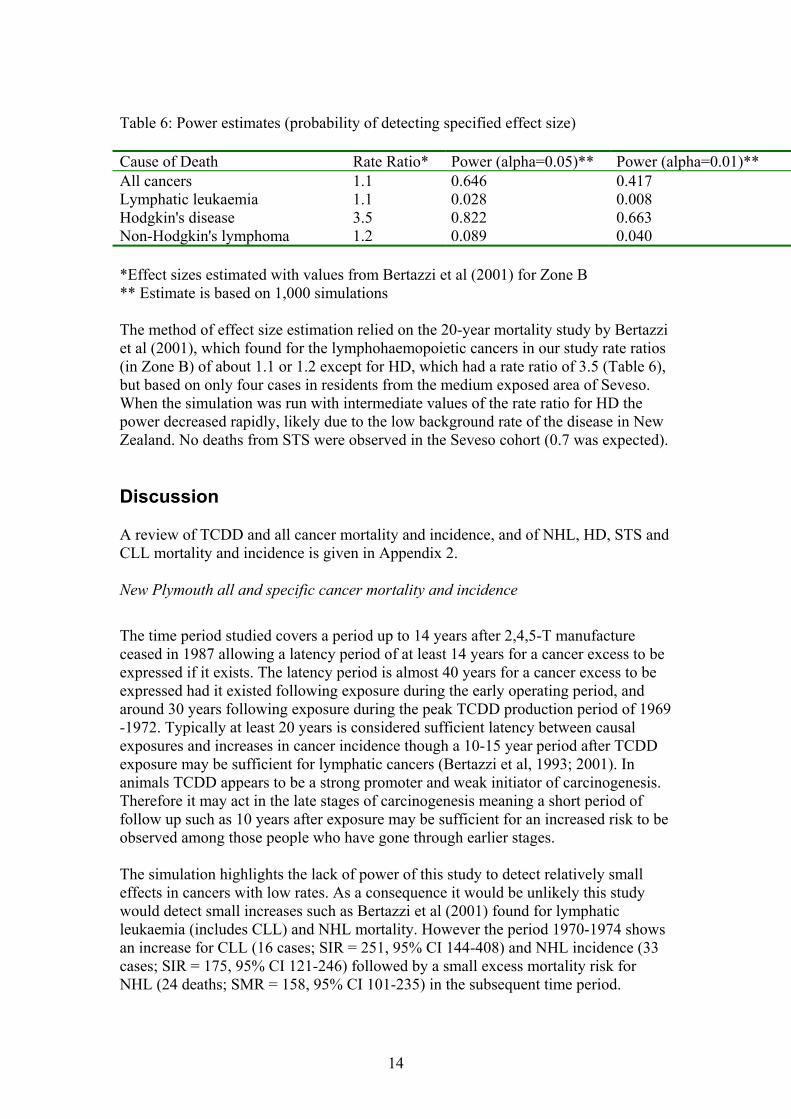
Table 6: Power estimates (probability of detecting specified effect size) Cause of Death Rate Ratio* Power (alpha=0.05)** Power (alpha=0.01)** All cancers 1.1 0.646 0.417 Lymphatic leukaemia 1.1 0.028 0.008 Hodgkin's disease 3.5 0.822 0.663 Non-Hodgkin's lymphoma 1.2 0.089 0.040 *Effect sizes estimated with values from Bertazzi et al (2001) for Zone B ** Estimate is based on 1,000 simulations The method of effect size estimation relied on the 20-year mortality study by Bertazzi et al (2001), which found for the lymphohaemopoietic cancers in our study rate ratios (in Zone B) of about 1.1 or 1.2 except for HD, which had a rate ratio of 3.5 (Table 6), but based on only four cases in residents from the medium exposed area of Seveso. When the simulation was run with intermediate values of the rate ratio for HD the power decreased rapidly, likely due to the low background rate of the disease in New Zealand. No deaths from STS were observed in the Seveso cohort (0.7 was expected). Discussion A review of TCDD and all cancer mortality and incidence, and of NHL, HD, STS and CLL mortality and incidence is given in Appendix 2. New Plymouth all and specific cancer mortality and incidence
The time period studied covers a period up to 14 years after 2,4,5-T manufacture ceased in 1987 allowing a latency period of at least 14 years for a cancer excess to be expressed if it exists. The latency period is almost 40 years for a cancer excess to be expressed had it existed following exposure during the early operating period, and around 30 years following exposure during the peak TCDD production period of 1969 -1972. Typically at least 20 years is considered sufficient latency between causal exposures and increases in cancer incidence though a 10-15 year period after TCDD exposure may be sufficient for lymphatic cancers (Bertazzi et al, 1993; 2001). In animals TCDD appears to be a strong promoter and weak initiator of carcinogenesis. Therefore it may act in the late stages of carcinogenesis meaning a short period of follow up such as 10 years after exposure may be sufficient for an increased risk to be observed among those people who have gone through earlier stages. The simulation highlights the lack of power of this study to detect relatively small effects in cancers with low rates. As a consequence it would be unlikely this study would detect small increases such as Bertazzi et al (2001) found for lymphatic leukaemia (includes CLL) and NHL mortality. However the period 1970-1974 shows an increase for CLL (16 cases; SIR = 251, 95% CI 144-408) and NHL incidence (33 cases; SIR = 175, 95% CI 121-246) followed by a small excess mortality risk for NHL (24 deaths; SMR = 158, 95% CI 101-235) in the subsequent time period.
14
The period 1970-1974 is the only period that shows an elevated cancer risk for all cancers and at least one of the four specific cancers. Assuming a 10-year minimum latency period and the cause was TCDD, the period of exposure would have been 1960-1964, which is partially outside of the 2,4,5-T manufacturing period and before TCP was manufactured on site. Even though the level of TCDD in 2,4,5-T was much higher up to 1973, annual 2,4,5-T production for 1962-1964 was lower than from 1969-1972. However the possibility of episodic or regular high levels of fugitive TCDD emissions during this time cannot be excluded. Overall the results do not suggest an increased cancer risk related to the entire period of 2,4,5-T manufacture. Of note is that, although the mean serum TCDD level for long term Paritutu residents is higher than for the New Zealand population, the estimated TCDD level when exposure ceased (Fowles et al, 2005) is in the order of at least 10 times less than estimated levels for occupationally exposed populations that have shown increased all cancer mortality (Smith and Lopipero, 2001). The mean TCDD level of 14.6 pg/g lipid in 2004, 17 years after manufacture ceased, is however similar to that (11 pg/g lipid) for Seveso residents from the medium exposed area 20 years after the incident (Landi et al, 1998). A suggestive increase in all cancer mortality among males from this area and the much smaller populated most highly exposed area (SMR=1.1, 95% CI 1.0-1.3) has been reported after 20 years (Bertazzi et al, 2001). It is possible that a small excess cancer risk does exist but is undetectable due to the small size of the population exposed and migration of some people resident during the years of 2,4,5-T manufacture out of New Plymouth before a diagnosis of cancer had been made. As an ecological study this study is limited by an inability to account for duration and extent of exposure and confounding factors. Inclusion of the entire TA population has also diluted TCDD exposure. Analysis for the Moturoa Census Area Unit that includes Paritutu was not undertaken due to small numbers of cancers and difficulties in matching the geographical area over time due to boundary changes. The population of Moturoa in the 2001 census was 3,408. Definite trends could not be observed for the specific cancers but the population size is small and few events were observed. Although increases were seen for CLL and NHL in two time periods the large confidence intervals resulting from a small number of cases makes it difficult to draw conclusions from the data. This problem is common to many published studies of TCDD exposure and cancer. Misclassification bias is also likely, notably for soft tissue sarcoma (IARC, 1997), and pathological review of a subset of cases of the four specific cancers would be necessary to clarify its extent. The consequence of reclassification of a few cases is important in instances where results are based on small numbers. In New Zealand a small non-significant excess all cancer mortality and no excess risk for NHL has been found among IWD production workers after about 30 years (�t Mannetje et al, 2005). New Zealand case-control studies of NHL (Pearce et al, 1987; Pearce, 1989), HD (Pearce et al, 1985) and STS (Smith et al, 1984; Smith and Pearce, 1986) have not found associations with phenoxy herbicide exposure. In summary, the main conclusions are:
15

• Although an 11% excess all cancer incidence, 75% excess NHL incidence and a 2.5 fold increase in CLL incidence was found for 1970-1974 it is not possible to identify the cause of this. Whilst TCDD exposure in the first few years of 2,4,5-T manufacture may have had a role if a 10 year latency period is assumed, unknown exposure(s) before the start of 2,4,5-T manufacture and chance are also possible explanations.
• There is no evidence of an increased cancer risk among the New Plymouth
population related to the entire period of 2,4,5-T manufacture.
• There is a slight downward trend for all cancer incidence and mortality among the New Plymouth population relative to the rest of New Zealand over the 32-year time period.
• The possibility of an undetectable small elevation in cancer risk cannot be
excluded given the study�s limitations. The ability to interpret these findings will be assisted by the findings of the current IWD study, particularly the serum TCDD results, which will clarify the historic exposure of workers compared to that of nearby long term Paritutu residents and overcome the limitations such as migration that are common to ecological studies.
16

Appendix 1: New Plymouth urban area and Taranaki hospital board district 1974-1978 cancer mortality SMR Non-Hodgkin�s lymphoma (ICD-8 code 200)
males Taranaki district 169 (p<0.15) females Taranaki district 203 (p<0.05)
males New Plymouth urban area 275 (p<0.01)
Hodgkin�s disease (ICD-8 code 201) males New Plymouth urban area
320 (p<0.10)
Source: Borman, 1982
17
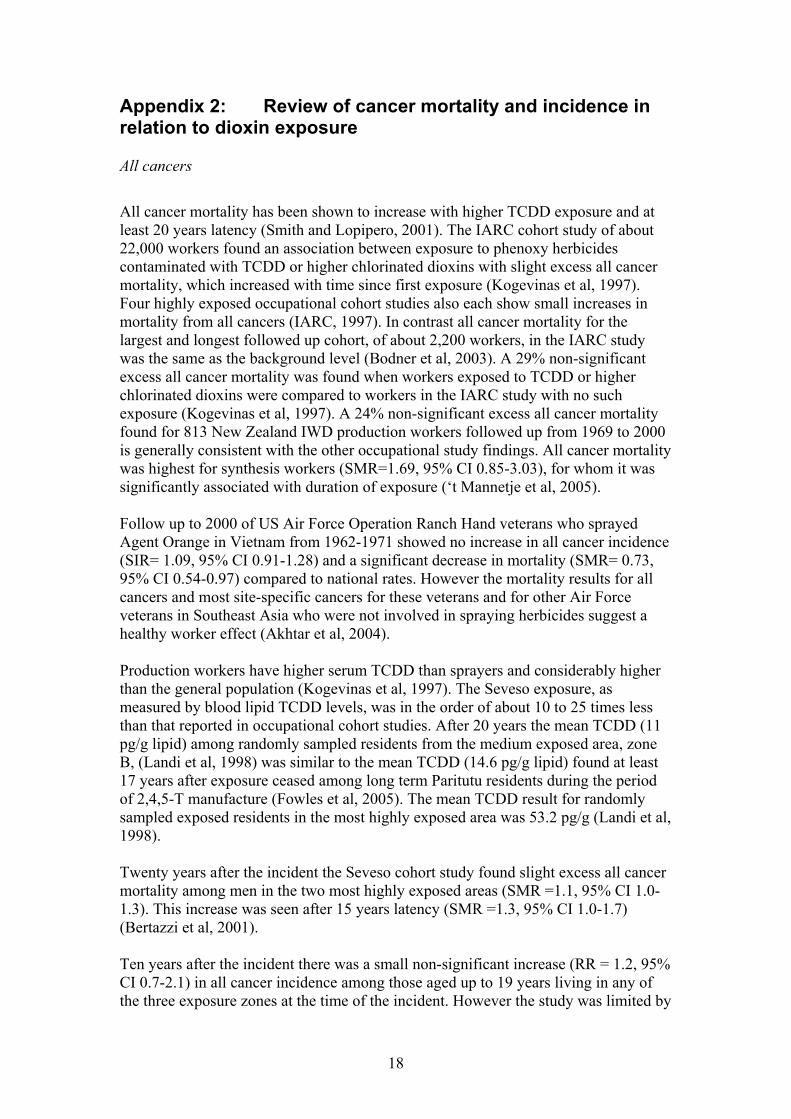
Appendix 2: Review of cancer mortality and incidence in relation to dioxin exposure All cancers
All cancer mortality has been shown to increase with higher TCDD exposure and at least 20 years latency (Smith and Lopipero, 2001). The IARC cohort study of about 22,000 workers found an association between exposure to phenoxy herbicides contaminated with TCDD or higher chlorinated dioxins with slight excess all cancer mortality, which increased with time since first exposure (Kogevinas et al, 1997). Four highly exposed occupational cohort studies also each show small increases in mortality from all cancers (IARC, 1997). In contrast all cancer mortality for the largest and longest followed up cohort, of about 2,200 workers, in the IARC study was the same as the background level (Bodner et al, 2003). A 29% non-significant excess all cancer mortality was found when workers exposed to TCDD or higher chlorinated dioxins were compared to workers in the IARC study with no such exposure (Kogevinas et al, 1997). A 24% non-significant excess all cancer mortality found for 813 New Zealand IWD production workers followed up from 1969 to 2000 is generally consistent with the other occupational study findings. All cancer mortality was highest for synthesis workers (SMR=1.69, 95% CI 0.85-3.03), for whom it was significantly associated with duration of exposure (�t Mannetje et al, 2005). Follow up to 2000 of US Air Force Operation Ranch Hand veterans who sprayed Agent Orange in Vietnam from 1962-1971 showed no increase in all cancer incidence (SIR= 1.09, 95% CI 0.91-1.28) and a significant decrease in mortality (SMR= 0.73, 95% CI 0.54-0.97) compared to national rates. However the mortality results for all cancers and most site-specific cancers for these veterans and for other Air Force veterans in Southeast Asia who were not involved in spraying herbicides suggest a healthy worker effect (Akhtar et al, 2004). Production workers have higher serum TCDD than sprayers and considerably higher than the general population (Kogevinas et al, 1997). The Seveso exposure, as measured by blood lipid TCDD levels, was in the order of about 10 to 25 times less than that reported in occupational cohort studies. After 20 years the mean TCDD (11 pg/g lipid) among randomly sampled residents from the medium exposed area, zone B, (Landi et al, 1998) was similar to the mean TCDD (14.6 pg/g lipid) found at least 17 years after exposure ceased among long term Paritutu residents during the period of 2,4,5-T manufacture (Fowles et al, 2005). The mean TCDD result for randomly sampled exposed residents in the most highly exposed area was 53.2 pg/g (Landi et al, 1998). Twenty years after the incident the Seveso cohort study found slight excess all cancer mortality among men in the two most highly exposed areas (SMR =1.1, 95% CI 1.0-1.3). This increase was seen after 15 years latency (SMR =1.3, 95% CI 1.0-1.7) (Bertazzi et al, 2001). Ten years after the incident there was a small non-significant increase (RR = 1.2, 95% CI 0.7-2.1) in all cancer incidence among those aged up to 19 years living in any of the three exposure zones at the time of the incident. However the study was limited by
18
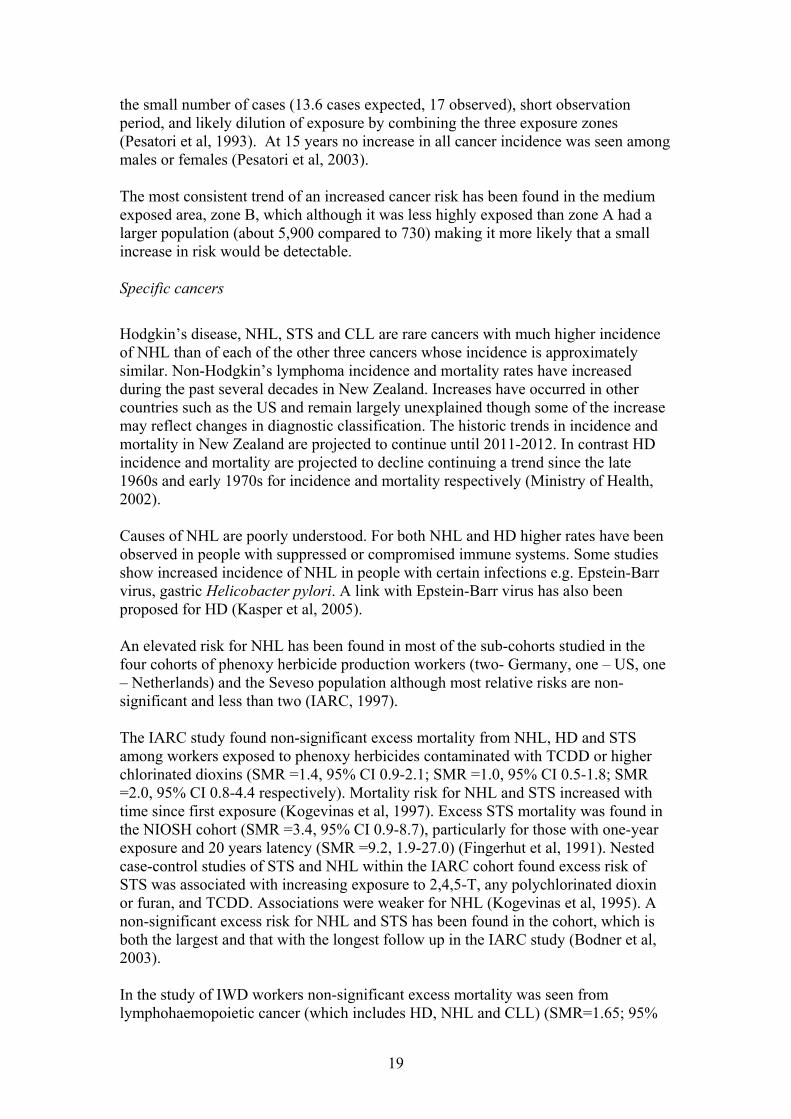
the small number of cases (13.6 cases expected, 17 observed), short observation period, and likely dilution of exposure by combining the three exposure zones (Pesatori et al, 1993). At 15 years no increase in all cancer incidence was seen among males or females (Pesatori et al, 2003). The most consistent trend of an increased cancer risk has been found in the medium exposed area, zone B, which although it was less highly exposed than zone A had a larger population (about 5,900 compared to 730) making it more likely that a small increase in risk would be detectable. Specific cancers
Hodgkin�s disease, NHL, STS and CLL are rare cancers with much higher incidence of NHL than of each of the other three cancers whose incidence is approximately similar. Non-Hodgkin�s lymphoma incidence and mortality rates have increased during the past several decades in New Zealand. Increases have occurred in other countries such as the US and remain largely unexplained though some of the increase may reflect changes in diagnostic classification. The historic trends in incidence and mortality in New Zealand are projected to continue until 2011-2012. In contrast HD incidence and mortality are projected to decline continuing a trend since the late 1960s and early 1970s for incidence and mortality respectively (Ministry of Health, 2002). Causes of NHL are poorly understood. For both NHL and HD higher rates have been observed in people with suppressed or compromised immune systems. Some studies show increased incidence of NHL in people with certain infections e.g. Epstein-Barr virus, gastric Helicobacter pylori. A link with Epstein-Barr virus has also been proposed for HD (Kasper et al, 2005). An elevated risk for NHL has been found in most of the sub-cohorts studied in the four cohorts of phenoxy herbicide production workers (two- Germany, one � US, one � Netherlands) and the Seveso population although most relative risks are non-significant and less than two (IARC, 1997). The IARC study found non-significant excess mortality from NHL, HD and STS among workers exposed to phenoxy herbicides contaminated with TCDD or higher chlorinated dioxins (SMR =1.4, 95% CI 0.9-2.1; SMR =1.0, 95% CI 0.5-1.8; SMR =2.0, 95% CI 0.8-4.4 respectively). Mortality risk for NHL and STS increased with time since first exposure (Kogevinas et al, 1997). Excess STS mortality was found in the NIOSH cohort (SMR =3.4, 95% CI 0.9-8.7), particularly for those with one-year exposure and 20 years latency (SMR =9.2, 1.9-27.0) (Fingerhut et al, 1991). Nested case-control studies of STS and NHL within the IARC cohort found excess risk of STS was associated with increasing exposure to 2,4,5-T, any polychlorinated dioxin or furan, and TCDD. Associations were weaker for NHL (Kogevinas et al, 1995). A non-significant excess risk for NHL and STS has been found in the cohort, which is both the largest and that with the longest follow up in the IARC study (Bodner et al, 2003). In the study of IWD workers non-significant excess mortality was seen from lymphohaemopoietic cancer (which includes HD, NHL and CLL) (SMR=1.65; 95%
19
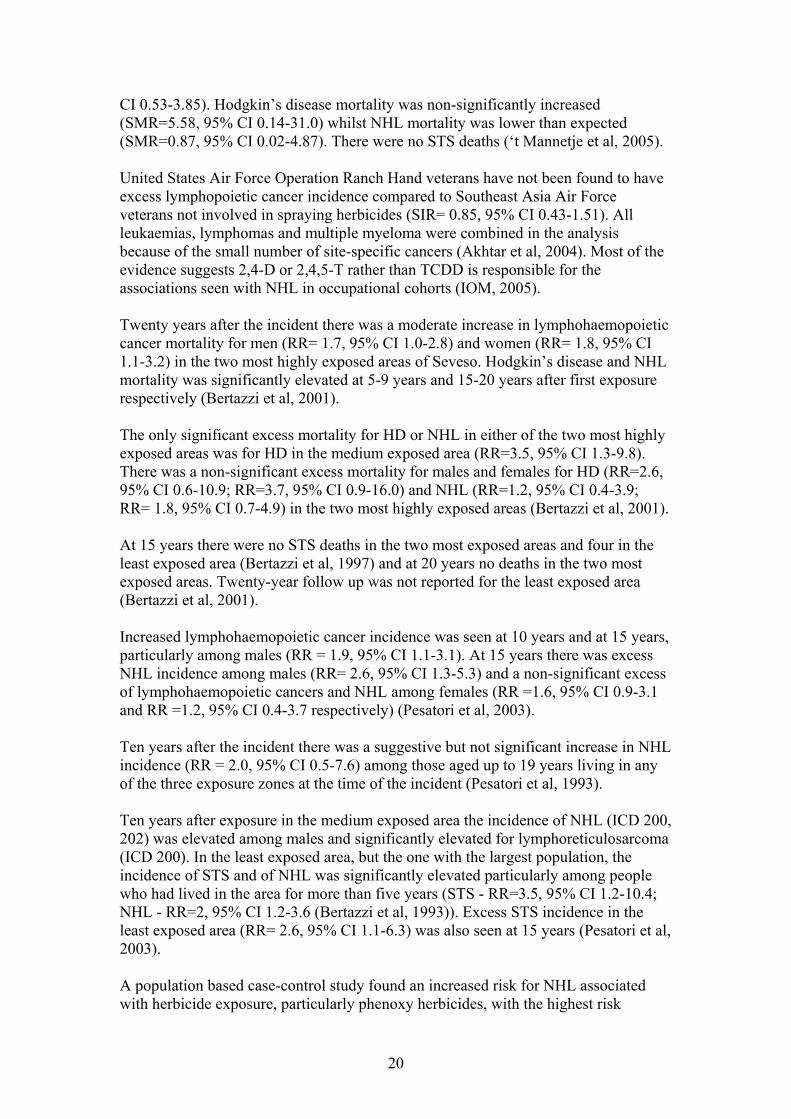
CI 0.53-3.85). Hodgkin�s disease mortality was non-significantly increased (SMR=5.58, 95% CI 0.14-31.0) whilst NHL mortality was lower than expected (SMR=0.87, 95% CI 0.02-4.87). There were no STS deaths (�t Mannetje et al, 2005). United States Air Force Operation Ranch Hand veterans have not been found to have excess lymphopoietic cancer incidence compared to Southeast Asia Air Force veterans not involved in spraying herbicides (SIR= 0.85, 95% CI 0.43-1.51). All leukaemias, lymphomas and multiple myeloma were combined in the analysis because of the small number of site-specific cancers (Akhtar et al, 2004). Most of the evidence suggests 2,4-D or 2,4,5-T rather than TCDD is responsible for the associations seen with NHL in occupational cohorts (IOM, 2005). Twenty years after the incident there was a moderate increase in lymphohaemopoietic cancer mortality for men (RR= 1.7, 95% CI 1.0-2.8) and women (RR= 1.8, 95% CI 1.1-3.2) in the two most highly exposed areas of Seveso. Hodgkin�s disease and NHL mortality was significantly elevated at 5-9 years and 15-20 years after first exposure respectively (Bertazzi et al, 2001). The only significant excess mortality for HD or NHL in either of the two most highly exposed areas was for HD in the medium exposed area (RR=3.5, 95% CI 1.3-9.8). There was a non-significant excess mortality for males and females for HD (RR=2.6, 95% CI 0.6-10.9; RR=3.7, 95% CI 0.9-16.0) and NHL (RR=1.2, 95% CI 0.4-3.9; RR= 1.8, 95% CI 0.7-4.9) in the two most highly exposed areas (Bertazzi et al, 2001). At 15 years there were no STS deaths in the two most exposed areas and four in the least exposed area (Bertazzi et al, 1997) and at 20 years no deaths in the two most exposed areas. Twenty-year follow up was not reported for the least exposed area (Bertazzi et al, 2001). Increased lymphohaemopoietic cancer incidence was seen at 10 years and at 15 years, particularly among males (RR = 1.9, 95% CI 1.1-3.1). At 15 years there was excess NHL incidence among males (RR= 2.6, 95% CI 1.3-5.3) and a non-significant excess of lymphohaemopoietic cancers and NHL among females (RR =1.6, 95% CI 0.9-3.1 and RR =1.2, 95% CI 0.4-3.7 respectively) (Pesatori et al, 2003). Ten years after the incident there was a suggestive but not significant increase in NHL incidence (RR = 2.0, 95% CI 0.5-7.6) among those aged up to 19 years living in any of the three exposure zones at the time of the incident (Pesatori et al, 1993). Ten years after exposure in the medium exposed area the incidence of NHL (ICD 200, 202) was elevated among males and significantly elevated for lymphoreticulosarcoma (ICD 200). In the least exposed area, but the one with the largest population, the incidence of STS and of NHL was significantly elevated particularly among people who had lived in the area for more than five years (STS - RR=3.5, 95% CI 1.2-10.4; NHL - RR=2, 95% CI 1.2-3.6 (Bertazzi et al, 1993)). Excess STS incidence in the least exposed area (RR= 2.6, 95% CI 1.1-6.3) was also seen at 15 years (Pesatori et al, 2003). A population based case-control study found an increased risk for NHL associated with herbicide exposure, particularly phenoxy herbicides, with the highest risk
20

occurring 10-20 years after initial exposure and then decreasing (Hardell and Eriksson, 1999). In New Zealand significantly elevated NHL mortality (RR= 1.5, 95% CI 1.05-2.1) was found among farmers compared to all employed males aged 15-64 years (Pearce and Howard, 1986). A case-control study of NHL cases registered on the New Zealand Cancer Registry from 1977 to 1981 found no excess risk of NHL among male farm workers exposed to phenoxy herbicides (Pearce et al, 1987) and little evidence of an association of NHL with duration or frequency of phenoxy herbicide use (Pearce, 1989). Excess NHL mortality has been found among New Zealand meat industry workers and seems to be predominantly associated with biological exposures such as animal blood (McLean, 2003). The Occupational Safety and Health (OSH) Cancer Panel is currently undertaking a case-control study of NHL based on cases registered with the Cancer Registry during 2003-2004. Preliminary findings suggest possible increased risks among market gardeners, printers, welders and slaughterers (OSH Cancer Panel, 2004). Occupations were identified from the literature a priori as possibly having a high risk for NHL. Epidemiological evidence for an association between phenoxy herbicide exposure and HD is weaker than that for NHL. In New Zealand a case-control study of HD cases registered on the Cancer Registry from 1977 to 1981 found no excess risk among male farm workers (Pearce et al, 1985). The first epidemiological studies suggesting a cancer risk associated with TCDD were a Swedish case report of three STSs in phenoxy herbicide workers (Hardell, 1977) followed by a case-control study of STS that showed an excess risk among workers exposed to phenoxy herbicides or chlorophenols (Hardell and Sandstrom, 1979). A general population based case-control study of STS in Finland found the highest risk at the lowest level of TCDD exposure (Tuomisto et al, 2004). A New Zealand case-control study of STS found no excess risk among those exposed to phenoxy herbicides (Smith et al, 1984; Smith and Pearce, 1986). Chronic lymphocytic leukaemia has many characteristics in common with lymphomas e.g. B cell origin, progression to an acute aggressive form of NHL. Epidemiological studies indicate that farming, particularly 2,4-D and 2,4,5-T exposure are associated with increased CLL mortality (IOM, 2005). Most of the epidemiological studies of TCDD and cancer have not analysed CLL separately. Findings for the Seveso cohort for lymphatic leukaemia (which includes CLL) have been non-significant (Appendix 3).
21
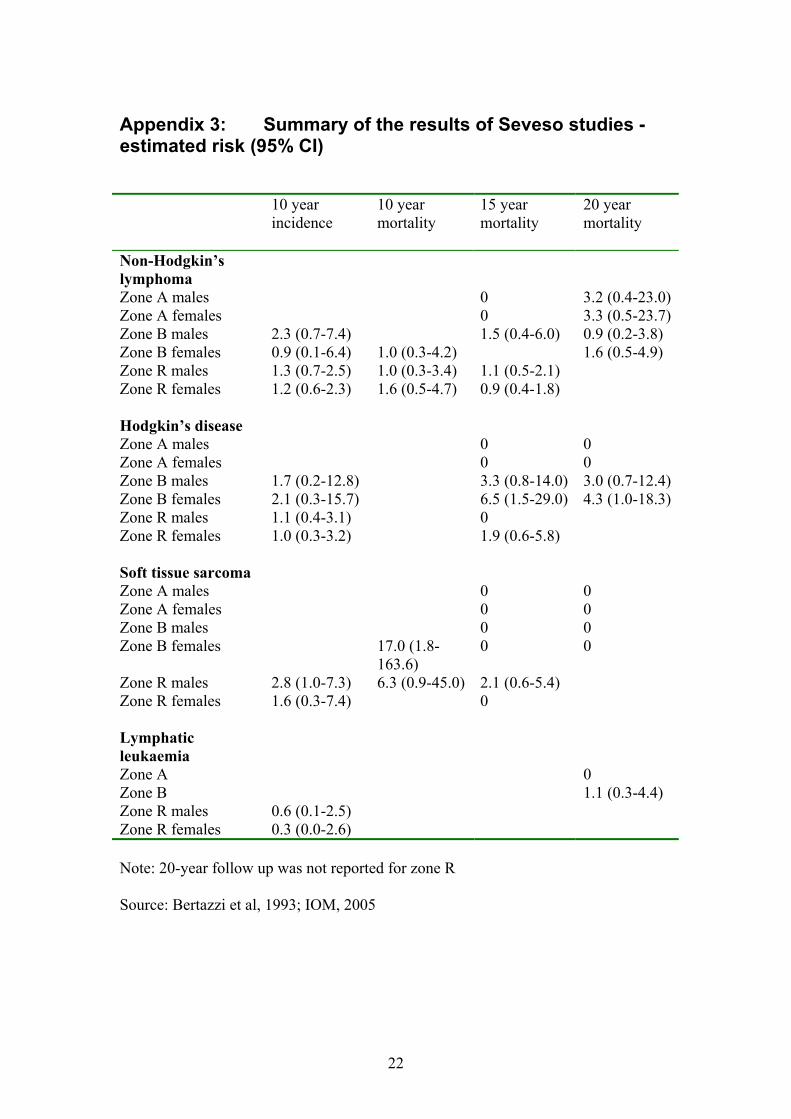
Appendix 3: Summary of the results of Seveso studies - estimated risk (95% CI) 10 year
incidence 10 year mortality
15 year mortality
20 year mortality
Non-Hodgkin�s lymphoma
Zone A males 0 3.2 (0.4-23.0)Zone A females 0 3.3 (0.5-23.7)Zone B males 2.3 (0.7-7.4) 1.5 (0.4-6.0) 0.9 (0.2-3.8) Zone B females 0.9 (0.1-6.4) 1.0 (0.3-4.2) 1.6 (0.5-4.9) Zone R males 1.3 (0.7-2.5) 1.0 (0.3-3.4) 1.1 (0.5-2.1) Zone R females 1.2 (0.6-2.3) 1.6 (0.5-4.7) 0.9 (0.4-1.8) Hodgkin�s disease Zone A males 0 0 Zone A females 0 0 Zone B males 1.7 (0.2-12.8) 3.3 (0.8-14.0) 3.0 (0.7-12.4)Zone B females 2.1 (0.3-15.7) 6.5 (1.5-29.0) 4.3 (1.0-18.3)Zone R males 1.1 (0.4-3.1) 0 Zone R females 1.0 (0.3-3.2) 1.9 (0.6-5.8) Soft tissue sarcoma Zone A males 0 0 Zone A females 0 0 Zone B males 0 0 Zone B females 17.0 (1.8-
163.6) 0 0
Zone R males 2.8 (1.0-7.3) 6.3 (0.9-45.0) 2.1 (0.6-5.4) Zone R females 1.6 (0.3-7.4) 0 Lymphatic leukaemia
Zone A 0 Zone B 1.1 (0.3-4.4) Zone R males 0.6 (0.1-2.5) Zone R females 0.3 (0.0-2.6) Note: 20-year follow up was not reported for zone R Source: Bertazzi et al, 1993; IOM, 2005
22
References Akhtar FZ, Garabrandt DH, Ketchum NS, Michalek JE. Cancer in US Air Force veterans of the Vietnam War. J Occup Environ Med 2004;46:123-36. Bertazzi PA, Pesatori AC, Consonni D, Tironi A, Landi MT, Zocchetti C. Cancer incidence in a population accidentally exposed to 2,3,7,8-tetrachlorodibenzo-para-dioxin. Epidemiol 1993;4:398-406. Bertazzi PA, Zocchetti C, Guercilena S, Consonni D, Tironi A, Landi MT, et al. Dioxin exposure and cancer risk: a 15-year mortality study after the �Seveso accident�. Epidemiol 1997;8:646-52. Bertazzi PA, Consonni D, Bachetti S, Rubagotti M, Baccarelli A, Zocchetti C, et al. Health effects of dioxin exposure: a 20-year mortality study. Am J Epidemiol 2001;153:1031-44. Bodner KM, Collins JJ, Bloemen LJ, Carson ML. Cancer risk for chemical workers exposed to 2,3,7,8-tetrachlorodibenzo-p-dioxin. Occup Environ Med 2003;60:672-5. Borman B. A cancer mortality atlas of New Zealand. Wellington: National Health Statistics Centre, Department of Health; 1982. Brinkman GL, Matthews REF, Earl WB. Possible health effects of manufacture of 2,4,5-T in New Plymouth. Report of Ministerial Committee of Inquiry to the Minister of Health. Wellington: October 1986. Fingerhut MA, Halperin WE, Marlow DA, Piacitelli LA, Honchar PA, Sweeney MH, et al. Cancer mortality in workers exposed to 2,3,7,8-tetrachlorodibenzo-p-dioxin. N Engl J Med 1991;324:212-8. Fowles J, Gallagher L, Baker V, Phillips D, Marriott F, Stevenson C, et al. A Study of 2,3,7,8-tetrachlorodibenzo-p-dioxin (TCDD) Exposures in Paritutu, New Zealand. A Report to the New Zealand Ministry of Health. Porirua: ESR; 2005. Hardell L. Malignant mesenchymal tumors and exposure to phenoxy acids � a clinical observation. Lakartidningen 1977;74:2753-4. Hardell L, Sandstrom A. Case-control study: soft-tissue sarcomas and exposure to phenoxyacetic acids or chlorophenols. Br J Cancer 1979;39:711-7. Hardell L, Eriksson M. A case-control study of non-Hodgkin lymphoma and exposure to pesticides. Cancer 1999;85:1353-60. International Agency for Research on Cancer (IARC). Monographs on the evaluation of carcinogenic risks to humans, Vol 69, Polychlorinated dibenzo-para-dioxins and polychlorinated dibenzofurans. Lyon: IARC; 1997. Institute of Medicine. Veterans and Agent Orange: Update 2004. Washington, DC: National Academy Press; 2005.
23

Kasper DL, Braunwald E, Fauci AS, Hauser SL, Longo DL, Jameson JL et al, editors. Harrison�s principles of internal medicine. Harrison�s Online. New York: McGraw-Hill; 2005. Kogevinas M, Kauppinen T, Winkelmann R, Becher H, Bertazzi PA, Bueno-de-Mesquita HB, et al. Soft tissue sarcoma and non-Hodgkin�s lymphoma in workers exposed to phenoxy herbicides, chlorophenols, and dioxins: two nested case-control studies. Epidemiol 1995;6:396-402. Kogevinas M, Becher H, Benn T, Bertazzi PA, Boffeta P, Bueno-de-Mesquita HB, et al. Cancer mortality in workers exposed to phenoxy herbicides, chlorophenols, and dioxins. An expanded and updated international cohort study. Am J Epidemiol 1997;145:1061-75. Landi MT, Consonni D, Patterson DG, Needham LL, Lucier G, Brambilla P, et al. 2,3,7,8-tetrachlorodibenzo-p-dioxin plasma levels in Seveso 20 years after the accident. Environ Health Perspect 1998;106:273-7. McLean D. Mortality and cancer incidence in New Zealand meat workers. Occasional Report Series No 4. Wellington: Centre for Public Health Research, Massey University; 2003. Ministry of Health. Cancer in New Zealand: Trends and projections. Public Health Intelligence Occasional Bulletin No 15. Wellington: Ministry of Health; 2002. OSH Cancer Panel. Occupational Cancer. The OSH Cancer Panel Newsletter. Wellington: Centre for Public Health Research, Massey University; December 2004. Pattle Delamore Partners Ltd. Dioxin Concentrations in Residential Soil, Paritutu, New Plymouth. Prepared for the Ministry for the Environment and the Institute of Environmental Science and Research Ltd. Wellington: Pattle Delamore Partners Ltd; September 2002. Pearce NE, Smith AH, Fisher DO. Malignant lymphoma and multiple myeloma linked with agricultural occupations in a New Zealand Cancer Registry-based study. Am J Epidemiol 1985;121:225-37. Pearce NE, Howard JK. Occupation, social class and male cancer mortality in New Zealand, 1974-78. Int J Epidemiol 1986;15:456-62. Pearce N, Sheppard RA, Smith AH, Teague CA. Non-Hodgkin�s lymphoma and farming: an expanded case-control study. Int J Cancer 1987;39:155-61. Pearce N. Phenoxy herbicides and non-Hodgkin�s lymphoma in New Zealand: frequency and duration of herbicide use. Br J Ind Med 1989;46:143-4. Pesatori AC, Consonni D, Tironi A, Zocchetti C, Fini A, Bertazzi PA. Cancer in a young population in a dioxin-contaminated area. Int J Epidemiol 1993;22:1010-13.
24
25
Pesatori AC, Consonni D, Bachetti S, Zocchetti C, Bonzini M, Baccarelli A, et al. Short- and long-term morbidity and mortality in the population exposed to dioxin after the �Seveso accident�. Ind Health 2003;41:127-38. Smith AH, Pearce NE, Fisher DO, Giles HJ, Teague CA, Howard JK. Soft tissue sarcoma and exposure to phenoxyherbicides and chlorophenols in New Zealand. J Natl Cancer Inst 1984;73: 1111-17. Smith AH, Pearce NE. Update on soft tissue sarcoma and phenoxy herbicides in New Zealand. Chemosphere 1986;15:1795-99. Smith AH, Lopipero P. Evaluation of the toxicity of dioxins and dioxin-like PCBs: a health risk appraisal for the New Zealand population. Wellington: Ministry for the Environment; February 2001. Steenland K, Piacitelli L, Deddens J, Fingerhut M, Chang LI. Cancer, heart disease, and diabetes in workers exposed to 2,3,7,8-tetrachlorodibenzo-p-dioxin. J Natl Cancer Inst 1999;91:779-86. �t Mannetje A, McLean D, Cheng S, Boffetta P, Colin D, Pearce N. Mortality in New Zealand workers exposed to phenoxy herbicides and dioxins. Occup Environ Med 2005;62:34-40. Tuomisto JT, Pekkanen J, Kiviranta H, Tukiainen E, Vartiainen T, Tuomisto J. Soft-tissue sarcoma and dioxin: a case-control study. Int J Cancer 2004;108:893-900.