Embed Size (px)
Citation preview

Cancellation Predictor for Revenue
Management
applied in the hospitality industry
Vrije Universiteit AmsterdamBusiness Analytics - Research Paper
Supervisor: Student:
prof.dr. G.M. Koole R. van [email protected] [email protected]
D. S. [email protected]
13 februari 2018

Samenvatting Cancellations of reservations influence the revenue signi-ficantly, a cancellation model is key to counter this problem. A PassengerName Record (PNR) approach is used to create a classification modelwhich is applied on a dataset of an international hospitality company,with the aim to increase revenue. The goal is to create a model whichcan be implemented, not only, in the hospitality industry but also in theairline industry or the car rental industry for example. This paper, partof the Master’s program of Business Analytics at Vrije Universiteit Am-sterdam, describes the steps from raw data until implementation. Fourmodels will be applied: Naıve Bayes, logistic regression, decision tree andrandom forest. In terms of accuracy, precision and F-score, random forestperforms the best. The features refundable (y/n), lead time, channel areimportant ones, according to the different models.
Keywords: revenue management, cancellation model, Passenger NameRecord (PNR), machine learning, hospitality
2
Inhoudsopgave
1 Introduction . . . . . . . . . . . . . . . . . . . . . . . . . . . . . . . . . . . . . . . . . . . . . . . . . . . 42 Literature Review . . . . . . . . . . . . . . . . . . . . . . . . . . . . . . . . . . . . . . . . . . . . . . 63 Data . . . . . . . . . . . . . . . . . . . . . . . . . . . . . . . . . . . . . . . . . . . . . . . . . . . . . . . . . 7
3.1 Available Data . . . . . . . . . . . . . . . . . . . . . . . . . . . . . . . . . . . . . . . . . . . . 73.2 Exploratory data analysis . . . . . . . . . . . . . . . . . . . . . . . . . . . . . . . . . . 8
4 Processing . . . . . . . . . . . . . . . . . . . . . . . . . . . . . . . . . . . . . . . . . . . . . . . . . . . . 114.1 Feature Engineering . . . . . . . . . . . . . . . . . . . . . . . . . . . . . . . . . . . . . . . 114.2 Selection . . . . . . . . . . . . . . . . . . . . . . . . . . . . . . . . . . . . . . . . . . . . . . . . . 12
5 Methodology . . . . . . . . . . . . . . . . . . . . . . . . . . . . . . . . . . . . . . . . . . . . . . . . . . 155.1 Naıve Bayes . . . . . . . . . . . . . . . . . . . . . . . . . . . . . . . . . . . . . . . . . . . . . . 155.2 Logistic Regression . . . . . . . . . . . . . . . . . . . . . . . . . . . . . . . . . . . . . . . . 155.3 Decision Tree . . . . . . . . . . . . . . . . . . . . . . . . . . . . . . . . . . . . . . . . . . . . . 165.4 Random Forest . . . . . . . . . . . . . . . . . . . . . . . . . . . . . . . . . . . . . . . . . . . 165.5 Approach . . . . . . . . . . . . . . . . . . . . . . . . . . . . . . . . . . . . . . . . . . . . . . . . 17
6 Results . . . . . . . . . . . . . . . . . . . . . . . . . . . . . . . . . . . . . . . . . . . . . . . . . . . . . . . 187 Implementation . . . . . . . . . . . . . . . . . . . . . . . . . . . . . . . . . . . . . . . . . . . . . . . . 228 Conclusion and discussion . . . . . . . . . . . . . . . . . . . . . . . . . . . . . . . . . . . . . . . 239 Appendix . . . . . . . . . . . . . . . . . . . . . . . . . . . . . . . . . . . . . . . . . . . . . . . . . . . . . 25
1 Introduction
Selling the right room to the right customer at the right moment for the rightprice is the challenge in the hospitality industry. With revenue management(RM) strategies, hotels attempt to optimize their revenue with, for example,dynamic pricing and allocation (Talluri and van Ryzin [1]). The classical way ofRM in the hospitality industry is selling a fixed number (the capacity) of rooms,which are perishable at a fixed deadline (the booking horizon). Based on his-torical reservations, market information, guest information and more availableinformation, hotels choose optimal controls in the form of dynamic pricing andcapacity allocation to maximize their revenue. These controls are the price set-ting and availabilities for various room types. RM is mainly associated with theairline industry and hospitality industry, but it is also applied in the car rentalindustry and the financial sector.
In today’s world, hotels offer refundable and non-refundable rates to guests.Recently, there’s an increased interest in refundable rates, where guests still haveto possibility to cancel (last-minute). Whereas guests value the flexibility, hotelsare dealing with the risk of empty rooms, and thus loss of revenue, which is aproblem for the industry. As such, RM systems can be further improved by takingcancellations into account. High cancellation rates can lead to consequent lossof revenue due to empty rooms. With last-minute cancellations and ”no-shows”,the capacity allocation is no longer optimal because hotels do not succeed inattracting guests on such short notice.
There are roughly two ways of taking cancellations into account: first Raj-opadhye [2] introduced a new method of giving the RM system ”net demand”.Net demand is defined as the number of bookings minus the number of cancel-lations. A disadvantage of this method is that a part of the reality is neglected,which may result in adding uncertainty to the model. The second method isincorporating a cancellation predictor into the RM system. This approach cangive insights in the behavior of cancellations.
This paper describes an approach how an industry, such as hospitality, canovercome this problem by creating a cancellation predictor. This system allowscontrolled overbookings and relies on subsequent cancellations to keep the remai-ning number of bookings at the check-in date at, or just below, the capacity ofthe hotel. In order to have a successful overbooking policy, a prediction modelfor cancellations is key, where the focus of this paper is aimed at.
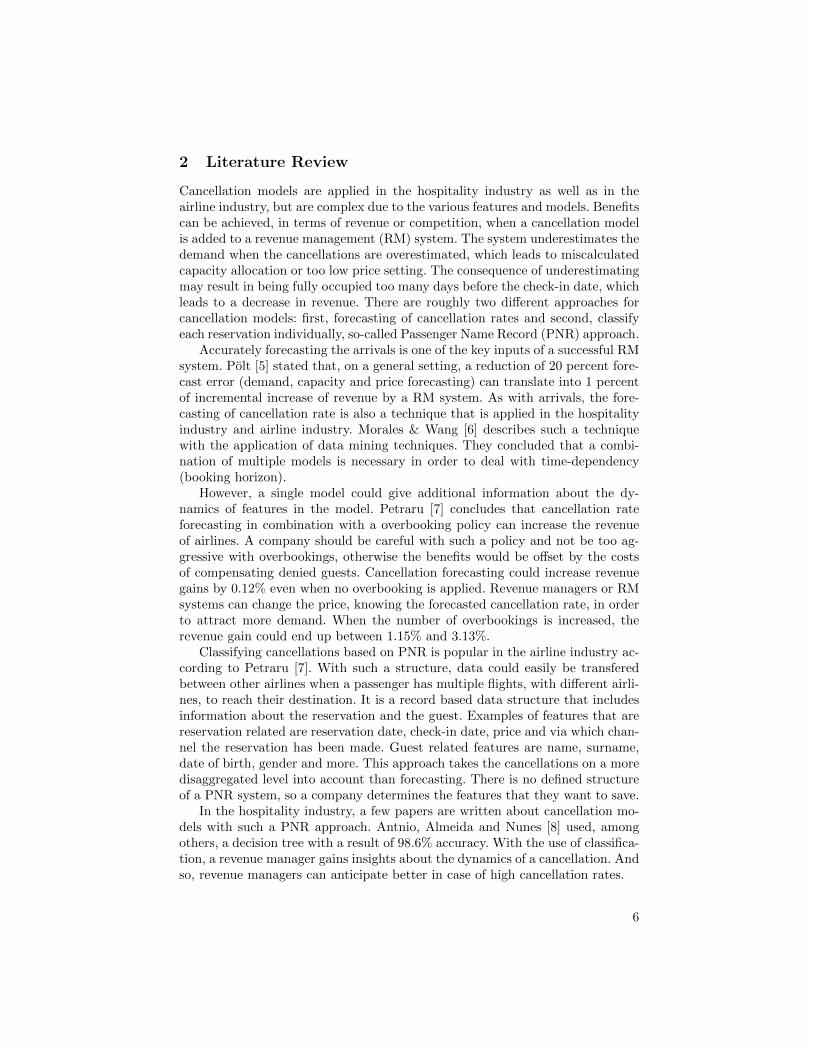
The reasons of cancellation may happen for multiple reasons: illness, badweather or a rescheduled meeting. Additionally, Chen and Xie (2013) and Chen,Schwartz, and Vargas [3] rightfully mention that cancellations occur due to deal-seeking customers via Online Traval Agencies, such as Booking.com and Expedia.This particular group of guests value the cancellation policies more than others.But it is fair to state that the hospitality sector does allow overbookings to cutdown the losses of cancellations. According to Rothstein [4], industries allowoverbookings since 1985. Even though there is a risk of having more arrivingguests than the capacity of the hotel.
4

To ensure optimal capacity allocation, the risks of overbooking have to bespecified and calculated. It may occur that there are not enough cancellationson the check-in date, and thus overbooking is a problem. In absence of ”last-minute”cancellations or ”no-shows”, a hotel may have out-of-order rooms thatcan be used in such emergency. As a second solution, a hotel could check if cus-tomers can go to another property of the same brand in the surrounding area.Third, it could be that an employee occupies a room in the hotel. Then theemployee could go to another property to ensure the guests stay at the hotelwhere they originally made the reservation. If all aforementioned options areunavailable, then the hotel manager needs to make a reservation at its compe-titor. Because a customer expects a certain quality level, the competitor shouldcomply with this level. Additionally, the hotel manager can compensate for theinconvenience by offering vouchers, discounts at bars or a night for free to thecustomer. Because of the additional costs of overbooking and potential reputa-tion damage, it is important to keep the risk of overbooking low.
The remaining part of the paper is structured as follows. In Section 2, severalapproaches and their corresponding cancellation models are discussed. An over-view of the available data and an explanatory analysis are presented in Section3. In Section 4, the data preprocessing is described. This is an important stepfor every machine learning algorithm: creating the input and selecting availabledata. The methodology is described in Section 5. Section 6 is dedicated to theimplementation of the model. In Section 7, the results are presented. Finally,Section 8 includes the conclusion and discussion.
5
2 Literature Review
Cancellation models are applied in the hospitality industry as well as in theairline industry, but are complex due to the various features and models. Benefitscan be achieved, in terms of revenue or competition, when a cancellation modelis added to a revenue management (RM) system. The system underestimates thedemand when the cancellations are overestimated, which leads to miscalculatedcapacity allocation or too low price setting. The consequence of underestimatingmay result in being fully occupied too many days before the check-in date, whichleads to a decrease in revenue. There are roughly two different approaches forcancellation models: first, forecasting of cancellation rates and second, classifyeach reservation individually, so-called Passenger Name Record (PNR) approach.
Accurately forecasting the arrivals is one of the key inputs of a successful RMsystem. Polt [5] stated that, on a general setting, a reduction of 20 percent fore-cast error (demand, capacity and price forecasting) can translate into 1 percentof incremental increase of revenue by a RM system. As with arrivals, the fore-casting of cancellation rate is also a technique that is applied in the hospitalityindustry and airline industry. Morales & Wang [6] describes such a techniquewith the application of data mining techniques. They concluded that a combi-nation of multiple models is necessary in order to deal with time-dependency(booking horizon).
However, a single model could give additional information about the dy-namics of features in the model. Petraru [7] concludes that cancellation rateforecasting in combination with a overbooking policy can increase the revenueof airlines. A company should be careful with such a policy and not be too ag-gressive with overbookings, otherwise the benefits would be offset by the costsof compensating denied guests. Cancellation forecasting could increase revenuegains by 0.12% even when no overbooking is applied. Revenue managers or RMsystems can change the price, knowing the forecasted cancellation rate, in orderto attract more demand. When the number of overbookings is increased, therevenue gain could end up between 1.15% and 3.13%.
Classifying cancellations based on PNR is popular in the airline industry ac-cording to Petraru [7]. With such a structure, data could easily be transferedbetween other airlines when a passenger has multiple flights, with different airli-nes, to reach their destination. It is a record based data structure that includesinformation about the reservation and the guest. Examples of features that arereservation related are reservation date, check-in date, price and via which chan-nel the reservation has been made. Guest related features are name, surname,date of birth, gender and more. This approach takes the cancellations on a moredisaggregated level into account than forecasting. There is no defined structureof a PNR system, so a company determines the features that they want to save.
In the hospitality industry, a few papers are written about cancellation mo-dels with such a PNR approach. Antnio, Almeida and Nunes [8] used, amongothers, a decision tree with a result of 98.6% accuracy. With the use of classifica-tion, a revenue manager gains insights about the dynamics of a cancellation. Andso, revenue managers can anticipate better in case of high cancellation rates.
6
3 Data
3.1 Available Data
For this article, data of an international hospitality company is available, con-taining reservation data and guest data. The guest data is connected to thereservation data via an unique key. In this section, the available features aredescribed and basic statistics are presented.
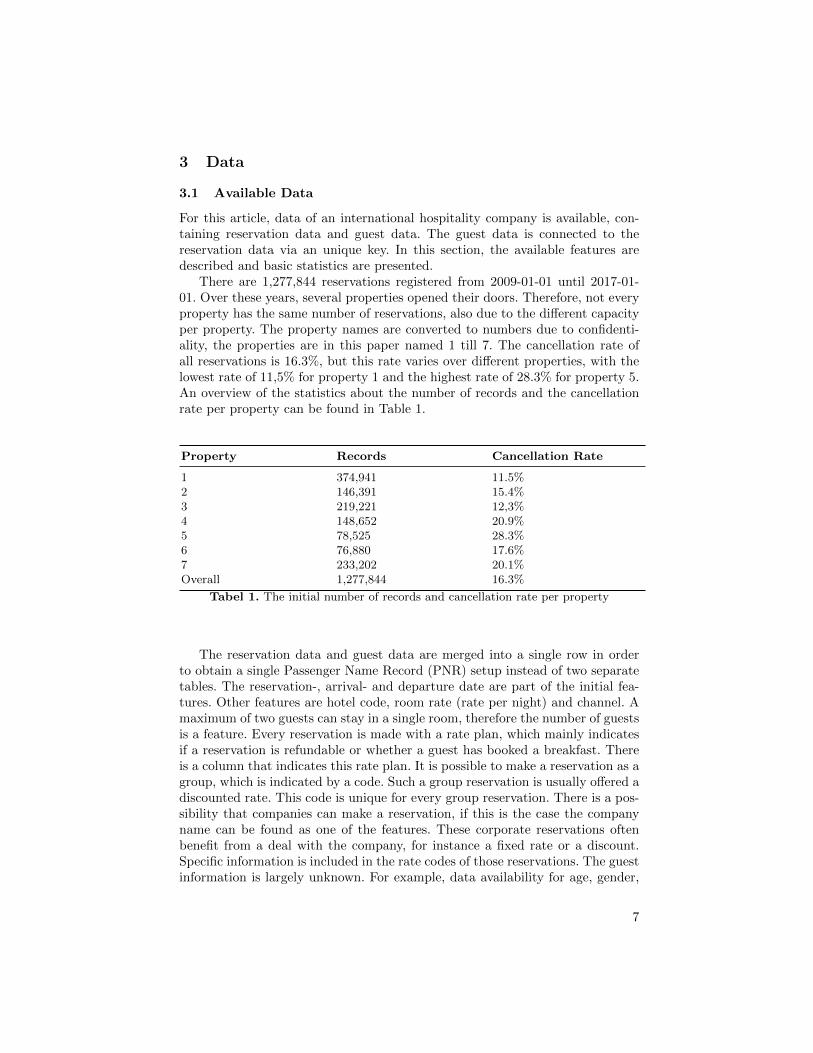
There are 1,277,844 reservations registered from 2009-01-01 until 2017-01-01. Over these years, several properties opened their doors. Therefore, not everyproperty has the same number of reservations, also due to the different capacityper property. The property names are converted to numbers due to confidenti-ality, the properties are in this paper named 1 till 7. The cancellation rate ofall reservations is 16.3%, but this rate varies over different properties, with thelowest rate of 11,5% for property 1 and the highest rate of 28.3% for property 5.An overview of the statistics about the number of records and the cancellationrate per property can be found in Table 1.
Property Records Cancellation Rate
1 374,941 11.5%2 146,391 15.4%3 219,221 12,3%4 148,652 20.9%5 78,525 28.3%6 76,880 17.6%7 233,202 20.1%Overall 1,277,844 16.3%
Tabel 1. The initial number of records and cancellation rate per property
The reservation data and guest data are merged into a single row in orderto obtain a single Passenger Name Record (PNR) setup instead of two separatetables. The reservation-, arrival- and departure date are part of the initial fea-tures. Other features are hotel code, room rate (rate per night) and channel. Amaximum of two guests can stay in a single room, therefore the number of guestsis a feature. Every reservation is made with a rate plan, which mainly indicatesif a reservation is refundable or whether a guest has booked a breakfast. Thereis a column that indicates this rate plan. It is possible to make a reservation as agroup, which is indicated by a code. Such a group reservation is usually offered adiscounted rate. This code is unique for every group reservation. There is a pos-sibility that companies can make a reservation, if this is the case the companyname can be found as one of the features. These corporate reservations oftenbenefit from a deal with the company, for instance a fixed rate or a discount.Specific information is included in the rate codes of those reservations. The guestinformation is largely unknown. For example, data availability for age, gender,
7
and city is only 0.01%, 4.3%, and 4.4%, respectively. For this reason only theemail address is taken into account in order to calculate repeat percentages. Thelast feature is the status of the reservation that indicates if there was a check-out,cancellation or no-show.
3.2 Exploratory data analysis
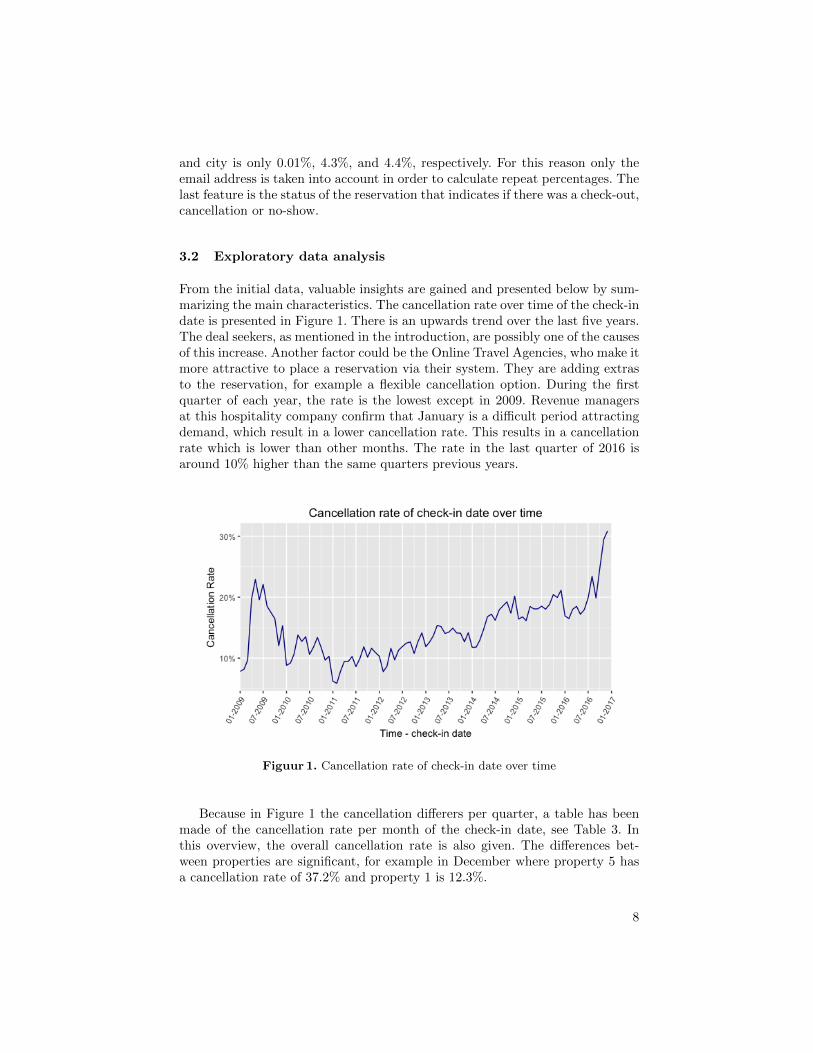
From the initial data, valuable insights are gained and presented below by sum-marizing the main characteristics. The cancellation rate over time of the check-indate is presented in Figure 1. There is an upwards trend over the last five years.The deal seekers, as mentioned in the introduction, are possibly one of the causesof this increase. Another factor could be the Online Travel Agencies, who make itmore attractive to place a reservation via their system. They are adding extrasto the reservation, for example a flexible cancellation option. During the firstquarter of each year, the rate is the lowest except in 2009. Revenue managersat this hospitality company confirm that January is a difficult period attractingdemand, which result in a lower cancellation rate. This results in a cancellationrate which is lower than other months. The rate in the last quarter of 2016 isaround 10% higher than the same quarters previous years.
Figuur 1. Cancellation rate of check-in date over time
Because in Figure 1 the cancellation differers per quarter, a table has beenmade of the cancellation rate per month of the check-in date, see Table 3. Inthis overview, the overall cancellation rate is also given. The differences bet-ween properties are significant, for example in December where property 5 hasa cancellation rate of 37.2% and property 1 is 12.3%.
8
Property Jan Feb Mar Apr May June July Aug Sept Oct Nov Dec
1 10.6 10.1 10.8 13.0 12.2 11.6 10.3 11.3 12.5 11.6 12.4 12.32 14.5 14.3 13.9 14.9 14.5 16.4 13.7 14.3 16.8 16.3 18.7 16.13 10.7 11.1 12.2 11.3 10.8 11.7 12.1 14.2 14.2 12.9 12.8 14.04 17.9 18.7 19.7 20.3 21.6 22.2 22.5 23.0 20.4 20.8 19.2 24.15 30.2 26.0 27.7 24.3 25.3 24.1 26.5 27.3 29.1 31.7 30.9 37.26 12.4 14.6 15.4 17.0 16.8 16.3 21.6 16.1 18.8 26.8 16.3 18.77 19.2 20.5 18.3 20.3 17.4 21.8 21.7 22.2 21.6 21.6 18.3 20.0Overall 14.3 14.2 15.1 16.7 16.3 16.3 16.1 16.8 17.1 17.5 16.6 18.4
Tabel 2. Cancellation rate per month per property and overall
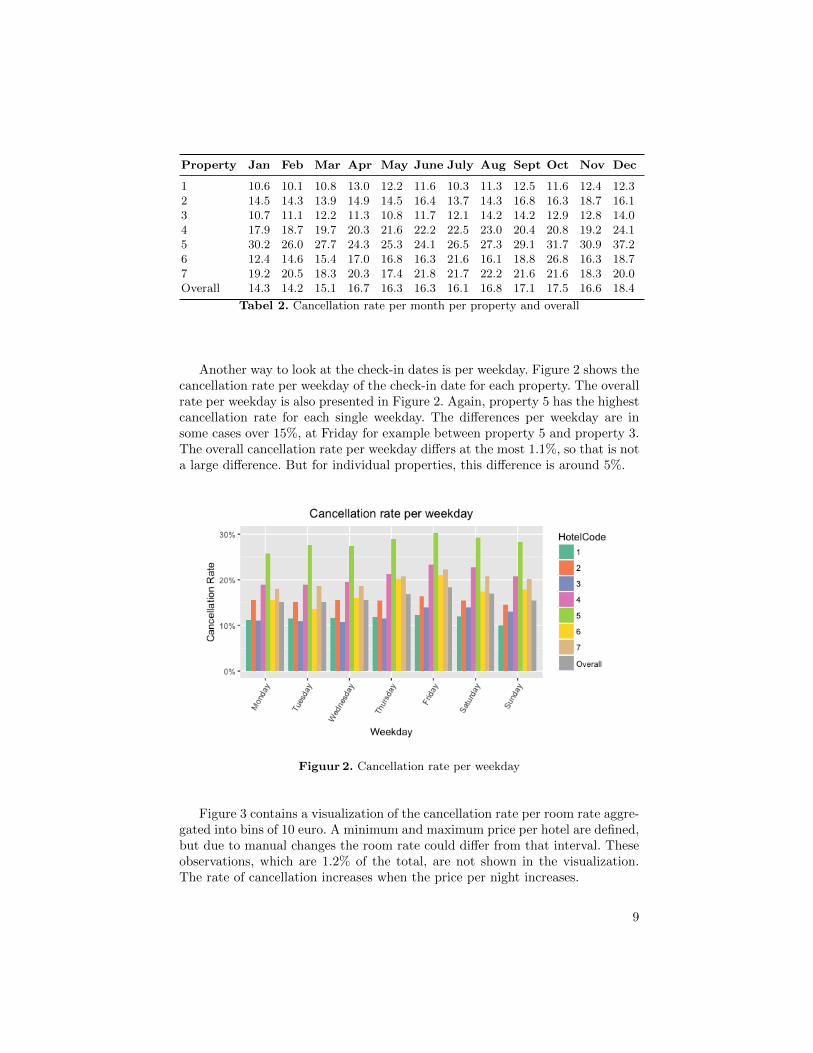
Another way to look at the check-in dates is per weekday. Figure 2 shows thecancellation rate per weekday of the check-in date for each property. The overallrate per weekday is also presented in Figure 2. Again, property 5 has the highestcancellation rate for each single weekday. The differences per weekday are insome cases over 15%, at Friday for example between property 5 and property 3.The overall cancellation rate per weekday differs at the most 1.1%, so that is nota large difference. But for individual properties, this difference is around 5%.
Figuur 2. Cancellation rate per weekday
Figure 3 contains a visualization of the cancellation rate per room rate aggre-gated into bins of 10 euro. A minimum and maximum price per hotel are defined,but due to manual changes the room rate could differ from that interval. Theseobservations, which are 1.2% of the total, are not shown in the visualization.The rate of cancellation increases when the price per night increases.
9
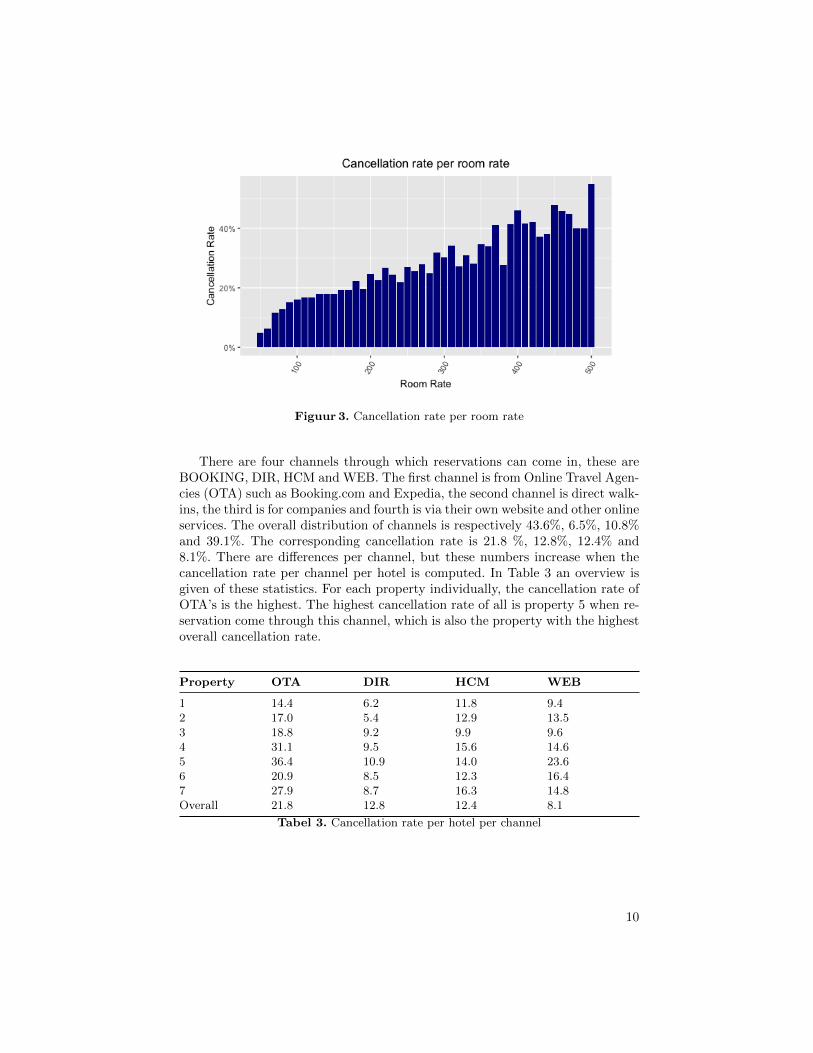
Figuur 3. Cancellation rate per room rate
There are four channels through which reservations can come in, these areBOOKING, DIR, HCM and WEB. The first channel is from Online Travel Agen-cies (OTA) such as Booking.com and Expedia, the second channel is direct walk-ins, the third is for companies and fourth is via their own website and other onlineservices. The overall distribution of channels is respectively 43.6%, 6.5%, 10.8%and 39.1%. The corresponding cancellation rate is 21.8 %, 12.8%, 12.4% and8.1%. There are differences per channel, but these numbers increase when thecancellation rate per channel per hotel is computed. In Table 3 an overview isgiven of these statistics. For each property individually, the cancellation rate ofOTA’s is the highest. The highest cancellation rate of all is property 5 when re-servation come through this channel, which is also the property with the highestoverall cancellation rate.
Property OTA DIR HCM WEB
1 14.4 6.2 11.8 9.42 17.0 5.4 12.9 13.53 18.8 9.2 9.9 9.64 31.1 9.5 15.6 14.65 36.4 10.9 14.0 23.66 20.9 8.5 12.3 16.47 27.9 8.7 16.3 14.8Overall 21.8 12.8 12.4 8.1
Tabel 3. Cancellation rate per hotel per channel
10
4 Processing
4.1 Feature Engineering
The creation of new features can boost the performance of a model. Howbert[9] states that well-conceived new features can sometimes capture the importantinformation in a dataset much more effective than the original features. This canbe achieved by creating a new feature or map exiting features to new space forexample. From the initial features, new features are created.
A date by itself cannot be used in classification problem. However, datescan be transformed to categories, such as weekday. As shown in Section 3, themonth and weekday of the check-in date can contain differences between pro-perties which can be valuable for a model. The weekday and month is derivedfrom reservation date, check-in date and check-out date. Resulting in six newfeatures, which are named as follows ReservationMonth, ReservationWeekday,ArrivalMonth, ArrivalWeekday, DepartureMonth and DepartureWeekday.
The number of days between dates can be a new feature, for example thelength of stay and the lead time. The length of stay is defined as the number ofnights a guest is planned to stay. The lead time is defined as the number of daysbetween reservation date and arrival date. Another feature that was created iscalled NumBusinessNights, which is the number of business night. A night of theweek is defined as a business night if the night is between Monday and Thursday.
An algorithm does not gain information of different group codes or companycodes. Therefore, these numbers are translated to binary columns, because groupcodes are unique and company codes are unique per company. Both columnindicate whenever the reservation is part of a group reservation or a companyreservation.
The feature RateCode has 353 unique values, 65.4% of these unique valuesoccur less than 100 times. These codes change over time and many of theseare not used for several years, for example with an opening of a property in2011. However, each of them defines if the reservation is refundable. For thisreason, RateCode is changed to a binary column where 1 is refundable and 0 isnon-refundable reservation.
Unfortunately, the quality of demographic information of guests is poor.However, every email address has a domain, for example .nl for email addres-ses from the Netherlands or .uk for email addresses from Great Britain. Eachreservation has a feature CountryCode which contains the country of the emaildomain. There are 194 unique CountryCodes matched to all the email address.There are some domains which does not belong to a country, such as .com or.net. These domains are labeled otherwise, respectively Commercial or Network.Table 9, which can be found in the Appendix, contains the top 20 frequency ofthe column CountryCode, which covers 90.3% of the records. The goals is tosee if a machine learning technique finds dependency between cancellation andCountryCode.
The final added features contain information about repeats and cancellations,which are based on email address. One of the repeat features is based on chain
11

level and the other on hotel level. The same as for the cancellation features.In total there are four new features added, named RepeatChain, RepeatHotel,CancellationsChain, CancellationsHotel. These features will be set to 0 for a newcustomer, because now a model is still able to classify the new instance. Ideally,the outcome for a hospitality company is that the higher number of repeats,the cancellation rate lowers. With such an outcome companies can measure theloyalty of their guests. Tepeci [10] states that a loyalty program is more profitablethan other marketing activities, such as price cuts or promotional programs.In Figure 4, the cancellation rate the repeat number 1 to 10 on chain level isvisualized, the rate fluctuates between 16% and 23 %. The number of repeatshas been set to a maximum of 10, due to readability of the graph.
Figuur 4. Cancellation rate per repeat on chain level
4.2 Selection
The overall quality of the data is high, but some features require a selection.A subset selection reduces the dimensionality of the data or feature withoutcreating new features. According to Howbert [9], a selection can be beneficial ifredundant, irrelevant or noisy features are removed. All in order to speed up thelearning process of the model, enhance generalization and alleviate the curse ofdimensionality.
The first step in the selection process is deleting test reservations, which aremade to test the system. The RateCode tells whenever a record was a test, thereare 1308 records removed from the dataset.
A revenue manager should know in advance how many reservations are likelyto cancel otherwise no actions can be executed to counter empty rooms. There
12

are some records that have a negative lead time. This implies that first a gueststayed in the hotel and after or during the stay placed a reservation. Variousminor technical reasons or situations could cause this, for example a reservationis extended with a few nights. Therefore, the records with a lead time smallerthan 0 are excluded from the dataset, since it is 35,293 and 3.3% of these recordsis canceled.
The room rate is bounded by the minimum and maximum price, which isdifferent for each property. These boundaries reduces 1.2% of the total amountof reservation. These deviations are caused by manual changes of employees ofthe company. There is no log of the original price, unfortunately the rate couldnot be restored. The number of records is unknown which are manually changedand are still in between the bounds.
Because this paper uses the Passenger Name Record (PNR) approach, therecords without a email address are removed from the dataset since the repeatstatistics are based on email address. In total there are 96,451 records removed,which is 7.5% of the total amount.
Besides removing records, a limit can be set to the maximum number ofunique values of a feature. The feature CountryCode needs such a limit sincethere are 194 different domains labeled. Some of the values only occur one,therefore a limit will be set to the maximum of 20. The rest of the 9.7% will beset at a new category ’Other’. This is also applied on the Channel feature, whichis discussed in Section 3. As with the CountryCode, the maximum number ofrepeats are set to a maximum of 10.
From the creation of features, records can be detected that contains a error.For example with the creation of the LeadTime feature. In some cases, the leadtime was below zero. Which is not possible, because it implies that a guest firststayed in a hotel and later on a reservation was made. These reservations areremoved from the data set.
In the end, 17.5% records are removed from the dataset. The number ofremaining records per property can be found in Table 10, in the Appendix withthe corresponding reduction per property. There are still over a million reserva-tion in the data set available where the algorithms can be trained and tested on.All of the feature engineering and selection has been done with the use of SQLServer. Table 4 shows an overview of the features, types, possible values and adescription. This is the set of features that will be used as input for each of themachine learning algorithms.
13
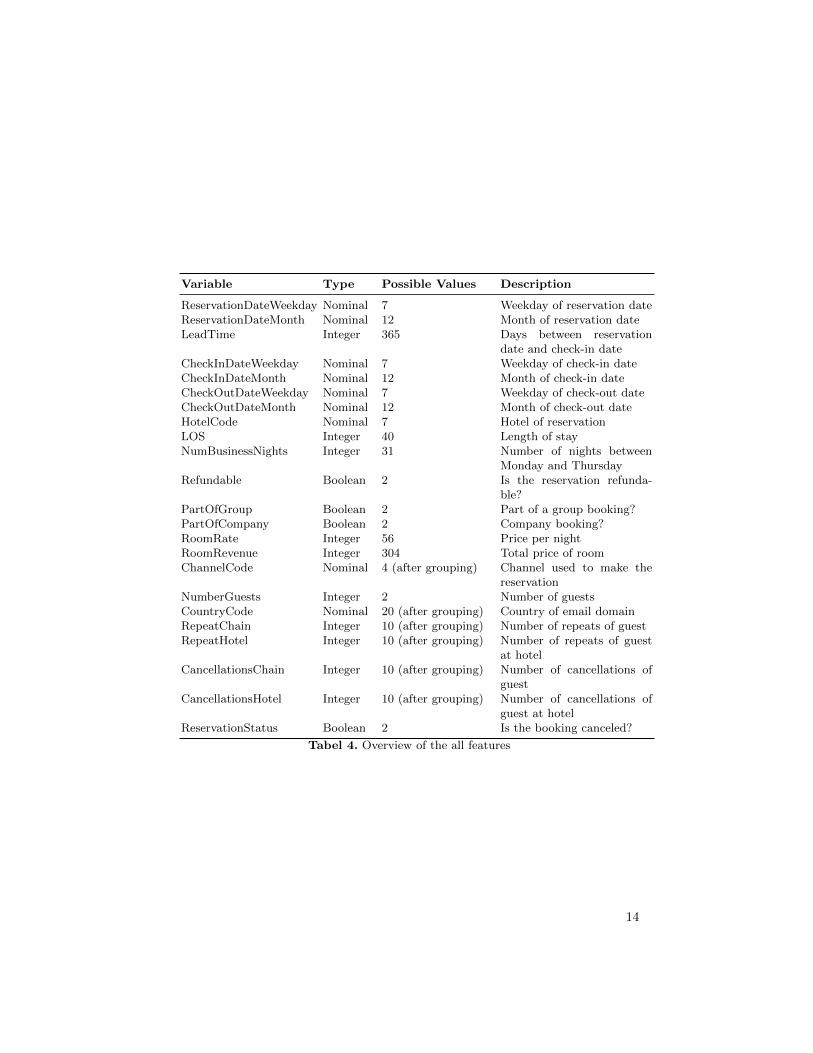
Variable Type Possible Values Description
ReservationDateWeekday Nominal 7 Weekday of reservation dateReservationDateMonth Nominal 12 Month of reservation dateLeadTime Integer 365 Days between reservation
date and check-in dateCheckInDateWeekday Nominal 7 Weekday of check-in dateCheckInDateMonth Nominal 12 Month of check-in dateCheckOutDateWeekday Nominal 7 Weekday of check-out dateCheckOutDateMonth Nominal 12 Month of check-out dateHotelCode Nominal 7 Hotel of reservationLOS Integer 40 Length of stayNumBusinessNights Integer 31 Number of nights between
Monday and ThursdayRefundable Boolean 2 Is the reservation refunda-
ble?PartOfGroup Boolean 2 Part of a group booking?PartOfCompany Boolean 2 Company booking?RoomRate Integer 56 Price per nightRoomRevenue Integer 304 Total price of roomChannelCode Nominal 4 (after grouping) Channel used to make the
reservationNumberGuests Integer 2 Number of guestsCountryCode Nominal 20 (after grouping) Country of email domainRepeatChain Integer 10 (after grouping) Number of repeats of guestRepeatHotel Integer 10 (after grouping) Number of repeats of guest
at hotelCancellationsChain Integer 10 (after grouping) Number of cancellations of
guestCancellationsHotel Integer 10 (after grouping) Number of cancellations of
guest at hotelReservationStatus Boolean 2 Is the booking canceled?
Tabel 4. Overview of the all features
14
5 Methodology
The input and output of the model is defined in the previous sections, therefore itis a supervised classification problem. Supervised learning is the machine learningtask of mapping a function to labeled training data, according to Mohri et al. [11].This way of classification will analyses the training data and apply the mappedfunction to new data examples. The ideal outcome is that the mapped functionwill accurately classify unseen data points. Generally, the input is transformedinto a vector of features. Attention should be paid to the number of input featuresdue to the curse of dimensionality, but there should be enough information toaccurately classify the new data point. According to Bellman [12], the curse ofdimensionally occurs when data in high-dimensional spaces get analyzed.
5.1 Naıve Bayes
The Naıve Bayes model is a probabilistic classifier based on Bayes’ theorem.This theorem estimates the probability of an event based on prior knowledgethat are associated to that event such as features. Equation (1) describes Bayes’theorem with the assumptions that A and B are events and P (B) 6= 0.
P (A|B) =P (B|A)P (A)
P (B)(1)
To break down Equation (1), P (A) and P (B) are the observation of A andB without regard of each other. The conditional probability is P (B|A), theprobability of event B given A. And, P (A|B) is the probability of event A givenB. In a Naıve Bayes model, A is defined as the possible outcome classes, for thisproblem it is ’1’ or ’0’, and B is defined as a vector of the n features that areknown.
One of the advantages of a Naıve Bayes classifier is the ability to convergequickly and it is easy to implement, which makes it possible to be trained moreoften than other algorithms. While this model is typically seen as a simple one,it may still perform as good as, perhaps even better, than a more complexmodel. The simplicity may be seen as an advantage: easy to understand or adisadvantage: the algorithm may be too simplistic.
5.2 Logistic Regression
Logistic regression is a type of regression model where the dependent variable iscategorical, which is in this paper a binary variable ’1’ and ’0’ that is representingif the reservation is canceled yes/no. The model was developed by Cox in 1958[13]. The model estimates the probability of a binary response. These type ofmodels can handle features that are continuous and/or categorical.
The model uses a logistic function to estimate these probabilities. The inputis any real input t. The function is defined as Equation (2).
15
σ(t) =1
1 + e−t(2)
In order to improve these models, the logarithm of numerical features areadded. From the Table 4, there are 10 features which are integer. So, there areten new features added for this model.
The advantage of logistic regression is that the outcome is a probability,therefore the classification the border for ’1’ or ’0’ can be shifted to an optimum.Typically, the variance of such a model is low, which makes it more robust tonoise in the dataset. The trade off is, in general, a higher bias, which is missingrelevant relations between features.
5.3 Decision Tree
A decision tree is an algorithm that builds a flow-chart like illustration that showsa possible outcome of a decision. In order to build a tree, the algorithm findsvariables that separate the data into two groups the best. The algorithm preferssplits such that it classifies the maximum number of observation correctly. Thisstep is repeated until the stopping criteria have been met, which are a minimumnumber of observations per category before attempting to split the tree and asplit must decrease the overall lack of fit by a factor. The latter is also knownas the cost complexity factor. A decision tree is know for a low bias but a highvariance.
An advantage of this algorithm is that the graphical representation makesit intuitive to understand, which is a plus for revenue managers because theytypically do not have experience in machine learning algorithms. A disadvantagecould be over fitting, because a tree can easily grow. This downside can becountered by the stopping criteria or by applying a random forest, which isexplained in the next subsection.
5.4 Random Forest
Random forest is an ensemble approach that operates by composing a aggrega-tion of decision trees. Ho [16] came in 1995 with a first idea of random decisionforests but Breiman [17] extended that idea in 2001 as what now is known as therandom forest algorithm. The principle behind ensemble methods is combining’weak’ learners in order to form together a ’strong’ learner. A sample is takenfrom the data, and the tree will be built with that sample. Every time a newsample is taken, and so a new tree is built. The number of trees is a setting ofthe algorithm. When a new input is presented to the random forest, it will beclassified by each of the trees. The average of the outcome will be taken and sothe new input will be classified.
One of the advantages is a fast runtime and it counters overfitting. Butthe more trees there are set to train the model, the longer it takes to predictnew data. Generally, in practical situations it is fast enough, but the run-timeperformance should be taken into consideration.
16
5.5 Approach
Cross-validation is applied to evaluate the performance of the models, to bemore specific k-fold cross-validation, described by Hastie et al. [14] . Smola andVishwanathan [15] showed that k-fold cross-validation can be computationallyexpense. But it overcomes the threat of overfitting of a model, for this researchk = 10 is taken. The idea behind this technique is splitting k times the datasetinto a training set and test set. These sets are respectively 80% of the totalrecords of a property and 20% of the total records of a property. Each model istrained on the same training set and tested on the same test set. The accuracyof each outcome will be computed. Eventually, the models are hold against abenchmark to rank the models. The benchmark is defined as the accuracy ifthe are no predicted cancellations. The benchmark per property is derived fromthe CancellationRate column of Table 1. Next to the accuracy, the precisionand recall is computed. The precision is defined as the percentage of correctlyclassified instances decided by the total number of test instances. Recall is alsoknown as the sensitivity, which is the number of true positives divided by allcorrectly classified test instances. A measurement that contains the precision andrecall is the F-score, which is a score about the test’s accuracy. For completeness,the confusion matrix is also shown in Section 7. From the confusion matrix, theabove three measurements are computed.
Models will be created for each property individually since the differencesbetween models are significant for several features, for example the cancellationrate per month differs over 15%. As an initial model, a Naıve Bayes classifierhas been used to confirm this initial thought. The benchmark, after the cleaningand selection, is 83.7%. A general model has been made and the accuracy is80.4%. There is a difference of 3.3% between the benchmark and the accuracy.But when a model is created for each hotel, the difference, for each hotel, issmaller than 3.3%. Further results are presented in Section 8.
By applying machine learning algorithms to each property, the dynamicsbetween features per property can be highlighted. These dynamics will help therevenue managers to understand whenever the cancellations act in similar wayfor different properties. The importance tells which features are used in the modeland which are not. Each feature will get a score and the five highest ranked scoresper property per model are presented in tables in Section 8. This importancecan be extracted for logistic regression, decision tree and random forest. It isimpossible to make a ranking between the features of the Naıve Bayes model.Because only the a-priori probabilities could be extracted from each model. Thatis, how frequently each level of class occurs in the training dataset. But this doesnot indicate the importance of the features of the Naıve Bayes model.
17
6 Results
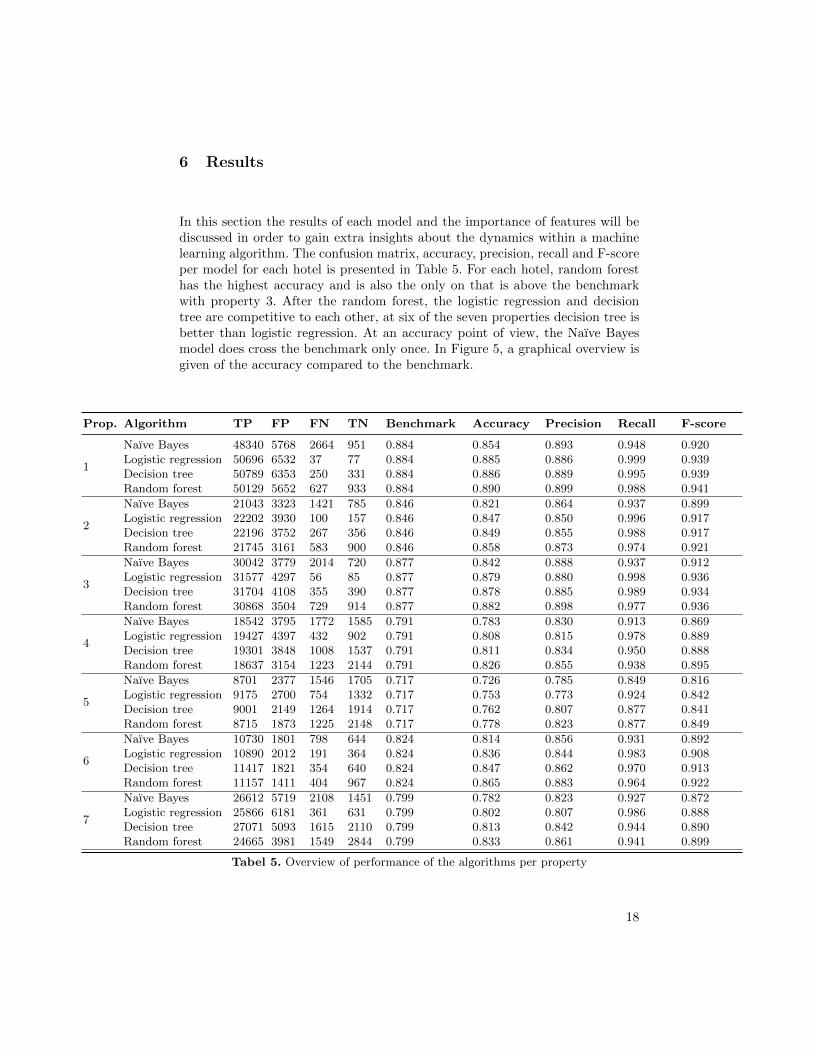
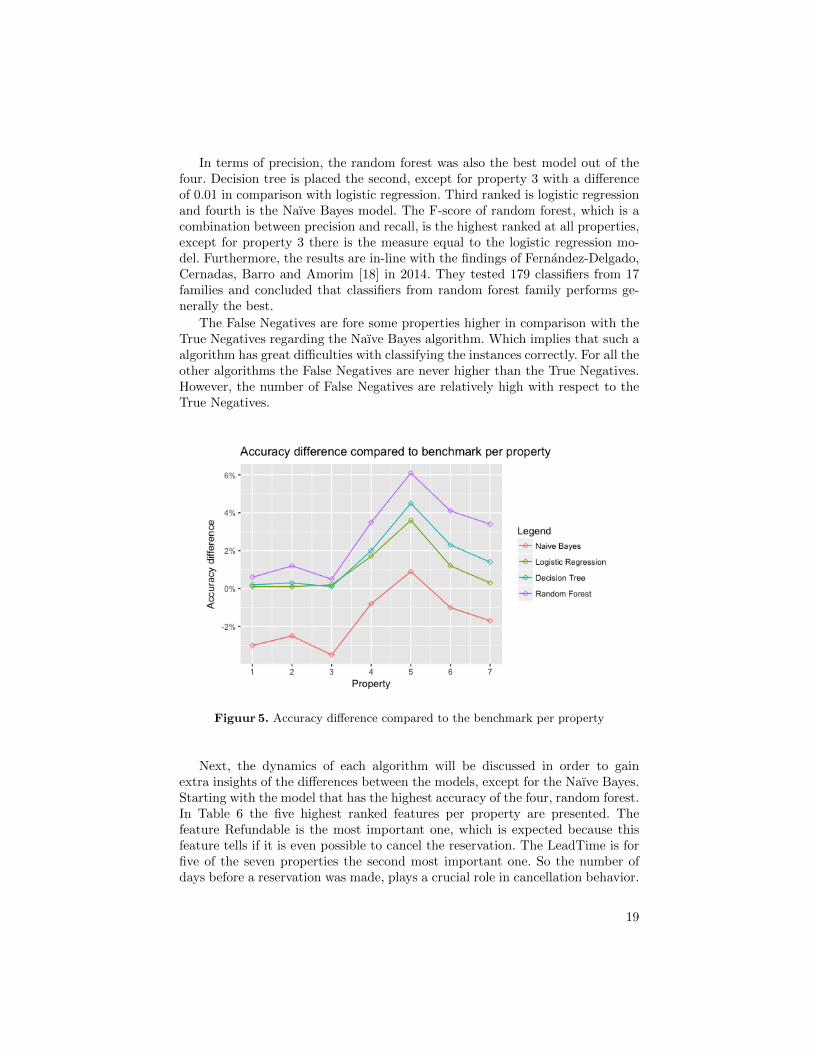
In this section the results of each model and the importance of features will bediscussed in order to gain extra insights about the dynamics within a machinelearning algorithm. The confusion matrix, accuracy, precision, recall and F-scoreper model for each hotel is presented in Table 5. For each hotel, random foresthas the highest accuracy and is also the only on that is above the benchmarkwith property 3. After the random forest, the logistic regression and decisiontree are competitive to each other, at six of the seven properties decision tree isbetter than logistic regression. At an accuracy point of view, the Naıve Bayesmodel does cross the benchmark only once. In Figure 5, a graphical overview isgiven of the accuracy compared to the benchmark.
Prop. Algorithm TP FP FN TN Benchmark Accuracy Precision Recall F-score
1
Naıve Bayes 48340 5768 2664 951 0.884 0.854 0.893 0.948 0.920Logistic regression 50696 6532 37 77 0.884 0.885 0.886 0.999 0.939Decision tree 50789 6353 250 331 0.884 0.886 0.889 0.995 0.939Random forest 50129 5652 627 933 0.884 0.890 0.899 0.988 0.941
2
Naıve Bayes 21043 3323 1421 785 0.846 0.821 0.864 0.937 0.899Logistic regression 22202 3930 100 157 0.846 0.847 0.850 0.996 0.917Decision tree 22196 3752 267 356 0.846 0.849 0.855 0.988 0.917Random forest 21745 3161 583 900 0.846 0.858 0.873 0.974 0.921
3
Naıve Bayes 30042 3779 2014 720 0.877 0.842 0.888 0.937 0.912Logistic regression 31577 4297 56 85 0.877 0.879 0.880 0.998 0.936Decision tree 31704 4108 355 390 0.877 0.878 0.885 0.989 0.934Random forest 30868 3504 729 914 0.877 0.882 0.898 0.977 0.936
4
Naıve Bayes 18542 3795 1772 1585 0.791 0.783 0.830 0.913 0.869Logistic regression 19427 4397 432 902 0.791 0.808 0.815 0.978 0.889Decision tree 19301 3848 1008 1537 0.791 0.811 0.834 0.950 0.888Random forest 18637 3154 1223 2144 0.791 0.826 0.855 0.938 0.895
5
Naıve Bayes 8701 2377 1546 1705 0.717 0.726 0.785 0.849 0.816Logistic regression 9175 2700 754 1332 0.717 0.753 0.773 0.924 0.842Decision tree 9001 2149 1264 1914 0.717 0.762 0.807 0.877 0.841Random forest 8715 1873 1225 2148 0.717 0.778 0.823 0.877 0.849
6
Naıve Bayes 10730 1801 798 644 0.824 0.814 0.856 0.931 0.892Logistic regression 10890 2012 191 364 0.824 0.836 0.844 0.983 0.908Decision tree 11417 1821 354 640 0.824 0.847 0.862 0.970 0.913Random forest 11157 1411 404 967 0.824 0.865 0.883 0.964 0.922
7
Naıve Bayes 26612 5719 2108 1451 0.799 0.782 0.823 0.927 0.872Logistic regression 25866 6181 361 631 0.799 0.802 0.807 0.986 0.888Decision tree 27071 5093 1615 2110 0.799 0.813 0.842 0.944 0.890Random forest 24665 3981 1549 2844 0.799 0.833 0.861 0.941 0.899
Tabel 5. Overview of performance of the algorithms per property
18
In terms of precision, the random forest was also the best model out of thefour. Decision tree is placed the second, except for property 3 with a differenceof 0.01 in comparison with logistic regression. Third ranked is logistic regressionand fourth is the Naıve Bayes model. The F-score of random forest, which is acombination between precision and recall, is the highest ranked at all properties,except for property 3 there is the measure equal to the logistic regression mo-del. Furthermore, the results are in-line with the findings of Fernandez-Delgado,Cernadas, Barro and Amorim [18] in 2014. They tested 179 classifiers from 17families and concluded that classifiers from random forest family performs ge-nerally the best.
The False Negatives are fore some properties higher in comparison with theTrue Negatives regarding the Naıve Bayes algorithm. Which implies that such aalgorithm has great difficulties with classifying the instances correctly. For all theother algorithms the False Negatives are never higher than the True Negatives.However, the number of False Negatives are relatively high with respect to theTrue Negatives.
Figuur 5. Accuracy difference compared to the benchmark per property
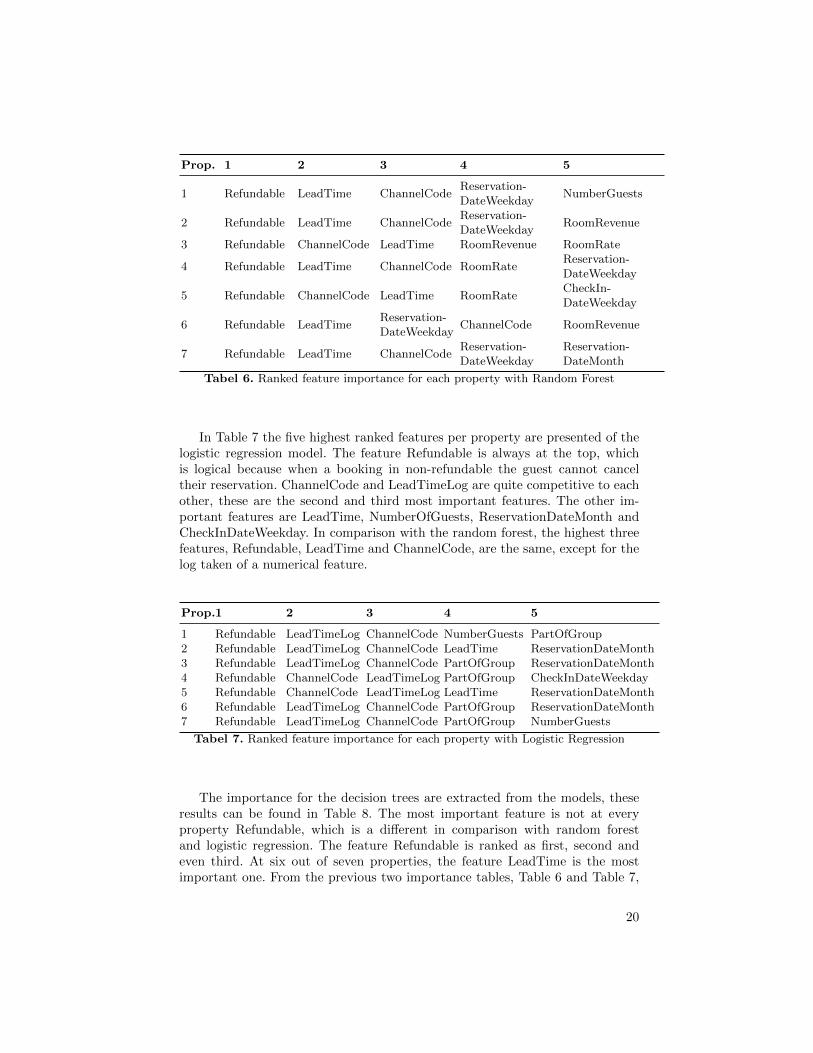
Next, the dynamics of each algorithm will be discussed in order to gainextra insights of the differences between the models, except for the Naıve Bayes.Starting with the model that has the highest accuracy of the four, random forest.In Table 6 the five highest ranked features per property are presented. Thefeature Refundable is the most important one, which is expected because thisfeature tells if it is even possible to cancel the reservation. The LeadTime is forfive of the seven properties the second most important one. So the number ofdays before a reservation was made, plays a crucial role in cancellation behavior.
19
Prop. 1 2 3 4 5
1 Refundable LeadTime ChannelCodeReservation-DateWeekday
NumberGuests
2 Refundable LeadTime ChannelCodeReservation-DateWeekday
RoomRevenue
3 Refundable ChannelCode LeadTime RoomRevenue RoomRate
4 Refundable LeadTime ChannelCode RoomRateReservation-DateWeekday
5 Refundable ChannelCode LeadTime RoomRateCheckIn-DateWeekday
6 Refundable LeadTimeReservation-DateWeekday
ChannelCode RoomRevenue
7 Refundable LeadTime ChannelCodeReservation-DateWeekday
Reservation-DateMonth
Tabel 6. Ranked feature importance for each property with Random Forest
In Table 7 the five highest ranked features per property are presented of thelogistic regression model. The feature Refundable is always at the top, whichis logical because when a booking in non-refundable the guest cannot canceltheir reservation. ChannelCode and LeadTimeLog are quite competitive to eachother, these are the second and third most important features. The other im-portant features are LeadTime, NumberOfGuests, ReservationDateMonth andCheckInDateWeekday. In comparison with the random forest, the highest threefeatures, Refundable, LeadTime and ChannelCode, are the same, except for thelog taken of a numerical feature.
Prop.1 2 3 4 5
1 Refundable LeadTimeLog ChannelCode NumberGuests PartOfGroup2 Refundable LeadTimeLog ChannelCode LeadTime ReservationDateMonth3 Refundable LeadTimeLog ChannelCode PartOfGroup ReservationDateMonth4 Refundable ChannelCode LeadTimeLog PartOfGroup CheckInDateWeekday5 Refundable ChannelCode LeadTimeLog LeadTime ReservationDateMonth6 Refundable LeadTimeLog ChannelCode PartOfGroup ReservationDateMonth7 Refundable LeadTimeLog ChannelCode PartOfGroup NumberGuests
Tabel 7. Ranked feature importance for each property with Logistic Regression
The importance for the decision trees are extracted from the models, theseresults can be found in Table 8. The most important feature is not at everyproperty Refundable, which is a different in comparison with random forestand logistic regression. The feature Refundable is ranked as first, second andeven third. At six out of seven properties, the feature LeadTime is the mostimportant one. From the previous two importance tables, Table 6 and Table 7,
20
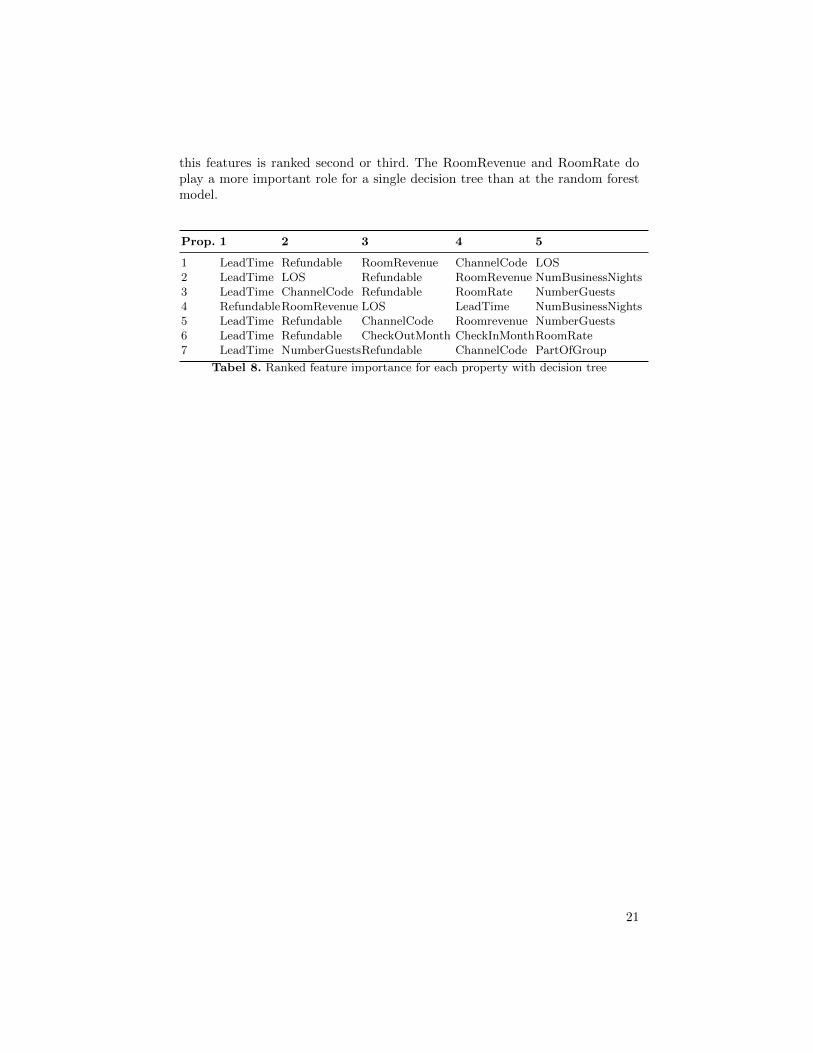
this features is ranked second or third. The RoomRevenue and RoomRate doplay a more important role for a single decision tree than at the random forestmodel.
Prop. 1 2 3 4 5
1 LeadTime Refundable RoomRevenue ChannelCode LOS2 LeadTime LOS Refundable RoomRevenue NumBusinessNights3 LeadTime ChannelCode Refundable RoomRate NumberGuests4 RefundableRoomRevenue LOS LeadTime NumBusinessNights5 LeadTime Refundable ChannelCode Roomrevenue NumberGuests6 LeadTime Refundable CheckOutMonth CheckInMonthRoomRate7 LeadTime NumberGuestsRefundable ChannelCode PartOfGroup
Tabel 8. Ranked feature importance for each property with decision tree
21
7 Implementation
A machine learning algorithm may improve the overall objective of a depart-ment or could result in a competitive advantage. This goal will be achieved ifa successful implementation leads to new insights or a more effective recourseusage. However, a machine learning algorithm has to engage employees in or-der to make use of it, for example by creating a sense of urgency. This senseof urgency can be created by explaining the problem of cancellations and thepossible improvement in terms of revenue. Another way of engaging employees isby explaining what the idea of a model is and the performance of it. Therefore,a basic understanding about the model is preferable, implying that a white-boxmethod is more desirable. There is the possibility to explain and interpret black-box method by decomposing the feature contribution. However, the idea of ablack-box method can be explainable for employees that do not have experiencein the field of machine learning. Take a random forest for example, in the basisit is a black-box method because the algorithm ensembles x number of trees.Yet, the concept is explainable, the model combines different decision trees anda decision tree is an intuitive algorithm. Revenue managers will understand thealgorithm better if a decomposition of the features is given, which may be in linewith their experience or not.
The number of expected cancellation should be communicated with the reve-nue management (RM) system, either automatically or manually. Extra roomsshould be sold in order to anticipate on the potential loss in terms of revenue.With an automated approach, an algorithm or heuristic is of the essence whichdecides when there should be extra rooms available. This is key in order to coun-ter the problem of cancellations. The number of predicted cancellations shouldnot be added instantly to the number of available rooms in the RM system. Insuch a situation, when all the rooms are instantly added, there is a possibilitythat the revenue can be even lower instead of doing nothing. The demand shouldincrease to gain revenue of those extra available rooms, and a way to do so islowering the price. A price drop can result in a negative influence with respect tothe revenue or the brand. For example, selling a room for a rate of 500 is betterthan selling five rooms for 99. It may happen that the current price is lowerthan the price of guests who made a reservation way in advance. These guestsdo not get ’rewarded’ to be early-birds, which should be the case according tothis international hospitality company. A consequence can be talking negativelyabout the brand.
Another way to make use of a cancellation model is to manually changethe allocation or availability of rooms in the RM system. These changes shouldbe made by revenue managers. This approach can be implemented faster thanthe automatic approach. A dashboard can be created which indicates whichreservations are likely to cancel for each single day in the future. The revenuemanager can look at which days there is a high cancellation rate, and so increasethe number of available rooms for those days. However, the speed and complexityof nowadays revenue management system is such that the advantages of usingmodels are not clear if there is a manual input setting added.
22
8 Conclusion and discussion
The data analysis in Section 3 provided insights in the dataset, which can beused for revenue managers to have a deeper understanding in cancellation beha-vior. Since 2010, the overall cancellation rate is slightly increasing. One of thecauses could be deal-seekers, who are pointed out in the introduction. On anaggregated seasonal level, the mutual differences are quantified. These findingshelp in the understanding of seasonal influences. The focus of Section 3 was alsohighlighting the differences between properties. Revenue managers know thatthose are present, but now these are partly quantified. Next the the seasonalinfluence and the differences per property, the cancellation rate slightly increasewhen the room rate increases. This may have a negative influence on the revenuewhen the hotel is almost fully occupied and the room rate has been set too high.This situation may lead to extra cancellations.
From the results, presented in the Section 6, the conclusion can be madethat random forest is the algorithm that performs the best. Due to the highestaccuracy for each property and also in terms of precision, it beats the othermodels. The dynamics within this algorithm are consistent, which is measuredwith the importance of the features. As expected, the feature extracted fromRateCode, the boolean Refundable, is the most important feature in each mo-del. Also, the feature LeadTime, which is extracted from the difference betweenreservation date and check-in date, turned out to be a relevant feature as well.These kind of findings, confirm that feature engineering and selection are one ofthe important steps in creating a useful model.
As mentioned in the results, the False Negatives are relatively high withrespect to the True Negatives. This implies that a negatives result of an instanceis not confidence to be an actual negative result, especially for the Naıve Bayesalgorithm. To counter this problem extensive research can be done in finding newfeatures or adding new columns to the reservations. For example, the price of theroom at the moment of canceling in comparison with the price at the momentof booking. Besides, there were not that many features present in the originaldataset that contained information about the guest itself, such as point of saleor gender. This could have a positive influence on the classification process. Nextto feature engineering, other models can be tested which are more black-box, forinstance a neural network could be applied.
The approach that is suggested in this paper can be applied in different indu-stries such as the airline industry and car rental industry, as well as the modelsthat are applied. Inevitably, issues will be faced regarding the data selection andfeature engineering because the data structure is in a different format, howeverthe same type of steps can be taken.
Revenue managers would benefit from the implementation of this algorithminto a dashboard, because these predictions should create more control in cer-tain situations. The ability to see which reservations are likely to cancel in aoverbooking situation for example. Besides their experience, they can act withmore knowledge in crucial situations with the goal of generating extra revenue.
23

Another point of discussion is the influence of competitors. Since the raiseof Online Travel Agencies, such as Booking.com or Expedia, revenue managersshould keep an eye on their direct competitors. There is no information taken intoaccount about this external factor. There is no literature about the influence ofcompetitors in hospitality, regarding dependence between cancellation and pricesor ranking. It could be innovative research if it is proven that there is a form ofdependence between cancellations and competitors.
24
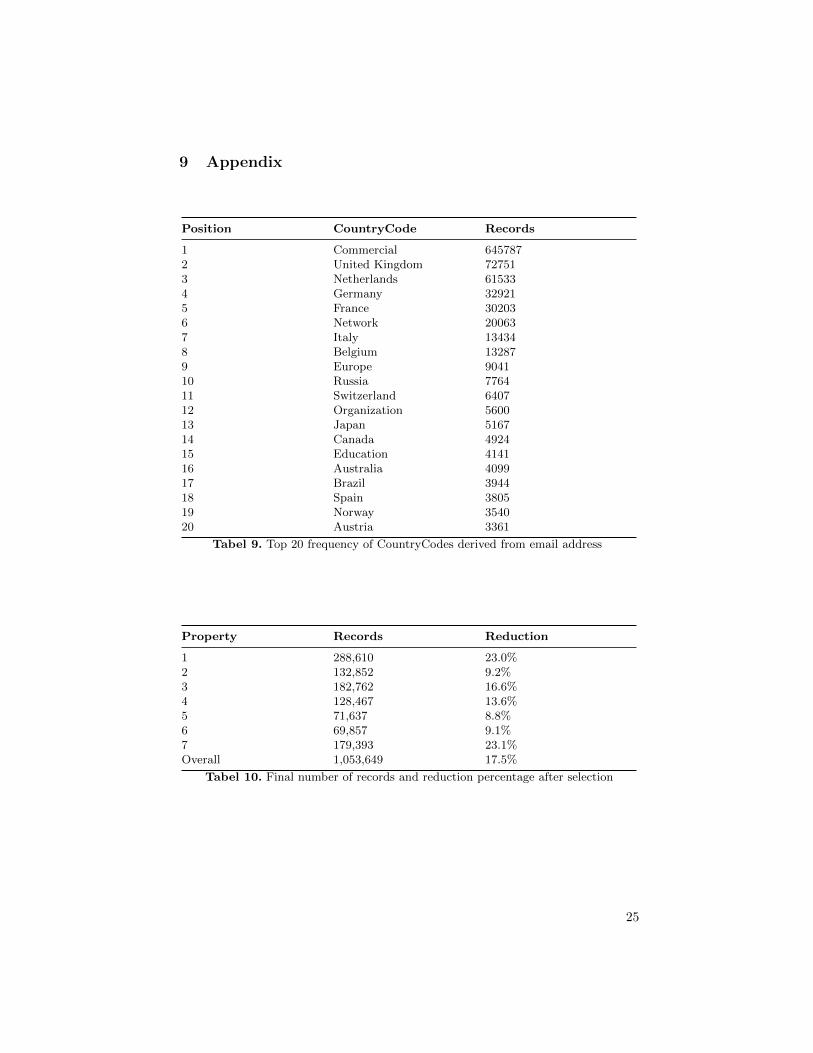
9 Appendix
Position CountryCode Records
1 Commercial 6457872 United Kingdom 727513 Netherlands 615334 Germany 329215 France 302036 Network 200637 Italy 134348 Belgium 132879 Europe 904110 Russia 776411 Switzerland 640712 Organization 560013 Japan 516714 Canada 492415 Education 414116 Australia 409917 Brazil 394418 Spain 380519 Norway 354020 Austria 3361
Tabel 9. Top 20 frequency of CountryCodes derived from email address
Property Records Reduction
1 288,610 23.0%2 132,852 9.2%3 182,762 16.6%4 128,467 13.6%5 71,637 8.8%6 69,857 9.1%7 179,393 23.1%Overall 1,053,649 17.5%
Tabel 10. Final number of records and reduction percentage after selection
25
Referenties
1. K. T. Talluri, G. J. van Ryzin: The Theory and Practice of Revenue Management,Kluwer Academic Publishers, 2004.
2. M. Rajopadhye, M. B. Ghalia, P. P. Wang: Forecasting uncertain hotel room de-mand. Information Sciences, 2001.
3. C. Chen, Z. Schwartz, P. Vargas: The search for the best deal: How hotel cancel-lation policies affect the search and booking decisions of deal-seeking customers.International Journal of Hospitality Management, 2011.
4. M. Rothstein: OR and airline overbooking problem. Operations Research, 1985.5. S. Polt: Forecasting is difficult - especially if it refers to the future. Reservations
and Yield Management Study Group Annual Meeting Proceedings, 1998.6. D. Morales, J. Wang: Forecasting Cancellation Rates for Services Booking Revenue
Management Using Data Mining, European Journal of Operational Research, 2009.7. O. Petraru: Airline passenger cancellations : modeling, forecasting and impacts on
revenue management, Massachusetts Institute of Technology, 2016.8. N. Antnio, A. Almeida, L. Nunes: Predicting hotel booking cancellations to decrease
uncertainty and increase revenue, Tourism & Management Studies, 2017.9. J. Howbert: Introduction to Machine Learning, University of Washington Bothell,
2012.10. M. Tepeci: Increasing brand loyalty in the hospitality industry, School of Hotel,
Restaurant, and Recreation Management, 1999.11. M. Mohri, A. Rostamizadeh, A. Talwalkar: Foundations of Machine Learning, MIT
Press, 2012.12. R. Bellman: Adaptive Control Processes: A Guided Tour, Princeton Legacy Li-
brary, 1961.13. D. Cox: The Regression Analysis of Binary Sequences, Journal of the Royal Sta-
tistical Society, 1958.14. T. Hastie, R. Tibshirani, J. Friedman: The elements of statistical learning, Springer
series in statistics, 2001.15. A. Smola, S. V. N. Vishwanathan, J. Friedman: Introduction to machine learning,
Cambridge University Press, 2010.16. T. Ho: Random Decision Forests, Proceedings of the 3rd International Conference
on Document Analysis and Recognition, 1995.17. L. Breiman: Random Forests, Machine Learning, 2001.18. M. Fernandez-Delgado, E. Cernadas, S. Barro, D. Amorim: Do we need hundreds
of classifiers to solve real world classification problems?, The Journal of MachineLearning Research, 2014.
26