Embed Size (px)
Citation preview

Canadians and Prohibition: An Analysis of the 1898 Referendum
BY RUTH DUPRÉ AND DÉSIRÉ VENCATACHELLUM HEC MONTRÉAL
– PRELIMINARY DRAFT –
MARCH 2005
To be presented at the Canadian Network for Economic History Conference, Queen’s University, April 15-17, 2005. We wish to thank Tania Rakotonirina for her very able research assistantship and Fonds Mercure HEC for financial aid. Our email addresses are: [email protected] and [email protected]

– 2 –
1. INTRODUCTION
While the American episode of alcohol prohibition (1919-1933) is notorious and has been
extensively studied, very little work has been done in a comparative international perspective.
Yet, the prohibition movement was international and quite a few countries, particularly the ones
with a significant Anglo-Saxon Protestant majority, went through a long-lasting and vigorous
struggle over this issue. Our larger research program is concerned with an international
exploration to shed new light on the American experiment with prohibition.
In this first paper we examine the Canadian case and more specifically, the national referendum
on the prohibition of alcohol of 1898. The story of the temperance movement struggle to
suppress the liquor trade can be divided into four phases: the 1840s-50s, the 1870s-80s, the
1890s-First World War and the 1920s. In the two first phases, Canada followed a road very
similar to the US. From the turn of the 20th century, their roads began to diverge as the
movement to prohibition intensified in the U.S. while it subsided in Canada until First World War.
The 1898 referendum was thus a turning point in the Canadian history of alcohol regulation.
Referendums are a very interesting tool to capture the preferences of a population. As Blocker
(1976) argues, referendums were the best indicator of the population prohibitionist sentiments
and preferences as they were direct single-issue processes compared to a political party or
representative platform. In Canadian politics, they are a rarity as they run against the
fundamental principle of British representative government. In fact, there have been only two
national referendums in Canadian history: this plebiscite on the prohibition of alcohol in 1898
and the infamous one on conscription in 1942.
There is a very rich and abundant American literature, historical and sociological, on the
temperance and prohibitionist movements. There are however very few empirical studies using
econometrics to test their determinants.1 In order to explain the prohibitionist preferences of the
Canadian population, we perform a multivariate analysis to investigate the determinants of the
1898 referendum outcome by electoral district. In line with the literature, we control for religious
1 We found a few public choice empirical studies for the U.S.: Goff and Anderson (1994); Munger and Schaller (1997); Hersch and Netter (1989); and Wasserman (1989 and 1990). The first two contrast the support for prohibition in 1917 (Congress votes) to the repeal in 1933 while the third is concerned with the timing of adoption of state wide prohibition before 1919. Wasserman analyzes two referendum votes in Missouri and in California in 1918. To our knowledge, there is none for Canada.

– 3 –
affiliation, provincial fixed effects and other demographic characteristics of each district. Our
preliminary results confirm the historical and sociological literatures on the temperance. For
instance, they indicate that electoral districts which were less likely to vote in favour of the
prohibition were populated by more Catholic, less married men, were less densely populated,
and situated in Quebec.
Next section summarizes the main features of the history of the prohibition issue until the 1898
Referendum. Section 3 shows the referendum outcome. Section 4 presents the dry and the wet
camps while section 5 outlines the specification and estimation results.
2. THE ROAD TO THE 1898 REFERENDUM Table 1
A Chronology of Events in Canadian Temperance 1807 First temperance society in North America
1827 First temperance society in Canada, Montreal
1838 Start of temperance work in Quebec by Father Chiniquy
1856 First non-wartime provincial Prohibition in Canada, New Brunswick
1864 Dunkin Act passed, allowing for local option votes on Prohibition
1874 First Women’s Christian Temperance Union meeting at Chatauqua, New York, later in Owen Sound, Ontario
1876 Founding of Dominion Alliance for the Total Suppression of the Liquor Traffic
1879 Canada Temperance Act (Scott Act) passed, allowing for easier Prohibition votes
1895 Royal Commission on the Liquor Traffic appointed in 1892 recommends against national Prohibition (majority report)
1898 Canada-wide plebiscite on Prohibition won, but Prohibition refused by Laurier
1915-17 Prohibition introduced in all provinces because of wartime
1917 National Prohibition imposed under War Measures Act
1918 War Measures Act ends: Prohibition ends in Quebec but not in other provinces
1921 Prohibition defeated in British Columbia
1923-29 Prohibition defeated in all provinces but Prince Edward Island
1948 Prohibition ends in Prince Edward Island, the last hold-out
1967 Activities of Canadian Temperance Federation and Ontario Temperance Federation cease
Source: Taken from Smart and Ogborne (1996: 41); bold on 1898 added.

– 4 –
In Canada as in other new countries, pioneer days of late 18th, early 19th century were days of
heavy drinking. Alcohol consumed was mostly in the form of “ardent spirits” like rum and whisky,
which according to the data available were consumed in a much larger volume than today by
the male population.2 The temperance movement arose out of concerns that this behaviour was
evil for the individual and disruptive for society. At both levels, the movement was focused on
salvation. The first temperance societies were established in Canada in the 1827, not long after
the U.S. They were led by Protestant, especially the Evangelical denominations as part of
revivalism.
From the 1840s, a number of organizations and societies crossed to Canada from the U.S.3
Abstinence pledges were very popular across British North American colonies as in the U.S.
Maine was the first state to adopt prohibition in 1851. New Brunswick (then a British Colony)
followed Maine’s example in 1856, along with a number of American states.4
The temperance movement subsided during the Civil War in both countries although the
Province of Canada (then Ontario and Quebec) passed the Dunkin Act in 1864 allowing local
option votes for prohibition. The revival of the movement was launched in the U.S. with the
notorious women’s temperance crusades of 1873-4 in which thousands of women kneeled,
sang and prayed in front of saloons all over the country but mostly in the Midwest. This led to
the formation of a new organization, quite important in the women’s movement, the WCTU
(Women Christian Temperance Union) in 1874 in the U.S. and in Canada.
Two years later in 1876, the umbrella organization, the Dominion Alliance for the Total
Suppression of the Liquor Trade, was set up. Even if the ultimate goal of the Dominion Alliance
and the WCTU was nationwide prohibition, the main policy they fought for and obtained in that
second wave were the so-called local option bills. The federal government passed the Dominion
Temperance Act (Scott Act) in 1879. It allowed local (county, city or township) bans on sales of
alcoholic beverages following a poll taken at given intervals after a specified proportion (usually
2 See for instance, Noel (1995) and Smart and Ogborne (1996). Water was dangerous, tea and coffee expensive and the times and work to accomplish were hard. 3 The most notable were, in chronological order, the Washingtonians (1840-49), the Sons of Temperance (formed in 1842 in the US, spread to Canada in 1847) and the Order of Good Templars (set up in 1850 in the US, 1855 in Canada). 4 12 states: with the Civil War, most of these bans were repealed, leaving only Maine, Vermont and New Hampshire by the end of the 1870s.

– 5 –
¼ of qualified electors) of the population signed for it. Quite a large number of polls were taken
over the subsequent decades in Ontario and in the Maritimes and very few in Quebec. About
half of them dried up the concerned counties.5
For the temperance movement, local prohibition was better than nothing but still unsatisfactory
because alcohol remained quite present in Canadian society and enforcement was difficult.
They kept pushing for total prohibition. Year after year from the mid-eighties, resolutions like the
following were moved in the House of Commons:
“That the object of good government is to promote the general welfare of the people by a careful encouragement and protection of whatever makes for the public good, and by equally careful discouragement and suppression of whatever tends to the public disadvantage.
That the traffic in alcoholic liquors as beverages is productive of serious injury to the moral, social and industrial welfare of the people of Canada.
That despite all preceding legislation, the evils of intemperance remain so vast in magnitude, so wide in extent, sand so destructive in effect, as to constitute a social peril and a national menace.
That this House is of the opinion, for the reasons hereinbefore set forth, that the right and most effectual legislative remedy for these evils is to be found in the enactment and enforcement of a law prohibiting the importation, manufacture and sale of intoxicating liquors for beverage purposes.”
Similar resolutions were moved again in 1887, 1888, 1889, 1891 by M.P. Jamieson.
Interestingly, amendments were added to make sure that public opinion would follow. For
instance, the 1884 Foster resolution above was adopted (122 to 40) after the amendment: “and
this House is prepared, so soon as public opinion will sufficiently sustain stringent measures, to
promote such legislation, so far as the same is within the competency of the Parliament of
Canada.”6 Again the resolution in 1889 was adopted (99 to 59) following an amendment that
“prohibition should be enacted when public sentiment was ripe for the reception and
enforcement of such a measure.”
In the discussion around the 1891 resolution, an amendment was carried in favour of the
appointment of a royal commission to obtain information relating to the subjects of the liquor
traffic and prohibition. The Royal Commission of five members chaired by Sir Joseph Hickson
5 In the decade of the 1880s, 29 out of 69 polled counties went dry in Ontario; 42 out of 47 in the Maritimes 8 out of 17 in Quebec and 2 out of 2 in Manitoba. Smart (1996:42). 6 G.E. Foster in the House of Commons, 1884. Source: Royal Commission 1895, minority report p. 690.

– 6 –
was appointed in 1892 with this mandate. Three years later, the majority of the Commission
(four of five: Reverend McLeod produced a minority report) concluded that:
“With the power possessed by the various provinces to legislate in respect to the traffic, the certainty that in some of the provinces Prohibition would meet with determined opposition; with an open frontier such as the Dominion possesses, largely bordering on States in which sale would be carried on; the undersigned consider that it is illusory to anticipate that a general prohibitory law could be enforced with any reasonable degree of efficiency.”7
Meanwhile, four provinces ran referenda whose results were quite encouraging for the
temperance movement:
For Against
Manitoba 1892 19 637 7 115
PEI 1893 10 616 3 390
Nova Scotia 1894 43 756 12 355
Ontario 1894 192 489 110 720
Source: Hayler (1913: 254) In the 1896 general elections, Wilfrid Laurier and the Liberal Party were put in power after an
almost uninterrupted Conservative reign of 30 years. A plebiscite was in the Liberal party
platform (seemingly since 1893). As soon as Laurier set foot in the House as P.M., he was
reminded of his electoral promise. Reminders were to be repeated for another two years before
Laurier finally acted after he suavely replied on April 13, 1898: « le cabinet est unanime et se
fera un devoir de tenir les engagements que le parti a pris lors de la convention de 1893. »8 The
Act of the Plebiscite on Prohibition [61 Vic c 51] was sanctioned on June 13 and the Governor
General’s proclamation on August 4th fixed the date of the referendum at Thursday, September
29, 1898.
In order to find out what kind of campaign took place in those two months before the
referendum, we searched through seven newspapers across Canada. Table 2 shows the results
of our investigation: the number of ads and messages pro and against prohibition, the calls for
meetings and the number of articles and letters on the issue. Almost everywhere, with the 7 Royal Commission Report 1895, p. 503. Given the technology and resources available in the 1890s, the product is very impressive. We found complaints at the House of Commons following the deposition of the report that the costs (at close to 100,000$) were too high. 8 House of Commons Debates, April 13, 1898, pp. 2856-2859.

– 7 –
exception of Halifax, there was very little of all this in August. Most of them were concentrated in
the last week before the referendum as can be seen from the figures in brackets (September 19
to 29). It thus looks like a short campaign and one with a rather mild fervour and intensity,
especially in Montreal compared to Toronto (Globe) and Winnipeg.9 Letters and articles were
well balanced, presenting the two sides of the issue. Ads were typically more on material than
on moral grounds. A good example is figure 1 below from La Presse of September 28.
Out of curiosity, we also compiled in the last columns of table 2 the numbers of ads concerning
drinking (curing drunkenness and toxicomany, beer, other alcoholic beverages and non
alcoholic beverages like water and sodas). Some interesting cultural diversity appears. There
are almost daily ads on curing drunkenness in La Presse, and almost none at all outside
Quebec while there are much less ads on water and sodas in La Presse as compared to the
other dailies.
9 For another part of our project, we examined some Australian and New Zealand newspapers around a few of their referendums on alcohol prohibition. The difference in quantity and intensity of the material in their newspapers compared to the Canadian ones in 1898 is striking.

– 8 –
Table 2 The Issue of Alcohol and Prohibition
in Selected Canadian Newspapers August-September 1898
Total Period and in Brackets [the Last 10 Days]
Ads, Messages Ads
Newspapers Anti
Prohib Pro
Prohib
Articles,Letters,
Etc Call for
Meetings
Curing Drunk ness Beer
Other Alcoholic
Beverages
Non Alcoh Water,Sodas
Montreal La Presse Montreal Star Gazette Toronto The Globe Daily Mail Empire Winnipeg W. Free Press Halifax H. Herald
4 [3] 3
[3] 4
[4]
6 [6] 1
[1]
1 [1]
1 [1]
7 [6] –
–
7 [6] –
7 [5]
3 [2]
11 [10] 12 [8] 4
[4]
33 [17]
8 [7]
21 [10]
6 [2]
4 [4] –
–
7 [7] –
7 [4]
4 [-]
44
6
22
4
1
–
–
28
33
3
26
10
44
6
30 + 10 generic 15 + 21 generic 42 + 35 generic
11
1
35
108
5
31
13
20
9
35
11
Notes: The period examined is August 4th to September 29th (day of the plebiscite) 1898. The total number of issues for each newspaper is 49 since none were published on Sundays. “Generic” means ads by merchants and salesmen offering baskets of different alcoholic beverages without marks identified.

– 9 –
Figure 1
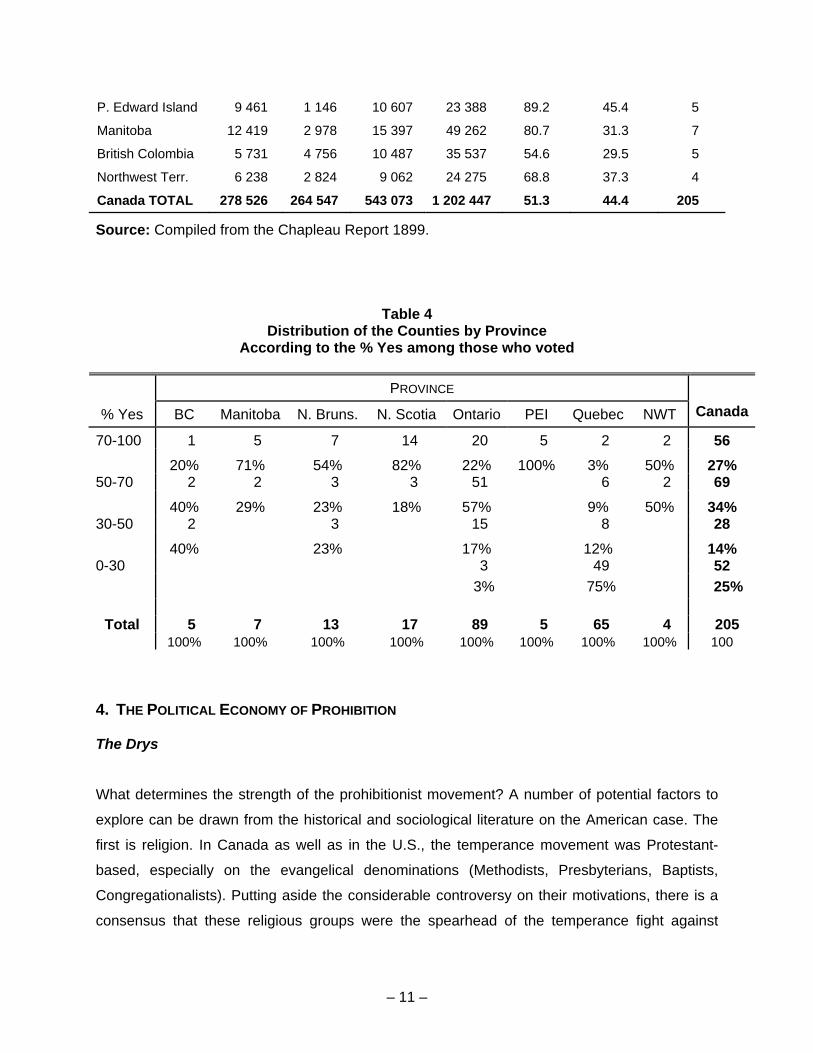
3. THE REFERENDUM OUTCOME
Canadians had to answer yes or no to the following question: «Are you in favour of the passing
of an Act prohibiting the importation, manufacture or sale of spirits, wine, ale, beer, cider and all
other alcoholic liquors for use as beverage ?». The global results were extremely close: 51 %
Yes / 49 % No. Regional disparities were wide: in Quebec the Yes represented 19 % of the
votes; in the Maritimes, more than 80 %; in Ontario, 57 %. Table 3 reports the total results by
province and table 4 gives us an idea of the distribution of the counties according to their
prohibitionist intensity (share of Yes among those who voted). The Yes accounted for less than
30 % of the votes in 75 % of Quebec counties compared to 3 % in Ontario and 0 % everywhere
else.

– 10 –
As table 3 shows, the turn out was rather low at 44 % of the enlisted voters with the lowest rates
of participation in the West (Manitoba, B.C., Northwest Territories). This was significantly lower
than the participation rates at contemporary general elections: 66 % in 1896, 81% in 1900, 74%
in 1904.10 In his official report to the Prime Minister, S. E. Chapleau (1899: vi) noted that the
voting appears to have taken place very quietly throughout the country. He added that not only
did he not receive any adverse reports from the officers but that some of them wrote about «the
complete apathy shown by the electors» in their polls.
After much discussion, the Laurier government decided not to act upon those positive results
arguing that less than a ¼ of the population [51 % of 44 %] was not a sufficient proportion for
such a drastic legislation to be legitimate and enforceable. Moreover, the P.M. Laurier was said
to have been afraid to split the country because of the sharp divide of the vote between French-
Canadians concentrated in Quebec and English-Canadians.
Defeated at the federal level, the prohibitionists turned to the provinces. The fiercest battle
probably took place in Ontario. In 1902 the Ontario government proposed a provincial
prohibition measure conditional on a referendum with a majority in favour at least equal to the
majority voting at the last General Election (that is, at least 212 723). The results were 199 749
Yes against 103 548.11 In fact, prohibitionists succeeded only in the smallest of the provinces,
Prince Edward Island in 1902. Large scale prohibition would have to wait for the First World
War.
Table 3 1898 National Referendum Results by Province
Provinces Number of Yes
Number of No
Total Votes
# Voters on the List
Yes as % of
Votes Participation
Rate #
Districts
Ontario 154 498 115 284 269 782 576 784 57.3 46.8 89
Quebec 28 582 122 614 151 196 335 678 18.9 45.0 65
Nova Scotia 34 678 5 370 40 048 101 502 86.6 39.5 17
New Brunswick 26 919 9 575 36 494 80 296 73.8 45.4 13
10 Source: Urquhart, Buckley, Leacy ed, Historical Statistics of Canada 1983, series Y51-74. 11 Hayler (1913:255).
– 11 –
P. Edward Island 9 461 1 146 10 607 23 388 89.2 45.4 5
Manitoba 12 419 2 978 15 397 49 262 80.7 31.3 7
British Colombia 5 731 4 756 10 487 35 537 54.6 29.5 5
Northwest Terr. 6 238 2 824 9 062 24 275 68.8 37.3 4
Canada TOTAL 278 526 264 547 543 073 1 202 447 51.3 44.4 205
Source: Compiled from the Chapleau Report 1899.
Table 4
Distribution of the Counties by Province According to the % Yes among those who voted
PROVINCE
% Yes BC Manitoba N. Bruns. N. Scotia Ontario PEI Quebec NWT Canada
70-100 1 5 7 14 20 5 2 2 56 20% 71% 54% 82% 22% 100% 3% 50% 27% 50-70 2 2 3 3 51 6 2 69 40% 29% 23% 18% 57% 9% 50% 34% 30-50 2 3 15 8 28 40% 23% 17% 12% 14% 0-30 3 49 52 3% 75% 25%
Total 5 7 13 17 89 5 65 4 205 100% 100% 100% 100% 100% 100% 100% 100% 100
4. THE POLITICAL ECONOMY OF PROHIBITION The Drys
What determines the strength of the prohibitionist movement? A number of potential factors to
explore can be drawn from the historical and sociological literature on the American case. The
first is religion. In Canada as well as in the U.S., the temperance movement was Protestant-
based, especially on the evangelical denominations (Methodists, Presbyterians, Baptists,
Congregationalists). Putting aside the considerable controversy on their motivations, there is a
consensus that these religious groups were the spearhead of the temperance fight against

– 12 –
drinking.12 In Canada, evangelicalism represented 40% of the population at the time of the
referendum.13
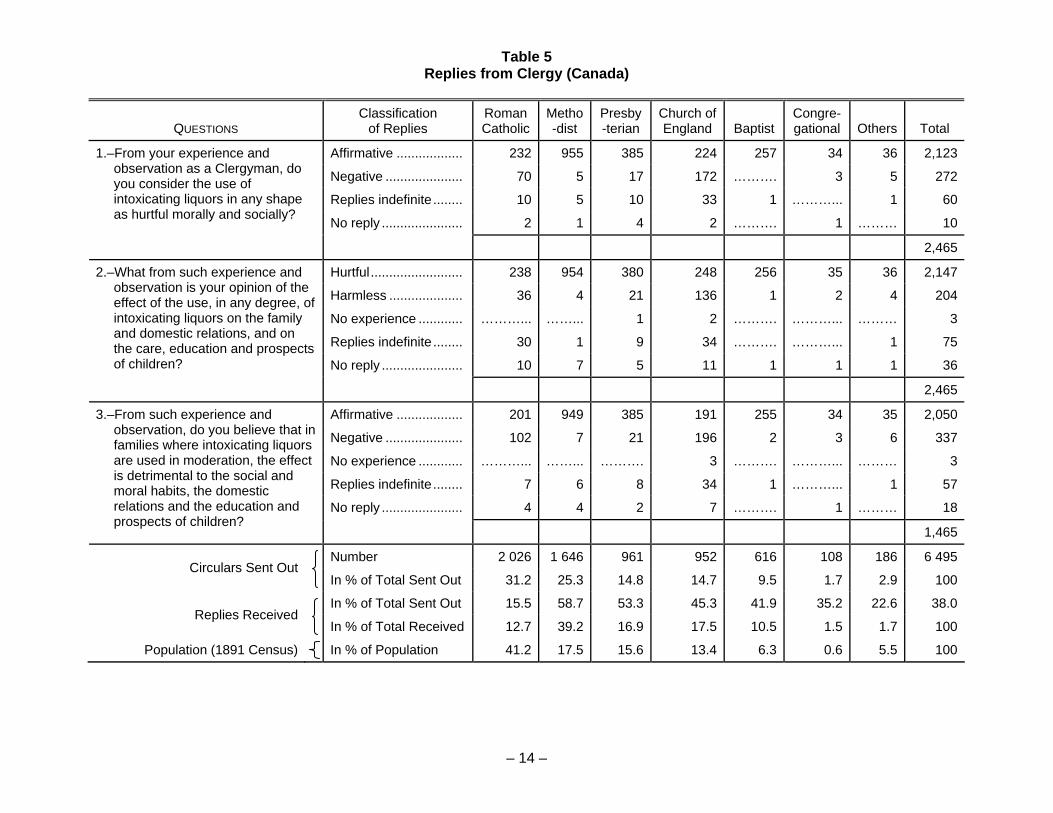
We found a very interesting source of information on the differences in the Canadian churches’
opinions and moral positions over the issue of alcohol in The Royal Commission on the Liquor
Traffic documents. Out of more than 6,000 questionnaires sent to members from the clergy of
all important denominations, the Commission received some 2,465 replies. As can be seen in
Table 5, there is a sharp difference in the replies from the Evangelical clergy compared to the
Anglican and the Catholic clergy. The difference is also marked in the participation rate.14
The second factor is the rural-urban opposition. For a long time following Hofstadter (1955), the
temperance movement was seen as the ultimate rural grassroots America’s attack upon the big
cities full of sin and foreigners. In Canada as in the U.S., it is true that rural areas were more
supportive of prohibition while large cities were more opposed. However, this may reflect the
difference in the homogeneity of the population between rural and urban settings. Immigrants
were concentrated in large cities making them much more heterogeneous. There is a
consensus in the literature that the largely WASP middle-class prohibitionist movement was
deeply suspicious and hostile to those “low class, low race” new immigrants filling the large
cities.15
Thirdly, women were on the forefront of the movement in Canada as well as in the U.S.
Intemperance was generally a male problem and more specifically a husband problem
(Thornton (1991:48). The temperance cause has been linked by many authors to women’s
12 The temperance movement has been perceived as people anxious to save souls by some or their middle-class status (by others following the notorious Gusfield 1963’s thesis), as conservative unable to confront modernity (Hofstadter (1955) or as progressive fighting to transform modern society (for instance, Timberlake (1963) or Tyrrell (1991). The jury is still out. 13 In Canada, this information is provided by the Census, thus self-reported and covering non-practising as well as practising people. The Census of 1901 also supplied data on the number of communicants as reported by the various churches. 14 These opinion data confirm the American findings about an opposition between two religious views of the world: the ritualistic and the evangelical (or pietistic) tradition. In the former (exemplified by the Roman Catholic Church, Orthodox Judaism, Episcopal or Church of England), individuals are expected to conform to a common body of doctrines and sacraments and to a hierarchical structure. In the evangelical tradition, there is no prescribed doctrine and adherents achieve salvation by their individual actions. Struggling for prohibition was such a type of action to get a control over individual lifestyles. See for instance Wasserman 1989: 889-890. 15 See Morone (2003:302-308); Timberlake (1963:152); Gusfield (1963); Blocker (1976).

– 13 –
suffrage. Since in Canada suffrage was only obtained in 1920, women did not vote in the 1898
Referendum.
Finally, in the U.S., the business support of the movement seems to have been a crucial factor.
Scientific management and large Chandlerian enterprises reinforced the case against drinking.
John Rockefeller, Henry Ford and many others contributed money, speeches and interventions
to the prohibitionist cause.16 To our knowledge, the business involvement was much milder in
Canada. But what is found everywhere (in Africa, Europe, America, Australasia), is that upper
classes were trying to impose values and restrictions upon lower classes because they
considered them to be unable to control themselves.
16 See Rumbarger (1989) and Timberlake (1963).
– 14 –
Table 5 Replies from Clergy (Canada)
QUESTIONS Classification
of Replies Roman Catholic
Metho-dist
Presby-terian
Church ofEngland Baptist
Congre-gational Others Total
Affirmative .................. 232 955 385 224 257 34 36 2,123
Negative ..................... 70 5 17 172 ………. 3 5 272
Replies indefinite ........ 10 5 10 33 1 ………... 1 60
No reply ...................... 2 1 4 2 ………. 1 ……… 10
1.–From your experience and observation as a Clergyman, do you consider the use of intoxicating liquors in any shape as hurtful morally and socially?
2,465
Hurtful......................... 238 954 380 248 256 35 36 2,147
Harmless .................... 36 4 21 136 1 2 4 204
No experience ............ ………... ……... 1 2 ………. ………... ……… 3
Replies indefinite ........ 30 1 9 34 ………. ………... 1 75
No reply ...................... 10 7 5 11 1 1 1 36
2.–What from such experience and observation is your opinion of the effect of the use, in any degree, of intoxicating liquors on the family and domestic relations, and on the care, education and prospects of children?
2,465
Affirmative .................. 201 949 385 191 255 34 35 2,050
Negative ..................... 102 7 21 196 2 3 6 337
No experience ............ ………... ……... ………. 3 ………. ………... ……… 3
Replies indefinite ........ 7 6 8 34 1 ………... 1 57
No reply ...................... 4 4 2 7 ………. 1 ……… 18
3.–From such experience and observation, do you believe that in families where intoxicating liquors are used in moderation, the effect is detrimental to the social and moral habits, the domestic relations and the education and prospects of children?
1,465
Number 2 026 1 646 961 952 616 108 186 6 495Circulars Sent Out
In % of Total Sent Out 31.2 25.3 14.8 14.7 9.5 1.7 2.9 100
In % of Total Sent Out 15.5 58.7 53.3 45.3 41.9 35.2 22.6 38.0Replies Received
In % of Total Received 12.7 39.2 16.9 17.5 10.5 1.5 1.7 100
Population (1891 Census) In % of Population 41.2 17.5 15.6 13.4 6.3 0.6 5.5 100

– 15 –
The Wets
As we saw above, both the Roman Catholic and Church of England churches found prohibition
too extremist a measure. They both favored moderation instead of prohibition and mostly stayed
away from the prohibitionist movements. In the 1901 Census, Catholics represented more than
40% of the population and Anglicans another 13%. This component of the Wet camp was thus
especially important in the 1898 Referendum with the strong anti-prohibitionist stance of the
Catholic French-Canadians (then 30% of the population).
Based on the economic interest rationale, we would expect that all segments of the alcohol
industry: brewers, distillers, retail traders would be combative wets. In the U.S., they were
organized in powerful associations with very large financial resources. There were also
organizations in Canada who sent representatives at the Royal Commission auditions and who
were behind some of the advertising against prohibition in the summer of 1898. But as we saw
above (table 2), their activities in the 1890s episode seem to have remained at a rather modest
level [from our knowledge, still very incomplete at this stage]. Furthermore, the distillers and
brewers lobbying activities were aimed at the national or regional levels rather than the local
ones.
Finally, what about the consumers of alcohol? They would seem to be a typical Olson latent
unorganized group without much political power. There are no consumption data at the district
level. But the provincial breakdown in table 6 shows that with the exception of Manitoba, the
most heavy-drinking provinces tended to be the least prohibitionist.
Table 6 Alcohol Consumption in Gallons per Capita
(1891-93: 3 Year Average) and Rank of the Province in [ ]
CANADA AND PROVINCES SPIRITS BEER WINE
Canada 0.720 3.598 0.103
British Columbia 1.480 [1] 7.145 [1] 0.466 [1]
Manitoba 0.905 [3] 3.436 [3] 0.063
Nova Scotia 0.434 [6] 1.321 [5] 0.042
New Brunswick 0.581 [5] 1.076 [6] 0.037

– 16 –
Ontario 0.665 [4] 5.264 [2] 0.027
Prince Edward Island 0.257 [7] 0.361 [7] 0.013
Quebec 0.925 [2] 2.705 [4] 0.234 [2]
NorthWest Territories --- --- ---
COUNTRIES SPIRITS BEER & CIDER WINE
Canada 1.0 8.0 0.6
United States 1.3 10.5 0.4
France 1.9 11.0 19.0
United Kingdom 0.9 27.0 0.4
Germany 1.3 18.0 2.5
Russia 1.0 0.9 0.5
Italy 0.4 1.0 16.5
Belgium 1.6 28.5 0.7
Sweden 4.2 6.2 0.4
Australia 1.0 12.0 0.6
Source: Royal Commission on the Liquor Traffic in Canada (1895) pp.16-24 for Canada and the provinces. To put the Canadian figures in perspective, the second panel reports international figures from a study “Dictionnary of Statistics” by M. Mulhall (1892) found in the Royal Commission Report p. 75.
Those were thus the main actors in this confrontation over the proper role of the state
concerning the regulation of alcohol. The prohibitionist camp was largely made of Evangelical
Protestant rural women, to whom should be added, at least in the US, businessmen
preoccupied with efficiency in mass production factories. The opponents to prohibition were to
be found in the large cities, in the working class immigrants, among Catholics and Anglicans
and unsurprisingly in the brewing and distilling industry.
5. MULTIVARIATE ANALYSIS
Following our previous discussion we specify an empirical model where the share of the yes
vote in each district is a function of the demographic characteristics to investigate the
determinants of the referendum outcome. We consider two possible measures of the

– 17 –
dependent variable. The first one is the share of yes by district among those who voted on the
referendum day. However, this measure may be a biased because it does not account for those
who abstained. We therefore consider a second measure of the intensity in favour of prohibition
defined as the share of those who voted yes relative to all eligible voters. We estimate those
two specifications and control for geographical and demographic characteristics of the different
districts. Indeed recall that our data is at the district level and not at the individual level. The
estimates are reported in Tables 8 (share of yes vote among for who voted) and 9 (share of yes
vote among for who are eligible to vote).
Many of the potential explanatory variables of the intensity of the vote are strongly correlated
(see table 7). One such variable is the share of the population who belong to the different
religious groups. By definition, these shares must sum to one and cannot be all included.
Moreover, some religious groups are more prevalent in some districts, or provinces, than in
others. For instance, most districts of Quebec are overwhelmingly catholic. Hence, for the sake
of clarity, we include two measures of religiosity by district: the share of Evangelists and the
share of Catholics. We expect the intensity of the yes vote to increase with the share of
Evangelists and to decrease with the share of Catholics. This is indeed the case in a simple
regression which includes only those two variables which are both strongly statistically
significant [column M1]
Using the share of individuals who self-report that they belong to a particular religious group
may not be appropriate because it does not inform us about the religiosity of those individuals.
Someone may report being a Catholic but he or she may never attend mass. Such a person is
not likely to be influenced by any guideline which is given by the church about how to vote. We
address that critique by using the number of people by district as reported by the different
churches to construct the share of actual communicants for each religion. As reported in column
M3 of Table 8, these two explanatory variables are strongly significant and of the expected sign.
It is of interest to note that their effect on the yes vote is much higher than when we use the
share of self-reported religion. This is not surprising because communicants are more likely to
abide by their church dogma and vote accordingly. Indeed, we are much more likely to observe
a higher share of yes votes in districts with more evangelists, who were strongly against alcohol.
However, the estimates obtained from this simple specification are biased because it suffers
from omitted variables which surely mattered for the intensity of the yes vote. Given the

– 18 –
diversity of production and consumption of alcohol across the provinces, it would make sense to
include provincial dummies as explanatory variables. Moreover, controlling for any provincial
effect will allow us to obtain a better estimate of the impact of religion on the yes vote.
Choosing Quebec as the reference province we find that all provinces, with the exception of
British Columbia and Ontario, are consistently more likely to vote in favour of prohibition. The
Ontario dummy is negative and significant unless we account for urbanization and the share of
married individuals in each district. However, as neither of those variables is significant, our
preferred specification is M4.
By including the share of married men as an explanatory variable we wish to investigate
whether married women could influence their husbands’ votes. Assuming that women are more
likely to be in favour of the prohibition of alcohol, they could lean on their husbands to have
them vote yes in the referendum. We are unable to find an effect in the data. In fact the estimate
is of the “wrong sign” (negative) but is not statistically different from zero (the T-ratio is very
small).
It is of interest to investigate if these estimates are robust when we consider the share of yes
vote among those who are eligible. The intensity of religion has the same qualitative impact on
the share of yes vote among those who are eligible as among those who actually vote. There
are however two differences which are of interest. Firstly, urban density has a negative impact
on the share of yes votes and secondly a higher share of married men is the district is more
likely to generate a vote in favour of prohibition. Hence, using this measure it appears that
married women were indeed able to lean on their husbands and influence the vote.

– 19 –
Table 7
Bivariate Correlations [All variables are at the district level]
(1) (2) (3) (4) (5) (6) (7) (8) (9) (1) % Anglicans 1 (2) % Catholics -0,737 1 (3) % Evangelists 0,556 -0,937 1 (4) % Married Men 0,254 -0,266 0,259 1 (5) Density (Population/area) 0,026 0,145 -0,185 0,108 1 (6) Literacy (% can write) 0,391 -0,3172 0,1786 -0,0122 0,1053 1 (7) «Wealth» (% stone houses) -0,047 0,1378 -0,1395 -0,0654 0,4936 0,0629 1 (8) % Yes/expressed votes 0,537 -0,824 0,803 0,068 -0,206 0,217 -0,197 1 (9) % Yes/listed voters 0,497 -0,839 0,857 0,209 -0,199 0,116 -0,163 0,9241 1

– 20 –
Table 8
Share of Yes Among Those who Voted
Ordinary least square estimates Dependent variable: Share of yes vote among those who are
voted M1 M2 M3 M4 M5 M6 Quantile
RELIGION
Self-declared 0.259* 0.426*** evangelists 1.903 4.013
Self declared –0.453*** –0.395*** catholics 4.217 4.336
Actual 0.995*** 1.087*** 1.058*** 1.063*** 0.990*** evangelists 4.818 5 4.686 4.595 6.604
Actual –0.617*** –0.508*** –0.525*** –0.527*** –0.505*** catholics 7.55 4.899 4.611 4.634 8.129
DEMOGRAPHICS Population –0.001 –0.001 0 density 1.562 1.5 0.31
Share of –0.052 –0.063 married men 0.179 0.282
PROVINCES
British –0.044 0.076 0.061 0.059 0.103** Columbia 0.625 1.053 0.795 0.776 1.977
Manitoba 0.122** 0.247*** 0.234*** 0.231*** 0.310*** 2.14 4.083 3.657 3.547 6.479
New 0.149*** 0.206*** 0.196*** 0.194*** 0.232*** Brunswick 2.907 3.975 3.688 3.601 6.087
Nova 0.253*** 0.291*** 0.281*** 0.279*** 0.348*** Scotia 5.613 6.743 6.278 6.085 9.825
Ontario –0.107** –0.003 –0.012 –0.013 0.05 2.056 0.066 0.235 0.246 1.621
Prince Edward 0.355*** 0.424*** 0.414*** 0.412*** 0.437*** Island 7.53 9.967 9.468 8.872 9.012
North West 0.103 0.208*** 0.193*** 0.191*** 0.264*** Territories 1.562 3.338 2.893 2.849 4.853
CONSTANT 0.596*** 0.507*** 0.549*** 0.449*** 0.467*** 0.485*** 0.440*** 5.903 5.619 11.824 6.878 6.412 4.051 5.027
OBSERVATIONS 205 205 205 205 205 205 205
R-SQUARED 0.687 0.875 0.676 0.842 0.845 0.845
Robust t statistics are reported below the point estimates* significant at 10%; ** significant at 5%; *** significant at 1%

– 21 –
Table 9
Share of Yes Among Those who are Eligible to Vote
Ordinary least square estimates Dependent variable: Share of yes vote among those who are
voted M1 M2 M3 M4 M5 M6 Quantile
RELIGION
Self-declared 0.268*** 0.295*** evangelists 4.787 5.354
Self declared –0.101** –0.169*** catholics 2.28 3.125
Actual 0.784*** 0.819*** 0.803*** 0.789*** 0.756*** evangelists 9.906 8.505 7.996 7.81 11.146
Actual –0.175*** –0.198*** –0.207*** –0.201*** –0.140*** catholics 5.82 3.894 3.725 3.695 4.978
DEMOGRAPHICS Population –0.001** –0.001** 0 density 2.155 2.333 0.739
Share of 0.162* 0.188** married men 1.844 2.595
PROVINCES
British –0.127*** –0.046 –0.054* –0.051 0.002 Columbia 4.197 1.534 1.682 1.625 0.064
Manitoba –0.091*** –0.011 –0.018 –0.011 0.061*** 3.218 0.37 0.576 0.338 2.871
New –0.001 0.03 0.025 0.03 0.092*** Brunswick 0.031 1.15 0.925 1.153 5.44
Nova 0.051** 0.063** 0.058** 0.063** 0.107*** Scotia 2.013 2.579 2.314 2.53 6.753
Ontario –0.089*** –0.034 –0.038* –0.037 0.02 3.479 1.518 1.674 1.611 1.444
Prince Edward 0.251*** 0.286*** 0.280*** 0.290*** 0.334*** Island 21.068 19.629 17.704 19.726 33.896
North West –0.02 0.05 0.042 0.048 0.086*** Territories 0.528 1.37 1.098 1.254 3.52
CONSTANT 0.153*** 0.212*** 0.167*** 0.176*** 0.186*** 0.129*** 0.063** 3.665 4.053 9.405 5.569 5.29 3.315 1.999
OBSERVATIONS 201 201 201 201 201 201 201
R-SQUARED 0.744 0.872 0.753 0.833 0.836 0.838
Robust t statistics are reported below the point estimates * significant at 10%; ** significant at 5%; *** significant at 1%

– 22 –
6. CONCLUSION
There is obviously much work still to be done. For instance, we need a better knowledge of the
alcohol industry in Canada. We also plan to incorporate in our model other socio-economic
data such as the proportion of foreign-born (to test for the importance of heterogeneity of the
population), the proportion of houses built in stone and brick (as a proxy for wealth), the literacy
rate (as proxy for education). This paper is thus a first shot at trying to test the literature on that
very important issue of alcohol regulation and of the temperance movement. As far as we
know, this is a première for the Canadian case. And as we have referendum data for quite a
few other countries (such as New Zealand, Australia, Norway, Sweden), we will pursue this type
of work in an international perspective.
We chose the 1898 referendum because it was a turning point in the evolution of alcohol
regulatory regimes in Canada. This is particularly revealing when compared to what was going
on in the U.S. at the same time. As we already pointed out in some previous work on smoking
(Alston et al 2002, p. 427), the U.S. Progressive Movement or its specific measures is seldom
studied in international comparative perspective. In both the U.S. and English Canada,
evangelicalism dominated the religious Protestant landscape. Social reformers in both sides of
the border pressed for the same type of government intervention. But the cultural backgrounds
and political institutions differed and produced more moderate policies in Canada. A crucial
difference was the presence of a significant anti prohibitionist French-Canadian component
(30%) which tipped the balance.

– 23 –
REFERENCES Alston, L.J., Dupré, R., Nonnenmacher, T. (2002), «Social Reformers and Regulation : The
Prohibition of Cigarettes in the United States and Canada», Explorations in Economic History 39, pp. 425-225.
Blocker, J.S. (1976), Retreat from Reform: The Prohibition Movement in the United States,
1890-1913 Westport, Connecticut: Greenwood Press. Goff, B. and Anderson, G., «The Political Economy of Prohibition in the United States, 1919-
1933», Social Science Quarterly (75: 2), 270-283. Gusfield, J. (1963), Symbolic Crusade: Status Politics and the American Temperance
Movement. Urbana: University of Illinois Press. Hayler, Guy (1913), Prohibition Advance in All Lands. A Study of the Worldwide Character of
the Drink Question. London: International Prohibition Confederation. Hersch, P.L. and Netter J.M. (1989), «State Prohibition of Alcohol: An Application of Diffusion
Analysis to Regulation», Research in Law and Economics (12), 55-70. Hofstadter, R. (1955), The Age of Reform: From Bryan to F.D.R. New York: McGraw Hill. Morone, J.A. (2003), Hellfire Nation. The Politics of Sin in American History. New Haven: Yale
University Press. Munger, M. and Schaller, T. (1997), «The Prohibition-Repeal Amendments: A Natural
Experiment in Interest Group Influence», Public Choice (90), 139-163. Noel, J. (1995), Canada Dry. Temperance Crusades before Confederation. Toronto: University
of Toronto Press. Rumbarger, J.J. (1989), Profits, Power and Prohibition: Alcohol Reform and the Industrializing of
America, 1800-1930. Albany: SUNY Press. Smart, R.G. and Ogborne A.C. (1996), Northern Spirits. A Social History of Alcohol in Canada.
Toronto: Addiction Research Foundation, 2nd edition. Thornton, M. (1991), The Economics of Prohibition. Salt Lake City: University of Utah Press. Timberlake, J. (1963), Prohibition and the Progressive Movement 1900-1920. Harvard
University Press. Tyrrell, I.R. (1991), Woman’s World/Woman’s Empire: The Women Christian Temperance
Union in International Perspective. Chapel Hill: University of North Carolina Press. Wasserman I.M. (1989), “The Missouri Prohibition Referendum of 1918” in Social Science
Quarterly, (70), 886-901.

– 24 –
Wasserman I.M. (1990), “Status Politics and Economic Class Interests: The 1918 Prohibition
Referendum in California” in Sociological Quarterly (31), 475-484. Governmental Documents Canada, Census 1901. Canada, Royal Commission on the Liquor Traffic in Canada, Report 1895. S. E. Chapleau, Report on the Prohibition Plebiscite on the 29th Day of September 1898 in the
Dominion of Canada. Ottawa: Queen’s Printer, 1899.