Embed Size (px)
Citation preview
Cambridgeshire Annual Public Health Report 2017
www.cambridgeshire.gov.uk

2 | Annual Public Health Report 2017
Contents
Introduction ..............................................................................................................3
Mapping health in Cambridgeshire ....................................................................... 4
Section 1
The determinants of health and health outcomes ............................................. 4
1.1 The index of multiple deprivation (2015) .......................................................4
1.2 What is the impact of socio-economic deprivation on health? ..................6
1.3 Income and health ..............................................................................................6
1.4 Income levels in Cambridgeshire districts ..................................................... 7
1.5 Factors affecting income deprivation ............................................................ 7
1.6 Children in low income families .......................................................................8
1.7 Employment and health ....................................................................................9
1.8 Education and health ....................................................................................... 10
1.9 School readiness.................................................................................................11
1.10 GCSE attainment ...............................................................................................12
1.11 Health deprivation and disability....................................................................12
1.12 Other IMD domains ............................................................................................13
Section 2 Key lifestyle and health behaviours - how does
Cambridgeshire compare with other areas? ..................................................... 14
2.1 Smoking and tobacco in Cambridgeshire ......................................................15
2.2 Smoking: children and young people .............................................................16
2.3 Unhealthy weight and obesity .........................................................................17
2.4 Unhealthy weight and obesity: children and young people ...................... 18
2.5 Alcohol and drug use ....................................................................................... 18
2.6 Alcohol use: children and young people........................................................19
Section 3 Mental health trends in Cambridgeshire ........................................................... 20
3.1 Suicide ............................................................................................................... 20
3.2 Children and young people’s mental health .................................................21
Section 4 Life expectancy and preventable deaths .......................................................... 22
4.1 Trends in preventable deaths ........................................................................23
Summary Summary and recommendations ........................................................................ 24
Appendix A ....................................................................................................................26
Annual Public Health Report 2017 | 3
Introduction
The purpose of this Annual Public Health Report 2017 is to provide a clear picture of the main health issues and trends in Cambridgeshire.
Sitting behind the report is a wealth of web-based statistics and information, which can be accessed through the website for Public
Health England’s Outcomes Framework www.phoutcomes.info and Local Health www.localhealth.org.uk
My Annual Public Health Report for 2016 focussed on health at a very local
electoral ward level – providing information through pictograms and maps
rather than traditional text and tables. It was designed to start a conversation
with all three tiers of local government and the voluntary and community
sector, understanding how we can work with communities to improve health
and building on activities and assets which already exist at local level. The 2016
Report is available on http://cambridgeshireinsight.org.uk/health/aphr
This year’s report has a different focus – concentrating on the wider social
and environmental factors affecting our health and wellbeing, and how these
influence the differences in health outcomes we see across the county. A brief
report such as this can only skate across the surface of these complex issues,
but can reflect some of the main findings and trends.
The report also looks at key lifestyle behaviours which impact on longer term health and wellbeing, and at trends in life expectancy and preventable deaths in the county.
While issues of population growth and increasing demand on health and care services are critical issues for Cambridgeshire, these are covered in some depth in the Joint Strategic Needs Assessment Core Dataset available on http://cambridgeshireinsight.org.uk/jsna so are not duplicated in this report.
I would like to thank the local Public Health Intelligence Team for their work in extracting and interpreting the key health information for Cambridgeshire and its districts, and for carrying out more detailed local analyses.

4 | Annual Public Health Report 2017
Mapping health in Cambridgeshire Because much of the information in this report is based on the five district/
city councils in Cambridgeshire, it’s important to understand the geography
of the county.
The map below shows the boundaries of the district/city councils within
Cambridgeshire and the main towns and villages which sit within each district.
Map 1: Local authority districts and major market towns, Cambridgeshire
Section 1: The determinants of health and health outcomes
1.1 The Index of Multiple Deprivation (2015)
An accepted way to look at the multiple factors which influence outcomes
across communities and combine these into a single measure, is the ‘Index of
Multiple Deprivation’ (IMD) which was last updated in 2015.
The IMD (2015) calculates scores for neighbourhoods of about 1,500 people
(called lower super output areas or LSOAs) for a range of factors, and then
ranks all LSOAs in the country for their level of socio-economic deprivation.
The map of Cambridgeshire opposite shows neighbourhoods (LSOAs) in the
county with their IMD (2015) ranks. Neighbourhoods among the most deprived
10 per cent in the county are coloured dark blue, and those among the least
deprived are coloured red. Cambridge City is expanded for clarity.
It is clear that there is a north-south gradient in Cambridgeshire, with
neighbourhoods with higher levels of deprivation concentrated in the north of
Fenland district, while the most socio-economically advantaged neighbourhoods
cluster in the southern part of the county. But there is also significant variation
between neighbourhoods in each district.
© Crown copyright and database rights 2017, Ordnance Survey 100023205
SECTION 1

Annual Public Health Report 2017 | 5
IMD (2015) DNA charts An alternative way of presenting information shown on map 2 is called a ‘DNA
chart’ because the bars on the chart look like pieces of DNA. Instead of putting
each neighbourhood (LSOA) onto the geographical map of an area, the LSOAs
from that area are lined up in rank order, and colour coded by the national decile
(10 per cent banding) in which they fall. The national DNA chart would have 10
colour coded bands of equal size (10 per cent each).
The DNA chart below for the districts of Cambridgeshire shows most districts have
more neighbourhoods in the least socio-economically deprived deciles than the
national average, although all have some neighbourhoods in more deprived deciles.
The notable exception is Fenland district, which has no neighbourhoods in the
most socio-economically advantaged 20 per cent, and a higher proportion in the
most deprived deciles.
Mostdeprived
Leastdeprived1 2 3 4 5 6 7 8 9 10
© Crown copyright and database rights 2017, Ordnance Survey 100023205Source: Index of Multiple Deprivation, department for communities & local government
https://www.gov.uk/government/statistics/english-indices-of-deprivation-2015
Map 2: Lower super output areas in Cambridgeshire, ranked by IMD (2015) decile
Figure 1: Cambridgeshire districts LSOAs, Index of Multiple Deprivation deciles 2015
Mostdeprived
Cambridge City
EastCambridgeshire
Fenland
Huntingdonshire
SouthCambridgeshire
0%
20
%
% of LSOAs within decile
40
%
60
%
80
%
100
%
Leastdeprived1 2 3 4 5 6 7 8 109
SECTION 1
6 | Annual Public Health Report 2017
SECTION 1
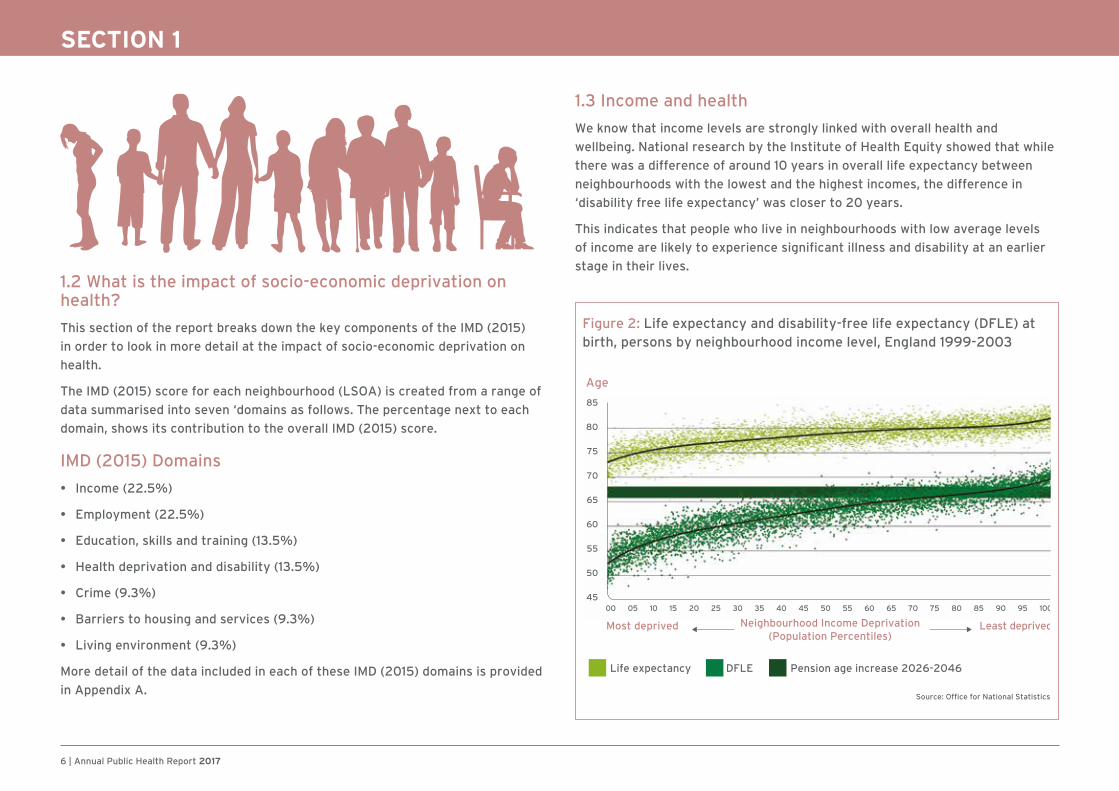
1.2 What is the impact of socio-economic deprivation on health?
This section of the report breaks down the key components of the IMD (2015)
in order to look in more detail at the impact of socio-economic deprivation on
health.
The IMD (2015) score for each neighbourhood (LSOA) is created from a range of
data summarised into seven ‘domains as follows. The percentage next to each
domain, shows its contribution to the overall IMD (2015) score.
IMD (2015) Domains
• Income (22.5%)
• Employment (22.5%)
• Education, skills and training (13.5%)
• Health deprivation and disability (13.5%)
• Crime (9.3%)
• Barriers to housing and services (9.3%)
• Living environment (9.3%)
More detail of the data included in each of these IMD (2015) domains is provided
in Appendix A.
1.3 Income and health
We know that income levels are strongly linked with overall health and
wellbeing. National research by the Institute of Health Equity showed that while
there was a difference of around 10 years in overall life expectancy between
neighbourhoods with the lowest and the highest incomes, the difference in
‘disability free life expectancy’ was closer to 20 years.
This indicates that people who live in neighbourhoods with low average levels
of income are likely to experience significant illness and disability at an earlier
stage in their lives.
Figure 2: Life expectancy and disability-free life expectancy (DFLE) at birth, persons by neighbourhood income level, England 1999-2003
Age
85
80
75
70
65
60
55
50
45
Source: Office for National Statistics5
Neighbourhood Income Deprivation(Population Percentiles)
Most deprived Least deprived
Life expectancy DFLE
00 05 10 15 20 25 30 35 40 45 50 55 60 65 70 75 80 85 90 95 100
Pension age increase 2026-2046

Annual Public Health Report 2017 | 7
SECTION 1
1.4 Income levels in Cambridgeshire districts
The following DNA chart shows the ‘Income’ domain scores for IMD (2015) for
each Cambridgeshire district. It’s clear that Fenland has a higher proportion of
income deprived neighbourhoods than other districts. The research from the
Institute of Health Equity would predict that Fenland would have shorter average
life expectancy and disability free life expectancy than the rest of the county.
It’s clear that the higher levels of income deprivation in North Fenland form part of
a wider picture, extending into West Norfolk and Lincolnshire. Conversely the low
levels of income deprivation in South Cambridgeshire district are part of a wider
picture extending into Suffolk, Essex and Hertfordshire.
It is also important to note that for people on low incomes living in the south
of the county including Cambridge City, high housing costs can significantly
limit the income they have available to meet other needs. More sophisticated
economic analyses would also include measures of income deprivation after
allowing for housing costs.
1.5 Factors affecting income deprivation
Income deprivation is related to the proportion of low paid work in the local
economy, which in turn depends on the types of employment available. This varies
across the county, with a higher dependence on farming and associated industries
such as food processing and packing in the northern rural areas. map 3 shows the
IMD (2015) income deprivation domain for Cambridgeshire and surrounding areas.
Figure 3: Cambridgeshire districts LSOAs, Index of Multiple Deprivation Deciles 2015 (Income)
Mostdeprived
Cambridge City
EastCambridgeshire
Fenland
Huntingdonshire
SouthCambridgeshire
0%
20
%
% of LSOAs with decile
40
%
60
%
80
%
100
%
Leastdeprived1 2 3 4 5 6 7 8 109
Source: Index of Multiple Deprivation, Department for Communities & Local Government https://www.gov.uk/government/statistics/english-indices-of-deprivation-2015
0 to 6.5 (1,703)
6.6 to 9.5 (1,745)
9.6 to 14.5 (1,737)
14.6 to 20.1 (1,148)
20.2 to 51.4 (1,178)
Map 3: Cambridgeshire and surrounding areas - % living in income deprived households reliant on means tested benefit, income domain score from the indices of deprivation 2015
© Crown copyright and database rights 2017
Ordnance Survey 100023205
8 | Annual Public Health Report 2017
SECTION 1
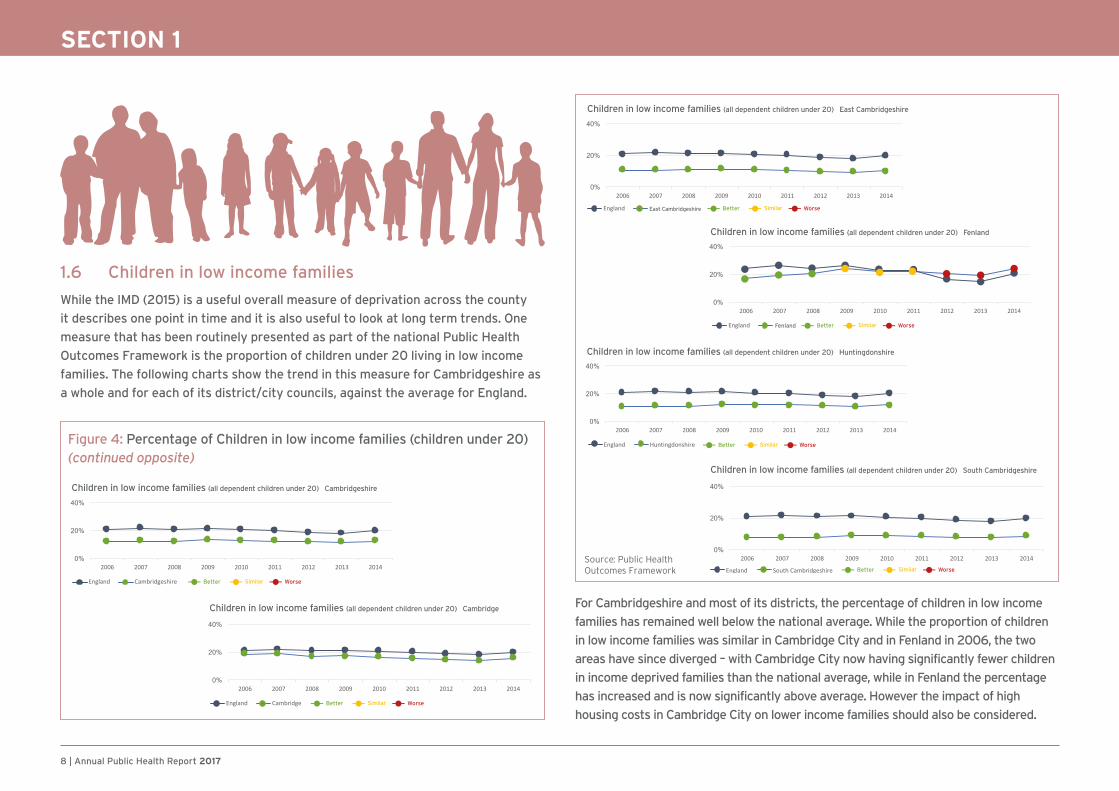
1.6 Children in low income families
While the IMD (2015) is a useful overall measure of deprivation across the county
it describes one point in time and it is also useful to look at long term trends. One
measure that has been routinely presented as part of the national Public Health
Outcomes Framework is the proportion of children under 20 living in low income
families. The following charts show the trend in this measure for Cambridgeshire as
a whole and for each of its district/city councils, against the average for England.
For Cambridgeshire and most of its districts, the percentage of children in low income
families has remained well below the national average. While the proportion of children
in low income families was similar in Cambridge City and in Fenland in 2006, the two
areas have since diverged – with Cambridge City now having significantly fewer children
in income deprived families than the national average, while in Fenland the percentage
has increased and is now significantly above average. However the impact of high
housing costs in Cambridge City on lower income families should also be considered.
Figure 4: Percentage of Children in low income families (children under 20) (continued opposite)
Children in low income families (all dependent children under 20) Cambridgeshire
SimilarBetter Worse
SimilarBetter Worse
Children in low income families (all dependent children under 20) Cambridge
Children in low income families (all dependent children under 20) East Cambridgeshire
SimilarBetter Worse
Children in low income families (all dependent children under 20) Huntingdonshire
SimilarBetter Worse
Children in low income families (all dependent children under 20) Fenland
SimilarBetter WorseFenland
Children in low income families (all dependent children under 20) South Cambridgeshire
SimilarBetter Worse
Source: Public Health Outcomes Framework

Annual Public Health Report 2017 | 9
SECTION 1
1.7 Employment and health
The IMD (2015) DNA chart for employment for Cambridgeshire districts, which
is based on the proportion of residents receiving out of work benefits, is very
similar to that for income. As for other measures, there is a high proportion
of neighbourhoods (LSOAs) in the least deprived 20 per cent nationally in
most Cambridgeshire districts, but Fenland has no neighbourhoods in the least
deprived 20 per cent and a higher proportion in the more deprived deciles.
The most common out of work benefit claimed is Employment Support Allowance
(ESA) which provides financial support to people with illness and disability who are
unable to work or are receiving personalised support to help them return to work.
There is a complex relationship between work and health – where unemployment and
low income are known to be risk factors for poorer health outcomes, but poor health
can in turn lead to reduced productivity, unemployment or reduced income. Map
4 shows the rates of ESA claimants for neighbourhoods in Cambridgeshire, which
closely mirrors the picture for wider IMD (2015) deprivation levels.
Source: Index of Multiple Deprivation, Department for Communities & Local Government https://www.gov.uk/government/statistics/english-indices-of-deprivation-2015
Figure 5: Cambridgeshire districts LSOAs, Index of Multiple Deprivation Deciles 2015 (Employment)
Mostdeprived
Cambridge City
EastCambridgeshire
Fenland
Huntingdonshire
SouthCambridgeshire
0%
20
%
% of LSOAs with decile
40
%
60
%
80
%
100
%
Leastdeprived1 2 3 4 5 6 7 8 109
33 to 70.9 (25)
24.1 to 32.9 (23)
17.7 to 24 (26)
14 to 17.6 (23)
2.6 to 13.9 (26)
© Crown copyright and database rights 2017, Ordnance Survey 100023205
Fenland
South Cambridgeshire
Huntingdon
Peterborough
Map 4: Rate of Employment Support Allowance (ESA) claimants in Cambridgeshire, May 2016 (per 1,000)

10 | Annual Public Health Report 2017
SECTION 1
1.8 Education and health We know that levels of education are closely related to health. Much of this
relationship is likely to be the result of better employment prospects and incomes
for people with higher qualifications. But there is also evidence that education
is linked to better ‘health literacy’ and adoption of healthier lifestyles. The
graph below shows that nationally, for adults up to the age of 75, people with no
educational qualifications are more than twice as likely to have an illness which
limits their daily life than people with degree level or similar qualifications.
We also know that as children grow, their cognitive ability - which will enable
them to do well at school, is strongly influenced by their social background. The
following graph, based on a study of children born in 1970, shows that children
from disadvantaged social backgrounds who had some of the highest (best)
cognitive scores (Q) at age two, had moved to below average cognitive scores by
age 10. Children from the most advantaged backgrounds with poor cognitive (Q)
scores at age two, had moved to better than average scores by age 10.
The Cambridgeshire DNA chart for the IMD (2015) Education Skills and Training,
shows that some Cambridgeshire districts score less well for this domain than
for income and employment. While Cambridge City and South Cambridgeshire
% ill
3rd level 5+O’s GCSE Other Qual No Qualifications2+A
30
20
10
0
Note: Vertical bars (I) representconfidence intervals
Source: Office for National Statistics Longitudinal Study18
Males
Females
Figure 6: Standardised limiting illness rate in 2001 at ages 16-71, by education level recorded
100
90
80
70
60
50
40
30
20
10
0
22 26 30 34 38 42 46 50 54 58 62 66 70 74 78 82 86 90 94 98 102 106 110 114 118
MonthsHigh socioeconomic status
Low socioeconomic status
Note: Q = cognitive scoreSource: 1970 British Cohort study17
Average positionin distribution
High Q at 22m
Low Q at 22m
Figure 7: Inequality in early cognitive development of children in the 1970 British Cohort Study, at ages 22 months to 10 years

Annual Public Health Report 2017 | 11
SECTION 1
have relatively high numbers of neighbourhoods in the least deprived 20
per cent for this domain, the proportion in both Huntingdonshire and East
Cambridgeshire in the top deciles is lower than the national average. Fenland has
no neighbourhoods (LSOAs) in the top 40 per cent nationally, and nearly half of
its LSOAs are in the lowest 20 per cent. There are also significant inequalities
within districts. Huntingdonshire, Cambridge City and East Cambridgeshire all
have neighbourhoods (LSOAs) in the lowest 10 per cent nationally. Educational
attainment, including its future impact on health and wellbeing is therefore a
particular concern for Cambridgeshire.
Source: Index of Multiple Deprivation, Department for Communities & Local Government https://www.gov.uk/government/statistics/english-indices-of-deprivation-2015
Figure 8: Cambridgeshire districts LSOAs, Index of Multiple Deprivation Deciles 2015 (Education, Skills and Training)
Mostdeprived
Cambridge City
EastCambridgeshire
Fenland
Huntingdonshire
SouthCambridgeshire
0%
20
%
% of LSOAs with decile
40
%
60
%
80
%
100
%
Leastdeprived1 2 3 4 5 6 7 8 9 10
1.9 School readiness
The first step to good educational attainment is for children to be ready to start
school, so that they are prepared for learning and can enjoy lessons. The ‘school
readiness’ of pupils is assessed in primary schools at the end of Reception year
and involves a range of assessment areas: personal, social and emotional
Case Study – Making a difference
Waterlees (Wisbech) Community Literacy Project
This project ran from 2012 to 2014. The total funding was £77,000,
provided by Cambridgeshire County Council. The project aimed to develop a
community approach to literacy development. The focus was the youngest
children and their families, and any people with low literacy within the
community, supported by initiatives that drew on local skills and capacity.
In 2013 in Wisbech only 31 per cent of Reception children achieved a good level of
development at the end of Reception year, using the national ‘school readiness’
measure. Two years later in 2015 this had risen to 57 per cent, showing an
increase of 26 per cent. This was almost double the national rate of improvement.
Because of the good results seen the county council has agreed to fund a
further community literacy project in Wisbech and a small number of other
areas around the county, and planning is underway for this.
development; physical development; and communication and language; as well
as the specific areas of mathematics and literacy. Figures for the 2015/16 school
year showed that for Cambridgeshire as a whole, the percentage of children who
were ‘school ready’ at age five was 69.7 per cent - similar to the England average
of 69.3 per cent. However, a more detailed breakdown of figures from the 2014/15
school year showed that only 49.3 per cent of Cambridgeshire children from more
disadvantaged backgrounds who were eligible for free school meals were ‘school
ready’, lower than the England average of 54.4 per cent for this group.
12 | Annual Public Health Report 2017
SECTION 1
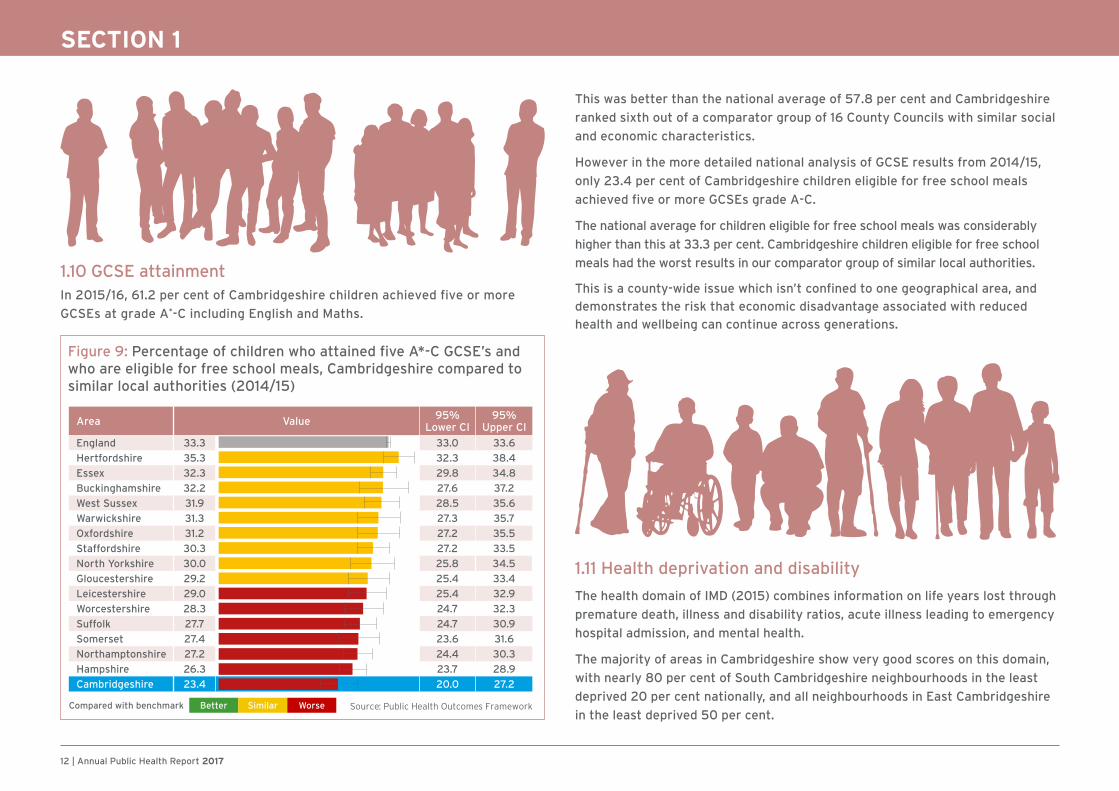
1.10 GCSE attainment In 2015/16, 61.2 per cent of Cambridgeshire children achieved five or more
GCSEs at grade A*-C including English and Maths.
This was better than the national average of 57.8 per cent and Cambridgeshire
ranked sixth out of a comparator group of 16 County Councils with similar social
and economic characteristics.
However in the more detailed national analysis of GCSE results from 2014/15,
only 23.4 per cent of Cambridgeshire children eligible for free school meals
achieved five or more GCSEs grade A-C.
The national average for children eligible for free school meals was considerably
higher than this at 33.3 per cent. Cambridgeshire children eligible for free school
meals had the worst results in our comparator group of similar local authorities.
This is a county-wide issue which isn’t confined to one geographical area, and
demonstrates the risk that economic disadvantage associated with reduced
health and wellbeing can continue across generations.
1.11 Health deprivation and disability
The health domain of IMD (2015) combines information on life years lost through
premature death, illness and disability ratios, acute illness leading to emergency
hospital admission, and mental health.
The majority of areas in Cambridgeshire show very good scores on this domain,
with nearly 80 per cent of South Cambridgeshire neighbourhoods in the least
deprived 20 per cent nationally, and all neighbourhoods in East Cambridgeshire
in the least deprived 50 per cent.
Figure 9: Percentage of children who attained five A*-C GCSE’s and who are eligible for free school meals, Cambridgeshire compared to similar local authorities (2014/15)
Area Value 95% Lower CI
95% Upper CI
England 33.3 33.0 33.6
Hertfordshire 35.3 32.3 38.4
Essex 32.3 29.8 34.8
Buckinghamshire 32.2 27.6 37.2
West Sussex 31.9 28.5 35.6
Warwickshire 31.3 27.3 35.7
Oxfordshire 31.2 27.2 35.5
Staffordshire 30.3 27.2 33.5
North Yorkshire 30.0 25.8 34.5
Gloucestershire 29.2 25.4 33.4
Leicestershire 29.0 25.4 32.9
Worcestershire 28.3 24.7 32.3
Suffolk 27.7 24.7 30.9
Somerset 27.4 23.6 31.6
Northamptonshire 27.2 24.4 30.3
Hampshire 26.3 23.7 28.9
Cambridgeshire 23.4 20.0 27.2
Compared with benchmark Better Similar Worse Source: Public Health Outcomes Framework
Annual Public Health Report 2017 | 13
SECTION 1
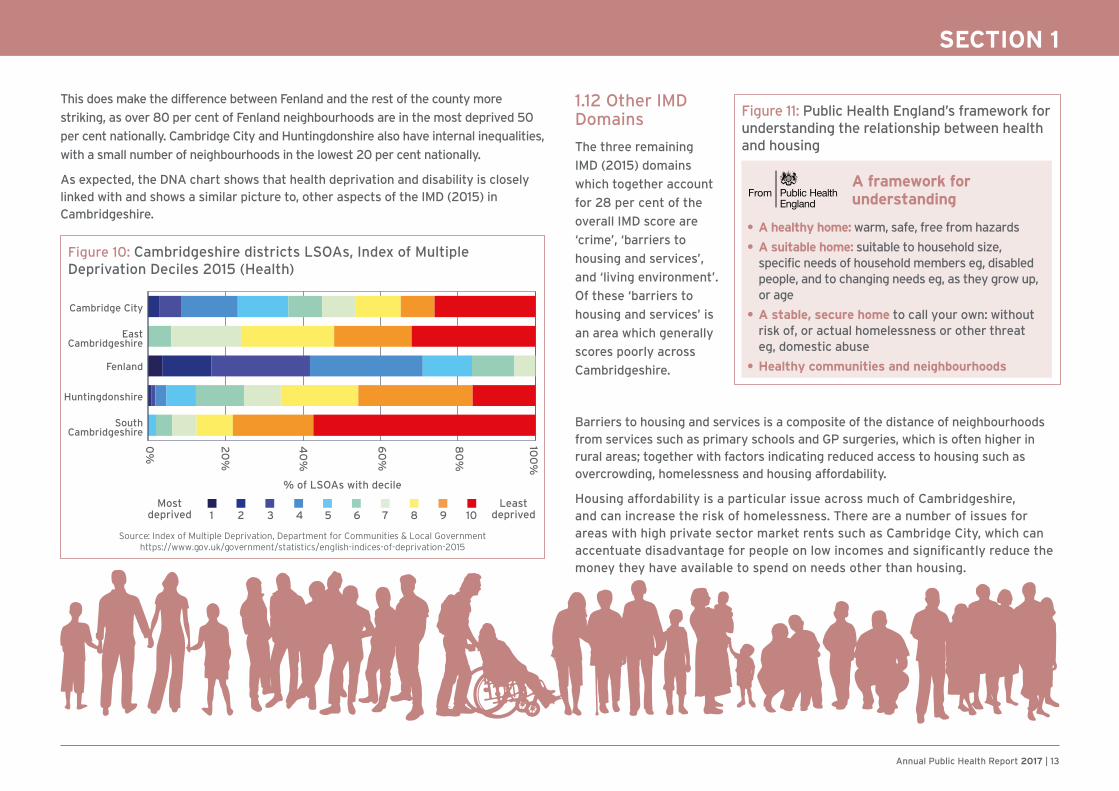
1.12 Other IMD Domains
The three remaining
IMD (2015) domains
which together account
for 28 per cent of the
overall IMD score are
‘crime’, ‘barriers to
housing and services’,
and ‘living environment’.
Of these ‘barriers to
housing and services’ is
an area which generally
scores poorly across
Cambridgeshire.
This does make the difference between Fenland and the rest of the county more
striking, as over 80 per cent of Fenland neighbourhoods are in the most deprived 50
per cent nationally. Cambridge City and Huntingdonshire also have internal inequalities,
with a small number of neighbourhoods in the lowest 20 per cent nationally.
As expected, the DNA chart shows that health deprivation and disability is closely linked with and shows a similar picture to, other aspects of the IMD (2015) in Cambridgeshire.
Barriers to housing and services is a composite of the distance of neighbourhoods from services such as primary schools and GP surgeries, which is often higher in rural areas; together with factors indicating reduced access to housing such as overcrowding, homelessness and housing affordability.
Housing affordability is a particular issue across much of Cambridgeshire, and can increase the risk of homelessness. There are a number of issues for areas with high private sector market rents such as Cambridge City, which can accentuate disadvantage for people on low incomes and significantly reduce the money they have available to spend on needs other than housing.
Source: Index of Multiple Deprivation, Department for Communities & Local Government https://www.gov.uk/government/statistics/english-indices-of-deprivation-2015
Figure 10: Cambridgeshire districts LSOAs, Index of Multiple Deprivation Deciles 2015 (Health)
Mostdeprived
Cambridge City
EastCambridgeshire
Fenland
Huntingdonshire
SouthCambridgeshire
0%
20
%
% of LSOAs with decile
40
%
60
%
80
%
100
%
Leastdeprived1 2 3 4 5 6 7 8 109
• A healthy home: warm, safe, free from hazards
• A suitable home: suitable to household size, specific needs of household members eg, disabled people, and to changing needs eg, as they grow up, or age
• A stable, secure home to call your own: without risk of, or actual homelessness or other threat eg, domestic abuse
• Healthy communities and neighbourhoods
A framework for understanding
Figure 11: Public Health England’s framework for understanding the relationship between health and housing

14 | Annual Public Health Report 2017
SECTION 2
Section 2: Key lifestyle and health behaviours - How does Cambridgeshire compare with other areas? It is increasingly recognised that a set of key lifestyle and health behaviours influence people’s risk of developing long term health conditions earlier in life and of dying prematurely.
The chart opposite indicates that almost one in five deaths in England can be
attributed to dietary factors and almost one in five to smoking. Lack of physical
activity and alcohol/drug use are also important risk factors.
It is also known that people’s social and environmental circumstances are
linked with their lifestyle behaviours and this has recently been mapped at local
authority level by Public Health England.
Figure 12: Attribution of deaths to risk factors and broken down by broad causes of death in England, 2013
Source: Public Health England ‘Health Profile for England’ 2017
Figure 13: The prevalence of risk factors across upper tier local authorities grouped into deprivation deciles. The most deprived areas have the highest prevalence of risk factors.
Smoking
Eating fewerthan 5 portions
of fruits andvegetables
a day
Inactive
Excessweight
0% 10% 20% 30% 40% 50% 60% 70%
Percentage of adults
Mostdeprived
Leastdeprived
England1234567810 9
Source: Public Health England ‘Health Profile for England’ 2017
Annual Public Health Report 2017 | 15
SECTION 2
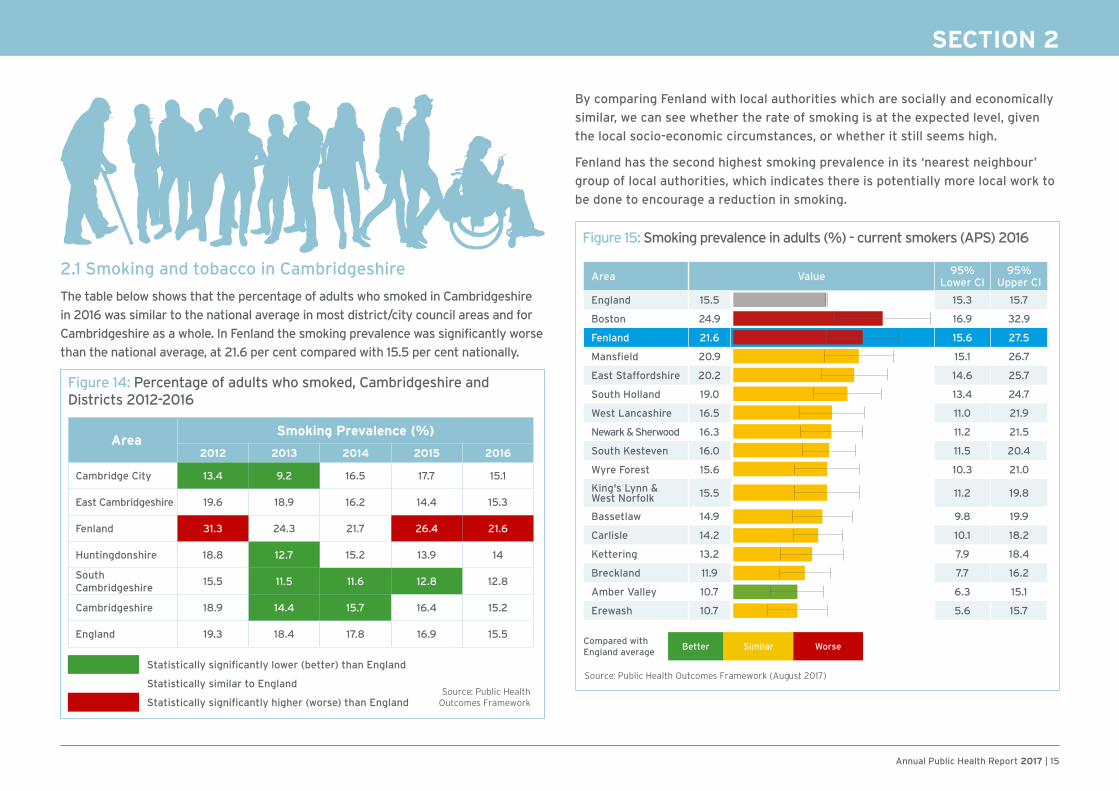
By comparing Fenland with local authorities which are socially and economically
similar, we can see whether the rate of smoking is at the expected level, given
the local socio-economic circumstances, or whether it still seems high.
Fenland has the second highest smoking prevalence in its ‘nearest neighbour’
group of local authorities, which indicates there is potentially more local work to
be done to encourage a reduction in smoking.
2.1 Smoking and tobacco in Cambridgeshire
The table below shows that the percentage of adults who smoked in Cambridgeshire
in 2016 was similar to the national average in most district/city council areas and for
Cambridgeshire as a whole. In Fenland the smoking prevalence was significantly worse
than the national average, at 21.6 per cent compared with 15.5 per cent nationally.
AreaSmoking Prevalence (%)
2012 2013 2014 2015 2016
Cambridge City 13.4 9.2 16.5 17.7 15.1
East Cambridgeshire 19.6 18.9 16.2 14.4 15.3
Fenland 31.3 24.3 21.7 26.4 21.6
Huntingdonshire 18.8 12.7 15.2 13.9 14
South Cambridgeshire
15.5 11.5 11.6 12.8 12.8
Cambridgeshire 18.9 14.4 15.7 16.4 15.2
England 19.3 18.4 17.8 16.9 15.5
Statistically significantly lower (better) than England
Statistically similar to England
Statistically significantly higher (worse) than EnglandSource: Public Health
Outcomes Framework
Figure 15: Smoking prevalence in adults (%) - current smokers (APS) 2016
Area Value 95% Lower CI
95% Upper CI
England 15.5 15.3 15.7
Boston 24.9 16.9 32.9
Fenland 21.6 15.6 27.5
Mansfield 20.9 15.1 26.7
East Staffordshire 20.2 14.6 25.7
South Holland 19.0 13.4 24.7
West Lancashire 16.5 11.0 21.9
Newark & Sherwood 16.3 11.2 21.5
South Kesteven 16.0 11.5 20.4
Wyre Forest 15.6 10.3 21.0
King's Lynn & West Norfolk 15.5 11.2 19.8
Bassetlaw 14.9 9.8 19.9
Carlisle 14.2 10.1 18.2
Kettering 13.2 7.9 18.4
Breckland 11.9 7.7 16.2
Amber Valley 10.7 6.3 15.1
Erewash 10.7 5.6 15.7
Compared with England average
Better Similar Worse
Source: Public Health Outcomes Framework (August 2017)
Figure 14: Percentage of adults who smoked, Cambridgeshire and Districts 2012-2016
16 | Annual Public Health Report 2017
SECTION 2
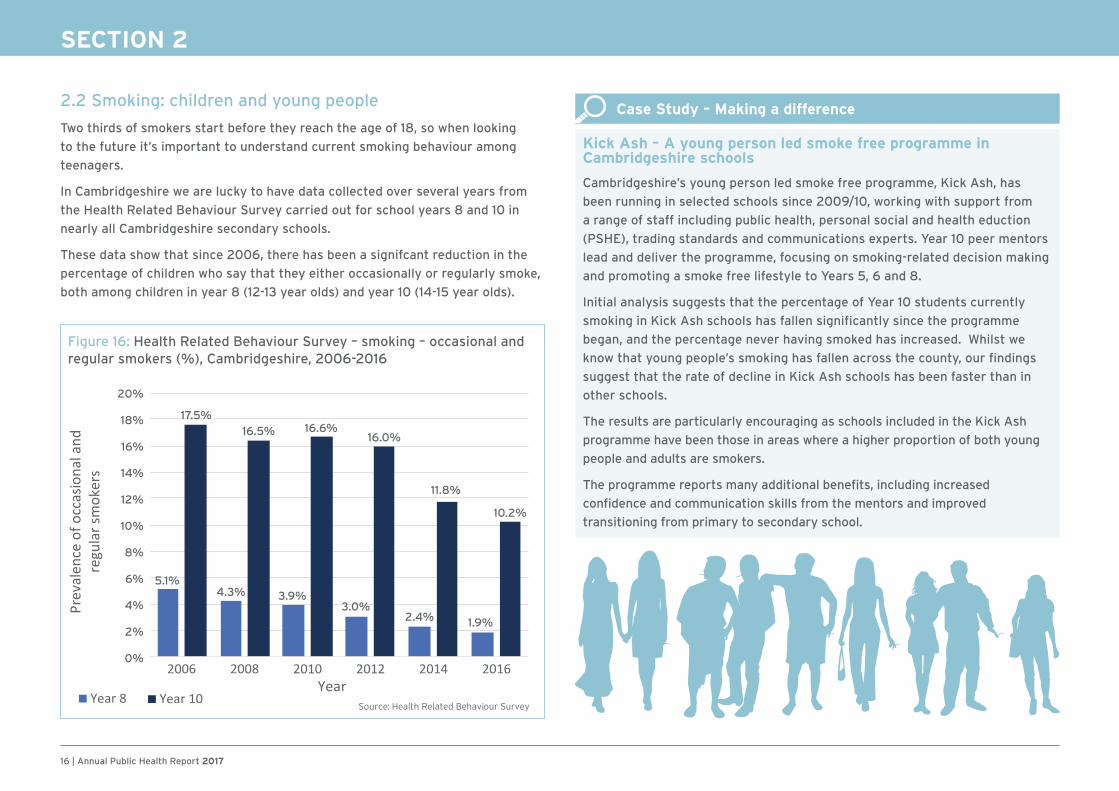
Figure 16: Health Related Behaviour Survey – smoking – occasional and regular smokers (%), Cambridgeshire, 2006-2016
20%
18%
16%
14%
12%
10%
8%
6%
4%
2%
0%
5.1%
17.5%
4.3%
16.5%
3.9%
16.6%
3.0%
16.0%
2.4%
11.8%
1.9%
10.2%
Source: Health Related Behaviour Survey
2.2 Smoking: children and young people
Two thirds of smokers start before they reach the age of 18, so when looking
to the future it’s important to understand current smoking behaviour among
teenagers.
In Cambridgeshire we are lucky to have data collected over several years from
the Health Related Behaviour Survey carried out for school years 8 and 10 in
nearly all Cambridgeshire secondary schools.
These data show that since 2006, there has been a signifcant reduction in the
percentage of children who say that they either occasionally or regularly smoke,
both among children in year 8 (12-13 year olds) and year 10 (14-15 year olds).
Case Study – Making a difference
Kick Ash – A young person led smoke free programme in Cambridgeshire schools
Cambridgeshire’s young person led smoke free programme, Kick Ash, has
been running in selected schools since 2009/10, working with support from
a range of staff including public health, personal social and health eduction
(PSHE), trading standards and communications experts. Year 10 peer mentors
lead and deliver the programme, focusing on smoking-related decision making
and promoting a smoke free lifestyle to Years 5, 6 and 8.
Initial analysis suggests that the percentage of Year 10 students currently
smoking in Kick Ash schools has fallen significantly since the programme
began, and the percentage never having smoked has increased. Whilst we
know that young people’s smoking has fallen across the county, our findings
suggest that the rate of decline in Kick Ash schools has been faster than in
other schools.
The results are particularly encouraging as schools included in the Kick Ash
programme have been those in areas where a higher proportion of both young
people and adults are smokers.
The programme reports many additional benefits, including increased
confidence and communication skills from the mentors and improved
transitioning from primary to secondary school.

Annual Public Health Report 2017 | 17
SECTION 2
2.3 Unhealthy weight and obesity
There has been national concern for some time about the long term rising trend in
both childhood and adult obesity, the implications that this has for individual health
and wellbeing, and the potential for increased demands on the health service due to
obesity related illness such as diabetes, joint problems and heart disease.
In Cambridgeshire a lower proportion of adults have an unhealthy weight than
the national average. When this is reviewed at a district level it’s clear that while
Cambridge City, with its young population, has a very low proportion of people with
unhealthy weight, East Cambridgeshire, Huntingdonshire and in particular Fenland
all have proportions of people with unhealthy weight which are significantly above
the national average.
Fenland also has a high rate of people with recorded diabetes (associated with
overweight and obesity) at 7.8 per cent of adults, compared with 6.4 per cent
nationally.
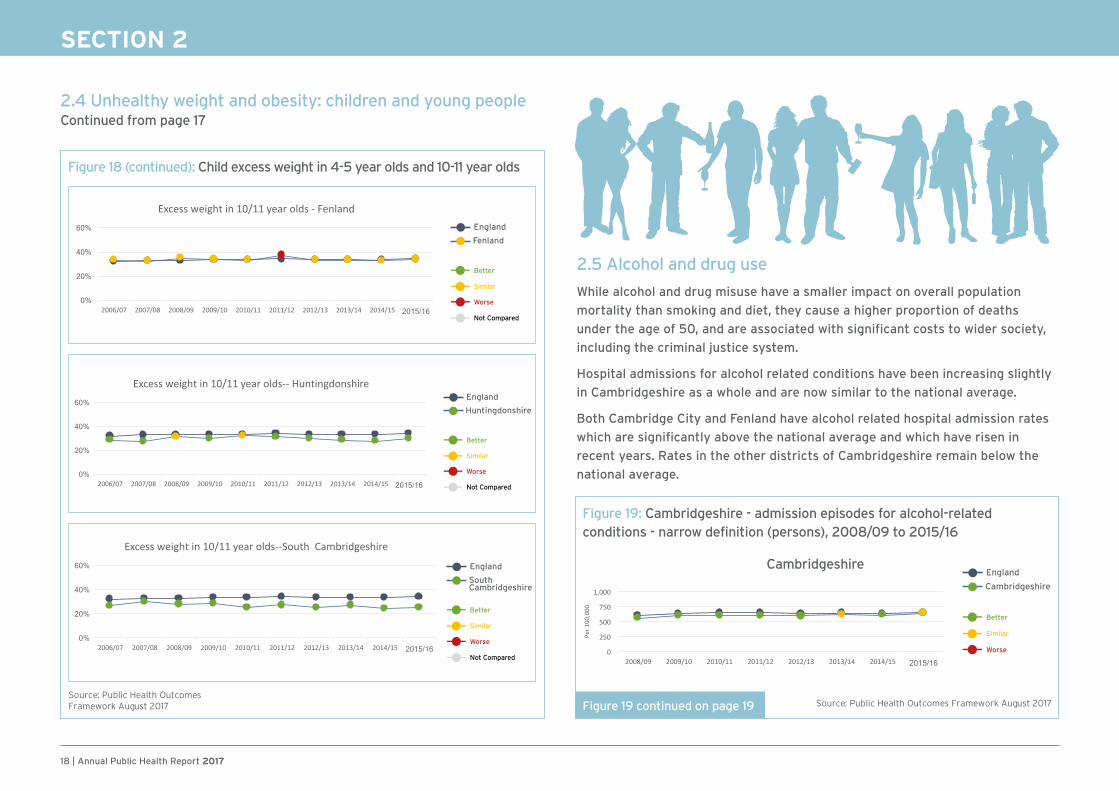
2.4 Unhealthy weight and obesity: children and young people
The weight of children in reception (age 4-5) and year 6 (age 10-11) is now measured
at school as part of the National Childhood Measurement Programme (NCMP).
The following trend graphs from 2006/07 through to 2015/16 show that the
percentage of children in year 6 in Cambridgeshire with an unhealthy weight has
fallen slightly from 29.4 per cent to 28.2 per cent between 2006/07 and 2015/16,
compared with a national increase from 31.7 per cent to 34.2 per cent. In Fenland
rates have stayed similar to the national average.
AreaExcess weight in adults, %
2012/14 2013/15
Cambridge City 48.3 46.7
East Cambridgeshire 68.0 68.1
Fenland 73.1 72.9
Huntingdonshire 67.3 67.6
South Cambridgeshire
63.6 63.6
Cambridgeshire 63.6 63.2
England 64.6 64.8
Statistically significantly lower (better) than England
Statistically similar to England
Statistically significantly higher (worse) than EnglandSource: Public Health
Outcomes Framework Source: Public Health Outcomes Framework August 2017
Figure 17: Percentage of adults with excess weight, Cambridgeshire & Districts, 2012/14 – 2013/15
Figure 18: Child excess weight in 10-11 year olds (%)
England
Cambridgeshire
Similar
Better
Not Compared
Worse
England
Cambridge
Similar
Better
Not Compared
Worse
England
EastCambridgeshire
Similar
Better
Not Compared
Worse
Figure 18 continued overleaf
18 | Annual Public Health Report 2017
SECTION 2
2.4 Unhealthy weight and obesity: children and young people Continued from page 17
2.5 Alcohol and drug use
While alcohol and drug misuse have a smaller impact on overall population
mortality than smoking and diet, they cause a higher proportion of deaths
under the age of 50, and are associated with significant costs to wider society,
including the criminal justice system.
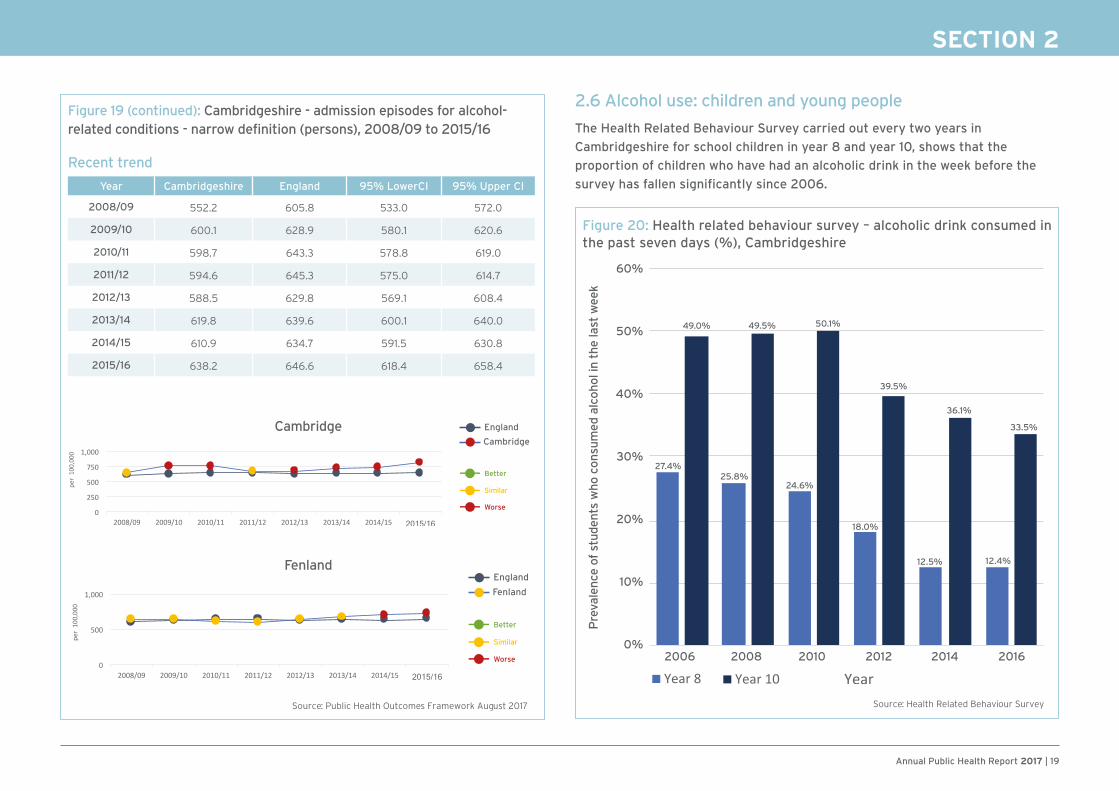
Hospital admissions for alcohol related conditions have been increasing slightly
in Cambridgeshire as a whole and are now similar to the national average.
Both Cambridge City and Fenland have alcohol related hospital admission rates
which are significantly above the national average and which have risen in
recent years. Rates in the other districts of Cambridgeshire remain below the
national average.
Figure 18 (continued): Child excess weight in 4-5 year olds and 10-11 year olds
England
Fenland
Similar
Better
Not Compared
Worse
England
Huntingdonshire
Similar
Better
Not Compared
Worse
England
SouthCambridgeshire
Similar
Better
Not Compared
Worse
Source: Public Health OutcomesFramework August 2017
England
Cambridgeshire
Similar
Better
Worse
Figure 19: Cambridgeshire - admission episodes for alcohol-related conditions - narrow definition (persons), 2008/09 to 2015/16
Figure 19 continued on page 19
Cambridgeshire
Source: Public Health Outcomes Framework August 2017
Annual Public Health Report 2017 | 19
SECTION 2
2.6 Alcohol use: children and young people
The Health Related Behaviour Survey carried out every two years in
Cambridgeshire for school children in year 8 and year 10, shows that the
proportion of children who have had an alcoholic drink in the week before the
survey has fallen significantly since 2006.
England
Fenland
Similar
Better
Worse
Figure 19 (continued): Cambridgeshire - admission episodes for alcohol-related conditions - narrow definition (persons), 2008/09 to 2015/16
Recent trend
Year Cambridgeshire England 95% LowerCI 95% Upper CI
2008/09 552.2 605.8 533.0 572.0
2009/10 600.1 628.9 580.1 620.6
2010/11 598.7 643.3 578.8 619.0
2011/12 594.6 645.3 575.0 614.7
2012/13 588.5 629.8 569.1 608.4
2013/14 619.8 639.6 600.1 640.0
2014/15 610.9 634.7 591.5 630.8
2015/16 638.2 646.6 618.4 658.4
England
Cambridge
Similar
Better
Worse
Cambridge
Fenland
Figure 20: Health related behaviour survey – alcoholic drink consumed in the past seven days (%), Cambridgeshire
Source: Health Related Behaviour Survey
60%
50%
40%
30%
20%
10%
0%2006 2008
27.4%
49.0% 49.5% 50.1%
39.5%
36.1%
33.5%
25.8%24.6%
18.0%
12.5% 12.4%
2010 2012 2014 2016
Pre
vale
nce
of s
tude
nts
who
con
sum
ed a
lcoh
ol in
the
last
wee
k
Source: Public Health Outcomes Framework August 2017
20 | Annual Public Health Report 2017
SECTION 3
Section 3: Mental Health trends in Cambridgeshire
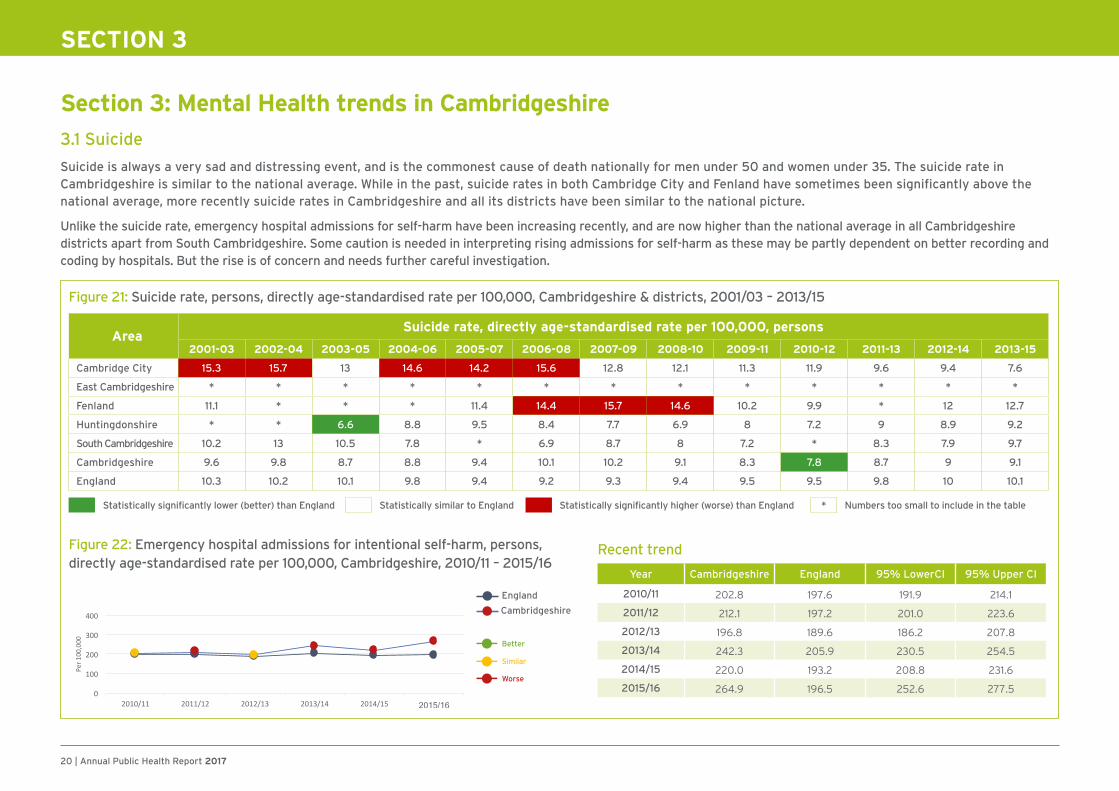
3.1 Suicide
Suicide is always a very sad and distressing event, and is the commonest cause of death nationally for men under 50 and women under 35. The suicide rate in Cambridgeshire is similar to the national average. While in the past, suicide rates in both Cambridge City and Fenland have sometimes been significantly above the national average, more recently suicide rates in Cambridgeshire and all its districts have been similar to the national picture.
Unlike the suicide rate, emergency hospital admissions for self-harm have been increasing recently, and are now higher than the national average in all Cambridgeshire districts apart from South Cambridgeshire. Some caution is needed in interpreting rising admissions for self-harm as these may be partly dependent on better recording and coding by hospitals. But the rise is of concern and needs further careful investigation.
AreaSuicide rate, directly age-standardised rate per 100,000, persons
2001-03 2002-04 2003-05 2004-06 2005-07 2006-08 2007-09 2008-10 2009-11 2010-12 2011-13 2012-14 2013-15
Cambridge City 15.3 15.7 13 14.6 14.2 15.6 12.8 12.1 11.3 11.9 9.6 9.4 7.6
East Cambridgeshire * * * * * * * * * * * * *
Fenland 11.1 * * * 11.4 14.4 15.7 14.6 10.2 9.9 * 12 12.7
Huntingdonshire * * 6.6 8.8 9.5 8.4 7.7 6.9 8 7.2 9 8.9 9.2
South Cambridgeshire 10.2 13 10.5 7.8 * 6.9 8.7 8 7.2 * 8.3 7.9 9.7
Cambridgeshire 9.6 9.8 8.7 8.8 9.4 10.1 10.2 9.1 8.3 7.8 8.7 9 9.1
England 10.3 10.2 10.1 9.8 9.4 9.2 9.3 9.4 9.5 9.5 9.8 10 10.1
Statistically significantly lower (better) than England Statistically similar to England Statistically significantly higher (worse) than England * Numbers too small to include in the table
Figure 21: Suicide rate, persons, directly age-standardised rate per 100,000, Cambridgeshire & districts, 2001/03 – 2013/15
Figure 22: Emergency hospital admissions for intentional self-harm, persons, directly age-standardised rate per 100,000, Cambridgeshire, 2010/11 – 2015/16
England
Cambridgeshire
Similar
Better
Worse
Recent trend
Year Cambridgeshire England 95% LowerCI 95% Upper CI
2010/11 202.8 197.6 191.9 214.1
2011/12 212.1 197.2 201.0 223.6
2012/13 196.8 189.6 186.2 207.8
2013/14 242.3 205.9 230.5 254.5
2014/15 220.0 193.2 208.8 231.6
2015/16 264.9 196.5 252.6 277.5

Annual Public Health Report 2017 | 21
SECTION 3
3.2 Children and young people’s mental health
There has been concern nationally about children’s and young people’s mental
health and access to appropriate mental health services, with a national
commitment to invest more in these services.
In Cambridgeshire, the Health Related Behaviour Survey of children in years
8 and 10 of secondary schools indicates some adverse trends in emotional
wellbeing since 2010, although these generally appear to have levelled out.
Since 2010 the proportion of children who describe themselves as sometimes
afraid to go to school because of bullying has increased, and the proportion of
children worried about exams and their future careers is also higher.
Rates of hospital admissions for self-harm amongst young people aged 10-24
have a rising trend in Cambridgeshire between 2011/12 and 2015/16, and are
well above the national average. Some caution is required as trends may be
the result of improved recording and coding by hospitals, but the issue is of
significant concern and requires further investigation.
England
Cambridgeshire
Similar
Better
Worse
Figure 24: Hospital admissions as a result of self-harm (10-24 years) Cambridgeshire. Directly standardised rate – per 100,000
Recent trend
Year Cambridgeshire England 95% LowerCI 95% Upper CI
2011/12 379.7 347.4 345.7 416.1
2012/13 396.2 346.3 361.3 433.6
2013/14 523.4 415.8 483.0 566.2
2014/15 477.6 398.8 439.0 518.6
2015/16 635.2 430.5 590.9 682.0
Source: Public Health England Child and maternal health profiles
Figure 23: Cambridgeshire schools health related behaviour survey findings 2010-2016
Source: Health Related Behaviour Survey
35%
30%
25%
20%
15%
10%
5%
0%
2010 2012 2014 2016
% pupils who at least sometimes feel afraid to be in school because of bullying
% of pupils picked on or bullied because of the way they look
% pupils who feel quite a lot ora lot satisfied with their life
% pupils who worry at leastquite a lot about school
work/exams/tests
% pupils who worry at leastquite a lot about their careers
70%
60%
50%
40%
30%
20%
10%
0%
2010 2012 2014 2016

22 | Annual Public Health Report 2017
Case Study – Making a difference
Cambridgeshire and Peterborough NHS Foundation Trust (CPFT) Mental Health Crisis First Response Service (FRS) and Sanctuaries
What was the problem?
Before this service was launched in September 2016 there was no capacity to see
people in need of mental healthcare out of hours except via A&E, and no self-
referral route, meaning many sought help direct from A&E. Service users told us
that it was very difficult and stressful trying to get help when in a mental health
crisis and they found the emergency department a stressful environment.
What was the solution?
• A new community-based crisis mental health service – ‘first response’ –
provides timely access to safe, effective, high quality care for people in mental
health crisis
• The first response service provides assertive and responsive support and
triage for anyone experiencing mental health crisis, including face-to-face
assessment if needed
• Open 24/7 for people of all ages throughout Cambridgeshire and Peterborough
• Welcomes self-referrals via dialing 111 and asking for option2 as well as
urgent referrals from carers, GPs, ambulance crews, police (anyone!) and the
emergency department.
What were the results?
• The service has demonstrated an immediate decline in the use of hospital
emergency departments for mental health needs with a 21 per cent reduction in
attendance despite the local context of many years of rapidly increasing figures
• A 26 per cent reduction in the number of people with mental health needs
being admitted to acute hospitals from the emergency department.
Section 4: Life expectancy and preventable deaths Life expectancy is an important summary measure for the overall health outcomes
in an area. It is generally quoted as an average over three years to make the statistic
more reliable. Life expectancy in Cambridgeshire as a whole has been consistently
above the national average since 2001-03 and has improved by over three years for
both men and women between 2001-03 and 2013-15. However life expectancy in the
county has ‘plateaued’ more recently, with no improvement for men since 2010-12
and only a small improvement for women.
There are inequalities in average life expectancy across the county, reflecting
differences in the wider determinants of health and lifestyle ‘risk’ behaviours
described in earlier sections. Average life expectancy for men in Fenland in
2013/15 was 78.6 years (significantly worse than the national average), while all
other districts in Cambridgeshire have above average male life expectancy, the
highest being South Cambridgeshire at 82.1 years. For women life expectancy in
Fenland is similar to the national average at 82.6 years, and again above average
in all other districts, the highest being South Cambridgeshire at 85.2 years.
SECTION 3
Figure 25: Cambridgeshire and districts average life expectancy by gender, 2013 to 2015
Indicator
Dat
a P
eri
od
Cam
bs
V
alu
e
En
gla
nd
va
lue
Cambridgeshire districts
Cam
brid
ge
E C
amb
s
Fen
lan
d
Hu
nts
S C
amb
s
Life expectancy at birth (Males), years 2013-15 80.9 79.5 80.3 81.6 78.6 81.0 82.1
Life expectancy at birth (Females), years 2013-15 84.4 83.1 84.1 84.8 82.6 84.7 85.2
Statistically significantly higher (better) than England
Statistically similar to England
Statistically significantly lower (worse) than England
SECTION 4

Annual Public Health Report 2017 | 23
SECTION 4
4.1 Trends in preventable deaths
Public Health England calculates a summary measure of deaths considered preventable through public health interventions in their broadest sense, and Cambridgeshire as a whole has shown a positive trend on this measure since 2001-03. However there has been a worrying upward movement in the most recent data on preventable mortality in Fenland, associated with an upturn in preventable deaths under the age of 75 from cardiovascular disease (heart disease and stroke).
England
Cambridgeshire
Similar
Better
Worse
England
Fenland
Similar
Better
Worse
Mortality rate from causes considered preventable (persons) - Cambridgeshire
Mortality rate from causes considered preventable (persons) - Fenland
England
Fenland
Similar
Better
Worse
Figure 26: Under 75 mortality rate from cardiovascular diseases considered preventable (persons), directly age-standardised rate per 100,000, Fenland, 2001-03/2013-15
Recent trend
Year Fenland England 95% LowerCI 95% Upper CI
2001 - 03 116.3 98.6 102.6 131.2
2002 - 04 107.6 91.9 94.7 121.9
2003 - 05 97.6 85.3 85.4 111.0
2004 - 06 88.3 78.9 76.8 100.9
2005 - 07 80.4 73.4 69.6 92.4
2006 - 08 73.2 68.9 63.0 84.7
2007 - 09 66.1 64.3 56.5 76.9
2008 - 10 64.0 60.7 54.6 74.5
2009 - 11 61.3 56.6 52.1 71.5
2010 - 12 54.5 53.5 46.0 64.2
2011 - 13 52.9 50.9 44.6 62.4
2012 - 14 52.3 49.2 44.0 61.6
2013 - 15 57.3 48.1 48.8 66.9
Source: Public Health Outcomes Framework
24 | Annual Public Health Report 2017
SUMMARY
Summary and recommendations This Annual Public Health Report 2017 has attempted to give a brief overview of some of the factors and circumstances which affect the health and wellbeing of
Cambridgeshire residents. It is clear that there are significant differences in health and the factors affecting health, both across the county as a whole and between
neighbourhoods within individual districts. One recommendation for the future is that where possible and statistically valid, we should be mapping more health and
wellbeing indicators at the local neighbourhood level to help ‘fine tune’ the provision, targeting and monitoring of campaigns and services.
It is often difficult to obtain data which is defined by circumstances other than geography, but this is possible for data on educational outcomes. The disparity in
educational outcomes between children receiving free school meals and their peers of the same age is a county-wide issue, and is consistent from the measurement of
school readiness in reception year right through to GCSE attainment at age 16. Addressing this should be a key public health priority due to the impact of educational
attainment on future health and wellbeing.
Another county-wide issue is young people’s emotional wellbeing – with some adverse trends seen since 2010 in the school based Health Related Behaviour Survey, and more
recently a rising trend in hospital admissions for self-harm. Joint work is already taking place across the NHS and local authorities to improve early intervention and support for
young people with mental health problems, so we would hope to see these trends improving, and the impact of this work needs careful monitoring.
Finally, there are a wealth of statistics throughout this report which demonstrate the health and wellbeing challenges for Fenland residents – in particular for the
North Fenland and Wisbech area. The causes are complex, with no easy answers – but a consistent and sustainable focus on the area from a range of organisations
will be needed to address the determinants of health such as educational attainment and economic development, as well as a focus from health and care providers on
delivering accessible prevention, treatment and support services to meet current needs.

Annual Public Health Report 2017 | 25
APPENDIX A
Domains and indicators for the updated Index of Multiple Deprivation IMD (2015)
• Adults and children in Income Support families
• Adults and children in income-based Jobseeker’s Allowance families
• Adults and children in income-based Employment and Support Allowance families
• Adults and children in Pension Credit (Guarantee) families
• Adults and children in Child Tax Credit and Working Tax credit families not already counted**
• Asylum seekers in England in receipt of subsistence support, accommodation support or both
• Claimants of Jobseeker’s Allowance (both contribution-based and income-based), aged 18-59/64
• Claimants of Employment and Support Allowance, aged 18-59/64
• Claimants of Incapacity Benefit, aged 18-59/64
• Claimants of Severe Disablement Allowance, aged 18-59/64
• Claimants of Carer’s Allowance, aged 18-59/64++
Income Deprivation
22.5%
Employment Deprivation
22.5%
Education, Skills and Training
Deprivation
13.5%
• Key Stage 2 attainment average points score
• Key Stage 4 attainment average points score
• Secondary school absence
• Staying on in education post 16
• Entry to higher education
• Adults with no or low qualifications aged 25-58/64**
• English language proficiency, aged 25-59/64++
Children and young people
Adult skills ++ New indicators ** Modified indicators
(% illustrates the weight of each domain
in the Index of Multiple Deprivation)

26 | Annual Public Health Report 2017
• Years of potential life lost
• Comparative illness and disability ratio
• Acute morbidity
• Mood and anxiety disorders
Recorded crime rates for:
• Burglary
• Violence
• Theft
• Criminal damage
• Road distance to: GP, supermarket or convenience store Primary school, Post Office
• Household overcrowding
• Houses affordability**
• Homelessness
• Housing in poor condition**
• Houses without central heating
• Air quality
• Road traffic accidents
Health Deprivation
and Disability
13.5%
Crime
9.3%
Barriers to Housing and
Services
9.3%
Living Environment Deprivation
9.3%
APPENDIX A
Geographical Barriers
Wider Barriers
Indoors Living Environment
Outdoors Living Environment
++ New indicators ** Modified indicators
(% illustrates the weight of each domain
in the Index of Multiple Deprivation)


www.cambridgeshire.gov.uk