Embed Size (px)
Citation preview

Calvin College Dormitory Bottom Up Energy Model Engineering 333: Section A Professor Heun May 18, 2017


Objective: The objective of ENGR-333-A was to develop a well-defined, bottom-up energy demand model for the energy consumption of the dormitories on Calvin College’s campus for each year of the past decade within an accuracy of ± 2%. Methods & Procedures: The class was divided into 7 groups, each comprising of 3-5 members. Groups were designated by respective areas of energy consumption that can be accounted for in the dormitories. A summary of each team and their area of responsibility can be found in Table 1. The teams individually and collectively acquired data for both electricity usage (kW) and duty cycle data (hr) for each respective area assigned. These two data values allowed for an estimate of the total electricity usage in kilowatt-hrs for each group. A summary of each teams data collection efforts along with subsequent calculations can be seen in Appendices 1-7, respectively. The total percent energy consumption for 2016 of each team can be found in Table 1. Historically, backcasting was conducted by each team and details can be seen in each respective appendix as well..
Table 1: Team Group Designations
Results: The results for each individual team can be found in Appendices 1-7. The class as a whole was able to model the dorms within a 2.34% error (based on a year sum total) in 2016. A summary of each teams contribution can be seen in Figure 1 as a stacked average graph. Historically, the class was far less accurate. The error in backcasting was primarily due to lack of documentation on both electrical device changes and historical human behavior. The stacked average graph for historical backcasting can be seen in Figure 2.
1

Figure 1: 2016 Team Contributions
Figure 2: Historical backcasting Team Contributions
2

APPENDIX TABLE OF CONTENTS 0. Future Recommendations
1. Hallway Lighting Technical Memorandum 2. Room Lighting Technical Memorandum 3. Computers and TVs Technical Memorandum 4. Gadgets Technical Memorandum 5. Appliances Technical Memorandum 6. Pumps Technical Memorandum 7. HVAC Technical Memorandum
3

Dormitory Bottom Up Energy Model
Appendix 0 Future Recommendations
4

Future Recommendations: Team 1: If motion sensing lights were implemented in NVW, it would save approximately 15,000 kWh/yr, which equates to $1800 per year in savings. Team 2: Since room lighting represents a large portion of the energy consumption in Calvin’s dormitories, the Room Lighting team recommends that all T8 CFL lights be replaced with 18 watt LEDs. This would result in an approximate investment of $40,048, and a payback period of six years.
Team 3: Team 3 recommends the limitation of the maximum screen size for student TV’s to 50 inch diagonally as well as limiting the number of gaming consoles per student. Team 4: In order to reduce energy consumption on Calvin’s campus, there are two main avenues of energy savings that students can achieve. First, students can limit the number of gadgets being used in the dorms. Although students have a need for most of the gadgets they use, limiting the usage of non-necessary gadgets would help reduce power consumption. Secondly, the college can encourage students to use gadgets that are up-to-date with battery technology. As new technology comes out and battery life improves, rechargeable gadgets will become increasingly more efficient with charging and power storage. Thus, discouraging students from using old laptops and other gadgets would decrease the number of inefficient batteries in use. We also predict that the usage of rechargeable gadgets will continue to increase with time, so these energy-saving habits will have more influence as time goes on. However, the rechargeable gadgets group has a small impact on the total dormitory energy consumption model. For this reason, we suggest focusing efforts on other groups in order to reduce the overall dormitory energy consumption. Team 5: In an effort to reduce energy consumption, Group A5 recommends introducing a cost system to the laundry machines in an effort to encourage students to only use the laundry machines when only necessary. The dryer machines consume the most electricity out of all appliances. To prevent small, unnecessary loads from being performed, a small charge could be added for use of the machines. A second recommendation would be to limit the amount of mini-refrigerators that are allowed in a single dorm room. The group identified a number of rooms during the walkthrough survey that had more than one mini-refrigerator in them, which is unnecessary. The final recommendation by Group A5 is to consider the removal of the vending machines from the dorm basements. Because the beverage vending machine has to refrigerate the beverages, it
5

has to run for most of the day. Removing the beverage vending machine and the snack vending machine from dorm basements could save an estimated 6,000 kW-hr per year. Team 6: Replace the current pumps with more efficient units. Team 7: The laundry room exhaust fans for the dormitories should be regulated more efficiently. If these fans are either put on a timer system or a motion detection system, it would ensure that they are only running when needed and not wasting any unnecessary energy. All of the circulation fan motors and air handler motors could be made to run more efficiently with stricter maintenance cycles. As most motor efficiencies are already fairly high, the only significant factor for them is maintenance. Dust and grime build up causes motors to draw more power than originally required and this increases consumption.
6

Dormitory Bottom Up Energy Model
Appendix I Hallway Lighting
Devin Auld, Scott Bokach, Joshua Bronner, and Alex Meador
7

Objective: The objective of Group A1 was to successfully account for all energy usage present in the hallways, entryways and basements of the seven Calvin dormitories for the year of 2016. This was done to aid the overall class goal of accounting for all dormitory electricity usage for 2016 within +/- 2%. The secondary objective was to backcast the data to match the trend over the past ten years. Research: To prepare for counting the dorm hallway lighting fixtures and account for their energy draw, initial research was conducted on various kinds of lighting and their uses at Calvin. Through conversations with the physical plant, this team learned that the Calvin dorms have gone through several lighting iterations starting with T12 fluorescent tubes, changing to T8 bulbs and lastly changing to T8 sized LED tube lights. Through online research it was found that T12 bulbs use 40 watts of electricity and cost between $3.00 and $4.50 for a 48 inch light bulb. It was then found that T8 bulbs use only 32 watts of electricity and cost between $2.80 and $3.00 for a 48 inch light bulb. Lastly it was found that T8 LED lights used only 18 watts and cost between $5.50 and $6.00. This data was used to help determine the electricity usage by each bulb in the dorm and then find a total current usage as well as an estimated usage for the past. Methods & Procedures: The primary objective was accomplished by manually counting lights and electronic fixtures present in the areas allocated to the team. This was done by individually completing dorm walkthroughs. Information was recorded in an internal team survey. Both the numerical count and applicable wattage data were tabulated into an excel file to aid in analysis. With a known number and wattage of lights and electronics present in the hallways, the team could calculate the power used by any one type of bulb or device. Next, the team moved on to calculating the duty cycles for each of these categories. The electric duty cycles were taken from both a micro and macro perspective. From the micro perspective, the team decided how long each light or device was on for a given day. It was assumed that when a dorm was occupied that the hallways and other areas of interest would be in use. The hallway lighting team worked in conjunction with Calvin Physical plant to obtain hallway lighting timing data. It was found that the current schedule has all hallway lights on for seventeen hours of the day, with a seven hour period at night where half of the lights are turned off. Electronic devices, such as wifi routers, fire alarms, and door alarms were assumed to be on at all times. Preliminary duty cycles were then ranged to better understand the most sensitive areas analyzed by the team.
It was found that the basement lighting was the most sensitive area. This was largely in part to large 60W U-shaped bulbs found in most dormitory basements. The lighting in the basements was found to not be on a timing system and thus further analysis was needed to find appropriate duty cycles. The hallways lighting team partnered with the Calvin Energy Recovery Fund (CERF) and was able to receive both a lux meter and concurrent lighting usage data taken from
8

the Noordewier Vanderwerp dorm. The lux meter received from CERF was used to observe the basement lighting duty cycle in the Schultze Eldersveld basement. This basement was chosen due to the lights being on a motion sensing system, instead of the common manual switch system. A discussions of the findings from this study can be found in Sub-Appendix 1.C.
During the summer months dorm occupancy drops as students move out, which results in portions of the hallway lighting being turned off entirely to conserve energy. The hallway lights are turned back on when summer camps and cleaning crews are present within the dorm. To calculate the duty cycles for the summer months, dorm event information was supplied by event services and reviewed to determine the occupancy. The duty cycle percentage multipliers for our model were calculated by dividing the number of days occupied for the month by the total number of days in the month. For BV, SE, NVW, BHT and RVD, the utilization percentages for the summer months was calculated to be 35%, 32% and 42% for June, July and August respectively. Increase summer camp activity in KHvR results in a utilization of 42%, 39% and 50% for June, July and August respectively. This can be seen in Figure 3.
After the current energy model was created for 2016 our group then began to backcast our model to show the change in energy usage over the past 10 years. In order to do this our group contacted the physical plant to determine when significant light changes took place so that the model could be updated to reflect the different efficiencies of the lights. It was determined that there was a significant change from T8 fluorescent tubes to T8 LED bulbs during the summer of 2015. This change was accounted for by multiplying the energy usage by the difference in efficiencies between the LED bulbs and fluorescent tubes. After this point there was no available data to indicate any other significant changes in lighting so our group left our model as a flat line as we assumed no significant change in usage or efficiency happened between 2007 and 2015.
Results: We found that hallway lighting contributes significantly to total annual electricity usage in the dorms. Specifically, hallway lighting accounts for 17.75% of current electricity use, and historically up to 27% of electricity use in the dorms. This can be seen graphically in Figure 1.1 and Figure 1.2. Our monthly duty cycles acted as our decision variables, the most sensitive of which were the basement lighting duty cycles. When refining basement lighting duty cycles using the lux meter data we found that basements which utilized motion sensing on off switches reduced their electricity demand significantly, as described in Appendix 1.B. In light of these discoveries the team recommends:
1) Switching all basement lights onto motion sensor activated power circuits. 2) Switch all basement light bulbs over to more efficient bulbs such as LED and Energy
Saving bulbs.
9

SUB-APPENDIX 1 TABLE OF CONTENTS
1.A: Key Figures 1.B: NVW /SE Basement Duty Cycle Analysis
10

Sub-Appendix 1.A: Key Figures
Figure 1.1: Hallway Lighting Monthly Energy Usage In 2016
Figure 1.2: Hallway Lighting Historical Energy Usage
11

Figure 1.3: Hallway Lighting Summer Utilization Example For BV Used In Duty Cycle
Calculations
12

Sub-Appendix 1.B: NVW /SE Basement Duty Cycle Analysis The lighting data for NVW was formatted into a graph and can be seen below in Figure 1.4. Any nonzero point on the line chart indicates a series of lights banks which were on. The SE data was formatted into a similar graph which can be seen in Figure 1.5. Any spike in the line indicates where the lights banks were turned on. It should be noted that the data for each study was collected over the period of the same week. For NVW, the data yielded that the basements lights were on 49% of the time during the week. This can be seen in Figure 1.6. For SE, it was determined that the lights were on for 23.9% of the time. This can be seen in Figure 1.7. This shows that there is a 25.1% decrease in electricity usage when motion sensing technologies are utilized. If motion sensing lights were implemented in NVW, it would save approximately 15,000 kWh/yr, which equates to $1800 per year in savings.
13

14

15

Figure 1.6: NVW Basement Lighting Percent ON/OFF (Manual Switch)
Figure 1.7: SE Basement Lighting Percent ON/OFF (Motion Sensing Switch)
16

Dormitory Bottom Up Energy Demand Model
Appendix II
Room Lighting
Ryan Hoek, Robert Lanser, Matthew Lenko, Elliot Slenk
17

Objective: The objective of Group A2, room lighting, was to gather physical data on the number of lighting fixtures and bulbs and bulb wattage, and use this data to develop a model for the lighting electricity usage of the seven Calvin College campus dormitories. This model consisted of the year 2016, and also backcasted lighting electricity usage to the year 2007. The group’s model was then applied to the class model, which had the initial goal of being within two percent of the actual annual energy usage.
Research & Data Collection: Light quantities and wattages were manually checked and recorded during dorm walkthroughs. A lux meter was placed in a laundry room to collect actual light usage. This data was then analyzed for a daily duty cycle, calculated as a daily percentage. Surveys were completed in the dorms to estimate accurate usages, and any additional lighting students had. An initial online survey was sent out, followed by a walk through survey. The walkthrough survey was helpful for the room lighting group because we were able to look at lights students brought in, and verify wattage. The survey results are below in the results section.
Methods & Procedures: At the start of the project, Group 2 identified that gathering light bulb quantities and wattages to be imperative to success. Dorm walkthroughs were conducted to determine wattages and quantities of the bulbs in all rooms of the residence halls (rooms were designated as areas with doors and limited foot traffic). Data was recorded in online spreadsheets where it was referenced and compared with dorm floor plans obtained from the physical plant. Dorm occupancy was determined to be a key variable for modeling; the residence life department was contacted and occupancy data was obtained. A typical student day was estimated to obtain values for the number of hours’ students are in their room with the lights on. After this initial estimate was made and input into one of the models, surveys were conducted with current residents to confirm the estimates. Historical projections were made on historical occupancy data and dorm overhead light bulb upgrades. Lighting upgrades were assumed to be one dorm per year, bulbs changed from F50 T12s to F32 T8s. Results: Room lighting accounted for 19.17% of the energy consumption, a total 253,620.4 kW-hr of energy during 2016. This percentage of energy consumption made Room Lighting the second largest category to the 2016 energy consumption model. The main lighting components that contributed to the total room lighting energy calculation were additional lights, overhead lights, closet lights, and laundry room lights. Based on the survey results and the lux meter data collection, the duty cycles for these variables were determined to be 8%, 19%, 13% and 22%, respectively. Figure 2.1 how the Room Lighting energy consumption changed on a monthly basis during 2016.
18

Figure 2.1: 2016 Energy Consumption from Room Lighting
Throughout the backcasting model, dorm room lighting was consistently the third highest source of electricity usage. Below, Figure 2.2 shows how the percent contribution changed over time. It accounted for a high of 19.81% in 2007 and a low of 16.07% in 2013.
Figure 2.2: Room Lighting Percent Contribution to backcasting Model
Discussion & Assessment: Through an analysis of adding and subtracting a half hour to each duty cycle (a conservative analysis), Team 2 has determined that an uncertainty value of 6.61% could be attributed to 2016. Based on this uncertainty, Room Lighting’s uncertainty could be responsible for up to 1.2% error in the overall energy demand model for the dorms. Although the 2016 model predicted the actual 2016 data within reason, these uncertainty calculations go to show that performing a bottom-up analysis with a high degree of accuracy can be difficult. However, Team 2 has used the given information and duty calculations to perform a Bottom-Up analysis which can be referenced for future energy improvements and considerations.
19
SUB-APPENDIX 2 TABLE OF CONTENTS
2.A Daily Duty Cycle Calculations
2.B Monthly Duty Cycle Calculations
2.C Occupancy Data
2.D Laundry Room Calculations
2.E Future Recommendations
20
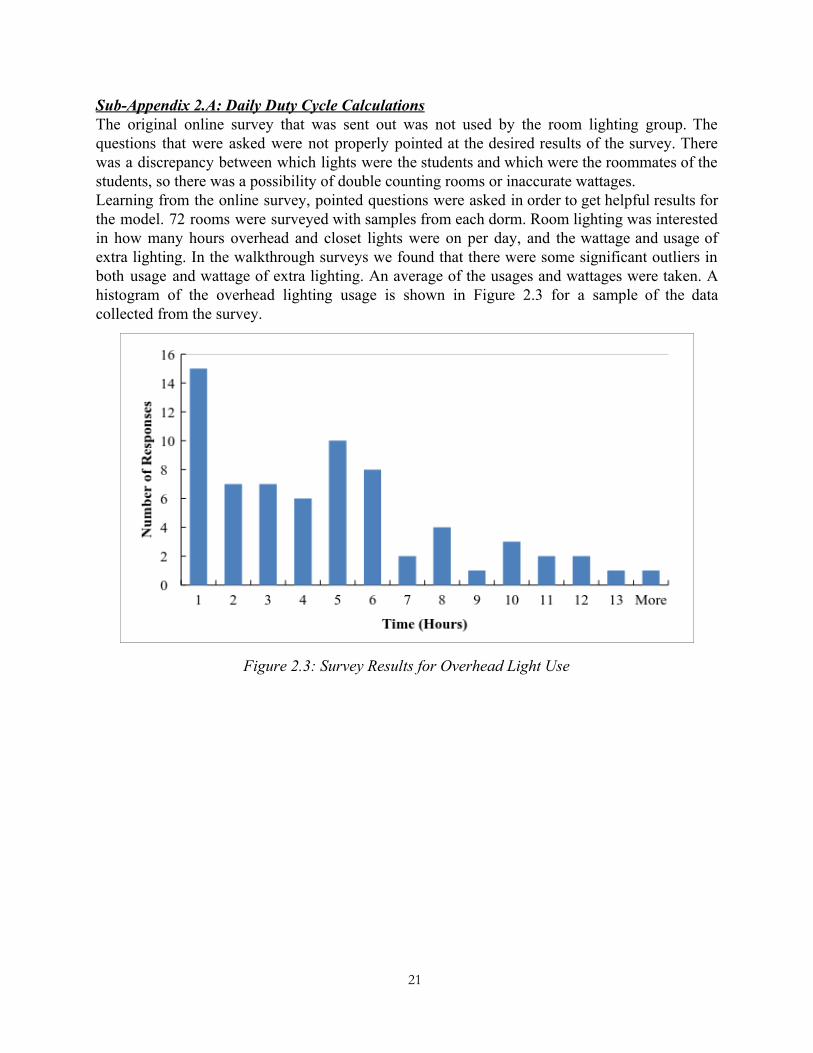
Sub-Appendix 2.A: Daily Duty Cycle Calculations The original online survey that was sent out was not used by the room lighting group. The questions that were asked were not properly pointed at the desired results of the survey. There was a discrepancy between which lights were the students and which were the roommates of the students, so there was a possibility of double counting rooms or inaccurate wattages. Learning from the online survey, pointed questions were asked in order to get helpful results for the model. 72 rooms were surveyed with samples from each dorm. Room lighting was interested in how many hours overhead and closet lights were on per day, and the wattage and usage of extra lighting. In the walkthrough surveys we found that there were some significant outliers in both usage and wattage of extra lighting. An average of the usages and wattages were taken. A histogram of the overhead lighting usage is shown in Figure 2.3 for a sample of the data collected from the survey.
Figure 2.3: Survey Results for Overhead Light Use
21

Sub-Appendix 2.B: Monthly Duty Cycle Calculations Monthly duty cycles were calculated by occupancy. The calculation consisted of week day, weekend, holiday, special event, and vacation factors (Table 2.1). The model holds the week day as the normal base day, factor of 1. All other types of days are scaled down from this datum.
Table 2.1: Duty cycle occupancy factors.
Scenario Occupancy Factor Weekday 1
Weekend day 0.75 Interim Factor 0.8
Christmas 0 Easter 0.2
Spring Break 0 Thanksgiving 0.15
Labor Day 0.5 Interim Break 0.35
The weekend factor was implemented as an accounting method for students who vacate campus on the weekend; Saturday and Sunday are considered weekend days, with Friday accounted as a weekday. Spring break and Christmas break were given factors of zero because students are required to vacate the dorms during these times. The interim factor was an additional factor that was multiplied in addition to the weekday, weekend factors. The interim factor accounts for the lower student body on campus due to interim trips and students not taking a class. The calculated duty cycles for each month are shown in Figure 2.4.
Figure 2.4: Monthly Duty Cycles
22

Sub-Appendix 2.C: Occupancy Data Annual dorm resident numbers were gathered with help from the Student Life office (Figure 2.5). These numbers were collected a month into the semester, this removes the number of students who drop out at the beginning of the semester from calculations. For modeling each dorm’s capacity was calculated (Figure 2.6), a full room was taken to be 2 students.
Figure 2.5: Annual Dorm Resident Population
Figure 2.6: Yearly Dorm Occupancy Percentages
23

Sub-Appendix 2.D: Laundry Room Data Analysis Thanks to Professor Heun and CERF, Team 2 was able to obtain a lux meter that would be used in the duty cycle calculation of the dorm laundry rooms. Figure 2.7 illustrates the results obtained from the Huizenga Laundry Room from March 11 to March 13. The daily duty cycle of 22% was applied to all the laundry room accounted for in the energy demand model.
Figure 2.7: Laundry Room Lux Meter Data Analysis
24

Sub-Appendix 2.E: Future Recommendations: Since room lighting represents a large portion of the energy consumption in Calvin’s dormitories, the Room Lighting team recommends that all T8 CFL lights be replaced with 18 watt LEDs. This would result in an approximate investment of $40,048, and a payback period of six years.
25

Dormitory Bottom Up Energy Model
Appendix III Computers and TVs
Brendan Biesboer, Kyle Mailhot, Nate Zylstra
26

Objective:
Group A3 was in charge of analyzing more than just computers and tv’s; this group was in charge of entertainment devices that remained plugged into the wall, including gaming systems, stereos, and external computer monitors. Laptop computers were not part of this group’s scope; the focus for computers was on desktop computers. A few bathroom appliances were observed as well, such as hair dryers. Methods & Procedures:
This project had a heavy influence on the behavior of students, the work consisted of three phases. The first phase was taking data on the behavior of the student body. This was done through the use of dorm-wide surveys. The next phase was determining the technical specifications of the devices that the students had. The team researched historical trends of device energy consumption and similar technical specifications. Finally, these two sections were combined into one model that is able to predict the energy consumption of the students due to their electronic devices that stay plugged in.
Research & Results:
To gather information on the usage of the devices in question, two surveys were put together in collaboration with other teams. The first survey was an online survey sent out to all students in the Calvin Dorms targeted at determining how many students had the devices being analyzed in their dorm rooms. There were over 222 responses to this survey, but a few issues arose with the ambiguity in certain answers on the survey. With the answers to the survey collected, a sensitivity study was performed. After looking at the initial survey data it was decided that the largest impact on the group’s electricity usage came from TVs. To help develop a better model and eliminate as much uncertainty as possible in the size and usage of TVs, a second survey was conducted where groups of students sat in the dorm lobbies asking students questions. Another 178 responses were gathered during this survey. The results of these two surveys can be found in Appendix 3.a. Finally, these results were combined to obtain an average behavior of students. These final results can be seen in Table 3.1.
27

Table 3.1: Final Combined Survey Results
When the data from the two surveys had been compiled together the group conducted research on the average electricity consumption by device. An average usage based on manufacturer specs for a variety of models for each product was found and used as the standard to analyze how much electricity was used by the devices in the dorms. For TVs the electricity was broken down to a per square inch of screen size to account for the wide variety of TV sizes throughout the dorms. Another assumption that had to be made was the percentage of students who owned LED TVs vs plasma. It was assumed there was a roughly 50% split between the two types of TVs along with another 50% split between Xbox and PlayStation consoles when it came to gaming systems. Using the data collected and the assumptions made by the team, it was determined that the appliances accounted for by the TV and Computers group used 30,620.4 kWh of electricity in 2016, accounting for 2.31% of the total electrical energy consumption in the dorms that year. Backcasting the data to 2007 consisted mainly of determining when certain trends of TVs and gaming consoles occurred. LED TVs did not show up on the market until 2008, thus is was determined that a linear trend occurred for people switching from plasma TVs to LED TVs up to 2016 where there was a 50% split between the two. Since the Xbox and PlayStation gaming consoles where the largest contributor to power draw from gaming, it was important to determine when new consoles were released to alter the specs on their power draw. The Xbox One and PlayStation 4 were released in November of 2013. This new generation of gaming consoles was forecasted to be purchased by 50% of gaming console users by 2016. Another contributing factor to the TV and Computers electricity usage would have been the switch from primarily desktop computers to laptop computers by students, but research showed that this occurred
28

before the allotted time window this project was looking at, making the information irrelevant and the only factor for desktop computers to be the improvements in efficiency over the past ten years. Once the data was compiled a graph of the backcasted electricity usage was put together as shown in Figure 3.1. When combined with the overall electrical usage over the past ten years, TVs and Computes still held around 2% of the energy usage each year.
Figure 3.1. backcasted data for TV and Computers group
Future Projections: Due to the small impact of the devices monitored by the TV and Computers group, there is no critical place to look at decreasing the energy consumed by these products. The only real impact on these products is limiting the size of TVs since the efficiency of screens over 50 inches decreases significantly. Other possibilities would be limiting the number of gaming consoles students could own, but there would be retaliation for these small electricity savings that could be avoided by looking for savings elsewhere.
29

SUB-APPENDIX 3 TABLE OF CONTENTS
3.A Tables 3.B Figures 3.C Future Recommendations
30

Sub-Appendix 3.A: Tables
Table 3.2: Final combined survey results Table 3.3: Google drive survey results
Table 3.4: Dorm lobby survey results
31

Sub-Appendix 3.B: Figures
Figure 3.2: backcasted data for TV and Computers group
Figure 3.2: Energy consumption per screen inch models for plasma and LED TV’s
32

Figure 3.3: Historical student ownership prediction of Plasma and LED TV’s Figure 3.4: Historical student ownership prediction of Xbox 360 and PS3 versus Xbox One and
PS4 gaming consoles
33

Sub-Appendix 3.C: Future Recommendations
● Limit the maximum screen size for student TV’s to 50 inch diagonally. ● Limit the number of gaming consoles per student.
34
Dormitory Bottom Up Energy Model
Appendix IV
Rechargeable Gadgets
Jonah Engel, Rich Floro, Björn Krebs, Ethan Postmus
35

Objective: The objective of Group A4 was to develop a well-defined, bottom-up electricity demand model to predict the annual energy consumption for the rechargeable gadgets used by students in the dorms of Calvin College for each year of the last decade. Initial Model: The initial model was created by applying details from knowledge about gadgets that were owned by team members. The model was formulated based off voltage and current draw of respective gadget chargers. These numbers varied from gadget to gadget, so the different types of models that dorm students might own needed to be taken into account. Using this knowledge, the idea of the online dorm survey came into fruition. Questions that were asked included gadget brands, duration of charges, and how old devices were. This data was then applied to the model to calculate an average student energy consumption value. Table 4.1 in Appendix 4.A provides an example of how the calculations were performed.
Research: Team A4 began the project by researching different chargers for multiple different devices. Charging power was calculated by multiplying the current draw by the voltage rating. The amount of time that the gadgets were plugged in was also necessary to get a kilowatt-hour value. However, this research proved to be tedious and extremely variable. After a suggestion from Professor Heun, the Gadgets team made a switch from considering the charging power and time to the number of charge cycles per day. Combining daily charge cycles with battery capacity in milliamp-hours calculated the kilowatt hour energy usage for each type of device. This research method proved to be more accurate and reliable. Data sheets for all kinds of models and iterations of gadgets are readily available online and provide reliable data for the amounts of energy required to charge the battery. For each gadget category, different types and their respective battery capacities were entered in excel and averages were taken. This yielded an average battery capacity for each gadget category. The surveys that the Gadget Team created allowed the online data to be directly applied to Calvin College’s dorm population. The updated example of calculations and battery data are found in Table 4.2 and Table 4.3 of Appendix 4.A. Survey Information:
In order to have data to base our modeling decisions on, the team decided to survey the student population that lived in the dorms. Our first approach was to develop an online survey that was sent out via email to the students that lived in the dorms. Unfortunately, the online survey results weren’t as successful as hoped for because it resulted in only 229 responses out of approximately 1800 students. After sending out the online survey, the group developed a need for more detailed questions, so a second face-to-face survey was developed. The second approach for collecting data was through a more detailed “in person” survey. The survey was conducted by sitting in the lobby of two dorms during the peak traffic hours and asking individuals to voluntarily answer a few select questions about their rechargeable gadgets. The goal of the second survey was gather more data to assist in
36

approximating Team A4’s most sensitive variables. The results of the second survey were very helpful in constructing the team’s model. Backcasting: In order to backcast energy consumption for the time period between 2007 and 2016, statistical data on gadget ownership and knowledge of technological trends were used to extend our model backwards. Pew Research provided data on smartphone, non-smartphone, and laptop ownership for most of the desired time period. The data on smartphone ownership did not extend for the full period, so a linear curve fit of the available data with an R squared value of .982 was used to predict the ownership for the years 2007 through 2010. Similarly, limited data was available for laptop ownership, so a linear curve with an R squared value of 0.7388 was used to approximate the ownership for the missing years. The average phone and laptop ownership for each year can be found in Figures 4.1 and 4.2 respectively. For each year, multiplier consisting of
was calculated. This multiplier was then applied to the total electricity2016 Ownership (%)Ownership for year 20XX (%)
generated by each device for the corresponding year, allowing for the trends in device ownership to be reflected across our yearly models. Additionally, because our model uses a basis of per-person consumption, data on the total dorm population was obtained, and reflected in our yearly models. Figure 4.3 shows the total Calvin dorm population over the years in question. Results When looking at the overall model, the rechargeable gadgets group has very low impact compared to the other energy usage groups, only contributing 1.92% of the total consumption. The total energy consumption from rechargeable gadgets modeled for 2016 can be found in Figure 4.4 of Appendix 4.A. Historically, a general upward trend can be developed, which corresponds to the increase in laptop and smartphone ownership as seen in Figure 4.5 in Appendix 4.A. The decline of non-smartphones, which require less charging and having lower battery sizes compared to the rising number of smartphones, would correlate with the general upward trend in energy consumption. The decrease in total energy consumption for the years of 2008, 2009, 2014, and 2015 matched the years over which the total Calvin dorm population decreased. Overall, the behavior of our energy consumption model matches trends in device ownership and dorm population over the past ten years.
Discussion & Assessment: Overall, the gadget group had a very low impact on the total energy consumed in the dorms. In 2016, the gadgets were calculated to contribute 1.92% of the total energy consumed. With that in mind, energy saving efforts should be focused elsewhere to places where efficiency can be improved or where there are high amounts of energy consumption. Finally, a significant amount of the data necessary for this assignment required specific knowledge of student behavior. The gadget group attempted to understand that behavior with the dorm surveys, however it was difficult to backcast that data corresponding to other classes and their gadgets because of the variation and advancement of rechargeable devices over the last decade.
37

SUB-APPENDIX 4 TABLE OF CONTENTS
4.A Tables & Figures 4.B Future Recommendations 4.C Works Cited
38

Sub-Appendix 4.A: Tables & Figures
Table 4.1: Example of Initial Data Collection Calculations.
Table 4.2: Example of Updated Battery Data Calculations.
Table 4.3: Updated Phone Battery Data Collection
39

Figure 4.1: Smartphone and Non-Smartphone Ownership Trends
Figure 4.2: Laptop Ownership Trends
40

Figure 4.3: Calvin College Dorm Population from 2006 to 2016
Figure 4.4: 2016 Monthly Gadget Electricity Consumption
41

Figure 4.5: backcast Gadget Electricity Consumption
42

Sub-Appendix 4.B: Future Recommendations In order to reduce energy consumption on Calvin’s campus, there are two main avenues of energy savings that students can achieve. First, students can limit the number of gadgets being used in the dorms. Although students have a need for most of the gadgets they use, limiting the usage of non-necessary gadgets would help reduce power consumption. Secondly, the college can encourage students to use gadgets that are up-to-date with battery technology. As new technology comes out and battery life improves, rechargeable gadgets will become increasingly more efficient with charging and power storage. Thus, discouraging students from using old laptops and other gadgets would decrease the number of inefficient batteries in use. We also predict that the usage of rechargeable gadgets will continue to increase with time, so these energy-saving habits will have more influence as time goes on. However, the rechargeable gadgets group has a small impact on the total dormitory energy consumption model. For this reason, we suggest focusing efforts on other groups in order to reduce the overall dormitory energy consumption.
43

Sub-Appendix 4.C: Works Cited Computer Data: Zickuhr, Kathryn. "Generations and their gadgets." Pew Research Center, 3 Feb. 2011,
www.pewinternet.org/2011/02/03/generations-and-their-gadgets/. Accessed 2 May 2017. Headphone Data: Linshi, Jack. "Beats Rolls Out its First Wireless Earphones." Times , 12 June 2014,
time.com/2865173/beats-rolls-out-its-first-wireless-earphones/. Accessed 2 May 2017. Phone Data: "Mobile Fact Sheet." Pew Research Center, 12 Jan. 2017,
www.pewinternet.org/fact-sheet/mobile/. Accessed 2 May 2017.
44

Dormitory Bottom Up Energy Model
Appendix V
Appliances
Cameron Bell, Caleb Bieske, Chris Griffin, & Bernice Portugal
45

Objective: The objective of Group A5 was to model all energy consumption related to dorm room appliances and community appliances in the 7 dormitory buildings and to accurately backcast that data ten years. An objective of ±2% accuracy compared to meter data was set for the overall class model. Research and Data Collection: To begin making accurate energy usage estimations for the dormitories, research was done for the power draw of every item. For items in which the brand was known, such as Keurig, vending machines and elevators, the power draw rate was taken directly from the manufacturer’s manual. For items whose brand varied throughout the dormitories, such a mini-fridges, fans, and personal printers, the typical power draw rates were taken from previously studied data, well-common companies such as Georgia Power, and websites whose content offered such data. The power draw rates implemented into the energy usage estimations do not take into account the “energy saving mode,” “sleep mode,” or any other modes aside from the average power draw and it's “ready mode.” The reason for this exclusion is because of the lack of known data. For example, data such as how long a student’s personal printer is on “sleeping” or “printing” mode is difficult to obtain and can vary individually. Therefore, using the average based power draw allows for consistency within our estimations. Throughout the project, continuous research for verifying the power draw rates used was performed. To obtain the number of appliances used, two methods were executed: an online survey and a walk through survey, which are further detailed in the Methods and Procedures section. Methods & Procedures: Group A5 was initially tasked with the refrigerators in the coffee kitchens of the dorms and the mini-fridges in students’ rooms. The scope of the group’s subject area broadened immensely to general appliances. The branch of appliances that are found in the coffee kitchen include: Full-size refrigerator with freezer, oven, microwave, and toaster. There are also numerous small-scale appliances that could be found in a student’s room such as half-size mini-fridges, full-size mini fridges, mini-fridges with freezer compartments, personal printers, box fans, circular fans, tower fans, coffee pots, and both small and large Keurig coffee makers. Thirdly, the appliances that we studied that are located in the dorm lobbies or basements are school printers, washers & dryers, and both beverage and snack vending machines.
We gathered almost exact quantities of the appliances found in the public spaces of every dorm based on walkthroughs and experience living the dorms. As for the personal appliances, we needed to gather accurate data from small samples in order to scale up to the whole dorm population. First a survey was conducted via email to students living in the dorms and we received 227 responses. The wording in some of the questions may have caused confusion about owning an appliance personally versus having one in your room, and led to strewed data. Therefore, we conducted a walkthrough of dorm rooms in order to get estimates of the number of certain appliances per room, and not per student.
To generate the amount of appliances in each dorm, the results from the walkthrough survey were analyzed. Percentages of dorm rooms that contained a specific appliance were generated. These percentages were then multiplied by the amount of rooms occupied in a specific dormitory to attain the total amount of appliances in each respective dormitory building. This method of calculating the appliances was very advantageous in backcasting because the group was able to simply enter the amount of rooms occupied in a dorm for a specific year and the number of appliances was output.
46

Results: The group determined that the appliances in each dorm made up a collective 32.27% of Calvin’s total energy consumption in the dormitories for 2016. Of this 32.27%, the combination of dryers, box fans, and full-size refrigerators contributed 55% towards the appliance’s yearly total. Through the backcasting process, a 10-year average was calculated and found to be 28.1% of Calvin’s total energy consumption. The group found this value to be reasonable given the applicable appliances and relative appliance efficiencies have not increased by a large amount over the past 10 years, as stated previously. Figure 5.1 below presents the final calculated energy consumption data from the combined 7 dorm’s appliances, projected monthly. The energy consumption decreases during the summer months to account for a decreased number of students in the dorm.
Figure 5.1: 2016 Energy Consumption from Appliances
Throughout the backcasting model, appliances consistently remained among the two highest sources of electricity usage. Below, Figure 5.2 shows how the percent contribution changed over time. It accounted for a high of 32.27% in 2016 and a low of 26.96% in 2008.
47

Figure 5.2: Average percent of total energy consumption per year in the backcasting analysis.
Discussion & Assessment: The dormitory appliances consumed the largest amount of energy each year, except for in 2009, 2011, 2013 and 2014 when hallway lighting consumed more energy. In 2016, appliances accounted for 32.27% of the total energy consumption in the dormitories. In a ten-year average in the backcasting analysis, appliances consumed 435,000 kW-hr per year, accounting for approximately 28% of total consumption. Group A5 found the appliance consumption numbers to be acceptable, due to the amount of appliances in the dorm and the amount that they are operated.
48

SUB-APPENDIX V TABLE OF CONTENTS 5.A Duty Cycle Calculations 5.B Future Recommendations
49

Sub-Appendix 5.A: Duty Cycle Calculations Group A5 found that many different appliances required different duty cycles, as specific appliances are operated different amounts than others. Group A5 also collaborated with Group A2, Room Lighting, to generate duty cycles based on when students were present in the dorms. The appliance duty cycles were split into three categories: general appliances, fans, and laundry machines. The reasoning behind this three-way split is as follows; the laundry machines are operated on a per-load basis rather than a per-hour basis, so modeling on a per-hour basis would be inaccurate. Box fans, circular fans, and tower fans are operated at a much higher rate than an appliance such as a toaster or a microwave, hence a specific duty cycle was given to fans. General appliance duty cycles were calculated based on when students are present in the dorms. These duty cycles accounted for breaks where students were on vacation, such as interim break in January and Christmas break in December. General appliances include all types of mini-refrigerators, personal printers, microwaves, ovens, toasters, Keurigs, and coffee pots. These duty cycle values can be seen below in Figure 5.3.
Figure 5.3: General appliance duty cycle values for one calendar year.
Fan duty cycles were estimated based on the temperature of the month and the amount that the students are present in the dorms. For example, the month of January was assigned a fan duty cycle of five percent, while the month of May was assigned a fan duty cycle of 60%. The complete annual fan duty cycle can be seen below in Figure 5.4.
50

Figure 5.4: Fan duty cycle values for one calendar year.
The duty cycles for washers and dryers were calculated based on the online survey and walkthrough survey results. The washers and dryers are calculated on a per-student basis, rather than a per-dorm room basis like the rest of the model. Students were questioned on how often they did laundry; once every other week, once per week, twice per week, or more than twice per week. Then, a weighted average was calculated, and a number of 3.14 loads per day was calculated. This value was per machine, so in every dorm 3.14 loads were performed per day, per machine. This value also accounted for the cleaning staff washing rags and materials used. Resident director appliances were also calculated differently. As all of the resident directors opted out of this beneficial class project, the group assumed that the resident directors did not follow the student break schedule. Therefore, separate duty cycles for ovens, oven surfaces, washers and dryers were calculated. Washers and dryers were subjected to 0.28 loads per day, or approximately 2 loads per week. Vending machines were calculated based on a duty cycle of 100%. Vending machines are always running to accommodate the needs of the customer, so they were calculated as such.
51

Sub-Appendix 5.B: Future Recommendations In an effort to reduce energy consumption, Group A5 recommends introducing a cost system to the laundry machines in an effort to encourage students to only use the laundry machines when only necessary. The dryer machines consume the most electricity out of all appliances. To prevent small, unnecessary loads from being performed, a small charge could be added for use of the machines. A second recommendation would be to limit the amount of mini-refrigerators that are allowed in a single dorm room. The group identified a number of rooms during the walkthrough survey that had more than one mini-refrigerator in them, which is unnecessary. The final recommendation by Group A5 is to consider the removal of the vending machines from the dorm basements. Because the beverage vending machine has to refrigerate the beverages, it has to run for most of the day. Removing the beverage vending machine and the snack vending machine from dorm basements could save an estimated 6,000 kW-hr per year.
52

Dormitory Bottom Up Energy Model
Appendix VI
Pumps
Ryan Beezhold, Dillon Carhuff, Ian McClaskie, Jared VanderKlay
53

Objective: The objective of Group A6 was to construct a fine-grained, bottom-up electricity demand model that predicts the annual electricity consumption for the pumps in the dormitories for each year of the last decade with an accuracy of ±2%. Research: The motors used to run the pumps in the dormitories listed both a horse power and a maximum current draw at a specific voltage. To find the actual power consumption of the motors the team needed to consult the MEP drawings from physical plant to find at which rate the motors were running. Using the head and flow rates of each pump, the team used the pump curves supplied by the manufacturer to find the percentage of the maximum power consumption at which the pump was operating. Using this information, the team could make a reasonable estimate to the actual power consumed by the pumps. Methods & Procedures: The first step that was taken was to visit the mechanical rooms of every dorm. While there, a picture was taken of each pump and of the specification plate of the pump. If there was no specification plate, the specifications were found from the manufacturer. These pictures were correlated with the MEP drawings of the dorms. Many of the MEP drawings were not up to date with the current number of pumps or with the specifications of each pump. The pumps were broken into three different categories: domestic hot water, heating hot water, and other. The domestic hot water provides hot water to the showers and faucets all throughout the dorm. The heating hot water pumps send the hot water used to provide heat all throughout the dorm. The other pumps include condensate pumps and sump pumps. The specifications of each pump were used to create the energy demand model. The specifications gave the needed information to calculate the power draw of each pump. The duty cycle of each pump was then estimated for each pump. This duty cycle was multiplied by the power draw to provide the energy usage, in terms of kW-hr, for each pump. The duty cycles needed to then be refined. The Physical Plant provided the information to do this. It was discovered that the heating hot water pumps were shut-off between mid-April and mid-October for each year. The duty cycle for these pumps during this time is then zero. To further refine the duty cycle estimates, a data collection project was completed. A system was set-up using a thermocouple to record the temperature of the pump. This system gathered temperature and time stamp data through a LabVIEW fieldpoint that ran on an independent network A different temperature was recorded while the pump was running than while it was off. This data collection lasted for several days to gather enough information to accurately model the duty cycle of the pump.
When looking to backcast the model ten years, more information was needed. The updates that happened to each dorm needed to be known. It was learned that during the last decade, none of the pumps in any of the dorms had been updated. This made the backcasting process very easy. The Physical Plant did change the start and end date of the heating hot water pumps in 2012. Before 2012, the heating hot water pumps would turn on anytime time the outside temperature dropped below 68° F. The number of days each year that the temperature was below 68° F was
54

estimated using a program through Carrier. This was done for each year before 2012.
Results: Given the energy demand model established through pump determination and data collection, it was determined that for 2016, dormitory water pumps consumed 168,986.5 kW-hrs. This equates to 12.77% of the yearly total expected energy consumption and ranks pumps as the 5th largest contributor to energy demand. Figure 6.2 displays the monthly energy consumption during 2016. The sharp decrease in energy consumption during the summer is a result of the Heating Hot Water (HHW) pumps being shut off from mid-April to mid-October The data collection setup was successful in capturing temperature and time stamp information for both the sump and condensate pumps. The resulting duty cycles determined from the collected data were 7% for the active sump pump and 4% for the condensate pumps. Given these low duty cycles the sump and condensate pumps were effectively negligible in the pump energy demand model, accounting for less than 1% of the total pump energy demand. Shown below in Figure 6.4, is an sample of the sump pump data collected. For the sake of brevity, collected data and full data graphs have not been added to this report. When printed from Microsoft Excel, the full collected data and graphs for the sump pump alone would exceed 185,000 pages.
When backcast, the 10-year average energy demand dropped from 12.77% in 2016 to 12.07%. This drop in total relative energy consumption comes in spite of the 17.3% decrease in pump energy usage from 2011 to 2012. This drop in energy consumption is visible in both Figures 6.1 and 6.3. Figure 6.1 displays the monthly energy consumptions for both 2011 and 2012. Figure 6.3 shows the total backcast energy consumption for the pump energy demand model.
Future Recommendations: While financial investments into improving pump system efficiencies are possible, because of the small overall contribution to the dormitory energy consumption and the difficulty with which the pumps would be replaced, investments are likely more profitable elsewhere. However, it is worth noting that because of the pump system's independence from student interaction, changes to system efficiency could be made without adversely affecting student life.
55

SUB-APPENDIX 6 TABLE OF CONTENTS
6.A Key Figures 6.B Duty Cycle Analysis 6.C Future Recommendations
56

Sub-Appendix 6.A: Key Figures
Figure 6.1: HHW Energy Consumption Operation Change
Figure 6.2: Pumps 2016 Monthly Energy Consumption
57

Figure 6.3: Pumps backcasting Model
58

Sub-Appendix 6.B: Duty Cycle Analysis
Figure 6.4: Sump Pump Duty Cycle
59

Sub-Appendix 6.C: Future Recommendations
● Replace the current pumps with more efficient units.
60

Dormitory Bottom Up Energy Model
Appendix VII
HVAC
Rounak Chatterjee, Toby Dalla Santa, Jenny Haney, Joel Hoskins, Caleb Senyshyn
61

Objective: Group A7 sought to model all energy consumption related to Heating, Ventilation, and Air Conditioning (HVAC) in the 7 dormitory buildings and accurately backcast that data ten years. An objective of ±2% accuracy compared to meter data was set for the overall class model.
Research:
In order to make accurate estimates the team needed to research the power draw of electric motors. The motors in the dorms gave a horsepower rating, but this equates to output power, not input required (Pragmatic Power, William J. Eccles) . Therefore, if the motor is not 100% 1
efficient, the power it draws will be higher than its rated horsepower. Typical motor efficiency for a motor of this size is around 90% , so the team used divided the rated power by this 2
efficiency to find actual motor power draw.
Methods & Procedures:
The team began by defining the project scope; heating was neglected in Group A7’s analysis and instead analyzed by the pumps team (see Appendix VI for more information). With a focus on ventilation and air conditioning, the team proceeded to verify all components and their specifications. This included circulation fans, laundry and exhaust fans, air conditioners, and more. It was discovered very early on that the MEP drawings of the dorms obtained from the Physical Plant were outdated. After discussing the matter with Jack Phillips, the team assumed ventilation from 7 fans (4 circulation, 2 laundry, and 1 mechanical) in every dorm. Tours of all dorms and mechanical rooms confirmed this assumption, and data was recorded for the power draw of each motor. An efficiency of 90% was assumed for all fans and used to calculate actual power draw.
Duty cycle calculations and backcasting were relatively straightforward for all ventilation components. All fans other than the laundry fans are run continuously every day and have been doing so for the last 10 years. Research showed that motor efficiencies have increased relatively little (3%) over the past 10 years , so even if motors were replaced (and we have no data 3
suggesting this) they still would not significantly change energy consumption backcasting. Laundry fans are manually switched on and off and were never on during any of the various dorm tours. Due to the switches being located at a distance from the light switches in most of the laundry rooms, many students do not turn them on, and thus a low duty cycle was estimated (5%).
The duty cycle calculations for the RD apartments required the use of heating and cooling modeling software called HAP (Hourly Analysis Program) by Carrier to model the RD AC systems. HAP requires space, environment, and system parameters to model the system. Space parameters include floor and ceiling areas, wall areas, window areas, and other building 1 Eccles, W. J. (2008). Pragmatic power. San Rafael, CA: Morgan & Claypool . 2 PREMIUM EFFICIENCY MOTOR SELECTION AND APPLICATION GUIDE. (n.d.). Retrieved May 1, 2017, from https://www.energy.gov/sites/prod/files/2014/04/f15/amo_motors_handbook_web.pdf 3 Ruddell, Steve. ee Publishers, edited by Mark Sheldon, EE Publishers, 10 July 2014. Accessed 2 May 2017.
62

specifications found on architectural and mechanical plans. Environmental parameters (climate conditions) were pulled for Grand Rapids from the HAP databases. Finally, system parameters for AC unit specifications were found on the spec plates located on each of the AC components. After inputting the space, environment, and system used in all of the RD apartments, the program returns a daily number of hours the AC system throughout the year. This run time was then converted into an electricity consumption based on the power draw values of the compressors and fans used in the AC system.
Results: The team determined that the HVAC systems in each dorm made up a collective 13.81% of Calvin’s total energy consumption in the dormitories for 2016. Of this 13.81%, AC systems only contributed 13% towards the HVAC yearly total. Through the backcasting process, a 10-year average was calculated and found to be 11.89% of Calvin’s total energy consumption. The team found this value to be reasonable given motor efficiencies have not increased by a large amount over the past 10 years, as stated previously. Figure 6.1 below presents the final calculated energy consumption data from the combined 7 dorm’s HVAC systems, projected monthly. The usage increases slightly during the summer months due to AC usage to combat warmer temperatures.
Figure 7.1: Yearly Energy Usage (all years same due to backcasting methods) Discussion & Assessment: Laundry fan duty cycles are a potential source of error in Team 7’s calculations. As stated earlier, laundry fans are manually switched on and off and were never on during any of the various dorm tours. The team used a 5% duty cycle assuming students rarely turn the fans on. This estimation is solely based on an assumption of human behavior, though this duty cycle estimation affects the
63

overall dorm energy model by a factor of 1-2%. A recommendation that could be made from this finding is to either have the fans continually running, if the college finds that to be necessary, or predetermine a duty cycle for these circulating fans that will minimize dorm energy consumption while fulfilling the air circulation requirement in the laundry rooms. Another important note to discuss is the expected increase in data during the summer months. This increase is not dependent on human behavior, which is the reason the HVAC energy curve model is unlike all other teams. To reiterate, the HVAC systems in the dorms, aside from the laundry fans, run continuously every day and have been doing so for the last 10 years, resulting in a horizontal line for the backcasted model. Future Projections: Due to the steady operating conditions of the HVAC systems within the dorms, the future of this model is not expected to change unless either more air handlers or fans are either added or removed from the current dorms. Especially hot or humid summers could result in slight deviations within the consumption from the RD apartment AC units. However, this would prove to be a very small percentage of the overall dorm consumption numbers.
64

SUB-APPENDIX VII TABLE OF CONTENTS
7.A Portion of AC Duty Cycle Calculations 7.B Monthly HVAC Energy Usage 7.C HVAC Portion of Total Model 7.D Future Recommendations
65
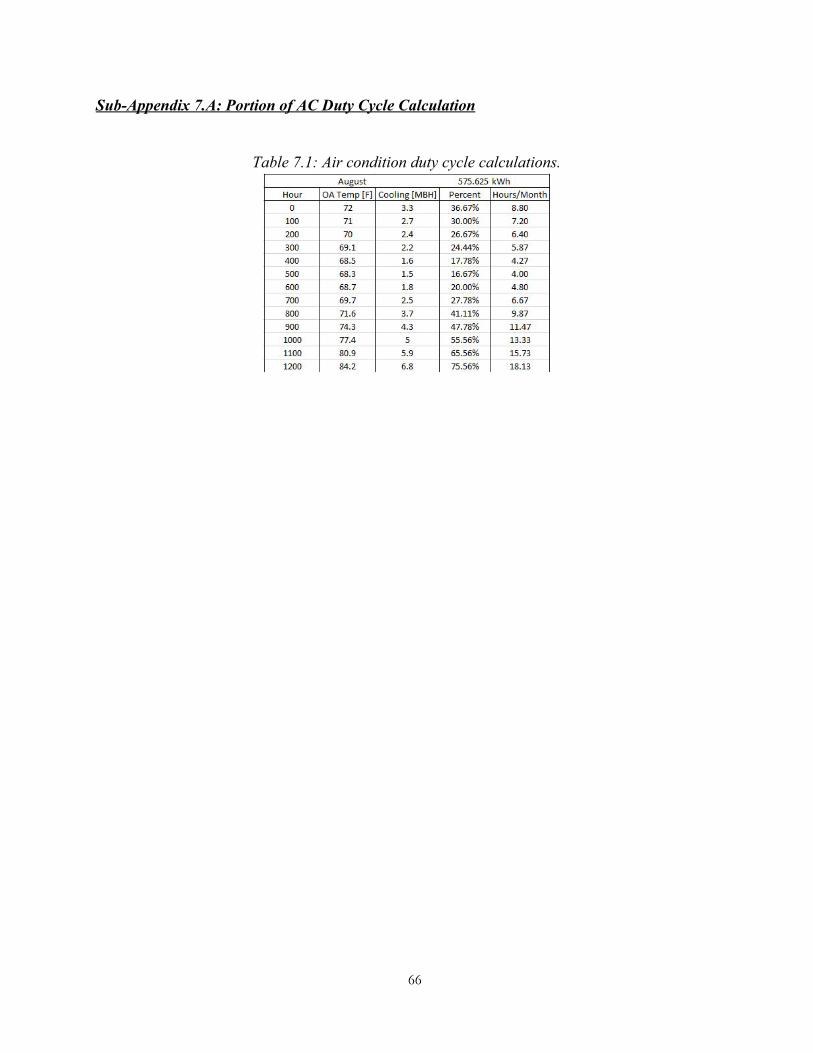
Sub-Appendix 7.A: Portion of AC Duty Cycle Calculation
Table 7.1: Air condition duty cycle calculations.
66

Sub-Appendix 7.B: Monthly HVAC Energy Usage
Figure 7.2: HVAC Monthly Energy Consumption.
67

Sub-Appendix 7.C: HVAC Portion of Total Model
Figure 7.3: HVAC Percentage contribution to dorm energy consumption.
68

Sub-Appendix 7.D: Future Recommendations The laundry room exhaust fans for the dormitories should be regulated more efficiently. If these fans are either put on a timer system or a motion detection system, it would ensure that they are only running when needed and not wasting any unnecessary energy. All of the circulation fan motors and air handler motors could be made to run more efficiently with stricter maintenance cycles. As most motor efficiencies are already fairly high, the only significant factor for them is maintenance. Dust and grime build up causes motors to draw more power than originally required and this increases consumption.
69