Embed Size (px)
DESCRIPTION
Analyzing supply chain of tata steel
Citation preview
Calculation of steel consumption per vehicle at Tata Steel and supply chain
analysis of vendor ecosystem
By
Prashant Mishra 1302-193
IMT Ghaziabad
The context
• Jamshedpur : a manufacturing hub• Tata steel + Tata Motors- perfect location• Logistically well connected• Still poor efficiency in demand fulfillment
The problem
• Erratic behaviour of supply chain of Tata motors, and tracking of per vehicle consumption of critical grades of steel .

Research Design
• Primary data• Secondary Data• Qualitative design• Questionaire design• Data collection
Procedural steps :
• Understanding the manufacturing process flow at Tata Steel.• Understanding the manufacturing process flow Tata Motors.• Analyzing the demand demographics of Tata Motors• Identifying the role of TSPDL.• Conducting vendor visits and interaction• Data collection and analysis• Result generation
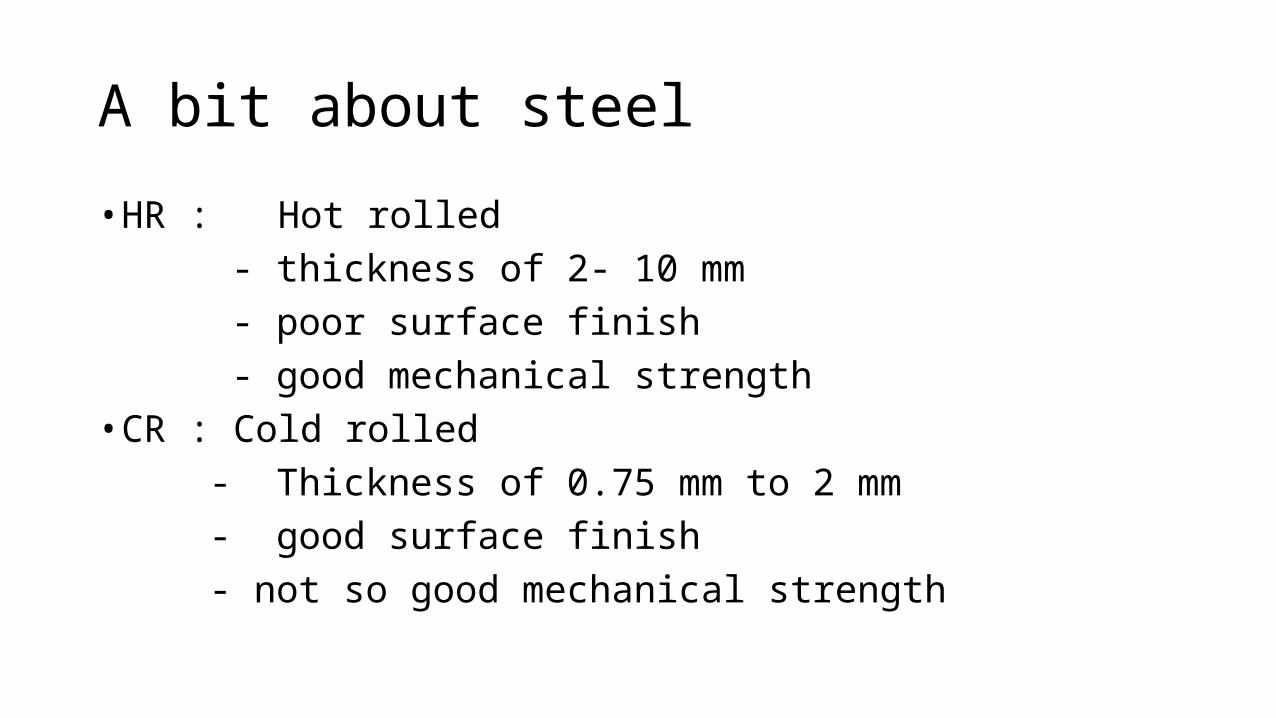
A bit about steel
• HR : Hot rolled - thickness of 2- 10 mm - poor surface finish - good mechanical strength• CR : Cold rolled - Thickness of 0.75 mm to 2 mm - good surface finish - not so good mechanical strength
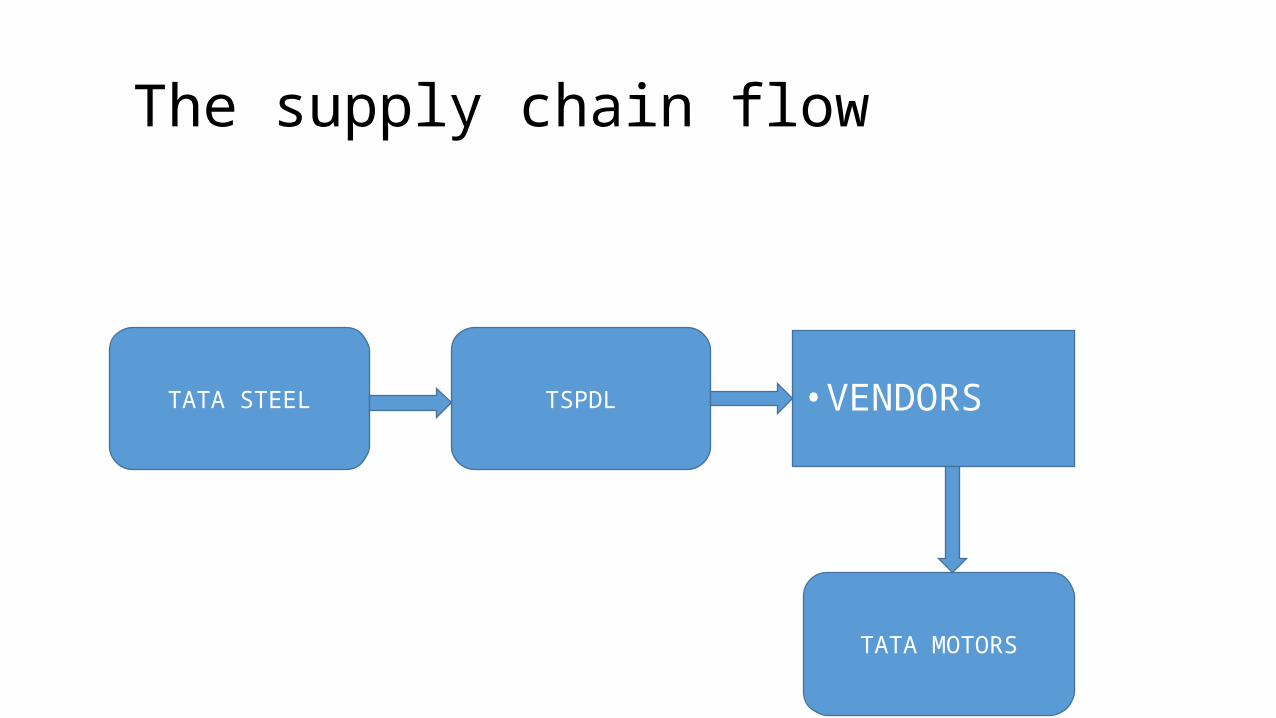
The supply chain flow
TATA STEEL • VENDORSTSPDL
TATA MOTORS
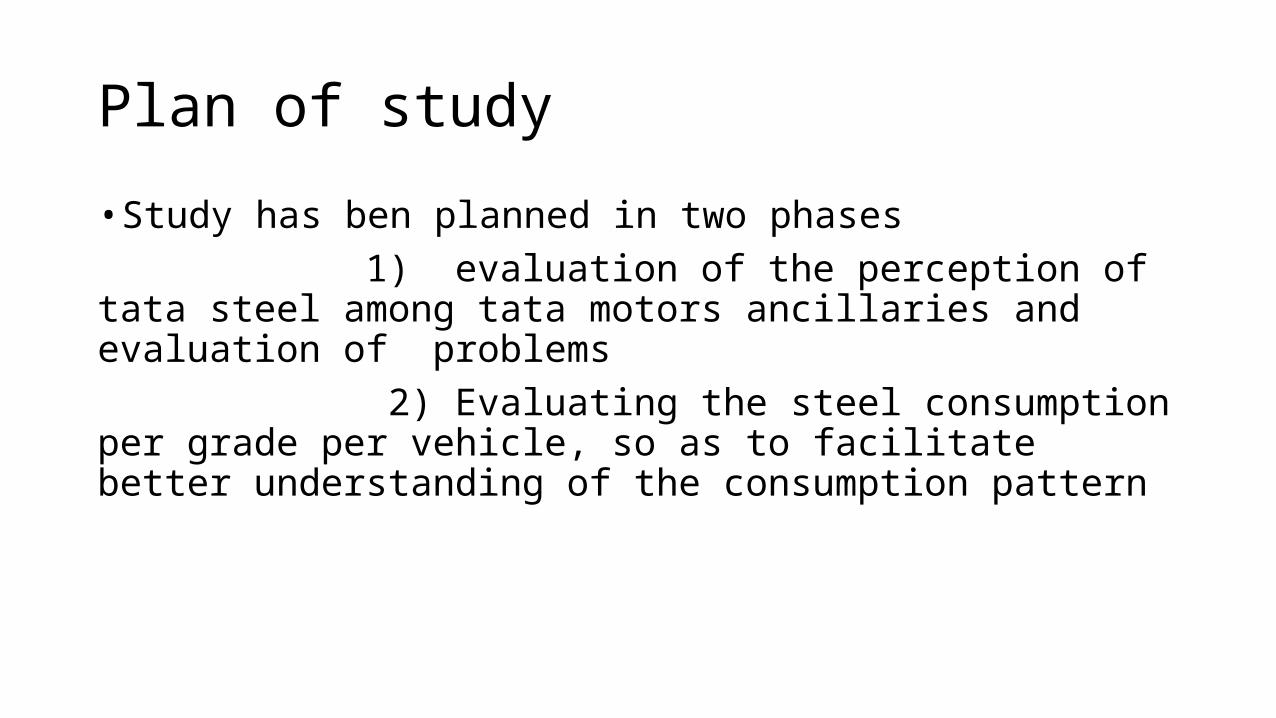
Plan of study
• Study has ben planned in two phases 1) evaluation of the perception of tata steel among tata motors ancillaries and evaluation of problems 2) Evaluating the steel consumption per grade per vehicle, so as to facilitate better understanding of the consumption pattern
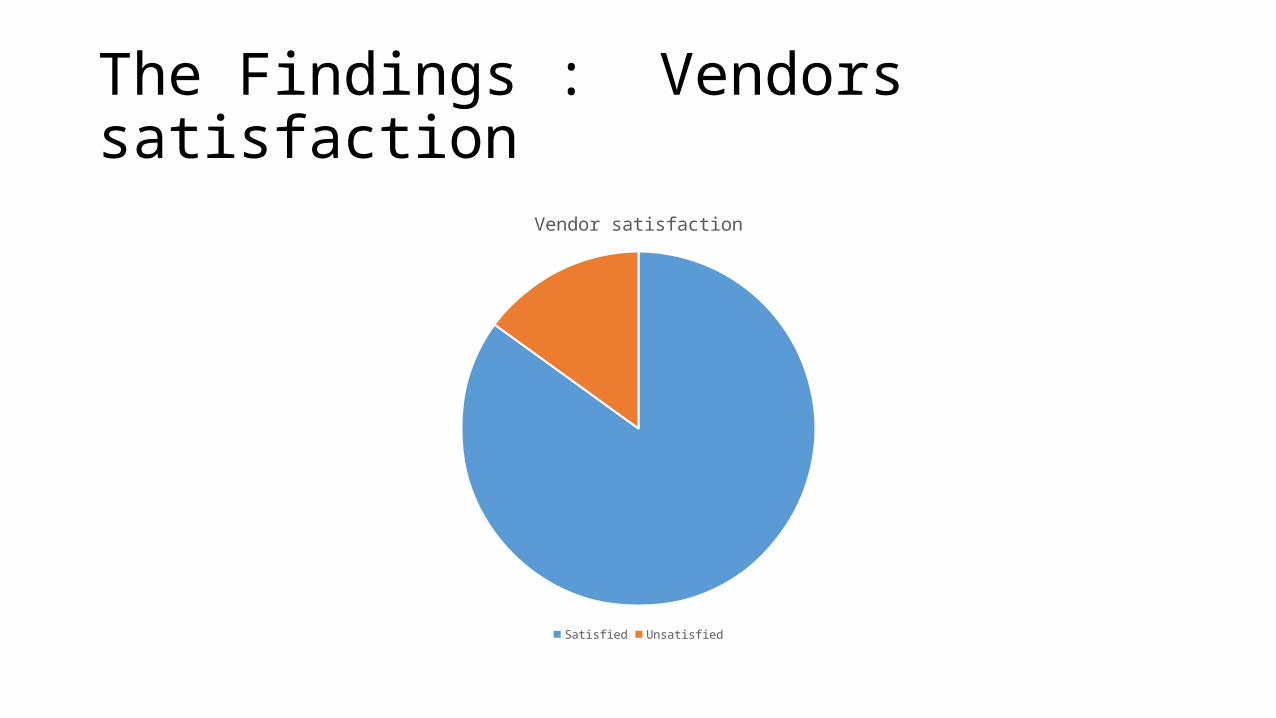
The Findings : Vendors satisfaction
Vendor satisfaction
Satisfied Unsatisfied
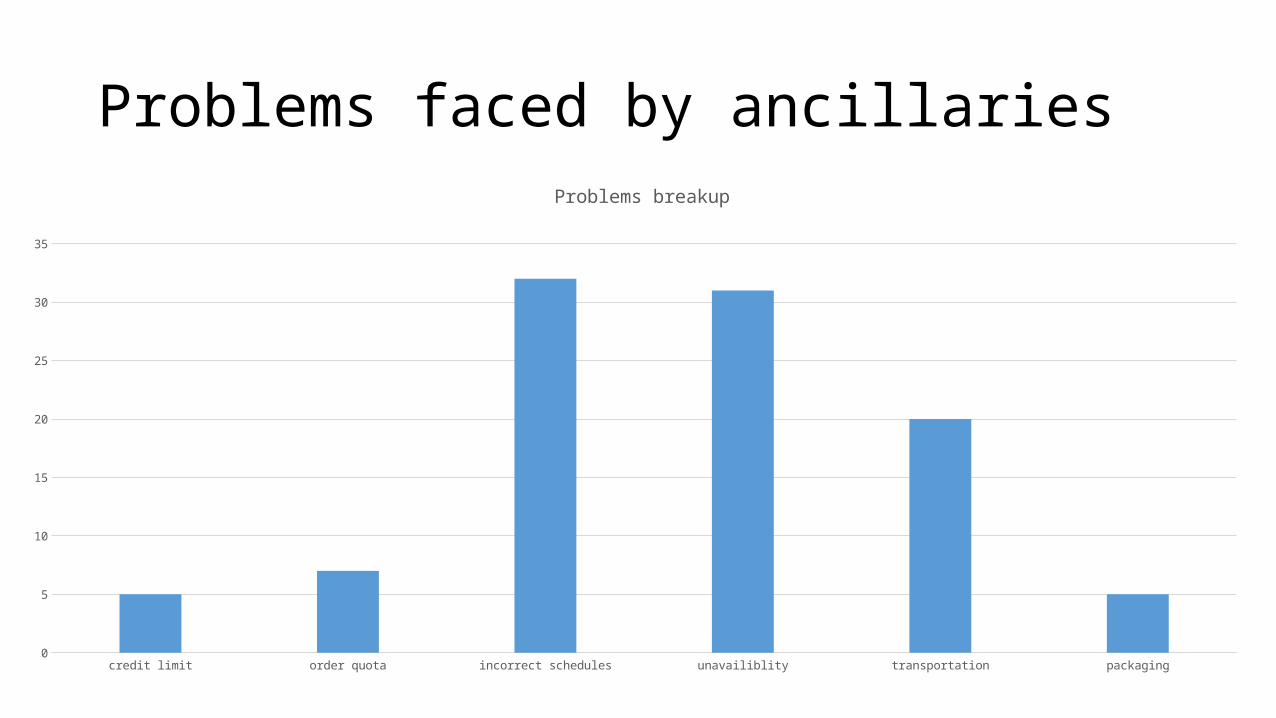
Problems faced by ancillaries
credit limit order quota incorrect schedules unavailiblity transportation packaging0
5
10
15
20
25
30
35
Problems breakup
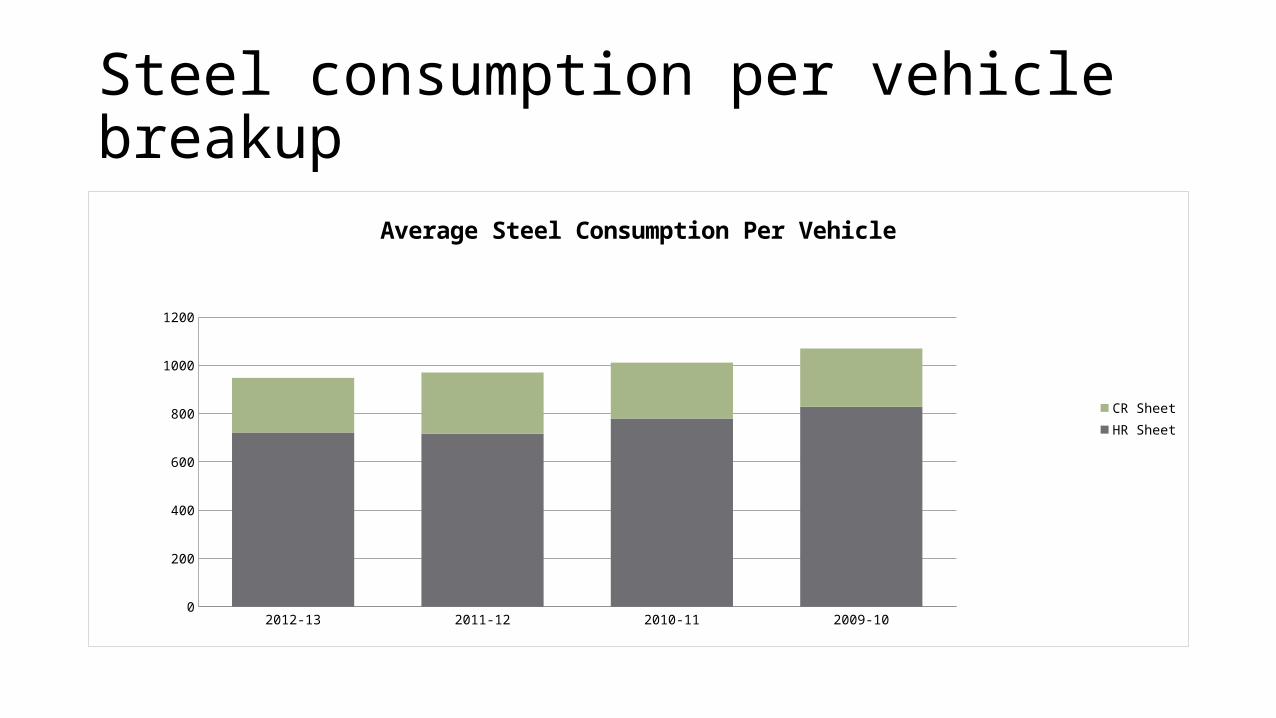
Steel consumption per vehicle breakup
2012-13 2011-12 2010-11 2009-100
200
400
600
800
1000
1200
Average Steel Consumption Per Vehicle
CR SheetHR Sheet
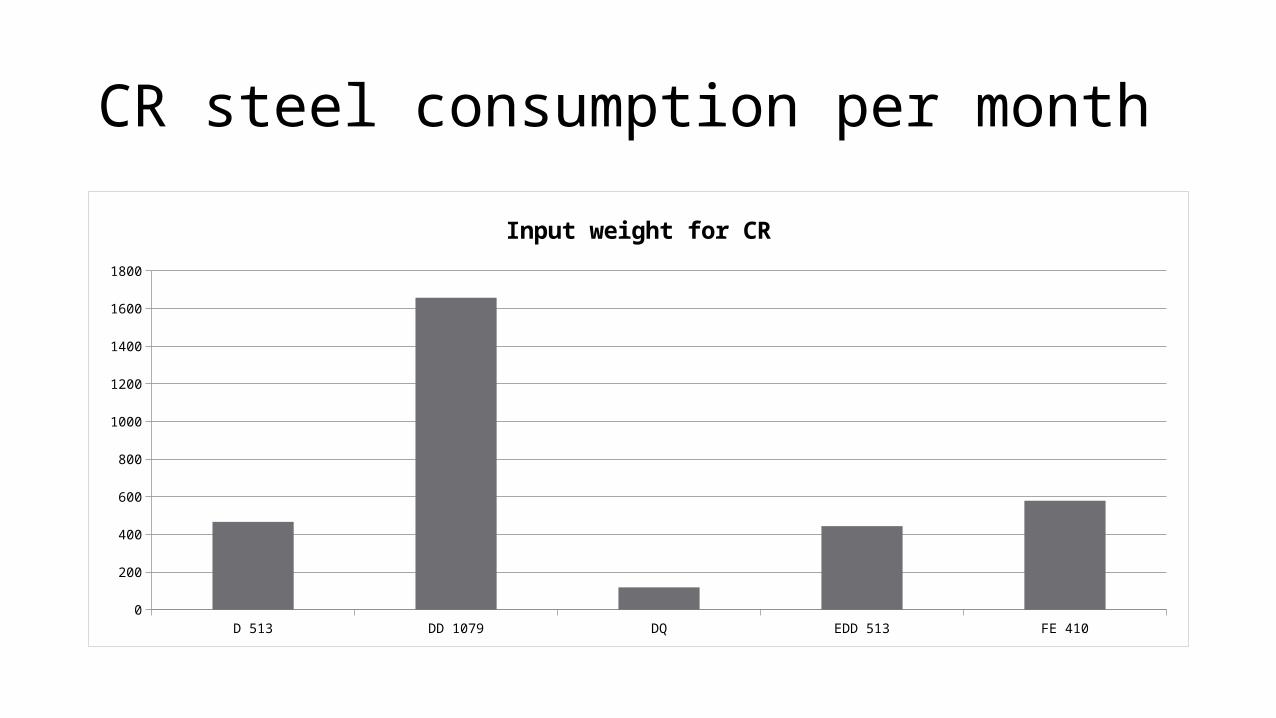
CR steel consumption per month
D 513 DD 1079 DQ EDD 513 FE 4100
200
400
600
800
1000
1200
1400
1600
1800
Input weight for CR
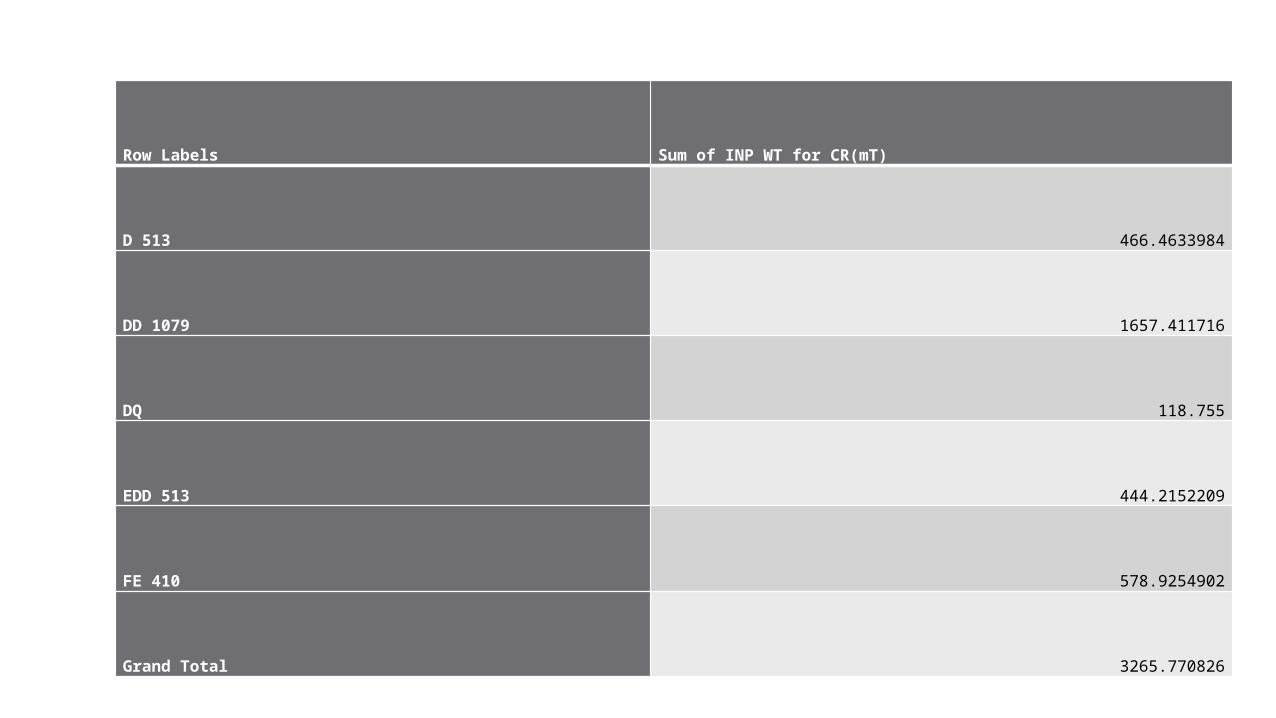
Row Labels Sum of INP WT for CR(mT)
D 513 466.4633984
DD 1079 1657.411716
DQ 118.755
EDD 513 444.2152209
FE 410 578.9254902
Grand Total 3265.770826
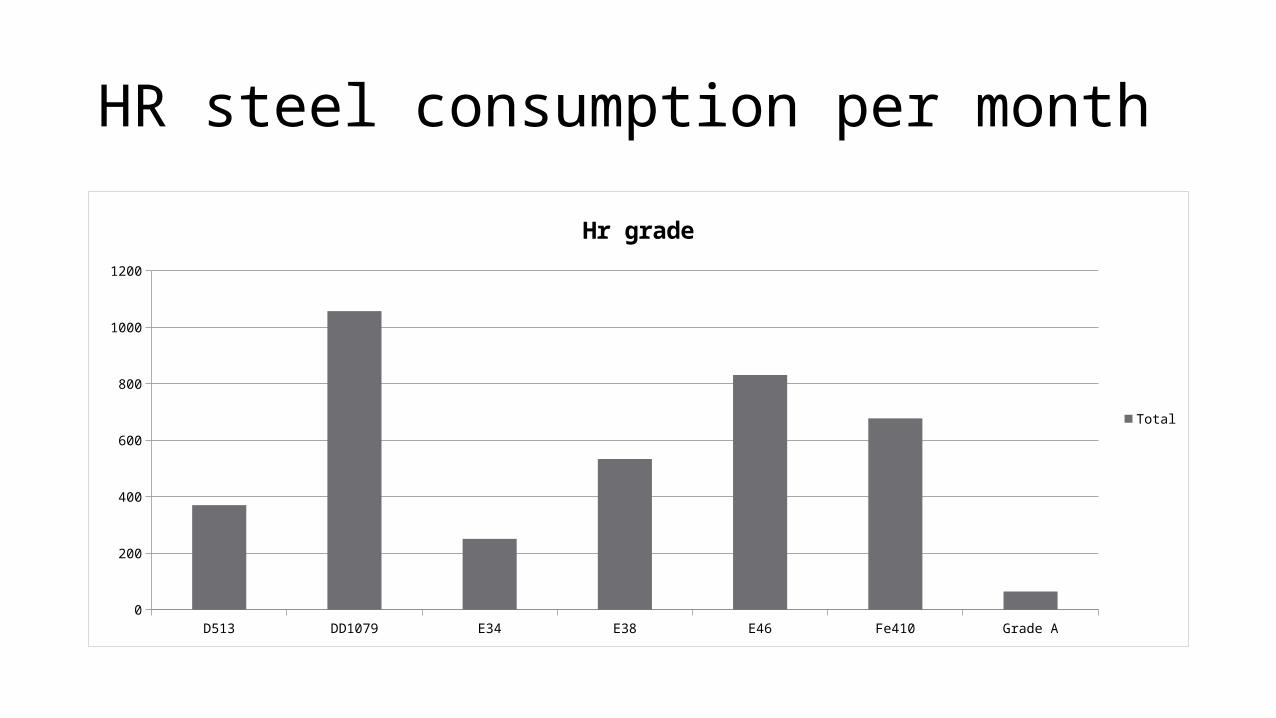
HR steel consumption per month
D513 DD1079 E34 E38 E46 Fe410 Grade A0
200
400
600
800
1000
1200
Hr grade
Total
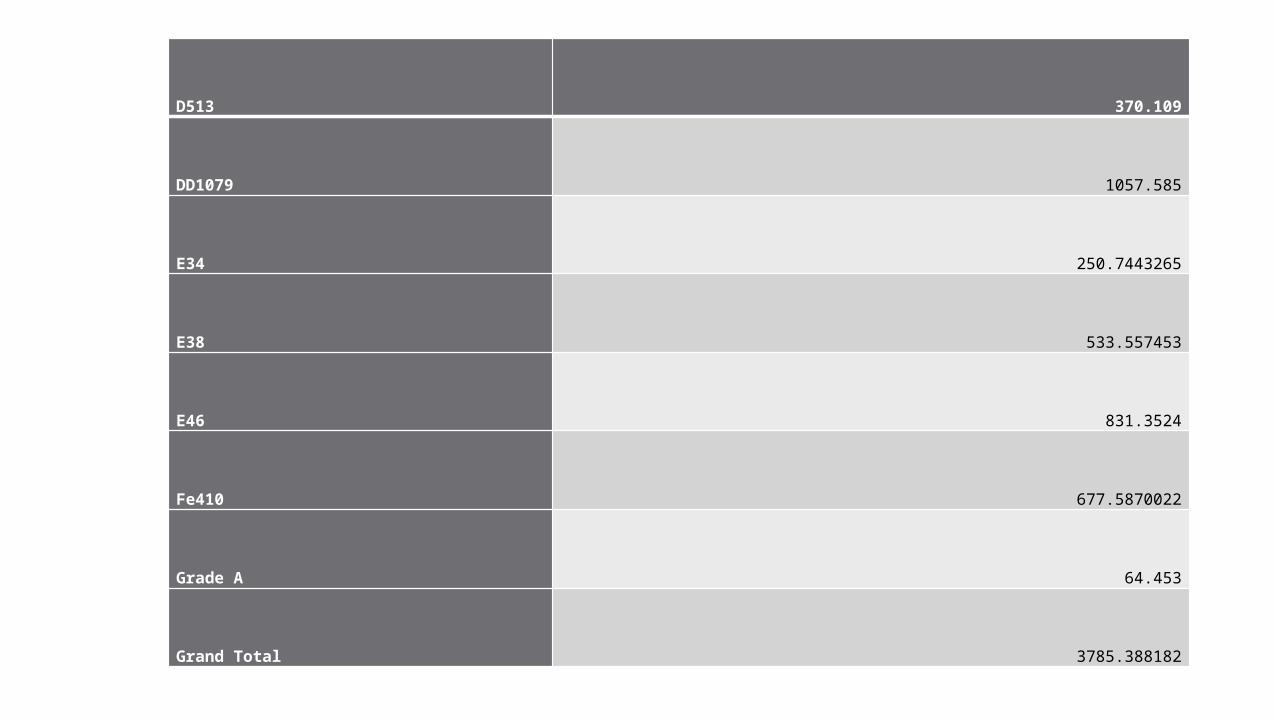
D513 370.109
DD1079 1057.585
E34 250.7443265
E38 533.557453
E46 831.3524
Fe410 677.5870022
Grade A 64.453
Grand Total 3785.388182
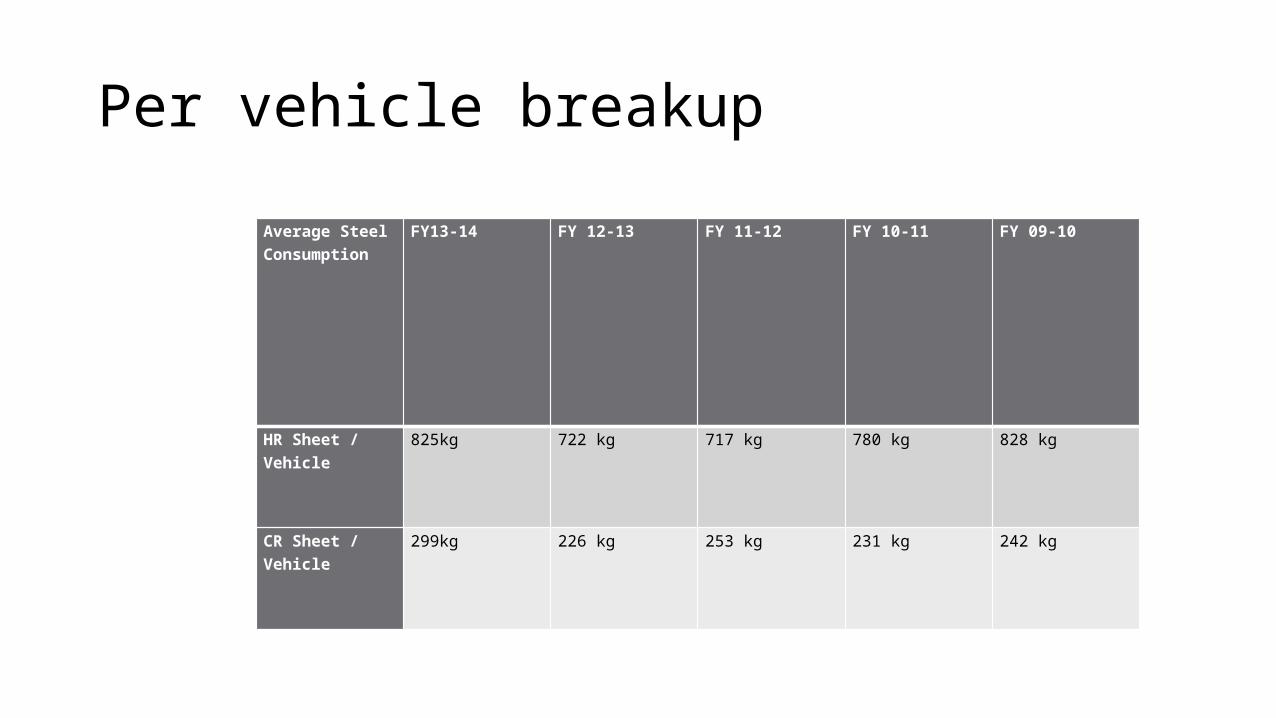
Per vehicle breakup
Average Steel Consumption
FY13-14 FY 12-13 FY 11-12 FY 10-11 FY 09-10
HR Sheet / Vehicle 825kg 722 kg 717 kg 780 kg 828 kg
CR Sheet / Vehicle 299kg 226 kg 253 kg 231 kg 242 kg
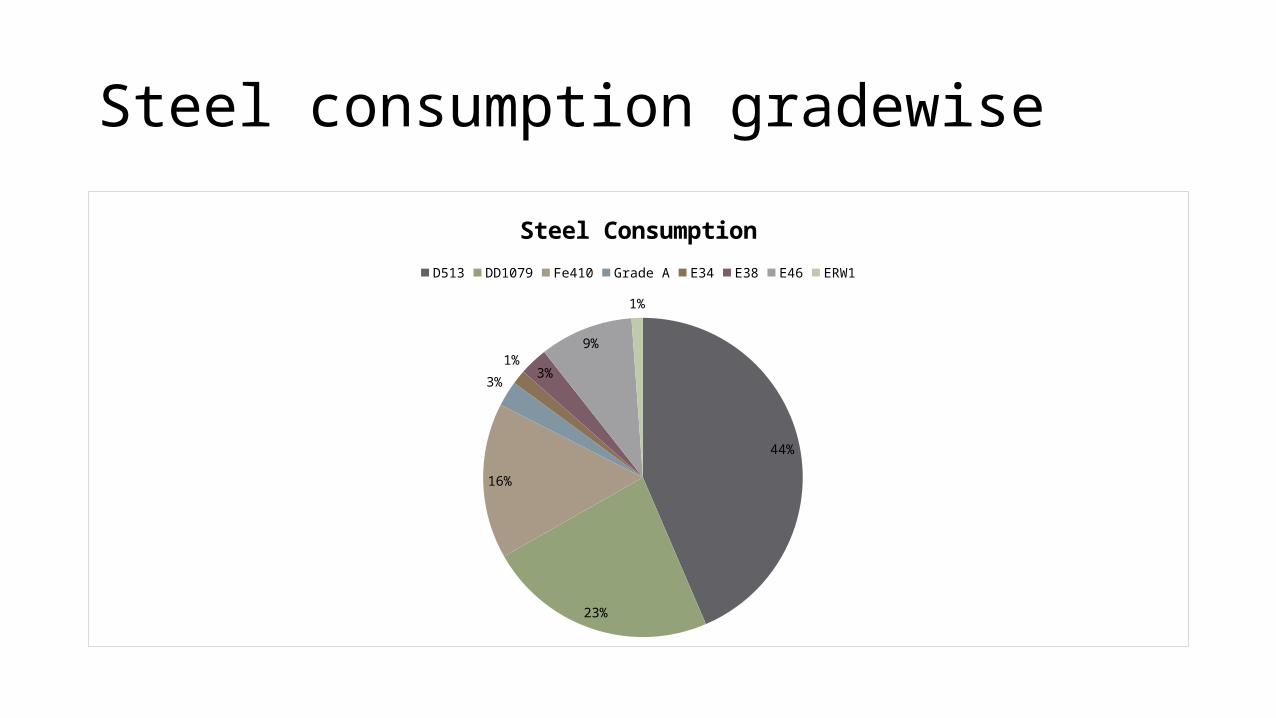
Steel consumption gradewise
44%
23%
16%
3%
1%3% 9%
1%
Steel Consumption
D513 DD1079 Fe410 Grade A E34 E38 E46 ERW1
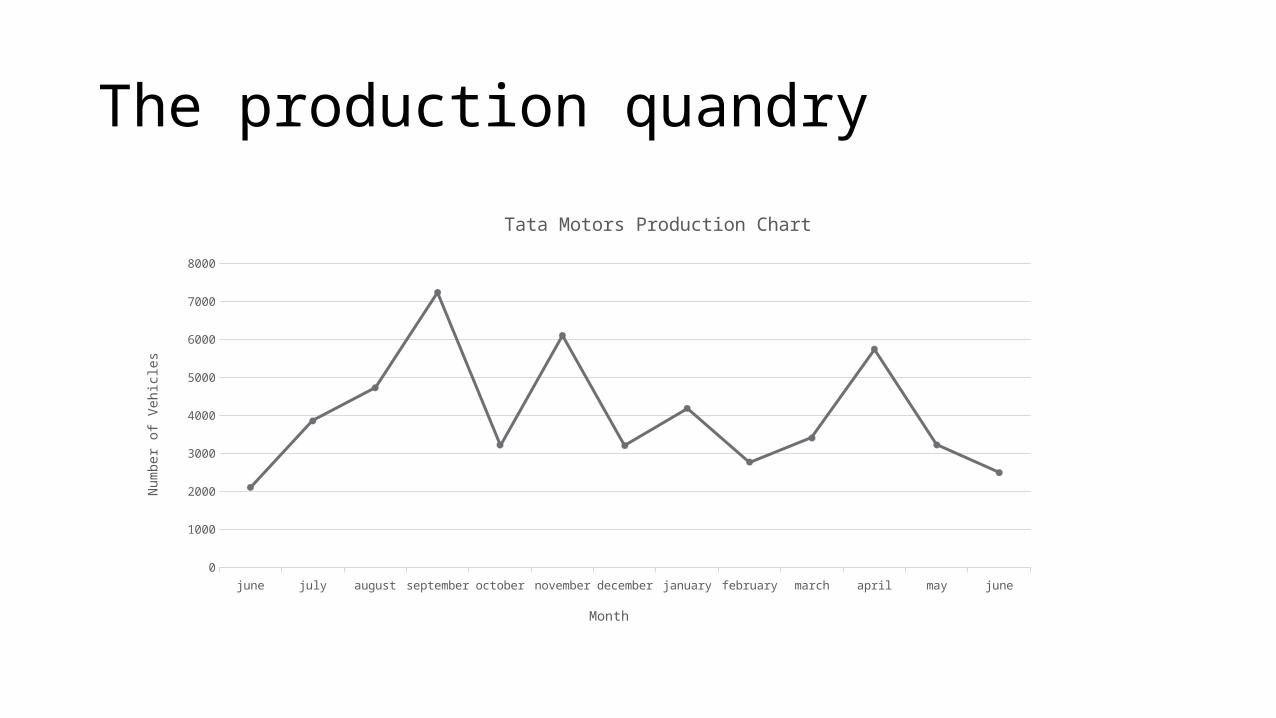
The production quandry
june july august september october november december january february march april may june0
1000
2000
3000
4000
5000
6000
7000
8000
Tata Motors Production Chart
Month
Num
ber o
f Veh
icles
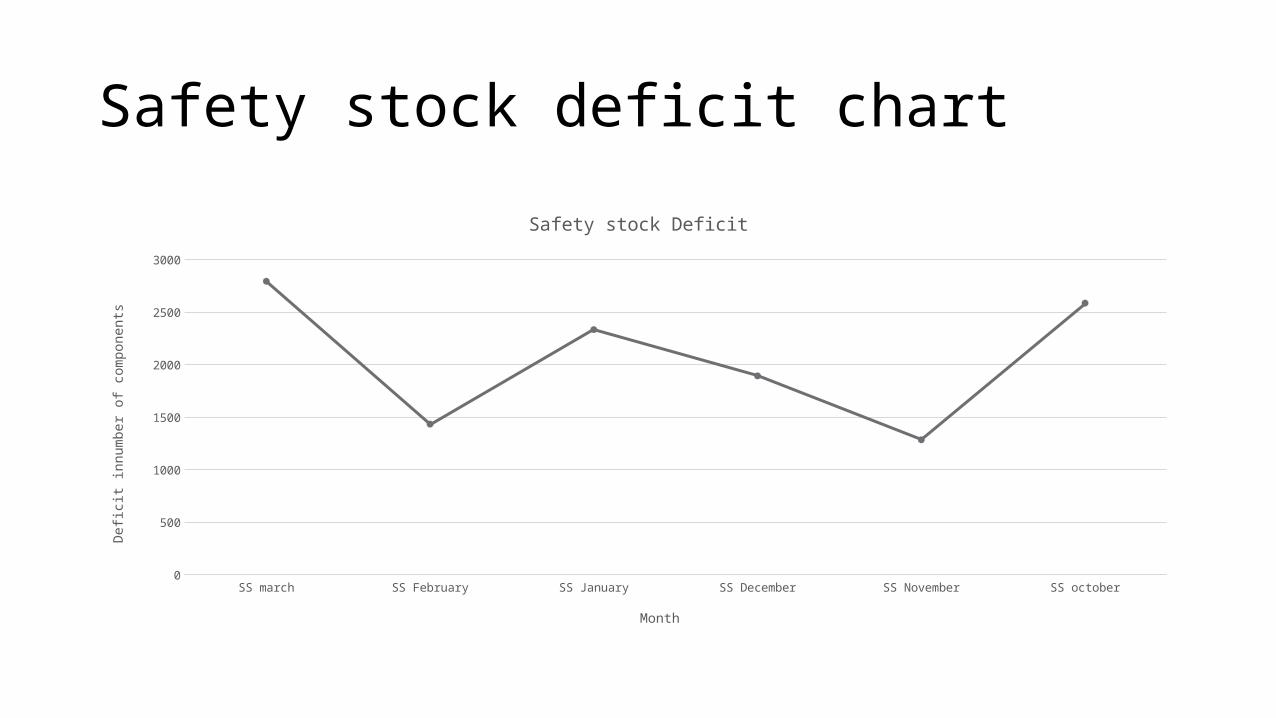
Safety stock deficit chart
SS march SS February SS January SS December SS November SS october0
500
1000
1500
2000
2500
3000
Safety stock Deficit
Month
Defic
it in
num
ber o
f com
pone
nts
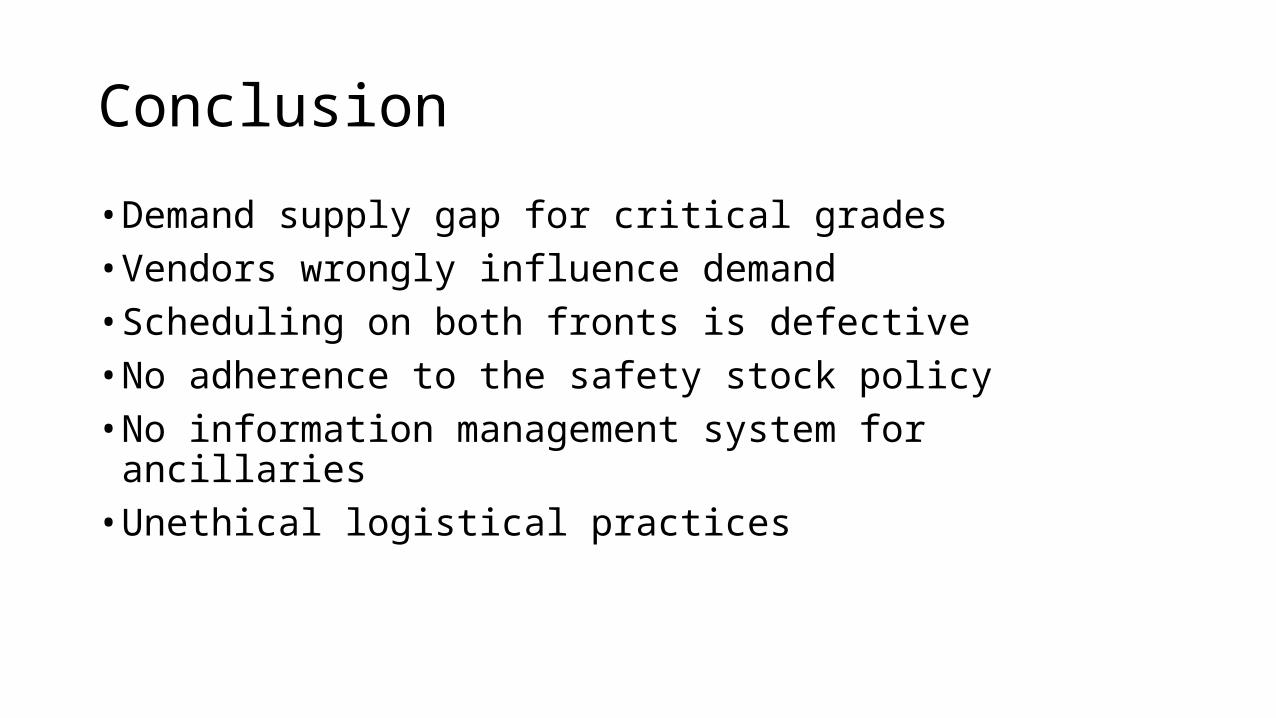
Conclusion
• Demand supply gap for critical grades• Vendors wrongly influence demand• Scheduling on both fronts is defective• No adherence to the safety stock policy• No information management system for ancillaries• Unethical logistical practices
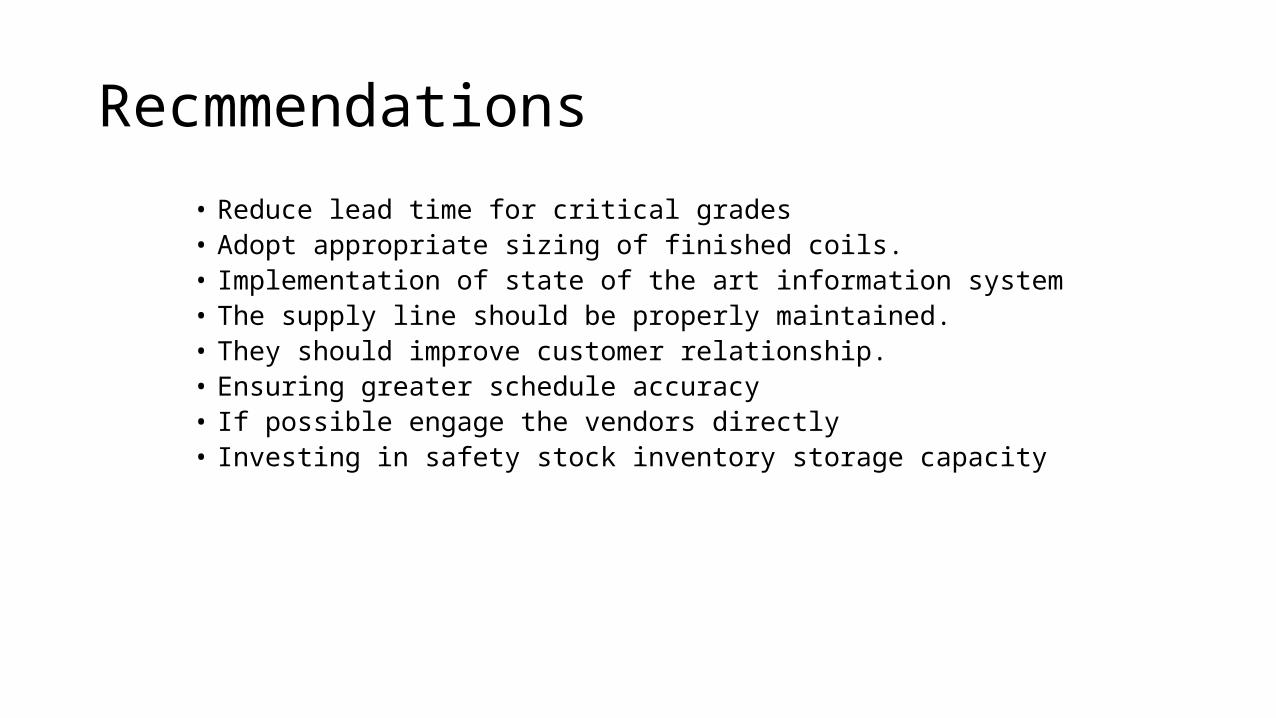
Recmmendations
• Reduce lead time for critical grades• Adopt appropriate sizing of finished coils.• Implementation of state of the art information system• The supply line should be properly maintained.• They should improve customer relationship.• Ensuring greater schedule accuracy• If possible engage the vendors directly• Investing in safety stock inventory storage capacity

Thank You !!
Questions please.