Embed Size (px)
Citation preview

Calculation of Environmental Profits withWeight Reduced Core Material in Rotor
Blades
Anita Tran
Faculty of Engineering, Lund UniversityDepartment of Mechanical Engineering
Division of Mechanics
September 15, 2016


Abstract
Construction of wind turbines has increased these recent years and is expected toescalate more in the nearest future. The expansion of wind power as an energy sourcerequires specific and comprehensive transport, when production is far away from theinstallation site. Generally, the development of turbines has gone towards biggerturbines with longer rotor blades. As the blades grow in length, optimization ofweight and sustainability will be more substantial. The turbine blades are subjectedto high stresses and therefore the choice of materials for blade design is important.Weight and strength are two very important parameters to take into account. Diabprovides the core material to the wind industry and offers a wide variety of differentmaterials with varied density. In this thesis, the environmental profits is examinedof wind power with respect to different core materials in the sandwich constructionused in the blades in the aspect of weight reduction. During this work, a literaturereview, calculations and data collection was conducted. The weight reduction with alighter material is 2,7 % and the total environmental profits was 1,2 % of CO2 thathas been compensated for in form of electricity production. The small amount ofenvironmental profit corresponded to the weight reduction.
Keywords: wind, turbine, rotor, blade, CO2, power, core, material, transportation

Preface
This master thesis project is coordinated by non-profit organization Miljobron, a linkbetween industry and the academia, coordinating projects that connects to sustain-able development.
This thesis is a degree project of 30 credits performed during spring semester, 2016.It is performed at the Faculty of Engineering, department of Mechanical Engineering,Division of Mechanics, at Lund University (Lund, Sweden) and at Diab (Laholm,Sweden). The thesis represents the final part of the authors master degree in Scienceof Engineering in Engineering Physics, 300 hp.
Supervisors:
Solveig Melin, Professor
Per Hokfelt, Sustainability Manager at Diab
Examiner:
Aylin Ahadi, Docent
ii
Acknowledgements
I would like to thank my supervisors Solveig Melin, Per Hokfelt, my examiner AylinAhadi and Malin Planander from Miljobron for offering me the opportunity to per-form this thesis and for their time, guidance, support, comments and wise remarks.
I also thank Carl-Johan Lindholm, Senior Engineer and Lars Hallkvist, Global Ac-count Manager in Wind Energy at Diab that has provided with useful informationand for their time devoted to this thesis.
Last but not the least, my most heartfelt thanks go to my family and Simon whohave supported me to complete my university studies and without them I would notbe the person I am now.
iii

Nomenclature
α Hellmann Exponent
β Constant used for simplification
ρ Air density
A Swept area of blades
B Orthographic projection area
CD Drag coefficient
CL Lift coefficient
Cfuel Fuel Consumption
Cp Coefficient of power
D Drag force
Ef Emission Factor
Ek Kinetic energy
ECO2 CO2 Emission
F Resulting aerodynamic force
g Acceleration of gravity
H Heat Value
h Height
L Lift force
l Length of air volume
mb Blade weight
Mg Moment
mw Air mass
P Wind power
Pmax Maximum Power
r Length of rotor blade
t Time
vw Wind velocity
iv

Contents
Preface ii
Acknowledgements iii
Nomenclature iv
1 Introduction 21.1 Background . . . . . . . . . . . . . . . . . . . . . . . . . . . . . . . . 21.2 Objectives . . . . . . . . . . . . . . . . . . . . . . . . . . . . . . . . . 21.3 Limitations . . . . . . . . . . . . . . . . . . . . . . . . . . . . . . . . 31.4 Model of Reference . . . . . . . . . . . . . . . . . . . . . . . . . . . . 3
2 Literature Review 52.1 Wind Turbines . . . . . . . . . . . . . . . . . . . . . . . . . . . . . . 5
2.1.1 Rotor Blades . . . . . . . . . . . . . . . . . . . . . . . . . . . 72.1.2 Sandwich Construction . . . . . . . . . . . . . . . . . . . . . . 72.1.3 Core Materials . . . . . . . . . . . . . . . . . . . . . . . . . . 8
2.2 Wind Power . . . . . . . . . . . . . . . . . . . . . . . . . . . . . . . . 92.2.1 Aerodynamics . . . . . . . . . . . . . . . . . . . . . . . . . . . 102.2.2 Wind Gradient . . . . . . . . . . . . . . . . . . . . . . . . . . 11
2.3 Life Cycle Assessment . . . . . . . . . . . . . . . . . . . . . . . . . . 112.4 Transportation . . . . . . . . . . . . . . . . . . . . . . . . . . . . . . 13
3 Method 143.1 Source of Information and Literature . . . . . . . . . . . . . . . . . . 14
3.1.1 Life Cycle Stages . . . . . . . . . . . . . . . . . . . . . . . . . 143.1.2 Defining Focus Areas . . . . . . . . . . . . . . . . . . . . . . . 16
3.2 Data Collection . . . . . . . . . . . . . . . . . . . . . . . . . . . . . . 163.3 Calculations . . . . . . . . . . . . . . . . . . . . . . . . . . . . . . . . 17
3.3.1 Estimating Weight Reduction of Core Material . . . . . . . . . 173.3.2 Core Material Production . . . . . . . . . . . . . . . . . . . . 18
v
3.3.3 Transportation . . . . . . . . . . . . . . . . . . . . . . . . . . 183.3.4 Electricity Production . . . . . . . . . . . . . . . . . . . . . . 213.3.5 Wind Speed Adjustments . . . . . . . . . . . . . . . . . . . . 253.3.6 Break-even Time . . . . . . . . . . . . . . . . . . . . . . . . . 26
3.4 Assumptions . . . . . . . . . . . . . . . . . . . . . . . . . . . . . . . . 263.4.1 Life Time . . . . . . . . . . . . . . . . . . . . . . . . . . . . . 263.4.2 Choice of Hellmann Exponent . . . . . . . . . . . . . . . . . . 273.4.3 Transportation . . . . . . . . . . . . . . . . . . . . . . . . . . 27
4 Summary of Results 284.1 Core Material Production . . . . . . . . . . . . . . . . . . . . . . . . 284.2 Transportation . . . . . . . . . . . . . . . . . . . . . . . . . . . . . . 284.3 Electricity Production . . . . . . . . . . . . . . . . . . . . . . . . . . 294.4 Total Environmental Profit . . . . . . . . . . . . . . . . . . . . . . . . 304.5 Break-even Time . . . . . . . . . . . . . . . . . . . . . . . . . . . . . 30
5 Discussions and Conclusions 31
6 Recommendations 33
References 34
Appendix 36Matlab Code . . . . . . . . . . . . . . . . . . . . . . . . . . . . . . . . . . 36
vi

List of Figures
2.1 Illustration of a horizontal wind turbine . . . . . . . . . . . . . . . . . 62.2 Distribution between balsa wood and Divinycell H60 . . . . . . . . . 72.3 Content of sandwich material in a rotor blade . . . . . . . . . . . . . 82.4 Divinycell H foams with different densities . . . . . . . . . . . . . . . 92.5 Lift and drag forces on airfoil . . . . . . . . . . . . . . . . . . . . . . 112.6 Life cycle of a wind turbine . . . . . . . . . . . . . . . . . . . . . . . 122.7 Scope of V112 3 MW wind plant LCA . . . . . . . . . . . . . . . . . 12
3.1 Scope of V112 3 MW wind plant for this thesis . . . . . . . . . . . . 153.2 Wind speed data from SMHI measured at Gubbhogen [11] . . . . . . 163.3 Transport from Diab production site A to Vestas production site B . 193.4 Transport from Vestas production site A to wind farm site B . . . . . 193.5 Fuel consumption per cargo weight given by linear interpolation . . . 203.6 Volume of air that passes the rotor blades . . . . . . . . . . . . . . . 213.7 Power curve for Vestas V112 . . . . . . . . . . . . . . . . . . . . . . . 23
List of Tables
1.1 Technical specifications of V112 [3] . . . . . . . . . . . . . . . . . . . 4
2.1 Densities for PN115, H60 and Balsa Wood . . . . . . . . . . . . . . . 7
3.1 Core material weight reduction for one blade . . . . . . . . . . . . . . 173.2 Technical data for the core materials [2] . . . . . . . . . . . . . . . . . 183.3 Distances for routes . . . . . . . . . . . . . . . . . . . . . . . . . . . . 18
4.1 Profit in material production . . . . . . . . . . . . . . . . . . . . . . . 284.2 Profit in transportation . . . . . . . . . . . . . . . . . . . . . . . . . . 29
vii

4.3 Profit in produced electricity per year . . . . . . . . . . . . . . . . . . 294.4 Total environmental profit in CO2 . . . . . . . . . . . . . . . . . . . . 30
viii


Introduction
In this chapter, the problem for this study is formulated. In addition, it describes thepurpose of the work, restrictions and the report outline.
1.1 Background
During a relatively short time, the development of modern wind turbines has beensubstantial. Generally, the trend has been towards larger turbines, which meanslonger rotor blades. Development of wind power is constantly researched. In 2012,the world’s longest rotor blades were produced by the Danish SSP Technology. Therotor blade had an astounding length of 83.5 meters [1]. Future wind turbines willcertainly be very large. This will also mean great potential costs for repair and re-placement of damaged turbines. To ensure high reliability it is therefore particularlyimportant for large wind turbines to reduce weight and ensure strength in the windturbine components. And through the development and use of strong and highly re-sistant advanced materials in fiber reinforced composites, reliability can be improved.
Diab [2] is a world-leading supplier of composite core materials that make prod-ucts lighter and stronger. It is in their interest to evaluate the environmental impactof their products and the environmental profit given by using an alternative to themore commonly used core material. In collaboration with Miljobron, this projectwas mediated with the goal to find out the environmental profits from using a lighterweighted rotor blade.
1.2 Objectives
The task involves examining the environmental profits of wind power with respectto different core materials in the sandwich construction used in the blades. Theenvironmental profits are defined as increased energy production for a wind turbinein the use of the products as well as reduced resource consumption in the transport
2
CHAPTER 1. INTRODUCTION 1.3. LIMITATIONS
and manufacturing of products to customers. The aim is to develop indicators andthe results will be reported in carbon dioxide equivalents (CO2-eq.).
To determine the impact of the weight of the core material of the rotor blades inrelation to the overall environmental profit of a wind turbine, and how large it iscompared to the CO2 compensation for the electricity produced by a wind turbine.
1.3 Limitations
This thesis only regard the environmental profits that can be found during the pro-duction of the core material, the overall power production for a wind turbine andthe transportation of the blades. This does not include maintenance activities suchas change of oil, lubrication and renovation/replacement of worn parts (e.g. thegearbox). Neither is the implications for the generator considered here. Transportsto and from the turbines for operation and maintenance purposes are not included.Profits during production of the core material and during transportation includeonly emissions of CO2. The environmental profits does not include the stages ofwind plant set-up or the last stage of the life cycle, i.e. the end of life. The environ-mental profits are expressed in CO2-equivalents. H60 was chosen as the alternativecore material due to the similarities in mechanical properties. This simplifies thecalculations with respect to the reliability of strength.
1.4 Model of Reference
The wind turbine parameters and power output are chosen to represent an averageonshore wind turbine from Vestas V112 3.0 MW, see Table 1.1. These parametersare chosen as reference values in the present thesis and the gain in CO2-equivalentswill be determined for the wind turbine V112 with two different core materials. Thespeed at which the turbine first starts to rotate and generate power is called thecut-in speed and the cut-out speed is the speed at which the turbine blades arebrought to rest to avoid damage from high winds. The swept area from the bladesare illustrated in figure 2.1 on page 6 as is the rotor diameter.
3

1.4. MODEL OF REFERENCE CHAPTER 1. INTRODUCTION
Table 1.1: Technical specifications of V112 [3]
OPERATIONAL DATA
Maximum rated power 3450 kW
Cut-in wind speed 3 m/s
Cut-out wind speed 25 m/s
ROTOR
Rotor diameter 112 m
Swept area 9852 m2
BLADE DIMENSIONS
Length 54.7 m
Weight 11.9 tonnes
4

Literature Review
This chapter provides the theoretical base of the study. The first section provides someinformation regarding wind turbines and their function. The second section describeswhat wind power is and how it is defined. This is followed by a brief explanation of alife cycle assessment. Last section provides information regarding the transportationof wind turbine parts.
2.1 Wind Turbines
A wind turbine is a machine that converts kinetic energy from the wind into electricalenergy. A horizontal wind turbine has a rotor and a generator placed in a rotatingsection, called the nacelle, at the top of the wind tower. Figure 2.1 provides anoverview of the wind turbine structural components. In the wind turbine, there is acontrol system that regulates the revolutions per minute, the blade position and thenacelle turns towards the wind with the aim to get as much power as possible. Thereis also a wind banner and an anemometer, which measures wind direction and windspeed. The kinetic energy of the rotor is transferred to a generator. The generatorconverts the kinetic energy into electrical energy. Before the electrical energy goesout to the power grid, it passes through a transformer that raises the voltage to fitthe voltage in the local high voltage power grid [4].
The largest wind turbine in Sweden today has a 90 meters high tower height, a110 meter rotor diameter and with a power of 4.1 MW [5]. To achieve a higheroutput from each turbine, it is desired to increase tower heights and rotor diameters.
A turbine require a minimum wind speed for production to pay off. The turbinealso has a maximum wind speed to prevent damage, and the generator usually havea maximum allowed power limit. A typical range of wind is 3m/s to 25m/s whichwill be adopted in this thesis. When the wind speed exceeds the cut-out speed, theturbine will shut down. Shutdown can be obtained in different ways. The most com-
5

2.1. WIND TURBINES CHAPTER 2. LITERATURE REVIEW
mon one is that the blades rotate, using the pitch control, so that they stand straightagainst the wind direction. This causes the propeller to stop rotating. Another wayis to block the rotor speed mechanically through a rotation stop mechanism. Alocking of the rotation mechanism, however, is not as desirable as it contributes tomechanical impact loadings of the rotor.
Figure 2.1: Illustration of a horizontal wind turbine
When calculating the energy exchange of a wind turbine in comparison with otherenergy sources, consideration must be taken to account the large amount of energyrequired to produce all the materials that the plant is constructed of. Especiallythe heavier steel structures, aluminum plates, etc. require large amounts of energyduring the manufacturing process which reduces the effective energy exchange. AVestas V112 with an installed capacity of max. 3 MW have produced the energyneeded to manufacture all parts of the plant within about 8 months of operation.This is called the break-even time [6].
6

CHAPTER 2. LITERATURE REVIEW 2.1. WIND TURBINES
2.1.1 Rotor Blades
In Horizontal Axis Wind Turbines (HAWT) there are generally three blades. Theblades together with the hub is called rotor. The blades rotate when hit by wind,causing the rotor to spin. The main components of the blades are carbon fibre andwoven glass fibres infused by an epoxy resin. They also contain auxiliary materialssuch as core material (balsa wood or Divinycell [2]) and various plastic films areused in the production of the blades. Figure 2.2 shows the distribution betweenDivinycell H60 and balsa wood in a standard V112 rotor blade. Material data forthe two constituents are given in Table 2.1.
Figure 2.2: Distribution between balsa wood and Divinycell H60
Table 2.1: Densities for PN115, H60 and Balsa Wood
Density
[kg/m3]
PN115 115
H60 60
Balsa Wood 155
2.1.2 Sandwich Construction
A sandwich structure is a construction material which is composed by the fuse ofdifferent layers, i.e. a thin layer of a refractory material on each side of a thickerlayer of a low weight strong core material. For such a case, the middle layer shouldwithstand shear while the compressive and tensile forces during bending will beabsorbed by the outer layers. Sandwich structures make it possible to reduce theweight of the product and, hence, the energy consumption for both at use and attransport to the customer.
7

2.1. WIND TURBINES CHAPTER 2. LITERATURE REVIEW
2.1.3 Core Materials
Among many different industries, Diab provides the core material to one of thefastest growing one, the wind industry. In wind turbines, the core material is usedin nacelles and blades.
The core material provided by Diab is what makes the middle layer of a sandwichconstruction. In this study, two different core materials from Diab are compared, Di-vinycell H60 and Divinycell PN115. The difference in weight for these two materialsare almost 50%, see Table 2.1. Figure 2.3 illustrates the content of core material ina rotor blade.
Figure 2.3: Content of sandwich material in a rotor blade
Source: private communication, Diab
Divinycell PN115 and H60
Two of the core materials that Diab manufactures are called Divinycell PN115 andH60. Divinycell PN115 is manufactured of thermoplastic polyethylene therephthalate(PET) which results in a thermoplastic foam. Divinycell H60 has a interpenetratingnetwork chemical structure (IPN), it is a foam with a combination of polyurea andPVC. Figure 2.4 shows three different IPN alternatives, they all look quite similarbut has different densities.
8

CHAPTER 2. LITERATURE REVIEW 2.2. WIND POWER
Figure 2.4: Divinycell H foams with different densities
Source: www.diabgroup.com
2.2 Wind Power
Wind power is defined as production of energy extracted from the wind. Wind poweris now used over large parts of the world to produce electricity in an environmentallyfriendly and sustainable way. Wind energy is a converted form of solar energy anddriven by the winds that occur when the earth and its atmosphere is heated by thesun. When the wind turbine is in operation, the wind power is the only thing thatdrives it; no hazardous fuel-transports are required, no emissions and no hazardouswaste is left behind.[4]
9
2.2. WIND POWER CHAPTER 2. LITERATURE REVIEW
The basic principle of wind power is based on being able to transmit mechanicalpower into electrical power that can be transferred into the grid. The mechanicalpower transmitted from the power available in the wind turbine by the wind turbine.The power available in the wind is further described by equation 2.1.
Pw =1
2ρAv3w (2.1)
The power available is Pw, ρ is the air density, A is the swept area and vw is the windvelocity. The incoming air creates a lift force on the rotor blade airfoil which resultsin a torque. The torque is then used in a generator to produce electricity. More onthis is described section 2.2.1.
2.2.1 Aerodynamics
Aerodynamics is a branch of fluid dynamics that describe how the air (or variousgases) behaves in motion and the interaction with a solid object, such as a rotorblade of a wind turbine.
The incoming air creates a lift force on the rotor blade airfoil which results in atorque. The lift force L is perpendicular to the direction of the oncoming air flow.This force is a consequence of the unequal pressure on the upper and lower airfoilsurfaces. The drag force D is parallel to the direction of the oncoming air flow. Thisforce is due both to viscous friction forces at the surface of the airfoil and to unequalpressure on the airfoil surfaces facing toward and away from the oncoming flow [7].Lift and drag forces are illustrated in Figure 2.5, CL denotes the lift coefficient, CDdenotes the drag coefficient. The aerodynamic loads are expressed in equation 2.2and 2.3. B denotes the area of the orthographic projection of the object.
L =1
2Bρv2CL (2.2)
D =1
2Bρv2CD (2.3)
10

CHAPTER 2. LITERATURE REVIEW 2.3. LIFE CYCLE ASSESSMENT
Figure 2.5: Lift and drag forces on airfoil
2.2.2 Wind Gradient
Wind speed varies with the height above ground. The change in wind speed withthe height in the atmosphere, as the wind profile discloses, may also be expressed asa wind gradient.
For wind turbine engineering, an exponential variation in wind speed with heightcan be defined relative to wind measured at a reference height according to equation2.4. v is wind speed, h is height and α is the Hellmann exponent [8]. The Hellmannexponent depends upon the coastal location and the shape of the terrain on theground, and the stability of the air flow. Thus the velocity at height h is defined asv according to Equation 2.4 where v10 denotes the wind speed at h10 = the height of10 metres.
v = v10 ·(h
h10
)α(2.4)
2.3 Life Cycle Assessment
Life Cycle Assessment (LCA) is a technique to assess environmental impacts associ-ated with all the stages of a product’s life from start to end (i.e., from raw materialextraction through materials processing, manufacturing, distribution, use, repair andmaintenance, and disposal or recycling). The life cycle for a wind turbine is shownin Figure 2.6. The scope of V112 3 MW wind plant LCA is shown in Figure 2.7. InSection 3.1.1, the different life cycle stages will be further analyzed.
11

2.3. LIFE CYCLE ASSESSMENT CHAPTER 2. LITERATURE REVIEW
Figure 2.6: Life cycle of a wind turbineSource: Life Cycle Assessment of Electricity Production from a V112 Turbine WindPlant [6]
Figure 2.7: Scope of V112 3 MW wind plant LCASource: Life Cycle Assessment of Electricity Production from a V112 Turbine WindPlant [6]
12

CHAPTER 2. LITERATURE REVIEW 2.4. TRANSPORTATION
2.4 Transportation
Wind farms generate a large amount of transport. It is not just the wind turbines inthemselves that involves transport, but also the transportation in the form of liftingand construction equipment and soil, rock and concrete shipments of new connectingroads and reinforcement of existing roads, concrete foundations, etc.
Deliveries of wind turbines are believed to come primarily from suppliers with itsmain production facilities in Denmark and Germany. With today’s transport andcargo carriers available for road and regulatory framework for dispense transportsfor these special transports, the choice often fall on road, rail and ferry transportall the way from the factory to the installation site. However, there is always a riskof disruption to dispense transports. Weather-related disruptions and unplannedmaintenance of the road network can provide major logistical problems. A plannedextensive road transport may also be difficult to combine with the scheduled main-tenance of the road systems.
The wind turbine components are divided into following transport modules: onemounting plate, one generator, three rotor blades, one hub and four tower sections[9], see Figure 2.1.
The transportation of turbines affects traffic in our society, risk for accidents, CO2
emissions, traffic jams etc. The question is whether these problems that impose costson society are considered in the context of wind energy, which is an important sourceof renewable energy.
The environmental impact of freight transport is extensive. Besides air emissionsof substances with global as well as regional and local impact as other impacts aris-ing from noise, land encroachment and vibrations. In line with the expansion ofwind power in Sweden, various types of transportation means are increasing as well,which makes it important to plan the logistics well so that CO2 emissions duringtransportation becomes as small as possible. [10]
13
Method
This chapter describes all the methods used to achieve the results for this thesis. Thework was initialised with a literature study to build up a base of understanding forwind turbines. Different calculations and data gathering was then made in order toachieve the final results.
3.1 Source of Information and Literature
This thesis work started with a literature study in order to understand the functionof wind turbines. A variety of books, articles and websites were used for this, booksand articles were found using LOVISA, the library catalogue at Lund University. Tolocate the different environmental profits and to understand where the reduction ofweight in the blades would make a difference, a study of a LCA from Vestas [6] wasconducted. Besides information regarding wind turbines, research regarding roadand rail transportation was made.
3.1.1 Life Cycle Stages
Following life cycle stages were taken from the LCA that Vestas made for the V112-model [6], each stage is described where the reduced weight of the core material willhave an impact. Out of the different stages manufacturing of the core materials,transportation from production sites to wind turbine site and power production areincluded in this thesis.
Manufacturing
This phase includes production of raw materials and the manufacturing of the rotorblades. Transport of the core material from Diab to the production of blades areincluded in this phase.
14

CHAPTER 3. METHOD3.1. SOURCE OF INFORMATION AND LITERATURE
Wind Plant Setup
In this phase, transportation of the blades from Vestas production site to the windturbine site in Gubbhogen is included. Processes associated with erecting the tur-bines are activities that make up this phase but have not been included in the scopeof this study.
Site Operations
The site operations phase deals with the general running of the wind turbine plantas it generates electric power. The power production is considered in this thesis butthe maintenance of the turbines is not.
End of Life
This is in the end of the turbines life and the plant components are dismantled andthe site is remediated to the agreed state. Final waste management of materials isalso considered in this phase, however it is not included in the scope of this study.
Figure 3.1: Scope of V112 3 MW wind plant for this thesis
15
3.2. DATA COLLECTION CHAPTER 3. METHOD
3.1.2 Defining Focus Areas
With the help of the LCA [6], the scope for this thesis was defined, see Figure 3.1.According to the assessment, there are three distinctive processes where there areenvironmental profits from decreasing the core material weight:
• Production of the core material of the rotor blade• Transportation of turbine components to wind plant site• Energy produced during wind plant operation
3.2 Data Collection
In order to calculate the power production for wind turbines, some data regardingwind speed needed to be gathered. This data was gathered from SMHI, SwedishMeteorological and Hydrological Institute [11]. These measurements were made atthe height of 10 m, h10 in Gubbhogen.
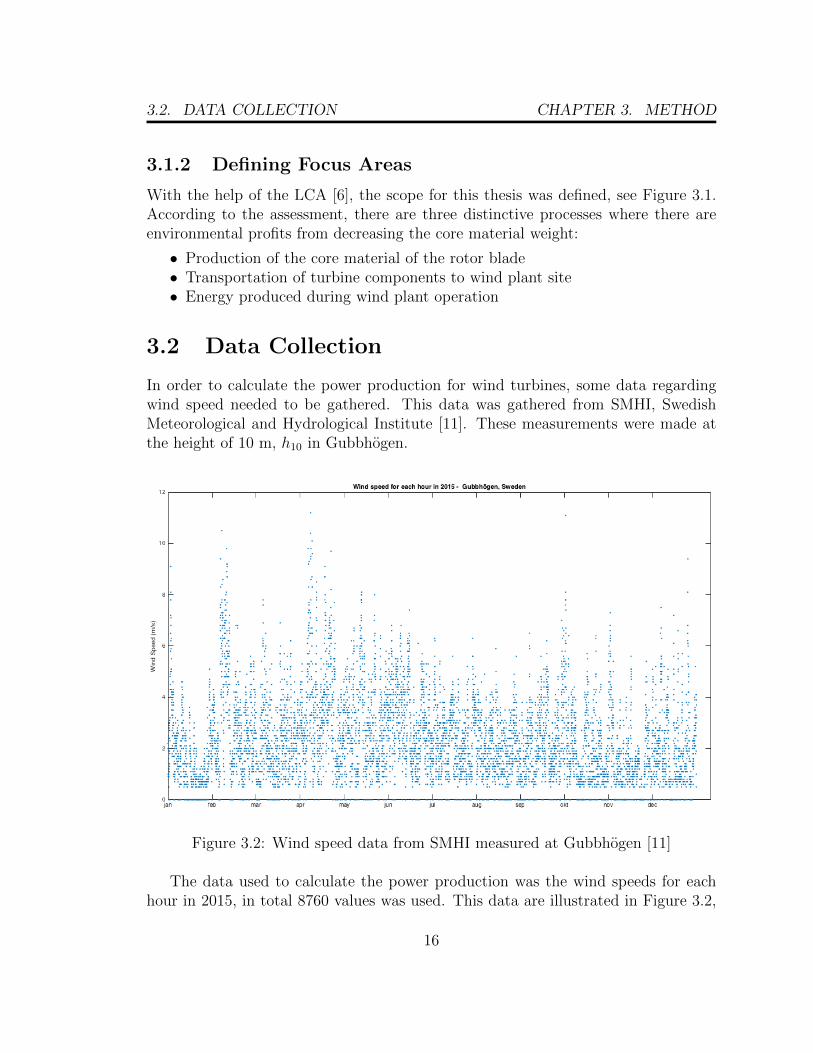
Figure 3.2: Wind speed data from SMHI measured at Gubbhogen [11]
The data used to calculate the power production was the wind speeds for eachhour in 2015, in total 8760 values was used. This data are illustrated in Figure 3.2,
16

CHAPTER 3. METHOD 3.3. CALCULATIONS
with speed values vary from 0 m/s to 11.2 m/s. Horizontal axis shows the monthsduring the year of 2015, and vertical axis shows the range of wind speed during thisyear.
3.3 Calculations
Calculations of the environmental profits has been made in three parts; CO2 for theproduction of the core material (3.3.2), the overall power production (3.3.3) and thetransportation of rotor blades (3.3.4). The calculations for the power productionare given in watt hours, Wh, which is converted to CO2. Below are the differentmethods used to get all the environmental profits for each section.
3.3.1 Estimating Weight Reduction of Core Material
The weight saved by using H60 instead of PN115 was calculated by multiplying thedensity of the material with the core material volume used in the blades. Using H60also results in a reduction of weight of resin. Resin is a collective name for epoxy,polyester, vinyl ester, etc. In the Vestas case, epoxy is used. Following values ofresin save, core density and volume were provided by Diab.
Table 3.1: Core material weight reduction for one blade
Density
[kg/m3]
Volume
[m3]
Weight
[kg]
PN115 115 5.3 613.3
H60 60 5.3 320.0
alternative core weight difference: 293.3
Surface Weight Save
[g/m2]
Surface Area
[m2]
Weight
[kg]
estimated foam
core surface0.2 152 30.4
Total weight reduction: 323.7
17

3.3. CALCULATIONS CHAPTER 3. METHOD
3.3.2 Core Material Production
To calculate the amount of CO2 that resulted when producing the different corematerials, two things was needed: the volume of the materials and the emissionfactor for the materials. The emission factors indicates the amount of CO2 in kgper kg core material. This information was provided by Diab, see Table 3.2. Bymultiplying the emission factors by the weight of the core materials, and taking thedifference between the two materials, the total amount of CO2 saved by using H60was obtained.
Table 3.2: Technical data for the core materials [2]
Density
[kg/m3]
Volume
[m3]
Weight
[kg]
Emission Factor
[kg CO2/kg core material ]
PN115 115 5.3 613.3 7.1
H60 60 5.3 320 6.6
3.3.3 Transportation
The routes consist of two parts, the first is the route from Diabs production site(Laholm, Sweden) where the core material is produced to Vestas production site(Lem, Denmark). The second part is the route from Vestas production site for therotor blades to the wind farm site (Gubbhogen). The distances for these routes arepresented in Table 3.3.
Table 3.3: Distances for routes
RouteDistance
[km]
Diab - Vestas 495
Vestas - Gubbhogen 1624
These routes are illustrated in Figure 3.3 and 3.4 using Google Maps. The calcu-lations of emitted CO2 for these routes were handled separately as the cargo for the
18

CHAPTER 3. METHOD 3.3. CALCULATIONS
first route is only the core material and the weight for the cargo in the second routeis the total weight of the rotor blades.
Figure 3.3: Transport from Diab production site A to Vestas production site B
Figure 3.4: Transport from Vestas production site A to wind farm site B
19

3.3. CALCULATIONS CHAPTER 3. METHOD
To calculate the greenhouse gas emission of a transport, there are several dif-ferent methods that can be used. The one chosen for this thesis was the methodrecommended by Naturvardsverket, the Swedish Environmental Protection Agency[12]. In Equation 3.1 ECO2 is the CO2 emission in kg, Cfuel is the fuel consumptionin m3, H is the heat value defined in GJ/m3 and Ef is the emission factor definedin kg/GJ .
ECO2 = Cfuel ·H · Ef (3.1)
The heat value and emission factor for heavy truck with diesel fuel was found atthe website of Naturvardsverket [12]. The amount of fuel consumed for the transportof a 2 MW rotor blade is according to Trafikverket, Swedish Transport Administra-tion, 0.56 litres per km. An unloaded truck consumes 0.5 litres per km. A 2 MWrotor blade weighs 9.5 tonnes and by using linear interpolation, the amount of fuelconsumed for transport of a rotor blade and for the core material was given, seeFigure 3.5. A rotor blad with PN115 has the fuel consumption of 0.575 litres per kmand for H60 the fuel consumption is 0.573 litres per km.
Figure 3.5: Fuel consumption per cargo weight given by linear interpolation
20

CHAPTER 3. METHOD 3.3. CALCULATIONS
3.3.4 Electricity Production
This part of the thesis was the most extensive one when it came to the calculations.Two different theories was considered in order to calculate the overall power produc-tion for a wind turbine. At the end, theory no. 1 was the one most suited for thescope of this thesis.
Theory 1: Reducing weight in blade
The kinetic energy Ek for an air mass mw with a wind velocity vw can be expressedas
Ek =1
2mwv
2w (3.2)
Denote A as the swept area of a particular wind turbines blades, with the bladelength r and the length of the ’tube’ of air that collides with the swept area per unittime is l, see Figure 3.6. The mass of air is
mw = Alρ = πr2lρ (3.3)
Figure 3.6: Volume of air that passes the rotor blades
Where ρ is the air density. The length can be described in terms of velocity vand time t, l = vt. Substituting this into the original equation for kinetic energy in(3.2) gives,
Ek =1
2Aρvtv2 =
1
2Aρtv3 (3.4)
21
3.3. CALCULATIONS CHAPTER 3. METHOD
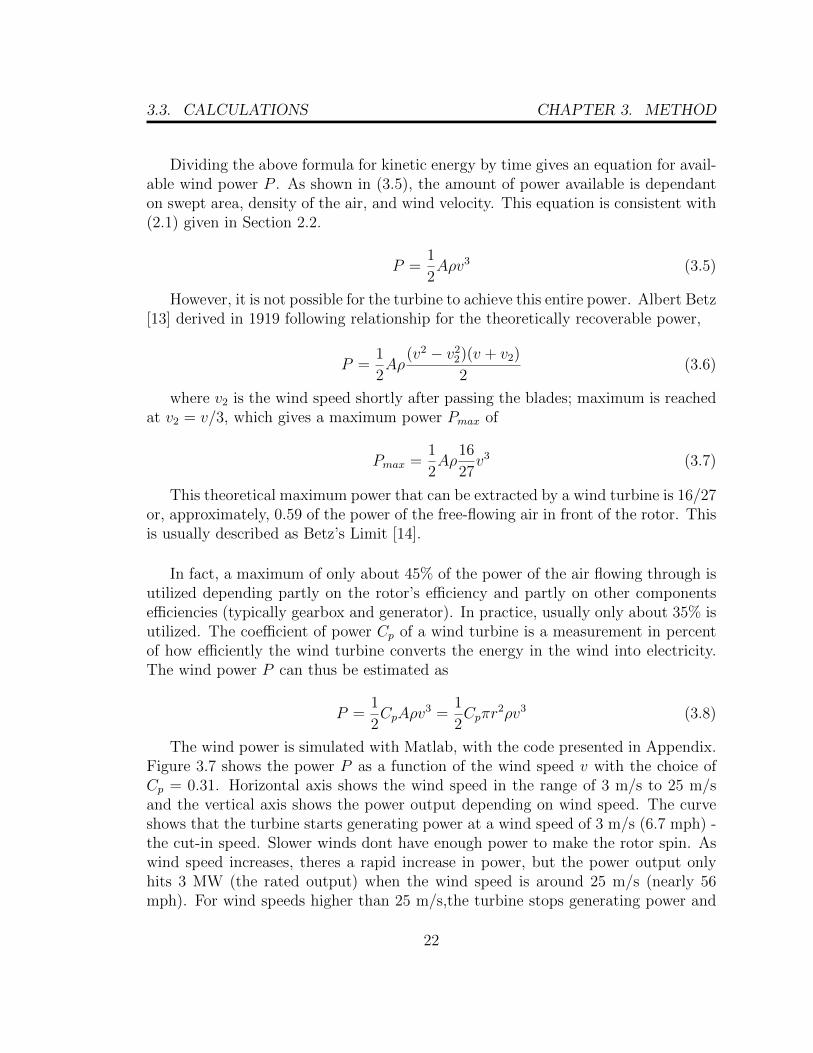
Dividing the above formula for kinetic energy by time gives an equation for avail-able wind power P . As shown in (3.5), the amount of power available is dependanton swept area, density of the air, and wind velocity. This equation is consistent with(2.1) given in Section 2.2.
P =1
2Aρv3 (3.5)
However, it is not possible for the turbine to achieve this entire power. Albert Betz[13] derived in 1919 following relationship for the theoretically recoverable power,
P =1
2Aρ
(v2 − v22)(v + v2)
2(3.6)
where v2 is the wind speed shortly after passing the blades; maximum is reachedat v2 = v/3, which gives a maximum power Pmax of
Pmax =1
2Aρ
16
27v3 (3.7)
This theoretical maximum power that can be extracted by a wind turbine is 16/27or, approximately, 0.59 of the power of the free-flowing air in front of the rotor. Thisis usually described as Betz’s Limit [14].
In fact, a maximum of only about 45% of the power of the air flowing through isutilized depending partly on the rotor’s efficiency and partly on other componentsefficiencies (typically gearbox and generator). In practice, usually only about 35% isutilized. The coefficient of power Cp of a wind turbine is a measurement in percentof how efficiently the wind turbine converts the energy in the wind into electricity.The wind power P can thus be estimated as
P =1
2CpAρv
3 =1
2Cpπr
2ρv3 (3.8)
The wind power is simulated with Matlab, with the code presented in Appendix.Figure 3.7 shows the power P as a function of the wind speed v with the choice ofCp = 0.31. Horizontal axis shows the wind speed in the range of 3 m/s to 25 m/sand the vertical axis shows the power output depending on wind speed. The curveshows that the turbine starts generating power at a wind speed of 3 m/s (6.7 mph) -the cut-in speed. Slower winds dont have enough power to make the rotor spin. Aswind speed increases, theres a rapid increase in power, but the power output onlyhits 3 MW (the rated output) when the wind speed is around 25 m/s (nearly 56mph). For wind speeds higher than 25 m/s,the turbine stops generating power and
22

CHAPTER 3. METHOD 3.3. CALCULATIONS
the rotor will brake mechanically so that the turbine doesn’t damage.
Figure 3.7: Power curve for Vestas V112
The kinetic energy in wind is converted to generate electricity or mechanicalpower. A lighter blade will require a lower wind speed to move and assuming thatthis difference in velocity can shift the power curve of the wind turbine to the left inFigure 3.7, more power will be generated.
The aerodynamic forces are used to calculate the reduced wind velocity needed tomove a lighter blade. These were mentioned in Section 2.2.1.
L is the lift force and D is the drag force. CL is the lift coefficient, CD is the dragcoefficient and B the area of the orthographic projection of the object. Accordingto (2.2) and (2.3), lift and drag are expressed as,
L =1
2Bρv2CL
D =1
2Bρv2CD
23

3.3. CALCULATIONS CHAPTER 3. METHOD
With Figure 2.5, F is the resulting F is shown in this figure,
Lift and drag forces on airfoil
The resulting aerodynamic force F is
F = L cosα +D sinα = (CL cosα + CD sinα)Bρv2
2(3.9)
By simplification of constants in 3.10, with β equal to
β = (CL cosα + CD sinα)Bρ
2(3.10)
the force is now written as
F = βv2 (3.11)
This force needs to be greater than Mg in 3.12, where mb is the blade weight andg is the acceleration of gravity,
Mg = mbg (3.12)
The minimum wind speed to move blades with the total weight of 35700 kg(weight of three blades with PN115) is 3 m/s. As follows from (3.11) and (3.12), thisrelation is derived:
F = βv2 = mbg ⇒ v =
√mbg
β(3.13)
3 =
√35700g
β⇒ β
g=
35700
32
24
CHAPTER 3. METHOD 3.3. CALCULATIONS
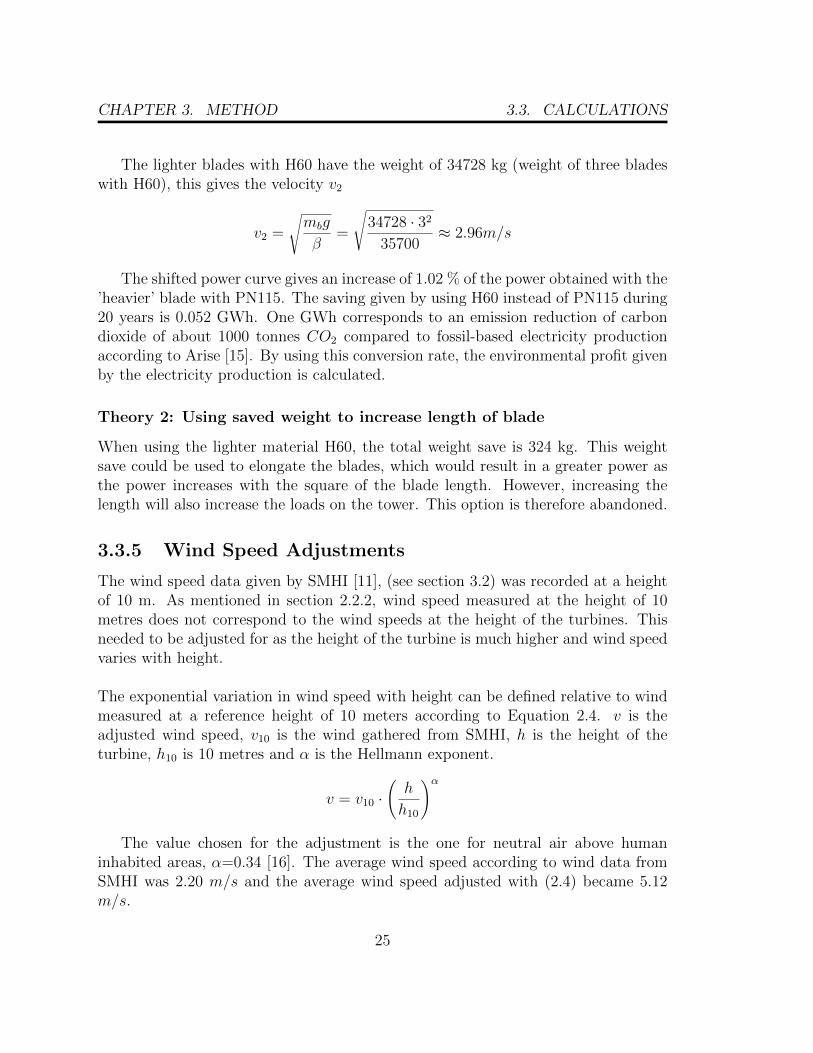
The lighter blades with H60 have the weight of 34728 kg (weight of three bladeswith H60), this gives the velocity v2
v2 =
√mbg
β=
√34728 · 32
35700≈ 2.96m/s
The shifted power curve gives an increase of 1.02 % of the power obtained with the’heavier’ blade with PN115. The saving given by using H60 instead of PN115 during20 years is 0.052 GWh. One GWh corresponds to an emission reduction of carbondioxide of about 1000 tonnes CO2 compared to fossil-based electricity productionaccording to Arise [15]. By using this conversion rate, the environmental profit givenby the electricity production is calculated.
Theory 2: Using saved weight to increase length of blade
When using the lighter material H60, the total weight save is 324 kg. This weightsave could be used to elongate the blades, which would result in a greater power asthe power increases with the square of the blade length. However, increasing thelength will also increase the loads on the tower. This option is therefore abandoned.
3.3.5 Wind Speed Adjustments
The wind speed data given by SMHI [11], (see section 3.2) was recorded at a heightof 10 m. As mentioned in section 2.2.2, wind speed measured at the height of 10metres does not correspond to the wind speeds at the height of the turbines. Thisneeded to be adjusted for as the height of the turbine is much higher and wind speedvaries with height.
The exponential variation in wind speed with height can be defined relative to windmeasured at a reference height of 10 meters according to Equation 2.4. v is theadjusted wind speed, v10 is the wind gathered from SMHI, h is the height of theturbine, h10 is 10 metres and α is the Hellmann exponent.
v = v10 ·(h
h10
)α
The value chosen for the adjustment is the one for neutral air above humaninhabited areas, α=0.34 [16]. The average wind speed according to wind data fromSMHI was 2.20 m/s and the average wind speed adjusted with (2.4) became 5.12m/s.
25

3.4. ASSUMPTIONS CHAPTER 3. METHOD
3.3.6 Break-even Time
An interesting aspect to consider when assessing the environmental performance ofwind plants is the point in time after which the environmental burdens of producingthe wind plant are outweighed by the environmental profits of the renewable energythat is generated.
According to the LCA of Vestas V112 [6], this aspect can be derived as an en-ergy balance showing the relationship between the energy requirement for the wholelife cycle of the wind plant and the power output from the wind plant. Followingthis approach, the break-even time after which the power production outweighs thepower required over the lifetime of the V112 wind plant is 8 months, or 0.67 years.This was derived by using following relation,
Energy requirement for the life cycle (GWh)
Energy produced in one year (GWh/year)= Break-even Time (year)
According to Arise [15], annual power production of a Vestas V112 turbine is 8.5GWh. This gives the energy requirement for the life,
0.67 (year) · 8.5 (GWh/year) = 5.695 (GWh)
By using the results in this thesis for the savings in production and transportationof H60 instead of PN115, CO2 converted to energy in GWh, the break-even time forthe lighter blades are given.
3.4 Assumptions
In order to conduct some of the calculations, a few assumptions were made. Theseare further described below.
3.4.1 Life Time
The life time of the wind plant is assumed to be 20 years. This corresponds to thedesign life time of the V112 3.0 MW turbine and applies to all components of thewind plant, except for certain replacement parts.
26

CHAPTER 3. METHOD 3.4. ASSUMPTIONS
3.4.2 Choice of Hellmann Exponent
The Hellmann exponent [16] was chosen as 0.34, based on two assumptions on thecoastal location and the stability of the air being ”Neutral air above human inhabitedareas”. The site Gubbhogen fits with the coastal location ”human inhabited areas”and the air stability is assumed to be ”neutral” [16].
3.4.3 Transportation
The entire transportation is assumed to be by road and that the cargo is transportedwith a heavy truck with trailer. Fuel consumption during the transportation for bothroutes is assumed to be a linear interpolated value based on 0.56 litre of fuel per kmfor a rotor blade with the weight of 9.5 tonnes, value given by Trafikverket [9].
27
Summary of Results
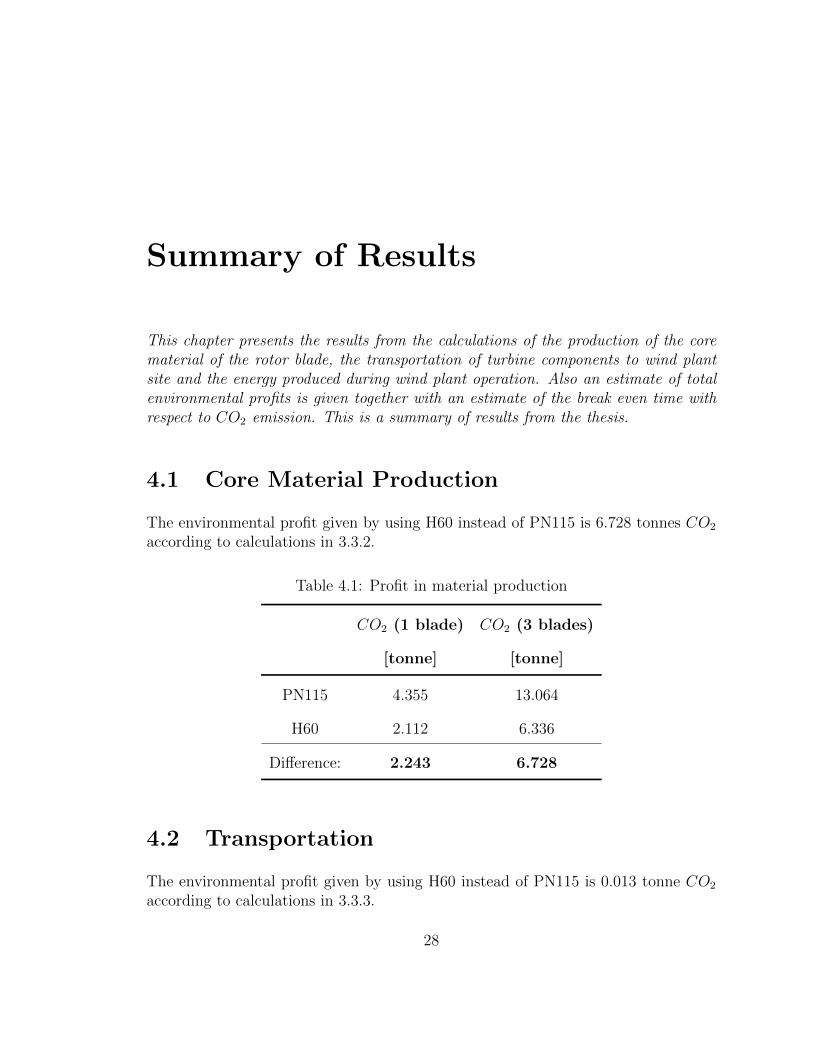
This chapter presents the results from the calculations of the production of the corematerial of the rotor blade, the transportation of turbine components to wind plantsite and the energy produced during wind plant operation. Also an estimate of totalenvironmental profits is given together with an estimate of the break even time withrespect to CO2 emission. This is a summary of results from the thesis.
4.1 Core Material Production
The environmental profit given by using H60 instead of PN115 is 6.728 tonnes CO2
according to calculations in 3.3.2.
Table 4.1: Profit in material production
CO2 (1 blade)
[tonne]
CO2 (3 blades)
[tonne]
PN115 4.355 13.064
H60 2.112 6.336
Difference: 2.243 6.728
4.2 Transportation
The environmental profit given by using H60 instead of PN115 is 0.013 tonne CO2
according to calculations in 3.3.3.
28

CHAPTER 4. SUMMARY OF RESULTS 4.3. ELECTRICITY PRODUCTION
Table 4.2: Profit in transportation
Fuel Consumed
per km
[m3/km]
Fuel
Consumed
[m3]
Heat
Value
[GJ/m3]
Emission
Factor
[kg/GJ]
CO2
[kg]
Route 1. Laholm - Lem
PN115 0.575 0.936 35.28 60.63 2003
H60 0.573 0.933 35.28 60.63 1996
Difference: 7
Route 2. Lem - Gubbhogen
PN115 0.512 0.253 35.28 60.63 542
H60 0.506 0.251 35.28 60.63 536
Difference: 6
4.3 Electricity Production
A Wind turbine with lighter blades produces 0.1045 GWh more after one year. After20 years, the profit is 2,09 GW. This is equivalent to an environmental profit of 2090tonne CO2 according to calculations in 3.3.4.
Table 4.3: Profit in produced electricity per year
Energy [GWh] CO2 [tonnes]
PN115 5.1135 5113.5
H60 5.2180 5218.0
Difference: 0.1045 104.5
29

4.4. TOTAL ENVIRONMENTAL PROFITCHAPTER 4. SUMMARY OF RESULTS
4.4 Total Environmental Profit
A Wind turbine with core material H60 instead of PN115 has a environmental profitof 2096.741 tonne CO2 according to the results given by Section 4.1, 4.2 and 4.3.
Table 4.4: Total environmental profit in CO2
CO2 [tonne]
Core Material Production 6.728
Transportation 0.013
Electricity Production 2090
Total: 2096.741
4.5 Break-even Time
The break-even time with the lighter blade is 7.87 months. This is around 5 dayssooner than the break-even time with the heavier core material according to calcu-lations in Section 3.3.6.
30

Discussions and Conclusions
Calculations resulted in an environmental profit of 2096.7 tonnes CO2 after a windturbine’s lifetime of 20 years by using core material H60 instead of PN115. Con-sidering that the electricity production after 20 years is equivalent to 61.362 ·103
tonnes CO2, the profit is not that large. The break-even time, amount of time whenthe power production outweighs the power required over the lifetime, is 7.87 monthscompared to 8.04 months with the heavier core material. This corresponds to areduction of 2%. The largest contribution of environmental profit came from theelectricity production.
Factors that could have affected the results are the assumptions that were made.Annual electricity production according to Arise [15] is 8.5 GWh but the result was5.1 GWh. Site placement was chosen to be Gubbhogen as it was rather close toHavsnas which was used in the calculations made by Trafikverket [9]. 8.5 GWh isproduced annually at the wind farm site Skappentorp which is much closer to thecoast than Gubbhogen. Based on the placements of wind turbine plants that areowned by Arise, the mean wind speeds at Gubbhogen is maybe more suitable for a 2MW turbine that has a lower wind speed range for power production. The Hellmannexponent was chosen as 0.34, based on two assumptions on the coastal location andthe stability of the air. The site Gubbhogen fits with the coastal location ”humaninhabited areas” but the assumption of air stability is hard to know and was there-fore set as ”neutral”. A Hellmann exponent at 0.45 would have corresponded to theannual electricity production according to Arise [15]. There is also uncertainty in thewind data used to calculate the electricity production as the adjusted wind speedswith the wind gradient is constant to the wind speed measured at the height of 10 m.
I believe that the environmental profit (excluding end-of-life) in fact is larger thanthe result given by this thesis. This due to the restrictions made in the scope ofthis study. Lighter rotor blades would probably result in less wear and tear for theturbine which would require less replacement parts for turbine, less transports formaintenance and service, etc.
31

CHAPTER 5. DISCUSSIONS AND CONCLUSIONS
The methods used in this thesis was a literature study, calculations and datacollection. The literature study was needed to get a base of knowledge in order toperform the work of this thesis and I would’nt have done this part differently. Cal-culations of transportation was performed with a method given by Naturvardsverket[12]; this part could have been performed with other methods. For example themethod used by Trafikverket, which used the relation of 2621 g CO2 per litre of fuel.The assumptions made for the transportation simplified the calculations which, ofcourse, affected the given result. However, since the environmental profit given bythe reduced weight during transportation was so extremely small, this wouldn’t havegiven a big impact to the total result of environmental profit. The electricity pro-duction was calculated based on Theory no. 1, which implicated a shift in the powercurve, as a lighter blade requires a lower wind speed to move. This method was notthat complex and a more advanced method involving simulations would probably bemore accurate. Wind speed data was collected at SMHI, these were measured at aheight of 10 m and then adjusted with a wind gradient. If there were wind speed datameasured at a height of 119 m, I would have rather used them for my calculations.
32

Recommendations
The environmental profit is only 2%, which is not that large. However, any kind ofweight reduction is desired to meet the demands of the fast growing wind industry.As the length of the rotor blades and the height of turbines grow, a lower weightreduces strains on the the turbine. The choice of core material also needs to beevaluated from a social and economic aspect during decision-making.
For further work or recommendations for alternative projects, I suggest that theenvironmental aspect of the end-of-life treatment is included with the results givenin this thesis. Other profits that could not be examined in this thesis due to thelimitations mentioned in section 1.3 should be further investigated.
33

References
[1] ”Announcement - Evoco.” 2013http://evocope.com/wp-content/uploads/2013/11/2013-June-SSP-EN.pdf08-08-16
[2] ”DIAB Global Portal.” 2016http://www.diabgroup.com/08-08-16
[3] ”V112-3.45 MW - Vestas.” 2016http://www.vestas.com/en/products/turbines/v112%203 3 mw08-08-16
[4] Wizelius. Vindkraft i teori och praktik. p. 17. 2003
[5] ”Folj bygget av Sveriges storsta vindkraftverk — Ny Teknik.” 2011.http://www.nyteknik.se/energi/folj-bygget-av-sveriges-storsta-vindkraftverk-641889308-08-16
[6] D’Souza, Gbegbaje-Das and Shonfield. Life Cycle Assessment of Electricity Pro-duction from a V112 Turbine Wind Plant. Final Report, PE North West EuropeApS, Denmark. 2011
[7] Manwell, McGowan and Rogers. Wind Energy Explained. p. 103. 2009
[8] Heier. Grid Integration of Wind Energy Conversion Systems. p. 45. 2005
[9] Jerksjo and Sjodin. CO2-utslapp fran transporter av vindkraftverk till vindkraft-parken Havsnas i Jamtland frn leverantoren i Danmark. 2009
[10] Trafikverket. Transporter till vindkraftsparker - en handbok. Borlange: Trafikver-ket. 2010
[11] ”Vind — SMHI.” 2015http://www.smhi.se/klimatdata/meteorologi/vind08-08-16
34

REFERENCES REFERENCES
[12] ”Berakna luft- och klimatutslapp - Naturvardsverket.” 2016http://www.naturvardsverket.se/Stod-i-miljoarbetet/Vagledningar/Luft-och-klimat/Berakna-dina-klimatutslapp/08-08-16
[13] Betz, A. Introduction to the Theory of Flow Machines. (D. G. Randall, Trans.)Oxford: Pergamon Press. 1966
[14] Bergey, KH. The Lanchester-Betz limit (energy conversion efficiency factor forwindmills). Journal of Energy 3.6 (1979): 382-384.
[15] Arise. Arsrapport 2015. Halmstad: Arise AB. 2015
[16] Kaltschmitt, Streicher and Wiese. Renewable energy: technology, economics,and environment. p. 55. 2007
35

Appendix
Matlab Code
%---CONSTANTS----%
p=1.225; %air density kg/m3
r=54.65; %radius, length of rotor blade
c=0.31; %coefficient of power
h=0.04; %wind speed difference between PN115 and H60,
%must be least 0.01
g=(119/10)^0.34; %Wind gradient
%Velocity vector v
t=0.01; %Timestep of 0,01
v0=0:t:3-t; %Before cut-in speed
v1=3:t:12;
v2=12+t:t:25;
v=0:t:25; %After cut-out speed
%Wind power vector P
P0=0;
P1=0.5*p*v1.^3*pi*r^2*c;
P2=P1(end);
P=ones(1,length(v0)+length(v1)+length(v2));
P(1:length(v0))=P0;
P((length(v0)+1):(length(v0)+length(v1)))=P1;
P((length(v0)+length(v1))+1:end)=P2;
plot(v,P) %Power curve plot
ylabel(’Power output [W]’)
xlabel(’Wind speed [m/s]’)
p_115=0; %power of PN115
p_60=0; %power of H60
%w_115 is the wind speed data for PN115, w_60 is the wind speed data for
36

%H60
w_115 = xlsread(’gubbhogen.xlsx’, 1, ’C2:C8761’, ’basic’)’*g;
w_60=w_115+h;
%Negative values of data is set as 0
for s=1:length(w_60)
if w_60(s) < 0
w_60(s)=0;
end
end
%Adds all GWh for one year
for s=1:length(w_115)
if w_115(s) > 0 && w_115(s) < 25
p_115=p_115+P(floor(w_115(s)*100));
end
end
for s=1:length(w_60)
if w_60(s) > 0 && w_60(s) < 25
p_60=p_60+P(floor(w_60(s)*100+h*100));
end
end
%profit in percent
profit=p_60/p_115 - 1;
37