Embed Size (px)
Citation preview
White Paper
Calculating ROI for Enterprise Transportation Management Software Page 1 © 2014 UltraShipTMS • All Rights Reserved • 1-800-731-7512
Calculating Savings and Return for an Enterprise Transportation Optimization and Automation SolutionSee how Optimization and Automation can save Millions on Transportation via a Simple, 5-minute Process!
White Paper
Calculating ROI for Enterprise Transportation Management Software Page 2 © 2014 UltraShipTMS • All Rights Reserved • 1-800-731-7512
Perhaps you’re not convinced that transportation management and optimization will be beneficial to your organization. If so, you should take 5 minutes to read this paper!
Even if key stakeholders like the CEO, CFO, or CIO are not fully aware of current transportation management dynamics and the real benefits of implementing a leading transportation management tool. Here’s a step-by-step process you can easily duplicate using the basic information and data from your company’s existing transportation program. We even provide an interactive savings calculation tool! See how much you can save, how little it actually costs, and how quickly it pays for itself.
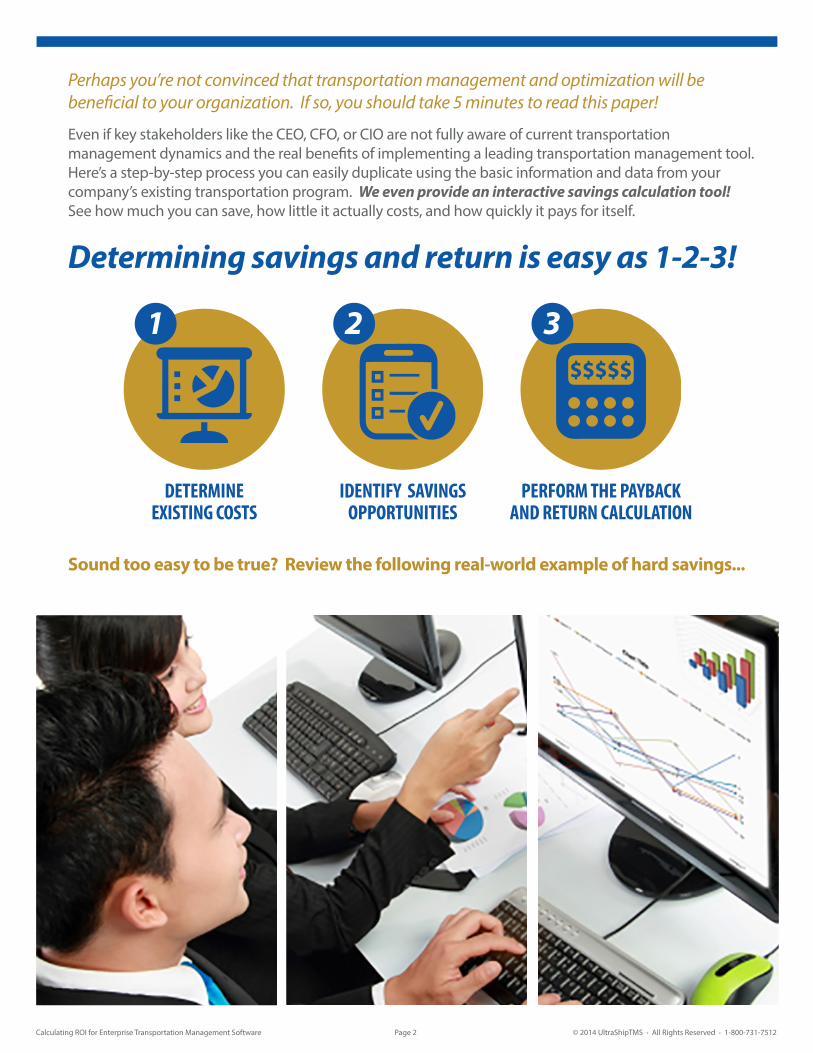
Determining savings and return is easy as 1-2-3!
Sound too easy to be true? Review the following real-world example of hard savings...
1 2 3Determine Existing Costs
Identify Savings Opportunities
Perform the Payback and Return Calculation
1 2 3Determine Existing Costs
Identify Savings Opportunities
Perform the Payback and Return Calculation
DETERMINEEXISTING COSTS
1
IDENTIFY SAVINGSOPPORTUNITIES
2
PERFORM THE PAYBACKAND RETURN CALCULATION
3
Calculating ROI for Enterprise Transportation Management Software Page 3 © 2014 UltraShipTMS • All Rights Reserved • 1-800-731-7512
CASE STUDY
WARWICKMANUFACTURING (company name changed)
For this exercise, we’ll look at transportation at Warwick Manufacturing Key Stats:
• Transportation volume: 125,000 shipments annually
• Inbound shipments of raw materials and components arrive at two Northeastern US production facilities
• Finished, packaged products ship outbound on dry vans throughout the continental US
Warwick Manufacturing generated impressive savings by investing in a Transportation Management System (TMS) and Transportation Optimizer solution.
Note: All calculations based on very conservative cost and savings estimates.

Calculating ROI for Enterprise Transportation Management Software Page 4 © 2014 UltraShipTMS • All Rights Reserved • 1-800-731-7512
1 2 3Determine Existing Costs
Identify Savings Opportunities
Perform the Payback and Return Calculation
1 2 3Determine Existing Costs
Identify Savings Opportunities
Perform the Payback and Return Calculation
DETERMINEEXISTING COSTS
1
IDENTIFY SAVINGSOPPORTUNITIES
2
PERFORM THE PAYBACKAND RETURN CALCULATION
3Step 1: Determine Existing Costs
Simply stated, transportation departments spend money on:
• Freight costs such as: - Line Haul - Fuel - Assessorials • Staffing costs such as: - Logistics personnel - IT personnel - Freight audit and payment administrative costs - Procurement/carrier management costs
Warwick Manufacturing’s existing freight costs are:
• 112,500 SHIPMENTS PER YEAR
• 550 MILE AVERAGE LENGTH OF HAUL
• $800.00 AVERAGE COST PER SHIPMENT
• $1.71 - COST PER MILE TO MOVE FREIGHT
TOTAL ANNUAL FREIGHT COST: $90MILLION
WARWICKMANUFACTURING
Calculating ROI for Enterprise Transportation Management Software Page 5 © 2014 UltraShipTMS • All Rights Reserved • 1-800-731-7512
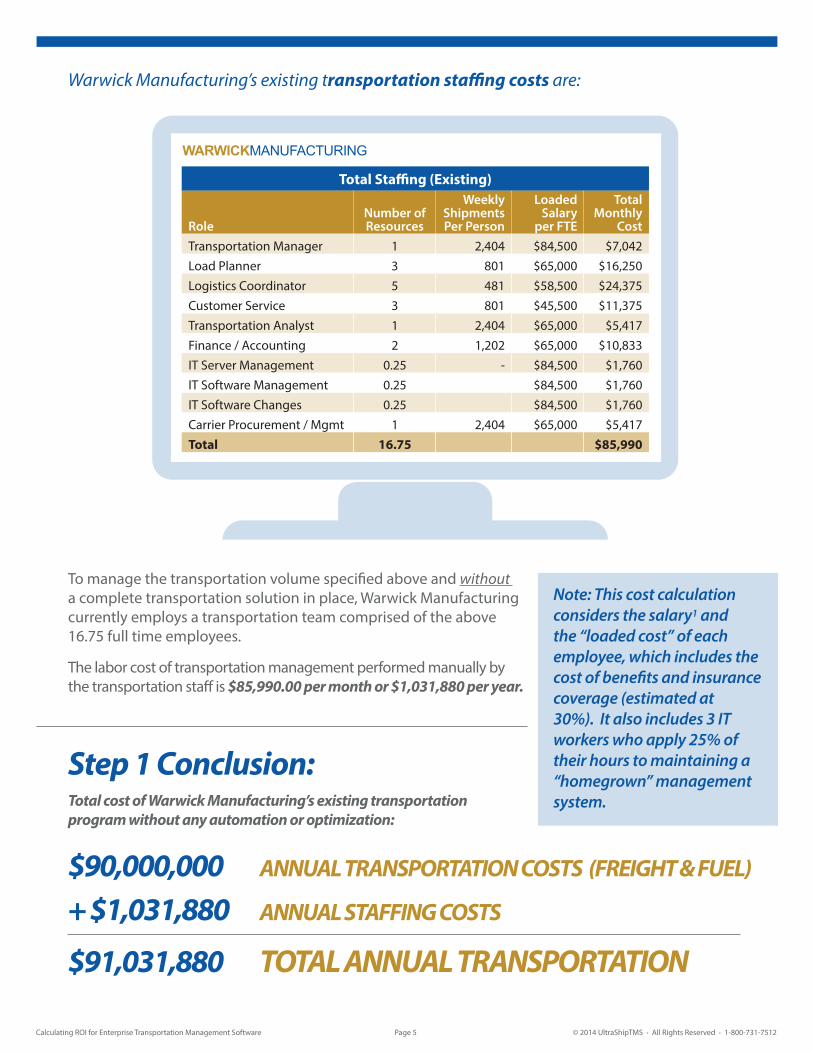
To manage the transportation volume specified above and without a complete transportation solution in place, Warwick Manufacturing currently employs a transportation team comprised of the above 16.75 full time employees.
The labor cost of transportation management performed manually by the transportation staff is $85,990.00 per month or $1,031,880 per year.
Step 1 Conclusion:Total cost of Warwick Manufacturing’s existing transportation program without any automation or optimization:
Note: This cost calculation considers the salary1 and the “loaded cost” of each employee, which includes the cost of benefits and insurance coverage (estimated at 30%). It also includes 3 IT workers who apply 25% of their hours to maintaining a “homegrown” management system.
Warwick Manufacturing’s existing transportation staffing costs are:
$90,000,000 ANNUAL TRANSPORTATION COSTS (FREIGHT & FUEL)
+ $1,031,880 ANNUAL STAFFING COSTS
$91,031,880 TOTAL ANNUAL TRANSPORTATION
Total Staffing (Existing)
RoleNumber of Resources
Weekly Shipments Per Person
Loaded Salary
per FTE
Total Monthly
CostTransportation Manager 1 2,404 $84,500 $7,042Load Planner 3 801 $65,000 $16,250Logistics Coordinator 5 481 $58,500 $24,375Customer Service 3 801 $45,500 $11,375Transportation Analyst 1 2,404 $65,000 $5,417Finance / Accounting 2 1,202 $65,000 $10,833IT Server Management 0.25 - $84,500 $1,760IT Software Management 0.25 $84,500 $1,760IT Software Changes 0.25 $84,500 $1,760Carrier Procurement / Mgmt 1 2,404 $65,000 $5,417Total 16.75 $85,990
WARWICKMANUFACTURING
Calculating ROI for Enterprise Transportation Management Software Page 6 © 2014 UltraShipTMS • All Rights Reserved • 1-800-731-7512
1 2 3Determine Existing Costs
Identify Savings Opportunities
Perform the Payback and Return Calculation
1 2 3Determine Existing Costs
Identify Savings Opportunities
Perform the Payback and Return Calculation
DETERMINEEXISTING COSTS
1
IDENTIFY SAVINGSOPPORTUNITIES
2
PERFORM THE PAYBACKAND RETURN CALCULATION
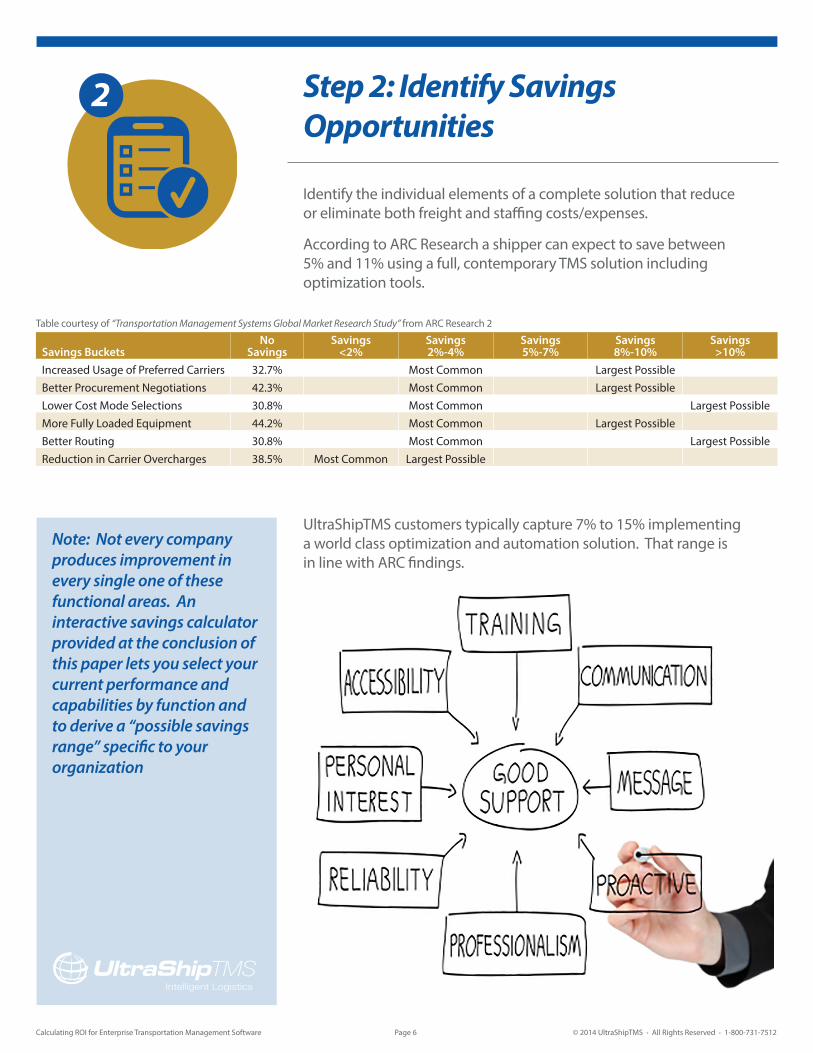
3Step 2: Identify Savings Opportunities
Identify the individual elements of a complete solution that reduce or eliminate both freight and staffing costs/expenses.
According to ARC Research a shipper can expect to save between 5% and 11% using a full, contemporary TMS solution including optimization tools.
UltraShipTMS customers typically capture 7% to 15% implementing a world class optimization and automation solution. That range is in line with ARC findings.
Table courtesy of “Transportation Management Systems Global Market Research Study” from ARC Research 2
Savings BucketsNo
SavingsSavings
<2%Savings 2%-4%
Savings 5%-7%
Savings 8%-10%
Savings >10%
Increased Usage of Preferred Carriers 32.7% Most Common Largest PossibleBetter Procurement Negotiations 42.3% Most Common Largest PossibleLower Cost Mode Selections 30.8% Most Common Largest PossibleMore Fully Loaded Equipment 44.2% Most Common Largest PossibleBetter Routing 30.8% Most Common Largest PossibleReduction in Carrier Overcharges 38.5% Most Common Largest Possible
Note: Not every company produces improvement in every single one of these functional areas. An interactive savings calculator provided at the conclusion of this paper lets you select your current performance and capabilities by function and to derive a “possible savings range” specific to your organization
Calculating ROI for Enterprise Transportation Management Software Page 7 © 2014 UltraShipTMS • All Rights Reserved • 1-800-731-7512
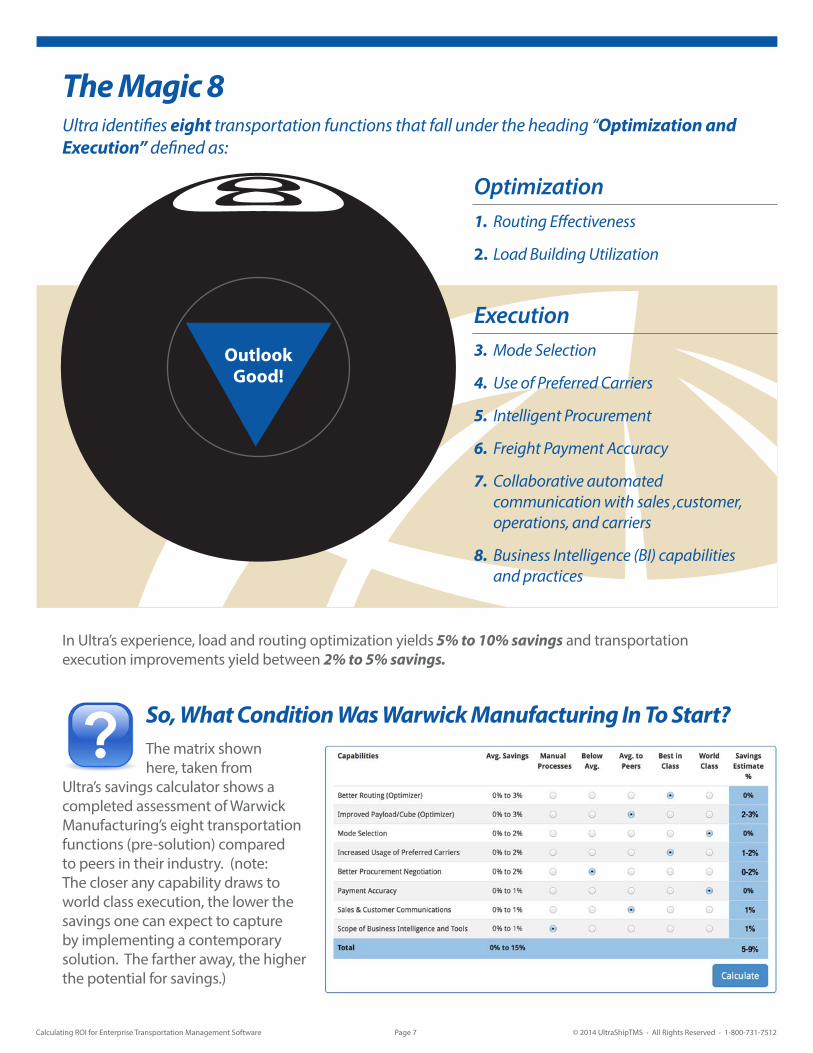
The Magic 8Ultra identifies eight transportation functions that fall under the heading “Optimization and Execution” defined as:
Optimization1. Routing Effectiveness
2. Load Building Utilization
Execution3. Mode Selection
4. Use of Preferred Carriers
5. Intelligent Procurement
6. Freight Payment Accuracy
7. Collaborative automated communication with sales ,customer, operations, and carriers
8. Business Intelligence (BI) capabilities and practices
In Ultra’s experience, load and routing optimization yields 5% to 10% savings and transportation execution improvements yield between 2% to 5% savings.
So, What Condition Was Warwick Manufacturing In To Start?The matrix shown here, taken from
Ultra’s savings calculator shows a completed assessment of Warwick Manufacturing’s eight transportation functions (pre-solution) compared to peers in their industry. (note: The closer any capability draws to world class execution, the lower the savings one can expect to capture by implementing a contemporary solution. The farther away, the higher the potential for savings.)
Outlook Good!
Calculating ROI for Enterprise Transportation Management Software Page 8 © 2014 UltraShipTMS • All Rights Reserved • 1-800-731-7512
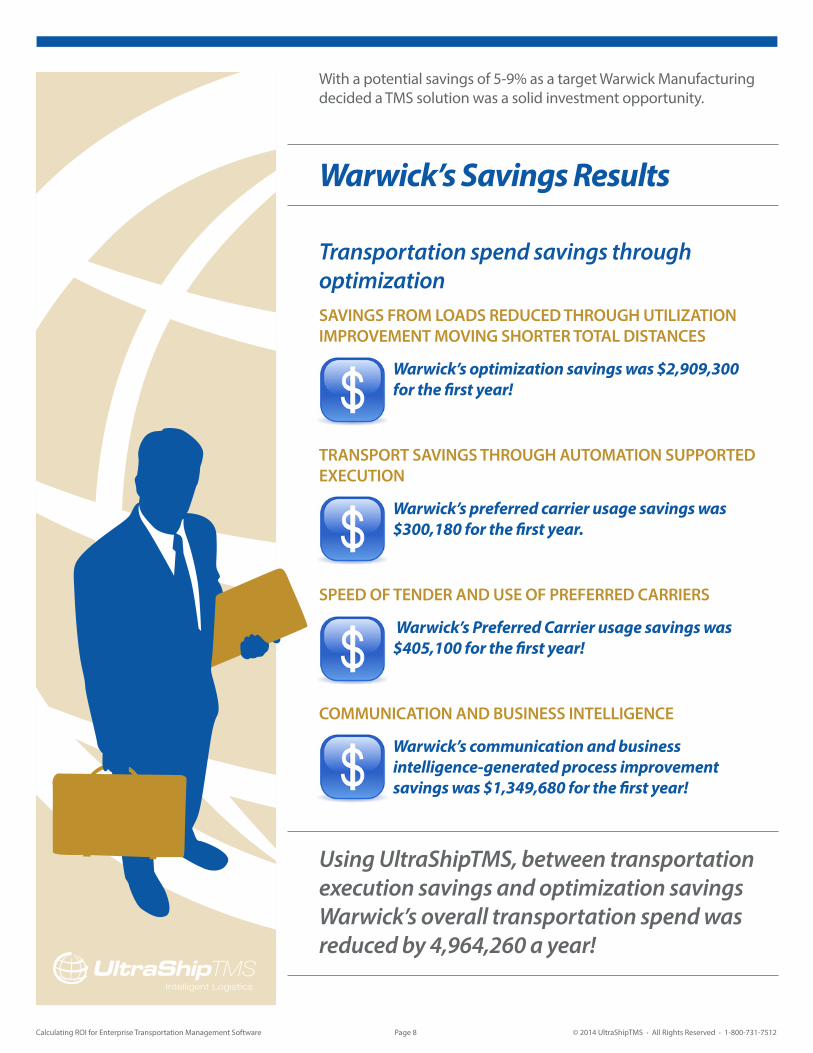
With a potential savings of 5-9% as a target Warwick Manufacturing decided a TMS solution was a solid investment opportunity.
Warwick’s Savings Results
Transportation spend savings through optimizationSAVINGS FROM LOADS REDUCED THROUGH UTILIZATION IMPROVEMENT MOVING SHORTER TOTAL DISTANCES
Warwick’s optimization savings was $2,909,300 for the first year!
TRANSPORT SAVINGS THROUGH AUTOMATION SUPPORTED EXECUTION
Warwick’s preferred carrier usage savings was $300,180 for the first year.
SPEED OF TENDER AND USE OF PREFERRED CARRIERS
Warwick’s Preferred Carrier usage savings was $405,100 for the first year!
COMMUNICATION AND BUSINESS INTELLIGENCE
Warwick’s communication and business intelligence-generated process improvement savings was $1,349,680 for the first year!
Using UltraShipTMS, between transportation execution savings and optimization savings Warwick’s overall transportation spend was reduced by 4,964,260 a year!
Calculating ROI for Enterprise Transportation Management Software Page 9 © 2014 UltraShipTMS • All Rights Reserved • 1-800-731-7512
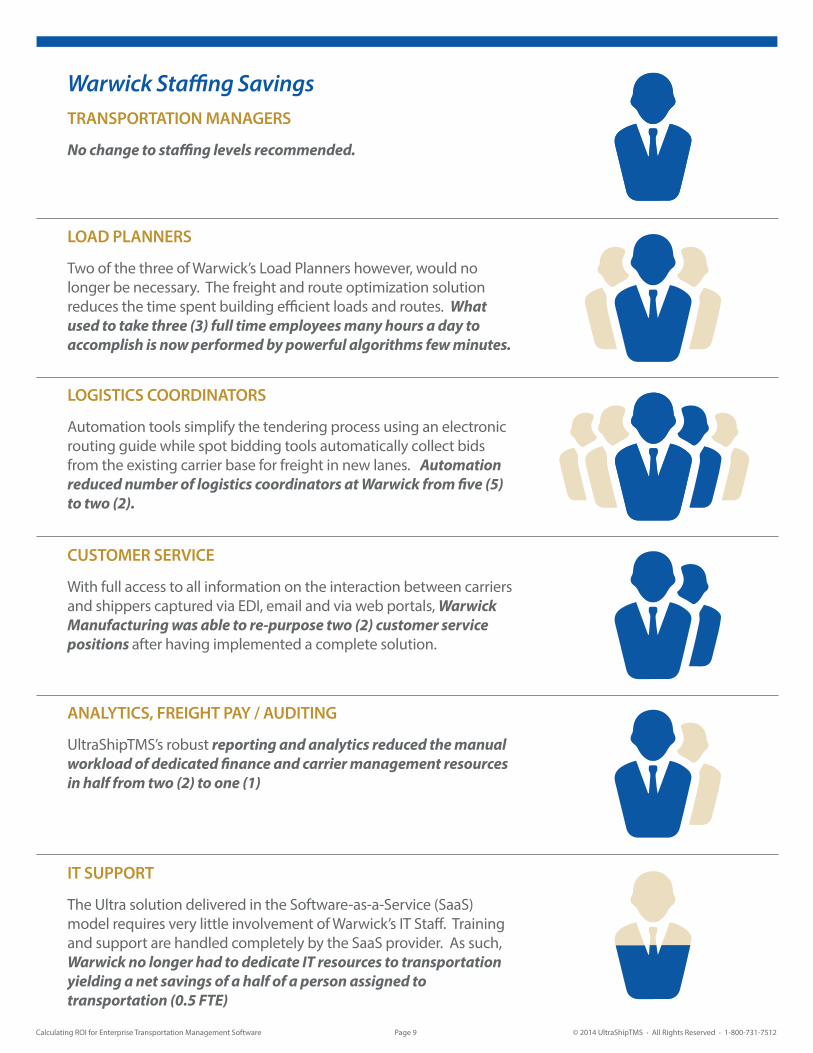
Warwick Staffing Savings TRANSPORTATION MANAGERS
No change to staffing levels recommended.
LOAD PLANNERS
Two of the three of Warwick’s Load Planners however, would no longer be necessary. The freight and route optimization solution reduces the time spent building efficient loads and routes. What used to take three (3) full time employees many hours a day to accomplish is now performed by powerful algorithms few minutes.
LOGISTICS COORDINATORS
Automation tools simplify the tendering process using an electronic routing guide while spot bidding tools automatically collect bids from the existing carrier base for freight in new lanes. Automation reduced number of logistics coordinators at Warwick from five (5) to two (2).
CUSTOMER SERVICE
With full access to all information on the interaction between carriers and shippers captured via EDI, email and via web portals, Warwick Manufacturing was able to re-purpose two (2) customer service positions after having implemented a complete solution.
ANALYTICS, FREIGHT PAY / AUDITING
UltraShipTMS’s robust reporting and analytics reduced the manual workload of dedicated finance and carrier management resources in half from two (2) to one (1)
IT SUPPORT
The Ultra solution delivered in the Software-as-a-Service (SaaS) model requires very little involvement of Warwick’s IT Staff. Training and support are handled completely by the SaaS provider. As such, Warwick no longer had to dedicate IT resources to transportation yielding a net savings of a half of a person assigned to transportation (0.5 FTE)

Calculating ROI for Enterprise Transportation Management Software Page 10 © 2014 UltraShipTMS • All Rights Reserved • 1-800-731-7512
Using a conservative assessment of the work eliminated at warwick due to automation, a total of 9.5 FTEs could be redeployed outside of transportation for a savings of $47,396 a month or:
Staffing Savings of $568,750 for the year!
Total Savings Driven By UltraShipTMS Warwick enjoyed first year savings well beyond the expectation of the initial assessment and they continue to derive benefit from the UltraShipTMS. Combining transportation and staffing savings,
Warwick saved a total of $5,533,010 a year!
Table 5
Manual Processes
Role ResourcesLoaded
SalaryTotal Annual
CostTransportation Manager 1 $84,500 $84,500Load Planner 3 $65,000 $195,000Dispatcher 5 $58,500 $292,500Customer Service 3 $45,500 $136,500Transportation Analyst 1 $65,000 $65,000Finance / Accounting 2 $65,000 $130,000IT Server Management 0.25 $84,500 $21,125IT Software Management 0.25 $84,500 $21,125IT Software Changes 0.25 $84,500 $21,125Carrier Procurement / Mgmt 1 $65,000 $65,000Total 16.75 $1,031,880
Automation Supported Execution
Resources Reduction Savings1 0 $01 2 $130,0002 3 $175,5001 2 $91,000
0.5 0.5 $32,5001 1 $65,0000 0.25 $21,125
0.25 0 $00 0.25 $21,125
0.5 0.5 $32,0007.25 9.5 $568,750
Note: The post-solution implementation roster shows the remaining tasks of Transportation Analyst and Carrier Procurement are combined into a single full time position.
Table 5 illustrates the complete labor costs and levels of effort for both the manual process and the alternative automated proces
In sum, the total transportation savings captured via Warwick Manufacturing’s optimization and automation equals $5.53 million a year or seven (6%) of their annual spend of $90 million.
Calculating ROI for Enterprise Transportation Management Software Page 11 © 2014 UltraShipTMS • All Rights Reserved • 1-800-731-7512
1 2 3Determine Existing Costs
Identify Savings Opportunities
Perform the Payback and Return Calculation
1 2 3Determine Existing Costs
Identify Savings Opportunities
Perform the Payback and Return Calculation
DETERMINEEXISTING COSTS
1
IDENTIFY SAVINGSOPPORTUNITIES
2
PERFORM THE PAYBACKAND RETURN CALCULATION
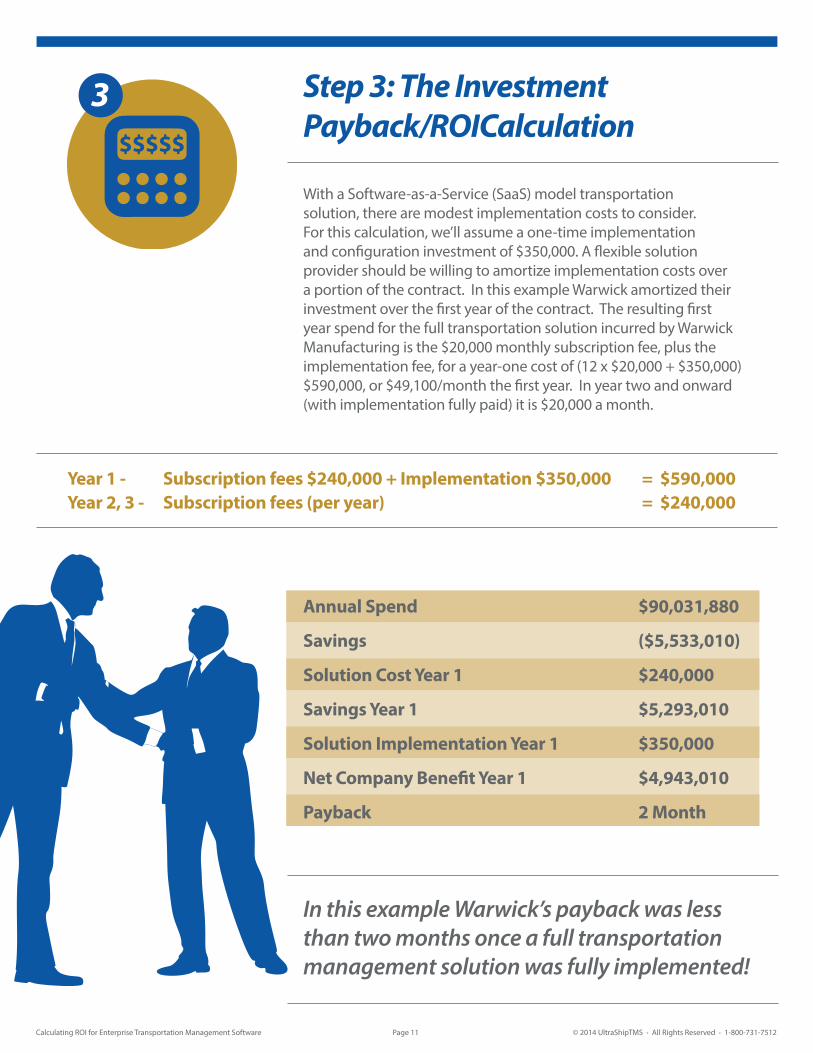
3 Step 3: The Investment Payback/ROICalculation
With a Software-as-a-Service (SaaS) model transportation solution, there are modest implementation costs to consider. For this calculation, we’ll assume a one-time implementation and configuration investment of $350,000. A flexible solution provider should be willing to amortize implementation costs over a portion of the contract. In this example Warwick amortized their investment over the first year of the contract. The resulting first year spend for the full transportation solution incurred by Warwick Manufacturing is the $20,000 monthly subscription fee, plus the implementation fee, for a year-one cost of (12 x $20,000 + $350,000) $590,000, or $49,100/month the first year. In year two and onward (with implementation fully paid) it is $20,000 a month.
Annual Spend $90,031,880
Savings ($5,533,010)
Solution Cost Year 1 $240,000
Savings Year 1 $5,293,010
Solution Implementation Year 1 $350,000
Net Company Benefit Year 1 $4,943,010
Payback 2 Month
In this example Warwick’s payback was less than two months once a full transportation management solution was fully implemented!
Year 1 - Subscription fees $240,000 + Implementation $350,000 = $590,000 Year 2, 3 - Subscription fees (per year) = $240,000
Calculating ROI for Enterprise Transportation Management Software Page 12 © 2014 UltraShipTMS • All Rights Reserved • 1-800-731-7512
ConclusionThis exercise should provide supply chain and finance leaders with an easy to understand and execute process for performing a savings and payback calculation. It is important to keep in mind that this example only took into account the more tangible drivers of savings – looking at hard costs that are more easily quantifiable, and thus, easier to consider. There are other “soft benefits” most companies also recognize. Together these can be a strong argument:
• Hard transportation savings between 7-15% • Tools to reduce manual staff workload • Global visibility and elimination of surprises • Business Intelligence (BI) for continuous improvement • SaaS scalability to support growth • Improved Transportation on-time delivery and customer service • Ease of implementation at minimal investment • Low monthly cost driving real savings and results
The case for powerful optimization and automation to manage transportation spend is strong. A proven low cost, easy-to-implement solution like UltraShipTMS can give you the tools to achieve these benefits.
Perform your own calculation to see how much your organization can save using UltraShipTMS. Visit our online savings calculator at www.UltraShipTMS.com/savings-calculator/ and plug in your own values to see the potential results you could achieve.
For more information or to arrange demonstration call (800) 731-7512 or visit www.UltraShipTMS.com.
1Salary statistics sourced: http://www.bls.gov/oes/current/oes113071.htm 2Savings statistics sourced: ARC Research’s Transportation Management Systems Global Market Research Study by Steve Banker
UltraShipTMS offers award winning software-as-a-service solutions to leading shippers in food production, packaging, retail and other industries. UltraShipTMS and the LoadFusion transportation optimizer provide a single-source solution for optimization, transportation and settlement for in- and out-bound shipping across all modes of transport. Built and supported by a brilliant team of transportation industry veterans and software developers, UltraShipTMS is an emerging leader in the supply chain management industry.
Visit us online: www.UltraShipTMS.com Call us toll-free: 1-800-731-7512