Embed Size (px)
Citation preview

Calculating the Return on Your Investment in Background Checks The True Cost and Financial Rewards
White Paper | Calculating Your ROI

IntroductionIs There Value?
The sheer number of employers using background screening as a final step in the recruiting process demonstrates the perceived importance of this best practice, with more than 89% of companies performing checks1. Given that so many companies include background screening in their HR process, some value is obviously being derived. But how much? Employers – both those who screen and those who don’t – would be wise to know how much a background screening program is actually worth.
What to Consider When Calculating Return
Most successful businesses track the financial impact of their expenses and investments to ensure that monies spent produce an appropriate rate of return. Human capital is often the largest expense on the balance sheet, accounting for close to 100% of expense in industries such as staffing. It’s also one of the most valuable assets – although the actual value can be harder to quantify.
Employers turn to tools like background screening to ensure they select the right assets to add to their teams. Effective background screening programs can help to improve employee retention, reduce the risk of workplace violence and minimize occupational fraud and theft. Unfortunately, these benefits are also often difficult to quantify. So when Human Resources is asked to justify the expense, how do they come up with a real number? Few people doubt that background screening is valuable, but just how valuable? Does it save employers hundreds, thousands, perhaps even millions of dollars?
In this paper, we’ll outline the key metrics that HR teams should consider when determining the value of background screening. We’ll also share a simple formula for calculating a return on the investment, including:
1. The rate and costs of employee turnover
2. The potential cost of violent employees
3. The financial impact of employee fraud and theft
Leveraging 40 years of knowledge and experience in background screening with enterprise and small businesses worldwide, Sterling Talent Solutions is well-positioned to shed some light on the financial impact of background screening on employers and to help quantify the benefits of this investment.
1 Sterling Talent Solutions Trends and Best Practices Report 2017
White Paper | Calculating Your ROI

100-250%
356,000
1 in 5
The average estimated cost of employee turnover per position, as a percentage of salary plus benefits
The number of violent workplace incidents across the 10 Canadian provinces in 20042
The share of incidents involving physical assault, sexual assault and robbery that occurred in the workplace3
Risks and Costs by the Numbers
2 Statistics Canada, General Social Survey on Victimization, 20043 Statistics Canada, Criminal Victimization in the Workplace, 20074 Association of Certified Fraud Examiners, Report to the Nations on Occupational Fraud & Abuse Global Fraud Study 2014
White Paper | Calculating Your ROI
White Paper | Calculating Your ROI
4 | © 2017 Sterling Talent Solutions | sterlingtalentsolutions.ca | 866.881.2011
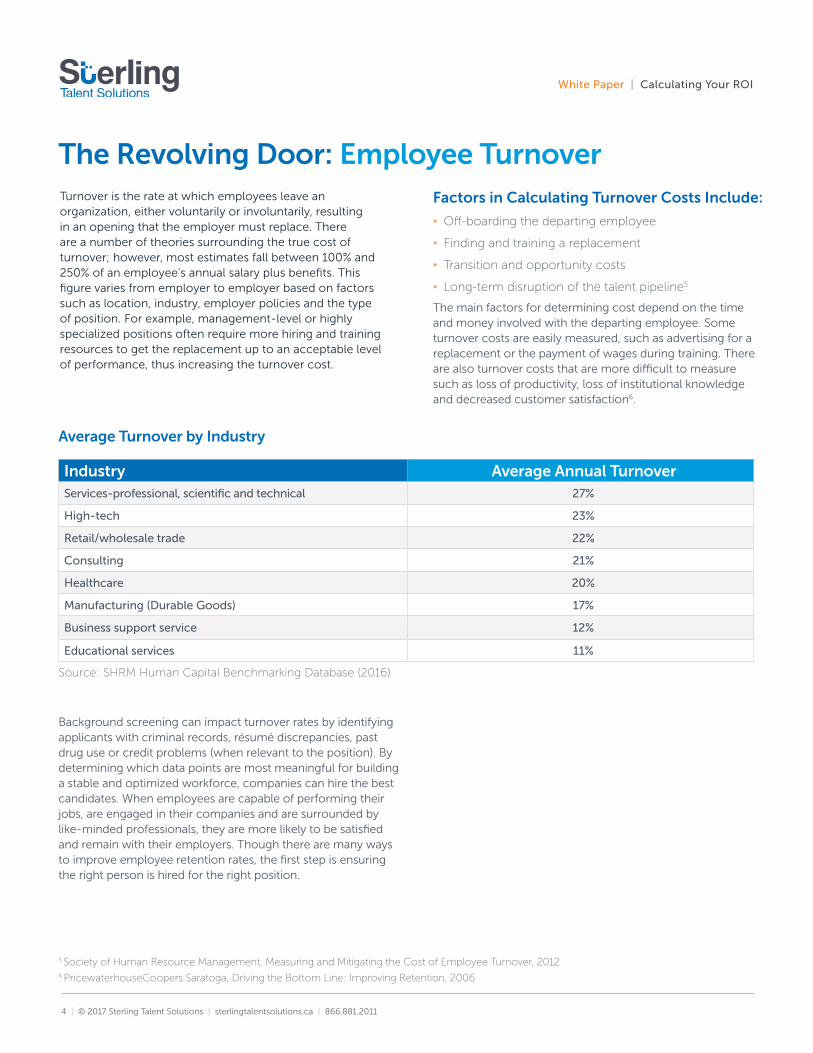
Turnover is the rate at which employees leave an organization, either voluntarily or involuntarily, resulting in an opening that the employer must replace. There are a number of theories surrounding the true cost of turnover; however, most estimates fall between 100% and 250% of an employee’s annual salary plus benefits. This figure varies from employer to employer based on factors such as location, industry, employer policies and the type of position. For example, management-level or highly specialized positions often require more hiring and training resources to get the replacement up to an acceptable level of performance, thus increasing the turnover cost.
Factors in Calculating Turnover Costs Include:
▪ Off-boarding the departing employee
▪ Finding and training a replacement
▪ Transition and opportunity costs
▪ Long-term disruption of the talent pipeline5
The main factors for determining cost depend on the time and money involved with the departing employee. Some turnover costs are easily measured, such as advertising for a replacement or the payment of wages during training. There are also turnover costs that are more difficult to measure such as loss of productivity, loss of institutional knowledge and decreased customer satisfaction6.
Background screening can impact turnover rates by identifying applicants with criminal records, résumé discrepancies, past drug use or credit problems (when relevant to the position). By determining which data points are most meaningful for building a stable and optimized workforce, companies can hire the best candidates. When employees are capable of performing their jobs, are engaged in their companies and are surrounded by like-minded professionals, they are more likely to be satisfied and remain with their employers. Though there are many ways to improve employee retention rates, the first step is ensuring the right person is hired for the right position.
Average Turnover by Industry
Industry Average Annual TurnoverServices-professional, scientific and technical 27%
High-tech 23%
Retail/wholesale trade 22%
Consulting 21%
Healthcare 20%
Manufacturing (Durable Goods) 17%
Business support service 12%
Educational services 11%
Source: SHRM Human Capital Benchmarking Database (2016)
The Revolving Door: Employee Turnover
5 Society of Human Resource Management, Measuring and Mitigating the Cost of Employee Turnover, 20126 PricewaterhouseCoopers Saratoga, Driving the Bottom Line: Improving Retention, 2006

White Paper | Calculating Your ROI
5 | © 2017 Sterling Talent Solutions | sterlingtalentsolutions.ca | 866.881.2011
Grim Stats: Workplace ViolenceAccording to Statistics Canada’s 2004 General Social Survey on Victimization, approximately 356,000 violent incidents – including sexual assault, robbery and physical assault – occurred in the workplace. The survey also found that workplace violence victims were also more likely to work in social assistance, health care, accommodation, food services and education.
These bleak statistics should be enough to convince any employer to take preventive measures to protect its teams. Workplace violence may be the harshest consequence of a bad hire, and its cost reaches far beyond litigation and turnover. A survey conducted by the Society for Human Resource Management asked participants which costs they incurred as a result of workplace violence. The chart below highlights the financial impact of workplace violence across a business.
Employees who commit violence against other employees often have a violent criminal past or a history of abusive behaviour in the workplace. A thorough criminal record check, verification of employment history and reference interviews with former supervisors can reveal potential risks and help employers protect their most valuable asset – their people.
Financial Impact of Workplace Violence
Management time/expense of being distracted from focusing on managing business operations 55%
Productivity loss (e.g., slower production) 37%
Staff replacement costs due to turnover caused by the incident 34%
Increased training expenses 31%
Increased security expenses 28%
Incident debriefing with affected employees 28%
Turnover-related expenses 27%
Increased communications cost (e.g., meetings, equipment) 27%
Increased legal expenses/higher utilization of legal staff 20%
Increased HR expenses 19%
Increased absenteeism 17%
Lawsuit-related expenses 15%
Temporary hiring costs 14%
Increased EAP/psychiatric services expenses 11%
Source: Society for Human Resource Management Survey Findings: Workplace Violence (February 29, 2012)

White Paper | Calculating Your ROI
6 | © 2017 Sterling Talent Solutions | sterlingtalentsolutions.ca | 866.881.2011
Employee fraud and theft is commonplace and most companies, regardless of size, encounter it to some degree. In the most extreme cases, it can take the form of corruption, asset misappropriation or financial statement fraud. Though many cases go undetected, the annual global cost of occupational fraud is estimated at more than $3.7 trillion7. Occupational fraud and theft is a problem that knows no borders, affecting employers around the world, as evidenced in these regional estimates of total loss per instance8.
RegionAverage Total Loss Per Fraud
Asia $1,500,000
Middle East $1,500,000
North America $1,200,000
Australia / New Zealand $1,100,000
Eastern Europe $1,000,000
According to the Association of Certified Fraud Examiners9, in 91% of fraud cases reported in 2016, the perpetrator displayed red flags: 45.8% were living beyond their means and 30% were experiencing financial difficulties. Credit checks on prospective employees can find these red flags and expose patterns of financial recklessness and instability. However, employers must be cautious when using credit history to determine an applicant’s suitability, and they should only do so when the applicant’s credit history is relevant to the job role (i.e., the person will be handling cash or will be in a position of financial authority). A few missed payments or sizeable debt should not necessarily be enough to prevent an applicant from gaining employment. The purpose of a credit check is to identify substantial issues with financial responsibility, such as an extensive history of collections, bad debt write-offs, bankruptcies or fraudulent banking.
Sticky Fingers: Occupational Fraud and Theft
7 Association of Certified Fraud Examiners, Global Fraud Study, 20148 KPMG, Who is the Typical Fraudster?, 20119 Association of Certified Fraud Examiners, Global Fraud Study, 2016
White Paper | Calculating Your ROI
7 | © 2017 Sterling Talent Solutions | sterlingtalentsolutions.ca | 866.881.2011
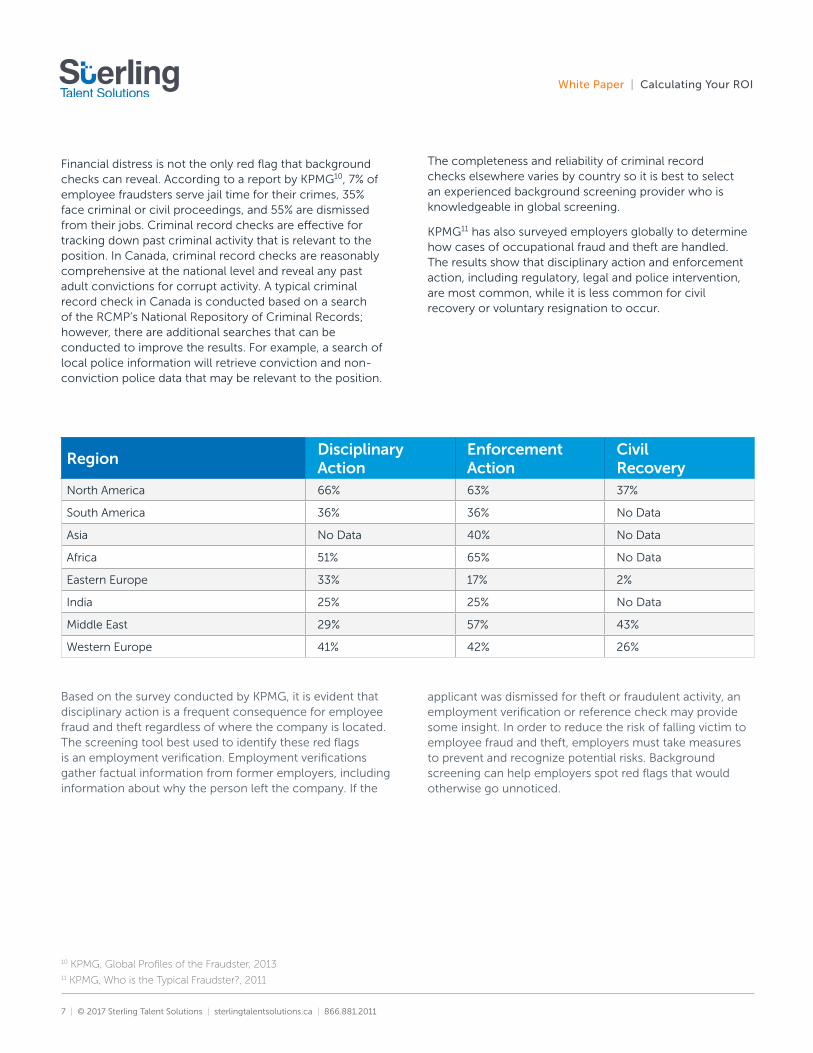
Financial distress is not the only red flag that background checks can reveal. According to a report by KPMG10, 7% of employee fraudsters serve jail time for their crimes, 35% face criminal or civil proceedings, and 55% are dismissed from their jobs. Criminal record checks are effective for tracking down past criminal activity that is relevant to the position. In Canada, criminal record checks are reasonably comprehensive at the national level and reveal any past adult convictions for corrupt activity. A typical criminal record check in Canada is conducted based on a search of the RCMP’s National Repository of Criminal Records; however, there are additional searches that can be conducted to improve the results. For example, a search of local police information will retrieve conviction and non-conviction police data that may be relevant to the position.
The completeness and reliability of criminal record checks elsewhere varies by country so it is best to select an experienced background screening provider who is knowledgeable in global screening.
KPMG11 has also surveyed employers globally to determine how cases of occupational fraud and theft are handled. The results show that disciplinary action and enforcement action, including regulatory, legal and police intervention, are most common, while it is less common for civil recovery or voluntary resignation to occur.
Based on the survey conducted by KPMG, it is evident that disciplinary action is a frequent consequence for employee fraud and theft regardless of where the company is located. The screening tool best used to identify these red flags is an employment verification. Employment verifications gather factual information from former employers, including information about why the person left the company. If the
RegionDisciplinary Action
Enforcement Action
Civil Recovery
North America 66% 63% 37%
South America 36% 36% No Data
Asia No Data 40% No Data
Africa 51% 65% No Data
Eastern Europe 33% 17% 2%
India 25% 25% No Data
Middle East 29% 57% 43%
Western Europe 41% 42% 26%
10 KPMG, Global Profiles of the Fraudster, 201311 KPMG, Who is the Typical Fraudster?, 2011
applicant was dismissed for theft or fraudulent activity, an employment verification or reference check may provide some insight. In order to reduce the risk of falling victim to employee fraud and theft, employers must take measures to prevent and recognize potential risks. Background screening can help employers spot red flags that would otherwise go unnoticed.

White Paper | Calculating Your ROI
8 | © 2017 Sterling Talent Solutions | sterlingtalentsolutions.ca | 866.881.2011
To calculate the financial contribution of background screening to your business, you should first determine which costs are relevant (i.e., turnover, workplace violence, occupational fraud). The real costs differ by company so you need to determine your specific costs.
Let’s Look at a Fictitious Company, Alpha Industries
Alpha Industries has 5,000 employees and a turnover rate of 37.5%, which results in annual hires of 1,950 employees. The company grows by 4% each year, adding an estimated 200 more employees annually for a total of 2,150 new hires. It takes Alpha Industries approximately three weeks to fill a vacancy and employees generate an average of $6,534.33 each in revenue per week.
A bad hire, which is considered to be an employee dismissed for theft, fraud or workplace violence, costs the company $25,840, or 75% of the average salary. Approximately 2% of hires are dismissed for these activities. Hiring a new employee costs the company $3,196 plus a background check, which costs $65 on average. Alpha Industries screens two applicants per position. If the company avoids bad hires and reduces its turnover rate by 15%, here is what its return on investment will look like:
Calculating The Return on Investment
Reduction of Turnover
(Hires x Turnover %) x [(Weeks to Replace x Average Revenue per Employee) + Hiring Cost] x Reduction in Turnover
= (2,150 x 37.5%) x [(3 x $6,534.33) + $3,196] x 15% = 806.25 x $22,798.99 x 15% = $2,757,252.85
Step 1: Calculate how much Alpha Industries will save by reducing its turnover by 15%:
Cost of Bad Hires
Hires x Cost of a Bad Hire x Percentage of Bad Hires
= 2,150 x $25,840 x 2% = $1,111,120.00
Step 2: Calculate how much Alpha Industries spends on bad hires:
Savings
Savings = Reduction of Turnover ($2,757,252.85) + Cost of Bad Hires ($1,111,120.00)
Savings = $3,868,372.85
Step 3: Calculate the savings achieved by implementing a background screening program:
White Paper | Calculating Your ROI
9 | © 2017 Sterling Talent Solutions | sterlingtalentsolutions.ca | 866.881.2011
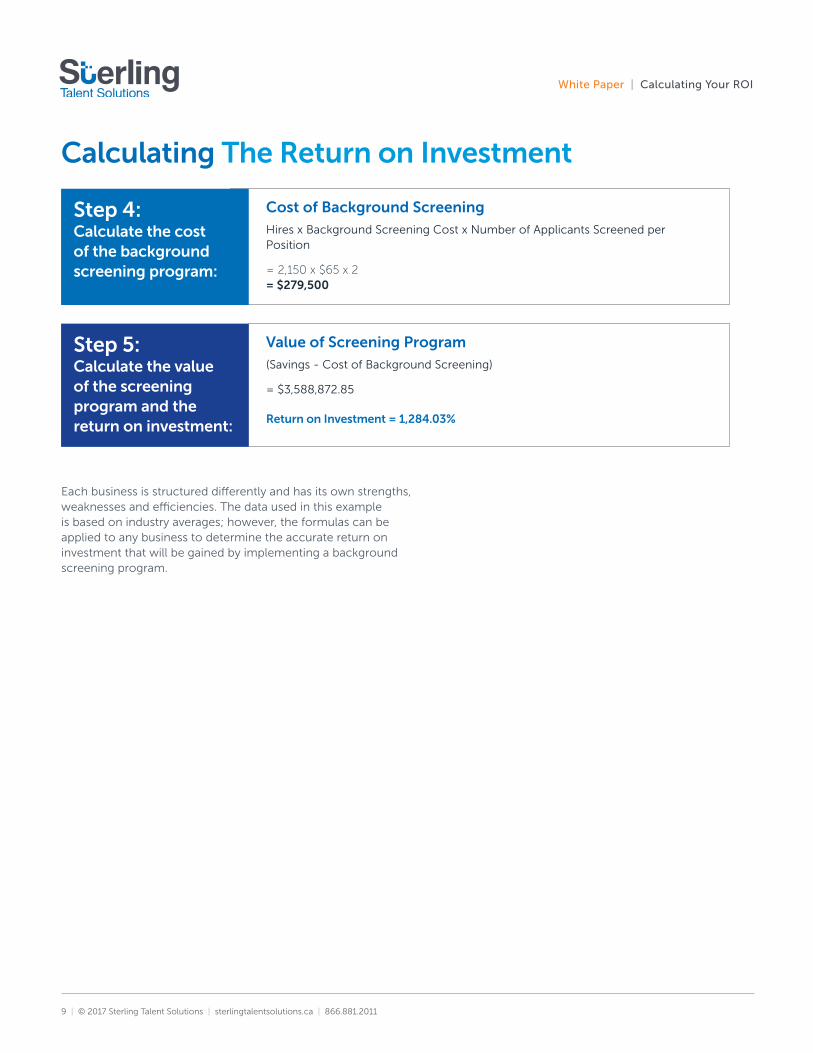
Cost of Background Screening
Hires x Background Screening Cost x Number of Applicants Screened per Position
= 2,150 x $65 x 2 = $279,500
Step 4: Calculate the cost of the background screening program:
Value of Screening Program
(Savings - Cost of Background Screening)
= $3,588,872.85
Return on Investment = 1,284.03%
Step 5: Calculate the value of the screening program and the return on investment:
Each business is structured differently and has its own strengths, weaknesses and efficiencies. The data used in this example is based on industry averages; however, the formulas can be applied to any business to determine the accurate return on investment that will be gained by implementing a background screening program.
Calculating The Return on Investment

White Paper | Calculating Your ROI
10 | © 2017 Sterling Talent Solutions | sterlingtalentsolutions.ca | 866.881.2011
ConclusionImplementing a background screening program makes financial sense when you consider the chain of events that can follow a bad or misinformed hire. The results of negligent hiring can be catastrophic and extremely costly for employers. This paper focused on turnover, workplace violence and occupational fraud and theft, but there are many other positive effects of background screening that cannot be accurately measured, including but not limited to, improved customer satisfaction, better performance and reduced absenteeism due to an engaged workforce. The many benefits of background screening make it clear that it is an investment well worth making.

About Us Sterling Talent Solutions, the world’s largest background screening provider, whose BackCheck business has been a market leader in Canada for over ten years, provides hiring peace of mind by delivering a simpler, smarter background screening experience for employers worldwide. Our comprehensive suite of background screening solutions deliver accurate, reliable results and tools to maintain compliance throughout the hiring cycle.
With 20 offices in nine countries and growing, our team of more than 4,000 employees proudly serves over 30,000 customers around the world, including 25% of the Fortune 100. Sterling is accredited by the National Association of Professional Background Screeners (NAPBS), a distinction earned by fewer than 10% of all background screening companies.
Want More? In addition to this report, Sterling regularly publishes cutting-edge research and insight on the latest trends in human resources, talent management and hire processing.
For more information, contact us at:
sterlingtalentsolutions.ca
866.881.2011
© 2017 Sterling Talent Solutions1659-CA-EN
The information contained in this document should not be relied or acted upon without first seeking the advice
of a competent legal adviser. Sterling Talent Solutions shall not be liable for any damages resulting from any
use of the information contained in this document.