Embed Size (px)
Citation preview

CALCULATING CRITICAL LOADS OF ACID DEPOSITION FOR FOREST SOILS IN
MANITOBA AND SASKATCHEWAN
Final Report: Data Sources, Critical Load, Exceedance and Limitations
Julian Aherne and Shaun A. Watmough Environmental and Resource Studies, Trent University
Peterborough, Ontario K9J 7B8 www.trentu.ca/ecosystems
August, 2006
PN 1372 DISCLAIMER: This report was prepared by Julian Aherne of Trent University, under contract to the Canadian Council of Ministers of the Environment (CCME) and is a working paper only. It contains information which has been prepared for, but not approved by, CCME. CCME is not responsible for the accuracy of the information contained herein and does not warrant, or necessarily share or affirm, in any way, any opinions expressed therein.

i
Project Title: Calculating Critical Loads of Acid Deposition for Forest Soils in Manitoba and Saskatchewan (MANISASK) Report Title: Data Sources, Critical Load, Exceedance and Limitations (Final
Report) Project Leader: Julian Aherne Scientific Team Members Dr Julian Aherne Canada Research Chair
Environmental and Resource Studies Trent University, Peterborough, Ontario K9J 7B8 Telephone: (705) 748-1011 x5351 E-mail: [email protected]
Dr Shaun A. Watmough Environmental and Resource Studies Trent University, Peterborough, Ontario K9J 7B8 Telephone: (705) 748-1011 x1647 E-mail:[email protected]
Progress Report: Final Report August, 2006 © Canadian Council of Ministers of the Environment 2006

ii
Acknowledgements This report has benefited from fruitful discussion with many individuals in relation to data sources and methodologies. Furthermore, many of these individuals represent organisations that contributed data. The following is an attempt to list individuals (and organisations) that have contributed time, energy and data; their contribution is gratefully acknowledged (apologies to those who I may have accidentally omitted). Contributors: Mike Shaw, Bob Vet and Mike Moran (Environment Canada, Science and Technology Branch), Max Posch (Co-ordination Centre for Effects, The Netherlands), Brian Moneith and David Kroetsch (Agriculture and Agri-food Canada), Lawrence Cheng and Preston McEachern (Alberta Environment), Cathy Jacques and Heather Evans (Alberta Sustainable Resource Development), Anthony Trofymow and Brian Titus (Canadian Forest Service, Victoria), Barbara Kishchuk and Cindy Shaw (Canadian Forest Service, Edmonton), Dan McKenney (Canadian Forest Service, Sault Ste. Marie), Ian DeMerchant (Canadian Forest Service, Fredricton), Robert Garrett and Rodney Klassen (Geological Survey of Canada), Paul Lenton (Manitoba Geoscience Information Services), Dave Bezak, Geoff Jones and Patricia Hurlburt (Manitoba Conservation), Rock Ouimet (Quebec Ministère des Resources Naturelles), Karen Zhou (Ontario Ministry of Natural Resources), Dean Jeffries and Isaac Wong (National Water Research Institute), Bill Slimmon (Northern Geological Survey, Saskatchewan), Michael McLaughlan (Saskatchewan Environment, Forest Service), Murray Hilderman (Saskatchewan Environment) and David Walker (University of Manitoba). Data sources: Canadian National Atmospheric Chemistry (NAtChem) Precipitation Database and its data contributing agencies (precipitation chemistry), Co-ordination Centre for Effects (long-term precipitation, temperature and runoff), Agriculture and Agri-Food Canada (Soil Landscapes of Canada and the National Ecological Framework), United States Geological Survey and Canada Centre for Remote Sensing (land cover), Environment Canada, Science and Technology Branch (deposition fields, and Acid Deposition and Oxidant Model data), Alberta Environment (REgional Lagrangian Acid Deposition model data), Geological Survey of Canada (Geochemical Landscapes project), Northern Geological Survey, Saskatchewan, and Geoscience Information Services, Manitoba (surfacial and bedrock geology), National Water Research Institute (runoff), Canadian Forest Service, Sault Ste. Marie (long-term precipitation, temperature and potential evaporation) and Canadian Forest Service (forest soil data from various national networks and projects: Canadian Intersite Decomposition Experiment, Soil Profile and Organic Carbon Database, ARNEWS, Forest Carbon Database). Funding source: Canadian Council of Ministers of the Environment INC. (CCME: Contract number 367-2006).

iii
Acronyms ADOM Acid Deposition and Oxidant Model AURAMS A Unified Regional Air quality Modelling System CAPMoN Canadian Air and Precipitation Monitoring Network CL Critical load EC Environment Canada ELA Experimental Lakes Area EXC Exceedance FEC Forest Ecosystem Classification GIS Geographical Information System ICPM&M International Co-operative Programme on Modelling and Mapping of Critical
Loads (and Levels) and Air Pollution Effects, Risks and Trends LRTAP Long-Range Transboundary Air Pollution LUC Land Use Categories N Nitrogen NAD North American Datum NEG-ECP New England Governors-Eastern Canadian Premiers NFI National Forest Inventory Q Precipitation surplus or runoff RELAD REgional Lagrangian Acid Deposition S Sulphur SLC Soils Landscape of Canada SSMB Steady-State Mass Balance UNECE United Nations Economic Commission for Europe UTM Universal Transverse Mercator Units. Where possible, data have been reported using the International System of Units (SI). Critical load and exceedance data are reported using the units molc ha–1 yr–1 (note the subscript ‘c’ refers to moles of charge). A corresponding and somewhat archaic term still commonly used is equivalence (eq): eq = molc. The units of molc ha–1 yr–1 are compatible with the critical load estimates presented in the recent Canadian Acid Deposition Science Assessment (Environment Canada 2004). Map legends. In a regional context, weathering rate (and associated critical load) can span several orders of magnitude, with higher values typically representing soils with high buffering capacities (i.e., not acid sensitive). As such, critical load maps have been reported using unequal intervals with smaller category intervals for the lower (more acid sensitive) data values: < 250, 250–500, 500–1000, 1000–2000 and 2000 molc ha–1 yr–1. Coincidentally, the first class (< 250 molc ha–1 yr–1) spans the range for sulphate deposition across Manitoba and Saskatchewan and the second class (250–500 molc ha–1 yr–1) spans the range of sulphate plus nitrate deposition.

iv
Table of Contents
Executive Summary ..........................................................................................................1 1. Introduction ...................................................................................................................2 3. Background...................................................................................................................5
3.1. The Critical Load Concept ......................................................................................5 3.2. Applying the Critical Load Concept.........................................................................5 3.3. Mapping Critical Loads ...........................................................................................6
4. The Steady-State Mass Balance Model........................................................................8 5. Model Inputs and Data Sources..................................................................................10
5.1. Base Cation and Chloride Deposition...................................................................11 5.2. Base Cation Weathering.......................................................................................13 5.3. Base Cation Uptake..............................................................................................15 5.4. Nitrogen Immobilisation, Uptake and Denitrification .............................................16 5.5. Critical Alkalinity Leaching ....................................................................................17 5.6. Sulphur and Nitrogen Deposition..........................................................................17
6. Critical Load and Exceedance for Manitoba and Saskatchewan ................................21 6.1. Introduction ...........................................................................................................21 6.2. Model Inputs for Manitoba and Saskatchewan.....................................................21 6.3. Critical Loads for Manitoba and Saskatchewan....................................................23 6.4. Exceedance for Manitoba and Saskatchewan......................................................25
7. Further Considerations and Uncertainties...................................................................29 7.1. Receptor Ecosystems...........................................................................................29 7.2. Soil Data Resolution .............................................................................................30 7.3. Regional Deposition Estimates.............................................................................32 7.4. Uncertainties Associated with EC Deposition Fields ............................................33
8. Conclusion ..................................................................................................................37 9. Recommendations ......................................................................................................38 References......................................................................................................................40 Appendix I .......................................................................................................................42 Appendix II ......................................................................................................................52 Appendix III .....................................................................................................................54 Appendix IV.....................................................................................................................55 Appendix V......................................................................................................................61

1
Executive Summary Critical load and exceedance of sulphur and nitrogen have been determined and mapped for upland forest soils in Manitoba and Saskatchewan. For consistency with eastern Canada, the methodology followed the protocol and guidelines established by the New England Governors-Eastern Canadian Premiers. The Soil Landscapes of Canada (SLC, version 2.1) was the principal database underlying the estimation of weathering rate and subsequent critical load determination. Although the SLC is the highest resolution soil coverage available for Manitoba and Saskatchewan, the scale is somewhat coarse (scale 1:1,000,000). However there was general (visual) agreement in the location of acid sensitive soils between the SLC and more detailed municipal soil surveys (for southern Manitoba). Total (wet and dry) atmospheric deposition for Manitoba and Saskatchewan were provided by Environment Canada. These estimates represented an important contribution to the project and significant ‘new’ data for both provinces. They are the first maps of total deposition for all major ions in precipitation for Manitoba and Saskatchewan; further, they are consistent with the annual average wet and dry deposition fields (1994–1998) recently developed for eastern Canada and used in the eastern Canada critical load assessment. The mean critical load for Manitoba and Saskatchewan was estimated at 1259 and 1151 molc ha–1 yr–1, respectively. Mean annual total sulphate and nitrogen deposition was 145 and 211 molc ha–1 yr–1 for Manitoba and 152 and 163 molc ha–1 yr–1 for Saskatchewan for the period 1994–1998. Approximately 7% of the mapped soils received acid deposition in excess of critical load in Manitoba and 2% in Saskatchewan. It could be argued that the current estimates of exceedance are somewhat conservative. At best, the mapped soil information, which underlies the critical load estimates, represent the ‘average’ soil. In reality, there is considerable variability within each soil mapping unit. This is supported by point observations, which show considerable variation within each mapping unit. In addition, the spatial interpolation of wet deposition and air concentrations over western Canada was based on limited measurement sites and it is likely that some of the spatial structure in the deposition fields was missed. As such, the estimated deposition may potentially be conservative. The critical load and exceedance estimates, similar to those for eastern Canada, represent a broad-scale regional assessment and are not intended for site-specific assessments. Furthermore, the estimates should be viewed somewhat as a starting point in the critical load process and not the end-point. The methodology followed the protocol and guidelines established by the New England Governors-Eastern Canadian Premiers. However, it is recognised that the underlying databases and their spatial resolution vary greatly between provinces leading to inconsistencies in the resultant maps across Canada. To meet this limitation of the current approach it is highly recommended that an alternative ‘soil point’ approach be developed to estimate critical load and exceedance for upland forest soils. The approach would further allow for greater consistency and integration with critical load estimates for surface waters. In addition, the approach would provide a framework for future dynamic modelling assessments.

2
1. Introduction The impact of acid deposition on biota is sufficiently understood such that critical thresholds aimed at protecting aquatic or terrestrial biota have been established as the basis for international agreements on sulphur (S) and nitrogen (N) emission reductions. These chemical thresholds are converted, with the aid of (steady-state) models, into critical loads. Critical load, defined as “a quantitative estimate of an exposure to one or more pollutants below which significant harmful effects on specified sensitive elements of the environment do not occur according to present knowledge”, have been widely accepted in Europe as a basis for the development of effects-based air pollution control strategies, as evidenced by the Oslo Protocol (1994 Protocol on Further Reduction of Sulphur Emissions) and the Gothenburg Protocol (1999 Protocol to Abate Acidification, Eutrophication and Ground-level Ozone). In October 1998, Canadian Energy and Environment Ministers signed The Canada-Wide Acid Rain Strategy for Post-2000, in which they committed to take steps over the long-term to solve the acid rain problem in eastern Canada and prevent one in western and northern Canada. The Strategy set a long-term goal of achieving the threshold of critical loads for acid deposition across Canada. Critical loads and current exceedances have been determined and mapped for upland forests in eastern Canada (Newfoundland, Prince Edward Island, Nova Scotia, New Brunswick, Quebec and Ontario) following guidelines established by the New England Governors-Eastern Canadian Premiers (NEG-ECP) Environmental Task Group on Forest Mapping (NEG-ECP 2001). In contrast, in western Canada (excluding Alberta) critical loads have not been mapped, although localised efforts have been carried out, or are underway, in Ester-Provost , Alberta (Turchenek and Abboud 2001), the Oil Sands Region, Alberta and the Georgia Basin, British Columbia. A level 0 approach, based on soil sensitivity, has previously been used to estimate critical loads for Alberta (CASA 1999). In August 2005, Trent University initiated an eight month project funded by the Canadian Council of Ministers of the Environment (CCME) to determine and map critical loads of acid deposition (and exceedances) for upland forest soils in Manitoba and initiate work in Saskatchewan. For consistency with eastern Canada, the methodology followed the protocol and guidelines established by the NEG-ECP. However, it was recognised that the underlying databases and their spatial resolution vary greatly between provinces leading to inconsistencies in the resultant maps. Therefore, a secondary objective of the proposed project was to identify a framework for Canada-wide determination and mapping of critical loads (acidity) using consistent databases and methodologies. An interim report describing the available data sources (and their limitations) required to meet the goals of the project was submitted to the CCME during October 2005 (Aherne and Watmough, 2005a). This final report incorporates much of the interim report (Sections 1, 2 3, 4 and 5) and further presents maps of critical load (sulphur and nitrogen) and exceedance for Manitoba and Saskatchewan (Sections 6, 7, 8 and 9). Additional to the Terms of Reference, critical load and exceedance have been determined and mapped for Saskatchewan. Furthermore, the report presents ‘new’ total

3
(wet and dry) deposition fields for Manitoba and Saskatchewan. Shortly after the initiation of the project, Environment Canada (EC) agreed to generate total deposition fields for Manitoba and Saskatchewan consistent with the fields recently developed for eastern Canada and used in the eastern Canada critical load assessment (Environment Canada 2004). This represented an important and essential input to the project, which effectively allowed for a more comparable approach between western (Manitoba and Saskatchewan) and eastern Canada. A detailed discussion of the deposition fields is beyond the scope of this report. The critical load and exceedance maps, similar to those for eastern Canada, represent a broad-scale regional assessment of critical loads of sulphur and nitrogen for upland forest soils and are not intended for site-specific assessments.

4
2. Objective The principal objective of this report was to describe the determination and mapping of critical load and exceedance for Manitoba and Saskatchewan. Further, the report attempts to identify scientific gaps, uncertainties and recommend possible future work to address limitations. A secondary objective was to identify a framework for Canada-wide determination and mapping of critical loads using consistent databases and methodologies. The principal task was to generate or acquire spatial data-sets (base maps) of the input variables required to calculate critical loads for Manitoba and Saskatchewan, using methodologies consistent with the approach in eastern Canada. This final report incorporates the interim report which assessed the availability and quality of data required for the determination and mapping of critical loads for Manitoba and Saskatchewan. In addition, the interim report focused on data limitations and potential solutions. The methodology (based on the available data) used in the current report was proposed in the interim report. A brief background on the critical load concept is presented (Section 3). This is followed by a general description of the NEG-ECP methodology for estimating critical loads for upland forest soils (Section 4) and a detailed description of regional data inputs and their sources (Section 5). Finally, critical load (sulphur and nitrogen) and exceedance maps for Manitoba and Saskatchewan are presented, with recommendations for future research (Sections 6, 7 and 9).

5
3. Background 3.1. The Critical Load Concept The critical load approach is a well-established element of the work programme of the United Nations Economic Commission for Europe (UNECE) Convention on Long-Range Transboundary Air Pollution (LRTAP). This work programme includes the production of maps of critical loads and their exceedances as a basis for developing effects-based abatement strategies for transboundary air pollutants. Under the Convention, an International Co-operative Programme on Modelling and Mapping of Critical Loads (and Levels) and Air Pollution Effects, Risks and Trends (ICPM&M) was established to develop methods to compute and map the sensitivity of ecosystems to air pollution and their exceedances. The ICPM&M have produced and updated the ‘Manual on Methodologies and Criteria for Modelling and Mapping Critical Loads (and Levels) and Air Pollution Effects, Risks and Trends’ (UBA 1993, UBA 1996, UBA 2004). This manual provides the scientific basis for determining and mapping critical loads, and mapping areas where air pollution values exceed critical loads. The manual identifies three levels of sophistication for the determination of critical loads: • Level 0: semi-quantitative approach based on allocating critical load ranges to
sensitive receptor ecosystems. • Level I: quantitative approach using time-independent steady state chemical
interactions between the soil solid phase and solution. • Level II: dynamic modelling approach to assess the time required to reach steady
state. A level I approach has been predominantly used to determine and map critical loads for upland forests in eastern Canada (Environment Canada 2004). Level I approaches are based on steady state mass balance methods; that is, they assume that equilibrium of major chemical processes has been achieved. For example, a standard level I mass balance approach for acidity of forest soil would identify the sources of acidity and alkalinity in the system and determine the maximum acid input that will balance the system at a specified critical limit for the selected chemical criterion (see Section 3.2). These fluxes of ions are usually based on long-term averages. The advantage of level I methods is that they can take into account processes that less sophisticated methods do not, such as acidity in the soil-plant system resulting from net uptake of base cations, or the neutralising effect of atmospheric inputs of calcium (Ca2+) and magnesium (Mg2+). The ICPM&M mapping manual (UBA 1993, UBA 1996, UBA 2004) is an essential reference for the application, determination and mapping of critical loads; and, as such, has been heavily relied upon and referenced throughout this report. The scientific basis and methodology applied by the NEG-ECP is directly based on ICPM&M approach. 3.2. Applying the Critical Load Concept The linking of ecosystem response to deposition level is the central principle of the critical load approach. In order to apply the concept, four elements need to be defined:

6
• Receptor: the ecosystem under consideration, such as surface waters, forest soils or groundwater.
• Biological indicator: the organism selected to represent the receptor, such as fish (surface waters), the forest stand (forest soils), or humans (groundwater).
• Chemical criterion: the chemical measure affected by atmospheric deposition (or concentration) that is used to predict the risk of damage to the biological indicator.
• Critical limit: the most unfavourable value that the chemical criterion may attain without long-term harmful effects to ecosystem structure and function (these effects are identified by damage to the biological indicator).
For each receptor ecosystem, a biological indicator is chosen. A suitable chemical criterion is selected for that biological indicator and a critical chemical limit is assigned. By using appropriate methods, a maximum value of atmospheric deposition (critical load) is calculated at which the critical limit will not be exceeded. In this way, ecosystem response is linked to atmospheric inputs. Regions where the current atmospheric deposition is greater than the critical load are termed ‘exceeded’. The critical load concept is strongly linked to sustainable management, since exceedances of critical loads are not, by definition, sustainable in the long-term. 3.3. Mapping Critical Loads Since critical load determinations are linked to an area representing one (or more) ecosystems, they are best represented as maps. Map-based data can be very efficiently handled with a Geographical Information System (GIS), which is an assembly of computer hardware and software designed to store, manipulate and display spatially referenced information. Most GIS use one of two primary formats for representing map data in digital form: a vector (polygon); or raster (grid cell) format. In vector systems, features are defined by a series of points, which, when joined with straight lines, form the outlines of the features. Soil maps are generally available as vector maps. In raster-based GIS, the data layer is subdivided into a fine mesh of grid cells onto which the attribute of the point is recorded. In this way, each cell is given a numeric value that represents the mapped feature. Land cover, climate and deposition maps are usually provided as raster maps. A large part of any mapping project consists of gathering and transforming data into the correct data type (primary base maps). In addition, secondary base maps may also be generated from interpolation of measured point data using surface mapping; or reclassification and overlay of primary base maps in a GIS. The principal task in the current project is to generate or acquire spatially consistent maps of the input variables required to calculate critical loads for Manitoba and Saskatchewan. Unlike atmospheric deposition (where spatial patterns may be defined using a small number of monitoring stations), soil attributes vary greater over short distances and are notoriously difficult to map. As such, critical load mapping generally relies on available soil maps, with observations from networks unable to describe provincial-scale spatial patterns. Coarse scale input maps ultimately reduce the accuracy of the final maps; however, point measurements may potentially be used for comparison and to gain confidence in the resultant maps. In eastern Canada, regional weathering rate maps were primarily derived from the highest resolution soil maps available for each province, with the exception of Quebec. Approximately 6000 measurements were

7
available from forest soil plots throughout Quebec; these were classified by sub-ecological region to generate a provincial weathering rate map.

8
4. The Steady-State Mass Balance Model The determination of critical load for upland forest soils in Manitoba and Saskatchewan followed the methodology and guidelines established by the NEG-ECP (which largely follows the ICPM&M protocol). Long-term critical load of S and N to upland forest soils was estimated using the Steady-State Mass Balance (SSMB) model. The SSMB model assumes a simplified, steady state input-output description of the most important biogeochemical processes that affect soil acidification. Potential ecosystem inputs include atmospheric deposition of sulphate (SO4
2–), N (nitrate and ammonium), chloride (Cl–), sodium (Na+), Ca2+, Mg2+ and potassium (K+); soil base cation weathering rate; and nitrogen fixation. Ecosystem outputs and consumption include net removal of nutrients by forest harvesting; nutrient loss through soil leaching; nitrogen denitrification; and nitrogen immobilisation. The SSMB model described in detailed by the ICPM&M (UBA 2004) estimates critical load of sulphur, CL(S), and nitrogen, CL(N): (4.1) critledeuiuwdepdep AlkNNNBcBCClBCNCLSCL ,
**)()( −+++−+−=+ where BCdep = base cation (BC = Ca2+ + Mg2+ + K+ + Na+) deposition, Cldep = Cl– deposition, BCw = base cation weathering, BcU = net base cation (Bc = Ca2+ + Mg2+ + K+) uptake by trees (harvesting removal), Ni = net N immobilisation rate in soil, Nu = net N uptake by trees, Nde = net denitrification rate, and Alkle,crit = critical alkalinity leaching rate. The asterisk denotes sea-salt corrected depositions. Units are in molc ha–1 yr–1. This formulation has been rewritten by the NEG-ECP to estimate the long-term critical loads of sulphur and nitrogen CL(S+N): (4.2) critledeuiuwdepdep AlkNNNBcBCClBCNSCL ,
**)( −+++−+−=+ Under the NEG-ECP protocol, harvesting removals were not considered in the calculations; therefore, long-term net uptake of N and base cations were set to a value of zero. Similarly, long-term net denitrification was considered negligible in well-drained upland forest ecosystems. The net N immobilisation in soils was also assumed to be negligible in the long-term since this process can be negative or close to zero with stand dynamics and natural disturbances such as fire (NEG-ECP 2001). The final model applied by the NEG-ECP to eastern Canada can therefore be simplified to: (4.3) critlewdepdep AlkBCClBCNSCL ,
**)( −+−=+ The critical alkalinity leaching rate for forest soils is estimated from a critical molar base cation to (inorganic) aluminium (Bc:Al) ratio in soil leachate and the gibbsite dissolution constant (Kgibb) which controls aluminium solubility in mineral soils (UBA 2004):
(4.4) crit
uwdep
critgibb
uwdepcritle AlBc
BcBcBcAlBcK
BcBcBcQAlk
):(5.1
):(5.1
3/13/2
,−+
⋅−⎟⎟⎠
⎞⎜⎜⎝
⎛
⋅
−+⋅⋅−=
where Q is soil runoff rate or precipitation surplus (m3 ha–1 yr–1), The NEG-ECP protocol used a Bc:Al ratio of 10, a log Kgibb of 9.0 and Bcu = 0 (as above); Kgibb is expressed as m6 molc–2.

9
Exceedance (EXC) of steady-state critical load of sulphur and nitrogen to upland forest soils, is calculated as the current deposition flux of SO4
2– plus N (nitrate plus ammonium) minus critical load: (4.5) EXC = S*
dep + Ndep – CL(S + N) where Sdep = SO4
2– deposition and Ndep = N deposition. Units are in molc ha–1 yr–1 and negative exceedance values represent regions that are ‘not exceeded’, i.e., soils will not acidify to a level where forest soil damage is expected.

10
5. Model Inputs and Data Sources The obvious sources of input data for calculating critical loads are measurements at the site under consideration. In many cases these are not available, especially when determining critical loads across large regions (Provinces). However, generalised information is usually available in the form of regional maps at the provincial to national scale. Mapped data-sets are obviously subject to a number of limitations, such as the available resolution of the information; in general, greater regional coverage is usually synonymous with a more coarse resolution of information. In addition, in some instances the required information may not be available and has to be inferred from other regionally available data-sets. Numerous point and spatial data-sets were acquired and collated from various agencies during the initial project period. These data-sets cover a broad-range of data types for the provinces of Manitoba and Saskatchewan. The principal data-sets acquired were: long-term precipitation chemistry (NatChem, EC), regional soil maps (Soil Landscapes of Canada (SLC), Agriculture and Agri-Food Canada), ecodistrict maps (National Ecological Framework, Agriculture and Agri-Food Canada), forest soil measurements from multiple national-scale networks and data compilations (Canadian Forest Service (CFS)), soil total content analysis (Geological Survey of Canada), long-term climate (precipitation and temperature) normals (CFS; Co-ordination Centre for Effects, The Netherlands), land cover maps (United Status Geological Survey and Canada Centre for Remote Sensing), runoff (National Water Research Institute) and Forest Ecosystem Classification (FEC) and National Forest Inventory (NFI) data (Saskatchewan Environment and Manitoba Conservation). Although many of the data-sets are not directly relevant to regional-scale determination of critical load, it is anticipated that they will be used to ‘ground truth’ or ‘gain confidence’ in the provincial maps. The model inputs required for the determination of critical loads of S and N for upland forests in Manitoba and Saskatchewan are described in detail in the following sections. It is important to note that critical loads are restricted to natural or semi-natural receptor ecosystems. In the current project, critical load was estimated for upland forest ecosystems. In contrast to eastern Canada, much of Manitoba and Saskatchewan is agricultural (crop) land (see Figure 1). The description of model inputs and discussion of data sources in the following section is limited to upland forest ecosystems. Although, in general, many of the data sources are provincial or national scale maps, their suitability is only considered in relation to upland forest ecosystems. The discussion is primarily focused on the minimal-set of model inputs required to determine and map critical loads of acid deposition (and exceedances) for upland forest soils in Manitoba and Saskatchewan following the NEG-ECP protocol (Equations 4.3 to 4.5); however, the discussion has been extended to included other important ecosystem inputs. Although largely excluded by the NEG-ECP protocol, a brief discussion on N model inputs is presented in the following section, further details can be found in Hornung et al. (1995) and UBA (2004).

11
Figure 1. Map showing land cover for Manitoba and Saskatchewan. The forested regions in the north (green and purple) are clearly distinct from the agricultural regions in the south. 5.1. Base Cation and Chloride Deposition The base cation and chloride depositions used in the critical load calculation should be the deposition after all feasible abatement measures have been taken (ideally the non-anthropogenic deposition), and should be sea-salt corrected (UBA 2004). During the last two decades monitoring of precipitation chemistry has been carried out at 13 sites across Manitoba and Saskatchewan (Figure 2, Table 1). However, currently chemistry is monitored at one station only across the region (Bratt’s Lake, Saskatchewan). In addition, much of the historic data is subject to data quality issues. Sites with a monthly sampling frequency (see Table 1) appear generally not to be applicable to regional mapping with many of the sites in Manitoba and Saskatchewan subject to local influences. Taking into account sampling frequency, the percentage of coverage (i.e., percentage of days that were sampled), and sample quality (by ionic balance) data are available for (approximately) five stations (including one in Saskatchewan only) during the early 1990s (1990–1995). The 1990s represents a period post major emission reductions in North America with observed base cation and Cl– concentrations in precipitation showing little or no trends (i.e., base cation deposition has been reasonably constant since the 1990s). There is a clear grouping in the observed deposition chemistry across the five sites: the two southern sites (McCreary and Point du Bois) show stronger anthropogenic influences (e.g., elevated nitrate (NO3
–), ammonium (NH4+) and SO42–) than the three
more northern sites (Table 2). The southern sites are located in agricultural regions (see Figure 1) and their chemistry is more representative of an anthropogenic-influenced atmosphere. In contrast, the northern sites clearly show lower concentration levels for all ions in precipitation with an average base cation concentration of approximately 5 µmolc L–1 compared to 15 µmolc L–1 for the southern sites (similar to concentrations in Dorset

12
Ontario which receives significantly higher levels of anthropogenic deposition, see Table 2). Precipitation volume shows relatively little variation across all five sites.
Figure 2. Location of wet deposition monitoring stations in Manitoba and Saskatchewan. The red circles denote stations with reliable data quality. See Table 1 for further details. Map Projection: UTM Zone 13. Datum: NAD83. Table 1. Site and sampling information for wet deposition monitoring stations located in Manitoba (MB) and Saskatchewan (SK; see Figure 1 for site locations). Site Code
Station name (Province)
Latitude Longitude Start Date End Date Sampling Frequency
CRE Cree Lake (SK) 57.350 –107.130 11-Aug-83 5-May-93 Daily KDS Kindersley (SK) 51.467 –109.167 31-Mar-77 31-Dec-85 Monthly WYN Wynyard (SK) 51.767 –105.067 1-Feb-74 31-Dec-85 Monthly BRA Bratt's Lake (SK) 50.203 –104.204 1-Jan-98 Daily BRO Brochet (MB) 57.900 –101.667 15-Aug-84 31-Dec-96 Daily PAS The Pas (MB) 53.967 –101.100 30-Apr-77 1-Jan-83 Monthly NWH Norway House (MB) 53.958 –97.846 1-Nov-70 22-Feb-88 Daily ISL Island Lake (MB) 53.865 –94.667 1-Jul-78 3-Jan-98 Daily DAU Dauphin (MB) 51.100 –100.050 31-Mar-77 1-Jan-83 Monthly MCC McCreary (MB) 50.709 –99.528 1-Sep-83 1-Jan-96 Daily BIS Bissett (MB) 51.033 –95.667 30-Apr-77 1-Jan-83 Monthly PDB Point du Bois (MB) 50.300 –95.550 2-Jan-84 17-Oct-88 Daily CHC Churchill (MB) 58.750 –94.067 1-May-77 1-Jan-83 Monthly

13
Recently, annual average wet and dry deposition fields (1994–1998) for the major ions in precipitation have been made available across eastern Canada (Ro and Vet 2003, Vet and Shaw 2004). In contrast, very little mapped deposition chemistry information is available for western Canada (with respect to Manitoba and Saskatchewan). In conjunction with this project, EC agreed to generate (preliminary) wet and dry deposition fields for Manitoba and Saskatchewan, consistent with those for eastern Canada (grid resolution: 35 km × 35 km). This represented an important and essential input to the project, which effectively allowed for a more comparable approach between western (Manitoba and Saskatchewan) and eastern Canada. The total deposition fields are discussed in more detail in Sections 6.2 and 7.4. Table 2. Average precipitation volume (PPT) and chemistry during the early 1990s (1990–1995) for monitoring stations in Manitoba (four stations) and Saskatchewan (one station). See Figure 2 and Table 1 for further site details. Precipitation chemistry for Dorset Ontario (DOR) and Saturna British Columbia (SAT) are included for comparison. Code PPT pH SO4
2– NO3– Cl– NH4
+ Na+ Ca2+ Mg2+ K+ m µmolc L–1 ISL 0.508 5.01 12.07 8.82 1.29 9.82 1.32 5.02 1.97 0.69 BRO 0.477 4.80 16.97 6.87 4.26 6.77 1.17 3.99 1.15 0.69 CRE 0.471 4.98 9.77 5.29 0.88 3.94 0.69 2.43 1.12 0.40 MCC 0.588 5.26 18.04 13.96 1.30 25.77 0.92 9.67 4.06 0.62 PDB 0.596 5.04 19.34 14.69 4.51 22.88 1.55 9.36 3.40 1.54 DOR 0.984 4.36 43.07 37.12 3.44 25.68 2.26 11.50 3.29 1.55 SAT 0.911 4.76 16.17 11.74 37.58 5.92 31.97 2.80 7.64 1.04 5.2. Base Cation Weathering Weathering refers to the long-term release of base cations from minerals in the soil matrix due to chemical dissolution, and the neutralisation and production of alkalinity connected to this process. This has to be distinguished from the denudation of base cations from ion exchange complexes (cation exchange) and the degradation of soil organic matter. There are numerous methods for determining weathering rates (see UBA 2004), although many require detailed soil observations. However, outside of agricultural regions, soil chemical observations (such as elemental content and mineralogy) are sparse or non-existent. As such, many of the methods suitable for regional applications are semi-empirical or estimate weathering rate from more readily available (mapped) data. For example, the Skokloster method assigns soils to one of five broad weathering rate classes based on soil parent material (and assumed typical mineralogy). Under the NEG-ECP critical load assessment, weathering rates for eastern Canada were generally estimated using a soil type–texture approximation method. The approach estimates weathering rate from (weighted average) texture (defined as a function of clay content) and parent material buffering class. The methodology is suitable for regional applications and requires data that is readily available from standard soil maps. Recently

14
the method has been used to estimate weathering rates for North America (Figure 3, Aherne and Watmough 2005b). The procedure provides weathering rates for BC (Ca2+ + Mg2+ + K+ + Na+). However, for computing the critical alkalinity leaching (Equation 4.4), the weathering rate for Bc (Ca2+ + Mg2+ + K+) is required; Bcw can be approximated by multiplying BCw with a factor between 0.70 for poor sandy soils and 0.85 for rich (sandy) soils. In addition, it is important that a uniform depth of soil (or rooting zone) is applied across the region of interest. Using these semi-empirical methods, weathering rates can be estimated for large regions such as Manitoba and Saskatchewan, or western Canada. The methodologies require information (data inputs) that are generally available from regional soil maps; as such, the resolution of the resulting weathering rate maps is dictated by the base soils map. Only two spatially consistent soil databases are available for Canada, both at very coarse resolutions. The Soil Landscapes of Canada (SLC, scale 1:1,000,000) was produced by generalising detailed soil survey data (online: sis.agr.gc.ca/cansis/nsdb/slc/intro.html). The level of mapping was designed to be used for broad, regional-scale assessments. Recent versions of the SLC have greater resolution (version 2.3) and future versions will be made available at a scale of 1:50,000 for eastern Canada and 1:100,000 for western Canada; however, this information will only be available for agricultural soils.
< 250250–500500–10001000–2000> 2000
Base cation weathering rate (molc ha–1 yr–1)
Figure 3. Base cation weathering rate (molc ha–1 yr–1) within the top 60 cm of soils across Canada and contiguous North America. Using semi-quantitative methods, soil weathering rates (derived from percent clay and substrate type) have been allocated to soil types and associations across both soil databases. Weathering rates were vertically and spatially weighted for each soil type to derive a single average value for each mapping unit.
15
A national ecological framework for Canada has been developed with four levels of generalisation (ecozone, ecoprovince, ecoregion and ecodistrict). The most detailed level is the ecodistrict, which is a subdivision of an ecoregion characterised by a distinctive assemblages of relief, landforms, geology, soil, vegetation, water bodies and fauna. The soils information available for the ecological framework is a further generalisation of the SLC map with a scale of 1:2,000,000 and, as such, does not offer an improvement in resolution (online: sis.agr.gc.ca/cansis/nsdb/ecostrat/intro.html). However, the ecological framework includes a supporting attribute database with 26 attributes covering five general categories, including: area of each ecological unit, climate, physical landscape characteristics, land cover and population. As such, the ecological framework, and the supporting attribute database may provide a more complete and consistent database for broad-scale critical load mapping. The SLC map offers the best resolution database available for estimating soil-weathering rates for Manitoba and Saskatchewan (and a Canada-wide assessment). Although more detailed soil databases (and maps) are available, they are generally confined to agricultural regions. The scale (1:1000,000) is consistent with the critical load mapping carried out in Ontario (similarly based on the SLC). As such, the SLC is recommended as the base soil map for determining critical loads for Manitoba and Saskatchewan. In addition, observations on soil texture and type are generally available from Forest Ecosystem Classification (or Ecological Land Classification) networks, which typically include a dense network of plots, e.g., approximately 9000 plots in Ontario. These data are consistent with the SLC and potentially provide a means to improve the resolution of the SLC map; this approach has been recently proposed for updating the Ontario critical load maps. Furthermore, the resultant weathering rate (or critical load) map may be verified using available data from point observation networks such as the ARNEWS or NFI plots. Data (soil chemical measurements) for more than 100 forest plots across Manitoba and Saskatchewan have been collated and compiled principally from the CFS networks and data compilations. These site-measured data may potentially be used to gain confidence in the provincial critical load maps for Manitoba and Saskatchewan. 5.3. Base Cation Uptake The uptake flux of base cations, Bcu, required in the critical load calculation is the long-term average removal of base cations from the ecosystem. The (long-term) net uptake of base cations is limited by their availability through deposition and weathering (neglecting the depletion of exchangeable base cations). For unmanaged ecosystems (e.g., national parks) the long-term (steady-state) net uptake is basically zero whereas for managed forests it is the long-term net growth uptake. The harvesting practice is of crucial importance, i.e., whether stems only, stems plus (parts of) branches or stems plus branches plus leaves/needles (whole-tree harvesting) are removed:
(5.1) period)(rotationharvestsbetweeninterval
biomassharvestedinremovedBcBcu =
The amount of base cations in the harvested biomass (stems and branches) can be calculated as:

16
(5.2) ( )brstbrststgru ctBcfctBckBc ⋅+⋅⋅= ,ρ where kgr is the average annual growth rate (m3 ha–1 yr–1), ρst is the density of stem wood (kg m–3), ctBc is the base cations content in stems (subscript st) and branches (subscript br) (molc kg–1) and fbr,st is the branch-to-stem ratio (kg kg–1). The contribution of branches should be neglected in the case of stem only removal. Note: the uptake fluxes should be calculated for the individual base cations (Ca2+, Mg2+ and K+) separately. Values for the density of stem wood of most trees are in the range of 400–500 kg m–3 for conifers and 550–700 kg m–3 for deciduous trees (UBA 2004). The branch-to-stem ratio is about 0.15 kg kg–1 for conifers and 0.20 kg kg–1 for deciduous trees (UBA 2004). Average nutrient contents for most species are also generally available. Growth rates used should be long-term average values, typical for the site. Under the NEG-ECP protocol, harvesting removals were not considered in the determination of critical load for upland forests in eastern Canada; therefore, the long-term net uptake of base cations (and N) was set to a value of zero. The same approach was used for Manitoba and Saskatchewan for consistency with eastern Canada. However, it is recommended that nutrient uptake (harvest removal) maps be produced for western and eastern Canada. In the absence of detailed tree species (distribution) maps, land cover maps may be used to delineate broad species types and uptake estimated using Equation 5.2 in combination with available average stem nutrient concentrations and growth rates. Growth rates may potentially be derived using the Carbon Budget Model for the Canadian Forestry Sector (CBM-CFS). A number of land cover maps are readily available, e.g., the Land Cover of Canada 1995 (online: www.ccrs.nrcan.gc.ca/ccrs/rd/apps/landcov/map_e.html) and the North America Land Cover Characteristics Database (online: edcsns17.cr.usgs.gov/glcc/na_int.html). Both maps provide a Canada-wide coverage; in addition, the latter has been previously used to estimate vegetation-specific dry deposition velocities for eastern Canada. 5.4. Nitrogen Immobilisation, Uptake and Denitrification Under the NEG-ECP protocol, N processes were considered negligible in the determination of critical loads for eastern Canada. Nonetheless, a brief description of all N parameters required in the SSMB model is presented below. Furthermore, it is highly recommend that their parameterisation be reviewed under a(ny forthcoming) Canada-wide critical load assessment. Nitrogen immobilisation is the long-term net immobilisation (accumulation) of N in the root zone, i.e., the continuous build-up of stable carbon-nitrogen-compounds in (forest) soils. In other words, this immobilisation of N should not lead to significant changes in the prevailing C/N ratio. This has to be distinguished from the high amounts of N accumulated in the soils over many years (decades) due to the increased deposition of N, leading to a decrease in the C/N ratio in the topsoil. The annual N immobilisation for Swedish forest soils since the last glaciation was estimated at 0.2–0.5 kg N ha–1 yr–1. Considering that immobilisation is probably higher in warmer climates, values of up to 1 kg N ha–1 yr–1 could be used for N immobilisation, without causing unsustainable accumulation of N in the soil. It should be pointed out,

17
however, that even higher values (closer to present-day immobilisation rates) have been used in critical load calculations (UBA 2004). Although studies on the capacity of forests to absorb N have been carried out, there is no consensus yet on long-term sustainable immobilisation rates. Nitrogen uptake is the long-term average removal of N from the ecosystem. The considerations and calculations are exactly the same as for the uptake of base cations (see Section 5.3). Net uptake of N in non-forest natural and semi-natural ecosystems is insignificant, unless they are used for extensive grazing. For example, in the United Kingdom net removal of N in sheep (mutton/wool) due to extensive grazing is between 0.5 and 2.0 kg N ha–1 yr–1, depending on site fertility and grazing density. Denitrification values for boreal and temperate ecosystems are typically in the range of 0.1–3.0 kg N ha–1 yr–1, where the higher values apply to wet(ter) soils; rates for well drained soils are generally below 0.5 kg N ha–1 yr–1. 5.5. Critical Alkalinity Leaching Under the NEG-ECP protocol, the critical alkalinity leaching (Equation 4.4) was estimated using spatially constant, or fixed, values of 10 for the Bc:Al ratio and 9 for log Kgibb. For consistency with eastern Canada, the critical alkalinity leaching for Manitoba and Saskatchewan followed the protocol and guidelines established by the NEG-ECP. Nonetheless, it is highly recommended that these fixed values be reviewed under a(ny forthcoming) Canada-wide critical load assessment. Critical alkalinity leaching also requires precipitation surplus or runoff (Q). This is the amount of water percolating from the root zone. It can be conveniently calculated as the difference between precipitation and actual evapotranspiration and it should be the long-term climatic mean annual value. In many cases evapotranspiration will have to be calculated by a model using basic meteorological input data (precipitation, temperature, radiation etc.). The CFS provide long-term normals for precipitation and temperature and estimates of agro-climate variables, such as potential evapotranspiration; these data allow precipitation surplus to be readily estimated (see Figure 4). Similarly, long-term precipitation and climate variables are available as high-resolution grids at a spatial resolution of 0.5 degrees for the global land surface (Mitchell et al. 2004). Alternatively, precipitation, evapotranspiration and precipitation surplus are available in the supporting attribute database under the ecological framework. In addition, a national runoff map is included in the Atlas of Canada (online: atlas.gc.ca); the runoff map is reasonably consistent with the precipitation surplus map generated from the CFS (agro-) climate data (see Figures 4 and 5); although, the precipitation surplus map depicts large areas with precipitation surplus deficit. 5.6. Sulphur and Nitrogen Deposition Acid deposition in western Canada has not received as much attention as in the more highly industrialised areas of eastern North America, but unlike other regions of the continent, emissions of acidifying gases (S and N) have increased. However, similar to base cation and Cl– deposition, the deposition of S and N required for the determination

18
of exceedance estimates, are very limited for western Canada (Manitoba and Saskatchewan).
Figure 4. Long-term average annual precipitation surplus estimated from long-term precipitation minus potential evaporation (1961–1990). Original climate and agro-climate indices (national-scale maps) were obtained from the CFS (online: http://www.glfc.cfs.nrcan.gc.ca/index_e.html).
Figure 5. National runoff map from the Atlas of Canada; spatial patterns are consistent with the precipitation surplus map in Figure 4 (online: http://atlas.nrcan.gc.ca/site/english/maps/archives/5thedition#environment ).

19
As stated previously (Section 5.1), in conjunction with this project, EC agreed to generate (preliminary) wet and dry deposition fields for Manitoba and Saskatchewan, consistent with those for eastern Canada (grid resolution: 35 km × 35 km). This represented an important input to the project, which effectively allowed for a more comparable approach (critical load and exceedance) between western and eastern Canada. In addition, a number of regional acid deposition models have been used in Canada to investigate the acid deposition issue (Environment Canada 2004). The REgional Lagrangian Acid Deposition model (RELAD) is a three-layer regional-scale Lagrangian model that simulates ground-level concentrations and wet and dry deposition of six S and N species. A 1° by 1° latitude-longitude grid is typically used for RELAD applications in western Canada (the model domain covers British Columbia, Alberta, Saskatchewan and Manitoba; see Figure 6).
Figure 6. Mean annual fields due to 1995 Canadian emissions only predicted by RELAD for sulphur wet deposition (kmolc ha–1 yr–1). The RELAD domain is indicated by the dark black outline. Each grid cell is 1° of latitude by 1° of longitude in size. Note that multiplication of the colour scale by 48 will convert units of kmolc to units of kg SO4
2–, yielding an alternate set of contour intervals (0.0, 0.48, 0.96, 1.44, 1.92, 2.40, 2.88, 3.36, 3.84, 4.32). Source: Environment Canada (2004). The Acid Deposition and Oxidant Model (ADOM) has been designed to consider all of the important processes that govern the fate of acidifying pollutants and oxidants in the atmosphere. These include pollutant emission, atmospheric transport and diffusion, gas-phase chemistry, aqueous-phase chemistry, cloud mixing and scavenging, and dry and wet deposition. The model domain covers eastern North America and extends into Manitoba and Saskatchewan (see Figure 7). Exceedance estimates using mapped S and N (wet and dry) deposition fields for Manitoba and Saskatchewan provided by EC are more consistent (methodology) with previous critical load assessments in eastern Canada. However, modelled deposition fields are available for the region (Manitoba and Saskatchewan). This allows for a unique

20
comparison of modelled and mapped deposition fields for Manitoba and Saskatchewan (which has not been carried out for eastern Canada). The RELAD and ADOM models both cover (at a minimum) a significant area of Manitoba and Saskatchewan. Although the domain of the RELAD model is more suited to the current study, it has not been as well tested as ADOM.
Figure 7. Gridded annual emissions (kilotonnes yr–1) of sulphate for ADOM scenario that describes the SO2 emissions expected to occur in 2010 after full implementation of the ‘first generation’ of Canadian and US acid rain control programs. Source: Environment Canada (2004). The figure is only intended to show the domain for ADOM. In the current study, exceedance can be estimated using the available mapped and modelled deposition fields. However, consistent deposition fields are not available for a Canada-wide (or western Canada) determination of critical load (exceedance) for upland forests. It may be possible to knit together the outputs from the various regional models to generate continuous Canada-wide S and N deposition maps; however, most models use different meteorological boundary conditions and it is unclear how comparable they are. Instead, AURAMS (A Unified Regional Air quality Modelling System), which is a new, size-resolved, chemically characterised, regional modelling system may provide a Canada-wide domain for deposition modelling (Environment Canada 2004).

21
6. Critical Load and Exceedance for Manitoba and Saskatchewan 6.1. Introduction Critical load and exceedance of S and N have been estimated for forest soils in Manitoba and Saskatchewan following the methodology and guidelines established by the NEG-ECP (which largely follow the ICPM&M protocol). The long-term critical load was estimated using the SSMB model as previously described in Section 4, Equation 4.3 (repeated below). (4.3) critlewdepdep AlkBCClBCNSCL ,
**)( −+−=+ where BCdep = base cation (BC = Ca2+ + Mg2+ + K+ + Na+) deposition, Cldep = Cl– deposition, BCw = base cation weathering, and Alkle,crit = critical alkalinity leaching rate. The exceedance of steady-state critical load of S and N to upland forest soils was calculated as the current deposition flux (1994–1998) of SO4
2– plus N minus critical load as previously described in Section 4, Equation 4.5 (repeated below). (4.5) EXC = S*
dep + Ndep – CL(S + N) where Sdep = SO4
2– deposition and Ndep = N deposition. Negative exceedance values indicate ‘no exceedance’, i.e., SO4
2– plus N deposition is less than the critical load; (upland forest) soils will not acidify to a level where deleterious effects are expected. An asterisk denotes sea-salt corrected (non-marine) depositions; sea-salt corrections were not carried out for Manitoba and Saskatchewan, as the marine influence is generally low (or negligible) over both provinces. Units are in molc ha–1 yr–1. See Sections 3 and 4 for a more complete description of the critical load concept and the methodology. To calculate critical load and exceedance of S and N for upland (mineral) forest soils in Manitoba and Saskatchewan, regionally consistent (continuous) maps for the SSMB model input variables are required. From Equations 4.3 and 4.5, the following inputs (or data maps) are required for Manitoba and Saskatchewan: total (wet and dry) base cation, Cl–, SO4
2– and N atmospheric deposition, base cation weathering and alkalinity leaching. These inputs (and the generation of regional maps) are described in detailed in Section 6.2. 6.2. Model Inputs for Manitoba and Saskatchewan Total (Wet and Dry) Atmospheric Deposition Sulphate, N, base cation and Cl– deposition estimates used in the determination of critical load and exceedance for Manitoba and Saskatchewan were supplied by EC. Shortly after the initiation of the project, EC agreed to estimate and provide total (wet and dry) atmospheric deposition for Manitoba and Saskatchewan. These estimates represented an important contribution to the project and significant ‘new’ data for both provinces. They are the first maps of total deposition for all major ions in precipitation for Manitoba and Saskatchewan, and are the highest resolution deposition fields available for both provinces (35 km × 35 km). Further, these estimates (maps) are consistent with the annual average wet and dry deposition fields (1994–1998) recently developed for

22
eastern Canada (Ro and Vet 2003, Vet and Shaw 2004) and used in the eastern Canada critical load assessment. The wet depositions fields were generated by interpolating the 1994–1998 mean deposition estimates at sites in and near Manitoba and Saskatchewan (see Appendix II for list of sites). The data from 1991–1993 at the Cree Lake CAPMoN (Canadian Air and Precipitation Monitoring Network) site were also used because of the lack of sites in northern Manitoba and Saskatchewan. The dry concentration fields were similarly generated but with a smaller number of sites; because of the lack of Ca2+ and Mg2+ measurements at Cree Lake, concentration values from the CAPMoN site at ELA (Experimental Lakes Area, North-western Ontario) were used as surrogate values. Air concentrations measurements for Ca2+ and Mg2+ are limited across the region, as such, the ELA data were considered to be the most representative surrogate values for Cree lake. All wet deposition and concentration fields were interpolated to a 35 km × 35 km grid. Dry deposition fields were generated by combining concentration and dry deposition velocity fields. Deposition velocities were generated using meteorological data and land use information. Deposition velocities were estimated for each chemical species at all grid squares every 3 hours for 14 different land use categories (LUCs). A 24-hour average dry deposition velocity was then calculated for each land use type as well as an overall ‘LUC-area-weighted’ dry deposition velocity based on the % area in the grid square of each land use type. This was carried out only for 1998 due to data limitations. It was then assumed that the 1998 dry deposition velocities were representative of the five-year period 1994–1998. The ‘overall’ land use category velocity was used to calculate dry deposition. Mean annual total (wet and dry) base cation and Cl– deposition for the period 1994–1998 are presented in Appendix 1, Figures A1 and A2. Mean annual total base cation deposition (1994–1998) is 142 molc ha–1 yr–1 for Manitoba and 144 molc ha–1 yr–1 for Saskatchewan (Table 3). Mean annual total chloride deposition (1994–1998) is 16 molc ha–1 yr–1 for Manitoba and 11 molc ha–1 yr–1 for Saskatchewan. Base Cation Weathering Under the NEG-ECP critical load assessment, weathering rates for eastern Canada were estimated using a soil type–texture approximation method (Sverdrup et al. 1990, Ouimet 2005). The approach estimates weathering rate from (weighted average) texture (defined as a function of clay content) and parent material class. The methodology is suitable for regional applications and requires data that is readily available from standard soil maps. This approach was used in conjunction with the SLC (version 2.1) map for Manitoba and Saskatchewan to estimate province-wide weathering rates. The SLC map is the best resolution database available for estimating regionally consistent soil base cation weathering rates for Manitoba and Saskatchewan. Further, version 2.1 of the SLC provides soil horizon information for each component soil type within each soil mapping unit. Although more detailed soil databases (and maps) are available, they are generally confined to agricultural regions (southern Manitoba and Saskatchewan) or spatially restricted surveys. The scale (1:1,000,000) is consistent with the critical load mapping carried out in Ontario (similarly based on the SLC); uncertainties associated with scale are further discussed in Section 7.2.
23
Percent clay were vertically (all soil horizons excluding the C horizon) and spatially (component soil types within a mapping unit) weighted following Helliwell et al. (1998) to derive a single average value for each mapping unit on the SLC map. Mean soil clay fraction was 22 % for Manitoba and 15% for Saskatchewan (Table 3). A base weathering rate was estimated following Ouimet (2005). This base weathering rate was further modified for temperature (Ouimet 2005). Long-term (1971–2000) mean annual average temperature was generated from a high-resolution grid of monthly temperature at a spatial resolution of 0.5 degrees for the global land surface (Mitchell et al. 2004). In addition, for consistency with eastern Canada, maximum soil depth was limited to 75 cm. Mean soil depth (excluding the C horizon) is 99 cm for Manitoba and 106 cm for Saskatchewan (Table 3). Long-term annual mean temperature and base cation weathering rate are presented in Appendix 1, Figures A3 and A4. Long-term (1971–2000) annual mean temperature is –1.0°C for Manitoba and 0.3°C for Saskatchewan (Table 3). Base cation (Ca2+, Mg2+, K+ and Na+) weathering rate is 893 molc ha–1 yr–1 for Manitoba and 818 molc ha–1 yr–1 for Saskatchewan. Critical Alkalinity Leaching Alkalinity leaching is typically estimated from a critical Bc:Al ratio and log Kgibb (see Section 4, Equation 4.4). Under the NEG-ECP protocol, an alkalinity leaching function was developed that corresponds to a value of 10 for the Bc:Al ratio and 9 for log Kgibb (Rock Ouimet, personal communication). For consistency with eastern Canada, critical alkalinity leaching for Manitoba and Saskatchewan was estimated following the protocol and guidelines established by the NEG-ECP. Critical alkalinity leaching also requires precipitation surplus (Q). This is the amount of water percolating from the rooting zone, and is generally estimated as the difference between long-term precipitation and actual evapotranspiration. Typically evapotranspiration is estimated (or modelled) using basic meteorological input data (precipitation, temperature, radiation, etc). Long-term precipitation and climate variables were generated from high-resolution grids at a spatial resolution of 0.5 degrees for the global land surface (Mitchell et al. 2004). Actual evapotranspiration was estimated from potential evapotranspiration and soil moisture following Federer (1982) and Prentice et al. (1993). Long-term mean annual precipitation surplus estimates at a spatial resolution of 0.5 degrees for Manitoba and Saskatchewan were provided by M. Posch, Co-ordination Centre for Effects, The Netherlands. Long-term mean annual precipitation surplus or runoff is presented in Appendix 1, Figure A5. Long-term (1971–2000) mean annual precipitation surplus is 97 mm for Manitoba and 64 mm for Saskatchewan (Table 3). 6.3. Critical Loads for Manitoba and Saskatchewan Critical load of S and N were estimated and mapped for Manitoba and Saskatchewan following the methodology and guidelines established by the NEG-ECP (see Section 4). The mean (median) critical load for Manitoba and Saskatchewan was estimated at 1259 (980) molc ha–1 yr–1 and 1151 (1052) molc ha–1 yr–1, respectively. The minimum critical load was estimated at 172 molc ha–1 yr–1 for Manitoba and 204 molc ha–1 yr–1 for Saskatchewan (Table 3). The median critical load is comparable to estimates for

24
provinces (i.e., New Brunswick and Nova Scotia) in eastern Canada (Ontario: 548 molc ha–1 yr–1, Quebec: 519 molc ha–1 yr–1, New Brunswick: 1169 molc ha–1 yr–1, Nova Scotia: 817 molc ha–1 yr–1, Newfoundland: 572 molc ha–1 yr–1; Note only median values have been published for eastern Canada: Environment Canada 2004, Ouimet et al. 2006). The critical loads are characterised by large spatial variability (Figure 8), primarily dictated by the base cation weathering rate (see Figure A4) and the base cation deposition (see Figure A1). Total Cl– deposition and critical alkalinity leaching have a limited effect on the final critical load; Cl– deposition is low across both provinces (see Figure A2) and runoff, which is important in determining the critical alkalinity leaching, is also low across both regions (see Figure A5). The lowest critical loads (< 500 molc ha–1 yr–1) generally occur in the northern region of both provinces, theses areas are associated with mineral soils that have low weathering parent material or organic soils. There is an obvious and clear distinction between the base rich (agricultural) soils in the south and the more acid (forest) soils in the north (Figure 8). Approximately 47% of the mapped soils in Manitoba have critical load less than 500 molc ha–1 yr–1 (3.1% less than 250 molc ha–1 yr–1). Similarly, approximately 36% of the soils in Saskatchewan have critical load less than 500 molc ha–1 yr–1 (0.5% less than 250 molc ha–1 yr–1).

25
Figure 8. Critical load of sulphur and nitrogen for (upland mineral) forest soils in Manitoba and Saskatchewan (molc ha–1 yr–1). Selected urban centres are indicated by white circles (Winnipeg and Churchill, Manitoba; Regina and Saskatoon, Saskatchewan). There is a clear distinction between the less sensitive (agricultural) soils in the south and the more sensitive (forest) soils in the north (see Figure 1 for land cover types). Map Projection: UTM Zone 13. Datum: NAD83. 6.4. Exceedance for Manitoba and Saskatchewan Exceedance of critical load of sulphur and nitrogen for forest soils in Manitoba and Saskatchewan was calculated by subtracting critical load (Figure 8) from total sulphate and nitrogen deposition. Mapped deposition fields were available from three sources: EC; ADOM and the RELAD model. Exceedance was determined using only the EC deposition estimates; EC deposition fields have the highest mapping resolution (35 km × 35 km grids) and are consistent with the critical load assessment in eastern Canada.

26
Table 3. Provincial (Manitoba and Saskatchewan) summary statistics (minimum, maximum, median and mean) for soil characteristics, model inputs and derived data. Manitoba Saskatchewan Variables Units Minimum Maximum Median Mean Minimum Maximum Median Mean Soil depth cm 4.5 265.6 100.0 98.5 5.6 340.0 100.0 105.4 Soil bulk density kg m–3 89.1 1699.5 1238.4 1127.1 100.0 1700.0 1428.6 1296.1 Soil organic carbon % 0.3 56.4 5.2 11.7 0.1 56.5 0.8 7.2 Soil clay fraction % 2.5 79.6 13.9 21.5 2.5 80.0 12.2 15.4 Base cation weathering molc ha–1 yr–1 64.3 3704.1 653.7 893.3 13.5 3817.3 718.1 818.5 Precipitation mm 354.7 584.3 489.0 485.9 307.9 527.1 427.9 420.4 Temperature °C –8.2 3.3 0.4 –1.0 –7.4 4.5 0.5 0.3 Precipitation surplus mm 36.0 158.2 100.2 97.2 6.6 142.6 61.9 63.7 Base cation deposition molc ha–1 yr–1 67.1 186.9 155.2 141.6 0.0 187.3 155.1 144.1 Chloride deposition molc ha–1 yr–1 8.7 29.1 15.4 15.9 5.8 23.5 10.7 11.4 Sulphate deposition molc ha–1 yr–1 105.2 183.7 145.4 145.0 99.7 191.7 154.6 152.2 Nitrogen deposition molc ha–1 yr–1 91.8 355.0 213.0 211.2 56.9 265.7 180.3 163.3 Critical load (S+N) molc ha–1 yr–1 171.5 4670.3 980.5 1259.2 203.5 4679.5 1052.0 1150.8 Exceedance (1994–1998) molc ha–1 yr–1 –4206.2 198.0 –535.6 –903.0 –4318.6 108.1 –721.4 –835.4 Notes 1. Soil depth, bulk density, organic carbon and clay fraction are derived from the Soil Landscapes of Canada, version 2.1. Data are
soil mapping unit averages (based on profile and soil type weighted averages for each mapping unit following Helliwell et al. 1998).
2. Base cation weathering is estimated from average percent clay and temperature, weighted to (at most) the top 75 cm of soil (see Section 6.2).
3. Precipitation, temperature and precipitation surplus are long-term mean annual values for the period 1971–2000. Data were generated from high-resolution grids at a spatial resolution of 0.5 degrees for the global land surface. Precipitation surplus data were estimated by Max Posch, Co-ordination Centre for Effects, The Netherlands.
4. Mean annual total (wet and dry) base cation, chloride, sulphate and nitrogen deposition for the period 1994–1998. Deposition fields were estimated by Mike Shaw and Bob Vet, Environment Canada, Science and Technology Branch; data were mapped on a 35 km × 35 km grid.
5. Positive exceedance values indicate exceedance of critical load.

27
Figure 9. Exceedance of critical load of sulphur and nitrogen for (upland mineral) forest soils in Manitoba and Saskatchewan (molc ha–1 yr–1) for the period 1994–1998. Exceedance (sulphur and nitrogen deposition > critical load) is shown in two class: 0–100 (red) and > 100 molc ha–1 yr–1 (black). Non-exceedance (sulphur and nitrogen deposition < critical load) is shown in two class: 0– –100 (yellow) and < –100 molc ha–1 yr–1 (grey). Selected urban centres are indicated by white circles (Winnipeg and Churchill, Manitoba; Regina and Saskatoon, Saskatchewan). Map Projection: UTM Zone 13. Datum: NAD83. Mean annual total (wet and dry) deposition for sulphate and nitrogen was available for the period 1994–1998 (see Section 6.2). The highest sulphate depositions (> 175 molc ha–1 yr–1) were mapped in south-eastern Manitoba and western Saskatchewan (Figure A6). The magnitude and spatial pattern of total sulphate deposition is similar to total base cation deposition (Figure A1). The highest nitrogen deposition (> 325 molc ha–1 yr–1) was mapped in south-eastern Manitoba (Figure A7). Mean annual total sulphate deposition was 145 molc ha–1 yr–1 for Manitoba and 152 molc ha–1 yr–1 for Saskatchewan for the period 1994–1998. Mean annual total nitrogen deposition was 211 molc ha–1 yr–1 for Manitoba and 163 molc ha–1 yr–1 for Saskatchewan (Table 3). It is important to note that total sulphate deposition estimates for Manitoba and Saskatchewan are significantly

28
lower than estimates for eastern Canada (see Figure A8). Mean annual total sulphate deposition was 320 molc ha–1 yr–1 for eastern Canada for the period 1994–1998. Exceedance of critical load was mapped in northern and southern Manitoba and across central Saskatchewan (Figure 9). In general, the estimated exceedance in central and southern regions was due to a combination of low critical load and high sulphate and nitrogen deposition (see Figures 8, A6 and A7). Approximately 7% of the mapped soils receive acid deposition in excess of critical load in Manitoba and 2% in Saskatchewan. The difference in exceedance is somewhat driven by the size (and number) of the soil mapping unit in each province. The average soil mapping unit size for Manitoba is approximately 3.3 times greater than Saskatchewan. The mean (median) exceedance for Manitoba and Saskatchewan for the period 1994–1998 was estimated at –903 (–536) molc ha–1 yr–1 and –835 (–721) molc ha–1 yr–1, respectively (Table 3). The median exceedance is within the range of values estimated for some provinces (i.e., New Brunswick) in eastern Canada (Ontario: 42 molc ha–1 yr–1, Quebec: –15 molc ha–1 yr–1, New Brunswick: –455 molc ha–1 yr–1, Nova Scotia: –135 molc ha–1 yr–1, Newfoundland: –134 molc ha–1 yr–1; Note only median values have been published for eastern Canada: Environment Canada 2004, Ouimet et al. 2006).
29
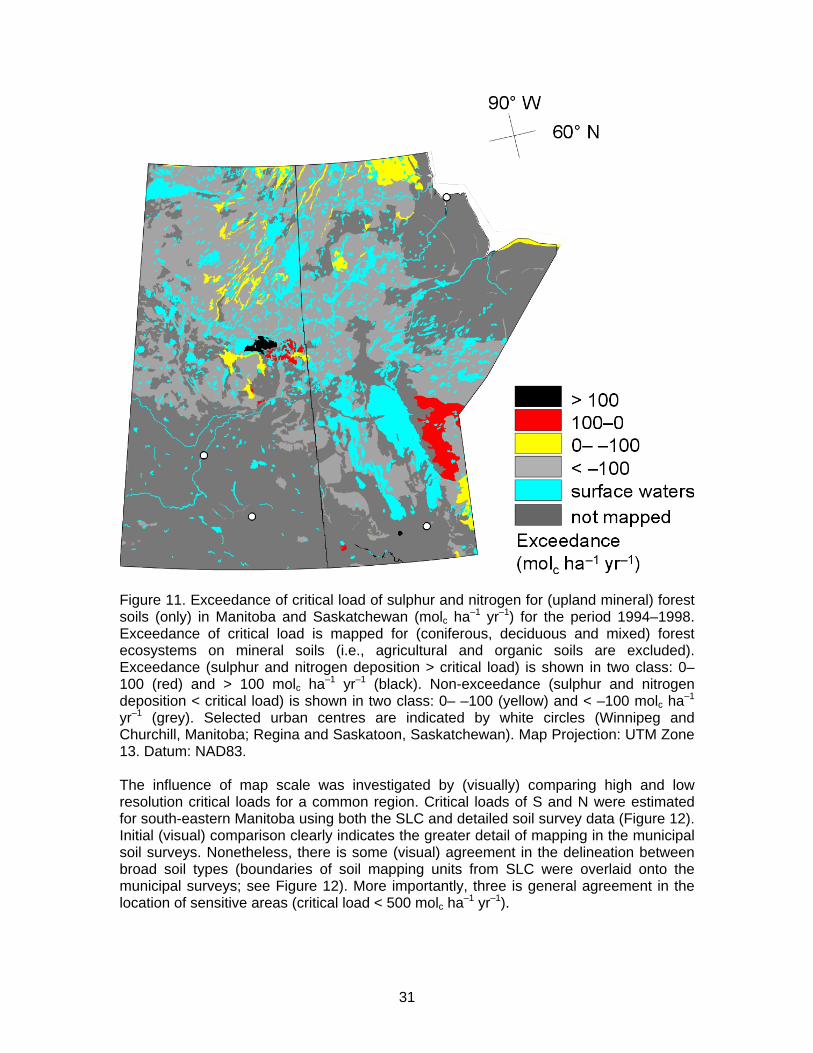
7. Further Considerations and Uncertainties Regional studies by their very nature incorporate simplifications and as such uncertainty. It is important to address uncertainty in regional modelling; however, to some extent a complete discussion of uncertainties and limitations is an exhaustive endeavour. Nonetheless provision of some estimate of uncertainty is important and necessary for subsequent interpretation of critical loads and their exceedances. Uncertainty arises from two sources: model structure and input data. The current assessment follows the methodology and guidelines established by the NEG-ECP for the Steady-State Mass Balance model. The approach largely follows the ICPM&M protocol, which has undergone rigorous uncertainty evaluation (see Skeffington 2006, Skeffington et al. 2006). As such, the following discussion is limited to receptor ecosystems, soil data resolution and regional atmospheric deposition data. 7.1. Receptor Ecosystems The NEG-ECP protocol presents a methodology for the determination of critical load of S and N for upland forest soils. However, to-date maps (and statistics) for eastern Canada have presented data for entire provincial land areas. Despite being largely forested, all provinces in eastern Canada have significant land areas dominated by agriculture or composed of organic soils. The current critical limit (under the NEG-ECP protocol) is unsuitable for these receptor ecosystems (see Section 3.2). This introduces bias into the critical load and may potentially inflate the estimated area of exceedance. Approximately 50% of the land area of Manitoba and Saskatchewan is composed of forest ecosystems (coniferous, deciduous, mixed or shrub-land) on mineral soils (Manitoba 51%, Saskatchewan 53%: derived from the SLC v2.1. See Figure 10). Under the NEG-ECP protocol, critical load of S and N should only be applied to these regions (upland mineral forest soils). The revised mean (median) critical load for Manitoba and Saskatchewan was estimated at 1429 (1023) molc ha–1 yr–1 and 697 (441) molc ha–1 yr–1, respectively. These provincial summaries are significantly different than the previous estimates based on the entire provincial land area (Table 3). The change in provincial summaries was obviously related to the sensitivity of the remaining areas, e.g., a large proportion of the non-sensitive area was ‘removed’ for Saskatchewan resulting in a lower critical load for the province. Further, limiting the mapped area to upland mineral forest soils reduced the area of exceedance from 7% to 3.3% for Manitoba, and from 2.0% to 1.1% for Saskatchewan (see Figure 11).

30
Figure 10. Critical load of sulphur and nitrogen for (upland mineral) forest soils (only) in Manitoba and Saskatchewan (molc ha–1 yr–1). Critical load is mapped for (coniferous, deciduous and mixed) forest ecosystems on mineral soils (i.e., agricultural and organic soils are excluded). Selected urban centres are indicated by white circles (Winnipeg and Churchill, Manitoba; Regina and Saskatoon, Saskatchewan). Map Projection: UTM Zone 13. Datum: NAD83. 7.2. Soil Data Resolution The Soil Landscapes of Canada (v2.1) is the principal base map underlying the estimated critical load for Manitoba and Saskatchewan. Although the SLC is the highest resolution soil coverage available for Manitoba and Saskatchewan, the scale is somewhat coarse (scale 1:1,000,000). The SLC was designed to be used for broad, regional-scale assessments. This has raised concerns regarding the suitability of the SLC for provincial critical load assessments. In comparison, detailed soil survey maps are generally available for agricultural regions, e.g., the scale of the municipal soil surveys for southern Manitoba range from 1:20,000 to 1:126,720.
31
Figure 11. Exceedance of critical load of sulphur and nitrogen for (upland mineral) forest soils (only) in Manitoba and Saskatchewan (molc ha–1 yr–1) for the period 1994–1998. Exceedance of critical load is mapped for (coniferous, deciduous and mixed) forest ecosystems on mineral soils (i.e., agricultural and organic soils are excluded). Exceedance (sulphur and nitrogen deposition > critical load) is shown in two class: 0–100 (red) and > 100 molc ha–1 yr–1 (black). Non-exceedance (sulphur and nitrogen deposition < critical load) is shown in two class: 0– –100 (yellow) and < –100 molc ha–1 yr–1 (grey). Selected urban centres are indicated by white circles (Winnipeg and Churchill, Manitoba; Regina and Saskatoon, Saskatchewan). Map Projection: UTM Zone 13. Datum: NAD83. The influence of map scale was investigated by (visually) comparing high and low resolution critical loads for a common region. Critical loads of S and N were estimated for south-eastern Manitoba using both the SLC and detailed soil survey data (Figure 12). Initial (visual) comparison clearly indicates the greater detail of mapping in the municipal soil surveys. Nonetheless, there is some (visual) agreement in the delineation between broad soil types (boundaries of soil mapping units from SLC were overlaid onto the municipal surveys; see Figure 12). More importantly, three is general agreement in the location of sensitive areas (critical load < 500 molc ha–1 yr–1).

32
Despite the general commonalties between both maps, there are significant differences in the estimated critical load (Figure 12). Surprisingly, the critical load estimates for the detailed soil surveys are more uncertain (less reliable). Although the municipal soil surveys have a much greater spatial delineation (small scale), the readily available supporting data (such as soil depth) is limited. The differences between both maps are potentially dictated by the limited data for the detailed soil surveys. Nonetheless, greater resolution maps (with supporting data) are more desirable for mapping critical load; however, municipal soil surveys are generally limited to agricultural areas and without detailed supporting data, uncertainty in critical load estimates will not be improved. To further assess the adequacy of the SLC, percent clay estimates derived from the regional maps were (visually) compared with estimates from plot observations (percent clay is the principal determinant of soil weathering rate; see Section 6.2). Weighted percent clay was estimated for all soil profile observations obtained from the FEC plots in Saskatchewan (N = ~1700) and the NFI plots in Manitoba (n = ~100). Point estimates of percent clay were overlaid onto the regional (SLC) estimates (Figure 13). In general there is reasonable (visual) agreement between the point and regional estimates of percent clay. Moreover, there is strong agreement between the high and low percent clay areas across both maps (point and regional). At best, the soil information associated with the mapping units on the SLC represents the modal, or average, soil condition. In reality, there may be considerable variability within each mapping unit. This is somewhat supported by the soil observations, which show considerable variation within each mapping unit despite showing general (average) agreement. 7.3. Regional Deposition Estimates Deposition fields for Manitoba and Saskatchewan were available from three sources: EC; ADOM and the RELAD model. EC have estimated wet and dry deposition for the major ions in precipitation (Ca2+, Mg2+, K+, Na+, Cl–, NH4+, NO3
– and SO42–) on a 35 km ×
35 km grid scale. ADOM estimates wet sulphate and nitrate deposition on a 127 km × 127 km grid scale. The RELAD model estimates wet and dry sulphate and nitrate deposition on approximately a 50 km × 110 km grid scale (see Figure 14). The Environment Canada estimates are available on the finest grid scale and for all major ions in precipitation. The EC fields were interpolated for a limited number of stations (see Appendix II); however, in general concentrations are spatially coherent and have regional patterns that vary in a smooth and systematic way over the course of a season or year. On the other hand, the variation in precipitation quantity (and deposition velocity) occurs over a much smaller scale than the variation in concentration (Whelpdale and Kaiser 1996). Thus, in regions with dense precipitation-monitoring networks (and modelled deposition velocity), regional wet (and dry) deposition can be more accurately estimated by combining grided fields of concentration with finer scale precipitation (and deposition velocity) data. The EC deposition field estimates are consistent with the deposition fields used in the eastern Canada critical load assessment; as such, the EC deposition fields have been used to estimate critical load and exceedance under the current assessment. Nonetheless, it is important to compare the available deposition estimates. Wet sulphate, which is common to all three sources for approximately the same period (EC: 1994–1998, ADOM: 1997, RELAD: 2000), was mapped for comparison (Figure 14). The magnitude of wet deposition is similar between the three estimates, with an average
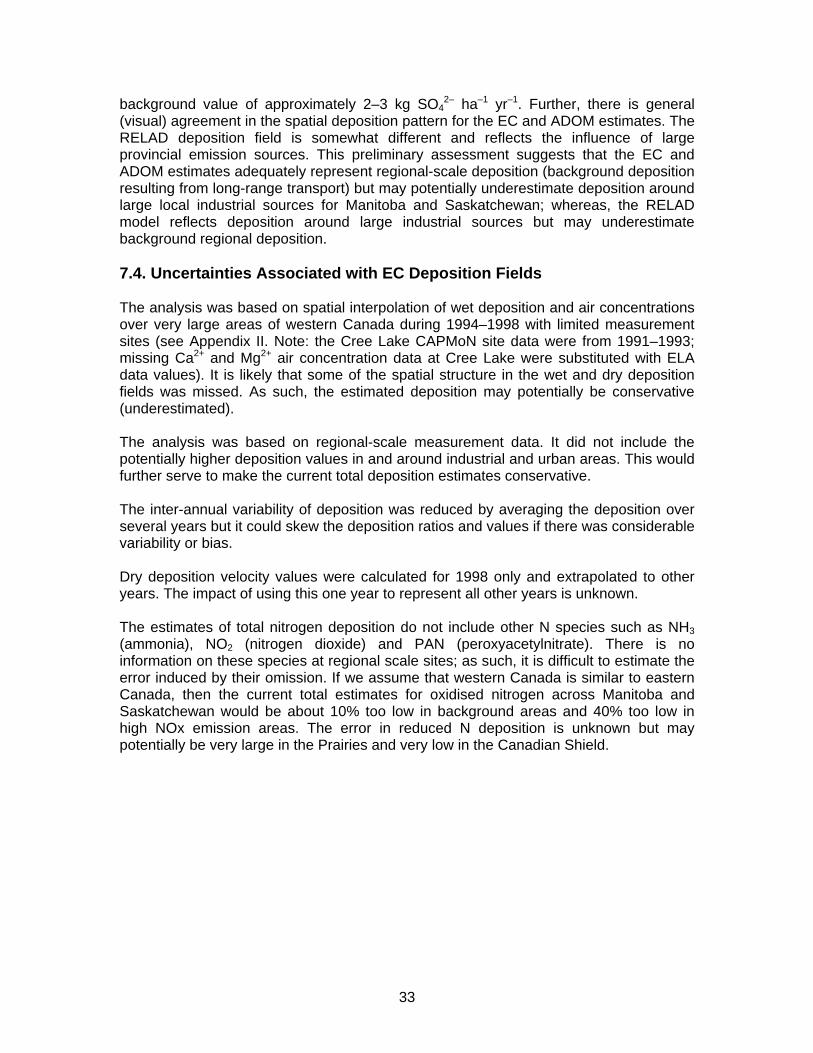
33
background value of approximately 2–3 kg SO42– ha–1 yr–1. Further, there is general
(visual) agreement in the spatial deposition pattern for the EC and ADOM estimates. The RELAD deposition field is somewhat different and reflects the influence of large provincial emission sources. This preliminary assessment suggests that the EC and ADOM estimates adequately represent regional-scale deposition (background deposition resulting from long-range transport) but may potentially underestimate deposition around large local industrial sources for Manitoba and Saskatchewan; whereas, the RELAD model reflects deposition around large industrial sources but may underestimate background regional deposition. 7.4. Uncertainties Associated with EC Deposition Fields The analysis was based on spatial interpolation of wet deposition and air concentrations over very large areas of western Canada during 1994–1998 with limited measurement sites (see Appendix II. Note: the Cree Lake CAPMoN site data were from 1991–1993; missing Ca2+ and Mg2+ air concentration data at Cree Lake were substituted with ELA data values). It is likely that some of the spatial structure in the wet and dry deposition fields was missed. As such, the estimated deposition may potentially be conservative (underestimated). The analysis was based on regional-scale measurement data. It did not include the potentially higher deposition values in and around industrial and urban areas. This would further serve to make the current total deposition estimates conservative. The inter-annual variability of deposition was reduced by averaging the deposition over several years but it could skew the deposition ratios and values if there was considerable variability or bias. Dry deposition velocity values were calculated for 1998 only and extrapolated to other years. The impact of using this one year to represent all other years is unknown. The estimates of total nitrogen deposition do not include other N species such as NH3 (ammonia), NO2 (nitrogen dioxide) and PAN (peroxyacetylnitrate). There is no information on these species at regional scale sites; as such, it is difficult to estimate the error induced by their omission. If we assume that western Canada is similar to eastern Canada, then the current total estimates for oxidised nitrogen across Manitoba and Saskatchewan would be about 10% too low in background areas and 40% too low in high NOx emission areas. The error in reduced N deposition is unknown but may potentially be very large in the Prairies and very low in the Canadian Shield.

34
Figure 12. Comparison of critical load of sulphur and nitrogen for south-eastern Manitoba (molc ha–1 yr–1) estimated from (detailed) municipality soil surveys and the Soil Landscapes of Canada (SLC). Soil polygon outlines are taken from the SLC version 2.2. The more detailed (higher resolution) soil survey information somewhat corresponds to the generalised soil polygons from the SLC (1:1,000,000). Detailed soil survey information was taken from 31 municipality surveys (Alexander, Argyle, Brokenhead, De Salaberry, Dufferin, Franklin, Grey, Hanover, La Broquerie, Lac Du Bonnet, Lorne, Louise, Macdonald, Montcalm, Morris, Pembina, Pinawa, Piney, Reynolds, Rhineland, Ritchot, Riverside, Roblin, Roland, Stanley, Ste. Anne, Strathcona, Stuartburn, Thompson, Turtle Mountain, Whitemouth; see Figure A9 in Appendix I).

35
Figure 13. Comparison of regional estimates of average percent clay derived from the Soil Landscapes of Canada, version 2.1 and plot estimates of percent clay derived from the Forest Ecosystem Classification (FEC) plots for Saskatchewan and the National Forest Inventory (NFI) plots for Manitoba (n = 1780). Plot estimates are also overlaid on the regional map; in general there is good (visual) agreement between regional and point estimates. Map Projection: UTM Zone 13. Datum: NAD83.

36
Figure 14. Comparison of wet sulphate deposition (kg ha–1 yr–1) estimates for Manitoba and Saskatchewan derived from interpolated deposition and concentration fields (Environment Canada (EC); 1994–1998; 35 km × 35 km); the Acid Deposition and Oxidant Model (ADOM; 1997; 127 km × 127 km) and the REgional Lagrangian Acid Deposition model (RELAD; 2000; 50 km × 110 km). Map Projection: UTM Zone 13. Datum: NAD83.

37
8. Conclusion Critical load of acid deposition (and exceedance) for upland forest soils in Manitoba and Saskatchewan were determined and mapped following the methodology and guidelines established by the NEG-ECP. The mean critical load for Manitoba and Saskatchewan was estimated at 1259 and 1151 molc ha–1 yr–1, respectively. Mean annual total S and N deposition was 145 and 211 molc ha–1 yr–1 for Manitoba and 152 and 163 molc ha–1 yr–1 for Saskatchewan for the period 1994–1998. Approximately 7% of the mapped soils receive acid deposition in excess of critical load in Manitoba and 2% in Saskatchewan. It could be argued that the current estimates of exceedance are somewhat conservative (underestimated). At best, the mapped soil information, which underlies the critical load estimates, represent the ‘average’ soil. In reality, there is considerable variability within each soil mapping unit. This is supported by the point observations, which show considerable variation within each mapping unit. In addition, the spatial interpolation of wet deposition and air concentrations over western Canada was based on limited measurement sites and it is likely that some of the spatial structure in the deposition fields was missed. As such, the estimated deposition may potentially be conservative. The determination and mapping of critical load (and exceedance) for Manitoba and Saskatchewan built upon work in eastern Canada. As such, it is logical to ask how the mapping compares for both regions. In general terms, the resultant maps for Manitoba and Saskatchewan are consistent to those for eastern Canada. The critical load estimates (based on the SLC) are consistent with the resolution used for Ontario. Similarly, the EC deposition field estimates are consistent with the deposition fields used in the eastern Canada critical load assessment. Furthermore, the critical load and exceedance estimates for Manitoba and Saskatchewan are within the range of values estimated for provinces in eastern Canada (e.g., New Brunswick and Nova Scotia). Finally, it is important to note that the resultant maps, similar to those for eastern Canada, represent a broad-scale regional assessment of critical load of S and N for upland forest soils and are not intended for site-specific assessments. Furthermore, the critical load and exceedance estimates should be viewed somewhat as a starting point in the critical load process and not the end-point. In eastern Canada, work is currently underway to improve upon the initial maps.

38
9. Recommendations A number of future research needs are recommended to address data limitations or knowledge-gaps, and to provide more robust or improved estimates of critical load and exceedance. The recommendations refer both to the critical load assessment for Manitoba and Saskatchewan, and a Canada-wide assessment. Additional atmospheric monitoring sites are required to reduce uncertainty in the estimated deposition fields. It is recommended that four monitoring sites be added to the existing CAPMoN network to improve estimates for the Prairie Provinces: three sites across northern Manitoba, Saskatchewan and Alberta, and one site in southern Alberta. Additional sites are required to provide deposition estimates for British Columbia. In addition, it is recommend that there be greater co-ordination between mapped and modelled deposition fields to allow future assessments of sulphur and nitrogen under proposed emission scenarios to be incorporated into Canada-wide critical load assessments. Ultimately this will require continental-scale atmospheric models. It is recommended that the regional critical load maps are verified through existing and new data collections. Critical loads should be determined for all available plot-level data from provincial and federal networks for comparison with regional estimates. It is noted that the collation and processing of these data is a formidable task. Further, it is recommended that sampling of soils and waters is undertaken at selected sites (catchments) in Manitoba and Saskatchewan where critical loads are determined to be low (or exceeded). Co-ordination of soil and water samples (i.e., catchment sampling) will provide data for additional weathering rate methods and future dynamic modelling assessments. It is recommended that provincial maps of critical load and exceedance only present data for the relevant receptor ecosystems (i.e., upland mineral forest soils). Although this may sacrifice or lessen the aesthetic value of these maps, it is unacceptable to present information for receptor ecosystems that do not have appropriately defined critical chemical limits. Further, it is recommended that the existing protocol be extended to include additional receptor ecosystems. Ultimately regional (spatial) estimates of critical load may only be improved through access to better quality (higher resolution) soil maps. However, outside of agriculture regions it is unlikely that detailed soil maps will be available. As such, it is highly recommended that an alternative ‘soil point’ approach is investigated (developed) to estimate critical load and exceedance for upland forest soils. Extensive soil information (qualitative and quantitative) is available through provincial and federal networks (e.g., ecosystems classification plots, national forest inventory). The utility and quality of these data should be assessed with the objective of estimating plot-level critical loads. This approach would allow for more comparable critical loads between provinces (currently limited by inconsistent data resolution for soils). The approach is more consistent with critical load estimates for surface waters and would allow for a greater integration of both data sets. In addition, the approach will provide a structure for future dynamic modelling assessments. It is highly recommended that nitrogen parameter values be reassessed under any forthcoming Canada-wide critical load assessment. The proposed assessment should
39
attempt to define (or recommend) parameter values for multiple receptor ecosystems. Similarly, it is also recommend that the fixed values used for the determination of the critical alkalinity leaching be reviewed and evaluated for multiple receptor ecosystems. The link between the chemical criterion and the biological indicator, i.e., the critical limit, requires further investigation and verification. It is recommended that nutrient uptake maps be produced for western and eastern Canada. Knowledge of nutrient pools and fluxes in forest ecosystems is lacking. It is recommended that a database containing available information on nutrients in forest vegetation from across Canada be compiled, from which maps of nutrient uptake and pools can be derived, and from which impacts of forest management on critical loads can be estimated. Further, the impact of fire requires investigation. It is recommended that a technical working group be formed to discuss, co-ordinate and develop a framework for western or Canada-wide critical loads (aquatic and terrestrial). The recent initiative by the task group to initiate an informal science network to discuss acid deposition and critical loads is applauded. However, there is a further need for a focused working group mandated to revise and extend the existing methodology and guidelines, and to integrate critical loads for terrestrial and aquatic ecosystems. It should be noted that a Canada-wide framework would not restrict greater detail at the provincial level but rather would ensure a more comparable and consistent base level approach between provinces across Canada. Ideally, the task group would also be a focal centre for co-operation with the United States and Europe on related critical load activities.

40
References Aherne J, Watmough SA 2005a. Calculating Critical Loads of Acid Deposition for Forest Soils in
Manitoba and Saskatchewan: A Preliminary Study on Data Sources and Limitations. Interim Report, Environmental and Resource Studies, Trent Univeristy, Peterborough, Ontario, 24pp.
Aherne J, Watmough SA 2005b. Critical loads of acidity for North America. Conference Abstracts, Acid Rain 2005, 7th International Conference on Acid Deposition. Prague, Czech Republic, 12–17 June 2005, p. 476.
Aherne J, Clair TA, Dennis IF, Gilliss M, Couture S, McNicol D, Weeber R, Dillon PJ, Keller W, Jeffries DS, Page S, Timoffee K, Cosby BJ 2005. Dynamic Modelling of Lakes in Eastern Canada. In, M. Posch, J. Slootweg and J.P. Hettelingh (editors) Modelling and mapping of critical thresholds in Europe: status report 2005, pp. 77–84. Co-ordination Centre for Effects, Netherlands Environmental Assessment Agency, Bilthoven, The Netherlands.
CASA 1999. Application of Critical, Target, and Monitoring Loads for the Evaluation and Management of Acid Deposition. Target Loading Subgroup, Clean Air Strategic Alliance (CASA), Edmonton, Alberta 67pp.
Environment Canada 2004. Canadian Acid Deposition: Science Assessment. Environment Canada Meteorological Service of Canada. Issued on CD-ROM, 479pp.
Federer CA 1982. Transpirational supply and demand: Plant, soil, and atmospheric effects evaluated by simulation. Water Resources Research 18(2): 355–362.
Helliwell RC, Ferrier RC, Jenkins A 1998. A comparison of methods for estimating soil characteristics in regional acidification models: an application of the MAGIC model to Scotland. Hydrolgy and Earth Systems Science 2, 509–520.
Hornung M, Sutton MA, Wilson RB (eds) 1995. Mapping and Modelling of Critical Loads for Nitrogen: A Workshop Report. Proceedings of the Grange-over-Sands Workshop 24–26 October 1994. Institute for Terrestrial Ecology, United Kingdom, 207pp.
Mitchell TD, Carter TR, Jones PD, Hulme M, New M .2004 A Comprehensive Set of High-Resolution Grids of Monthly Climate for Europe and the Globe: the Observed Record (1901–2000) and 16 Scenarios (2001–2100). Tyndall Centre for Climate Change Research, Working Paper 55, 25pp.
NEG-ECP 2001. Critical Load of Sulphur and Nitrogen Assessment and Mapping Protocol for Upland Forests. New England Governors and eastern Canadian Premiers Environment Task Group, Acid Rain Action Plan, Halifax, Canada.
Ouimet R 2005. Cartographie des Charges Critiques d’Acidité des Forêts: Deuxième Approximation. Gouvernement du Québec Ministère des Ressources naturelles et de la Faune. Direction de la recherche forestière. Rapport interne n° 487, 48pp.
Ouimet R, Arp PA, Watmough SA, Aherne J, DeMerchant I 2006. Determination and mapping critical loads of acidity and exceedances for upland forest soils in Eastern Canada. Water Air and Soil Pollution, in press.
Prentice IC, Sykes MT, Cramer W 1993. A simulation model for the transient effects of climate change on forest landscapes. Ecological Modelling 65: 51–70.
Ro CU, Vet RJ 2002 Analyzed data fields from the National Atmospheric Chemistry Database (NAtChem) and Analysis Facility. Air Quality Research Branch, Meteorological Service of Canada, Environment Canada, Toronto, Ontario.
Skeffington RA 2006. Quantifying uncertainty in critical loads: (A) Literature review. Water Air and Soil Pollution 169, 3–24.
Skeffington RA, Whitehead PG, Abbot J 2006. Quantifying uncertainty in critical loads: (B) Acidity mass balance critical loads on a sensitive site. Water Air and Soil Pollution 169, 25–46.

41
Sverdrup H, de Vries W, Henriksen A 1990. Mapping Critical Loads. Miljörapport 1990:14. Nordic Council of Ministers, Copenhagen, 124pp.
Turchenek LW, Abboud SA 2001. Site-specific Critical Loads of Acid Deposition on Soils in the Provost-Esther Area, Alberta. AGRA Earth & Environmental Ltd and Alberta Research Council, Edmonton, Alberta, 128pp.
UBA 1993. Manual on Methodologies and Criteria for Mapping Critical Levels/Loads and Geographical Areas where they are Exceeded. Federal Environmental Agency (Umweltbundesamt), Berlin, Germany, 109pp.
UBA 1996. Manual on Methodologies and Criteria for Mapping Critical Levels/Loads and Geographical Areas where they are Exceeded. Federal Environmental Agency (Umweltbundesamt), Berlin, Germany, 144pp.
UBA 2004. Manual on Methologies and Criteria for Modelling and Mapping Critical Loads and Levels and Air Pollution Effects, Risks and Trends. Federal Environmental Agency (Umweltbundesamt), Berlin, Germany (online: www.icpmapping.org).
Vet RJ, Shaw M 2004. 1994–1998 Average Dry Deposition Velocities Calculated using the MSC Air Quality Research Branch Dry Deposition Model (RDM). Meteorological Service of Canada, Environment Canada, Toronto, Ontario.
Whelpdale DM, Kaiser MS (editors) 1996. Global Acid Deposition Assessment. Global Atmosphere Watch No. 106, World Meteorological Organisation, 241pp.

42
Appendix I Supplemental regional data inputs (maps) and supporting data maps. Figure A1. Mean annual total (wet and dry) deposition for base cations. Figure A2. Mean annual total (wet and dry) deposition for chloride. Figure A3. Mean annual average temperature. Figure A4. Base cation weathering. Figure A5. Long-term mean annual precipitation surplus. Figure A6. Mean annual total (wet and dry) deposition for sulphate. Figure A7. Mean annual total (wet and dry) deposition for nitrogen. Figure A8. Mean annual total (wet and dry) deposition for sulphate for eastern Canada. Figure A9. Regional municipal boundaries for Manitoba.
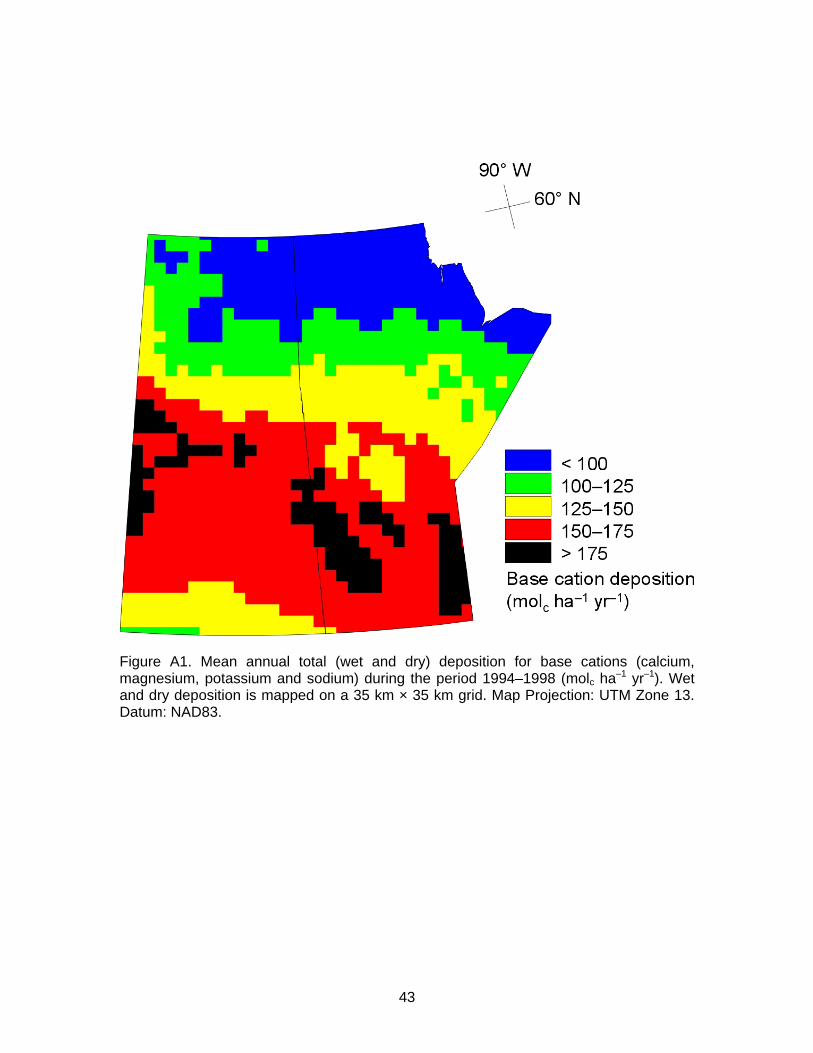
43
Figure A1. Mean annual total (wet and dry) deposition for base cations (calcium, magnesium, potassium and sodium) during the period 1994–1998 (molc ha–1 yr–1). Wet and dry deposition is mapped on a 35 km × 35 km grid. Map Projection: UTM Zone 13. Datum: NAD83.

44
Figure A2. Mean annual total (wet and dry) deposition for chloride during the period 1994–1998 (molc ha–1 yr–1). Wet and dry deposition is mapped on a 35 km × 35 km grid. Map Projection: UTM Zone 13. Datum: NAD83.

45
Figure A3. Mean annual average temperature during the period 1971–2000 (°C). The long-term mean was generated from a high-resolution grid of monthly temperature (1901–2000) at a spatial resolution of 0.5 degrees for the global land surface (Mitchell et al., 2004). Temperature is mapped on a 35 km × 35 km grid. Map Projection: UTM Zone 13. Datum: NAD83.

46
Figure A4. Base cation (calcium, magnesium, potassium and sodium) weathering rate (molc ha–1 yr–1) within the top 75 cm of soils for Manitoba and Saskatchewan. Soil information was taken from the Soil Landscapes of Canada (SLC), version 2.1. Using semi-quantitative methods, soil weathering rates (derived from percent clay and substrate type) were allocated to soil types. Percent clay were vertically (soil horizons excluding the C horizon) and spatially (component soil types within a mapping unit) weighted to derive a single average value for each mapping unit on the SLC map. Weathering rate was estimated following Ouimet (2005). The base weathering rate was further modified for temperature (Ouimet 2005). Map Projection: UTM Zone 13. Datum: NAD83.

47
Figure A5. Long-term mean annual precipitation surplus or runoff during the period 1971–2000 (mm) estimated from long-term precipitation minus (modelled) actual evapotranspiration. Actual evapotranspiration was estimated from potential evapotranspiration and soil moisture following Federer (1982) and Prentice et al. (1993). Precipitation surplus estimates were provided by M. Posch, Co-ordination Centre for Effects, The Netherlands. Long-term climate variables were generated from high-resolution grids at a spatial resolution of 0.5 degrees for the global land surface (Mitchell et al. 2004). Precipitation surplus is mapped on a 35 km × 35 km grid. Map Projection: UTM Zone 13. Datum: NAD83.
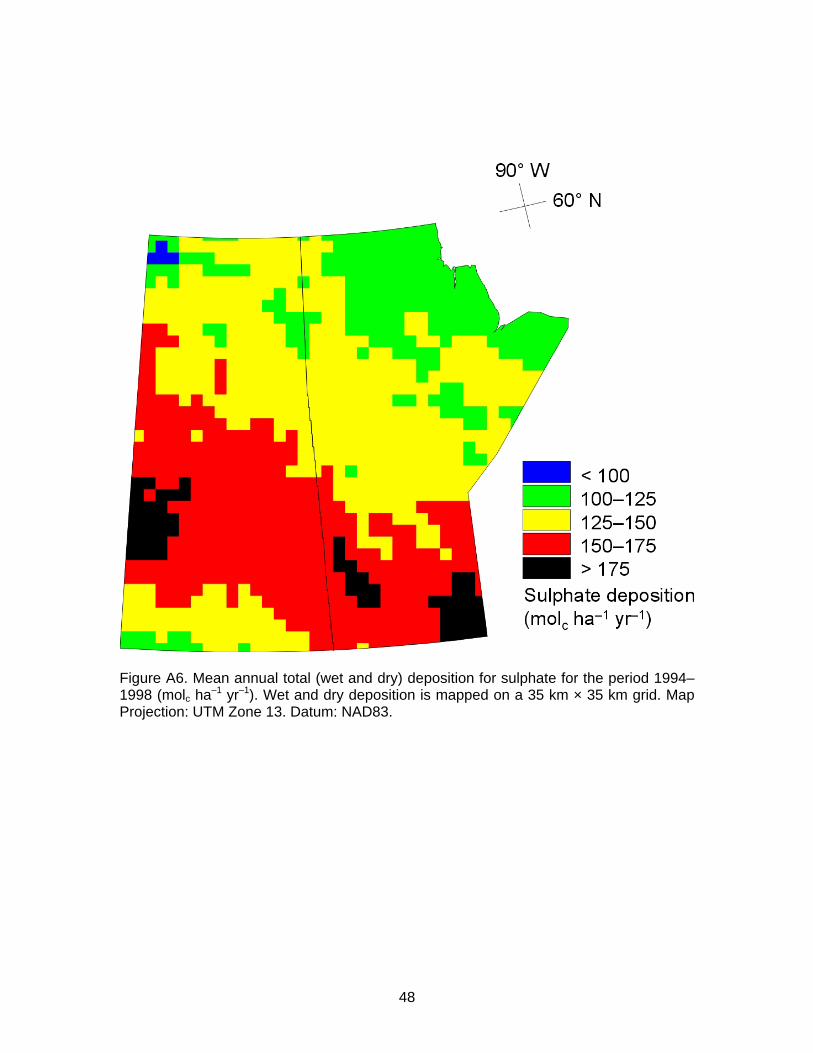
48
Figure A6. Mean annual total (wet and dry) deposition for sulphate for the period 1994–1998 (molc ha–1 yr–1). Wet and dry deposition is mapped on a 35 km × 35 km grid. Map Projection: UTM Zone 13. Datum: NAD83.

49
Figure A7. Mean annual total (wet and dry) deposition for nitrogen (nitrate, ammonium and nitric acid) during the period 1994–1998 (molc ha–1 yr–1). Wet and dry deposition is mapped on a 35 km × 35 km grid. Map Projection: UTM Zone 13. Datum: NAD83.

50
Figure A8. Mean annual total (wet and dry) deposition for sulphate for the period 1994–1998 (molc ha–1 yr–1) for eastern Canada. Sulphate deposition in eastern Canada is considerably greater than Manitoba and Saskatchewan. The lowest deposition mapping class for eastern Canada encompasses the range of deposition for Manitoba and Saskatchewan (see Figure A6). Wet and dry deposition is mapped on a 45 km × 45 km grid (Aherne et al. 2005).

51
Figure A9. Regional municipal boundaries for Manitoba. Municipal soil survey information was used to generate high-resolution critical loads of sulphur and nitrogen for southeastern Manitoba (see Figure 12, Section 7.2). Source: web2.gov.mb.ca/mli/ soils/index.html

52
Appendix II List of monitoring sites used to generate the EC deposition fields

53
Sites used for Manitoba-Saskatchewan Deposition Estimates
Air concentration values of Ca and Mg at Cree Lake were estimated using data from E.L.A.Data used: Cree Lake: 1991–1993, all other sites:1994–1998Air concentration values of Ca and Mg at Cree Lake were estimated using data from E.L.A.
Dry Wet
CA CL HNO3 K MG NA NH4 NO3 SO2nssSO4 CA CL K MG NA NH4 NO3
nssSO4
Station NetworkB W CANOE AREA IMPR * * * * * * * *
BADLANDS NAT PK IMPR * * * * * * * *
BEAVERLODGE ABPM * * * * * * * *
BROCHET B MAPN * * * * * * * *
CAMP RIPLEY NADP * * * * * * * *
CASTLEGAR BCPM * * * * * * * *
CEDAR CREEK NADP * * * * * * * *
CHASSELL NADP * * * * * * * *
CLANCY NADP * * * * * * * *
COLD LAKE ABPM * * * * * * * *
COTTONWOOD NADP * * * * * * * *
Cree Lake CAPM * * * * * * * * * * * * * * * * * *
DRAYTON VALLEY ABPM * * * * * * * *
E.L.A. CAPM * * * * * * * * * * * * * * * * * *
Esther CAPM * * * * * * * * * * * * * * * * * *
FERNBERG NADP * * * * * * * *
FOND DU LAC NADP * * * * * * * *
FORT CHIPEWYAN ABPM * * * * * * * *
FORT MCMURRAY B ABPM * * * * * * * *
FORT VERMILLION ABPM * * * * * * * *
GERALDTON APIC * * * * * * * *
GIVE OUT MORGAN NADP * * * * * * * *
GLACIER N.P. NADP * * * * * * * *
GLACIER NP CAST * *
IMPR * * * * * * * *
GRINDSTONE LAKE NADP * * * * * * * *
HAVRE EXPERIMENT NADP * * * * * * * *
HIGH PRAIRIE ABPM * * * * * * * *
HOVLAND NADP * * * * * * * *
HURON WELL FIELD NADP * * * * * * * *
ICELANDIC NADP * * * * * * * *
ISLE ROYALE B NADP * * * * * * * *
Island Lake CAPM * * * * * * * *
KANANASKIS ABPM * * * * * * * *
LAMBERTON NADP * * * * * * * *
LITTLE BIG HORN NADP * * * * * * * *
LOST TRAIL PASS NADP * * * * * * * *
MARCELL NADP * * * * * * * *
McCreary CAPM * * * * * * * *
NEWCASTLE NADP * * * * * * * *
PALOUSE FARM NADP * * * * * * * *
PERKINSTOWN CAST * * * * * * * * * * * *
POINT DU BOIS MAPN * * * * * * * *
RED DEER ABPM * * * * * * * *
ROOSEVELT N.P. B NADP * * * * * * * *
ROYAL PARK ABPM * * * * * * * *
SALMON & CHA NF IMPR * * * * *
SPOONER NADP * * * * * * * *
SUFFIELD ABPM * * * * * * * *
SULA RANGER DIS IMPR * * * * *
Snare Rapids CAPM * * * * * * * *
THEODORE ROOSEVELT N CAST * * * *
TROUT LAKE NADP * * * * * * * *
VOYAGEURS NP CAST * * * *
WOLF RIDGE NADP * * * * * * * *
WOODWORTH NADP * * * * * * * *
YELLOWSTONE NADP * * * * * * * *
YELLOWSTONE NP CAST *
IMPR * * * * * * * * *

54
Appendix III Online data sources Soils Soil Landscapes of Canada: http://sis.agr.gc.ca/cansis/nsdb/slc/intro.html Municipality soil maps for Manitoba: https://web2.gov.mb.ca/mli/soils/index.html Climate Global precipitation and temperature grids: www.cru.uea.ac.uk/cru/data/hrg.htm Long-term mean climate grids for Canada: www.glfc.cfs.nrcan.gc.ca/landscape Deposition Precipitation chemistry: www.msc.ec.gc.ca/natchem/precip/index_e.html Land cover North America land cover: http://edcsns17.cr.usgs.gov/glcc/ Geology Saskatchewan: www.infomaps.gov.sk.ca/website/SIR_Geological_Atlas/viewer.htm Manitoba: www.gov.mb.ca/iedm/mrd/geo/gis/geoscimaps.html
55
Appendix IV Presentation given at the Workshop on the Development of Critical Loads to Protect Canadian Ecosystems from Atmospheric Deposition of Sulphur and Nitrogen, November 6–7 2005, Calgary, Alberta.
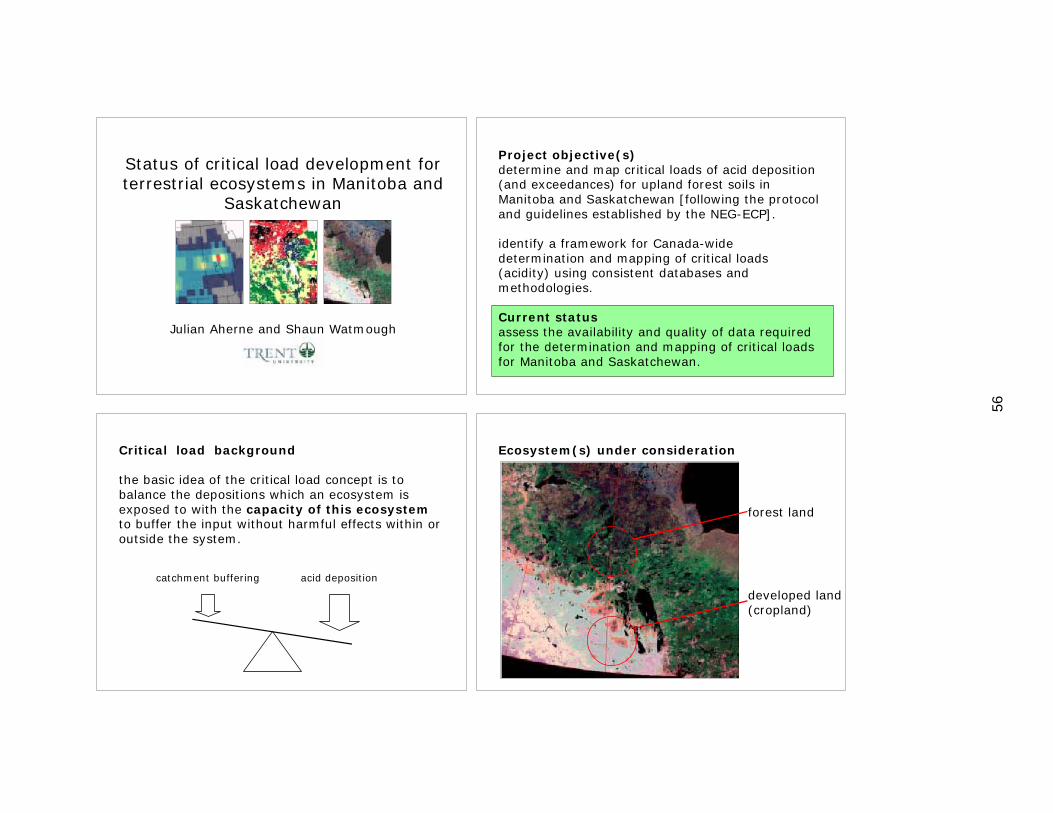
56
Status of critical load development forterrestrial ecosystems in Manitoba and
Saskatchewan
Julian Aherne and Shaun Watmough
Project objective(s)determine and map critical loads of acid deposition(and exceedances) for upland forest soils inManitoba and Saskatchewan [following the protocoland guidelines established by the NEG-ECP].
identify a framework for Canada-widedetermination and mapping of critical loads(acidity) using consistent databases andmethodologies.
Current statusassess the availability and quality of data requiredfor the determination and mapping of critical loadsfor Manitoba and Saskatchewan.
Critical load background
the basic idea of the critical load concept is tobalance the depositions which an ecosystem isexposed to with the capacity of this ecosystemto buffer the input without harmful effects within oroutside the system.
acid depositioncatchment buffering
Ecosystem(s) under consideration
forest land
developed land(cropland)

57
Applying the concept
critical loads are linked to an area representing one(or more) ecosystems, as such, they are bestrepresented as maps.
map-based data is veryefficiently handled witha Geographical InformationSystem (GIS).
Critical load methodology
CL(S + N) = BCdep – Cldep + BCw – Bcu + Ni + Nu + Nde – Alkle(crit)
base cation and chloride deposition
base cation weathering
base cation uptake
nitrogen immobilisation, uptake and denitrification
critical alkalinity leaching
Critical load methodology
further considerations under the NEG-ECP Protocol
CL(S + N) = BCdep – Cldep + BCw – Bcu + Ni + Nu + Nde – Alkle(crit)
CL(S + N) = BCdep – Cldep + BCw – Alkle(crit)
× × ××
Base cation and chloride deposition
deposition used in the critical load calculationsshould be non-anthropogenic, non-marinedeposition.
during the last two decades monitoring ofprecipitation chemistry has been carried out at 13sites across Manitoba and Saskatchewan. However,currently chemistry is monitored at one station onlyacross the region (Bratt's Lake, Saskatchewan). Inaddition, much of the historic data is subject todata quality issues.

58
Base cation and chloride deposition
acceptable data is available from (approximately)five stations during the early 1990s.
15 µmolc L–1 (base cations)
5 µmolc L–1 (base cations)
Base cation weathering rate
weathering refers to the release of base cationsfrom minerals in the soil. There are numerousmethods for determining weathering rates.
methods suitable for regional applications aresemi-empirical or estimate weathering rate frommore readily available (mapped) data.
under the NEG-ECP assessment, weathering ratesfor eastern Canada were estimated using soil typeand texture method.
< 2525–5050–100100–200> 200
Base cation weathering rate
mmolc m–2 yr–1
Base cation weathering rate
limitations: only two spatially consistent soildatabases are available for (western) Canada, bothat very coarse resolutions.
the Soils Landscape of Canada (SLC, scale1:1,000,000) was produced by generalisingdetailed soil survey data.
the national ecological framework: ecodistrict soilsinformation available is a further generalisation ofthe SLC map with a scale of 1:2,000,000 (benefitsfrom an attribute database).

59
Critical alkalinity leaching
Alkle(crit) = –Q × (H+ + Al3+ [– HCO3– – RCOO])
precipitation surplus
aluminium (via Bc:Al ratio)
hydrogen (gibbsite relationship)
the NEG-ECP protocol used a Bc:Al ratio of 10 anda log Kgibb of 9.
precipitation surplus is the amount of waterpercolating from the root zone.
Critical load exceedance
Exc = Sdep + Ndep – CL(S + N)
observations of sulphur and nitrogen deposition forthe determination of exceedance, are very limitedfor Manitoba and Saskatchewan (and westernCanada).
a number of regional acid deposition models havebeen used in Canada to investigate the aciddeposition issue.
Critical load exceedance
models: RELAD and ADOM both cover (a significantproportion of) Manitoba and Saskatchewan.
sulphur wet deposition (kmolc ha–1 yr–1)

60
Conclusion
critical loads of acid deposition (and exceedances)for upland forest soils in Manitoba andSaskatchewan can be determined and mapped usingexisting (available) data sources. Very coarse basecation and chloride deposition fields will begenerated for the limited observations. The SoilLandscapes of Canada will be used to estimated soilweathering rate. The critical alkalinity leaching willbe generated from the default values as proposedby the NEG-ECP protocol. The resulting critical loadswill be compared with modelled deposition fields forsulphur and nitrogen (RELAD and ADOM) toestimate exceedance.
Recommendations #1
1. soil and water sampling is undertaken at selectedsites in Manitoba and Saskatchewan where criticalloads are determined to be low (or exceeded).
2. available plot data (ARNEWS or NFI) be used tovalidate the regional critical load mapping.
3. the national ecological framework be furtherinvestigated for Canada-wide critical loads.
4. a comparison of RELAD and ADOM model outputsbe carried out for common domain regions.
Recommendations #2
5. nutrient uptake maps be produced for western(and eastern) Canada.
6. nitrogen parameter values be reassessed under a(future) Canada-wide critical load assessment.
7. a technical working group be formed to discuss(co-ordinate) and develop a framework for westernor Canada-wide critical loads.
Acknowledgements
Canadian Council of Ministers of the Environment(funding); Meteorological Service of Canada;Canadian National Atmospheric Chemistry(NAtChem) Precipitation Database (precipitationchemistry); Agriculture and Agri-Food Canada (SoilLandscapes of Canada and the National EcologicalFramework); United Status Geological Survey (landcover); The Prairie Farm RehabilitationAdministration (PFRA), Agriculture and Agri-FoodCanada (runoff and land cover).

61
Appendix V Critical load maps for Canada (Saskatchewan, Manitoba, Quebec, New Brunswick, Newfoundland, Nova Scotia and Prince Edward Island).

Figure A10. Critical load of sulphur and nitrogen for (upland mineral) forest soils in Canada (molc ha–1 yr–1). Map combines the outputs from this report (Manitoba and Saskatchewan) with existing maps for eastern Canada. Note the critical load maps (and critical load exceedances) for eastern Canada were produced through the New England Governors and Eastern Canadian Premiers (NEG/ECP) Acid Rain Action Plan, in collaboration with Environment Canada (see Ouimet et al. (2006) for further details).


![Basic concepts: Acid-Base chemistry & pH 1.Recognizing acid/base and conjugate base/acid 2.Calculation of pH, pOH, [H 3 O + ], [OH - ] 3.Calculating pH](https://img.pdfslide.us/doc/110x75/56649cfe5503460f949cee87/basic-concepts-acid-base-chemistry-ph-1recognizing-acidbase-and-conjugate.jpg)
![Acids, Bases, and Salts Properties of Acids, Bases and Salts Calculating pH, pOH, [H 3 O + ], [OH - ] Calculating pH, pOH, [H 3 O + ], [OH - ] Acid-Base](https://img.pdfslide.us/doc/110x75/56649e625503460f94b5e04e/acids-bases-and-salts-properties-of-acids-bases-and-salts-calculating-ph.jpg)