Embed Size (px)
Citation preview

2008-2009 PROGRESS REPORT
ON THE CANADA-WIDE
ACID RAIN STRATEGY FOR POST-2000
PN 1458 ISSN 1911-1541 PDF
© Canadian Council of Ministers of the Environment 2011

The Canadian Council of Ministers of the Environment (CCME) is the major intergovernmental forum in Canada for discussion and joint action on environmental issues of national, international and global concern. The 14 member governments work as partners in developing nationally consistent environmental standards, practices and legislation.
Canadian Council of Ministers of the Environment 123 Main St., Suite 360 Winnipeg, Manitoba R3C 1A3 Telephone: (204) 948-2090 Fax: (204) 948-2125 www.ccme.ca PN 1458 ISSN 1911-1541 PDF Ce document est également publié en français.
© Canadian Council of Ministers of the Environment 2011
ii

The Canada-Wide Acid Rain Strategy for Post-2000 In October 1998, federal, provincial, and territorial Energy and Environment Ministers signed The Canada-Wide Acid Rain Strategy for Post 2000. The primary long-term goal of The Strategy is “to meet the environmental threshold of critical loads for acid deposition across Canada”. As steps towards the achievement of this goal, The Strategy calls for a number of actions, including:
• Pursuing further emission reduction commitments from the United States;
• Establishing new sulphur dioxide (SO2) emission reduction targets in eastern Canada;
• Preventing pollution, and keeping “clean” areas clean; • Ensuring the adequacy of acid rain science and monitoring
programs; and, • Annually reporting on SO2 and nitrogen oxides (NOx) emissions
and forecasts, on compliance with international commitments, and on progress in implementing The Strategy.
iii

Table of Contents 1. Introduction ............................................................................................................... 1
1.1. Background ........................................................................................................... 1
1.2. Highlights of the 08/09 Progress Report ............................................................... 1
1.3. The Strategy ......................................................................................................... 2
1.4. Delivery of The Strategy ....................................................................................... 2
1.5. The ARTG’s approach for coordinating the implementation of The Strategy ........ 3
2. State of acid rain in Canada ..................................................................................... 5
2.1. Emissions of acidifying pollutants ......................................................................... 5
2.2. Deposition of acidifying pollutants ....................................................................... 13
2.3. Ecosystem critical loads and exceedances ......................................................... 17
3. Domestic Emission Reduction Efforts and Efforts to Keep Clean Areas Clean and Prevent Pollution............................................................................................................ 19
3.1. Provincial efforts ................................................................................................. 19
3.1.1. Ontario ..................................................................................................... 20 3.1.2. Québec ..................................................................................................... 22 3.1.3. New Brunswick ......................................................................................... 24 3.1.4. Nova Scotia .............................................................................................. 26 3.1.5. Newfoundland and Labrador .................................................................... 28 3.1.6. British Columbia ....................................................................................... 29 3.1.7. Alberta ...................................................................................................... 30 3.1.8. Saskatchewan .......................................................................................... 32 3.1.9. Manitoba .................................................................................................. 33
3.2. Federal Commitment .......................................................................................... 34
4. Continuing science on acid rain causes and impacts ............................................. 36
4.1. National Acid Rain Science Plan ......................................................................... 36
4.1.1. Progress in the modelling and mapping of terrestrial critical loads and exceedances .......................................................................................................... 37 4.1.2. Workshop on the adequacy of current approaches to assess critical loads of acidity ................................................................................................................. 38 4.1.3. Western Canada Sulphur and Nitrogen Deposition Workshop ................. 39 4.1.4. Understanding the role of nitrogen ........................................................... 39
5. Next steps............................................................................................................... 39
iv
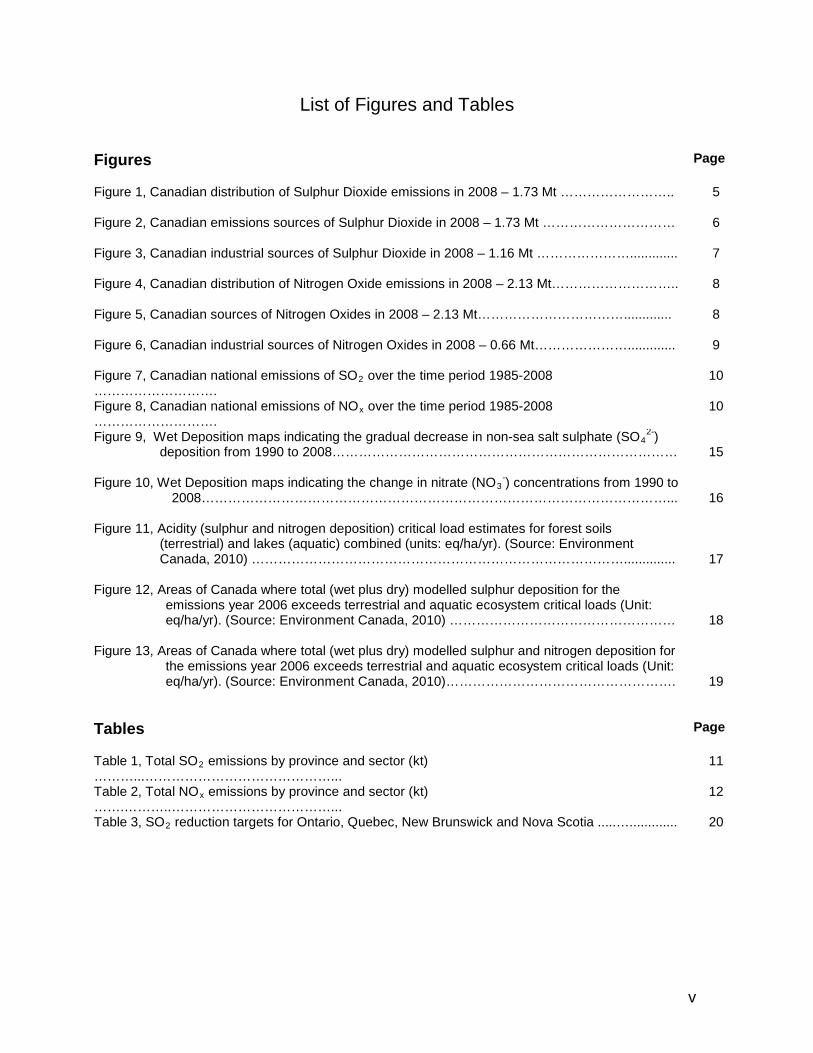
List of Figures and Tables
Tables
Page
Table 1, Total SO2 emissions by province and sector (kt) ………...……………………………………...
11
Table 2, Total NOx emissions by province and sector (kt) …….………..………………………………...
12
Table 3, SO2 reduction targets for Ontario, Quebec, New Brunswick and Nova Scotia .....…............. 20
Figures
Page
Figure 1, Canadian distribution of Sulphur Dioxide emissions in 2008 – 1.73 Mt …………………….. 5
Figure 2, Canadian emissions sources of Sulphur Dioxide in 2008 – 1.73 Mt ………………………… 6
Figure 3, Canadian industrial sources of Sulphur Dioxide in 2008 – 1.16 Mt …………………............. 7
Figure 4, Canadian distribution of Nitrogen Oxide emissions in 2008 – 2.13 Mt……………………….. 8
Figure 5, Canadian sources of Nitrogen Oxides in 2008 – 2.13 Mt……………………………............. 8
Figure 6, Canadian industrial sources of Nitrogen Oxides in 2008 – 0.66 Mt…………………............. 9
Figure 7, Canadian national emissions of SO2 over the time period 1985-2008 ……………………….
10
Figure 8, Canadian national emissions of NOx over the time period 1985-2008 ……………………….
10
Figure 9, Wet Deposition maps indicating the gradual decrease in non-sea salt sulphate (SO42-)
deposition from 1990 to 2008……………………………………………………………………
15
Figure 10, Wet Deposition maps indicating the change in nitrate (NO3-) concentrations from 1990 to
2008……………………………………………………………………………………………...
16
Figure 11, Acidity (sulphur and nitrogen deposition) critical load estimates for forest soils (terrestrial) and lakes (aquatic) combined (units: eq/ha/yr). (Source: Environment Canada, 2010) …………………………………………………………………………..............
17
Figure 12, Areas of Canada where total (wet plus dry) modelled sulphur deposition for the emissions year 2006 exceeds terrestrial and aquatic ecosystem critical loads (Unit: eq/ha/yr). (Source: Environment Canada, 2010) ……………………………………………
18
Figure 13, Areas of Canada where total (wet plus dry) modelled sulphur and nitrogen deposition for the emissions year 2006 exceeds terrestrial and aquatic ecosystem critical loads (Unit: eq/ha/yr). (Source: Environment Canada, 2010)…………………………………………….
19
v

1. Introduction
1.1. Background The Canada-Wide Acid Rain Strategy for Post-2000 (hereafter called The Strategy), was signed on October 19, 1998, by all 26 Canadian Energy and Environment Ministers to provide a framework for the long-term management of acid rain in Canada. The Strategy was developed in response to the recognition by science and policy communities in the 1990s1 that although acidifying emission control programs in both Canada and the United States were successfully meeting targets and caps, substantially greater reductions would be needed in order to halt acid rain damage in eastern Canada. The body mandated to coordinate the implementation of The Strategy is the Canadian Council of Ministers of the Environment (CCME) Acid Rain Task Group (ARTG)2. Since the inception of The Strategy, the ARTG has been reporting to Ministers and the Canadian public on progress made on achieving the commitments made under The Strategy and on sulphur dioxide (SO2) and nitrogen oxide (NOx) emissions and forecasts. Originally produced on an annual basis, the Progress Report is now a biennial publication beginning with the 2006/07 report, alternating with the biennial Canada – United States Air Quality Agreement progress report which presents similar information.
1.2. Highlights of the 08/09 Progress Report This report provides a summary of activities contributing to the implementation of The Strategy in 2008 and 2009. An effort has been made to present an overview of the latest scientific knowledge on acid deposition to provide the reader with knowledge of “what has been done” and “what remains to be done” with respect to ensuring deposition levels do not exceed critical loads anywhere in Canada, which is the long-term goal of The Strategy. Also readers will find emissions of SO2 and NOx by province/territory and major emitting sector, as well as a graphical representation of changes in national SO2 and NOx emissions over the past 20 years. This progress report highlights recent actions taken to reduce emissions of acidifying pollutants in provinces in the sulphur oxide management area (SOMA). This report also focuses on the commitments by other jurisdictions under The Strategy to keep clean areas clean and prevent pollution. These commitments are becoming increasingly important in light of findings that areas of Manitoba and Saskatchewan, namely downwind of major pollution sources, could be receiving levels of acid deposition in excess of critical loads. Given the fact that emissions of acidifying
1 For example, the 1997 Canadian Acid Rain Assessment (Environment Canada, 1998) indicated that large areas of eastern Canada continued to receive “twice as much sulphate as the local lakes and wetlands can tolerate without suffering long-term damage.” 2 Formerly known as the Acidifying Emissions Task Group.
1
pollutants are predicted to rise in western Canada due to a growing economy and population, it is clear that more needs to be done to understand the potential for acid rain damage in these “clean” regions.
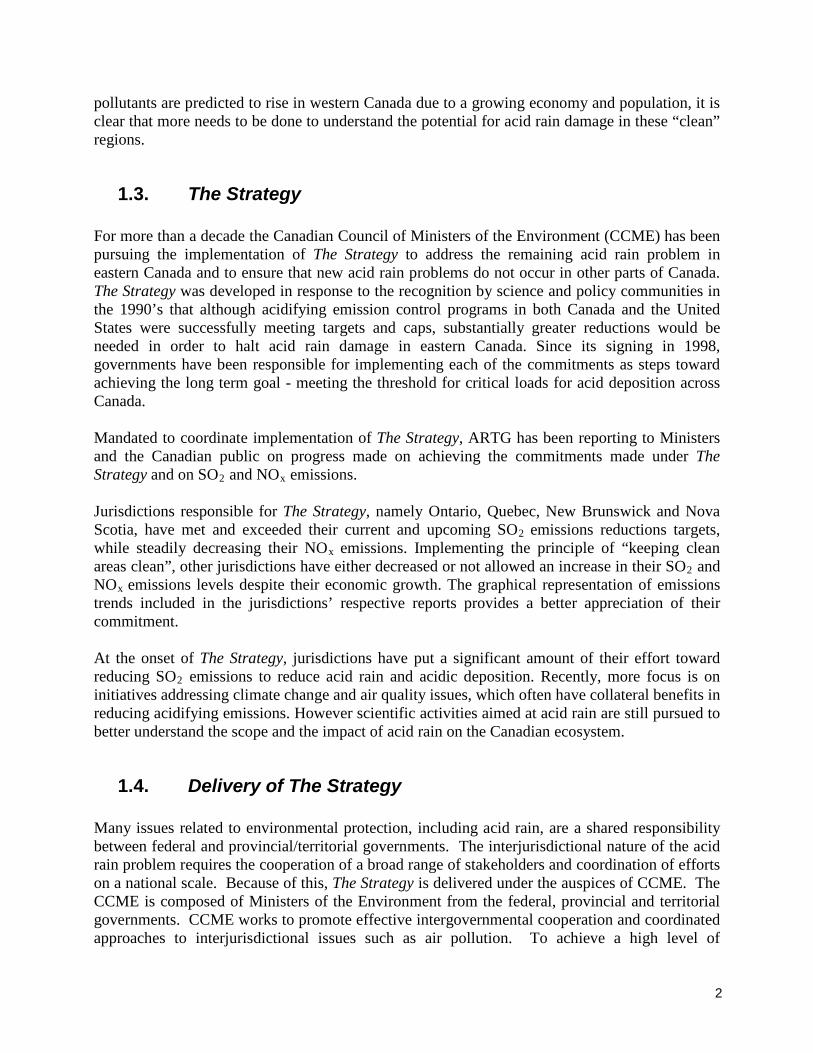
1.3. The Strategy For more than a decade the Canadian Council of Ministers of the Environment (CCME) has been pursuing the implementation of The Strategy to address the remaining acid rain problem in eastern Canada and to ensure that new acid rain problems do not occur in other parts of Canada. The Strategy was developed in response to the recognition by science and policy communities in the 1990’s that although acidifying emission control programs in both Canada and the United States were successfully meeting targets and caps, substantially greater reductions would be needed in order to halt acid rain damage in eastern Canada. Since its signing in 1998, governments have been responsible for implementing each of the commitments as steps toward achieving the long term goal - meeting the threshold for critical loads for acid deposition across Canada. Mandated to coordinate implementation of The Strategy, ARTG has been reporting to Ministers and the Canadian public on progress made on achieving the commitments made under The Strategy and on SO2 and NOx emissions. Jurisdictions responsible for The Strategy, namely Ontario, Quebec, New Brunswick and Nova Scotia, have met and exceeded their current and upcoming SO2 emissions reductions targets, while steadily decreasing their NOx emissions. Implementing the principle of “keeping clean areas clean”, other jurisdictions have either decreased or not allowed an increase in their SO2 and NOx emissions levels despite their economic growth. The graphical representation of emissions trends included in the jurisdictions’ respective reports provides a better appreciation of their commitment. At the onset of The Strategy, jurisdictions have put a significant amount of their effort toward reducing SO2 emissions to reduce acid rain and acidic deposition. Recently, more focus is on initiatives addressing climate change and air quality issues, which often have collateral benefits in reducing acidifying emissions. However scientific activities aimed at acid rain are still pursued to better understand the scope and the impact of acid rain on the Canadian ecosystem.
1.4. Delivery of The Strategy Many issues related to environmental protection, including acid rain, are a shared responsibility between federal and provincial/territorial governments. The interjurisdictional nature of the acid rain problem requires the cooperation of a broad range of stakeholders and coordination of efforts on a national scale. Because of this, The Strategy is delivered under the auspices of CCME. The CCME is composed of Ministers of the Environment from the federal, provincial and territorial governments. CCME works to promote effective intergovernmental cooperation and coordinated approaches to interjurisdictional issues such as air pollution. To achieve a high level of
2
environmental quality across the country, CCME establishes nationally-consistent environmental standards, strategies and objectives. The Air Management Committee was established under CCME to manage intergovernmental approaches to air quality issues in Canada, excluding climate change. AMC manages air-related Canada-wide standards, the work of air-related working groups and serves as the forum for federal-provincial-territorial dialogue on significant air issues. AMC also recommends priorities for cooperative action on existing and new air quality issues, potentially including the development of national plans or strategies to address these priorities and potential mechanisms to accomplish them. ARTG is a working group reporting to AMC. In support of its role of coordinating The Strategy and reporting biennially on progress, ARTG: • provides advice on the implementation of steps aimed at achieving the long-term goal of The
Strategy • undertakes stakeholder consultations as outlined in its work plan • recommends revisions to The Strategy as required to better meet its objectives, • identifies emerging issues related to acid deposition • tracks acid rain related science developments and provides advice on appropriate response to
AMC.
1.5. The ARTG’s approach for coordinating the implementation of The Strategy
In order to ensure that the long-term goal of not exceeding critical loads is achieved, The Strategy commits federal, provincial and territorial Ministers of Environment and Energy to: • pursue further emission reduction commitments from the United States • establish new SO2 emission reduction targets in eastern Canada • prevent pollution, and keep “clean” areas clean • ensure the adequacy of acid rain science and monitoring programs • report on SO2 and NOx emissions and forecasts, on compliance with international
commitments, and on progress in implementing The Strategy. The Strategy describes in detail the importance of these commitments in terms of the overall objective of meeting critical loads, however it does not associate timeframes with each commitment or break down the commitments into the specific tasks. Since its inception, the ARTG has worked toward accomplishing commitments made in The Strategy by undertaking tasks within its purview, such as: • funding work by consultants to advance knowledge of the role of nitrogen in acidification and
to develop and map critical loads and exceedances for western Canada • hosting a workshop in March 2009 on Acid deposition critical loads: Status of methods and
indicators. The purpose of the workshop was to discuss critical loads of sulphur and nitrogen acidity in order to assess the adequacy of current approaches and to develop recommendations on how to improve critical load estimates for Canadian ecosystems
3
• hosting a workshop in partnership with the Wood Buffalo Environmental Association and the Cumulative Environmental Management Association in April 2009. The purpose of the workshop was to examine the state of the science on atmospheric deposition of sulphur and nitrogen and ecosystem impacts in Western Canada, discuss policy implications, and identify areas for future science and policy concentration.
In 2006 ARTG completed a five-year review of The Strategy. Together with the 2004 Canadian Acid Deposition Science Assessment, ARTG undertook to define The Strategy commitments in terms of the specific actions or tasks required to achieve them in a Long-Term Strategic Plan. ARTG uses the Long-Term Strategic Plan as a tool for planning yearly work activities and for ensuring these activities are targeted toward achieving the goals of The Strategy. ARTG also considers it to be a set of recommendations to the governments that signed The Strategy of the specific actions that are required in order to successfully meet the long-term goal of eliminating critical load exceedances. The Long-Term Strategic Plan is posted on CCME’s website at: (http://www.ccme.ca/assets/pdf/artg_long_term_stratplan_e.pdf).
4
2. State of acid rain in Canada
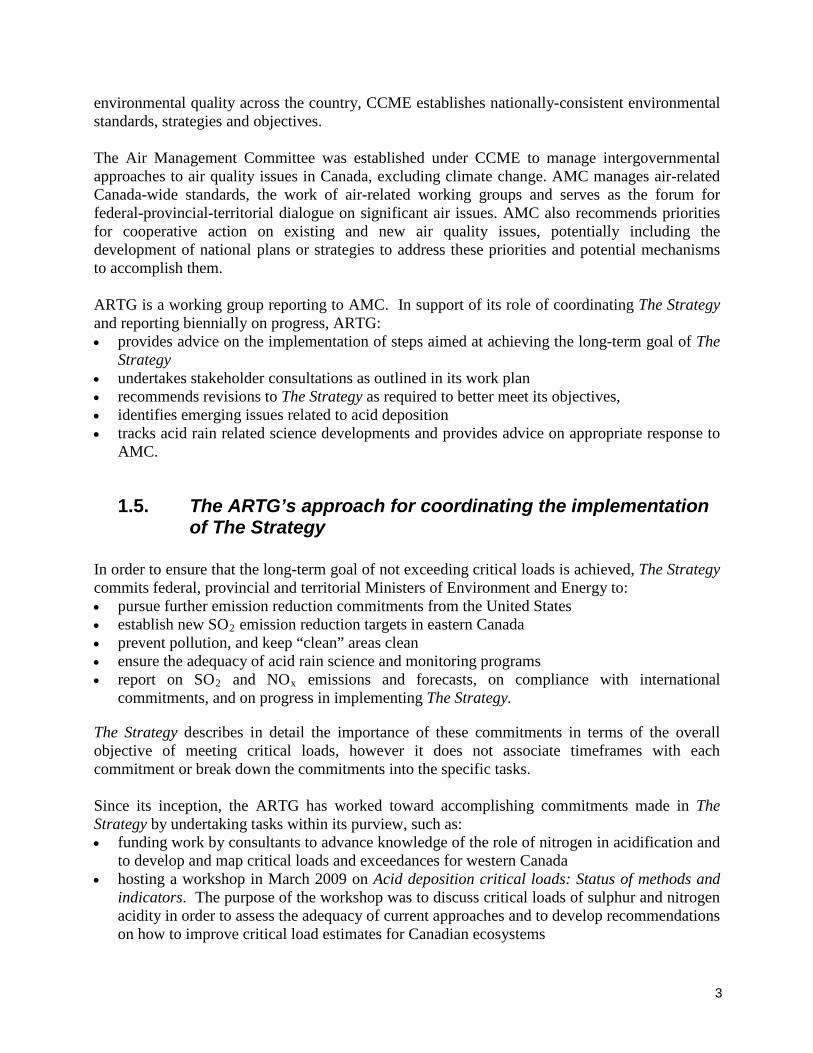
2.1. Emissions of acidifying pollutants The federal government in collaboration with the provinces and territories has made great strides in reducing emissions of acidifying pollutants since the height of the acid rain problem in the 70’s and 80’s and in fine-tuning the monitoring, measurement and reporting of these emissions. Despite these efforts, emissions of acidifying pollutants such as SO2 and NOx continue to negatively impact the health of Canadians and the environment. A detailed breakdown of the national SO2 and NOx emissions is provided in the following charts. The distribution of SO2 emissions by province3 across Canada in 2008 is presented in Figure 1. The provinces of Alberta, Ontario and Manitoba accounted for 64% of the total SO2 emissions in Canada.
Figure 1, Canadian distribution of Sulphur Dioxide emissions in 2008 – 1.73 Mt Source: 2008 CAC emissions for Canada, Pollution Data Division, Environment Canada (October 2010)
The relative contributions by source for SO2 emissions across Canada in 2008 are shown in Figure 2. As can be seen, the largest contributors come from industrial sources (almost 2/3 of the total emissions) and more than one quarter of the SO2 emissions come from the non-industrial
3 Prince Edward Island and the territories account for less than 1% of the total SO2 emissions and are not shown on the chart.
Distribution of SO2 Emissions in Canada in 2008
AB 22%
BC 6%
MB 20%
ON 22%
QC 10%
SK 7%
NS 8%
NB 3%NL 2%
5

sources such as electric power generation. Electric power generation contributes 430 kilotonnes (kt) of the 1732 kt total SO2 emissions.
Figure 2, Canadian emissions sources of Sulphur Dioxide in 2008 – 1.73 Mt Source: 2008 CAC emissions for Canada, Pollution Data Division, Environment Canada (October 2010)
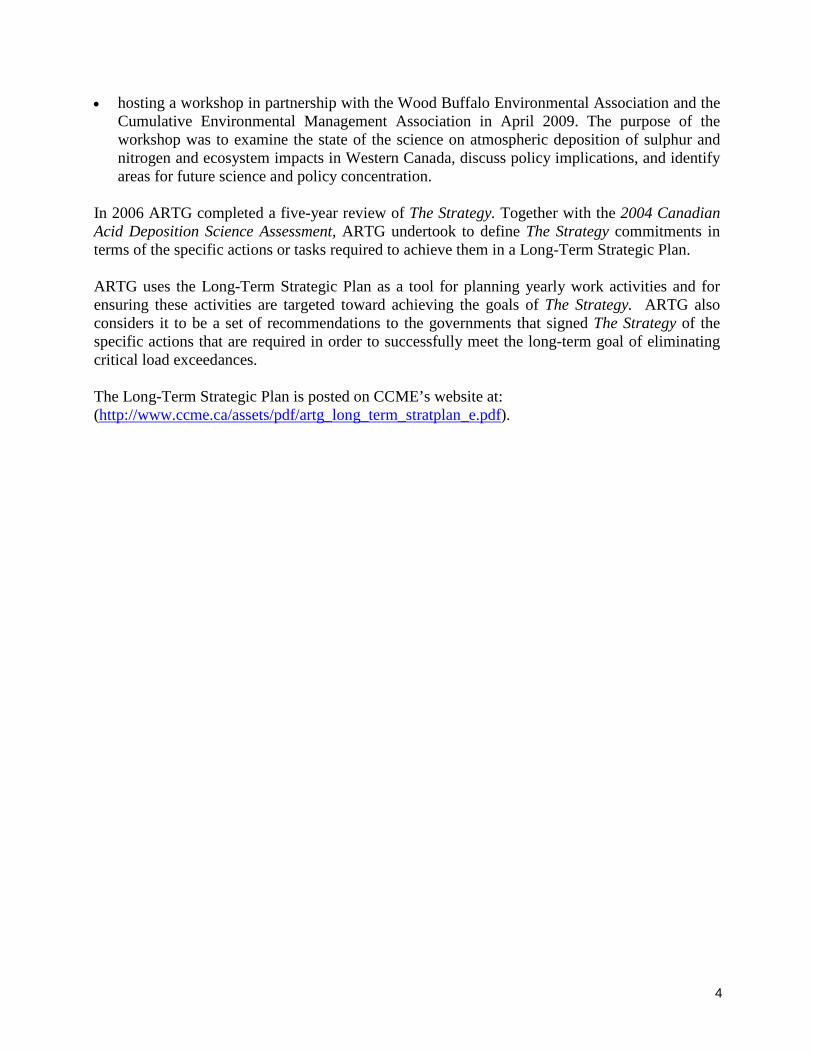
Figure 3 provides a more detailed breakdown of the SO2 emissions from industrial sources. The largest contributors from this group are non-ferrous smelting and refining and the upstream petroleum industries, which account for almost 75% of the industries emissions. Other contributors include downstream petroleum and aluminum both contributing over 5% of the total industrial emissions. Other minor contributors, totalling approximately 13% of the total emissions from industrial sources included in Other Industries are pulp and paper, cement and concrete, iron and steel, iron ore mining and chemicals.
Canadian SOx Emission Sources in 2008 - 1.73Mt total
Other Industrial Sources
33%
Mobile Sources and Other minor
contributors6%
Other Non-Industrial Sources
3%Electric Power Generation
25%
Non-Ferrous Smelting and
Refining33%
6
Figure 3, Canadian industrial sources of Sulphur Dioxide in 2008 – 1.16 Mt Source: 2008 CAC emissions for Canada, Pollution Data Division, Environment Canada (October 2010)
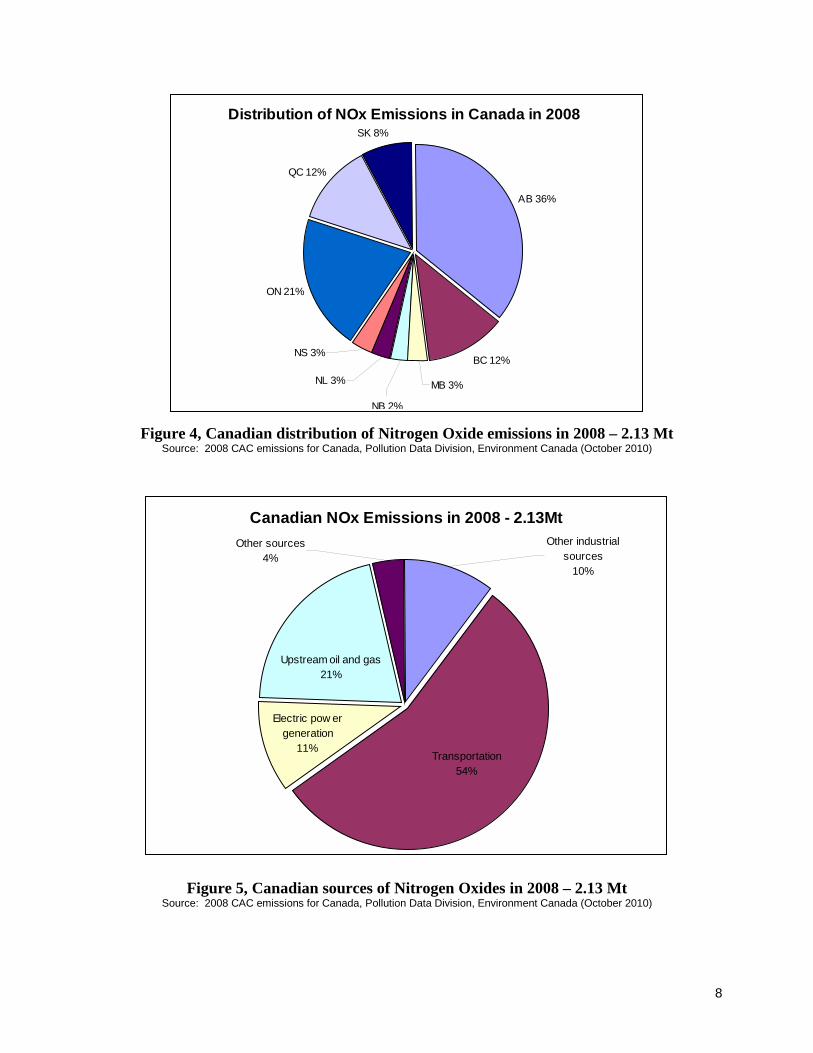
The distribution of NOx emissions by province4 across Canada is presented in Figure 4. The largest contributing provinces are Alberta at 36% followed by Ontario at 21% and then British Columbia and Québec each contributing 12%. The provinces of Saskatchewan, Manitoba, New Brunswick, Nova Scotia and Newfoundland and Labrador account for the remaining 19% of the total emissions. This emission breakdown is consistent with the 2006-07 Acid Rain Progress Report. Figure 5 presents the relative contribution by source of the NOx emissions across Canada. Whereas transportation was a minor contributor to SO2 emissions, it is by far the largest contributor to NOx emissions, accounting for 54% of the Canadian total. Other large contributing sources include the electric power generation and the upstream oil and gas sectors, accounting for 11% and 21% of the national total respectively. The transportation category which includes the emissions from aircrafts, marine, on-road and off-road vehicles account for 1.1 megatonnes (Mt) of the 2.3 Mt of NOx released in Canada in 2008. A more detailed breakdown of the industrial emissions for 2008 is provided in Figure 6. The upstream petroleum industry accounted for 67% (444kt) of the industrial NOx emissions. Other industrial sectors such as cement and concrete (6%), pulp and paper (5%), petroleum product transportation and distribution (5%), downstream petroleum (4%), chemicals (3%), mining and rock quarrying (2%), iron ore mining (2%) and several others below 2% contributed to the remaining 220kt released in 2008.
4 Prince Edward Island and the territories account for approximately 1% of the total NOx emissions and are not shown on the chart.
Canadian Industrial Sources of SO2 in 2008
Total Other Industries
13%
Upstream Petroleum
25%
Non-Ferrous Smelting and
Refining49%
Downstream Petroleum
7%
Aluminum 6%
7
Distribution of NOx Emissions in Canada in 2008
AB 36%
BC 12%
ON 21%
QC 12%
SK 8%
MB 3%NL 3%
NB 2%
NS 3%
Figure 4, Canadian distribution of Nitrogen Oxide emissions in 2008 – 2.13 Mt Source: 2008 CAC emissions for Canada, Pollution Data Division, Environment Canada (October 2010)
Figure 5, Canadian sources of Nitrogen Oxides in 2008 – 2.13 Mt
Source: 2008 CAC emissions for Canada, Pollution Data Division, Environment Canada (October 2010)
Canadian NOx Emissions in 2008 - 2.13MtOther sources
4%Other industrial
sources10%
Upstream oil and gas21%
Electric pow er generation
11%Transportation
54%
8
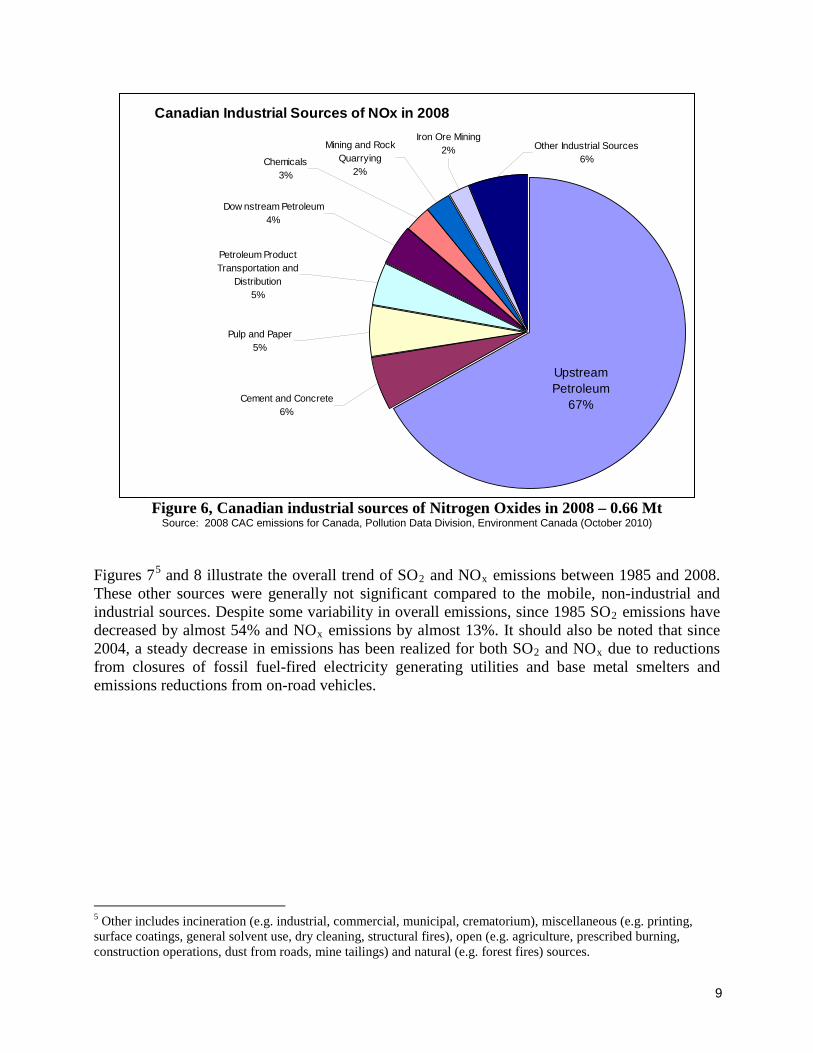
Figure 6, Canadian industrial sources of Nitrogen Oxides in 2008 – 0.66 Mt Source: 2008 CAC emissions for Canada, Pollution Data Division, Environment Canada (October 2010)
Figures 75 and 8 illustrate the overall trend of SO2 and NOx emissions between 1985 and 2008. These other sources were generally not significant compared to the mobile, non-industrial and industrial sources. Despite some variability in overall emissions, since 1985 SO2 emissions have decreased by almost 54% and NOx emissions by almost 13%. It should also be noted that since 2004, a steady decrease in emissions has been realized for both SO2 and NOx due to reductions from closures of fossil fuel-fired electricity generating utilities and base metal smelters and emissions reductions from on-road vehicles.
5 Other includes incineration (e.g. industrial, commercial, municipal, crematorium), miscellaneous (e.g. printing, surface coatings, general solvent use, dry cleaning, structural fires), open (e.g. agriculture, prescribed burning, construction operations, dust from roads, mine tailings) and natural (e.g. forest fires) sources.
Canadian Industrial Sources of NOx in 2008
Chemicals3%
Other Industrial Sources6%
Mining and Rock Quarrying
2%
Iron Ore Mining2%
Dow nstream Petroleum4%
Petroleum Product Transportation and
Distribution5%
Pulp and Paper5%
Cement and Concrete6%
Upstream Petroleum
67%
9

National SO2 Trend 1985 to 2008
0
500000
1000000
1500000
2000000
2500000
3000000
3500000
4000000
1985
1987
1989
1991
1993
1995
1997
1999
2001
2003
2005
2007
Year
Emis
sion
s (t
onne
s)
OtherMobileNon-IndustrialIndustrial
Figure 7. Canadian national emissions of SO2 over the time period 1985-2008 Source: 2010 National Pollutant Release Inventory – Air Pollutant Emission Summaries and Trends, November 2010
(Does not include Incineration, Miscellaneous, Open or Natural Sources)
National NOx Trend 1985 to 2008
0
500000
1000000
1500000
2000000
2500000
3000000
3500000
1985
1987
1989
1991
1993
1995
1997
1999
2001
2003
2005
2007
Year
Emis
sion
s (to
nnes
) Other
Mobile
Non-Industrial
Industrial
Figure 8. Canadian national emissions of NOx over the time period 1985-2008 Source: 2010 National Pollutant Release Inventory – Air Pollutant Emission Summaries and Trends, November 2010
(Does not include Incineration, Miscellaneous, Open or Natural Sources) Tables 1 and 2 below provide 2008 emissions data of SO2 and NOx for various source sectors for each province. Table 1 indicates that the SO2 emissions in 2008 are well below the national cap of 3.2 Mt and in fact, the total national emissions of SO2 (1.73 Mt) is below the established SOMA cap (1.75 Mt).
10

Table 1. Total SO2 emissions by province and sector (kt)
Caps Caps 1994-99 2005 2010/15 2008 1994-99 2005 2010/15 2008
British Columbia New Brunswick Upstream oil and gas 46 Non-ferrous mining and smelting 7 Non-ferrous mining and smelting 5 Pulp & Paper 7 Pulp & Paper 11 Electric power generation 23 Transportation 22 Other 12 Other 15 Total 175 122.5 87.5 49 Total N/A N/A N/A 99 Nova Scotia 2010 2015 Alberta Electric power generation 145 108.75 72.5 60.9 108 Upstream oil and gas 107 Other 29 Oil sands 116 Total 189 142 142 119.07 137 Electric power generation 124 Prince Edward Island Other 30 Electric power generation <0.5 Total N/A N/A N/A 377 Other 2 Saskatchewan Total 5 N/A N/A 2 Electric power generation 91 Newfoundland and Labrador Upstream oil and gas 21 Petroleum refining 13 Other 11 Iron ore mining 8 Total N/A N/A N/A 123 Electric power generation 5 Manitoba Other 17 Non-ferrous mining and smelting 346 Total 45 60 60 43 Other 4 Yukon Total 550 N/A N/A 350 Total N/A N/A N/A 1 Ontario Northwest Territories Non-ferrous mining and smelting 192 Mining and rock quarrying <0.5 Petroleum refining 34 Upstream oil and gas <0.5 Other industrial sources 54 Other <0.5 Electric power generation 76 Total N/A N/A N/A <0.5 Other 26 Nunavut Total 885 N/A 442.5 382 Total N/A N/A N/A <0.5 Quebec SOMA Non-ferrous mining and smelting 21 Total 1750 1750 1750 673 Aluminum industry 57 Canada
Petroleum refining 12 Total 3200 3200 3200 1733
Pulp & Paper 10 Other 71 Total 500 300 250 171
Note: Summing provincial sector values may not equal provincial totals and summing provincial totals may not equal Canada total, due to rounding. N/A = Not applicable
The emission summaries exclude emissions from open (e.g., landfills) and natural (e.g., forest fires) sources. The Newfoundland and Labrador cap is a provincial cap and is not part of The Canada-Wide Acid Rain Strategy. This cap does not include offshore sources which are not regulated by the Department of Environment and Conservation.
Source: 2008 data from the National Pollutant Release Inventory (NPRI), October 2010. National, provincial and territorial emissions inventories were developed collaboratively by Environment Canada and the different jurisdictions using information and statistics compiled through voluntary and mandatory surveys, permits, and models. Commencing in the year 2002, mandatory reported National Pollutant Release Inventory (NPRI) data by stationary point sources were used.
11

As shown in Table 2, national NOx emissions in 2008 totalled 2.1 Mt which is below the national cap of 2.5 Mt. The most significant source of NOx emissions in Canada continues to be the transportation sector, contributing to just slightly more than half of the national emissions total.
Table 2. Total NOx emissions by province and sector (kt) Caps Caps
1994 and
beyond 2008
1994 and
beyond 2008 British Columbia Nova Scotia
Stationary sources 92 Stationary sources 29
Transportation 163 Transportation 43 Total N/A 255 Total N/A 72
Alberta Prince Edward Island
Stationary sources 517 Stationary sources 1
Transportation 237 Transportation 5 Total N/A 754 Total N/A 6 Saskatchewan Newfoundland and Labrador
Stationary sources 65 Stationary sources 20
Transportation 100 Transportation 34 Total N/A 165 Total N/A 54 Manitoba Yukon
Stationary sources 8 Stationary sources <0.5
Transportation 59 Transportation 1 Total N/A 67 Total N/A 1 Ontario Northwest Territories
Stationary sources 138 Stationary sources 7
Transportation 297 Transportation 2 Total N/A 435 Total N/A 9 Quebec Nunavut
Stationary sources 63 Stationary sources 3
Transportation 195 Transportation 1 Total N/A 258 Total N/A 4 New Brunswick Canada Stationary sources 26 Total 2514 2135 Transportation 27 Total N/A 53
Note: Summing provincial sector values may not equal provincial totals and summing provincial totals may not equal Canada total, due to rounding.
N/A = Not applicable The emission summaries exclude emissions from open ( e.g., landfills) and natural (e.g., forest fires) sources. Source: 2008 data from the National Pollutant Release Inventory (NPRI), October 2010. National, provincial and territorial
emissions inventories were developed collaboratively by Environment Canada and the different jurisdictions using information and statistics compiled through voluntary and mandatory surveys, permits, and models. Commencing in the year 2002, mandatory reported National Pollutant Release Inventory (NPRI) data by stationary point sources were used.
12

With the growing population and economy in western Canada, emissions of acidifying pollutants are increasing in certain regions and this is causing concern that the western provinces (some of which have soils that are as susceptible to acid rain damage as in eastern Canada) may soon show signs of acidification comparable to what has been experienced in eastern Canada. For this reason, ARTG and other acid rain stakeholders across Canada are beginning to shift focus to western Canada, in terms of developing critical loads information and conducting other science activities.
2.2. Deposition of acidifying pollutants Acidifying emissions (namely SO2 and NOx) from point and area sources are deposited on the Earth’s surface (namely as sulphate (SO4
2-) and nitrate (NO3-)) in rain and snow, particles and
gases and/or in cloud water and fog. Temporal and spatial information on the total deposition of these pollutants is essential to be able to determine what areas of the country are susceptible to acid rain damage, as well as what changes can be observed based on past and proposed emission control actions. In Canada, wet deposition data are currently collected at over 70 sites across the country by the Canadian Air and Precipitation Monitoring Network (CAPMoN) and several provincial monitoring networks. Data from these networks as well as networks in the U.S. are stored in and analyzed by the Canadian National Atmospheric Chemistry (NAtChem) Database and Analysis Facility. The maps below provide a geographical comparison of wet deposition levels (kg/ha/yr) in North America from 1990 to 2008 (the most recent data year) for both non-sea salt sulphate and nitrate deposition. Some monitoring sites have been shut down over the years and large areas of Canada are not being monitored. Given the paucity of the data it is not possible to draw contour lines across Canada north of 49o N latitude; therefore, dots are plotted instead. The highest levels of wet non-sea-salt sulphate deposition have consistently occurred in eastern North America along a southwest to northeast axis (Figure 9). Non-sea-salt sulphate refers to sulphate that is attributed only to anthropogenic sources. The maps illustrate there have been significant reductions in wet non-sea-salt sulphate deposition in much of eastern Canada and the eastern United States over the last two decades resulting from SO2 emission reductions from the implementation of the Eastern Canadian Acid Rain Program, the Canada-wide Acid Rain Strategy and the U.S. Clean Air Act. In 2008, the acid-sensitive areas of the Canadian Shield in Ontario, Quebec, Nova Scotia and New Brunswick received less than 20 kg S/ha/yr. Similar to the wet sulphate deposition pattern, the highest levels of wet nitrate deposition occur in eastern North America (Figure 10). The maps clearly show a significant decline in wet nitrate deposition, particularly since 2000. In 2008, wet nitrate deposition over eastern Canada is also below 20 kg/ha/yr. Deposition data for the western provinces are very sparse, but generally speaking, both wet sulphate and wet nitrate deposition levels in western Canada are currently lower than in eastern Canada. Dry deposition patterns are not shown here; however, dry deposition constitutes a significant portion of total sulphur and total nitrogen deposition, particularly in western Canada. Total (wet + dry) deposition information is an essential
13

requirement to adequately assess ecosystem effects and sensitivity to acid deposition damage (i.e., critical load exceedances).
14

Figure 9 –Wet Deposition maps indicating the gradual decrease in non-sea salt sulphate (SO4
-) deposition from 1990 to 2008 (Source: Environment Canada, 2010).
15

Figure 10 –Wet Deposition maps indicating the change in nitrate (NO3
-) concentrations from 1990 to 2008 (Source: Environment Canada, 2010).
16

2.3. Ecosystem critical loads and exceedances Canada uses critical loads to assess the level of acidifying emission reductions required in order to protect sensitive ecosystems. A critical load is defined as the amount of acid deposition an ecosystem can withstand over the long-term before it is significantly harmed, and so is a measure of how sensitive an ecosystem is over the long-term. A critical load exceedance is a measurement of the amount of acid deposition received beyond this threshold (exceedance = acidifying deposition – critical load). Aquatic critical loads determined primarily in eastern Canada and expressed in terms of sulphur deposition only were influential during the development of The Strategy in the late 1990s. Since then, determination of critical loads has evolved to include forest ecosystems as well as the influence of nitrogen deposition. Critical load estimates are now available for aquatic and forest ecosystems in terms of total acid deposition, i.e., wet plus dry deposition of sulphur plus nitrogen (in equivalents/ha/yr) for eastern and western Canada (Figure 11).
Figure 11 - Acidity (sulphur and nitrogen deposition) critical load estimates for forest soils (terrestrial) and lakes (aquatic) combined (units: eq/ha/yr). (Source: Environment Canada, 2010). The critical load (CL) value shown in each grid square (Figure 11) is the lower value of either the 5th percentile aquatic critical load value or the 5th percentile terrestrial critical load value from the
A change in units Due to the fact that critical loads are now expressed for sulphur and nitrogen combined and these compounds have different atomic weights, the units used are now charge equivalents or moles of charge per hectare per year (eq/ha/yr or molc/ha/yr), both of which are interchangeable and used in this report. Combined critical loads can no longer be reported in kg/ha/yr as was done in the 1980s and 1990s. As a point of reference, however, 400 eq/ha/yr = 19.2 kg SO4
2-/ha/yr, which is close to the 1983 target of 20 kg wet SO4
2-/ha/yr.
17

distribution of values within each square. Choosing the 5th percentile value implies 95% ecosystem protection. The lower value is indicative of the most sensitive ecosystem. The majority of the mapped CL values are for forest soils given that soil data (based on land cover and soil landscape maps) are generally more available over a larger geographical area than lake chemistry data; however, the extremely low CL values (red squares) are commonly defined by lake CLs. Ecosystems with low critical loads (red, orange and yellow squares) occur in every Canadian province. The greatest concentration of extremely low critical values can be observed along the coastal mountains of BC; in northern SK and MB; and in various regions of ON, NL, NS, and southern NB. As new lake chemistry data becomes available from ongoing and planned surveys, it is likely that more grid squares with extremely low values will appear based on the current approach to characterize critical loads. Exceedances of combined ecosystem critical loads have been estimated based on total (both wet and dry) sulphur-only deposition (Figure 12) and total sulphur plus nitrogen deposition (Figure 13) generated by the air quality model AURAMS (A Unified Regional Air quality Modelling System) of Environment Canada for the emissions year 2006.
Figure 12 - Areas of Canada where total (wet plus dry) modelled sulphur deposition currently (2006 emissions) exceeds terrestrial and aquatic ecosystem critical loads (Unit: eq/ha/yr). (Source: Environment Canada, 2010) Sulphur deposition continues to be the primary agent responsible for ecosystem acidification in Canada6. As such, estimates of sulphur deposition in excess of critical loads are indicative of the immediate impact of current levels of acid deposition on the environment. Coloured areas on Figure 12 are currently at risk of continued and/or new damage from excess sulphur deposition (above the critical load) despite reductions in Canadian and U.S. emissions. These areas include
6 Jeffries, D.S., D.K. McNicol, R.C. Weeber (2005) Chapter 6: Effects on Aquatic Chemistry and Biology. In 2004 Canadian Acid Deposition Science Assessment. Downsview, Ontario: Environment Canada, Meteorological Service of Canada.
18
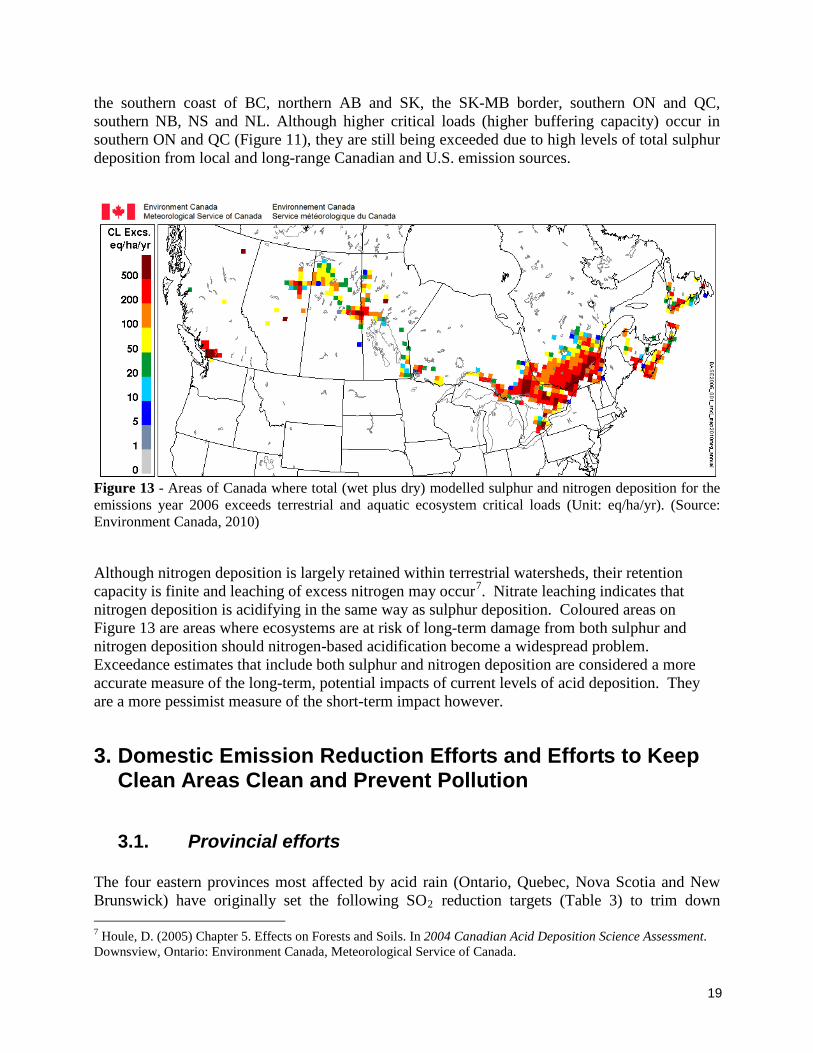
the southern coast of BC, northern AB and SK, the SK-MB border, southern ON and QC, southern NB, NS and NL. Although higher critical loads (higher buffering capacity) occur in southern ON and QC (Figure 11), they are still being exceeded due to high levels of total sulphur deposition from local and long-range Canadian and U.S. emission sources.
Figure 13 - Areas of Canada where total (wet plus dry) modelled sulphur and nitrogen deposition for the emissions year 2006 exceeds terrestrial and aquatic ecosystem critical loads (Unit: eq/ha/yr). (Source: Environment Canada, 2010)
Although nitrogen deposition is largely retained within terrestrial watersheds, their retention capacity is finite and leaching of excess nitrogen may occur7. Nitrate leaching indicates that nitrogen deposition is acidifying in the same way as sulphur deposition. Coloured areas on Figure 13 are areas where ecosystems are at risk of long-term damage from both sulphur and nitrogen deposition should nitrogen-based acidification become a widespread problem. Exceedance estimates that include both sulphur and nitrogen deposition are considered a more accurate measure of the long-term, potential impacts of current levels of acid deposition. They are a more pessimist measure of the short-term impact however.
3. Domestic Emission Reduction Efforts and Efforts to Keep Clean Areas Clean and Prevent Pollution
3.1. Provincial efforts
The four eastern provinces most affected by acid rain (Ontario, Quebec, Nova Scotia and New Brunswick) have originally set the following SO2 reduction targets (Table 3) to trim down
7 Houle, D. (2005) Chapter 5. Effects on Forests and Soils. In 2004 Canadian Acid Deposition Science Assessment. Downsview, Ontario: Environment Canada, Meteorological Service of Canada.
19

deposited levels as part of The Strategy. These provinces, along with the other jurisdictions affected to a lesser extent by this problem, have agreed to pursue a “keeping clean areas clean” (KCAC) principle and to take steps to ensure the pollution prevention approach is applied to new sources. Jurisdictions are to take steps necessary to ensure that all parts of Canada meet critical loads in the future by managing emissions of SO2 and NOx such that deposition levels do not approach the critical load and that areas that at present do not exceed critical loads remain clean. Pollution prevention is defined as the use of processes, practices, materials and energy that avoid or minimize the creation of pollutants.
TABLE 3: SO2 REDUCTION TARGETS FOR ONTARIO, QUÉBEC, NEW BRUNSWICK AND NOVA SCOTIA (as set in 2000 and 2001)
Province Former Eastern Canada Acid Rain Program Caps
Caps set for the Canada-Wide Acid Rain Strategy (kt)
Timelines for achievement
Ontario 885 kt • 442.5 (50% reduction) 2015
Québec 500 kt • 300 (40% reduction) • 250 (50% reduction)
2002 2010
New Brunswick 175 kt • 122.5 (30% reduction) • 87.5 (50% reduction)
2005 2010
Nova Scotia 189 kt • 142 (25% reduction) • 94.5 (50% cumulative reduction
goal) a
2005 2010
a Ninety-four and a half kt was a reduction target and not a cap. Nova Scotia's commitment was to reduce SO2 emissions by 25% from the existing cap by 2005 and to further reduce emissions to achieve a cumulative reduction goal of 50% by 2010 from existing sources.
3.1.1. Ontario
Emissions status Ontario reached its 2015 SO2 emissions reduction target in 2007 and went beyond by almost 14% in 2008, for a total emission of 382 kt. The largest contributor of SO2 emissions remains the non-ferrous mining and smelting sector (192 kt or 50%), followed by electric power generation (76 kt or 20%). Emissions of NOx have also decreased by 5% from year 2007, 32% since 2000, the transportation sector contributing 68% of a total emission of 435 kt.
20

Progress on SO2 emissions reduction in Ontario
0200400600800
10001200
1990 1995 2000 2002 2005 2006 2007 2008
kilo
tonn
es Total SO2 emissionsCap 2015Cap 1994 and beyond
Progress on NOx emissions reduction in Ontario
0100200300400500600700
1995 2000 2002 2005 2006 2007 2008
kilo
tonn
es
Total NOx emissions
Actions and policies Between 2007 and 2008 Ontario’s coal fired electricity generators reduced SO2 emissions by 28% and nitrogen oxides (NOx) emissions by 16.5%. Preliminary data show this downward trend in SO2 emissions continuing in 2009. In 2008, the total acidifying emission rate of 4.53 grams/kWh was Ontario Power Generation’s (OPG) lowest rate ever and was 25% lower than it was ten years previously. Additionally, low emission rates and lower coal fired electricity generation, primarily due to reduced energy demand and increased use of cleaner alternative fuels, helped the fossil plants achieve the lowest acid gas emissions in the past 25 years. For example, Lambton Generating Station units, equipped with Flue Gas Desulphurization equipment and Selective Catalytic Reduction (SCR) for NOx reduction are recognized as some of the cleanest coal-fired generating units in North America.
Ontario is also making landmark progress on Canada's largest clean air and climate change initiative as OPG prepares to close four coal-fuelled power units in 2010 - four years ahead of the 2014 target. Following the path of the Green Energy Act, 2009 (see http://www.mei.gov.on.ca/en/energy/gea/) to transition the province to electricity generated from green energy, OPG will continue to assess converting its remaining 11 units to other types of fuel such as biomass, a renewable fuel source that could not only provide Ontario with renewable energy, but could provide an alternate use for existing coal plants, as coal is phased out in the years ahead. Atikokan Generating Station will be OPG's initial focus for transition to biomass by the target year of 2012.
21
With these closures and transitions to alternative fuels, Ontario is on track to be one of the first jurisdictions in Canada to eliminate coal-fired electricity generation. Since October 2003, Ontario has secured contracts representing more than 5,000 MW of new renewable energy supply from large and small-scale projects across Ontario. More than 1,400 MW of these projects have reached commercial operation and are generating clean electricity from wind, water, sun and bio-based resources. In addition, in 2008 and 2009, Ontario continued to meet Canada’s obligations for the Ozone Annex under the Canada-US Air Quality Agreement -Pollutant Emission Management Area (PEMA) by keeping emissions from fossil fuel power plants under the 39 kt annual NOx cap. The nitrogen dioxide and SO2emissions for the industrial facilities regulated under Industry Emissions – Nitrogen Oxides and Sulphur Dioxide (O. Reg. 194/05) have also declined annually since 2006 due to a number of factors including lower economic activity and some facility improvements. As well, in 2008, Ontario’s Drive Clean vehicle inspection and maintenance program reduced emissions of smog-causing NOx by 8,578 tonnes and hydrocarbons (HC) by over 19,480 tonnes. The Drive Clean Program is responsible for reducing emissions of NOx, HCs and the toxic gas carbon monoxide (CO) by over 35% from light-duty vehicles in the program area. These reductions were attributed to the emissions system repairs required by Drive Clean, and the resulting carryover of successful repairs from previous years and better maintenance of vehicles. Finally, in 2008, Drive Clean heavy-duty diesel program was responsible for reducing particulate matter emissions by 234 tonnes.
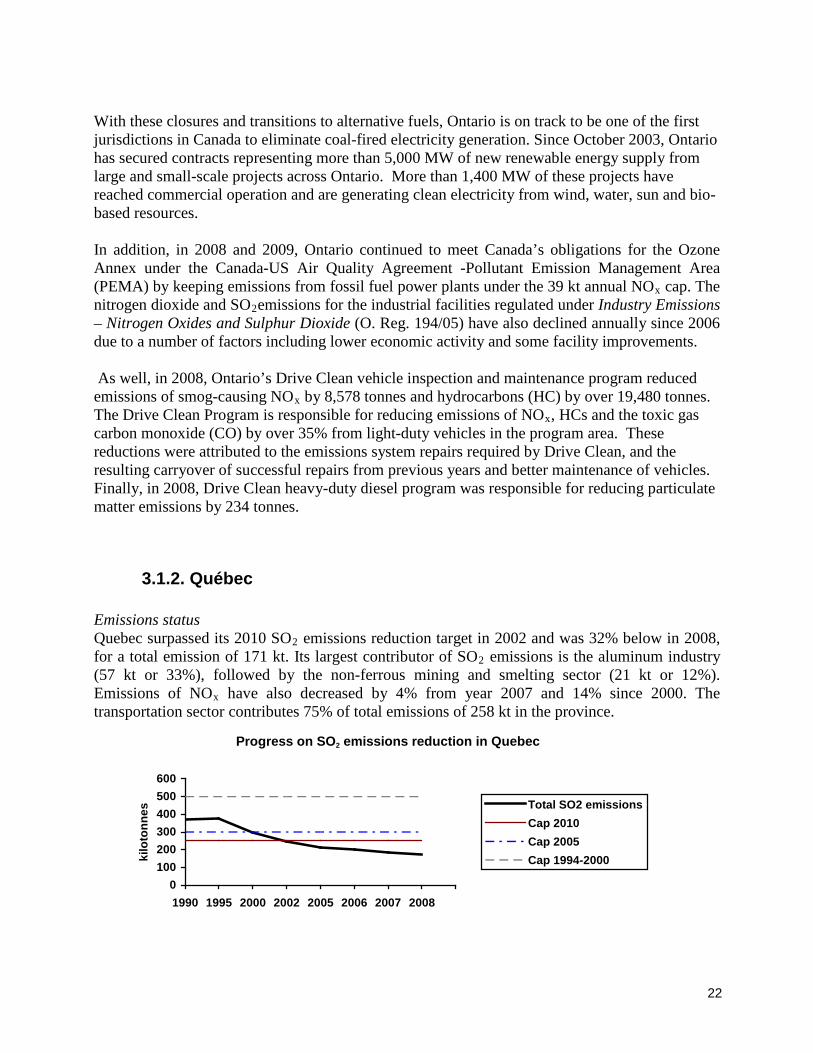
3.1.2. Québec Emissions status Quebec surpassed its 2010 SO2 emissions reduction target in 2002 and was 32% below in 2008, for a total emission of 171 kt. Its largest contributor of SO2 emissions is the aluminum industry (57 kt or 33%), followed by the non-ferrous mining and smelting sector (21 kt or 12%). Emissions of NOx have also decreased by 4% from year 2007 and 14% since 2000. The transportation sector contributes 75% of total emissions of 258 kt in the province.
Progress on SO2 emissions reduction in Quebec
0100200300400500600
1990 1995 2000 2002 2005 2006 2007 2008
kilo
tonn
es Total SO2 emissionsCap 2010Cap 2005Cap 1994-2000
22
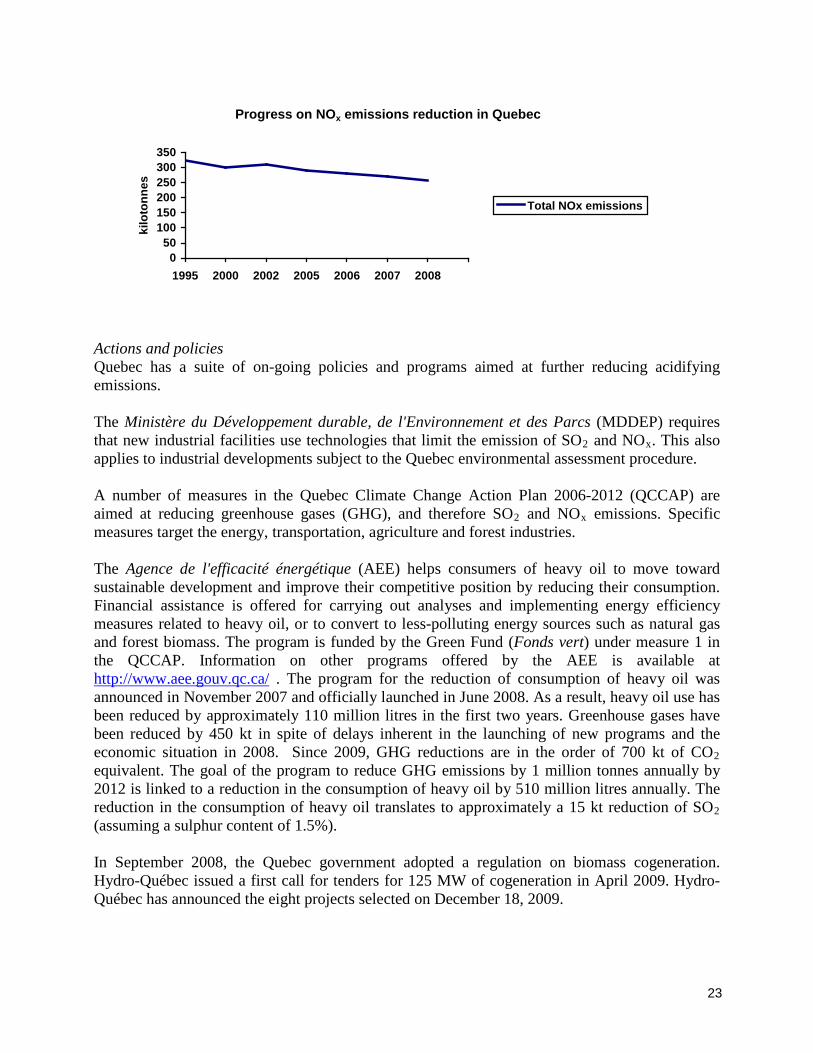
Progress on NOx emissions reduction in Quebec
050
100150200250300350
1995 2000 2002 2005 2006 2007 2008
kilo
tonn
es
Total NOx emissions
Actions and policies Quebec has a suite of on-going policies and programs aimed at further reducing acidifying emissions. The Ministère du Développement durable, de l'Environnement et des Parcs (MDDEP) requires that new industrial facilities use technologies that limit the emission of SO2 and NOx. This also applies to industrial developments subject to the Quebec environmental assessment procedure. A number of measures in the Quebec Climate Change Action Plan 2006-2012 (QCCAP) are aimed at reducing greenhouse gases (GHG), and therefore SO2 and NOx emissions. Specific measures target the energy, transportation, agriculture and forest industries. The Agence de l'efficacité énergétique (AEE) helps consumers of heavy oil to move toward sustainable development and improve their competitive position by reducing their consumption. Financial assistance is offered for carrying out analyses and implementing energy efficiency measures related to heavy oil, or to convert to less-polluting energy sources such as natural gas and forest biomass. The program is funded by the Green Fund (Fonds vert) under measure 1 in the QCCAP. Information on other programs offered by the AEE is available at http://www.aee.gouv.qc.ca/ . The program for the reduction of consumption of heavy oil was announced in November 2007 and officially launched in June 2008. As a result, heavy oil use has been reduced by approximately 110 million litres in the first two years. Greenhouse gases have been reduced by 450 kt in spite of delays inherent in the launching of new programs and the economic situation in 2008. Since 2009, GHG reductions are in the order of 700 kt of CO2 equivalent. The goal of the program to reduce GHG emissions by 1 million tonnes annually by 2012 is linked to a reduction in the consumption of heavy oil by 510 million litres annually. The reduction in the consumption of heavy oil translates to approximately a 15 kt reduction of SO2 (assuming a sulphur content of 1.5%). In September 2008, the Quebec government adopted a regulation on biomass cogeneration. Hydro-Québec issued a first call for tenders for 125 MW of cogeneration in April 2009. Hydro-Québec has announced the eight projects selected on December 18, 2009.
23

Furthermore, in February 2009 the Quebec government published its action plan on forest biomass recovery. The use of forest biomass reduces the use of fossil fuels, which reduces GHGs and SO2 emissions. The action plan is available at the following address: http://www.mrnf.gouv.qc.ca/english/publications/forest/publications/biomass-action-plan.pdf . It is too early to see the results of reductions of NOx and SO2 from this action plan. Lastly, the Quebec government plans to continue to develop hydroelectric power, wind power and energy efficiency, as announced in its Energy Strategy. In that regard, it should be noted Hydro-Québec’s announcement on May 5, 2008 that it has selected projects totalling 2,004.5 MW from its second call for tenders for the purchase of wind power produced in Quebec. Also, on April 30, 2009, Hydro-Québec announced that it is issuing calls for tenders for two separate blocks of 250 MW of wind power from community and aboriginal projects. Projects involving wind and hydro-electric power provide Quebec with a clean source of energy without emissions from NOx and SO2,
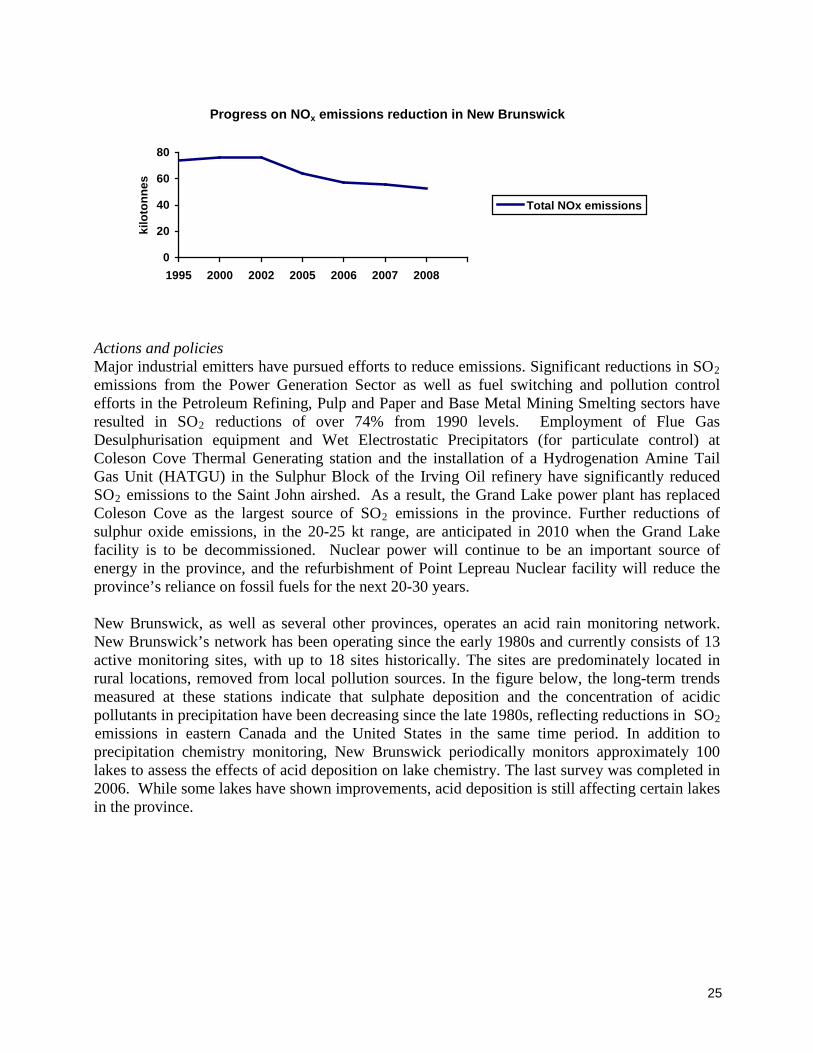
3.1.3. New Brunswick Emissions status New Brunswick has met its SO2 emissions reduction targets each year since being established in 2000. In fact, New Brunswick met its SO2 reduction target for 2005 in 2002 and its 2010 target in 2006. In 2008, New Brunswick’s SO2 emissions totalled 49 kt, representing a reduction of 74% over 1990 emission levels (189 kt). Most of these reductions have been realized through the addition of flue gas desulphurization and other pollution control equipment in major SO2 emissions contributors such as the Coleson Cove power plant. The largest contributor to SO2 emissions in New Brunswick is the electric power generation sector which accounts for 22 kt (45% of total SO2) emissions in the province. Emissions of NOx in 2008 show a decrease of 5% from 2007 levels and over 30% from 2000 levels. The 2008 NOx emissions totalled 53kt with the transportation sector and the stationary sources sector each contributing approximately half of the NOx emitted in New Brunswick.
Progress on SO2 emissions reduction in New Brunswick
0
50
100
150
200
1990 1995 2000 2002 2005 2006 2007 2008
kilo
tonn
es Total SO2 emissionsCap 2010Cap 2005Cap 1994-2000
24
Progress on NOx emissions reduction in New Brunswick
0
20
40
60
80
1995 2000 2002 2005 2006 2007 2008
kilo
tonn
es
Total NOx emissions
Actions and policies Major industrial emitters have pursued efforts to reduce emissions. Significant reductions in SO2 emissions from the Power Generation Sector as well as fuel switching and pollution control efforts in the Petroleum Refining, Pulp and Paper and Base Metal Mining Smelting sectors have resulted in SO2 reductions of over 74% from 1990 levels. Employment of Flue Gas Desulphurisation equipment and Wet Electrostatic Precipitators (for particulate control) at Coleson Cove Thermal Generating station and the installation of a Hydrogenation Amine Tail Gas Unit (HATGU) in the Sulphur Block of the Irving Oil refinery have significantly reduced SO2 emissions to the Saint John airshed. As a result, the Grand Lake power plant has replaced Coleson Cove as the largest source of SO2 emissions in the province. Further reductions of sulphur oxide emissions, in the 20-25 kt range, are anticipated in 2010 when the Grand Lake facility is to be decommissioned. Nuclear power will continue to be an important source of energy in the province, and the refurbishment of Point Lepreau Nuclear facility will reduce the province’s reliance on fossil fuels for the next 20-30 years. New Brunswick, as well as several other provinces, operates an acid rain monitoring network. New Brunswick’s network has been operating since the early 1980s and currently consists of 13 active monitoring sites, with up to 18 sites historically. The sites are predominately located in rural locations, removed from local pollution sources. In the figure below, the long-term trends measured at these stations indicate that sulphate deposition and the concentration of acidic pollutants in precipitation have been decreasing since the late 1980s, reflecting reductions in SO2 emissions in eastern Canada and the United States in the same time period. In addition to precipitation chemistry monitoring, New Brunswick periodically monitors approximately 100 lakes to assess the effects of acid deposition on lake chemistry. The last survey was completed in 2006. While some lakes have shown improvements, acid deposition is still affecting certain lakes in the province.
25
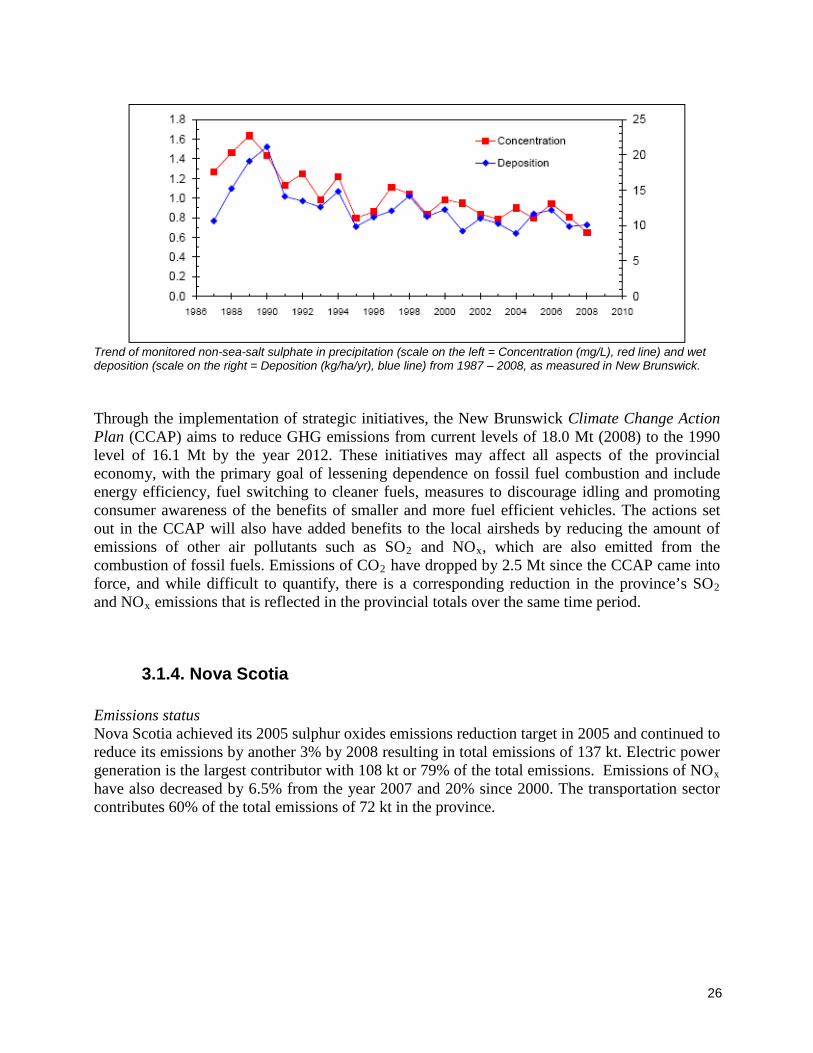
Trend of monitored non-sea-salt sulphate in precipitation (scale on the left = Concentration (mg/L), red line) and wet deposition (scale on the right = Deposition (kg/ha/yr), blue line) from 1987 – 2008, as measured in New Brunswick. Through the implementation of strategic initiatives, the New Brunswick Climate Change Action Plan (CCAP) aims to reduce GHG emissions from current levels of 18.0 Mt (2008) to the 1990 level of 16.1 Mt by the year 2012. These initiatives may affect all aspects of the provincial economy, with the primary goal of lessening dependence on fossil fuel combustion and include energy efficiency, fuel switching to cleaner fuels, measures to discourage idling and promoting consumer awareness of the benefits of smaller and more fuel efficient vehicles. The actions set out in the CCAP will also have added benefits to the local airsheds by reducing the amount of emissions of other air pollutants such as SO2 and NOx, which are also emitted from the combustion of fossil fuels. Emissions of CO2 have dropped by 2.5 Mt since the CCAP came into force, and while difficult to quantify, there is a corresponding reduction in the province’s SO2 and NOx emissions that is reflected in the provincial totals over the same time period.
3.1.4. Nova Scotia Emissions status Nova Scotia achieved its 2005 sulphur oxides emissions reduction target in 2005 and continued to reduce its emissions by another 3% by 2008 resulting in total emissions of 137 kt. Electric power generation is the largest contributor with 108 kt or 79% of the total emissions. Emissions of NOx have also decreased by 6.5% from the year 2007 and 20% since 2000. The transportation sector contributes 60% of the total emissions of 72 kt in the province.
26

Progress on SO2 emissions reduction in Nova Scotia
0
50
100
150
200
1990 1995 2000 2002 2005 2006 2007 2008
kilo
tonn
es
Total SO2 emissionsProvincial Cap 2020Provincial Cap 2015Cap 2005Cap 1994-2000
Progress on NOx emissions reduction in Nova Scotia
020406080
100120
1995 2000 2002 2005 2006 2007 2008
kilo
tonn
es
Total NOx emissions
Actions and policies In Nova Scotia, there are a number of initiatives either completed or ongoing which contribute to the reduction of emissions that cause acid precipitation. Owners of facilities that release over 90 tonnes of SO2 per year were required by the province’s Air Quality Regulations to submit an emission reduction plan by December 31, 2007 demonstrating the proposed means to achieve SO2 emission reductions of 25% from 2001 levels by 2010. These plans were reviewed by Nova Scotia Environment in 2008. For the province’s electrical power generating facilities under Nova Scotia Power, Nova Scotia’s Air Quality Regulations have emission caps for annual NOx emissions (a 20% reduction from 2000 levels starting in 2009) and for annual SO2 emissions (a 25% reduction from the 2005 cap starting in 2010). Nova Scotia Power accounts for the majority of the SO2 emissions in Nova Scotia. Nova Scotia’s Climate Change Action Plan released in January 2009 included several commitments related to reducing SO2 and NOx emissions beyond the year 2010.
In August 2009 Nova Scotia announced new SO2 and NOx emission caps to meet goals established in the Climate Change Action Plan. Nova Scotia’s Air Quality Regulations (pursuant to the Environment Act) were amended to incorporate tighter limits on Nova Scotia Power’s SO2
27
emissions for 2015 and 2020. These annual caps will achieve a 58% reduction from 1995 levels by 2015 and a 75% reduction from 1995 levels by 2020. Provincial annual SO2 emission caps were also added for 2015 (119 kt) and 2020 (71 kt), building on the 2005 provincial cap. For NOx, new, tighter limits on Nova Scotia Power’s NOx emissions for 2015 and 2020 were established. The annual caps will achieve a 28% reduction from 2000 levels by 2015 and a 44% reduction by 2020. In addition to the caps for SO2 and NOx emissions, there is a commitment in the Climate Change Action Plan to assess by 2011 the effectiveness of the province’s current and past sulphur reduction efforts. There is also a commitment to continue to require that all utility and industrial boilers install low-NOx burner technology during upgrades. A clearer definition of "low-NOx" will be developed to strengthen this requirement.
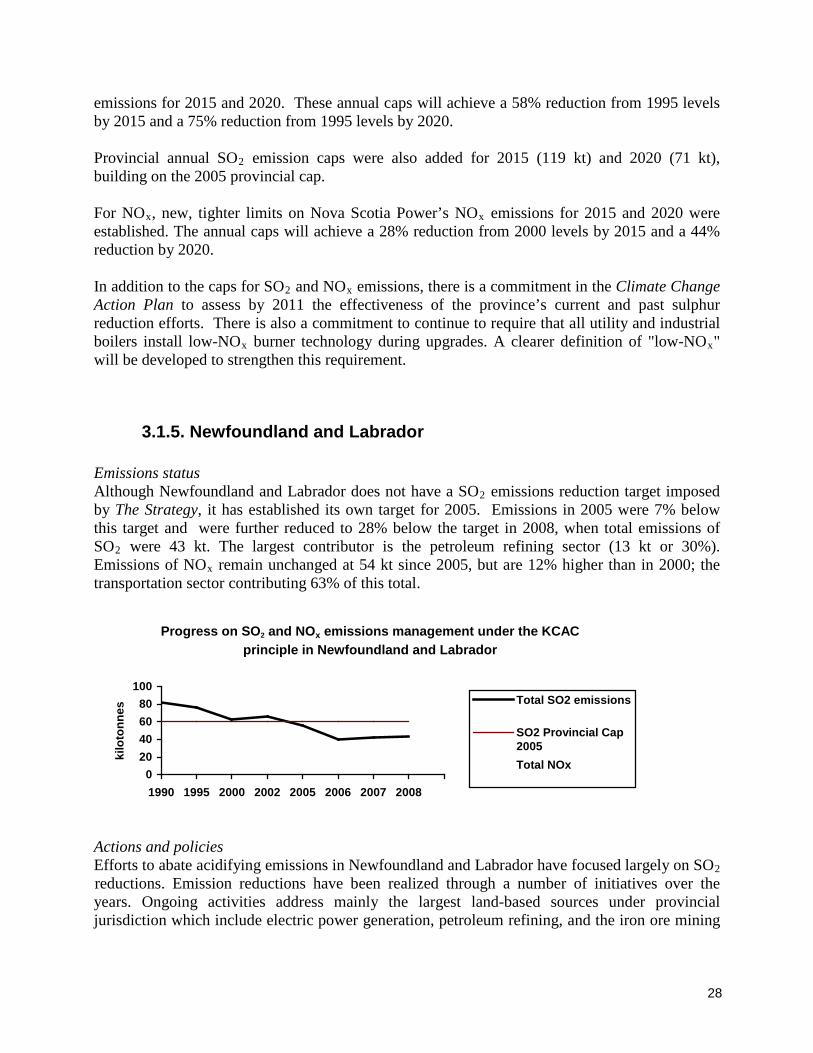
3.1.5. Newfoundland and Labrador Emissions status Although Newfoundland and Labrador does not have a SO2 emissions reduction target imposed by The Strategy, it has established its own target for 2005. Emissions in 2005 were 7% below this target and were further reduced to 28% below the target in 2008, when total emissions of SO2 were 43 kt. The largest contributor is the petroleum refining sector (13 kt or 30%). Emissions of NOx remain unchanged at 54 kt since 2005, but are 12% higher than in 2000; the transportation sector contributing 63% of this total.
Progress on SO2 and NOx emissions management under the KCAC principle in Newfoundland and Labrador
020406080
100
1990 1995 2000 2002 2005 2006 2007 2008
kilo
tonn
es
Total SO2 emissions
SO2 Provincial Cap2005Total NOx
Actions and policies Efforts to abate acidifying emissions in Newfoundland and Labrador have focused largely on SO2 reductions. Emission reductions have been realized through a number of initiatives over the years. Ongoing activities address mainly the largest land-based sources under provincial jurisdiction which include electric power generation, petroleum refining, and the iron ore mining
28

industry. Land-based SO2 emissions have been reduced from 65 kt in 1990 to about 28 kt in 2008. Newfoundland and Labrador instituted a provincial SO2 emissions cap of 60 kt/yr, in effect since January 2005 under section 7 of the Air Pollution Control Regulations 2004 (REGULATION 39/04) of the Environmental Protection Act (O.C. 2004-232). The complete regulations, including information such as ambient air quality standards, fines for exceeding emission levels for certain substances and vehicle emission standards can be found online at http://www.hoa.gov.nl.ca/hoa/regulations/rc040039.htm. It should be noted that although this cap has not been set under the auspices of The Strategy (as The Strategy only committed New Brunswick, Nova Scotia, Ontario and Quebec to specifically set new targets) it does constitute a commitment to reduce emissions of SO2 in eastern Canada. It also contributes to efforts by the provinces and states engaged in the New England Governors / Eastern Canadian Premiers (NEG/ECP) Acid Rain Program to significantly reduce emissions of SO2.
3.1.6. British Columbia
Emissions status Since 1995, SO2 emissions in British Columbia have been hovering between 90 and 100 kt per year. In 2008, SO2 emissions were 99 kt, an increase of 7.6% from 2007 mainly due to the increased activities of the main contributor, upstream oil and gas. It should be noted that this also represents a decrease of almost 11% from 1995 levels. The upstream oil and gas sector remains the largest contributor of SO2 emissions (46 kt or 46%), followed by the transportation sector (22 kt or 22%). Overall emissions of NOx have decreased by 4.5% from year 2007 and 15% since 2000. The transportation sector contributes 64% of the total emissions of 163 kt in the province.
Progress on SO2 and NOx emissions management under the KCAC principle in British Columbia
0
100
200
300
400
1990 1995 2000 2002 2005 2006 2007 2008
kilo
tonn
es
Total SO2 emissionsTotal NOx
Actions and policies To follow up on commitments made in the 2007 Energy Plan, the province released new flaring, incinerating, and venting guidelines for upstream oil and gas operations in February 2008. The purpose of these guidelines is to conserve natural gas resources, reduce unnecessary SO2
29

emissions and ultimately eliminate routine flaring from oil and gas producing wells and production facilities by 2016. In June 2008, the province also released The BC Air Action Plan (http://www.bcairsmart.ca/) which made a number of commitments to reducing air emissions and improving overall air quality. Funds have been committed for a three year time period to implement 28 actions aimed at reducing pollution from all sources. Transportation, Industry, and Communities have all been targeted as critical avenues for these reductions. Current actions taken include promoting a province-wide anti-idling campaign, encouraging companies to use the cleanest available technologies, greening vehicle fleets across the province through Green Fleets BC and enhancing programs such as Scrap-It which has helped remove 12,000 older polluting vehicles off the road. These actions are targeted toward fine particulate matter and ground level ozone, with co-benefits for SO2 and NOx reductions resulting from several of the initiatives. In addition, the province has also passed legislation that will enable it to adopt California vehicle emissions standards. A number of airshed management plans are now in place in several communities across B.C., including Prince George, Whistler, Williams Lake and the Fraser Valley.
3.1.7. Alberta Emissions status Alberta has been steadily reducing its SO2 emissions since 1995, down to 377 kt in 2008, a decrease of 7% from 2007 and a reduction from 2000 levels by 86 kt or almost 19 %. The largest contributor remains electric power generation (124 kt or 33%), followed by oil sands (116 kt or 31%) and upstream oil and gas (107 kt or 28%). Emissions of NOx have been rising slowly since 1995; however, emissions decreased in 2008 by 7% from 2007 for a total of 755 kt; 68% of these emissions coming from stationary sources.
Progress on SO2 and NOx emissions management under the KCAC principle in Alberta
0200400600800
1000
1990 1995 2000 2002 2005 2006 2007 2008
kilo
tonn
es
Total SO2 emissionsTotal NOx
Actions and policies As part of the Industrial Heartland project, a series of comprehensive, science-based targets, outcomes and actions have been set for the region to protect the air, land and water of Alberta’s capital region. For air, all large industrial facilities within the Industrial Heartland that individually emit more than 100 tonnes/year of either NOx or SO2, will be subject to a
30
cumulative airshed target of 25,000 tonnes per year of NOx and 28,000 tonnes per year of SO2. The limits on air emissions set for NOx and SO2 are based on a number of considerations, including the impact of these emissions on air quality, the emissions reduction technology available and the assumed number of new facilities. The proposed emissions limits are consistent with the Industrial Release Limits Policy that recommends limits “are required to ensure that:
• The environment and human health are protected; • The most appropriate pollution prevention and control technologies are adopted; • Continuous improvement is sought based on the application of practicable control
technology, or more stringent control technology to meet ambient air quality objectives.”
Limits on air emissions reflect Alberta’s policy to Keep Clean Areas Clean, encouraging new and older facilities to continuously improve their emission control technologies. These air emissions limits will be subject to review every five years, at which time the current state of air quality and emissions reduction technologies will be considered. Alberta Environment is working with stakeholders to design components of an emissions allocations system in order to ensure benefits of air emissions offsets are realized within the capital region. For more information visit: http://www.environment.alberta.ca/1933.html. The Alberta Energy Resources Conservation Board’s (ERCB) Interim Directive (ID) 2001-03: Sulphur Recovery Guidelines for the Province of Alberta (ID 2001-03) was issued in August 29, 2001. The Guidelines established stringent requirements for sulphur emissions, provide a schedule for existing plants to meet the same sulphur recovery requirements as new plants, and encouraged operators to take early action to improve performance. The 2008 annual summary report of the Guidelines show that overall for both grandfathered and non-grandfathered plants, total emissions have been reduced 53% since 2000 and about 15% from 2007 to 2008. Grandfathered plants are those that do not meet the sulphur recovery requirements for new plants listed in ID 2001-03. These include some sulphur recovery plants and larger acid gas flaring plants (sulphur inlet greater than one tonne per day). Non-grandfathered plants are those with an approved sulphur inlet greater than one tonne per day that meet the requirements for new plants, as listed in ID 2001-03. This includes both sulphur recovery plants and acid gas injection plants. Improvements due to improved performance and decreased sulphur throughput resulted in 75% reduction from 2000 to 2008 for grandfathered acid gas flaring plants and 52% reduction for grandfathered sulphur recovery plants when compared to the baseline year 2000. Overall, emissions from grandfathered plants have decreased by approximately 57% from 2000 to 2008. This represents a reduction of approximately 220 tonnes of SO2 emissions per day in Alberta. Emissions were reduced approximately 40% from 2000 to 2008 for non-grandfathered plants. Sulphur input at these plants decreased approximately 35% during that same time period. Since 2000, 15 plants have made upgrades to meet the new requirements, 13 plants have been reissued licenses with new emission requirements, and 8 plants have ceased operation. For details see “ST101: Sulphur Recovery and Sulphur Emissions at Alberta Sour Gas Plants - Annual
31
Report for the 2008 Operating Year (Published July 2009)” - http://www.ercb.ca/docs/products/STs/st101_current.pdf .
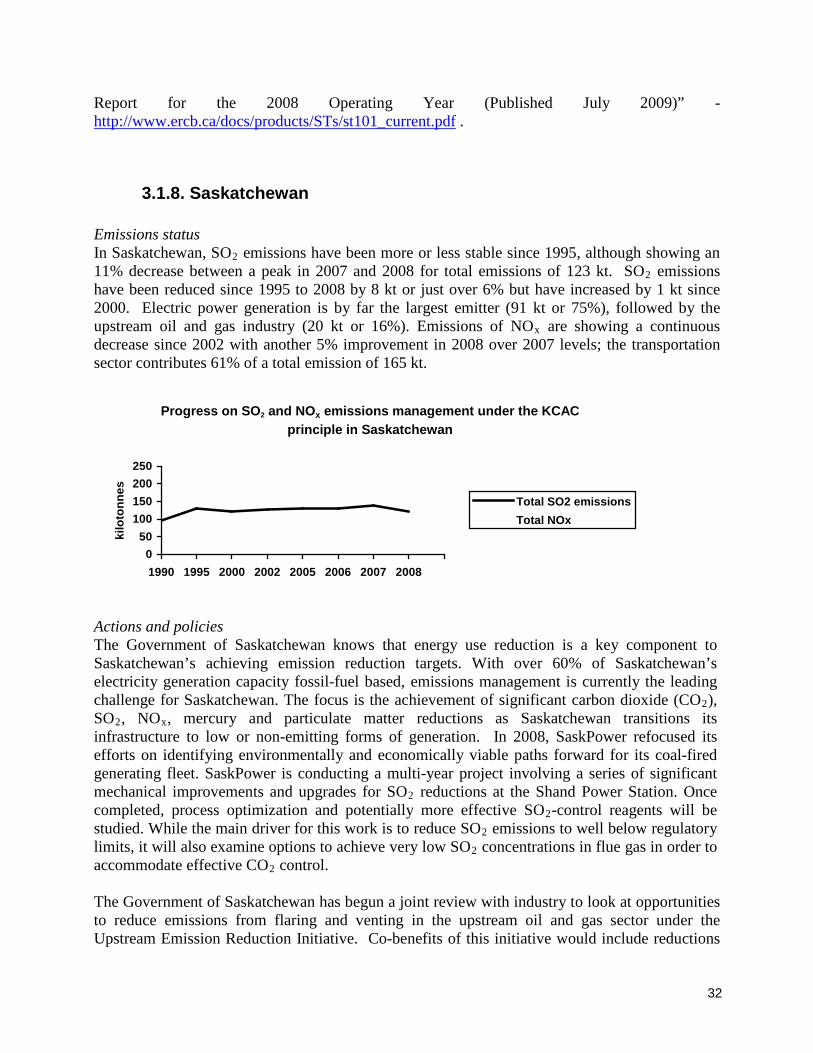
3.1.8. Saskatchewan Emissions status In Saskatchewan, SO2 emissions have been more or less stable since 1995, although showing an 11% decrease between a peak in 2007 and 2008 for total emissions of 123 kt. SO2 emissions have been reduced since 1995 to 2008 by 8 kt or just over 6% but have increased by 1 kt since 2000. Electric power generation is by far the largest emitter (91 kt or 75%), followed by the upstream oil and gas industry (20 kt or 16%). Emissions of NOx are showing a continuous decrease since 2002 with another 5% improvement in 2008 over 2007 levels; the transportation sector contributes 61% of a total emission of 165 kt.
Progress on SO2 and NOx emissions management under the KCAC principle in Saskatchewan
050
100150200250
1990 1995 2000 2002 2005 2006 2007 2008
kilo
tonn
es
Total SO2 emissionsTotal NOx
Actions and policies The Government of Saskatchewan knows that energy use reduction is a key component to Saskatchewan’s achieving emission reduction targets. With over 60% of Saskatchewan’s electricity generation capacity fossil-fuel based, emissions management is currently the leading challenge for Saskatchewan. The focus is the achievement of significant carbon dioxide (CO2), SO2, NOx, mercury and particulate matter reductions as Saskatchewan transitions its infrastructure to low or non-emitting forms of generation. In 2008, SaskPower refocused its efforts on identifying environmentally and economically viable paths forward for its coal-fired generating fleet. SaskPower is conducting a multi-year project involving a series of significant mechanical improvements and upgrades for SO2 reductions at the Shand Power Station. Once completed, process optimization and potentially more effective SO2-control reagents will be studied. While the main driver for this work is to reduce SO2 emissions to well below regulatory limits, it will also examine options to achieve very low SO2 concentrations in flue gas in order to accommodate effective CO2 control. The Government of Saskatchewan has begun a joint review with industry to look at opportunities to reduce emissions from flaring and venting in the upstream oil and gas sector under the Upstream Emission Reduction Initiative. Co-benefits of this initiative would include reductions
32

of NOx and SO2 emissions. Saskatchewan government will participate in the Upstream Emission Reduction Initiative at an annual contribution of $300,000 to support one or two large projects in Saskatchewan per year with industry. In addition, Saskatchewan would also provide up to an additional $100,000 per year as the provincial contribution to smaller oil and gas industry emission reductions projects in Saskatchewan.
3.1.9. Manitoba Emissions status In Manitoba, the trend since 1995 has been a gradual increase in SO2 emissions peaking at 397 kt in 2005. More recently, a sharp decrease has taken place resulting in emissions of 312 kt in 2008 or 3 % below the 2000 levels. Essentially all of the SO2 emissions in the province originate from the non-ferrous mining and smelting sector (346 kt or 99%). Emissions of NOx have also decreased by 4% from year 2007 and by 18% since 2000; the transportation sector contributing 88% of total emissions of 67 kt.
Progress on SO2 and NOx emissions management under the KCAC principle in Manitoba
0100200300400500600
1990 1995 2000 2002 2005 2006 2007 2008
kilo
tonn
es
Total SO2 emissionsTotal NOx
Actions and policies In Manitoba, emissions from industrial developments are regulated under The Environment Act. Manitoba’s SO2 emissions arise mostly from operations of its two base metal smelters. These releases can vary from year to year due to factors such as operating schedules, shutdowns, etc. Manitoba continues to work with its base metal industry to strive to manage emissions to ensure protection of local community air quality and to natural systems downwind from the facilities. In mid-2008 the Climate Change and Emissions Reductions Act was passed which includes a provision for the phase-out of coal for power generation at Manitoba Hydro by 2010 (except in support of emergency operations). This action, on average, should also reduce SO2 releases from the one coal plant in Manitoba by approximately 700 tonnes per year. In June 2009 HudBay Minerals Inc. indicated that it expected to permanently close its copper smelter in Flin Flon before July 1, 2010. SO2 emissions to the atmosphere from this facility will essentially be eliminated, resulting in an approximate 50% lowering of such releases for the province.
33

3.2. Federal Commitment National emissions status The federal government gathers national emissions data to monitor air quality and to better tailor domestic and international air policies.
As shown by the following figures, national emissions of SO2 and NOx have steadily decreased and are below their corresponding caps since 1990 and 1995 respectively. As a matter of fact, the total SO2 emissions for Canada are now below the cap for the Sulphur Oxide Management Area (SOMA) which comprises the southern parts of Ontario and Quebec, New Brunswick, Nova Scotia and Prince-Edward-Island, totalling 1,733 kt, a 25% decrease since year 2000 and now 46% below the national cap of 3,200 killotonnes. Emissions of NOx have also steadily decreased since 2002. In 2008, emissions of 2,135 kt represents another 5.7% reduction from 2007 totals and now result in a level 15% below the national cap of 2,514 kt.
Progress on NOx emissions reduction in Canada
0500
10001500200025003000
1995 2000 2002 2005 2006 2007 2008
kilo
tonn
es
Total NOx emissionsNational Cap
Progress on SO2 emissions reduction in Canada
0500
100015002000250030003500
1990 1995 2000 2002 2005 2006 2007 2008
kilo
tonn
es Total SO2 emissionsSO2 SOMASOMA CapNational Cap
3,200 kt
1,750 kt
2,500 kt
34
Actions and policies The federal government has made progress in the development and implementation of regulatory approaches to reduce greenhouse gases and air pollutant emissions in Canada. In 2008, the federal government initiated the development of a comprehensive air management system which is intended to be a major step toward more effective management of air quality across Canada. In that context, the federal government has worked intensively, with various industrial sectors, provinces and non-government organizations to develop the air management system which would include the establishment of nationally applied ambient air quality standards and minimum requirements for industrial emissions of air pollutants including NOx and SO2. It is anticipated that these standards and requirements would be entrenched in provincial and territorial legislation and the Canadian Environmental Protection Act, 1999 (CEPA 1999) where appropriate. During this same time period, the federal government has proceeded with regulations and regulatory approaches by developing a series of amendments to regulations for on-road, off-road and marine vehicles and engines to reduce emissions, elaborating Canadian positions and proposals to reduce emissions from ships operating in Canada, the United States and international waters, and developing an approach to regulating emissions from light-duty motor vehicles pursuant to the Canadian Environmental Protection Act, 1999. In July 2008, a report was released by Environment Canada on the evaluation of five regulations for smog-causing emissions in the transportation sector. The five regulations examined included; Sulphur in Gasoline Regulations, Sulphur in Diesel Fuel Regulations, On-Road Vehicle and Engine Emission Regulations, Off-Road Small Spark-Ignition Engine Emission Regulations and Off-Road Compression-Ignition Engine Emission Regulations. The findings of the evaluation found that all five regulations are on track to achieving their intended environmental outcomes. The standards set out by the regulations have been achieved by the sulphur in fuels regulations and are beginning to be achieved in the case of on-road vehicles. Off-road engines are starting to undergo compliance verification testing to assess the emission performance of products sold in Canada. It is expected that these achievements will contribute to the ultimate outcome sought by the regulations which is to reduce risks to Canadians, their health and their environment from air pollutants and greenhouse gas emissions. The Government has also published three regulations for 1) architectural paints, 2) auto refinish products and 3) certain consumer products to reduce emissions of volatile organic compounds which contribute to the formation of smog. The Energy Efficiency Regulations were also amended to improve the performance standards of products sold in Canada, notably gas furnaces. Other themes such as the Clean Energy Programs, have contributed indirectly to the reduction of acidifying emissions. Results from this horizontal initiative are included in Environment Canada Performance Reports publicly accessible at: http://www.tbs-sct.gc.ca/dpr-rmr/index-eng.asp . Reducing transboundary flows of acidifying emissions Since particulate matter (PM) shares common precursor emissions (SO2 and NOx) with acid deposition it is likely that any new, more stringent targets or objectives would contribute further to efforts to reduce transboundary flows (and impacts) of acidifying pollutants. Canada and the United States have committed to reducing cross-border air pollution and recognize the significant human health and ecosystem effects (including acid rain) associated
35

with PM2.5 and its precursors. Both countries continued discussions in 2007-2008 towards the development of a PM Annex under the Canada-U.S. Air Quality Agreement. Analytical work was undertaken to develop and advance Canada’s positions on the pollutant emission management area, pollutants of concern, and potential emission reductions commitments for mobile sources. Intercessional work on PM has continued, focusing on exchanging information on emissions and ambient monitoring and reporting obligations in each country and increasing the understanding of potential emission reduction commitments for stationary sources. As a Party to the United Nations Convention on Long-range Transboundary Air Pollution (CLRTAP), Canada has participated actively at an international level to address air quality globally. Canada continues to be in compliance with the established caps for SO2 and NOx set in three of the Convention protocols related to acid rain. In fact, Canada is below the national SO2 cap by 46 %, and below the NOx national cap by 15 %. Canada is 61 % below the SO2 cap in the Sulphur Oxide Management Area (SOMA). Canada is also an active participant in the negotiations for revisions to the Gothenburg Protocol8, a CLRTAP multi-pollutant agreement on acidification, eutrophication and ground level ozone. Annex 1 of the Gothenburg Protocol contains critical loads and levels for acidity. Canada has helped to develop the draft revised text to this annex.
4. Continuing science on acid rain causes and impacts
4.1. National Acid Rain Science Plan One of the commitments under The Strategy is to ensure the adequacy of acid rain science and monitoring programs. In 2006, ARTG led the development of a 5-year National Acid Rain Science Plan (hereinafter called The Science Plan) that outlines research, monitoring and modeling activities required to assess environmental improvements, verify the effectiveness of emission control programs in reducing acid rain damage to ecosystems, and detect new problem areas. The implementation of The Science Plan is the responsibility of federal/territorial/provincial governments in collaboration with industry, academia and non-government environmental organizations. The Science Plan focuses on addressing two main priorities: 1) improving the spatial and temporal coverage of deposition and aquatic and terrestrial chemical and biological information across Canada, primarily in sensitive terrain in the West while at minimum maintaining current efforts in the East; and 2) continuing to enhance research on the mechanisms and rates of ecosystem impacts and ecosystem recovery concerning acidification and related stressors. Since 2006, the capacity to measure wet deposition across Canada has increased with the establishment of new Canadian Air and Precipitation Monitoring Network sites in Ontario, southern Alberta and northern Saskatchewan (with a second one underway). The ability to calculate future levels of acid deposition and other air pollutants across Canada and North America has also improved, enabling the prediction of future critical load exceedances for lakes and forest soils across Canada as well as a more integrated approach to air quality management. Environment Canada has also
8 Information on the Gothenburg Protocol can be found at: http://www.unece.org/env/lrtap/multi_h1.htm
36
deployed new lake chemistry and biological surveys in coastal British Columbia, northern Saskatchewan, northern Manitoba, and central Ontario in order to assess the status of lakes in highly sensitive areas where information is limited. Data from these surveys along with provincial data have resulted in new and improved critical load estimates for many sensitive lakes in western Canada. In Alberta, the NOx/SO2 Management Working Group of the Cumulative Environmental Management Association is wrapping up a 5-year research program of acid deposition and development of MAGIC, a dynamic ecosystem response model, in the oil sands area. Some research results have been published in a special issue of the Journal of Limnology. In addition to continued monitoring of the potential acid deposition impacts caused by emissions from the oil sands industry, the Terrestrial Environmental Effects Monitoring (TEEM) program under the Wood Buffalo Environmental Association is conducting an evaluation of the conditional time average gradient method for dry deposition flux measurement which was developed in Europe.
4.1.1. Progress in the modelling and mapping of terrestrial critical loads and exceedances
Over the last few years, ARTG has funded a number of projects to assess forest sensitivity to acid deposition in the Prairies. In 2008, Trent University completed two contracts to determine and map critical loads and exceedances for forest soils in Alberta9, and in Manitoba and Saskatchewan10 following the same protocol as for critical load estimates in eastern Canada. These reports were mentioned in the 2006/2007 Progress Report; however, the final results were still pending at the time so they are summarized here. It was estimated that approximately 8.5% of the mapped soils in Alberta received acid deposition in excess of the critical load, with the percentage ranging from 0 to 11% when different critical limits (receptor and level of protection) were applied in the calculations. In the case of Manitoba and Saskatchewan, it was suggested that levels of acid deposition in these two provinces are unlikely to exceed current estimates of forest soil critical loads. This work was a refinement of a previous assessment11 of acidity critical load and exceedances, which had concluded that approximately 2% of the mapped soils in SK and 7% in MB received acid deposition in excess of the critical load. The discrepancy between both evaluations of forest soil sensitivity in SK and MB is attributed to the use of a range of observed and modeled sulphur and nitrogen deposition values in the latter one, an approach intended to reduce uncertainty in deposition data which is sparse in these provinces. Nevertheless, these most recent estimates are still subject to uncertainties and assumptions. New critical load estimates for soils in western Canada along with existing estimates for eastern Canada (2004 Canadian Acid Deposition Science Assessment) were combined into one Canada-wide acidity critical load map for Canadian forest soils. The combined critical load map, as well as maps of exceedances (generated based on measured and modeled sulphur and nitrogen deposition) are presented in a collaborative report prepared for ARTG in 2008 titled A National
9 PN 1408 Calculating Critical Loads of Acid Deposition for Forest Soils in Alberta (2008) 10 PN 1409 Critical Load and Exceedance Estimates for Upland Forest Soils in Manitoba and Saskatchewan (2008) 11 PN 1372 Calculating Critical Loads of Acid Deposition for Forest Soils in Manitoba and Saskatchewan – Final Report: Data Sources, Critical Load, Exceedance and Limitations (2006)
37

Picture of Acid Deposition Critical Loads for Forest Soils in Canada. This report concluded that from Alberta eastward there are upland forest soils in every province that currently receive acid deposition levels greater than their long-term critical load, particularly in southeastern Canada, despite significant past reductions in acidifying emissions.
4.1.2. Workshop on the adequacy of current approaches to assess critical loads of acidity
On March 18 and 19, 2009, ARTG hosted a workshop of technical experts in Ottawa titled Acid deposition critical loads: Status of methods and indicators. The purpose of the workshop was to discuss critical loads of sulphur and nitrogen acidity in order to assess the adequacy of current approaches and to develop recommendations on how to improve critical load estimates for Canadian ecosystems. Workshop participants included experts from Canada, United States, Ireland, Netherlands and Sweden. An overall conclusion of the workshop was that critical loads continue to be a useful tool to assess the sensitivity of ecosystems to acid deposition and to inform emission reduction policies. Also, while the approaches used are satisfactory, the quality of the information input into the calculations is inadequate. Further research and monitoring are needed to generate higher quality (more representative) data that can also then be used to predict ecosystem response and recovery (dynamic modeling) in selected areas. It was also concluded that there is a need to revisit, with guidance from CCME, what biological elements and receptor ecosystems need to be protected and to what degree. As well, nitrogen needs to be better accounted for in critical load assessments. Finally, Canada and the U.S. need to work together to harmonize ecosystem sensitivity assessments along the border so they can be integrated to inform North American emission reduction policies. The following is a summary of recommendations identified by workshop participants for future work required to improve critical loads estimates for Canada: • Continue to apply steady-state models to map aquatic and terrestrial critical loads at a national
scale as a useful tool to inform emission control policies.
• Improve and expand atmospheric and ecosystem monitoring efforts in order to obtain more representative data and to fill in spatial gaps identified in the 2004 Canadian Acid Deposition Science Assessment.
• Continue to update and expand critical load mapping to other areas/ecosystem receptors within Canada and improve comparability with the U.S. border.
• Review and develop biological indicators toward producing an extended list of sensitive elements that are required to maintain ecosystem function and structure and to determine critical limits and loads for those that should be protected.
• Apply dynamic models in areas where more data are or become available in order to assess sensitivity in more detail and evaluate temporal trends in exceedance.
• Continue to investigate methods for refining weathering rates.
• Promote open-access to critical load information by establishing a national database.
38
• Undertake a study to relate how emission control programs have reduced the exceedance of critical loads.
4.1.3. Western Canada Sulphur and Nitrogen Deposition Workshop On April 28 and 29, 2009, ARTG hosted a workshop in Banff, Alberta, in partnership with The Wood Buffalo Environmental Association and the Cumulative Environmental Management Association to examine the state of the science on atmospheric deposition of sulphur and nitrogen and ecosystem impacts in Western Canada, discuss policy implications, and identify areas for future science and policy concentration. The workshop was very well attended by representatives from government, industry, environmental and health non-profit organizations, and academic institutions. A special issue of the Journal of Limnology is being dedicated to present key scientific papers that came out of the workshop in order to make them available to a larger audience. The special issue was published in February 2010 and can be viewed at this web site: www.jlimnol.it/JL_69_supl1/JL_69_supl1.htm .
4.1.4. Understanding the role of nitrogen Science shows that current and projected nitrogen deposition levels may undermine some of the benefits of controlling SO2 emissions. As such, there is a continuous commitment to improve our understanding of the role of nitrogen in acidification as well as to identify emerging issues associated with nitrogen acidification. One of these emerging issues is the potential for increased NOx and NH3 emissions to result in the eutrophication of terrestrial ecosystems due to excess amounts of atmospheric nitrogen. In 2009, ARTG undertook a literature review to gather the latest research linking atmospheric reactive nitrogen (rN) deposition to eutrophication and to assess the relevance and applicability to Canadian circumstances. This information is currently being updated to include research and policy gaps, and will be synthesized and integrated into a non-technical plain language report.
5. Next steps For over a decade, CCME has supported the efforts of jurisdictions in Canada to address acid rain and has shown that through a concerted effort, significant progress can be made even beyond our national and international commitments. Continued research, however, has also increased our knowledge of this issue to the extent that we now know the scope of acid deposition may have a larger impact than originally thought. In fact, despite the significant efforts by jurisdictions, there are still areas (refer to Figure 11) receiving levels of acid deposition that exceed the long-term capacity of their ecosystems to process these influxes and to recover to their natural state.
39

The year 2010 will see the outcome of a national initiative to establish a comprehensive air management approach in Canada. This may present an opportunity to integrate the issue of acid rain into the broader management of air pollution in Canada.
40


![[Challenge:Future] acid rain](https://img.pdfslide.us/doc/110x75/55a25f5e1a28abc5718b4679/challengefuture-acid-rain.jpg)