Embed Size (px)
Citation preview
Calcium Digestibility and Requirements for Digestible Calcium by Growing Pigs
Hans H. Stein Department of Animal Sciences
University of Illinois, Urbana, IL 61801 Phone: (217) 333-0013
Summary The standardized total tract digestibility (STTD) of Ca in most feed ingredients used in diets fed to pigs has been determined, and the effect of microbial phytase on STTD of Ca has also been reported. This has made it possible to formulate diets based on values for STTD of Ca and attempts to determine requirements for STTD of Ca for 11 to 25, 25 to 50, and 100 to 130 kg pigs have been made. Results of these experiments have indicated that STTD Ca provided in excess of the requirement is detrimental to pig growth performance. This is particularly true if dietary STTD P is marginal, whereas the negative effects of excess Ca is mitigated ifSTTD Pis provided in excess of the requirement. As a consequence, effects of microbial phytase on the STTD of Ca need to be accounted for in diet formulation. Based on currently available information, it is recommended that diets for pigs less than 50 kg are formulated to have a STTD Ca:STTD P ratio between 1:1 and 1.35:1, whereas diets for pigs greater than 100 kg should have a STTD Ca:STTD P ratio that does not exceed 1.1 :1.
Introduction Historically, requirements for Ca in diets fed to pigs
have been expressed on the basis of total Ca and all feed requirement tables include values for the requirement for total Ca by different categories of pigs. This is in contrast to values for P where requirements are usually expressed as values for either apparent total tract digestible (ATTD) P or standardized total tract digestible (STTD) P. In the current version of the National Research Council's Nutrient Requirements of Swine, requirements for total Ca were calculated by multiplying requirements for STTD P by 2.15 (NRC, 2012). However, the committee that developed "Nutrient Requirements of Swine" acknowledged that this approach was used simply because no data for the digestibility of Ca in feed ingredients were available and the committee specifically stated that 1\ preferred ratio would have been a ratio between digestible Ca and digestible P, but again, because of lack of data the ratios between total Ca and STTD Pare used" (NRC, 2012). Thus, the lack of data for digestibility of Ca in feed ingredients prevented the committee from estimating requirements for STTD of Ca.
However, during the last few years, values for the digestibility of Ca in most Ca containing feed ingredients have been determined, and it has, therefore, been possible to initiate work to estimate requirements for digestible Ca in diets fed to different categories of pigs.
57
It is the objective of the current contribution to present currently available data for digestibility of Cain feed ingredients and preliminary data for the requirement for STTD Ca by growing-finishing pigs.
Digestibility of Ca in Feed Ingredients Preliminary work to determine the digestibility of
Ca in feed ingredients fed to pigs indicated that the basal endogenous loss of Ca from pigs is between 150 and 400 mg per kg of dry matter intake (DMI) (GonzalezVega et al., 2013). As a consequence, values for ATTD of Ca are influenced by the inclusion level of Ca in the diets because the endogenous Ca contributes a greater proportion of Ca to the fecal output of Ca at low levels of Ca intake compared with greater levels of intake. Values for the ATTD of Ca are, therefore, not additive in mixed diets and as a consequence, digestibility values for Ca need to be corrected for the basal endogenous losses and expressed as values for the STTD of Ca.
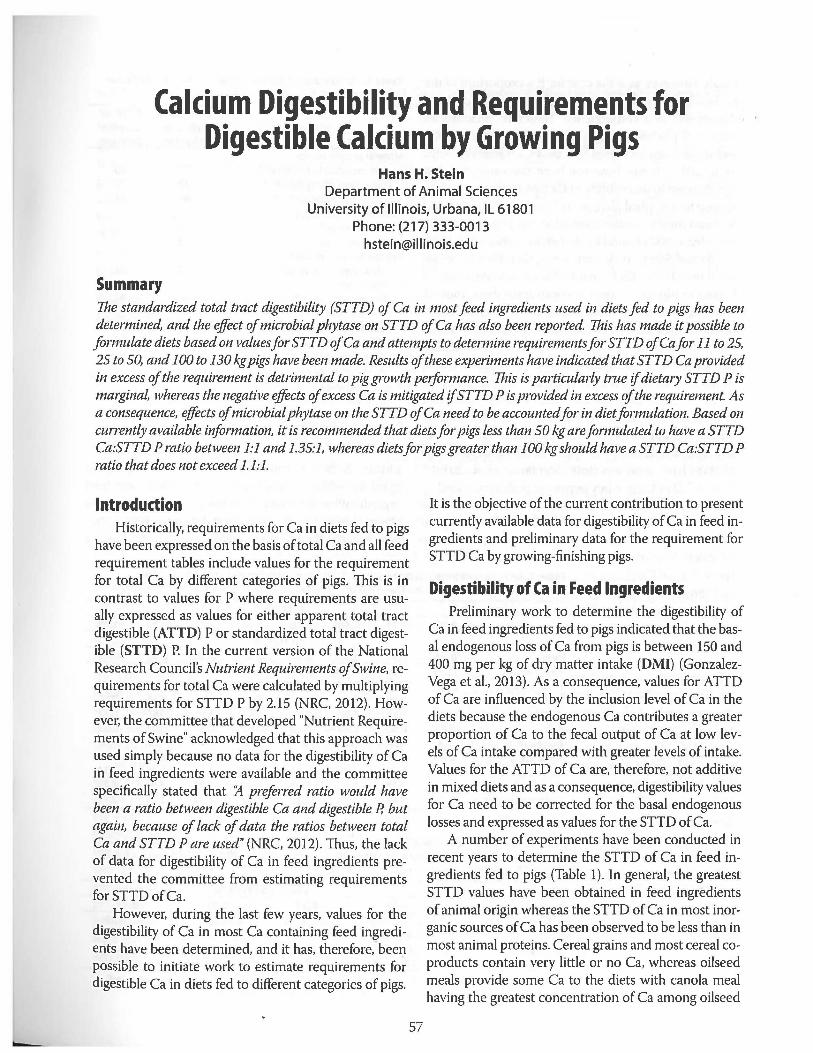
A number of experiments have been conducted in recent years to determine the STTD of Ca in feed ingredients fed to pigs (Table 1). In general, the greatest STTD values have been obtained in feed ingredients of animal origin whereas the STTD of Ca in most inorganic sources of Ca has been observed to be less than in most animal proteins. Cereal grains and most cereal coproducts contain very little or no Ca, whereas oilseed meals provide some Ca to the diets with canola meal having the greatest concentration of Ca among oilseed
meals. However, as is the case for P, a proportion of the Ca in oilseed meals is bound to phytate with a reduced digestibility as a consequence. Therefore, inclusion of microbial phytase to diets that contain oilseed meals will result in an increased STTD ofCa (Gonzalez-Vega et al., 2013). It has, however, been demonstrated that the increase in digestibility of Ca that is observed in response to microbial phytase in diets based on corn and soybean meal is greater than what can be explained by the release of Ca bound to phytate in soybean meal (Almeida and Stein, 2013), and is was, therefore, hypothesized that dietary Ca from mineral supplements may be bound to phytate in corn-soybean meal diets. Indeed, working with corn-based diets, it was subsequently demonstrated that the STTD of Ca in calcium carbonate, but not in monocalcium phosphate or dicalcium phosphate, is increased if microbial phytase is added to the diet (Gonzalez-Vega et al., 2015a). Likewise, the STTD of Ca in fish meal included in a corn-based diet is increased by microbial phytase (Gonzalez-Vega et al., 2015b), but for other animal proteins such as meat and bone meals and poultry meals, effects of microbial phytase have been less clear (Merriman et al., 2016b). The STTD of Ca in whey permeate is also increased by microbial phytase, but that is not the case for skim milk powder and whey powder (University of Illinois, unpublished data). There is, however, no impact of particle size of calcium carbonate on
Table 1. Standardized total tract digestibility (STTD) of Ca in feed ingredients, %1
Ingredient Mineral supplements
Monocalcium phosphate1 Dicalcium phosphate 1 Calcium carbonate1
Plant feed ingredients Canola meal2 Soybean meal2
Animal feed ingredients Meat and bone meal3 Meatmeal3 Fish mea14 Poultry mea13 Poultry by product mea13 Skim milk powder2 Whey powder2 Whey permeate2
1 Gonzalez-Vega et al., 2015a.
STTD of Ca STTD of without Ca with phytase phytase
77 73 64
42 78
77 77 76 82 88 93 96 58
80 75 71
82 86 87 76 87 97 93 71
2 Unpublished data from the University of Illinois. 3 Merriman et al., 2016b. 4 Gonzalez-Vega et al., 2015b.
phytase is used is most likely that the phytate from the plant ingredients may chelate Ca from non-plant feed ingredients in the stomach of the pigs, which prevents absorption in the small intestine, but if microbial phytase reduces the chelating abilities of phytate, less Ca
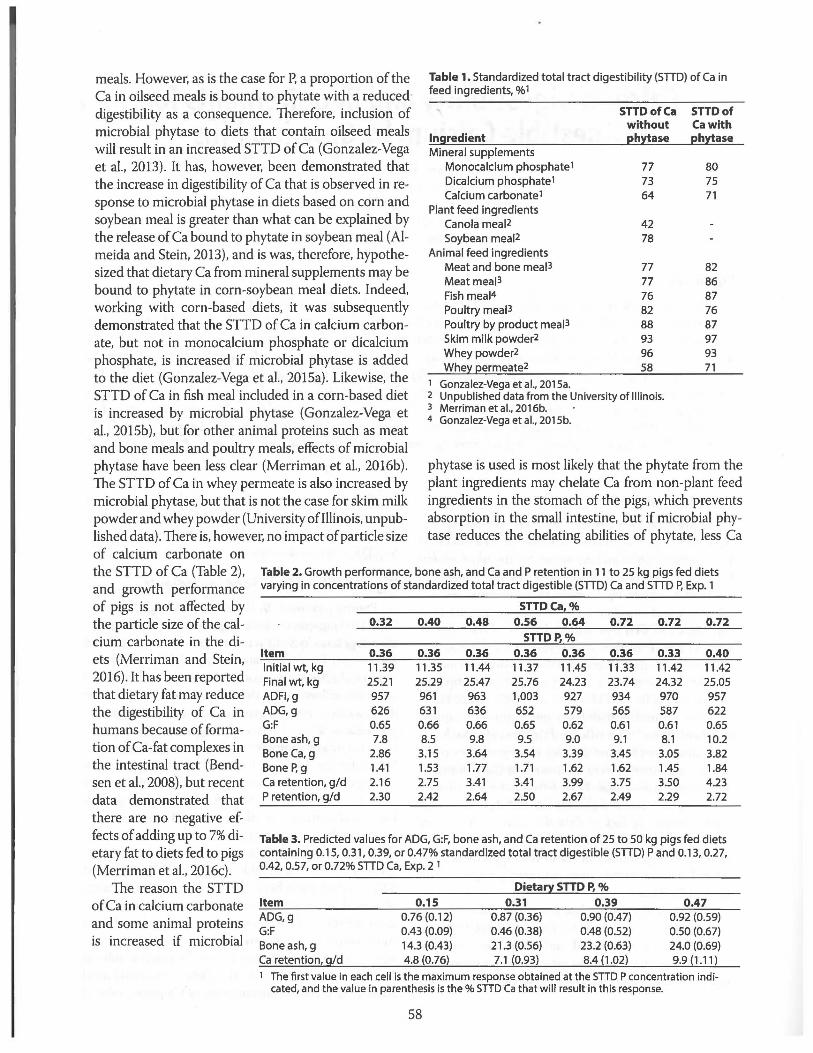
the STTD of Ca (Table 2), and growth performance of pigs is not affected by the particle size of the calcium carbonate in the diets (Merriman and Stein, 2016). It has been reported that dietary fat may reduce the digestibility of Ca in humans because of formation of Ca-fat complexes in the intestinal tract (Bendsen et al., 2008), but recent data demonstrated that there are no negative ef-
Table 2. Growth performance, bone ash, and Ca and P retention in 11 to 25 kg pigs fed diets varying in concentrations of standardized total tract digestible (STID) Ca and STID P, Exp. 1
fects of adding up to 7% dietary fat to diets fed to pigs (Merriman et al., 2016c).
The reason the STTD of Ca in calcium carbonate and some animal proteins is increased if microbial
Item Initial wt, kg Final wt, kg ADFI,g ADG,g G:F Bone ash, g BoneCa,g Bone P, g Ca retention, g/d P retention, g/d
0.32
0.36 11.39 25.21 957 626 0.65 7.8
2.86 1.41 2.16 2.30
0.40 0.48
0.36 0.36 11.35 11.44 25.29 25.47 961 963 631 636 0.66 0.66 8.5 9.8
3.15 3.64 1.53 1.77 2.7S 3.41 2.42 2.64
STTDCa% 0.56 0.64
STTDP,% 0.36 0.36 11.37 11.45 25.76 24.23 1,003 652 0.65 9.5 3.54 1.71 3.41 2.50
927 579 0.62 9.0 3.39 1.62 3.99 2.67
0.72
0.36 11.33 23.74 934 565 0.61 9.1
3.45 1.62 3.75 2.49
0.72 0.72
0.33 0.40 11.42 11.42 24.32 25.05 970 957 587 622 0.61 0.65 8.1 10.2
3.05 3.82 1.45 1.84 3.50 4.23 2.29 2.72
Table 3. Predicted values for ADG, G:F, bone ash, and Ca retention of 25 to 50 kg pigs fed diets containing 0.15, 0.31, 0.39, or 0.47% standardized total tract digestible (STID) P and 0.13, 0.27, 0.42, 0.57, or 0.72% STID Ca, Exp. 2 1
Item ADG,g G:F Bone ash, g Ca retention, g/d
0.15 0.76 (0.12) 0.43 (0.09) 14.3 (0.43) 4.8 (0.76)
Dietary STTD P, %
0.31 0.39 0.87 (0.36) 0.90 (0.47) 0.46 (0.38) 0.48 (O.S2) 21.3 (0.56) 23.2 (0.63) 7.1 (0.93) 8.4 (1.02)
0.47 0.92 (0.59) 0.50 (0.67) 24.0 (0.69) 9.9 (1.11)
1 The first value in each cell is the maximum response obtained at the STID P concentration indicated, and the value in parenthesis is the% STID Ca that will result in this response.
58
will be bound to phytate, which will result in increased digestibility of Ca. However, because excess dietary Ca will reduce the digestibility of P and thereby increase P excretion in the feces (Stein et al., 2011) and reduce growth performance of pigs (Gonzalez-Vega, 2016a,b; Merriman et al., 2016a), it is important to take the increased digestibility of Ca that is a result of microbial phytase into account in formulation of diets fed to growing pigs.
Requirements for Digestible Ca by Growing Pigs
Three experiments were conducted to determine the requirements for digestible Ca by growing pigs. In the first experiment, 6 diets that contained 0.36% STTD P and 6 levels of digestible Ca from 0.32 to 0.72% were used (Gonzalez-Vega et al., 2016a). Two additional diets containing 0.72% Ca and either 0.33 or 0.40% STTD P were also formulated. The 8 diets were fed for 22 days to pigs that were 11.39 ± 1.21 kg at the start of the experiment with 4 pigs per pen and 8 replicate pens per treatment. Individual pig weights were recorded at the beginning and at the conclusion of the experiment and on the last day of the experiment, one pig per pen was sacrificed and the right femur was removed. Data for average daily gain (ADG), average daily feed intake (ADFI) and average gain to feed (G:F)
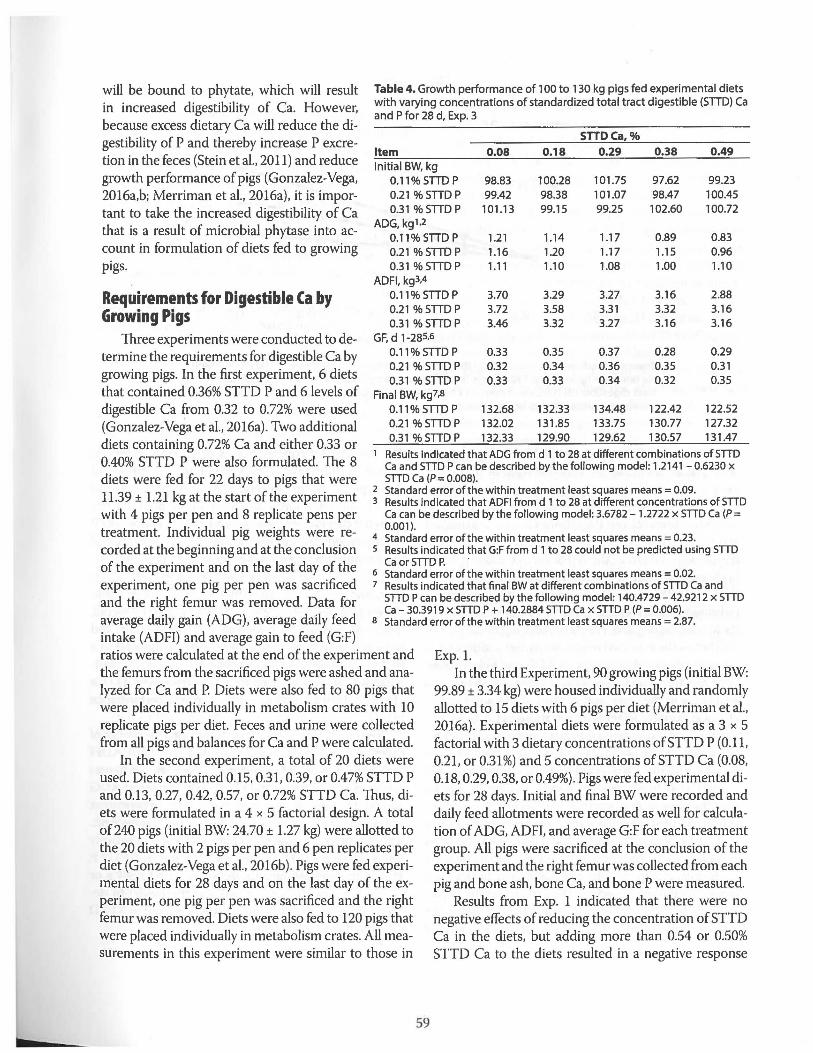
Table 4. Growth performance of 100 to 130 kg pigs fed experimental diets with varying concentrations of standardized total tract digestible (STTD) Ca and P for 28 d, Exp. 3
STTDCa,% Item 0.08 0.18 0.29 0.38 0.49 Initial BW, kg
0.11%STTD P 98.83 100.28 101.75 97.62 99.23 0.21 %STTD P 99.42 98.38 101.07 98.47 100.45 0.31% STTD P 101.13 99.15 99.25 102.60 100.72
ADG, kg1.2
0.11%STTD P 1.21 1.14 1.17 0.89 0.83 0.21 %STTDP 1.16 1.20 1.17 1.15 0.96 0.31 %STTD P 1.11 1.10 1.08 1.00 1.10
ADFI, kg3.4 0.11%STTD P 3.70 3.29 3.27 3.16 2.88 0.21% STTD P 3.72 3.58 3.31 3.32 3.16 0.31 %STTD P 3.46 3.32 3.27 3.16 3.16
GF, d 1-285,6
0.11%STTD P 0.33 0.35 0.37 0.28 0.29 0.21 %STTDP 0.32 0.34 0.36 0.35 0.31 0.31 %STTD P 0.33 0.33 0.34 0.32 0.35
Final BW, kg7.s 0.11%STTD P 132.68 132.33 134.48 122.42 122.52 0.21 %STTD P 132.02 131.85 133.75 130.77 127.32
0.31 %STTD P 132.33 129.90 129.62 130.57 131.47
1 Results indicated that ADG from d 1 to 28 at different combinations of STTD Ca and STTD P can be described by the following model: 1.2141-0.6230 x STTD Ca (P = 0.008).
2 Standard error of the within treatment least squares means= 0.09. 3 Results indicated that ADFI from d 1 to 28 at different concentrations of STTD
Ca can be described by the following model: 3.6782- 1.2722 x STTD Ca (P = 0.001).
4 Standard error of the within treatment least squares means= 0.23. 5 Results indicated that G:F from d 1 to 28 could not be predicted using STTD
Ca or STTD P. . 6 Standard error of the within treatment least squares means= 0.02. 7 Results indicated that final BW at different combinations of STTD Ca and
STTD P can be described by the following model: 140.4729-42.9212 x STTD Ca- 30.3919 x STTD P + 140.2884 STTD Ca x STTD P (P = 0.006).
s Standard error of the within treatment least squares means= 2.87.
ratios were calculated at the end of the experiment and the femurs from the sacrificed pigs were ashed and analyzed for Ca and P. Diets were also fed to 80 pigs that were placed individually in metabolism crates with 10 replicate pigs per diet. Feces and urine were collected from all pigs and balances for Ca and P were calculated.
Exp.l. In the third Experiment, 90 growing pigs (initial BW:
99.89 ± 3.34 kg) were housed individually and randomly allotted to 15 diets with 6 pigs per diet {Merriman et al., 2016a). Experimental diets were formulated as a 3 x 5 factorial with 3 dietary concentrations ofSTTD P (0.11, 0.21, or 0.31 %) and 5 concentrations of STTD Ca (0.08, 0.18, 0.29, 0.38, or 0.49%). Pigs were fed experimental diets for 28 days. Initial and final BW were recorded and daily feed allotments were recorded as well for calculation of ADG, ADFI, and average G:F for each treatment group. All pigs were sacrificed at the conclusion of the experiment and the right femur was collected from each pig and bone ash, bone Ca, and bone P were measured.
In the second experiment, a total of 20 diets were used. Diets contained 0.15, 0.31, 0.39, or 0.47% STTD P and 0.13, 0.27, 0.42, 0.57, or 0.72% STTD Ca. Thus, diets were formulated in a 4 x 5 factorial design. A total of240 pigs (initial BW: 24.70 ± 1.27 kg) were allotted to the 20 diets with 2 pigs per pen and 6 pen replicates per diet (Gonzalez-Vega et al., 2016b). Pigs were fed experimental diets for 28 days and on the last day of the experiment, one pig per pen was sacrificed and the right femur was removed. Diets were also fed to 120 pigs that were placed individually in metabolism crates. All measurements in this experiment were similar to those in
59
Results from Exp. 1 indicated that there were no negative effects of reducing the concentration of STTD Ca in the diets, but adding more than 0.54 or 0.50% STTD Ca to the diets resulted in a negative response
100
95
90
85
80
75
70
65 0
-O.llSTIDP
...._0.21 STID P
~0.31STIDP
0.1
Bone ash
\
0.2 0.3 0.4 0.5
Standardized total tract digestible Ca, %
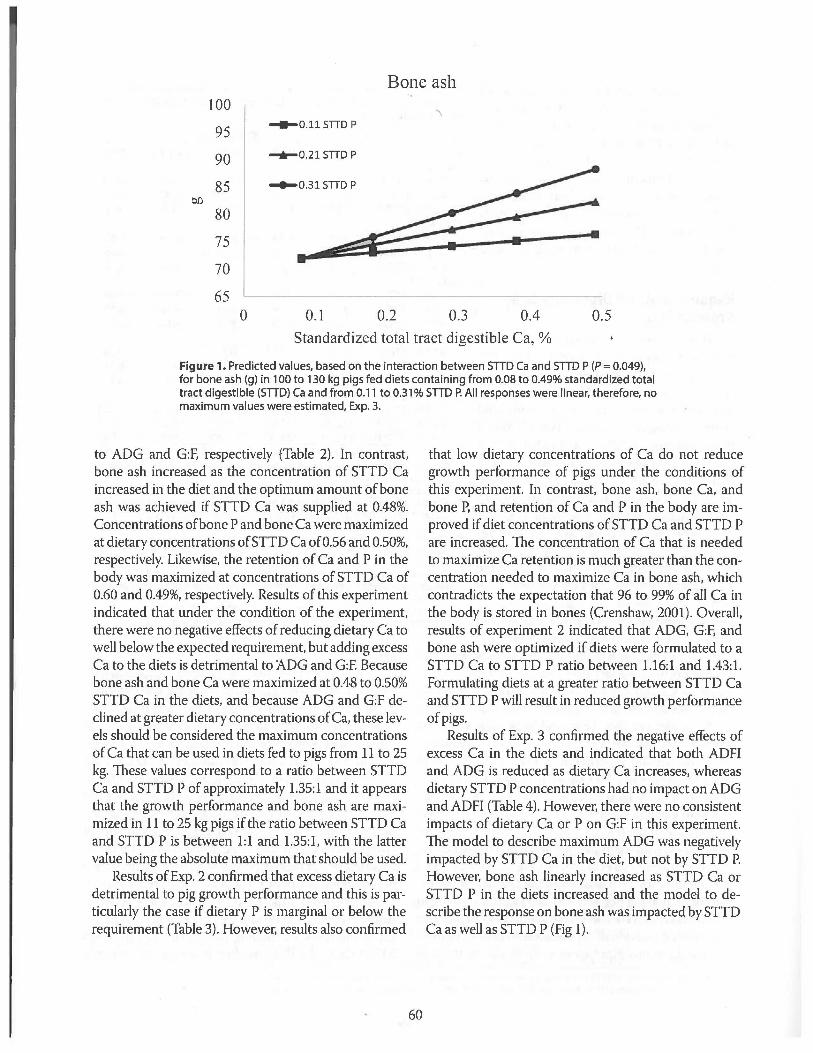
Figure 1. Predicted values, based on the interaction between STTD Ca and STTD P (P = 0.049), for bone ash (g) in 100 to 130 kg pigs fed diets containing from 0.08 to 0.49% standardized total tract digestible (STTD) Ca and from 0.11 to 0.31% STTD P. All responses were linear, therefore, no maximum values were estimated, Exp. 3.
to ADG and G:F, respectively (Table 2). In contrast, bone ash increased as the concentration of STTD Ca increased in the diet and the optimum amount of bone ash was achieved if STTD Ca was supplied at 0.48%. Concentrations ofbone P and bone Ca were maximized at dietary concentrations ofSTTD Ca of0.56 and 0.50%, respectively. Likewise, the retention of Ca and P in the body was maximized at concentrations of STTD Ca of 0.60 and 0.49%, respectively. Results of this experiment indicated that under the condition of the experiment, there were no negative effects of reducing dietary Ca to well below the expected requirement, but adding excess Ca to the diets is detrimental to :ADG and G:F. Because bone ash and bone Ca were maximized at 0.48 to 0.50% STTD Ca in the diets, and because ADG and G:F declined at greater dietary concentrations of Ca, these levels should be considered the maximum concentrations of Ca that can be used in diets fed to pigs from 11 to 25 kg. These values correspond to a ratio between STTD Ca and STTD P of approximately 1.35:1 and it appears that the growth performance and bone ash are maximized in 11 to 25 kg pigs if the ratio between STTD Ca and STTD Pis between 1:1 and 1.35:1, with the latter value being the absolute maximum that should be used.
Results ofExp. 2 confirmed that excess dietary Ca is detrimental to pig growth performance and this is particularly the case if dietary P is marginal or below the requirement (Table 3). However, results also confirmed
60
that low dietary concentrations of Ca do not reduce growth performance of pigs under the conditions of this experiment. In contrast, bone ash, bone Ca, and bone P, and retention of Ca and P in the body are improved if diet concentrations of STTD Ca and STTD P are increased. The concentration of Ca that is needed to maximize Ca retention is much greater than the concentration needed to maximize Ca in bone ash, which contradicts the expectation that 96 to 99% of all Ca in the body is stored in bones (Crenshaw, 2001). Overall, results of experiment 2 indicated that ADG, G:F, and bone ash were optimized if diets were formulated to a STTD Ca to STTD P ratio between 1.16:1 and 1.43:1. Formulating diets at a greater ratio between STTD Ca and STTD P will result in reduced growth performance of pigs.
Results of Exp. 3 confirmed the negative effects of excess Ca in the diets and indicated that both ADFI and ADG is reduced as dietary Ca increases, whereas dietary STTD P concentrations had no impact on ADG and ADFI (Table 4). However, there were no consistent impacts of dietary Ca or P on G:F in this experiment. The model to describe maximum ADG was negatively impacted by STTD Ca in the diet, but not by STTD P. However, bone ash linearly increased as STTD Ca or STTD P in the diets increased and the model to describe the response on bone ash was impacted by STTD Ca as well as STTD P (Fig 1).
Condusions Results of 3 experiments with 11 to 25 kg pigs, 25
to 50 kg pigs, and 100 to 130 kg pigs indicate that during short term experiments, it is not possible to reduce growth performance of pigs by reducing the concentration of STTD Ca in the diets. In contrast, inclusion of excess STTD Ca in the diet will reduce ADG and G:F and this effect is more pronounced if dietary STTD P is marginal or below the requirement than if STTD P is provided in excess of the requirement. It is also clear that the amount of STTD Ca needed to maximize bone ash, bone Ca, bone P, or retention of Ca and P in the body is much greater than the amount needed to maximize growth performance. Based on these results it is recommended that the STTD Ca to STTD P ratio for pigs less than 50 kg should be between 1:1 and 1.35:1, whereas diets fed to pigs above 100 kg should have a STTD Ca to STTD P ratio that does not exceed 1.1:1. Because the STTD of Ca is increased in diets containing microbial phytase, it is important that the effect of phytase on STTD ofCa is taken into account in diet formulation.
References Almeida, F. N., and H. H. Stein. 2013. Effects of a novel
phytase on the digestibility of phosphorus in cornsoybean meal diets fed to weanling and growing pigs. J. Anim. Sci. Biotech. 4:8
Bendsen, N. T, A. L. Hother, S. K. Jensen, J. K. Lorenzen, and A. Astrup. 2008. Effect of dairy calcium on fecal fat excretion: a randomized crossover trial. Int. J. Obesity. 32:1816-1824.
Crenshaw, T D. 2001. Calcium, phosphorus, vitamin D, and vitamin K in swine nutrition. In: A. J. Lewis, and L. L. Southern, editors, Swine nutrition. 2nd ed. CRC Press, Boca Raton, FL. p. 187-212.
Gonzalez-Vega, J. C., C. L. Walk, Y. Liu, and H. H. Stein. 2013. Determination of endogenous intestinal losses of Ca and true total tract digestibility of calcium in canola meal fed to growing pigs. J. Anim. Sci. 91:4807-4816.
Gonzalez-Vega, J. C., C. L. Walk, and H. H. Stein. 2015a. Effects of microbial phytase on apparent and standardized total tract digestibility of calcium in calcium supplements fed to growing pigs. J. Anim. Sci. 93:2255-2264.
61
Gonzalez-Vega, J. C., C. L. Walk, and H. H. Stein. 2015b. Effect of phytate, microbial phytase, fiber; and soybean oil on calculated values for apparent and standardized total tract digestibility of calcium and apparent total tract digestibility of phosphorus in fish meal fed to growing pigs. J. Anim. Sci. 93:4808-4818.
Gonzalez-Vega, J. C., Y. Liu, J. C. McCann, C. L. Walk, J. J. Loor, and H. H. Stein. 2016a. Requirement for digestible calcium by 11 to 25 kg pigs as determined by growth performance, bone ash concentration, calcium and phosphorus balances, and expression of genes involved in transport of calcium in intestinal and kidney cells. J. Anim. Sci. In Press.
Gonzalez-Vega, J. C., C. L. Walk, and H. H. Stein. 2016b. Digestible calcium requirements for 25 to 50 kg pigs. J. Anim. Sci. 94(Suppl. 2):101 (Abstr.)
Merriman, L. A., and H. H. Stein. 2016. Particle size of calcium carbonate does not affect apparent and standardized total tract digestibility of calcium, retention of calcium, or growth performance of growing pigs. J. Anim. Sci. 94. In Press.
Merriman, L. A., C. L. Walk, C. M. Parsons, and H. H. Stein. 2016a. Digestible calcium requirement for 100 to 130 kg pigs. J. Anim. Sci. 94(E-Suppl. 5):458 (Abstr.)
Merriman, L.A., C. L. Walk, and H. H. Stein. 2016b. The effect of microbial phytase on the apparent and standardized total tract digestibility of calcium in feed ingredients of animal origin. ]. Anim. Sci. 94(Suppl. 2):110 (Abstr.)
Merriman, L.A., C. L. Walk, and H. H. Stein. 2016c. Effect of fat sources on ATTD of minerals.]. Anim. Sci. 94(Suppl. 2):104 (Abstr.)
NRC. 2012. Nutrient Requirements of Swine. 11th rev. ed. Natl. Acad. Press, Washington, DC.
Stein, H. H., 0 . Adeola, G. L. Cromwell, S. W. Kim, D. C. Mahan, and P. S. Miller. 2011. Concentration of dietary calcium supplied by calcium carbonate does not affect the apparent total tract digestibility of calcium, but reduces digestibility of phosphorus by growing pigs. J. Anim. Sci. 89:2139-2144.