Embed Size (px)
Citation preview
DIGESTIBILITY OF CALCIUM AND DIGESTIBLE CALCIUM REQUIREMENTS IN PIGS
BY
JOLIE CAROLINE GONZÁLEZ VEGA
DISSERTATION
Submitted in partial fulfillment of the requirements for the degree of Doctor of Philosophy in Animal Sciences
in the Graduate College of the University of Illinois at Urbana-Champaign, 2016
Urbana, Illinois Doctoral Committee:
Professor Hans H. Stein, Chair Professor Emeritus Michael R. Murphy Professor Thomas D. Crenshaw, University of Wisconsin-Madison Assistant Professor Ryan N. Dilger Assistant Professor Marie-Pierre Létourneau-Montminy, Laval University
ii
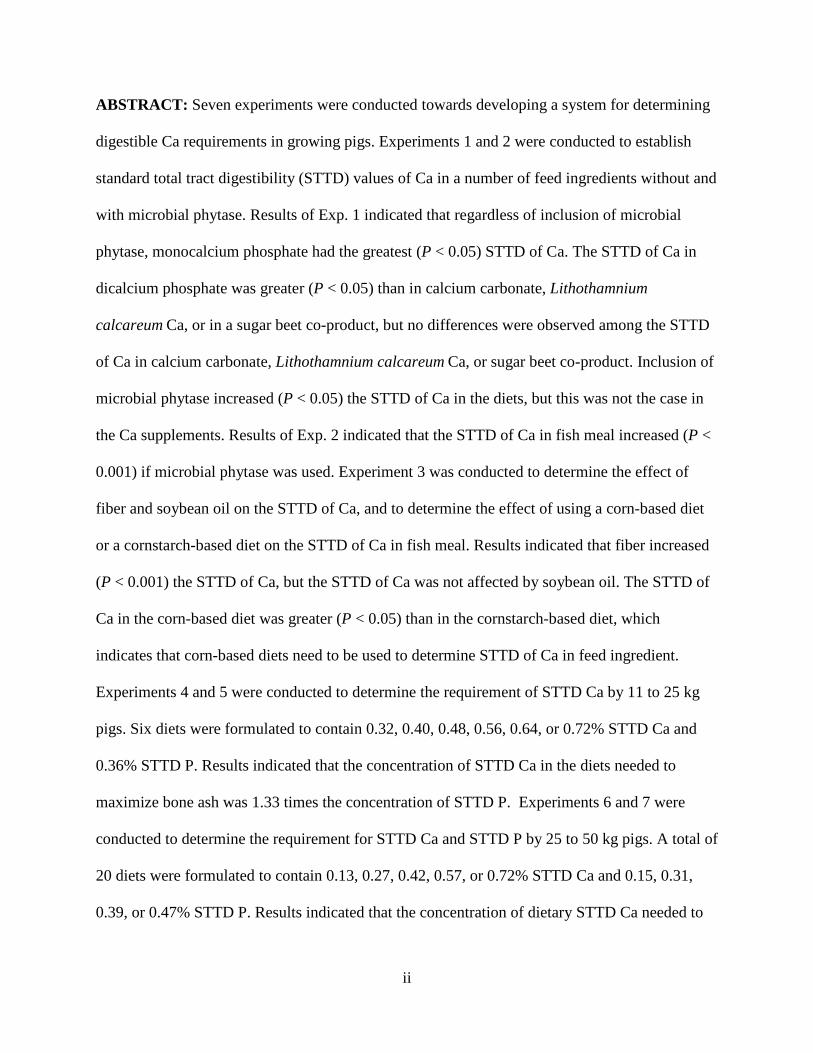
ABSTRACT: Seven experiments were conducted towards developing a system for determining
digestible Ca requirements in growing pigs. Experiments 1 and 2 were conducted to establish
standard total tract digestibility (STTD) values of Ca in a number of feed ingredients without and
with microbial phytase. Results of Exp. 1 indicated that regardless of inclusion of microbial
phytase, monocalcium phosphate had the greatest (P < 0.05) STTD of Ca. The STTD of Ca in
dicalcium phosphate was greater (P < 0.05) than in calcium carbonate, Lithothamnium
calcareum Ca, or in a sugar beet co-product, but no differences were observed among the STTD
of Ca in calcium carbonate, Lithothamnium calcareum Ca, or sugar beet co-product. Inclusion of
microbial phytase increased (P < 0.05) the STTD of Ca in the diets, but this was not the case in
the Ca supplements. Results of Exp. 2 indicated that the STTD of Ca in fish meal increased (P <
0.001) if microbial phytase was used. Experiment 3 was conducted to determine the effect of
fiber and soybean oil on the STTD of Ca, and to determine the effect of using a corn-based diet
or a cornstarch-based diet on the STTD of Ca in fish meal. Results indicated that fiber increased
(P < 0.001) the STTD of Ca, but the STTD of Ca was not affected by soybean oil. The STTD of
Ca in the corn-based diet was greater (P < 0.05) than in the cornstarch-based diet, which
indicates that corn-based diets need to be used to determine STTD of Ca in feed ingredient.
Experiments 4 and 5 were conducted to determine the requirement of STTD Ca by 11 to 25 kg
pigs. Six diets were formulated to contain 0.32, 0.40, 0.48, 0.56, 0.64, or 0.72% STTD Ca and
0.36% STTD P. Results indicated that the concentration of STTD Ca in the diets needed to
maximize bone ash was 1.33 times the concentration of STTD P. Experiments 6 and 7 were
conducted to determine the requirement for STTD Ca and STTD P by 25 to 50 kg pigs. A total of
20 diets were formulated to contain 0.13, 0.27, 0.42, 0.57, or 0.72% STTD Ca and 0.15, 0.31,
0.39, or 0.47% STTD P. Results indicated that the concentration of dietary STTD Ca needed to
iii
maximize ADG and G:F was between 1.16 and 1.43 times the concentration of STTD P, but to
maximize bone ash, dietary STTD Ca needs to be between 1.53 and 1.81 times the concentration
of STTD P. In conclusion, diets for growing pigs may be formulated using values for STTD of
Ca in feed ingredients, but, it is recommended that Ca digestibility of feed ingredients are
determined in corn-based diets. If diets are formulated to meet STTD Ca and STTD P
requirements, the utilization of both minerals is maximized. Additional research is needed to
determine the STTD Ca requirements by pigs above 50 kg BW.
Key words: digestible calcium, digestible phosphorus, microbial phytase, phytate, pig,
requirements
iv
ACKNOWLEDGMENTS
Completing this dissertation brings a great joy in me. Not only for all we accomplished,
but also for all the experiences during this process. One thing I noticed, time flies, and what you
decide to do with your time will impact your future. I cannot express in one page all my gratitude
to all the people who have helped me to achieve my goals, and I hope they all feel they are a part
of this successful achievement. Dr. Stein, only you and me know how much you have guided me
and supported me during 20% of my life. I am thankful because you have known how to
embrace my talents and supported me in all my challenges. I really had so much fun doing this
work with calcium in pigs, and you made it more enjoyable with all your comments, suggestions,
ideas, and with the gene expression. Thank you for the national and international trips that you
provided me, and thank you for your support to grow as student, I really enjoyed them all.
I express my gratitude to my committee members, Dr. Murphy, Dr. Crenshaw, Dr.
Dilger, and Dr. Létourneau-Montminy for all your suggestions, comments, ideas, time, and
support to complete this dissertation. This would not be the same without your contributions, all
of you are very genius people, and I am much honored to have you all in my committee.
I also want to thank ALL the members of the Stein lab, the farm crew, and the feed mill
personnel, because you have been very helpful and kind to me. Please take credit for this
dissertation, because without your good help this would not have been completed. I thank the
University of Illinois for opening the doors to international students, also thanks to all the
professors, secretaries, and special thanks to HiDee. HiDee, you are a great example to all, very
kind, hard worker, and always helpful. Also, thanks to ALL my friends for your encouragement
and fun moments during all these years.
v
I want to thank with all my heart Ylljam Gjikola for all your kindness, help, and support
during my last years of my PhD studies. You are like a fine pearl that I found with great value.
Also, thanks to my friend Trypsi, she has been a sweet support to me during the last 6 years.
My deepest gratitude to my family. Querida familia, completar mi doctorado ha sido un
gran logro para todos nosotros. Por eso, quiero agradecer profundamente a todos ustedes por
todo lo que han hecho por mi. Yo no lo habria logrado sin su ayuda, gracias papito Jorge, mamita
Mery, hermanitas Steffi, Licette, and Sophia, sobrinitos, abuelita Susana, tios y primos. Ustedes
mas que nadie saben mi historia y condiciones para venir a este nuevo pais a buscar
oportunidades para un mejor futuro. Mi Padre ha sido realmente bueno conmigo, El siempre ha
proveido en todo momento. Haberlo logrado me llena de inmensa alegria y espero ustedes tomen
parte de este triunfo. Agradezco por cada una de sus vidas, hay grandes cosas para cada uno de
nosotros, no solo a nivel de educación si no muchas mas. La vida es hermosa, es un tesoro, que
debemos apreciar cada dia. Los amo mucho y mis felicitaciones para ustedes tambien. Lo hemos
logrado!!!
vi
TABLE OF CONTENTS
CHAPTER 1 ................................................................................................................................... 1
INTRODUCTION ....................................................................................................................... 1
LITERATURE CITED ............................................................................................................... 3
CHAPTER 2 ................................................................................................................................... 5
PHYTATE, PHYTASE, AND CALCIUM IN PIGS: LITERATURE REVIEW .......................... 5
PHYTATE ................................................................................................................................... 5
Phytate and Minerals ............................................................................................................... 6
Phytate and Protein .................................................................................................................. 7
Phytate and Energy .................................................................................................................. 8
Release of Nutrients that are Bound to Phytate ....................................................................... 9
PHYTASE ................................................................................................................................. 10
CALCIUM ................................................................................................................................ 13
Absorption of Ca ................................................................................................................... 13
Digestibility of Ca ................................................................................................................. 16
CALCIUM REQUIREMENTS................................................................................................. 18
LITERATURE CITED ............................................................................................................. 21
TABLE ...................................................................................................................................... 34
CHAPTER 3 ................................................................................................................................. 35
EFFECTS OF MICROBIAL PHYTASE ON APPARENT AND STANDARDIZED TOTAL TRACT DIGESTIBILITY OF CALCIUM IN CALCIUM SUPPLEMENTS FED TO GROWING PIGS.......................................................................................................................... 35
INTRODUCTION ..................................................................................................................... 36
MATERIALS AND METHODS .............................................................................................. 37
RESULTS.................................................................................................................................. 41
DISCUSSION ........................................................................................................................... 44
LITERATURE CITED ............................................................................................................. 50
TABLES .................................................................................................................................... 55
CHAPTER 4 ................................................................................................................................. 71
EFFECT OF PHYTATE, MICROBIAL PHYTASE, FIBER, AND SOYBEAN OIL ON CALCULATED VALUES FOR APPARENT AND STANDARDIZED TOTAL TRACT DIGESTIBILITY OF CALCIUM IN FISH MEAL FED TO GROWING PIGS ........................ 71
INTRODUCTION ..................................................................................................................... 72
vii
MATERIALS AND METHODS .............................................................................................. 73
Experiment 1: Effect of Microbial Phytase on Ca Digestibility in the Absence or the Presence of Phytate ................................................................................................................ 73
Experiment 2: Effects of Type of Diet, Fiber, and Soybean Oil on Ca Digestibility ............ 76
RESULTS.................................................................................................................................. 78
Experiment 1: Effect of Microbial Phytase on Ca Digestibility in the Absence or the Presence of Phytate ................................................................................................................ 78
Experiment 2: Effects of Type of Diet, Fiber, and Soybean Oil on Ca Digestibility ............ 79
DISCUSSION ........................................................................................................................... 80
Chemical Characteristics of Ingredients ................................................................................ 80
Endogenous Losses of Ca ...................................................................................................... 81
Experiment 1: Effect of Microbial Phytase on Ca Digestibility in the Absence or the Presence of Phytate ................................................................................................................ 81
Experiment 2: Effects of Type of Diet, Fiber, and Soybean Oil on Ca Digestibility ............ 83
Conclusions ........................................................................................................................... 85
LITERATURE CITED ............................................................................................................. 86
TABLES .................................................................................................................................... 93
CHAPTER 5 ............................................................................................................................... 107
REQUIREMENT FOR DIGESTIBLE CALCIUM BY 11 TO 25 KG PIGS AS DETERMINED BY GROWTH PERFORMANCE, BONE ASH CONCENTRATIONS, CALCIUM AND PHOSPHORUS BALANCES, AND EXPRESSION OF GENES INVOLVED IN TRANSPORT OF CALCIUM IN INTESTINAL AND KIDNEY CELLS ....................................................... 107
INTRODUCTION ................................................................................................................... 108
MATERIALS AND METHODS ............................................................................................ 109
Experiment 1: Growth Performance, Bone Ash, and Gene Expression .............................. 109
Experiment 2. Calcium and P Balance ................................................................................ 114
RESULTS................................................................................................................................ 116
Experiment 1: Growth Performance, Bone Ash, and Gene Expression .............................. 116
Experiment 2. Calcium and P Balance ................................................................................ 117
DISCUSSION ......................................................................................................................... 119
Conclusions ......................................................................................................................... 123
LITERATURE CITED ........................................................................................................... 124
FIGURES ................................................................................................................................ 130
TABLES .................................................................................................................................. 142
viii
CHAPTER 6 ............................................................................................................................... 155
REQUIREMENT FOR DIGESTIBLE CALCIUM BY 25 TO 50 KG PIGS AT DIFFERENT DIETARY CONCENTRATIONS OF PHOSPHORUS BY GROWTH PERFORMANCE, BONE ASH CONCENTRATION, AND CALCIUM AND PHOSPHORUS BALANCES . 155
INTRODUCTION ................................................................................................................... 156
MATERIALS AND METHODS ............................................................................................ 157
Experiment 1: Requirements for Digestible Ca to Maximize Growth Performance and Bone Ash ....................................................................................................................................... 157
Experiment 2. Calcium and P Balance ................................................................................ 161
RESULTS................................................................................................................................ 163
Experiment 1: Requirements for Digestible Ca to Maximize Growth Performance and Bone Ash ....................................................................................................................................... 163
Experiment 2. Calcium and P Balance ................................................................................ 164
DISCUSSION ......................................................................................................................... 166
Conclusions ......................................................................................................................... 171
LITERATURE CITED ........................................................................................................... 173
FIGURES ................................................................................................................................ 178
TABLES .................................................................................................................................. 191
GENERAL CONCLUSIONS ..................................................................................................... 208
1
CHAPTER 1
INTRODUCTION
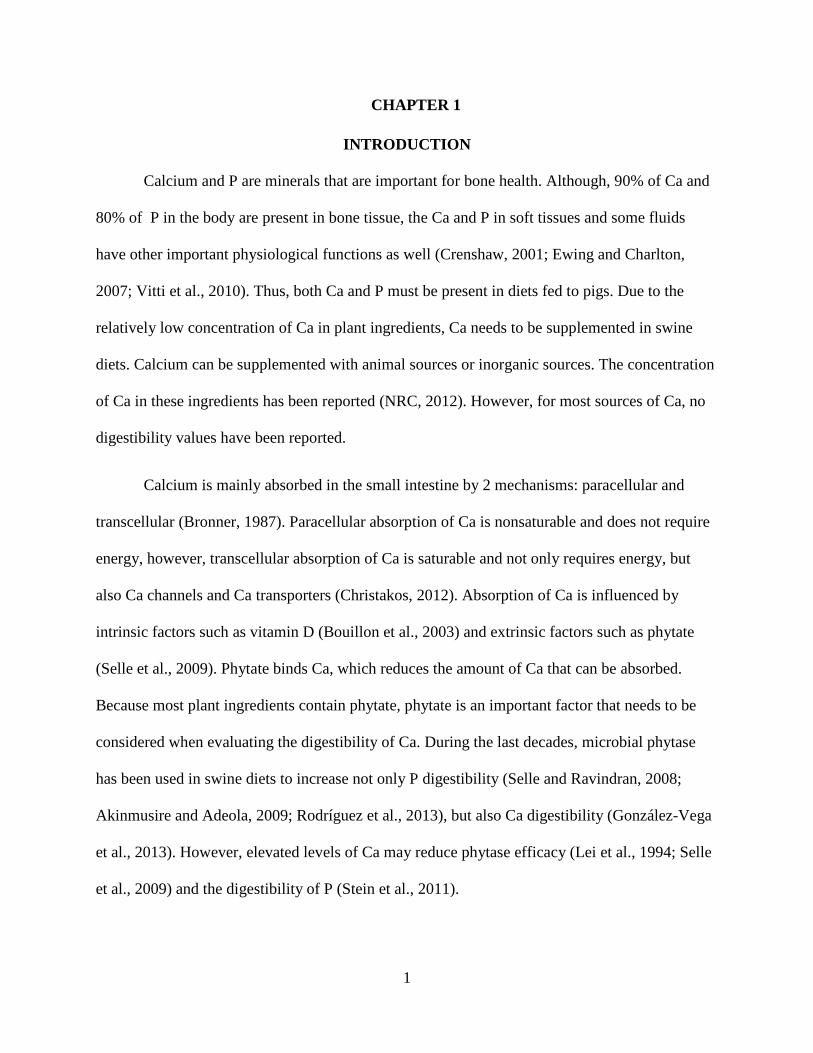
Calcium and P are minerals that are important for bone health. Although, 90% of Ca and
80% of P in the body are present in bone tissue, the Ca and P in soft tissues and some fluids
have other important physiological functions as well (Crenshaw, 2001; Ewing and Charlton,
2007; Vitti et al., 2010). Thus, both Ca and P must be present in diets fed to pigs. Due to the
relatively low concentration of Ca in plant ingredients, Ca needs to be supplemented in swine
diets. Calcium can be supplemented with animal sources or inorganic sources. The concentration
of Ca in these ingredients has been reported (NRC, 2012). However, for most sources of Ca, no
digestibility values have been reported.
Calcium is mainly absorbed in the small intestine by 2 mechanisms: paracellular and
transcellular (Bronner, 1987). Paracellular absorption of Ca is nonsaturable and does not require
energy, however, transcellular absorption of Ca is saturable and not only requires energy, but
also Ca channels and Ca transporters (Christakos, 2012). Absorption of Ca is influenced by
intrinsic factors such as vitamin D (Bouillon et al., 2003) and extrinsic factors such as phytate
(Selle et al., 2009). Phytate binds Ca, which reduces the amount of Ca that can be absorbed.
Because most plant ingredients contain phytate, phytate is an important factor that needs to be
considered when evaluating the digestibility of Ca. During the last decades, microbial phytase
has been used in swine diets to increase not only P digestibility (Selle and Ravindran, 2008;
Akinmusire and Adeola, 2009; Rodríguez et al., 2013), but also Ca digestibility (González-Vega
et al., 2013). However, elevated levels of Ca may reduce phytase efficacy (Lei et al., 1994; Selle
et al., 2009) and the digestibility of P (Stein et al., 2011).
2
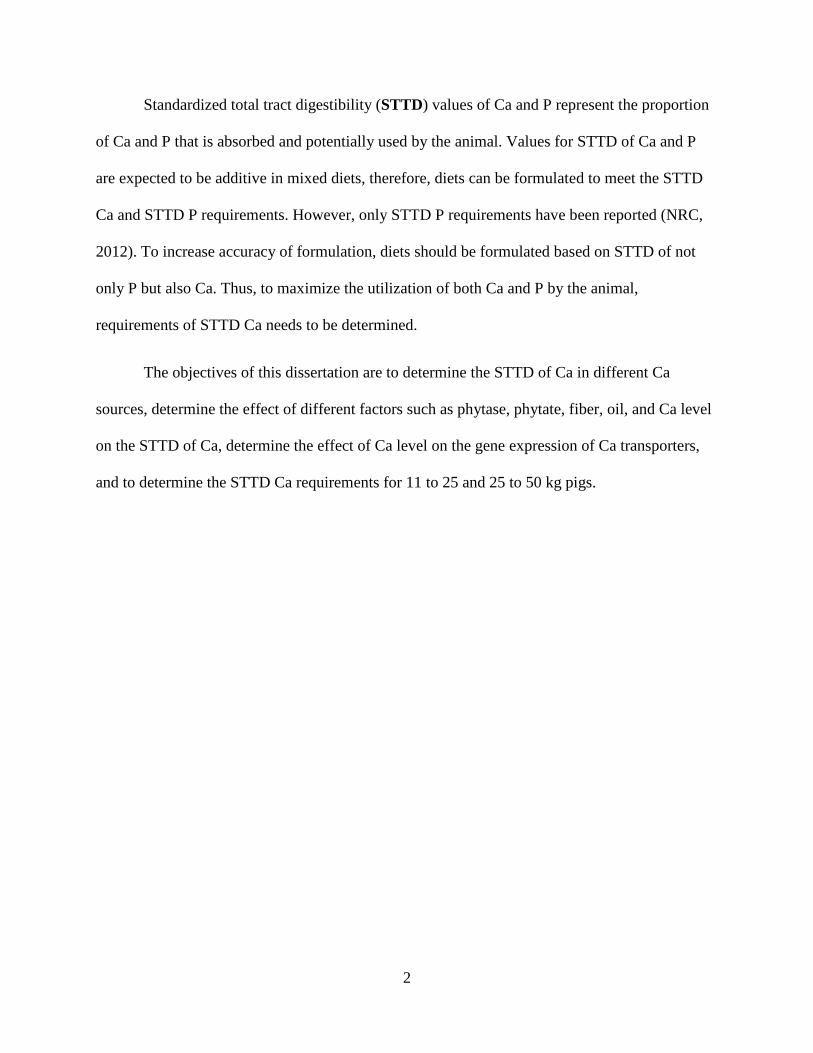
Standardized total tract digestibility (STTD) values of Ca and P represent the proportion
of Ca and P that is absorbed and potentially used by the animal. Values for STTD of Ca and P
are expected to be additive in mixed diets, therefore, diets can be formulated to meet the STTD
Ca and STTD P requirements. However, only STTD P requirements have been reported (NRC,
2012). To increase accuracy of formulation, diets should be formulated based on STTD of not
only P but also Ca. Thus, to maximize the utilization of both Ca and P by the animal,
requirements of STTD Ca needs to be determined.
The objectives of this dissertation are to determine the STTD of Ca in different Ca
sources, determine the effect of different factors such as phytase, phytate, fiber, oil, and Ca level
on the STTD of Ca, determine the effect of Ca level on the gene expression of Ca transporters,
and to determine the STTD Ca requirements for 11 to 25 and 25 to 50 kg pigs.
3
LITERATURE CITED
Akinmusire, A. S., and O. Adeola. 2009. True digestibility of phosphorus in canola and soybean
meals for growing pigs: Influence of microbial phytase. J. Anim. Sci. 87:977-983.
Bouillon, R., S. Van Cromphaut, and G. Carmeliet. 2003. Intestinal calcium absorption:
Molecular vitamin D mediated mechanism. J. Cell. Biochem. 88:332-339.
Bronner, F. 1987. Intestinal calcium absorption: Mechanisms and implications. J. Nutr.
117:1347-1352.
Christakos, S. 2012. Recent advances in our understanding of 1,25-dihydroxyvitamin D3
regulation of intestinal calcium absorption. Arch. Biochem. Biophys. 523:73-76.
Crenshaw, T. D. 2001. Calcium, phosphorus, vitamin D, and vitamin K in swine nutrition. In: A.
J. Lewis and L. L. Southern, editors, Swine Nutrition. 2nd ed. CRC Press, Boca Raton,
FL. p. 187-212.
Ewing, W., and S. J. Charlton. 2007. Calcium. Phosphorus. In: The Minerals Directory. 2nd ed.
Context Products Ltd, Leicestershire, UK. p. 5a-5f, and 19a-19f.
González-Vega, J. C., C. L. Walk, Y. Liu, and H. H. Stein. 2013. Determination of endogenous
intestinal losses of Ca and true total tract digestibility of calcium in canola meal fed to
growing pigs. J. Anim. Sci. 91:4807-4816.
Lei, X. G., P. K. Ku, E. R. Miller, M. T. Yokoyama, and D. E. Ullrey. 1994. Calcium level
affects the efficacy of supplemental microbial phytase in corn-soybean meal diets of
weanling pigs. J. Anim. Sci. 72:139-143.
NRC. 2012. Nutrient Requirements of Swine. 11th rev. ed. Natl. Acad. Press, Washington, DC.
Rodríguez, D. A., R. C. Sulabo, J. C. González-Vega, and H. H. Stein. 2013. Energy
concentration and phosphorus digestibility in canola, cottonseed, and sunflower products
4
fed to growing pigs. Can. J. Anim. Sci. 93:493-503.
Selle, P. H., A. J. Cowieson, and V. Ravindran. 2009. Consequences of calcium interactions with
phytate and phytase for poultry. Livest. Sci. 124:126-141.
Selle, P. H., and V. Ravindran. 2008. Phytate-degrading enzymes in pig nutrition. Livest. Sci.
113:99-122.
Stein, H. H., O. Adeola, G. L. Cromwell, S. W. Kim, D. C. Mahan, and P. S. Miller. 2011.
Concentration of dietary calcium supplied by calcium carbonate does not affect the
apparent total tract digestibility of calcium, but reduces digestibility of phosphorus by
growing pigs. J. Anim. Sci. 89:2139-2144.
Vitti, D. M. S. S., J. C. Da Silva Filho, H. Louvandini, R. S. Dias, I. C. S. Bueno, and E.
Kebreab. 2010. Phosphorus and calcium utilization in ruminants using isotope dilution
technique. In: D. M. S. S. Vitti and E. Kebreab, editors, Phosphorus and calcium
utilization and requirements in farm animals. CAB International, London, UK. p. 45-67.
5
CHAPTER 2
PHYTATE, PHYTASE, AND CALCIUM IN PIGS: LITERATURE REVIEW
Digestion is the process that takes place in the gastrointestinal tract to break down
ingested nutrients into smaller molecules that are able to be absorbed by the animal. The
gastrointestinal tract has a complex environment where secretions, pH, enzymes, cells, motility,
bacteria, and others factors play a role in the digestion of nutrients. However, digestibility of a
nutrient is not only influenced by these factors, but may also be influenced by extrinsic factors
such as the level of the nutrient in the diet and interactions with other nutrients. All these factors
may enhance or reduce the digestibility of the nutrient. As an example, phytate reduces the
digestibility of Ca (Selle et al., 2009), whereas, phytase increases the digestibility of Ca
(González-Vega et al., 2013). If the digestibility of Ca in feed ingredients is determined, diets
can be formulated to meet the requirements for digestible Ca and digestible P, which likely will
result in more accurate diet formulations.
PHYTATE
Phytate is a salt of phytic acid (myo-inositol 1, 2, 3, 4, 5, 6-hexakis dihydrogen
phosphate; IP6) and is present in most plant seeds. Phytic acid has a molecular weight of 660
g/mol and has 12 negative charges that may chelate different cations such as Ca, Mg, K, Cu, Zn,
Fe, and phytate also may bind protein, starch, and lipids (Onyango et al., 2009; Selle et al.,
2009). The functions of phytic acid are to protect the seed from oxidative stress (Graf, 1983) and
to retain some P, inositol, and other minerals in the seed for the germination process, but some
enzymes are required to release these nutrients during germination (Kies, 2005).
6
Phytate is mainly present in plants as Mg and K salt mixtures (Onyango et al., 2009) and
the concentration of phytate in plant seeds is variable, but is mostly between 1 and 3% (Graf,
1983). Likewise, the location of phytate in the seed may vary (Kies, 2005). In wheat, barley, and
rice, phytate is mainly located in the aleurone layer, in corn, most phytate is located in the germ,
and in dicotyledonous seeds, phytate is located in the cotyledons (Kies, 2005; Bohn et al., 2008).
The process of biosynthesis and storage of phytic acid is different among plants and is
influenced by weather conditions, soil conditions, and enzymes that are present in the plant
(Bohn et al., 2008). Inositol phosphate kinase is one of the kinases responsible for phytic acid
biosynthesis, but its functions may vary among plant species (Shi et al., 2003). For most seeds,
the biosynthesis of phytate starts after flowering, and phytate is stored during maturation of the
seed (Kies, 2005; Bohn et al., 2008). Research is ongoing to elucidate the process of biosynthesis
and accumulation of phytic acid in seeds (Shi et al., 2003; Bohn et al., 2008).
Phytate and Minerals
Phytate contains 282 g P per kg (Selle et al., 2009) and most of the P in plant ingredients
is bound to phytate, which is mostly unavailable for absorption by pigs and poultry. The majority
of the phytate-bound P is, therefore, excreted in the feces and may contribute to increased P-
pollution. Consequently, diets for pigs are most correctly formulated based on standardized total
tract digestibility (STTD) of P (NRC, 2012). Inclusion of inorganic P in the diets is needed to
compensate for the low STTD of the phytate-bound P, but this is expensive (Kies, 2005). During
recent decades, research has, therefore, been conducted to identify solutions that may contribute
to a reduction in the amount of P excreted in the feces and also to make more phytate bound P
available to pigs or poultry.
7
Phytate is negatively charged and as phytate moves from a low pH in the stomach to a
greater pH in the small intestine, phytate becomes more negative (Santos, 2012). This enhances
the reaction between phytate and cations or proteins resulting in the precipitation of these salts
(Santos, 2012). Phytate has more affinity for cations such as Cu and Zn, but because Ca is the
most abundant cation in swine and poultry diets, Ca is more likely than other cations to form
such salts (Selle et al., 2009). However, addition of Cu and Zn in diets for weanling pigs is often
elevated because these minerals act as growth promoters (Jay et al., 2010). Therefore, Cu and Zn
may also bind to phytate in the intestinal tract, and thereby, reduce the availability of these
minerals for absorption (Santos, 2012).
Most of the Ca in diets for swine and poultry is supplemented as inorganic Ca because of
the low concentration of Ca in most plant ingredients (NRC, 2012). The apparent total tract
digestibility (ATTD) of Ca in diets containing both inorganic Ca and intrinsic Ca increases if
microbial phytase is used (Poulsen et al., 2010; Rodríguez et al., 2013; Almaguer et al., 2014).
Likewise, ATTD and true total tract digestibility (TTTD) of Ca from intrinsic Ca in canola meal
also increase if microbial phytase is included in the diet (González-Vega et al., 2013). The reason
for the increase in ATTD and TTTD of Ca if phytase is added to the diets is that phytase
hydrolyzes the phytate, reducing the chance to bind Ca, because phytate is able to chelate up to
5.1 atoms of Ca (Selle et al., 2009).
Phytate and Protein
Phytate may react with proteins containing basic AA (i. e., Arg, His, and Lys) in an
environment where the pH is below the isoelectric point because they get positively charged
(Cowieson et al., 2009; Selle et al., 2009; Santos, 2012; Selle et al., 2012). The resulting phytate-
protein complexes may precipitate and protein may become less soluble, which will result in a
8
reduced digestibility of protein (Cowieson et al., 2009; Selle et al., 2009; Santos, 2012). Phytate
may also negatively affect the activation of endogenous enzymes such as pepsin, which is
involved in protein digestion (Selle et al., 2009; Santos, 2012). In addition, phytate may bind to
water, which will result in less water around the proteins, which reduces protein solubility
(Santos, 2012). The negative effect of phytate on protein digestibility may also result in the
gastrointestinal tract hypersecreting pepsin, HCl, mucus, and sodium bicarbonate (Selle et al.,
2009), and endogenous losses of AA and minerals may, therefore, increase (Cowieson et al.,
2004). Active absorption of AA may also be reduced because of reduced effectiveness of the Na-
K pump (Onyango et al., 2009; Selle et al., 2009; Santos, 2012). One g of phytate may bind 10 g
of protein (Cowieson et al., 2009), but effects of phytate on protein digestibility has sometimes
been difficult to demonstrate in pigs.
Phytate and Energy
Phytate may have a negative impact on energy utilization because of a reduction in lipid
and glucose uptake (Selle et al., 2009). Digestibility of lipids is affected because phytate
decreases the activity of lipase (Knuckles, 1988), and also may form phytate-lipid-peptide
complexes (Cosgrove, 1966). Likewise, starch digestibility and glucose absorption may be
negatively affected (Selle et al., 2009) because phytate decreases the activity of α-amylase
(Deshpande and Cheryan, 1984) and also reduces the activity of the Na-K pump, which is
needed for glucose uptake. Phytate-starch complexes or protein-starch-phytate complexes may
also be formed (Thompson et al., 1987), but it is believed that phytate has a greater impact on
glucose absorption than on the digestibility of starch (Selle et al., 2009).
9
Release of Nutrients that are Bound to Phytate
Phytate is considered an anti-nutritional factor for pigs and poultry (Santos, 2012), but
germination of seeds, soaking, dehulling, fermentation, or use of enzymes are techniques that
may be applied to reduce the negative effects of phytate. Germination has been used to reduce
the phytate concentration in seeds, due to an increase in activity of enzymes in the seed during
germination (Camacho et al., 1992). During germination, the nutrient composition in the seed
changes, while protein, starch, and phytate concentrations decrease, and concentrations of free
AA, free sugars, reducing sugars, and phenolic compounds increase (Tian et al., 2010).
Germination is very effective in decreasing the concentration of phytate compared with other
techniques such as soaking, de-hulling, or cooking (Duhan et al., 2002). In vitro digestibility of
protein and starch in cowpeas increases more by germination than by soaking the seeds in
distilled water or dehulling soaked seeds (Preet and Punia, 2000). Increasing germination time of
soaked rye and barley seeds reduces the concentration of phytate P and increases the activity of
phytase and acid phosphatase enzymes compared with ungerminated seeds (Centeno et al.,
2001). Thus, the reduction of phytate P and increase in endogenous phosphatases in the seeds
that are a result of germination may contribute to an increased digestibility of P by pigs and
poultry. However, feeding pigs and poultry with germinated seeds is not very practical in a
commercial setting.
Fermentation may also be used to reduce the phytate content in seeds due to an increase
in phytase activity. This technique was used in wheat germ, which increased not only phytase
activity, but also the availability of Ca, Fe, K, Mn, Na, and Zn (Rizzello et al., 2010). Reduction
of the pH by fermentation may enhance the activation of endogenous phytases and also phytases
from lactic acid bacteria, which increase the availability of P bound to phytate (Rizzello et al.,
10
2010). Fermentation of feed ingredients such as soybean meal also may enhance the digestibility
of P by hydrolyzing some of the phytate-bound P (Rojas and Stein, 2012).
PHYTASE
Inclusion of microbial phytase in diets fed to pigs and poultry has become more common
during recent decades to make phytate-bound P available for absorption. Although some cereals
such as wheat and rye contain phytase, the efficacy of this phytase is only 40% of the efficacy of
microbial phytase (Zimmermann et al., 2002), therefore, inclusion of microbial phytase is
common in poultry and pig diets.
Phytase (myo-inositol hexakisphosphate phosphohydrolase) hydrolyzes the ester bonds in
phytate resulting in inositol phosphate (IP) IP5, IP4, IP3, IP2, IP1, inositol, and inorganic P
(Wyss et al., 1999). Phytases can be divided mainly into 3 categories by the position of the
inositol ring where they initiate the hydrolysis, which are the 3-, 5-, or 6- positions. Because only
one type of phytase is not able to hydrolyze all the ester bonds, the myo-inositol intermediates
have to be hydrolyzed by other types of phytases (Greiner and Konietzny, 2010). Inclusion of
microbial phytase in pig diets may lead to generation of IP3, IP4, or IP5 and not complete
hydrolysis of phytate, but this may not represent a problem because pigs may hydrolyze these
components in the small intestine (Hu et al., 1996).
Phytases are known as 3-phytases (e.g., Aspergillus niger based phytase), 5-phytases
(e.g., Pisium sativum based phytase), or 6-phytases (e.g., Escherichia coli based phytase; Greiner
and Konietzny, 2010). Most diets fed to pigs and poultry contain 3-phytases or 6-phytases. In
general, 3-phytases are from microbial origin, whereas 6-phytases are from plant origin, but there
are some exceptions. As an example of these exceptions, lupin has 3-phytase activity and E. coli
11
and Periophora lycii have 6-phytase activity (Greiner and Konietzny, 2010). Although, microbial
phytases are more effective than phytases from plant origin, a combination may be used. The pH
in the gastrointestinal tract plays an important role in the efficacy of the enzyme. Low pH in the
stomach enhances the activity of microbial phytase (60%) and plant origin phytase (40%), but a
greater pH in the small intestine and secretion of HCl, pepsin, and proteases may reduce the
activity of the enzyme (Rapp et al., 2001). Therefore, the hydrolysis of phytate in the stomach
plays an important role for the digestibility of P (Jongbloed et al., 1992).
Microbial phytases may originate from either fungi or bacteria, but both have similar
effects on Ca and P digestibility (Guggenbuhl et al., 2007; Selle and Ravindran, 2008). The fungi
and bacterial phytases may differ in the place of enzyme production. The fungal phytase is
mostly extracellularly located, whereas bacterial phytase is either extracellularly (e.g., Bacillus
subtilis, Enterobacter sp.) or intracellularly (e.g., E. coli, Klebsiella aerogenes) located
(Kerovuo, 2000). Fungal and bacterial phytases also differ in substrate specificity,
thermostability, and pH optima (Kerovuo, 2000; Rao et al., 2009). Research on other sources of
production of phytase such as phytases produced by genetically modified plants (e.g., wheat and
corn) and production of phytase by pigs are still being conducted.
The advantage of adding microbial phytase to the diets is the increase in digestibility of P
(Akinmusire and Adeola, 2009; Almeida and Stein, 2010; Rodríguez et al., 2013), Ca (Rodríguez
et al., 2013; González-Vega et al., 2013; 2014b), and sometimes also protein (Ravindran et al.,
1999; Kies et al., 2001) and energy (Kies et al., 2001). However, the positive effect of phytase on
protein and energy digestibility is mostly observed if diets are deficient in P compared with diets
containing adequate levels of P (Almeida et al., 2013a). Although, the use of microbial phytase
in the diet is very common, phytase from genetically modified plants can also be used to feed
12
pigs. Phytase from transgenic corn increases energy and P digestibility, but not AA digestibility
when fed to pigs (Li et al., 2013).
The ideal phytase is defined as being able to remain active after heat has been applied in
feed processing or storage conditions, remain stable in the gastrointestinal tract, and have a low
inclusion cost in the diet (Greiner and Konietzny, 2010). The efficacy of phytase is influenced by
many factors such as stability under pH conditions, resistance of pepsin or proteases in the
gastrointestinal tract (Greiner and Konietzny, 2010), feeding management (e.g., feeding level and
feeding frequency), age or physiological status of the animal (Mroz et al., 1994; Kemme et al.,
1997a), and others. The level of phytase also determines the effect of phytase on the digestibility
of nutrients (Kies et al., 2006; Veum and Ellersieck, 2008). Increasing levels of microbial
phytase up to 1,500 phytase units (FTU)/kg linearly and quadratically increased the digestibility
of P (Almeida and Stein, 2012). Likewise, super-dosing of microbial phytase up to 15,000 FTU
resulted in an increase in mineral digestibility (Kies et al., 2006), however, depending on the
mineral, digestibility increased only between 4 and 12 percentage units from pigs fed 1,500 and
15,000 FTU (Kies et al., 2006). Thus, super-dosing of phytase is not always necessary to get the
best Ca and P digestibility. Inclusion levels of phytase between 800 and 1,000 FTU/kg were
reported to be optimum for weanling and growing pigs (Almeida et al., 2013b).
The activity of phytase may be affected by metal ions, however, it is not clear the cause
of this negative effect. Binding of metal ions to the enzyme, formation of metal ion-phytic acid
complexes, or increased intestinal pH may be some of the possible reasons for the decrease in the
efficacy of the enzyme (Liu et al., 1998; Kerovuo, 2000). The most abundant metal ion in diets
fed to pigs is Ca. The amount of Ca that is included in diets fed to pigs sometimes exceeds the
requirement established by NRC (2012) because Ca supplements such as calcium carbonate are
13
inexpensive, therefore, excess of Ca has not been a concern from an economic stand point.
However, it has been reported that increased levels of dietary Ca may decrease phytase activity
(Lei et al., 1994; Lantzsch et al., 1995; Brady et al., 2002; Selle et al., 2009) and reduce P
digestibility (Clark, 1969; Stein et al., 2011). Therefore, the interactions among Ca, P, phytate,
and phytase in pigs need to be elucidated.
CALCIUM
Calcium and P are 2 important minerals in the body that are interrelated because the
absorption and utilization of one mineral may influence the absorption and utilization of the
other. Approximately 96 to 99% of Ca and 60 to 80% of the P in the body is present in the
skeletal tissue, and only 20 to 40% of P is present in soft tissue or fluids (Crenshaw, 2001; Vitti
et al., 2010). The greater variation in P in skeletal tissue compared with Ca is due to variation in
the proportion of soft tissue to skeletal tissue during the growing phases of pigs (Crenshaw,
2001). Calcium and P have important functions in the body such as formation and maintenance
of bones, transmission of nerve impulses, cofactors of enzymes, muscle contraction, synthesis of
protein and phospholipids, components of nucleic acids, and other functions (Crenshaw, 2001;
Ewing and Charlton, 2007; Vitti et al., 2010).
Absorption of Ca
Calcium needs to be in a soluble or ionic form to be absorbed. Therefore, Ca needs to be
released from the other components in the diet, which is possible through enzymes and gastric
acid secretions (Allen, 1982). Calcium is mainly absorbed in the small intestine (Partridge, 1978;
Liu et al., 2000), mostly in the duodenum, but the place where Ca is absorbed may vary among
Ca sources and types of diets (Partridge, 1978; González-Vega et al., 2014a). Although result of
14
some studies indicated absorption of Ca in the colon (Liu et al., 2000), results of recent studies
have indicated that no absorption of Ca takes place in the large intestine (González-Vega et al.,
2014a).
Calcium can be absorbed by nonsaturable paracellular (diffusion) absorption or by
saturable transcellular absorption (active transport; Bronner, 1987). The amount of Ca
transported by each mechanism is influenced by the level of Ca in the diet relatively to the
requirement. At high levels of dietary Ca, the nonsaturable mechanism transports more Ca,
whereas the saturable mechanism transports more Ca at lower Ca levels (Bronner, 1987). The
nonsaturable mechanism takes place using paracellular routes, and the saturable mechanism
takes place using the cellular routes. The saturable mechanism needs to transport Ca through Ca
channels that are located in the apical side of the cell. These channels are called transient
receptor potential vanilloid (TRPV), and designated as TRPV6 and TRPV5 for the intestines and
the kidneys, respectively (Christakos, 2012). Once Ca is inside the cell, the Ca binding proteins
(CaBP), also known as calbindin, diffuses the Ca across the cell. The CaBP9K is principally
found in the intestines and CaBP28k in kidneys. Calcium exits the cell from the basolateral side
through a Na/Ca exchanger with the plasma membrane Ca-ATPase. The saturable mechanism is
vitamin D (1,25 dihydroxycholecalciferol (1,25-(OH)2D3)) –dependent because 1,25-(OH)2D3
influences the expression of CaBP9k and TRPV6 (Christakos, 2012), and the expression of Ca-
ATPase (Kutuzova and DeLuca, 2004). Several experiments have been conducted to determine
the influence of vitamin D on the expression of genes involved in Ca absorption with wild type
mice or vitamin D receptor-knock out mice (Bouillon et al., 2003; van Abel et al., 2003;
Kutuzova and DeLuca, 2004). By using real-time quantitative PCR the mRNA of the genes
involved in Ca absorption can be quantified (van Abel et al., 2003). Although results of some
15
studies have demonstrated that vitamin D up-regulated TRPV5, TRPV6, CaBP, and Ca-ATPase
(van Abel et al., 2003; Kutuzova and DeLuca, 2004) and dietary Ca up-regulates only TRPV6
and CaBP (van Abel et al., 2003), results of other studies have indicated up-regulation only in
some genes (Bouillon et al., 2003). Therefore, it is concluded that because vitamin D up-
regulates the synthesis of genes involved in Ca absorption, Ca absorption in intestine and kidney
reabsorption increases. It has been believed that 1,25-(OH)2D3 influences only the saturable
mechanism, but results of recent studies indicated that 1,25-(OH)2D3 may also play a role in the
nonsaturable paracellular mechanism (Kutuzova and DeLuca, 2004; Christakos, 2012).
Activation of vitamin D starts in the liver where a hydroxyl group is added at the C-25 position
of cholecalciferol to form 25-hydroxycholecalciferol (25-(OH)2D3). The C at the 1 position is
then hydroxylated in the kidney to form 1,25-(OH)2D3, which is the active form of vitamin D.
This form is released in the circulation to regulate directly or indirectly the expression of genes
involved in homeostasis of Ca, as well as the proliferation and differentiation of bone cells,
epithelial cells, and the immune system (Omdahl et al., 2002; Bouillon et al., 2003; Kutuzova
and DeLuca, 2004; Veum, 2010).
Fiber may influence the absorption of minerals due to its physical or chemical properties
(Woldeghebriel et al., 2013). Some properties such as formation of complexes, viscosity, and
physical entrapment may reduce the availability of minerals (Torre et al., 1995; Van der Klis et
al., 1995; Fly et al., 1996; Guillon and Champ, 2000; Debon and Tester, 2001; Miyada et al.
2011). However, fermentation of fiber may increase absorption of minerals in large intestine
(Miyada et al., 2012). It is possible that reduction in intestinal pH caused by the production of
short chain fatty acids may enhance solubility of minerals (Wong et al., 2006; Rose et al., 2007;
16
Bird et al., 2000). Additionally, butyrate may increase the proliferation of epithelial cells
increasing surface area for absorption (Montagne et al., 2003).
The effect of fat in digestibility of nutrients may vary. The reduction of rate of passage
caused by fat may enhance digestibility of AA (Cervantes-Pahm and Stein, 2008; Kil and Stein,
2011). However, formation of Ca soaps reduces digestibility of Ca in rats (Frommelt et al.,
2014). Limited information is available about the effect of different dietary factors on the
digestibility of Ca in pigs.
Digestibility of Ca
Among Ca sources, the concentration and digestibility of Ca differ. Plant sources have
relatively low concentrations of Ca, whereas animal and inorganic sources have relatively high
concentrations of Ca. As a consequence, Ca originating from animal proteins or inorganic
sources are used to supply Ca in swine and poultry diets (NRC, 2012). Although the
concentration of Ca in most feed ingredients has been reported, only few digestibility values are
available. Digestibility can be defined as apparent, standardized, or true digestibility (Stein et al.,
2007). Apparent digestibility values of a nutrient may vary with the concentration of the nutrient
in the diet if there are endogenous losses of the nutrient. Therefore, apparent digestibility values
are not expected to be always additive in mixed diets, whereas values for standardized or true
digestibility are additive in mixed diets (Stein et al., 2005) because these values are corrected for
endogenous losses. Thus, if basal or total endogenous losses are subtracted from the output in the
digestibility calculations, values are not influenced by the nutrient concentration. It is, therefore,
recommended to formulate diets using standardized or true digestibility values (NRC, 2012).
Due to measurable endogenous losses of Ca, ATTD values need to be corrected to determine
STTD or TTTD (Fan and Archbold, 2012; González-Vega et al., 2013). Some studies have
17
reported ATTD of Ca in diets (Kemme et al., 1997b; Stein et al., 2006, 2008; Malde et al., 2010),
or in corn, soybean meal, or calcium carbonate (Bohlke et al., 2005; Stein et al., 2011). Recent
STTD and TTTD values of Ca have been reported in inorganic Ca sources and in canola meal
(González-Vega et al., 2013; 2014a; 2014b), and in corn-SBM diets (Fan and Archbold, 2012),
but further research needs to be conducted to determine STTD or TTTD of Ca in animal sources
and other feed ingredients.
Modeling is a mathematical tool that can be used to predict the digestibility of a nutrient
by taking into account parameters that influence digestibility to obtain a good predictor value,
but a good correlation between predicted and observed values needs to be demonstrated. Recent
models for ATTD of Ca and P were reported by Létourneau-Montminy et al. (2011), which
integrate different physiological aspects along the gastrointestinal tract of pigs. Although many
factors were considered such us pH, retention time, endogenous losses, solubilization, insoluble
complexes, and others, the model only had 0.78 R2 and 20.4% disturbance error for ATTD of Ca,
but 0.90 R2 and 96.5% disturbance error for ATTD of P between the observed and the predicted
value. Modeling for P digestibility has been easier than for Ca digestibility because there are
more available data for P than for Ca. While the model reported by Symeou et al. (2012)
overestimates P digestibility by 10%, the model predicted the negative effect of increasing levels
of Ca and the positive effect of microbial phytase on P digestibility. A more sophisticated model
that includes the interactions between genotype of pigs and P retention and excretion was
recently proposed (Symeou et al., 2014). This model predicts P digested, P retained, and P
excreted, but if canola meal or DDGS were used in the diets, the prediction of these parameters
was poor. Some inconsistencies in the model may have been a result of Ca and P interactions that
18
are still not well understood. This model also was not able to predict Ca digestibility. Therefore,
more research is needed to elucidate factors that influence Ca and P digestibility in pigs.
CALCIUM REQUIREMENTS
Nutrient requirements can be determined by factorial calculations and empirical
measurements. Because the factorial technique accounts for several factors such as availability,
obligatory losses of the nutrient in the body, and retention is believed that requirements obtained
using this approach is more precise (Weremko et al., 1997). However, empirical measurements,
which uses one or several response criteria to determine the nutrient requirement, have been
most commonly used (Weremko et al., 1997; NRC, 2012). However, several factors such as sex
and age may influence the requirement values (NRC, 2012).
Diets formulated to contain energy and nutrients that are at or close to the requirements
of the animal allow the most economical and sustainable production. Experiments have been
conducted to determine the requirement of Ca and P by pigs (Rutledge et al., 1961; Coalson et
al., 1972, 1974; Thomas and Kornegay, 1981; Partanen et al., 2010; Saraiva et al., 2011).
However, in most of these experiments the requirements of total Ca and total P have been
determined. The requirement of digestible P has been reported (NRC, 2012), but no values for
the requirement of digestible Ca are available. Most of the studies conducted to determine Ca
and P requirements consider the levels of Ca and P that result in the maximum growth
performance of the pigs rather than the maximum bone strength or bone ash. This is because
requirements of Ca and P are greater for maximum bone ash than for maximum ADG (NRC,
2012).
19
Muscle and bones growth independently, therefore, deposition of Ca and P in lean tissue
and skeletal tissue are not directly proportional (Crenshaw, 2001). Thus, the ratio between Ca
and P in the body range between 1.20:1 and 1.60:1 for a 25 kg pig, and between 1.25:1 and
1.70:1 for a 50 kg pig (Rymarz et al., 1982; Hendriks and Moughan, 1993; Mahan and Shields,
1998; Wiseman et al., 2009; Pettey et al., 2015). However, because 96 to 99% of Ca is present in
skeletal tissue (Crenshaw, 2001), it is expected that requirements of STTD Ca to maximize bone
ash are close to requirements to maximize Ca retention in the body.
The importance of the Ca:P ratio in formulation of diets fed to pigs has been addressed
for several decades. This is because excess or deficiency of one mineral may affect the utilization
of the other (Crenshaw, 2001). The NRC (2012) recommends to formulate diets using a total Ca:
total P ratio of 1:1 or 1:25:1 or a total Ca:digestible P ratio of 2.15:1. The requirements suggested
by NRC (2012) are expressed as total Ca and STTD P. The reason requirements are not
expressed as STTD Ca is that no data for the requirement of STTD of Ca have been reported.
However, it is believed that if diets are formulated using STTD Ca:STTD P, it will give an
estimate of the amount of Ca and P that will be absorbed by the pig, theoretically should result in
the most economic and environmentally friendly diet formulation.
Recent studies that determined digestible P requirements in pigs had at least 5 levels of
digestible P with a constant level of total Ca (Saraiva et al., 2009; 2012), or with a constant total
Ca:digestible P ratio (Ruan et al., 2007; Partanen et al., 2010; Zhai and Adeola, 2013a; 2013b).
However, because the requirements for digestible Ca are unknown, it is difficult to design these
types of experiments. Therefore, having only one level of Ca may limit the absorption and
retention of P if the Ca level is less than the Ca requirement. Likewise, because it is not known
what is the ideal total Ca:digestible P ratio or digestible Ca:digestible P ratio, absorption and
20
retention of Ca and P may vary, depending on the Ca:P ratio used. In a recent study, results
indicated an optimum true digestible Ca:true digestible P ratio of 0.9:1 and 1.0:1 to maximize
G:F in growing pigs (Fan and Archbold, 2012), the question of which levels of Ca and P should
be used is still unanswered.
The requirement of STTD P suggested by NRC (2012) was obtained from a model
based on maximum whole-body P retention using Eq. [1]:
STTD P requirements (g/d) = 0.85 × [(maximum whole-body P retention)/0.77 + 0.19 ×
feed dry matter intake + 0.007 × BW], [1]
where 85% of P requirement was assumed to achieve the maximum growth performance, 77% of
STTD P was assumed to be retained in the body, 190 mg/kg DMI was estimated as basal
endogenous losses of P, and 7 mg/kg BW per day was assumed as minimum urinary losses. It
was also assumed that whole-body P mass has a direct relationship with body protein, Eq. [2]:
Body P mass (g) = 1.1613 + 26.012 × body protein + 0.2299 × (body protein)2. [2]
After the requirements of STTD P were established, the requirements for total Ca
suggested by NRC (2012) were derived from STTD P requirements by using a 2.15:1 Ca: STTD
P ratio (Table 2.1). However, the basis for using this ratio is not clear and more research in this
area is needed.
21
LITERATURE CITED
Akinmusire, A. S., and O. Adeola. 2009. True digestibility of phosphorus in canola and soybean
meals for growing pigs: Influence of microbial phytase. J. Anim. Sci. 87:977-983.
Allen, L. H. 1982. Calcium bioavailability and absorption: A review. Am. J. Clin. Nutr. 35:783-
808.
Almaguer, B. L., R. C. Sulabo, and H. H. Stein. 2014. Standardized total tract digestibility of
phosphorus in copra meal, palm kernel expellers, palm kernel meal, and soybean meal
fed to growing pigs. J. Anim. Sci. 92:2473-2480.
Almeida, F. N., A. A. Pahm, G. I. Petersen, N. R. Augspurger, and H. H. Stein. 2013a. Effects of
phytase on amino acid and energy digestibility in corn-soybean meal diets fed to growing
pigs. Prof. Anim. Sci. 29:693-700.
Almeida, F. N., and H. H. Stein. 2010. Performance and phosphorus balance of pigs fed diets
formulated on the basis of values for standardized total tract digestibility of phosphorus.
J. Anim. Sci. 88:2968-2977.
Almeida, F. N., and H. H. Stein. 2012. Effects of graded levels of microbial phytase on the
standardized total tract digestibility of phosphorus in corn and corn coproducts fed to
pigs. J. Anim. Sci. 90:1262-1269.
Almeida, F. N., R. C. Sulabo, and H. H. Stein. 2013b. Effects of a novel bacterial phytase
expressed in Aspergillus Oryzae on digestibility of calcium and phosphorus in diets fed to
weanling or growing pigs. J. Anim. Sci. Biotechnol. 4:8.
Bohlke, R. A., R. C. Thaler, and H. H. Stein. 2005. Calcium, phosphorus, and amino acid
digestibility in low-phytate corn, normal corn, and soybean meal by growing pigs. J.
Anim. Sci. 83:2396-2403.
22
Bohn, L., A. S. Meyer, and S. K. Rasmussen. 2008. Phytate: impact on environment and human
nutrition. A challenge for molecular breeding. J. Zheijang Univ. Sci. B. 9:165-191.
Bouillon, R., S. Van Cromphaut, and G. Carmeliet. 2003. Intestinal calcium absorption:
Molecular vitamin D mediated mechanism. J. Cell. Biochem. 88:332-339.
Brady, S. M., J. J. Callan, D. Cowan, M. McGrane, and J. V. O’Doherty. 2002. Effect of phytase
inclusion and calcium/phosphorus ratio on the performance and nutrient retention of
grower-finisher pigs fed barley/wheat/soya bean meal-based diets. J. Sci. Food Agric.
82:1780-1790.
Bronner, F. 1987. Intestinal calcium absorption: Mechanisms and implications. J. Nutr.
117:1347-1352.
Camacho, L., C, Sierra, R. Campos, E. Guzmán, and D. Marcus. 1992. Nutritional changes
caused by the germination of legumes commonly eaten in Chile. Arch. Latinoam. Nutr.
42:283-290.
Centeno, C., A. Viveros, A. Brenes, R. Canales, A. Lozano, and C. de la Cuadra. 2001. Effect of
several germination conditions on total P, phytate P, phytase, and acid phosphatase
activities and inositol phosphate esters in rye and barley. J. Agric. Food Chem. 49:3208-
3215.
Cervantes-Pahm, S. K., and H. H. Stein. 2008. Effect of dietary soybean oil and soybean protein
concentration on the concentration of digestible amino acids in soybean products fed to
growing pigs. J. Anim. Sci. 86:1841-1849.
Christakos, S. 2012. Recent advances in our understanding of 1,25-dihydroxyvitamin D3
regulation of intestinal calcium absorption. Arch. Biochem. Biophys. 523:73-76.
23
Clark, I. 1969. Importance of dietary Ca:PO4 ratios on skeletal, Ca, Mg, and PO4 metabolism.
Am. J. Physiol. 217:865-870.
Coalson, J. A., C. V. Maxwell, J. C. Hillier, and E. C. Nelson. 1974. Calcium requirement of the
cesarean derived colostrum-free pig from 3 through 9 weeks of age. J. Anim. Sci. 38:772-
777.
Coalson, J. A., C. V. Maxwell, J. C. Hillier, R. D. Washam, and E. C. Nelson. 1972. Calcium
and phosphorus requirements of young pigs reared under controlled environmental
conditions. J. Anim. Sci. 35:1194-1200.
Cosgrove, D. J. 1966. The chemistry and biochemistry of inositol polyphosphates. Rev. Pure
Appl. Chem. 16:209-224.
Cowieson, A. J., T. Acamovic, and M. R. Bedford. 2004. The effects of phytase and phytic acid
on the loss of endogenous amino acids and minerals from broiler chickens. Br. Poult. Sci.
45:101-108.
Cowieson, A. J., M. R. Bedford, P. H. Selle, and V. Ravindran. 2009. Phytate and microbial
phytase: implications for endogenous nitrogen losses and nutrient availability. Worlds
Poult. Sci. J. 65:401-417.
Crenshaw, T. D. 2001. Calcium, phosphorus, vitamin D, and vitamin K in swine nutrition. In: A.
J. Lewis and L. L. Southern, editors, Swine Nutrition. 2nd ed. CRC Press, Boca Raton,
FL. p. 187-212.
Debon, S. J. J., and R. F. Tester. 2001. In vitro binding of calcium, iron and zinc by non-starch
polysaccharides. Food Chem. 73:401-410.
Deshpande, S. S., and M. Cheryan. 1984. Effects of phytic acid, divalent cations, and their
interactions on α-amylase activity. J. Food. Sci. 49:516-524.
24
Duhan, A., N. Khetarpaul, and S. Bishnoi. 2002. Changes in phytates and HCl extractability of
calcium, phosphorus, and iron of soaked, dehulled, cooked, and sprouted pigeon pea
cultivar (UPAS-120). Plant Foods Hum. Nutr. 57:275-284.
Ewing, W., and S. J. Charlton. 2007. Calcium. Phosphorus. In: The Minerals Directory. 2nd ed.
Context Products Ltd, Leicestershire, UK. p. 5a-5f, and 19a-19f.
Fan, M. Z., and T. Archbold. 2012. Effects of dietary true digestible calcium to phosphorus ratio
on growth performance and efficiency of calcium and phosphorus use in growing pigs
fed corn and soybean meal-based diets. J. Anim. Sci. 90:254-256.
Fly, A. D., G. L. Czarnecki-Maulden, G. F. Fahey, Jr., and E. C. Titgemeyer. 1996.
Hemicellulose does not affect iron bioavailability in chicks. J. Nutr. 126:308-316.
Frommelt, L., M. Bielohuby, B. J. M. Stoehr, D. Menhofer, M. Bidlingmaier, and E. Kienzle.
2014. Effects of low-carbohydrate, high-fat diets on apparent digestibility of minerals and
trace elements in rats. Nutrition. 30:869-875.
González-Vega, J. C., C. L. Walk, Y. Liu, and H. H. Stein. 2013. Determination of endogenous
intestinal losses of Ca and true total tract digestibility of calcium in canola meal fed to
growing pigs. J. Anim. Sci. 91:4807-4816.
González-Vega, J. C., C. L. Walk, Y. Liu, and H. H. Stein. 2014a. The site of net absorption of
Ca from the intestinal tract of growing pigs and effect of phytic acid, Ca level and Ca
source on Ca digestibility. Arch. Anim. Nutr. 68:126-142.
González-Vega, J. C., C. L. Walk, and H. H. Stein. 2014b. Effects of microbial phytase on
apparent and standardized total tract digestibility of calcium in calcium supplements fed
to growing pigs. J. Anim. Sci. 92(Suppl. 2):36 (Abstr.)
Graf, E. 1983. Applications of phytic acid. J. Am. Oil Chem. Soc. 60:1861-1867.
25
Greiner, R., and U. Konietzny. 2010. Phytases: Biochemistry, enzymology and characteristics
relevant to animal feed use. In: M. Bedford and G. Partridge, editors, Enzymes in farm
animal nutrition. 2nd ed. CAB International, Oxfordshire, UK. p. 96-128.
Guggenbuhl, P., A. P. Quintana, and C. S. Nunes. 2007. Comparative effects of three phytases
on phosphorus and calcium digestibility in the growing pig. Livest. Sci. 109:258-260.
Guillon, F., and M. Champ. 2000. Structural and physical properties of dietary fibres, and
consequences of processing on human physiology. Food Res. Int. 33:233-245.
Hendriks, W. H., and P. J. Moughan. 1993. Whole-body mineral composition of entire male and
female pigs depositing protein at maximal rates. Livest. Prod. Sci. 33:161-170.
Hu, H. L., A. Wise, and C. Henderson. 1996. Hydrolysis of phytate and inositol tri-, tetra-, and
penta- phosphates by the intestinal mucosa of the pig. Nutr. Res. 16:781-787.
Jay, Y. J., J. M. DeRouchey, M. D. Tokach, R. D. Goodband, J. L. Nelssen, D. G. Renter, and S.
S. Dritz. 2010. Feed additives for swine: Fact sheets – high dietary levels of copper and
zinc for young pigs, and phytase. J. Swine Health Prod.18:87-91.
Jongbloed, A. W., Z. Mroz, and P. A. Kemme. 1992. The effect of supplementary Aspergillus
niger phytase in diets for pigs on concentration and apparent digestibility of dry matter,
total phosphorus, and phytic acid in different sections of the alimentary tract. J. Anim.
Sci. 70:1159-1168.
Kemme, P. A., A. W. Jongbloed, Z. Mroz, and A. C. Beynen. 1997a. The efficacy of Aspergillus
niger phytase in rendering phytate phosphorus available for absorption in pigs is
influenced by pig physiological status. J. Anim. Sci. 75:2129-2138.
Kemme, P. A., J. S. Radcliffe, A. W. Jongbloed, and Z. Mroz. 1997b. Factors affecting
phosphorus and calcium digestibility in diets for growing-finishing pigs. J. Anim. Sci.
26
75:2139-2146.
Kerovuo, J. 2000. A novel phytase from Bacillus. Characterization and production of the
enzyme. PhD Diss. Univ. of Helsinki, Finland.
Kies, A. K. 2005. Phytase studies in pigs and poultry. Effect on protein digestion and energy
utilization. PhD Diss. Wageningen Univ., The Netherlands.
Kies, A. W., P. A. Kemme, L. B. J. Sebek, J. T. M. van Diepen, and A. W. Jongbloed. 2006.
Effect of graded doses and a high dose of microbial phytase on the digestibility of various
minerals in weaner pigs. J. Anim. Sci. 84:1169-1175.
Kies, A. K., K. H. F. Van Hemert, and W. C. Sauer. 2001. Effect of phytase on protein and
amino acid digestibility and energy utilisation. Worlds Poult. Sci. J. 57:109-126.
Kil, D. Y., and H. H. Stein. 2011. Dietary soybean oil and choice white grease improve apparent
ileal digestibility of amino acids in swine diets containing corn, soybean meal, and
distillers dried grains with solubles. Rev. Colomb. Cienc. Pecu. 24:248-253.
Knuckles, B. E. 1988. Effect of phytate and other myo-inositol phosphate esters on lipase
activity. J. Food Sci. 53:250-252.
Kutuzova, G. D., and H. F. DeLuca. 2004. Gene expression profiles in rat intestine identify
pathways for 1,25-dihydroxyvitamin D3 stimulated calcium absorption and clarify its
immunomodulatory properties. Arch. Biochem. Biophys. 432:152-166.
Lantzsch, H. J., S. Wjst, and W. Drochner. 1995. The effect of dietary calcium on the efficacy of
microbial phytase in rations for growing pigs. J. Anim. Physiol. Anim. Nutr. 73:19-26.
Lei, X. G., P. K. Ku, E. R. Miller, M. T. Yokoyama, and D. E. Ullrey. 1994. Calcium level
affects the efficacy of supplemental microbial phytase in corn-soybean meal diets of
weanling pigs. J. Anim. Sci. 72:139-143.
27
Létourneau-Montminy, M. P., A. Narcy, P. Lescoat, M. Magnin, J. F. Bernier, D. Sauvant, C.
Jondreville, and C. Pomar. 2011. Modeling the fate of dietary phosphorus in the digestive
tract of growing pigs. J. Anim. Sci. 89:3596-3611.
Li, S. F., Y. B. Niu, J. S. Liu, L. Lu, L. Y. Zhang, C. Y. Ran, M. S. Feng, B. Du, J. L. Deng, and
X. G. Luo. 2013. Energy, amino acid, and phosphorus digestibility of phytase transgenic
corn for growing pigs. J. Anim. Sci. 91:298-308.
Liu, J., D. W. Bollinger, D. R. Ledoux, and T. L. Veum. 1998. Lowering the dietary calcium to
total phosphorus ratio increases phosphorus utilization in low-phosphorus corn-soybean
meal diets supplemented with microbial phytase for growing-finishing pigs. J. Anim. Sci.
76:808-813.
Liu, J., D. W. Bollinger, D. R. Ledoux, and T. L. Veum. 2000. Effects of dietary
calcium:phosphorus ratios on apparent absorption of calcium and phosphorus in the small
intestine, cecum, and colon of pigs. J. Anim. Sci. 78:106-109.
Mahan, D. C., and R. G. Shields, Jr. 1998. Macro- and micromineral composition of pigs from
birth to 145 kilograms of body weight. J. Anim. Sci. 76:506-512.
Malde, M. K., I. E. Graff, H. Siljander-Rasi, E. Venäläinen, K. Julshamn, J. I. Pedersen, and J.
Valaja. 2010. Fish bones – a highly available calcium source for growing pigs. J. Anim.
Physiol. Anim. Nutr. 94:e66-e76.
Mroz, Z., A. W. Jongbloed, and P. A. Kemme. 1994. Apparent digestibility and retention of
nutrients bound to phytate complexes as influenced by microbial phytase and feeding
regimen in pigs. J. Anim. Sci. 72:126-132.
NRC. 2012. Nutrient Requirements of Swine. 11th rev. ed. Natl. Acad. Press, Washington, DC.
Omdahl, J. L., H. A. Morris, and B. K. May. 2002. Hydroxylase enzymes of the vitamin D
28
pathway: expression, function, and regulation. Annu. Rev. Nutr. 22: 139-166.
Onyango, E. M., E. K. Asem, and O. Adeola. 2009. Phytic acid increases mucin and endogenous
amino acid losses from the gastrointestinal tract of chickens. Br. J. Nutr. 101:836-842.
Partanen, K., H. Siljander-Rasi, M. Karhapää, K. Ylivainio, and T. Tupasela. 2010. Responses of
growing pigs to different levels of dietary phosphorus - Performance, bone
characteristics, and solubility of faecal phosphorus. Livest. Sci. 134:109-112.
Partridge, I. G. 1978. Studies on digestion and absorption in the intestines of growing pigs: 3.
Net movements of mineral nutrients in the digestive tract. Br. J. Nutr. 39:527-537.
Pettey, L. A., G. L. Cromwell, Y. D. Jang, and M. D. Lindemann. 2015. Estimation of calcium
and phosphorus content in growing and finishing pigs: Whole empty body components
and relative accretion rates. J. Anim. Sci. 93:158-167.
Poulsen, H. D., D. Carlson, J. V. Nørgaard, and K. Blaabjerg. 2010. Phosphorus digestibility is
highly influenced by phytase but slightly by calcium in growing pigs. Livest. Sci.
134:100-102.
Preet, K., and D. Punia. 2000. Antinutrients and digestibility (in vitro) of soaked, dehulled and
germinated cowpeas. Nutr. Health. 14:109-117.
Rao, D. E. C. S., T. P. Reddy, and V. D. Reddy. 2009. Molecular characterization,
physicochemical properties, known and potential applications of phytases: An overview.
Crit. Rev. Biotechnol. 29:182-198.
Rapp, C., H.-J. Lantzsch, and W. Drochner. 2001. Hydrolysis of phytic acid by intrinsic plant
and supplemented microbial phytase (Aspergillus niger) in the stomach and small
intestine of minipigs fitted with re-entrant cannulas 3. Hydrolysis of phytic acid (IP6) and
occurrence of hydrolysis products (IP5, IP4, IP3, and IP2). J. Anim. Physiol. a. Anim.
29
Nutr. 85:420-430.
Ravindran, V., S. Cabahug, G. Ravindran, and W. L. Bryden. 1999. Influence of microbial
phytase on apparent ileal amino acid digestibility of feedstuffs for broilers. Poult. Sci.
78:699-706.
Rizzello, C. G., L. Nionelli, R. Coda, M. D. Angelis, and M. Gobbetti. 2010. Effect of sourdough
fermentation on stabilization, and chemical and nutritional characteristics of wheat germ.
Food Chem. 119:1079-1089.
Rodríguez, D. A., R. C. Sulabo, J. C. González-Vega, and H. H. Stein. 2013. Energy
concentration and phosphorus digestibility in canola, cottonseed, and sunflower products
fed to growing pigs. Can. J. Anim. Sci. 93:493-503.
Rojas, O. J., and H. H. Stein. 2012. Digestibility of phosphorus by growing pigs of fermented
and conventional soybean meal without and with microbial phytase. 2012. J. Anim. Sci.
90:1506-1512.
Rose, D. J., M. R. DeMeo, A. Keshavarzian, and B. R. Hamaker. 2007. Influence of dietary fiber
on inflammatory bowel disease and colon cancer: Importance of fermentation pattern.
Nutr. Rev. 65:51-62.
Ruan, Z., Y. G. Zhang, Y. L. Yin, T. J. Li, R. L. Huang, S. W. Kim, G. Y. Wu, and Z. Y. Deng.
2007. Dietary requirement of true digestible phosphorus and total calcium for growing
pigs. Asian-Aust. J. Anim. Sci. 20:1236-1242.
Rutledge, E. A., L. E. Hanson, and R. J. Meade. 1961. A study of the calcium requirements of
pigs weaned at three weeks of age. J. Anim. Sci. 20:243.
Rymarz, A., H. Fandrejewski, and J. Kielanowski. 1982. Content and retention of calcium,
phosphorus, potassium and sodium in the bodies of growing gilts. Livest. Prod. Sci.
30
9:399-407.
Saraiva, A., J. L. Donzele, R. F. M. de Oliveira, M. L. T. de Abreu, F. C. O. Silva, S. E. F.
Guimarães, and S. W. Kim. 2012. Phosphorus requirements for 60 to 100 kg pigs
selected for high lean deposition under different thermal environments. J. Anim. Sci.
90:1499-1505.
Saraiva, A., J. L. Donzele, R. F. M. de Oliveira, M. L. T. de Abreu, F. C. O. Silva, and F. A.
Santos. 2009. Available phosphorus levels in diets for swine from 15 to 30 kg genetically
selected for meat deposition. R. Bras. Zootec. 38:307-313.
Saraiva, A., J. L. Donzele, R. F. M. de Oliveira, M. L. T. de Abreu, F. C. O. Silva, R. A. Vianna,
and A. L. Lima. 2011. Available phosphorus levels in diets for 30 to 60 kg female pigs
selected for meat deposition by maintaining calcium and available phosphorus ratio. R.
Bras. Zootec. 40:587-592.
Santos, T. 2012. Phytate: Anti-nutrient for poultry, swine. Feedstuffs. 84:18-20.
Selle, P. H., A. J. Cowieson, N. P. Cowieson, and V. Ravindran. 2012. Protein-phytate
interactions in pig and poultry nutrition: a reappraisal. Nutr. Res. Rev. 25:1-17.
Selle, P. H., A. J. Cowieson, and V. Ravindran. 2009. Consequences of calcium interactions with
phytate and phytase for poultry and pigs. Livest. Sci. 124:126-141.
Selle, P. H., and V. Ravindran. 2008. Phytate-degrading enzymes in pig nutrition. Livest. Sci.
113:99-122.
Shi, J., H. Wang, Y. Wu, J. Hazebroek, R. B. Meeley, and D. S. Ertl. 2003. The Maize low-
phytic acid mutant Ipa2 is caused by mutation in an inositol phosphate kinase gene. Plant
Physiol. 131:507-515.
Stein, H. H., O. Adeola, G. L. Cromwell, S. W. Kim, D. C. Mahan, and P. S. Miller. 2011.
31
Concentration of dietary calcium supplied by calcium carbonate does not affect the
apparent total tract digestibility of calcium, but reduces digestibility of phosphorus by
growing pigs. J. Anim. Sci. 89:2139-2144.
Stein, H. H., M. G. Boersma, and C. Pedersen. 2006. Apparent and true total tract digestibility of
phosphorus in field peas (Pisum sativum L.) by growing pigs. Can. J. Anim. Sci. 86:523-
525.
Stein, H. H., C. T. Kadzere, S. W. Kim, and P. S. Miller. 2008. Influence of dietary phosphorus
concentration on the digestibility of phosphorus in monocalcium phosphate by growing
pigs. J. Anim. Sci. 2008. 86:1861-1867.
Stein, H. H., C. Pedersen, A. R. Wirt, and R. A. Bohlke. 2005. Additivity of values for apparent
and standardized ileal digestibility of amino acids in mixed diets fed to growing pigs. J.
Anim. Sci. 83:2387-2395.
Stein, H. H., B. Sève, M. F. Fuller, P. J. Moughan, and C. F. M. de Lange. 2007. Invited review:
Amino acid bioavailability and digestibility in pig feed ingredients: Terminology and
application. J. Anim. Sci. 85:172-180.
Symeou, V., S. A. Edwards, and I. Kyriazakis. 2012. Modeling digestibility of dietary
phosphorus in growing and finish pigs. J. Anim. Sci. 90:59-61.
Symeou, V., I. Leinonen, and I. Kyriazakis. 2014. Modelling phosphorus intake, digestion,
retention, and excretion in growing and finishing pigs: model description. Anim. 8:1612-
1621.
Thomas, H. R., and E. T. Kornegay. 1981. Phosphorus in swine. I. Influence of dietary calcium
and phosphorus levels and growth rate on feedlot performance of barrows, gilts, and
boars. J. Anim. Sci. 52:1041-1048.
32
Thompson, L. U., C. L. Button, and D. J. A. Jenkins. 1987. Phytic acid and calcium affect the in
vitro rate of navy bean starch digestion and blood glucose response in humans. Amer. J.
Clin. Nutr. 46:467-473.
Tian, B., B. Xie, J. Shi, J. Wu, Y. Cai, T. Xu, S. Xue, and Q. Deng. 2010. Physicochemical
changes of oat seeds during germination. Food Chem. 119:1195-1200.
Torre, M., A. R. Rodriguez, and F. Saura-Calixto. 1995. Interactions of Fe(II), Ca(II) and Fe(III)
with high dietary fibre materials: A physicochemical approach. Food Chem. 54:23-31.
van Abel, M., J. G. J. Hoenderop, A. W. C. M. van der Kemp, J. P. T. M. van Leeuwen, and R. J.
M. Bindels. 2003. Regulation of the epithelial Ca2+ channels in small intestine as studied
by quantitative mRNA detection. Am. J. Physiol. Gastrointest. Liver Physiol. 285:G78-
F85.
van der Klis, J. D., C. Kwakernaak, and W. de Wit. 1995. Effects of endoxylanase addition to
wheat-based diets on physico-chemical chyme conditions and mineral absorption in
broilers. Anim. Feed Sci. Technol. 51:15-27.
Veum, T. L. 2010. Phosphorus and calcium nutrition and metabolism. In: Phosphorus and
calcium utilization and requirements in farm animals. D. M. S. S. Vitti and E. Kebreab,
editors. CAB International, London, United Kingdom. p. 94-111.
Veum, T. L., and M. R. Ellersieck. 2008. Effect of low doses of Aspergillus niger phytase on
growth performance, bone strength, and nutrient absorption and excretion by growing and
finishing swine fed corn-soybean meal diets deficient in available phosphorus and
calcium. J. Anim. Sci. 86:858-870.
Vitti, D. M. S. S., J. C. Da Silva Filho, H. Louvandini, R. S. Dias, I. C. S. Bueno, and E.
Kebreab. 2010. Phosphorus and calcium utilization in ruminants using isotope dilution
33
technique. In: D. M. S. S. Vitti and E. Kebreab, editors, Phosphorus and calcium
utilization and requirements in farm animals. CAB International, London, UK. p. 45-67.
Weremko, D., H. Fandrejewski, and T. Zebrowska. 1997. Bioavailability of phosphorus in feeds
of plant origin for pigs – Review. Asian Austr. J. Anim. Sci. 10:551-566.
Wiseman, T. G., D. C. Mahan, and N. R. St-Pierre. 2009. Mineral composition of two genetic
lines of barrows and gilts from twenty to one hundred twenty-five kilograms of body
weight. J. Anim. Sci. 87:2306-2314.
Woldeghebriel, A., S. Smith, T. Barrios, and S. Gebrelul. 2013. Impacts of high fiber diet on
digestion and absorption of minerals in growing pigs. J. Agric. Sci. Technol. 3:886-895.
Wyss, M., R. Brugger, A. Kronenberger, R. Rémy, R. Fimbel, G. Oesterhelt, M. Lehmann, and
A. P. G. M. Van Loon. 1999. Biochemical characterization of fungal phytases (myo-
inositol hexakisphosphate phosphohydrolases): Catalytic properties. Appl. Environ.
Microbiol. 65:367-373.
Zhai, H., and O. Adeola. 2013a. True digestible phosphorus requirement of 10 to 20 kg pigs. J.
Anim. Sci. 91:3716-3723.
Zhai, H., and O. Adeola. 2013b. The true digestible phosphorus requirements for twenty to forty
kilogram pigs. J. Anim. Sci. 91:5307-5313.
Zimmermann, B., H. -J. Lantzsch, R. Mosenthin, F. -J. Schöner, H. K. Biesalski, and W.
Drochner. 2002. Comparative evaluation of the efficacy of cereal and microbial phytases
in growing pigs fed diets with marginal phosphorus supply. J. Sci. Food Agric. 82:1298-
1304.
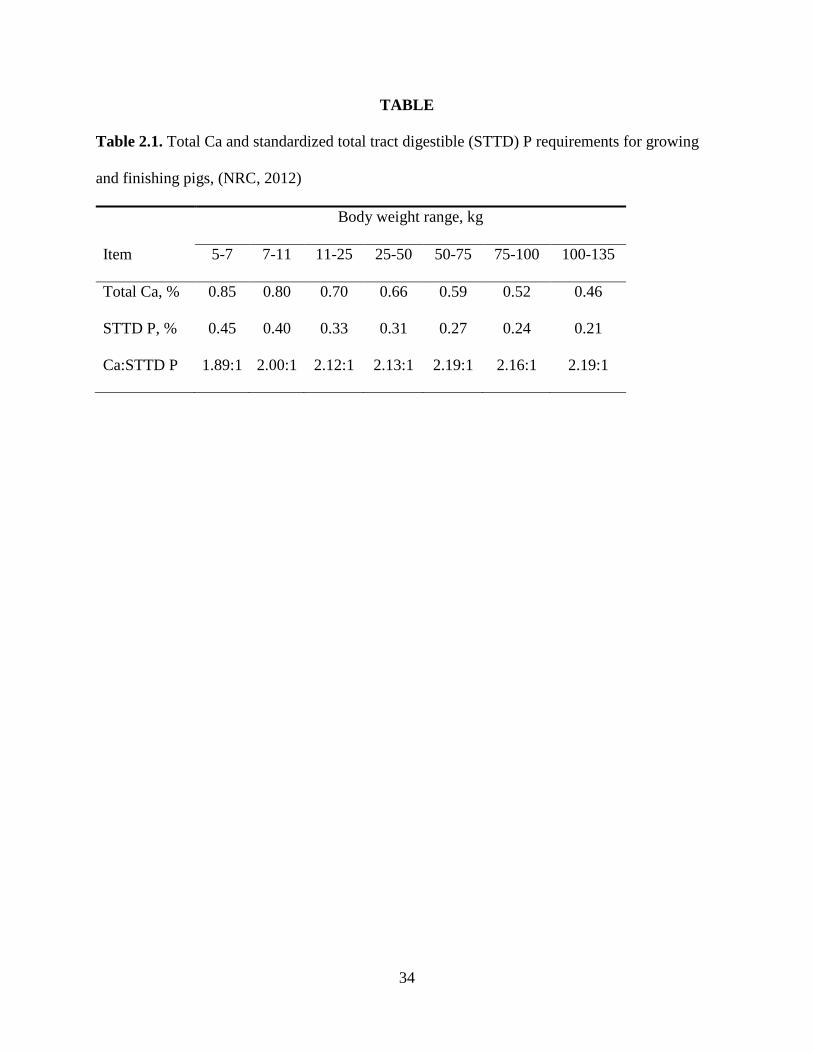
34
TABLE
Table 2.1. Total Ca and standardized total tract digestible (STTD) P requirements for growing
and finishing pigs, (NRC, 2012)
Body weight range, kg
Item 5-7 7-11 11-25 25-50 50-75 75-100 100-135
Total Ca, % 0.85 0.80 0.70 0.66 0.59 0.52 0.46
STTD P, % 0.45 0.40 0.33 0.31 0.27 0.24 0.21
Ca:STTD P 1.89:1 2.00:1 2.12:1 2.13:1 2.19:1 2.16:1 2.19:1
35
CHAPTER 3
EFFECTS OF MICROBIAL PHYTASE ON APPARENT AND STANDARDIZED
TOTAL TRACT DIGESTIBILITY OF CALCIUM IN CALCIUM SUPPLEMENTS FED
TO GROWING PIGS
ABSTRACT: An experiment was conducted to test the hypothesis that differences in the
apparent total tract digestibility (ATTD) and standardized total tract digestibility (STTD) of Ca
exist among Ca supplements and that inclusion of microbial phytase increases the ATTD and
STTD of Ca. One hundred and four growing barrows (average initial BW of 17.73 ± 2.53 kg)
were allotted to a randomized complete block design with 13 dietary treatments and 8 pigs per
treatment. A basal diet containing corn, cornstarch, potato protein isolate, soybean oil, calcium
carbonate, monosodium phosphate, vitamins, and minerals was formulated. Five additional diets
were formulated by adding monocalcium phosphate (MCP), dicalcium phosphate (DCP),
calcium carbonate, L. calcareum Ca, or a high-Ca sugar beet co-product to the basal diet at the
expense of cornstarch. Six additional diets with 500 units per kilogram of microbial phytase were
also formulated. A Ca-free diet was used to determine basal endogenous losses of Ca. Feces
were collected using the marker-to-marker approach. Results indicated that regardless of
inclusion of microbial phytase, MCP had the greatest (P < 0.05) ATTD and STTD of Ca. The
ATTD and STTD of Ca in DCP were greater (P < 0.05) than in calcium carbonate, L. calcareum
Ca, or in the sugar beet co-product, but no differences were observed among the ATTD and
STTD of Ca in calcium carbonate, L. calcareum Ca, or sugar beet co-product. Inclusion of
microbial phytase increased (P < 0.05) the ATTD and STTD of Ca in the diets, but this was not
the case in the Ca supplements. Regardless of inclusion of microbial phytase, the ATTD of P was
36
greater (P < 0.05) in pigs fed basal, MCP, or DCP diets than in pigs fed calcium carbonate, L.
calcareum Ca, or the sugar beet co-product, but pigs fed calcium carbonate diets had greater (P <
0.05) ATTD of P than pigs fed L. calcareum Ca or the sugar beet co-product. Regardless of Ca
source, inclusion of microbial phytase increased (P < 0.001) the ATTD of P. In conclusion, MCP
has the greatest ATTD and STTD of Ca among the calcium supplements used in this experiment,
followed by DCP. Basal, MCP, and DCP diets had greater ATTD of P than the other diets, and
inclusion of microbial phytase increased the ATTD and STTD of Ca and ATTD of P in the diets.
Key words: apparent digestibility, calcium, calcium supplements, phytase, pigs, standardized
digestibility
INTRODUCTION
Most Ca in diets fed to pigs is supplemented as inorganic Ca due to the low concentration
of Ca in most plant-based feed ingredients. In a typical corn-soybean meal diet for a 40-kg pig,
the Ca contribution from corn and soybean meal is around 1 g per kg of diet, whereas
approximately 5 g of Ca per kg of diet is supplied by limestone and calcium phosphates (NRC,
1998). Apparent total tract digestibility (ATTD) values for Ca in some ingredients have been
reported (Bohlke et al., 2005; Stein et al., 2011; González-Vega et al., 2013), but for most
commonly used Ca sources, digestibility values are not available. Values for ATTD of Ca may
be influenced by the concentration of Ca in the diet, which is a result of the endogenous loss of
Ca from the intestinal tract of pigs (González-Vega et al., 2013). Therefore, it is likely that
values for standardized total tract digestibility (STTD) of Ca are more accurate to use in diet
formulations than values for ATTD because STTD values are additive in mixed diets (NRC,
2012). However, for most feed ingredients, values for the STTD of Ca are not available, but the
37
relative bioavailability of Ca may vary among Ca supplements (Ross et al., 1984). It is, therefore,
expected that STTD of Ca also differs among Ca sources.
Inclusion of microbial phytase in swine diets often increases the digestibility of Ca and P
(Brady et al., 2002; Liao et al., 2006; Poulsen et al., 2010), but effects of phytase on the STTD of
Ca in individual ingredients have not been reported. Therefore, the objectives of this experiment
were to test the hypothesis that 1) differences in the ATTD and STTD of Ca exist among Ca
supplements; and 2) that inclusion of microbial phytase to the diets increases the ATTD and
STTD of Ca. If these hypotheses are confirmed, it will be concluded that diets fed to pigs are
most accurately formulated if values for the STTD of Ca in all feed ingredients are used.
MATERIALS AND METHODS
The Institutional Animal Care and Use Committee at the University of Illinois reviewed
and approved the protocol for the experiment. Pigs used in the experiment were the offspring of
G-Performer boars and Fertilis 25 females (Genetiporc, Alexandria, MN).
Animals and Housing
One hundred and four growing barrows with an average initial BW of 17.73 ± 2.53 kg
were randomly allotted to 13 diets with 8 replicate pigs per treatment using the Experimental
Animal Allotment Program (Kim and Lindemann, 2007). The weight of the pigs was used as the
block for the allotment. Pigs were housed individually in metabolism cages that were equipped
with a feeder, a nipple drinker, a slatted floor, and a screen floor for total fecal collection. This
experiment was conducted in 5 blocks, 3 blocks with 2 replicate pigs per diet and 2 blocks with 1
pig per diet.
Diets and Feeding
The sources of Ca that were used in this experiment were monocalcium phosphate
38
(MCP), dicalcium phosphate (DCP), calcium carbonate, L. calcareum Ca (Vistacal; AB Vista
Feed Ingredients, Marlborough, UK), and a sugar beet co-product (Limex; British Sugar PLC,
Peterborough, UK; Table 3.1). Monocalcium phosphate and DCP were obtained from PCS Sales,
Northbrook, IL. Calcium carbonate was obtained from ILC Resources, Urbandale, IA.
Lithothamnium calcareum Ca is a source of Ca produced by calcified seaweeds, Lithothamnium
calcareum, and was obtained from Celtic Sea Minerals, Currabinny, Co. Cork, Ireland. The
sugar beet co-product was obtained during sugar juice purification, and is a source of Ca in the
form of calcium dihydroxide precipitated with carbon dioxide (Associated British Foods Annual
Report and Accounts, 2008).
A basal diet containing corn, cornstarch, potato protein isolate, soybean oil, calcium
carbonate, monosodium phosphate (MSP), vitamins, and minerals was formulated (Table 3.2).
This diet contained 0.33% Ca and 0.42% total P (Table 3.3). Two diets containing 0.70 and
0.79% Ca and 0.64 and 0.67% total P were formulated by adding MCP or DCP, respectively, to
the basal diet and the inclusion of MSP was eliminated. Three additional diets that all contained
between 0.75 and 0.86% Ca and between 0.40 and 0.42% total P were formulated by adding
calcium carbonate, L. calcareum Ca, or the sugar beet co-product to the basal diet at the expense
of cornstarch.
Six additional diets that were similar to the previous 6 diets, with the exception that they
also contained 500 units per kg of microbial phytase (Quantum Blue, AB Vista Feed Ingredients,
Marlborough, UK), were also formulated. Microbial phytase was included in these diets at the
expense of cornstarch. A Ca-free diet that was used to measure basal endogenous losses of Ca
was also formulated. This diet contained cornstarch, potato protein isolate, sucrose, soybean oil,
Solka floc, MSP, crystalline AA, vitamins, and minerals.
39
Pigs were fed each diet for 13 d and the feed allotment was calculated as 3 times the daily
maintenance energy requirement (i.e., 106 kcal of ME/kg BW0.75; NRC, 1998). The allotments of
feed were divided into 2 equal meals and provided at 0700 and 1700 h daily. Pigs had free access
to water throughout the experiment. The initial 5 d was an adaptation period to the diets and
fecal samples were collected quantitatively from d 6 to 11 using the marker-to-marker approach
(Adeola, 2001). Indigo carmine was the indigestible marker added to the morning meal on d 6 to
mark the beginning of fecal collection. Ferric oxide was the marker added to the morning meal
on d 11 to mark the end of fecal collection. Fecal samples were stored at -20°C immediately after
collection and samples were dried in a forced-air oven at 65°C and finely ground through a 1-
mm screen in a Wiley mill (model 4; Thomas Scientific, Swedesboro, NJ) before laboratory
analysis.
Sample Analysis
Corn, potato protein isolate, MCP, DCP, calcium carbonate, L. calcareum Ca, the sugar
beet co-product, MSP, all diets, and all fecal samples were analyzed for DM (Method 930.15;
AOAC Int., 2007) and for Ca and P by inductively coupled plasma spectroscopy-optical
emission spectroscopy (Method 985.01 A, B, and D; AOAC Int., 2007) after wet ash sample
preparation (Method 975.03 B(b); AOAC Int., 2007). All ingredients and diets were also
analyzed for ash (Method 942.05; AOAC Int., 2007). Corn, potato protein isolate, and diets were
analyzed for GE using an adiabatic bomb calorimeter (Model 6300, Parr Instruments, Moline,
IL) and for CP using the combustion procedure (Method 990.03; AOAC Int., 2007) on an
Elementar Rapid N-cube protein/nitrogen apparatus (Elementar Americas Inc., Mt. Laurel, NJ).
These samples were also analyzed for ADF (Method 973.18; AOAC Int., 2007), NDF (Holst,
1973), phytic acid (Ellis et al., 1977), and for acid-hydrolyzed ether extract using 3N HCl
40
(Sanderson, 1986) followed by crude fat extraction with petroleum ether (Method 2003.06,
AOAC Int., 2007) on a Soxtec 2050 automated analyzer (FOSS North America, Eden Prairie,
MN). Diets were also analyzed for phytase activity (Engelen et al., 2001).
Calculations and Statistical Analysis
The amount of phytate-bound P in corn, potato protein isolate, and diets was calculated as
28.2% of the concentration of phytate (Tran and Sauvant, 2004) and the amount of non-phytate P
was calculated as the difference between phytate-bound P and total P. Values for ATTD and
STTD of Ca were calculated for each diet according to standard procedures (NRC, 2012).
Samples from pigs fed the Ca-free diet were used to determine basal endogenous losses of Ca.
The ATTD of Ca in each of the Ca-containing ingredients without or with microbial phytase was
calculated using the difference procedure (Adeola, 2001). The values for ATTD of Ca were
corrected for endogenous losses of Ca to obtain the STTD of Ca using the same principles as
those outlined to calculated standardized ileal digestibility of AA (Stein et al., 2007).
Normality of residuals and outliers were tested using the UNIVARIATE procedure of
SAS (SAS Inst. Inc., Cary, NC). Data of the diets were analyzed as a 6 × 2 factorial and the
ATTD and STTD of Ca in the Ca sources were analyzed as a 5× 2 factorial using the MIXED
procedure of SAS. The model included the fixed effects of Ca source, the level of phytase, and
the interaction between Ca source and level of phytase, and the random effect of block. Least
square means were calculated for each treatment using the LSMeans procedure in SAS and
differences among means were separated using the PDIFF option of SAS. The pig was the
experimental unit and an alpha level of 0.05 was used to determine significance among means.
41
RESULTS
Nutrient Composition of Ingredients and Diets
The concentration of Ca in corn, potato protein isolate, MCP, DCP, Ca carbonate, L.
calcareum Ca, and sugar beet co-product was between 0.01 and 41.82%, and the concentration
of P was between 0.15 and 21.60% (as-fed basis; Table 3.1). The MSP used in this experiment
was analyzed to contain 0.09% Ca and 27.10% P. The ingredient composition of the
experimental diets without microbial phytase is presented in Table 3.2 (as-fed basis). The
concentration of Ca in basal diets without and with microbial phytase was 0.33 and 0.31%,
respectively, and the concentration of P was 0.42 and 0.40%, respectively (Tables 3.3 and 3.4).
The analyzed concentration of Ca in diets containing MCP, DCP, Ca carbonate, L. calcareum
Ca, and the sugar beet co-product was between 0.70 and 0.86% if phytase was not used and
between 0.75 and 0.86% in diets that contained microbial phytase. The concentration of P was
between 0.40 and 0.67% if phytase was not used and between 0.42 and 0.69% if phytase was
used. The concentration of Ca and P in the Ca-free diet was 0.02% and 0.23%, respectively. The
concentration of Ca and P in the diets was close to expected values, with the exception that the
concentration of Ca in the Ca carbonate diet without phytase was slightly less than expected, but
it was assumed that this small difference did not affect the results. The concentration of phytase
in most diets was close to expected values, although the concentration of phytase in MCP and L.
calcareum Ca diets were somewhat greater than formulated.
Digestibility of Ca in Diets
All pigs remained healthy and consumed their assigned diets without apparent problems.
The ADFI and basal endogenous losses (mg/d) of Ca were not affected by Ca source or
microbial phytase (Table 3.5). The intake of Ca increased (P < 0.001) in pigs fed diets containing
DCP or Ca carbonate if microbial phytase was used, but Ca intake was not affected by microbial
42
phytase in the basal diet or in the diets containing MCP, L. calcareum Ca, or the sugar beet co-
product (Ca source × phytase interaction, P < 0.001). Regardless of phytase inclusion, pigs fed
diets containing DCP or the sugar beet co-product had greater (P < 0.05) fecal output than pigs
fed Ca carbonate or the basal diets, but fecal output was not different from MCP and L.
calcareum Ca. Regardless of Ca source, pigs fed diets containing microbial phytase had greater
(P < 0.05) fecal output than pigs fed diets that did not contain microbial phytase. Regardless of
phytase inclusion, the concentration of Ca was greater (P < 0.05) in feces from pigs fed Ca
carbonate, L. calcareum Ca, or sugar beet co-product than from pigs fed the basal, MCP, or DCP
diets. Inclusion of microbial phytase decreased (P < 0.05) the concentration of Ca in feces,
regardless of the Ca source. The amount of Ca output was not affected by the inclusion of
microbial phytase, but pigs fed the L. calcareum Ca or the sugar beet co-product diets had a
greater (P < 0.05) amount of Ca output than pigs fed the basal, MCP, DCP, or Ca carbonate
diets. The amount of Ca absorbed in pigs fed the basal, L. calcareum Ca, or the sugar beet co-
product diets was not affected by microbial phytase inclusion, but pigs fed MCP, DCP, or Ca
carbonate had a greater (P < 0.05) amount of Ca absorbed if microbial phytase was included in
the diets than if no microbial phytase was used (Ca source × phytase interaction, P < 0.01).
Regardless of phytase inclusion, pigs fed the MCP diets had the greatest (P < 0.05) ATTD of Ca,
but pigs fed the basal or DCP diets had a greater (P < 0.05) ATTD of Ca than pigs fed the Ca
carbonate, L. calcareum Ca, or the sugar beet co-product diets. Regardless of phytase inclusion,
pigs fed MCP diets had greater (P < 0.05) STTD of Ca than pigs fed the DCP, Ca carbonate, L.
calcareum Ca, or the sugar beet co-product diets, but STTD of Ca was not different between the
MCP and basal diets. Regardless of Ca source, the ATTD and STTD of Ca increased (P < 0.05)
if microbial phytase was added to the diets.
43
Digestibility of Ca in Ingredients
Inclusion of microbial phytase did not affect the ATTD or STTD of Ca in the Ca sources
(Table 3.6). Regardless of inclusion of microbial phytase, pigs fed MCP had the greatest (P <
0.05) ATTD and STTD values of Ca, and pigs fed DCP had greater (P < 0.05) ATTD and STTD
of Ca than pigs fed Ca carbonate, L. calcareum Ca, or the sugar beet co-product, but no
differences were observed among ATTD and STTD of Ca in Ca carbonate, L. calcareum Ca, and
the sugar beet co-product.
Digestibility of P in Diets
Regardless of Ca source, inclusion of microbial phytase increased (P < 0.05) the amount
of P intake, percentage of P absorbed, and ATTD of P (Table 3.7). The percentage of P in the
feces and amount of P output decreased (P < 0.05) if microbial phytase was included in the diets.
Regardless of phytase inclusion, pigs fed MCP or DCP had greater (P < 0.05) P intake than pigs
fed the basal, Ca carbonate, L. calcareum Ca, or the sugar beet co-product diets. Pigs fed the
basal diets had less (P < 0.05) concentration of P in feces than pigs fed MCP, DCP, Ca
carbonate, L. calcareum Ca, or the sugar beet co-product diets, regardless of phytase inclusion.
The amounts of P output from pigs fed MCP, DCP, L. calcareum Ca, or the sugar beet co-
product were greater (P < 0.05) than from pigs fed Ca carbonate or the basal diets, regardless of
phytase inclusion, but pigs fed Ca carbonate diets had greater (P < 0.05) P output than pigs fed
the basal diets. The percentage of P absorbed was greater (P < 0.05) in pigs fed MCP or DCP
diets than pigs fed basal, Ca carbonate, L. calcareum Ca, or the sugar beet co-product diets, but
pigs fed basal diets had greater (P < 0.05) percentage of P absorbed than pigs fed Ca carbonate,
L. calcareum Ca, or the sugar beet co-product diets. The ATTD of P was greater (P < 0.05) in
pigs fed basal, MCP, or DCP diets than pigs fed Ca carbonate, L. calcareum Ca, or the sugar beet
44
co-product diets, regardless of phytase inclusion, but pigs fed Ca carbonate had greater (P <
0.05) ATTD of P than pigs fed L. calcareum Ca or the sugar beet co-product diets.
DISCUSSION
The concentration of Ca and P in MCP and the concentration of P in DCP used in this
experiment are in agreement with reported values (Sauvant et al., 2004; Rostagno et al., 2011;
NRC, 2012), but the concentration of Ca in DCP was less than published values (Sauvant et al.,
2004; Rostagno et al., 2011; NRC, 2012). The reason for variations in the concentration of Ca in
MCP and DCP is that what is commercially known as MCP and DCP, in fact are mixtures of a
number of P-containing compounds (Baker, 1989; Petersen and Stein, 2006) as a result of the
way feed grade MCP and DCP are produced. Production of MCP and DCP starts with the
addition of phosphoric acid to Ca carbonate and the reaction between these 2 components is
stopped according to the amount of total P desired in the final product. The reaction will be
stopped at 18.5% P if DCP is produced and at 21.0% P if MCP is produced. Therefore, the final
product is a mixture of unreacted calcium carbonate, MCP, hydrated DCP, anhydrous DCP, and
other reactive P compounds. Phosphorus compounds such as ferrous phosphate, aluminum
phosphate, magnesium phosphate, sodium phosphate, and unreacted phosphoric acid represents
between 15 and 17% of the total P in the final products (Baker, 1989). Calcium is also present as
Ca fluoride and Ca sulfate, which represents 36.2 to 42.3% of the total Ca in the final products
(Baker, 1989). In general, what is commercially known as MCP contains 50 to 70% MCP and 10
to 15% DCP, and DCP may contain approximately 29% MCP and 57% DCP (Petersen and
Stein, 2006).
45
The concentrations of Ca and P in Ca carbonate used in this experiment were greater than
reported values (Sauvant et al., 2004; NRC 2012), but the concentrations of Ca and P in MSP
were within the range of reported values (Sauvant et al., 2004; González-Vega et al., 2013, 2014;
NRC, 2012). Lithothamnium calcareum may be used as a Ca supplement for poultry (Walk et al.,
2012) and pigs (Melo and Moura, 2009; González-Vega et al., 2014). The concentrations of Ca
and P in L. calcareum Ca used in this experiment were slightly greater than reported values
(Melo and Moura, 2009; Walk et al., 2012; González-Vega et al., 2014).
The sugar beet co-product is mostly used in agriculture for soil conditioning and for
correction of soil acidity (Associated British Foods Annual Report and Accounts, 2008). The
concentrations of Ca and P in the sugar beet co-product used in this experiment were close to
expected values.
The concentration of Ca and P in corn concur with reported values (Sauvant et al., 2004;
Rostagno et al., 2011; Almeida and Stein, 2012; NRC, 2012), but the concentration of phytate-
bound P was slightly less than reported values (Sauvant et al., 2004; Almeida and Stein, 2012).
The concentration of Ca, P, and phytate in potato protein isolate were close to previous data
(González-Vega et al., 2013). The concentrations of Ca and P in the diets were close to the
expected values, but varied among the diets due to the way the diets were formulated. Because of
the different concentration of Ca and P in the test ingredients used in this experiment, it was not
possible to maintain a constant concentration of Ca and P among all diets. However, the ATTD
of Ca is not influenced by Ca concentration in the diets if the Ca concentration is between 0.33
and 0.80% (Stein et al., 2011) and if the P concentration is between 0.44 and 0.66% (Stein et al.,
2008), and all diets, except the Ca-free diet, were formulated to stay within these limits.
46
Phytate and Ca Interactions
Phytate in plant feed ingredients, may bind up to 6 atoms of Ca and promote the
formation of Ca-phytate complexes and reduce the digestibility of Ca in the intestinal tract (Selle
et al., 2009). There are 2 possible mechanisms that may explain how phytate decreases the
digestibility of Ca. One possible mechanism is that phytate binds the intrinsic Ca in the feed
ingredient and reduces digestibility. For example, when canola meal was used as the sole source
of dietary Ca, the ATTD and true total tract digestibility of Ca were less than that of pigs fed
canola meal with microbial phytase (González-Vega et al., 2013). This indicates that intrinsic Ca
in canola meal was indeed bound to phytate, and the addition of microbial phytase hydrolyzed
the phytate ester bonds, and therefore, phytate had less ability to bind Ca if phytase was added to
the diet. The other possible mechanism is that not only intrinsic Ca, but also supplemented
dietary Ca, may form complexes with phytate. The ATTD of Ca in diets in which the majority of
the Ca was inorganic Ca increased if phytase was added to the diets (Guggenbuhl et al., 2007;
Poulsen et al., 2010; Rodríguez et al., 2013). The increase in ATTD of Ca in most of these
experiments was greater than what can be explained by release of intrinsic Ca from phytate,
which indicates that some of the added dietary Ca may also complex with phytate if phytase is
not used in the diet. The fact that the ATTD and STTD of Ca in the diets evaluated in this
experiment increased as microbial phytase was added to the diet indicates that some of the Ca in
those feed ingredients was bound to phytate. The observation that microbial phytase did not
affect the ATTD and STTD of Ca in the Ca supplements, but only in the diets, further indicates
that dietary phytate binds to Ca from the inorganic dietary Ca sources.
Differences in Digestibility of Ca among Sources of Ca
47
The greater ATTD and STTD of Ca in MCP and DCP than in Ca carbonate indicates
that Ca in Ca carbonate is more easily bound to phytate or is less soluble. This is likely because
Ca in MCP and DCP is already bound to P, which is a result of the reaction between Ca
carbonate and phosphoric acid in the production of these ingredients.
We are not aware of other experiments with pigs in which Ca digestibility is compared
among MCP, DCP, and calcium carbonate, but in a recent experiment with broilers it was
observed that the digestibility of Ca in MCP (67.9%) was greater than in limestone (34.1%;
Angel, 2013). Thus, results obtained both with broilers and with pigs indicate that the
digestibility of Ca in Ca carbonate or limestone is less than the digestibility of Ca in MCP and
DCP.
Concentrations of Ca in L. calcareum Ca and the sugar beet co-product were relatively
less than in Ca carbonate, however, L. calcareum Ca is a very soluble source of Ca (Walk et al.,
2012; González-Vega et al., 2014). The ATTD of Ca in Ca carbonate obtained in this experiment
was in agreement with reported values (Stein et al., 2011), but the ATTD and STTD of Ca in Ca
carbonate and L. calcareum Ca were greater than the values reported by González-Vega et al.
(2014). The total and available P levels in the diets were similar among experiments, but the
main difference among the experiments is that corn-based diets were used by Stein et al. (2011)
and in the present experiment, whereas semi-synthetic diets were used by González-Vega et al.
(2014). We are not aware of the form in which Ca is present in L. calcareum Ca or in the sugar
beet co-product, but the observation that ATTD and STTD of Ca in L. calcareum Ca and the
sugar beet co-product were not different from values for Ca carbonate without or with microbial
phytase indicates that Ca-P complexes may have been formed in pigs fed L. calcareum Ca
(González-Vega et al., 2014) and the sugar beet co-product.
48
Previous data reported a difference in relative bioavailability among Ca supplements
(Ross et al., 1984), which could indicate that STTD of Ca may differ among Ca supplements.
Results of the present study demonstrated that there are differences in Ca digestibility among Ca
supplements. Therefore, generated values for STTD of Ca in Ca supplements without or with
phytase may lead to a more accurate formulation of diets fed to pigs.
Digestibility of P
Phosphorus from corn and potato protein isolate represents 30 to 53% of the total P in the
diets used in this experiment, which results in 24 to 43% of the total P in the diets being bound to
phytate. Inclusion of microbial phytase in the diets decreases the amount of P excreted in feces
(Harper et al., 1997), which is a result of the hydrolysis of phytate by phytase. Therefore, the
increase in ATTD of P that was observed as phytase was added to the diets can be explained by
the release of P bound to phytate (Poulsen et al., 2010).
Monosodium phosphate was the source of P used in the basal, Ca carbonate, L.
calcareum Ca, and sugar beet co-product diets and MCP and DCP were the main sources of P in
the MCP and DCP diets. The ATTD of P in MSP is greater than in MCP and DCP (Petersen and
Stein, 2006), but in the current experiment, the greater ATTD of P observed in diets containing
MCP or DCP compared with diets using MSP may be a result of the reduced contribution of P
from corn in diets containing MCP or DCP compared with diets containing MSP. In diets
containing MCP or DCP, between 24 and 27% of the total P is bound to phytate, whereas in the
diets containing MSP, between 38 and 43% of the total P is bound to phytate.
Conclusions
The ATTD and STTD of Ca were greater in MCP and DCP than in Ca carbonate, L.
calcareum Ca, and the sugar beet co-product. Inclusion of microbial phytase increased the ATTD

49
and STTD of Ca in diets, but not in the Ca supplements, confirming that dietary phytate
interferes with Ca digestibility. The ATTD of P was greater in the basal, MCP, and DCP diets
than in the other diets, and regardless of the Ca source, addition of microbial phytase increased
the ATTD of P in all diets.
50
LITERATURE CITED
Adeola, O. 2001. Digestion and balance techniques in pigs. In: A. J. Lewis and L. L. Southern,
editor, Swine nutrition. 2nd ed. CRC Press, Washington, DC. p. 903-916.
Almeida, F. N., and H. H. Stein. 2012. Effects of graded levels of microbial phytase on the
standardized total tract digestibility of phosphorus in corn and corn coproducts fed to
pigs. J. Anim. Sci. 90:1262-1269.
Angel, R. 2013. Calcium to phosphorus ratios in broilers. In: 24th Annual Aust. Poult. Sci.
Symp., Sydney, Australia. p. 10-13.
AOAC International. 2007. Official Methods of Analysis of AOAC Int. 18th ed. Rev. 2. W.
Hortwitz and G. W. Latimer, Jr., eds. AOAC Int., Gaithersburg, MD.
Associated British Foods Annual Report and Accounts. 2008. From beet to bowl: The beet sugar
production process. http://www.abf.co.uk/documents/pdfs/2008/2008_annual_report.pdf.
(Accessed 8 August 2013.)
Baker, D. H. 1989. Phosphorus sources for poultry. Multi-State Poultry Newsletter. 1:5-6.
Bohlke, R. A., R. C. Thaler, and H. H. Stein. 2005. Calcium, phosphorus, and amino acid
digestibility in low-phytate corn, normal corn, and soybean meal by growing pigs. J.
Anim. Sci. 83:2396-2403.
Brady, S. M., J. J. Callan, D. Cowan, M. McGrane, and J. V. O’Doherty. 2002. Effect of phytase
inclusion and calcium/phosphorus ratio on the performance and nutrient retention of
grower-finisher pigs fed barley/wheat/soya bean meal-based diets. J. Sci. Food Agric.
82:1780-1790.
Ellis, R., E. R. Morris, and C. Philpot. 1977. Quantitative determination of phytate in the
presence of high inorganic phosphate. Anal. Biochem. 77:536-539.
51
Engelen, A. J., F. C. van der Heeft, P. H. G. Ransdorp, W. A. C. Somers, J. Schaefer, and J. C.
van der Vat. 2001. Determination of phytase activity in feed by a colorimetric enzymatic
method: Collaborative interlaboratory study. J. AOAC Int. 84:629-633.
González-Vega, J. C., C. L. Walk, Y. Liu, and H. H. Stein. 2013. Determination of endogenous
intestinal losses of Ca and true total tract digestibility of calcium in canola meal fed to
growing pigs. J. Anim. Sci. 91:4807-4816.
González-Vega, J. C., C. L. Walk, Y. Liu, and H. H. Stein. 2014. The site of net absorption of Ca
from the intestinal tract of growing pigs and effect of phytic acid, Ca level and Ca source
on Ca digestibility. Arch. Anim. Nutr. 68:126-142.
Guggenbuhl, P., A. P. Quintana, and C. S. Nunes. 2007. Comparative effects of three phytases
on phosphorus and calcium digestibility in the growing pig. Livest. Sci. 109:258-260.
Harper, A. F., E. T. Kornegay, and T. C. Schell. 1997. Phytase supplementation of low-
phosphorus growing-finishing pig diets improves performance, phosphorus digestibility,
and bone mineralization and reduces phosphorus excretion. J. Anim. Sci. 75:3174-3186.
Holst, D. O. 1973. Holst filtration apparatus for Van Soest detergent fiber analysis. J. AOAC.
56:1352-1356.
Kim, B. G., and M. D. Lindemann. 2007. A new spreadsheet method for the experimental animal
allotment. J. Anim. Sci. 85 (Suppl. 2):112 (Abstr.)
Liao, S. F., W. C. Sauer, A. Kies, M. Cervantes, J. K. Htoo, and J. M. He. 2006. Effect of
phytase supplementation to diets for weanling pigs on the utilization of phosphorus and
calcium. Interciencia 31:262-267.
Miyada, T., A. Nakajima, and K. Ebihara. 2011. Iron bound to pectin is utilised by rats. Br. J.
Nutr. 106:73-78.
52
Miyada, T., A. Nakajima, and K. Ebihara. 2012. Degradation of pectin in the caecum contributes
to bioavailability of iron in rats. Br. J. Nutr. 107:1452-1457.
Melo, T. V., and A. M. A. Moura. 2009. Utilição da farinha de algas calcáreas na alimentação
animal. Arch. Zootec. 58:99-107.
NRC. 1998. Nutrient Requirements of Swine. 10th rev. ed. Natl. Acad. Press, Washington, DC.
NRC. 2012. Nutrient Requirements of Swine. 11th rev. ed. Natl. Acad. Press, Washington, DC.
Petersen, G. I., and H. H. Stein. 2006. Novel procedure for estimating endogenous losses and
measurement of apparent and true digestibility of phosphorus by growing pigs. J. Anim.
Sci. 84:2126-2132.
Petersen, G. I., C. Pedersen, M. D. Lindemann, and H. H. Stein. 2011. Relative bioavailability of
phosphorus in inorganic phosphorus sources fed to growing pigs. J. Anim. Sci. 89:460-
466.
Poulsen, H. D., D. Carlson, J. V. Nørgaard, and K. Blaabjerg. 2010. Phosphorus digestibility is
highly influenced by phytase but slightly by calcium in growing pigs. Livest. Sci.
134:100-102.
Rodríguez, D. A., R. C. Sulabo, J. C. González-Vega, and H. H. Stein. 2013. Energy
concentration and phosphorus digestibility in canola, cottonseed, and sunflower products
fed to growing pigs. Can. J. Anim. Sci. 93:493-503.
Ross, R. D., G. L. Cromwell, and T. S. Stahly. 1984. Effects of source and particle size on the
biological availability of calcium supplements for growing pigs. J. Anim. Sci. 59:125-
134.
Rostagno, H. S., L. F. Teixeira Albino, J. Lopez Donzele, P. C. Gomes, R. F. de Oliveira, D. C.
Lopes, A. Soares Ferreira, S. L. de Toledo Barreto, and R. F. Euclides. 2011. Brazilian
53
Tables for Poultry and Swine. 3rd ed. H. S. Rostagno, ed. Univ. Fed. de Viçosa, Viçosa,
Brazil.
Sanderson, P. 1986. A new method of analysis of feedingstuffs for the determination of crude
oils and fats. In: W. Haresign and D. J. A. Cole, editors, Recent advances in animal
nutrition. Butterworths, London, U.K. p. 77-81.
Sauvant, D., J.-M. Perez, and G. Tran. 2004. Tables of Composition and Nutritional Value of
Feed Materials: Pig, Poultry, Sheep, Goats, Rabbits, Horses, Fish. 2nd ed. Wageningen
Academic Publishers, Wageningen, the Netherlands.
Selle, P. H., A. J. Cowieson, and V. Ravindran. 2009. Consequences of calcium interactions with
phytate and phytase for poultry and pigs. Livest. Sci. 124:126-141.
Stein, H. H., O. Adeola, G. L. Cromwell, S. W. Kim, D. C. Mahan, and P. S. Miller. 2011.
Concentration of dietary calcium supplied by calcium carbonate does not affect the
apparent total tract digestibility of calcium, but reduces digestibility of phosphorus by
growing pigs. J. Anim. Sci. 89:2139-2144.
Stein, H. H., C. T. Kadzere, S. W. Kim, and P. S. Miller. 2008. Influence of dietary phosphorus
concentration on the digestibility of phosphorus in monocalcium phosphate by growing
pigs. J. Anim. Sci. 86:1861-1867.
Stein, H. H., B. Sève, M. F. Fuller, P. J. Moughan, and C. F. M. de Lange. 2007. Invited review:
Amino acid bioavailability and digestibility in pig feed ingredients: Terminology and
application. J. Anim. Sci. 85:172-180.
Tran, G., and D. Sauvant. 2004. Chemical data and nutritional value. In: D. Sauvant, J.-M. Perez,
and G. Tran, editors, Tables of composition and nutritional value of feed materials: pig,
poultry, sheep, goats, rabbits, horses, fish. 2nd ed. Wageningen Academic Publishers,

54
Wageningen, the Netherlands. p. 17-24.
Walk, C. L., E. K. Addo-Chidie, M. R. Bedford, and O. Adeola. 2012. Evaluation of a highly
soluble calcium source and phytase in the diets of broiler chickens. Poult. Sci. 91:2255-
2263.
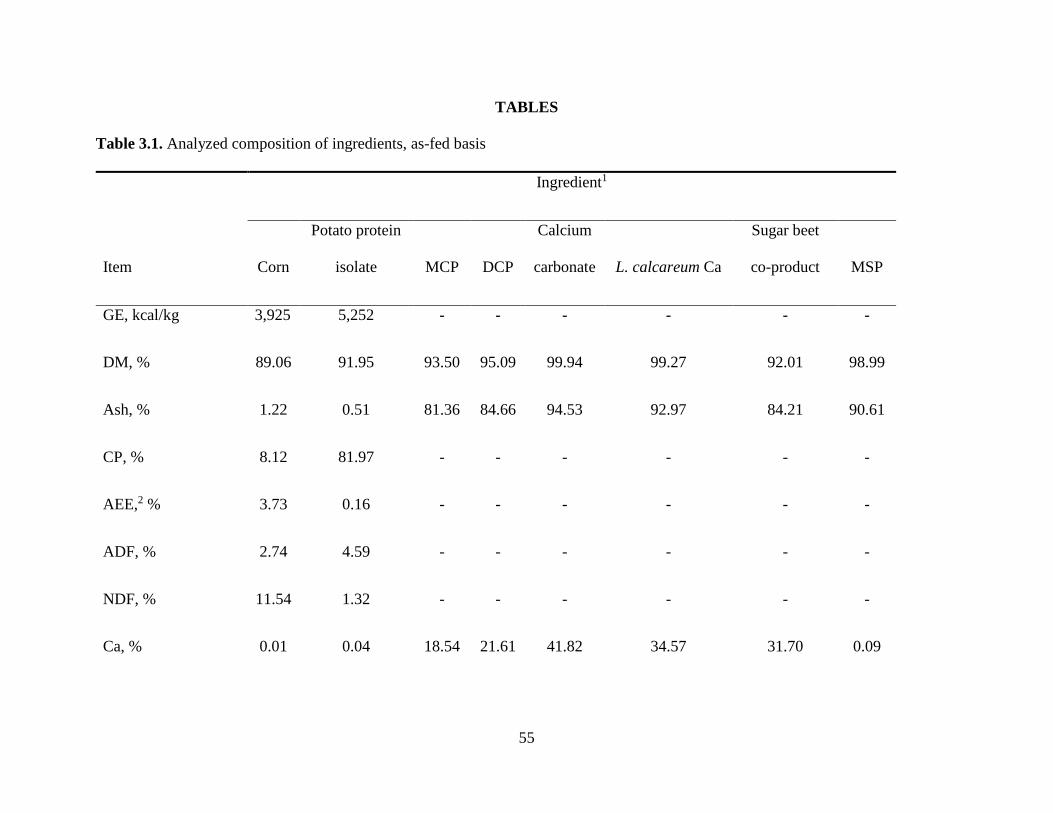
55
TABLES
Table 3.1. Analyzed composition of ingredients, as-fed basis
Ingredient1
Item Corn
Potato protein
isolate MCP DCP
Calcium
carbonate L. calcareum Ca
Sugar beet
co-product MSP
GE, kcal/kg 3,925 5,252 - - - - - -
DM, % 89.06 91.95 93.50 95.09 99.94 99.27 92.01 98.99
Ash, % 1.22 0.51 81.36 84.66 94.53 92.97 84.21 90.61
CP, % 8.12 81.97 - - - - - -
AEE,2 % 3.73 0.16 - - - - - -
ADF, % 2.74 4.59 - - - - - -
NDF, % 11.54 1.32 - - - - - -
Ca, % 0.01 0.04 18.54 21.61 41.82 34.57 31.70 0.09
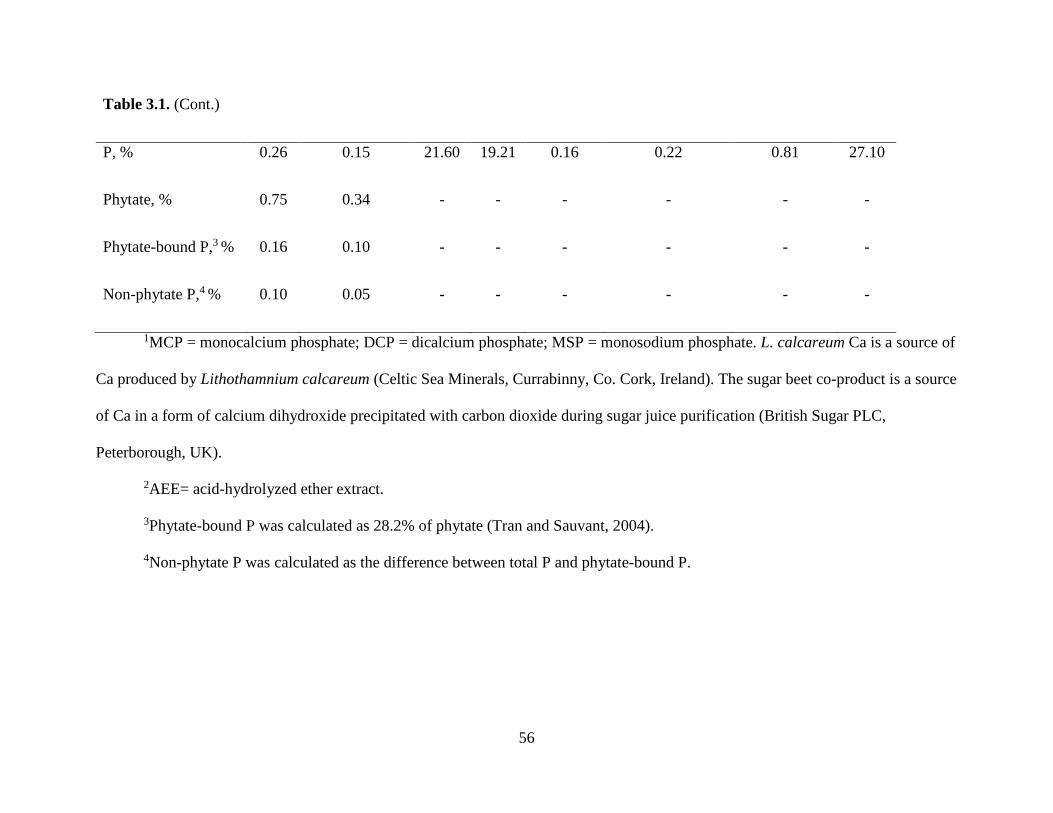
56
Table 3.1. (Cont.)
P, % 0.26 0.15 21.60 19.21 0.16 0.22 0.81 27.10
Phytate, % 0.75 0.34 - - - - - -
Phytate-bound P,3 % 0.16 0.10 - - - - - -
Non-phytate P,4 % 0.10 0.05 - - - - - -
1MCP = monocalcium phosphate; DCP = dicalcium phosphate; MSP = monosodium phosphate. L. calcareum Ca is a source of
Ca produced by Lithothamnium calcareum (Celtic Sea Minerals, Currabinny, Co. Cork, Ireland). The sugar beet co-product is a source
of Ca in a form of calcium dihydroxide precipitated with carbon dioxide during sugar juice purification (British Sugar PLC,
Peterborough, UK).
2AEE= acid-hydrolyzed ether extract.
3Phytate-bound P was calculated as 28.2% of phytate (Tran and Sauvant, 2004).
4Non-phytate P was calculated as the difference between total P and phytate-bound P.
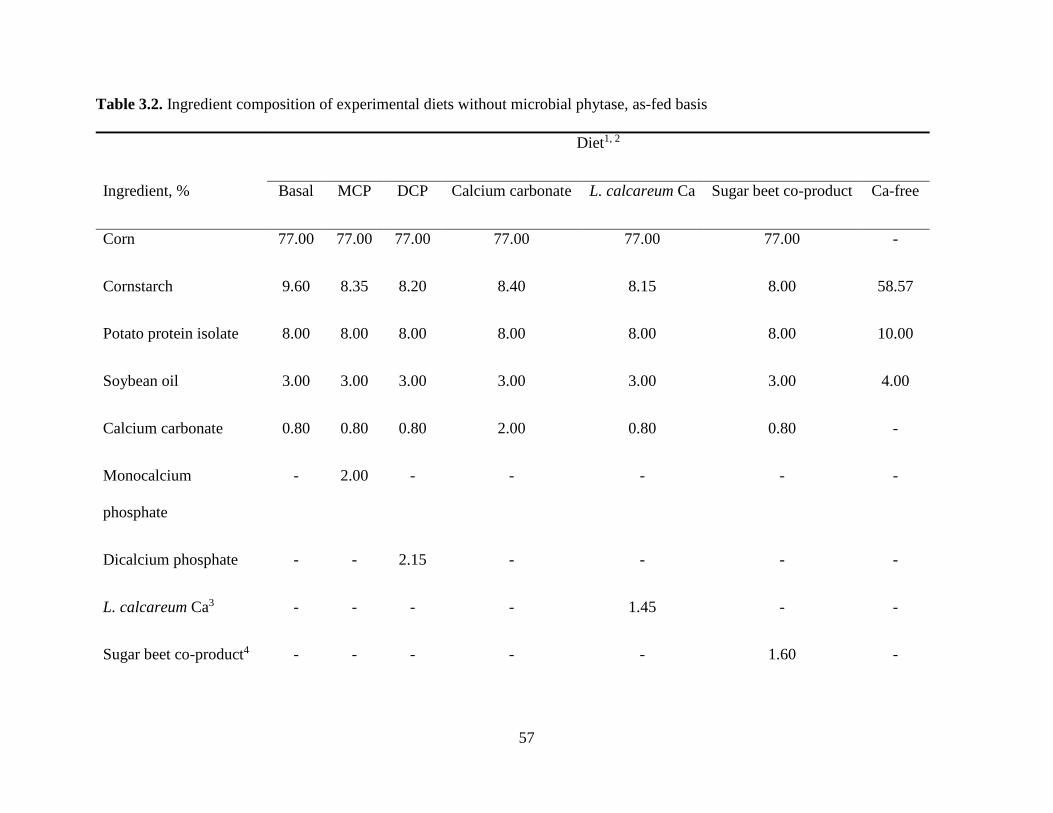
57
Table 3.2. Ingredient composition of experimental diets without microbial phytase, as-fed basis
Diet1, 2
Ingredient, % Basal MCP DCP Calcium carbonate L. calcareum Ca Sugar beet co-product Ca-free
Corn 77.00 77.00 77.00 77.00 77.00 77.00 -
Cornstarch 9.60 8.35 8.20 8.40 8.15 8.00 58.57
Potato protein isolate 8.00 8.00 8.00 8.00 8.00 8.00 10.00
Soybean oil 3.00 3.00 3.00 3.00 3.00 3.00 4.00
Calcium carbonate 0.80 0.80 0.80 2.00 0.80 0.80 -
Monocalcium
phosphate
- 2.00 - - - - -
Dicalcium phosphate - - 2.15 - - - -
L. calcareum Ca3 - - - - 1.45 - -
Sugar beet co-product4 - - - - - 1.60 -
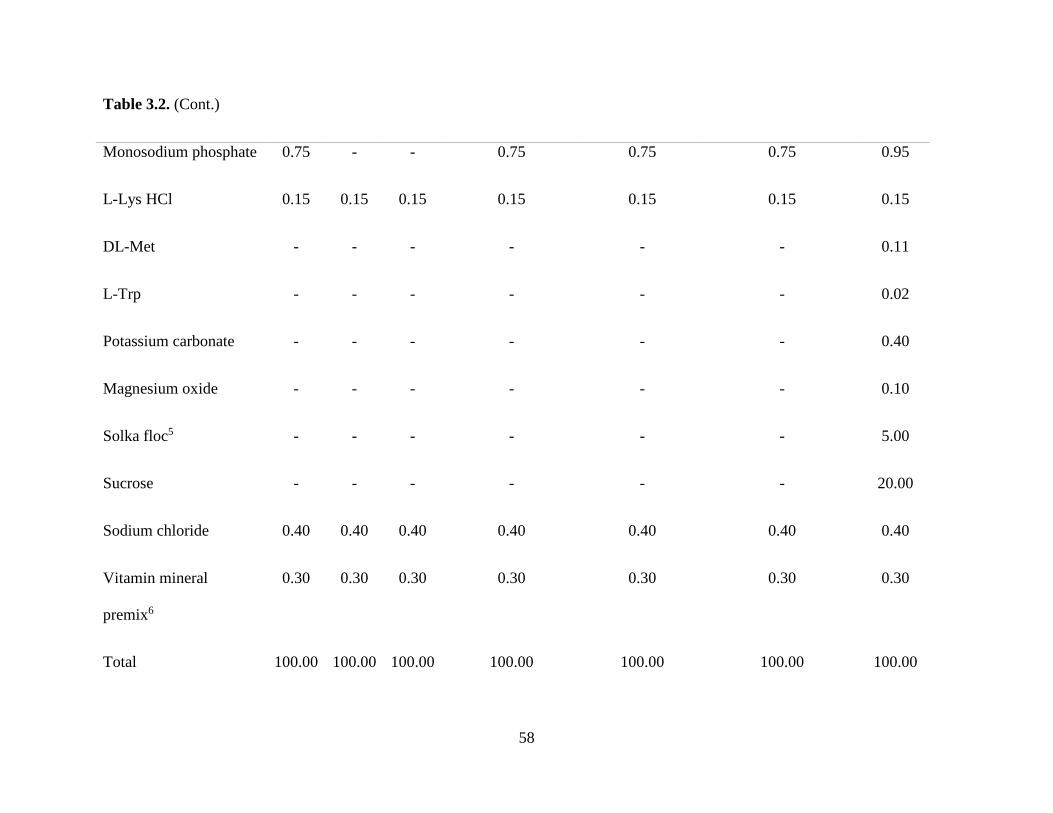
58
Table 3.2. (Cont.)
Monosodium phosphate 0.75 - - 0.75 0.75 0.75 0.95
L-Lys HCl 0.15 0.15 0.15 0.15 0.15 0.15 0.15
DL-Met - - - - - - 0.11
L-Trp - - - - - - 0.02
Potassium carbonate - - - - - - 0.40
Magnesium oxide - - - - - - 0.10
Solka floc5 - - - - - - 5.00
Sucrose - - - - - - 20.00
Sodium chloride 0.40 0.40 0.40 0.40 0.40 0.40 0.40
Vitamin mineral
premix6
0.30 0.30 0.30 0.30 0.30 0.30 0.30
Total 100.00 100.00 100.00 100.00 100.00 100.00 100.00
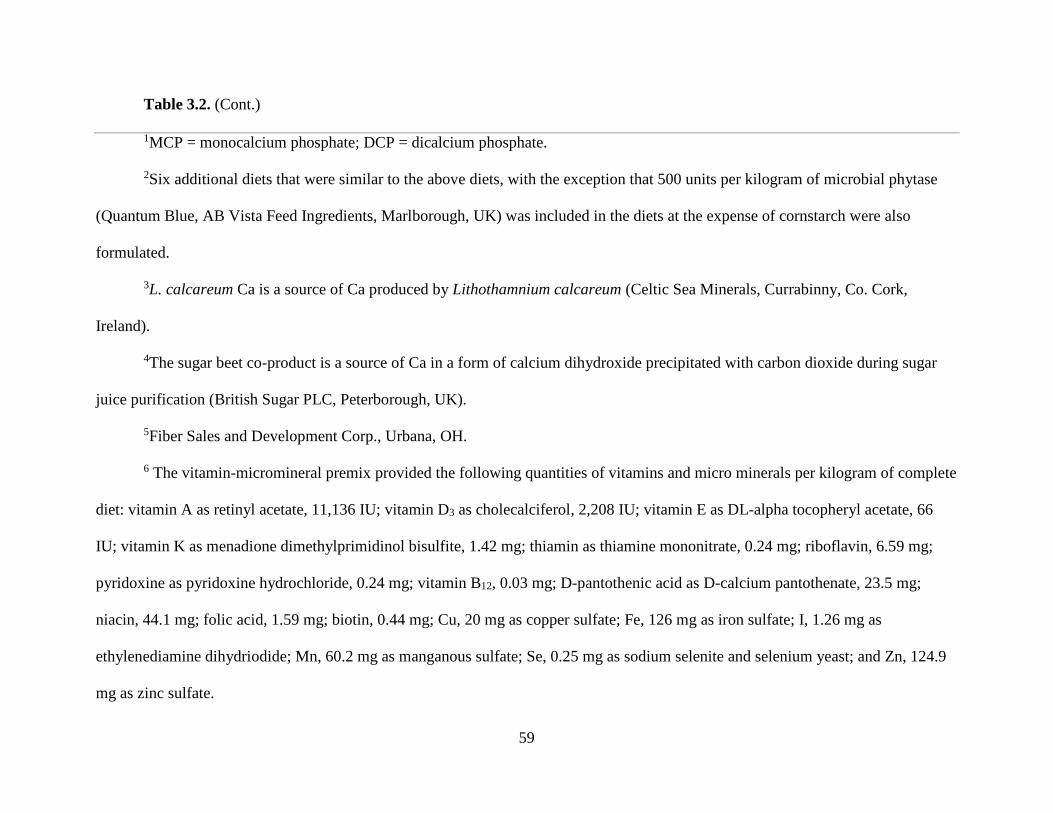
59
Table 3.2. (Cont.)
1MCP = monocalcium phosphate; DCP = dicalcium phosphate.
2Six additional diets that were similar to the above diets, with the exception that 500 units per kilogram of microbial phytase
(Quantum Blue, AB Vista Feed Ingredients, Marlborough, UK) was included in the diets at the expense of cornstarch were also
formulated.
3L. calcareum Ca is a source of Ca produced by Lithothamnium calcareum (Celtic Sea Minerals, Currabinny, Co. Cork,
Ireland).
4The sugar beet co-product is a source of Ca in a form of calcium dihydroxide precipitated with carbon dioxide during sugar
juice purification (British Sugar PLC, Peterborough, UK).
5Fiber Sales and Development Corp., Urbana, OH.
6 The vitamin-micromineral premix provided the following quantities of vitamins and micro minerals per kilogram of complete
diet: vitamin A as retinyl acetate, 11,136 IU; vitamin D3 as cholecalciferol, 2,208 IU; vitamin E as DL-alpha tocopheryl acetate, 66
IU; vitamin K as menadione dimethylprimidinol bisulfite, 1.42 mg; thiamin as thiamine mononitrate, 0.24 mg; riboflavin, 6.59 mg;
pyridoxine as pyridoxine hydrochloride, 0.24 mg; vitamin B12, 0.03 mg; D-pantothenic acid as D-calcium pantothenate, 23.5 mg;
niacin, 44.1 mg; folic acid, 1.59 mg; biotin, 0.44 mg; Cu, 20 mg as copper sulfate; Fe, 126 mg as iron sulfate; I, 1.26 mg as
ethylenediamine dihydriodide; Mn, 60.2 mg as manganous sulfate; Se, 0.25 mg as sodium selenite and selenium yeast; and Zn, 124.9
mg as zinc sulfate.
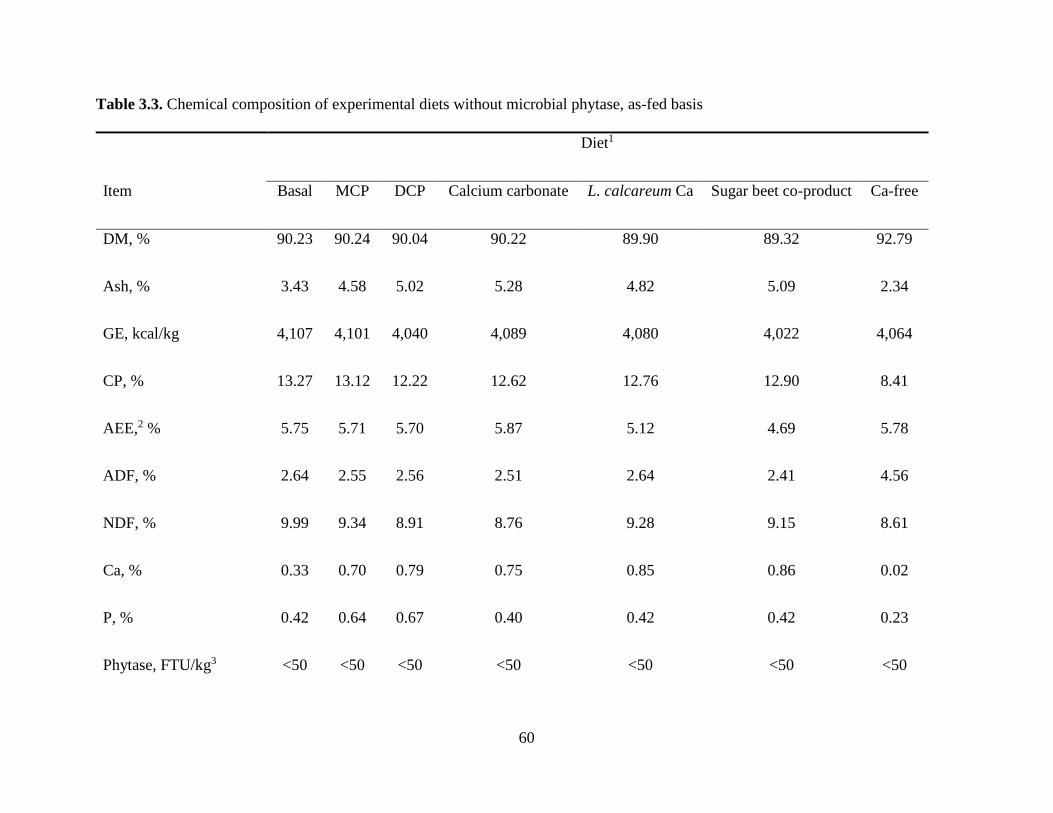
60
Table 3.3. Chemical composition of experimental diets without microbial phytase, as-fed basis
Diet1
Item Basal MCP DCP Calcium carbonate L. calcareum Ca Sugar beet co-product Ca-free
DM, % 90.23 90.24 90.04 90.22 89.90 89.32 92.79
Ash, % 3.43 4.58 5.02 5.28 4.82 5.09 2.34
GE, kcal/kg 4,107 4,101 4,040 4,089 4,080 4,022 4,064
CP, % 13.27 13.12 12.22 12.62 12.76 12.90 8.41
AEE,2 % 5.75 5.71 5.70 5.87 5.12 4.69 5.78
ADF, % 2.64 2.55 2.56 2.51 2.64 2.41 4.56
NDF, % 9.99 9.34 8.91 8.76 9.28 9.15 8.61
Ca, % 0.33 0.70 0.79 0.75 0.85 0.86 0.02
P, % 0.42 0.64 0.67 0.40 0.42 0.42 0.23
Phytase, FTU/kg3 <50 <50 <50 <50 <50 <50 <50
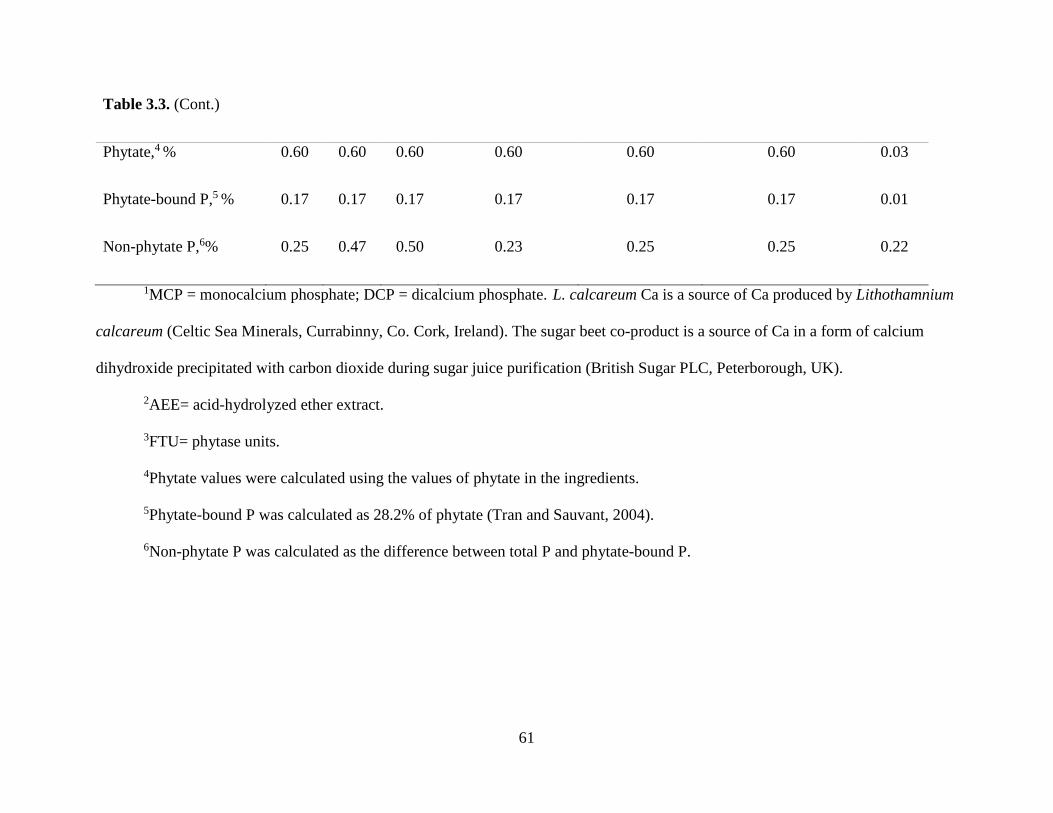
61
Table 3.3. (Cont.)
Phytate,4 % 0.60 0.60 0.60 0.60 0.60 0.60 0.03
Phytate-bound P,5 % 0.17 0.17 0.17 0.17 0.17 0.17 0.01
Non-phytate P,6% 0.25 0.47 0.50 0.23 0.25 0.25 0.22
1MCP = monocalcium phosphate; DCP = dicalcium phosphate. L. calcareum Ca is a source of Ca produced by Lithothamnium
calcareum (Celtic Sea Minerals, Currabinny, Co. Cork, Ireland). The sugar beet co-product is a source of Ca in a form of calcium
dihydroxide precipitated with carbon dioxide during sugar juice purification (British Sugar PLC, Peterborough, UK).
2AEE= acid-hydrolyzed ether extract.
3FTU= phytase units.
4Phytate values were calculated using the values of phytate in the ingredients.
5Phytate-bound P was calculated as 28.2% of phytate (Tran and Sauvant, 2004).
6Non-phytate P was calculated as the difference between total P and phytate-bound P.
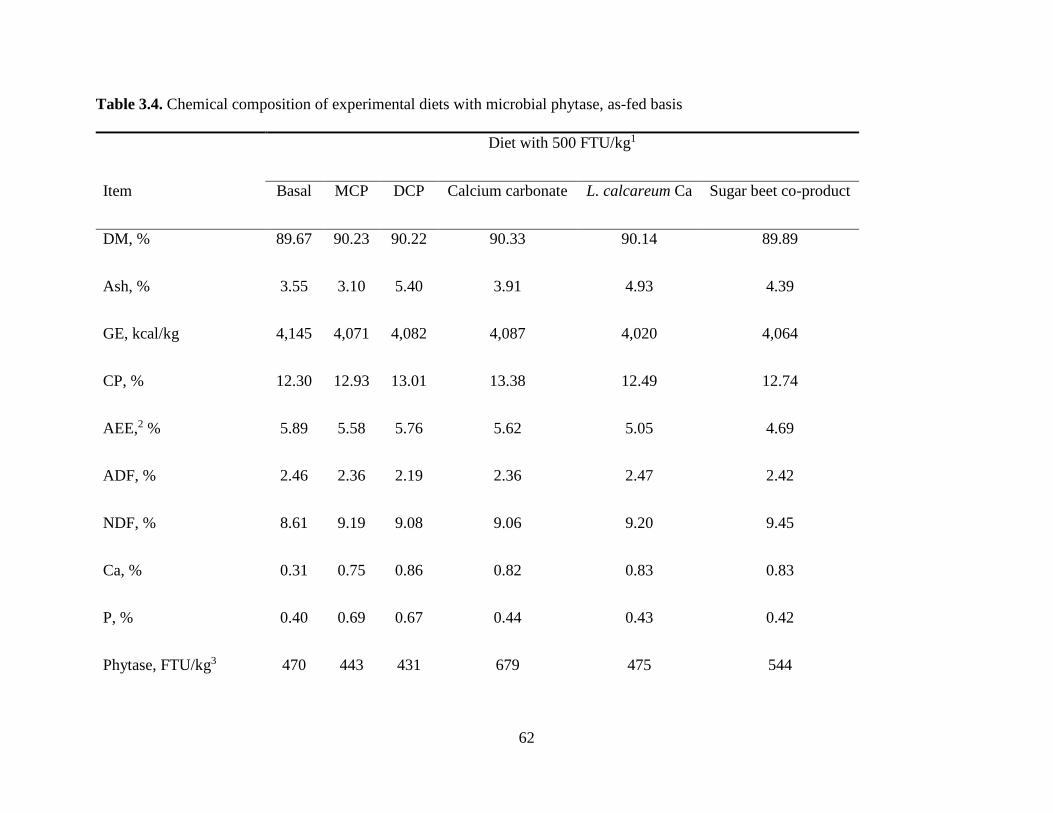
62
Table 3.4. Chemical composition of experimental diets with microbial phytase, as-fed basis
Diet with 500 FTU/kg1
Item Basal MCP DCP Calcium carbonate L. calcareum Ca Sugar beet co-product
DM, % 89.67 90.23 90.22 90.33 90.14 89.89
Ash, % 3.55 3.10 5.40 3.91 4.93 4.39
GE, kcal/kg 4,145 4,071 4,082 4,087 4,020 4,064
CP, % 12.30 12.93 13.01 13.38 12.49 12.74
AEE,2 % 5.89 5.58 5.76 5.62 5.05 4.69
ADF, % 2.46 2.36 2.19 2.36 2.47 2.42
NDF, % 8.61 9.19 9.08 9.06 9.20 9.45
Ca, % 0.31 0.75 0.86 0.82 0.83 0.83
P, % 0.40 0.69 0.67 0.44 0.43 0.42
Phytase, FTU/kg3 470 443 431 679 475 544
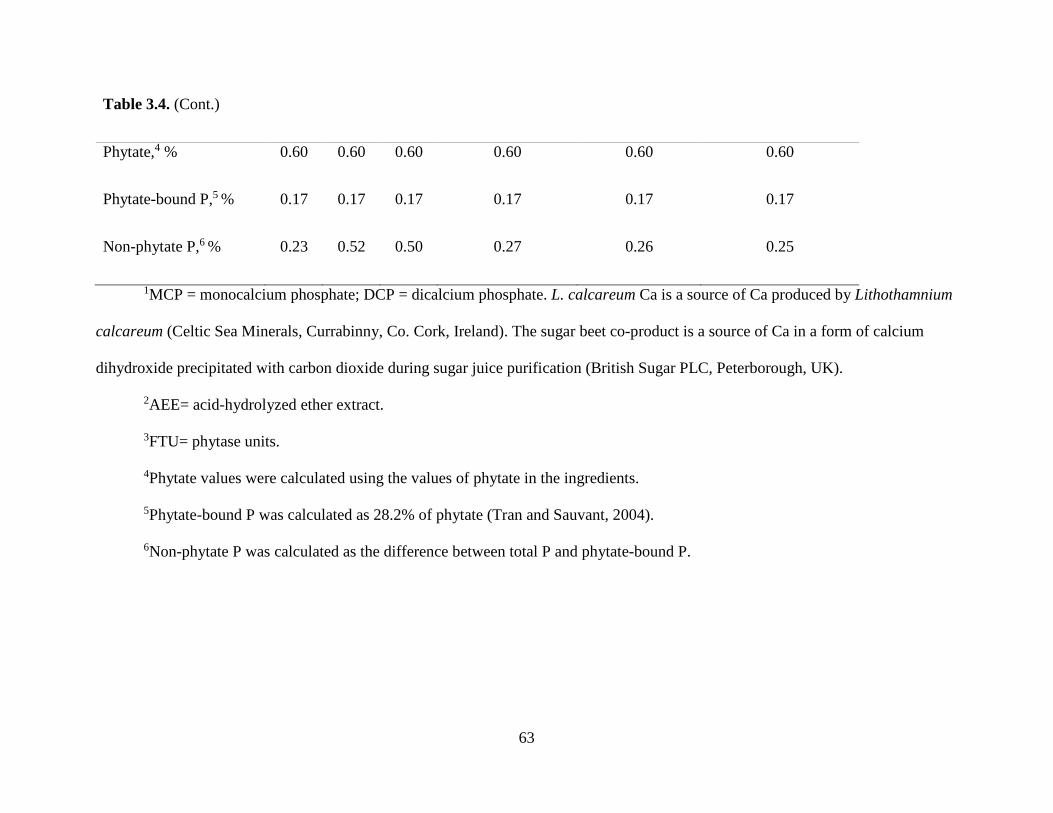
63
Table 3.4. (Cont.)
Phytate,4 % 0.60 0.60 0.60 0.60 0.60 0.60
Phytate-bound P,5 % 0.17 0.17 0.17 0.17 0.17 0.17
Non-phytate P,6 % 0.23 0.52 0.50 0.27 0.26 0.25
1MCP = monocalcium phosphate; DCP = dicalcium phosphate. L. calcareum Ca is a source of Ca produced by Lithothamnium
calcareum (Celtic Sea Minerals, Currabinny, Co. Cork, Ireland). The sugar beet co-product is a source of Ca in a form of calcium
dihydroxide precipitated with carbon dioxide during sugar juice purification (British Sugar PLC, Peterborough, UK).
2AEE= acid-hydrolyzed ether extract.
3FTU= phytase units.
4Phytate values were calculated using the values of phytate in the ingredients.
5Phytate-bound P was calculated as 28.2% of phytate (Tran and Sauvant, 2004).
6Non-phytate P was calculated as the difference between total P and phytate-bound P.
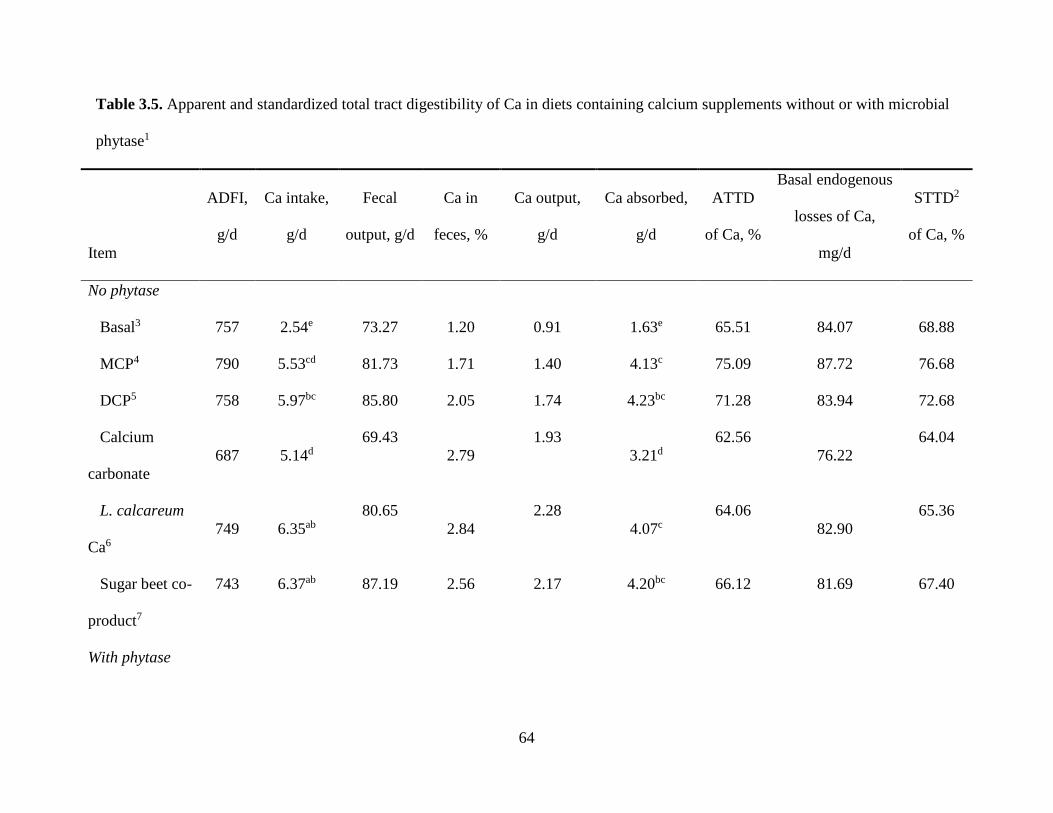
64
Table 3.5. Apparent and standardized total tract digestibility of Ca in diets containing calcium supplements without or with microbial
phytase1
Item
ADFI,
g/d
Ca intake,
g/d
Fecal
output, g/d
Ca in
feces, %
Ca output,
g/d
Ca absorbed,
g/d
ATTD
of Ca, %
Basal endogenous
losses of Ca,
mg/d
STTD2
of Ca, %
No phytase
Basal3 757 2.54e 73.27 1.20 0.91 1.63e 65.51 84.07 68.88
MCP4 790 5.53cd 81.73 1.71 1.40 4.13c 75.09 87.72 76.68
DCP5 758 5.97bc 85.80 2.05 1.74 4.23bc 71.28 83.94 72.68
Calcium
carbonate 687 5.14d
69.43 2.79
1.93 3.21d
62.56 76.22
64.04
L. calcareum
Ca6 749 6.35ab
80.65 2.84
2.28 4.07c
64.06 82.90
65.36
Sugar beet co-
product7
743 6.37ab 87.19 2.56
2.17 4.20bc 66.12 81.69 67.40
With phytase
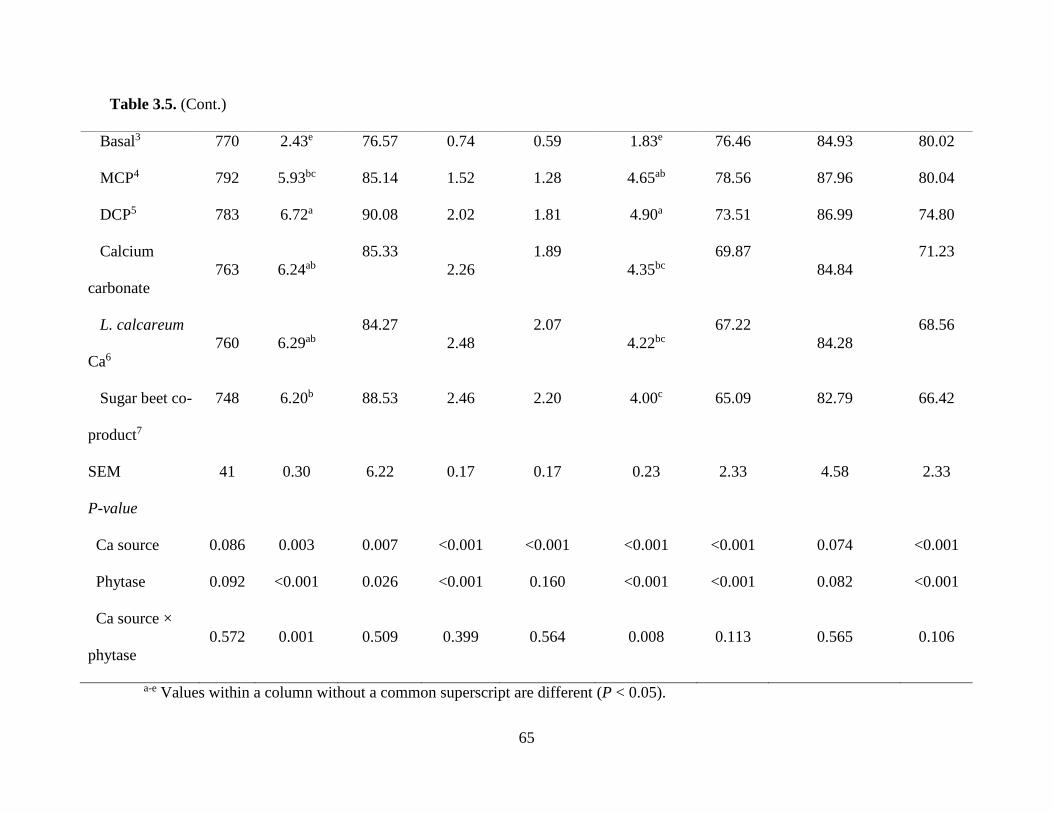
65
Table 3.5. (Cont.)
Basal3 770 2.43e 76.57 0.74 0.59 1.83e 76.46 84.93 80.02
MCP4 792 5.93bc 85.14 1.52 1.28 4.65ab 78.56 87.96 80.04
DCP5 783 6.72a 90.08 2.02 1.81 4.90a 73.51 86.99 74.80
Calcium
carbonate 763 6.24ab
85.33 2.26
1.89 4.35bc
69.87 84.84
71.23
L. calcareum
Ca6 760 6.29ab
84.27 2.48
2.07 4.22bc
67.22 84.28
68.56
Sugar beet co-
product7
748 6.20b 88.53 2.46 2.20 4.00c 65.09 82.79 66.42
SEM 41 0.30 6.22 0.17 0.17 0.23 2.33 4.58 2.33
P-value
Ca source 0.086 0.003 0.007 <0.001 <0.001 <0.001 <0.001 0.074 <0.001
Phytase 0.092 <0.001 0.026 <0.001 0.160 <0.001 <0.001 0.082 <0.001
Ca source ×
phytase 0.572 0.001 0.509 0.399 0.564 0.008 0.113 0.565 0.106
a-e Values within a column without a common superscript are different (P < 0.05).
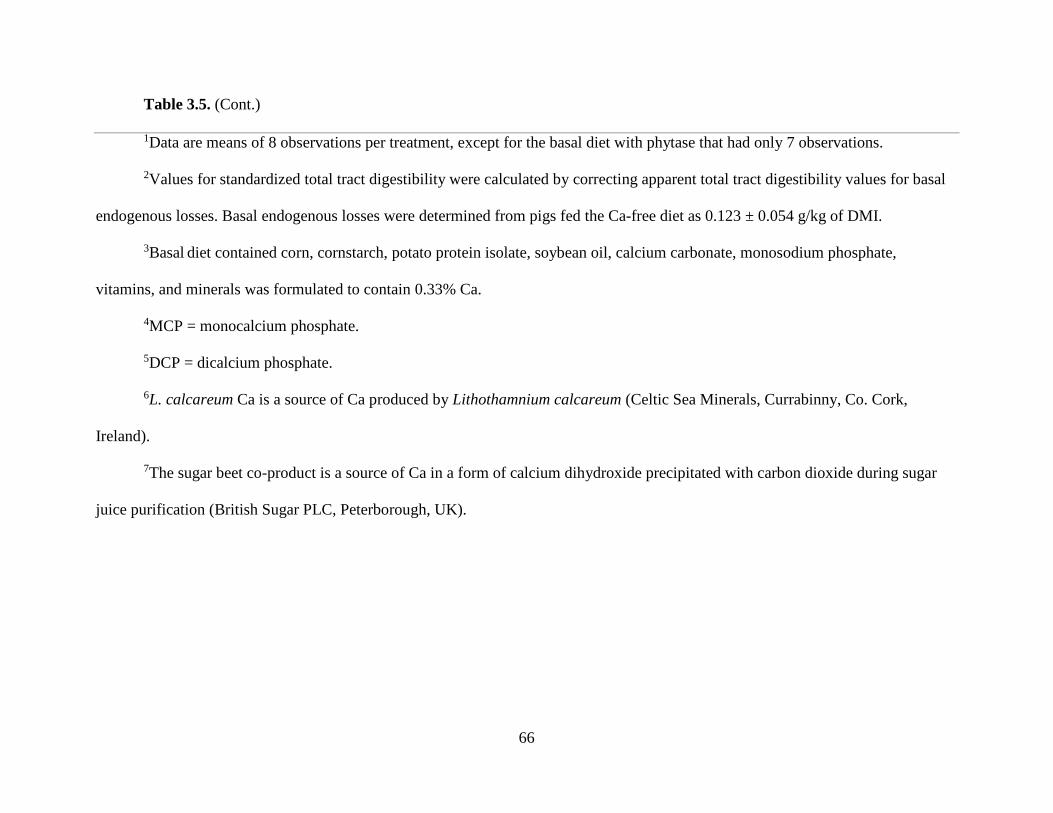
66
Table 3.5. (Cont.)
1Data are means of 8 observations per treatment, except for the basal diet with phytase that had only 7 observations.
2Values for standardized total tract digestibility were calculated by correcting apparent total tract digestibility values for basal
endogenous losses. Basal endogenous losses were determined from pigs fed the Ca-free diet as 0.123 ± 0.054 g/kg of DMI.
3Basal diet contained corn, cornstarch, potato protein isolate, soybean oil, calcium carbonate, monosodium phosphate,
vitamins, and minerals was formulated to contain 0.33% Ca.
4MCP = monocalcium phosphate.
5DCP = dicalcium phosphate.
6L. calcareum Ca is a source of Ca produced by Lithothamnium calcareum (Celtic Sea Minerals, Currabinny, Co. Cork,
Ireland).
7The sugar beet co-product is a source of Ca in a form of calcium dihydroxide precipitated with carbon dioxide during sugar
juice purification (British Sugar PLC, Peterborough, UK).
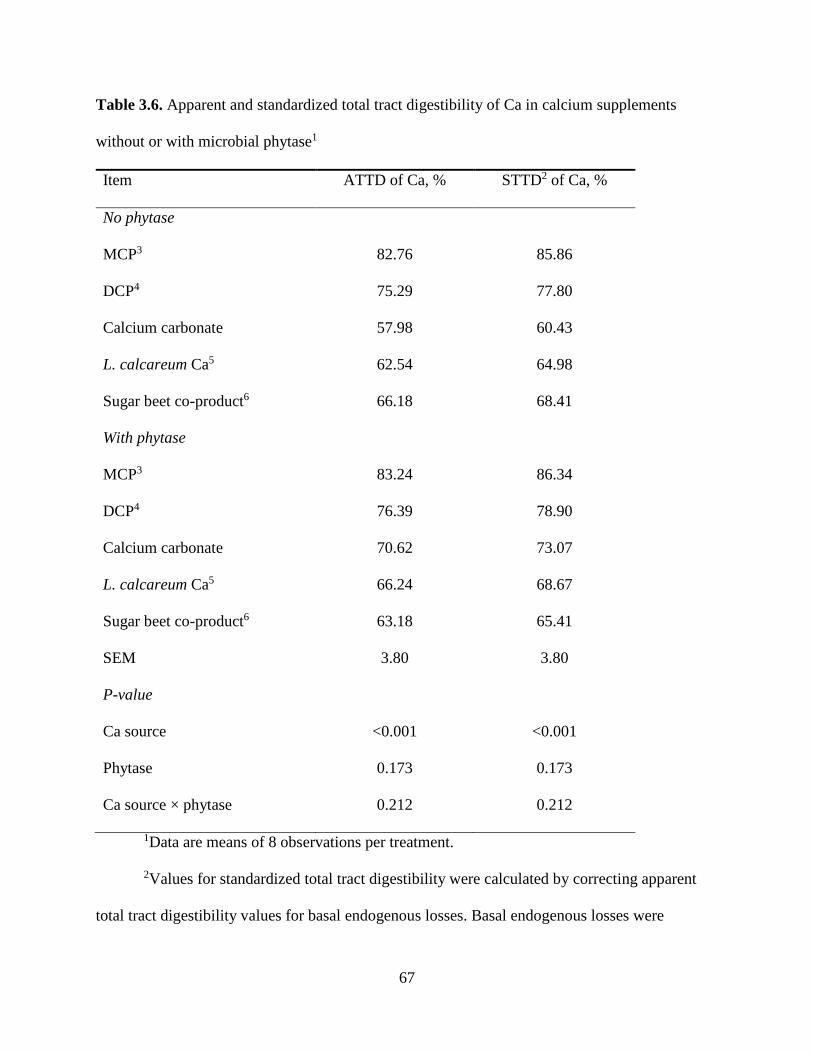
67
Table 3.6. Apparent and standardized total tract digestibility of Ca in calcium supplements
without or with microbial phytase1
Item ATTD of Ca, % STTD2 of Ca, %
No phytase
MCP3 82.76 85.86
DCP4 75.29 77.80
Calcium carbonate 57.98 60.43
L. calcareum Ca5 62.54 64.98
Sugar beet co-product6 66.18 68.41
With phytase
MCP3 83.24 86.34
DCP4 76.39 78.90
Calcium carbonate 70.62 73.07
L. calcareum Ca5 66.24 68.67
Sugar beet co-product6 63.18 65.41
SEM 3.80 3.80
P-value
Ca source <0.001 <0.001
Phytase 0.173 0.173
Ca source × phytase 0.212 0.212
1Data are means of 8 observations per treatment.
2Values for standardized total tract digestibility were calculated by correcting apparent
total tract digestibility values for basal endogenous losses. Basal endogenous losses were
68
Table 3.6. (Cont.)
determined from pigs fed the Ca-free diet as 0.123 ± 0.054 g/kg of DMI.
3MCP = monocalcium phosphate.
4DCP = dicalcium phosphate.
5L. calcareum Ca is a source of Ca produced by Lithothamnium calcareum (Celtic Sea
Minerals, Currabinny, Co. Cork, Ireland).
6The sugar beet co-product is a source of Ca in a form of calcium dihydroxide
precipitated with carbon dioxide during sugar juice purification (British Sugar PLC,
Peterborough, UK).
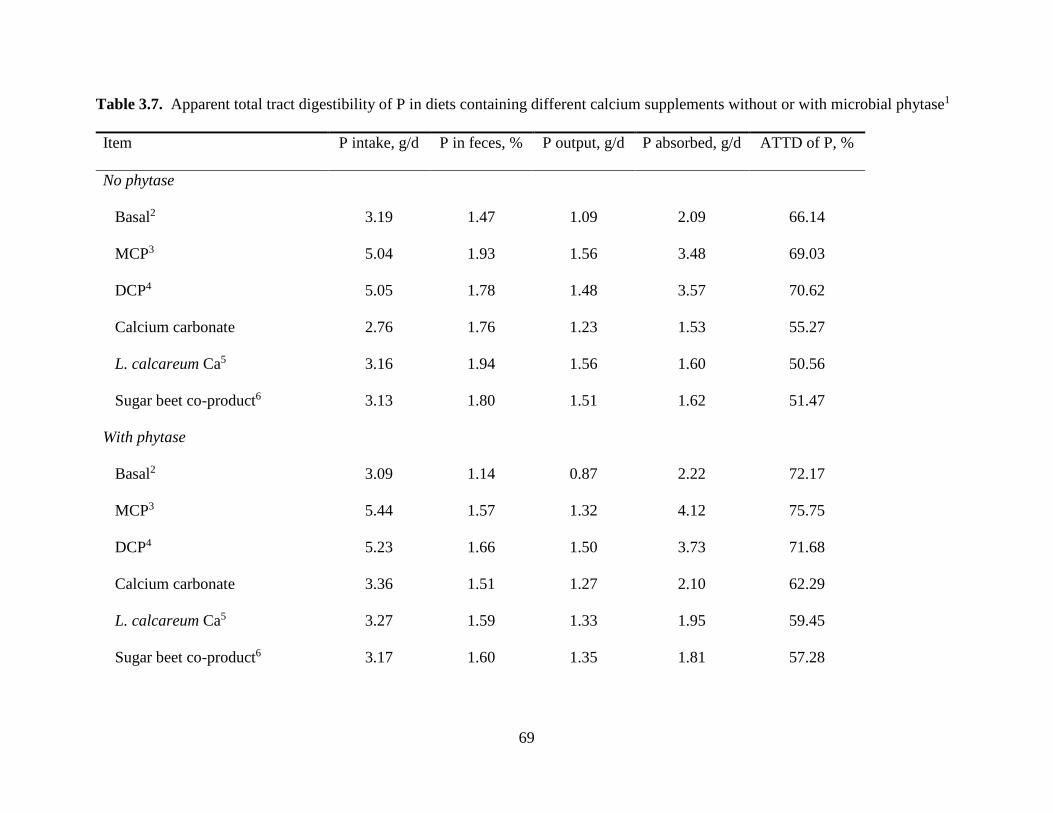
69
Table 3.7. Apparent total tract digestibility of P in diets containing different calcium supplements without or with microbial phytase1
Item P intake, g/d P in feces, % P output, g/d P absorbed, g/d ATTD of P, %
No phytase
Basal2 3.19 1.47 1.09 2.09 66.14
MCP3 5.04 1.93 1.56 3.48 69.03
DCP4 5.05 1.78 1.48 3.57 70.62
Calcium carbonate 2.76 1.76 1.23 1.53 55.27
L. calcareum Ca5 3.16 1.94 1.56 1.60 50.56
Sugar beet co-product6 3.13 1.80 1.51 1.62 51.47
With phytase
Basal2 3.09 1.14 0.87 2.22 72.17
MCP3 5.44 1.57 1.32 4.12 75.75
DCP4 5.23 1.66 1.50 3.73 71.68
Calcium carbonate 3.36 1.51 1.27 2.10 62.29
L. calcareum Ca5 3.27 1.59 1.33 1.95 59.45
Sugar beet co-product6 3.17 1.60 1.35 1.81 57.28
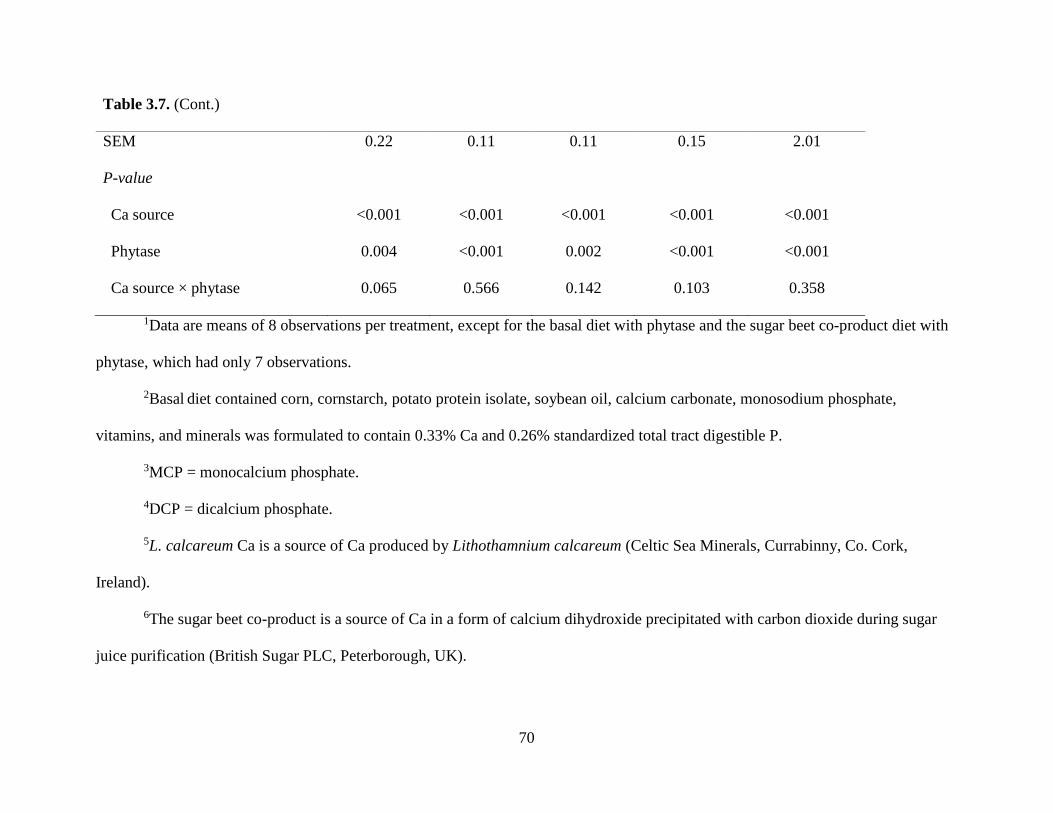
70
Table 3.7. (Cont.)
SEM 0.22 0.11 0.11 0.15 2.01
P-value
Ca source <0.001 <0.001 <0.001 <0.001 <0.001
Phytase 0.004 <0.001 0.002 <0.001 <0.001
Ca source × phytase 0.065 0.566 0.142 0.103 0.358
1Data are means of 8 observations per treatment, except for the basal diet with phytase and the sugar beet co-product diet with
phytase, which had only 7 observations.
2Basal diet contained corn, cornstarch, potato protein isolate, soybean oil, calcium carbonate, monosodium phosphate,
vitamins, and minerals was formulated to contain 0.33% Ca and 0.26% standardized total tract digestible P.
3MCP = monocalcium phosphate.
4DCP = dicalcium phosphate.
5L. calcareum Ca is a source of Ca produced by Lithothamnium calcareum (Celtic Sea Minerals, Currabinny, Co. Cork,
Ireland).
6The sugar beet co-product is a source of Ca in a form of calcium dihydroxide precipitated with carbon dioxide during sugar
juice purification (British Sugar PLC, Peterborough, UK).
71
CHAPTER 4
EFFECT OF PHYTATE, MICROBIAL PHYTASE, FIBER, AND SOYBEAN OIL
ON CALCULATED VALUES FOR APPARENT AND STANDARDIZED TOTAL
TRACT DIGESTIBILITY OF CALCIUM IN FISH MEAL FED TO GROWING PIGS
ABSTRACT: Two experiments were conducted to determine the effects of phytate, phytase,
fiber, and soybean oil on the apparent total tract digestibility (ATTD) and standardized total tract
digestibility (STTD) of Ca and on ATTD of P in fish meal fed to growing pigs. In Exp. 1, 40
growing pigs (initial average BW: 19.16 ± 2.04 kg) were randomly allotted to 1 of 5 diets with 8
pigs per treatment and placed in metabolism crates. Four diets were used in a 2 × 2 factorial
design with 2 levels of phytate (0 or 0.7%), and 2 levels of microbial phytase (0 or 500 phytase
units/kg). The diet containing no phytate was based on sucrose, cornstarch, fish meal, casein, and
soybean oil, and the diet containing 0.7% phytate was based on corn, corn germ, fish meal,
casein, and soybean oil. A Ca-free diet was used to determine basal endogenous losses of Ca.
Feces were collected from d 6 to d 13 after a 5-d adaptation period. Results indicated that the
ATTD and STTD of Ca in fish meal and the ATTD of P increased (P < 0.001) if phytase was
used, and were greater (P < 0.05) in the diets based on corn and corn germ. Experiment 2 was
conducted to determine effects of fiber and soybean oil on the ATTD and STTD of Ca and the
ATTD of P in fish meal. Fifty growing pigs (initial average BW: 19.36 ± 0.99 kg) were
randomly allotted to 1 of 5 diets with 10 pigs per treatment. Two diets contained sucrose,
cornstarch, fish meal, casein, and either 0 or 8% of a synthetic source of fiber. Two additional
diets contained fish meal, casein, corn and either 1 or 7% soybean oil. A Ca-free diet was also
used. Pigs were housed individually in metabolism crates and fecal samples were collected.
72
Results indicated that fiber increased (P < 0.001) the ATTD and STTD of Ca and the ATTD of
P, but the ATTD and STTD of Ca or the ATTD of P were not affected by soybean oil. In
agreement with results of Exp. 1, the ATTD and STTD of Ca and the ATTD of P in the corn-
based diet were greater (P < 0.05) than in the cornstarch-based diet. In conclusion, phytase and
fiber increased the ATTD and STTD of Ca and the ATTD of P in fish meal, but inclusion of
soybean oil did not affect digestibility of Ca or P. The observation that values for the ATTD and
STTD of Ca and ATTD of P are greater in corn-based diets than in cornstarch-based diets
indicates that values for the digestibility of Ca and P obtained in cornstarch-based diets may not
always be representative for the digestibility in practical corn-based diets.
Key words: calcium digestibility, fiber, fish meal, phytase, phytate, soybean oil
INTRODUCTION
Phytate may bind Ca from dietary calcium carbonate (González-Vega et al., 2015) and
intrinsic Ca in plant ingredients (Selle et al., 2009; González-Vega et al., 2013), but the effect of
phytate on the digestibility of Ca in feed ingredients of animal origin has not been reported.
Results of experiments in which a synthetic form of phytate was used have been inconsistent
(Onyango et al., 2008; González-Vega et al., 2014). However, if natural phytate from an intact
feed ingredient is added to a mixed diet that also contains other sources of Ca, phytate-Ca
complexes may be formed. When intact feed ingredients are used, not only phytate, but also
fiber, fat, and other nutrients are often added, and it is not known to which degree these nutrients
influence the standardized total tract digestibility of Ca and the formation of Ca-phytate bonds.
Digestibility of Ca can be determined by the direct procedure that includes the test
ingredient as the only source of the nutrient of interest (Adeola, 2001). By formulating diets
73
based on ingredients that contain virtually no Ca such as cornstarch, corn, or corn germ, it is
possible to obtain digestibility values for Ca from the ingredient of interest. However, some fiber
and fat is added to the diet if corn or corn germ are used. Fiber may reduce the digestibility of
AA and energy (Ma et al., 2008; Zhang et al., 2013), but effects of fiber on the digestibility of
minerals is variable (Grieshop et al., 2001). Fat may reduce the absorption of Ca in humans
(Agnew and Holdsworth, 1971) and the digestibility of Ca in rats (Frommelt et al., 2014), but to
our knowledge, there are no data on the effect of fat on the digestibility of Ca by pigs. The
objectives of these experiments were to test the hypothesis that microbial phytase, dietary
soybean oil, phytate from corn, and dietary fiber may influence the digestibility of Ca in fish
meal.
MATERIALS AND METHODS
The Institutional Animal Care and Use Committee at the University of Illinois (Urbana-
Champaign, IL) reviewed and approved the protocol for both experiments. Pigs used in the
experiments were the offspring of G-Performer boars and Fertilis 25 females (Genetiporc,
Alexandria, MN).
Experiment 1: Effect of Microbial Phytase on Ca Digestibility in the Absence or the Presence
of Phytate
Diets, Animals, and Experimental Design. Experiment 1 was designed to determine the
effect of phytase on the apparent total tract digestibility (ATTD) and the STTD of Ca in fish
meal in a diet without phytate as well as a diet with phytate. Forty growing pigs (initial average
BW: 19.16 ± 2.04 kg) were randomly allotted to 1 of 5 diets with 8 replicate pigs per diet and
housed individually in metabolism crates. The crates were equipped with a slatted floor, a feeder,
74
a nipple drinker, and a screen floor that allowed for total fecal collection. The Experimental
Animal Allotment Program (Kim and Lindemann, 2007) was used to allot pigs to experimental
diets.
All dietary ingredients were analyzed for nutrient composition prior to diet formulation
(Table 4.1). Five diets were formulated. Four diets were used in a 2 × 2 factorial design with 2
levels of phytate (0 and 0.7%) and 2 levels of microbial phytase (0 and 500 phytase units
(FTU)/kg; Quantum Blue, AB Vista Feed Ingredients, Marlborough, UK). Fish meal was the
source of Ca in all diets and corn and corn germ were used to add natural phytate to the diets
(Table 4.2). A Ca-free diet that contained cornstarch, potato protein isolate, sucrose, soybean oil,
Solka floc, crystalline AA, monosodium phosphate, vitamins, and minerals was also formulated,
and this diet was used to determine basal endogenous losses of Ca. All diets except the Ca-free
diet were formulated to meet Ca and P requirements of 11 to 25 kg pigs (NRC, 2012; Table 4.3).
Feeding and Sample Collection. Each pig was fed one of the experimental diets for 13 d
and an amount of diet equivalent to 2.7 times the daily maintenance energy requirement (i.e., 197
kcal of ME/kg BW0.60; NRC, 2012) was provided each day. Pigs had free access to water
throughout the experiment. The daily allotments of feed were divided into 2 equal meals and
provided at 0700 and 1700 h. Pigs had a 5-d adaptation period to the diets followed by 5 d of
quantitative collection of fecal samples according to the marker-to-marker approach (Adeola,
2001). An indigestible marker (Indigo carmine) was added to the morning meal on d 6 to mark
the beginning of fecal collection and ferric oxide was added to the morning meal on d 11 to mark
the conclusion of fecal collection. The ferric oxide marker passed on d 12 or d 13, and fecal
collections ceased at the time this marker appeared in the feces. Fecal samples were stored at -
75
20°C immediately after collection. Orts that were collected during the collection period were
dried in a forced-air oven at 65ºC and the weight was subtracted from the total feed intake.
Sample Analysis. Fecal samples were dried in a forced-air oven at 65°C, ground in a
Wiley mill (Model 4; Thomas Scientific, Swedesboro, NJ) using a 1-mm screen, and sub-
samples were collected for analysis after all the ground materials had been mixed. Fish meal,
casein, corn germ, corn, potato protein isolate, diets, and fecal samples were analyzed for DM by
oven drying at 135°C for 2 h (Method 930.15; AOAC Int., 2007), and for Ca and P by
Inductively Coupled Plasma-Optical Emission Spectroscopy (ICP-OES; Method 985.01 A, B,
and D; AOAC Int., 2007) after wet ash sample preparation [Method 975.03 B(b); AOAC Int.,
2007]. Fish meal, casein, corn germ, corn, potato protein isolate, and diet samples were analyzed
for GE using an isoperibol bomb calorimeter (Model 6300, Parr Instruments, Moline, IL) and for
N using the combustion procedure (Method 990.03; AOAC Int., 2007) on an Elementar Rapid
N-cube protein/nitrogen apparatus (Elementar Americas Inc., Mt. Laurel, NJ) and CP was
calculated as N × 6.25. These samples were also analyzed for ash (Method 942.05; AOAC Int.,
2007), and for acid-hydrolyzed ether extract using 3N HCl (Sanderson, 1986) followed by crude
fat extraction with petroleum ether (Method 2003.06, AOAC Int., 2007) on a Soxtec 2050
Automated Analyzer (FOSS North America, Eden Prairie, MN). Corn germ and corn were
analyzed for ADF and NDF using Ankom Technology method 12 and 13, respectively
(Ankom2000 Fiber Analyzer, Ankom Technology, Macedon, NY). Diets were analyzed for ADF
(Method 973.18; AOAC Int., 2007) and NDF (Holst, 1973). Corn germ, corn, and potato protein
isolate were also analyzed for phytate (Ellis et al., 1977). Diets were analyzed for phytase
activity (Engelen et al., 2001). Corn and corn germ were analyzed for insoluble dietary fiber
(IDF) and soluble dietary fiber (SDF) using the ANKOM Dietary Fiber Analyzer (Method
76
991.43; AOAC Int., 2007). Corn germ was de-fatted before analyzed for IDF and SDF (Method
985.29E; AOAC Int., 2007).
Calculations and Statistical Analysis. The concentration of phytate-bound P in corn
germ, corn, potato protein isolate, and diets was calculated as 28.2% of phytate (Tran and
Sauvant, 2004) and the concentration of non-phytate P was calculated by subtracting phytate-
bound P from total P.
The basal endogenous losses of Ca were determined from pigs fed the Ca-free diet and
ATTD and STTD values of Ca in each diet were calculated as outlined for calculation of ATTD
and STTD of P (Almeida and Stein, 2010; NRC, 2012).
The UNIVARIATE procedure of SAS (SAS Inst. Inc., Cary, NC) was used to determine
normality of residuals and also to identify outliers. One pig fed the fish meal-cornstarch-based
diet with phytase was identified as an outlier and removed from the data set. Data were analyzed
as a 2 × 2 factorial using the Proc MIXED of SAS. The model included the fixed effects of type
of diet, phytase, and the interaction between type of diet and phytase. The LSMEANS procedure
was used to calculate the mean values for the treatments and means were separated using the
PDIFF option if significant differences were observed. Pig was the experimental unit and an
alpha level of 0.05 was used to assess significance among treatments.
Experiment 2: Effects of Type of Diet, Fiber, and Soybean Oil on Ca Digestibility
Diets, Animals, and Experimental Design. Experiment 2 was designed to evaluate
effects of fiber and soybean oil on digestibility of Ca in fish meal. Fifty growing pigs (initial
average BW: 19.36 ± 0.99 kg) were randomly allotted to 1 of 5 diets. There were 2 blocks of 25
pigs with 5 replicate pigs for each diet in each block. Therefore, a total of 10 pigs were used per
treatment. Pigs were housed individually in metabolism crates as described for Exp. 1.
77
A cornstarch-based diet containing fish meal as the sole source of Ca was formulated and
a similar diet was formulated with the exception that 8% Solka floc was included at the expense
of cornstarch to evaluate the effects of fiber on ATTD and STTD of Ca (Table 4.4). Two corn-
based diets in which fish meal was the sole source of Ca were also formulated with 2 levels of
soybean oil (1 or 7%) to evaluate the effect of soybean oil on ATTD and STTD of Ca. All diets
were formulated to meet Ca and P requirements for 11 to 25 kg pigs (NRC, 2012; Table 4.5). A
Ca-free diet that contained corn, potato protein isolate, soybean oil, monosodium phosphate,
crystalline AA, vitamins, and minerals was also formulated to determine basal endogenous losses
of Ca. Each pig was fed one of the experimental diets for 13 d with a 5-d adaptation period and a
5-d marker based collection period as explained for Exp. 1. An amount of diet equivalent to 3
times the daily maintenance energy requirement (i.e., 197 kcal of ME/kg BW0.60; NRC, 2012)
was provided each day. Pigs were fed experimental diets for 13 d and fecal samples were
collected as explained for Exp. 1.
Fish meal, casein, corn, potato protein isolate, diets, and fecal samples were analyzed for
DM, Ca, and P. Diets and ingredients were analyzed for GE, CP, acid-hydrolyzed ether extract,
and ash. Corn and diets were analyzed for ADF, NDF, and phytate. Corn was analyzed for SDF
and IDF as explained for Exp. 1. Values for ATTD and STTD of Ca in each diet were calculated
as explained for Exp. 1.
Statistical Analysis. The UNIVARIATE procedure of SAS (SAS Inst. Inc., Cary, NC)
was used to determine normality of residuals and also to identify outliers. Three extreme outliers
were identified and removed from the data (2 pigs fed the fish meal diet and 1 pig fed the fish
meal with fiber diet). Data were analyzed using the Proc MIXED of SAS with diet as fixed effect
and period as random effect and CONTRAST statements were used to determine differences
78
between cornstarch and corn-based diets, the effect of fiber, and the effect of soybean oil on
response variables. The LSMEANS procedure was used to calculate means as explained for Exp.
1.
RESULTS
Experiment 1: Effect of Microbial Phytase on Ca Digestibility in the Absence or the Presence
of Phytate
All pigs remained healthy and consumed their diets during the experiment. Feed intake
was greater (P < 0.01) for pigs fed corn-corn germ-based diets compared with pigs fed
cornstarch-based diets, but ADFI was not affected by the inclusion of phytase (Table 4.6). Daily
Ca intake was not affected by the type of diet used or by inclusion of phytase in the diets. Daily
fecal output increased (P < 0.001) if corn-corn germ-based diets were used, but decreased (P <
0.05) if phytase was added to the diets. The concentration of Ca in the feces and the output of Ca
decreased (P < 0.001) if corn-corn germ-based diets rather than cornstarch-based diets were
used, and the output of Ca in feces was less (P < 0.05) if phytase was added to the diets than if
no phytase was used. The amount of Ca absorbed, ATTD of Ca, and STTD of Ca increased (P <
0.001) if corn-corn germ-based diets were used compared with cornstarch-based diets, and were
greater (P < 0.05) if phytase was added to the diets than if no phytase was used. Daily basal
endogenous losses of Ca increased (P < 0.05) in cornstarch-based diets if phytase was used, but
decreased (P < 0.05) in corn-corn germ-based diets if phytase was included (diet × phytase
interaction, P < 0.05).
Phosphorus intake was greater (P < 0.001) if corn-corn germ-based diets were used than
if pigs were fed cornstarch-based diets. However, the concentration of P in feces was less (P <
79
0.05) for pigs fed corn-corn germ-based diets than for pigs fed cornstarch-based diets, and not
affected by the inclusion of phytase. Daily P output decreased (P < 0.01) if phytase was added to
the diets to a greater extent if corn-corn germ-based diets were used than if cornstarch-based
diets were used (diet × phytase interaction, P < 0.05). Therefore, inclusion of phytase increased
(P < 0.01) the amount of P absorbed in corn-corn germ-based diets, but not in cornstarch-based
diets (diet × phytase interaction, P < 0.05). The ATTD of P was greater (P < 0.001) in corn-corn
germ-based diets than in cornstarch-based diets and also greater (P < 0.05) if phytase was
included in the diets than if no phytase was used.
Experiment 2: Effects of Type of Diet, Fiber, and Soybean Oil on Ca Digestibility
Pigs readily consumed their diets throughout the experiment, but one pig fed the fish
meal with fiber diet died on the 4th d of the adaptation period due to meningitis of bacterial
origin. All other pigs remained healthy throughout the experiment.
Type of Diet: Cornstarch-Based Diet vs. Corn-Based Diet. Feed intake, Ca intake, fecal
output, Ca absorbed, basal endogenous losses of Ca, the ATTD of Ca, and the STTD of Ca were
greater (P < 0.05) for pigs fed the corn-based diets than for pigs fed the cornstarch-based diets
(Table 4.7). However, Ca in feces and the amount of Ca output was greater (P < 0.05) from pigs
fed the cornstarch-based diets than from pigs fed the corn-based diets. Pigs fed the corn-based
diets had greater (P < 0.05) P intake, P absorbed, and greater ATTD of P than pigs fed
cornstarch-based diets, but P-output in feces was less (P < 0.05) for pigs fed corn based diets
compared with pigs fed cornstarch-based diets.
Effect of Fiber. Feed intake, daily Ca intake, fecal output, Ca absorbed, basal
endogenous losses of Ca, ATTD of Ca, and STTD of Ca increased (P < 0.001) if fiber was
included in the cornstarch-based diet. Fiber also reduced (P < 0.001) the amount and percentage
80
of Ca in feces. Inclusion of fiber increased (P < 0.001) P intake, P absorbed, and the ATTD of P,
but decreased (P < 0.001) the amount and percentage of P in feces.
Effect of Soybean Oil. Inclusion of soybean oil in the corn-based diet reduced (P <
0.001) feed intake, Ca intake, fecal output, amount of Ca absorbed, and basal endogenous losses
of Ca, but did not affect the amount and percentage of Ca in feces or the ATTD or STTD of Ca.
Phosphorus intake, P output, and amount of P absorbed decreased (P < 0.001) if soybean oil was
included in the diet, but percentage of P in feces and the ATTD of P were not affected by
inclusion of soybean oil in the diet.
DISCUSSION
Chemical Characteristics of Ingredients
The concentration of Ca and P in the fish meal used in these 2 experiments were greater
than reported values (Rostagno et al., 2011; NRC, 2012; Rojas and Stein, 2013), but were in
agreement with values reported by Sauvant et al. (2004). Increased Ca and P concentration in
fish meal is likely a result of inclusion of more bone from the fish filet industry in fish meal,
which increases the concentration of ash in fish meal. The concentration of Ca in casein and the
concentration of Ca, P, and phytate in potato protein isolate concurred with reported values
(Cervantes-Pahm and Stein, 2010; Rostagno et al., 2011; NRC, 2012; González-Vega et al.,
2013). Because of the negligible Ca in casein and potato protein isolate, these ingredients can be
used as AA sources in diets that are formulated to determine Ca digestibility. The concentration
of Ca, P, and phytate in corn were within the range of published values (Rostagno et al., 2011;
NRC, 2012; Rojas et al., 2013), and confirm that corn and corn-coproducts contain virtually no
Ca and that most P is bound to phytate.
81
Endogenous Losses of Ca
Basal endogenous loss of Ca obtained from pigs fed the Ca-free diet based on cornstarch,
potato protein isolate, and sucrose was 0.22 g/kg DMI (Exp. 1), but the endogenous loss from
pigs fed the Ca-free diet based on corn and potato protein isolate was 0.396 g/kg DMI (Exp. 2).
The reason for this difference may be that different ingredients used in a nutrient-free diet may
result in different endogenous losses of nutrients (Boisen and Moughan, 1996).
Experiment 1: Effect of Microbial Phytase on Ca Digestibility in the Absence or the Presence
of Phytate
The reason for the greater feed intake in pigs fed corn-corn germ based diets compared
with pigs fed cornstarch-based diets is that these diets contained less ME than the cornstarch-
based diets and because pigs were fed to the same daily ME intake, more of the corn-corn germ
based diets was provided. The observation that inclusion of microbial phytase increased Ca and
P digestibility in corn-corn germ based diets was expected because phytase hydrolyzes phytate,
which increases the availability of P and Ca to be absorbed (Poulsen et al., 2010; Almeida et al.,
2013; Rodríguez et al., 2013; Almaguer et al., 2014). Because all Ca in the diets was from fish
meal, the increased ATTD of Ca that was observed as phytase was added to the diets indicates
that Ca from fish meal was bound to phytate, which to our knowledge has not been previously
reported. It is, however, not clear why the ATTD and STTD of Ca in the cornstarch diet was
increased by phytase because this diet did not contain phytate. The values for ATTD of Ca in
fish meal that were calculated were close to reported values for ATTD of Ca in diets containing
fish bones fed to pigs (Malde et al., 2010). However, to our knowledge, this is the first time
values for the STTD of Ca in fish meal have been reported.
82
Phytate reduces the digestibility not only of P, but also of Ca (Selle et al., 2009). Pigs fed
corn-soybean meal diets had less ATTD of Ca and P than pigs fed corn grits diets, because of the
greater concentration of phytate in the corn-soybean meal diets than in corn grits diets (Liu et al.,
2014). The ATTD of Ca and P in the corn-corn germ based diets was expected to be less than in
the cornstarch-based diets. However, in contrast with our hypothesis, an increase in ATTD and
STTD of Ca and in the ATTD of P in the corn-corn germ based diet was observed compared
with the cornstarch-based diet. The reason for this observation may be that the fiber in the corn-
corn germ based diet increased the motility in the intestinal tract and thereby enhanced
absorption and reduced precipitation of minerals, but further research is needed to verify this
hypothesis.
Digestibility of Ca and P was possibly increased because of the greater concentration of
fat in the corn-corn germ based diets compared with the cornstarch based diets because dietary
fat may decrease rate of passage, which may enhance the digestibility of nutrients (Cervantes-
Pahm and Stein, 2008; Kil and Stein, 2011). The Ca:STTD P ratio was similar among all diets,
but the Ca:total P ratio was 1.5:1 for the cornstarch-based diets and 1:1 for the corn-corn germ-
based diets. Decreasing the Ca:total P ratio from 1.5:1 to 1:1 may increase the ATTD of Ca and
P in corn-based diets containing microbial phytase (Liu et al., 1998).
Values for the ATTD of P in the corn-corn germ-based diet were a combination of the
ATTD of P in fish meal and the ATTD of P in corn and corn germ. Reported values for the
ATTD of P in fish meal range from 62.7 to 90.0% (Rodehutscord et al., 1997; NRC, 2012;
Sulabo et al., 2013; Kim et al., 2014). In corn, the range in ATTD of P is from 26.0 to 33.5%
(Almeida and Stein, 2012; NRC, 2012; Rojas et al., 2013), and in corn germ, values for ATTD of
P range from 33.0 to 37.3% (Almeida and Stein, 2012; NRC, 2012). Therefore, corn-corn germ
83
based diets were expected to have less ATTD of P than the cornstarch-based diets, because most
of the P in the cornstarch-based diets originated from fish meal. The reason we were not able to
verify this hypothesis is possibly that the lack of fiber in the cornstarch based diets may have
resulted in precipitation of the P from fish meal, which resulted in reduced digestibility in this
diet.
Experiment 2: Effects of Type of Diet, Fiber, and Soybean Oil on Ca Digestibility
Experiment 2 was conducted to elucidate possible reasons for the unexpected results from
Exp. 1, which indicated that the ATTD and STTD of Ca and the ATTD of P are greater in corn-
corn germ based diets than in cornstarch-based diets. Results of Exp. 2 confirmed that values for
ATTD and STTD of Ca and the ATTD of P were greater in the corn-based diets than in the
cornstarch-based diets. The values for ATTD and STTD of Ca (40.42 and 45.64%, respectively)
in fish meal in the cornstarch-based diet obtained in this experiment were close to the values for
ATTD and STTD of Ca (51.22 and 53.87%, respectively) in fish meal observed in Exp. 1. In
contrast the ATTD and STTD of Ca in the corn-based diet was 84.24 and 88.99%, respectively.
Because all Ca in all diets was from fish meal, the difference in ATTD and STTD of Ca
between the 2 types of diets may have been caused by fiber, fat, or other unknown factors. The
fact that fiber (Solka floc) and corn increased the ATTD and STTD of Ca in fish meal by 16.6
and 42.5 percentage units, respectively, indicates that fiber possibly prevented some precipitation
that may have occurred in the cornstarch-based diet. However, Solka floc is 100% cellulose,
which is insoluble fiber, whereas the total dietary fiber in corn is 28% soluble and 72% insoluble
(Jaworski et al., 2015). Fermentation of soluble dietary fiber results in production of short chain
fatty acids, which may contribute to increased mineral absorption due to a reduction in intestinal
pH (Wong et al., 2006; Rose et al., 2007). A low pH may enhance Ca solubility and increase
84
absorption of Ca in rats (Ohta et al., 1995), humans (Coudray et al., 1997), and pigs (Bird et al.,
2000). Synthesis of butyrate may also enhance the growth of epithelial cells in the small and
large intestine, which may further enhance absorption of nutrients (Montagne et al., 2003).
Therefore, the greater digestibility of Ca observed in the corn-based diet compared with the
cornstarch-based diet may be a result of the fermentation of fiber in the corn-based diet.
The high values for STTD of Ca in the corn-based diet indicate that Ca from fish meal
has high digestibility in commercial diets. The calculated value for ATTD of Ca in fish meal in
the cornstarch-fiber diet was in agreement with reported values, but the value in the corn-based
diet was greater than previously reported values of diets containing fish bones (Malde et al.,
2010).
A positive effect of fat on digestibility of AA in pigs has been observed, which is
presumed to be a result of a reduction in the rate of passage (Cervantes-Pahm and Stein, 2008;
Kil and Stein, 2011). However, the effect of fat on ATTD of Ca and P in rats and humans is
variable, because depending on the type of fatty acids, different effects on pH and formation of
Ca soaps have been reported (Boyd et al., 1932; Agnew and Holdsworth, 1971; Wargovich et al.,
1984). In humans, high levels of Ca increased fat excretion (Bendsen et al., 2008), which may
lead to a lower body fat content (Soares et al., 2012). In rats, high dietary fat content decreases
the digestibility of Ca due to formation of Ca soaps (Frommelt et al., 2014). Saturated fat
decreases the absorption of Ca (Gacs and Barltrop, 1977). However, soybean oil is mostly
unsaturated fat, which may results in less Ca soaps being formed. This may be the reason for the
observation in the present experiment indicating that soybean oil did not influence the ATTD and
STTD of Ca or the ATTD of P in pigs.
85
Conclusions
The digestibility of Ca and P in fish meal is less in cornstarch-based diets than in corn-
based diets, but inclusion of microbial phytase in the diet will increase the digestibility of Ca and
P regardless of the type of diet used. Inclusion of synthetic fiber in the cornstarch-based diet
resulted in an increased digestibility of Ca and P, and it is possible that lack of fiber in
cornstarch-based diets results in precipitation of Ca and P in the intestinal tract. Soybean oil did
not affect the ATTD and STTD of Ca or the ATTD of P in fish meal. Due to the negative effect
of cornstarch-based diets on the ATTD and STTD of Ca, it is recommended that Ca digestibility
of feed ingredients should be determined in corn-based diets.
86
LITERATURE CITED
Adeola, O. 2001. Digestion and balance techniques in pigs. In: A. J. Lewis and L. L. Southern,
editors, Swine nutrition. CRC Press, Washington, DC. p. 903-916.
Agnew, J. E., and C. D. Holdsworth. 1971. The effect of fat on calcium absorption from a mixed
meal in normal subjects, patients with malabsorptive disease, and patients with a partial
gastrectomy. Gut. 12:973-977.
Almaguer, B. L., R. C. Sulabo, and H. H. Stein. 2014. Standardized total tract digestibility of
phosphorus in copra meal, palm kernel expellers, palm kernel meal, and soybean meal
fed to growing pigs. J. Anim. Sci. 92:2473-2480.
Almeida, F. N., and H. H. Stein. 2010. Performance and phosphorus balance of pigs fed diets
formulated on the basis of values for standardized total tract digestibility of phosphorus.
J. Anim. Sci. 88:2968-2977.
Almeida, F. N., and H. H. Stein. 2012. Effects of graded levels of microbial phytase on the
standardized total tract digestibility of phosphorus in corn and corn coproducts fed to
pigs. J. Anim. Sci. 90:1262-1269.
Almeida, F. N., R. C. Sulabo, and H. H. Stein. 2013. Effects of a novel bacterial phytase
expressed in Aspergillus Oryzae on digestibility of calcium and phosphorus in diets fed to
weanling or growing pigs. J. Anim. Sci. Biotech. 4:8.
AOAC International. 2007. Official methods of analysis of AOAC Int. 18th ed. Rev. 2. W.
Hortwitz and G. W. Latimer, Jr., eds. AOAC Int., Gaithersburg, MD.
Bendsen, N. T., A-L. Hother, S. K. Jensen, J. K. Lorenzen, and A. Astrup. 2008. Effect of dairy
calcium on fecal fat excretion: A randomized crossover trial. Int. J. Obesity. 32:1816-
1824.
87
Bird, A. R., T. Hayakawa, Y. Marsono, J. M. Gooden, I. R. Record, R. L. Correll, and D. L.
Topping. 2000. Coarse brown rice increases fecal and large bowel short-chain fatty acids
and starch but lowers calcium in the large bowel of pigs. J. Nutr. 130:1780-1787.
Boisen, S., and P. Moughan. 1996. Dietary influences on endogenous ileal protein and amino
acid loss in the pig-A review. Acta Agric. Scand. Sect. A. Anim. Sci. 46:154-164.
Boyd, O. F., C. L. Crum, and J. F. Lyman. 1932. The absorption of calcium soaps and the
relation of dietary fat to calcium utilization in the white rat. J. Biol. Chem. 95:29-41.
Cervantes-Pahm, S. K., and H. H. Stein. 2008. Effect of dietary soybean oil and soybean protein
concentration on the concentration of digestible amino acids in soybean products fed to
growing pigs. J. Anim. Sci. 86:1841-1849.
Cervantes-Pahm, S. K., and H. H. Stein. 2010. Ileal digestibility of amino acids in conventional,
fermented, and enzyme-treated soybean meal and in soy protein isolate, fish meal, and
casein fed to weanling pigs. J. Anim. Sci. 88:2674-2683.
Coudray, C., J. Bellanger, C. Castiglia-Delavaud, C. Rémésy, M. Vermorel, and Y.
Rayssignuier. 1997. Effects of soluble or partly soluble dietary fibres supplementation on
absorption and balance of calcium, magnesium, iron and zinc in healthy young men. Eur.
J. Clin. Nutr. 51: 375-380.
Ellis, R., E. R. Morris, and C. Philpot. 1977. Quantitative determination of phytate in the
presence of high inorganic phosphate. Anal. Biochem. 77:536-539.
Engelen, A. J., F. C. van der Heeft, P. H. G. Ransdorp, W. A. C. Somers, J. Schaefer, and J. C.
van der Vat. 2001. Determination of phytase activity in feed by a colorimetric enzymatic
method: Collaborative interlaboratory study. J. AOAC Int. 84:629–633.
88
Frommelt, L., M. Bielohuby, B. J. M. Stoehr, D. Menhofer, M. Bidlingmaier, and E. Kienzle.
2014. Effects of low-carbohydrate, high-fat diets on apparent digestibility of minerals and
trace elements in rats. Nutrition. 30:869-875.
Gacs, G., and D. Barltrop. 1977. Significance of Ca-soap formation for calcium absorption in rat.
Gut. 18:64-68.
González-Vega, J. C., C. L. Walk, Y. Liu, and H. H. Stein. 2013. Determination of endogenous
intestinal losses of Ca and true total tract digestibility of calcium in canola meal fed to
growing pigs. J. Anim. Sci. 91:4807-4816.
González-Vega, J. C., C. L. Walk, Y. Liu, and H. H. Stein. 2014. The site of net absorption of Ca
from the intestinal tract of growing pigs and effect of phytic acid, Ca level and Ca source
on Ca digestibility. Arch. Anim. Nutr. 68:126-142.
González-Vega, J. C., C. L. Walk, and H. H. Stein. 2015. Effects of microbial phytase on
apparent and standardized total tract digestibility of calcium in calcium supplements fed
to growing pigs. J. Anim. Sci. 93:2255-2264.
Grieshop, C. M., D. E. Reese, and G. C. Fahey, Jr. 2001. Nonstarch polysaccharides and
oligosaccharides in swine nutrition. In: A. J. Lewis and L. L. Southern, editors, Swine
nutrition. CRC Press, Washington, DC. p. 107-130.
Holst, D. O. 1973. Holst filtration apparatus for Van Soest detergent fiber analysis. J. AOAC.
56:1352-1356.
Jaworski, N. W., H. N. Lærke, K. E. Bach Knudsen, and H. H. Stein. 2015. Carbohydrate
composition and in vitro digestibility of dry matter and non-starch polysaccharides in
corn, sorghum, and wheat, and co-products from these grains. J. Anim. Sci. 93: 1103-
1113.
89
Kil, D. Y., and H. H. Stein. 2011. Dietary soybean oil and choice white grease improve apparent
ileal digestibility of amino acids in swine diets containing corn, soybean meal, and
distillers dried grains with solubles. Rev. Colomb. Cienc. Pecu. 24:248-253.
Kim, B. G., and M. D. Lindemann. 2007. A new spreadsheet method for the experimental animal
allotment. J. Anim. Sci. 85 (Suppl. 2):218. (Abstr.)
Kim B. G., Y. Liu, and H. H. Stein. 2014. Energy concentration and phosphorus digestibility in
yeast products produced from the ethanol industry, and in brewers’ yeast, fish meal, and
soybean meal fed to growing pigs. J. Anim. Sci. 92:5476-5484.
Liu, J., D. W. Bollinger, D. R. Ledoux, and T. L. Veum. 1998. Lowering the dietary calcium to
total phosphorus ratio increases phosphorus utilization in low-phosphorus corn-soybean
meal diets supplemented with microbial phytase for growing-finishing pigs. J. Anim. Sci.
76:808-813.
Liu, Y., Y. L. Ma, J. M. Zhao, M. Vazquez-Añón, and H. H. Stein. 2014. Digestibility and
retention of zinc, copper, manganese, iron, calcium, and phosphorus in pigs fed diets
containing inorganic or organic minerals. J. Anim. Sci. 92:3407-3415.
Ma, Q. G., B. U. Metzler, M. Eklund, C. Ji, and R. Mosenthin. 2008. The effects of cellulose,
pectin and starch on standardized ileal and apparent toal tract amino acid digestibilities
and bacterial contribution of amino acids in feces of growing pigs. Asian-Aust. J. Anim.
Sci. 21: 873-882.
Malde, M. K., I. E. Graff, H. Siljander-Rasi, E. Venäläinen, K. Julshamn, J. I. Pedersen, and J.
Valaja. 2010. Fish bones – A highly available calcium source for growing pigs. J. Anim.
Physiol. Anim. Nutr. 94:e66-e76.
Montagne, L., J. R. Pluske, D. J. Hampson. 2003. A review of interactions between dietary fibre
90
and the intestinal mucosa, and their consequences on digestive health in young non-
ruminant animals. Anim. Feed Sci. Technol. 108: 95-117.
NRC. 2012. Nutrient requirements of swine. 11th rev. ed. Natl. Acad. Press, Washington, DC.
Ohta, A., M. Ohtsuki, S. Baba, T. Takizawa, T. Adachi, and S. Kimura. 1995. Effects of
fructooligosaccharides on the absorption of iron, calcium and magnesium in iron-
deficient rats. J. Nutr. Sci. Vitaminol. 41: 281-291.
Onyango, E. M., E. K. Asem, and O. Adeola. 2008. Phytic acid increases mucin and endogenous
amino acid losses from the gastrointestinal tract of chickens. Br. J. Nutr. 101:836-842.
Poulsen, H. D., D. Carlson, J. V. Nørgaard, and K. Blaabjerg. 2010. Phosphorus digestibility is
highly influenced by phytase but slightly by calcium in growing pigs. Livest. Sci.
134:100-102.
Rodehutscord, M., M. Faust, and C. Hof. 1997. Digestibility of phosphorus in protein-rich
ingredients for pig diets. Arch. Tierernahr. 50:201-211.
Rodríguez, D. A., R. C. Sulabo, J. C. González-Vega, and H. H. Stein. 2013. Energy
concentration and phosphorus digestibility in canola, cottonseed, and sunflower products
fed to growing pigs. Can. J. Anim. Sci. 93:493-503.
Rojas, O. J., Y. Liu, and H. H. Stein. 2013. Phosphorus digestibility and concentration of
digestible and metabolizable energy in corn, corn coproducts, and bakery meal fed to
growing pigs. J. Anim. Sci. 91:5326-5335.
Rojas, O. J., and H. H. Stein. 2013. Concentration of digestible, metabolizable, and net energy
and digestibility of energy and nutrients in fermented soybean meal, conventional
soybean meal, and fish meal fed to weanling pigs. J. Anim. Sci. 91:4397-4405.
Rose, D. J., M. R. DeMeo, A. Keshavarzian, and B. R. Hamaker. 2007. Influence of dietary fiber
91
on inflammatory bowel disease and colon cancer: Importance of fermentation pattern.
Nutr. Rev. 65:51-62.
Rostagno, H. S., L. F. T. Albino, J. L. Donzele, P. C. Gomes, R. F. de Oliveira, D. C. Lopes, A.
S. Ferreira, S. L. T. Barreto, R. F. Euclides. 2011. Brazilian tables for poultry and swine.
H. S. Rostagno. 3rd. ed. Universidade Federal de Viçosa, Viçosa, BR.
Sanderson, P. 1986. A new method of analysis of feedingstuffs for the determination of crude
oils and fats. In: W. Haresign and D. J. A. Cole, editors, Recent advances in animal
nutrition. Butterworths, London, U.K. p. 77-81.
Sauvant, D., J.-M. Perez, and G. Tran. 2004. Tables of composition and nutritional value of feed
materials: Pigs, Poultry, Cattle, Sheep, Goats, Rabbits, Horses, Fish. D. Sauvant, J. M.
Pérez, and G. Tran, ed. Institut National de la Recherche Agronomique, Association
Française de Zootechnie, Paris, France.
Selle, P. H., A. J. Cowieson, and V. Ravindran. 2009. Consequences of calcium interactions with
phytate and phytase for poultry and pigs. Livest. Sci. 124:126-141.
Soares, M. J., L. L. Murhadi, A. V. Kurpad, W. L. Chan She Ping-Delfos, and L. S. Piers. 2012.
Mechanistic roles for calcium and vitamin D in the regulation of body weight. Obes. Rev.
13:592-605.
Sulabo, R. C., J. K. Mathai, J. L. Usry, B. W. Ratliff, D. M. McKilligan, J. D. Moline, G. Xu,
and H. H. Stein. 2013. Nutritional value of dried fermentation biomass, hydrolyzed
porcine intestinal mucosa products, and fish meal fed to weanling pigs. J. Anim. Sci.
91:2802-2811.
Tran, G., and D. Sauvant. 2004. Chemical data and nutritional value. Pages 17-24 in Tables of
composition and nutritional value of feed materials: pig, poultry, sheep, goats, rabbits,
92
horses, fish. D. Sauvant, J.-M. Perez, and G. Tran. 2nd ed. Wageningen Academic
Publishers, Wageningen, the Netherlands.
Wargovich, M. J., V. W. S. Eng, and H. L. Newmark. 1984. Calcium inhibits the damaging and
compensatory proliferation effects of fatty acids on mouse colon epithelium. Cancer Lett.
23:253-258.
Wong, J. M. W., R. de Souza, C. W. C. Kendall, A. Emam, and D. J. A. Jenkins. 2006. Colonic
health: Fermentation and short chain fatty acids. J. Clin. Gastroenterol. 40:235-243.
Zhang, W., D. Li, L. Liu, J. Zang, Q. Duan, W. Yang, and L. Zhang. 2013. The effects of dietary
fiber level on nutrient digestibility in growing pigs. J. Anim. Sci. Biotechnol. 4:17.
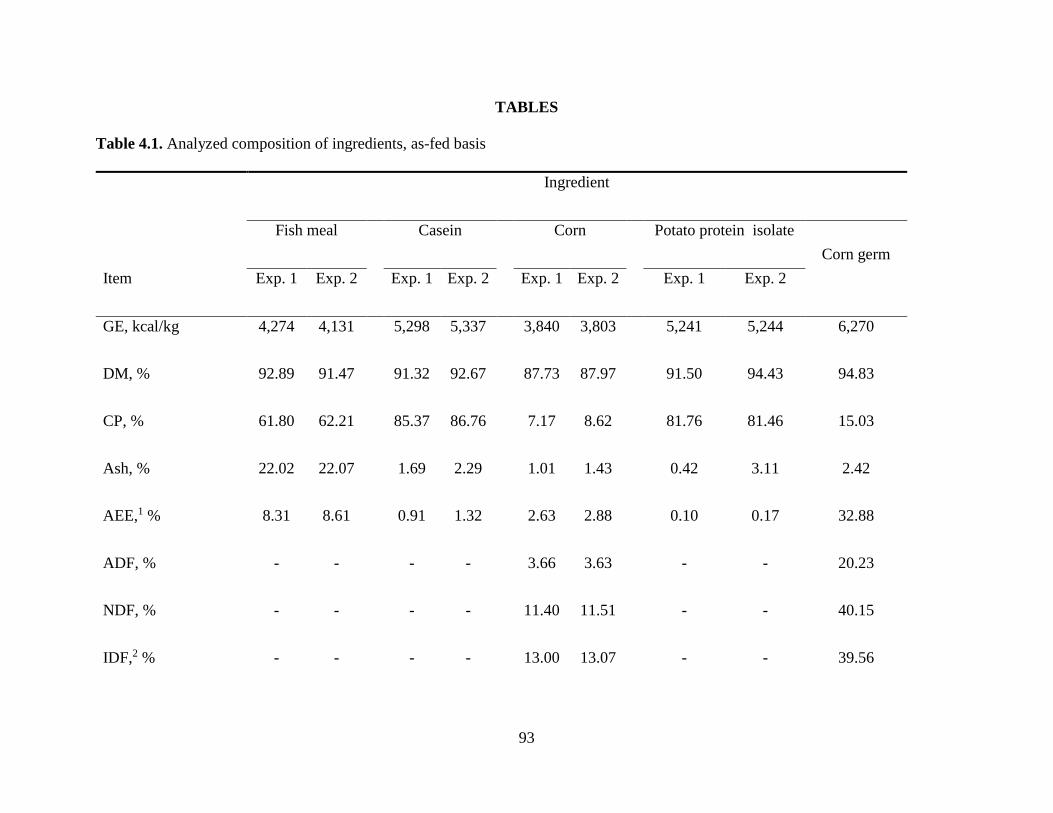
93
TABLES
Table 4.1. Analyzed composition of ingredients, as-fed basis
Ingredient
Fish meal Casein Corn Potato protein isolate Corn germ
Item Exp. 1 Exp. 2 Exp. 1 Exp. 2 Exp. 1 Exp. 2 Exp. 1 Exp. 2
GE, kcal/kg 4,274 4,131 5,298 5,337 3,840 3,803 5,241 5,244 6,270
DM, % 92.89 91.47 91.32 92.67 87.73 87.97 91.50 94.43 94.83
CP, % 61.80 62.21 85.37 86.76 7.17 8.62 81.76 81.46 15.03
Ash, % 22.02 22.07 1.69 2.29 1.01 1.43 0.42 3.11 2.42
AEE,1 % 8.31 8.61 0.91 1.32 2.63 2.88 0.10 0.17 32.88
ADF, % - - - - 3.66 3.63 - - 20.23
NDF, % - - - - 11.40 11.51 - - 40.15
IDF,2 % - - - - 13.00 13.07 - - 39.56
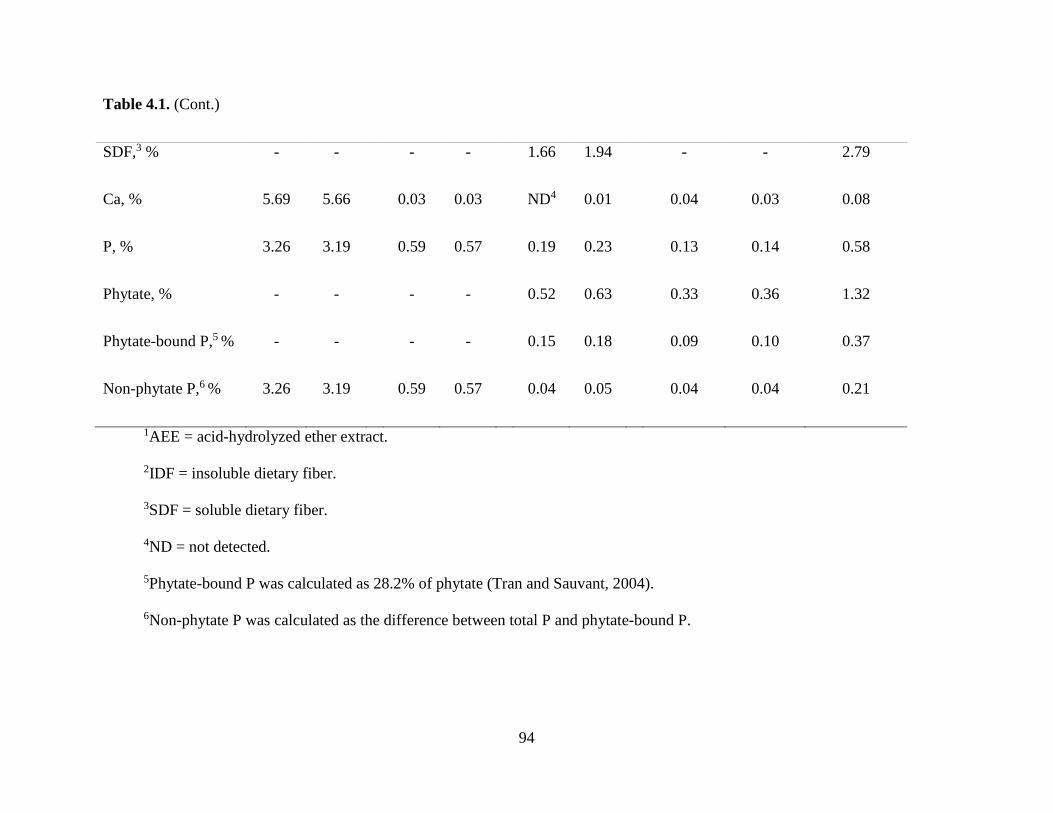
94
Table 4.1. (Cont.)
SDF,3 % - - - - 1.66 1.94 - - 2.79
Ca, % 5.69 5.66 0.03 0.03 ND4 0.01 0.04 0.03 0.08
P, % 3.26 3.19 0.59 0.57 0.19 0.23 0.13 0.14 0.58
Phytate, % - - - - 0.52 0.63 0.33 0.36 1.32
Phytate-bound P,5 % - - - - 0.15 0.18 0.09 0.10 0.37
Non-phytate P,6 % 3.26 3.19 0.59 0.57 0.04 0.05 0.04 0.04 0.21
1AEE = acid-hydrolyzed ether extract.
2IDF = insoluble dietary fiber.
3SDF = soluble dietary fiber.
4ND = not detected.
5Phytate-bound P was calculated as 28.2% of phytate (Tran and Sauvant, 2004).
6Non-phytate P was calculated as the difference between total P and phytate-bound P.
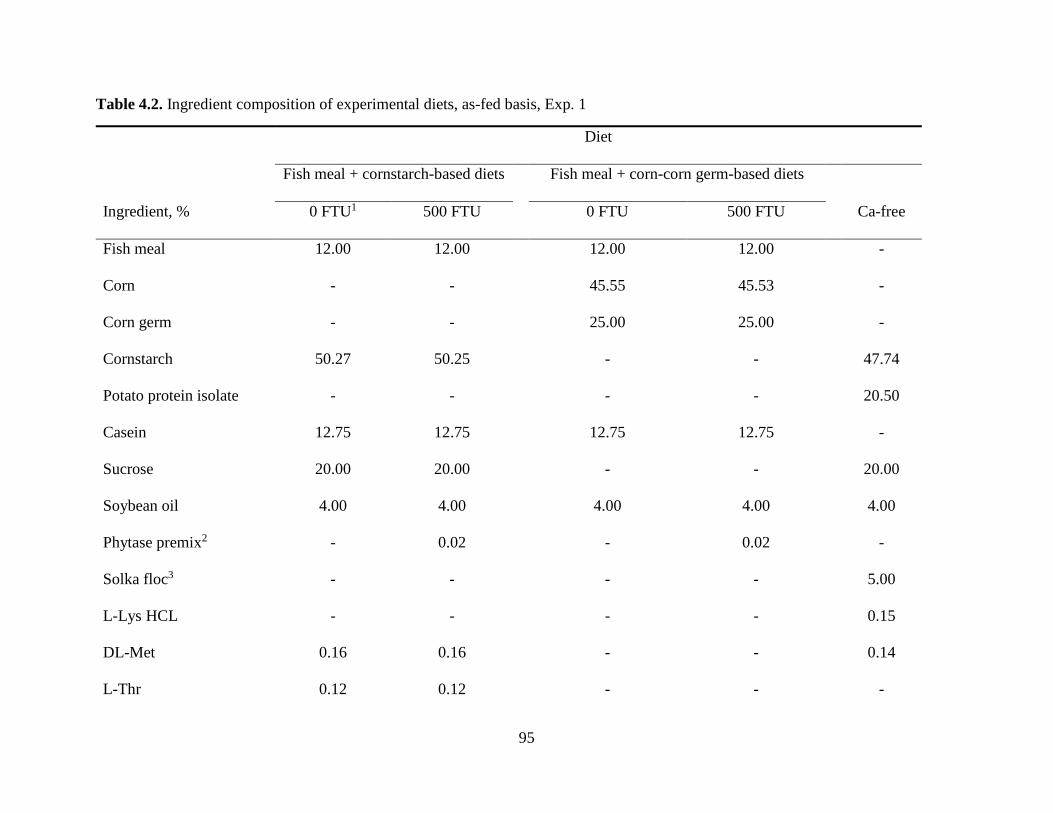
95
Table 4.2. Ingredient composition of experimental diets, as-fed basis, Exp. 1
Diet
Fish meal + cornstarch-based diets Fish meal + corn-corn germ-based diets
Ingredient, % 0 FTU1 500 FTU 0 FTU 500 FTU Ca-free
Fish meal 12.00 12.00 12.00 12.00 -
Corn - - 45.55 45.53 -
Corn germ - - 25.00 25.00 -
Cornstarch 50.27 50.25 - - 47.74
Potato protein isolate - - - - 20.50
Casein 12.75 12.75 12.75 12.75 -
Sucrose 20.00 20.00 - - 20.00
Soybean oil 4.00 4.00 4.00 4.00 4.00
Phytase premix2 - 0.02 - 0.02 -
Solka floc3 - - - - 5.00
L-Lys HCL - - - - 0.15
DL-Met 0.16 0.16 - - 0.14
L-Thr 0.12 0.12 - - -
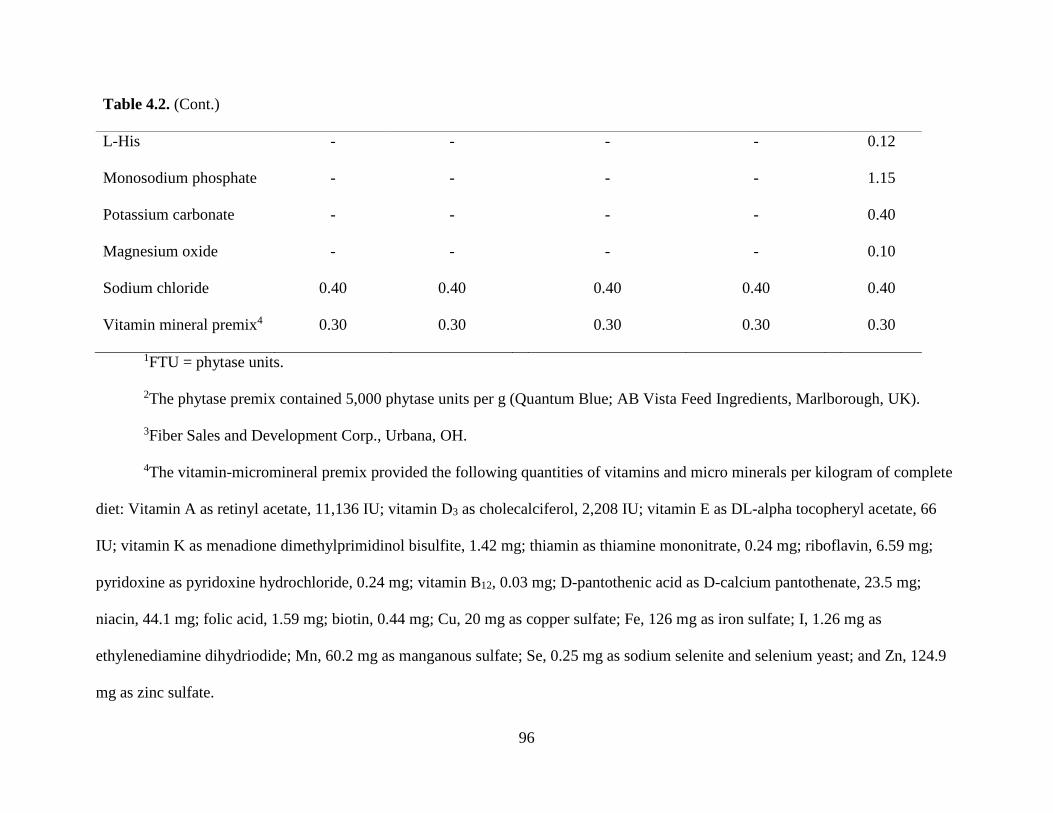
96
Table 4.2. (Cont.)
L-His - - - - 0.12
Monosodium phosphate - - - - 1.15
Potassium carbonate - - - - 0.40
Magnesium oxide - - - - 0.10
Sodium chloride 0.40 0.40 0.40 0.40 0.40
Vitamin mineral premix4 0.30 0.30 0.30 0.30 0.30
1FTU = phytase units.
2The phytase premix contained 5,000 phytase units per g (Quantum Blue; AB Vista Feed Ingredients, Marlborough, UK).
3Fiber Sales and Development Corp., Urbana, OH.
4The vitamin-micromineral premix provided the following quantities of vitamins and micro minerals per kilogram of complete
diet: Vitamin A as retinyl acetate, 11,136 IU; vitamin D3 as cholecalciferol, 2,208 IU; vitamin E as DL-alpha tocopheryl acetate, 66
IU; vitamin K as menadione dimethylprimidinol bisulfite, 1.42 mg; thiamin as thiamine mononitrate, 0.24 mg; riboflavin, 6.59 mg;
pyridoxine as pyridoxine hydrochloride, 0.24 mg; vitamin B12, 0.03 mg; D-pantothenic acid as D-calcium pantothenate, 23.5 mg;
niacin, 44.1 mg; folic acid, 1.59 mg; biotin, 0.44 mg; Cu, 20 mg as copper sulfate; Fe, 126 mg as iron sulfate; I, 1.26 mg as
ethylenediamine dihydriodide; Mn, 60.2 mg as manganous sulfate; Se, 0.25 mg as sodium selenite and selenium yeast; and Zn, 124.9
mg as zinc sulfate.
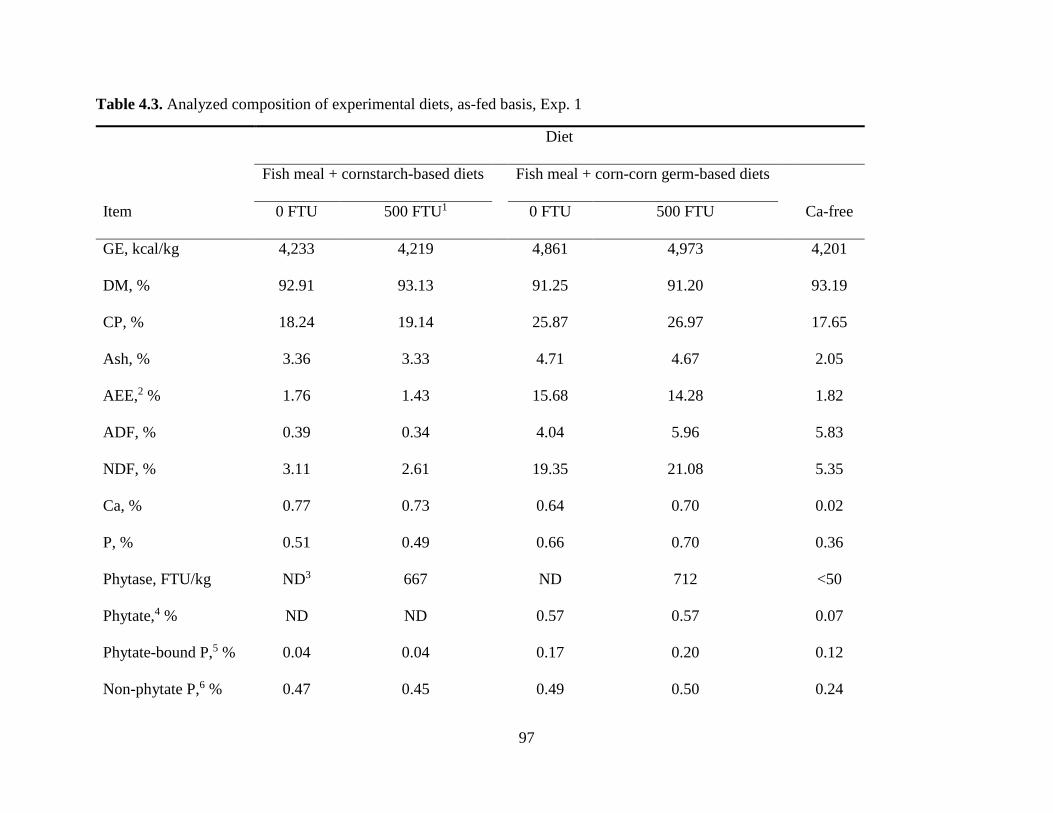
97
Table 4.3. Analyzed composition of experimental diets, as-fed basis, Exp. 1
Diet
Fish meal + cornstarch-based diets Fish meal + corn-corn germ-based diets
Item 0 FTU 500 FTU1 0 FTU 500 FTU Ca-free
GE, kcal/kg 4,233 4,219 4,861 4,973 4,201
DM, % 92.91 93.13 91.25 91.20 93.19
CP, % 18.24 19.14 25.87 26.97 17.65
Ash, % 3.36 3.33 4.71 4.67 2.05
AEE,2 % 1.76 1.43 15.68 14.28 1.82
ADF, % 0.39 0.34 4.04 5.96 5.83
NDF, % 3.11 2.61 19.35 21.08 5.35
Ca, % 0.77 0.73 0.64 0.70 0.02
P, % 0.51 0.49 0.66 0.70 0.36
Phytase, FTU/kg ND3 667 ND 712 <50
Phytate,4 % ND ND 0.57 0.57 0.07
Phytate-bound P,5 % 0.04 0.04 0.17 0.20 0.12
Non-phytate P,6 % 0.47 0.45 0.49 0.50 0.24
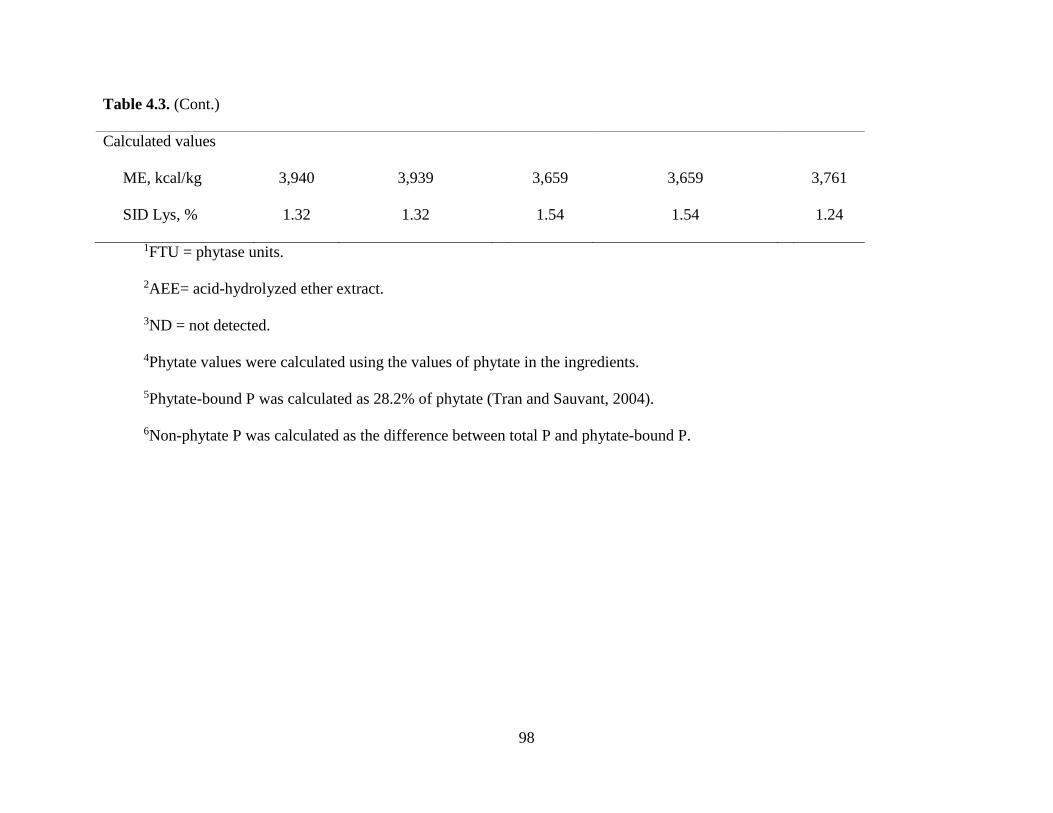
98
Table 4.3. (Cont.)
Calculated values
ME, kcal/kg 3,940 3,939 3,659 3,659 3,761
SID Lys, % 1.32 1.32 1.54 1.54 1.24
1FTU = phytase units.
2AEE= acid-hydrolyzed ether extract.
3ND = not detected.
4Phytate values were calculated using the values of phytate in the ingredients.
5Phytate-bound P was calculated as 28.2% of phytate (Tran and Sauvant, 2004).
6Non-phytate P was calculated as the difference between total P and phytate-bound P.
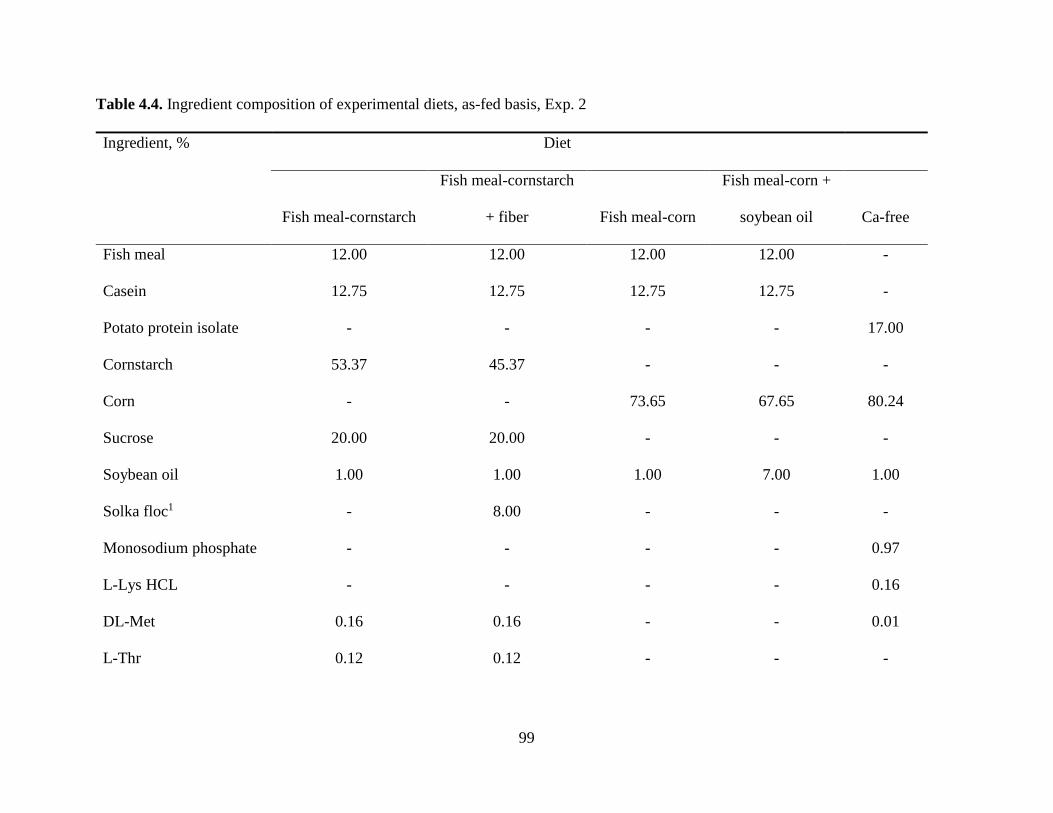
99
Table 4.4. Ingredient composition of experimental diets, as-fed basis, Exp. 2
Ingredient, % Diet
Fish meal-cornstarch
Fish meal-cornstarch
+ fiber Fish meal-corn
Fish meal-corn +
soybean oil Ca-free
Fish meal 12.00 12.00 12.00 12.00 -
Casein 12.75 12.75 12.75 12.75 -
Potato protein isolate - - - - 17.00
Cornstarch 53.37 45.37 - - -
Corn - - 73.65 67.65 80.24
Sucrose 20.00 20.00 - - -
Soybean oil 1.00 1.00 1.00 7.00 1.00
Solka floc1 - 8.00 - - -
Monosodium phosphate - - - - 0.97
L-Lys HCL - - - - 0.16
DL-Met 0.16 0.16 - - 0.01
L-Thr 0.12 0.12 - - -
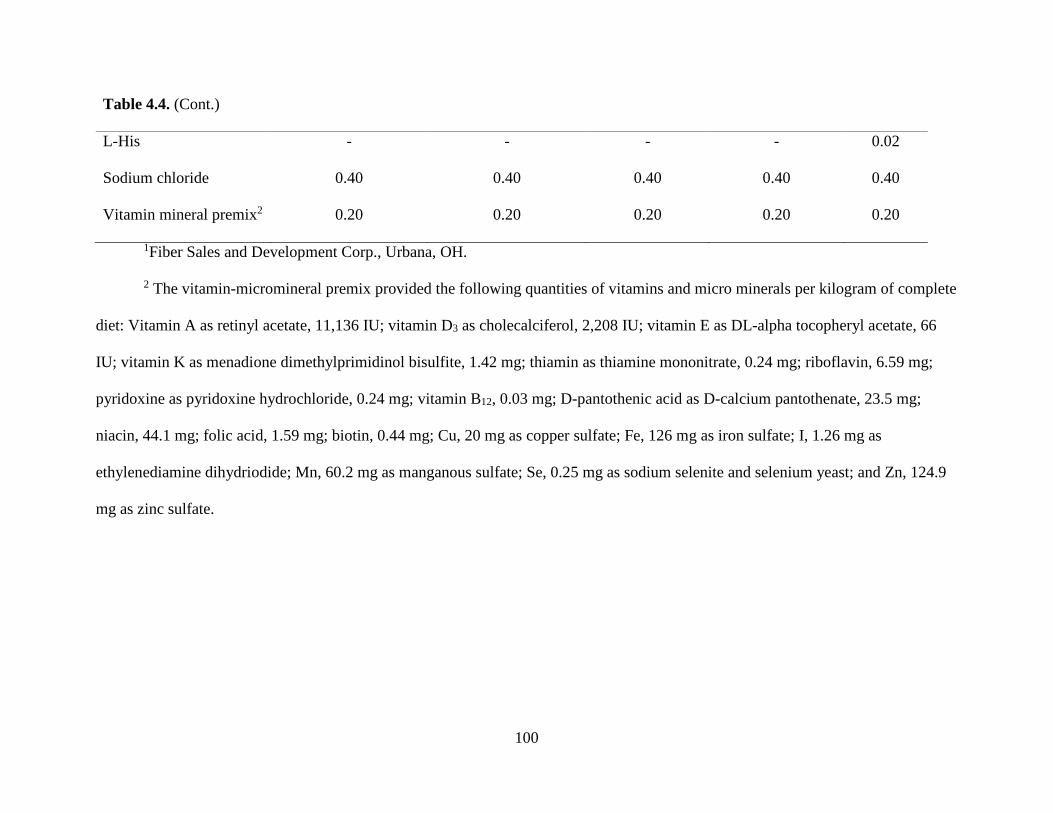
100
Table 4.4. (Cont.)
L-His - - - - 0.02
Sodium chloride 0.40 0.40 0.40 0.40 0.40
Vitamin mineral premix2 0.20 0.20 0.20 0.20 0.20
1Fiber Sales and Development Corp., Urbana, OH.
2 The vitamin-micromineral premix provided the following quantities of vitamins and micro minerals per kilogram of complete
diet: Vitamin A as retinyl acetate, 11,136 IU; vitamin D3 as cholecalciferol, 2,208 IU; vitamin E as DL-alpha tocopheryl acetate, 66
IU; vitamin K as menadione dimethylprimidinol bisulfite, 1.42 mg; thiamin as thiamine mononitrate, 0.24 mg; riboflavin, 6.59 mg;
pyridoxine as pyridoxine hydrochloride, 0.24 mg; vitamin B12, 0.03 mg; D-pantothenic acid as D-calcium pantothenate, 23.5 mg;
niacin, 44.1 mg; folic acid, 1.59 mg; biotin, 0.44 mg; Cu, 20 mg as copper sulfate; Fe, 126 mg as iron sulfate; I, 1.26 mg as
ethylenediamine dihydriodide; Mn, 60.2 mg as manganous sulfate; Se, 0.25 mg as sodium selenite and selenium yeast; and Zn, 124.9
mg as zinc sulfate.
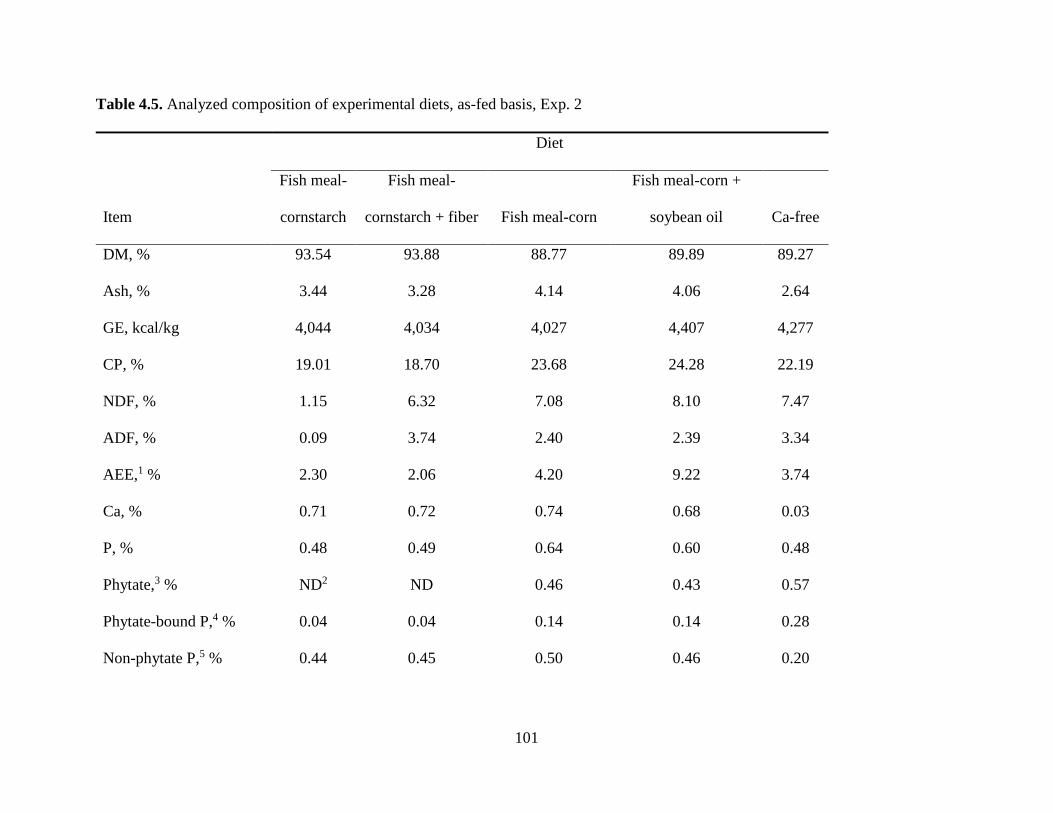
101
Table 4.5. Analyzed composition of experimental diets, as-fed basis, Exp. 2
Diet
Item
Fish meal-
cornstarch
Fish meal-
cornstarch + fiber Fish meal-corn
Fish meal-corn +
soybean oil Ca-free
DM, % 93.54 93.88 88.77 89.89 89.27
Ash, % 3.44 3.28 4.14 4.06 2.64
GE, kcal/kg 4,044 4,034 4,027 4,407 4,277
CP, % 19.01 18.70 23.68 24.28 22.19
NDF, % 1.15 6.32 7.08 8.10 7.47
ADF, % 0.09 3.74 2.40 2.39 3.34
AEE,1 % 2.30 2.06 4.20 9.22 3.74
Ca, % 0.71 0.72 0.74 0.68 0.03
P, % 0.48 0.49 0.64 0.60 0.48
Phytate,3 % ND2 ND 0.46 0.43 0.57
Phytate-bound P,4 % 0.04 0.04 0.14 0.14 0.28
Non-phytate P,5 % 0.44 0.45 0.50 0.46 0.20
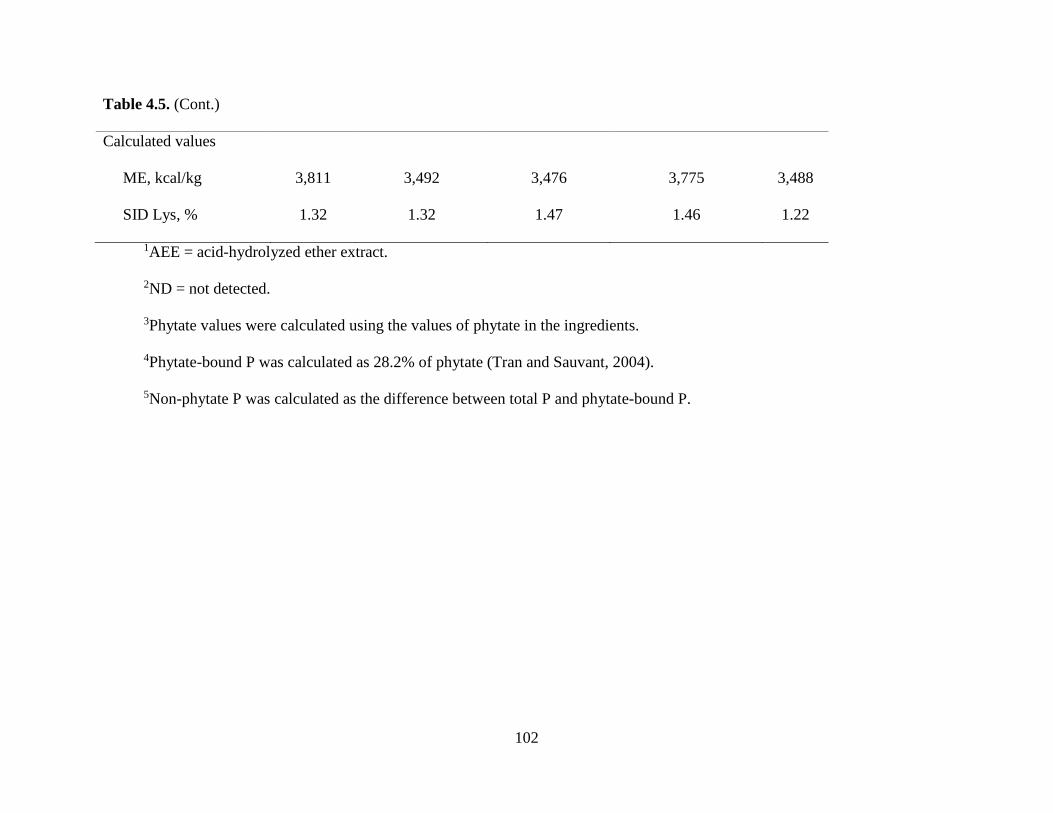
102
Table 4.5. (Cont.)
Calculated values
ME, kcal/kg 3,811 3,492 3,476 3,775 3,488
SID Lys, % 1.32 1.32 1.47 1.46 1.22
1AEE = acid-hydrolyzed ether extract.
2ND = not detected.
3Phytate values were calculated using the values of phytate in the ingredients.
4Phytate-bound P was calculated as 28.2% of phytate (Tran and Sauvant, 2004).
5Non-phytate P was calculated as the difference between total P and phytate-bound P.
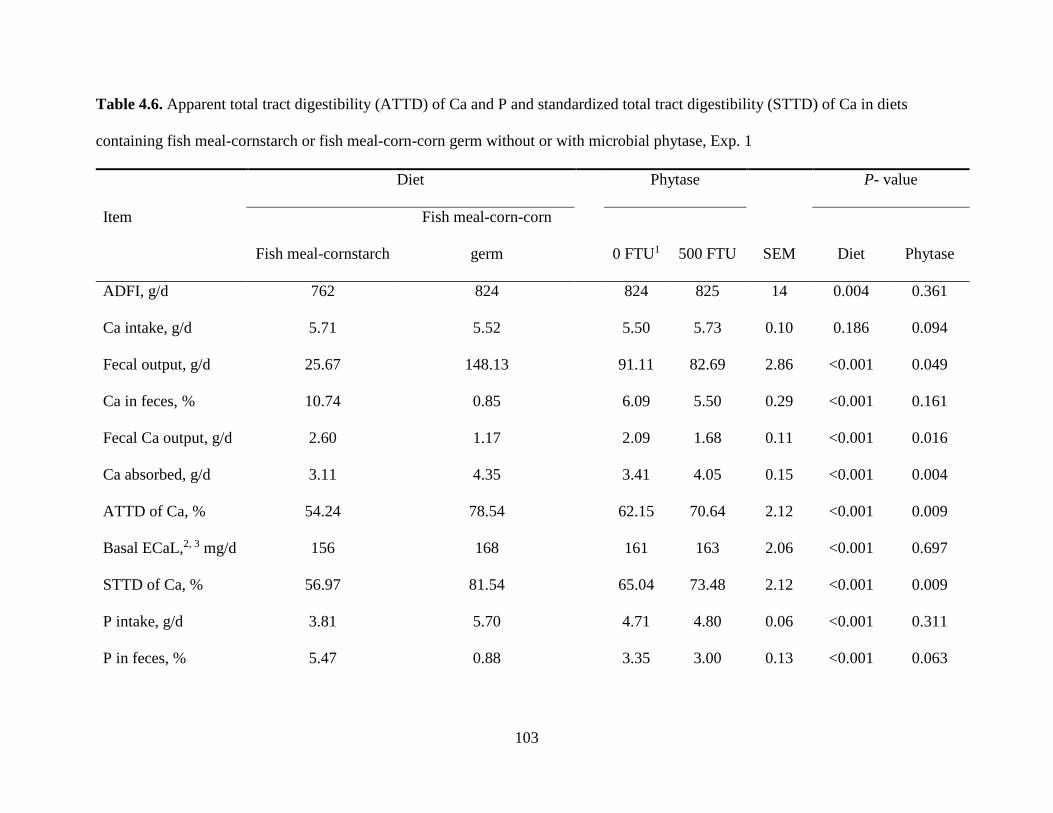
103
Table 4.6. Apparent total tract digestibility (ATTD) of Ca and P and standardized total tract digestibility (STTD) of Ca in diets
containing fish meal-cornstarch or fish meal-corn-corn germ without or with microbial phytase, Exp. 1
Diet Phytase P- value
Item
Fish meal-cornstarch
Fish meal-corn-corn
germ
0 FTU1 500 FTU SEM Diet Phytase
ADFI, g/d 762 824 824 825 14 0.004 0.361
Ca intake, g/d 5.71 5.52 5.50 5.73 0.10 0.186 0.094
Fecal output, g/d 25.67 148.13 91.11 82.69 2.86 <0.001 0.049
Ca in feces, % 10.74 0.85 6.09 5.50 0.29 <0.001 0.161
Fecal Ca output, g/d 2.60 1.17 2.09 1.68 0.11 <0.001 0.016
Ca absorbed, g/d 3.11 4.35 3.41 4.05 0.15 <0.001 0.004
ATTD of Ca, % 54.24 78.54 62.15 70.64 2.12 <0.001 0.009
Basal ECaL,2, 3 mg/d 156 168 161 163 2.06 <0.001 0.697
STTD of Ca, % 56.97 81.54 65.04 73.48 2.12 <0.001 0.009
P intake, g/d 3.81 5.70 4.71 4.80 0.06 <0.001 0.311
P in feces, % 5.47 0.88 3.35 3.00 0.13 <0.001 0.063
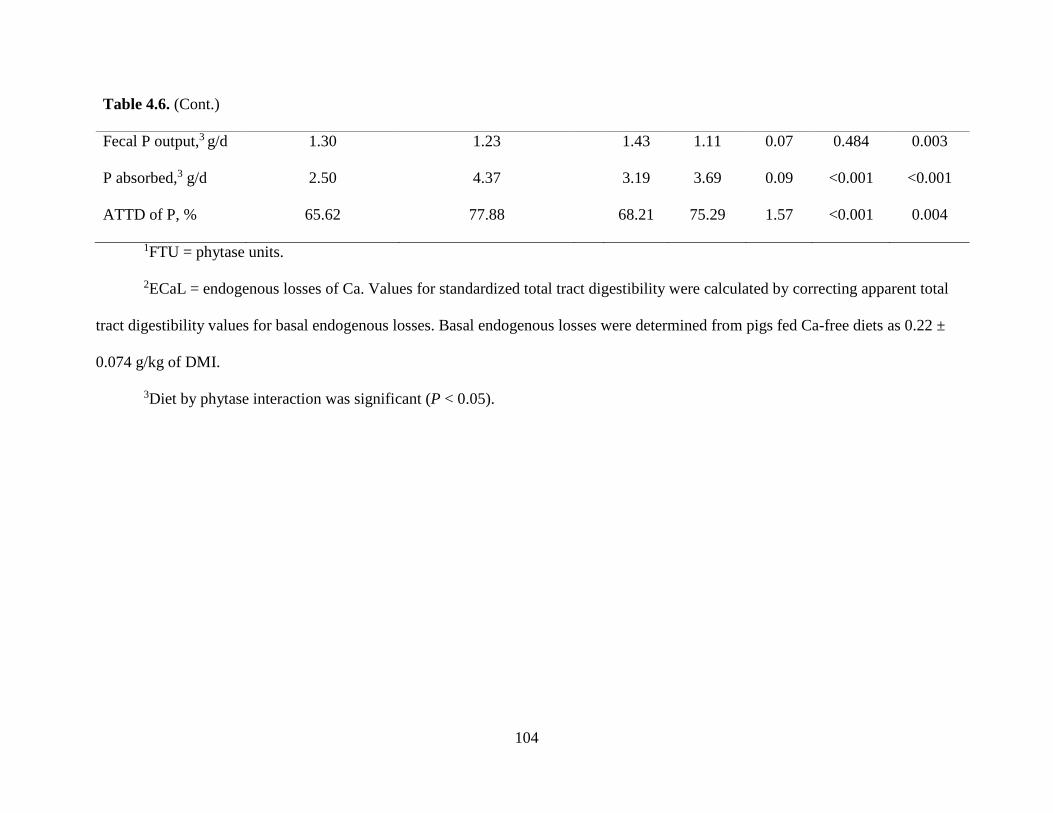
104
Table 4.6. (Cont.)
Fecal P output,3 g/d 1.30 1.23 1.43 1.11 0.07 0.484 0.003
P absorbed,3 g/d 2.50 4.37 3.19 3.69 0.09 <0.001 <0.001
ATTD of P, % 65.62 77.88 68.21 75.29 1.57 <0.001 0.004
1FTU = phytase units.
2ECaL = endogenous losses of Ca. Values for standardized total tract digestibility were calculated by correcting apparent total
tract digestibility values for basal endogenous losses. Basal endogenous losses were determined from pigs fed Ca-free diets as 0.22 ±
0.074 g/kg of DMI.
3Diet by phytase interaction was significant (P < 0.05).
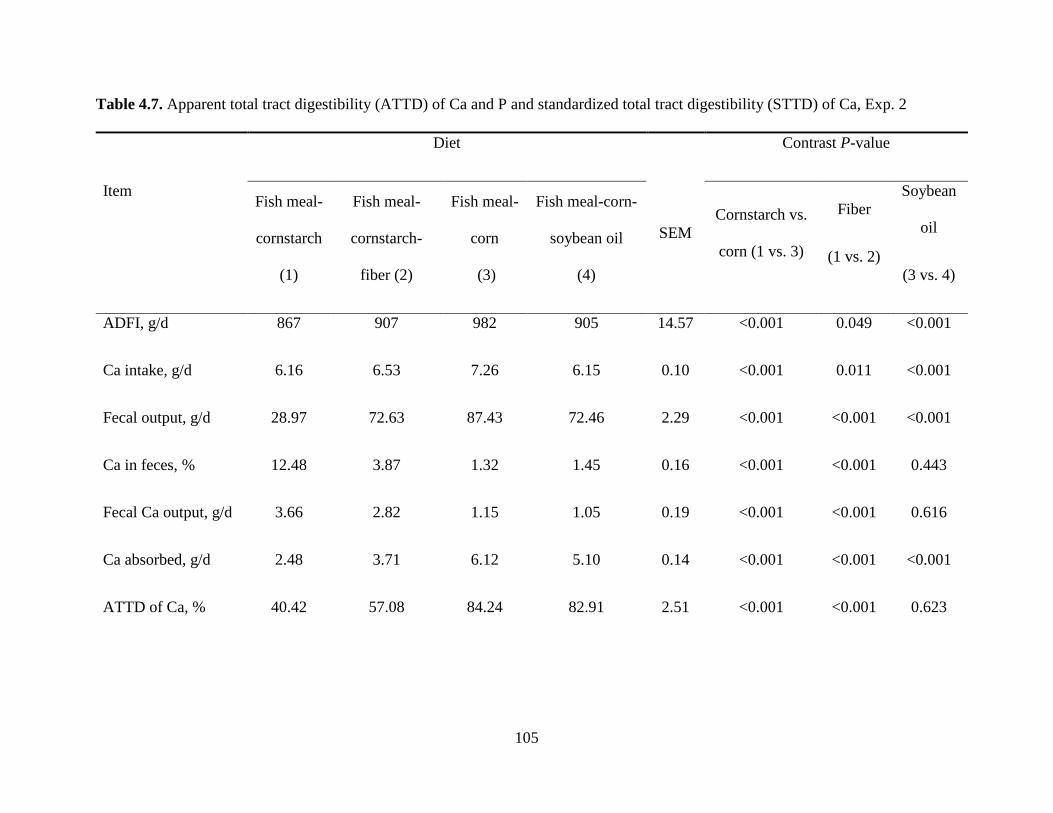
105
Table 4.7. Apparent total tract digestibility (ATTD) of Ca and P and standardized total tract digestibility (STTD) of Ca, Exp. 2
Diet Contrast P-value
Item Fish meal-
cornstarch
(1)
Fish meal-
cornstarch-
fiber (2)
Fish meal-
corn
(3)
Fish meal-corn-
soybean oil
(4)
SEM Cornstarch vs.
corn (1 vs. 3)
Fiber
(1 vs. 2)
Soybean
oil
(3 vs. 4)
ADFI, g/d 867 907 982 905 14.57 <0.001 0.049 <0.001
Ca intake, g/d 6.16 6.53 7.26 6.15 0.10 <0.001 0.011 <0.001
Fecal output, g/d 28.97 72.63 87.43 72.46 2.29 <0.001 <0.001 <0.001
Ca in feces, % 12.48 3.87 1.32 1.45 0.16 <0.001 <0.001 0.443
Fecal Ca output, g/d 3.66 2.82 1.15 1.05 0.19 <0.001 <0.001 0.616
Ca absorbed, g/d 2.48 3.71 6.12 5.10 0.14 <0.001 <0.001 <0.001
ATTD of Ca, % 40.42 57.08 84.24 82.91 2.51 <0.001 <0.001 0.623
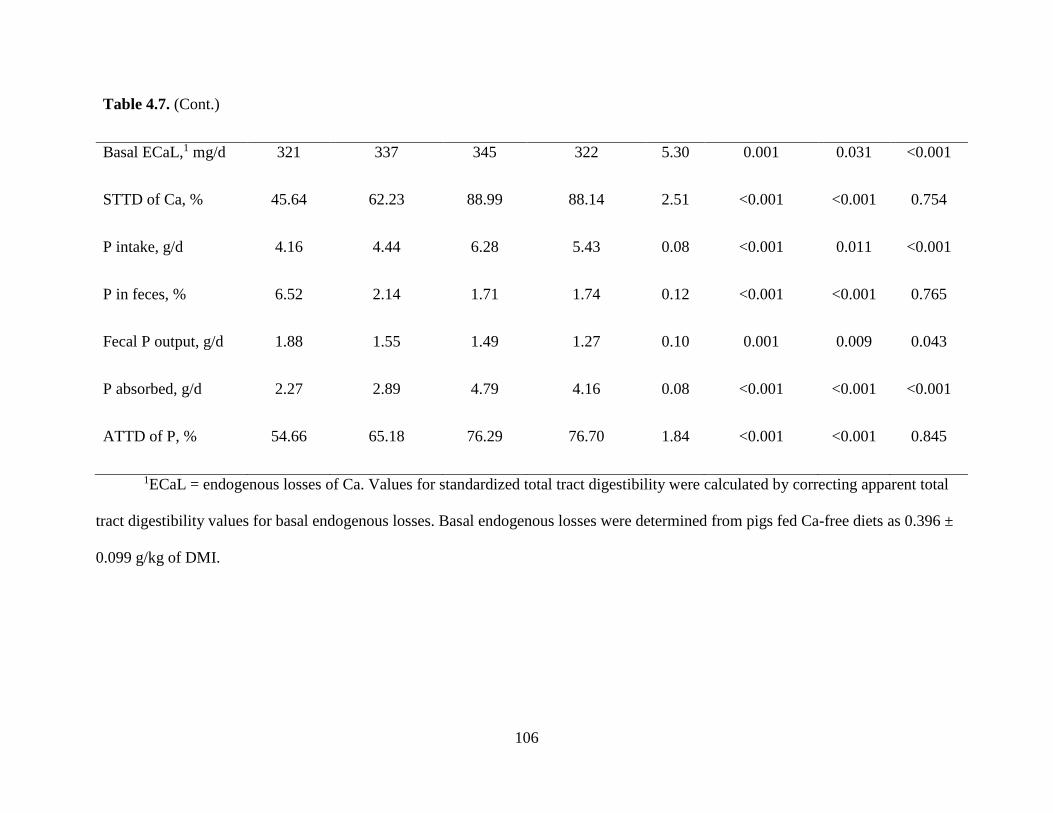
106
Table 4.7. (Cont.)
Basal ECaL,1 mg/d 321 337 345 322 5.30 0.001 0.031 <0.001
STTD of Ca, % 45.64 62.23 88.99 88.14 2.51 <0.001 <0.001 0.754
P intake, g/d 4.16 4.44 6.28 5.43 0.08 <0.001 0.011 <0.001
P in feces, % 6.52 2.14 1.71 1.74 0.12 <0.001 <0.001 0.765
Fecal P output, g/d 1.88 1.55 1.49 1.27 0.10 0.001 0.009 0.043
P absorbed, g/d 2.27 2.89 4.79 4.16 0.08 <0.001 <0.001 <0.001
ATTD of P, % 54.66 65.18 76.29 76.70 1.84 <0.001 <0.001 0.845
1ECaL = endogenous losses of Ca. Values for standardized total tract digestibility were calculated by correcting apparent total
tract digestibility values for basal endogenous losses. Basal endogenous losses were determined from pigs fed Ca-free diets as 0.396 ±
0.099 g/kg of DMI.
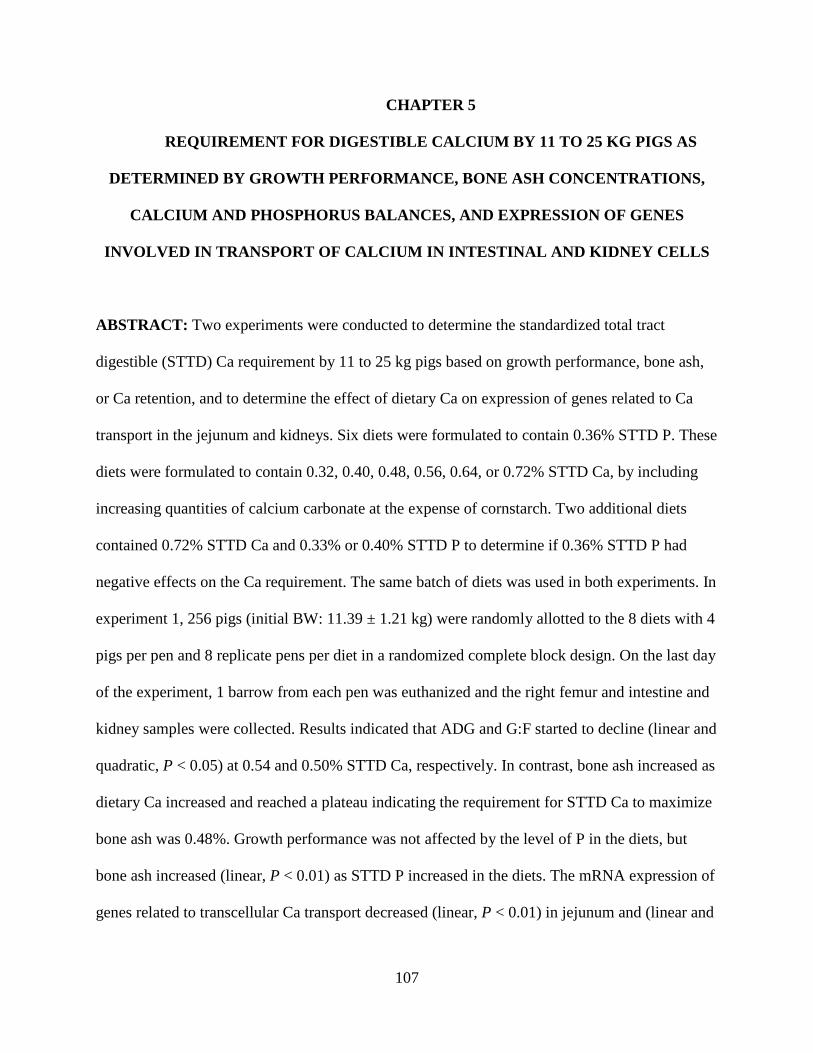
107
CHAPTER 5
REQUIREMENT FOR DIGESTIBLE CALCIUM BY 11 TO 25 KG PIGS AS
DETERMINED BY GROWTH PERFORMANCE, BONE ASH CONCENTRATIONS,
CALCIUM AND PHOSPHORUS BALANCES, AND EXPRESSION OF GENES
INVOLVED IN TRANSPORT OF CALCIUM IN INTESTINAL AND KIDNEY CELLS
ABSTRACT: Two experiments were conducted to determine the standardized total tract
digestible (STTD) Ca requirement by 11 to 25 kg pigs based on growth performance, bone ash,
or Ca retention, and to determine the effect of dietary Ca on expression of genes related to Ca
transport in the jejunum and kidneys. Six diets were formulated to contain 0.36% STTD P. These
diets were formulated to contain 0.32, 0.40, 0.48, 0.56, 0.64, or 0.72% STTD Ca, by including
increasing quantities of calcium carbonate at the expense of cornstarch. Two additional diets
contained 0.72% STTD Ca and 0.33% or 0.40% STTD P to determine if 0.36% STTD P had
negative effects on the Ca requirement. The same batch of diets was used in both experiments. In
experiment 1, 256 pigs (initial BW: 11.39 ± 1.21 kg) were randomly allotted to the 8 diets with 4
pigs per pen and 8 replicate pens per diet in a randomized complete block design. On the last day
of the experiment, 1 barrow from each pen was euthanized and the right femur and intestine and
kidney samples were collected. Results indicated that ADG and G:F started to decline (linear and
quadratic, P < 0.05) at 0.54 and 0.50% STTD Ca, respectively. In contrast, bone ash increased as
dietary Ca increased and reached a plateau indicating the requirement for STTD Ca to maximize
bone ash was 0.48%. Growth performance was not affected by the level of P in the diets, but
bone ash increased (linear, P < 0.01) as STTD P increased in the diets. The mRNA expression of
genes related to transcellular Ca transport decreased (linear, P < 0.01) in jejunum and (linear and
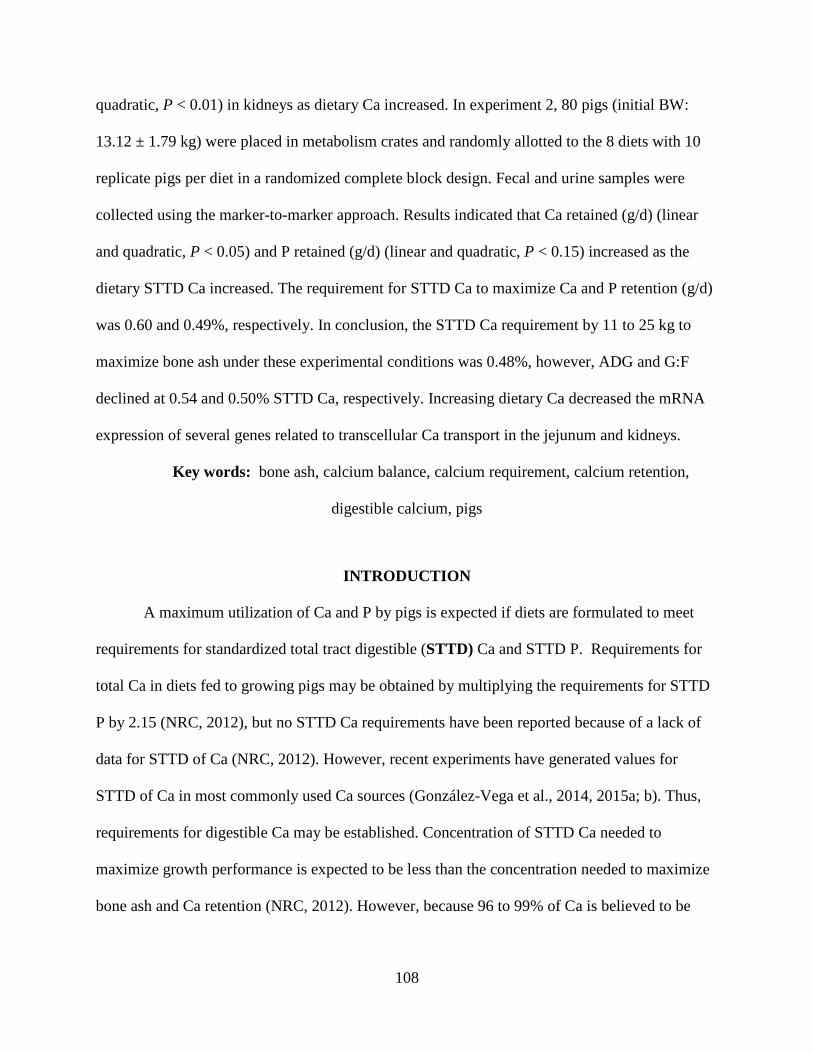
108
quadratic, P < 0.01) in kidneys as dietary Ca increased. In experiment 2, 80 pigs (initial BW:
13.12 ± 1.79 kg) were placed in metabolism crates and randomly allotted to the 8 diets with 10
replicate pigs per diet in a randomized complete block design. Fecal and urine samples were
collected using the marker-to-marker approach. Results indicated that Ca retained (g/d) (linear
and quadratic, P < 0.05) and P retained (g/d) (linear and quadratic, P < 0.15) increased as the
dietary STTD Ca increased. The requirement for STTD Ca to maximize Ca and P retention (g/d)
was 0.60 and 0.49%, respectively. In conclusion, the STTD Ca requirement by 11 to 25 kg to
maximize bone ash under these experimental conditions was 0.48%, however, ADG and G:F
declined at 0.54 and 0.50% STTD Ca, respectively. Increasing dietary Ca decreased the mRNA
expression of several genes related to transcellular Ca transport in the jejunum and kidneys.
Key words: bone ash, calcium balance, calcium requirement, calcium retention,
digestible calcium, pigs
INTRODUCTION
A maximum utilization of Ca and P by pigs is expected if diets are formulated to meet
requirements for standardized total tract digestible (STTD) Ca and STTD P. Requirements for
total Ca in diets fed to growing pigs may be obtained by multiplying the requirements for STTD
P by 2.15 (NRC, 2012), but no STTD Ca requirements have been reported because of a lack of
data for STTD of Ca (NRC, 2012). However, recent experiments have generated values for
STTD of Ca in most commonly used Ca sources (González-Vega et al., 2014, 2015a; b). Thus,
requirements for digestible Ca may be established. Concentration of STTD Ca needed to
maximize growth performance is expected to be less than the concentration needed to maximize
bone ash and Ca retention (NRC, 2012). However, because 96 to 99% of Ca is believed to be
109
deposited in skeletal tissue (Crenshaw, 2001), no differences between concentrations of STTD
Ca needed to maximized bone ash and Ca retention are expected.
Vitamin D may influence the expression of genes involved in transcellular transport of
Ca, which is mainly active if dietary Ca is relatively low (Kutuzova and DeLuca, 2004).
Extensive research has been conducted in broiler chickens, rats, and mice to evaluate the effect
of dietary Ca concentrations on expression of genes involved in transcellular transport of Ca in
the small intestine and kidneys (Armbrecht et al., 1980, 2003; Rosenberg et al., 1986; Hurwitz et
al., 1995; Van de Graaf et al., 2004; Healy et al., 2005; Ko et al., 2009), but limited data have
been reported for pigs. Therefore, the objectives of the present experiments were to determine
the requirement for STTD Ca by 11 to 25 kg pigs to maximize growth performance, bone ash,
and Ca retention, and to determine the effect of dietary Ca on the expression of genes involved in
transcellular transport of Ca in the jejunum and kidneys in pigs.
MATERIALS AND METHODS
The Institutional Animal Care and Use Committee at the University of Illinois reviewed
and approved the protocol for 2 experiments. Pigs used in both experiments were the offspring of
G-Performer boars and Fertilis 25 females (Genetiporc, Alexandria, MN).
Experiment 1: Growth Performance, Bone Ash, and Gene Expression
Animals, Diets, and Feeding. Two hundred and fifty six pigs (initial average BW: 11.39 ± 1.21
kg) were randomly allotted to 8 diets with 8 replicate pens per diet in a randomized complete
block design. Pen was the experimental unit and each pen had 2 barrows and 2 gilts. The
experiment was conducted in 2 blocks, 1 block with 3 replicate pens per diet and 1 block with 5
replicate pens per diet. The Experimental Animal Allotment Program (Kim and Lindemann,
110
2007) was used to allot pigs to experimental diets. Pigs were housed in pens with fully slatted
floors, and room temperature was controlled (maximum temperature: 27.5 ± 2.1ºC; minimum
temperature: 24.1 ± 2.2ºC).
Diets were based on corn, soybean meal, and lactose (Table 5.1). A diet containing
0.36% STTD P and 0.32% STTD Ca was formulated (Table 5.2). Five additional diets were
formulated to contain 0.36% STTD P and 0.40, 0.48, 0.56, 0.64, or 0.72% STTD Ca, by
including increasing quantities of calcium carbonate in the diets at the expense of cornstarch.
The 3 diets with the least concentrations of Ca contained total less Ca than the requirement
according to NRC (2012) and the 3 diets with the greatest concentrations of Ca met or exceeded
the Ca requirement, but the concentration of STTD P in all diets was 10% above the requirement
(NRC, 2012; Table 5.3). Two additional diets were formulated to contain 0.72% STTD Ca and
0.33% or 0.40% STTD P.
Growth Performance and Bone Measurements. Pigs were allowed ad libitum access to
feed and water throughout the experiment, and pigs were weighed at the beginning of the
experiment, at d 10, and at the conclusion of the experiment (d 22). The amount of feed offered
was recorded every day, and the amount of feed left in the feeder at the conclusion of the
experiment was subtracted from the total feed offered. On the last day of the experiment, 1
barrow in each pen that had a BW closest to the average BW of the pen was euthanized via
captive bolt stunning. The right front foot and the right hind leg were removed and stored at -
20ºC. The right front foot and the right hind leg of each pig were autoclaved separately at 125ºC
for 55 min. The 3rd and 4th metacarpals were removed from the feet and femurs were removed
from the hind legs. The marrow of the broken metacarpals and femurs was removed and the
bones were dried and soaked in petroleum ether under a chemical hood for 72 h to remove the
111
remaining marrow and fat. Bones were dried overnight at 130ºC and ashed at 600ºC for 16 h to
calculate the concentration of bone ash.
Sample Analysis. Corn, soybean meal, lactose, calcium carbonate, monocalcium
phosphate, diets, and bones were analyzed for DM by oven drying at 135°C for 2 h (Method
930.15; AOAC Int., 2007), for ash (Method 942.05; AOAC Int., 2007), and for Ca and P by
inductively coupled plasma-optical emission spectrometry (ICP-OES; Method 985.01 A, B, and
C; AOAC Int., 2007) after wet ash sample preparation (Method 975.03 B(b); AOAC Int., 2007).
Corn, soybean meal, and lactose were analyzed for GE using an isoperibol bomb calorimeter
(Model 6300, Parr Instruments, Moline, IL). Benzoic acid was used as the standard for
calibration. Corn, soybean meal, lactose, and diets were analyzed for N using the combustion
procedure (Method 990.03; AOAC Int., 2007) on an Elementar Rapid N-cube protein/nitrogen
apparatus (Elementar Americas Inc., Mt. Laurel, NJ) and CP was calculated as N × 6.25. Corn,
soybean meal, and diets were also analyzed for ADF (Method 973.18; AOAC Int., 2007) and
NDF (Holst, 1973). Corn and soybean meal were analyzed for phytic acid (Megazyme method;
AB Vista, Ystrad Mynach, UK), and diets were analyzed for phytate-P using a Foss near-infrared
spectrometer with the phytate-P levels predicted using AUNIR calibration standards (AB Vista,
Memphis, TN).
Sample Collection for Gene Expression. From 48 euthanized pigs that were fed diets
containing 0.36% STTD P and 0.40, 0.48, 0.56, 0.64, or 0.72% STTD Ca, 5-cm jejunum tissue
samples were collected from the middle region of the small intestine, cut longitudinally, washed
with PBS, and scraped with microscope slides to recover the mucosa layer. Kidney samples were
collected from these pigs between the renal cortex and the renal medulla. Scraped mucosal layer
112
and kidney samples were snap-frozen in liquid N immediately after collection and stored at -
80°C.
RNA Extraction and Quantitative Reverse Transcription-PCR. The RNA was extracted
from 100 mg of tissue using the PureLink RNA Mini Kit (Invitrogen, Carlsbad, CA) according
to manufacturer’s instructions. The RNA quantity and quality were assessed using the ND-1000
Nanodrop spectrophotometer (Thermo Scientific, Wilmington, DE) and the Agilent 2100
Bioanalyzer (Agilent Technologies, Santa Clara, CA), respectively (average RNA integrity
number = 9.63 ± 0.36). The RNA was subjected to reverse transcription by using the Superscript
III First-Strand Synthesis SuperMix (Invitrogen, Carlsbad, CA) to synthesize the double-stranded
cDNA. Double-stranded cDNA was diluted and used for quantitative reverse transcription (qRT-
PCR). Each 10 µL reaction consisted of 5 µL SYBR Green (Applied Biosystems, Foster City,
CA), 4 µL diluted cDNA sample, 0.4 μL of 10 μM forward and reverse primer, and 0.2 μL
DNase/RNase free water. The reactions were performed in an ABI Prism 7900 HT (Applied
Biosystems, Foster City, CA) using the following conditions: 2 min at 50°C, 10 min at 95°C, 40
cycles of 15 s at 95°C, and 1 min at 60°C. An additional dissociation stage was added to verify
the presence of a single PCR product. All reactions were run in triplicate. Data were analyzed
using the 7900 HT Sequence Detection Systems Software (version 2.2.1, Applied Biosystems,
Foster City, CA).
Two internal control genes, glyceraldehyde 3-phosphate dehydrogenase (GAPDH) and
hydroxymethylbilane synthase (HMBS) were used to normalize the expression of tested genes
(Vigors et al., 2014). The selected tested genes are involved into the active transcellular transport
of Ca and these tested genes included S100 calcium binding protein G (S100G), transient
receptor potential cation channel, subfamily V, member 6 (TRPV6), ATPase, Ca++ transporting,
113
plasma membrane 1 (ATP2B1 or PMCA1), and vitamin D (1, 25-dihydroxyvitamin D3) receptor
(VDR) in jejunum samples; and S100G, calbindin 1, 28kDa (CALB1), TRPV6, transient receptor
potential cation channel, subfamily V, member 5 (TRPV5), ATP2B1, and VDR in kidney
samples. Primers are listed in Table 5.4 and primers for TRPV5 and CALB1 were designed
using the Primer3 program (Ye et al., 2012). All primers were commercially synthesized by
Applied Biosystems (Foster, CA). Primers for TRPV5 and CALB1 were verified by gel
electrophoresis and sequencing.
Calculations and Statistical Analysis. The percentage of phytate-bound P in corn and
soybean meal was calculated as 28.2% of phytate (Tran and Sauvant, 2004). The percentage of
phytate in diets was calculated by dividing the analyzed phytate-bound P by 0.282, and to
calculate the percentage of non-phytate P, the amount of phytate-bound P was subtracted from
the amount of total P. Dietary cation-anion difference (DCAD) was calculated using the
following equation:
DCAD, mEq/kg = [(Na*10000)/23] + [(K*10000)/39] – [(Cl*10000)/35.5], [1]
where Na, K, and Cl are expressed in percentage of inclusion in diet.
The ADG, ADFI, and G:F were calculated for each pen and treatment group. Bone ash
percentage was calculated by dividing the quantity of bone ash by the quantity of fat-free dried
bone and multiplied by 100. To obtain the relative gene expression data, the average of quantity
of triplicate samples were calculated and divided by the geometric mean of the 2 internal control
genes. The gene expression data were expressed as a fold change relative to the average of the
diet containing the least concentration of Ca (0.32% STTD Ca).
Normality of residuals and identification of outliers were determined by the
UNIVARIATE procedure of SAS (SAS Inst. Inc., Cary, NC). Gene expression data were log-10
114
transformed to align measures to a normal distribution. Body weight, ADG, ADFI, G:F, bone
variables, and log-scale gene expression data were analyzed using the Proc MIXED of SAS
(SAS Inst. Inc., Cary, NC). The model included diet as the fixed effect and block as the random
effect. The LSMEANS procedure was used to calculate mean values for treatments. Gene
expression data presented in figures were back-transformed using antilog. Linear and quadratic
effects of increasing levels of STTD Ca were determined using CONTRAST statements. The
PROC NLIN of SAS was used for broken line analysis if the linear effect was significant, and for
quadratic analyses if the quadratic effect was significant. If both linear and quadratic effects were
significant, the intersection of the broken line and the quadratic line was determined (Baker et
al., 2002). Pen was the experimental unit and results were considered significant at P ≤ 0.05 and
considered a trend at P ≤ 0.15.
Experiment 2. Calcium and P Balance
Animals, Diets, and Feeding. Eighty pigs (initial average BW: 13.12 ± 1.79 kg) were
randomly allotted to 8 diets with 10 replicate pigs per diet in a randomized complete block
design. The 8 diets used in Exp. 1 were also used in Exp. 2, and the amount of each diet that was
needed for both experiments was mixed in 1 batch. This experiment was conducted in 2 blocks
with 40 pigs and 5 replicate pigs per diet in each block. The Experimental Animal Allotment
Program (Kim and Lindemann, 2007) was used to allot pigs to experimental diets. Pigs were
housed individually in metabolism crates that were equipped with a slatted floor, a feeder, and a
nipple drinker. A screen floor and a urine pan were placed under each crate, and a bucket was
placed under each urine pan, which allowed for total collection of feces and urine. Pigs had free
access to water throughout the experiment. The room temperature was controlled (maximum
temperature: 27.5 ± 1.6ºC; minimum temperature: 23.8 ± 1.1ºC). Pigs were fed 3 times the daily
115
maintenance energy requirement (i.e., 197 kcal of ME/kg BW0.60; NRC, 2012). The daily
allotments of feed were divided into 2 equal meals and provided at 0700 and 1700 h. Pigs were
fed each diet for 13 d and the initial 5 d were an adaptation period to the diets and fecal samples
were collected quantitatively from the feed provided from d 6 to 11 using the marker-to-marker
approach (Adeola, 2001). The beginning of fecal collections was marked by adding an
indigestible marker (indigo carmine) to the morning meal on d 6, and the conclusion of fecal
collection was marked by adding ferric oxide to the morning meal on d 11. Urine samples were
collected every morning from d 6 to 11 and 50 mL of 6N HCl was added to each bucket after
they were emptied. Fecal samples and 20% of the collected urine were stored at -20°C
immediately after collection. Orts collected during the collection period were dried in a forced-
air oven at 65ºC and feed intake was calculated by subtracting the orts from feed allowance.
Sample Analysis and Statistical Analysis. Before analysis, urine samples were thawed at
room temperature, thoroughly mixed, and a subsample of 10 mL was collected. Urine samples
were analyzed for Ca and P as explained for Exp. 1. Fecal samples were dried in a forced-air
oven at 65°C and then ground in a Wiley mill (model 4; Thomas Scientific, Swedesboro, NJ)
using a 1-mm screen. Fecal samples were analyzed for DM as explained for Exp. 1 and for Ca
and P by ICP-OES (Method 965.17; 985.01 mod. AOAC Int., 2007). The apparent total tract
digestibility (ATTD) of Ca and P was calculated according to standard procedures (NRC, 2012).
Values for absorption and retention of Ca and P were calculated as explained by González-Vega
et al. (2013). Data were analyzed using PROC MIXED of SAS as explained for Exp. 1. Pig was
the experimental unit and results were considered significant at P ≤ 0.05 and a trend at P ≤ 0.15.
116
RESULTS
Experiment 1: Growth Performance, Bone Ash, and Gene Expression
All pigs remained healthy and consumed their diets without apparent problems, but 1 gilt
died due to meningitis and ADG, ADFI, and G:F of the pen for this pig were adjusted
(Lindemann and Kim, 2007). There were no effects of increasing concentration of STTD Ca on
final BW or ADFI (Table 5.5). However, overall ADG decreased (quadratic, P < 0.05) as the
concentration of STTD Ca increased (Fig. 5.1). The concentration of STTD Ca at which ADG
started to decline was 0.54% as determined by the intersection between the quadratic and the
broken line analysis. Likewise, overall G:F decreased (quadratic, P < 0.01) as the concentration
of STTD Ca increased (Fig. 5.2). The G:F intersection between the quadratic and the broken line
analysis was at 0.50% STTD Ca. In contrast, bone ash and bone Ca in grams in femurs increased
linearly (P < 0.05) and quadratically (P < 0.05) as the concentration of STTD Ca increased (Fig.
5.3 and 5.4, respectively). Likewise, bone P in grams in femurs and bone ash in grams in
metacarpals increased quadratically (P < 0.05) as the concentration of STTD Ca increased (Fig.
5.5 and 5.6, respectively). The concentrations of STTD Ca to maximize bone ash, bone Ca, and
bone P in femurs, and bone ash in metacarpals were 0.48, 0.50, 0.56, and 0.54%, respectively.
There was no effect of increasing concentration of STTD P on BW, ADG from d 1 to 10
or from d 1 to 22, ADFI, G:F from d 1 to 10, or bone P percentage in femurs (Table 5.6).
However, ADG from d 10 to 22, G:F from d 10 to 22 and from d 1 to 22, bone ash, bone Ca, and
bone P in grams in femurs and bone ash in grams in metacarpals increased linearly (P < 0.05) as
the concentration of STTD P increased. Bone Ca percentage in femurs tended to increase (P =
0.144) as concentration of STTD P increased. Bone ash in percent of dried bone weight in
117
metacarpals increased linearly (P < 0.01) and quadratically (P < 0.01) as the concentration of
STTD P increased.
Gene expression. The effect of increasing concentration of STTD Ca was evaluated for
the internal control genes in jejunum and kidney, and as it was expected, the mRNA expression
of internal control genes was not affected by the concentration of STTD Ca in diets. In jejunum,
the mRNA expression of TRPV6 linearly decreased (P < 0.01) as the concentration of STTD Ca
increased (Fig. 5.7). There was a tendency (P < 0.10) for a linear and quadratic decrease in the
mRNA expression of S100G as the concentration of STTD Ca increased. However, the mRNA
expression of ATP2B1 quadratically increased (P < 0.001) as dietary STTD Ca increased,
reaching the maximum expression for the diet containing 0.64% STTD Ca and 0.36% STTD P.
Likewise, the mRNA expression of VDR quadratically increased (P < 0.01) as the concentration
of STTD Ca increased, reaching the maximum expression for the diet containing 0.64% STTD
Ca and 0.36% STTD P. However in kidney, the mRNA expression of TRPV6 (linear, P < 0.001),
TRPV5 (linear, P < 0.001), S100G (linear, P < 0.001, and quadratic P = 0.056), and CALB1
(linear and quadratic, P < 0.01) decreased as the concentration of STTD Ca increased (Fig. 5.8).
Increasing concentration of STTD Ca quadratically increased (P < 0.01) the mRNA expression
of VDR in the kidney, reaching the maximum expression for the diet containing 0.56% STTD Ca
and 0.36% STTD P. However, increasing concentration of STTD Ca had no effect on the mRNA
expression of ATP2B1 in the kidney.
Experiment 2. Calcium and P Balance
Balance of Ca and ATTD of Ca. Pigs consumed the diets and remained healthy
throughout the experiment. There was no effect of increasing concentration of STTD Ca on feed
intake (Table 5.7). However, Ca intake, Ca absorption, and Ca excretion in percentage of intake
118
increased linearly (P < 0.001) as dietary STTD Ca increased. Likewise, fecal and urine Ca output
and Ca excreted in g/d increased linearly (P < 0.001) and quadratically (P < 0.05) as the
concentration of dietary STTD Ca increased. However, Ca retention in percentage of intake and
ATTD of Ca decreased linearly (P < 0.001) as dietary STTD Ca increased. The quantity of Ca
retained in g/d increased linearly (P < 0.001) and quadratically (P < 0.05) as dietary
concentration of STTD Ca increased. The concentration of STTD Ca needed to maximize Ca
retention in g per d was 0.60% (Fig. 5.9). Increasing dietary STTD P did not affect feed intake,
Ca intake, absorbed Ca, or ATTD of Ca. However, increasing concentration of STTD P
decreased (linear and quadratic, P < 0.05) fecal Ca output, (linear and quadratic, P < 0.05) Ca
excreted in g/d, (linear, P < 0.001) urine Ca output, and (linear, P < 0.001) Ca excretion in
percentage of intake. However, Ca retention in percentage of intake linearly increased (P <
0.001) as the concentration of STTD P increased.
Balance of P and ATTD of P. Intake, absorption, and excretion of P in g/d were not
affected by increasing the concentration of STTD Ca in the diet (Table 5.8). However, urine P
output and P excretion in percent of intake decreased linearly (P < 0.05) and quadratically (P <
0.01) as the concentration of STTD Ca increased. There was a tendency (P < 0.15) for an
increase in the quantity of P retained in g/d as the concentration of STTD Ca increased. The
concentration of STTD Ca needed to maximize P retention in g/d was 0.49% (Fig. 5.10). The
ATTD of P decreased linearly (P < 0.001) as dietary STTD Ca increased. However, fecal P
output increased linearly (P < 0.01) and P retention (% of intake) increased linearly (P < 0.05)
and quadratically (P < 0.01) as the concentration of STTD Ca increased. There were no effects of
increasing concentration of STTD P in the diet on fecal or urine output of P or P excretion in g/d.
However, the quantity of absorbed and retained P in g/d and ATTD of P increased linearly (P <
119
0.05) as dietary STTD P increased. There was a tendency (P < 0.15) for an increase in P intake
and P retention in percent of intake as concentration of STTD P increased, however, P excretion
in percent of intake tended to decrease (P = 0.07) as concentration of STTD P increased.
DISCUSSION
The concentration of Ca and P in corn and monocalcium phosphate were in agreement
with reported values (de Blas et al., 2010; Rostagno et al., 2011; NRC, 2012), but the
concentration of Ca and P in soybean meal and calcium carbonate were greater than reported
values (Sauvant et al., 2004; de Blas et al., 2010; Rostagno et al., 2011; NRC, 2012). However,
all ingredients were analyzed before diet mixing so these differences did not influence
concentrations of Ca and P in the diets, and the Ca and P in all diets were close to calculated
values.
The ratio of Ca and P in the diets is important to consider because an excess or deficiency
of one mineral may affect the utilization of the other (Crenshaw, 2001). In the present
experiment, 0.36% STTD P was used, which is 10% above the requirement (NRC, 2012) to
make sure pigs were not deficient in P. Results obtained for the diet containing 0.33% STTD P
indicated that there were no differences in growth performance between pigs fed 0.36% STTD P
and pigs fed 0.33% STTD P. The reduced quantity of bone ash in pigs fed the diet containing
0.33% STTD P was expected because P requirements are established to maximize growth
performance, but not bone ash (NRC, 2012). The observation that pigs fed 0.40% STTD P had
greater G:F and Ca retention than pigs fed 0.36% STTD P indicates that pigs fed 0.36% STTD P
may have been marginally deficient in STTD P despite receiving 10% more P than the
120
requirement. However, this may at least partly be a result of the reduced ATTD of P that was
observed as STTD Ca in the diets increased.
Results illustrate that the quantity of STTD Ca that is needed to maximize retention of Ca
and maximize bone ash is different from the quantity needed to maximize growth performance.
Increasing concentrations of Ca may increase formation of Ca-P complexes in the
gastrointestinal tract, which reduces digestibility of P (Clark, 1969; Brink et al., 1992; Stein et
al., 2011; González-Vega et al., 2014). This negative effect on digestibility of P may be one of
the reasons for the negative effect of increasing concentrations of dietary STTD Ca on ADG and
G:F. This response was also observed in 25 kg pigs that were fed increasing concentrations of
true total tract digestible Ca and a constant concentration of true total tract digestible P (Fan and
Archbold, 2012). However, the increase in bone ash that was observed as the STTD Ca increased
indicates that although ATTD of P was reduced at the greatest concentrations of dietary STTD
Ca, pigs were able to maximize bone ash if there was enough Ca in the diet. The observation that
ADG and G:F were not negatively affected by the least concentration of STTD Ca indicates that
pigs were able to mobilize Ca from the bones to compensate for the deficiency of dietary Ca. It is
possible that 22 d was too short a period to deplete bone Ca stores and therefore observe negative
effects on growth performance. Similar results were observed in pigs fed low levels of Ca for 32
d (Eklou-Kalonji et al., 1999) and in rats fed high levels of Ca and low levels of P for 28 d
(Shapiro and Heaney, 2003).
In this experiment, the STTD Ca:STTD P ratios ranged from 0.88:1 to 2.00:1. Dietary Ca
above 0.50 or 0.54% STTD Ca negatively affected G:F and ADG, which corresponds to
digestible Ca:digestible P ratios between 1.39:1 and 1.50:1. To maximize bone ash, bone Ca, and
bone P, dietary STTD Ca above 0.48% were needed, and to maximize retention of Ca and P, a
121
minimum of 0.60 and 0.49% STTD Ca, respectively, were needed, which correspond to
digestible Ca:digestible P ratios between 1.33:1 and 1.67:1. These values are within the range of
values for the Ca:P ratio in the whole body (Rymarz et al., 1982; Hendriks and Moughan, 1993;
Mahan and Shields, 1998; Wiseman et al., 2009; Pettey et al., 2015).
In studies aimed at determining Ca or P requirements in pigs, the dietary concentration of
one mineral may be constant while responses to graded levels of the other mineral is observed
(Fan and Archbold, 2012). Alternatively, a constant Ca:P ratio may be used (Zhai and Adeola,
2013). In this experiment, a constant concentration of dietary STTD P was used in diets with
varying dietary Ca. In studies that used a constant concentration of dietary Ca, increasing
concentrations of STTD P increased growth performance (Ekpe et al., 2002; Saraiva et al., 2009;
Viana et al., 2013; Zhai and Adeola, 2013). However, in this experiment, increasing
concentrations of STTD Ca decreased growth performance, which is in agreement with results
observed by Fan and Archbold (2012). This observation indicates that to maximize growth
performance in pigs the ratio of STTD Ca to STTD P likely is more important than the absolute
concentration of both minerals.
Calcium may be absorbed by paracellular or transcellular routes. If luminal Ca
concentration is high, most Ca is absorbed by passive absorption using the paracellular route,
(Hurwitz, 1996; Fleet and Schoch, 2010). In contrast, if luminal Ca concentration is low, most
Ca is absorbed by active transport using the transcellular route, which requires Ca channels,
transporters, and energy (Hurwitz, 1996; Bouillon et al., 2003; Fleet and Schoch, 2010). Calcium
crosses the brush border membrane using Ca channels (TRPV6 and/or TRPV5), and in the
cytoplasm, Ca is bound to Ca binding proteins (calbindin-D9k and/or calbindin-D28k), which
transport Ca to the basolateral membrane (Schröder et al., 1996; Bouillon et al., 2003; Schwaller,
122
2010), where it is released from the cell via PMCA1 or by a Na+/Ca2+ exchanger (Bouillon et al.,
2003; Prozkowiec-Weglarz and Angel, 2013). Therefore, dietary Ca concentration may affect the
expression of genes related to Ca transport. As indicated by the results from the current
experiment, the mRNA expression of Ca binding proteins and Ca channel proteins were
regulated by dietary Ca concentrations in both the jejunum and the kidneys. These results are in
close agreement with data obtained in mice, rats, and broiler chickens (Armbrecht et al., 1980,
2003; Rosenber et al., 1986; Hurwitz et al., 1995; Van de Graaf et al., 2004; Ko et al., 2009).
Calcium homeostasis is mainly regulated by 2 hormones, parathyroid hormone (PTH)
and calcitonin (Crenshaw, 2001). Secretion of PTH increases at low dietary Ca concentrations
due to low plasma Ca concentrations (Eklou-Kalonji et al., 1999). Parathyroid hormone increases
the production of 1-hydroxylase in the kidneys, which forms 1,25-dihydroxycholecalciferol
(1,25-(OH)2D3), the active form of vitamin D (Hurwitz, 1996; Crenshaw et al., 2011). If 1,25-
(OH)2D3 is bound to VDR, up-regulation of several genes involved in transcellular Ca transport
may occur (Healy et al., 2005), which may increase Ca absorption in the small intestine and Ca
reabsorption in the kidneys (Bouillon et al., 2003). In broiler chickens, rats, and mice, the
expression of TRPV6, TRPV5, S100G, and/or PMCA1 was increased in the small intestine and/or
in the kidneys at low dietary Ca concentrations (Armbrecht et al., 1980, 2003; Rosenber et al.,
1986; Hurwitz et al., 1995; Van de Graaf et al., 2004; Ko et al., 2009). Results from this
experiment support this observation because the mRNA expression of TRPV6 and S100G in the
jejunum, and the mRNA expression of TRPV5, TRPV6, S100G, and CALB1 in the kidneys were
down-regulated at high concentrations of dietary Ca. In mice, high concentrations of dietary Ca
increased mRNA expression of VDR in the kidney, but not in the duodenum (Healy et al., 2005).
Our results for the kidney support this observation. Thus, results of this experiment indicate that
123
although, at high dietary concentrations of Ca, mRNA expression of Ca transporters was down-
regulated in jejunum, most Ca may have been absorbed using the paracellular route. As a
consequence, Ca that was not needed for bone tissue synthesis was subsequently excreted in the
urine, indicating that Ca homeostasis was regulated mainly at the renal level. In contrast, at low
concentrations of dietary Ca, most Ca is likely absorbed using the transcellular route. As a
consequence, vitamin D-dependent transport may play a role in increasing Ca absorption from
the small intestine and in Ca reabsorption in the kidneys at low concentrations of dietary Ca.
Conclusions
Growth performance of pigs was reduced if dietary Ca exceeded approximately 0.50%
STTD Ca in diets containing 0.36% STTD P. Bone ash, bone Ca, and bone P were maximized by
dietary Ca above 0.48% STTD Ca, and retention of Ca and P was maximized if dietary Ca was
above 0.60 or 0.49% STTD Ca, respectively. Based on these results, it is likely that the
requirement for STTD Ca for 11 to 25 kg pigs is approximately 1.35 times the required STTD P,
but further experiments need to be conducted to verify this value. Increasing concentrations of
dietary Ca decreased expression of genes related to Ca transport in the jejunum and kidneys of
pigs, and although Ca absorption is negatively affected by increasing concentrations of dietary
Ca, the main site for regulation of Ca homeostasis appears to be in the kidneys.
124
LITERATURE CITED
Adeola, O. 2001. Digestion and balance techniques in pigs. In: A. J. Lewis and L. L. Southern,
editors, Swine nutrition. 2nd ed. CRC Press, Washington, DC. p. 903-916.
AOAC International. 2007. Official Methods of Analysis of AOAC Int. 18th ed. Rev. 2. W.
Hortwitz and G. W. Latimer, Jr., eds. AOAC Int., Gaithersburg, MD.
Armbrecht, H. J., M. A. Boltz, and M. E. H. Bruns. 2003. Effect of age and dietary calcium on
intestinal calbindin D-9k expression in the rat. Arch. Biochem. Biophys. 420:194-200.
Armbrecht, H. J., T. V. Zenser, C. J. Gross, and B. B. Davis. 1980. Adaptation to dietary calcium
and phosphorus restriction changes with age in the rat. Am. J. Physiol. 239:E322-327.
Baker, D. H., A. B. Batal, T. M. Parr, N. R. Augspurger, and C. M. Parsons. 2002. Ideal ratio
(relative to lysine) of tryptophan, threonine, isoleucine, and valine for chicks during the
second and third weeks posthatch. Poult. Sci. 81:485-494.
Bouillon, R., S. Van Cromphaut, and G. Carmeliet. 2003. Intestinal calcium absorption:
Molecular vitamin D mediated mechanisms. J. Cell. Biochem. 88:332-339.
Brink, E. J., A. C. Beynen, P. R. Dekker, E. C. H. van Beresteijn, and R. van der Meer. 1992.
Interaction of calcium and phosphate decreases ileal magnesium solubility and apparent
magnesium absorption in rats. J. Nutr. 122:580-586.
Clark, I. 1969. Importance of dietary Ca:PO4 ratios on skeletal, Ca, Mg, and PO4 metabolism.
Am. J. Physiol. 217:865-870.
Crenshaw, T. D. 2001. Calcium, phosphorus, vitamin D, and vitamin K in swine nutrition. In: A.
J. Lewis, and L. L. Southern, editors, Swine nutrition. 2nd ed. CRC Press, Boca Raton,
FL. p. 187-212.
Crenshaw, T. D., L. A. Rortvedt, and Z. Hassen. 2011. Triennial growth symposium: A novel
125
pathway for vitamin D-mediated phosphate homeostasis: Implications for skeleton
growth and mineralization. J. Anim. Sci. 89:1957-1964.
De Blas, C., G. G. Mateos, and P. García-Rebollar. 2010. Tablas FEDNA de composición y
valor nutritivo de alimentos para la fabricación de piensos compuestos. 3ra ed. C. de
Blas, G. G. Mateos, and P. García-Rebollar, editors. Fund. Esp. Desarrollo Nutr. Anim.,
Madrid, Spain.
Eklou-Kalonji, E., E. Zerath, C. Colin, C. Lacroix, X. Holy, I. Denis, and A. Pointllart. 1999.
Calcium-regulating hormones, bone mineral content, breaking load and trabecular
remodeling are altered in growing pigs fed calcium-deficient diets. J. Nutr. 129:188-193.
Ekpe, E. D., R. T. Zijlstra, and J. F. Patience. 2002. Digestible phosphorus requirement of
grower pigs. Can. J. Anim. Sci. 82:541-549.
Fan, M. Z., and T. Archbold. 2012. Effects of dietary true digestible calcium to phosphorus ratio
on growth performance and efficiency of calcium and phosphorus use in growing pigs
fed corn and soybean meal-based diets. J. Anim. Sci. 90(Suppl. 4):254-256.
Fleet, J. C., and R. D. Schoch. 2010. Molecular mechanism for regulation of intestinal calcium
absorption by vitamin D and other factors. Crit. Rev. Clin. Lab. Sci. 47:181-195.
González-Vega, J. C., C. L. Walk, Y. Liu, and H. H. Stein. 2013. Determination of endogenous
intestinal losses of Ca and true total tract digestibility of calcium in canola meal fed to
growing pigs. J. Anim. Sci. 91:4807-4816.
González-Vega, J. C., C. L. Walk, Y. Liu, and H. H. Stein. 2014. The site of net absorption of Ca
from the intestinal tract of growing pigs and effect of phytic acid, Ca level and Ca source
on Ca digestibility. Arch. Anim. Nutr. 68:126-142.
González-Vega, J. C., C. L. Walk, and H. H. Stein. 2015a. Effects of microbial phytase on
126
apparent and standardized total tract digestibility of calcium in calcium supplements fed
to growing pigs. J. Anim. Sci. 93:2255-2264.
González-Vega, J. C., C. L. Walk, and H. H. Stein. 2015b. Effect of phytate, microbial phytase,
fiber, and soybean oil on calculated values for apparent and standardized total tract
digestibility of calcium and apparent total tract digestibility of phosphorus in fish meal
fed to growing pigs. J. Anim. Sci. 93:4808-4818.
Gupta, G. K., T. Agrawal, M. G. Del Core, W. J. Hunter III, and D. K. Agrawal. 2012.
Decreased expression of vitamin D receptors in neointimal lesion following coronary
artery angioplasty in atherosclerotic swine. PLoS ONE. 7:e42789.
Healy, K. D., M. A. Frahm, H. F. DeLuca. 2005. 1,25-Dihydroxyvitamin D3 up-regulates the
renal vitamin D receptor through indirect gene activation and receptor stabilization. Arch.
Biochem. Biophys. 433:466-473.
Hendriks, W. H., and P. J. Moughan. 1993. Whole-body mineral composition of entire male and
female pigs depositing protein at maximal rates. Livest. Prod. Sci. 33:161-170.
Holst, D. O. 1973. Holst filtration apparatus for Van Soest detergent fiber analysis. J. AOAC.
56:1352-1356.
Hurwitz, S. 1996. Homeostatic control of plasma calcium concentration. Crit. Rev. Biochem.
Mol. 31: 41-100.
Hurwitz, S., I. Plavnik, A. Shapiro, E. Wax, H. Talpaz, and A. Bar. 1995. Calcium metabolism
and requirements of chickens are affected by growth. J. Nutr. 125: 2679-2686.
Kim, B. G., and M. D. Lindemann. 2007. A new spreadsheet method for the experimental animal
allotment. J. Anim. Sci. 85 (Suppl. 2):218 (Abstr.)
Ko, S., G. Lee, T. T. B. Vo, E. Jung, K. Choi, K. Cheung, J. W. Kim, J. Park, G. T. OH, and E.
127
Jeung. 2009. Dietary Ca and 1,25-dihydroxyvitamin D3 regulate transcription of calcium
transporter genes in calbindin-D9k knockout mice. J. Reprod. Dev. 55:137-142.
Kutuzova, G. D., and H. F. DeLuca. 2004. Gene expression profiles in rat intestine identify
pathways for 1,25-dihydroxyvitamin D3 stimulated calcium absorption and clarify its
immunomodulatory properties. Arch. Biochem. Biophys. 432:152-166.
Lindemann, M. D., and B. G. Kim. 2007. Technical note: A model to estimate individual feed
intake of swine in group feeding. J. Anim. Sci. 85:972-975.
Mahan, D. C., and R. G. Shields, Jr. 1998. Macro- and micromineral composition of pigs from
birth to 145 kilograms of body weight. J. Anim. Sci. 76:506-512.
NRC. 2012. Nutrient Requirements of Swine. 11th rev. ed. Natl. Acad. Press, Washington, DC.
Pettey, L. A., G. L. Cromwell, Y. D. Jang, and M. D. Lindemann. 2015. Estimation of calcium
and phosphorus content in growing and finishing pigs: Whole empty body components
and relative accretion rates. J. Anim. Sci. 93:158-167.
Prozkowiec-Weglarz, M., and R. Angel. 2013. Calcium and phosphorus metabolism in broilers:
Effect of homeostatic mechanism on calcium and phosphorus digestibility. J. Appl. Poult.
Res. 22:609-627.
Rosenberg, J., S. Hurwitz, and A. Bar. 1986. Regulation of kidney calcium-binding protein in the
bird (Gallus Domesticus). Comp. Biochem. Physiol. 83A: 277-281.
Rostagno, H. S., L. F. T. Albino, J. L. Donzele, P. C. Gomes, R. F. de Oliveira, D. C. Lopes, A.
S. Ferreira, S. L. T. Barreto, and R. F. Euclides. 2011. Brazilian tables for poultry and
swine. H. S. Rostagno, editor, 3rd ed. Universidade Federal de Viçosa, Viçosa, BR.
Rymarz, A., H. Fandrejewski, and J. Kielanowski. 1982. Content and retention of calcium,
phosphorus, potassium and sodium in the bodies of growing gilts. Livest. Prod. Sci.
128
9:399-407.
Saraiva, A., J. L. Donzele, R. F. M. de Oliveira, M. L. T. de Abreu, F. C. O. Silva, and F. A.
Santos. 2009. Available phosphorus levels in diets for swine from 15 to 30 kg genetically
selected for meat deposition. R. Bras. Zootec. 38:307-313.
Sauvant, D., J.-M. Perez, and G. Tran. 2004. Tables of composition and nutritional value of feed
materials: pig, poultry, sheep, goats, rabbits, horses, fish. 2nd ed. Wageningen Academic
Publishers, Wageningen, the Netherlands.
Schröder, B., C. Schlumbohm, R. Kaune, and G. Breves. 1996. Role of calbindin-D9k in
buffering cytosolic free Ca2+ ions in pig duodenal enterocytes. J. Physiol. 492:715-722.
Schwaller, B. 2010. Cytosolic Ca2+ buffers. Cold Spring Harb. Perspect. Biol. 2:a004051.
Shapiro, R., and R. P. Heaney. 2003. Co-dependence of calcium and phosphorus for growth and
bone development under conditions of varying deficiency. Bone. 32 :532-540.
Stein, H. H., O. Adeola, G. L. Cromwell, S. W. Kim, D. C. Mahan, and P. S. Miller. 2011.
Concentration of dietary calcium supplied by calcium carbonate does not affect the
apparent total tract digestibility of calcium, but reduces digestibility of phosphorus by
growing pigs. J. Anim. Sci. 89:2139-2144.
Tran, G., and D. Sauvant. 2004. Chemical data and nutritional value. In: D. Sauvant, J.-M. Perez,
and G. Tran, editors, Tables of composition and nutritional value of feed materials: pig,
poultry, sheep, goats, rabbits, horses, fish. 2nd ed. Wageningen Academic Publishers,
Wageningen, the Netherlands. p. 17-24.
Van de Graaf, S. F. J., I. Boullart, J. G. J. Hoenderop, and R. J. M. Bindels. 2004. Regulation of
the epithelial Ca2+ channels TRPV5 and TRPV6 by 1α,25-dihydroxy vitamin D3 and
dietary Ca2+. J. Steroid Biochem. 89-90: 303-308.
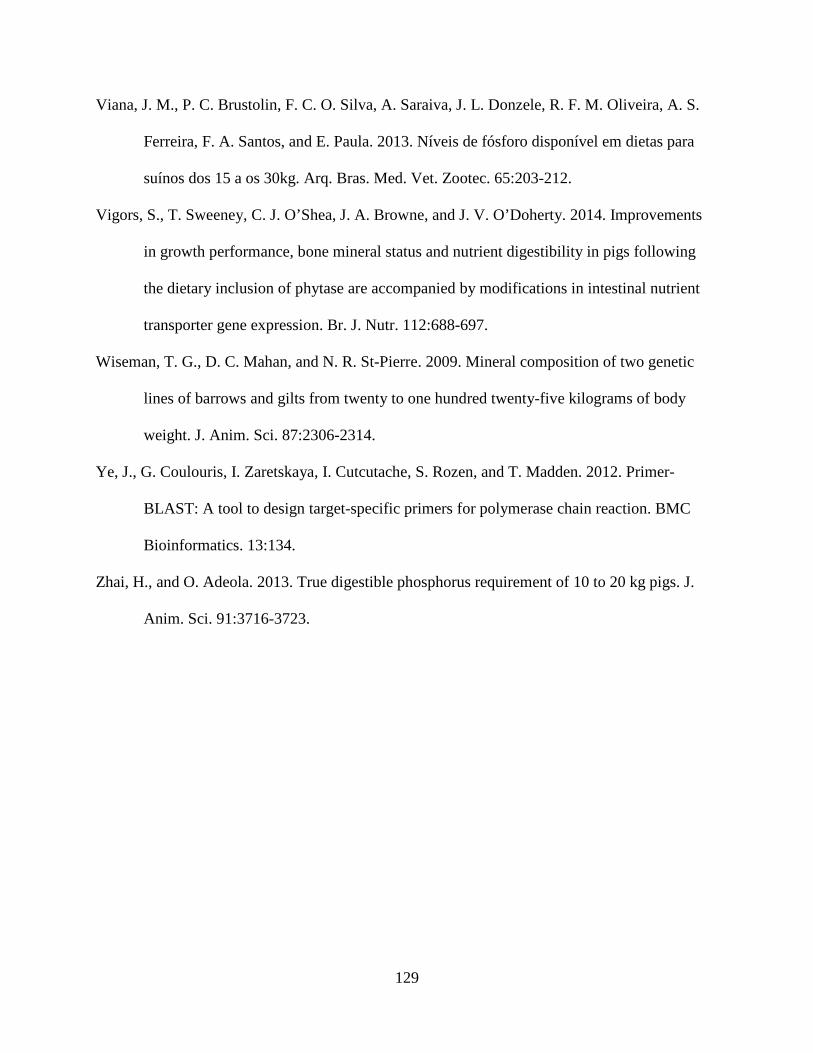
129
Viana, J. M., P. C. Brustolin, F. C. O. Silva, A. Saraiva, J. L. Donzele, R. F. M. Oliveira, A. S.
Ferreira, F. A. Santos, and E. Paula. 2013. Níveis de fósforo disponível em dietas para
suínos dos 15 a os 30kg. Arq. Bras. Med. Vet. Zootec. 65:203-212.
Vigors, S., T. Sweeney, C. J. O’Shea, J. A. Browne, and J. V. O’Doherty. 2014. Improvements
in growth performance, bone mineral status and nutrient digestibility in pigs following
the dietary inclusion of phytase are accompanied by modifications in intestinal nutrient
transporter gene expression. Br. J. Nutr. 112:688-697.
Wiseman, T. G., D. C. Mahan, and N. R. St-Pierre. 2009. Mineral composition of two genetic
lines of barrows and gilts from twenty to one hundred twenty-five kilograms of body
weight. J. Anim. Sci. 87:2306-2314.
Ye, J., G. Coulouris, I. Zaretskaya, I. Cutcutache, S. Rozen, and T. Madden. 2012. Primer-
BLAST: A tool to design target-specific primers for polymerase chain reaction. BMC
Bioinformatics. 13:134.
Zhai, H., and O. Adeola. 2013. True digestible phosphorus requirement of 10 to 20 kg pigs. J.
Anim. Sci. 91:3716-3723.
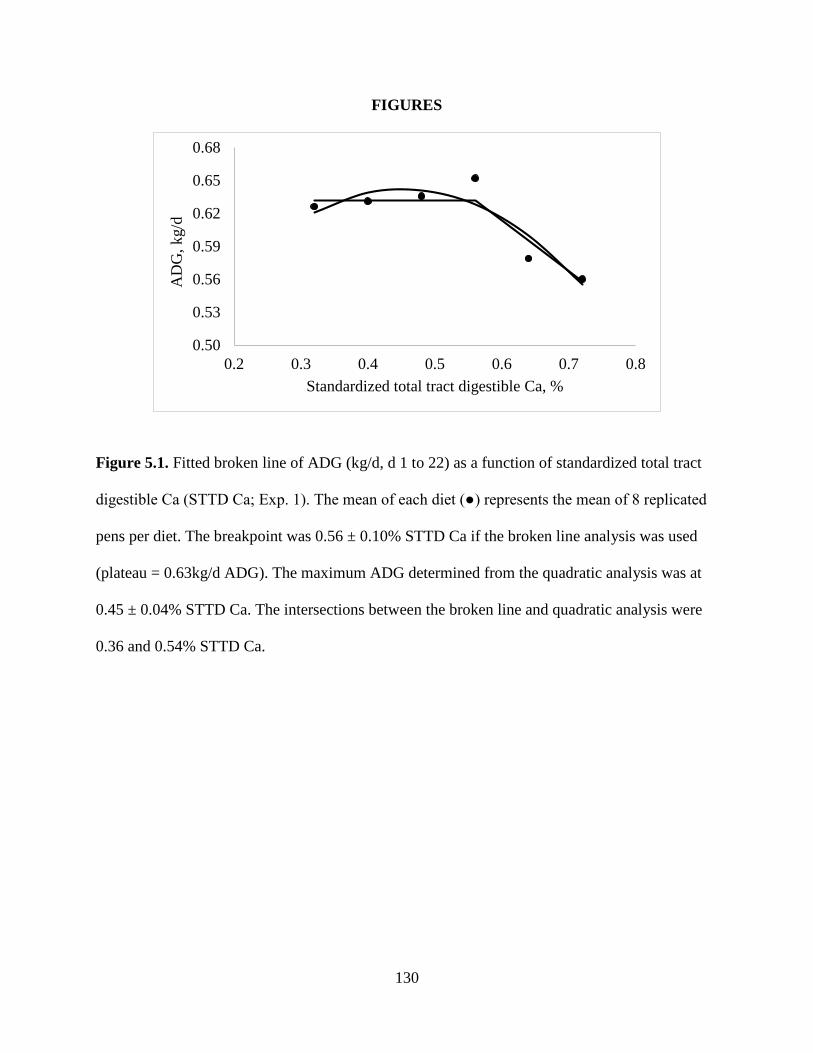
130
FIGURES
Figure 5.1. Fitted broken line of ADG (kg/d, d 1 to 22) as a function of standardized total tract
digestible Ca (STTD Ca; Exp. 1). The mean of each diet (●) represents the mean of 8 replicated
pens per diet. The breakpoint was 0.56 ± 0.10% STTD Ca if the broken line analysis was used
(plateau = 0.63kg/d ADG). The maximum ADG determined from the quadratic analysis was at
0.45 ± 0.04% STTD Ca. The intersections between the broken line and quadratic analysis were
0.36 and 0.54% STTD Ca.
0.50
0.53
0.56
0.59
0.62
0.65
0.68
0.2 0.3 0.4 0.5 0.6 0.7 0.8
AD
G, k
g/d
Standardized total tract digestible Ca, %
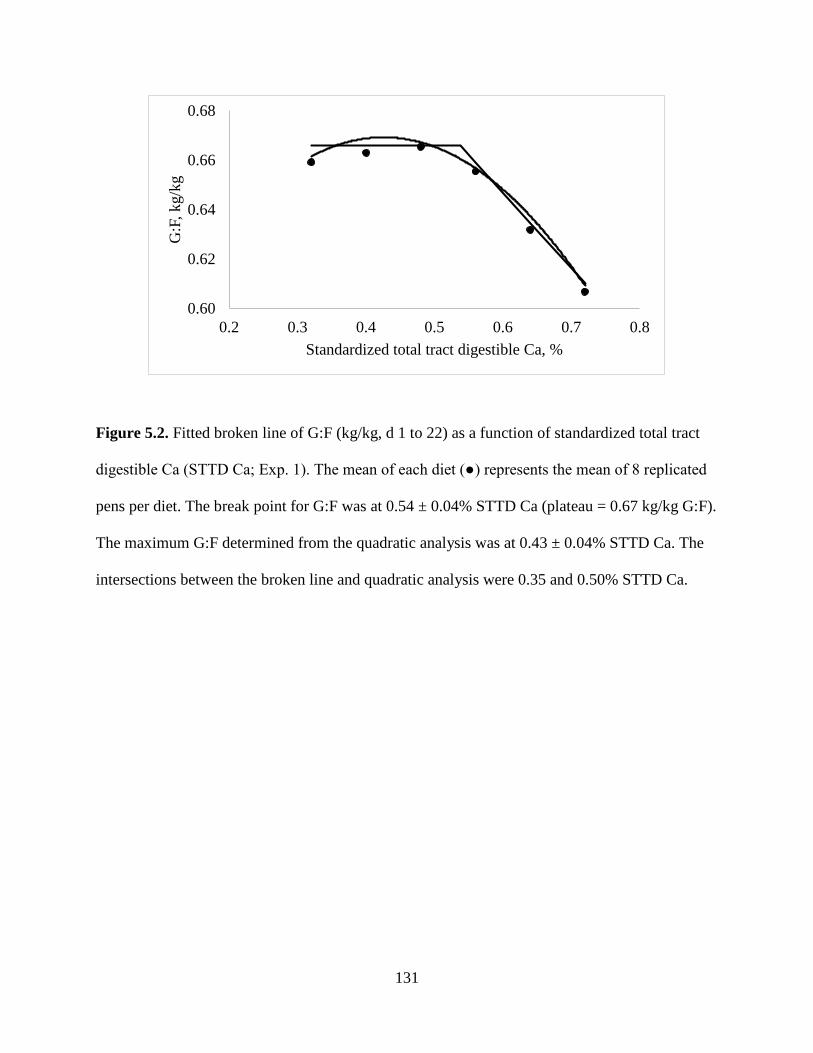
131
Figure 5.2. Fitted broken line of G:F (kg/kg, d 1 to 22) as a function of standardized total tract
digestible Ca (STTD Ca; Exp. 1). The mean of each diet (●) represents the mean of 8 replicated
pens per diet. The break point for G:F was at 0.54 ± 0.04% STTD Ca (plateau = 0.67 kg/kg G:F).
The maximum G:F determined from the quadratic analysis was at 0.43 ± 0.04% STTD Ca. The
intersections between the broken line and quadratic analysis were 0.35 and 0.50% STTD Ca.
0.60
0.62
0.64
0.66
0.68
0.2 0.3 0.4 0.5 0.6 0.7 0.8
G:F
, kg/
kg
Standardized total tract digestible Ca, %
132
Figure 5.3. Fitted broken line of bone ash in femurs (g) as a function of standardized total tract
digestible Ca (STTD Ca; Exp. 1). The mean of each diet (●) represents the mean of 8 replicated
pens per diet. The break point for g bone ash was at 0.48 ± 0.11% STTD Ca if the broken line
analysis was used (plateau = 9.30g bone ash). The maximum concentration of bone ash
determined from the quadratic analysis was 0.57 ± 0.03% STTD Ca. The intersections between
the broken line and quadratic analysis were 0.48 and 0.66% STTD Ca.
6
7
8
9
10
0.2 0.3 0.4 0.5 0.6 0.7 0.8
Bon
e as
h in
fem
urs,
g
Standardized total tract digestible Ca, %
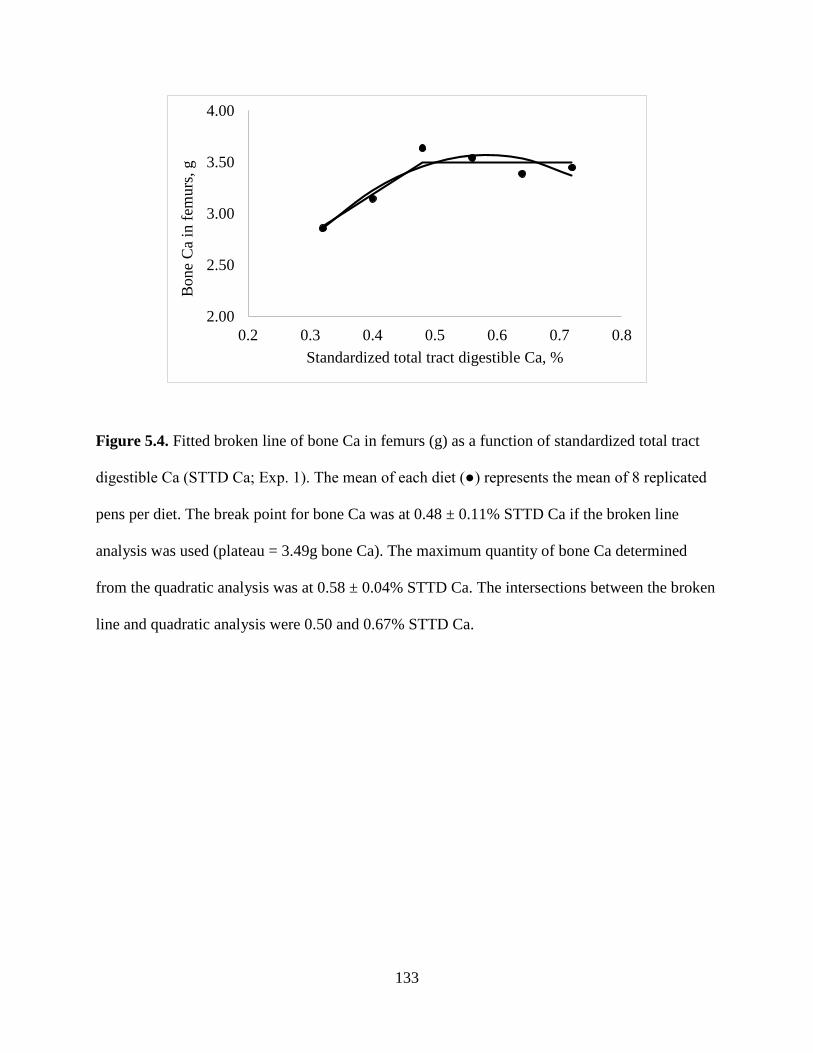
133
Figure 5.4. Fitted broken line of bone Ca in femurs (g) as a function of standardized total tract
digestible Ca (STTD Ca; Exp. 1). The mean of each diet (●) represents the mean of 8 replicated
pens per diet. The break point for bone Ca was at 0.48 ± 0.11% STTD Ca if the broken line
analysis was used (plateau = 3.49g bone Ca). The maximum quantity of bone Ca determined
from the quadratic analysis was at 0.58 ± 0.04% STTD Ca. The intersections between the broken
line and quadratic analysis were 0.50 and 0.67% STTD Ca.
2.00
2.50
3.00
3.50
4.00
0.2 0.3 0.4 0.5 0.6 0.7 0.8
Bon
e C
a in
fem
urs,
g
Standardized total tract digestible Ca, %
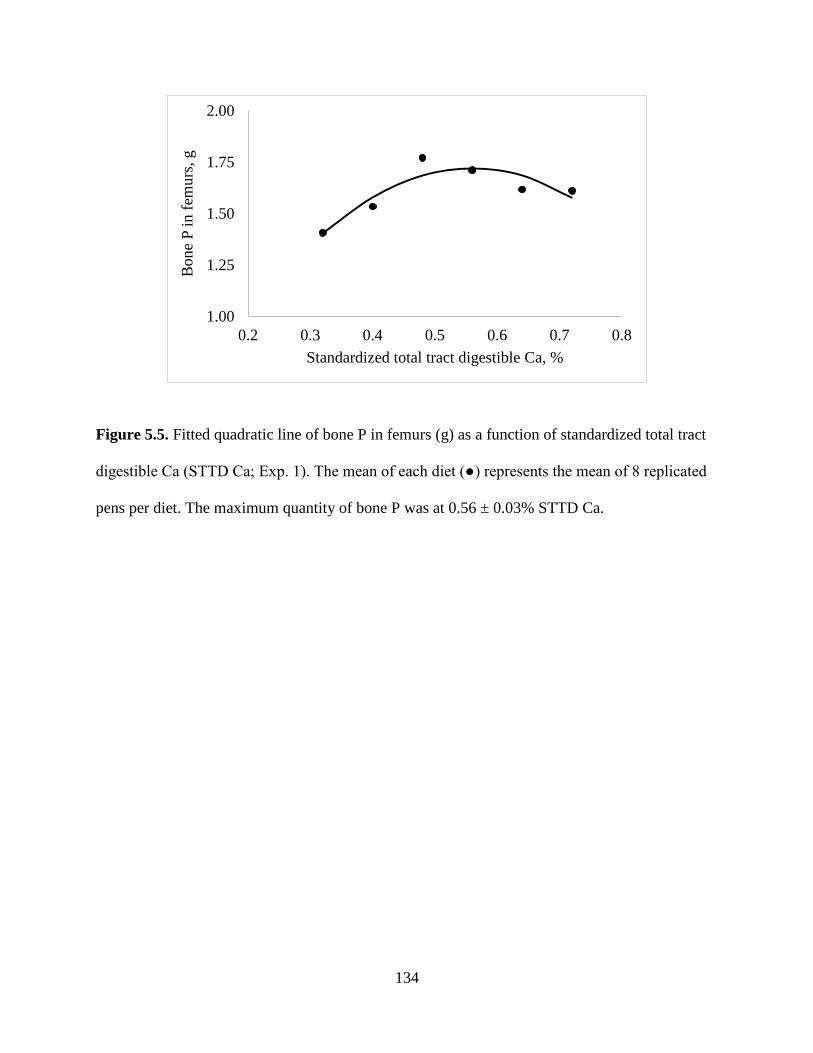
134
Figure 5.5. Fitted quadratic line of bone P in femurs (g) as a function of standardized total tract
digestible Ca (STTD Ca; Exp. 1). The mean of each diet (●) represents the mean of 8 replicated
pens per diet. The maximum quantity of bone P was at 0.56 ± 0.03% STTD Ca.
1.00
1.25
1.50
1.75
2.00
0.2 0.3 0.4 0.5 0.6 0.7 0.8
Bon
e P
in fe
mur
s, g
Standardized total tract digestible Ca, %
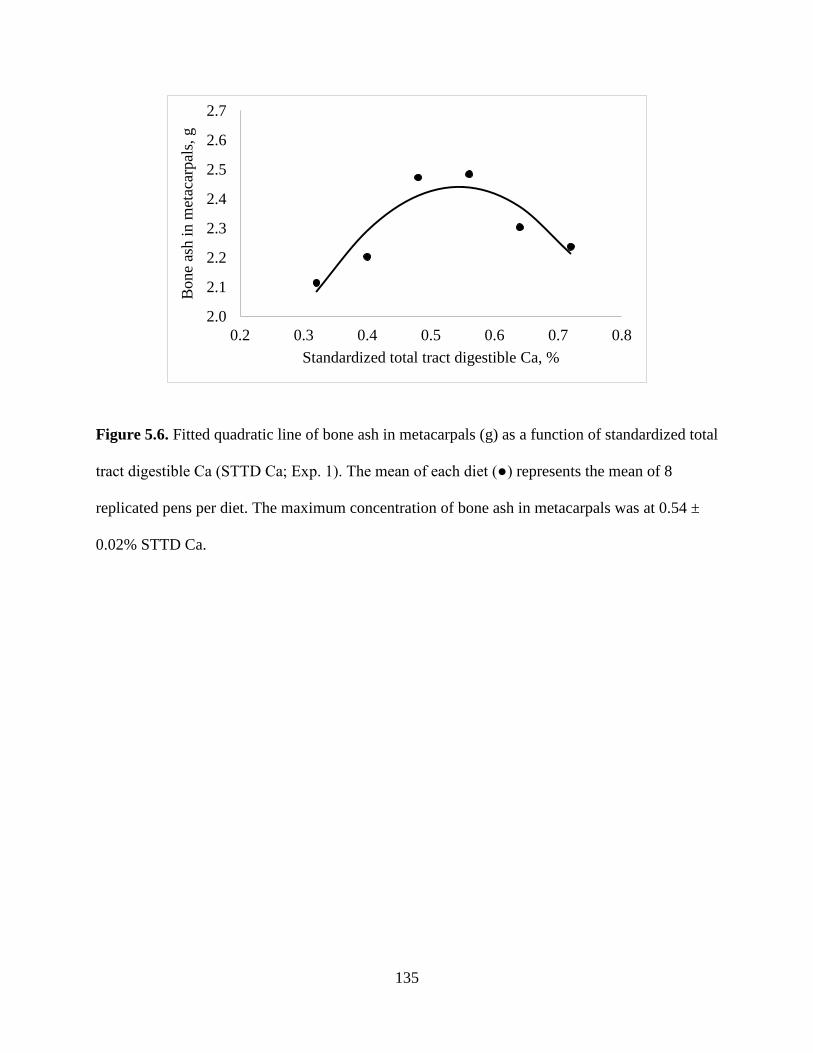
135
Figure 5.6. Fitted quadratic line of bone ash in metacarpals (g) as a function of standardized total
tract digestible Ca (STTD Ca; Exp. 1). The mean of each diet (●) represents the mean of 8
replicated pens per diet. The maximum concentration of bone ash in metacarpals was at 0.54 ±
0.02% STTD Ca.
2.0
2.1
2.2
2.3
2.4
2.5
2.6
2.7
0.2 0.3 0.4 0.5 0.6 0.7 0.8
Bon
e as
h in
met
acar
pals
, g
Standardized total tract digestible Ca, %
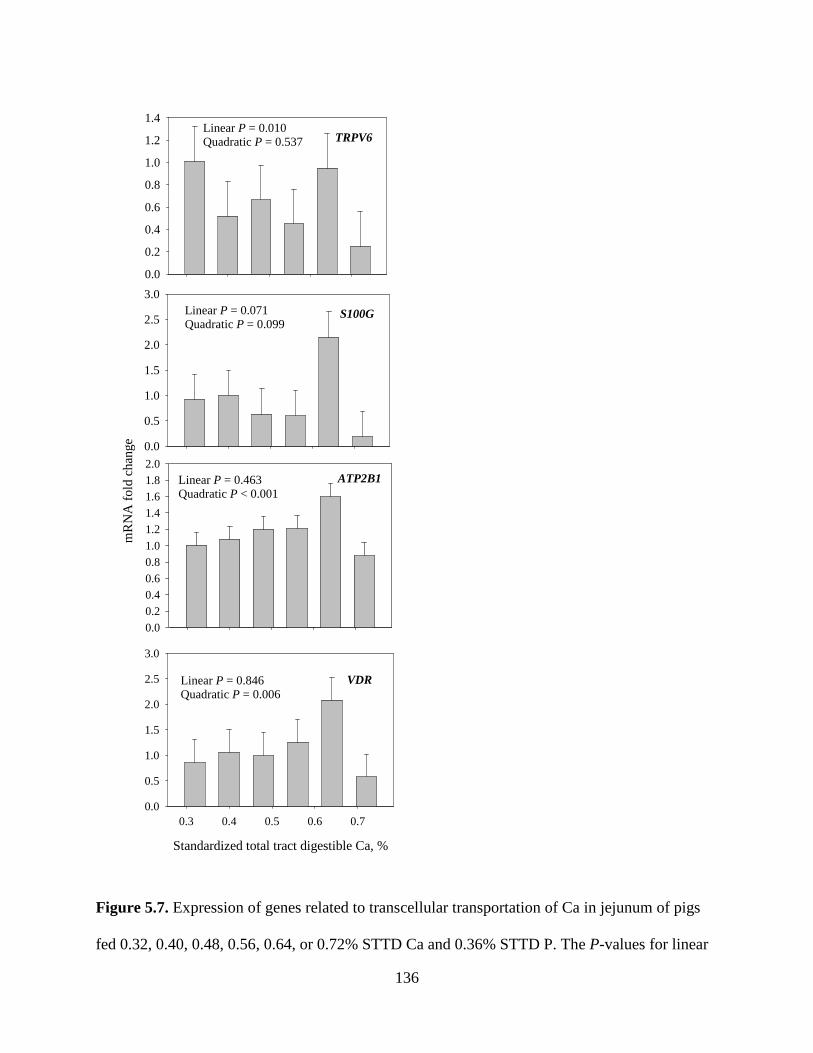
136
Figure 5.7. Expression of genes related to transcellular transportation of Ca in jejunum of pigs
fed 0.32, 0.40, 0.48, 0.56, 0.64, or 0.72% STTD Ca and 0.36% STTD P. The P-values for linear
TRPV6
0.0
0.2
0.4
0.6
0.8
1.0
1.2
1.4
0.0
0.5
1.0
1.5
2.0
2.5
3.0
0.00.20.40.60.81.01.21.41.61.82.0
Linear P = 0.463Quadratic P < 0.001
Linear P = 0.071Quadratic P = 0.099
Linear P = 0.010Quadratic P = 0.537
Standardized total tract digestible Ca, %
0.3 0.4 0.5 0.6 0.70.0
0.5
1.0
1.5
2.0
2.5
3.0
Linear P = 0.846Quadratic P = 0.006
mR
NA
fold
cha
nge
S100G
ATP2B1
VDR
137
Figure 5.7. (Cont.)
and quadratic effect of increasing concentration of STTD Ca, and means for each diet and
standard errors (vertical bars) are indicated. TRPV6 = transient receptor potential cation channel,
subfamily V, member 6; S100G = S100 calcium binding protein G; ATP2B1 = ATPase, Ca++
transporting, plasma membrane 1; VDR = vitamin D (1, 25-dihydroxyvitamin D3) receptor.
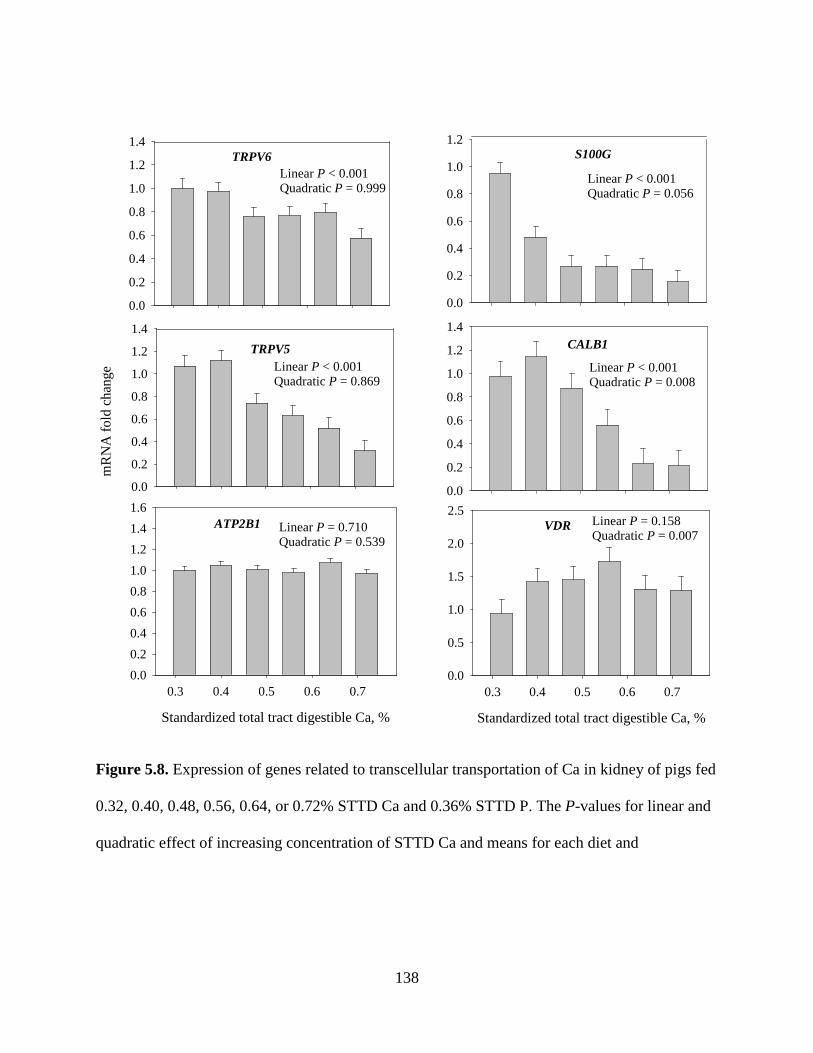
138
2D Graph 14
Standardized total tract digestible Ca, %
0.3 0.4 0.5 0.6 0.70.00.20.40.60.81.01.21.41.6
0.0
0.2
0.4
0.6
0.8
1.0
1.2
1.4
Linear P < 0.001Quadratic P = 0.999
0.0
0.2
0.4
0.6
0.8
1.0
1.2
1.4
Linear P < 0.001Quadratic P = 0.869
Linear P = 0.710Quadratic P = 0.539
0.0
0.2
0.4
0.6
0.8
1.0
1.2
Linear P < 0.001Quadratic P = 0.056
0.0
0.2
0.4
0.6
0.8
1.0
1.2
1.4
Linear P < 0.001Quadratic P = 0.008
Standardized total tract digestible Ca, %
0.3 0.4 0.5 0.6 0.70.0
0.5
1.0
1.5
2.0
2.5Linear P = 0.158Quadratic P = 0.007
mR
NA
fold
cha
nge
TRPV6
TRPV5
ATP2B1
S100G
CALB1
VDR
Figure 5.8. Expression of genes related to transcellular transportation of Ca in kidney of pigs fed
0.32, 0.40, 0.48, 0.56, 0.64, or 0.72% STTD Ca and 0.36% STTD P. The P-values for linear and
quadratic effect of increasing concentration of STTD Ca and means for each diet and
139
Figure 5.8. (Cont.)
standard errors (vertical bars) are indicated. TRPV6 = transient receptor potential cation channel,
subfamily V, member 6; TRPV5 = transient receptor potential cation channel, subfamily V,
member 5; ATP2B1 = ATPase, Ca++ transporting, plasma membrane 1; S100G = S100 calcium
binding protein G; CALB1 = calbindin 1, 28kDa; VDR = vitamin D (1, 25-dihydroxyvitamin D3)
receptor.
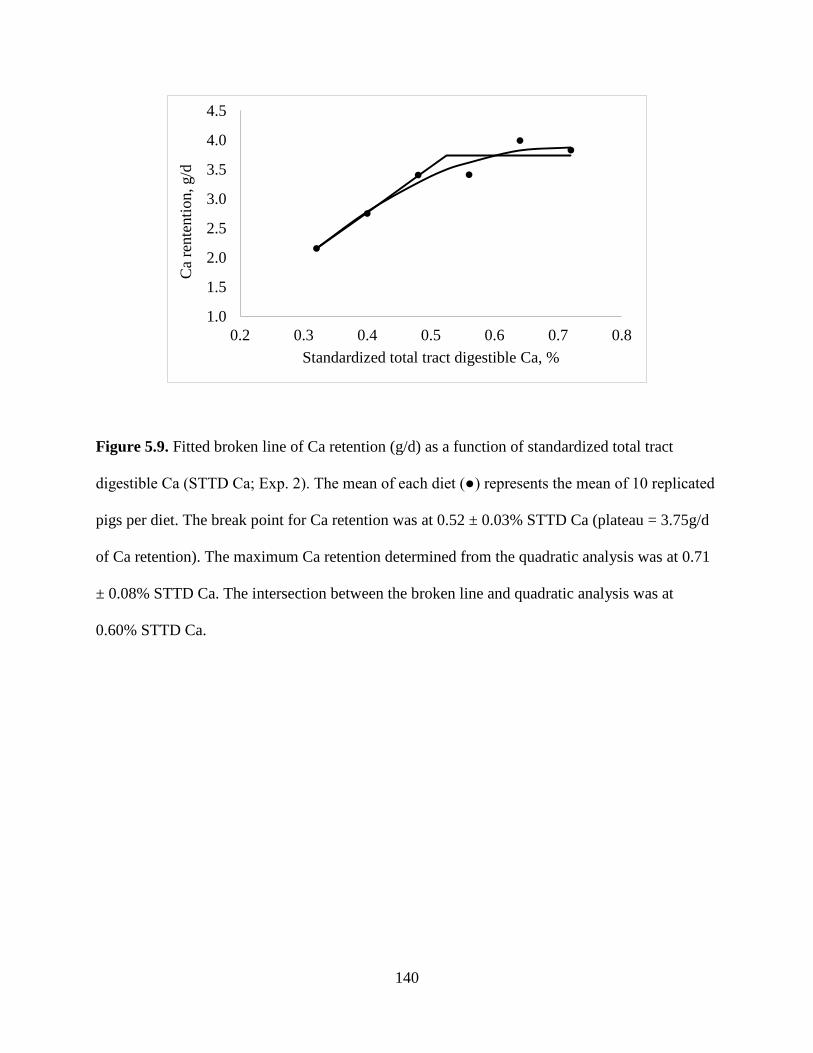
140
Figure 5.9. Fitted broken line of Ca retention (g/d) as a function of standardized total tract
digestible Ca (STTD Ca; Exp. 2). The mean of each diet (●) represents the mean of 10 replicated
pigs per diet. The break point for Ca retention was at 0.52 ± 0.03% STTD Ca (plateau = 3.75g/d
of Ca retention). The maximum Ca retention determined from the quadratic analysis was at 0.71
± 0.08% STTD Ca. The intersection between the broken line and quadratic analysis was at
0.60% STTD Ca.
1.0
1.5
2.0
2.5
3.0
3.5
4.0
4.5
0.2 0.3 0.4 0.5 0.6 0.7 0.8
Ca
rent
entio
n, g
/d
Standardized total tract digestible Ca, %
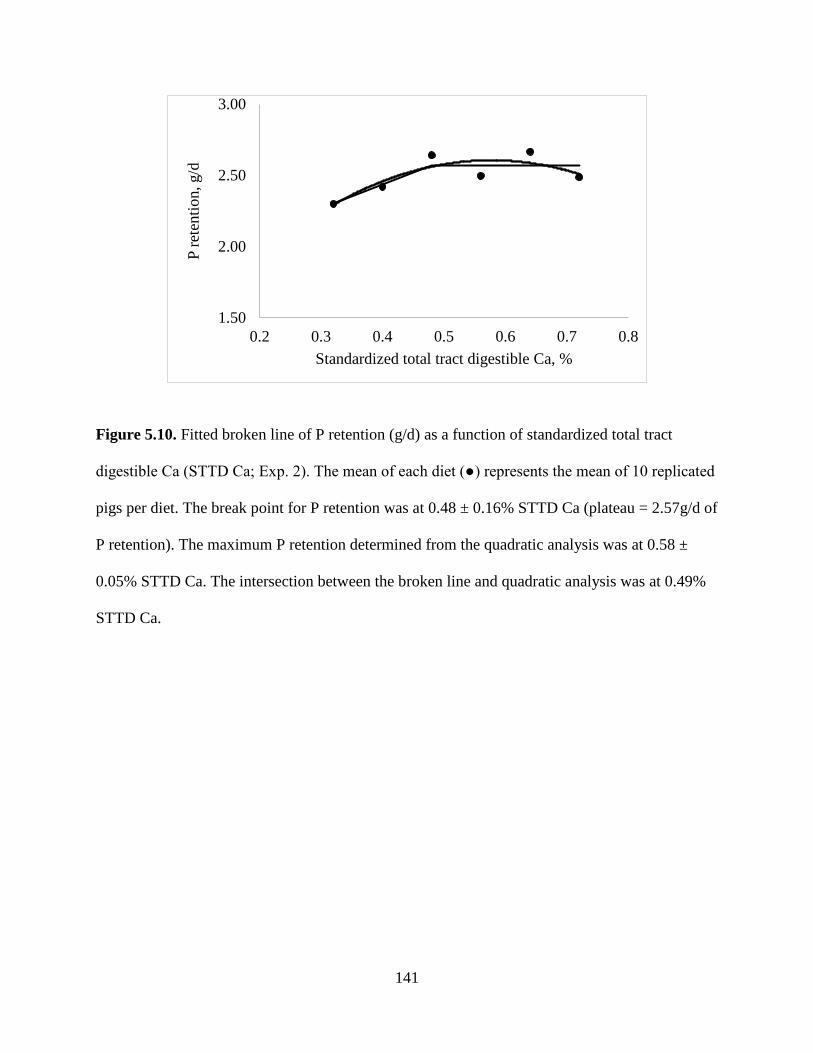
141
Figure 5.10. Fitted broken line of P retention (g/d) as a function of standardized total tract
digestible Ca (STTD Ca; Exp. 2). The mean of each diet (●) represents the mean of 10 replicated
pigs per diet. The break point for P retention was at 0.48 ± 0.16% STTD Ca (plateau = 2.57g/d of
P retention). The maximum P retention determined from the quadratic analysis was at 0.58 ±
0.05% STTD Ca. The intersection between the broken line and quadratic analysis was at 0.49%
STTD Ca.
1.50
2.00
2.50
3.00
0.2 0.3 0.4 0.5 0.6 0.7 0.8
P re
tent
ion,
g/d
Standardized total tract digestible Ca, %
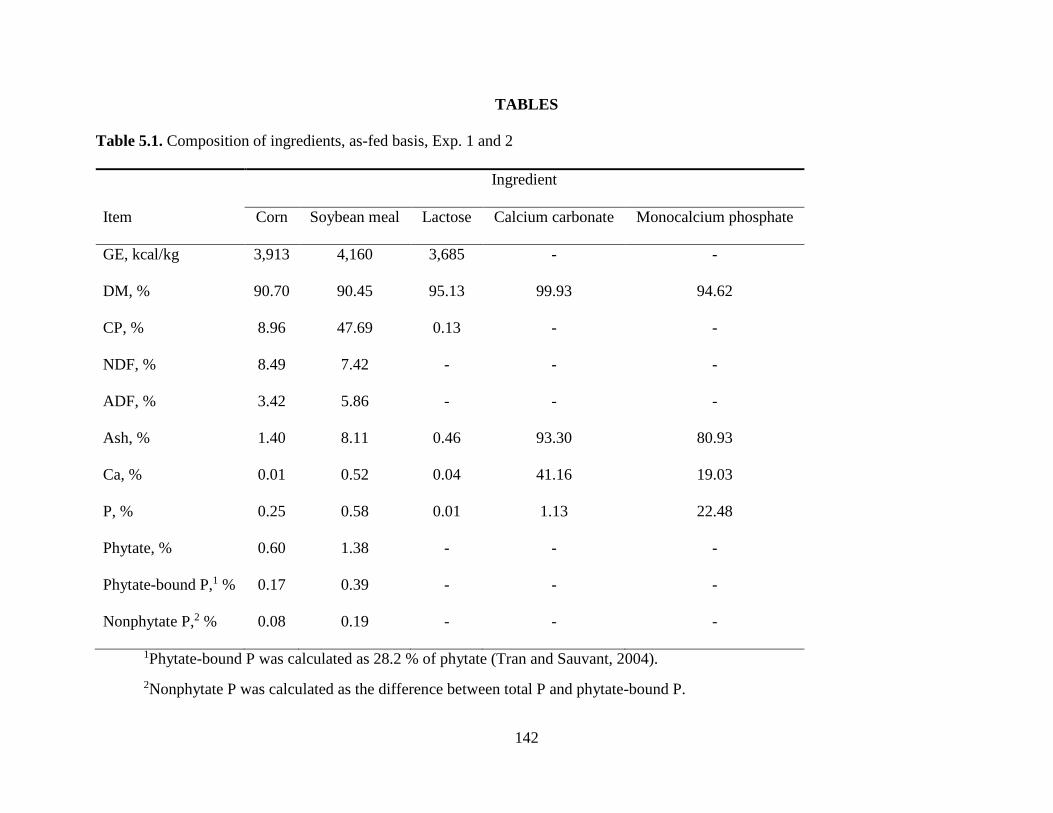
142
TABLES
Table 5.1. Composition of ingredients, as-fed basis, Exp. 1 and 2
Ingredient
Item Corn Soybean meal Lactose Calcium carbonate Monocalcium phosphate
GE, kcal/kg 3,913 4,160 3,685 - -
DM, % 90.70 90.45 95.13 99.93 94.62
CP, % 8.96 47.69 0.13 - -
NDF, % 8.49 7.42 - - -
ADF, % 3.42 5.86 - - -
Ash, % 1.40 8.11 0.46 93.30 80.93
Ca, % 0.01 0.52 0.04 41.16 19.03
P, % 0.25 0.58 0.01 1.13 22.48
Phytate, % 0.60 1.38 - - -
Phytate-bound P,1 % 0.17 0.39 - - -
Nonphytate P,2 % 0.08 0.19 - - -
1Phytate-bound P was calculated as 28.2 % of phytate (Tran and Sauvant, 2004). 2Nonphytate P was calculated as the difference between total P and phytate-bound P.
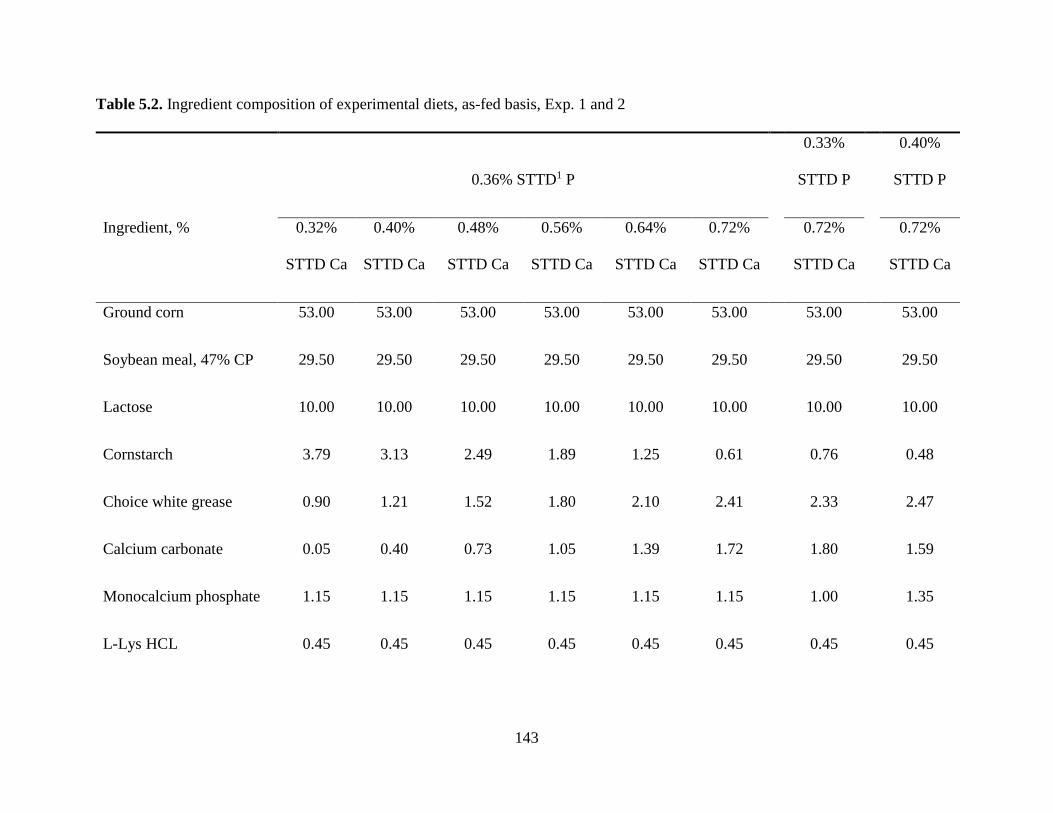
143
Table 5.2. Ingredient composition of experimental diets, as-fed basis, Exp. 1 and 2
0.36% STTD1 P
0.33%
STTD P
0.40%
STTD P
Ingredient, % 0.32%
STTD Ca
0.40%
STTD Ca
0.48%
STTD Ca
0.56%
STTD Ca
0.64%
STTD Ca
0.72%
STTD Ca
0.72%
STTD Ca
0.72%
STTD Ca
Ground corn 53.00 53.00 53.00 53.00 53.00 53.00 53.00 53.00
Soybean meal, 47% CP 29.50 29.50 29.50 29.50 29.50 29.50 29.50 29.50
Lactose 10.00 10.00 10.00 10.00 10.00 10.00 10.00 10.00
Cornstarch 3.79 3.13 2.49 1.89 1.25 0.61 0.76 0.48
Choice white grease 0.90 1.21 1.52 1.80 2.10 2.41 2.33 2.47
Calcium carbonate 0.05 0.40 0.73 1.05 1.39 1.72 1.80 1.59
Monocalcium phosphate 1.15 1.15 1.15 1.15 1.15 1.15 1.00 1.35
L-Lys HCL 0.45 0.45 0.45 0.45 0.45 0.45 0.45 0.45
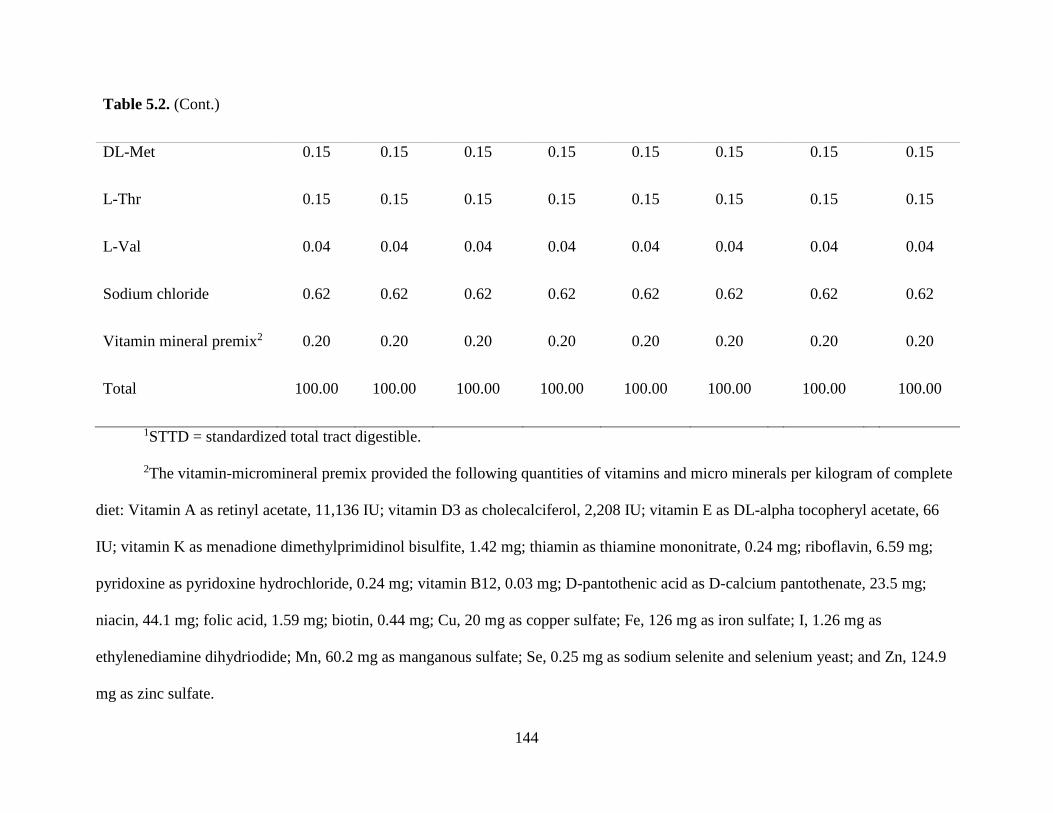
144
Table 5.2. (Cont.)
DL-Met 0.15 0.15 0.15 0.15 0.15 0.15 0.15 0.15
L-Thr 0.15 0.15 0.15 0.15 0.15 0.15 0.15 0.15
L-Val 0.04 0.04 0.04 0.04 0.04 0.04 0.04 0.04
Sodium chloride 0.62 0.62 0.62 0.62 0.62 0.62 0.62 0.62
Vitamin mineral premix2 0.20 0.20 0.20 0.20 0.20 0.20 0.20 0.20
Total 100.00 100.00 100.00 100.00 100.00 100.00 100.00 100.00
1STTD = standardized total tract digestible.
2The vitamin-micromineral premix provided the following quantities of vitamins and micro minerals per kilogram of complete
diet: Vitamin A as retinyl acetate, 11,136 IU; vitamin D3 as cholecalciferol, 2,208 IU; vitamin E as DL-alpha tocopheryl acetate, 66
IU; vitamin K as menadione dimethylprimidinol bisulfite, 1.42 mg; thiamin as thiamine mononitrate, 0.24 mg; riboflavin, 6.59 mg;
pyridoxine as pyridoxine hydrochloride, 0.24 mg; vitamin B12, 0.03 mg; D-pantothenic acid as D-calcium pantothenate, 23.5 mg;
niacin, 44.1 mg; folic acid, 1.59 mg; biotin, 0.44 mg; Cu, 20 mg as copper sulfate; Fe, 126 mg as iron sulfate; I, 1.26 mg as
ethylenediamine dihydriodide; Mn, 60.2 mg as manganous sulfate; Se, 0.25 mg as sodium selenite and selenium yeast; and Zn, 124.9
mg as zinc sulfate.
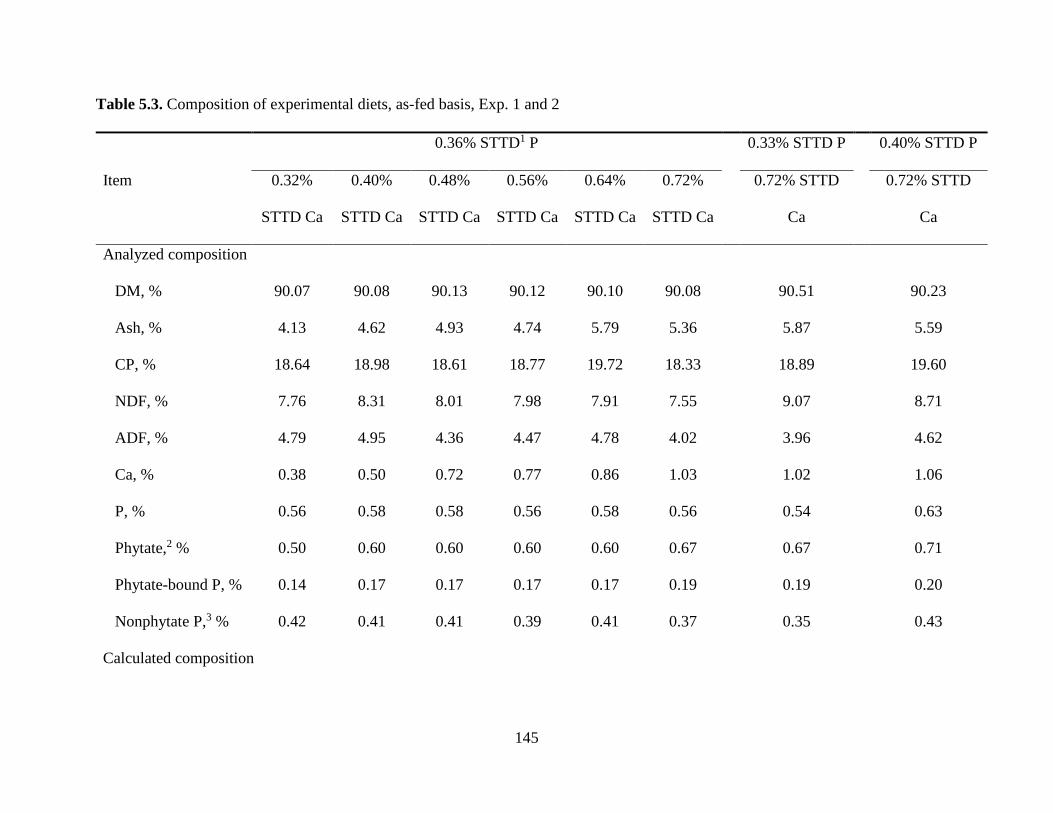
145
Table 5.3. Composition of experimental diets, as-fed basis, Exp. 1 and 2
0.36% STTD1 P 0.33% STTD P 0.40% STTD P
Item 0.32%
STTD Ca
0.40%
STTD Ca
0.48%
STTD Ca
0.56%
STTD Ca
0.64%
STTD Ca
0.72%
STTD Ca
0.72% STTD
Ca
0.72% STTD
Ca
Analyzed composition
DM, % 90.07 90.08 90.13 90.12 90.10 90.08 90.51 90.23
Ash, % 4.13 4.62 4.93 4.74 5.79 5.36 5.87 5.59
CP, % 18.64 18.98 18.61 18.77 19.72 18.33 18.89 19.60
NDF, % 7.76 8.31 8.01 7.98 7.91 7.55 9.07 8.71
ADF, % 4.79 4.95 4.36 4.47 4.78 4.02 3.96 4.62
Ca, % 0.38 0.50 0.72 0.77 0.86 1.03 1.02 1.06
P, % 0.56 0.58 0.58 0.56 0.58 0.56 0.54 0.63
Phytate,2 % 0.50 0.60 0.60 0.60 0.60 0.67 0.67 0.71
Phytate-bound P, % 0.14 0.17 0.17 0.17 0.17 0.19 0.19 0.20
Nonphytate P,3 % 0.42 0.41 0.41 0.39 0.41 0.37 0.35 0.43
Calculated composition
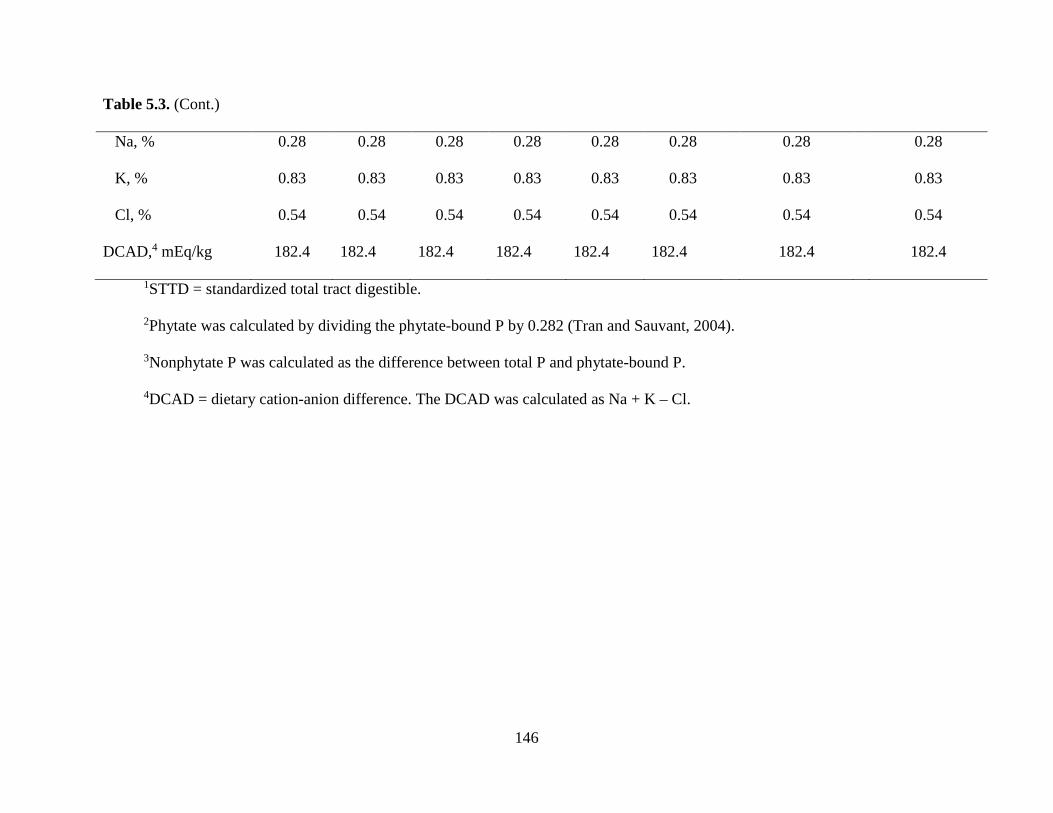
146
Table 5.3. (Cont.)
Na, % 0.28 0.28 0.28 0.28 0.28 0.28 0.28 0.28
K, % 0.83 0.83 0.83 0.83 0.83 0.83 0.83 0.83
Cl, % 0.54 0.54 0.54 0.54 0.54 0.54 0.54 0.54
DCAD,4 mEq/kg 182.4 182.4 182.4 182.4 182.4 182.4 182.4 182.4
1STTD = standardized total tract digestible.
2Phytate was calculated by dividing the phytate-bound P by 0.282 (Tran and Sauvant, 2004).
3Nonphytate P was calculated as the difference between total P and phytate-bound P.
4DCAD = dietary cation-anion difference. The DCAD was calculated as Na + K – Cl.
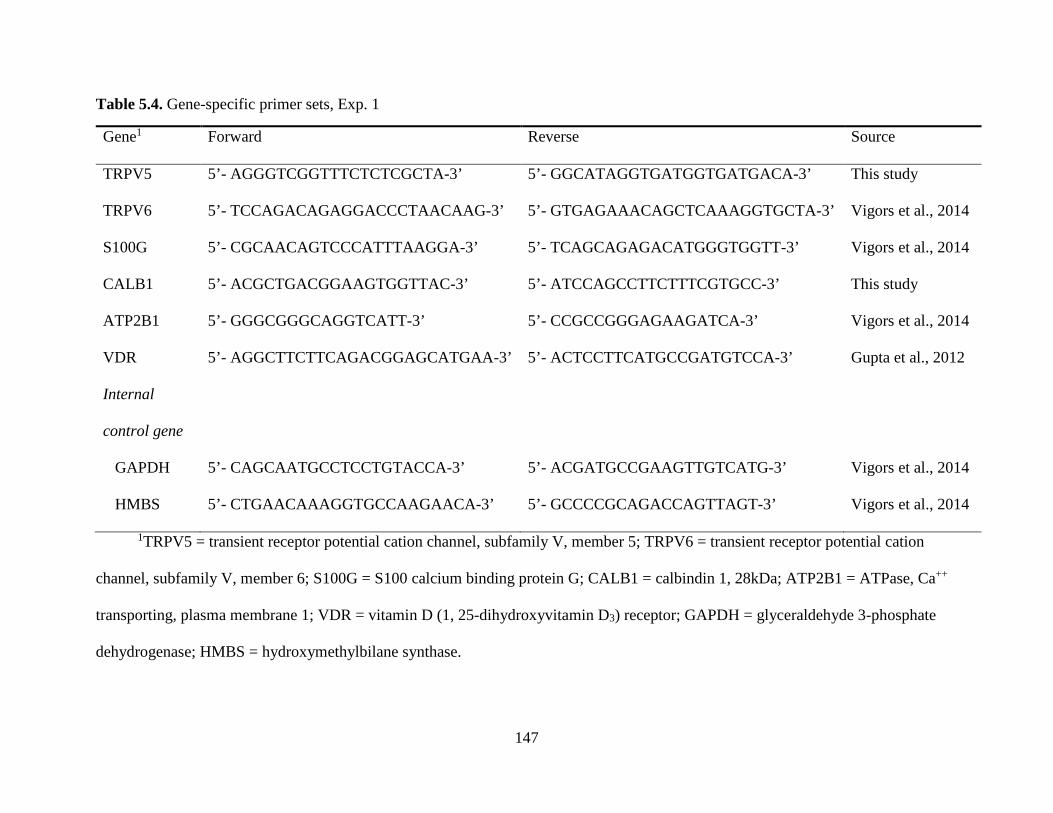
147
Table 5.4. Gene-specific primer sets, Exp. 1
Gene1 Forward Reverse Source
TRPV5 5’- AGGGTCGGTTTCTCTCGCTA-3’ 5’- GGCATAGGTGATGGTGATGACA-3’ This study
TRPV6 5’- TCCAGACAGAGGACCCTAACAAG-3’ 5’- GTGAGAAACAGCTCAAAGGTGCTA-3’ Vigors et al., 2014
S100G 5’- CGCAACAGTCCCATTTAAGGA-3’ 5’- TCAGCAGAGACATGGGTGGTT-3’ Vigors et al., 2014
CALB1 5’- ACGCTGACGGAAGTGGTTAC-3’ 5’- ATCCAGCCTTCTTTCGTGCC-3’ This study
ATP2B1 5’- GGGCGGGCAGGTCATT-3’ 5’- CCGCCGGGAGAAGATCA-3’ Vigors et al., 2014
VDR 5’- AGGCTTCTTCAGACGGAGCATGAA-3’ 5’- ACTCCTTCATGCCGATGTCCA-3’ Gupta et al., 2012
Internal
control gene
GAPDH 5’- CAGCAATGCCTCCTGTACCA-3’ 5’- ACGATGCCGAAGTTGTCATG-3’ Vigors et al., 2014
HMBS 5’- CTGAACAAAGGTGCCAAGAACA-3’ 5’- GCCCCGCAGACCAGTTAGT-3’ Vigors et al., 2014
1TRPV5 = transient receptor potential cation channel, subfamily V, member 5; TRPV6 = transient receptor potential cation
channel, subfamily V, member 6; S100G = S100 calcium binding protein G; CALB1 = calbindin 1, 28kDa; ATP2B1 = ATPase, Ca++
transporting, plasma membrane 1; VDR = vitamin D (1, 25-dihydroxyvitamin D3) receptor; GAPDH = glyceraldehyde 3-phosphate
dehydrogenase; HMBS = hydroxymethylbilane synthase.
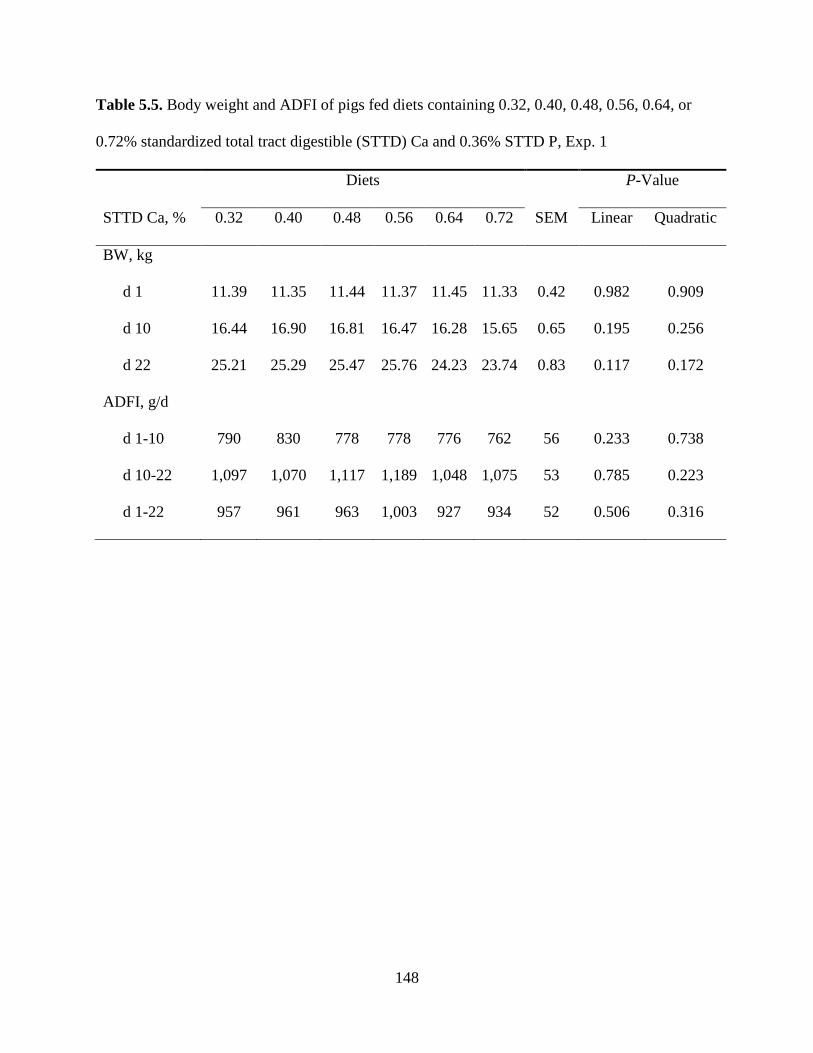
148
Table 5.5. Body weight and ADFI of pigs fed diets containing 0.32, 0.40, 0.48, 0.56, 0.64, or
0.72% standardized total tract digestible (STTD) Ca and 0.36% STTD P, Exp. 1
Diets P-Value
STTD Ca, % 0.32 0.40 0.48 0.56 0.64 0.72 SEM Linear Quadratic
BW, kg
d 1 11.39 11.35 11.44 11.37 11.45 11.33 0.42 0.982 0.909
d 10 16.44 16.90 16.81 16.47 16.28 15.65 0.65 0.195 0.256
d 22 25.21 25.29 25.47 25.76 24.23 23.74 0.83 0.117 0.172
ADFI, g/d
d 1-10 790 830 778 778 776 762 56 0.233 0.738
d 10-22 1,097 1,070 1,117 1,189 1,048 1,075 53 0.785 0.223
d 1-22 957 961 963 1,003 927 934 52 0.506 0.316
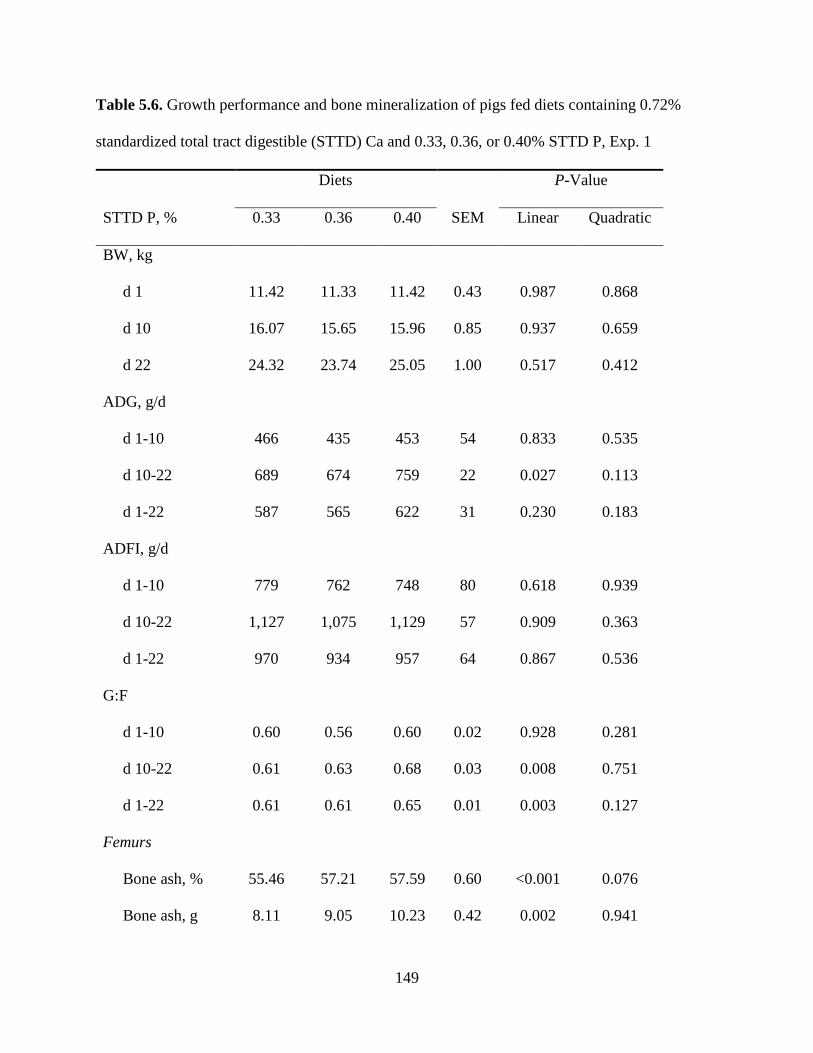
149
Table 5.6. Growth performance and bone mineralization of pigs fed diets containing 0.72%
standardized total tract digestible (STTD) Ca and 0.33, 0.36, or 0.40% STTD P, Exp. 1
Diets P-Value
STTD P, % 0.33 0.36 0.40 SEM Linear Quadratic
BW, kg
d 1 11.42 11.33 11.42 0.43 0.987 0.868
d 10 16.07 15.65 15.96 0.85 0.937 0.659
d 22 24.32 23.74 25.05 1.00 0.517 0.412
ADG, g/d
d 1-10 466 435 453 54 0.833 0.535
d 10-22 689 674 759 22 0.027 0.113
d 1-22 587 565 622 31 0.230 0.183
ADFI, g/d
d 1-10 779 762 748 80 0.618 0.939
d 10-22 1,127 1,075 1,129 57 0.909 0.363
d 1-22 970 934 957 64 0.867 0.536
G:F
d 1-10 0.60 0.56 0.60 0.02 0.928 0.281
d 10-22 0.61 0.63 0.68 0.03 0.008 0.751
d 1-22 0.61 0.61 0.65 0.01 0.003 0.127
Femurs
Bone ash, % 55.46 57.21 57.59 0.60 <0.001 0.076
Bone ash, g 8.11 9.05 10.23 0.42 0.002 0.941
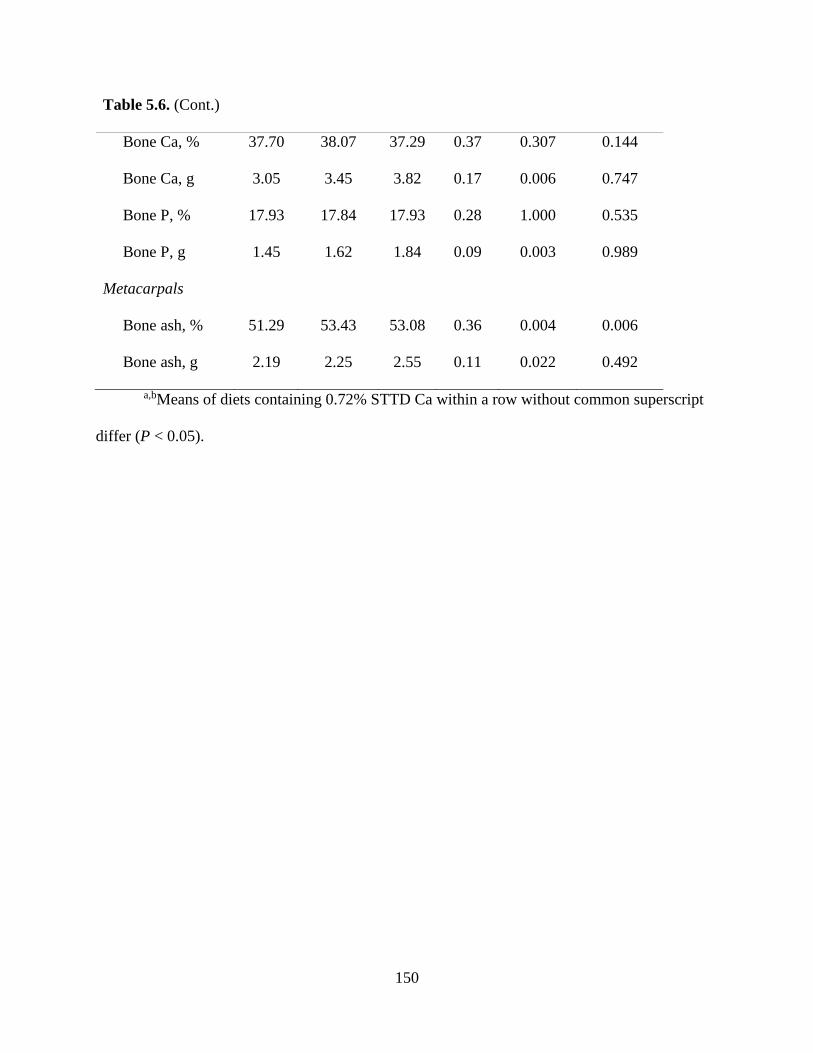
150
Table 5.6. (Cont.)
Bone Ca, % 37.70 38.07 37.29 0.37 0.307 0.144
Bone Ca, g 3.05 3.45 3.82 0.17 0.006 0.747
Bone P, % 17.93 17.84 17.93 0.28 1.000 0.535
Bone P, g 1.45 1.62 1.84 0.09 0.003 0.989
Metacarpals
Bone ash, % 51.29 53.43 53.08 0.36 0.004 0.006
Bone ash, g 2.19 2.25 2.55 0.11 0.022 0.492
a,bMeans of diets containing 0.72% STTD Ca within a row without common superscript
differ (P < 0.05).
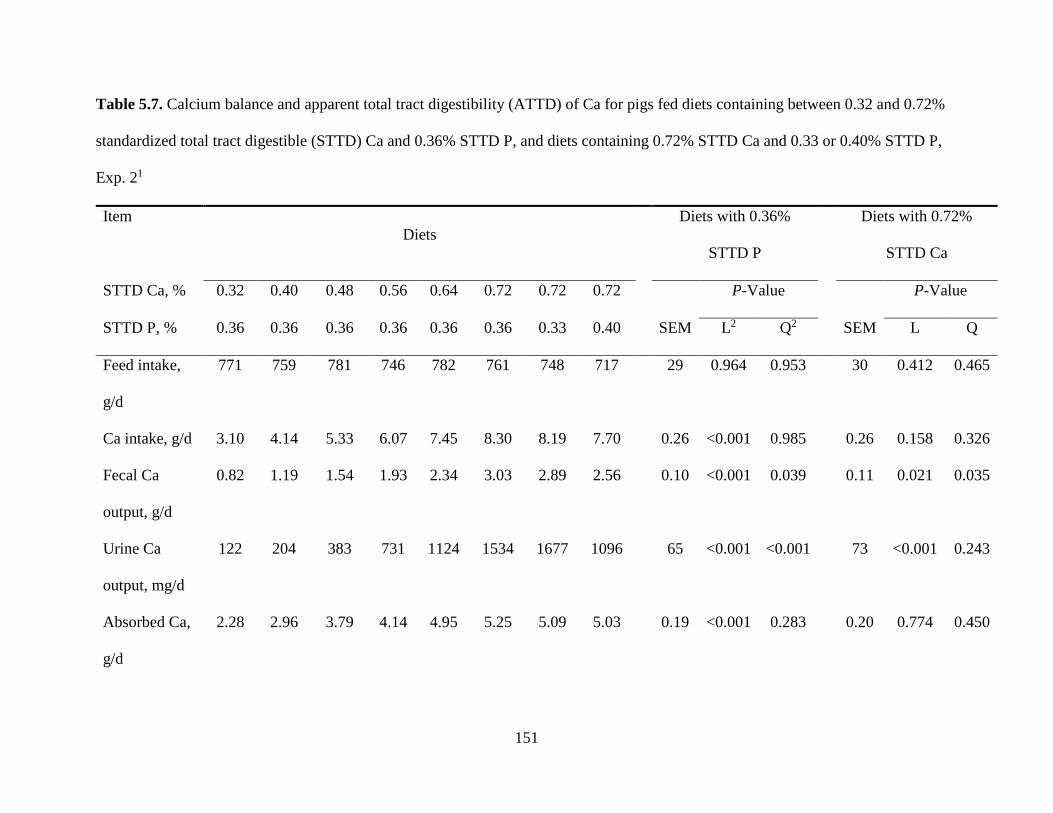
151
Table 5.7. Calcium balance and apparent total tract digestibility (ATTD) of Ca for pigs fed diets containing between 0.32 and 0.72%
standardized total tract digestible (STTD) Ca and 0.36% STTD P, and diets containing 0.72% STTD Ca and 0.33 or 0.40% STTD P,
Exp. 21
Item Diets
Diets with 0.36%
STTD P
Diets with 0.72%
STTD Ca
STTD Ca, % 0.32 0.40 0.48 0.56 0.64 0.72 0.72 0.72 P-Value P-Value
STTD P, % 0.36 0.36 0.36 0.36 0.36 0.36 0.33 0.40 SEM L2 Q2 SEM L Q
Feed intake,
g/d
771 759 781 746 782 761 748 717 29 0.964 0.953 30 0.412 0.465
Ca intake, g/d 3.10 4.14 5.33 6.07 7.45 8.30 8.19 7.70 0.26 <0.001 0.985 0.26 0.158 0.326
Fecal Ca
output, g/d
0.82 1.19 1.54 1.93 2.34 3.03 2.89 2.56 0.10 <0.001 0.039 0.11 0.021 0.035
Urine Ca
output, mg/d
122 204 383 731 1124 1534 1677 1096 65 <0.001 <0.001 73 <0.001 0.243
Absorbed Ca,
g/d
2.28 2.96 3.79 4.14 4.95 5.25 5.09 5.03 0.19 <0.001 0.283 0.20 0.774 0.450
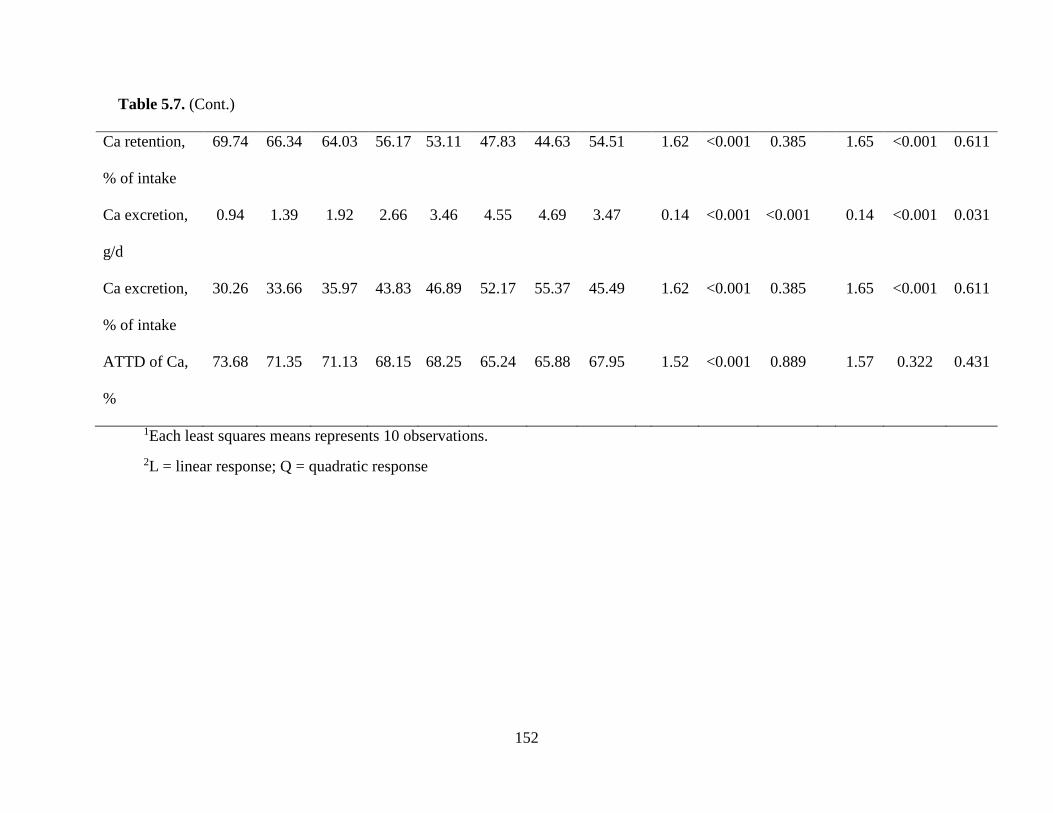
152
Table 5.7. (Cont.)
Ca retention,
% of intake
69.74 66.34 64.03 56.17 53.11 47.83 44.63 54.51 1.62 <0.001 0.385 1.65 <0.001 0.611
Ca excretion,
g/d
0.94 1.39 1.92 2.66 3.46 4.55 4.69 3.47 0.14 <0.001 <0.001 0.14 <0.001 0.031
Ca excretion,
% of intake
30.26 33.66 35.97 43.83 46.89 52.17 55.37 45.49 1.62 <0.001 0.385 1.65 <0.001 0.611
ATTD of Ca,
%
73.68 71.35 71.13 68.15 68.25 65.24 65.88 67.95 1.52 <0.001 0.889 1.57 0.322 0.431
1Each least squares means represents 10 observations. 2L = linear response; Q = quadratic response
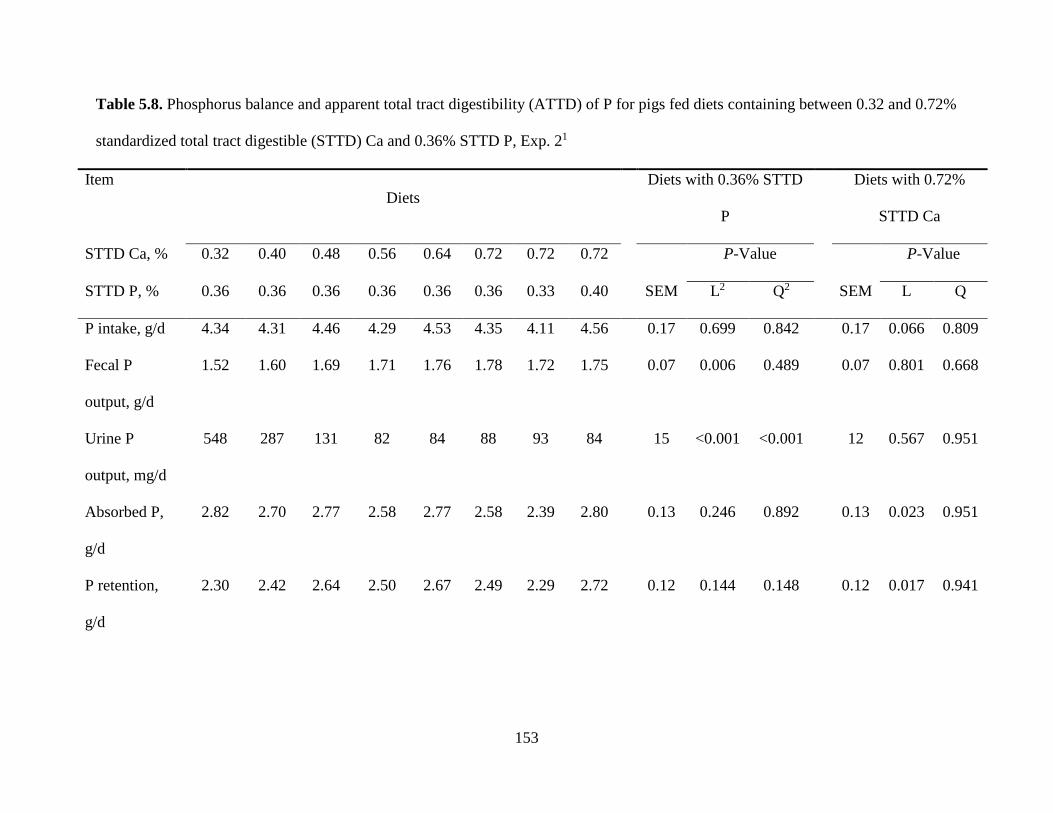
153
Table 5.8. Phosphorus balance and apparent total tract digestibility (ATTD) of P for pigs fed diets containing between 0.32 and 0.72%
standardized total tract digestible (STTD) Ca and 0.36% STTD P, Exp. 21
Item Diets
Diets with 0.36% STTD
P
Diets with 0.72%
STTD Ca
STTD Ca, % 0.32 0.40 0.48 0.56 0.64 0.72 0.72 0.72 P-Value P-Value
STTD P, % 0.36 0.36 0.36 0.36 0.36 0.36 0.33 0.40 SEM L2 Q2 SEM L Q
P intake, g/d 4.34 4.31 4.46 4.29 4.53 4.35 4.11 4.56 0.17 0.699 0.842 0.17 0.066 0.809
Fecal P
output, g/d
1.52 1.60 1.69 1.71 1.76 1.78 1.72 1.75 0.07 0.006 0.489 0.07 0.801 0.668
Urine P
output, mg/d
548 287 131 82 84 88 93 84 15 <0.001 <0.001 12 0.567 0.951
Absorbed P,
g/d
2.82 2.70 2.77 2.58 2.77 2.58 2.39 2.80 0.13 0.246 0.892 0.13 0.023 0.951
P retention,
g/d
2.30 2.42 2.64 2.50 2.67 2.49 2.29 2.72 0.12 0.144 0.148 0.12 0.017 0.941
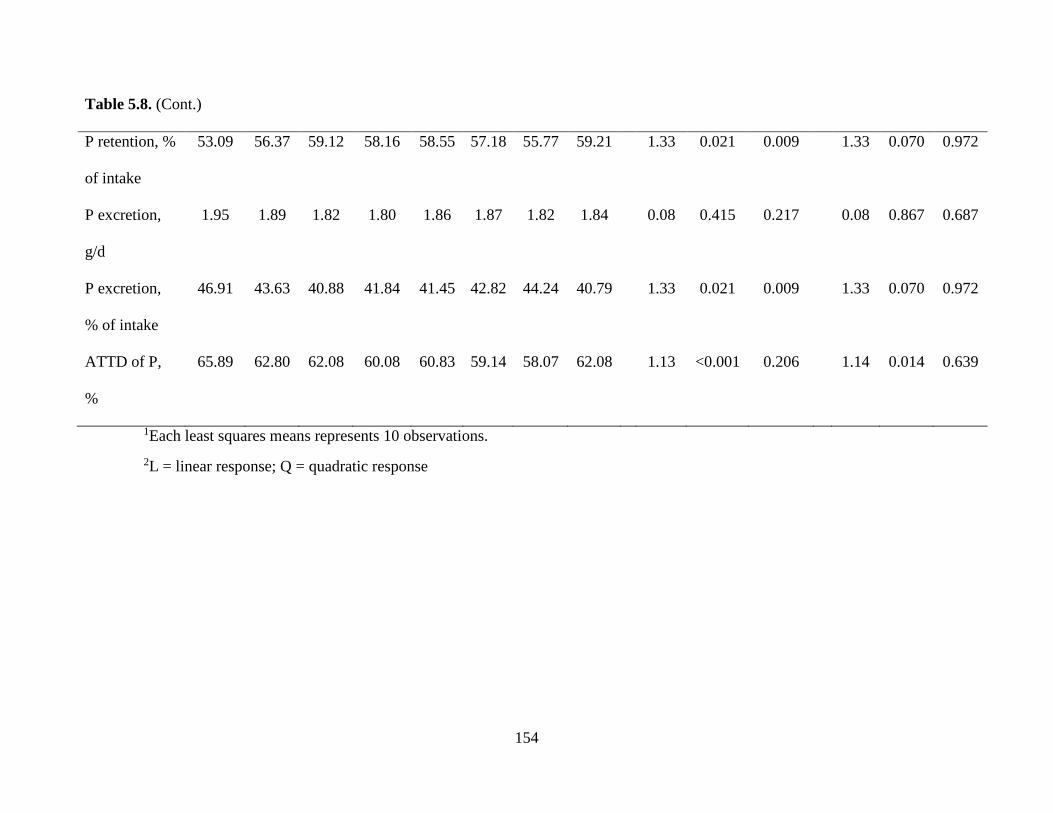
154
Table 5.8. (Cont.)
P retention, %
of intake
53.09 56.37 59.12 58.16 58.55 57.18 55.77 59.21 1.33 0.021 0.009 1.33 0.070 0.972
P excretion,
g/d
1.95 1.89 1.82 1.80 1.86 1.87 1.82 1.84 0.08 0.415 0.217 0.08 0.867 0.687
P excretion,
% of intake
46.91 43.63 40.88 41.84 41.45 42.82 44.24 40.79 1.33 0.021 0.009 1.33 0.070 0.972
ATTD of P,
%
65.89 62.80 62.08 60.08 60.83 59.14 58.07 62.08 1.13 <0.001 0.206 1.14 0.014 0.639
1Each least squares means represents 10 observations. 2L = linear response; Q = quadratic response
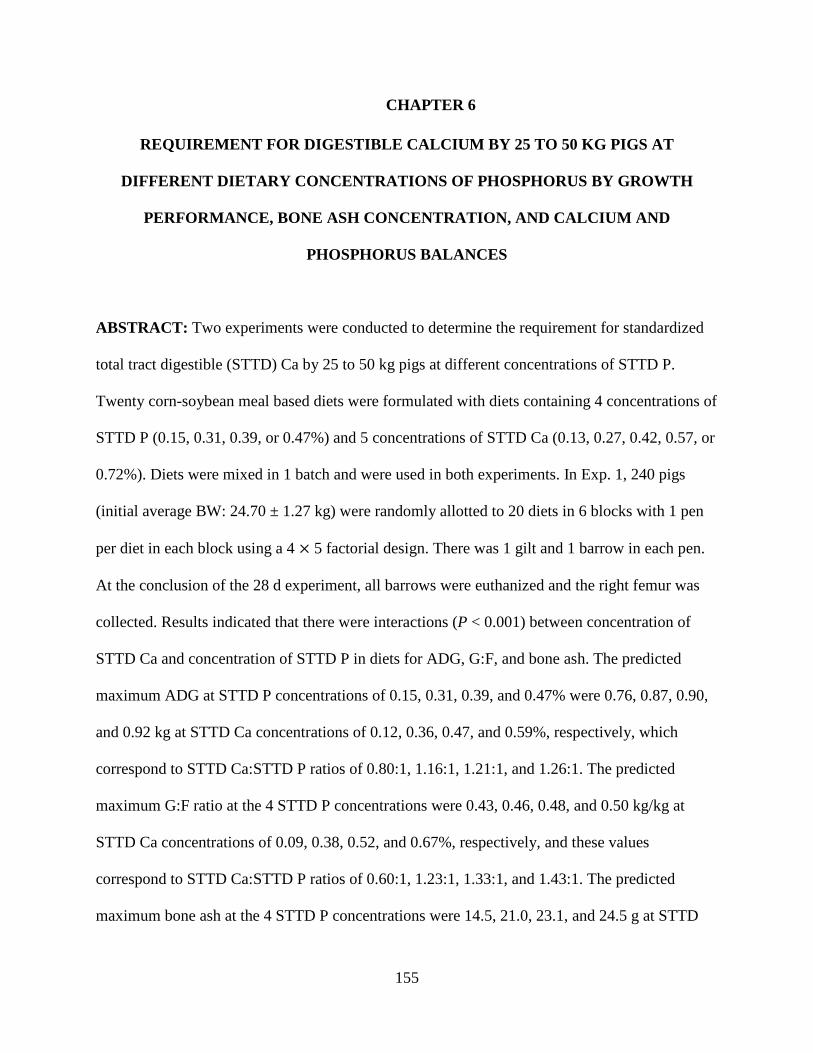
155
CHAPTER 6
REQUIREMENT FOR DIGESTIBLE CALCIUM BY 25 TO 50 KG PIGS AT
DIFFERENT DIETARY CONCENTRATIONS OF PHOSPHORUS BY GROWTH
PERFORMANCE, BONE ASH CONCENTRATION, AND CALCIUM AND
PHOSPHORUS BALANCES
ABSTRACT: Two experiments were conducted to determine the requirement for standardized
total tract digestible (STTD) Ca by 25 to 50 kg pigs at different concentrations of STTD P.
Twenty corn-soybean meal based diets were formulated with diets containing 4 concentrations of
STTD P (0.15, 0.31, 0.39, or 0.47%) and 5 concentrations of STTD Ca (0.13, 0.27, 0.42, 0.57, or
0.72%). Diets were mixed in 1 batch and were used in both experiments. In Exp. 1, 240 pigs
(initial average BW: 24.70 ± 1.27 kg) were randomly allotted to 20 diets in 6 blocks with 1 pen
per diet in each block using a 4 × 5 factorial design. There was 1 gilt and 1 barrow in each pen.
At the conclusion of the 28 d experiment, all barrows were euthanized and the right femur was
collected. Results indicated that there were interactions (P < 0.001) between concentration of
STTD Ca and concentration of STTD P in diets for ADG, G:F, and bone ash. The predicted
maximum ADG at STTD P concentrations of 0.15, 0.31, 0.39, and 0.47% were 0.76, 0.87, 0.90,
and 0.92 kg at STTD Ca concentrations of 0.12, 0.36, 0.47, and 0.59%, respectively, which
correspond to STTD Ca:STTD P ratios of 0.80:1, 1.16:1, 1.21:1, and 1.26:1. The predicted
maximum G:F ratio at the 4 STTD P concentrations were 0.43, 0.46, 0.48, and 0.50 kg/kg at
STTD Ca concentrations of 0.09, 0.38, 0.52, and 0.67%, respectively, and these values
correspond to STTD Ca:STTD P ratios of 0.60:1, 1.23:1, 1.33:1, and 1.43:1. The predicted
maximum bone ash at the 4 STTD P concentrations were 14.5, 21.0, 23.1, and 24.5 g at STTD
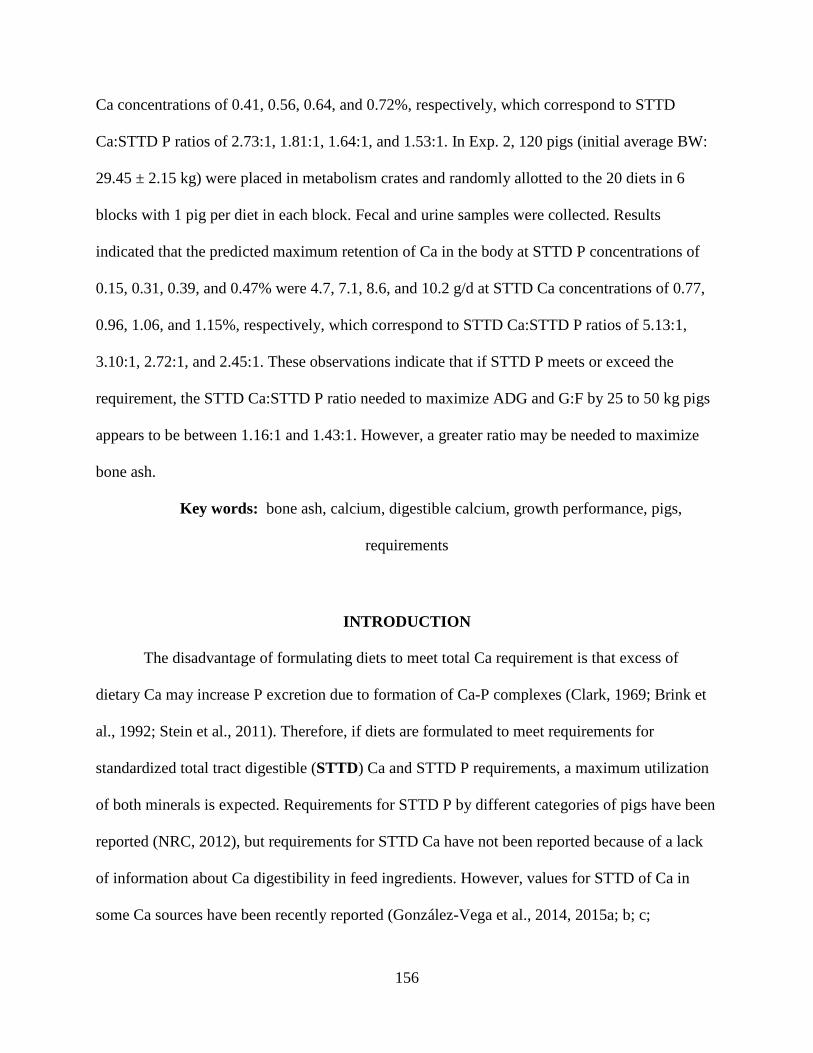
156
Ca concentrations of 0.41, 0.56, 0.64, and 0.72%, respectively, which correspond to STTD
Ca:STTD P ratios of 2.73:1, 1.81:1, 1.64:1, and 1.53:1. In Exp. 2, 120 pigs (initial average BW:
29.45 ± 2.15 kg) were placed in metabolism crates and randomly allotted to the 20 diets in 6
blocks with 1 pig per diet in each block. Fecal and urine samples were collected. Results
indicated that the predicted maximum retention of Ca in the body at STTD P concentrations of
0.15, 0.31, 0.39, and 0.47% were 4.7, 7.1, 8.6, and 10.2 g/d at STTD Ca concentrations of 0.77,
0.96, 1.06, and 1.15%, respectively, which correspond to STTD Ca:STTD P ratios of 5.13:1,
3.10:1, 2.72:1, and 2.45:1. These observations indicate that if STTD P meets or exceed the
requirement, the STTD Ca:STTD P ratio needed to maximize ADG and G:F by 25 to 50 kg pigs
appears to be between 1.16:1 and 1.43:1. However, a greater ratio may be needed to maximize
bone ash.
Key words: bone ash, calcium, digestible calcium, growth performance, pigs,
requirements
INTRODUCTION
The disadvantage of formulating diets to meet total Ca requirement is that excess of
dietary Ca may increase P excretion due to formation of Ca-P complexes (Clark, 1969; Brink et
al., 1992; Stein et al., 2011). Therefore, if diets are formulated to meet requirements for
standardized total tract digestible (STTD) Ca and STTD P requirements, a maximum utilization
of both minerals is expected. Requirements for STTD P by different categories of pigs have been
reported (NRC, 2012), but requirements for STTD Ca have not been reported because of a lack
of information about Ca digestibility in feed ingredients. However, values for STTD of Ca in
some Ca sources have been recently reported (González-Vega et al., 2014, 2015a; b; c;
157
Merriman and Stein, 2015), and as a consequence, requirements for STTD Ca can be determined.
An attempt to determine the requirement for STTD Ca by 11 to 25 kg pigs was made (González-
Vega et al., 2015c), and results indicated that the STTD Ca to STTD P ratio was important in the
diet. A negative effect of increasing concentration of dietary STTD Ca was observed for ADG
and G:F, and ADG and G:F were maximized at a STTD Ca:STTD P ratio below 1.39:1 and
1.50:1, respectively. However, bone ash and the quantity of Ca and P retained in the body were
maximized if the STTD Ca: STTD P ratio was between 1.33:1 and 1.67:1. These ratios are in
agreement with the ratio between Ca and P in the body of pigs, which has been reported to be in
the range between 1.20:1 and 1.60:1 (Rymarz et al., 1982; Hendriks and Moughan, 1993; Mahan
and Shields, 1998; Wiseman et al., 2009; Pettey et al., 2015). There are, however, no estimates
for the STTD Ca requirement by 25 to 50 kg pigs. Thus, the present experiments were conducted
to test the hypothesis that a wide range of STTD Ca:STTD P negatively affects growth
performance, therefore, the requirement for STTD Ca by 25 to 50 kg pigs needed to maximize
ADG, G:F, bone ash, and Ca retention will be determined at different concentrations of STTD P.
MATERIALS AND METHODS
The Institutional Animal Care and Use Committee at the University of Illinois reviewed
and approved the protocol for 2 experiments. Pigs used in both experiments were the offspring of
PIC 359 boars and F-46 sows (Pig Improvement Company, Hendersonville, TN).
Experiment 1: Requirements for Digestible Ca to Maximize Growth Performance and Bone
Ash
Animals, Diets, and Feeding. Two hundred and forty pigs (initial average BW: 24.70 ± 1.27 kg)
were randomly allotted to 20 diets in 6 blocks with 1 pen per diet in each block using a 4 × 5
158
factorial design. The Experimental Animal Allotment Program (Kim and Lindemann, 2007) was
used to allot pigs to experimental diets. Pen was the experimental unit and there was 1 gilt and 1
barrow in each pen. Room temperature was controlled and each pen had a feeder, a nipple
drinker, and a fully slatted concrete floor. Feed and water were available at all times.
Twenty corn-soybean meal based diets were formulated to contain different Ca and P
concentrations, but to keep the concentration of phytate constant, all diets contained the same
amount of corn and soybean meal (Table 6.1). Diets were formulated to contain 0.15, 0.31, 0.39,
or 0.47% STTD P and 0.18, 0.42, 0.66, 0.90, or 1.14% total Ca (0.13, 0.27, 0.42, 0.57, or 0.72%
STTD Ca), respectively; Tables 6.2 and 6.3. Concentrations of P ranged from 48 to 152% of the
STTD P requirement (NRC, 2012) and concentrations of Ca ranged from 27 to 173% of the total
Ca requirement (NRC, 2012). The concentration of P was increased in the diets by adding
increased concentrations of monosodium phosphate (MSP), but to maintain the same Na
concentration among diets, inclusion of sodium bicarbonate was reduced as MSP increased in the
diets.
Growth Performance and Bone Measurements. Pig weights were recorded on d 1 and
28. Pigs were allowed ad libitum access to feed and the amount of feed offered each day was
recorded. To calculate feed intake, the amount of feed in the feeders on d 28 was subtracted from
the total amount of feed offered. On d 28, all barrows were euthanized via captive bolt stunning.
Stomach contents were immediately collected to measure pH. The right femurs were removed,
cleaned, and stored at -20ºC. The frozen bones were later thawed, broken, and soaked in
petroleum ether under a chemical hood for 72 h to remove bone marrow and fat. Bones were
dried overnight at 130ºC and then ashed at 600ºC for 24 h.
159
Sample Analysis. Corn, soybean meal, calcium carbonate, MSP, monocalcium phosphate
(MCP), NaCl, and diets were analyzed for DM by oven drying at 135°C for 2 h (Method 930.15;
AOAC Int., 2007), for ash (Method 942.05; AOAC Int., 2007), for Na by flame emission
photometry (Method 956.01; AOAC Int., 2007), and for Cl by manual titration (Method 9.15.01,
943.01; AOAC, 2006). Ingredients, diets, and bone ash were analyzed for Ca and P by
inductively coupled plasma-optical emission spectrometry (ICP-OES; Method 985.01 A, B, and
C; AOAC Int., 2007) after wet ash sample preparation [Method 975.03 B(b); AOAC Int., 2007].
Corn, soybean meal, and diets were analyzed for N using the combustion procedure (Method
990.03; AOAC Int., 2007) on an Elementar Rapid N-cube protein/nitrogen apparatus (Elementar
Americas Inc., Mt. Laurel, NJ) and CP was calculated as N × 6.25. Corn and soybean meal were
analyzed for GE using an isoperibol bomb calorimeter (Model 6300, Parr Instruments, Moline,
IL) and for phytic acid (Megazyme method; AB Vista, Ystrad Mynach, UK). Diets were
analyzed for phytate-P using a Foss near-infrared spectrometer with the phytate-P levels
predicted using AUNIR calibration standards (AB Vista, Memphis, TN). The pH of the stomach
content was measured using a pH meter (Oakton pH 11 Standard Portable Meter, Fisher
Scientific, Pittsburgh, PA, USA).
Calculations and Statistical Analyses. The percentage of phytate-bound P in corn and
soybean meal was calculated as 28.2% of phytate (Tran and Sauvant, 2004). The percentage of
phytate in diets was calculated by dividing the analyzed phytate-bound P by 0.282, and non-
phytate P was calculated by subtracting the amount of phytate-bound P from total P. Dietary
cation-anion difference (DCAD) was calculated using the following equation:
DCAD, mEq/kg = [(Na*10000)/23] + [(K*10000)/39] – [(Cl*10000)/35.5], [1]
where Na, K, and Cl are expressed in percentage of inclusion in diet. The ADG, ADFI, and G:F
160
were calculated. Bone ash percentage was calculated by dividing the quantity of bone ash by the
quantity of fat-free dried bone and multiplying by 100.
Normality of residuals and identification of outliers were determined by the
UNIVARIATE procedure of SAS (SAS Inst. Inc., Cary, NC). Data for BW, ADG, ADFI, G:F,
bone ash, bone Ca, bone P, and stomach pH were analyzed using the Proc MIXED of SAS (SAS
Inst. Inc., Cary, NC). The fixed effects of the model were dietary concentration of STTD Ca,
dietary concentration of STTD P, and the interaction between STTD Ca and STTD P; the
random effect was block. Effect of dietary STTD Ca, STTD P, or the interaction between STTD
Ca and STTD P were considered significant at P ≤ 0.05. If the interaction or the main effects
were significant, the program NLREG was used to determine parameter estimates for the surface
response model to increasing concentrations of STTD Ca and STTD P. The parameter estimates
of the model that were not significant (P > 0.05) and were not included in a significant
interaction were removed from the model and the estimates were recalculated. The surface
response full model was:
Y = a + b × STTD Ca + c × STTD Ca2 + d × STTD P + e × STTD P2 + f × STTD Ca × STTD P,
[2]
where Y was the dependent variable, a was the intercept, b, c, d, e, and f were the coefficients,
STTD Ca and STTD P were the percentage concentrations of dietary STTD Ca and STTD P. If
parameter estimate c was significant (P ≤ 0.05), the concentrations of STTD Ca at the maximum
response values were calculated using the following equation:
STTD Ca max = [(- f × STTD P) – b] / (2 × c), [3]
where STTD Ca max is the concentration of STTD Ca at the maximum response and STTD P is
the percentage concentration of STTD P in the diet. The maximum response values were,
161
therefore, calculated using the respective model equations with the concentrations of STTD Ca at
the maximum response in each concentration of STTD P. The LSMEANS procedure was used to
calculate mean values for treatments and the pen was the experimental unit for all analyses.
Experiment 2. Calcium and P Balance
Animals, Diets, and Feeding. One hundred and twenty pigs (initial average BW: 29.45 ±
2.15 kg) were randomly allotted to 20 diets in 6 blocks with 1 pig per diet in each block using a 4
× 5 factorial design. The 20 diets used in Exp. 1 were also used in Exp. 2, and the amount of
each diet that was needed for both experiments was mixed in 1 batch. Pigs were housed
individually in metabolism crates that were equipped with a slatted floor, a feeder, and a nipple
drinker. Pigs had free access to water throughout the experiment. Each pen had a screen floor for
fecal collection and a urine pan with a urine bucket for total urine collection.
Pigs were fed 3 times the daily maintenance energy requirement (i.e., 197 kcal of ME/kg
BW0.60; NRC, 2012). The daily allotments of feed were divided into 2 equal meals and provided
at 0800 and 1700 h. Pigs were fed each diet for 13 d, the initial 5 d were an adaptation period to
the diets and fecal samples were collected quantitatively from the feed provided from d 6 to 11
using the marker-to-marker approach (Adeola, 2001). The beginning of fecal collections was
marked by adding a color marker (indigo carmine) to the morning meal on d 6, and the
conclusion of fecal collection was marked by adding ferric oxide to the morning meal on d 11.
Urine samples were collected every morning from d 6 to d 11 and 50 mL of 6N HCl was added
to each bucket after they were emptied. Fecal samples and 20% of the collected urine were
stored at -20°C immediately after collection. Orts collected during the collection period were
dried in a forced-air oven at 65ºC and feed intake was calculated by subtracting the orts from
feed allowance. Blood samples were collected on d 1 and d 13 by jugular venipuncture. Samples
162
were immediately centrifuged and plasma samples were collected and stored at -20°C for Ca and
P analysis.
Sample Analysis and Statistical Analyses. Fecal samples were dried in a forced-air oven
at 65°C and ground in a Wiley mill (model 4; Thomas Scientific, Swedesboro, NJ) using a 1-mm
screen. Fecal samples were analyzed for DM as explained for Exp. 1. Fecal and urine samples
were analyzed for Ca and P as explained for Exp. 1. Plasma samples were analyzed for Ca and P
(Method 968.08 D(b); AOAC Int., 2007). The apparent total tract digestibility (ATTD) of Ca
and P were calculated according to standard procedures (NRC, 2012). Values for retention of Ca
and P were calculated as explained by González-Vega et al. (2013). Data were analyzed using
PROC MIXED of SAS and parameter estimates for the surface response model to increasing
levels of STTD Ca and STTD P were determined as explained for Exp. 1. For the urine Ca
output and urine P output data, the surface response full model was:
Y = a + b × STTD Ca + c × STTD Ca2 + d × STTD P + e × STTD P2 + f × STTD Ca × STTD P
+ g × STTD Ca2 × STTD P + h × STTD Ca × STTD P2 + i × STTD Ca2 × STTD P2, [4]
where Y was the dependent variable, a was the intercept, b, c, d, e, f, g, h, and i were the
coefficients, STTD Ca and STTD P are the percentage concentrations of dietary STTD Ca and
STTD P. The concentrations of STTD Ca at the maximum or minimum response values were
calculated using the following equation:
STTD Ca max/min = [- (h × STTD P2 + f × STTD P + b)] / [2 × (i × STTD P2 + g × STTD P +
c)], [5]
where STTD Ca max/min is the percentage concentration of STTD Ca at the maximum or
minimum response and STTD P is the percentage concentration of STTD P in the diet. The
maximum or minimum response values were, therefore, calculated using the respective model
163
equations with the concentrations of STTD Ca at the maximum or minimum response in each
concentration of STTD P. Pig was the experimental unit for all analyses.
RESULTS
Experiment 1: Requirements for Digestible Ca to Maximize Growth Performance and Bone
Ash
All pigs consumed their diets without apparent problems, but 1 gilt and 1 barrow fed the
diet containing 0.13% STTD Ca and 0.47% STTD P died from blocks 3 and 4, respectively. The
ADG, ADFI, and G:F of the pen for these pigs were adjusted (Lindemann and Kim, 2007).
However, values of bone ash, bone Ca, and bone P from this barrow were missing.
The predicted maximum BW at STTD P concentrations of 0.15, 0.31, 0.39, and 0.47%
was 46.0, 49.0, 49.9, and 50.5 kg at STTD Ca concentrations of 0.14, 0.35, 0.45, and 0.56%,
respectively (Table 6.4). These values correspond to STTD Ca:STTD P ratios of 0.93:1, 1.13:1,
1.15:1, and 1.19:1 (Fig. 6.1). The predicted maximum ADG at STTD P concentrations of 0.15,
0.31, 0.39, and 0.47% was 0.76, 0.87, 0.90, and 0.92 kg at STTD Ca concentrations of 0.12,
0.36, 0.47, and 0.59%, respectively, which correspond to STTD Ca:STTD P ratios of 0.80:1,
1.16:1, 1.21:1, and 1.26:1 (Fig. 6.2). The predicted maximum ADFI at the 4 STTD P
concentrations was 1.80, 1.90, 1.89, and 1.85 kg at STTD Ca concentrations of 0.14, 0.33, 0.43,
and 0.52%, respectively, and these values correspond to STTD Ca:STTD P ratios of 0.93:1,
1.06:1, 1.10:1, and 1.11:1 (Fig. 6.3). The predicted maximum G:F at the 4 STTD P
concentrations was 0.43, 0.46, 0.48, and 0.50 kg/kg at STTD Ca concentrations of 0.09, 0.38,
0.52, and 0.67%, respectively, which correspond to STTD Ca:STTD P ratios of 0.60:1, 1.23:1,
1.33:1, and 1.43:1 (Fig. 6.4).
164
The predicted maximum bone ash at STTD P concentrations of 0.15, 0.31, 0.39, and
0.47% was 14.5, 21.0, 23.1, and 24.5 g at STTD Ca concentrations of 0.41, 0.56, 0.64, and
0.72%, respectively (Table 6.5). These values correspond to STTD Ca:STTD P ratios of 2.73:1,
1.81:1, 1.64:1, and 1.53:1 (Fig. 6.5). The predicted maximum bone Ca and bone P at STTD P
concentrations of 0.15, 0.31, 0.39, and 0.47% were 5.7, 8.2, 9.1, and 9.6 g Ca at STTD Ca
concentrations of 0.42, 0.57, 0.65, and 0.73%, and 2.7, 3.9, 4.3, and 4.6 g P at STTD Ca
concentrations of 0.40, 0.55, 0.63, and 0.71%, respectively. These values correspond to STTD
Ca:STTD P ratios of 2.80:1, 1.84:1, 1.67:1, and 1.55:1 for bone Ca (Fig. 6.6) and 2.67:1, 1.77:1,
1.62:1, and 1.51:1 for bone P (Fig. 6.7). The stomach pH was less (P = 0.016) in pigs fed the diet
containing 0.13% STTD Ca than in pigs fed diets containing 0.27, 0.57, or 0.72% STTD Ca, but
not different from the pH of the diet containing 0.42% STTD Ca.
Experiment 2. Calcium and P Balance
Pigs consumed the diets without problems throughout the experiment, but 1 barrow fed
the diet containing 0.57% STTD Ca and 0.31% STTD P was euthanized on d 9 of the experiment
due to an injured leg. Therefore, this diet had 1 missing replication.
The ATTD of Ca in diets linearly increased (P = 0.009) as concentration of STTD Ca
increased, but was not affected by the concentration of STTD P (Table 6.6). However, the ATTD
of P in diets linearly decreased (P < 0.001) as the concentration of STTD Ca increased, but
linearly increased (P < 0.001) as the concentration of STTD P increased. Due to linear responses
for ATTD of Ca and ATTD of P, maximum values were not estimated. The predicted maximum
urine Ca output at 0.15% STTD P was 8.8 g/d at STTD Ca concentration of 0.64%, which
correspond to STTD Ca:STTD P ratio of 4.27:1 (Fig. 6.8). However, the predicted minimum
urine Ca output at STTD P concentrations of 0.31, 0.39, and 0.47% were 0.4, -0.3, and 0.2 g/d at
165
STTD Ca concentrations of 0.24, 0.29, and 0.29%, respectively, which correspond to STTD
Ca:STTD P ratios of 0.77:1, 0.74:1, and 0.62:1. The predicted minimum urine P output at STTD
P concentrations of 0.15, 0.31, and 0.39% were 0.0, 0.2, and 0.7 g/d at STTD Ca concentrations
of 0.49, 0.62, and 0.78%, respectively, which correspond to STTD Ca:STTD P ratios of 3.27:1,
2.00:1, and 2.00:1, respectively (Fig. 6.9). The values for minimum urine P output at 0.47%
STTD P was not estimated due to a nearly linear response. The predicted maximum retention of
Ca in the body at STTD P concentrations of 0.15, 0.31, 0.39, and 0.47% were 4.7, 7.1, 8.6, and
10.2 g/d at STTD Ca concentrations of 0.77, 0.96, 1.06, and 1.15%, respectively, and these
values correspond to STTD Ca:STTD P ratios of 5.13:1, 3.10:1, 2.72:1, and 2.45:1 (Fig. 6.10).
These STTD Ca concentrations needed to maximize retention of Ca in the body were
extrapolations of the model. The predicted maximum retention of P in the body at the 4 STTD P
concentrations were 1.8, 2.6, 3.2, and 4.0 g/d at STTD Ca concentrations of 0.15, 0.45, 0.61, and
0.76%, respectively, which correspond to STTD Ca:STTD P ratios of 1.00:1, 1.46:1, 1.55:1, and
1.61:1 (Fig. 6.11).
Calcium in plasma increased (P < 0.001) in pigs fed diets containing 0.15% STTD P as
the concentration of dietary Ca increased, but for pigs fed diets containing 0.31, 0.39, or 0.47%
STTD P no change in plasma concentration of Ca was observed as dietary Ca increased
(interaction, P < 0.001; Fig. 6.12). However, P in plasma linearly decreased (P = 0.003) as the
concentration of STTD Ca increased, and linearly increased (P = 0.003) as the concentration of
STTD P increased (Fig. 6.13). Due to the linear response for Ca and P in plasma, maximum
values were not estimated.
166
DISCUSSION
The concentration of Ca, P, Na, and Cl in corn, calcium carbonate, MSP, MCP, and NaCl
were in agreement with reported values (Sauvant et al., 2004; de Blas et al., 2010; Rostagno et
al., 2011; NRC, 2012). The concentration of P, Na, and Cl in soybean meal were close to
reported values (Sauvant et al., 2004; de Blas et al., 2010; Rostagno et al., 2011; NRC, 2012),
but the concentration of Ca was greater than expected (Sauvant et al., 2004; de Blas et al., 2010;
Rostagno et al., 2011; NRC, 2012). However, diets were formulated based on analyzed values
for Ca and P in all ingredients and the concentration of Ca, P, Na, and Cl in all diets were,
therefore, close to calculated values.
Utilization of Ca and P in the body is dependent on the excess or deficiency of one
mineral or the other (Crenshaw, 2001), therefore, the ratio between Ca and P needs to be
considered in diet formulations. Studies that are design to determine Ca or P requirements
usually are designed to contain a constant dietary concentration of one mineral with graded
levels of the other mineral, or alternatively, a constant Ca:P ratio may be used. Results obtained
from a previous study that aimed at determining STTD Ca requirements by 11 to 25 kg pigs,
indicated that the ratio between STTD Ca and STTD P was important for maximizing ADG,
G:F, the quantity of deposited bone ash, Ca retained, and P retained (González-Vega et al.,
2015c). Due to the negative effect of increasing the concentration of STTD Ca in diets with a
constant concentration of STTD P on ADG and G:F (González-Vega et al., 2015c), the current
experiments were designed to include 4 concentrations of STTD P and 5 concentrations of STTD
Ca, which allowed us to determine requirements of STTD Ca at different concentrations of
STTD P.
167
The fact that increasing concentrations of STTD Ca had a negative effect on growth
performance of pigs fed diets containing concentrations of STTD P between 48.4 and 151.6% of
the requirement (NRC, 2012), especially at low P concentration, is in agreement with results
obtained in our previous study with 11 to 25 kg pigs (González-Vega et al., 2015c). The negative
effect of increasing dietary Ca on growth performance was also observed in fast-growing Cobb
broiler chickens (Hurwitz et al., 1995). This may be caused by formation of Ca-P complexes in
the gastrointestinal tract due to excess Ca in diets, which reduces digestibility of P (Clark, 1969;
Brink et al., 1992; Stein et al., 2011; González-Vega et al., 2014). However, the negative effect
of increasing concentration of STTD Ca on growth performance of pigs was ameliorated as
concentration of STTD P increased, which further indicates that the negative effects of high
dietary concentrations of STTD Ca may have been caused by reduced P digestibility.
Regardless of the concentration of STTD P in the diet, final BW, ADG, and G:F were
less affected by Ca concentrations below the requirement than if Ca was provided above the
requirement, which indicates that at low concentrations of dietary Ca, pigs were able to mobilize
Ca from Ca stores to compensate for the deficiency of dietary Ca. These results are in agreement
with previous reports (Eklou-Kalonji et al., 1999; González-Vega et al., 2015c). The implications
of the results obtained for growth performance is that the STTD Ca:STTD P ratio is important in
diet formulation because excess Ca needs to be avoided.
Results from our study with 11 to 25 kg pigs indicated that the quantity of STTD Ca that
was needed to maximize bone ash and retention of Ca was greater than the quantity needed to
maximize growth performance (González-Vega et al., 2015c). Results obtained from the current
experiments supported this observation, and these results are also in agreement with data from
studies that aimed at determining P requirements in pigs (Ketaren et al., 1993; Partanen et al.,
168
2010; Adeola et al., 2015). It is possible that these responses are a result of the fact that
deposition of Ca and P in bones and in soft tissue are independent (Crenshaw, 2001). However, it
is also possible that the results for bone ash and Ca retention simply reflect that the pig is able to
deposit significantly more Ca and P in bones than what is needed to maximize ADG and G:F.
Thus, bones seem to be the default storage site for Ca and P if availability exceeds the
requirement to maximize growth performance.
If diets met or exceeded STTD P requirement (NRC, 2012), the STTD Ca values to
maximize ADG and G:F ranged from 0.36 to 0.67%, which corresponded to a STTD Ca:STTD P
ratios between 1.16:1 and 1.43:1. However, the STTD Ca values to maximize bone ash, bone Ca,
and bone P ranged from 0.55 to 0.73%, which corresponded to a STTD Ca:STTD P ratio
between 1.55:1 and 1.77:1. These values are close to the Ca:P ratio in the body, which ranges
between 1.25:1 and 1.70:1 for a 50 kg pig (Rymarz et al., 1982; Hendriks and Moughan, 1993;
Mahan and Shields, 1998; Wiseman et al., 2009; Pettey et al., 2015).
Requirements for STTD Ca to maximize bone ash were expected to be close to
requirements to maximize Ca retention, because 96 to 99% of Ca is believed to be stored in
skeletal tissue (Crenshaw, 2001). However, results from Exp. 2 indicated that the STTD Ca
values to maximize Ca retention ranged from 0.96 to 1.15%, which corresponded to a STTD
Ca:STTD P ratio between 2.45:1 and 3.10:1. There is not a clear explanation for the greater
quantities needed to maximize Ca retention than the quantities needed to maximize bone ash,
however, similar results were observed previously in 11 to 25 kg pigs (González-Vega et al.,
2015c). Thus, results from our 2 experiments indicate that there may be Ca stored in tissues other
than bones, that the Ca:P ratio in bone ash is not constant, or that retention of ash in the femur is
not representative of deposition of ash in all skeletal tissue. Results from the present experiment
169
demonstrate that plasma Ca is influenced by dietary Ca if P is deficient, but plasma Ca
concentration was not increased as dietary Ca increased for pigs fed a diet that was not deficient
in P, which indicates that it is unlikely that significant quantities of Ca are stored in plasma if
dietary Ca is increased. Deposition of minerals in bones is a result of the exchange of minerals
among 3 compartments: hydration shell, crystal surface, and crystal interior (Szymendera, 1970).
Because bone ash accounts only for the crystalline mineral, minerals present in the hydration
shell are not included in values for bone ash. This may explain the difference between the
concentration of Ca needed to maximize bone ca concentration and the Ca needed to maximize
Ca retention, however, it is not clear, why this difference was not also observed for P retention.
Accumulation of minerals in the cecum has been observed in rats fed diets varying in the
concentration of inulin (Levrat et al., 1991). However, if minerals are deposited in the cecum it is
expected that not only Ca, but also P, are deposited. In the present experiment, the quantity of P
required to maximize P in bone ash was in very good agreement with the quantity needed to
maximize P retention. It is, therefore, unlikely, that deposition of minerals in the cecum
contributed to the discrepancy between Ca needed to maximize Ca retention and Ca needed to
maximize Ca in bone ash.
Although, deposition of Ca in soft tissue is negligible (Crenshaw, 2001; Pettey et al.,
2015), calcification of soft tissue has been reported. A tenfold increase of Ca concentration in
kidney was observed in dogs fed phosphates (Laflamme and Jowsey, 1972), and calcification of
soft tissues has been observed in rats and rabbits (Spaulding and Walser, 1970; Jowsey and
Balasubramaniam, 1972). The Ca:P ratios in the bones in 11 to 25 kg pigs were between 2.03:1
and 2.14:1 (González-Vega et al., 2015c) and the Ca:P ratios in the bones from pigs in the
current study ranged between 2.03:1 and 2.20:1, which are close to the ratio of 2.15:1 that is
170
needed to form hydroxyapatite [Ca5(PO4)3(OH); Crenshaw, 2001]. Bones differ in size and
mineral content (Han et al., 2015), which may result in challenges to quantify deposition of ash
in all skeletal tissue, however, data from Crenshaw et al. (1981, 2009) indicated that femur is a
good indicator of whole body bone mineral content. Therefore, the greater quantities of STTD
Ca needed to maximize Ca retention than the quantities needed to maximize bone ash, is likely a
result of accumulation of Ca in soft tissues, however, further research needs to be conducted to
elucidate this difference.
The fact that increased concentration of dietary Ca negatively affects the ATTD of P is in
agreement with previous reports (Stein et al., 2011; González-Vega et al., 2015c), which is likely
a consequence of formation of Ca-P complexes in the intestine (Clark, 1969; Brink et al., 1992;
Stein et al., 2011; González-Vega et al., 2014, 2015c). However, the effect of dietary Ca on
ATTD of Ca in diets varies. At low concentrations of dietary Ca, ATTD of Ca increases as a
result of reduced contribution of endogenous Ca to total Ca output as dietary Ca increases
(González-Vega et al., 2013), which explains the increase in ATTD of Ca from diets containing
0.13 to 0.27% STTD Ca. No effect of dietary Ca on ATTD of Ca has been reported in diets
containing from 55 to 173% of the requirement of Ca (Stein et al., 2011), however, negative
effects of increasing dietary Ca was observed in diets containing from 54 to 147% of the
requirement of Ca (González-Vega et al., 2015c). In the current experiment, it was observed that
for diets containing 0.15% STTD P and from 0.27 to 0.72% STTD Ca (from 64 to 173% of the
requirement of Ca), ATTD of Ca was negatively affected by dietary Ca concentration. This is
possibly because excess Ca formed Ca-P complexes (Clark, 1969; Brink et al., 1992; Stein et al.,
2011; González-Vega et al., 2014, 2015c). The fact that ATTD of Ca in diets was not affected by
the concentration of dietary P is in agreement with previous reports (Stein et al., 2008; González-
171
Vega et al., 2015c). Likewise, the increase in ATTD of P with increased dietary P was previously
reported (Stein et al., 2008; González-Vega et al., 2015c), which is likely a consequence of a
reduced contribution of endogenous P.
The fact that in diets deficient in either Ca or P there was a minimum excretion of Ca and
P in urine indicates that there are obligatory losses of Ca and P in urine. A minimum urinary loss
of P of 7 mg/kg BW per day was reported by NRC (2012), therefore, a minimum of 0.21 g per
day was expected in Exp. 2. This is in agreement with the predicted value (0.20 g/d) for the diet
containing 0.31% STTD P. There is also an obligatory loss of Ca in humans (Nordin and Morris,
1989), but, to our knowledge, the amount of obligatory losses of Ca in pigs has not been
estimated.
The observation that the concentration of Ca in plasma from pigs fed diets containing the
least concentration of STTD P increased as concentration of STTD Ca increased, may be a result
of deficiency of P, which limited Ca deposition in bones. Therefore, absorbed Ca that could not
be deposited in bones was circulating in blood to be later excreted in the urine. Increased
concentration of Ca in plasma as the concentration of dietary Ca increased has also been
observed in chickens (Hurwitz et al., 1995).
Conclusions
Because STTD Ca negatively influenced the digestibility of P, but dietary STTD P did
not affect the digestibility of Ca, interactions between STTD Ca and STTD P need to be
considered to formulate diets. Data from these experiments indicate that utilization of both
minerals is influenced by STTD Ca and STTD P ratio. Therefore, if STTD P is below
recommended requirement (NRC, 2012), the STTD Ca:STTD P ratio needed to maximize ADG
and G:F is between 0.60:1 and 0.80:1, whereas, the STTD Ca:STTD P ratio needed to maximize
172
bone ash, bone Ca, and bone P is between 2.67:1 and 2.80:1. However, these ratios will
negatively affect growth performance of pigs. In contrast, if STTD P meets or exceeds the
requirement (NRC, 2012), a STTD Ca:STTD P ratio between 1.16:1 and 1.43:1 is needed to
maximize ADG and G:F. A greater ratio will reduce growth performance, although a ratio
between 1.55:1 and 1.77:1 is needed to maximize bone ash, bone Ca, and bone P. The
implication of this observation is that the ratios needed to maximize bone ash, bone Ca, and bone
P may reduce growth performance, therefore, it is recommended that, for commercial growing-
finishing pigs, diets should be formulated using a ratio of STTD Ca: STTD P between 1.16:1 and
1.43:1.
173
LITERATURE CITED
Adeola, O. 2001. Digestion and balance techniques in pigs. In: A. J. Lewis and L. L. Southern,
editor, Swine nutrition. 2nd ed. CRC Press, Washington, DC. p. 903-916.
Adeola, O., M. J. Azain, S. D. Carter, T. D. Crenshaw, M. J. Estienne, B. J. Kerr, M. D.
Lindemann, C. V. Maxwell, P. S. Miller, M. C. Shannon, and E. van Heugten. 2015. A
cooperative study on the standardized total-tract digestible phosphorus requirement of
twenty-kilogram pigs. J. Anim. Sci. 93:5743-5753.
AOAC. 2006. Official Methods of Analysis. 18th ed. Assoc. Off. Anal. Chem., Arlington, VA.
AOAC International. 2007. Official Methods of Analysis of AOAC Int. 18th ed. Rev. 2. W.
Hortwitz and G. W. Latimer, Jr., eds. AOAC Int., Gaithersburg, MD.
Brink, E. J., A. C. Beynen, P. R. Dekker, E. C. H. van Beresteijn, and R. van der Meer. 1992.
Interaction of calcium and phosphate decreases ileal magnesium solubility and apparent
magnesium absorption in rats. J. Nutr. 122:580-586.
Clark, I. 1969. Importance of dietary Ca:PO4 ratios on skeletal, Ca, Mg, and PO4 metabolism.
Am. J. Physiol. 217:865–870.
Crenshaw, T. D. 2001. Calcium, phosphorus, vitamin D, and vitamin K in swine nutrition. In: A.
J. Lewis, and L. L. Southern, editors, Swine nutrition. 2nd ed. CRC Press, Boca Raton,
FL. p. 187-212.
Crenshaw, T. D., J. R. Danielson, L. E. Hoffman, and D. K. Schneider. 2009. Femurs are more
accurate than fibulas as predictors of whole body bone mineral content in growing pigs. J.
Anim. Sci. 87.(E-Suppl 2):510(Abstr.)
Crenshaw, T. D., E. R. Peo, A. J. Lewis, B. D. Moser, and D. Olson. 1981. Influence of age,
sex, and calcium and phosphorus levels on the mechanical properties of various bones in
174
swine. J. Anim. Sci. 52:1319-1329.
De Blas, C., G. G. Mateos, and P. García-Rebollar. 2010. Tablas FEDNA de composición y
valor nutritivo de alimentos para la fabricación de piensos compuestos. 3ra ed. C. de
Blas, G. G. Mateos, and P. García-Rebollar, editors. Fund. Esp. Desarrollo Nutr. Anim.,
Madrid, Spain.
Eklou-Kalonji, E., E. Zerath, C. Colin, C. Lacroix, X. Holy, I. Denis, and A. Pointllart. 1999.
Calcium-regulating hormones, bone mineral content, breaking load and trabecular
remodeling are altered in growing pigs fed calcium-deficient diets. J. Nutr. 129:188-193.
González-Vega, J. C., C. L. Walk, Y. Liu, and H. H. Stein. 2013. Determination of endogenous
intestinal losses of Ca and true total tract digestibility of calcium in canola meal fed to
growing pigs. J. Anim. Sci. 91:4807-4816.
González-Vega, J. C., C. L. Walk, Y. Liu, and H. H. Stein. 2014. The site of net absorption of Ca
from the intestinal tract of growing pigs and effect of phytic acid, Ca level and Ca source
on Ca digestibility. Arch. Anim. Nutr. 68:126-142.
González-Vega, J. C., C. L. Walk, and H. H. Stein. 2015a. Effects of microbial phytase on
apparent and standardized total tract digestibility of calcium in calcium supplements fed
to growing pigs. J. Anim. Sci. 93:2255-2264.
González-Vega, J. C., C. L. Walk, and H. H. Stein. 2015b. Effect of phytate, microbial phytase,
fiber, and soybean oil on calculated values for apparent and standardized total tract
digestibility of calcium and apparent total tract digestibility of phosphorus in fish meal
fed to growing pigs. J. Anim. Sci. 93:4808-4818.
175
González-Vega, J. C., C. L. Walk, and H. H. Stein. 2015c. Digestible calcium requirements and
calcium and phosphorus balance for weanling pigs. J. Anim. Sci. 93(Suppl. 2):51-52
(Abstr.)
Han, J. C., H. X. Qu, J. G. Wang, G. H. Chen, Y. F. Yan, J. L. Zhang, F. M. Hu, L. Y. You, and
Y. H. Cheng. 2015. Comparison of the growth and mineralization of the femur, tibia, and
metatarsus of broiler chicks. Braz. J. Poult. Sci. 17:333-340.
Hendriks, W. H., and P. J. Moughan. 1993. Whole-body mineral composition of entire male and
female pigs depositing protein at maximal rates. Livest. Prod. Sci. 33:161-170.
Hurwitz, S., I. Plavnik, A. Shapiro, E. Wax, H. Talpaz, and A. Bar. 1995. Calcium metabolism
and requirements of chickens are affected by growth. J. Nutr. 125: 2679-2686.
Jowsey, J., and P. Balasubramaniam. 1972. Effect of phosphate supplements on soft-tissue
calcification and bone turnover. Clin. Sci. 42:289-299.
Ketaren, P. P., E. S. Batterham, and E. White. 1993. Phosphorus studies in pigs. 1. Available
phosphorus requirements of grower/finisher pigs. Br. J. Nutr. 70:249-268.
Kim, B. G., and M. D. Lindemann. 2007. A new spreadsheet method for the experimental animal
allotment. J. Anim. Sci. 85 (Suppl. 2):218 (Abstr.)
Laflamme, G. H., and J. Jowsey. 1972. Bone and soft tissue changes with oral phosphate
supplements. J. Clin. Invest. 51:2834-2840.
Levrat, M. A., C. Rémésy, and C. Demigné. 1991. High propionic acid fermentations and
mineral accumulation in the cecum of rats adapted to different levels of inulin. J. Nutr.
121:1730-1737.
Lindemann, M. D., and B. G. Kim. 2007. Technical note: A model to estimate individual feed
intake of swine in group feeding. J. Anim. Sci. 85:972-975.
176
Mahan, D. C., and R. G. Shields, Jr. 1998. Macro- and micromineral composition of pigs from
birth to 145 kilograms of body weight. J. Anim. Sci. 76:506-512.
Merriman, L. A., and H. H. Stein. 2015. Effect of particle size in calcium carbonate on apparent
and standardized total tract digestibility and retention of calcium by growing pigs. J.
Anim. Sci. 93(Suppl. 2):52. (Abstr.)
Nordin, B. E. C., and H. A. Morris. 1989. The calcium deficiency model for osteoporosis. Nutr.
Rev. 47:65-72.
NRC. 2012. Nutrient Requirements of Swine. 11th rev. ed. Natl. Acad. Press, Washington, DC.
Partanen, K., H. Siljander-Rasi, M. Karhapää, K. Ylivainio, and T. Tupasela. 2010. Responses of
growing pigs to different levels of dietary phosphorus - Performance, bone
characteristics, and solubility of faecal phosphorus. Livest. Sci. 134:109-112.
Pettey, L. A., G. L. Cromwell, Y. D. Jang, and M. D. Lindemann. 2015. Estimation of calcium
and phosphorus content in growing and finishing pigs: Whole empty body components
and relative accretion rates. J. Anim. Sci. 93:158-167.
Rostagno, H. S., L. F. T. Albino, J. L. Donzele, P. C. Gomes, R. F. de Oliveira, D. C. Lopes, A.
S. Ferreira, S. L. T. Barreto, and R. F. Euclides. 2011. Brazilian tables for poultry and
swine. H. S. Rostagno, editor, 3rd ed. Universidade Federal de Viçosa, Viçosa, BR.
Rymarz, A., H. Fandrejewski, and J. Kielanowski. 1982. Content and retention of calcium,
phosphorus, potassium and sodium in the bodies of growing gilts. Livest. Prod. Sci.
9:399-407.
Sauvant, D., J.-M. Perez, and G. Tran. 2004. Tables of composition and nutritional value of feed
materials: pig, poultry, sheep, goats, rabbits, horses, fish. 2nd ed. Wageningen Academic
Publishers, Wageningen, the Netherlands.
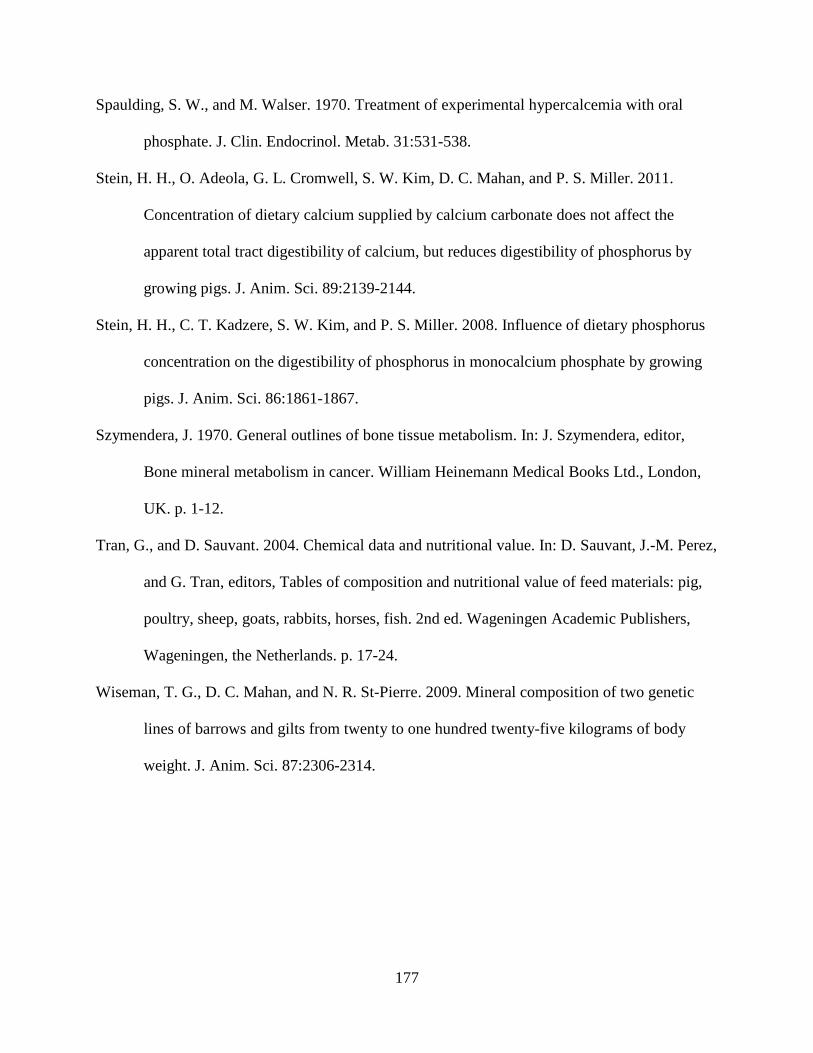
177
Spaulding, S. W., and M. Walser. 1970. Treatment of experimental hypercalcemia with oral
phosphate. J. Clin. Endocrinol. Metab. 31:531-538.
Stein, H. H., O. Adeola, G. L. Cromwell, S. W. Kim, D. C. Mahan, and P. S. Miller. 2011.
Concentration of dietary calcium supplied by calcium carbonate does not affect the
apparent total tract digestibility of calcium, but reduces digestibility of phosphorus by
growing pigs. J. Anim. Sci. 89:2139-2144.
Stein, H. H., C. T. Kadzere, S. W. Kim, and P. S. Miller. 2008. Influence of dietary phosphorus
concentration on the digestibility of phosphorus in monocalcium phosphate by growing
pigs. J. Anim. Sci. 86:1861-1867.
Szymendera, J. 1970. General outlines of bone tissue metabolism. In: J. Szymendera, editor,
Bone mineral metabolism in cancer. William Heinemann Medical Books Ltd., London,
UK. p. 1-12.
Tran, G., and D. Sauvant. 2004. Chemical data and nutritional value. In: D. Sauvant, J.-M. Perez,
and G. Tran, editors, Tables of composition and nutritional value of feed materials: pig,
poultry, sheep, goats, rabbits, horses, fish. 2nd ed. Wageningen Academic Publishers,
Wageningen, the Netherlands. p. 17-24.
Wiseman, T. G., D. C. Mahan, and N. R. St-Pierre. 2009. Mineral composition of two genetic
lines of barrows and gilts from twenty to one hundred twenty-five kilograms of body
weight. J. Anim. Sci. 87:2306-2314.
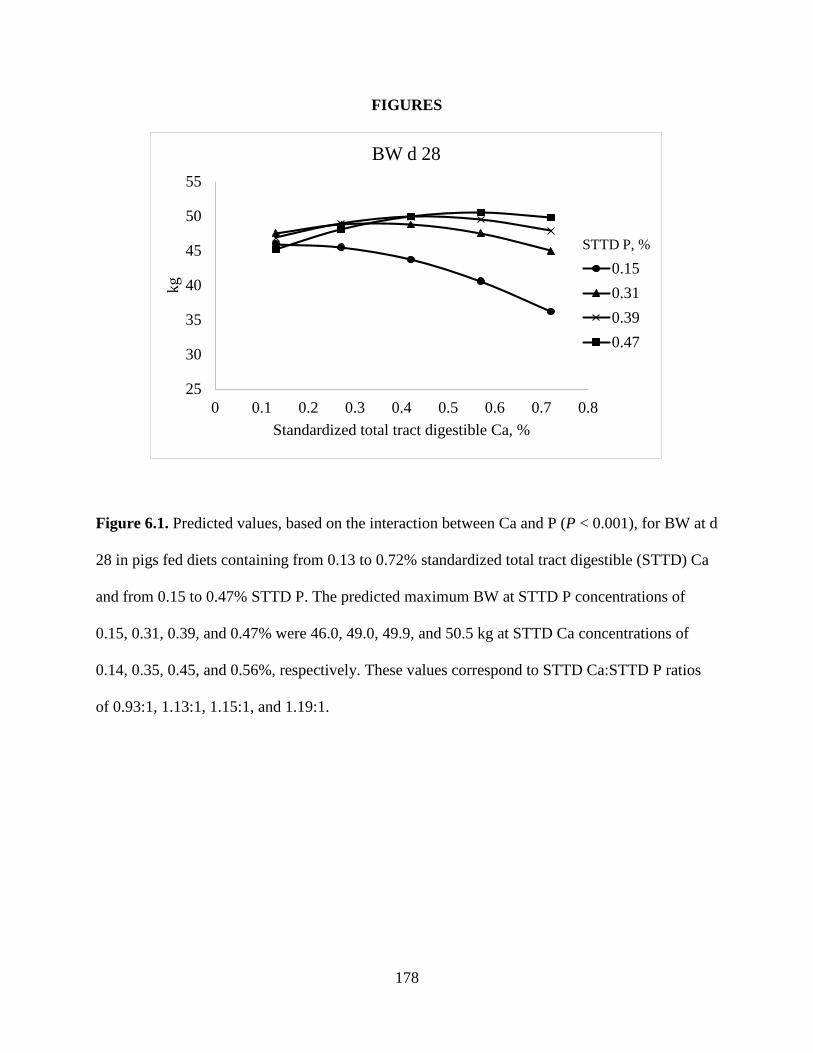
178
FIGURES
Figure 6.1. Predicted values, based on the interaction between Ca and P (P < 0.001), for BW at d
28 in pigs fed diets containing from 0.13 to 0.72% standardized total tract digestible (STTD) Ca
and from 0.15 to 0.47% STTD P. The predicted maximum BW at STTD P concentrations of
0.15, 0.31, 0.39, and 0.47% were 46.0, 49.0, 49.9, and 50.5 kg at STTD Ca concentrations of
0.14, 0.35, 0.45, and 0.56%, respectively. These values correspond to STTD Ca:STTD P ratios
of 0.93:1, 1.13:1, 1.15:1, and 1.19:1.
25
30
35
40
45
50
55
0 0.1 0.2 0.3 0.4 0.5 0.6 0.7 0.8
kg
Standardized total tract digestible Ca, %
BW d 28
0.150.310.390.47
STTD P, %
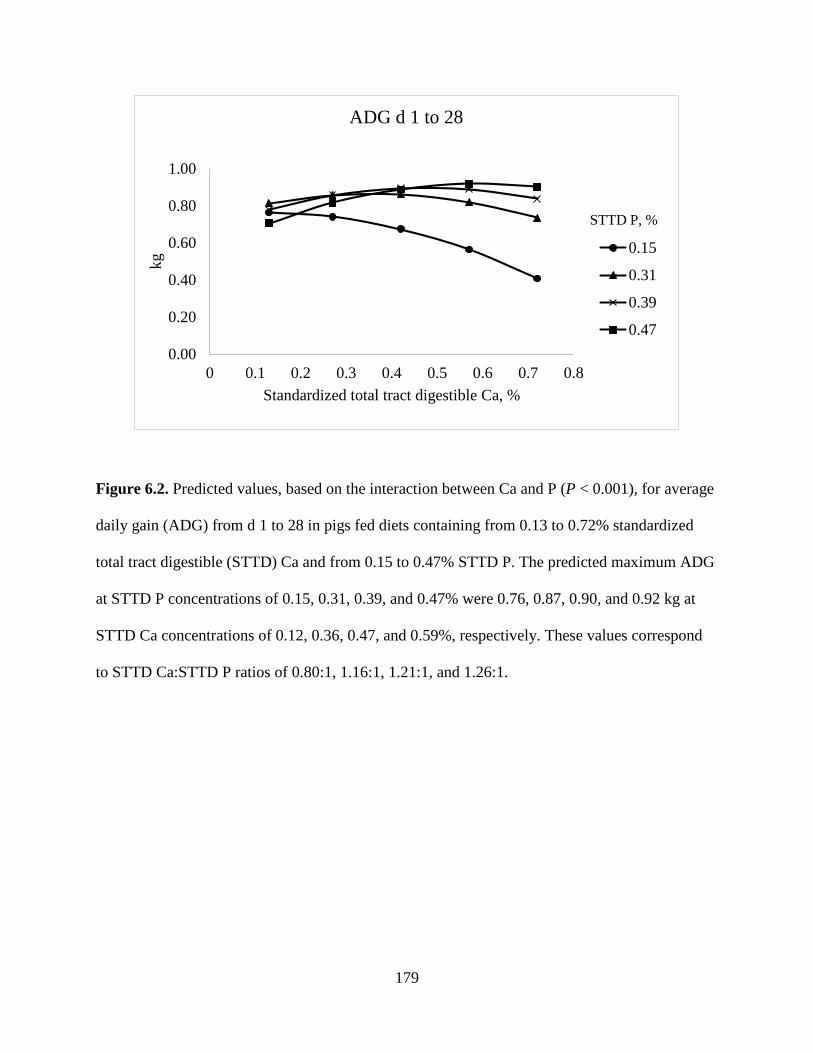
179
Figure 6.2. Predicted values, based on the interaction between Ca and P (P < 0.001), for average
daily gain (ADG) from d 1 to 28 in pigs fed diets containing from 0.13 to 0.72% standardized
total tract digestible (STTD) Ca and from 0.15 to 0.47% STTD P. The predicted maximum ADG
at STTD P concentrations of 0.15, 0.31, 0.39, and 0.47% were 0.76, 0.87, 0.90, and 0.92 kg at
STTD Ca concentrations of 0.12, 0.36, 0.47, and 0.59%, respectively. These values correspond
to STTD Ca:STTD P ratios of 0.80:1, 1.16:1, 1.21:1, and 1.26:1.
0.00
0.20
0.40
0.60
0.80
1.00
0 0.1 0.2 0.3 0.4 0.5 0.6 0.7 0.8
kg
Standardized total tract digestible Ca, %
ADG d 1 to 28
0.15
0.31
0.39
0.47
STTD P, %
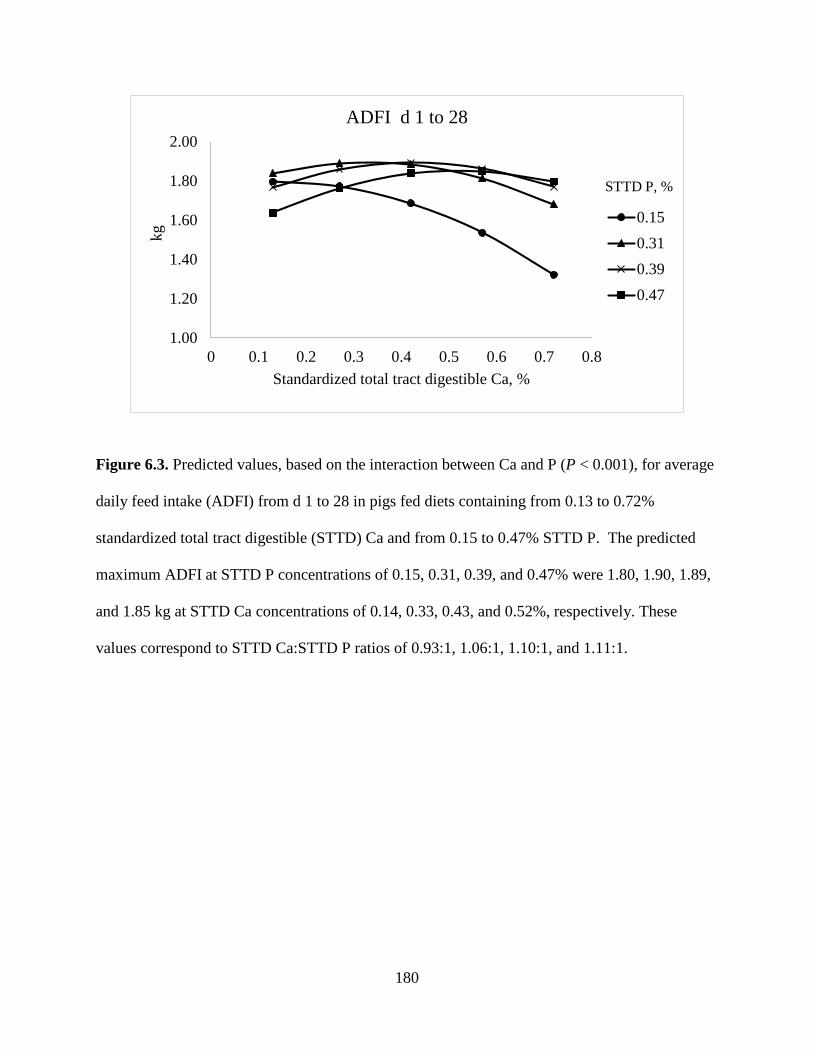
180
Figure 6.3. Predicted values, based on the interaction between Ca and P (P < 0.001), for average
daily feed intake (ADFI) from d 1 to 28 in pigs fed diets containing from 0.13 to 0.72%
standardized total tract digestible (STTD) Ca and from 0.15 to 0.47% STTD P. The predicted
maximum ADFI at STTD P concentrations of 0.15, 0.31, 0.39, and 0.47% were 1.80, 1.90, 1.89,
and 1.85 kg at STTD Ca concentrations of 0.14, 0.33, 0.43, and 0.52%, respectively. These
values correspond to STTD Ca:STTD P ratios of 0.93:1, 1.06:1, 1.10:1, and 1.11:1.
1.00
1.20
1.40
1.60
1.80
2.00
0 0.1 0.2 0.3 0.4 0.5 0.6 0.7 0.8
kg
Standardized total tract digestible Ca, %
ADFI d 1 to 28
0.150.310.390.47
STTD P, %
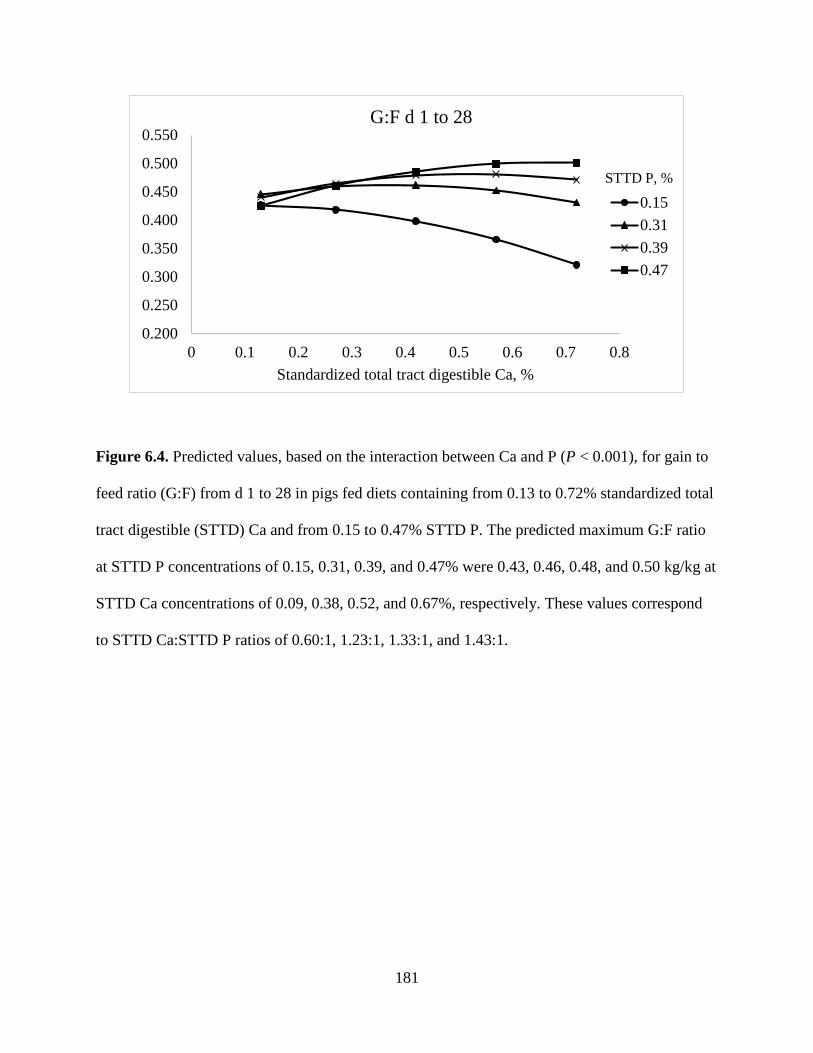
181
Figure 6.4. Predicted values, based on the interaction between Ca and P (P < 0.001), for gain to
feed ratio (G:F) from d 1 to 28 in pigs fed diets containing from 0.13 to 0.72% standardized total
tract digestible (STTD) Ca and from 0.15 to 0.47% STTD P. The predicted maximum G:F ratio
at STTD P concentrations of 0.15, 0.31, 0.39, and 0.47% were 0.43, 0.46, 0.48, and 0.50 kg/kg at
STTD Ca concentrations of 0.09, 0.38, 0.52, and 0.67%, respectively. These values correspond
to STTD Ca:STTD P ratios of 0.60:1, 1.23:1, 1.33:1, and 1.43:1.
0.200
0.250
0.300
0.350
0.400
0.450
0.500
0.550
0 0.1 0.2 0.3 0.4 0.5 0.6 0.7 0.8Standardized total tract digestible Ca, %
G:F d 1 to 28
0.150.310.390.47
STTD P, %
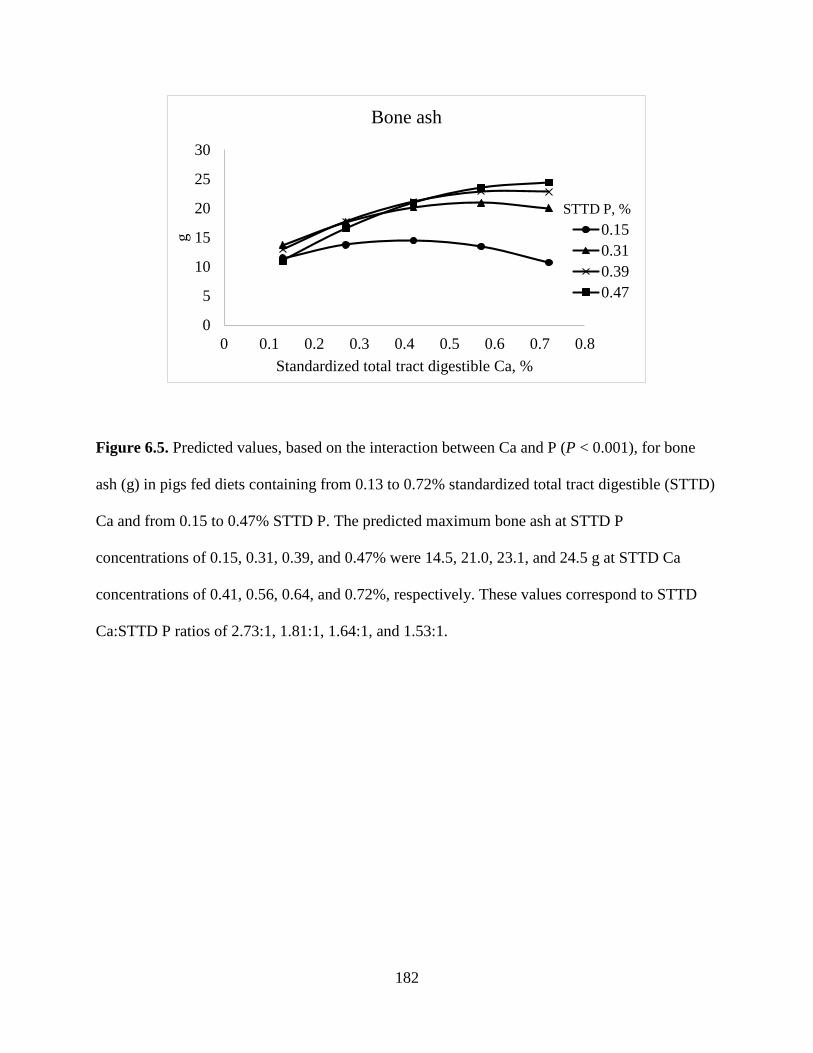
182
Figure 6.5. Predicted values, based on the interaction between Ca and P (P < 0.001), for bone
ash (g) in pigs fed diets containing from 0.13 to 0.72% standardized total tract digestible (STTD)
Ca and from 0.15 to 0.47% STTD P. The predicted maximum bone ash at STTD P
concentrations of 0.15, 0.31, 0.39, and 0.47% were 14.5, 21.0, 23.1, and 24.5 g at STTD Ca
concentrations of 0.41, 0.56, 0.64, and 0.72%, respectively. These values correspond to STTD
Ca:STTD P ratios of 2.73:1, 1.81:1, 1.64:1, and 1.53:1.
0
5
10
15
20
25
30
0 0.1 0.2 0.3 0.4 0.5 0.6 0.7 0.8
g
Standardized total tract digestible Ca, %
Bone ash
0.150.310.390.47
STTD P, %
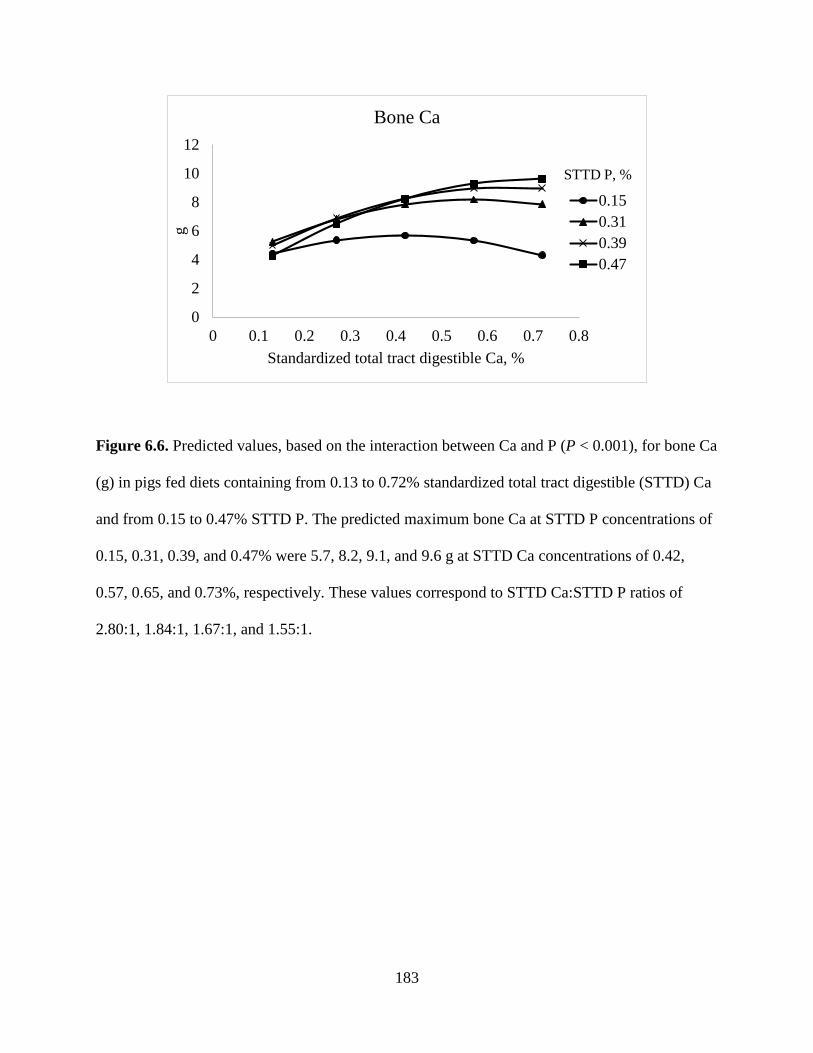
183
Figure 6.6. Predicted values, based on the interaction between Ca and P (P < 0.001), for bone Ca
(g) in pigs fed diets containing from 0.13 to 0.72% standardized total tract digestible (STTD) Ca
and from 0.15 to 0.47% STTD P. The predicted maximum bone Ca at STTD P concentrations of
0.15, 0.31, 0.39, and 0.47% were 5.7, 8.2, 9.1, and 9.6 g at STTD Ca concentrations of 0.42,
0.57, 0.65, and 0.73%, respectively. These values correspond to STTD Ca:STTD P ratios of
2.80:1, 1.84:1, 1.67:1, and 1.55:1.
0
2
4
6
8
10
12
0 0.1 0.2 0.3 0.4 0.5 0.6 0.7 0.8
g
Standardized total tract digestible Ca, %
Bone Ca
0.150.310.390.47
STTD P, %
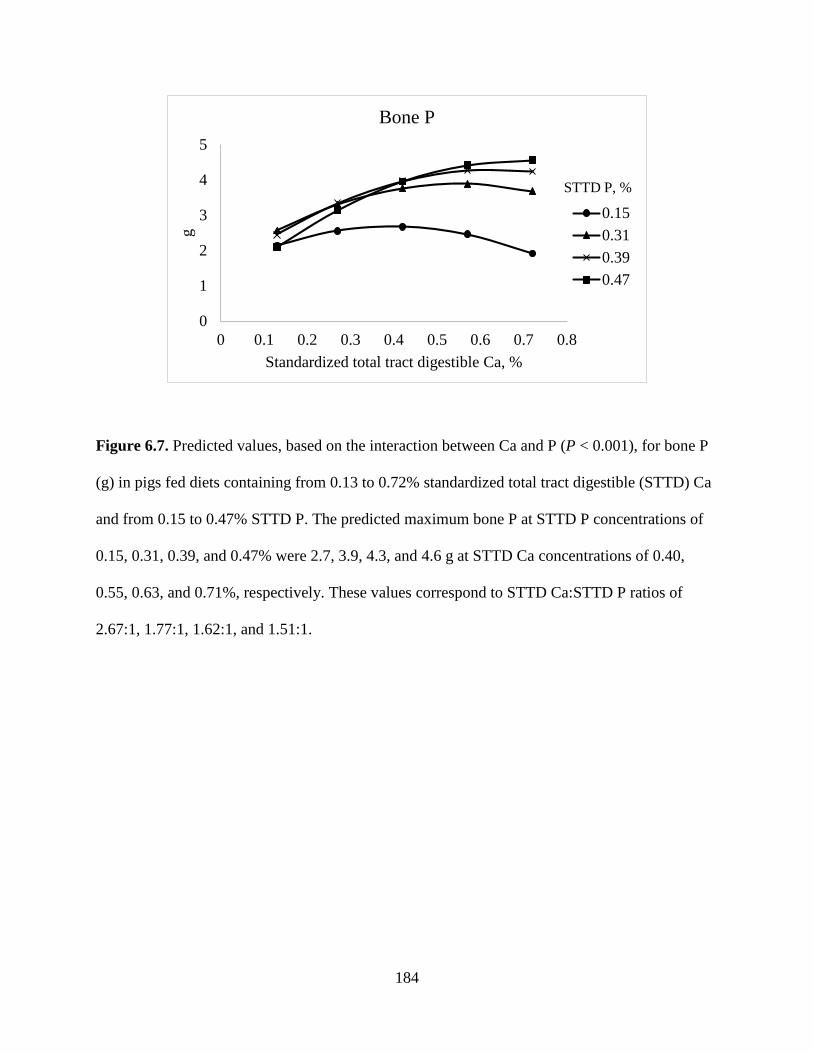
184
Figure 6.7. Predicted values, based on the interaction between Ca and P (P < 0.001), for bone P
(g) in pigs fed diets containing from 0.13 to 0.72% standardized total tract digestible (STTD) Ca
and from 0.15 to 0.47% STTD P. The predicted maximum bone P at STTD P concentrations of
0.15, 0.31, 0.39, and 0.47% were 2.7, 3.9, 4.3, and 4.6 g at STTD Ca concentrations of 0.40,
0.55, 0.63, and 0.71%, respectively. These values correspond to STTD Ca:STTD P ratios of
2.67:1, 1.77:1, 1.62:1, and 1.51:1.
0
1
2
3
4
5
0 0.1 0.2 0.3 0.4 0.5 0.6 0.7 0.8
g
Standardized total tract digestible Ca, %
Bone P
0.150.310.390.47
STTD P, %
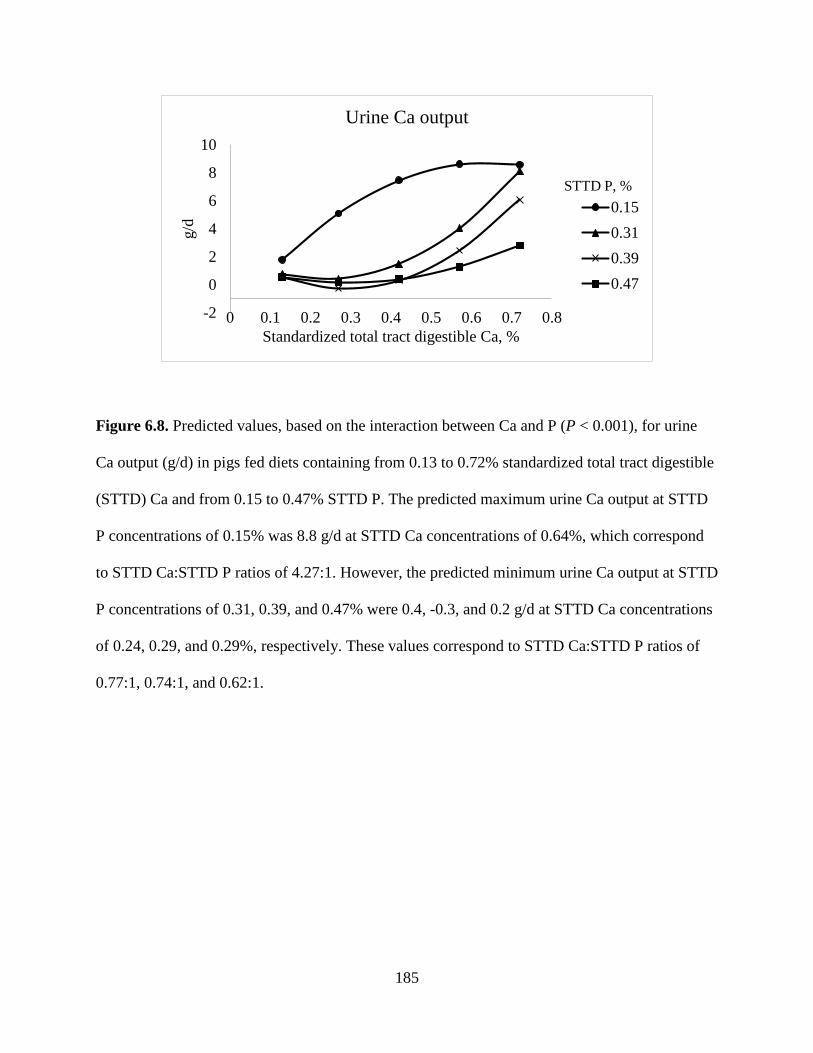
185
Figure 6.8. Predicted values, based on the interaction between Ca and P (P < 0.001), for urine
Ca output (g/d) in pigs fed diets containing from 0.13 to 0.72% standardized total tract digestible
(STTD) Ca and from 0.15 to 0.47% STTD P. The predicted maximum urine Ca output at STTD
P concentrations of 0.15% was 8.8 g/d at STTD Ca concentrations of 0.64%, which correspond
to STTD Ca:STTD P ratios of 4.27:1. However, the predicted minimum urine Ca output at STTD
P concentrations of 0.31, 0.39, and 0.47% were 0.4, -0.3, and 0.2 g/d at STTD Ca concentrations
of 0.24, 0.29, and 0.29%, respectively. These values correspond to STTD Ca:STTD P ratios of
0.77:1, 0.74:1, and 0.62:1.
-2
0
2
4
6
8
10
0 0.1 0.2 0.3 0.4 0.5 0.6 0.7 0.8
g/d
Standardized total tract digestible Ca, %
Urine Ca output
0.150.310.390.47
STTD P, %
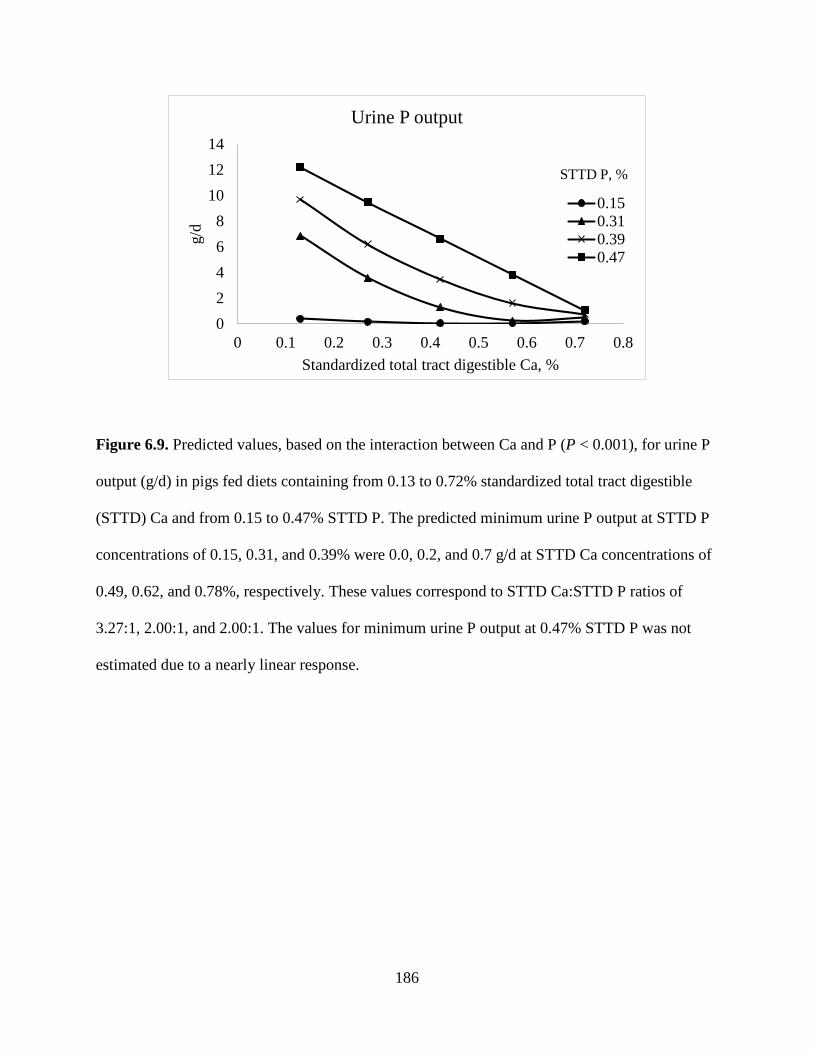
186
Figure 6.9. Predicted values, based on the interaction between Ca and P (P < 0.001), for urine P
output (g/d) in pigs fed diets containing from 0.13 to 0.72% standardized total tract digestible
(STTD) Ca and from 0.15 to 0.47% STTD P. The predicted minimum urine P output at STTD P
concentrations of 0.15, 0.31, and 0.39% were 0.0, 0.2, and 0.7 g/d at STTD Ca concentrations of
0.49, 0.62, and 0.78%, respectively. These values correspond to STTD Ca:STTD P ratios of
3.27:1, 2.00:1, and 2.00:1. The values for minimum urine P output at 0.47% STTD P was not
estimated due to a nearly linear response.
02468
101214
0 0.1 0.2 0.3 0.4 0.5 0.6 0.7 0.8
g/d
Standardized total tract digestible Ca, %
Urine P output
0.150.310.390.47
STTD P, %
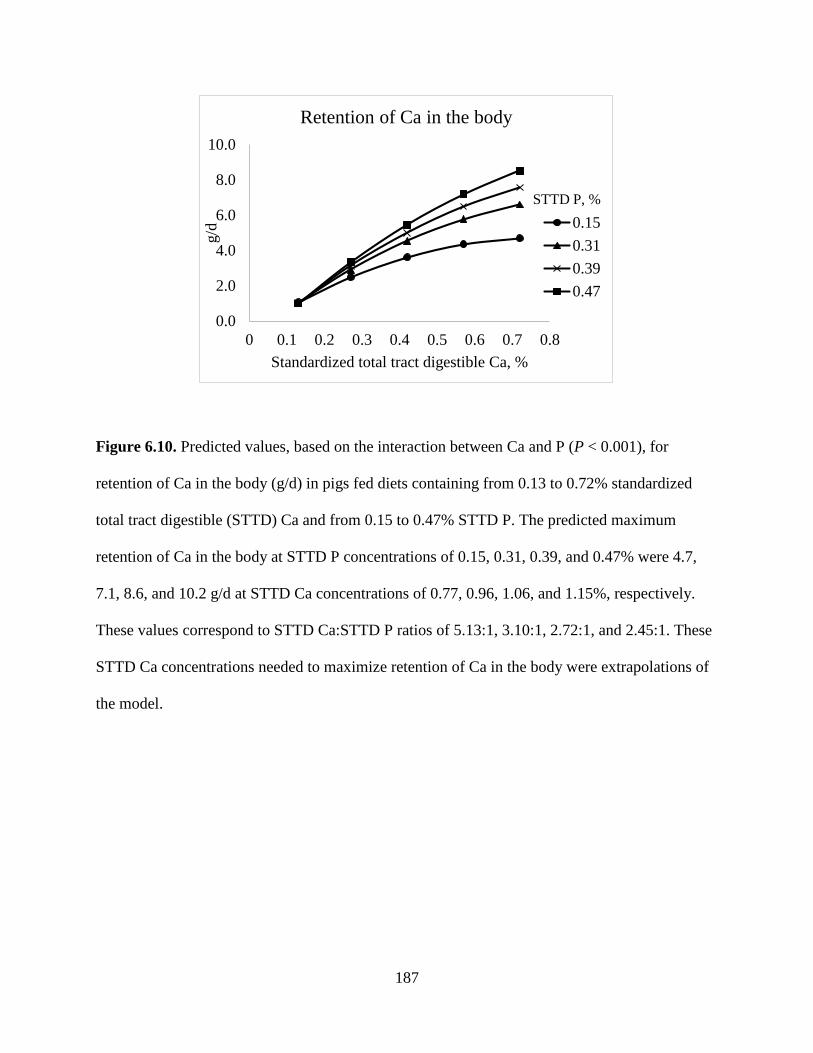
187
Figure 6.10. Predicted values, based on the interaction between Ca and P (P < 0.001), for
retention of Ca in the body (g/d) in pigs fed diets containing from 0.13 to 0.72% standardized
total tract digestible (STTD) Ca and from 0.15 to 0.47% STTD P. The predicted maximum
retention of Ca in the body at STTD P concentrations of 0.15, 0.31, 0.39, and 0.47% were 4.7,
7.1, 8.6, and 10.2 g/d at STTD Ca concentrations of 0.77, 0.96, 1.06, and 1.15%, respectively.
These values correspond to STTD Ca:STTD P ratios of 5.13:1, 3.10:1, 2.72:1, and 2.45:1. These
STTD Ca concentrations needed to maximize retention of Ca in the body were extrapolations of
the model.
0.0
2.0
4.0
6.0
8.0
10.0
0 0.1 0.2 0.3 0.4 0.5 0.6 0.7 0.8
g/d
Standardized total tract digestible Ca, %
Retention of Ca in the body
0.150.310.390.47
STTD P, %
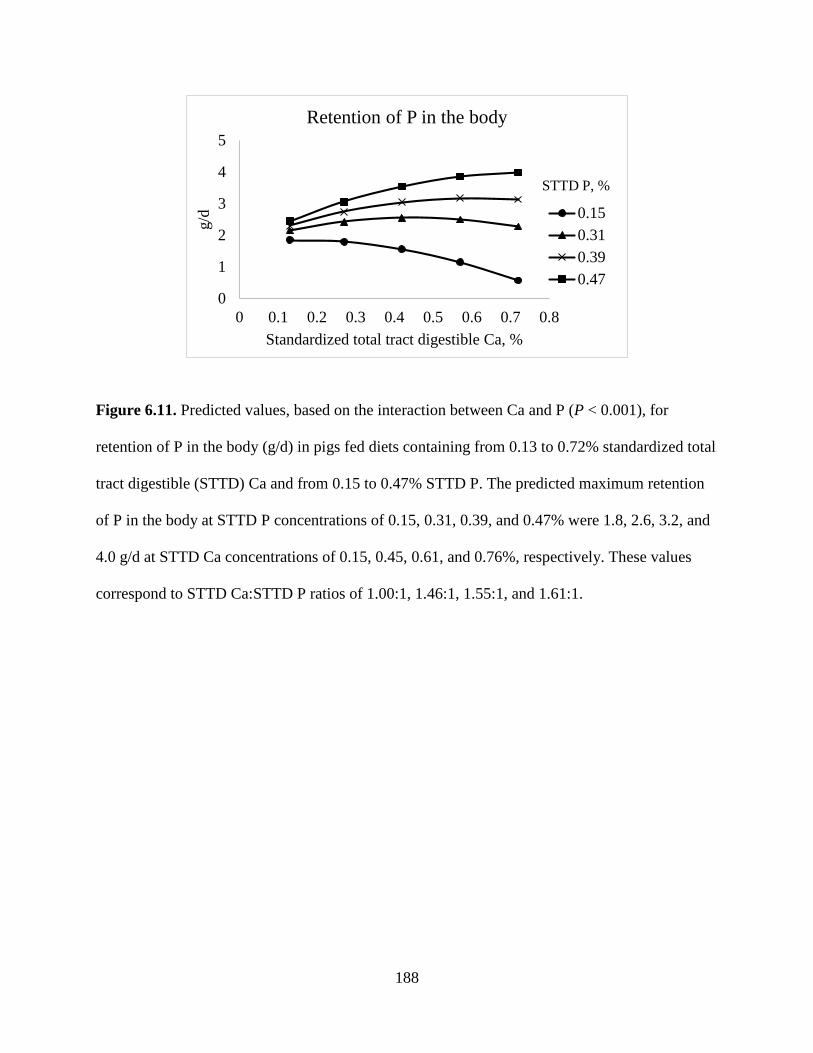
188
Figure 6.11. Predicted values, based on the interaction between Ca and P (P < 0.001), for
retention of P in the body (g/d) in pigs fed diets containing from 0.13 to 0.72% standardized total
tract digestible (STTD) Ca and from 0.15 to 0.47% STTD P. The predicted maximum retention
of P in the body at STTD P concentrations of 0.15, 0.31, 0.39, and 0.47% were 1.8, 2.6, 3.2, and
4.0 g/d at STTD Ca concentrations of 0.15, 0.45, 0.61, and 0.76%, respectively. These values
correspond to STTD Ca:STTD P ratios of 1.00:1, 1.46:1, 1.55:1, and 1.61:1.
0
1
2
3
4
5
0 0.1 0.2 0.3 0.4 0.5 0.6 0.7 0.8
g/d
Standardized total tract digestible Ca, %
Retention of P in the body
0.150.310.390.47
STTD P, %
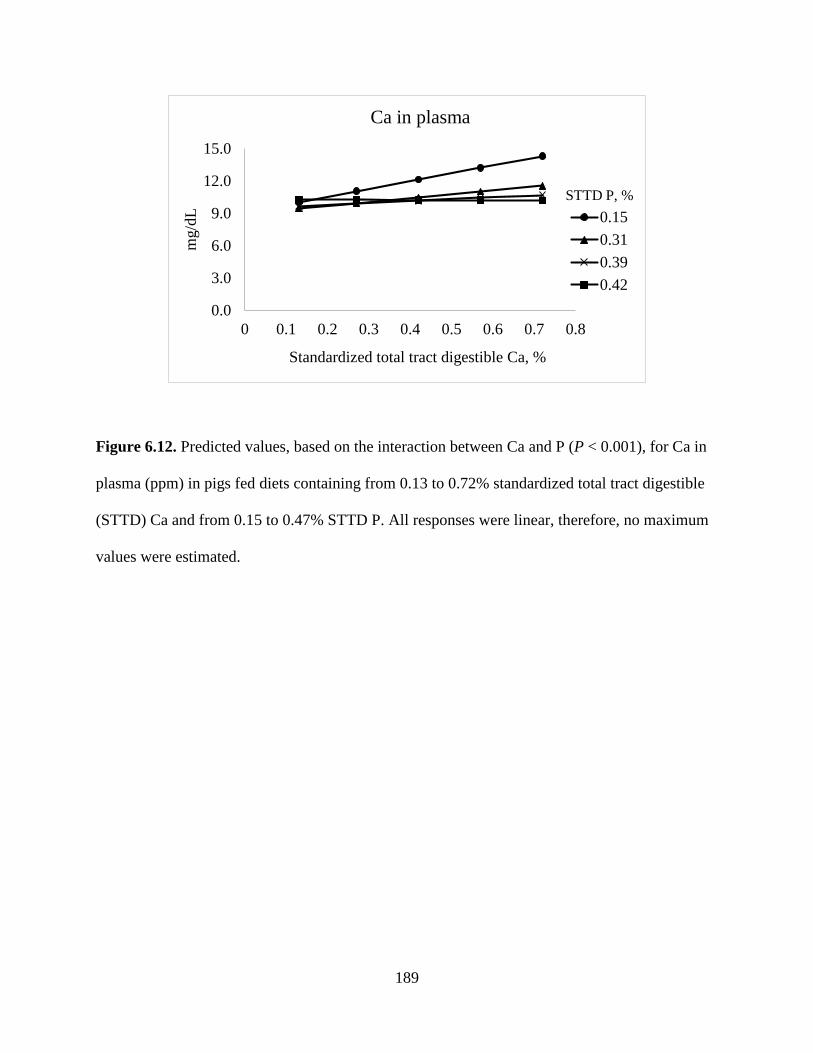
189
Figure 6.12. Predicted values, based on the interaction between Ca and P (P < 0.001), for Ca in
plasma (ppm) in pigs fed diets containing from 0.13 to 0.72% standardized total tract digestible
(STTD) Ca and from 0.15 to 0.47% STTD P. All responses were linear, therefore, no maximum
values were estimated.
0.0
3.0
6.0
9.0
12.0
15.0
0 0.1 0.2 0.3 0.4 0.5 0.6 0.7 0.8
mg/
dL
Standardized total tract digestible Ca, %
Ca in plasma
0.150.310.390.42
STTD P, %
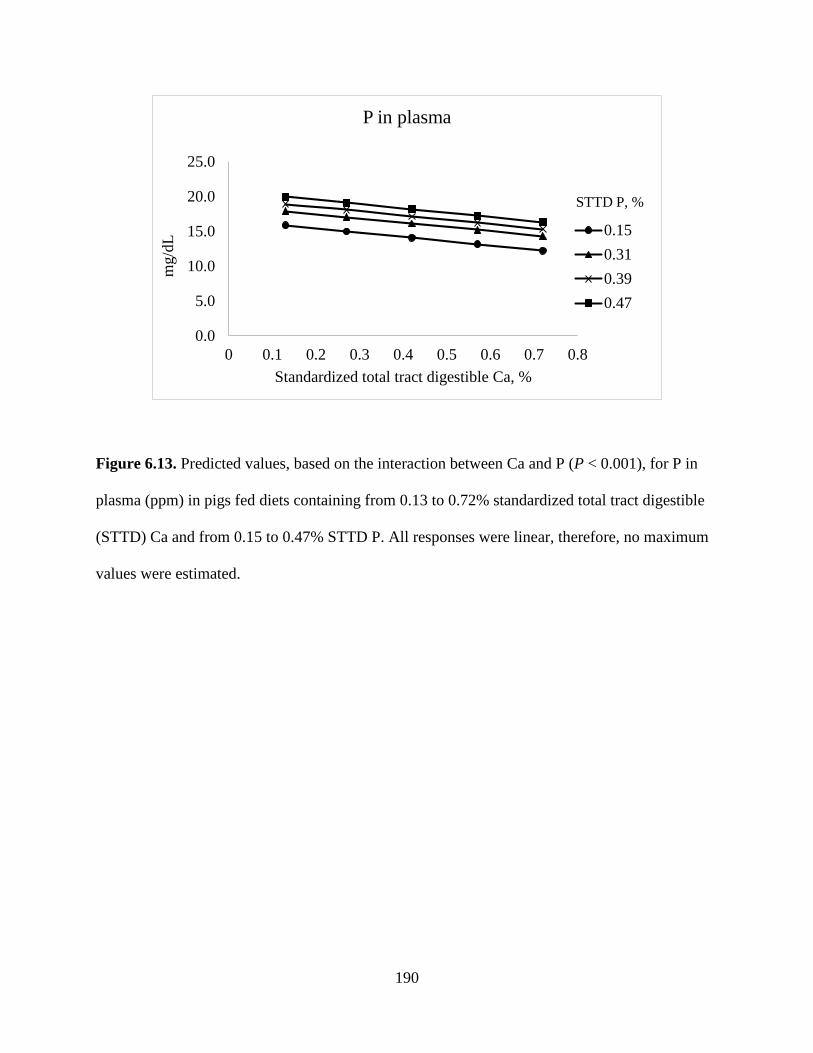
190
Figure 6.13. Predicted values, based on the interaction between Ca and P (P < 0.001), for P in
plasma (ppm) in pigs fed diets containing from 0.13 to 0.72% standardized total tract digestible
(STTD) Ca and from 0.15 to 0.47% STTD P. All responses were linear, therefore, no maximum
values were estimated.
0.0
5.0
10.0
15.0
20.0
25.0
0 0.1 0.2 0.3 0.4 0.5 0.6 0.7 0.8
mg/
dL
Standardized total tract digestible Ca, %
P in plasma
0.150.310.390.47
STTD P, %
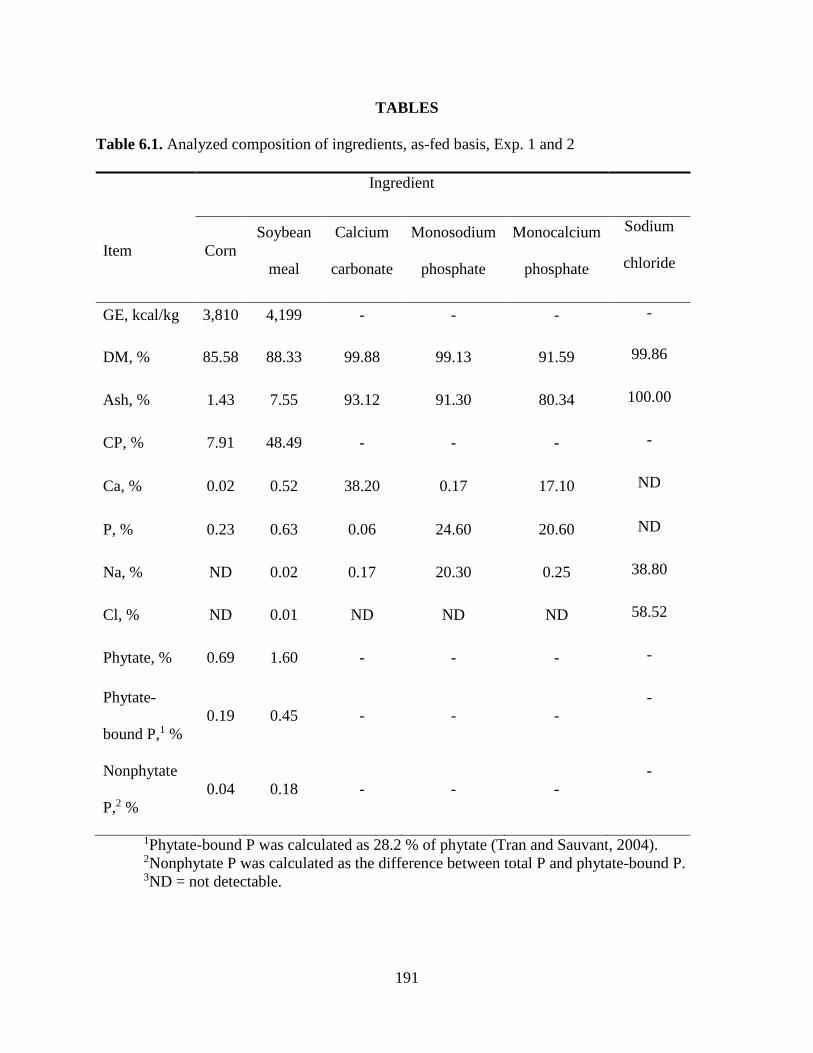
191
TABLES
Table 6.1. Analyzed composition of ingredients, as-fed basis, Exp. 1 and 2
Ingredient
Item Corn Soybean
meal
Calcium
carbonate
Monosodium
phosphate
Monocalcium
phosphate
Sodium
chloride
GE, kcal/kg 3,810 4,199 - - - -
DM, % 85.58 88.33 99.88 99.13 91.59 99.86
Ash, % 1.43 7.55 93.12 91.30 80.34 100.00
CP, % 7.91 48.49 - - - -
Ca, % 0.02 0.52 38.20 0.17 17.10 ND
P, % 0.23 0.63 0.06 24.60 20.60 ND
Na, % ND 0.02 0.17 20.30 0.25 38.80
Cl, % ND 0.01 ND ND ND 58.52
Phytate, % 0.69 1.60 - - - -
Phytate-
bound P,1 % 0.19 0.45 - - -
-
Nonphytate
P,2 % 0.04 0.18 - - -
-
1Phytate-bound P was calculated as 28.2 % of phytate (Tran and Sauvant, 2004). 2Nonphytate P was calculated as the difference between total P and phytate-bound P. 3ND = not detectable.
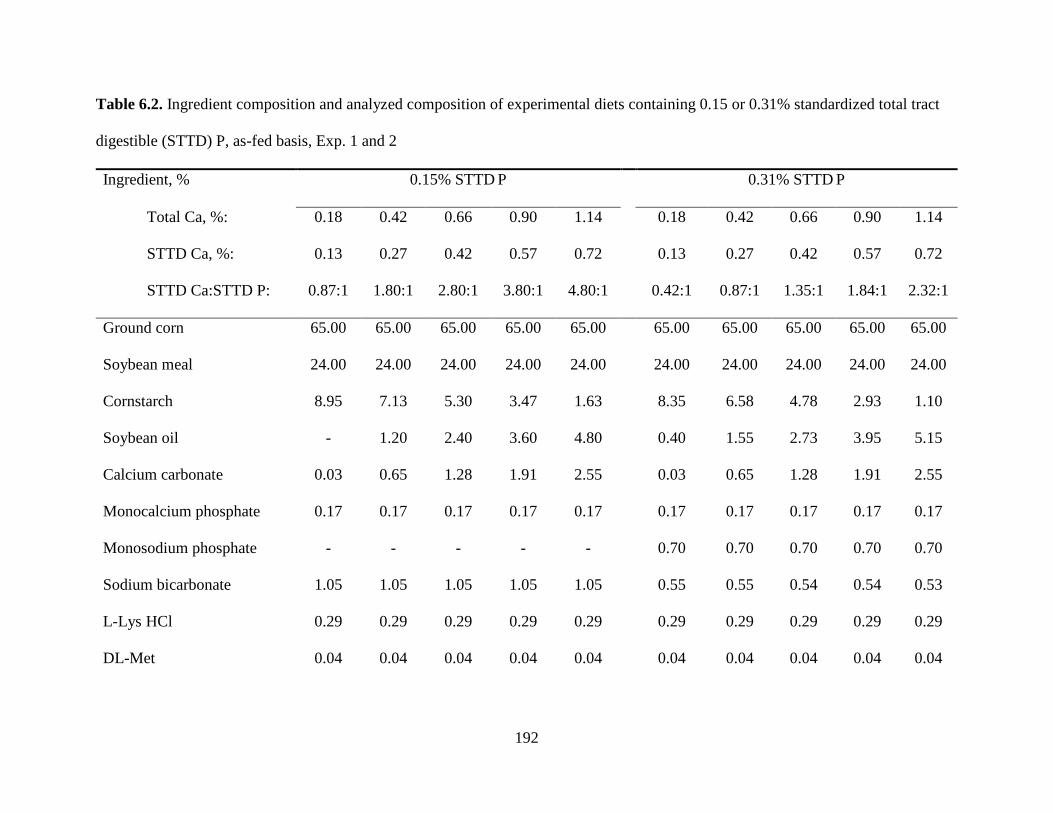
192
Table 6.2. Ingredient composition and analyzed composition of experimental diets containing 0.15 or 0.31% standardized total tract
digestible (STTD) P, as-fed basis, Exp. 1 and 2
Ingredient, % 0.15% STTD P 0.31% STTD P
Total Ca, %: 0.18 0.42 0.66 0.90 1.14 0.18 0.42 0.66 0.90 1.14
STTD Ca, %: 0.13 0.27 0.42 0.57 0.72 0.13 0.27 0.42 0.57 0.72
STTD Ca:STTD P: 0.87:1 1.80:1 2.80:1 3.80:1 4.80:1 0.42:1 0.87:1 1.35:1 1.84:1 2.32:1
Ground corn 65.00 65.00 65.00 65.00 65.00 65.00 65.00 65.00 65.00 65.00
Soybean meal 24.00 24.00 24.00 24.00 24.00 24.00 24.00 24.00 24.00 24.00
Cornstarch 8.95 7.13 5.30 3.47 1.63 8.35 6.58 4.78 2.93 1.10
Soybean oil - 1.20 2.40 3.60 4.80 0.40 1.55 2.73 3.95 5.15
Calcium carbonate 0.03 0.65 1.28 1.91 2.55 0.03 0.65 1.28 1.91 2.55
Monocalcium phosphate 0.17 0.17 0.17 0.17 0.17 0.17 0.17 0.17 0.17 0.17
Monosodium phosphate - - - - - 0.70 0.70 0.70 0.70 0.70
Sodium bicarbonate 1.05 1.05 1.05 1.05 1.05 0.55 0.55 0.54 0.54 0.53
L-Lys HCl 0.29 0.29 0.29 0.29 0.29 0.29 0.29 0.29 0.29 0.29
DL-Met 0.04 0.04 0.04 0.04 0.04 0.04 0.04 0.04 0.04 0.04
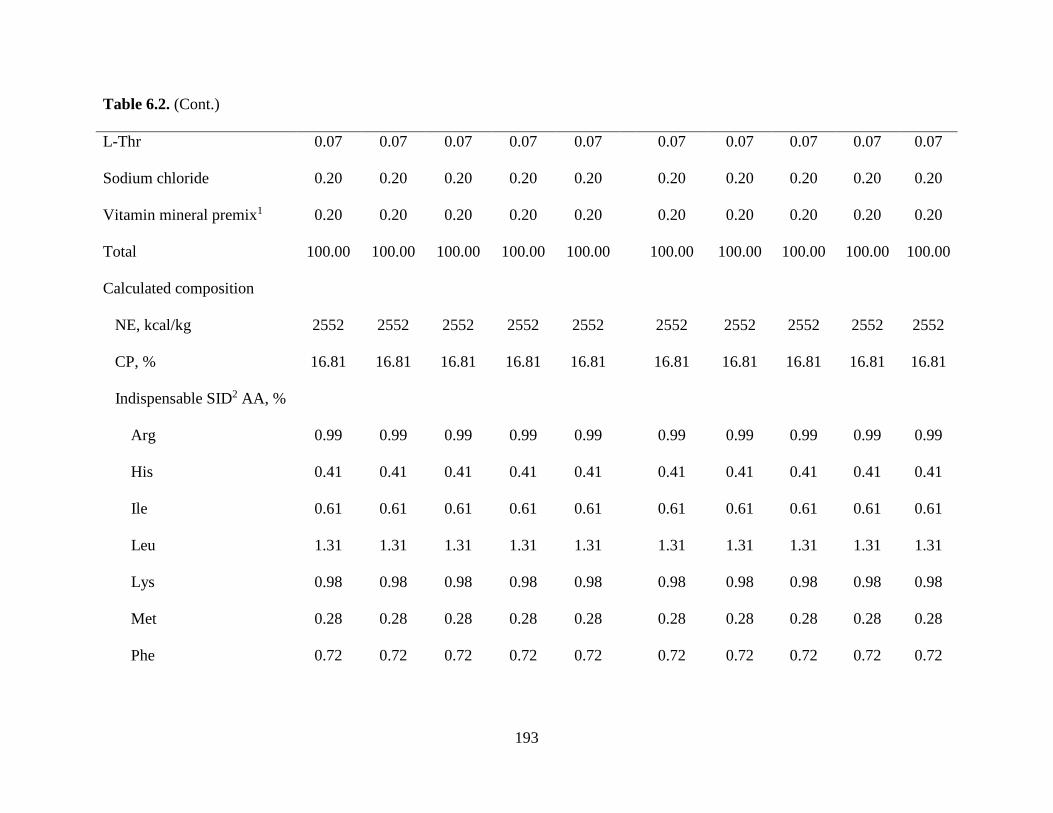
193
Table 6.2. (Cont.)
L-Thr 0.07 0.07 0.07 0.07 0.07 0.07 0.07 0.07 0.07 0.07
Sodium chloride 0.20 0.20 0.20 0.20 0.20 0.20 0.20 0.20 0.20 0.20
Vitamin mineral premix1 0.20 0.20 0.20 0.20 0.20 0.20 0.20 0.20 0.20 0.20
Total 100.00 100.00 100.00 100.00 100.00 100.00 100.00 100.00 100.00 100.00
Calculated composition
NE, kcal/kg 2552 2552 2552 2552 2552 2552 2552 2552 2552 2552
CP, % 16.81 16.81 16.81 16.81 16.81 16.81 16.81 16.81 16.81 16.81
Indispensable SID2 AA, %
Arg 0.99 0.99 0.99 0.99 0.99 0.99 0.99 0.99 0.99 0.99
His 0.41 0.41 0.41 0.41 0.41 0.41 0.41 0.41 0.41 0.41
Ile 0.61 0.61 0.61 0.61 0.61 0.61 0.61 0.61 0.61 0.61
Leu 1.31 1.31 1.31 1.31 1.31 1.31 1.31 1.31 1.31 1.31
Lys 0.98 0.98 0.98 0.98 0.98 0.98 0.98 0.98 0.98 0.98
Met 0.28 0.28 0.28 0.28 0.28 0.28 0.28 0.28 0.28 0.28
Phe 0.72 0.72 0.72 0.72 0.72 0.72 0.72 0.72 0.72 0.72
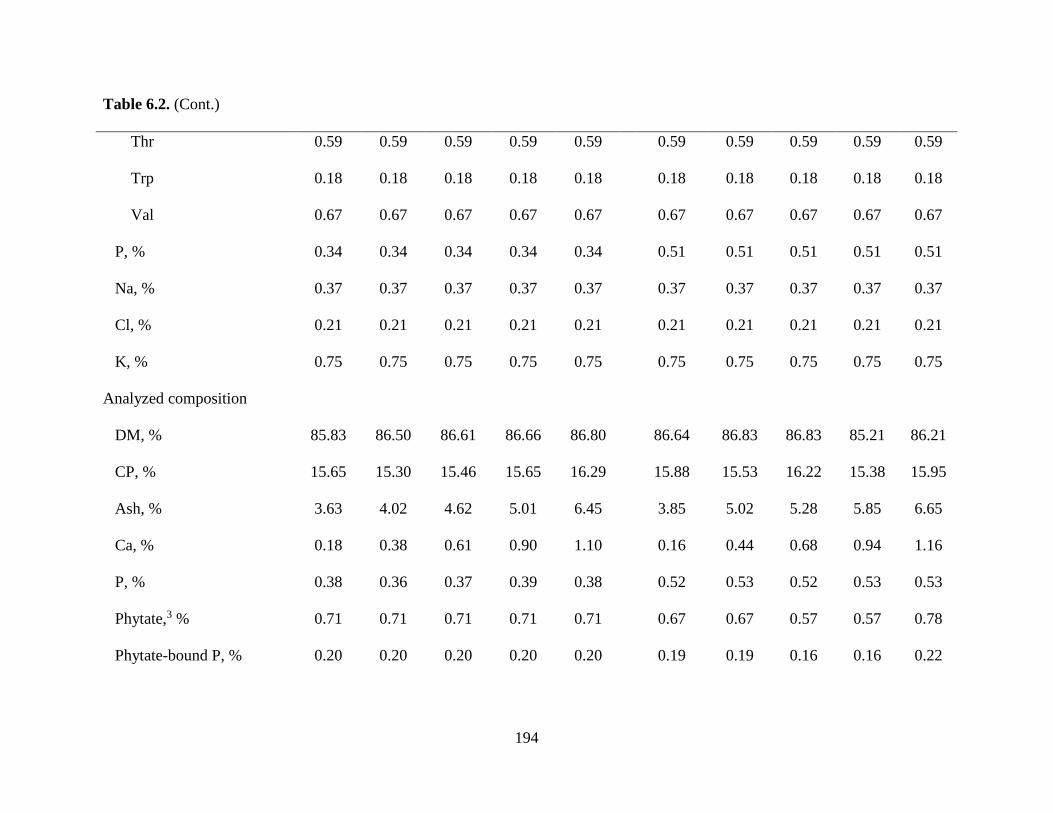
194
Table 6.2. (Cont.)
Thr 0.59 0.59 0.59 0.59 0.59 0.59 0.59 0.59 0.59 0.59
Trp 0.18 0.18 0.18 0.18 0.18 0.18 0.18 0.18 0.18 0.18
Val 0.67 0.67 0.67 0.67 0.67 0.67 0.67 0.67 0.67 0.67
P, % 0.34 0.34 0.34 0.34 0.34 0.51 0.51 0.51 0.51 0.51
Na, % 0.37 0.37 0.37 0.37 0.37 0.37 0.37 0.37 0.37 0.37
Cl, % 0.21 0.21 0.21 0.21 0.21 0.21 0.21 0.21 0.21 0.21
K, % 0.75 0.75 0.75 0.75 0.75 0.75 0.75 0.75 0.75 0.75
Analyzed composition
DM, % 85.83 86.50 86.61 86.66 86.80 86.64 86.83 86.83 85.21 86.21
CP, % 15.65 15.30 15.46 15.65 16.29 15.88 15.53 16.22 15.38 15.95
Ash, % 3.63 4.02 4.62 5.01 6.45 3.85 5.02 5.28 5.85 6.65
Ca, % 0.18 0.38 0.61 0.90 1.10 0.16 0.44 0.68 0.94 1.16
P, % 0.38 0.36 0.37 0.39 0.38 0.52 0.53 0.52 0.53 0.53
Phytate,3 % 0.71 0.71 0.71 0.71 0.71 0.67 0.67 0.57 0.57 0.78
Phytate-bound P, % 0.20 0.20 0.20 0.20 0.20 0.19 0.19 0.16 0.16 0.22
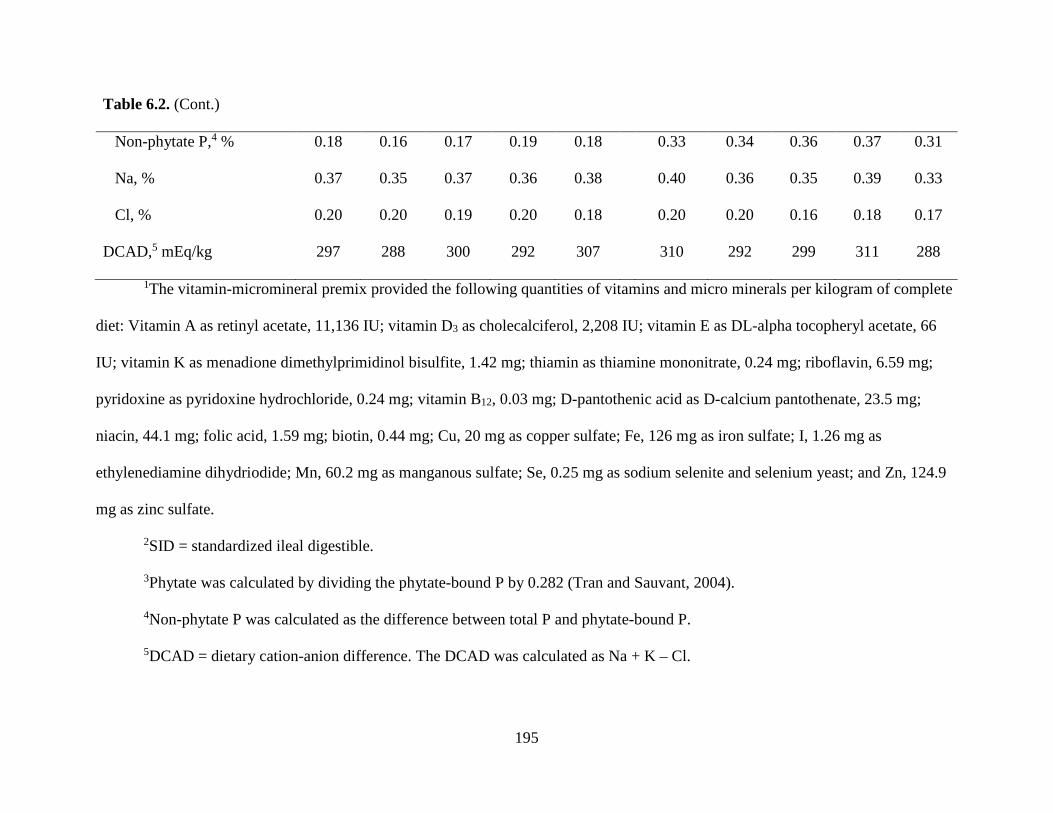
195
Table 6.2. (Cont.)
Non-phytate P,4 % 0.18 0.16 0.17 0.19 0.18 0.33 0.34 0.36 0.37 0.31
Na, % 0.37 0.35 0.37 0.36 0.38 0.40 0.36 0.35 0.39 0.33
Cl, % 0.20 0.20 0.19 0.20 0.18 0.20 0.20 0.16 0.18 0.17
DCAD,5 mEq/kg 297 288 300 292 307 310 292 299 311 288
1The vitamin-micromineral premix provided the following quantities of vitamins and micro minerals per kilogram of complete
diet: Vitamin A as retinyl acetate, 11,136 IU; vitamin D3 as cholecalciferol, 2,208 IU; vitamin E as DL-alpha tocopheryl acetate, 66
IU; vitamin K as menadione dimethylprimidinol bisulfite, 1.42 mg; thiamin as thiamine mononitrate, 0.24 mg; riboflavin, 6.59 mg;
pyridoxine as pyridoxine hydrochloride, 0.24 mg; vitamin B12, 0.03 mg; D-pantothenic acid as D-calcium pantothenate, 23.5 mg;
niacin, 44.1 mg; folic acid, 1.59 mg; biotin, 0.44 mg; Cu, 20 mg as copper sulfate; Fe, 126 mg as iron sulfate; I, 1.26 mg as
ethylenediamine dihydriodide; Mn, 60.2 mg as manganous sulfate; Se, 0.25 mg as sodium selenite and selenium yeast; and Zn, 124.9
mg as zinc sulfate.
2SID = standardized ileal digestible.
3Phytate was calculated by dividing the phytate-bound P by 0.282 (Tran and Sauvant, 2004).
4Non-phytate P was calculated as the difference between total P and phytate-bound P.
5DCAD = dietary cation-anion difference. The DCAD was calculated as Na + K – Cl.
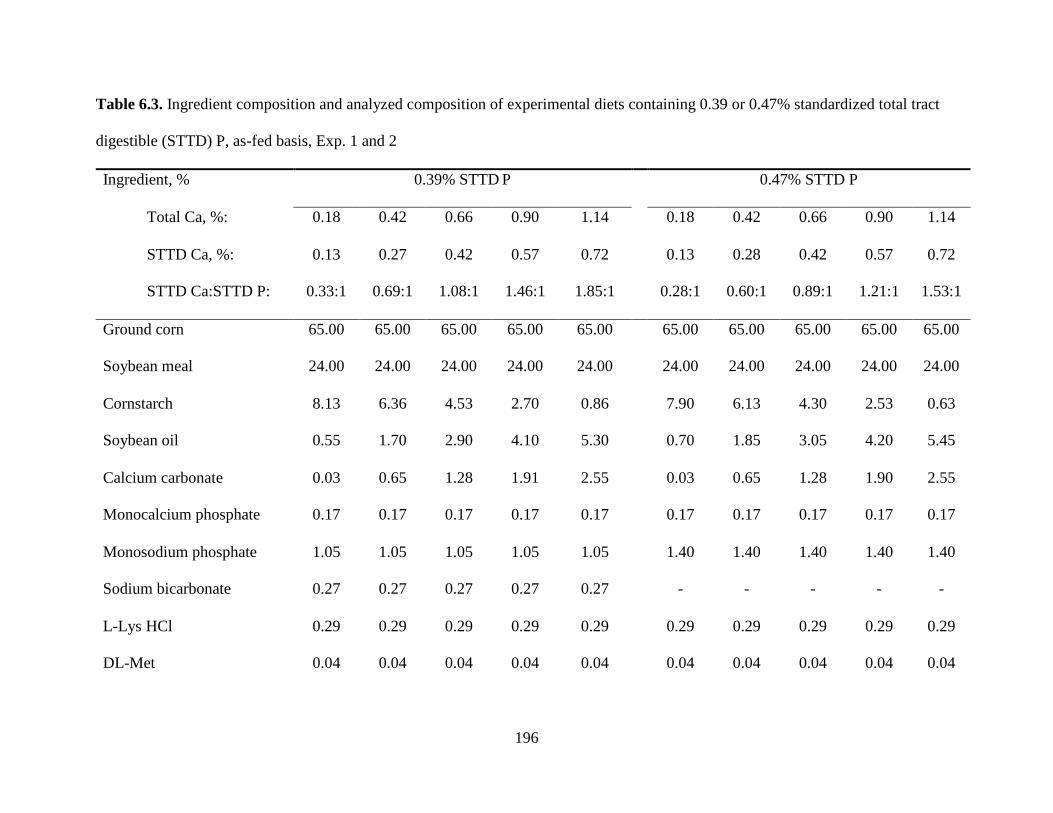
196
Table 6.3. Ingredient composition and analyzed composition of experimental diets containing 0.39 or 0.47% standardized total tract
digestible (STTD) P, as-fed basis, Exp. 1 and 2
Ingredient, % 0.39% STTD P 0.47% STTD P
Total Ca, %: 0.18 0.42 0.66 0.90 1.14 0.18 0.42 0.66 0.90 1.14
STTD Ca, %: 0.13 0.27 0.42 0.57 0.72 0.13 0.28 0.42 0.57 0.72
STTD Ca:STTD P: 0.33:1 0.69:1 1.08:1 1.46:1 1.85:1 0.28:1 0.60:1 0.89:1 1.21:1 1.53:1
Ground corn 65.00 65.00 65.00 65.00 65.00 65.00 65.00 65.00 65.00 65.00
Soybean meal 24.00 24.00 24.00 24.00 24.00 24.00 24.00 24.00 24.00 24.00
Cornstarch 8.13 6.36 4.53 2.70 0.86 7.90 6.13 4.30 2.53 0.63
Soybean oil 0.55 1.70 2.90 4.10 5.30 0.70 1.85 3.05 4.20 5.45
Calcium carbonate 0.03 0.65 1.28 1.91 2.55 0.03 0.65 1.28 1.90 2.55
Monocalcium phosphate 0.17 0.17 0.17 0.17 0.17 0.17 0.17 0.17 0.17 0.17
Monosodium phosphate 1.05 1.05 1.05 1.05 1.05 1.40 1.40 1.40 1.40 1.40
Sodium bicarbonate 0.27 0.27 0.27 0.27 0.27 - - - - -
L-Lys HCl 0.29 0.29 0.29 0.29 0.29 0.29 0.29 0.29 0.29 0.29
DL-Met 0.04 0.04 0.04 0.04 0.04 0.04 0.04 0.04 0.04 0.04
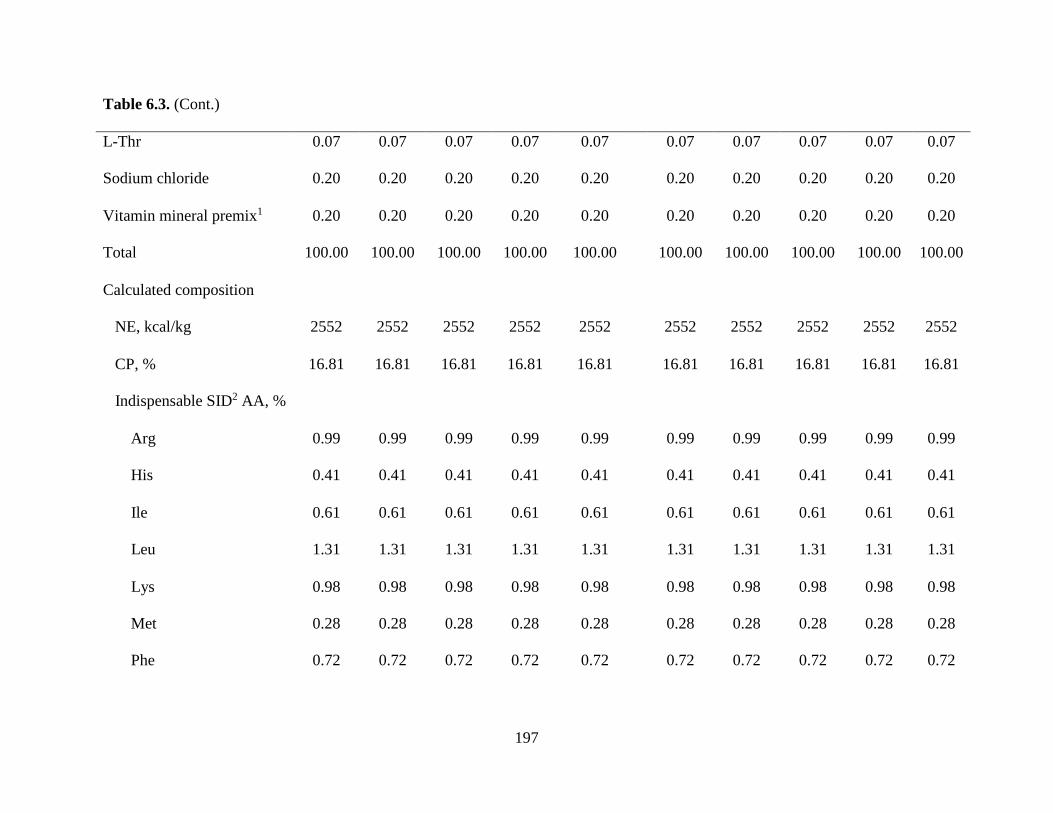
197
Table 6.3. (Cont.)
L-Thr 0.07 0.07 0.07 0.07 0.07 0.07 0.07 0.07 0.07 0.07
Sodium chloride 0.20 0.20 0.20 0.20 0.20 0.20 0.20 0.20 0.20 0.20
Vitamin mineral premix1 0.20 0.20 0.20 0.20 0.20 0.20 0.20 0.20 0.20 0.20
Total 100.00 100.00 100.00 100.00 100.00 100.00 100.00 100.00 100.00 100.00
Calculated composition
NE, kcal/kg 2552 2552 2552 2552 2552 2552 2552 2552 2552 2552
CP, % 16.81 16.81 16.81 16.81 16.81 16.81 16.81 16.81 16.81 16.81
Indispensable SID2 AA, %
Arg 0.99 0.99 0.99 0.99 0.99 0.99 0.99 0.99 0.99 0.99
His 0.41 0.41 0.41 0.41 0.41 0.41 0.41 0.41 0.41 0.41
Ile 0.61 0.61 0.61 0.61 0.61 0.61 0.61 0.61 0.61 0.61
Leu 1.31 1.31 1.31 1.31 1.31 1.31 1.31 1.31 1.31 1.31
Lys 0.98 0.98 0.98 0.98 0.98 0.98 0.98 0.98 0.98 0.98
Met 0.28 0.28 0.28 0.28 0.28 0.28 0.28 0.28 0.28 0.28
Phe 0.72 0.72 0.72 0.72 0.72 0.72 0.72 0.72 0.72 0.72
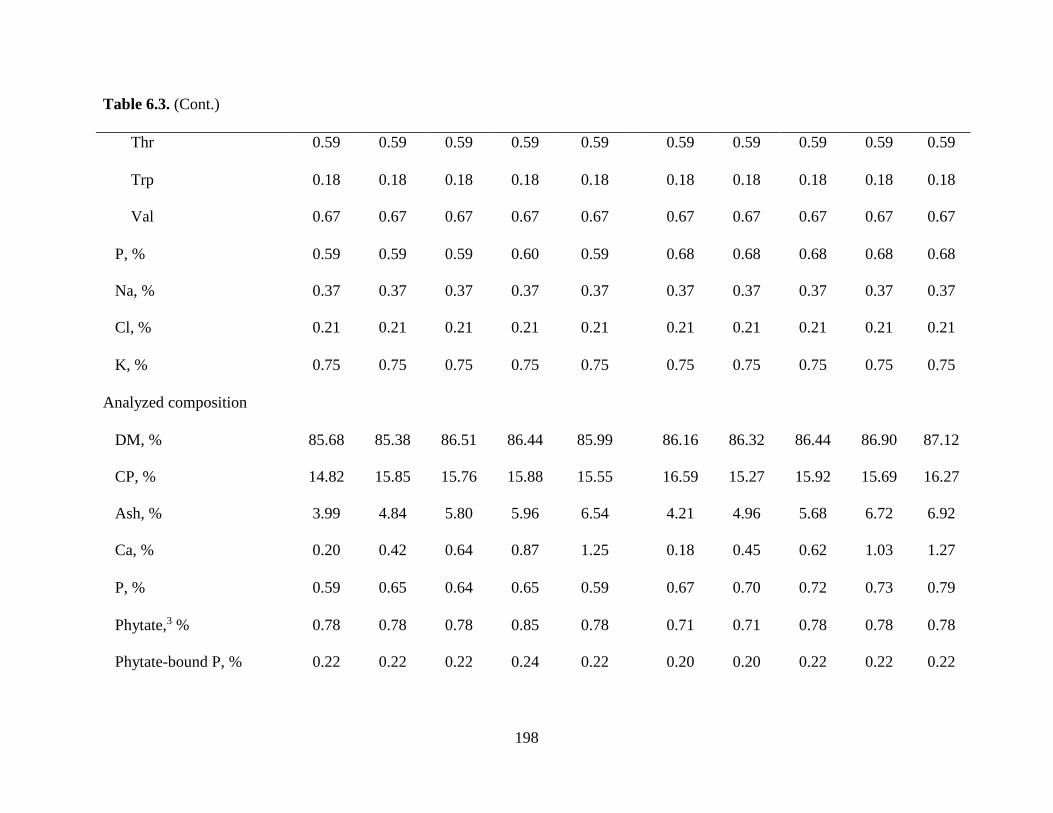
198
Table 6.3. (Cont.)
Thr 0.59 0.59 0.59 0.59 0.59 0.59 0.59 0.59 0.59 0.59
Trp 0.18 0.18 0.18 0.18 0.18 0.18 0.18 0.18 0.18 0.18
Val 0.67 0.67 0.67 0.67 0.67 0.67 0.67 0.67 0.67 0.67
P, % 0.59 0.59 0.59 0.60 0.59 0.68 0.68 0.68 0.68 0.68
Na, % 0.37 0.37 0.37 0.37 0.37 0.37 0.37 0.37 0.37 0.37
Cl, % 0.21 0.21 0.21 0.21 0.21 0.21 0.21 0.21 0.21 0.21
K, % 0.75 0.75 0.75 0.75 0.75 0.75 0.75 0.75 0.75 0.75
Analyzed composition
DM, % 85.68 85.38 86.51 86.44 85.99 86.16 86.32 86.44 86.90 87.12
CP, % 14.82 15.85 15.76 15.88 15.55 16.59 15.27 15.92 15.69 16.27
Ash, % 3.99 4.84 5.80 5.96 6.54 4.21 4.96 5.68 6.72 6.92
Ca, % 0.20 0.42 0.64 0.87 1.25 0.18 0.45 0.62 1.03 1.27
P, % 0.59 0.65 0.64 0.65 0.59 0.67 0.70 0.72 0.73 0.79
Phytate,3 % 0.78 0.78 0.78 0.85 0.78 0.71 0.71 0.78 0.78 0.78
Phytate-bound P, % 0.22 0.22 0.22 0.24 0.22 0.20 0.20 0.22 0.22 0.22

199
Table 6.3. (Cont.)
Non-phytate P,4 % 0.37 0.43 0.42 0.41 0.37 0.47 0.50 0.50 0.51 0.57
Na, % 0.36 0.40 0.38 0.37 0.36 0.36 0.41 0.34 0.35 0.37
Cl, % 0.17 0.20 0.20 0.20 0.20 0.20 0.20 0.16 0.16 0.17
DCAD,5 mEq/kg 301 310 301 297 292 292 314 295 299 305
1The vitamin-micromineral premix provided the following quantities of vitamins and micro minerals per kilogram of complete
diet: Vitamin A as retinyl acetate, 11,136 IU; vitamin D3 as cholecalciferol, 2,208 IU; vitamin E as DL-alpha tocopheryl acetate, 66
IU; vitamin K as menadione dimethylprimidinol bisulfite, 1.42 mg; thiamin as thiamine mononitrate, 0.24 mg; riboflavin, 6.59 mg;
pyridoxine as pyridoxine hydrochloride, 0.24 mg; vitamin B12, 0.03 mg; D-pantothenic acid as D-calcium pantothenate, 23.5 mg;
niacin, 44.1 mg; folic acid, 1.59 mg; biotin, 0.44 mg; Cu, 20 mg as copper sulfate; Fe, 126 mg as iron sulfate; I, 1.26 mg as
ethylenediamine dihydriodide; Mn, 60.2 mg as manganous sulfate; Se, 0.25 mg as sodium selenite and selenium yeast; and Zn, 124.9
mg as zinc sulfate.
2SID = standardized ileal digestible.
3Phytate was calculated by dividing the phytate-bound P by 0.282 (Tran and Sauvant, 2004).
4Non-phytate P was calculated as the difference between total P and phytate-bound P.
5DCAD = dietary cation-anion difference. The DCAD was calculated as Na + K – Cl.
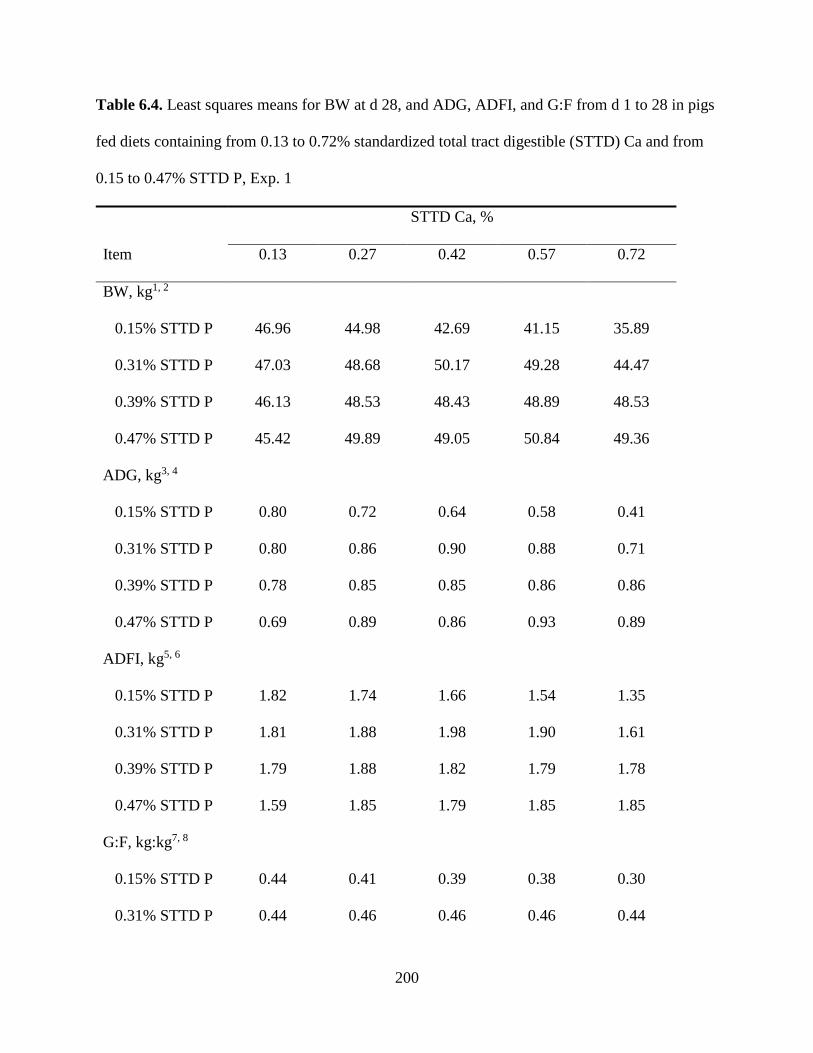
200
Table 6.4. Least squares means for BW at d 28, and ADG, ADFI, and G:F from d 1 to 28 in pigs
fed diets containing from 0.13 to 0.72% standardized total tract digestible (STTD) Ca and from
0.15 to 0.47% STTD P, Exp. 1
STTD Ca, %
Item 0.13 0.27 0.42 0.57 0.72
BW, kg1, 2
0.15% STTD P 46.96 44.98 42.69 41.15 35.89
0.31% STTD P 47.03 48.68 50.17 49.28 44.47
0.39% STTD P 46.13 48.53 48.43 48.89 48.53
0.47% STTD P 45.42 49.89 49.05 50.84 49.36
ADG, kg3, 4
0.15% STTD P 0.80 0.72 0.64 0.58 0.41
0.31% STTD P 0.80 0.86 0.90 0.88 0.71
0.39% STTD P 0.78 0.85 0.85 0.86 0.86
0.47% STTD P 0.69 0.89 0.86 0.93 0.89
ADFI, kg5, 6
0.15% STTD P 1.82 1.74 1.66 1.54 1.35
0.31% STTD P 1.81 1.88 1.98 1.90 1.61
0.39% STTD P 1.79 1.88 1.82 1.79 1.78
0.47% STTD P 1.59 1.85 1.79 1.85 1.85
G:F, kg:kg7, 8
0.15% STTD P 0.44 0.41 0.39 0.38 0.30
0.31% STTD P 0.44 0.46 0.46 0.46 0.44
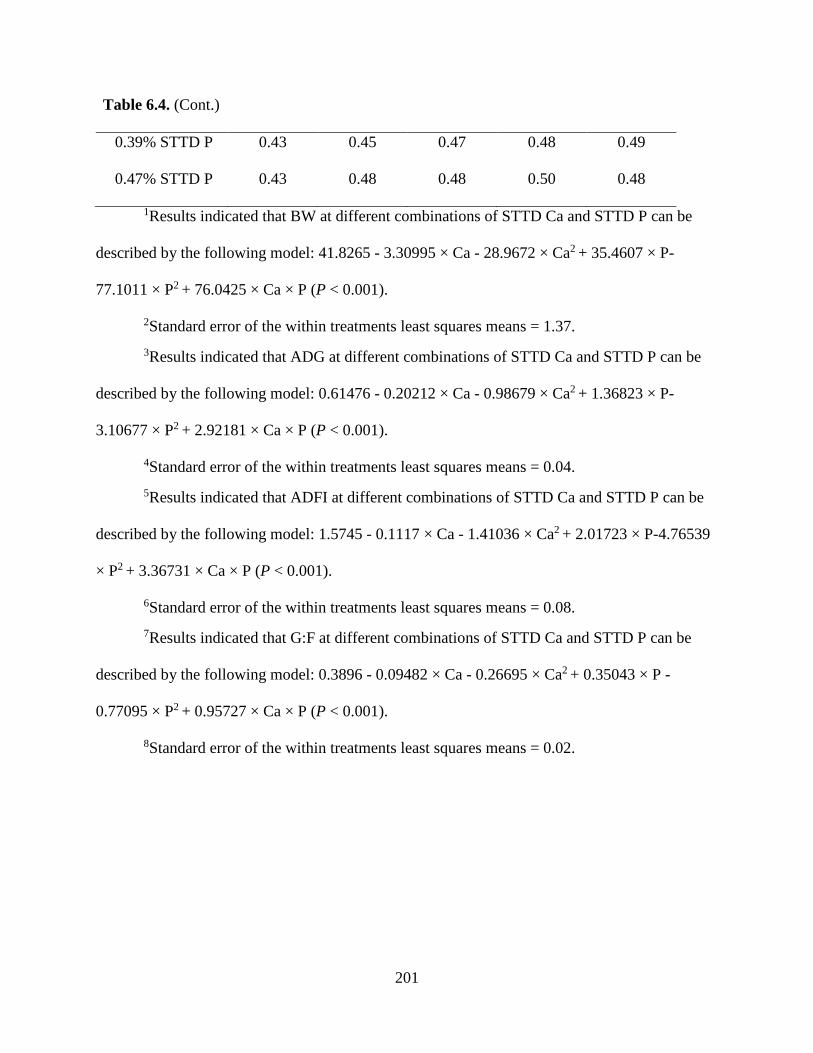
201
Table 6.4. (Cont.)
0.39% STTD P 0.43 0.45 0.47 0.48 0.49
0.47% STTD P 0.43 0.48 0.48 0.50 0.48
1Results indicated that BW at different combinations of STTD Ca and STTD P can be
described by the following model: 41.8265 - 3.30995 × Ca - 28.9672 × Ca2 + 35.4607 × P-
77.1011 × P2 + 76.0425 × Ca × P (P < 0.001).
2Standard error of the within treatments least squares means = 1.37. 3Results indicated that ADG at different combinations of STTD Ca and STTD P can be
described by the following model: 0.61476 - 0.20212 × Ca - 0.98679 × Ca2 + 1.36823 × P-
3.10677 × P2 + 2.92181 × Ca × P (P < 0.001).
4Standard error of the within treatments least squares means = 0.04. 5Results indicated that ADFI at different combinations of STTD Ca and STTD P can be
described by the following model: 1.5745 - 0.1117 × Ca - 1.41036 × Ca2 + 2.01723 × P-4.76539
× P2 + 3.36731 × Ca × P (P < 0.001).
6Standard error of the within treatments least squares means = 0.08. 7Results indicated that G:F at different combinations of STTD Ca and STTD P can be
described by the following model: 0.3896 - 0.09482 × Ca - 0.26695 × Ca2 + 0.35043 × P -
0.77095 × P2 + 0.95727 × Ca × P (P < 0.001).
8Standard error of the within treatments least squares means = 0.02.
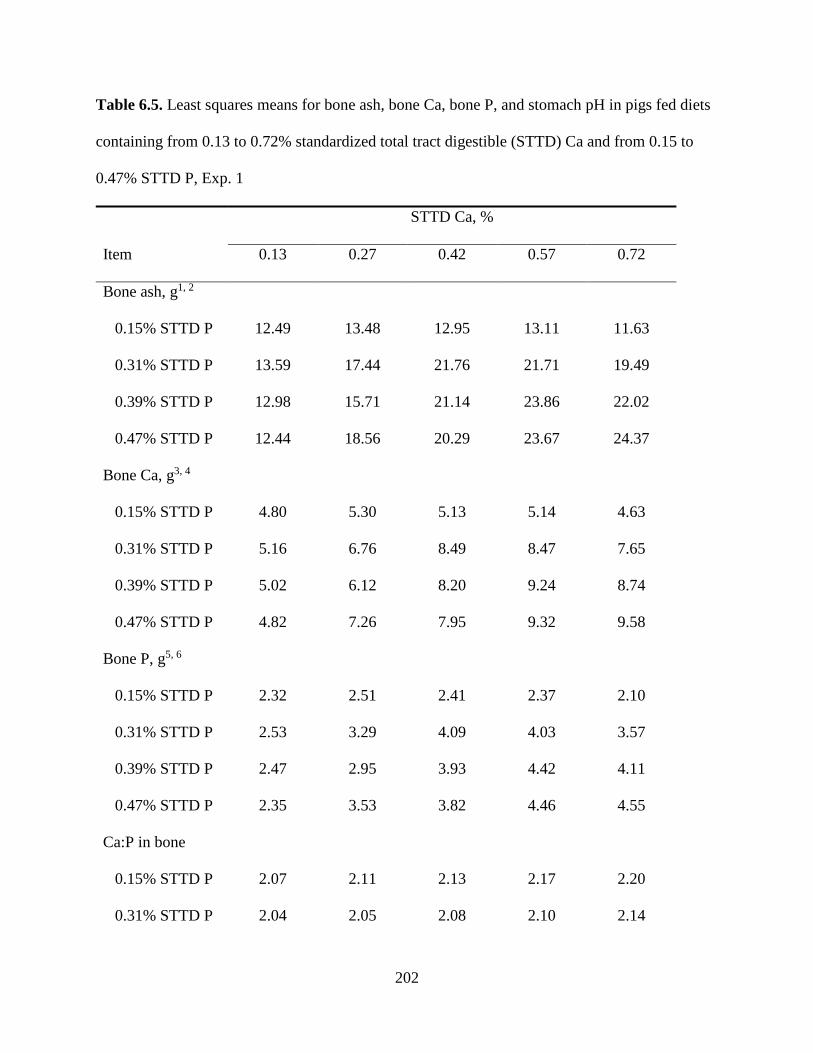
202
Table 6.5. Least squares means for bone ash, bone Ca, bone P, and stomach pH in pigs fed diets
containing from 0.13 to 0.72% standardized total tract digestible (STTD) Ca and from 0.15 to
0.47% STTD P, Exp. 1
STTD Ca, %
Item 0.13 0.27 0.42 0.57 0.72
Bone ash, g1, 2
0.15% STTD P 12.49 13.48 12.95 13.11 11.63
0.31% STTD P 13.59 17.44 21.76 21.71 19.49
0.39% STTD P 12.98 15.71 21.14 23.86 22.02
0.47% STTD P 12.44 18.56 20.29 23.67 24.37
Bone Ca, g3, 4
0.15% STTD P 4.80 5.30 5.13 5.14 4.63
0.31% STTD P 5.16 6.76 8.49 8.47 7.65
0.39% STTD P 5.02 6.12 8.20 9.24 8.74
0.47% STTD P 4.82 7.26 7.95 9.32 9.58
Bone P, g5, 6
0.15% STTD P 2.32 2.51 2.41 2.37 2.10
0.31% STTD P 2.53 3.29 4.09 4.03 3.57
0.39% STTD P 2.47 2.95 3.93 4.42 4.11
0.47% STTD P 2.35 3.53 3.82 4.46 4.55
Ca:P in bone
0.15% STTD P 2.07 2.11 2.13 2.17 2.20
0.31% STTD P 2.04 2.05 2.08 2.10 2.14
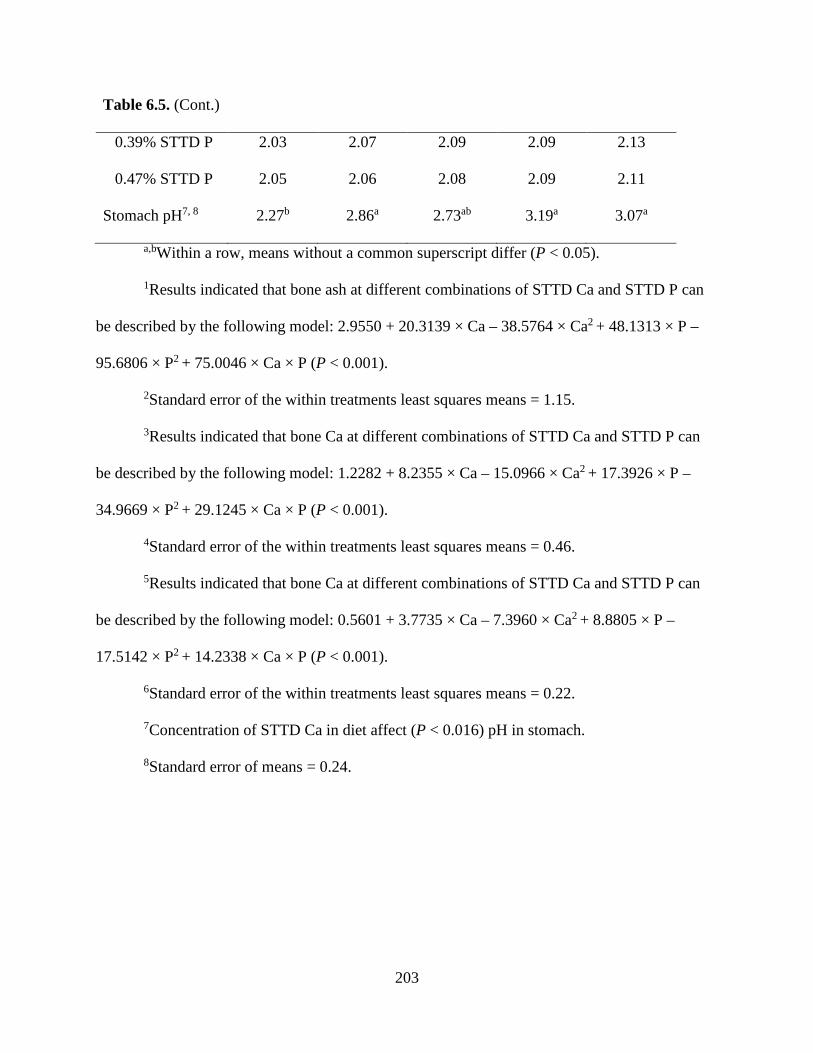
203
Table 6.5. (Cont.)
0.39% STTD P 2.03 2.07 2.09 2.09 2.13
0.47% STTD P 2.05 2.06 2.08 2.09 2.11
Stomach pH7, 8 2.27b 2.86a 2.73ab 3.19a 3.07a
a,bWithin a row, means without a common superscript differ (P < 0.05).
1Results indicated that bone ash at different combinations of STTD Ca and STTD P can
be described by the following model: 2.9550 + 20.3139 × Ca – 38.5764 × Ca2 + 48.1313 × P –
95.6806 × P2 + 75.0046 × Ca × P (P < 0.001).
2Standard error of the within treatments least squares means = 1.15.
3Results indicated that bone Ca at different combinations of STTD Ca and STTD P can
be described by the following model: 1.2282 + 8.2355 × Ca – 15.0966 × Ca2 + 17.3926 × P –
34.9669 × P2 + 29.1245 × Ca × P (P < 0.001).
4Standard error of the within treatments least squares means = 0.46.
5Results indicated that bone Ca at different combinations of STTD Ca and STTD P can
be described by the following model: 0.5601 + 3.7735 × Ca – 7.3960 × Ca2 + 8.8805 × P –
17.5142 × P2 + 14.2338 × Ca × P (P < 0.001).
6Standard error of the within treatments least squares means = 0.22.
7Concentration of STTD Ca in diet affect (P < 0.016) pH in stomach.
8Standard error of means = 0.24.
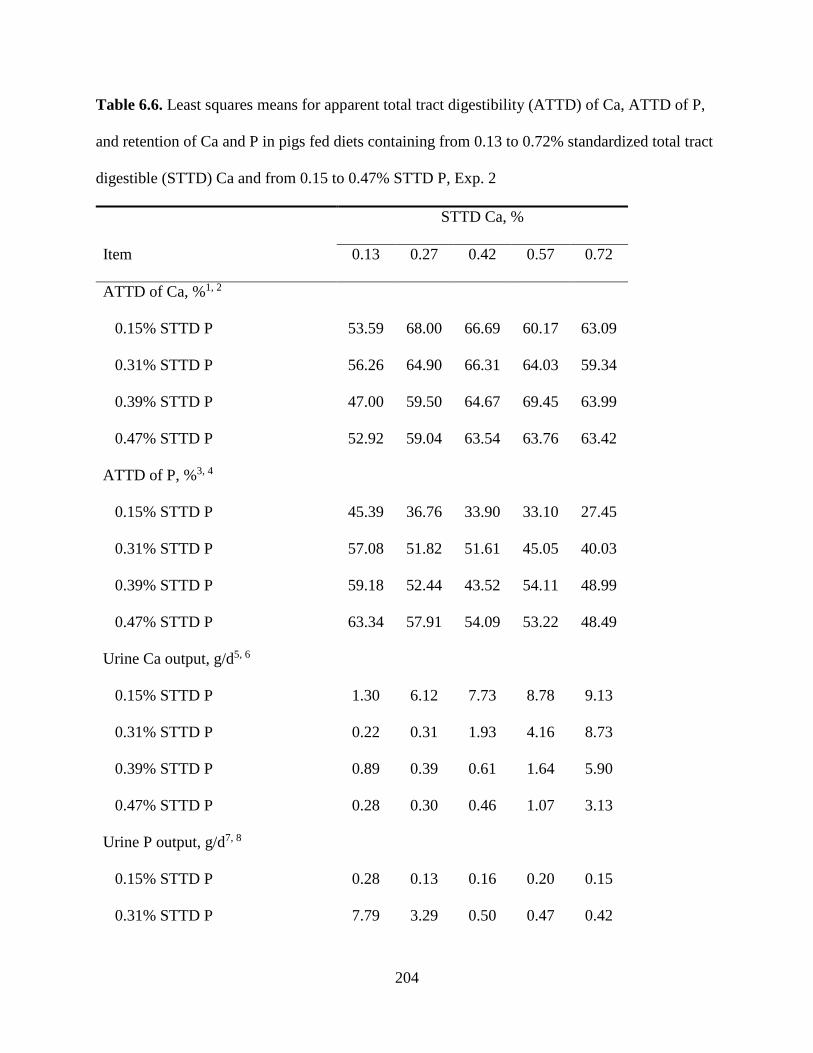
204
Table 6.6. Least squares means for apparent total tract digestibility (ATTD) of Ca, ATTD of P,
and retention of Ca and P in pigs fed diets containing from 0.13 to 0.72% standardized total tract
digestible (STTD) Ca and from 0.15 to 0.47% STTD P, Exp. 2
STTD Ca, %
Item 0.13 0.27 0.42 0.57 0.72
ATTD of Ca, %1, 2
0.15% STTD P 53.59 68.00 66.69 60.17 63.09
0.31% STTD P 56.26 64.90 66.31 64.03 59.34
0.39% STTD P 47.00 59.50 64.67 69.45 63.99
0.47% STTD P 52.92 59.04 63.54 63.76 63.42
ATTD of P, %3, 4
0.15% STTD P 45.39 36.76 33.90 33.10 27.45
0.31% STTD P 57.08 51.82 51.61 45.05 40.03
0.39% STTD P 59.18 52.44 43.52 54.11 48.99
0.47% STTD P 63.34 57.91 54.09 53.22 48.49
Urine Ca output, g/d5, 6
0.15% STTD P 1.30 6.12 7.73 8.78 9.13
0.31% STTD P 0.22 0.31 1.93 4.16 8.73
0.39% STTD P 0.89 0.39 0.61 1.64 5.90
0.47% STTD P 0.28 0.30 0.46 1.07 3.13
Urine P output, g/d7, 8
0.15% STTD P 0.28 0.13 0.16 0.20 0.15
0.31% STTD P 7.79 3.29 0.50 0.47 0.42
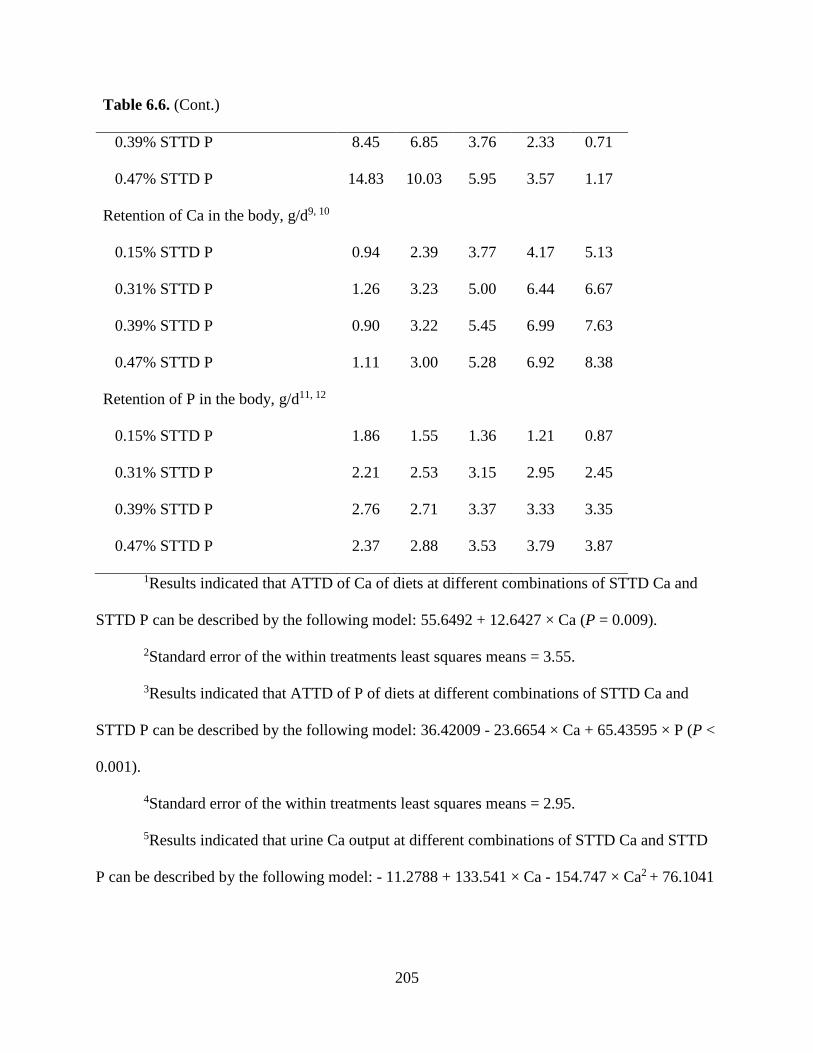
205
Table 6.6. (Cont.)
0.39% STTD P 8.45 6.85 3.76 2.33 0.71
0.47% STTD P 14.83 10.03 5.95 3.57 1.17
Retention of Ca in the body, g/d9, 10
0.15% STTD P 0.94 2.39 3.77 4.17 5.13
0.31% STTD P 1.26 3.23 5.00 6.44 6.67
0.39% STTD P 0.90 3.22 5.45 6.99 7.63
0.47% STTD P 1.11 3.00 5.28 6.92 8.38
Retention of P in the body, g/d11, 12
0.15% STTD P 1.86 1.55 1.36 1.21 0.87
0.31% STTD P 2.21 2.53 3.15 2.95 2.45
0.39% STTD P 2.76 2.71 3.37 3.33 3.35
0.47% STTD P 2.37 2.88 3.53 3.79 3.87
1Results indicated that ATTD of Ca of diets at different combinations of STTD Ca and
STTD P can be described by the following model: 55.6492 + 12.6427 × Ca (P = 0.009).
2Standard error of the within treatments least squares means = 3.55.
3Results indicated that ATTD of P of diets at different combinations of STTD Ca and
STTD P can be described by the following model: 36.42009 - 23.6654 × Ca + 65.43595 × P (P <
0.001).
4Standard error of the within treatments least squares means = 2.95.
5Results indicated that urine Ca output at different combinations of STTD Ca and STTD
P can be described by the following model: - 11.2788 + 133.541 × Ca - 154.747 × Ca2 + 76.1041
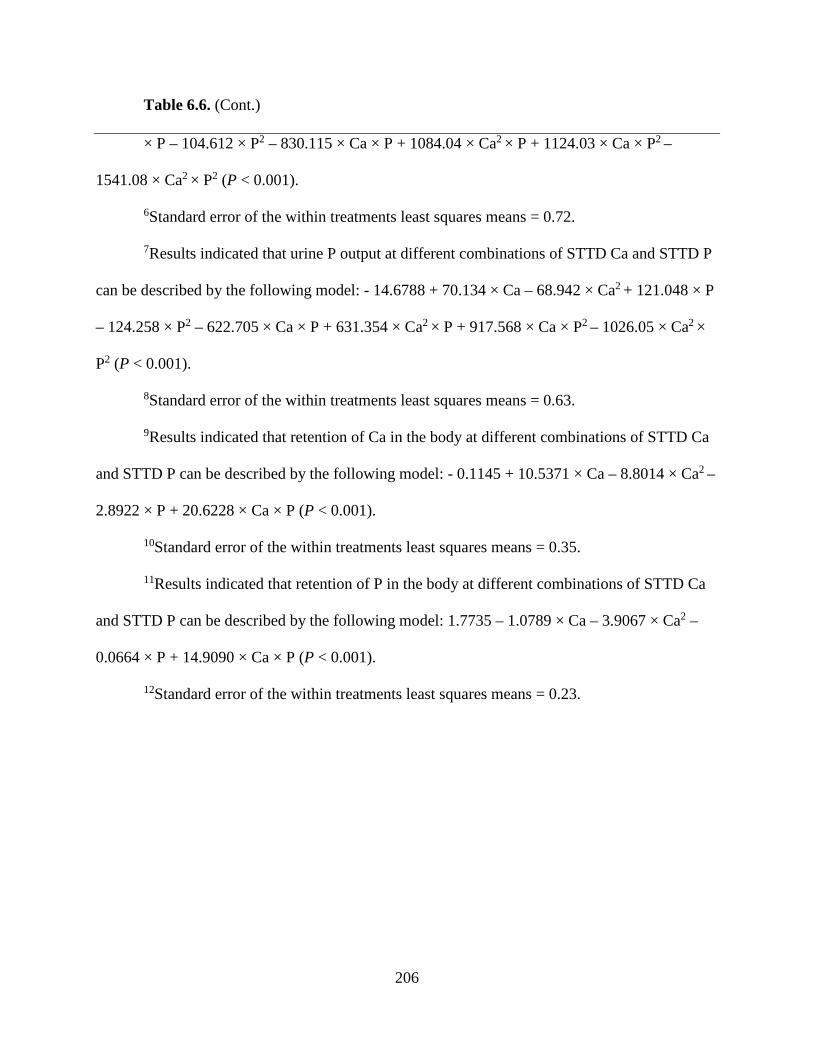
206
Table 6.6. (Cont.)
× P – 104.612 × P2 – 830.115 × Ca × P + 1084.04 × Ca2 × P + 1124.03 × Ca × P2 –
1541.08 × Ca2 × P2 (P < 0.001).
6Standard error of the within treatments least squares means = 0.72.
7Results indicated that urine P output at different combinations of STTD Ca and STTD P
can be described by the following model: - 14.6788 + 70.134 × Ca – 68.942 × Ca2 + 121.048 × P
– 124.258 × P2 – 622.705 × Ca × P + 631.354 × Ca2 × P + 917.568 × Ca × P2 – 1026.05 × Ca2 ×
P2 (P < 0.001).
8Standard error of the within treatments least squares means = 0.63.
9Results indicated that retention of Ca in the body at different combinations of STTD Ca
and STTD P can be described by the following model: - 0.1145 + 10.5371 × Ca – 8.8014 × Ca2 –
2.8922 × P + 20.6228 × Ca × P (P < 0.001).
10Standard error of the within treatments least squares means = 0.35.
11Results indicated that retention of P in the body at different combinations of STTD Ca
and STTD P can be described by the following model: 1.7735 – 1.0789 × Ca – 3.9067 × Ca2 –
0.0664 × P + 14.9090 × Ca × P (P < 0.001).
12Standard error of the within treatments least squares means = 0.23.
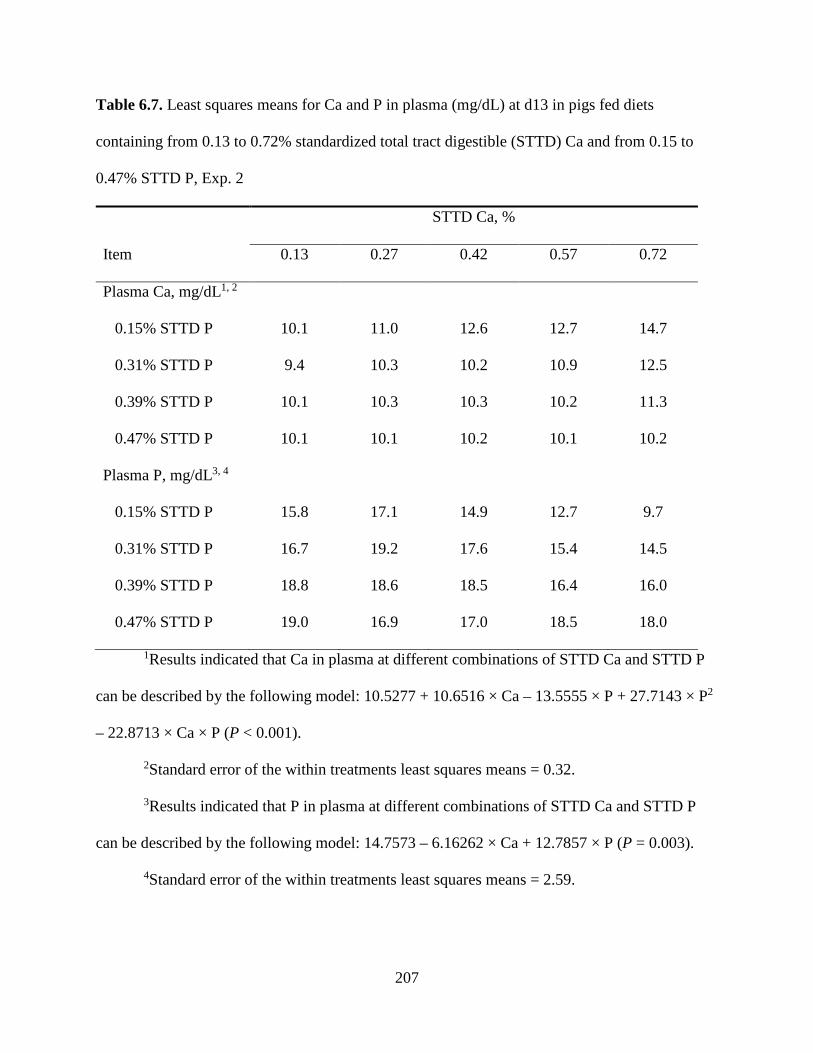
207
Table 6.7. Least squares means for Ca and P in plasma (mg/dL) at d13 in pigs fed diets
containing from 0.13 to 0.72% standardized total tract digestible (STTD) Ca and from 0.15 to
0.47% STTD P, Exp. 2
STTD Ca, %
Item 0.13 0.27 0.42 0.57 0.72
Plasma Ca, mg/dL1, 2
0.15% STTD P 10.1 11.0 12.6 12.7 14.7
0.31% STTD P 9.4 10.3 10.2 10.9 12.5
0.39% STTD P 10.1 10.3 10.3 10.2 11.3
0.47% STTD P 10.1 10.1 10.2 10.1 10.2
Plasma P, mg/dL3, 4
0.15% STTD P 15.8 17.1 14.9 12.7 9.7
0.31% STTD P 16.7 19.2 17.6 15.4 14.5
0.39% STTD P 18.8 18.6 18.5 16.4 16.0
0.47% STTD P 19.0 16.9 17.0 18.5 18.0
1Results indicated that Ca in plasma at different combinations of STTD Ca and STTD P
can be described by the following model: 10.5277 + 10.6516 × Ca – 13.5555 × P + 27.7143 × P2
– 22.8713 × Ca × P (P < 0.001).
2Standard error of the within treatments least squares means = 0.32.
3Results indicated that P in plasma at different combinations of STTD Ca and STTD P
can be described by the following model: 14.7573 – 6.16262 × Ca + 12.7857 × P (P = 0.003).
4Standard error of the within treatments least squares means = 2.59.
208
GENERAL CONCLUSIONS
Most diets fed to pigs are currently formulated to meet requirements for total Ca and
requirements for digestible P. Formulating using values for total Ca has 2 disadvantages: one is
that the amount of Ca that will be absorbed is unknown, and the other disadvantage is that excess
dietary Ca decreases the digestibility of P, which increases P excretion. Excretion of Ca and P in
feces may be reduced if diets are formulated to meet requirements for standardized total tract
digestible (STTD) Ca and STTD P. Therefore, determination of STTD values for Ca in feed
ingredients and determination of requirements for STTD Ca by pigs may result in a reduction in
excretion of P from pigs.
Due to the relatively low concentration of Ca in plant ingredients, Ca supplements or
animal ingredients need to be included in diets. Results of the present research indicated that the
STTD of Ca vary among Ca supplements, and STTD of Ca was greater in monocalcium
phosphate and dicalcium phosphate than in Ca carbonate. It appears that phytate is able to bind
more Ca from Ca carbonate than Ca from monocalcium phosphate and dicalcium phosphate.
This hypothesis was supported by the observation that STTD of Ca in diets containing calcium
carbonate increased if microbial phytase was used, but that was not the case for Ca from
monocalcium phosphate or dicalcium phosphate. Likewise, the STTD of Ca in fish meal
increased if microbial phytase was included in the diet, which indicates that Ca from fish meal
may also be bound to phytate and subsequently released if phytase is added to the diet. Thus, the
effect of microbial phytase is dependent on the source of Ca in the diet. Most commercial diets
contain fiber and oil, and results from this research indicates that fiber may increase STTD of Ca
and ATTD of P, whereas soybean oil did not affect the STTD of Ca or the ATTD of P in fish
meal. It was also observed that cornstarch-based diets had a negative effect on the STTD of Ca
209
compared with corn-based diets, and it is, therefore, recommended that Ca digestibility in feed
ingredients is determined in corn-based diets because these values are more representative of
commercial diets.
For 11 to 25 kg pigs, it was observed that growth performance was negatively affected if
diets contained more than 0.50% STTD Ca and 0.36% STTD P. However, bone ash, bone Ca,
bone P, retention of Ca, and retention of P were maximized by dietary Ca above 0.48% STTD
Ca. Based on these results, it is concluded that it is likely that the requirement for STTD Ca for
11 to 25 kg pigs is approximately 1.35 times the required STTD P, but further experiments need
to be conducted to verify this value. It was also observed that although expression of genes
related to Ca transport in the jejunum and kidneys of pigs were decreased as dietary Ca
increased, data indicated that kidneys appear to be the main site for regulation of Ca
homeostasis.
For 25 to 50 kg pigs, a negative effect on ADG and G:F of increasing concentration of
STTD Ca in diets was observed, especially for diets containing 0.15% STTD P. However, this
negative effect was ameliorated as concentration of STTD P in diets increased. Based on these
results, it was concluded that a STTD Ca:STTD P ratio between 1.16:1 and 1.43:1 was needed to
maximize ADG and G:F, but a ratio between 1.53:1 and 1.81:1 was needed to maximize bone
ash. One of the main reasons for the negative effect of excess Ca on growth performance is the
negative effect of excess Ca on the digestibility of P. Therefore, it is recommended to formulate
diets using the ratio between STTD Ca:STTD P. One surprising observation from this work was
that it appears that Ca can be retained in the body in excess of what is retained in bones,
indicating that at high levels of Ca intake some Ca maybe stored in soft tissue.
210
In conclusion, results from these experiments indicate that values for STTD of Ca vary
among different sources of Ca. As a consequence, values for STTD of Ca should be used to
formulate diets fed to pigs. Inclusion of microbial phytase may increase STTD of Ca of some Ca
sources. To maximize the utilization of Ca and P and to maximize growth performance of pigs,
diets should be formulated to meet the requirements for STTD Ca and STTD P, because this will
result in more efficient utilization of both P and Ca. It is likely that in diets where STTD P meets
or exceeds the requirement, growth performance will be maximized if the STTD Ca: STTD P
ratio in the diet is between 1.15:1 and 1.45:1.