Embed Size (px)
Citation preview
TTNDFD: A new (and better) tool to evaluate forages and monitor dairy
rations
Dr. David Combs
Dept. of Dairy Science
University of Wisconsin-Madison
Better Understanding Forage Fiber
and Digestibility
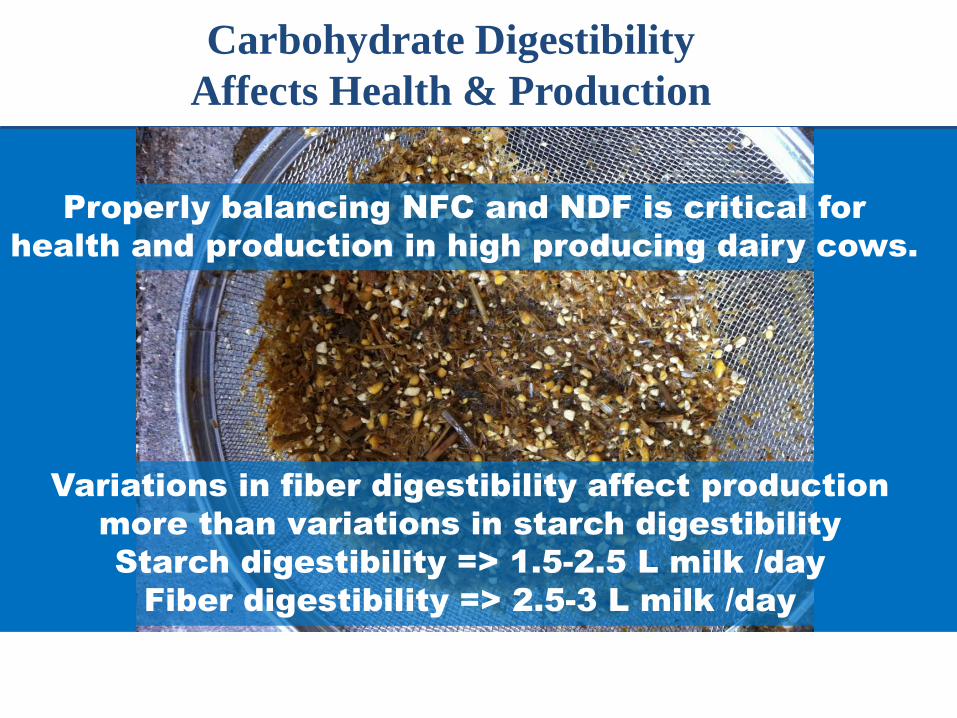
Carbohydrate Digestibility
Affects Health & Production
Properly balancing NFC and NDF is critical for
health and production in high producing dairy cows.
Variations in fiber digestibility affect production
more than variations in starch digestibility
Starch digestibility => 1.5-2.5 L milk /day
Fiber digestibility => 2.5-3 L milk /day
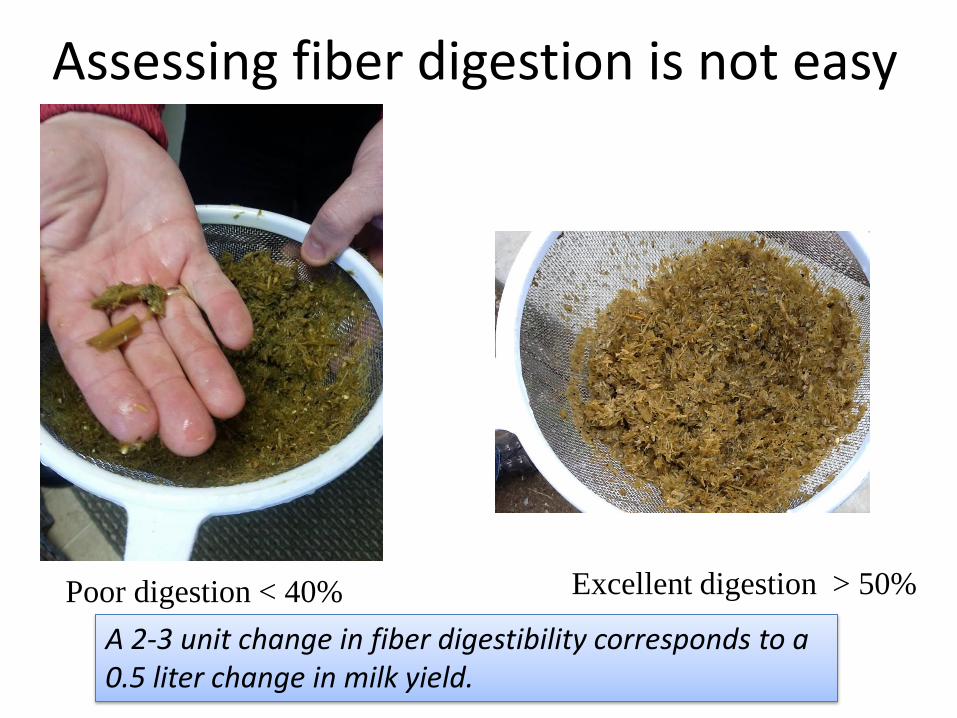
Assessing fiber digestion is not easy
Poor digestion < 40% Excellent digestion > 50%
A 2-3 unit change in fiber digestibility corresponds to a 0.5 liter change in milk yield.
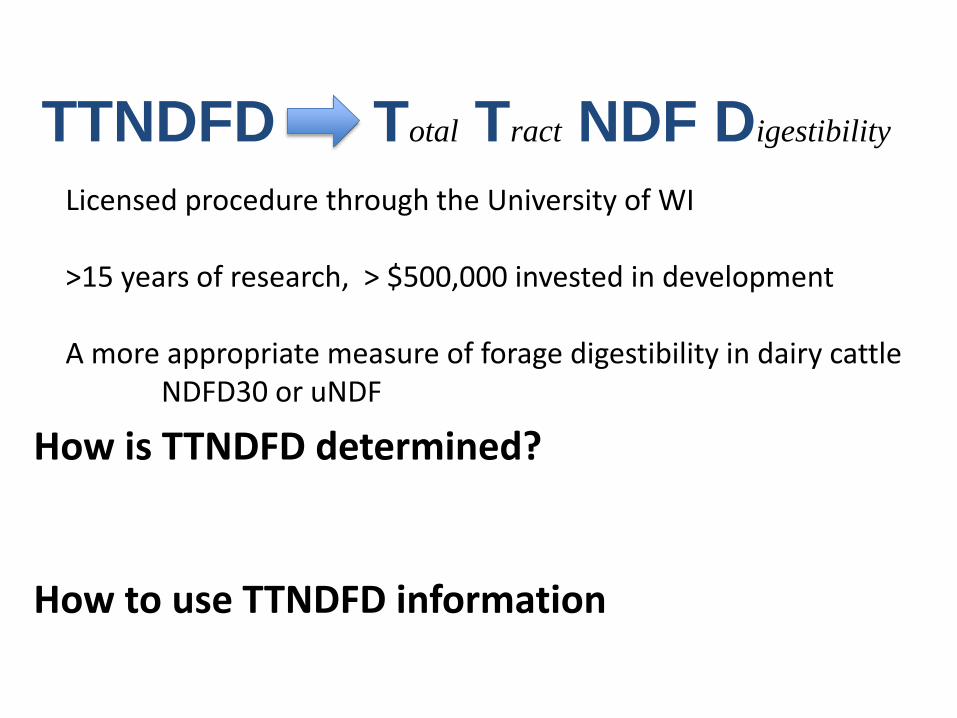
How is TTNDFD determined?
How to use TTNDFD information
TTNDFD Total Tract NDF Digestibility
Licensed procedure through the University of WI >15 years of research, > $500,000 invested in development A more appropriate measure of forage digestibility in dairy cattle NDFD30 or uNDF
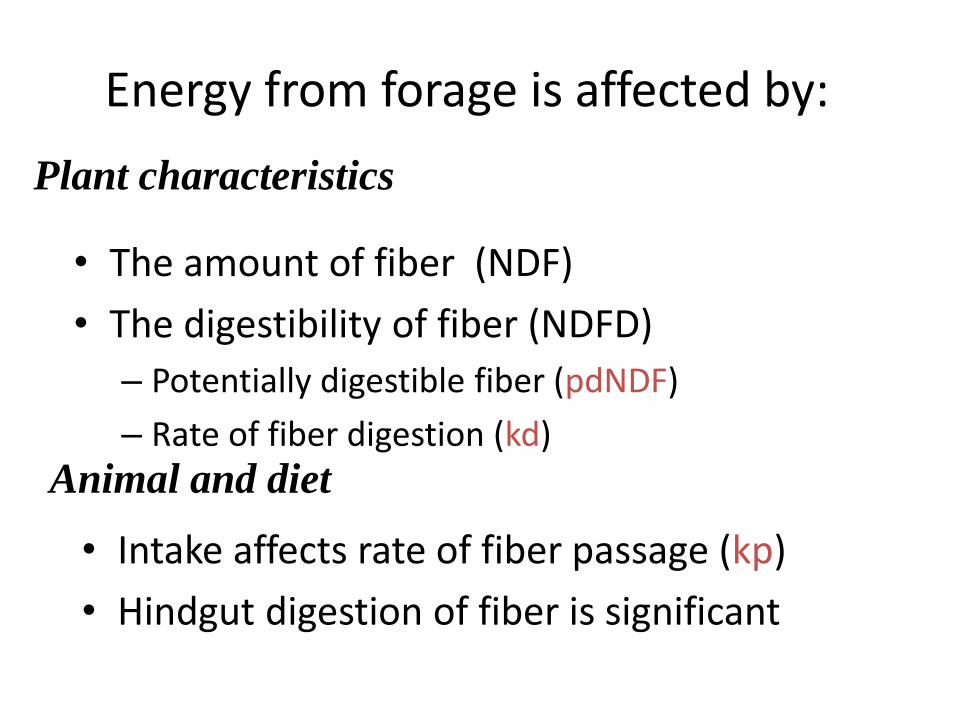
Energy from forage is affected by:
• The amount of fiber (NDF)
• The digestibility of fiber (NDFD)
– Potentially digestible fiber (pdNDF)
– Rate of fiber digestion (kd)
Plant characteristics
Animal and diet
• Intake affects rate of fiber passage (kp)
• Hindgut digestion of fiber is significant
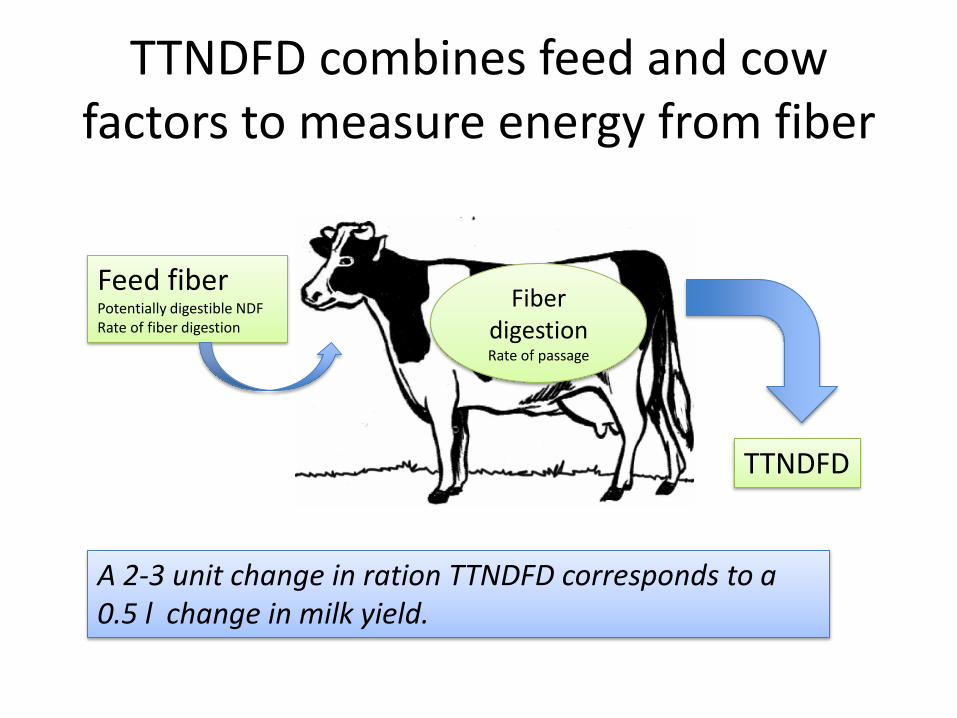
TTNDFD combines feed and cow factors to measure energy from fiber
Feed fiber Potentially digestible NDF Rate of fiber digestion
Fiber digestion Rate of passage
TTNDFD
A 2-3 unit change in ration TTNDFD corresponds to a 0.5 l change in milk yield.
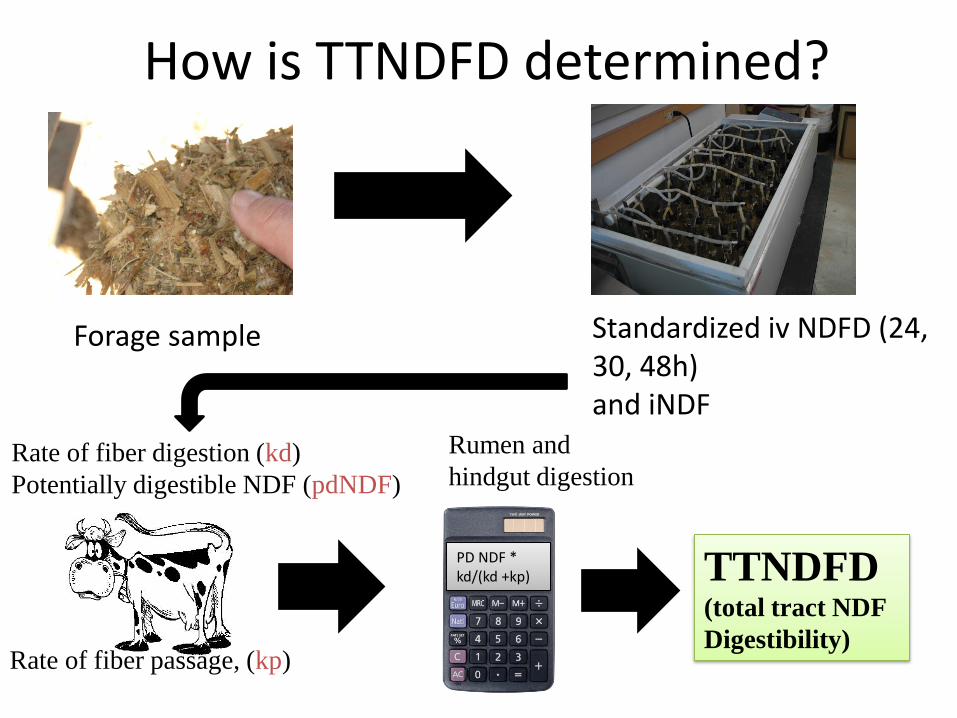
How is TTNDFD determined?
Rate of fiber digestion (kd)
Potentially digestible NDF (pdNDF)
Rate of fiber passage, (kp)
TTNDFD (total tract NDF
Digestibility)
Standardized iv NDFD (24, 30, 48h) and iNDF
Forage sample
PD NDF * kd/(kd +kp)
Rumen and
hindgut digestion
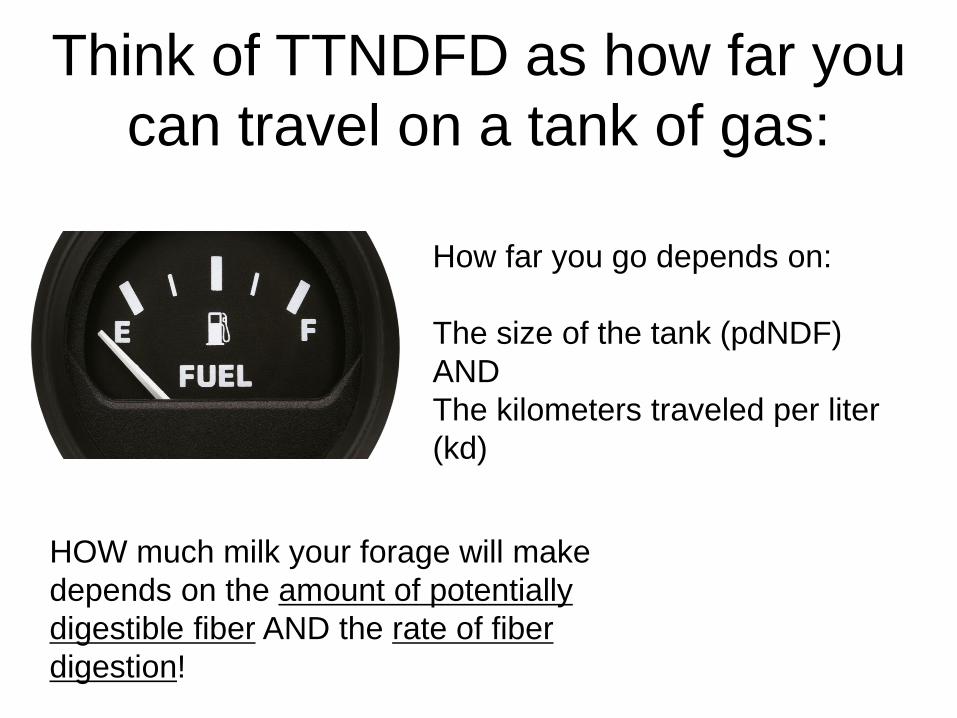
Think of TTNDFD as how far you
can travel on a tank of gas:
How far you go depends on:
The size of the tank (pdNDF)
AND
The kilometers traveled per liter
(kd)
HOW much milk your forage will make
depends on the amount of potentially
digestible fiber AND the rate of fiber
digestion!
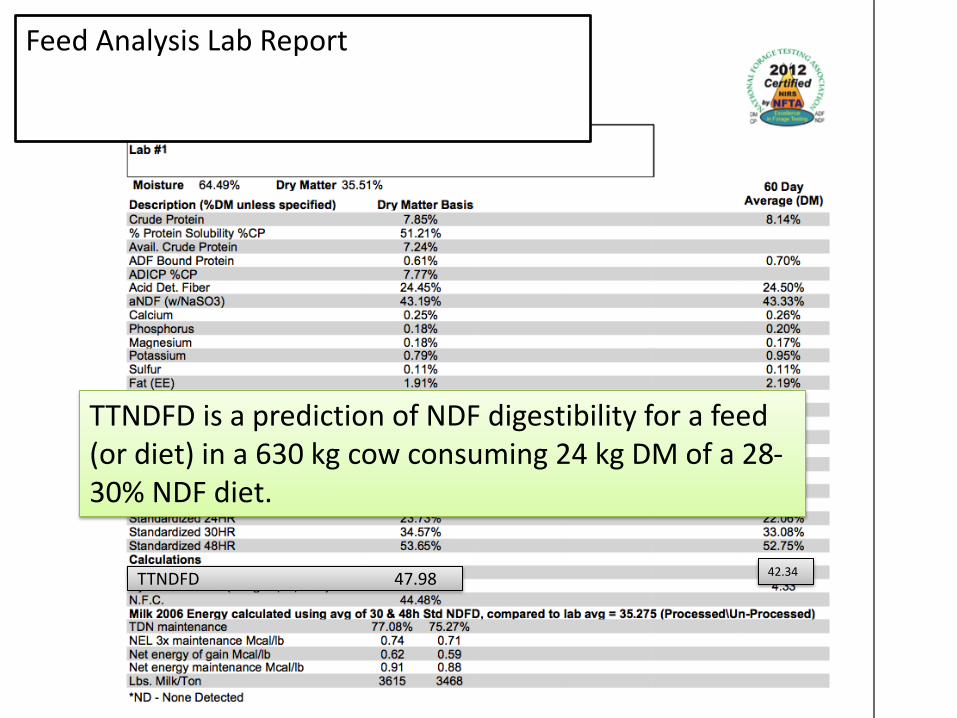
42.34 TTNDFD 47.98
TTNDFD is a prediction of NDF digestibility for a feed (or diet) in a 630 kg cow consuming 24 kg DM of a 28-30% NDF diet.
Feed Analysis Lab Report
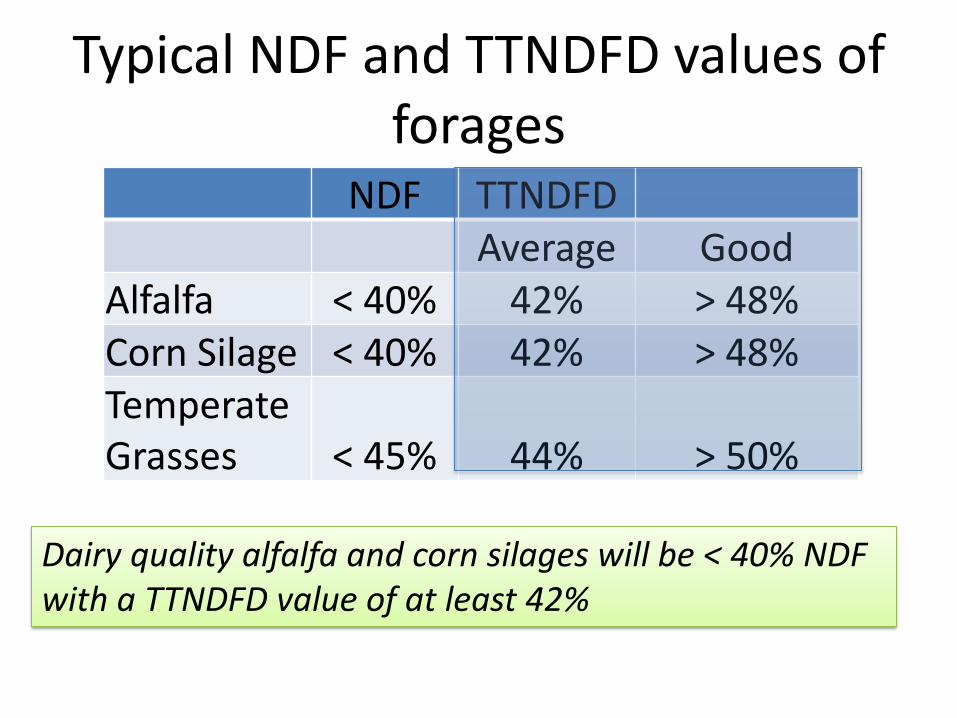
Typical NDF and TTNDFD values of forages
NDF TTNDFD Average Good
Alfalfa < 40% 42% > 48% Corn Silage < 40% 42% > 48% Temperate Grasses < 45% 44% > 50%
Dairy quality alfalfa and corn silages will be < 40% NDF with a TTNDFD value of at least 42%
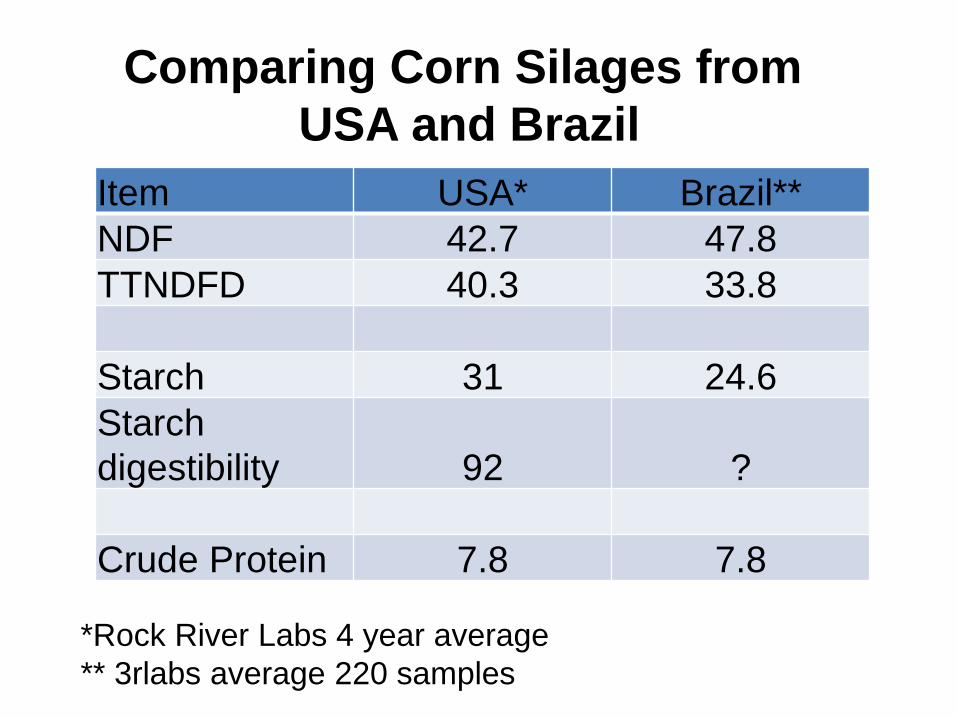
Item USA* Brazil**
NDF 42.7 47.8
TTNDFD 40.3 33.8
Starch 31 24.6
Starch
digestibility 92 ?
Crude Protein 7.8 7.8
Comparing Corn Silages from
USA and Brazil
*Rock River Labs 4 year average
** 3rlabs average 220 samples
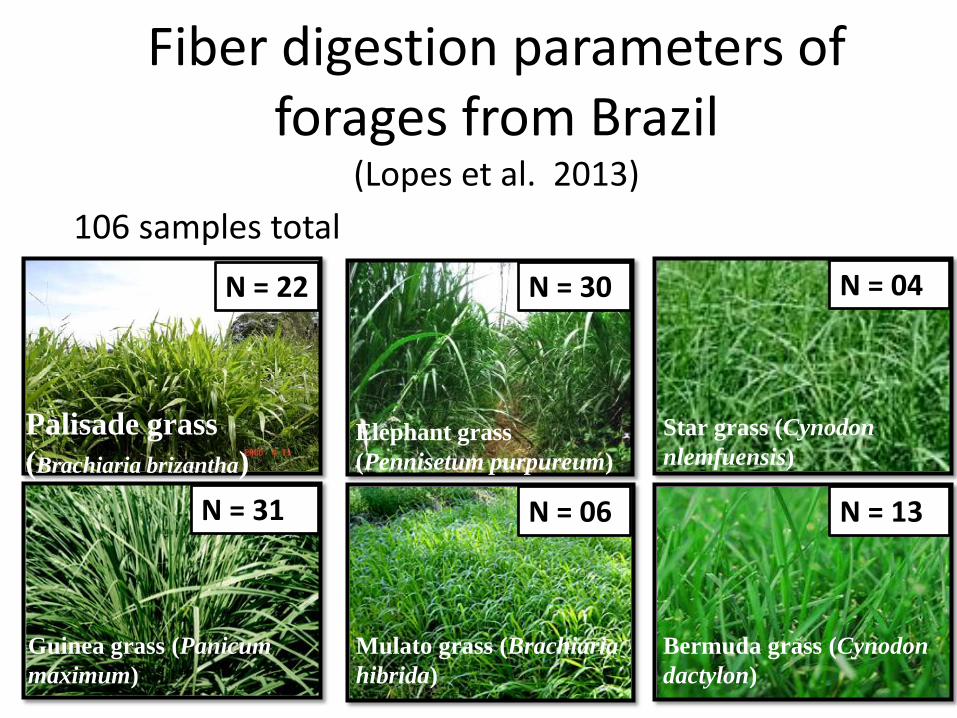
Fiber digestion parameters of forages from Brazil
(Lopes et al. 2013)
106 samples total
Palisade grass
(Brachiaria brizantha)
Mulato grass (Brachiaria
hibrida)
Bermuda grass (Cynodon
dactylon)
Star grass (Cynodon
nlemfuensis)
Guinea grass (Panicum
maximum)
Elephant grass
(Pennisetum purpureum)
N = 22 N = 30
N = 31
N = 04
N = 13 N = 06
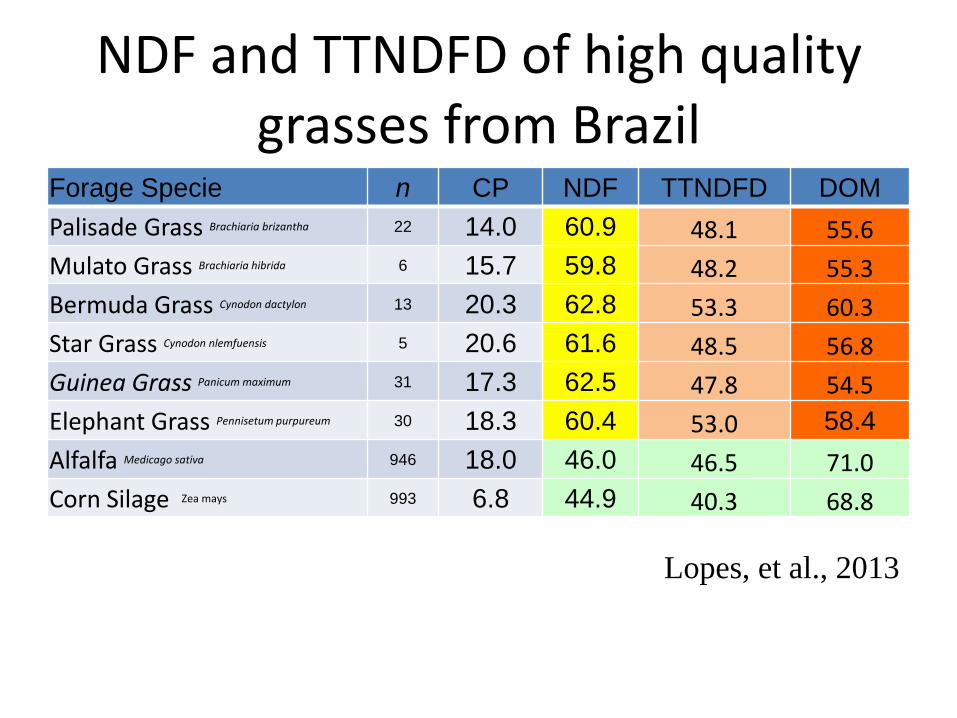
NDF and TTNDFD of high quality grasses from Brazil
Forage Specie n CP NDF TTNDFD DOM
Palisade Grass Brachiaria brizantha 22 14.0 60.9 48.1 55.6
Mulato Grass Brachiaria hibrida 6 15.7 59.8 48.2 55.3
Bermuda Grass Cynodon dactylon 13 20.3 62.8 53.3 60.3
Star Grass Cynodon nlemfuensis 5 20.6 61.6 48.5 56.8
Guinea Grass Panicum maximum 31 17.3 62.5 47.8 54.5
Elephant Grass Pennisetum purpureum 30 18.3 60.4 53.0 58.4
Alfalfa Medicago sativa 946 18.0 46.0 46.5 71.0
Corn Silage Zea mays 993 6.8 44.9 40.3 68.8
Lopes, et al., 2013
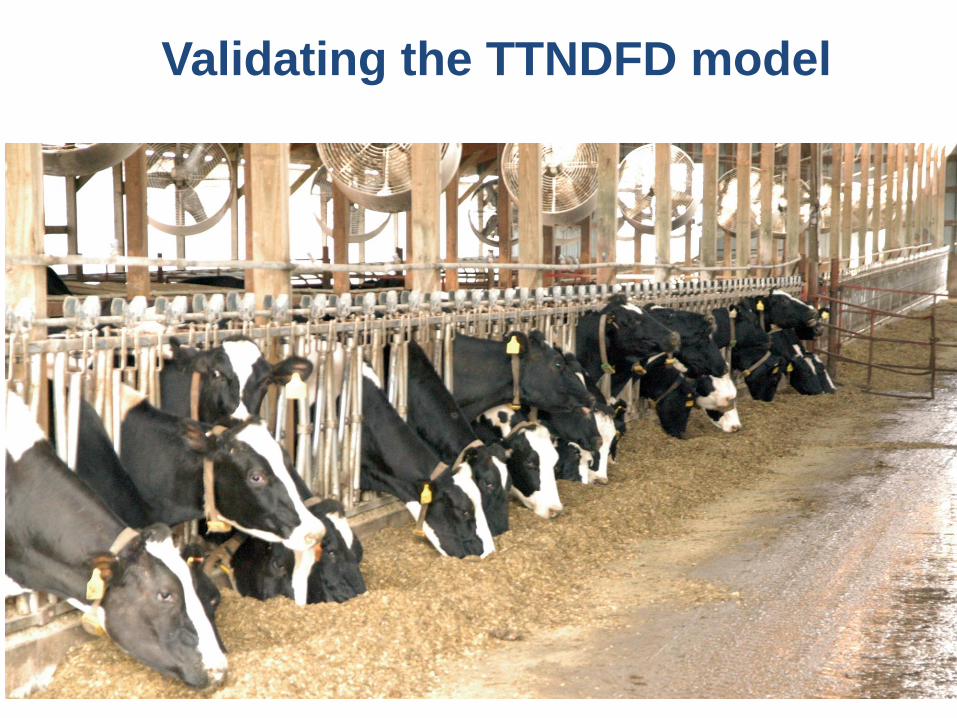
Validating the TTNDFD model
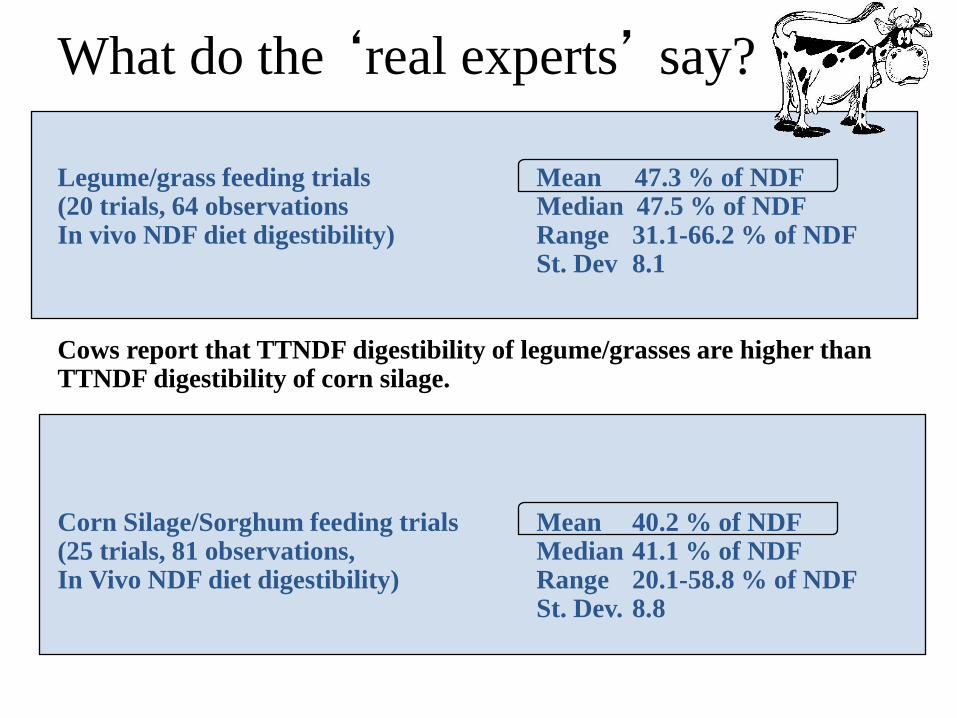
What do the ‘real experts’ say?
Legume/grass feeding trials Mean 47.3 % of NDF (20 trials, 64 observations Median 47.5 % of NDF In vivo NDF diet digestibility) Range 31.1-66.2 % of NDF St. Dev 8.1 Cows report that TTNDF digestibility of legume/grasses are higher than TTNDF digestibility of corn silage. Corn Silage/Sorghum feeding trials Mean 40.2 % of NDF (25 trials, 81 observations, Median 41.1 % of NDF In Vivo NDF diet digestibility) Range 20.1-58.8 % of NDF St. Dev. 8.8
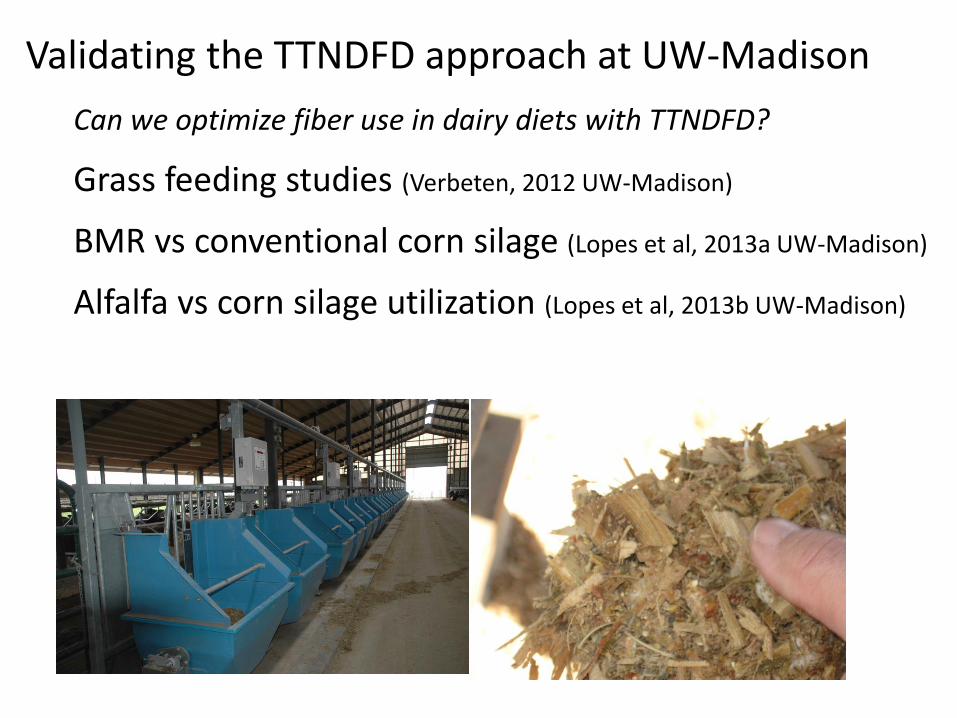
Validating the TTNDFD approach at UW-Madison
Can we optimize fiber use in dairy diets with TTNDFD?
Grass feeding studies (Verbeten, 2012 UW-Madison)
BMR vs conventional corn silage (Lopes et al, 2013a UW-Madison)
Alfalfa vs corn silage utilization (Lopes et al, 2013b UW-Madison)
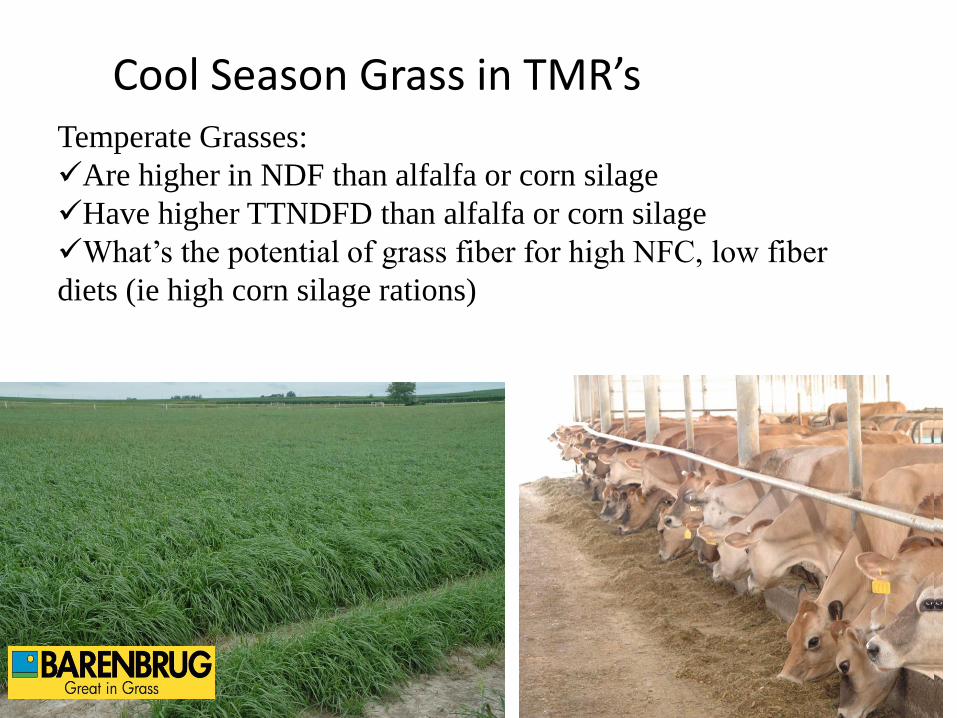
Temperate Grasses:
Are higher in NDF than alfalfa or corn silage
Have higher TTNDFD than alfalfa or corn silage
What’s the potential of grass fiber for high NFC, low fiber
diets (ie high corn silage rations)
Cool Season Grass in TMR’s
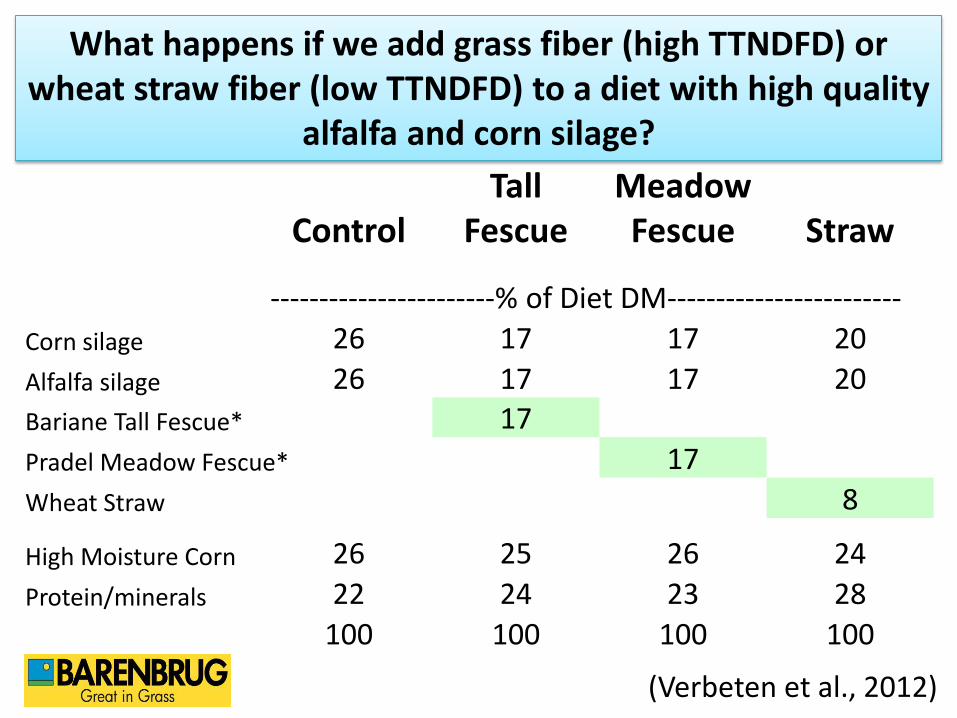
Control Tall
Fescue Meadow Fescue Straw
-----------------------% of Diet DM------------------------
Corn silage 26 17 17 20
Alfalfa silage 26 17 17 20
Bariane Tall Fescue* 17
Pradel Meadow Fescue* 17
Wheat Straw 8
High Moisture Corn 26 25 26 24
Protein/minerals 22 24 23 28
100 100 100 100
What happens if we add grass fiber (high TTNDFD) or wheat straw fiber (low TTNDFD) to a diet with high quality
alfalfa and corn silage?
(Verbeten et al., 2012)
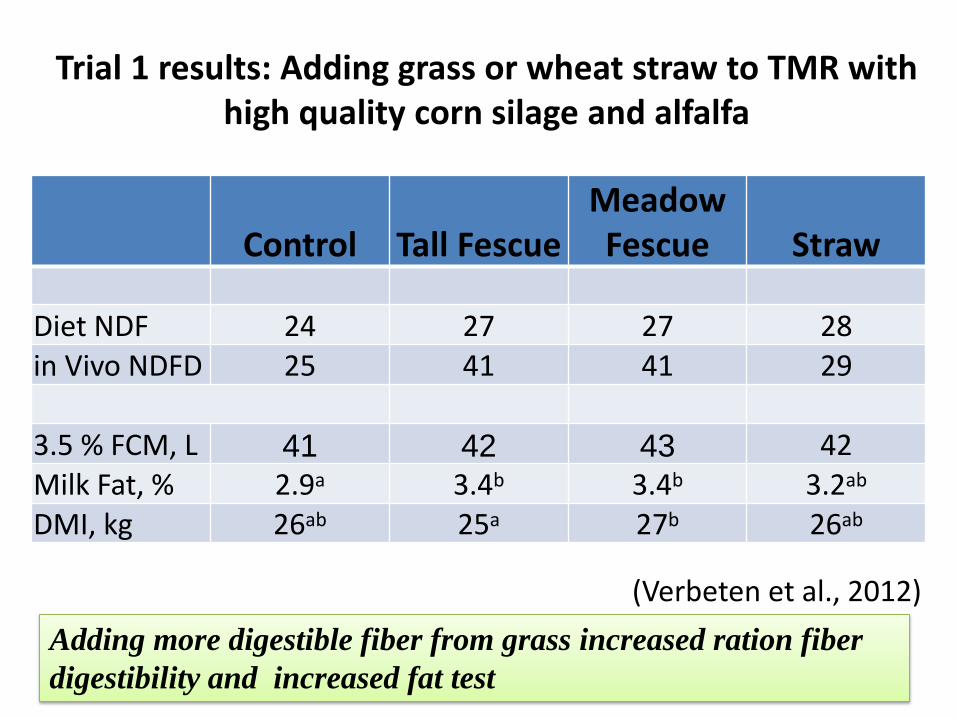
Control Tall Fescue Meadow Fescue Straw
Diet NDF 24 27 27 28 in Vivo NDFD 25 41 41 29
3.5 % FCM, L 41 42 43 42 Milk Fat, % 2.9a 3.4b 3.4b 3.2ab
DMI, kg 26ab 25a 27b 26ab
Trial 1 results: Adding grass or wheat straw to TMR with high quality corn silage and alfalfa
(Verbeten et al., 2012)
Adding more digestible fiber from grass increased ration fiber
digestibility and increased fat test
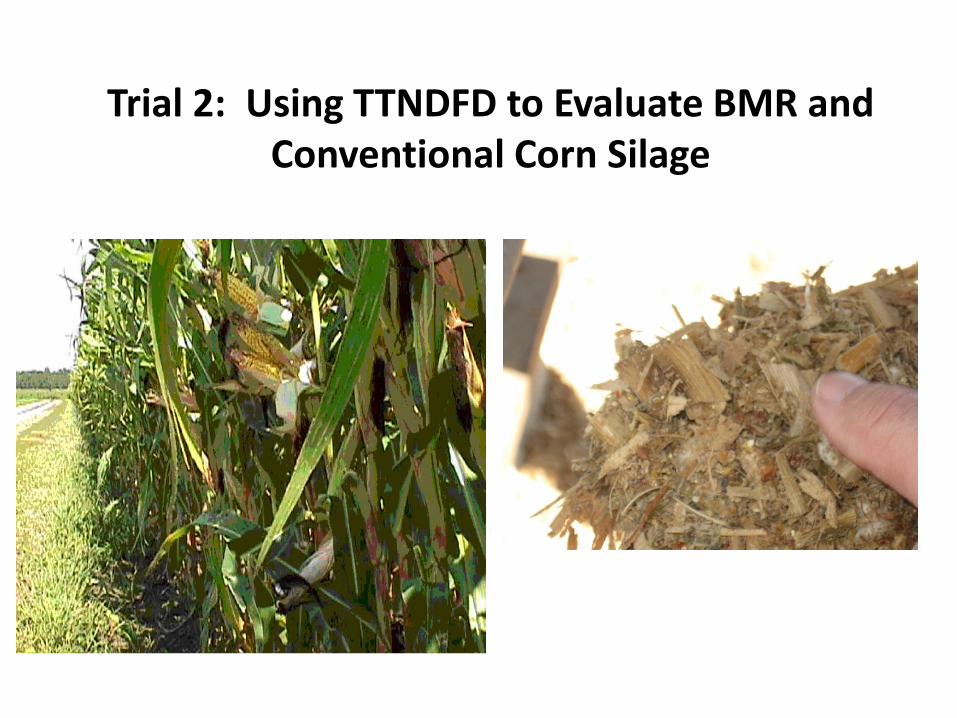
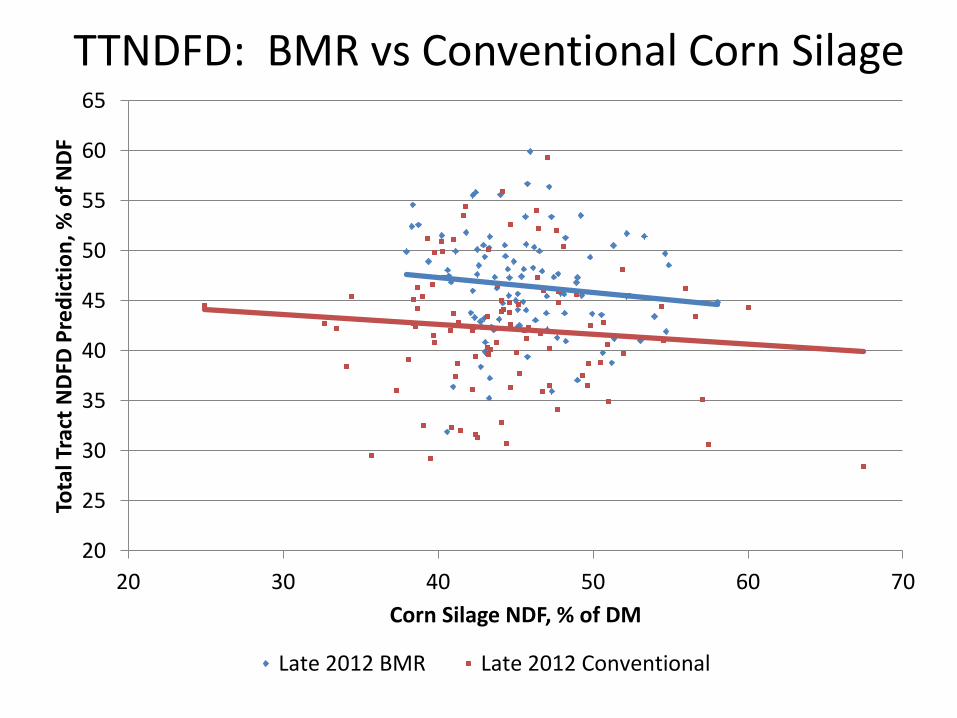
Trial 2: Using TTNDFD to Evaluate BMR and Conventional Corn Silage
20
25
30
35
40
45
50
55
60
65
20 30 40 50 60 70
Tota
l Tra
ct N
DFD
Pre
dic
tio
n, %
of
ND
F
Corn Silage NDF, % of DM
Late 2012 BMR Late 2012 Conventional
TTNDFD: BMR vs Conventional Corn Silage
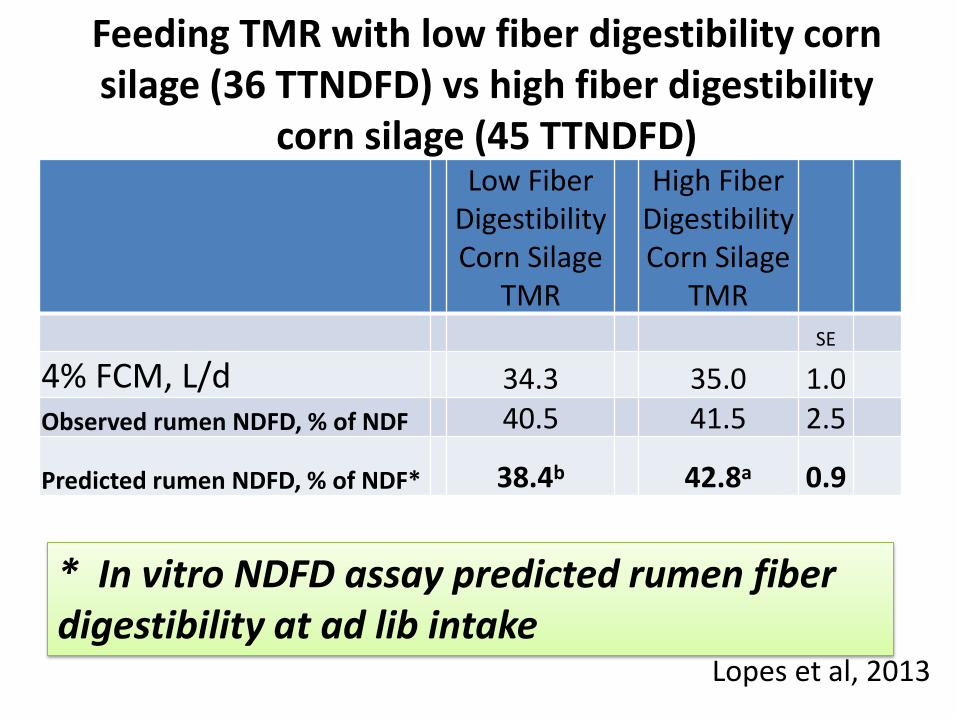
Feeding TMR with low fiber digestibility corn silage (36 TTNDFD) vs high fiber digestibility
corn silage (45 TTNDFD) Low Fiber
Digestibility Corn Silage
TMR
High Fiber Digestibility Corn Silage
TMR
SE
4% FCM, L/d 34.3 35.0 1.0
Observed rumen NDFD, % of NDF 40.5 41.5 2.5
Predicted rumen NDFD, % of NDF* 38.4b 42.8a 0.9
* In vitro NDFD assay predicted rumen fiber digestibility at ad lib intake
Lopes et al, 2013
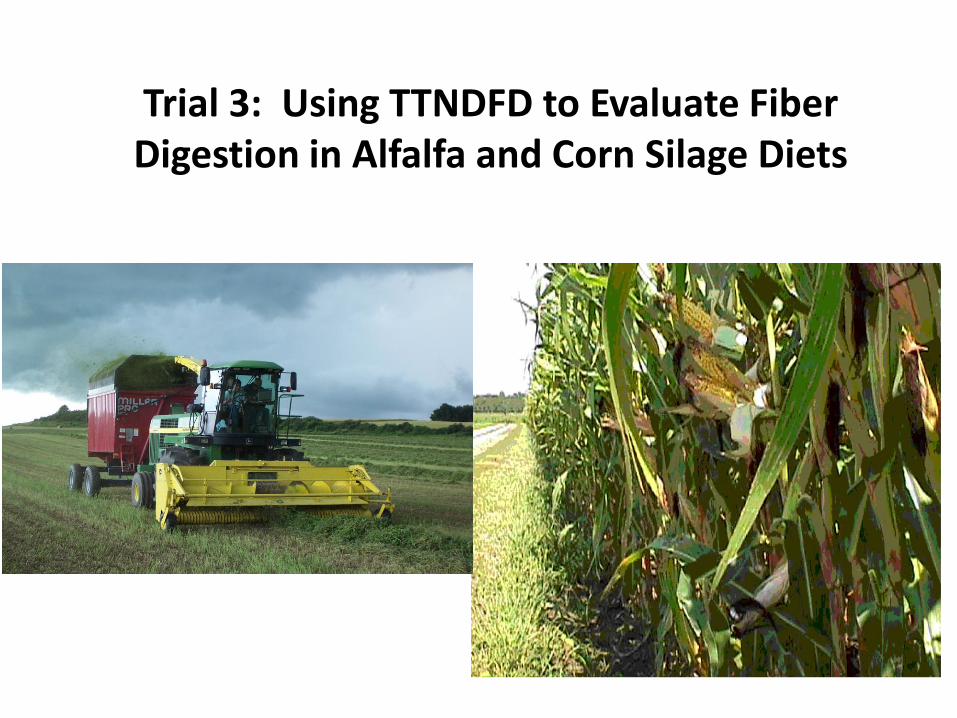
Trial 3: Using TTNDFD to Evaluate Fiber Digestion in Alfalfa and Corn Silage Diets
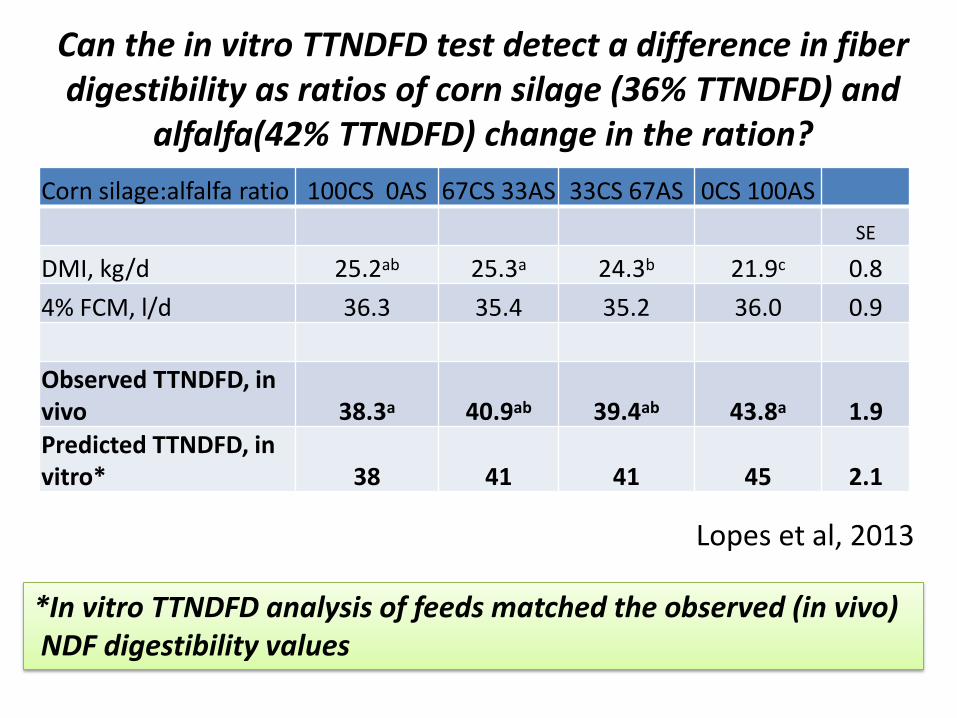
Can the in vitro TTNDFD test detect a difference in fiber digestibility as ratios of corn silage (36% TTNDFD) and
alfalfa(42% TTNDFD) change in the ration?
Corn silage:alfalfa ratio 100CS 0AS 67CS 33AS 33CS 67AS 0CS 100AS
SE
DMI, kg/d 25.2ab 25.3a 24.3b 21.9c 0.8
4% FCM, l/d 36.3 35.4 35.2 36.0 0.9
Observed TTNDFD, in vivo 38.3a 40.9ab 39.4ab 43.8a 1.9 Predicted TTNDFD, in vitro* 38 41 41 45 2.1
*In vitro TTNDFD analysis of feeds matched the observed (in vivo) NDF digestibility values
Lopes et al, 2013
How to use TTNDFD
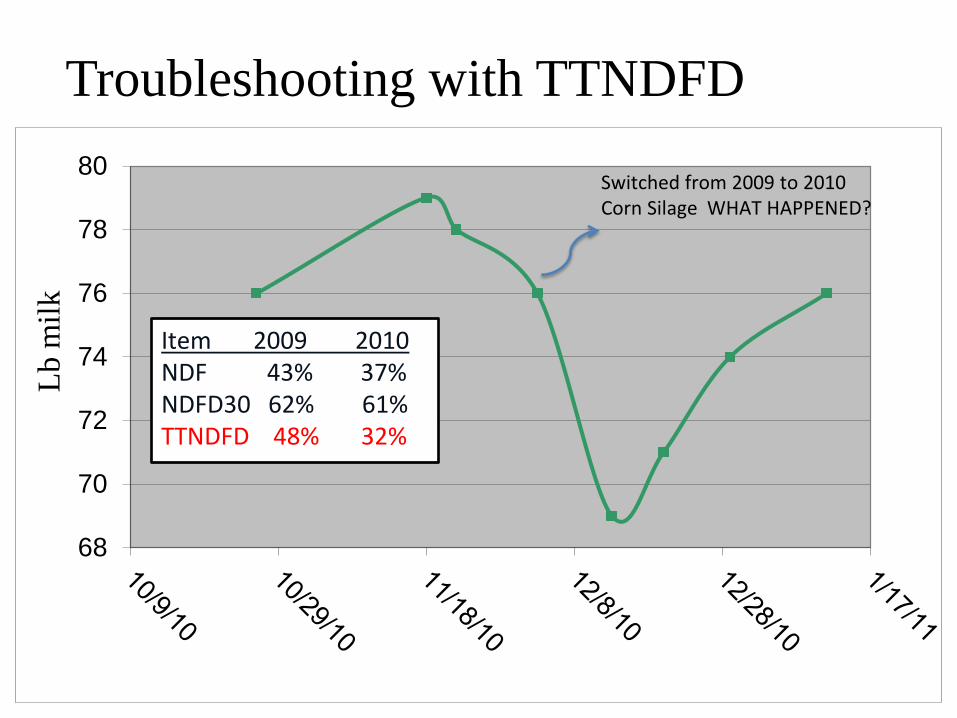
68
70
72
74
76
78
80Switched from 2009 to 2010 Corn Silage WHAT HAPPENED?
Item 2009 2010 NDF 43% 37% NDFD30 62% 61% TTNDFD 48% 32%
Lb m
ilk
Troubleshooting with TTNDFD
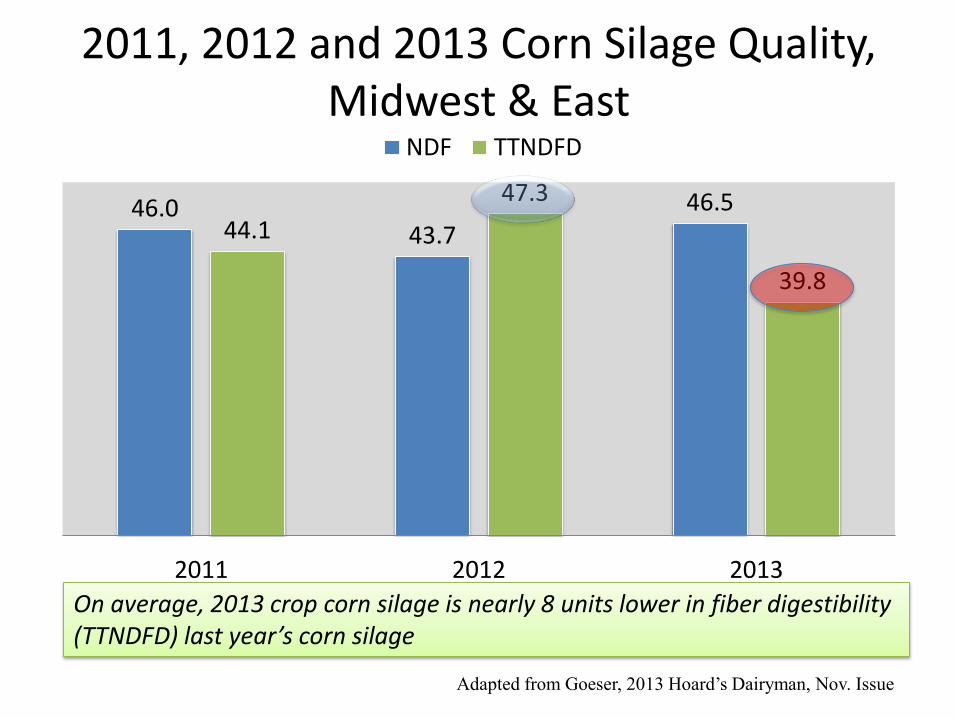
46.0 43.7
46.5 44.1
47.3
39.8
2011 2012 2013
NDF TTNDFD
2011, 2012 and 2013 Corn Silage Quality, Midwest & East
On average, 2013 crop corn silage is nearly 8 units lower in fiber digestibility (TTNDFD) last year’s corn silage
Adapted from Goeser, 2013 Hoard’s Dairyman, Nov. Issue.
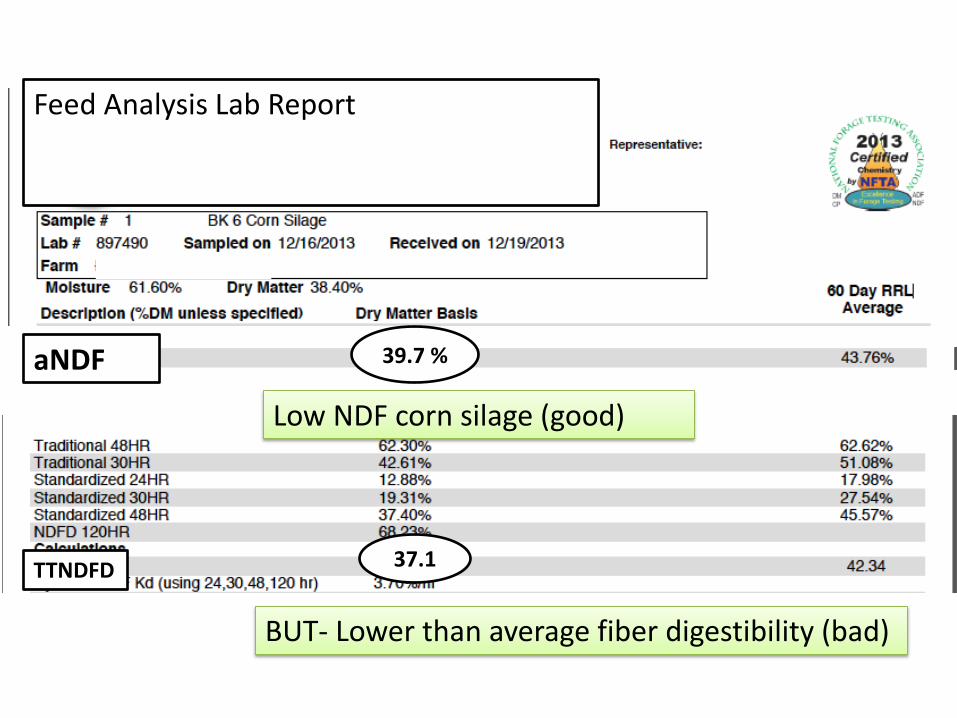
Low NDF corn silage (good)
BUT- Lower than average fiber digestibility (bad)
39.7 %
37.1 TTNDFD
aNDF
Feed Analysis Lab Report
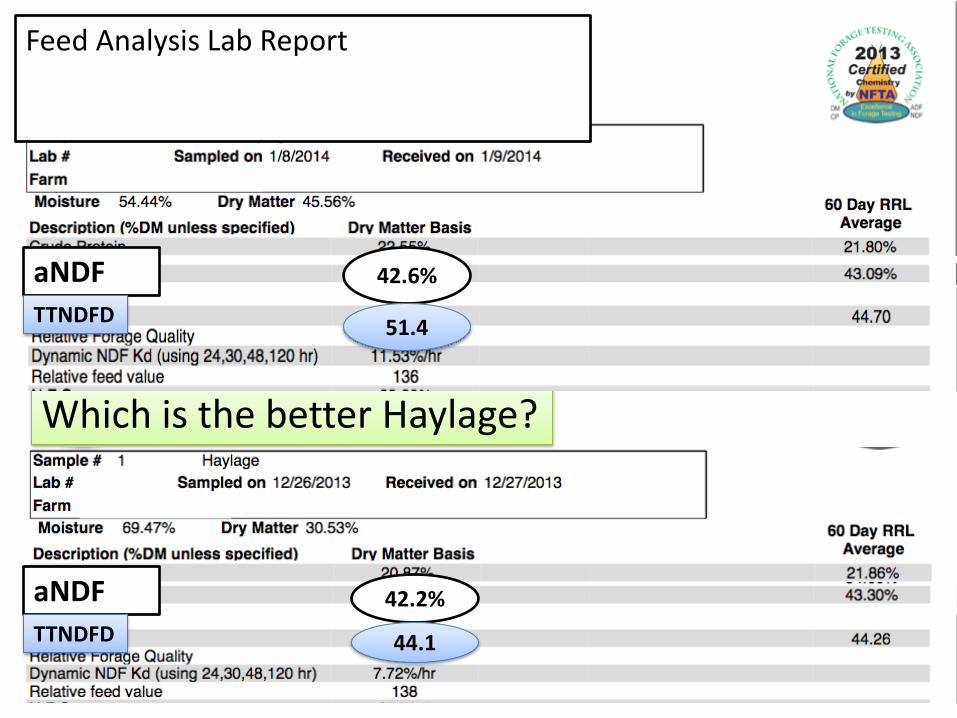
Which is the better Haylage?
Feed Analysis Lab Report
aNDF
aNDF
42.6%
42.2%
TTNDFD
TTNDFD
51.4
44.1
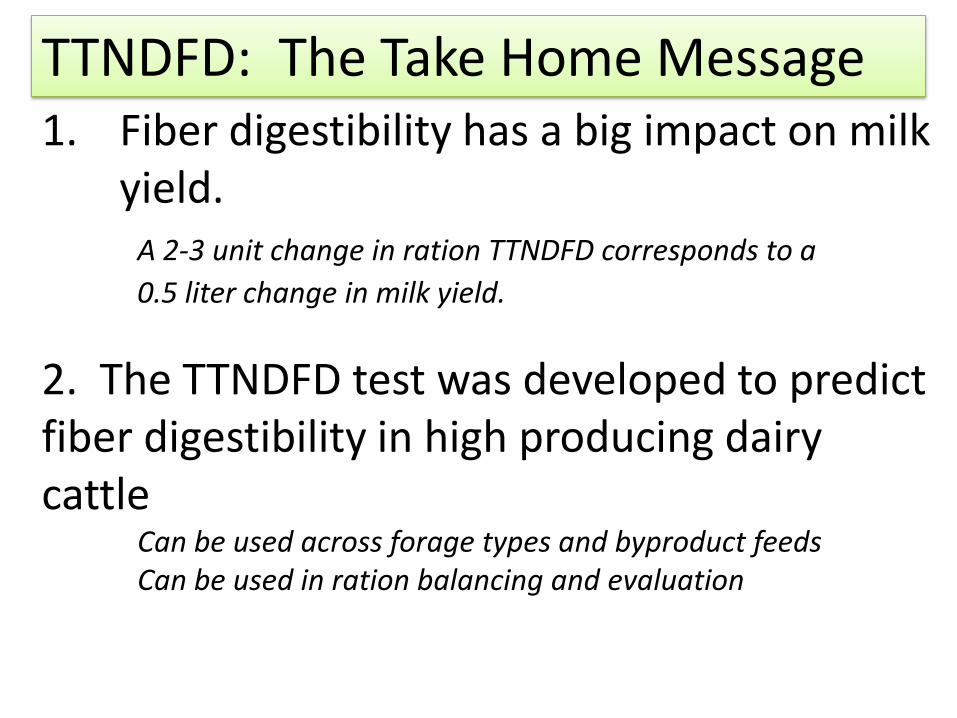
1. Fiber digestibility has a big impact on milk yield.
A 2-3 unit change in ration TTNDFD corresponds to a
0.5 liter change in milk yield.
2. The TTNDFD test was developed to predict fiber digestibility in high producing dairy cattle Can be used across forage types and byproduct feeds Can be used in ration balancing and evaluation
TTNDFD: The Take Home Message
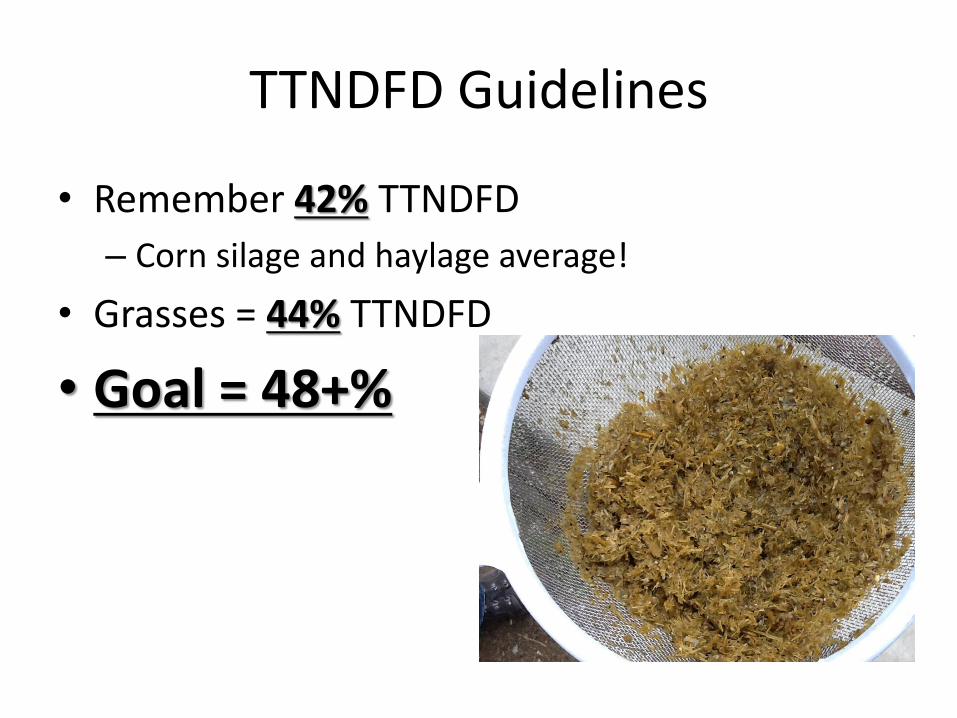
TTNDFD Guidelines
• Remember 42% TTNDFD
– Corn silage and haylage average!
• Grasses = 44% TTNDFD
• Goal = 48+%

Thank You!
Visit our Web site:
http://dysci.wisc.edu/
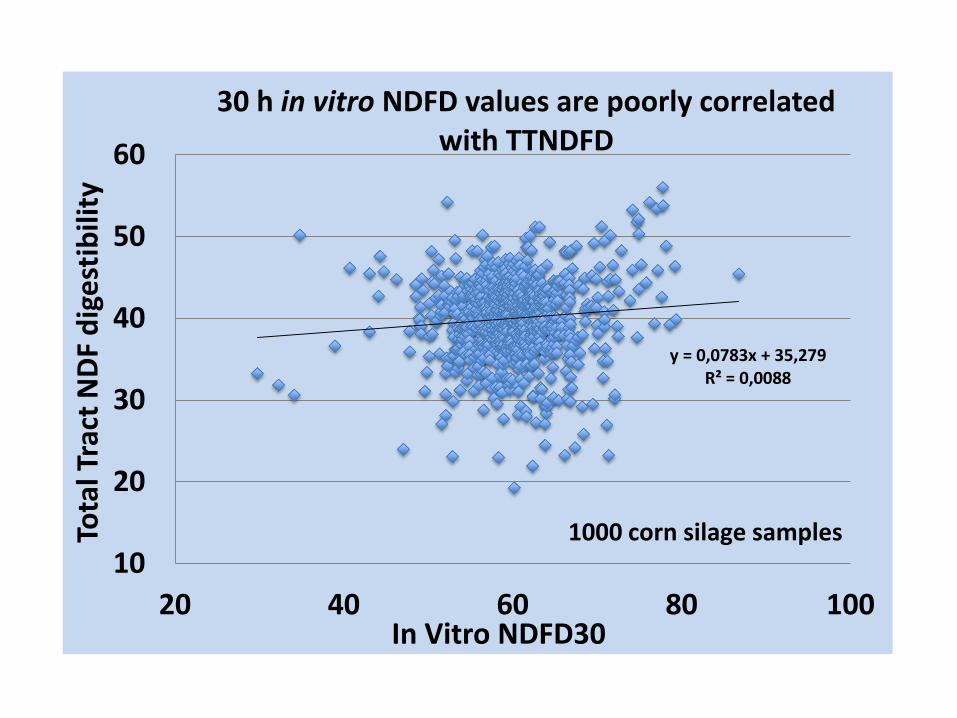
y = 0,0783x + 35,279 R² = 0,0088
10
20
30
40
50
60
20 40 60 80 100
Tota
l Tra
ct N
DF
dig
est
ibili
ty
In Vitro NDFD30
30 h in vitro NDFD values are poorly correlated with TTNDFD
1000 corn silage samples
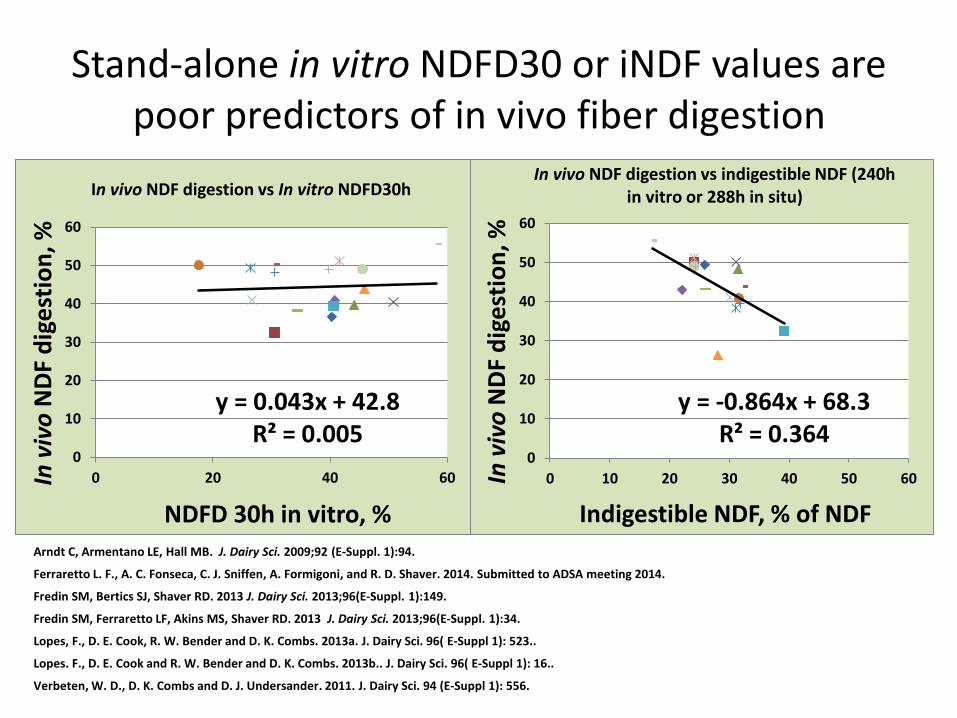
Stand-alone in vitro NDFD30 or iNDF values are poor predictors of in vivo fiber digestion
y = -0.864x + 68.3 R² = 0.364
0
10
20
30
40
50
60
0 10 20 30 40 50 60In v
ivo
ND
F d
ige
stio
n, %
Indigestible NDF, % of NDF
In vivo NDF digestion vs indigestible NDF (240h in vitro or 288h in situ)
y = 0.043x + 42.8 R² = 0.005
0
10
20
30
40
50
60
0 20 40 60In v
ivo
ND
F d
ige
stio
n, %
NDFD 30h in vitro, %
In vivo NDF digestion vs In vitro NDFD30h
Arndt C, Armentano LE, Hall MB. J. Dairy Sci. 2009;92 (E-Suppl. 1):94. Ferraretto L. F., A. C. Fonseca, C. J. Sniffen, A. Formigoni, and R. D. Shaver. 2014. Submitted to ADSA meeting 2014. Fredin SM, Bertics SJ, Shaver RD. 2013 J. Dairy Sci. 2013;96(E-Suppl. 1):149. Fredin SM, Ferraretto LF, Akins MS, Shaver RD. 2013 J. Dairy Sci. 2013;96(E-Suppl. 1):34. Lopes, F., D. E. Cook, R. W. Bender and D. K. Combs. 2013a. J. Dairy Sci. 96( E-Suppl 1): 523.. Lopes. F., D. E. Cook and R. W. Bender and D. K. Combs. 2013b.. J. Dairy Sci. 96( E-Suppl 1): 16.. Verbeten, W. D., D. K. Combs and D. J. Undersander. 2011. J. Dairy Sci. 94 (E-Suppl 1): 556.
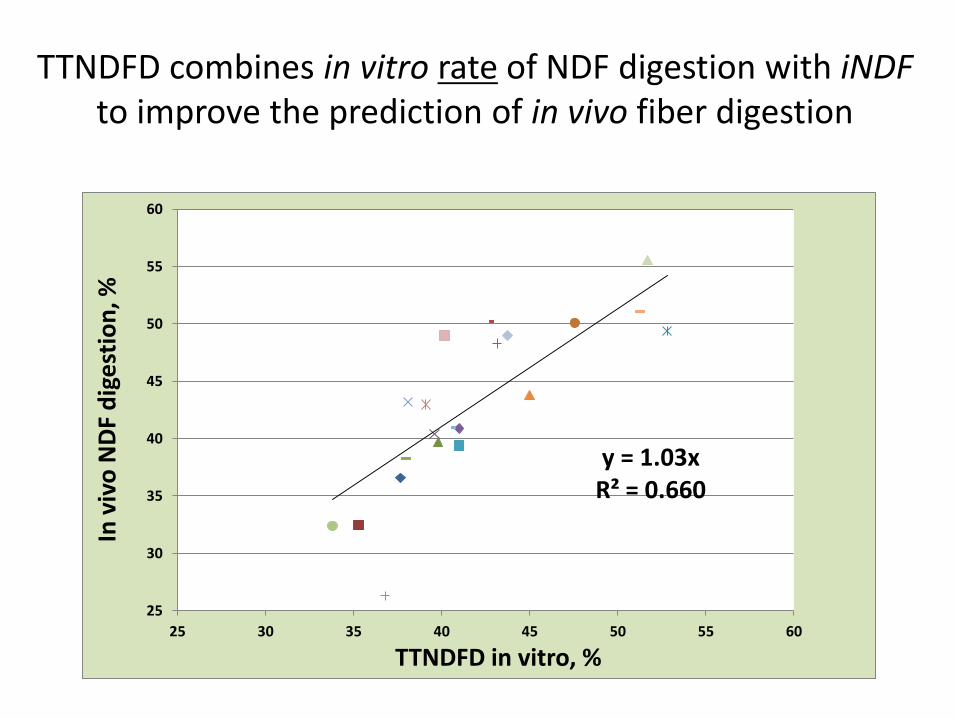
TTNDFD combines in vitro rate of NDF digestion with iNDF to improve the prediction of in vivo fiber digestion
y = 1.03x R² = 0.660
25
30
35
40
45
50
55
60
25 30 35 40 45 50 55 60
In v
ivo
ND
F d
ige
stio
n, %
TTNDFD in vitro, %
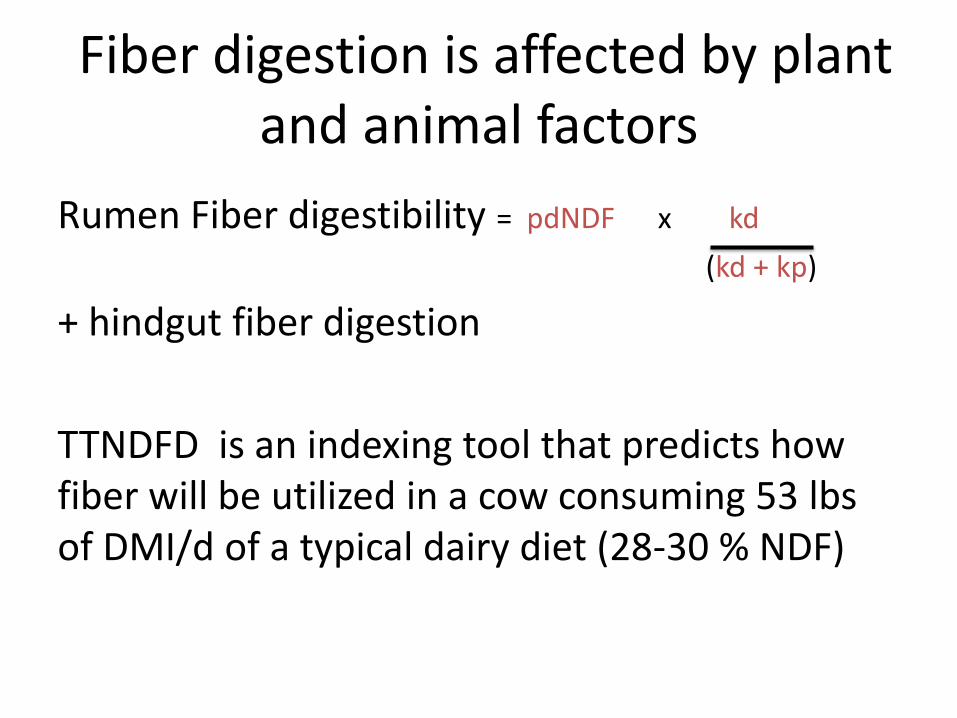
Fiber digestion is affected by plant and animal factors
Rumen Fiber digestibility = pdNDF x kd
(kd + kp)
+ hindgut fiber digestion
TTNDFD is an indexing tool that predicts how fiber will be utilized in a cow consuming 53 lbs of DMI/d of a typical dairy diet (28-30 % NDF)
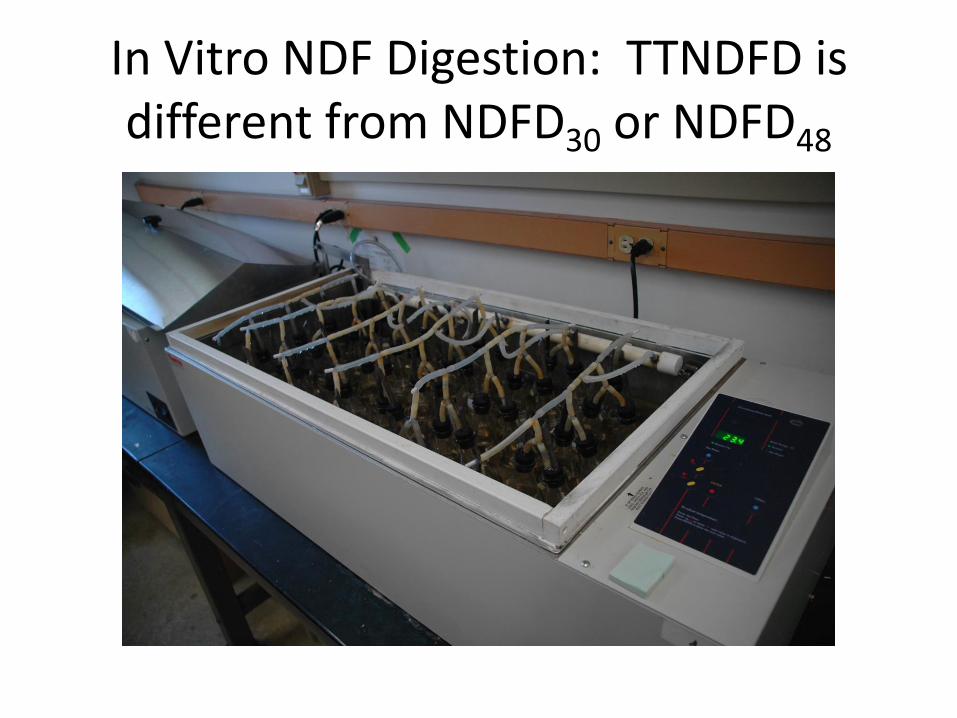
In Vitro NDF Digestion: TTNDFD is different from NDFD30 or NDFD48
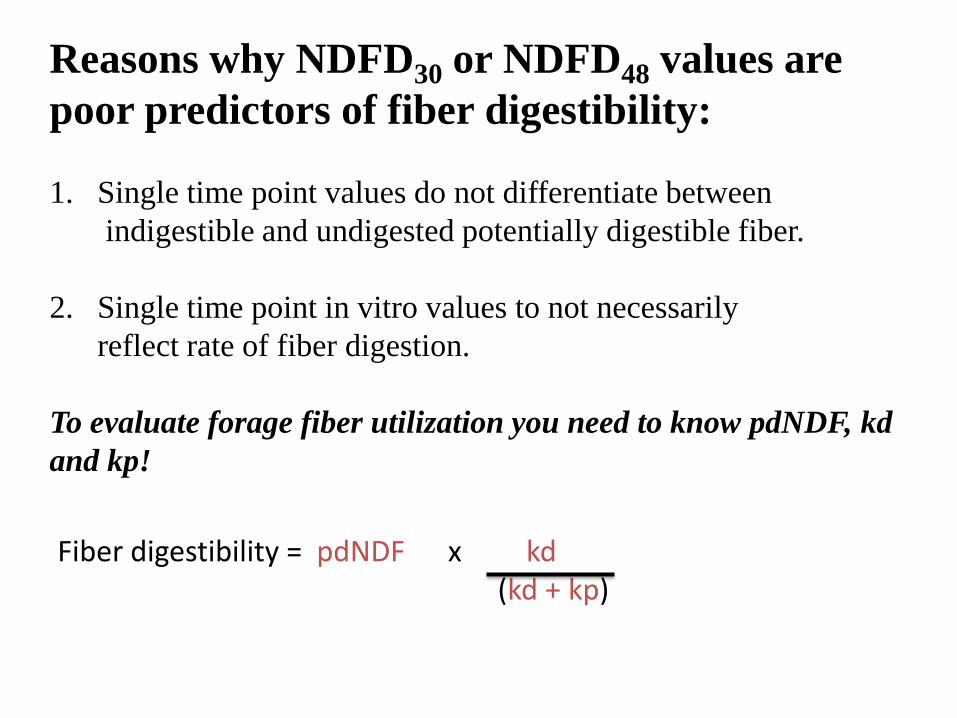
Reasons why NDFD30 or NDFD48 values are
poor predictors of fiber digestibility:
1. Single time point values do not differentiate between
indigestible and undigested potentially digestible fiber.
2. Single time point in vitro values to not necessarily
reflect rate of fiber digestion.
To evaluate forage fiber utilization you need to know pdNDF, kd
and kp!
Fiber digestibility = pdNDF x kd (kd + kp)
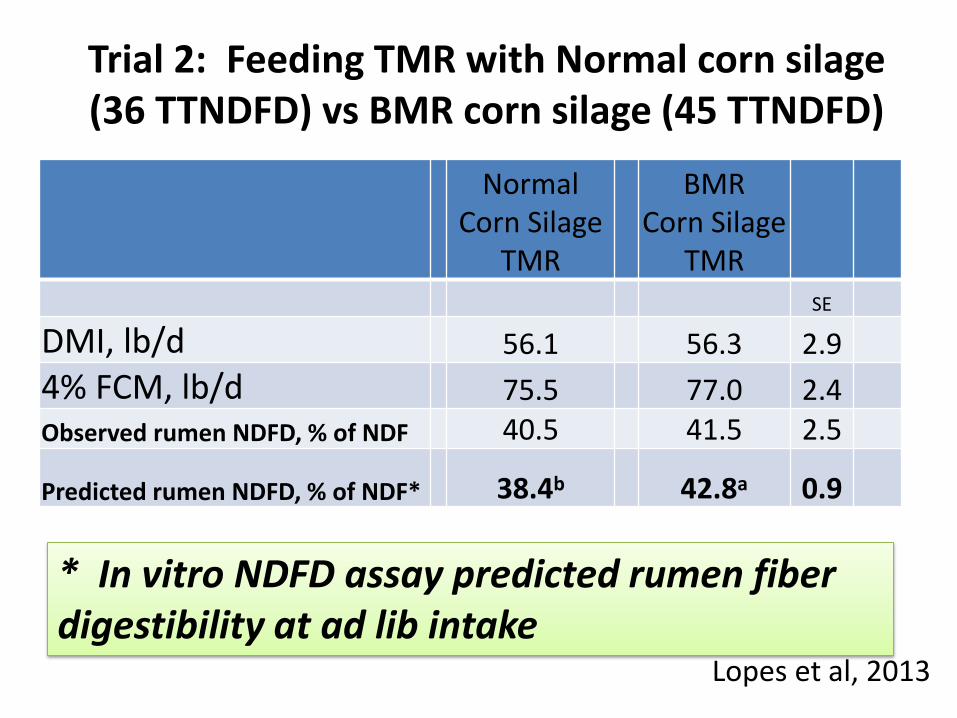
Trial 2: Feeding TMR with Normal corn silage (36 TTNDFD) vs BMR corn silage (45 TTNDFD)
Normal Corn Silage
TMR
BMR Corn Silage
TMR
SE
DMI, lb/d 56.1 56.3 2.9
4% FCM, lb/d 75.5 77.0 2.4
Observed rumen NDFD, % of NDF 40.5 41.5 2.5
Predicted rumen NDFD, % of NDF* 38.4b 42.8a 0.9
* In vitro NDFD assay predicted rumen fiber digestibility at ad lib intake
Lopes et al, 2013
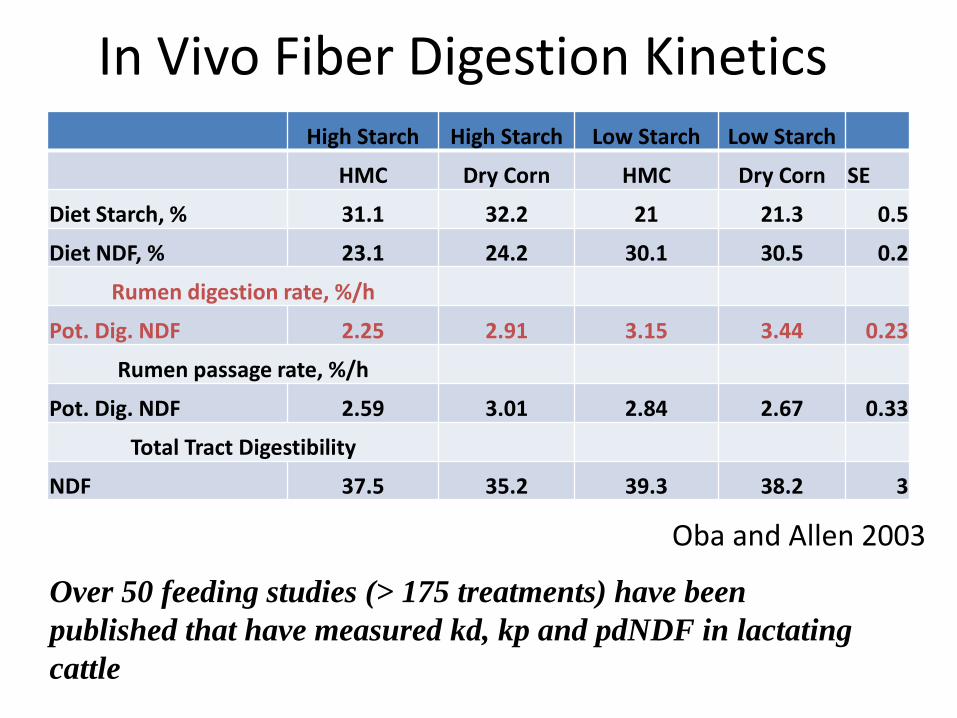
In Vivo Fiber Digestion Kinetics
High Starch High Starch Low Starch Low Starch
HMC Dry Corn HMC Dry Corn SE
Diet Starch, % 31.1 32.2 21 21.3 0.5
Diet NDF, % 23.1 24.2 30.1 30.5 0.2
Rumen digestion rate, %/h
Pot. Dig. NDF 2.25 2.91 3.15 3.44 0.23
Rumen passage rate, %/h
Pot. Dig. NDF 2.59 3.01 2.84 2.67 0.33
Total Tract Digestibility
NDF 37.5 35.2 39.3 38.2 3
Over 50 feeding studies (> 175 treatments) have been
published that have measured kd, kp and pdNDF in lactating
cattle
Oba and Allen 2003
Fiber digestibility = pdNDF x kd + hindgut digestion (kd + kp)
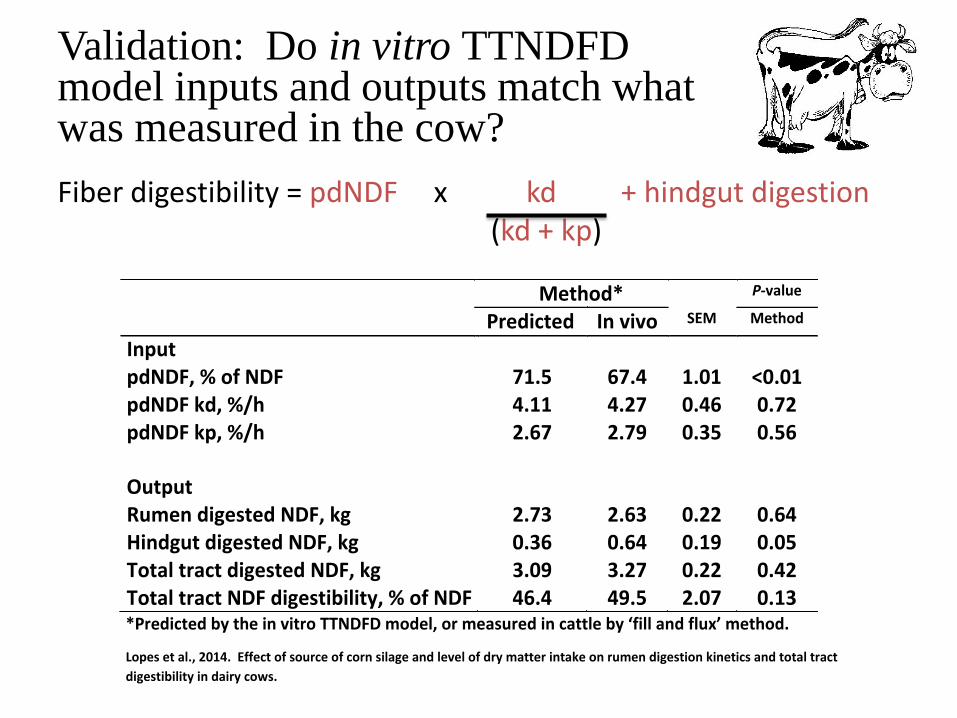
Validation: Do in vitro TTNDFD model inputs and outputs match what was measured in the cow?
Method* P-value
Predicted Invivo SEM Method
Input
pdNDF,%ofNDF 71.5 67.4 1.01 <0.01pdNDFkd,%/h 4.11 4.27 0.46 0.72pdNDFkp,%/h 2.67 2.79 0.35 0.56 Output RumendigestedNDF,kg 2.73 2.63 0.22 0.64HindgutdigestedNDF,kg 0.36 0.64 0.19 0.05TotaltractdigestedNDF,kg 3.09 3.27 0.22 0.42TotaltractNDFdigestibility,%ofNDF 46.4 49.5 2.07 0.13*PredictedbytheinvitroTTNDFDmodel,ormeasuredincattleby‘fillandflux’method.
Lopesetal.,2014.Effectofsourceofcornsilageandlevelofdrymatterintakeonrumendigestionkineticsandtotaltract
digestibilityindairycows.