Embed Size (px)
Citation preview
1
THE COCA-COLA COMPANY
CAGNY 2019
JAMES QUINCEYCEO
JOHN MURPHYDEPUTY CFO

2
RECONCILIATION TO U.S. GAAP FINANCIAL INFORMATIONThe following presentation may include certain "non-GAAP financial measures" as defined in Regulation G under the Securities Exchange Act of 1934. A schedule which reconciles our results as
reported under Generally Accepted Accounting Principles and the non-GAAP financial measures included in the following presentation can be found here or on the company's website at www.coca-
colacompany.com (in the “Investors” section).
The 2019 outlook information provided in this presentation includes forward-looking non-GAAP financial measures, which management uses in measuring performance. The company is not able to
reconcile full year 2019 projected organic revenues (non-GAAP) to full year 2019 projected reported net revenues, full year 2019 projected comparable currency neutral operating income (non-
GAAP) to full year 2019 projected reported operating income, or full year 2019 projected comparable EPS from continuing operations (non-GAAP) to full year 2019 projected reported EPS from
continuing operations without unreasonable efforts because it is not possible to predict with a reasonable degree of certainty the actual impact of changes in foreign currency exchange rates; the
exact timing and amount of acquisitions, divestitures and/or structural changes; and the exact timing and amount of comparability items throughout 2019. The unavailable information could have a
significant impact on full year 2019 GAAP financial results.
This presentation may contain statements, estimates or projections that constitute “forward-looking statements” as defined under U.S. federal securities laws. Generally, the words “believe,” “expect,”
“intend,” “estimate,” “anticipate,” “project,” “will” and similar expressions identify forward-looking statements, which generally are not historical in nature. Forward-looking statements are subject to certain
risks and uncertainties that could cause actual results to differ materially from The Coca-Cola Company’s historical experience and our present expectations or projections. These risks include, but are
not limited to, obesity and other health-related concerns; failure to address evolving consumer product and shopping preferences; increased competition; water scarcity and poor quality; increased
demand for food products and decreased agricultural productivity; product safety and quality concerns; public debate and concern about perceived negative health consequences of certain ingredients,
such as non-nutritive sweeteners and biotechnology-derived substances, and of other substances present in our beverage products or packaging materials; an inability to be successful in our innovation
activities; an inability to protect our information systems against service interruption, misappropriation of data or breaches of security; failure to comply with personal data protection laws; an inability to be
successful in our efforts to digitize the Coca-Cola system; changes in the retail landscape or the loss of key retail or foodservice customers; an inability to expand operations in emerging and developing
markets; fluctuations in foreign currency exchange rates; interest rate increases; an inability to maintain good relationships with our bottling partners; a deterioration in our bottling partners' financial
condition; increases in income tax rates, changes in income tax laws or unfavorable resolution of tax matters; increased or new indirect taxes in the United States and throughout the world; failure to
realize the economic benefits from or an inability to successfully manage the possible negative consequences of our productivity and reinvestment program; an inability to attract or retain a highly skilled
and diverse workforce; increase in the cost, disruption of supply or shortage of energy or fuel; increase in the cost, disruption of supply or shortage of ingredients, other raw materials, packaging
materials, aluminum cans and other containers; changes in laws and regulations relating to beverage containers and packaging; significant additional labeling or warning requirements or limitations on
the marketing or sale of our products; unfavorable general economic conditions in the United States; unfavorable economic and political conditions in international markets; litigation or legal proceedings;
increased legal and reputational risk associated with conducting business in markets with high-risk legal compliance environments; failure by third-party service providers and business partners to
satisfactorily fulfill their commitments and responsibilities; failure to adequately protect, or disputes relating to, trademarks, formulae and other intellectual property rights; adverse weather conditions;
climate change; damage to our brand image, corporate reputation and social license from negative publicity, whether or not warranted, concerning product safety or quality, human and workplace rights,
obesity or other issues; changes in, or failure to comply with, the laws and regulations applicable to our products or our business operations; changes in accounting standards; an inability to achieve our
overall long-term growth objectives; deterioration of global credit market conditions; default by or failure of one or more of our counterparty financial institutions; an inability to renew collective bargaining
agreements on satisfactory terms, or strikes, work stoppages or labor unrest experienced by us or our bottling partners; future impairment charges; future multi-employer pension plan withdrawal
liabilities; an inability to successfully integrate and manage our company-owned or -controlled bottling operations or other acquired businesses or brands; an inability to successfully manage our
refranchising activities; failure to realize a significant portion of the anticipated benefits of our strategic relationship with Monster; global or regional catastrophic events; and other risks discussed in our
company’s filings with the Securities and Exchange Commission (SEC), including our Annual Report on Form 10-K for the year ended December 31, 2018. You should not place undue reliance on
forward-looking statements, which speak only as of the date they are made. The Coca-Cola Company undertakes no obligation to publicly update or revise any forward-looking statements.
FORWARD-LOOKING STATEMENTS

33
KEY THEMES FOR TODAY
VISION & OPPORTUNITY
WINNING TODAY WHILE INVENTING TOMORROW
CREATING SHAREOWNER VALUE
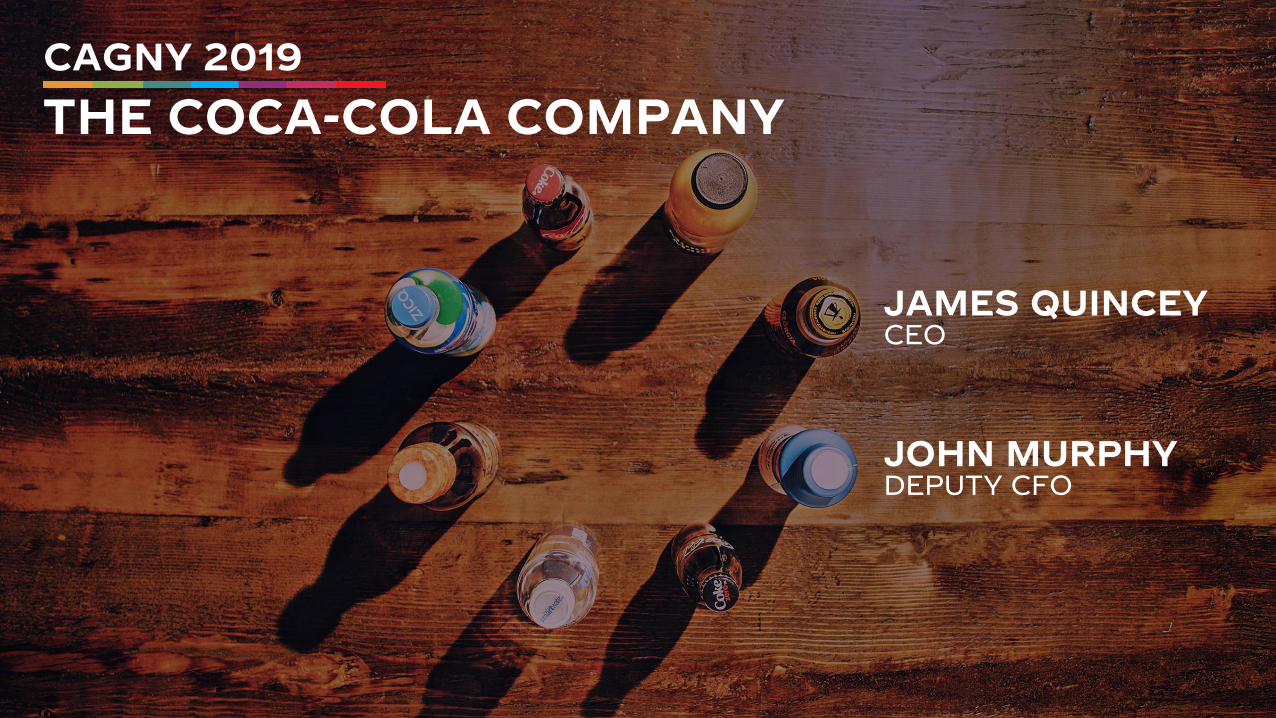
Pervasive Distribution
Global Footprint With Local Touch
Diversifying Revenue
Revenue Composition(adjusted for Costa Acquisition)
200+ Countries and Territories
~225 Bottling Partners
>20 Channels
28M Customer Outlets
16M Cold Drink Assets
Building from a Strong Foundation
Strong Position in All Category Clusters
#2#1 #1
#1 in 32 of Top 40 Marketsin Over 75 Category / Country Combos
#1
Sparkling Soft Drinks
Juice, Dairy & Plant
Hydration Energy
#1
Tea & Coffee
Source: GlobalData and internal estimatesMONSTER is a trademark and product of Monster Beverage Corporation in which TCCC has a minority investment. fairlife is a trademark and product of fairlife, LLC, our joint venture with Select Milk Producers, Inc.
WE ARE BUILDING A TOTAL BEVERAGE COMPANY
VISION & OPPORTUNITY
4
Strong Global Position
#1 Value Share Position in Global NARTD
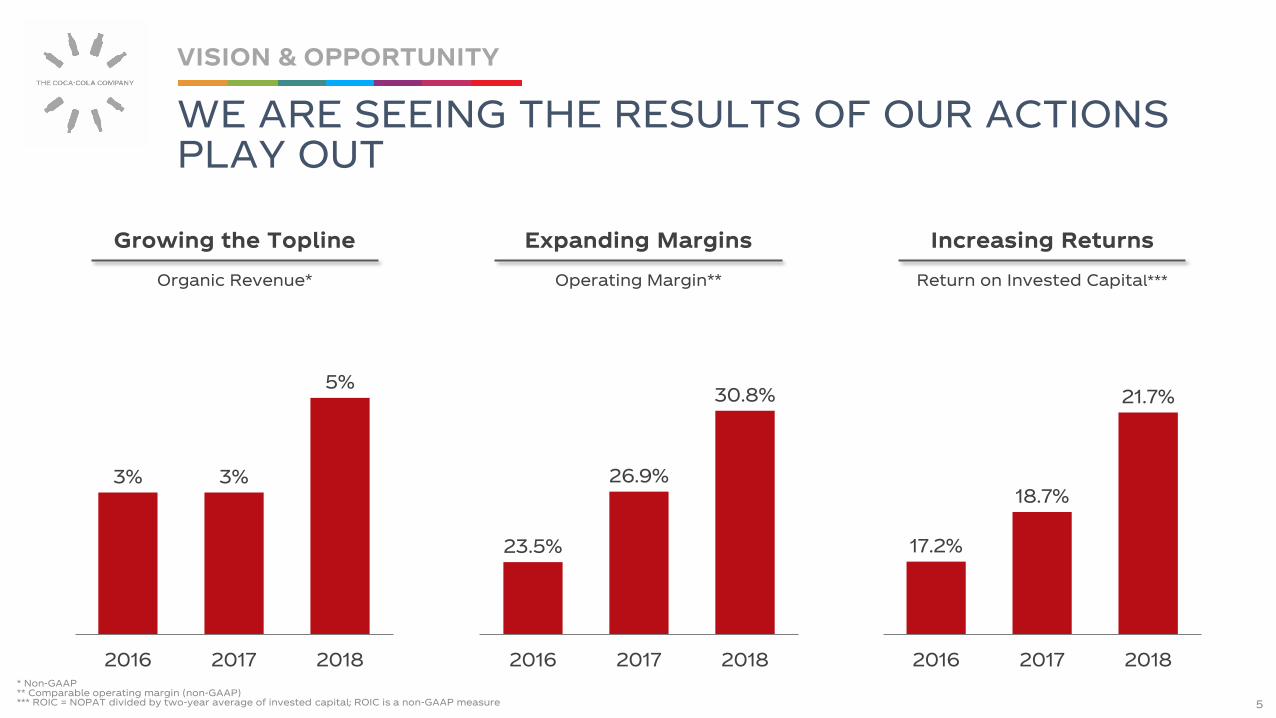
WE ARE SEEING THE RESULTS OF OUR ACTIONS PLAY OUT
VISION & OPPORTUNITY
5
Increasing ReturnsGrowing the Topline Expanding Margins
17.2%
18.7%
21.7%
2016 2017 2018
23.5%
26.9%
30.8%
2016 2017 2018
Organic Revenue* Operating Margin** Return on Invested Capital***
3% 3%
5%
2016 2017 2018* Non-GAAP** Comparable operating margin (non-GAAP)*** ROIC = NOPAT divided by two-year average of invested capital; ROIC is a non-GAAP measure
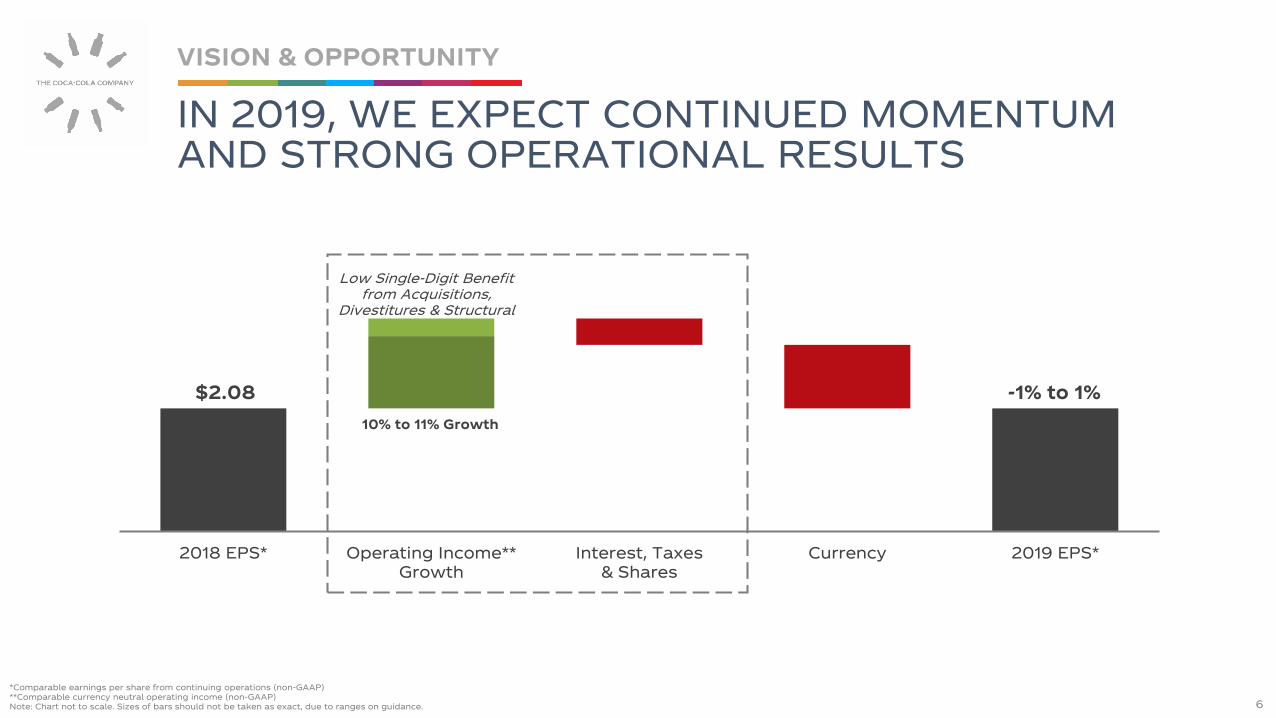
2018 EPS* Operating Income**Growth
Interest, Taxes& Shares
Currency 2019 EPS*
10% to 11% Growth
$2.08 -1% to 1%
Low Single-Digit Benefitfrom Acquisitions,
Divestitures & Structural
*Comparable earnings per share from continuing operations (non-GAAP)**Comparable currency neutral operating income (non-GAAP)Note: Chart not to scale. Sizes of bars should not be taken as exact, due to ranges on guidance.
IN 2019, WE EXPECT CONTINUED MOMENTUM AND STRONG OPERATIONAL RESULTS
VISION & OPPORTUNITY
6

Sparkling Soft Drinks
Juice, Dairy & Plant
Hydration
EnergyNRTD Cold
RTD Tea/Coffee
Hot Bev.
$1.5Trillion
Industry Retail Value Growth
2014-2017 CAGR
Hot & Cold Beverages Industry Retail Value
% Sales by Channel
Source: GlobalData for channel data. GlobalData and Euromonitor for historical industry retail value growth. Internal estimates for retail value dollars.Note: Industry growth for nonalcoholic ready-to-drink excludes white milk and bulk water.
0 50 100
HouseholdProducts
PackagedFood
NARTD
Modern Trade (e.g. Large Retailer)
Traditional (e.g. "Mom & Pop" Shops)
Eating & Drinking Out
Outpaced Relative Growth Large Dollar OpportunityHighly Diversified
with Strong Pricing Power
3.3%
3.9%
4.2%
HouseholdProducts
PackagedFood
NARTD
COMPETING IN A GREAT INDUSTRY
VISION & OPPORTUNITY
7
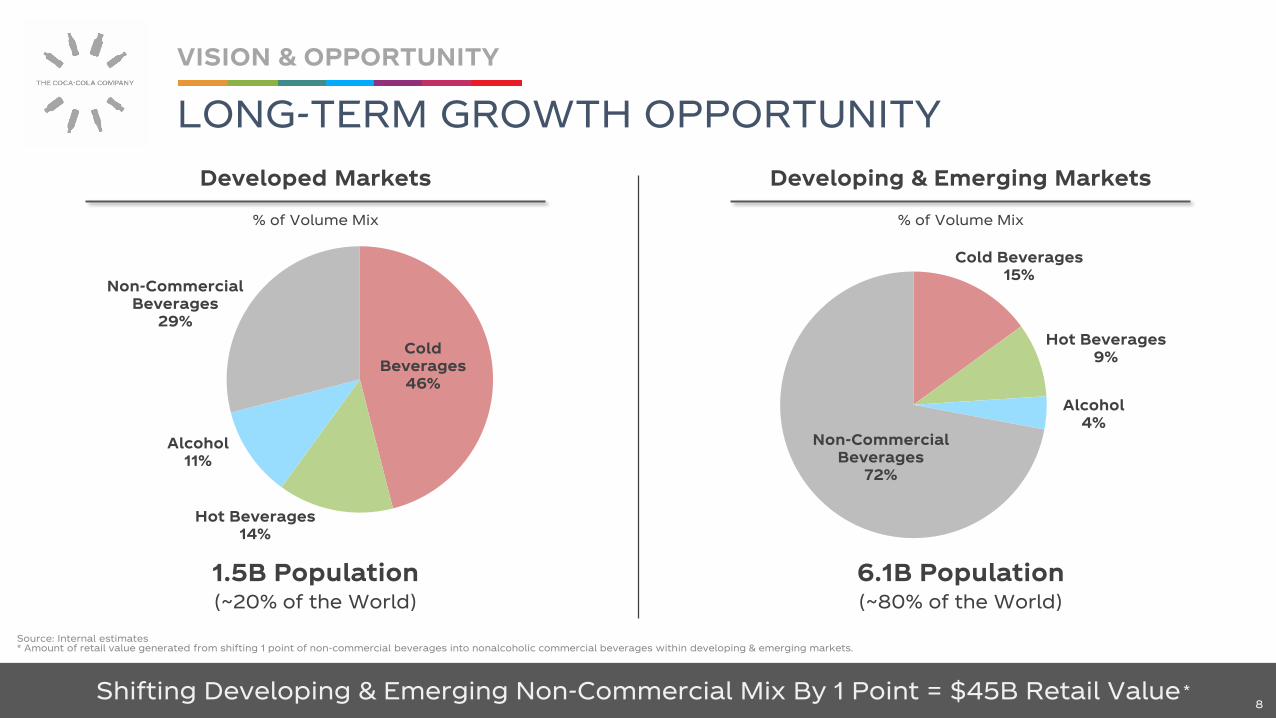
Developed Markets Developing & Emerging Markets
Cold Beverages15%
Hot Beverages9%
Alcohol4%
Non-Commercial Beverages
72%
Cold Beverages
46%
Hot Beverages14%
Alcohol11%
Non-Commercial Beverages
29%
Shifting Developing & Emerging Non-Commercial Mix By 1 Point = $45B Retail Value
1.5B Population(~20% of the World)
6.1B Population(~80% of the World)
% of Volume Mix % of Volume Mix
*
Source: Internal estimates * Amount of retail value generated from shifting 1 point of non-commercial beverages into nonalcoholic commercial beverages within developing & emerging markets.
LONG-TERM GROWTH OPPORTUNITY
VISION & OPPORTUNITY
8
99
KEY THEMES FOR TODAY
VISION & OPPORTUNITY
WINNING TODAY WHILE INVENTING TOMORROW
CREATING SHAREOWNER VALUE
TCCC has a minority investment in BODYARMOR. fairlife is a trademark and product of fairlife, LLC, our joint venture with Select Milk Producers, Inc.
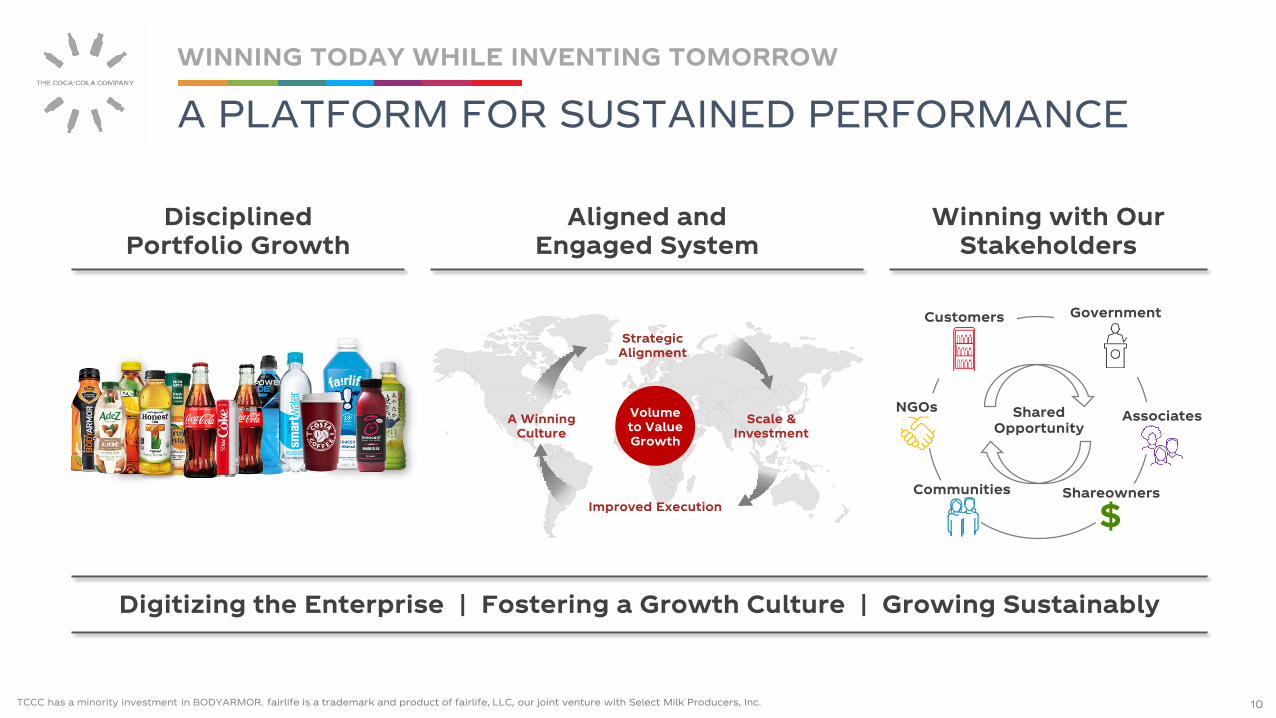
A PLATFORM FOR SUSTAINED PERFORMANCE
WINNING TODAY WHILE INVENTING TOMORROW
10
Customers
AssociatesNGOs
Government
Communities
Scale & Investment
A WinningCulture
Volumeto ValueGrowth
Strategic Alignment
Improved Execution
Aligned and Engaged System
Winning with Our Stakeholders
Digitizing the Enterprise | Fostering a Growth Culture | Growing Sustainably
Shared Opportunity
$
Disciplined Portfolio Growth
Shareowners
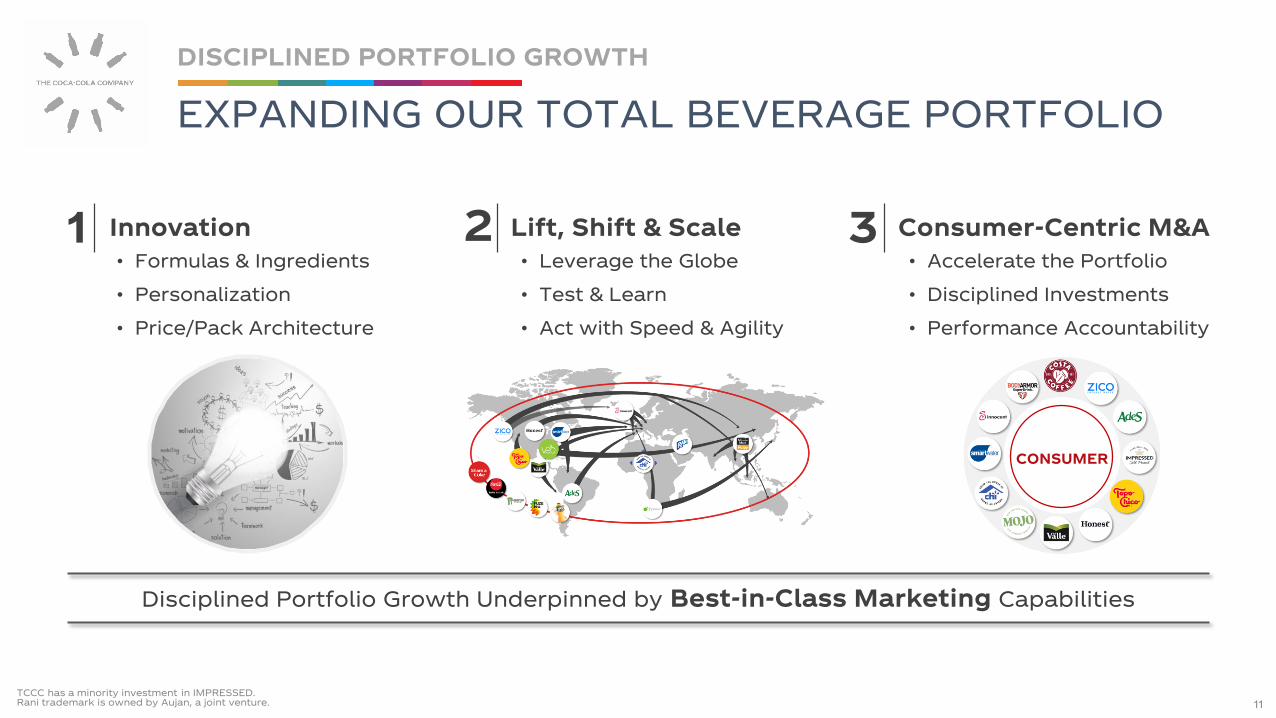
Innovation1 Lift, Shift & Scale2 3 Consumer-Centric M&A
• Formulas & Ingredients
• Personalization
• Price/Pack Architecture
• Leverage the Globe
• Test & Learn
• Act with Speed & Agility
• Accelerate the Portfolio
• Disciplined Investments
• Performance Accountability
CONSUMER
Disciplined Portfolio Growth Underpinned by Best-in-Class Marketing Capabilities
TCCC has a minority investment in IMPRESSED.Rani trademark is owned by Aujan, a joint venture.
EXPANDING OUR TOTAL BEVERAGE PORTFOLIO
DISCIPLINED PORTFOLIO GROWTH
11

+700
RENEWAL
EXPONENTIAL
TRANSFORMATIONAL
DISRUPTIVE
Note: Innovation contribution to unit case volume includes innovation launched in the past 3 years.
New Innovation: % Contribution to Unit
Case Volume
9%
10%
13%
17%
2015 2016 2017 2018
Accelerating PipelineBroad Innovative Approach
KNOWN TO THE COCA-COLA COMPANY
KN
OW
N T
O T
HE
WO
RL
D
KNOWN NEW
KN
OW
NN
EW
Spectrum of Growth: Recent Key Innovations
Fiber-Infused Products
Georgia Craftsman Coca-Cola Freestyle
Arctic Cooler
Killing Zombies
20% of Launches = 80% of Volume
30% of Launches =
1% of Volume
# of Launches
Vo
lum
e
Product Innovation: Analysis of ~2,000 product
launches across 5 years:
ZOMBIES KILLED IN 2018
DISCIPLINED APPROACH TO INNOVATION
DISCIPLINED PORTFOLIO GROWTH
12

Trademark Coca-Cola Retail Value Growth
Accelerating the Pace of Innovation Expanding the Consumer Base Driving Accelerated Growth
2%
4%
6%
2016 2017 2018
Note: Trademark Coca-Cola retail value growth is based on Euromonitor
INNOVATION: TAILORING THE SPARKLING PORTFOLIO TO TODAY’S CONSUMER
DISCIPLINED PORTFOLIO GROWTH
13

Volume Behavior Value Behavior (Profit & ROIC)
Leverages Momentum Step-Change in Growth Trend
One-Off, Annual Plan Multi-Year System Strategy
Operational Initiatives to Drive Volume
Strategic Initiatives to DriveRevenue > Transactions > Volume
Old Mindset
Revenue Growth Management Initiatives Are Rolling Out Globally
New Mindset Defined Strategy
Consumer
Shopper
Channel/Customer
Premiumization(Categories /
Brands / Packs)
Brand Stratification
Based on Elasticity
Geographic & Channel
Segmentation
vs.
REVENUE GROWTH MANAGEMENT IS A RENEWED PHILOSOPHY ON SYSTEM-WIDE VALUE CREATION
DISCIPLINED PORTFOLIO GROWTH
14
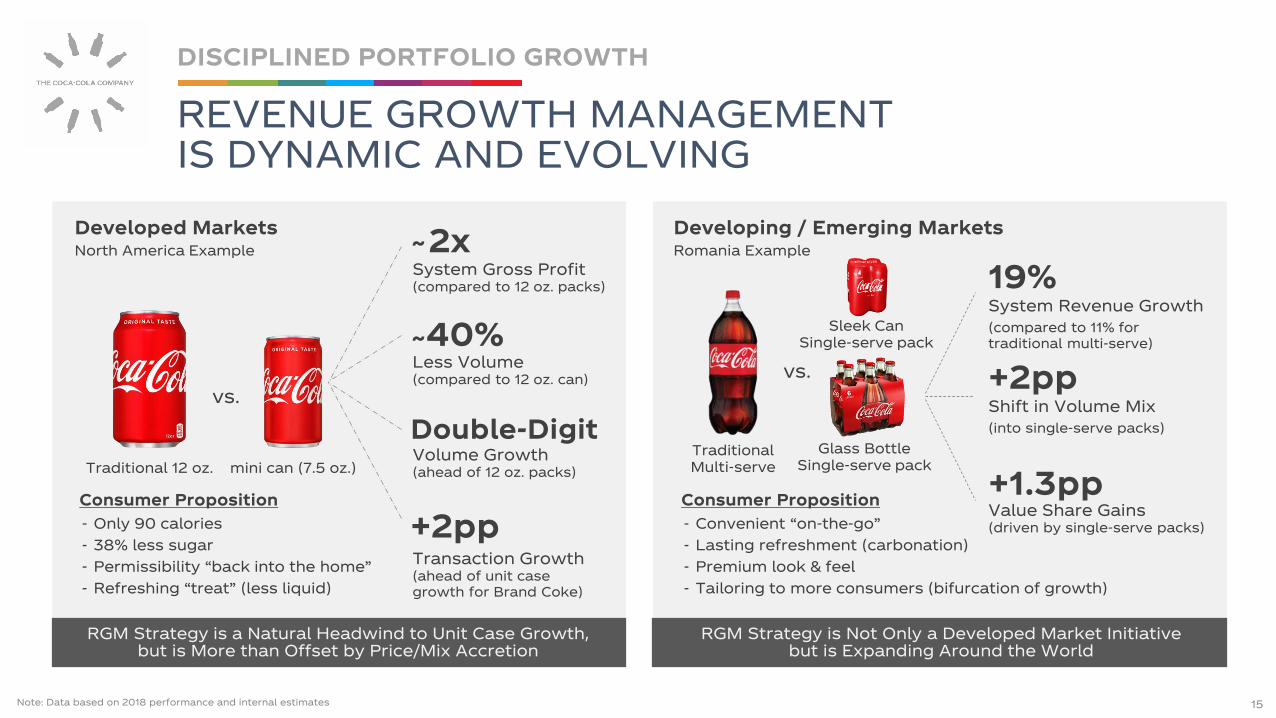
Developed MarketsNorth America Example
vs.
Traditional 12 oz. mini can (7.5 oz.)
Consumer Proposition
- Only 90 calories
- 38% less sugar
- Permissibility “back into the home”
- Refreshing “treat” (less liquid)
RGM Strategy is a Natural Headwind to Unit Case Growth, but is More than Offset by Price/Mix Accretion
2xSystem Gross Profit(compared to 12 oz. packs)
40%Less Volume(compared to 12 oz. can)
Double-DigitVolume Growth(ahead of 12 oz. packs)
~
~
+2ppTransaction Growth(ahead of unit case growth for Brand Coke)
RGM Strategy is Not Only a Developed Market Initiative but is Expanding Around the World
Developing / Emerging MarketsRomania Example
19%System Revenue Growth
(compared to 11% for traditional multi-serve)
+2ppShift in Volume Mix
(into single-serve packs)
+1.3ppValue Share Gains(driven by single-serve packs)
Consumer Proposition
- Convenient “on-the-go”
- Lasting refreshment (carbonation)
- Premium look & feel
- Tailoring to more consumers (bifurcation of growth)
vs.
Sleek Can Single-serve pack
Glass Bottle Single-serve pack
Traditional Multi-serve
Note: Data based on 2018 performance and internal estimates
REVENUE GROWTH MANAGEMENT IS DYNAMIC AND EVOLVING
DISCIPLINED PORTFOLIO GROWTH
15

In 2018, over 500 lift/shift/scale launches were executed across multiple key markets and on-trend brands
37EUROPEANMARKETS
3x PRICE POINT OF MAINSTREAM
WATER
23COUNTRIESLAUNCHED IN 2018
19EUROPEANMARKETS
GAINING ~1 POINT OF VALUE SHARE IN
FIRST YEAR
NOW MARKET LEADER IN 11 EUROPEAN
MARKETS
Source: Internal estimates
EXPANDING OUR PORTFOLIO THROUGH LIFT, SHIFT AND SCALE
DISCIPLINED PORTFOLIO GROWTH
16

Real-Time Ritual Building
Best-in-Class Vending Across
Multiple Channels
Expand Beans, Roast & Ground, Pods & Others
Innovate in Hot & Cold RTD Packs
BUILDING A WORLD-CLASS COFFEE PLATFORM THROUGH THE ACQUISITION OF COSTA
DISCIPLINED PORTFOLIO GROWTH
Planned Launch of Costa Ready-To-Drink by Mid-2019 in Select Markets 17
Use Retailto BuildBrand &
Experience
Expand Consumption
Occasions(Cold | Hot)
Provide Total Beverage Solutions
to Customers

Fund the Portfolio We Want, Not What We Have
Fewer, Bigger, Smarter Bets on Explorers and Challengers Invest Optimally in Leaders
1
3 2
• Rethink traditional marketing and drive different approaches (i.e. digital, point of sale activation, sampling)
• Kill Zombies, learn as we go
• Fund new Explorers & accelerate winners to Challengers
• Optimally funded media plans, based on advanced analytics
• Align investment with solid execution in the market
• Redeploy excess funds to drive exponential growth
• Coordinated marketing & commercial investments (i.e. “commercial sync”)
• Persistent and segmented marketing
• Fight for share gains on path to Leader status
EXPLORER(<10% Value Share)
Success Criteria: +DD% Value Growth
CHALLENGER(10-20% Value Share)
Success Criteria: Gain +1pt Value Share
LEADER(>20% Value Share)
Success Criteria: Value Growth > PCE
Disciplined Portfolio Growth within the Leader-Challenger-Explorer Framework
FRAMEWORK FOR RESOURCE ALLOCATION TO DRIVE PROFITABLE GROWTH
DISCIPLINED PORTFOLIO GROWTH
18

Becoming a Total Beverage Company in Mexico, While Accelerating Revenue and Expanding Margins
*REVENUE GROWTH
~3xMARGIN
EXPANSION
425bps
PROFIT GROWTH
10%(2006 – 2018 CAGR)
JUICE
TEA HYDRATION ENERGY
DAIRY
JUICE DRINKS
Create a Vision
Adjust Operating Model
Build or Acquire Capabilities
2006 Non-Sparkling Market Position: #6
Mexico’s Journey from Explorer, to Challenger, to Leader
*
*
*
* Currency neutral revenue and operating income performance for the Coca-Cola Mexico Business Unit (2006 – 2018)
SPARKLING SOFT DRINKS SPARKLING SOFT DRINKS
2018 Non-Sparkling Market Position: #1
RESOURCE ALLOCATION DRIVES PERFORMANCE AS WE GROW THE PORTFOLIO
DISCIPLINED PORTFOLIO GROWTH
19

Scale & Investment
A WinningCulture
Volumeto ValueGrowth
Strategic Alignment
Improved Execution
• Sharper focus on value over volume
• Aligned financial incentives to drive better decision making
• Gaining efficiencies through scale & improved supply chains
• Leverage best-in-class capabilities
• Stronger execution across global system
Refranchising Transformational Benefits
An Aligned and Engaged System Focused on Long-Term Value Creation
SHARED VISION OF DISCIPLINED GROWTH ACROSS A RENEWED SYSTEM
ALIGNED AND ENGAGED SYSTEM
20

3452
66
2016 2017 2018
NET COOLER INSTALLS (‘000)
FOCUS ON VALUE OVER VOLUME
• Removing Unprofitable SKUs
• Stop Low-Value Promotions
• Price/Pack Reset in Key Markets
1 ACCELERATED INNOVATION
• Double-Digit Volume Growth of Coca-Cola Zero Sugar in ‘18
• 3% Growth in Priority Small Packs*
• Fuze Tea #2 RTD Tea Brand within 1 Year of Launch**
2
3 IMPROVED EXECUTION
A Renewed & Aligned Focus… …Driving Accelerated Results
Engaged and Aligned System is Driving Stronger Execution and Performance
812
14
2016 2017 2018
FIELD SALES VISITS PER DAY -0.5%
-1.0%
0.5%
2.5%
3.0%
-0.5%
-1.5%
1.0%
3.0%
2.0%
2014 2015 2016 2017 2018
Revenue/UC Growth
Revenue Growth
‘LEGACY’ CCE CCEP
* Priority small packs = PET <1Litre, Glass <1Litre, Cans < 33cl; FY 2018 volume growth** Nielsen (2018) – Total of markets where Fuze Tea available (GB, BE, DE, FR, NO, SE, NL) and excluding Private Label
Note: Revenue and Revenue/UC growth are comparable currency neutral (non-GAAP). 2018 excludes the impact of incremental soft drinks taxes.
STRATEGIC ALIGNMENT DRIVING ACCELERATED PERFORMANCE (Case Study Of Coca-Cola European Partners)
ALIGNED AND ENGAGED SYSTEM
21

• B2B
• B2C
• Data Analytics
• New Leadership
• New Operating Model
• Compensation & Incentives
• Cultural Evolution
• World Without Waste
• Water Stewardship and Replenishment
• Women’s Economic Empowerment
CREATING A FOUNDATION FOR THE FUTURE
TAKING ACTION FOR SUSTAINABLE SUCCESS
22
Digitizing the Enterprise Fostering a Growth Culture Growing Sustainably
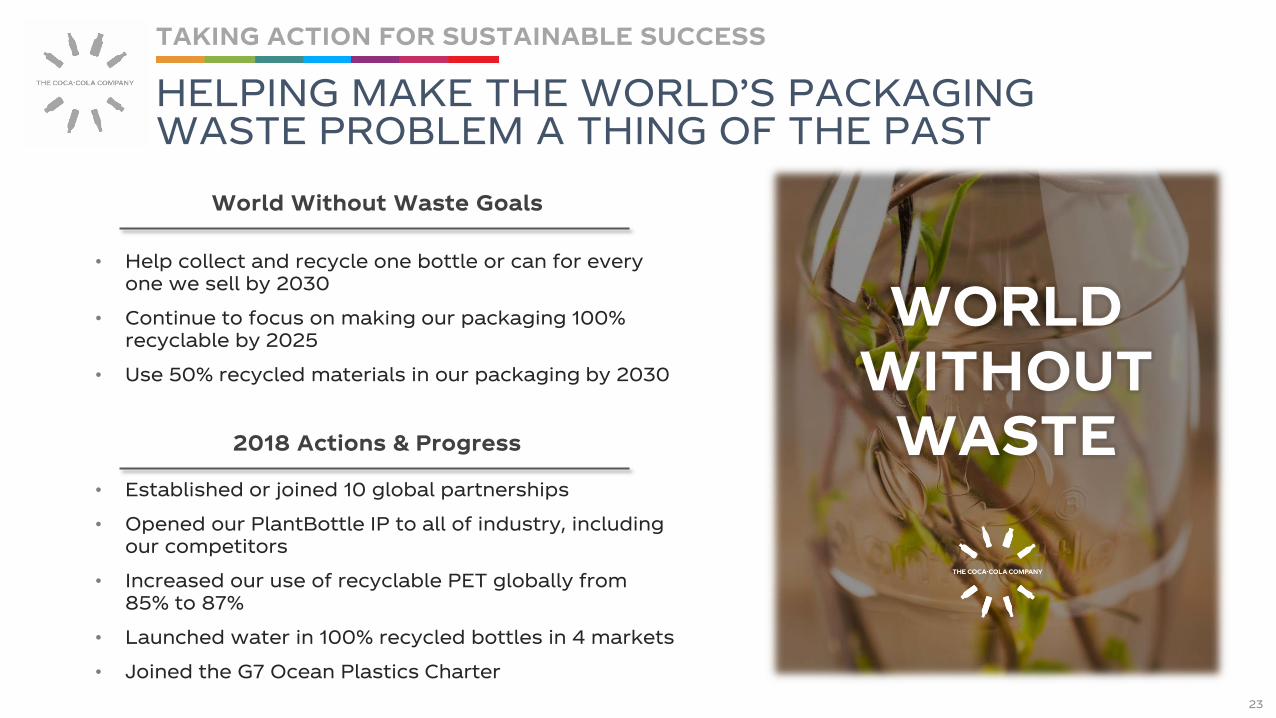
• Help collect and recycle one bottle or can for every one we sell by 2030
• Continue to focus on making our packaging 100% recyclable by 2025
• Use 50% recycled materials in our packaging by 2030
WORLD WITHOUT
WASTE
TAKING ACTION FOR SUSTAINABLE SUCCESS
HELPING MAKE THE WORLD’S PACKAGING WASTE PROBLEM A THING OF THE PAST
World Without Waste Goals
• Established or joined 10 global partnerships
• Opened our PlantBottle IP to all of industry, including our competitors
• Increased our use of recyclable PET globally from 85% to 87%
• Launched water in 100% recycled bottles in 4 markets
• Joined the G7 Ocean Plastics Charter
2018 Actions & Progress
23
• Positioned to Win in a Great Industry with Compelling Opportunity
• Transforming the Portfolio Through Disciplined Growth
• Engaged System Aligned for Success Today and Building a Competitive Advantage for the Future
• Fostering an Accountable, Performance-Driven Growth Culture
A BRIGHT FUTURE AHEAD
CAGNY 2019
24

2525
KEY THEMES FOR TODAY
VISION & OPPORTUNITY
WINNING TODAY WHILE INVENTING TOMORROW
CREATING SHAREOWNER VALUE

Pushing the Enterprise to Sustainably Maximize Free Cash Flow and Returns
KEY AREAS OF FOCUS
CREATING SHAREOWNER VALUE
26
Capital Allocation Productivity Culture
MarginsTopline Growth
$
Investing in People and Capabilities

* Non-GAAP** Comparable currency neutral (non-GAAP)Note: Adjusted free cash flow conversion ratio = FCF adjusted for pension contributions / net income adjusted for non-cash items impacting comparability
Organic Revenue
Operating Income
Earnings Per Share
Free Cash FlowKey Strengths
4 to 6% 6 to 8% 7 to 9% 90 to 95%
* ****
Global leader in growth industry
Clear destination
Aligned and engaged system
New culture aligning for growth
Delivering strong returns
Adjusted Free Cash Flow Conversion Ratio*
Confident in Achieving Our Long-Term Targets
SUSTAINABLE GROWTH…ATTRACTIVE LONG-TERM INVESTMENT
CREATING SHAREOWNER VALUE
27

• Sharper Focus on Value over Volume
• Revenue Growth Management Initiatives
• Lift, Shift and Scale Strategy
• Accelerating the Innovation Pipeline
• Improved Marketplace Execution
2016 Q1'17 Q2'17 Q3'17 Q4'17 Q1'18 Q2'18 Q3'18 Q4'18 2018
3%
5% Long-Term
4 to 6%
Note: Organic revenue is a non-GAAP financial measure.
TOPLINE IS RESPONDING TO RECENT ACTIONS
CREATING SHAREOWNER VALUE
28
Strategic Actions Organic Revenue Growth

2014 through 2018 2019
$3.8 Billion Total Gross Productivity Savings($600 Million in 2019)
Supply Chain Cost Marketing Investment Operating Expense
• System Procurement Advantage
• R&D Optimization
• Automation and Technology
• Freight and Distribution Cost Optimization
• Returns-Based Framework
• More Efficient Trade Spend
• Reduce Non-Media Spend
• Leverage Digital Marketing
• Faster and More Effective Decision Making
• Incentives to Drive the Right Behavior
• Upgrade Financial Reporting Systems
We Will Continue to Seek Productivity in 2019 and Beyond Through Three Main Cost Drivers
FOCUSED ON DELIVERING PRODUCTIVITY
CREATING SHAREOWNER VALUE
29

2017Comparable*
Accounting Refranchising 2018Underlying
2018Comparable
CurrencyNeutral*
2019-2020UnderlyingRequired
2020 BaseBusiness
Adjusted**
27%
34%+~200bps
~170bps
~380bps
~70bps
• 2018 Compression Due to Accounting Changes (No Significant Impact to Profit Before Tax)
• Strong Benefits from Refranchising
• Two Years of Solid Underlying Expansion Through Disciplined Growth & Productivity
• Continued Currency Headwinds Driving Difference to Comparable Margins
‘Base Business’ On Track to Deliver 2020 Margin Target of 34%+
* Comparable and comparable currency neutral are non-GAAP measures** Base business, before recent acquisitions; comparable currency neutral (non-GAAP); currency neutralized based on 2017 foreign currency exchange rates
Operating Margin Expansion
32%
+480bps
WE ARE EXPANDING OPERATING MARGINS…
CREATING SHAREOWNER VALUE
30
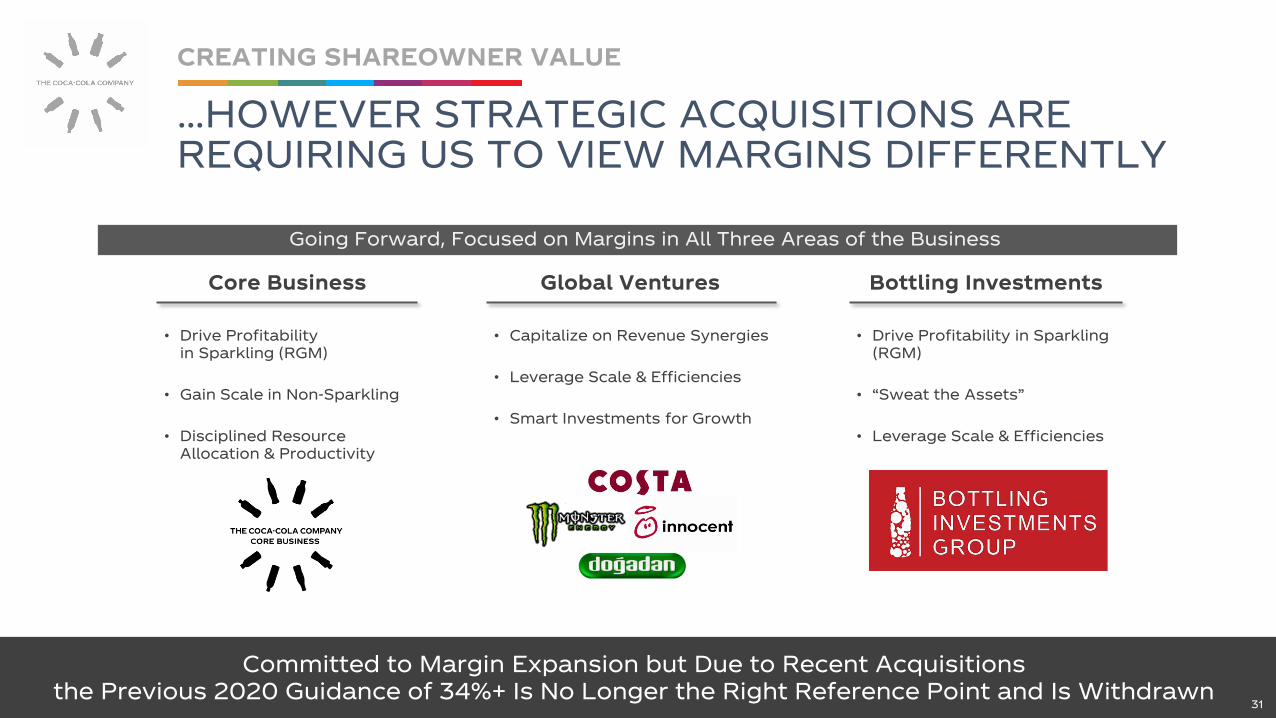
Global Ventures Bottling InvestmentsCore Business
• Drive Profitability in Sparkling (RGM)
• Gain Scale in Non-Sparkling
• Disciplined Resource Allocation & Productivity
• Capitalize on Revenue Synergies
• Leverage Scale & Efficiencies
• Smart Investments for Growth
• Drive Profitability in Sparkling (RGM)
• “Sweat the Assets”
• Leverage Scale & Efficiencies
Committed to Margin Expansion but Due to Recent Acquisitionsthe Previous 2020 Guidance of 34%+ Is No Longer the Right Reference Point and Is Withdrawn
Going Forward, Focused on Margins in All Three Areas of the Business
…HOWEVER STRATEGIC ACQUISITIONS ARE REQUIRING US TO VIEW MARGINS DIFFERENTLY
CREATING SHAREOWNER VALUE
31
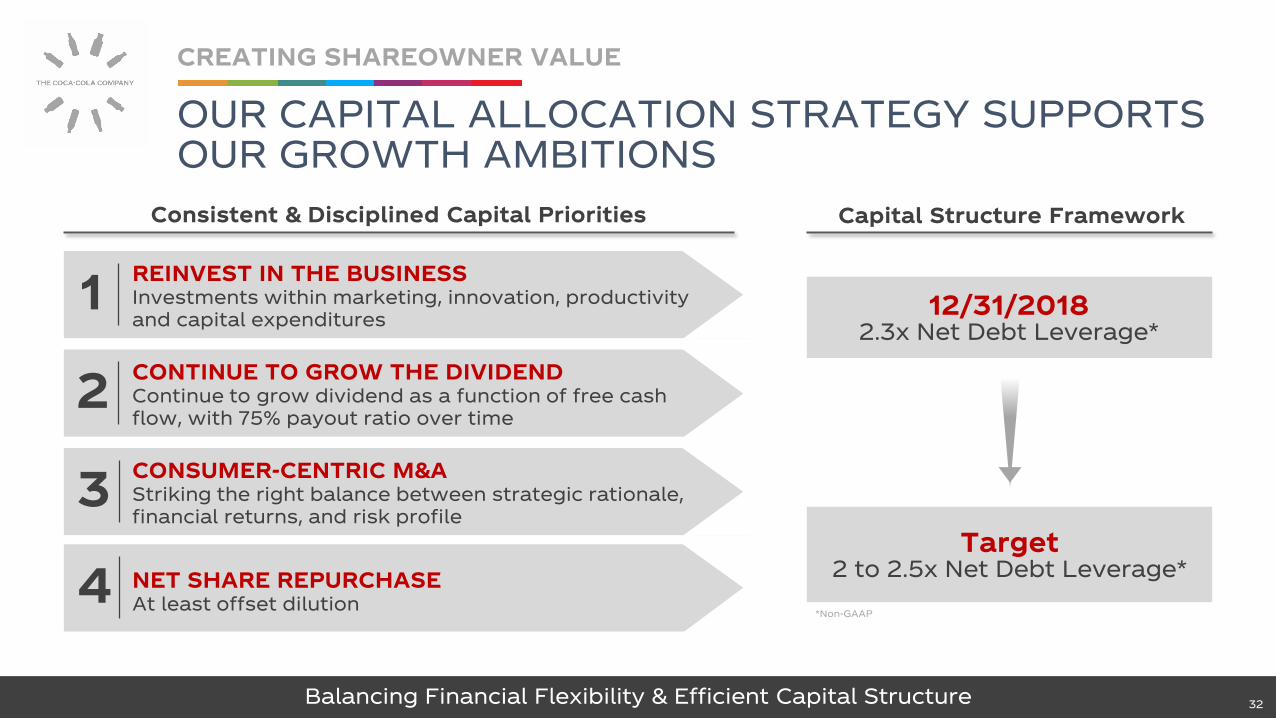
Balancing Financial Flexibility & Efficient Capital Structure
Target2 to 2.5x Net Debt Leverage*
12/31/20182.3x Net Debt Leverage*
*Non-GAAP
REINVEST IN THE BUSINESSInvestments within marketing, innovation, productivity and capital expenditures
1
CONTINUE TO GROW THE DIVIDENDContinue to grow dividend as a function of free cash flow, with 75% payout ratio over time
2
CONSUMER-CENTRIC M&AStriking the right balance between strategic rationale, financial returns, and risk profile
3
NET SHARE REPURCHASEAt least offset dilution4
Consistent & Disciplined Capital Priorities Capital Structure Framework
OUR CAPITAL ALLOCATION STRATEGY SUPPORTS OUR GROWTH AMBITIONS
CREATING SHAREOWNER VALUE
32

2018 Target
70%
90% to 95%
* Non-GAAP; adjusted free cash flow conversion ratio = FCF adjusted for pension contributions / net income adjusted for non-cash items impacting comparability
WE ARE COMMITTED TO IMPROVING FREE CASH FLOW
CREATING SHAREOWNER VALUE
33
Pushing the Enterprise to Sustainably Maximize Free Cash Flow and Returns
Strong Focus on Free Cash Flow Conversion Ratio* Target Key Drivers
• Achieve Best-in-Class Payables and Receivables Benchmarks
• Optimize Inventory Levels
• Refranchising and Restructuring Costs Causing a Drag on Conversion
• Will Reduce Going Forward
• Optimal Levels of Capital Investments to Maximize ROI
Working Capital Management
One-Time Costs
Capital Investments

* ROIC = NOPAT divided by two-year average of invested capital; ROIC is a non-GAAP measureNote: 2015 and 2016 invested capital is calculated as follows: Total debt plus total equity minus total cash, cash equivalents and short-term investments minus marketable securities. 2017 and 2018 invested capital is calculated as follows: Total debt plus total equity minus total cash, cash equivalents and short-term investments minus marketable securities minus net assets held for sale – discontinued operations
IMPROVINGRETURNS
+500bps
IMPROVING RETURNS IN A LESS CAPITAL-INTENSIVE MODEL
CREATING SHAREOWNER VALUE
34
16.7%17.2%
18.7%
21.7%
2015 2016 2017 2018
*Return on Invested Capital
• Accelerating Organic Revenue Growth
• Strengthening Operating Margin Expansion
• Less Capital-Intensive Model
• Disciplined Use of Capital
Performance and Strategic Actions Driving Returns
Pushing the Enterprise to Sustainably Maximize Free Cash Flow and Returns

*Non-GAAP**Comparable currency neutral (non-GAAP)***Comparable EPS from continuing operations (non-GAAP)
2019 OUTLOOK
CREATING SHAREOWNER VALUE
35
2019 Guidance
Focused on Executing the Strategy
• Topline Momentum in All Operating Segments
• Strong Productivity
• Strong Marketing and Innovation Pipeline
• Rising Interest Rate Environment
• Currency Headwinds Offsetting Strong Operational Growth
Factors Driving Guidance
Organic Revenue* 4%
Operating Income** 10% to 11%
Comparable EPS*** -1% to +1%
Free Cash Flow* At Least $6B

• Clear Strategy for Sustainable Growth is Driving Topline Momentum
• Path to Expanding Operating Margins Across Our Businesses
• Disciplined Capital Allocation via Returns-Based Framework
• Committed to Improving Cash Flow Generation
• Delivering Against Our Near- and Long-Term Financial Targets
CREATING SHAREOWNER VALUE
CAGNY 2019
36

Q&A
37