Embed Size (px)
Citation preview
CCPPRRCC
CCCCRRPP CANADIAN POLICE RESEARCH CENTRE CENTRE CANADIEN DE RECHERCHES POLICIÈRES
TR-09-2001 Hangings - A Practical Study of Ligatures and Suspension Point Morphology Tara Nicholls, B.Sc
TECHNICAL REPORT September, 2000
Submitted by: Ontario Provincial Police Technical Identification Services Unit Barrie, Ontario
NOTE: Further information NOTA: Pour de plus ample about this report can be renseignements veuillez obtained by calling the communiquer avec le CCRP CPRC information number au (613) 998-6343 (613) 998-6343
© HER MAJESTY THE QUEEN IN RIGHT OF CANADA (2001) © SA MAJESTÉ LA REINE DU CHEF DU CANADA (2001) as represented by the Solicitor General of Canada. représentée par le Solliciteur général du Canada.
Executive Summary
The purpose of the study was to examine the physical evidence consistent with a self-inflicted hanging act, such as a suicide or auto-erotic death and provide a comparison through the examination of homicidal hangings. The goal of the study is to improve, through education, the investigative techniques at death scenes involving hangings and, ultimately, to be able to distinguish homicidal hanging scenes from suicidal scenes using physical evidence and a thorough investigation. This study produced a large number of observations and measurements and these, combined with results of a survey of hanging cases and a literature review, led to the creation of a data form providing criteria for investigators in the area of suspicious hanging deaths. Sommaire
Cette étude examine les éléments de preuve matériels d’une pendaison auto-infligée (suicide, mort auto-érotique), puis les compare à ceux d’un homicide par pendaison. E lle vise à améliorer, par l’éducation, les techniques d’enquête utilisées sur les lieux de décès par pendaison et à aider à distinguer les homicides par pendaison des suicides grâce à l’examen d’éléments de preuve matériels et à une enquête minutieuse. On a formulé un grand nombre d’observations et on a élaboré quantité de mesures qui, conjuguées aux ré sultats d’une recherche sur des cas de pendaison et une recension des écrits, ont permis d’établir des critères relatifs aux morts par pendaison suspectes à l’intention des enquêteurs.
HANGINGS - A PRACTICAL STUDY OF LIGATURES AND SUSPENSION POINT MORPHOLOGY - PHASE II
By Tara Nicholls, B.Sc.
Canadian Police Research Council
Ontario Provincial Police Technical Identification Services Unit, Barrie, Ontario
Supervised by Staff Sergeant J. P. Downey
Completion Date: September 11, 2000
Copyright by Tara Nicholls, 2000

List of Diagrams
List of Photographs
List of Tables
List of Charts
Abstract
Introduction
Purpose of Study
Materials The Gallows The “Crash Test Dummy” The Suspension Beams The Ligatures The Digital Calipers The Custom Designed Jig Photographic Equipment Fingerprint Lifting Tape Ultraviolet Light Analysis
Methods The Static Fall Description The Drag Description Trial Identification System
TABLE OF CONTENTS
PAGE
Results Observations
Omnichrome Infrared Photos and Light Indentation Tapings Cross-Section Analysis Photographic Analysis of Indentations Photographic Analysis of Wood Fibre Directionality Photographic Analysis of Rope Fibres
Raw Data Statistical Methods
2
5
6
9
11
17
19 19 19 20 20 21 21 22 22 22
23 24 25 27
28 28 28 28 29 29 31 32 32
33 34
PAGE
Description of Results for Area Measurements of Indentation Tapings 35 Description of Results for Perimeter Measurements of Indentation Tapings 35 Description of Results for Indentation Depth Measurements 36 OMPPAC survey
Survey Characteristics 1998 Survey Results 1999 Survey Results
Discussion Summary of Results Table 1. Phase II Results - Comparative Summary. Implications for Education of Hanging Death Scene Investigations
A. Scene Observations B. Photographs C. Measurements D. Evidence Collected at Scene E. Post Mortem Examination
Research Design Sources of Variability The Future Conclusion
Acknowledgements
Appendix A - Diagrams 1 - 5
Appendix B -Photographs 1 - 58
Appendix C - Tables 2 - 15
Appendix D - Charts 1 - 40
Appendix E - OMPPAC Survey 1998 and 1999
Appendix F - Sudden Death Hanging Investigation Scene Data Form - Criteria for Education
Appendix G - Descriptive Statistics
Appendix H - References Cited
38 38 40 41
44 44 46 47 47 48 49 49 49
50 50 51 52
53
54
59
71
79
120
123
130
171

LIST OF DIAGRAMS - APPENDIX A
DIAGRAM 1 - Side Elevation of Gallows
DIAGRAM 2 - Front Elevation of Gallows
DIAGRAM 3 - Noose knot
DIAGRAM 4 - Ligature and Opposite Side Illustration
DIAGRAM 5 - Example of Indentation Tapings, Calculation o Perimeter
1
Area an
PAGE
55
55
56
57
58
LIST OF PHOTOGRAPHS - APPENDIX B
PHOTO 1. Winch connected to main rope.
PHOTO 2. Winch used for drag trials.
PHOTO 3. The gallows, with research assistant Paula Webster.
PHOTO 4. Example of how ligature tied for static fall trial.
PHOTO 5. The “crash test dummy”.
PHOTO 6. The noose knot.
PHOTO 7. Router.
PHOTO 8. Pro-Max Digital Calipers.
PHOTO 9. The Custom Designed Jig.
PHOTO 10. Bronica ETRSi camera.
PHOTO 11. Wild microscope with 35 mm camera attachment.
PHOTO 12. Control sample of cross-section of indentation of wood.
PHOTO 13. Ligature side, static fall trial, cross-section of indentation.
PHOTO 14. Opposite side, static fall trial, cross-section of indentation.
PHOTO 15. Opposite side, drag trial, cross-section of indentation.
PHOTO 16. Ligature side, drag trial, cross-section of indentation.
PHOTO 17. Failure in wood layers, static fall trial, cross-section of indentation.
PHOTO 18. Failure in wood layers, static fall trial, cross-section of indentation.
PHOTO 19. Control area of suspension beam, prior to trials.
PHOTO 20. Control area, flat surface of board.
PHOTO 21. Control area, flat surface of board.
2
PAGE
60
60
60
60
61
61
61
61
62
62
62
63
63
63
63
63
63
64
64
64
64
PAGE
64
64
65
65
65
65
65
65
66
66
66
66
PHOTO 22. Control area of board (8.75x).
PHOTO 23. Example of static fall indentation, ligature side.
PHOTO 24. Example of static fall hanging indentation.
PHOTO 25. Failure of wood layers (8.75x)
PHOTO 26. Opposite side, static fall indentation.
PHOTO 27. Ligature side, drag indentation.
PHOTO 28. Ligature side, drag indentation.
PHOTO 29. Opposite side, drag indentation.
PHOTO 30. Drag indentation, minimal wood failure (8.75x).
PHOTO 31. Striations evident, static fall indentation (20x).
PHOTO 32. Striations evident, drag trial (20x).
PHOTO 33. Double indentation, static fall trial.
PHOTO 34. Ligature side, static fall trial, wood splinter directed downward (8.75x). 66
PHOTO 35. Ligature side, static fall trial, wood fibres directed downward (20x). 66
PHOTO 36. Ligature side, static fall trial, wood splinter directed downward (20x). 67
PHOTO 37. Ligature side, static fall trial, wood splinters directed downward (20x). 67
67
67
67
67
PHOTO 38. Wood splinter directed downward, static fall trial (20x).
PHOTO 39. Wood splinter directed downward, static fall trial (20x).
PHOTO 40. Opposite side, static fall trial, wood fibres directed downward (8.75x).
PHOTO 41. Opposite side, static fall trial, wood fibres directed downward (20x).
3

PHOTO 42. Ligature side, drag trial, wood fibre directed upward (20x).
PHOTO 43. Ligature side, drag trial, wood fibres directed upward (40x).
PHOTO 44. Opposite side, drag trial, wood fibres directed downward (8.75x).
PHOTO 45. Opposite side, drag trial, wood splinter directed downward (20x).
PHOTO 46. Opposite side, drag trial, wood fibres directed downward (20x).
PHOTO 47. Control section of rope.
PHOTO 48. Control section of rope.
PHOTO 49. Control section of rope (8.75x).
PHOTO 50. Control section of rope (20x).
PHOTO 51. Compression area and filamentation, static fall trial rope (8.75x).
PHOTO 52. Filamentation of static fall trial rope (20x).
PHOTO 53. Filamentation and flattened fibre of drag trial ligature rope (20x).
PHOTO 54. Filamentation and flattened fibres of drag trial ligature rope (20x).
PHOTO 55. Filamentation of drag trial rope (40x).
PHOTO 56. Snag of individual rope fibre, drag trial (8.75x).
PHOTO 57. Close up of area where snag pulled from ligature (20x).
PHOTO 58. Example of rope fibre within drag indentation (20x).
4
PAGE
68
68
68
68
68
69
69
69
69
69
69
70
70
70
70
70
70

LIST OF TABLES - APPENDIX C PAGE
TABLE 1. Phase II Results - Comparative Summary
TABLE 2. Summary Statistics of Area Measurements of Indentation Tapings - Static Fall Trials
TABLE 3. SumMary Statistics of Area Measurements of Indentation Tapings - Drag Trials
TABLE 4. Summary Statistics of Perimeter Measurements of Indentation Tapings - Static Fall Trials
TABLE 5. Summary Statistics of Perimeter Measurements of Indentation Tapings - Drag Trials
TABLE 6. Ligature Side Control Measurements
TABLE 7. Opposite Side Control Measurements
TABLE 8. Ligature Side Indentation Depth Measurements - Static Fall Trials*
TABLE 9. Opposite Side Indentation Depth Measurements - Static Fall Trials*
TABLE 10. Ligature Side Indentation Depth Measurements - Drag Trials*
TABLE 11. Opposite Side Indentation Depth Measurements - Drag Trials*
TABLE 12. Ligature Side Indentation Depth Measurements - Static Fall Trials**
TABLE 13. Opposite Side Indentation Depth Measurements - Static Fall Trials**
TABLE 14. Ligature Side Indentation Depth Measurements - Drag Trials**
TABLE 15. Opposite Side Indentation Depth Measurements - Drag Trials**
*after subtraction of Initial Control Measurements **prior to subtraction of Initial Control Measurements
5
47
72
72
73
73
74
74
75
75
76
76
77
77
78
78

4
LIST OF CHARTS - APPENDIX D
PAGE
CHART 1. Mean Area Measurements of Static Fall Trial Indentation Tapings For all Boards.
CHART 2. Mean Area Measurements of Drag Trial Indentation Tapings for all Boards.
CHART 3. Mean Area Measurements of Board 1 Static Fall and Drag Indentation Tapings.
CHART 4. Mean Area Measurements of Board 2 Static Fall and Drag Indentation Tapings.
CHART 5. Mean Area Measurements of Board 3 Static fall and Drag Indentation Tapings.
CHART 6. Mean Area Measurements of Board 4 Static fall and Drag Indentation Tapings.
CHART 7. Mean Area Measurements of Board 5 Static fall and Drag Indentation Tapings.
CHART 8. Mean Area Measurements of Board 6 Static fall and Drag Indentation Tapings.
CHART 9. Mean Area Measurements of Board 7 Static fall and Drag Indentation Tapings.
CHART 10. Mean Area Measurements of Board 8 Static fall and Drag Indentation Tapings.
80
81
82
83
84
85
86
87
88
89
CHART 11. Mean Perimeter Measurements of Static Fall Trial Indentation Tapings for all Boards. 90
CHART 12. Mean Perimeter Measurements of Drag Trial Indentation Tapings for Boards. 91
CHART 13. Mean Perimeter Measurements of Board 1 Static Fall and Drag Indentation Tapings. 92
CHART 14. Mean Perimeter Measurements of Board 2 Static Fall and Drag Indentation Tapings. 93
6

CHART 15. Mean Perimeter Measurements of Board 3 Static Fall and Drag Inden tation Tapings.
CHART 16. Mean Perimeter Measurements of Board 4 Static Fall and Drag Indentation Tapings.
CHART 17. Mean Perimeter Measurements of Board 5 Static Fall and Drag Indentation Tapings.
CHART 18. Mean Perimeter Measurements of Board 6 Static Fall and Drag Inden tation Tapings.
CHART 19. Mean Perimeter Measurements of Board 7 Static Fall and Drag Inden tation Tapings.
CHART 20. Mean Perimeter Measurements of Board 8 Static Fall and Drag Inden tation Tapings.
CHART 21. Control Board Measurements of Ligature Side of all Boards.
CHART 22. Control Board Measurements of Opposite Side of all Boards.
CHART 23. Depth of Indentations for Static Fall Trials comparing Ligature and Opposite Sides for all Boards.
CHART 24. Depth of Indentations for Drag Trials comparing Ligature and Opposite Sides for all Boards.
CHART 25. Depth of Indentations for Board 1 Static Fall and Drag Trials - Ligature Side.
CHART 26. Depth of Indentations for Board 1 Static Fall and Drag Trials - Opposite Side
CHART 27. Depth of Indentations for Board 2 Static Fall and Drag Trials - Ligature Side.
CHART 28. Depth of Indentations for Board 2 Static Fall and Drag Trials - Opposite Side.
CHART 29. Depth of Indentations for Board 3 Static Fall and Drag Trials - Ligature Side.
7
PAGE
94
95
96
97
98
99
100
101
102
103
104
105
106
107
108

CHART 30. Depth of Indentations for Board 3 Static Fall and Drag Trials - Opposite Side.
CHART 31. Depth of Indentations for Board 4 Static Fall and Drag Trials - Ligature Side.
CHART 32. Depth of Indentations for Board 4 Static Fall and Drag Trials - Opposite Side.
CHART 33. Depth of Indentations for Board 5 Static Fall and Drag Trials - Ligature Side.
CHART 34. Depth of Indentations for Board 5 Static Fall and Drag Trials - Opposite Side.
CHART 35. Depth of Indentations for Board 6 Static Fall and Drag Trials - Ligature Side.
CHART 36. Depth of Indentations for Board 6 Static Fall and Drag Trials - Opposite Side.
CHART 37. Depth of Indentations for Board 7 Static Fall and Drag Trials - Ligature Side.
CHART 38. Depth of Indentations for Board 7 Static Fall and Drag Trials - Opposite Side.
CHART 39. Depth of Indentations for Board 8 Static Fall and Drag Trials - Ligature Side.
CHART 40. Depth of Indentations for Board 8 Static Fall and Drag Trials - Opposite Side.
I
8
PAGE
109
110
111
112
113
114
115
116
117
118
119
Abstract
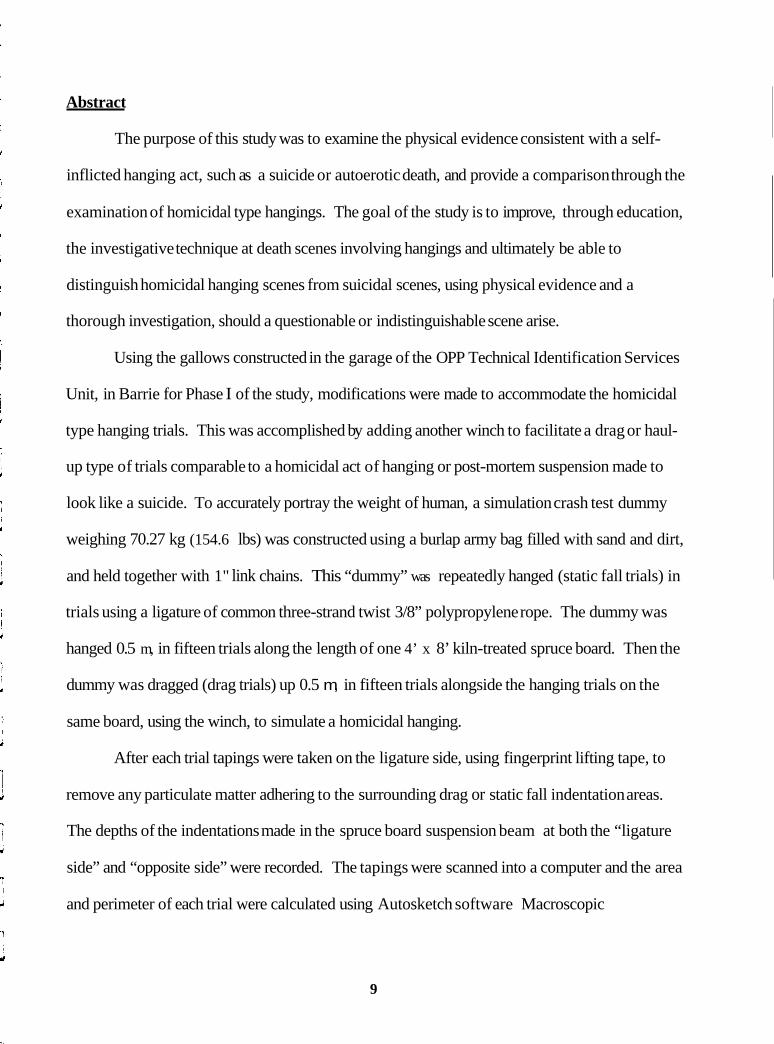
The purpose of this study was to examine the physical evidence consistent with a self-
inflicted hanging act, such as a suicide or autoerotic death, and provide a comparison through the
examination of homicidal type hangings. The goal of the study is to improve, through education,
the investigative technique at death scenes involving hangings and ultimately be able to
distinguish homicidal hanging scenes from suicidal scenes, using physical evidence and a
thorough investigation, should a questionable or indistinguishable scene arise.
Using the gallows constructed in the garage of the OPP Technical Identification Services
Unit, in Barrie for Phase I of the study, modifications were made to accommodate the homicidal
type hanging trials. This was accomplished by adding another winch to facilitate a drag or haul-
up type of trials comparable to a homicidal act of hanging or post-mortem suspension made to
look like a suicide. To accurately portray the weight of human, a simulation crash test dummy
weighing 70.27 kg (154.6 lbs) was constructed using a burlap army bag filled with sand and dirt,
and held together with 1" link chains. This “dummy” was repeatedly hanged (static fall trials) in
trials using a ligature of common three-strand twist 3/8” polypropylene rope. The dummy was
hanged 0.5 m, in fifteen trials along the length of one 4’ x 8’ kiln-treated spruce board. Then the
dummy was dragged (drag trials) up 0.5 m, in fifteen trials alongside the hanging trials on the
same board, using the winch, to simulate a homicidal hanging.
After each trial tapings were taken on the ligature side, using fingerprint lifting tape, to
remove any particulate matter adhering to the surrounding drag or static fall indentation areas.
The depths of the indentations made in the spruce board suspension beam at both the “ligature
side” and “opposite side” were recorded. The tapings were scanned into a computer and the area
and perimeter of each trial were calculated using Autosketch software Macroscopic
9

observations of the indentations and ropes used were made, and a macro and microscopic
photographic analysis was completed for demonstration purposes. A survey of hanging cases
using the OPP files available from Central Region, Barrie TISU was completed for two years,
1998 and 1999, to assess what is being recorded at hanging scenes, and demonstrate areas that
require greater focus at a suspicious hanging death.
Observational results from this comparative study of suicidal and homicidal hangings
indicate that at the macroscopic level, the amount of densification of the wood, in a cross-section
of the indentation, is much greater in the static fall trials than the drag trials. In static falls the
wood fibres were directed downward on both sides of the suspension beam, while in drags the
fibres were directed up on the ligature side and down on the opposite side. Analysis of the
indentations created in the wood suspension beams found that significantly deeper indentations
were created in the static fall trials, than in the drag trials, due to the force that is created by the
weight of the dummy. The area and perimeter calculations of the tapings revealed that generally
the static fall indentations were much larger on the ligature side. In addition, the rope
compression and filamentation was greater in the static falls, and directionality was observed in
the drag trials due to snags in the rope pulled over the suspension beam.
Therefore, this combination of observations and measurements, combined with the results
of the OMPPAC survey and literature review, resulted in the creation of a data form which
provides criteria for education of new investigators in the area of suspicious hanging deaths.
10
Introduction
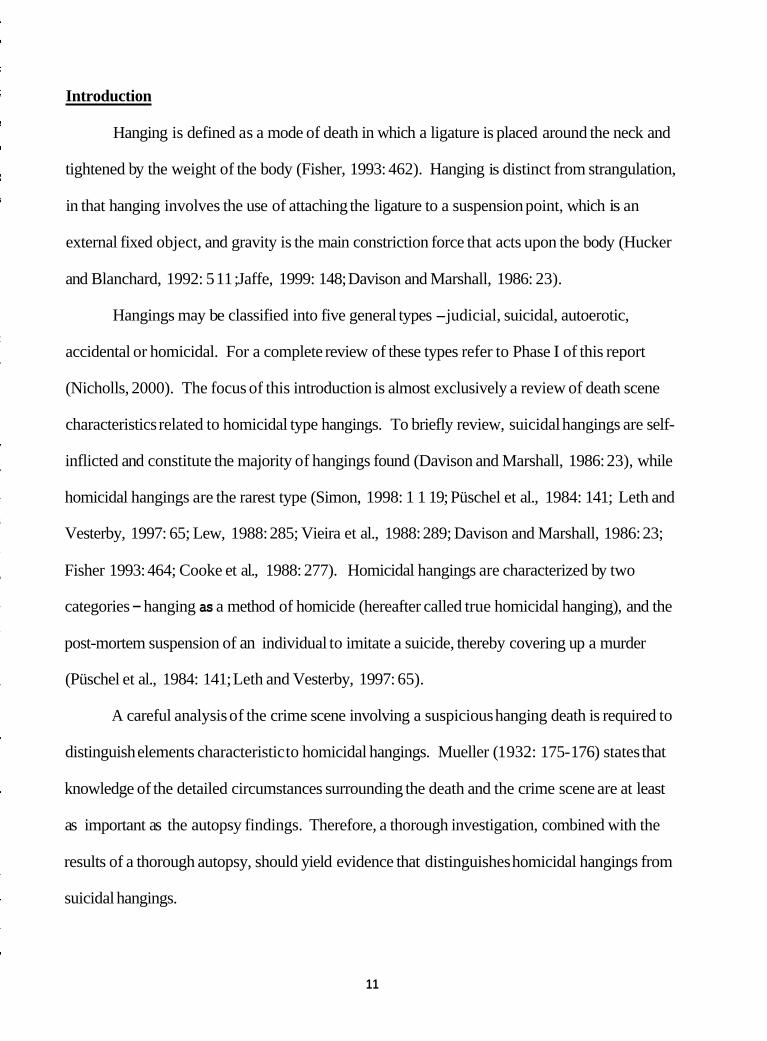
Hanging is defined as a mode of death in which a ligature is placed around the neck and
tightened by the weight of the body (Fisher, 1993: 462). Hanging is distinct from strangulation,
in that hanging involves the use of attaching the ligature to a suspension point, which is an
external fixed object, and gravity is the main constriction force that acts upon the body (Hucker
and Blanchard, 1992: 5 1 1 ; Jaffe, 1999: 148; Davison and Marshall, 1986: 23).
Hangings may be classified into five general types -judicial, suicidal, autoerotic,
accidental or homicidal. For a complete review of these types refer to Phase I of this report
(Nicholls, 2000). The focus of this introduction is almost exclusively a review of death scene
characteristics related to homicidal type hangings. To briefly review, suicidal hangings are self-
inflicted and constitute the majority of hangings found (Davison and Marshall, 1986: 23), while
homicidal hangings are the rarest type (Simon, 1998: 1 1 19; Püschel et al., 1984: 141; Leth and
Vesterby, 1997: 65; Lew, 1988: 285; Vieira et al., 1988: 289; Davison and Marshall, 1986: 23;
Fisher 1993: 464; Cooke et al., 1988: 277). Homicidal hangings are characterized by two
categories - hanging as a method of homicide (hereafter called true homicidal hanging), and the
post-mortem suspension of an individual to imitate a suicide, thereby covering up a murder
(Püschel et al., 1984: 141; Leth and Vesterby, 1997: 65).
A careful analysis of the crime scene involving a suspicious hanging death is required to
distinguish elements characteristic to homicidal hangings. Mueller (1 932: 175- 176) states that
knowledge of the detailed circumstances surrounding the death and the crime scene are at least
as important as the autopsy findings. Therefore, a thorough investigation, combined with the
results of a thorough autopsy, should yield evidence that distinguishes homicidal hangings from
suicidal hangings.
11

--.-
Positive death scene findings characteristic of a homicidal hanging scene include signs of
a fight or struggle (Püschel et al., 1984: 147), indicated by a disturbance of the furniture, for
example (Vieira et al., 1988: 288). In one case, bloodstains and broken objects within the house
raised the suspicion of investigators, as the victim was found hanging from a beam at the front
door of the stable (Radian and Radovici, 1957: 232). Similarly, torn and bloodstained clothing
on the victim of a post-mortem suspension made to appear as a suicide, correlated well with the
findings at autopsy of blunt force trauma preceding strangulation (Boltz, 1956: 133-1 34). While
such signs of a struggle should be obvious, it must be noted however, that in suicidal hangings
injuries can be found that are not related to crime. “Occlusion of the airway invariably elicits a
struggle, a dramatic condition commonly referred to as air hunger” (author’s emphasis) (Spitz
and Fisher, 1980: 321). Injuries and signs of a struggle or violence may therefore be produced as
a result of the body hitting an object during spasm, or by previous suicide attempts (Leth and
Vesterby, 1997: 68; Fisher, 1993: 463; Vieira et al., 1988: 288).
Drag marks on the ground, and subsequent marks on the skin or clothing of the victim are
also indications of a struggle (Püschel et al., 1984: 147). In one case described by Rooks (1935:
106-1 07) smears of cattle muck on the hands and face of a hanged woman in a cattle shed were
caused by strangulation on the ground by her son. In another case described by Kipper (1926:
21 9-220), discovery of the fight scene and the trail of disturbed vegetation led searchers to the
victim who had been dragged 20 metres by two men and subsequently hanged from a tree
branch. Dirt on the victim that is not present at the scene should be noted (Fisher, 1993: 465), as
well as materials, such as dust, that should be disturbed by the action of the victim but are found
undisturbed at the scene (Püschel et al., 1984: 147).
12
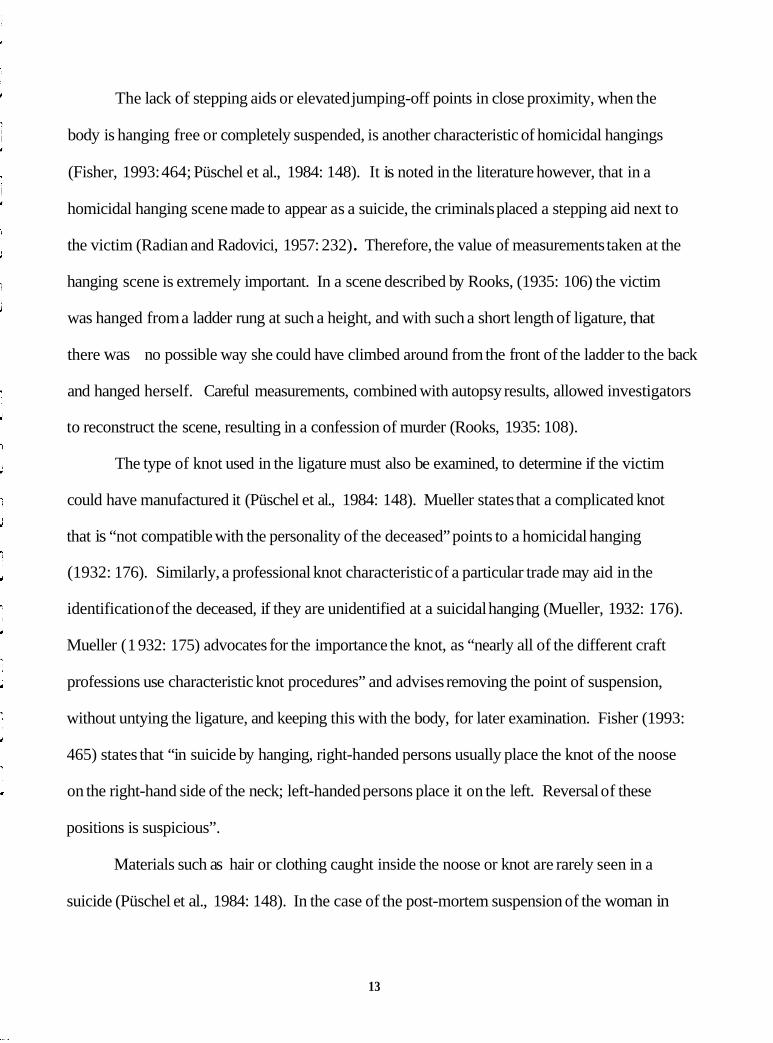
The lack of stepping aids or elevated jumping-off points in close proximity, when the
body is hanging free or completely suspended, is another characteristic of homicidal hangings
(Fisher, 1993: 464; Püschel et al., 1984: 148). It is noted in the literature however, that in a
homicidal hanging scene made to appear as a suicide, the criminals placed a stepping aid next to
the victim (Radian and Radovici, 1957: 232). Therefore, the value of measurements taken at the
hanging scene is extremely important. In a scene described by Rooks, (1935: 106) the victim
was hanged from a ladder rung at such a height, and with such a short length of ligature, that
there was no possible way she could have climbed around from the front of the ladder to the back
and hanged herself. Careful measurements, combined with autopsy results, allowed investigators
to reconstruct the scene, resulting in a confession of murder (Rooks, 1935: 108).
The type of knot used in the ligature must also be examined, to determine if the victim
could have manufactured it (Püschel et al., 1984: 148). Mueller states that a complicated knot
that is “not compatible with the personality of the deceased” points to a homicidal hanging
(1932: 176). Similarly, a professional knot characteristic of a particular trade may aid in the
identification of the deceased, if they are unidentified at a suicidal hanging (Mueller, 1932: 176).
Mueller (1 932: 175) advocates for the importance the knot, as “nearly all of the different craft
professions use characteristic knot procedures” and advises removing the point of suspension,
without untying the ligature, and keeping this with the body, for later examination. Fisher (1993:
465) states that “in suicide by hanging, right-handed persons usually place the knot of the noose
on the right-hand side of the neck; left-handed persons place it on the left. Reversal of these
positions is suspicious”.
Materials such as hair or clothing caught inside the noose or knot are rarely seen in a
suicide (Püschel et al., 1984: 148). In the case of the post-mortem suspension of the woman in
13

her closet, a slip-knot was used that contained clumps of the victim’s hair, an indication that this
was not a suicidal hanging (Simon, 1998: 1120). Similarly, a hair bundle was found in the
ligature of a post-mortem suspension of a woman., by her husband, from a door handle
(Weimann, 1929: 139). Other cases have found a shirt collar (Boltz, 1956: 133), and head
coverings (Rooks, 1935: 106; Klauer, 1933: 376) caught under the ligature around the neck.
Therefore, careful analysis of the ligature and knots used can yield important information that
death may have been a homicide.
Homicidal hangings are also suspected when the victim is tied up, however it is possible
to find a bound victim in a suicide (Püschel et al., 1984: 148-149; Leth and Vesterby, 1997: 69),
and often a reconstruction is required to determine if the victim could have hung themselves in
that posit ion.
Determining if the suspension of the hanging victim occurred before or after death, is
another important factor in differentiating a homicidal hanging from a suicidal hanging (Leth and
Vesterby, 1997: 68; Vieira et al., 1988: 288). Lividity in hanging cases is present in the feet,
legs, and hands (Fisher, 1993: 465). The distribution of lividity at the scene should correspond
to the hanging position, or it may indicate the post-mortem suspension of an individual (Jaffe,
1999: 148). Similarly, the position of the limbs after the onset of rigor mortis should correspond
to the body’s hanging position (Fisher, 1993: 465). Other pathological evidence, as reviewed in
Phase I, (Nicholls, 2000) also provides an indication of whether the individual was alive at the
time of suspension.
Examination of the suspension point and the ligature at the scene will provide further
evidence of the type of death that has taken place (Püschel et al., 1984: 148-149). According to
Popp, "the point of suspension has received too little attention, as far as the literature indicates”
14
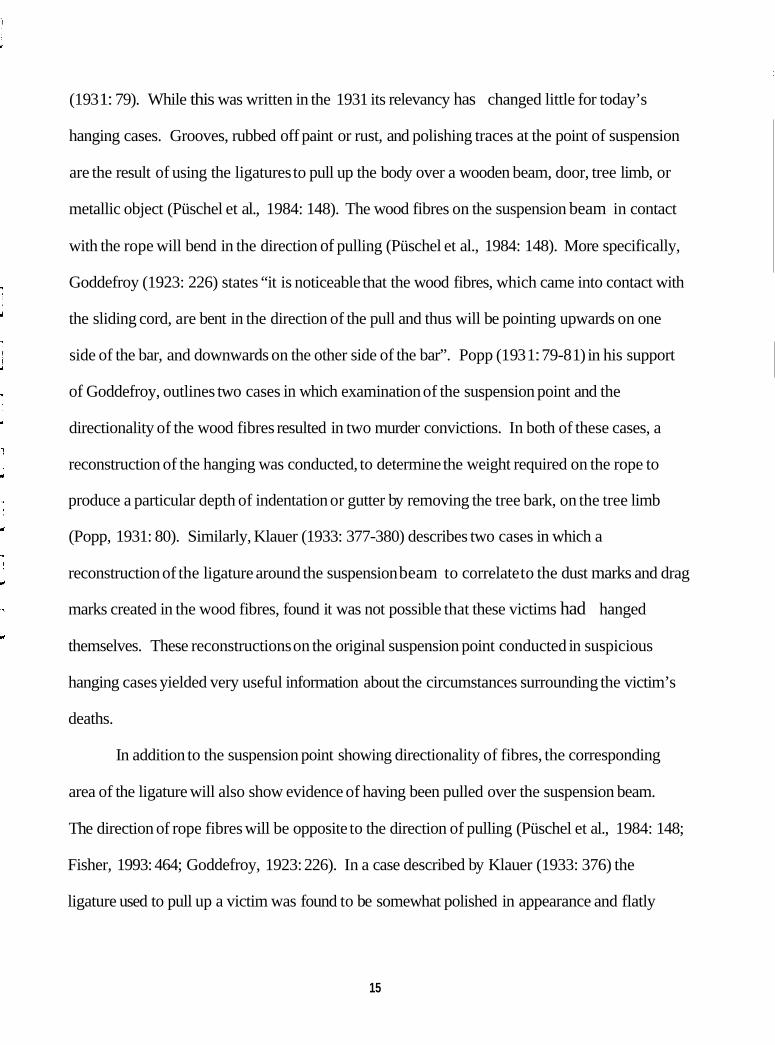
(1 93 1 : 79). While this was written in the 193 1 its relevancy has changed little for today’s
hanging cases. Grooves, rubbed off paint or rust, and polishing traces at the point of suspension
are the result of using the ligatures to pull up the body over a wooden beam, door, tree limb, or
metallic object (Püschel et al., 1984: 148). The wood fibres on the suspension beam in contact
with the rope will bend in the direction of pulling (Püschel et al., 1984: 148). More specifically,
Goddefroy (1923: 226) states “it is noticeable that the wood fibres, which came into contact with
the sliding cord, are bent in the direction of the pull and thus will be pointing upwards on one
side of the bar, and downwards on the other side of the bar”. Popp (1 93 1 : 79-8 1) in his support
of Goddefroy, outlines two cases in which examination of the suspension point and the
directionality of the wood fibres resulted in two murder convictions. In both of these cases, a
reconstruction of the hanging was conducted, to determine the weight required on the rope to
produce a particular depth of indentation or gutter by removing the tree bark, on the tree limb
(Popp, 1931: 80). Similarly, Klauer (1933: 377-380) describes two cases in which a
reconstruction of the ligature around the suspension beam to correlate to the dust marks and drag
marks created in the wood fibres, found it was not possible that these victims had hanged
themselves. These reconstructions on the original suspension point conducted in suspicious
hanging cases yielded very useful information about the circumstances surrounding the victim’s
deaths.
In addition to the suspension point showing directionality of fibres, the corresponding
area of the ligature will also show evidence of having been pulled over the suspension beam.
The direction of rope fibres will be opposite to the direction of pulling (Püschel et al., 1984: 148;
Fisher, 1993: 464; Goddefroy, 1923: 226). In a case described by Klauer (1933: 376) the
ligature used to pull up a victim was found to be somewhat polished in appearance and flatly
15

pressed at the areas in contact with the suspension point, the top of the bedroom door frame. In
addition, the fibres are likely to pick up some transfer material from the suspension point.
Mueller (1932: 177) describes a case in which the ligature was soiled with rust from the steel-
pipe over which the rope was drawn to hang the victim. This type of characterization is
important if the individual was moved or cut down after hanging, and the original suspension
point needs to be located or identified.
Thus, homicidal hanging death scenes often have very characteristic features that allow
for a confident determination of the circumstances surrounding death. To identify these features,
however, investigators should thoroughly document the scene, using notes, photographs, and
measurements, as a homicidal hanging scene may not be suspected until later, at which point the
original context of the scene is lost.
16

Purpose of Study
In a study of the Methods of Suicide used in Canada, between 1980 and 1982, hangings
accounted for 24.52% of male suicides and 18.87% of female suicides (Health Canada, 1994:
32). Between 1990 and 1992, hangings accounted for 30.83% of male suicides and 22.26% of
female suicides, an increase in this method of suicide, over the previous study completed ten
years earlier (Health Canada, 1994: 32). Suicidal hangings, therefore, are increasing in
frequency within Canada, and the death scenes of this type that scenes of crime officers and
identification officers encounter have correspondingly increased. Thus, it is important to be able
to distinguish, at sudden death scenes involving hangings, the physical evidence consistent with
a self-inflicted act, such as suicide or autoeroticism, from the physical evidence consistent with a
homicidal hanging.
Because homicidal hangings are so rare they pose a risk to investigators. As Püschel et
al., note “lack of precise examination at the hanging site poses the risk that an indictable offence
could go unnoticed” (Püschel et al., 1984: 141). The hypothesis of this study is that the physical
characteristics of suicidal hanging death scenes are different and distinguishable from homicidal
hanging death scenes, due to the differential treatment of the ligature and suspension beam at
each type of scene. Thus, the aim of this study (distinguished as Phase II), is to quantify and
qualify the physical features characteristic of homicidal hanging death scenes, typical of drag or
haul-up type hangings. Phase II of this study provides a comparison to the initial Phase I study
involving suicidal or drop-type hangings (called static falls). Phase II also examines the suicidal
type hanging trials alongside the homicidal-type hangings (called drags) to apply the knowledge
and experience gained from the trials in Phase I to improve the reliability of the study. The
results of this study will be useful to scenes of crime and identification officers, providing them
17

with characteristics to investigate the ligature, and suspension point of the hanging, and thereby
determine the manner of death with greater accuracy.
A necessity for this type of proactive research has already been demonstrated. The Metro
Toronto Police Services completed a few hanging trials in response to a coroner’s inquest into a
suspicious hanging death (Shearer, personal communication), however this is considered reactive
research.
This type of practical study in the field of suicidal and homicidal hangings has not been
found within the literature to have ever taken place. The closest that has been found in the
literature are German articles from the Criminology Archives (Archiv für Kriminologie) that
describe reconstructions of homicidal hanging scenes on the original suspension beams to
determine the circumstances surrounding the victim’s deaths, as previously mentioned (Popp,
193 1; Klauer, 1933). Thus, proactive research in this area is beneficial, for the suspicious
hanging deaths that are encountered, and for an understanding of how to improve hanging death
scene investigations.
18
Materials
The Gallows
Using the gallows that was constructed for Phase I of this project, modifications were
made by Staff Sergeant Pat Downey, to facilitate both the suicidal and homicidal type hanging
trials (refer to Nicholls, 2000 for original design). The main changes from the original design
involve the movement of the winch connected to the main rope (used to raise and lower the
“dummy”) to a post inside the gallows, and the addition of another winch, on an opposite post,
used for the homicidal type drag trials (Diagrams 1 and 2; Photos 1 and 2). The gallows was also
moved outside, and a new beam to suspend the pulley was added, increasing the height to 3.873
m (Diagram 1, Photo 3). The width and length remained the same, at 1.504 m wide and 1.581 m
long, respectively. Measurements were taken using the MM30 Laser measuring device.
Ligature ropes were looped three times around the suspension beam for static fall or
suicidal type hanging trials and the end was tied around two hooks drilled into the gallows,
allowing the rope to tighten upon itself during the hanging trial (Photo 4).
The “Crash Test Dummy"
To accurately portray the weight of human, a simulation male crash test dummy weighing
70.27 kg (1 54.6 lbs) was constructed using a burlap army bag filled with sand and dirt, and held
together with 1 " link chains (Photo 5). The chains were held around the bag with cable and
plastic ties, and joined at the top with a padlock, which was connected to a D-ring with a loop, in
turn connected to the spring-loaded clasp (Photo 6). The original crash test dummies used in
Phase I were returned to Transport Canada. In order to study a greater sample for data analysis,
19
the decision was made to limit this portion of the study to the heavier “male” weight, allowing
for more trials.
The Suspension Beams
Suspension beams used in the hanging trials were purchased from the Simcoe Block store
in Barrie. Kiln treated 2” x 4” x 8’ spruce boards were used, and each board was preformed to
uniform standards, routered on the two sides in contact with the hanging ligature, using a new ¼"
bit (Photo 7). This resulted in rounded edges that allowed the rope to pass over easier, and was a
uniform standard from which the indentation made by each hanging trial could be measured.
Hand clamps were used to affix each suspension beam to the main suspension beam of the
gallows. Each individual suspension beam could then be removed after a set of trials and
indentation depths measured.
The Ligatures
The ligature material chosen for the study was 3/8” three-strand twist polypropylene rope
(Photo 2). Polypropylene rope was chosen because it is a relatively common and inexpensive
rope, with intermediate stretch, that would likely not break or snap during hanging. In order to
study a greater sample for data analysis, this portion of the study was limited to this diameter of
rope, allowing for more trials.
For static fall trials, the rope was tied into the metal loop of the D-ring, using a noose
knot (Diagram 3, Photo 6) which tightened during hanging. The other end of the rope was
looped three times around the suspension beam and then tied off in the manner mentioned
20
previously, around the metal hooks. The amount of rope used for each ligature was enough to
facilitate a 0.5 m drop.
For the drag trials, the rope was looped into the winch and turned approximately eight
times, to wind it onto the spool (Photo 2). Then the remaining length of rope was tied off into
the metal loop of the D-ring attached to the dummy, and 0.5 m was measured on the rope to
determine the drag length.
The Digital Calipers
The digital calipers used for the entire study were Pro-Max Digital Calipers, made by
Fred V. Victor Fowler Company Incorporated (Photo 8). Each measurement was taken to the
two decimal places shown in the display of the calipers, equal to 1/100* of a millimeter. For
measurement of the indentation depth made in the wood suspension beams the squared end of
the depth armature portion of the caliper was used.
The Custom Designed Jig
To accurately measure the indentation depths made in the wood, a custom designed jig
was fashioned to hold the calipers in position, at a constant angle, during measurements
(Photo 9). It was constructed of a piece of angle iron, with another piece of metal welded on and
two nuts/bolts to tighten the calipers firmly against the jig. A hole was drilled into the angle iron
so that the squared end of the caliper could be viewed when measuring the depth of the
indentation.
21
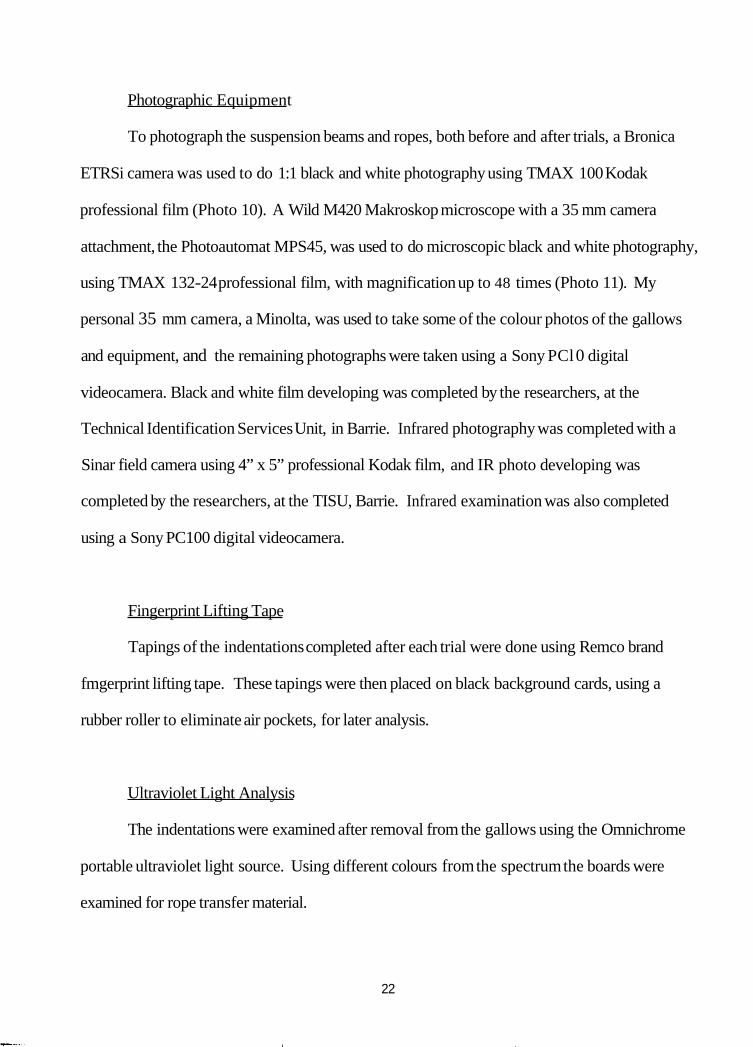
Photographic Equipment
To photograph the suspension beams and ropes, both before and after trials, a Bronica
ETRSi camera was used to do 1:1 black and white photography using TMAX 100 Kodak
professional film (Photo 10). A Wild M420 Makroskop microscope with a 35 mm camera
attachment, the Photoautomat MPS45, was used to do microscopic black and white photography,
using TMAX 132-24 professional film, with magnification up to 48 times (Photo 11). My
personal 35 mm camera, a Minolta, was used to take some of the colour photos of the gallows
and equipment, and the remaining photographs were taken using a Sony PCl 0 digital
videocamera. Black and white film developing was completed by the researchers, at the
Technical Identification Services Unit, in Barrie. Infrared photography was completed with a
Sinar field camera using 4” x 5” professional Kodak film, and IR photo developing was
completed by the researchers, at the TISU, Barrie. Infrared examination was also completed
using a Sony PC100 digital videocamera.
Fingerprint Lifting Tape
Tapings of the indentations completed after each trial were done using Remco brand
fmgerprint lifting tape. These tapings were then placed on black background cards, using a
rubber roller to eliminate air pockets, for later analysis.
Ultraviolet Light Analysis
The indentations were examined after removal from the gallows using the Omnichrome
portable ultraviolet light source. Using different colours from the spectrum the boards were
examined for rope transfer material.
22

Methods
Two types of trials were conducted in this study. The physical characteristics of the static
fall type of hanging, consistent with a suicide, and the drag type of hanging, consistent with a
homicide, were examined. For the hangings, each trial of 3/8" polypropylene rope was either
dropped or dragged 0.5 m, and fifteen trials of each type of hanging were conducted on the same
board. Seven and a half boards were used in the study, completing trials until there was no rope
left.
For each trial a new length of ligature rope was used. Each wood surface was
preconditioned to have rounded corners and even surfaces so deviations from the normal after
the hanging trials could be measured, and errors eliminated. One type of ligature knot was used
to hang the dummy (Diagram 3).
Control measurements of the boards, after routering, were taken prior to the hanging
trials, along both sides of the board, namely the “ligature” and “opposite” sides (Diagram 4).
This was completed using the custom designed jig and the digital calipers, and fifteen
measurements were taken along each side, along all eight boards. The five centimeters at each
end of the board was marked off and not used for control measurements or photographs. Three
photographs each at 1 : 1,8.75 times and 20 times magnification were taken at predetermined
areas on each board for control purposes. Similarly, fifteen photographs along a control section
of rope were taken at 30 cm intervals, to represent the condition of the original rope prior to
hanging trials.
23
The Static Fall Description
A complete static fall hanging trial, from start to finish, was a lengthy process. The
dummy was raised to the appropriate mark on the main rope, with the winch. A piece of rope for
the ligature was measured off and cut. This was tied around the metal loop of the D-ring, using
the noose knot. The other end of the ligature was looped three times around the suspension beam
and wrapped around the metal hooks.
The dummy was then raised using the winch to the correct height for the drop, and a
crowbar was used to unlock the spring-loaded clasp. The dummy fell 0.5 m, and a notation was
made as to the quality of the trial, or if any problems occurred. The main rope was lowered
using the winch and the clasp was inserted in the metal loop, and locked. The dummy was raised
to release the tension fiom the ligature rope and suspension beam, and the ligature knot was cut
off. This end of the rope was then immediately retied to designate it as closest to the dummy, for
orientation during later examinations. Using a black felt marker, the trial number was marked
directly on the suspension beam, under the indentation mark on the “ligature side”.
The points of compression on the first loop of ligature rope around the suspension beam
were marked between two pieces of red evidence tape, for later photographic analysis. The
ligature was removed fiom the suspension beam, and the rope was taped together into a bundle
in areas away from the rope in contact with the suspension beam, marked using the trial
identification system, and placed into a box.
A taping of the indentation area on the ligature side of the suspension beam was then
completed, using the fingerprint lifting tape. A piece of tape was removed fiom the roll and
placed over the curvature of the board, to encompass the ligature side of the indent. Using the
rubber roller, the tape was flattened to remove air bubbles and pick up as much transfer material
24
--,-
from the board and any rope fibres that may be present. The tape was then lifted off and placed
onto a black background card, using the roller to remove any air pockets. It was marked using
the trial identification system on the back, and stored for later analysis.
This process was then repeated for the next fourteen trials, and then the fifteen drag trials
were completed on the same board. After the thirty trials a new board was used.
The Drag Description
The drag trials using the second winch on the gallows, were completed to examine the
results of a simulation homicidal type hanging. Each drag trial was completed in between the
static fall trials, so that a completed board had an alternating set of thirty trials down its length.
The dummy was raised to the appropriate mark on the main rope. A piece of rope for the
ligature was measured off and cut. One end was placed in the winch and the handle was turned
approximately eight times, to wind some of the rope onto the winch. The free end was placed
over the suspension beam, and tied off around the metal loop of the D-ring, using the noose knot.
Using the winch, the slack in the rope was taken up, until it was just taught, with one person
making sure the rope did not touch the suspension beam during this process. Using a black felt
marker, the rope was marked with a 0.5 m increment, just under the suspension beam on the
ligature side, and using the winch, was cranked or dragged up exactly this distance.
To release the tension on the ligature rope and suspension beam, the other winch was
used to take up the slack created on the main rope and raise the dummy slightly, so the ligature
rope could be cut off. This end of the rope was then immediately retied to designate it as closest
to the dummy. Using a black felt marker, the trial number was marked directly onto the
suspension beam, under the indentation mark on the ligature side. The ligature was removed
25
fiom the suspension beam and taped together into a bundle in areas away fiom the rope that was
in contact with the suspension beam, marked with tape using the trial identification system, and
placed into a box.
A taping of the indentation area on the ligature side of the suspension beam was then
completed, using the fingerprint lifting tape. A piece of tape was removed from the roll and
placed over the curvature of the board, to encompass the ligature side of the indent. Using the
rubber roller, the tape was flattened to remove air bubbles and pick up as much transfer material
fiom the board and any rope fibres that may be present. The tape was then lifted off and placed
onto a black background card, using the roller to remove any air pockets. It was marked using
the trial identification system on the back, and stored for later analysis. This process was then
repeated for the next fourteen trials.
After a set of trials was completed, the suspension beam was removed fiom the gallows,
and measurements of the indentations on both the ligature and opposite sides were taken using
the digital calipers and custom designed jig. Three measurements were taken at the deepest part
of the indentation mark on both sides. These measurements allowed for a comparison of the
depth of the indentations created during each type of trial. Examination for rope transfer onto
the boards and indentations was completed using the Omnichrome portable ultraviolet light after
completion of the trials.
The tapings taken during each trial were examined under the microscope at varying
magnifications for rope fibre transfer material. The tapings were then scanned into a computer
using a Hewlett Packard ScanJet 4C scanner, and brought up into Autosketch version 2.1, a
drawing software. In this program, the tapings were analyzed by drawing a free-hand perimeter
26

around the outline of the indentation (Diagram 5), and asking the software to calculate the area
(cm²) and perimeter (cm) of each trial (Diagram 5 ) on the ligature side. This allowed for
comparison of the differences between the static fall and drag trials in the size of the indentation.
Photographs at the macro (1 : 1) and microscopic levels were also completed after the
trials, on both the ropes and boards, to demonstrate the changes that take place after a hanging
trial. Infiared photographs of the indentations on the boards were completed at the 1 : 1 level, and
the indentations were also examined using the IR light attachment of the PC100 digital video
camera.
Trial Identification System
To identify each trial, suspension beam indentation, and ligature rope, a letter and number
system of identification was devised. Each trial was given a board identifier (ie. B#l, B#2, etc)
and a number/letter system to distinguish between static falls and drags. Static falls were
designated using the letter “a” and drags were designated using the letter "b". Therefore, for
each board there were fifteen static fall trials numbered 1 a to 15a, and fifteen drag trials
numbered 1 b to 15b. For example, B#3-7a would designate the seventh static fall trial on board
number three.
27
Results
Observations
Omnichrome
After trials were completed on Board #1 and #2, the indentations were looked at under
different colours of the ultraviolet spectrum using the Omnichrome portable UV light source. It
was hypothesized that rope fibres broken off of the ligature during the hanging trials may be
more readily visible under this light source, if they were not picked up by the tapings. However,
no fibres were observed for either Board #1 or #2, and this test was dropped from the remainder
of the trials.
Infrared Photos and Light
Using both Infrared photography and an IR light source from the Sony PC 100 digital
videocamera, the indentations were examined for rope fibres and more visible grooves or
striations caused in the wood surface by the passage of the individual rope fibres over the wood.
Neither the photographs nor the IR light source yielded any remarkable results, and these tests
were subsequently dropped from the remainder of the trials.
Indentation Tapings
Initially the tapings were taken with the idea of counting the number of rope fibres
transferred on the ligature side of the indentation during the hanging trials, using the Wild
microscope. Three 1 cm² blocks were to be counted across each taping and a tally of the number
of fibres in each block would be kept, to determine where the fibres were more likely to be
found, and in what numbers. However, it was often not possible to distinguish rope fibres from
28
L the wood fibres that were also picked up during the taping or any other fibres (i.e. clothing fibres
or dust) that may have adhered to the board, and subsequently the taping. Although many efforts
were made to keep the boards free from outside fibres and contamination, a few red and blue
fibres were observed, and the yellow polypropylene fibres were difficult to distinguish. This test
was subsequently dropped from the remainder of the trials, as it was very time consuming and
yielded poor results. The indentations were still taped, however, as the calculation of the area
and perimeter using the Autosketch program, was an important discovery to the project (see
Description of Results, below).
Cross-Section Analysis
A sample board was taken for analysis to Dr. Paul Cooper, University of Toronto,
Faculty of Forestry. He examined the indentations under a higher power microscope, but was
unable to observe anything beyond what had already been discovered about the indentations. He
did, however, have the idea to cut through the cross-section of the indentation using a band saw.
Dr. Cooper observed that the “densification” or compression of the wood tissue is greater in the
static fall trials and similarly, that significant "failure" or breakage of the wood layers is only
evident in the static fall trials. The drag trials exhibit minimal to no observable failure.
In the control photograph of the cross-section of wood after routering, no densification is
observed (Photo 12). In comparison, the cross-section of the ligature side of a static fall trial
(Photo 13) is observed to have the greatest amount of densification. Similarly the densification
on the opposite side of the static fall trial is also quite apparent (Photo 14). The cross-section of
the opposite side of a drag trial is pictured in Photo 15, and shows minimal densification of the
wood layers, and a very small indentation, while surprisingly, the ligature side (Photo 16) of the
29
drag trial has hardly any visible densification. This result was unexpected, as it was
hypothesized that the ligature side of the drag trials, closest to the dummy, would bear more of
the weight than the opposite side, however the reverse appears to be true.
Examples of failure in the wood layers, or fracture, of the wood during a static fall is
evident in Photos 17 and 18, where there is a much deeper indentation. This visual characteristic
is only observed to be remarkable in the static fall trials.
Dr. Cooper also suggested examining a thin section of the indentation cross-section, to
determine if there were changes at the cellular level of the wood due to the different types of
hanging trials. After softening the wood with a drop of water, he used an Exacto knife to remove
a thin strip of the wood and then placed a droplet of phloroglucinol on the wood, and mounted it
on a slide. Phloroglucinol is a liquid that stains the lignin in the wood cells red/pink for
observation under a transmission light microscope. Examining the samples that Dr. Cooper
created, we were unable to observe anything remarkable that was characteristic of either a static
fall or drag trial, at the cellular level. It was also difficult to know if any changes were due to the
cutting action of the Exacto blade. Changes at the cellular level are still being examined using
different cutting methods, as are calculations of the area of densification in the cross-section to
characterize a static fall from a drag trial (refer to Webster, 2001 for results).
Dr. Cooper also remarked that the indentations on these types of treated wood boards, if
exposed to a significant amount of water, will rehydrate and the wood will bounce back,
appearing as if there was never an indentation there. This is an important observation for
hanging scenes that may become exposed to rain water (such as in the doorway of a barn or
garage), and in cases such as these, the information should be recorded, and if necessary,
30

preserved by covering with plastic to keep the water off. He noted that this does not apply to
trees, as they are living, so they will retain their shape and damage despite being wet.
Photographic Analysis of Indentations
Representative control photographs of the boards prior to the hanging trials were taken at
the 1 : 1 level (Photos 19-21) and at higher magnification (Photo 22) to represent the condition of
the wood prior to the hanging trials. In comparison, representative examples of static fall
indentations on the ligature side at the 1 : 1 level are Photos 23 and 24. Note the deep indentation
and failure of the wood layers, seen better in Photo 25, under 8.75x magnification. An example
of the opposite side of a static fall indentation at the 1 :1 level is Photo 26; it is notably shallower
and has less significant fracture of the wood.
Representative examples of drag indentations on the ligature side, at the 1 : 1 level, are in
Photos 27 and 28, while an example of the opposite side, which appears to be deeper, is Photo
29. The amount of failure of the wood layers in a drag trial is observed at 8.75x magnification,
but is very minimal (Photo 30).
The striations in the indentations evident at the 20x magnification level, caused by the
passage of the individual rope fibres over the board during the trials, seem to be virtually
indistinguishable between the two types of trials (Photos 3 1 and 32).
A double or triple indentation was also sometimes observed, but only in the static fall
trials due to the rope being looped three times around the suspension beam (Photo 33). Each
successive indentation was shallower than the previous, and often the third, if visible, was very
faint. Multiple indentations were not observed in the drag trials, as the rope only passed once
over the suspension beam. It is important to note however, that ifa victim was dragged up and
31

then tied around the suspension beam, it is possible that multiple indentations may appear,
especially if they are left hanging for a length of time.
Photographic Analysis of Wood Fibre Directionality
As stated by Goddefroy (1 923: 226- 227), a suicidal hanging will exhibit "wood fibres
directed . . .downward on both sides", while a homicidal drag type hanging will exhibit "wood
fibres.. . bent in the direction of the pull.. .upwards on one side.. .downwards on the other side".
This directionality of wood fibres on the suspension beams was observed to be true and was
recorded photographically.
Examples of broken wood and fibres directed downward on the ligature side of the static
falls are seen in Photos 34-39. Examples of fibres directed downward on the opposite side of the
static falls are seen in Photos 40 and 41.
Fibres directed upwards on the ligature side of the drag trials are observed in Photos 42
and 43. Downward directed wood fibres on the opposite side of the drags are observed in Photos
44-46.
Photographic Analysis of Rope Fibres
Representative photographs of the selected control rope are observed in Photos 47 and
48, at the 1 :1 level, showing a clean, new length of rope. The control rope at 8.75x
magnification is Photo 49, and at 20x magnification is Photo 50.
In comparison, the compression or flattening and filamentation or breakage of the rope
fibres, in a static fall trial rope is observed in Photos 5 1 and 52. The filamentation and flattening
32

of the rope fibres in a drag trial is somewhat similar, (Photos 53-55), however the extent to
which the rope fibres are compressed in a static fall is much greater due to the force.
The best indicator of directionality in the trials was exhibited by the drag trial ropes,
which often had snags in the length of rope that had passed over the suspension beam. An
example of this is Photo 56, in which an individual fibre has been pulled out of the bundle of
strands by the wood, and the close up of the snagged fibres’ origin within the strand is Photo 57.
These snags were the best indicator of directionality as they retained their positions after removal
fiom the suspension beam, in the direction in which they had been pulled out.
Surprisingly in the drag trials, little transfer material fiom the wood of the suspension
beam was observed, but in the static fall trials at the points of the first loop the most transferred
wood splinters were seen.
An example of a rope fibre found within a drag indentation, rarely observed in either type
of trials, was photographed at 20x magnification (Photo 58).
Raw Data
The numerical results of this study rest on four kinds of collected data from the hanging
trials - depth of the indentation produced by the hanging trials, on the ligature and opposite
sides, and calculation of the area and perimeter of the indentation tapings from each trial. The
raw data of area calculations fiom the Autosketch program is in the descriptive statistics of
Appendix G. The raw data of perimeter calculations fiom the Autosketch program is in the
descriptive statistics of Appendix G. The raw data collected fiom the fifteen control
measurements taken on each side of the board is in the control descriptive statistics in Appendix
33

G. The raw data collected from the indentation measurements is in the descriptive statistics in
Appendix G.
To calculate the maximum indentation depth on either the ligature or opposite side, the
fifteen control measurements were averaged and subtracted from the average of the indentation
measurements on that side, and then the standard deviation was recalculated using the formula: I
Statistical Methods
Statistical calculations were completed on the Minitab Statistical Software package,
Enhanced Version, Release 9.1 for Sun. Raw data was entered into the program, and descriptive
statistics were calculated. Minitab uses the sample standard deviation to calculate deviation from
the mean.
Summary statistics of the area (Tables 2 and 3) and perimeter (Tables 4 and 5)
measurements of the indentation tapings are within Appendix C. Summary tables of the
descriptive statistics of the control board measurements (Tables 6 and 7) and the calculated
maximum indentation depth, after subtraction of the control measurement and recalculation of
the combined standard deviations (the true indentation depths recorded for each board) are in
Tables 8-1 1. The indentation measurements prior to subtraction of the control measurements
(Tables 12- 15) are also contained within Appendix C. The mean and standard deviations of each
set of measurements were plotted in Charts 1 - 40, within Appendix D.
34
C
Description of Results for Area Measurements of Indentation Tapings
It was expected that the force generated in a 0.5 m static fall hanging would be greater
than that generated during the drag hanging, thereby creating a larger indentation in overall area
on the ligature side. This general trend was observed for all boards (Charts 1 and 2), and was
statistically significant for all boards (Charts 3-7 and 9-10), except Board 6 (Chart 8). For static
fall trials the mean area of the indentation tapings ranged from 3.290 ± 0.877 cm² to 6.135 ±
1.202 cm², while the mean area of the drag indentation tapings ranged from 1.8258 f 0.3692 cm²
to 3.613 ± 0.747 cm² While there is some overlap in the calculated areas, the static fall
calculations are generally much larger, providing an important criteria to investigate suicidal
from homicidal hangings. If a taping of the indentation is taken at a scene, and a reconstruction
of a suicidal type hanging is completed on the original suspension beam, and another taping is
taken, the comparison of indentation area between the two hangings will provide good criteria to
distinguish a suspicious hanging death.
Description of Results for Perimeter Measurements of Indentation Tapings
Similar to the area calculations, it was expected that the force generated in a 0.5 m static
fall hanging would be greater than that generated during the drag hanging, thereby creating a
larger indentation in overall perimeter size on the ligature side. This general trend was observed
for all boards (Charts 11 and 12), and statistically significant for six boards (Charts 13-14, 16-17,
19-20), however not Board 3 (Chart 15) or Board 6 (Chart 18). For the static fall trials the mean
perimeter of the indentation tapings ranged from 9.524 ± 1.824 cm to 13.180 ± 1.132 cm, while
the mean perimeter of the drag indentation tapings ranged from 6.436 ± 1.601 cm to 8.84 ± 1.01 1
35

cm. Similar to the area results, there is an overlap, but the static fall calculations are generally
much larger for the perimeters of the indentations.
The calculation of the perimeter measurements would be more remarkable if the standard
deviations could be decreased. This requires more practice with the Autosketch program, and
careful collection of the perimeter of the indentation, perhaps by using the roller with more
pressure, during the taping process, to collect the most information possible, Similar to the area
calculation, if a comparative hanging is conducted, the calculation of the perimeter measurement
provides another important characteristic to distinguish a suspicious hanging death, and could
quickly be approximated using a ruler, without software such as Autosketch.
Description of Results for Indentation Depth Measurements
An analysis of the Control measurements taken prior to the hanging trials shows that the
routering process is indeed a relatively accurate method of maintaining control across the boards
(Charts 21 and 22). The initial depths for both the ligature and opposite sides of all boards are all
approximately the same, suggesting that all boards were routered to be approximately the same
evenness and height, as measured by the custom designed jig and digital calipers.
It was expected that due to the force generated by the static fall hangings, the indentation
depths created would be deeper in these hangings, than the drag hangings. This general trend
was observed for all boards (Charts 25-40) and was statistically significant for both the ligature
and opposite sides, when comparing the static fall trials to the drag trials, for all boards. This
result demonstrates that at the 0.5 m height, there is a significant difference in indentation depth
created as a result of the rope being treated differently during the two types of hanging trials.
36
In comparison to the results of Phase 1 (Nicholls, 2000), which found that the weight of
the crash test dummy could not be correlated to a particular indentation depth, it is possible from
this set of results to correlate the indentation depth to treatment of the ligature in the different
types of trials. This result is one of the most important characteristics for distinguishing a static
fall from a drag trial, as results indicate that for the ligature side of static fall trials there are no
average indentation depths less than 1.464 ± 0.0660 mm (Board 6, Chart 35), while for the drag
trials on the ligature side there are no average indentation depths greater than 1.1322 ± 0.0564
mm (Board 8, Chart 39).
The static fall trials compare well to the result demonstrated for 3/8"polypropylene rope
in Chart 45 of Phase I of the project (Nicholls, 2000). Using a slightly lighter male dummy (68.1
kg), and fifteen 0.5 m static fall hanging trials, the ligature side indentation was measured to be
2.2843 ± 0.3028 mm, falling within the average range of ligature side indentations recorded for
all the static fall trials completed in Phase 2, from 1.4674 ± 0.0660 mm (Board 6) to 4.28 17 ±
0.1 133 mm (Board 5) (Chart 23). Thus, this comparison shows that using the same rope type
and roughly the same weight of dummy, the same results were obtained for different board types
(i.e. lumber yard versus scrap wood) and dummy styles (i.e. crash test dummy versus weighted
burlap bag), illustrating continuity across both studies.
It was expected that the force generated by the dummy during both types of hangings
would be concentrated primarily on the ligature side. This was found to be the general trend
upon comparing the ligature and opposite sides for all the static fall trials (Chart 23). For all
boards the ligature side of the static falls was significantly deeper than the opposite side, with the
exception of Board 6, in which the opposite side was slightly deeper, although not significantly
so. Contrary to expectations, however, the general trend in the drag trials was for the opposite
37
side indentation to be deeper, and this was significant in five boards (Chart 24). Therefore, this
suggests that the opposite side supports a greater amount of the force during the drag trial, a
finding that is contrary both to the expectations of the trial and to the findings of the static falls.
This result is an important characteristic if measurements of indentations reveal the opposite side
is deeper than the ligature side, the hanging should be further investigated as potentially
suspicious.
OMMPAC Survey
A survey of the sudden death hanging cases from 1999 and 1998 was conducted, using
the OPP OMMPAC system and case files from Central Region, investigated by the Technical
Identification Services Unit (TISU) in Barrie. Cases were selected that involved hanging as part
of the mode of death, and those investigated by the Peterborough TISU were omitted, as their
files could not be accessed. The survey involved recording as much information as possible
from both the case file and the OMPPAC system, which records the investigating officers’ notes.
Based on characteristics that have been studied in both Phase I and Phase 2 of this project, the
survey was set up to determine how investigators have recorded these scenes and whether the
key characteristics such as ropes, knots, and suspension points were examined. Twenty-eight
characteristics were recorded.
Survey Characteristics
The survey, in Appendix E, records what ‘type of hanging’ the coroner determined the
death to be. ‘Location of hanging’ is the place where the victim was found hanging. ‘Stepping
aids’ located near to the point of hanging were recorded in column three. The ‘suspension point
38
type’ is the material that the ligature and body are found hanging from The ‘ligature type’ is the
material used to hang the victim. The ‘knot type’ used on the ligature around the neck was
recorded, if the ligature was a rope or other material that could be tied. The ‘knot location’ is the
placement on the neck. 'Hair/clothing caught in ligature’ describes if any materials were caught
in the ligature around the neck. ‘Complete or incomplete suspension’ describes if the victim was
fully hanging off the ground or not. ‘Suicide note’ describes if a note was found at the scene or
not. 'Dirt/dust' describes if the victim had any dirt or dust on them at the time of discovery.
‘Grooves’ describes if the suspension point was examined for indentation marks or
grooves created by the hanging. Similarly ‘Fibres’ describes if the rope or suspension point was
examined for fibre directionality. ‘Drag marks’ and ‘Signs of struggle’ describe the general
nature of the scene, and whether any observations indicate the victim was dragged or involved in
a struggle. ‘Measurements taken’ records whether the investigating officers took any
measurements at the scene. ‘Photographs’ records whether any officers took any photos at the
scene. ‘Main evidence’ describes the main pieces of evidence seized at the scene or autopsy.
‘Evidence kept’ describes whether the report states where or for how long the evidence was kept.
‘PM attended’ describes whether the Identification Unit or SOCO officer attended the
autopsy of the victim. ‘Weight’ and ‘height’ describe if these measurements were taken at
autopsy or approximated at the scene. ‘Lividity’ and ‘Rigor mortis’ describe the condition of the
body at the scene or at autopsy. ‘Cause of death’ is the cause determined by the pathologist at
autopsy. ‘Other injuries’ describes any other remarkable injuries the victim may have had at the
time of discovery or at autopsy. ‘SOCO or Ident’ describes which level of investigating officer
attended the scene, either Scenes of Crime Officer or Identification Unit. ‘Suspicious Case’
describes if any characteristics recorded reflect a potentially suspicious hanging death, and if so,
39
which characteristics. "NR" within the survey table means that the trait for that case was ‘not
recorded’ on either the OMPPAC system or within the case file folder.
1998 Survey Results
In 1998, Barrie TISU investigated nine sudden deaths involving hangings (Appendix E).
All were ruled to be suicidal, and five of the nine hangings occurred outside, using tree limbs as
the suspension point. In four cases the existence of a stepping aid near the location of hanging
was not recorded. Six cases used a type of rope as the ligature, but in none of the cases was the
type of knot recorded. Case #3 was the only case to have recorded the location of the knot, at the
right of the neck towards the back. Interestingly, in Case #2, the left glove of the victim was
caught under the ligature around the neck, found hanging from a tree limb. This case was the
only one of nine in which a material was recorded under the ligature. In six of the nine cases,
complete or incomplete suspension was not recorded. A suicide note was found in six cases, not
found in two cases, and not recorded at all in one case. In both Cases #1 and #2 the victim was
found to have bark on their pants, as they had apparently climbed trees to hang themselves from
the limbs. Observations were not recorded for the remaining seven cases.
In the categories of grooves, fibres, and drag marks, no observations were recorded for
any of the cases, suggesting that none of these factors were examined during the investigations.
In six of the cases, officers reported that there were no signs of a struggle at the scene, however
this information was not recorded at the remaining scenes. Similarly, in six cases measurements
were taken, however in three cases this information was not recorded. In all nine hanging deaths
photographs were taken, and the ligature was seized as evidence, often along with biological
samples taken at autopsy. In only one case, however, was information recorded as to the
40
location or status of the evidence seized, and in this case (#4) it was destroyed. Eight of the nine
cases had either an Ident officer or SOCO officer attend the post mortem, however, in one
sudden death hanging case an autopsy was not conducted, therefore no cause of death or other
injuries were reported. Case #3 was the only case in which the weight, height, and lividity of the
victim were recorded. In two cases the victim had rigor mortis, in one case the victim was
frozen, and in the remaining six cases this characteristic was not recorded. The cause of death in
the eight cases that had an autopsy was determined to be asphyxia, and in six of these cases no
other injuries were apparent. Identification officers from the Barrie TISU attended all of these
cases in 1998.
Overall, based on this analysis, the most suspicious case from the nine would be Case #2,
as the glove being caught under the ligature next to the neck is very characteristic of a homicidal
hanging. The bark on the pants of the victim in this case, however, is likely indicative of the
victim climbing the tree and attaching the ligature to the limb himself or herself. Case #4 was
interesting as the victim was found to be twenty feet off the ground, with no stepping aids (i.e. a
ladder) present to assist this hanging, and no record of any bark on the pants. Case #5 was also
unique in that a post-mortem was not conducted, therefore this case is missing all of the
associated information that arises out of this type of examination, including a cause of death.
1999 Survey Results
In 1999, Barrie TISU investigated seven sudden death hanging cases (Appendix E). All
seven cases were found to be suicidal hangings, as ruled by the coroner, and in comparison to
1998, only two hangings were from tree limbs outside, while the remainders were inside the
house or garage. The use of stepping aids to facilitate the hanging was not recorded in three
41
cases, and in two cases no stepping aid was found. Six of the seven ligatures were ropes or tie
down cords, but the knot type was not recorded in any of the cases. The knot location in Case #1
was found to be on the right side of the neck under the ear of the victim, but was not reported for
the remainder of the cases. Materials such as hair or clothing caught in the ligature around the
neck were not recorded for any of the cases, and only in three cases was complete or incomplete
suspension recorded. Any observance of a suicide note was not recorded for five of the seven
hangings, and for all nine cases disturbances of dirt/dust were not recorded.
Details of grooves over the suspension beam and fibre transfer onto the ligature were
recorded only in Case #7, by a very observant Identification officer, as this was the only case
from all hangings surveyed to have both observations and photographs of these characteristics.
Incidence of drag marks was not reported for any case. There were no signs of a struggle in two
cases, and in the remaining five no observations were recorded. In five cases measurements
were taken at the scene, however, in the other two cases it was not recorded whether
measurements were taken. Photographs were taken in all cases, and in six cases the ligature
formed part of the main evidence seized, along with other items such as bio samples, drugs, and
a rifle. Case #4 however had no record of any evidence being seized. In five of seven hangings,
the location or length of time the evidence was kept was not recorded. In five of the cases the
post-mortem was attended by an officer from the Barrie TISU, in one case a SOCO officer
attended, and in one case it was not indicated that the autopsy was attended at all. In Case #1 the
weight and height of the victim was recorded, likely because the identity of the individual was
initially unknown, but was not recorded for the remaining six cases. Lividity was present in five
of seven cases, not recorded for the other two cases, and rigor mortis was only present in one
case, one victim was frozen outside, and this characteristic was not recorded for the remainder of
42

the cases. Cause of death was due to asphyxiation in all cases, except Case #6, where death was
caused by a gunshot wound. Other injuries were not present in five cases, not recorded in one
case, and only a skin abrasion and gunshot wound were noted for the others. The Barrie TISU
attended all of the hanging scenes except for Case #4 in which a SOCO officer attended the
scene.
Overall, based on this analysis of scene characteristics, the most suspicious case from
these seven would be Case #6. The circumstances are very different, due to the apparent self-
inflicted gunshot wound and then subsequent hanging, and because of this rarity the ligature and
suspension beam should have been examined. The circumstances surrounding Cases #1 and #5
are also very interesting. In Case #1 the victim was initially unidentified, and in Case #5 a
hostile homeless individual was found trespassing near the hanging scene, but stated that he/she
had not observed or encountered the victim in the days prior to the hanging, Thus, other
circumstances make these cases somewhat suspicious, however, as much of the information
required to raise suspicions in all of the cases was often not recorded by the investigating
officers, it is difficult to judge the characteristics for validity.
43

Discussion
Summary of Results
Phase I of the project examined static fall trials exclusively, using two different sizes of
polypropylene rope, and two different dummy weights, with three different drop heights. Results
from the examination of ropes after hanging trials indicated that it was not possible to correlate a
particular amount of rope compression to determine a drop height or to determine an individual’s
weight. Remeasurement of the ropes after a period of time to determine relaxation concluded
there is the possibility of change in diameter of the rope over time, and that measurements of the
rope taken at a time after the initial hanging scene would not be representative of the original
conditions at the scene. Thus, while this was an important discovery, Phase II data collection
focused more on fibre directionality and rope diameter measurements were not collected, instead
photographs were taken to provide a macroscopic analysis.
Indentation measurements of the static fall trials on the ligature side of the boards in
Phase I determined that as drop height increased, the indentation depths also increased, up to 1 .0
m and then decreased at the 1.5 m drop height. It was also found that because a particular depth
of indentation could not be correlated to a particular weight, that it must be determined upon
investigation whether the individual committed suicide or was the victim of a post-mortem
suspension, as the depths were not significantly different between the weights. To collect a
greater volume of data, Phase II focused on only one weight, one rope diameter and one drop
height, to determine the differences in indentation depth between suicidal type and homicidal
type hangings.
Phase II data collection considered a greater range of data collection methods, including
photography, both macro and microscopic, tapings, and measurements of indentations. Attempts
44

were made to use other instrumentation, such as the Omnichrome ultraviolet light and infrared
lights, and to involve a multi-disciplinary investigation, using specialists such as Dr. Cooper, as
in the examination of the cross-section of the indentations, both at the macroscopic and cellular
level. This may ultimately prove to be an important part of the investigative process of sudden
death hanging scenes, when more conclusive results are determined (Webster, 2001).
Phase II observational results (Table 1) indicate that at the macroscopic level, the amount
of densification of the wood, in a cross-section of the indentation, is much greater in the static
fall trials than the drag trials. The same result was found for the amount of visible failure in the
wood layers. Additionally, it appeared that the densification was greater on the opposite side of
the drag trials, than the ligature side, and the reverse appeared to be true for the static fall trials.
Once more conclusive calculations are made, this opposing characteristic will provide another
method to evaluate suspicious hanging death scenes.
Observation of the indentations at the macro and microscopic level, revealed differences
in the amount of wood failure, as previously mentioned, and in the depth of the indentations
between the static fall and drag trials, as proved by measurements. Analysis of wood fibre
directionality was found to be consistent with Goddefroy's assessment of the rope passing over
the suspension beam (1 923: 226-227) - that in the suicidal type hangings the fibres were directed
downward on both the ligature and opposite sides, while in the drag hangings the fibres were
directed upwards on the ligature side and downwards on the opposite side (Table 1). The best
indicator of rope fibre directionality in the drag trials was found to be the snags pulled out by the
wood of the suspension beam, which retained their positions after removal from the suspension
beam.
45

Quantitative measurements from the tapings yielded the result that both the area and
perimeter of the ligature side of the indentations were generally larger for static fall trials, than
for drag trials. Similarly, the depth of indentations calculated using the jig and digital calipers
resulted in statistically significant differences between the static fall and drag trials, for both
ligature and opposite sides, with the static fall trials being significantly deeper than the drag
trials. In addition, measurement of the indentation depths confirmed the visual result that the
ligature side was deeper for the static fall trials, and shallower for the drag trials.
A survey of 1998 and 1999 sudden death cases involving hangings, investigated by the
Barrie Technical Identification Services Unit revealed that some pieces of critical information at
the scene are often not recorded. Based on the results of this project and traits characteristic to
each type of hanging scene (i.e. suicidal or homicidal), reviewed in the Introduction sections of
Phase I and II, twenty-eight traits were examined for the sixteen cases reviewed in the survey. In
six of the nine cases in 1998, 50% or greater (13 or more traits, not including the ‘SOCO or
Ident’ and ‘Suspicious Case’ columns) of the traits were missing from the OMPPAC report and
case file. In four of the seven cases in 1999, 50% or greater of the traits were missing. It must
be noted however, that the OMPPAC system is a database management system, and not intended
to be a comprehensive record management system Despite this, some officers’ notes were
reviewed, and pieces of information were still missing from their notes. The results of this
survey indicate that there are differences in the amount and type of notes taken at scenes by
different officers, and also likely some lack of knowledge of some of the key characteristics that
distinguish homicidal hangings, probably because they occur so rarely. It is precisely for this
reason that Püschel(l984: 141) advocates for a thorough examination of the hanging scene, and
studies like this allow for review and education of characteristics.
46

TABLE 1. PHASE II RESULTS - COMPARATIVE SUMMARY.
SUICIDAL STATIC FALL HANGING HOMICIDAL DRAG HANGING Deeper indentations in suspension beam Significantly shallower indentations Taping area and perimeter calculations Taping area and perimeter calculations larger, on ligature side Wood fibres directed down on ligature side and down on opposite side Densification and failure of wood layers Minimal to no observable densification and greater in cross-section failure
• Rope compression and filamentation in Some filamentation of rope fibres; snags in areas where first loop of ligature contacts suspension beam over suspension beam
smaller, on ligature side Wood fibres directed up on ligature side and down on opposite side
rope provide directionality of rope drag
Implications for Education of Hanging Death Scene Investigations
As a result of Phases I and II of this study, criteria for education of the physical
characteristics to investigate sudden death hanging scenes have been reevaluated in accordance
with the potential for distinguishing a homicide. To facilitate this, a data form has been created,
described below, that outlines the criteria that should be recorded and examined at a suspicious
sudden death hanging scene (Appendix F). It is also important to determine the circumstances
surrounding the scene, by speaking to the witness who may have cut the victim down, for
example, as they may have information regarding how the victim was hanging or whether they
were fully suspended. In suspicious cases, or where circumstances seem suspect, it only takes a
few more minutes to be complete and thorough in the investigation of the scene.
A. Scene Observations
Observations recorded at the scene of a suspicious hanging death are not that different
from any other hanging death, however more focus should be concentrated on the ligature, knot,
suspension point, and the associated indentation marks and potential for fibre directionality.
Knot types and location should be recorded, as well as any material caught beneath the ligature,
47

an important characteristic of homicidal hangings. Signs of a struggle or dirt/dust disturbed at
the scene or on the victim are other indicators of a possible homicide. After the ligature has been
recorded, sketched, and removed, the indentations on the suspension point should be described,
photographed, and measured for depth. The same should be completed for control areas away
from the hanging area along the same suspension point, to provide a comparison. Any fibre
direction on the suspension beam should be recorded for the ligature and opposite sides, visible
by using a microscope. If the suspension beam is made of wood the relative amount of failure
should be recorded, and after all other measurements, observations and photographs have been
completed on the suspension beam, the cross-section should be examined, if possible. Using a
band-saw, a cut should be made through the middle of the indentation, and through the control
areas, and an examination for densification should be completed. Any snags in the ligature or
fibre directionality should be recorded, as well as any compression areas visible.
A taping of the suspension beam on the ligature side should be completed, at the area of
the indentation under the first loop of the ligature. Using software such as Autosketch, the area
and perimeter of this taping can be calculated, and is a useful comparative tool ifreconstructed
hangings are completed on the same suspension beam.
B. Photographs
In addition to the photographs that are regularly taken at the scene and of the victim, the
focus should be on extra photos of the knot type and location, as well as indentations and normal
control areas on the suspension beam. Other photographs should record fibre direction or snags,
if present, and the cross-section of the suspension, as previously mentioned. If the scene exhibits
48

signs of a struggle, photographs should be taken of this, as it would be completed at other death
scenes.
C. Measurements
Measurements should include the height of the victim, distance from the ground or floor
to the victim’s feet, and the distance from the ground to the knot of the ligature at the neck.
Other measurements should include the distance of the knot at the neck to the suspension point,
distance from the ground to the suspension point, and approximate length of the ligature. As
well, if a stepping aid is present, the height of the step and distance from the top of the step to the
feet of the victim should be recorded. Dimensions of the suspension beam and any other
relevant measurements should be recorded. A basic diagram or sketch should also be created to
illustrate the scene and its dimensions, as would be noted in any other hanging death.
D. Evidence Collected at Scene
Notes should be recorded as to what evidence was secured from the scene, if any, and
where it was deposited, in case it needs to be found at a later date. Because evidence at the OPP
is only held in suicide cases for three months, or often destroyed at the request of the family, a
special effort should be made to keep the evidence of suspicious hanging cases, in the event of
later reexamination.
E. Post Mortem Examination
The examination of the body at the post mortem should record basic information such as
rigor and livor mortis, and whether these features correspond to the hanging position at the
49
scene. The weight of the victim, and any other injuries present on the body should be reported,
as they may be indicative a post-mortem suspension. Cause of death and estimated time since
death should be reported.
Research Design
Research design problems encountered during the course of Phase II were minimal.
Because most of the design problems were worked out of the gallows in Phase I, the major
problem encountered for this project was how to analyze the tapings effectively. This was
solved by experimenting with different computer programs to find a method to calculate the area
and perimeter of the indentations, to determine differences between the static fall and drag trials.
Another challenge was the analysis of the cross-section of the indentations, and attempts
to examine the wood at the cellular level for distinctive changes. This research, as previously
mentioned, is still ongoing and will be finished within the next eight months (Webster, 2001).
Improvements over Phase I include a broader range of analyses that were conducted to
extract the most amount of information possible from the trials. In addition, more efforts were
made to control the study through photographs and initial measurements, prior to the hanging
trials. This resulted in a greater comparative aspect to the study, and lower standard deviations.
Sources of Variability
Possible sources of variability within the study causing standard deviation include the
routering process on the wood suspension beams, although as previously mentioned the routering
was considered quite effective at maintaining control across the boards. In addition, all boards
50
were purchased from the same lot at the lumber yard and were the same type of wood (spruce),
resulting in uniform pieces of wood from which to begin the project.
Observer error, using the manufactured jig and digital calipers, may have occurred.
However, measurements taken using the custom-designed jig eliminated the major source of
variability within the measurement process, as a constant angle was maintained. One other
source of variability may have been the squared end of the depth armature of the calipers. A less
precise measurement may have occurred because the end was not pointed, however this should
have only minimally affected the depth.
A source of variability among the tapings may have been due to observer error in using
the Autosketch program, as a free-hand line was drawn to outline the area used in the
calculations. In the future, it is suggested that a line is drawn on the top of the tape in a visible
colour (i.e. white china marker) and then this is scanned in its entirety. This distinctly visible
outline will result in an easier detection of the area, and a free-hand line can then be more
accurately drawn using the Autosketch program, resulting in lower standard deviations.
The Future
Future studies in this area should focus on characterizing homicidal and suicidal hangings
on different types of commonly used suspension beams (i.e. metal bar, tree limb) and using a
greater array of ligatures (i.e. belts, electrical cord, dog leash). Now that the ground work for
this type of proactive study has been laid, future data collection can expand the knowledge base
by examining for similar characteristics in different materials. It is important that education and
proactive learning result from these kinds of studies, prior to being confronted with the task of
investigating a suspicious hanging death.
51

Conclusion
The aim of this study was to provide a practical investigation into the physical evidence
consistent with suicidal and homicidal hanging acts, and more specifically, examine the ligature
and suspension point morphology to determine characteristics that differentiate the two death
scenes. A combination of observations and measurements from the hanging trials, and a survey
of past cases and review of the literature, has resulted in an educational tool, the data form, to
facilitate improvements in the study of the ligature and suspension beam at the scene of a
suspicious hanging death. Education of these criteria to new investigators will hopefully result
in an improved investigation of hanging death scenes, and may one day help to discriminate the
rarely observed homicidal hanging.
52

Acknowledgements
First, I would like to thank the two most important people in this Phase of the project, and the CPRC for funding my research - Thank you so much. • Paula Webster, my very dedicated student assistant, without whom this project could
not have been completed, University of Toronto at Mississauga, Forensic Science and Biology student.
• Staff Sergeant Pat Downey, my mentor, Technical Identification Services Unit (TISU), OPP, Barrie. Thank you for your support and taking time out to advise me on this project. Canadian Police Research Council, Ottawa.
Next, I would like to thank these very important people, in no particular order, other than alphabetically, for their support, encouragement, and advice: • Judith Brown, Eric Silk OPP Library, Orillia. • Dr. Paul Cooper, University of Toronto, Forestry Department. • Dr. Cummins, Forensic Science Coordinator, University of Toronto at Mississauga. • Tim and Joe Downey. • Oliver Foese. • Identification Constables Gail Hankin, Tom Krezel, Scott Macleod, Carm McCann,
Paul Rosato, and Special Constable Elena Vizza of TISU, OPP, Barrie. • Julie Graham, Canadian Police Research Council (CPRC), Ottawa. • Julie Grimaldi and Angela Eke, Operational Policy and Support Bureau, Orillia. • Dr. Uli Krull, University of Toronto at Mississauga, Chemistry Department.
Constable Don Shearer, OPP. • Sergeant John Tod, Forensic Identification Services (FIS), Orillia.
53

APPENDIX A - DIAGRAMS 1 - 5
54
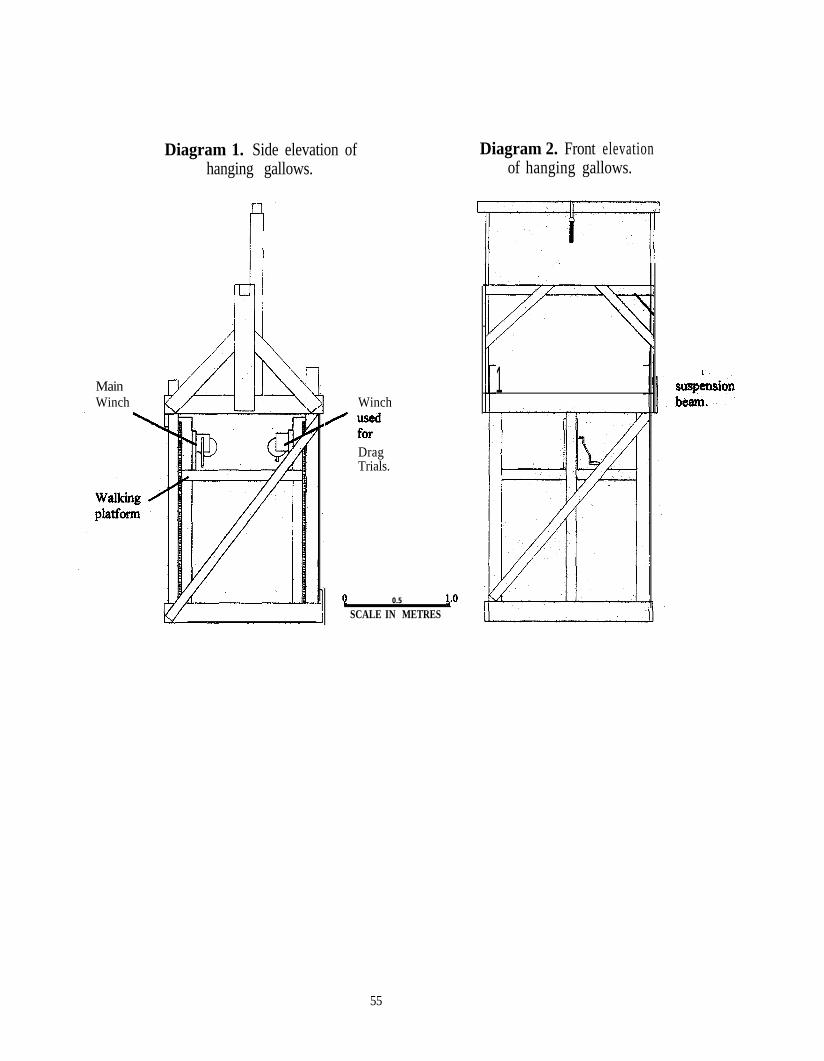
Diagram 1. Side elevation ofhanging gallows.
MainWinch Winch
DragTrials.
0.5
SCALE IN METRES
Diagram 2. Front elevationof hanging gallows.
L r’
1 Main
55
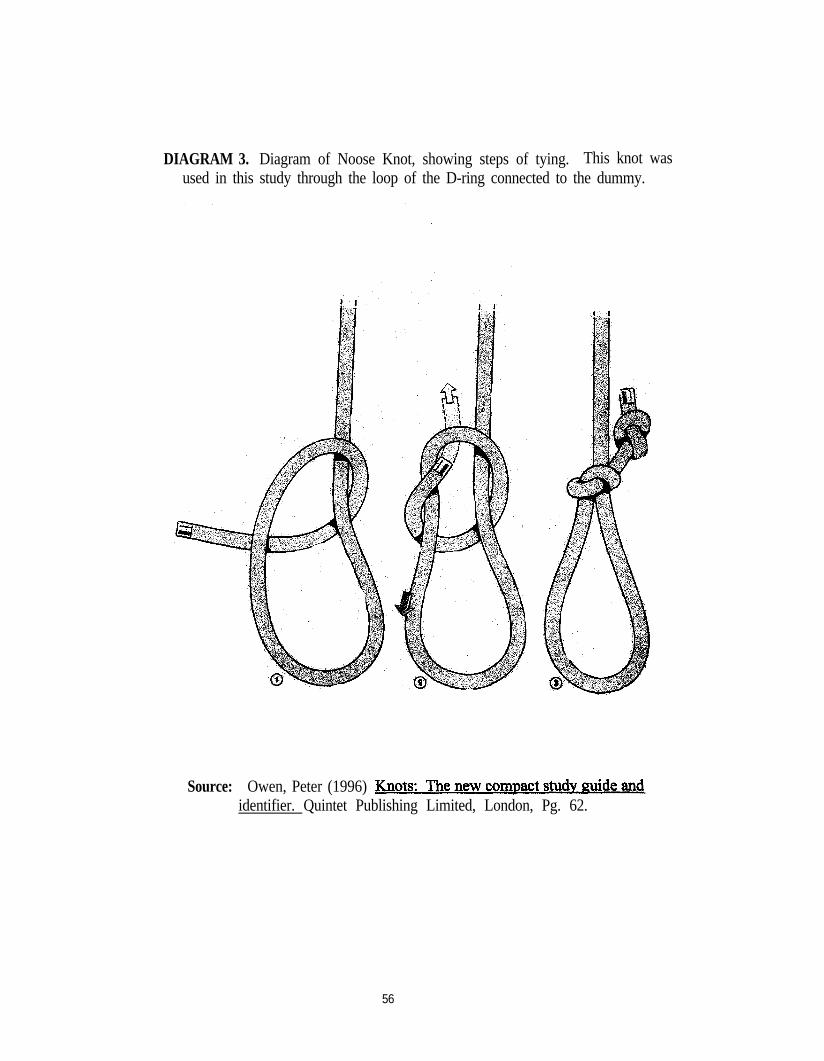
DIAGRAM 3. Diagram of Noose Knot, showing steps of tying. This knot wasused in this study through the loop of the D-ring connected to the dummy.
Source: Owen, Peter (1996) identifier. Quintet Publishing Limited, London, Pg. 62.
56
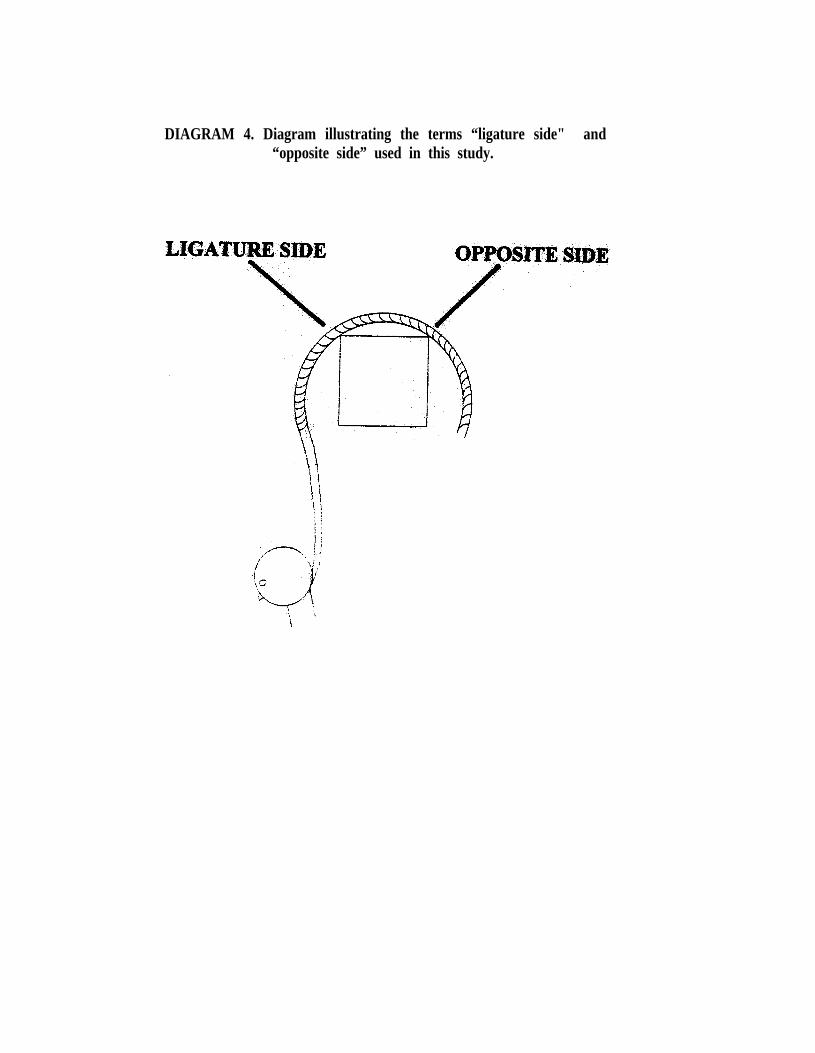
DIAGRAM 4. Diagram illustrating the terms “ligature side" and“opposite side” used in this study.
57

58

APPENDIX B -PHOTOGRAPHS 1 - 58
59

Photo 1. Winch connected tomain rope.
Photo 2. Winch used fordrag trials. 3/8”
polypropylene rope used inthis study.
Photo 4. Example of howligature rope tied around hooksand looped around suspension
beam, in static fall trial.
Photo 3. The gallows, withresearch assistant Paula Webster.
60
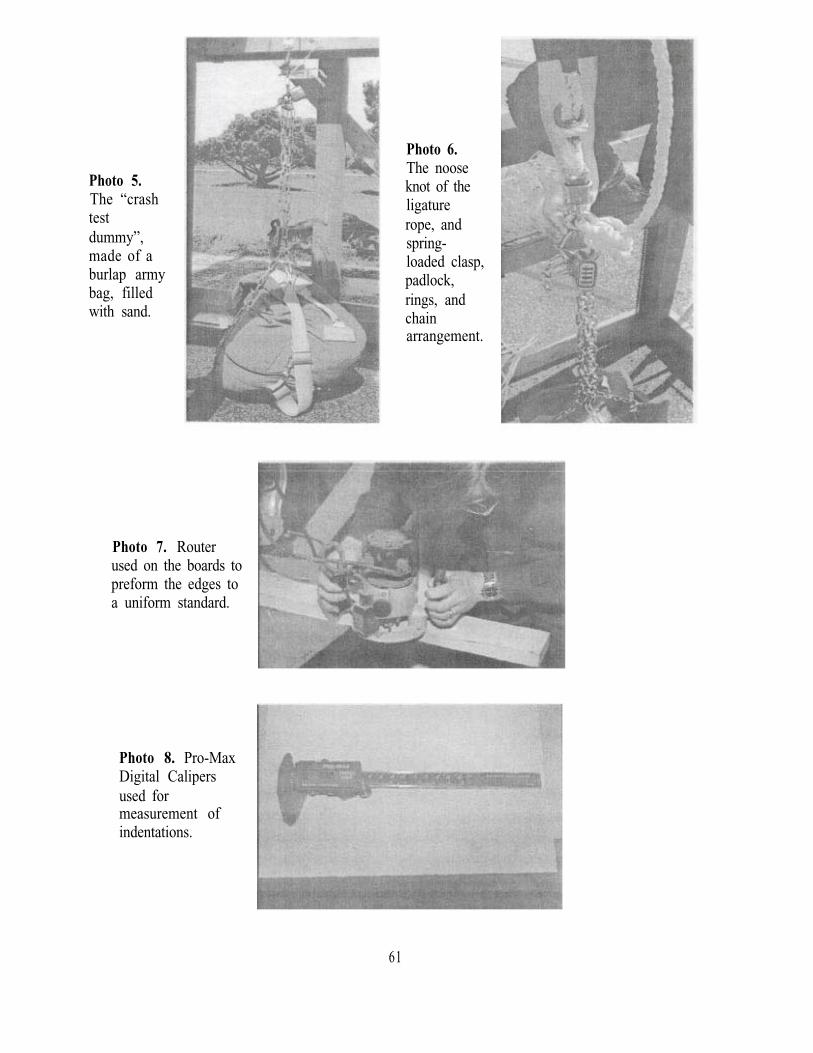
Photo 5.The “crashtestdummy”,made of aburlap armybag, filledwith sand.
Photo 7. Routerused on the boards topreform the edges toa uniform standard.
Photo 8. Pro-MaxDigital Calipersused formeasurement ofindentations.
Photo 6.The nooseknot of theligaturerope, andspring-loaded clasp,padlock, rings, andchainarrangement.
61
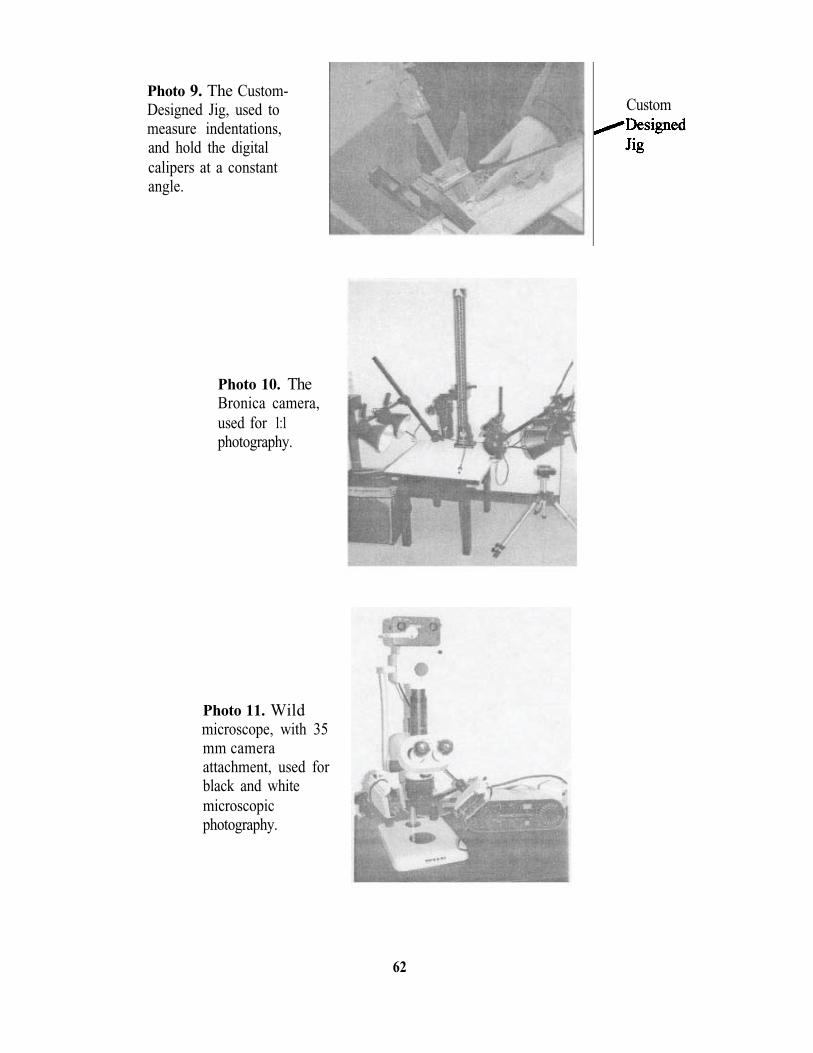
Photo 9. The Custom-Designed Jig, used tomeasure indentations,and hold the digitalcalipers at a constantangle.
Photo 10. TheBronica camera,used for 1:1photography.
Photo 11. Wildmicroscope, with 35mm cameraattachment, used forblack and whitemicroscopicphotography.
Custom
62
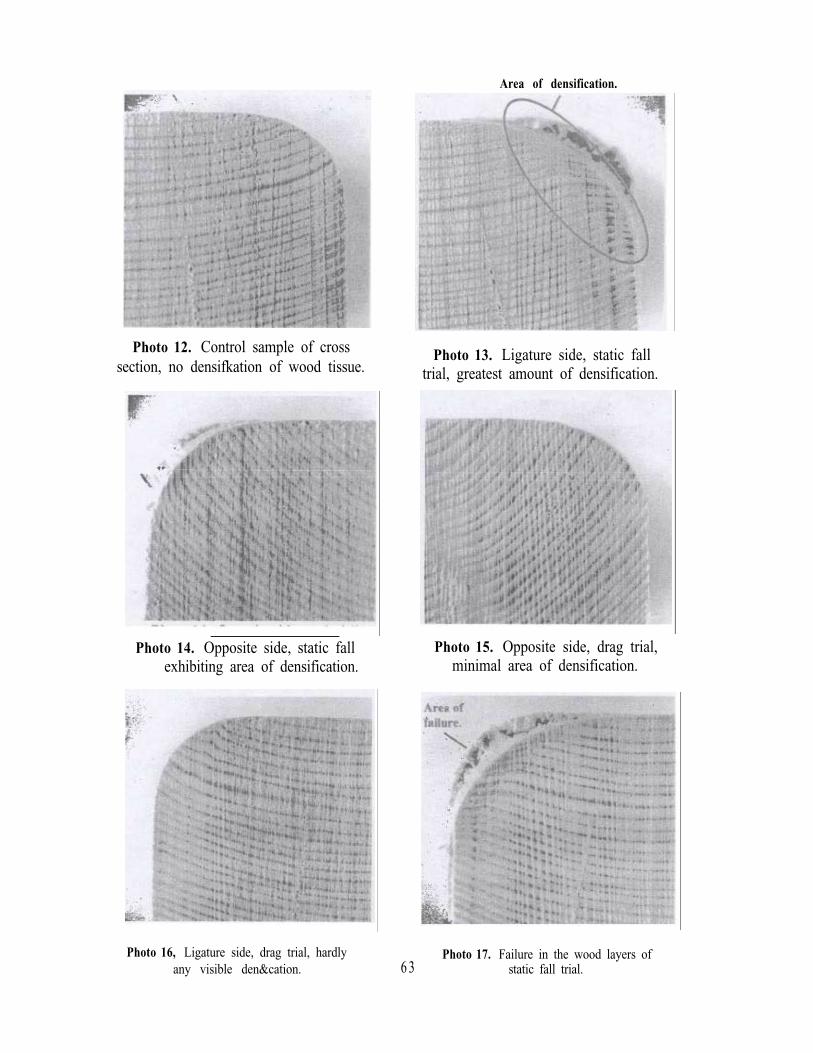
Area of densification.
Photo 12. Control sample of crosssection, no densifkation of wood tissue.
Photo 13. Ligature side, static falltrial, greatest amount of densification.
Photo 14. Opposite side, static fall Photo 15. Opposite side, drag trial, exhibiting area of densification. minimal area of densification.
Photo 16, Ligature side, drag trial, hardlyany visible den&cation. 6 3
Photo 17. Failure in the wood layers ofstatic fall trial.
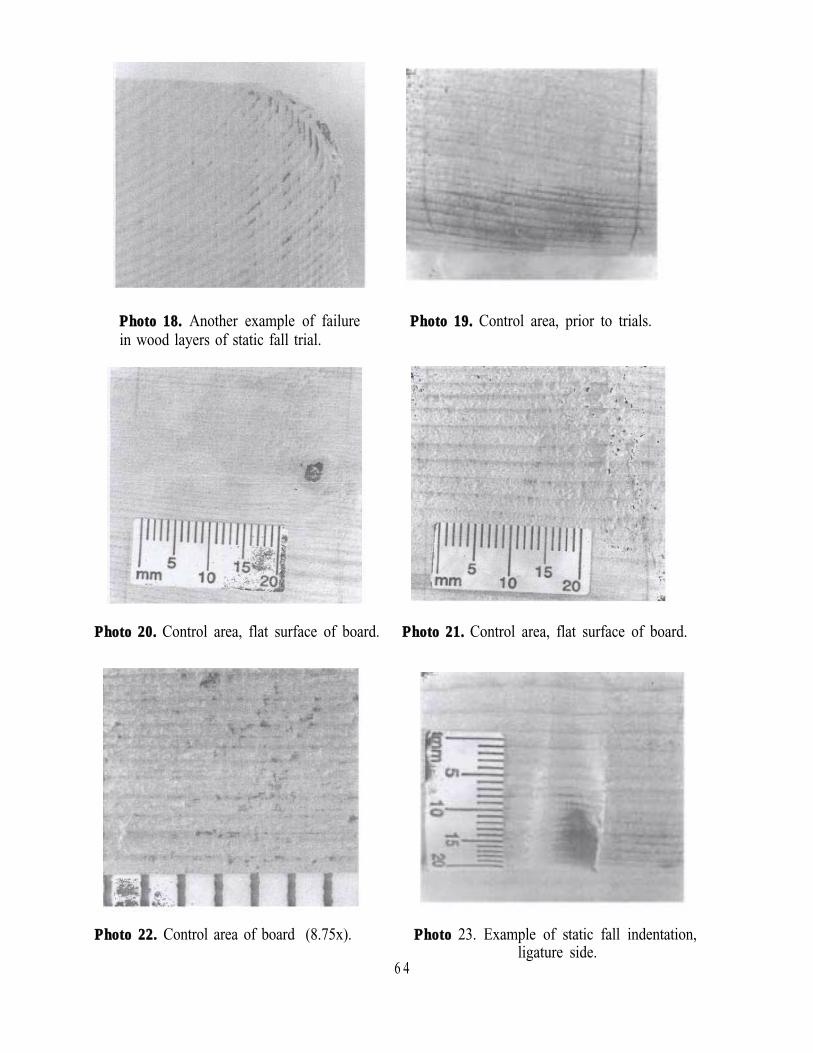
Photo 18. Another example of failurein wood layers of static fall trial.
Photo 19. Control area, prior to trials.
Photo 20. Control area, flat surface of board. Photo 21. Control area, flat surface of board.
Photo 22. Control area of board (8.75x). Photo 23. Example of static fall indentation,ligature side.
6 4
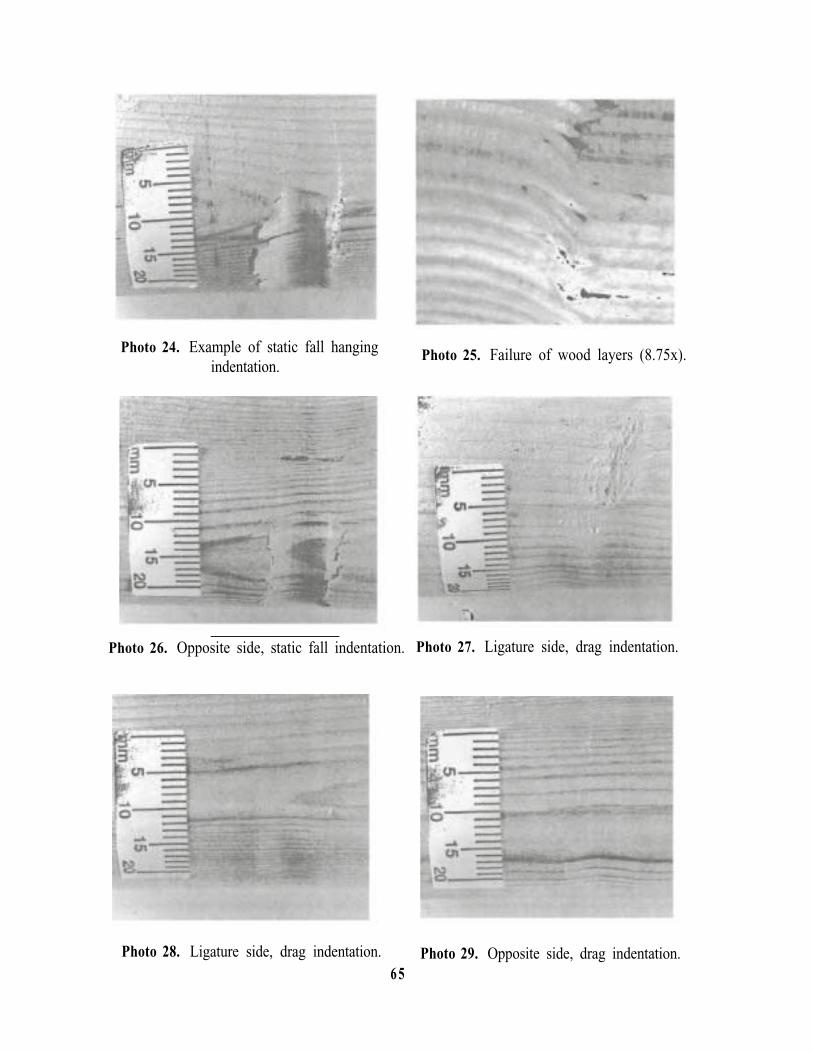
Photo 24. Example of static fall hanging indentation.
Photo 25. Failure of wood layers (8.75x).
Photo 26. Opposite side, static fall indentation. Photo 27. Ligature side, drag indentation.
Photo 28. Ligature side, drag indentation.6 5
Photo 29. Opposite side, drag indentation.
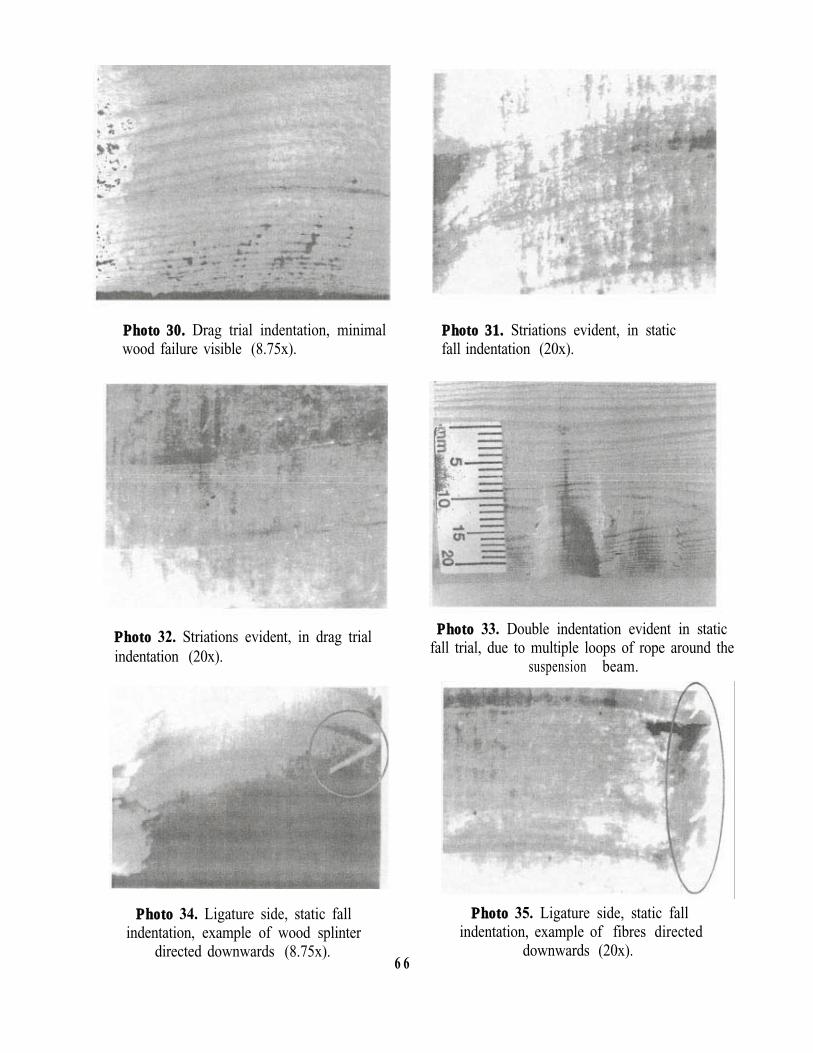
Photo 30. Drag trial indentation, minimal Photo 31. Striations evident, in staticwood failure visible (8.75x). fall indentation (20x).
Photo 32. Striations evident, in drag trialindentation (20x).
Photo 33. Double indentation evident in staticfall trial, due to multiple loops of rope around the
suspension beam.
Photo 34. Ligature side, static fallindentation, example of wood splinter
directed downwards (8.75x).6 6
Photo 35. Ligature side, static fallindentation, example of fibres directed
downwards (20x).
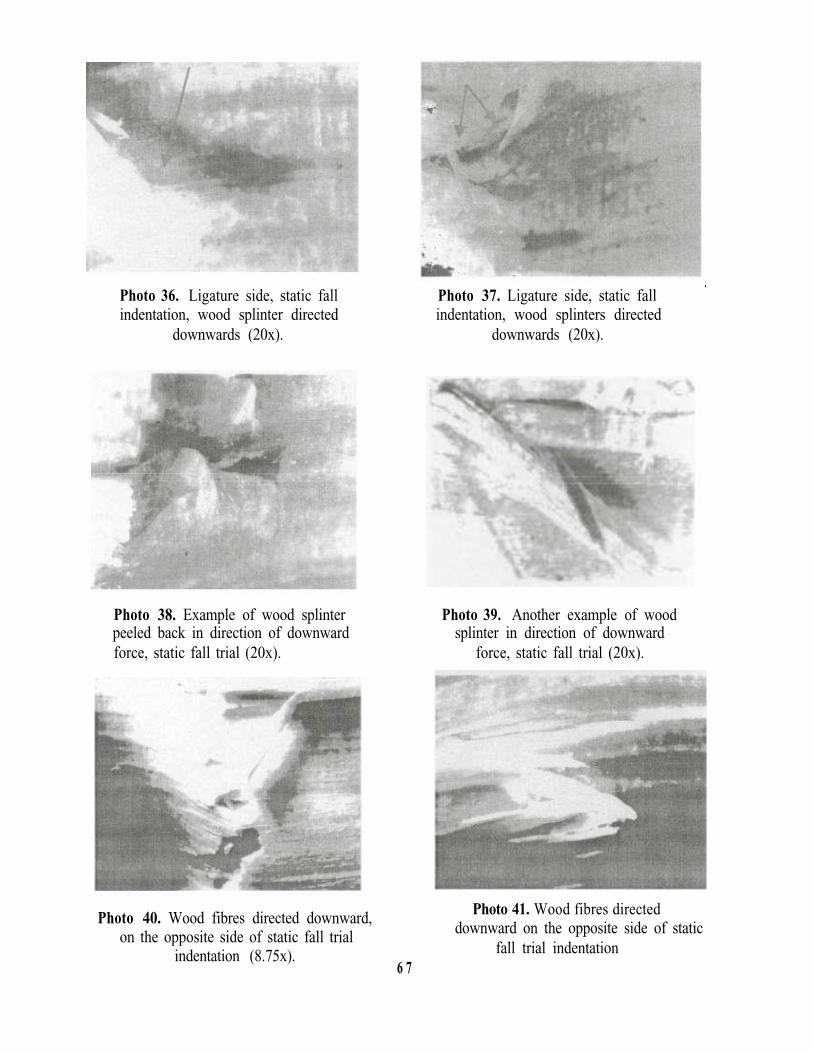
Photo 36. Ligature side, static fallindentation, wood splinter directed
downwards (20x).
Photo 38. Example of wood splinterpeeled back in direction of downwardforce, static fall trial (20x).
Photo 40. Wood fibres directed downward,on the opposite side of static fall trial
indentation (8.75x).6 7
Photo 37. Ligature side, static fallindentation, wood splinters directed
downwards (20x).
Photo 39. Another example of woodsplinter in direction of downward
force, static fall trial (20x).
Photo 41. Wood fibres directed downward on the opposite side of static
fall trial indentation
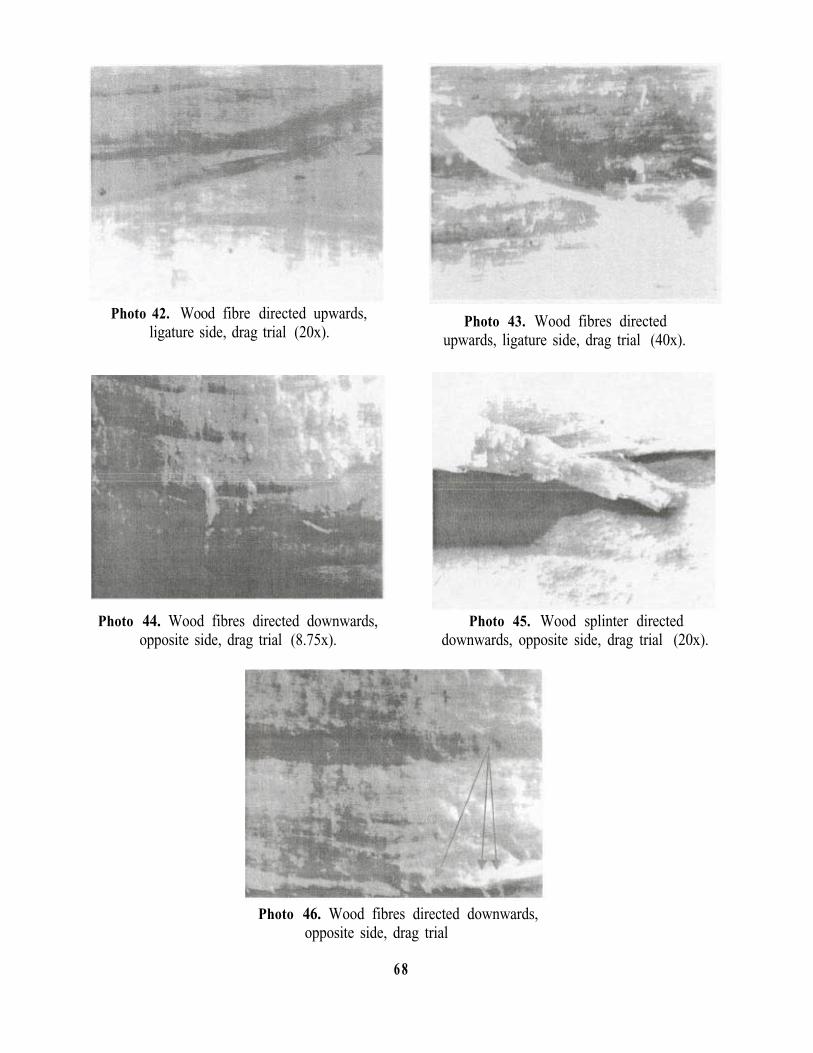
Photo 42. Wood fibre directed upwards,ligature side, drag trial (20x).
Photo 43. Wood fibres directedupwards, ligature side, drag trial (40x).
Photo 44. Wood fibres directed downwards, Photo 45. Wood splinter directedopposite side, drag trial (8.75x). downwards, opposite side, drag trial (20x).
Photo 46. Wood fibres directed downwards,opposite side, drag trial
6 8
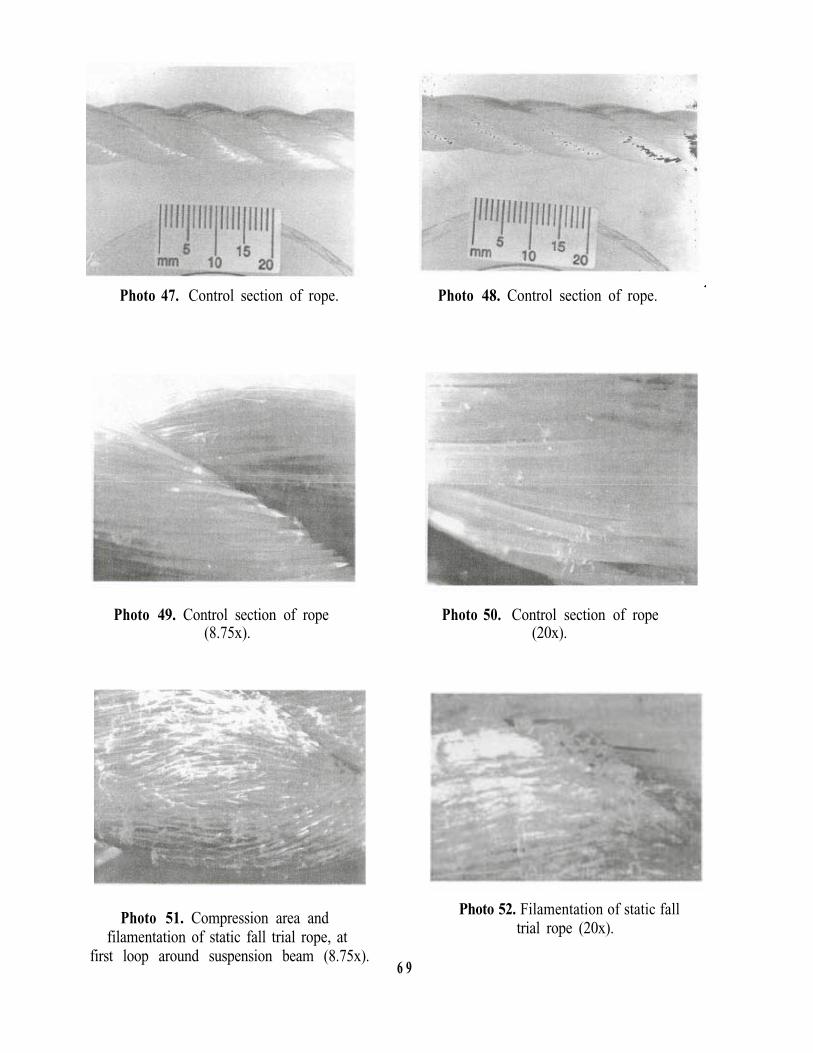
Photo 47. Control section of rope.
Photo 49. Control section of rope(8.75x).
Photo 51. Compression area andfilamentation of static fall trial rope, at
first loop around suspension beam (8.75x).6 9
Photo 48. Control section of rope.
Photo 50. Control section of rope(20x).
Photo 52. Filamentation of static fall trial rope (20x).
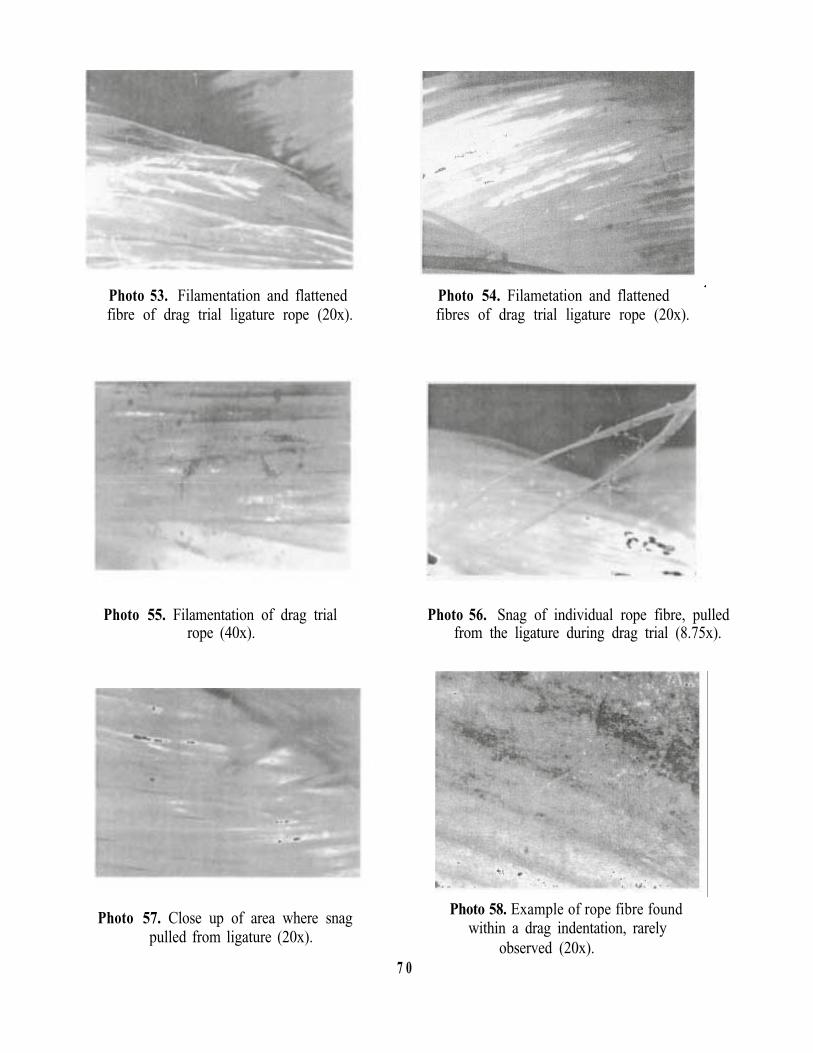
Photo 53. Filamentation and flattenedfibre of drag trial ligature rope (20x).
Photo 55. Filamentation of drag trialrope (40x).
Photo 57. Close up of area where snagpulled from ligature (20x).
7 0
Photo 54. Filametation and flattenedfibres of drag trial ligature rope (20x).
Photo 56. Snag of individual rope fibre, pulledfrom the ligature during drag trial (8.75x).
Photo 58. Example of rope fibre found within a drag indentation, rarely
observed (20x).

APPENDIX C - TABLES 2 - 15
71
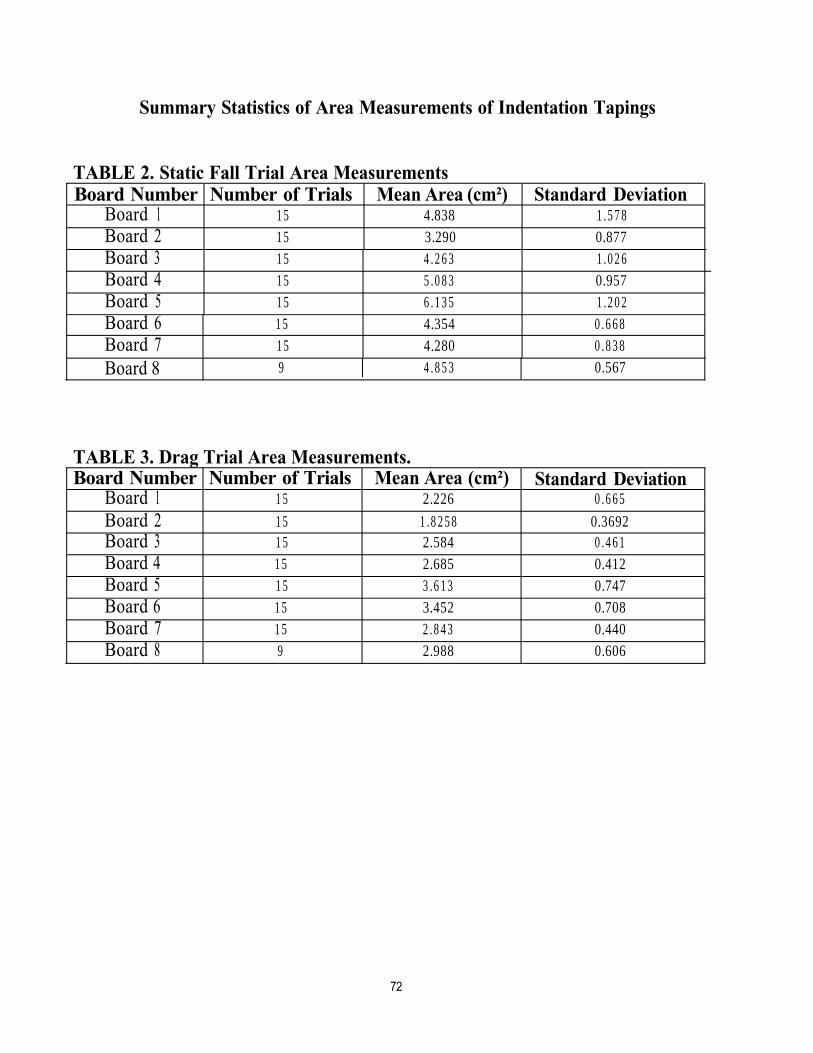
Summary Statistics of Area Measurements of Indentation Tapings
TABLE 2. Static Fall Trial Area MeasurementsBoard Number Number of Trials Mean Area (cm²) Standard Deviation
Board 1 15 4.838 1.578Board 2 15 3.290 0.877Board 3 15 4.263 1.026Board 4 15 5.083 0.957Board 5 15 6.135 1.202Board 6 15 4.354 0.668Board 7 15 4.280 0.838Board 8 9 4.853 0.567
TABLE 3. Drag Trial Area Measurements.Board Number Number of Trials Mean Area (cm²) Standard Deviation
Board 1 15 2.226 0.665Board 2 15 1.8258 0.3692Board 3 15 2.584 0.461Board 4 15 2.685 0.412Board 5 15 3.613 0.747Board 6 15 3.452 0.708Board 7 15 2.843 0.440Board 8 9 2.988 0.606
72
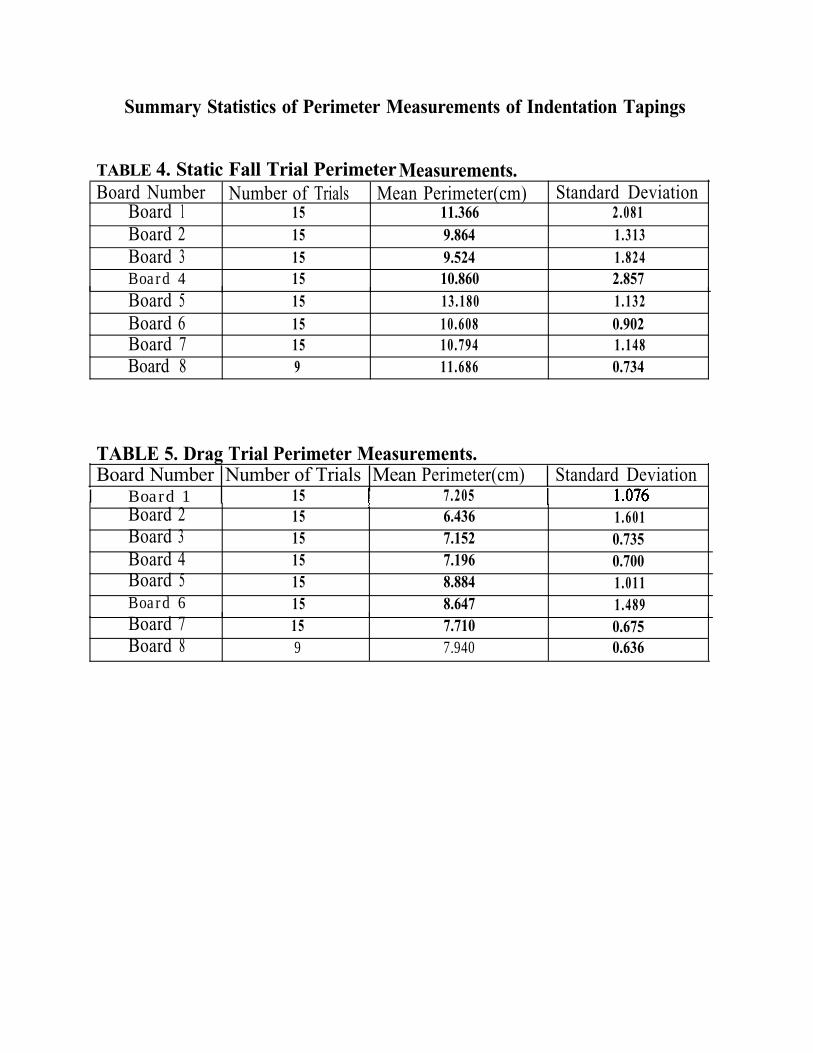
Summary Statistics of Perimeter Measurements of Indentation Tapings
TABLE 4. Static Fall Trial Perimeter Measurements.Board Number Number of Trials Mean Perimeter(cm) Standard Deviation
Board 1 15 11.366 2.081Board 2 15 9.864 1.313Board 3 15 9.524 1.824Board 4 15 10.860 2.857Board 5 15 13.180 1.132Board 6 15 10.608 0.902Board 7 15 10.794 1.148Board 8 9 11.686 0.734
TABLE 5. Drag Trial Perimeter Measurements.Board Number Number of Trials Mean Perimeter(cm) Standard Deviation
Board 1 15 7.205Board 2 15 6.436 1.601Board 3 15 7.152 0.735Board 4 15 7.196 0.700Board 5 15 8.884 1.011Board 6 15 8.647 1.489Board 7 15 7.710 0.675Board 8 9 7.940 0.636
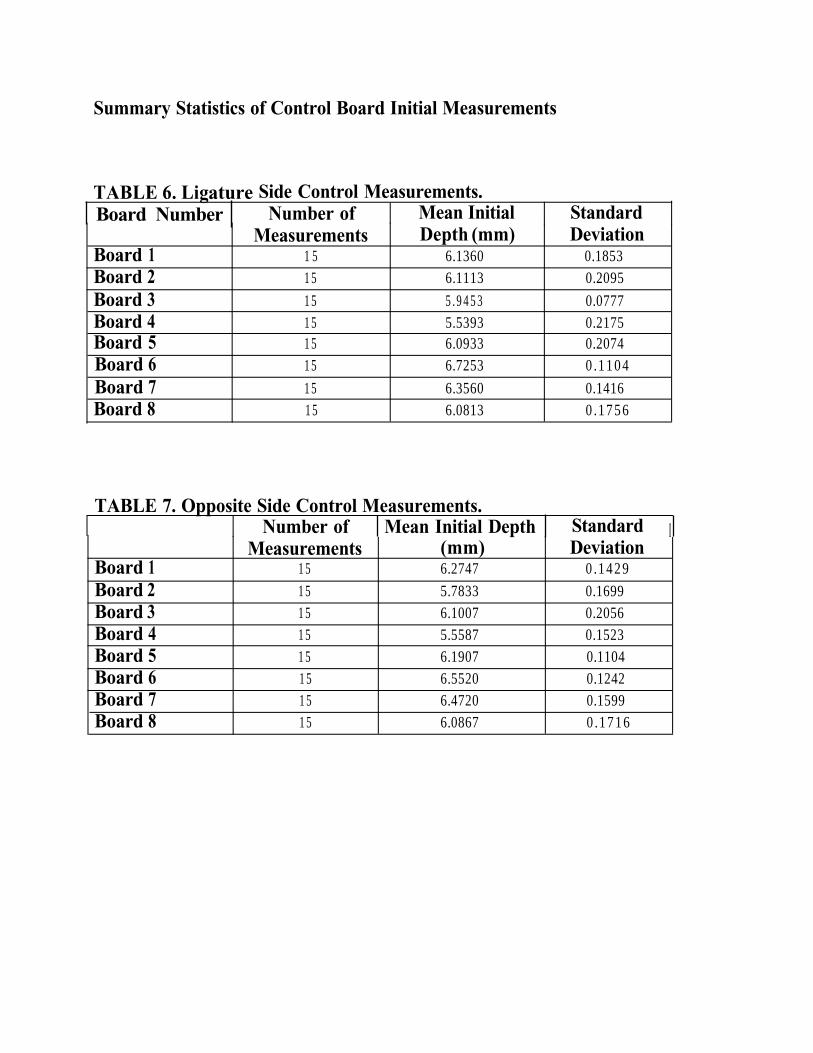
Summary Statistics of Control Board Initial Measurements
ature TABLE 6. Lig Board Number
Side Control Measurements.Number of Mean Initial Standard
Measurements Depth (mm) DeviationBoard 1 1 5 6.1360 0.1853Board 2 15 6.1113 0.2095Board 3 15 5.9453 0.0777Board 4 15 5.5393 0.2175Board 5 15 6.0933 0.2074Board 6 15 6.7253 0.1104Board 7 15 6.3560 0.1416Board 8 15 6.0813 0.1756
TABLE 7. Opposite Side Control Measurements.Number of Mean Initial Depth Standard I
Measurements (mm) DeviationBoard 1 15 6.2747 0.1429Board 2 15 5.7833 0.1699Board 3 15 6.1007 0.2056Board 4 15 5.5587 0.1523Board 5 15 6.1907 0.1104Board 6 15 6.5520 0.1242Board 7 15 6.4720 0.1599Board 8 15 6.0867 0.1716
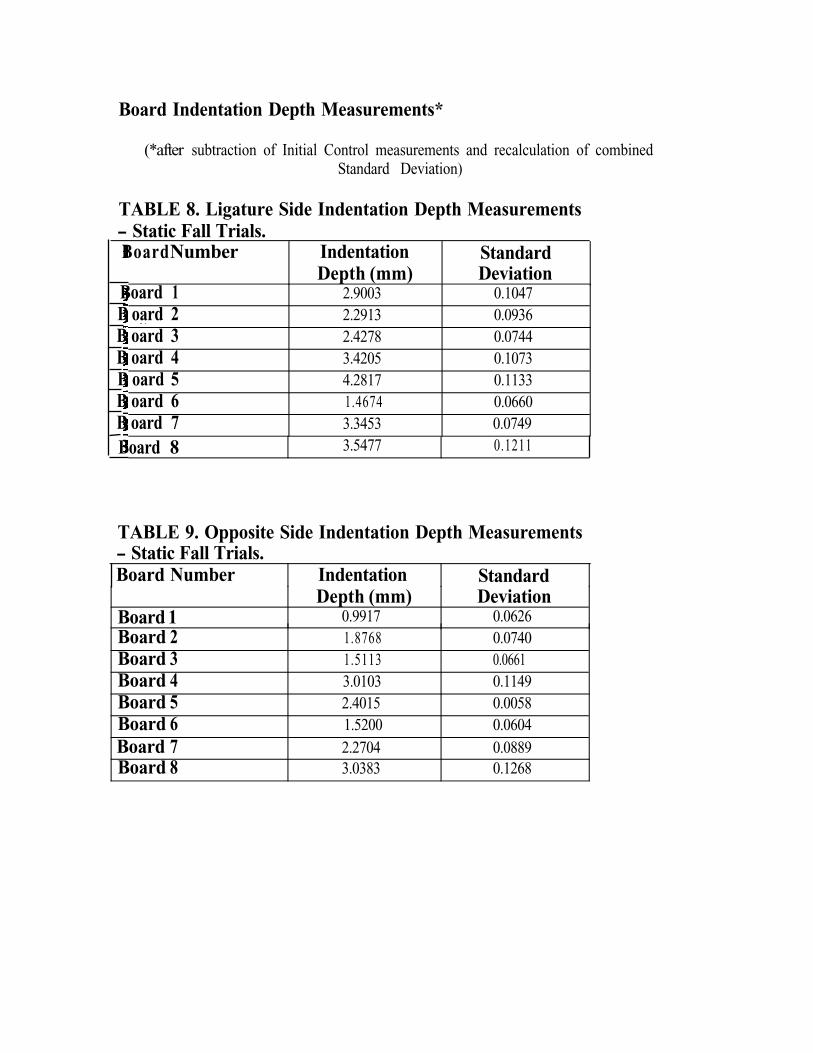
Board Indentation Depth Measurements*
(*after subtraction of Initial Control measurements and recalculation of combinedStandard Deviation)
TABLE 8. Ligature Side Indentation Depth Measurements- Static Fall Trials.Board Number Indentation Standard
Depth (mm) DeviationBoard 1 2.9003 0.1047B oard 2 2.2913 0.0936B oard 3 2.4278 0.0744B oard 4 3.4205 0.1073B oard 5 4.2817 0.1133B oard 6 1.4674 0.0660B oard 7 3.3453 0.0749
Board 8 3.5477 0.1211
TABLE 9. Opposite Side Indentation Depth Measurements- Static Fall Trials.
Board Number Indentation Standard
Board 1Depth (mm)
0.9917Deviation
0.0626Board 2 1.8768 0.0740Board 3 1.5113 0.0661Board 4 3.0103 0.1149Board 5 2.4015 0.0058Board 6 1.5200 0.0604Board 7 2.2704 0.0889Board 8 3.0383 0.1268
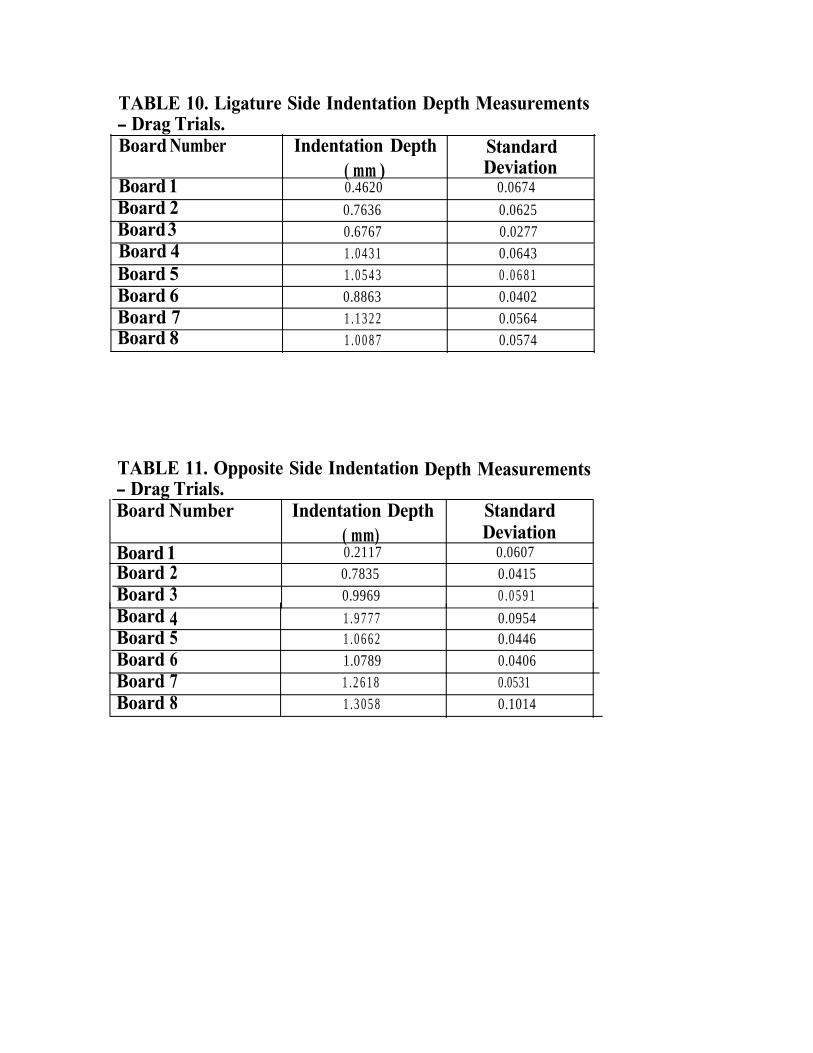
TABLE 10. Ligature Side Indentation Depth Measurements- Drag Trials.Board Number Indentation Depth Standard
( mm ) DeviationBoard 1 0.4620 0.0674Board 2 0.7636 0.0625Board 3 0.6767 0.0277Board 4 1.0431 0.0643Board 5 1.0543 0.0681Board 6 0.8863 0.0402Board 7 1.1322 0.0564Board 8 1.0087 0.0574
TABLE 11. Opposite Side Indentation Depth Measurements- Drag Trials.Board Number
Board 1
Indentation Depth( mm)
StandardDeviation
0.2117 0.0607Board 2 0.7835 0.0415Board 3 0.9969 0.0591Board 4 1.9777 0.0954Board 5 1.0662 0.0446Board 6 1.0789 0.0406Board 7 1.2618 0.0531Board 8 1.3058 0.1014
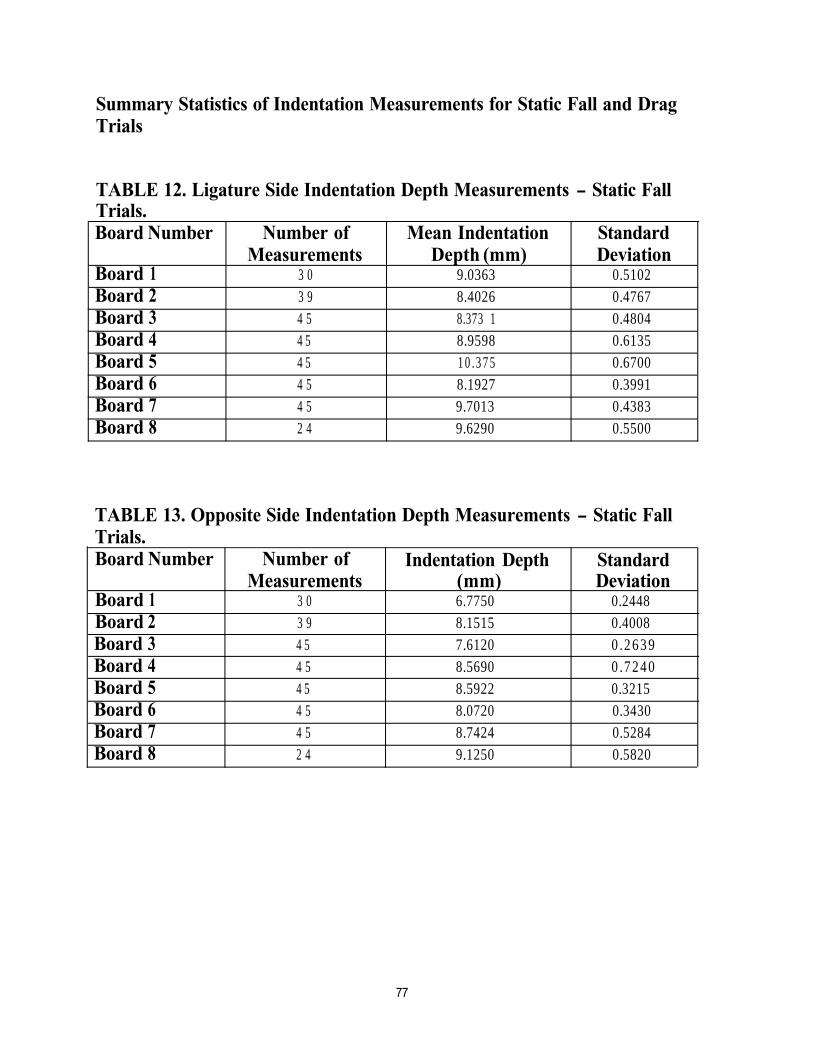
Summary Statistics of Indentation Measurements for Static Fall and DragTrials
TABLE 12. Ligature Side Indentation Depth Measurements - Static FallTrials.Board Number Number of Mean Indentation Standard
Measurements Depth (mm) DeviationBoard 1 3 0 9.0363 0.5102Board 2 3 9 8.4026 0.4767Board 3 4 5 8.373 1 0.4804Board 4 4 5 8.9598 0.6135Board 5 4 5 10.375 0.6700Board 6 4 5 8.1927 0.3991Board 7 4 5 9.7013 0.4383Board 8 2 4 9.6290 0.5500
TABLE 13. Opposite Side Indentation Depth Measurements - Static FallTrials.Board Number Number of Indentation Depth Standard
Measurements (mm) DeviationBoard 1 3 0 6.7750 0.2448Board 2 3 9 8.1515 0.4008Board 3 4 5 7.6120 0.2639Board 4 4 5 8.5690 0.7240Board 5 4 5 8.5922 0.3215Board 6 4 5 8.0720 0.3430Board 7 4 5 8.7424 0.5284Board 8 2 4 9.1250 0.5820
77
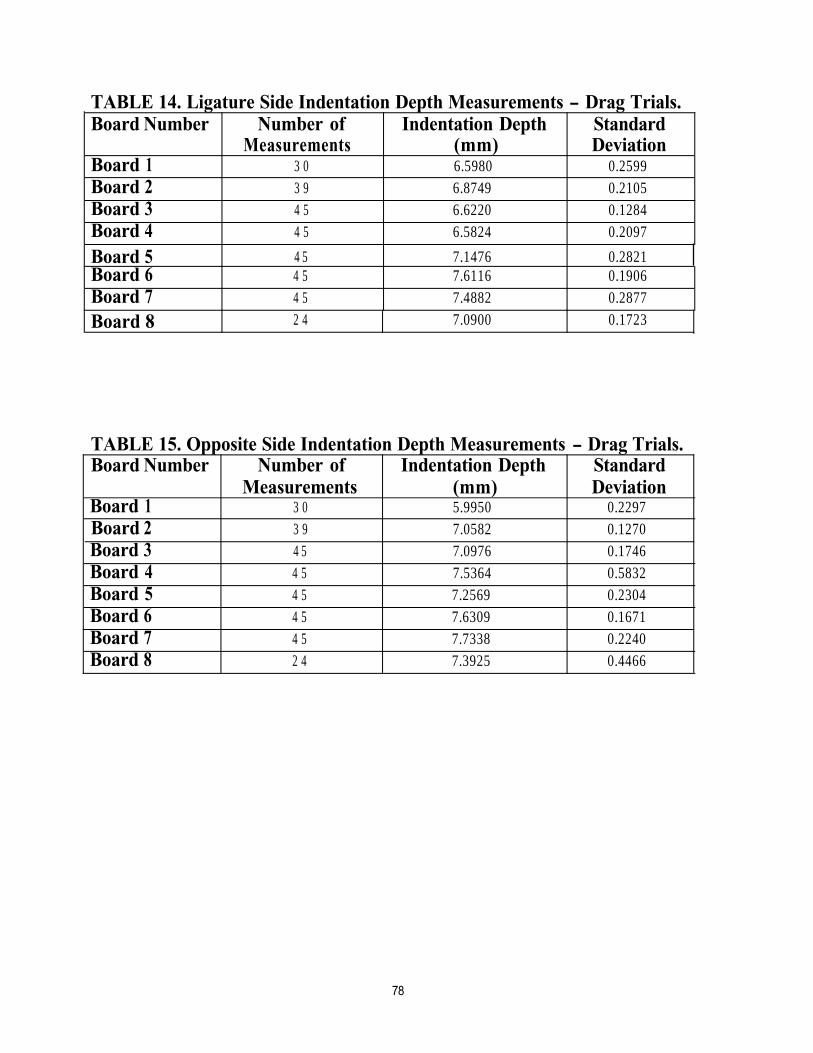
TABLE 14. Ligature Side Indentation Depth Measurements - Drag Trials.Board Number Number of Indentation Depth Standard
Measurements (mm) DeviationBoard 1 3 0 6.5980 0.2599Board 2 3 9 6.8749 0.2105Board 3 4 5 6.6220 0.1284Board 4 4 5 6.5824 0.2097
Board 5 4 5 7.1476 0.282 1Board 6 4 5 7.6116 0.1906Board 7 4 5 7.4882 0.2877
Board 8 2 4 7.0900 0.1723
TABLE 15. Opposite Side Indentation Depth Measurements - Drag Trials.Board Number Number of Indentation Depth Standard
Measurements (mm) DeviationBoard 1 3 0 5.9950 0.2297Board 2 3 9 7.0582 0.1270Board 3 4 5 7.0976 0.1746Board 4 4 5 7.5364 0.5832Board 5 4 5 7.2569 0.2304Board 6 4 5 7.6309 0.1671Board 7 4 5 7.7338 0.2240Board 8 2 4 7.3925 0.4466
78

APPENDIX D - CHARTS 1 - 40
79
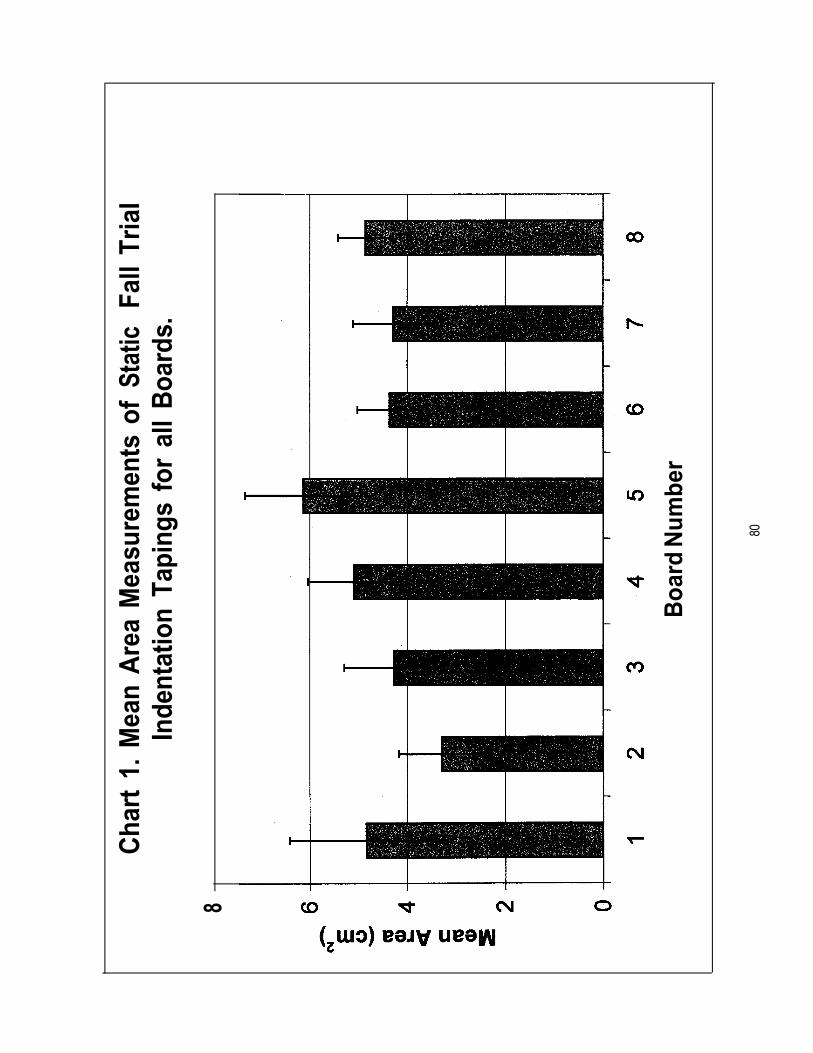
Cha
rt 1
. M
ean
Are
a M
easu
rem
ents
of
Stat
ic F
all
Tria
lIn
dent
atio
n Ta
ping
s fo
r al
l B
oard
s.
8
Boa
rd N
umbe
r
80
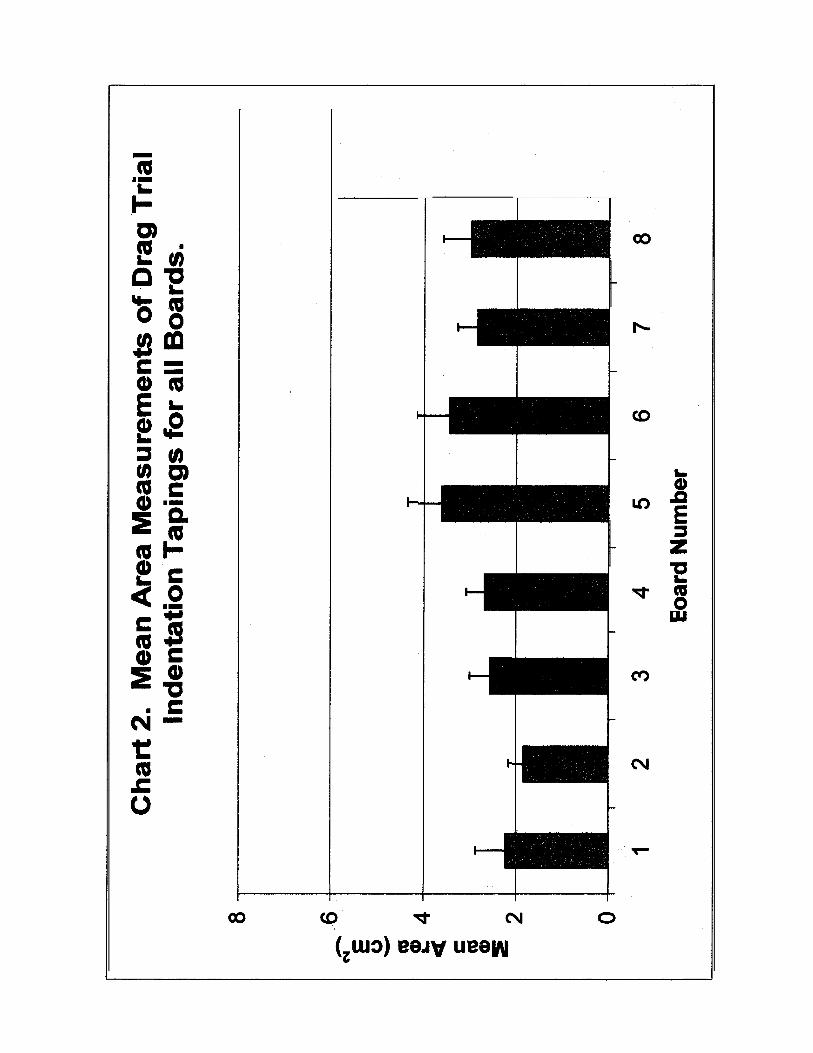
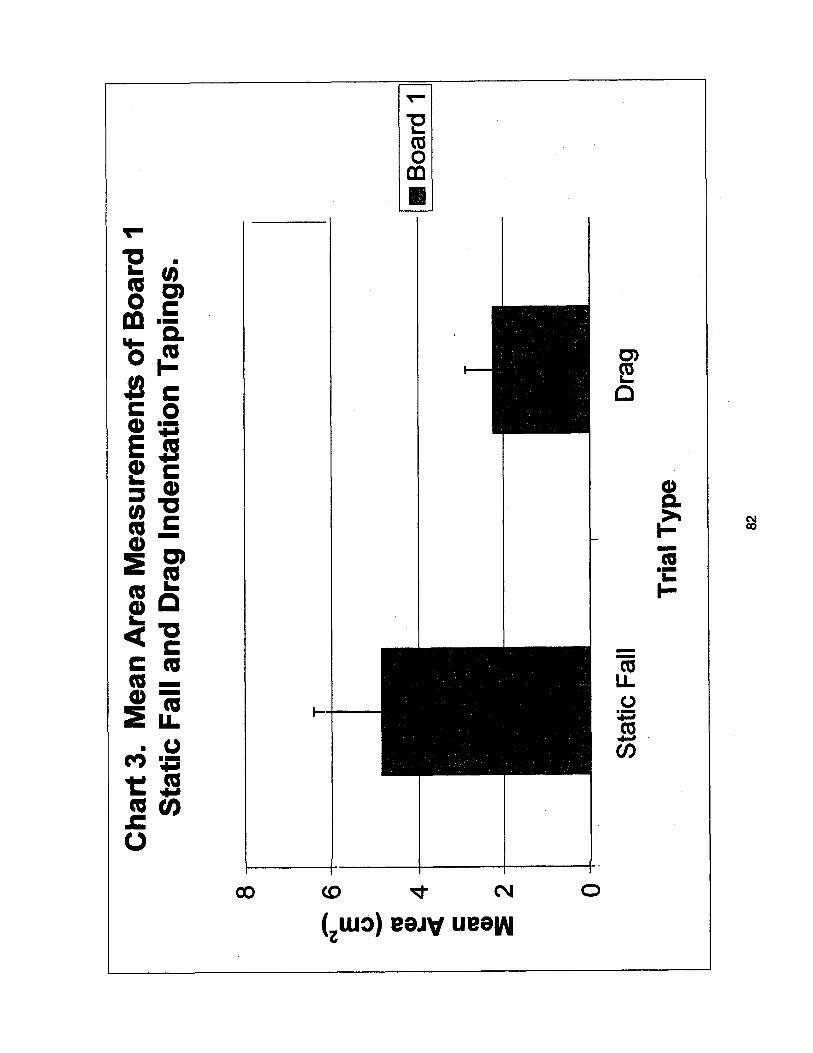
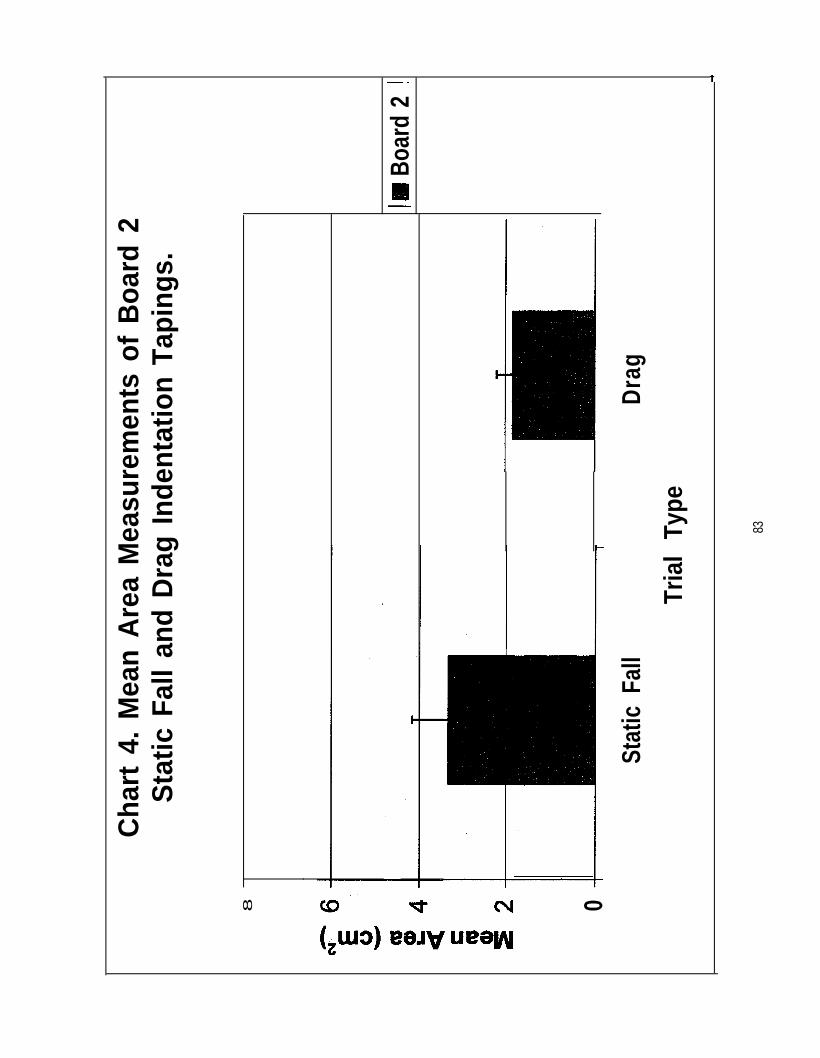
Cha
rt 4
. M
ean
Are
a M
easu
rem
ents
of
Boa
rd 2
Sta
tic F
all
and
Dra
g In
dent
atio
n Ta
ping
s.
8
E g E2 0
Boar
d 2
1
Stat
ic F
all
Tria
l Ty
pe
Dra
g
83
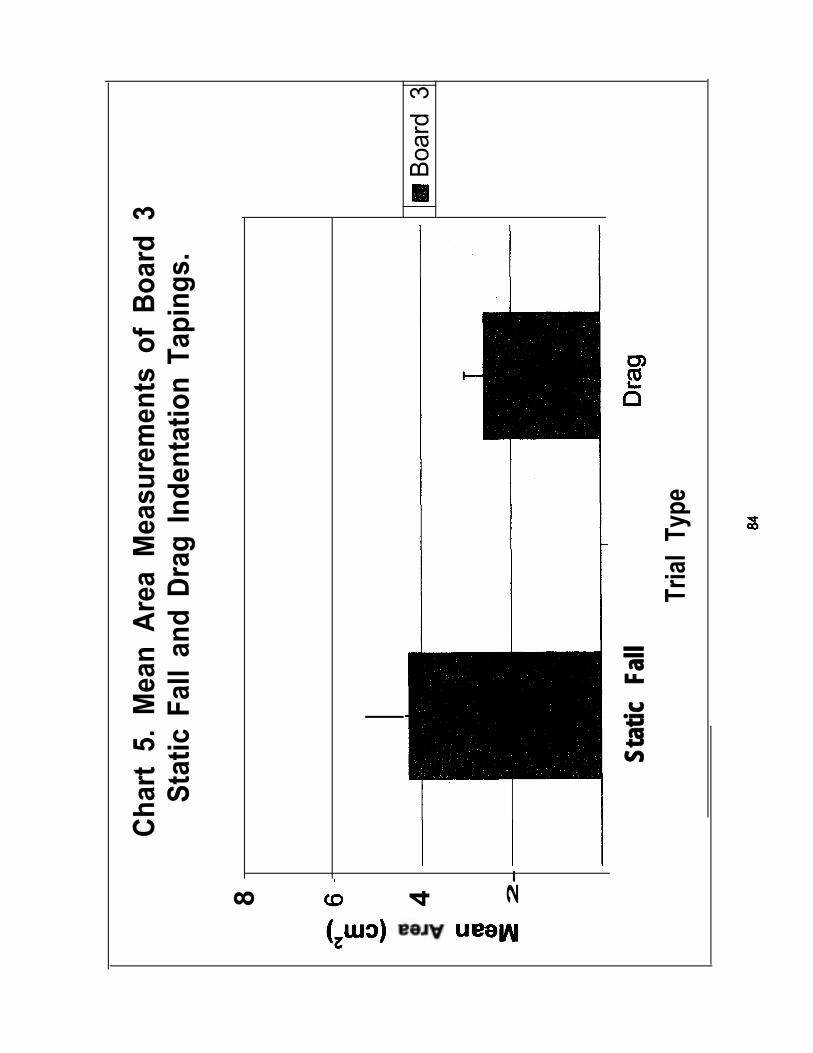
8
4
2
-
Cha
rt 5
. M
ean
Are
a M
easu
rem
ents
of
Boa
rd 3
Sta
tic F
all
and
Dra
g In
dent
atio
n Ta
ping
s.
Boa
rd 3
Stat
ic F
all
Tria
l Ty
pe
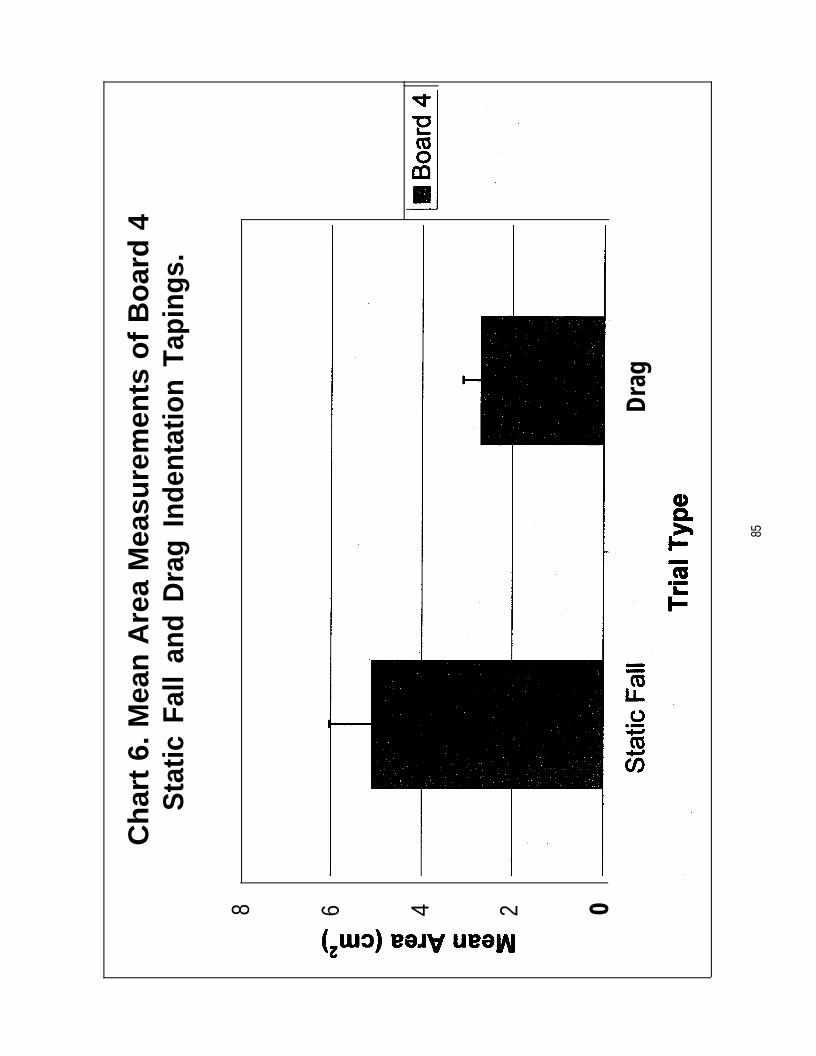
8 6 4 2 0
Ch
art
6. M
ean
Are
a M
easu
rem
ents
of
Bo
ard
4S
tatic
Fal
l an
d D
rag
Inde
ntat
ion
Tapi
ngs.
Dra
g
85
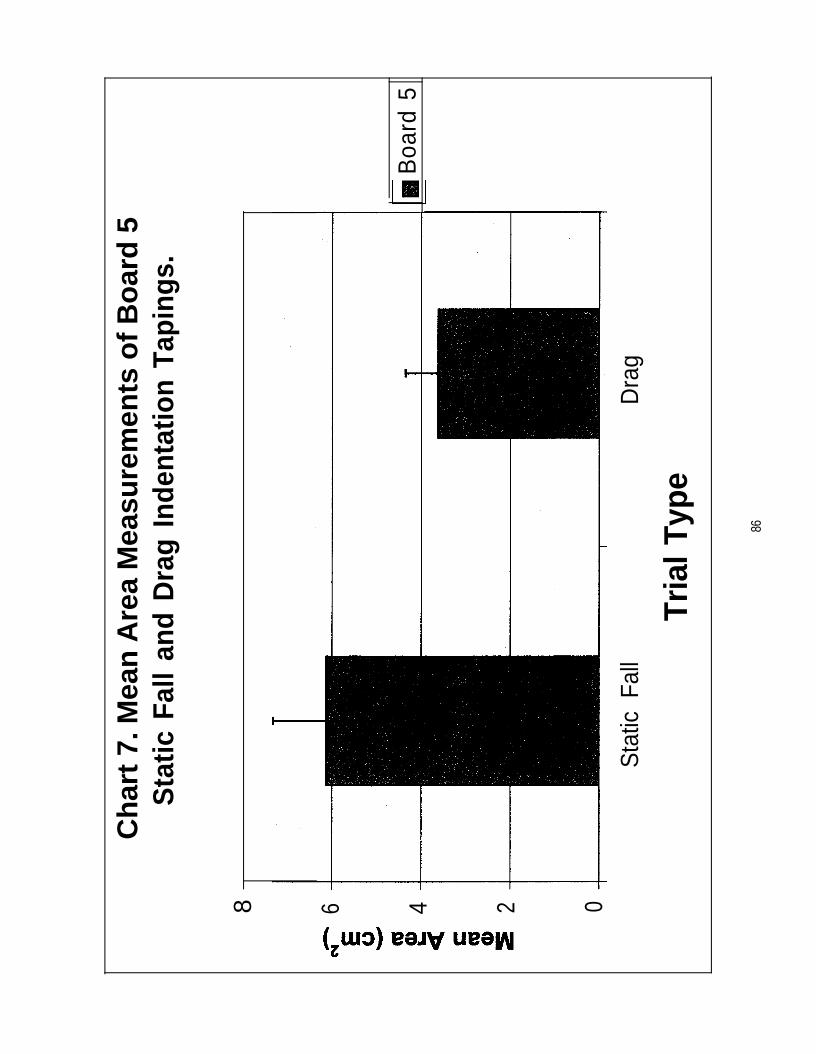
Ch
art
7. M
ean
Are
a M
easu
rem
ents
of
Bo
ard
5S
tatic
Fal
l an
d D
rag
Inde
ntat
ion
Tapi
ngs.
8 6 4 2 0St
atic
Fal
lD
rag
Tria
l Typ
e
Boa
rd 5
86
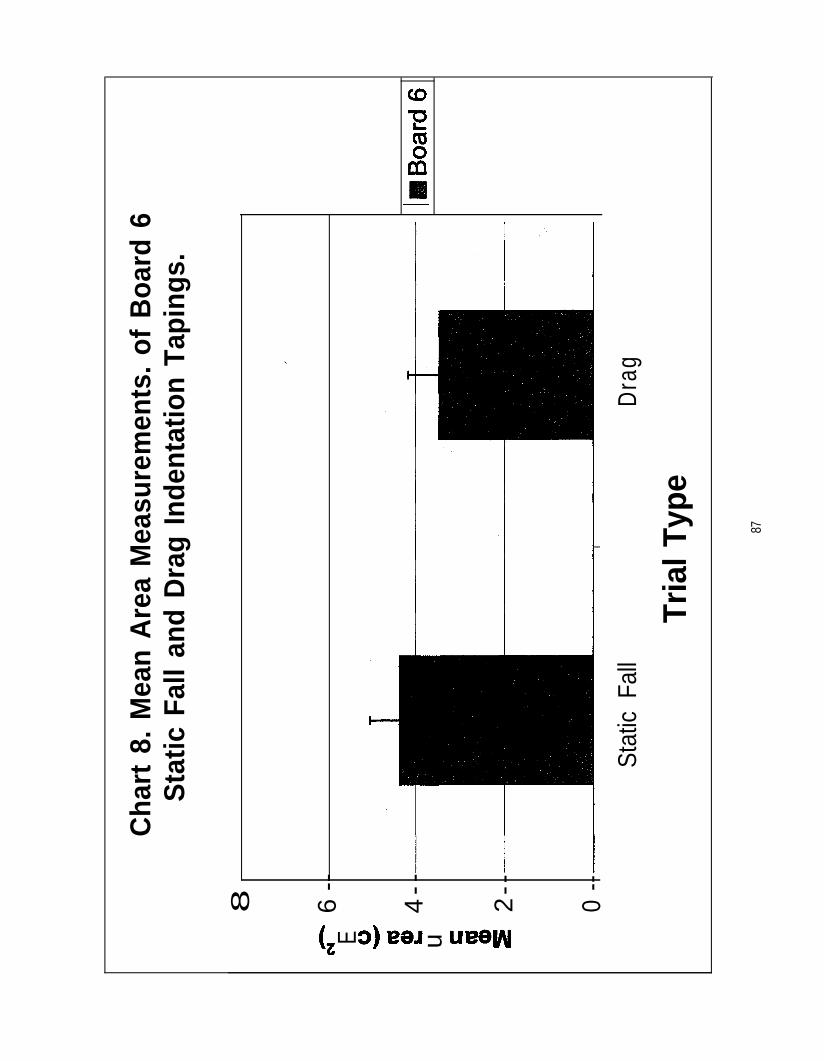
Cha
rt 8
. M
ean
Are
a M
easu
rem
ents
. of
Boa
rd 6
Sta
tic F
all
and
Dra
g In
dent
atio
n Ta
ping
s.
Stat
ic F
all
Dra
g
Tria
l Typ
e
8
cu-
6 --
E 22 i! u4
--
i 32
--
0 --
87
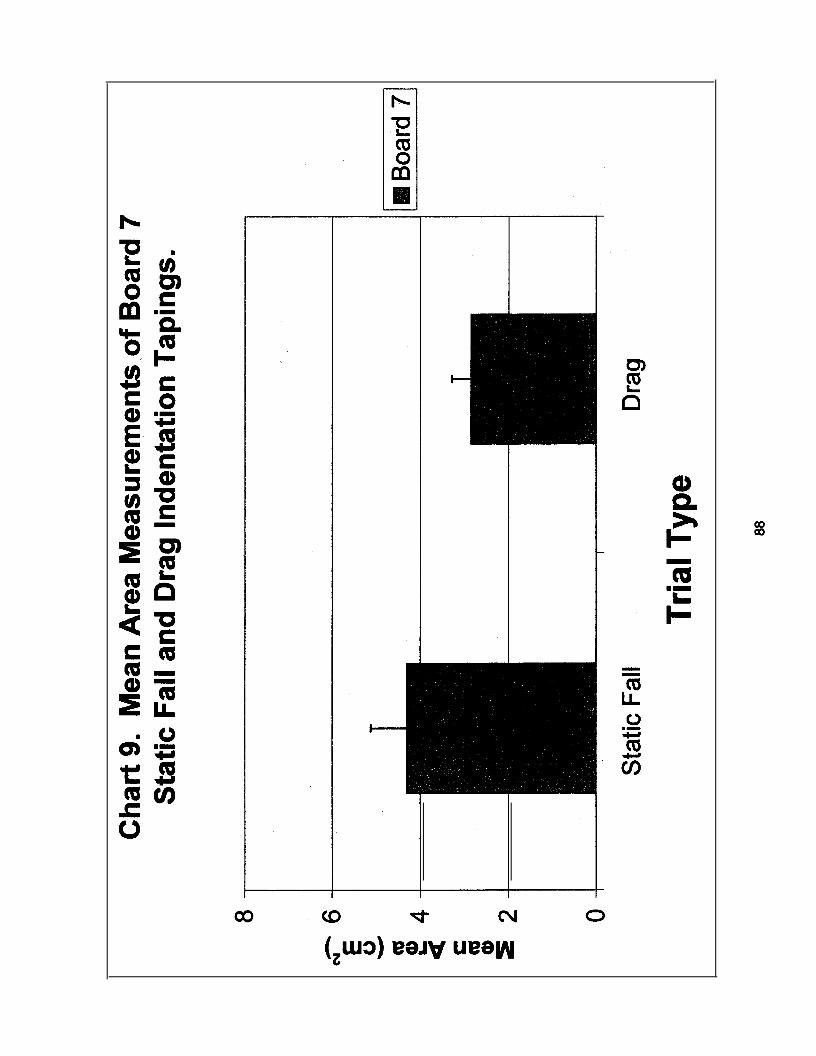
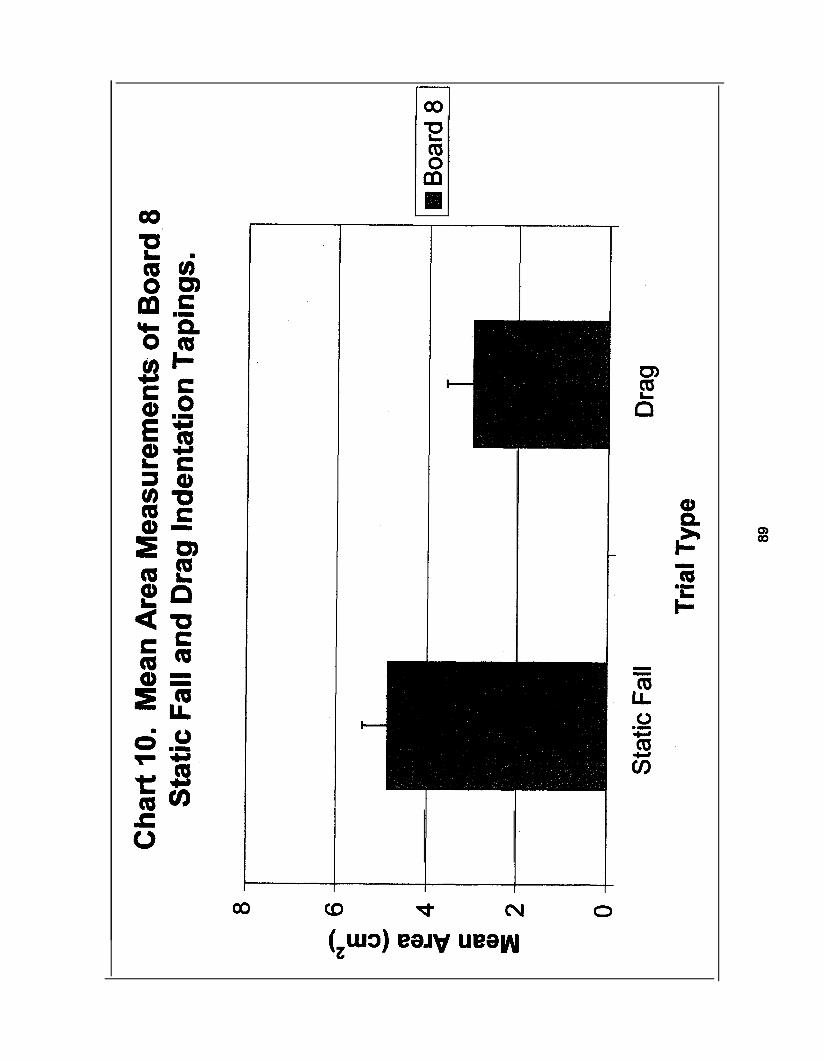
0
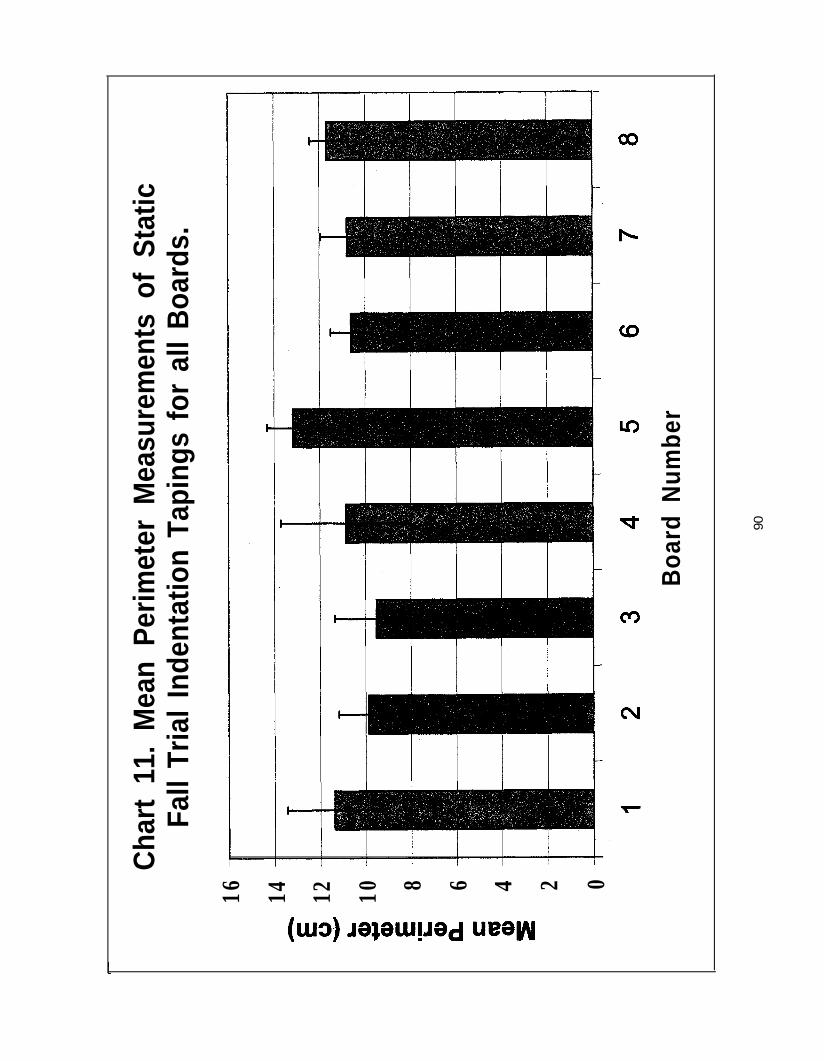
16 14 12 10 8 6 4 2 0
Cha
rt 1
1. M
ean
Per
imet
er M
easu
rem
ents
of
Sta
ticFa
ll Tr
ial
Inde
ntat
ion
Tapi
ngs
for
all
Boa
rds.
Boa
rd N
umbe
r
90
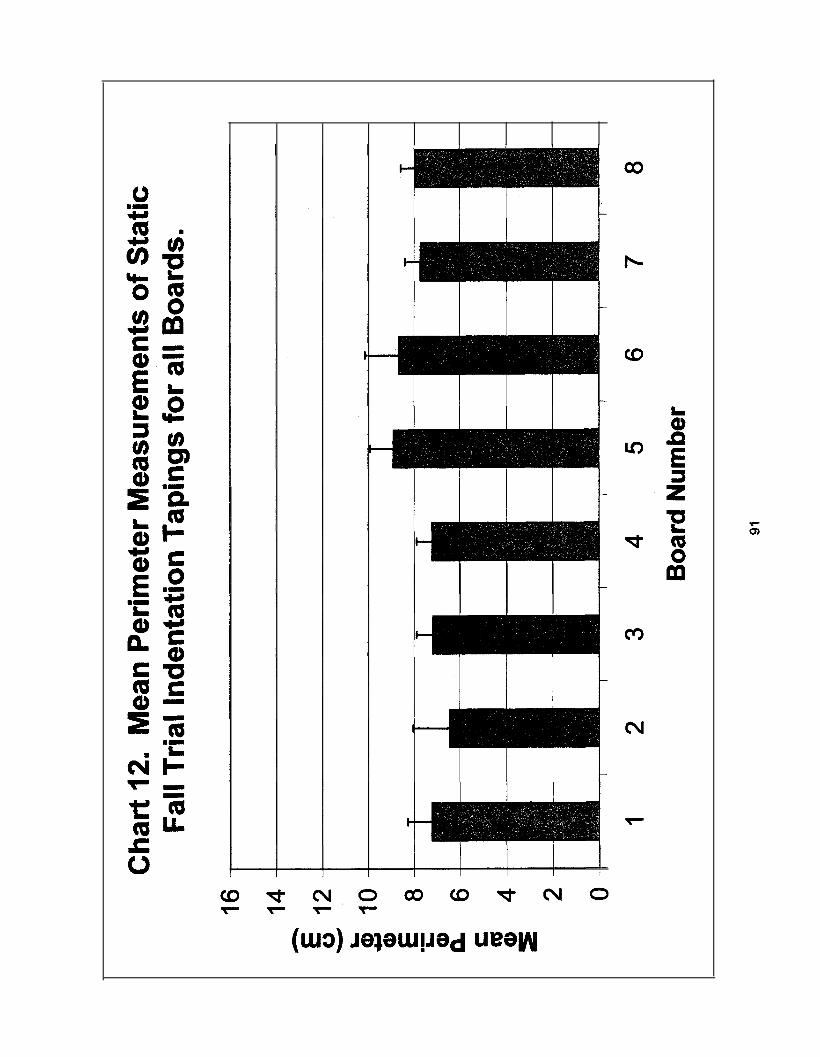
0

Cha
rt 1
3. M
ean
Per
imet
er M
easu
rem
ents
of
Boa
rd 1
Sta
tic F
all a
nd D
rag
Inde
ntat
ion
Tapi
ngs
16 14 12 10 8 6 4 2 0S
tatic
Fall
Dra
g
Tria
l Ty
pe
92
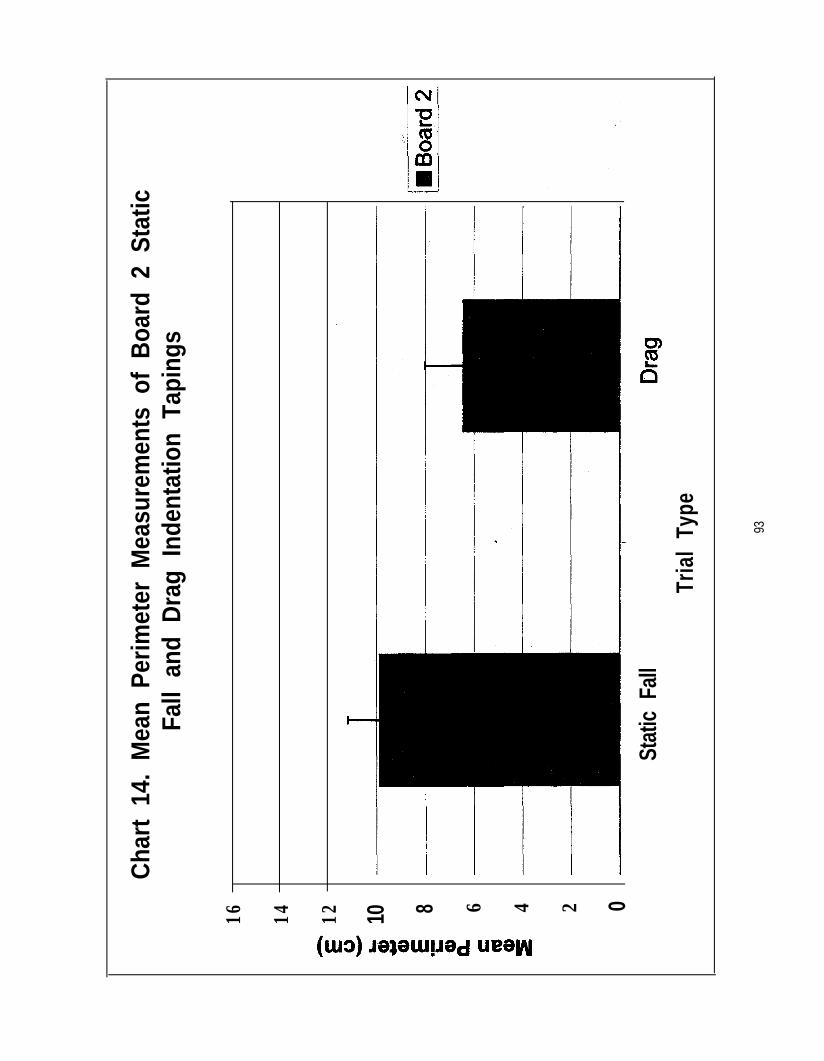
16 14 12 10 8 6 4 2 0
Cha
rt 1
4. M
ean
Perim
eter
Mea
sure
men
ts o
f B
oard
2 S
tatic
Fall
and
Dra
g In
dent
atio
n Ta
ping
s
Stat
ic F
all
Tria
l Ty
pe
93

r
Ch
art
15.
Mea
n P
erim
eter
Mea
sure
men
ts o
f B
oar
d 3
Sta
tic
Fal
l an
d D
rag
Ind
enta
tion
Tap
ing
s
16 14 2 0
Tria
l Ty
pe
WI B
oard
3
Stat
ic F
all
Drag
94
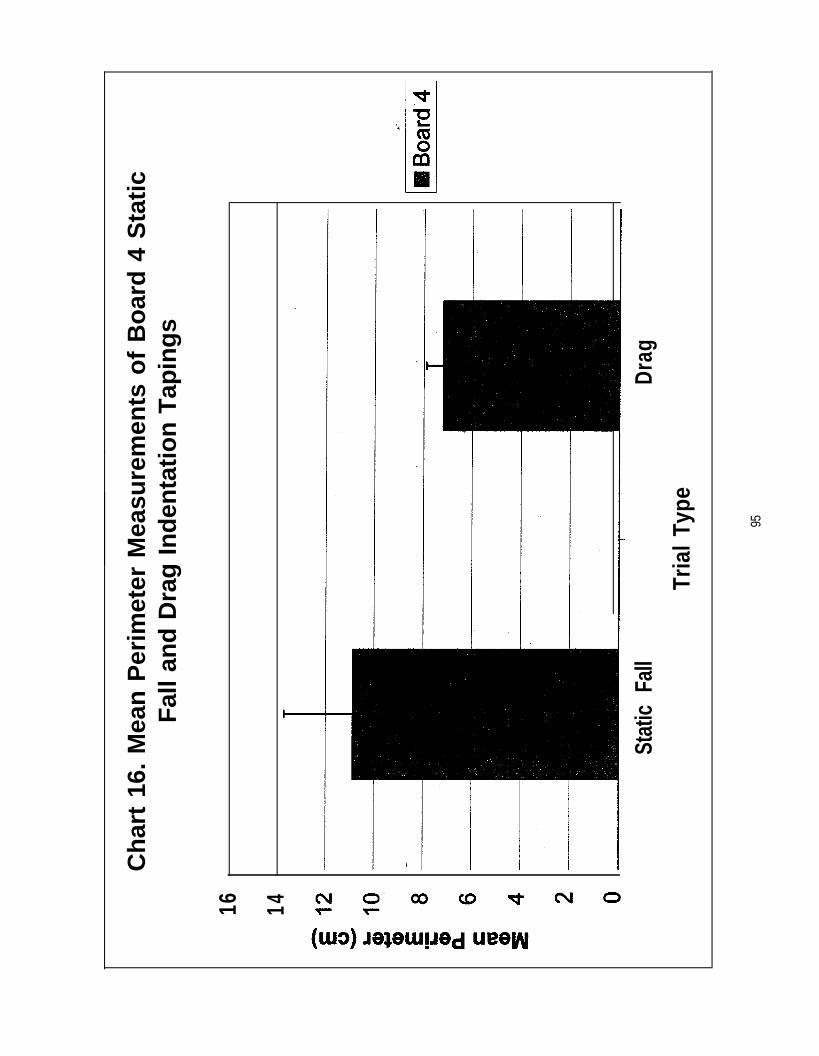
16 14
Ch
art
16.
Mea
n P
erim
eter
Mea
sure
men
ts o
f B
oar
d 4
Sta
tic
Fal
l an
d D
rag
Ind
enta
tion
Tap
ing
s
Stat
ic F
all
Tria
l Ty
pe
Drag
95
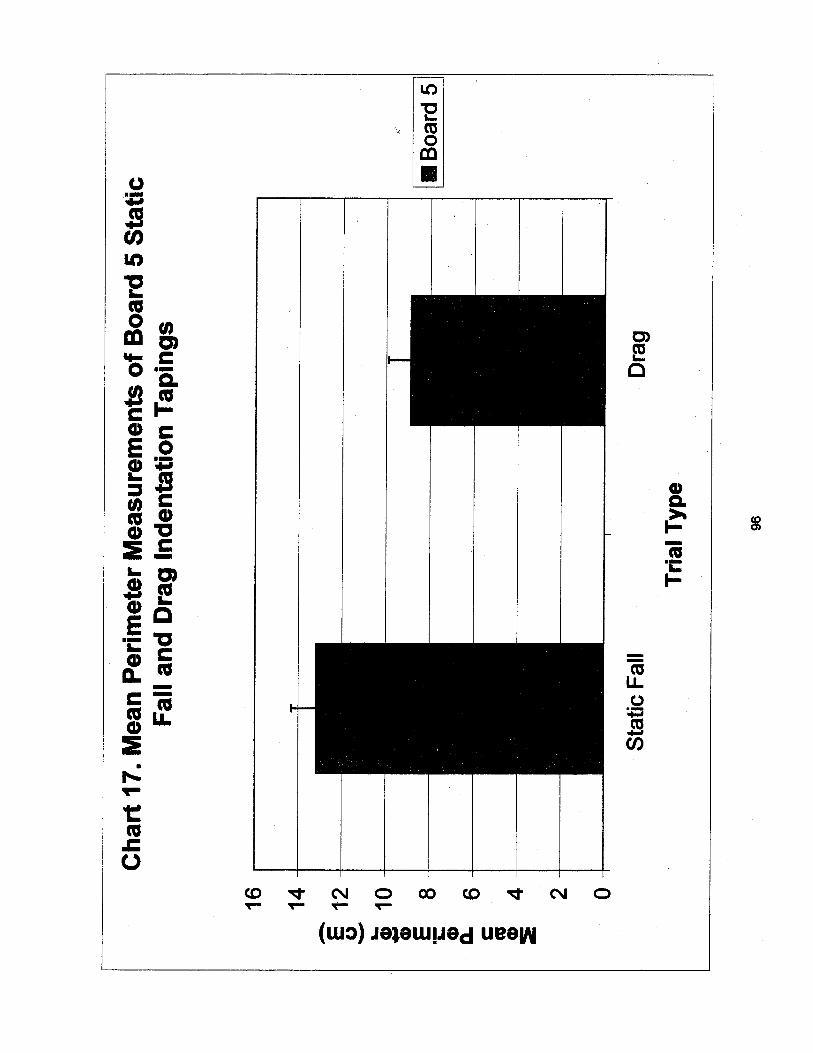
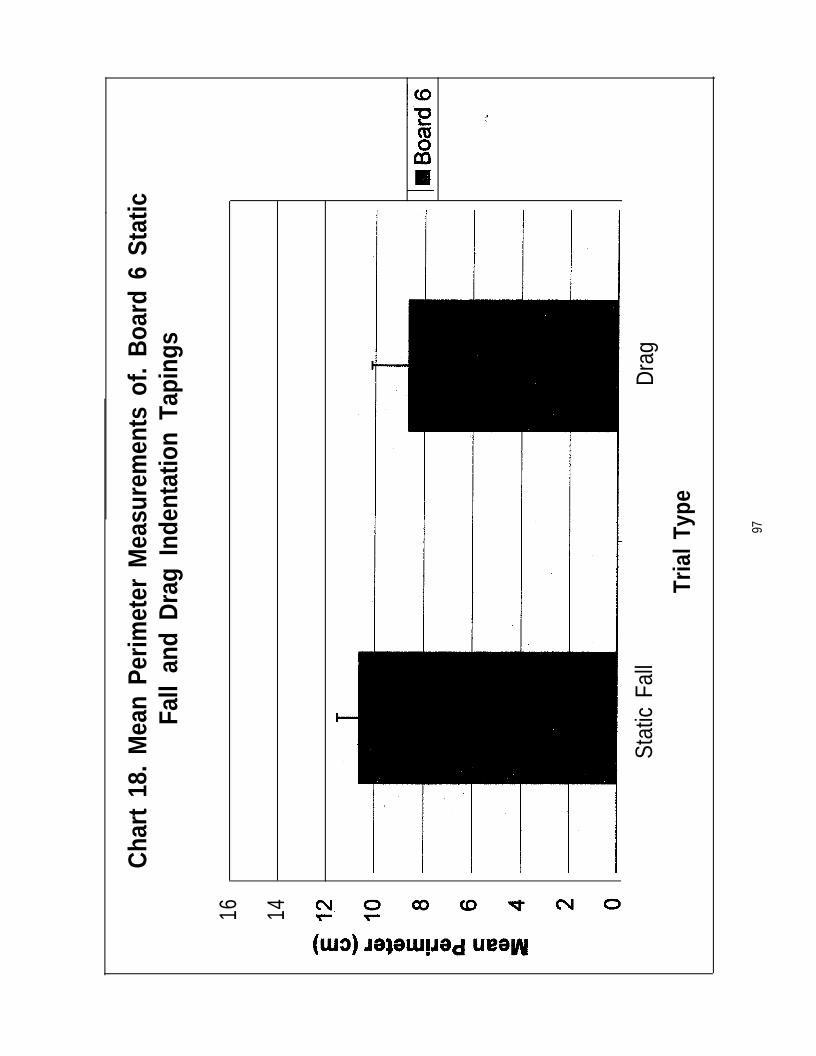
16 14
Cha
rt 1
8. M
ean
Perim
eter
Mea
sure
men
ts o
f. B
oard
6 S
tatic
Fall
and
Dra
g In
dent
atio
n Ta
ping
s
Stat
ic F
all
Tria
l Ty
pe
Dra
g
97
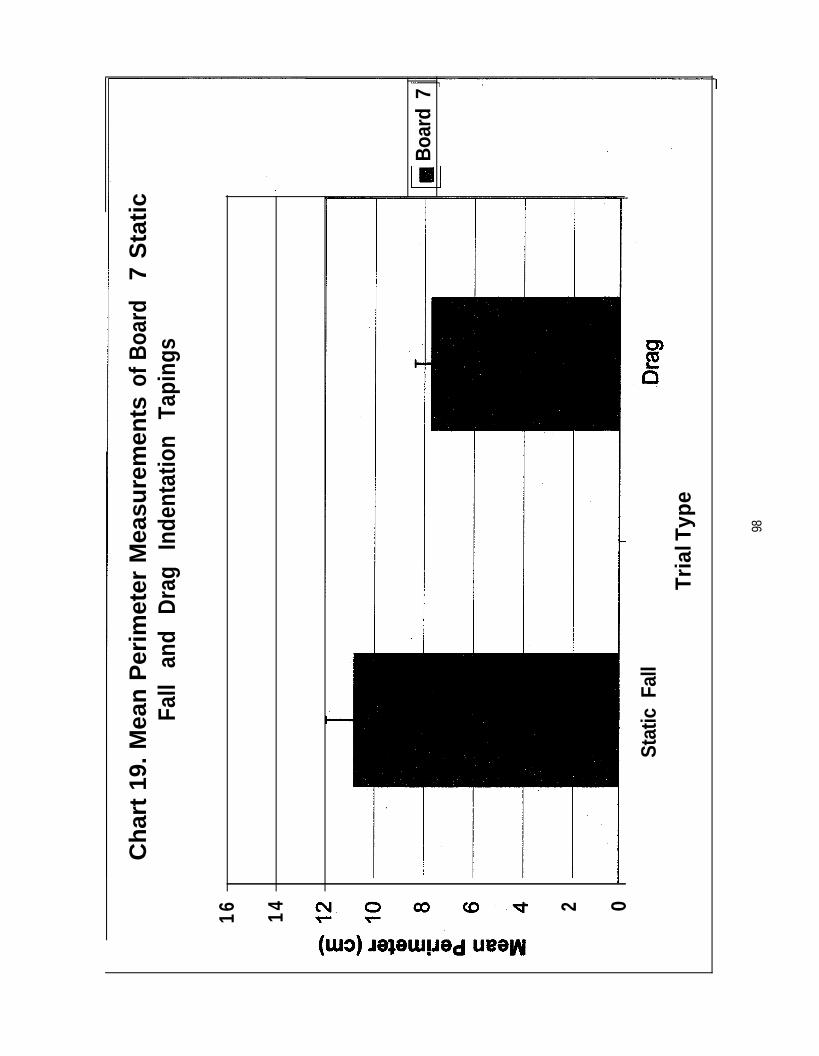
16 14 2 0
Ch
art
19.
Mea
n P
erim
eter
Mea
sure
men
ts o
f Boa
rd 7
Sta
tic
Fall
and
Dra
g In
dent
atio
n Ta
ping
s
Boa
rd 7
Stat
ic F
all
Tria
l Typ
e
98
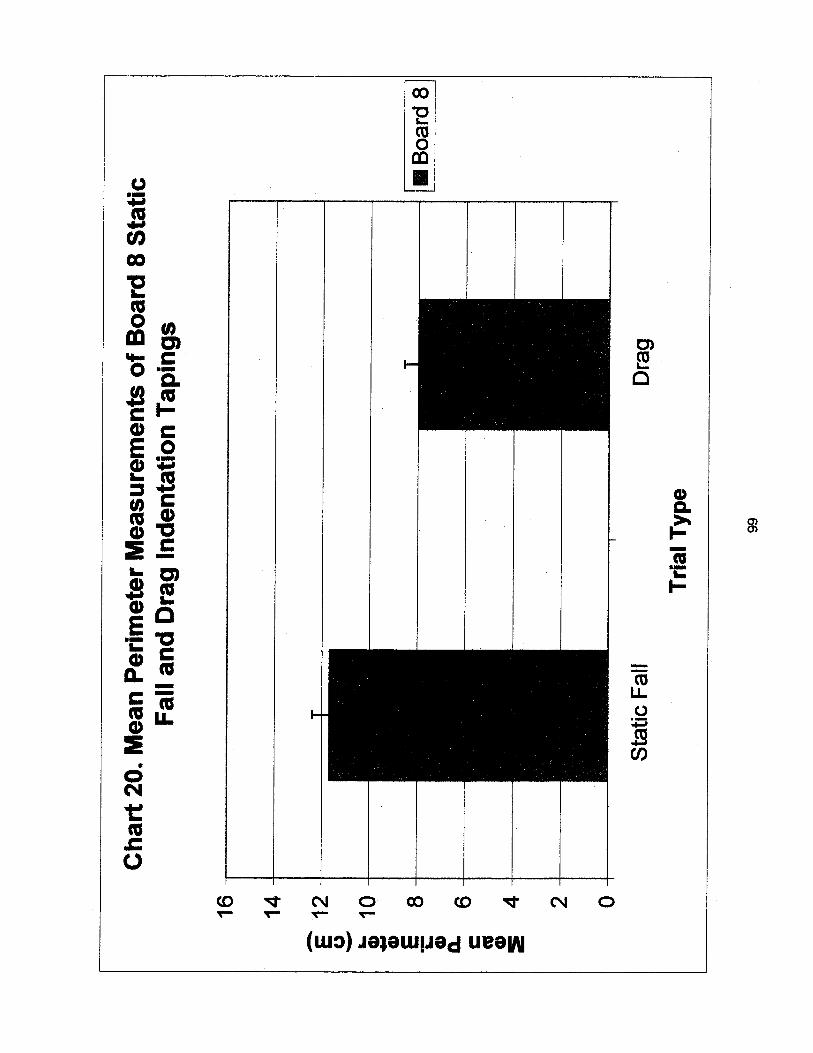
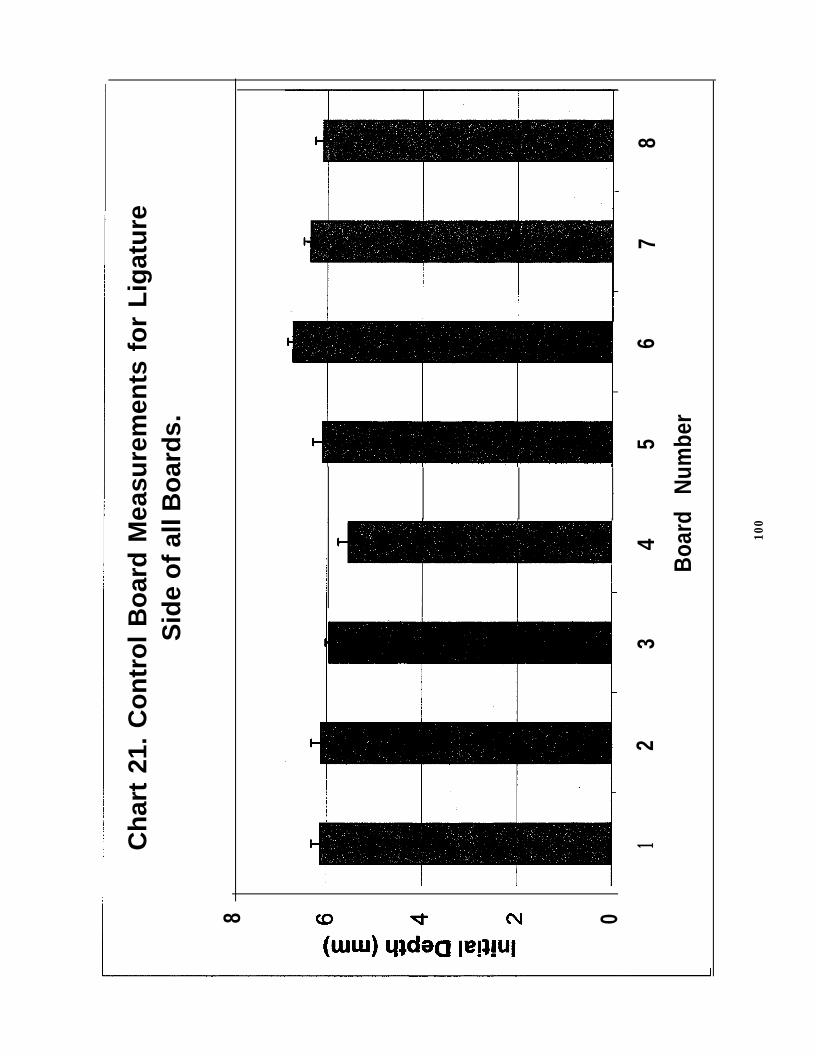
8
P6
E r 54
P 3 .a =2 0
Ch
art
21.
Co
ntr
ol
Bo
ard
Mea
sure
men
ts f
or
Lig
atu
reS
ide
of a
ll B
oar
ds.
I
12
34
5
Boa
rd
Num
ber
67
8
100
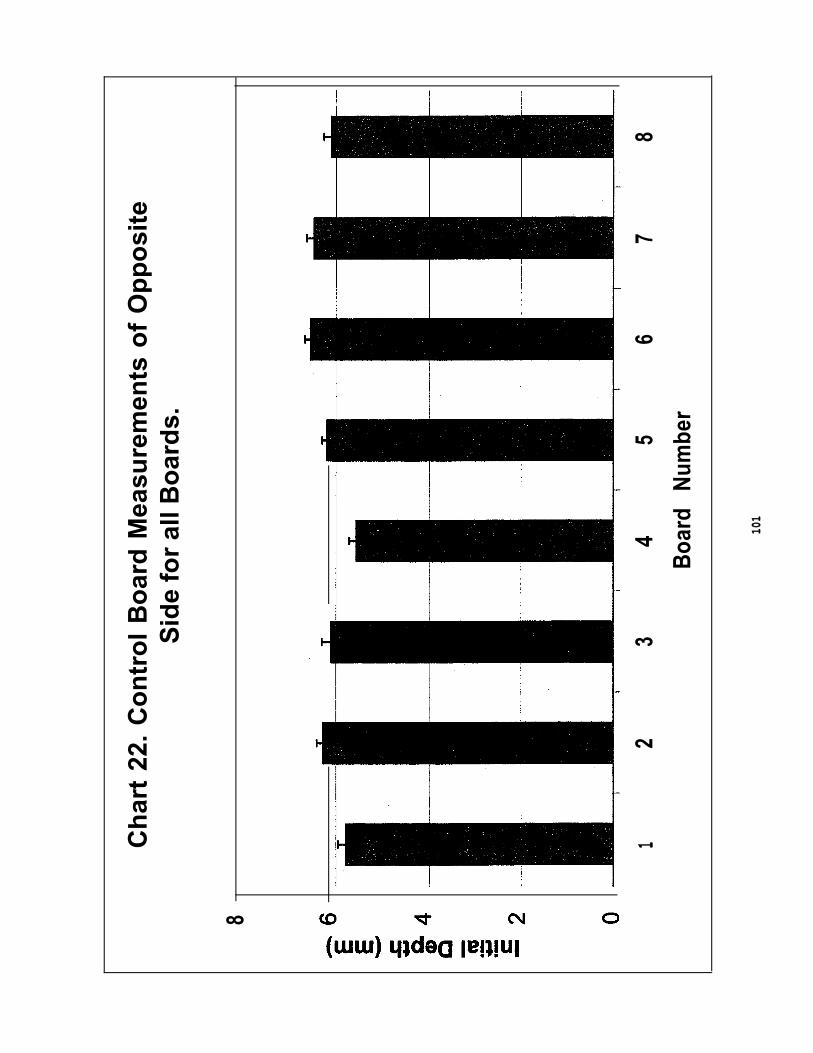
8
Ch
art
22.
Co
ntr
ol
Bo
ard
Mea
sure
men
ts o
f O
pp
osi
teS
ide
for
all B
oar
ds.
12
34
5
Boa
rd
Num
ber
67
8
101
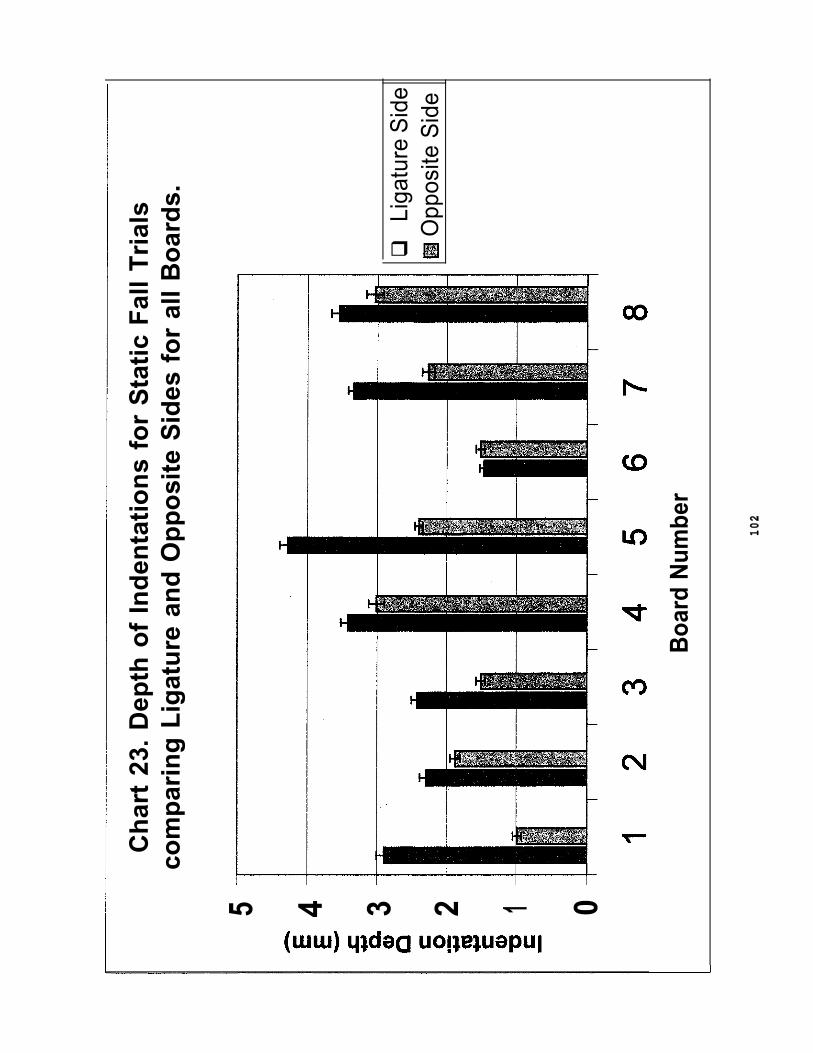
Ch
art
23.
Dep
th o
f In
den
tati
on
s fo
r S
tati
c F
all
Tri
als
com
par
ing
Lig
atu
re a
nd
Op
po
site
Sid
es f
or
all
Bo
ard
s.
5 4 3 2 1 0
!
Liga
ture
Sid
e O
ppos
ite S
ide
Boa
rd N
umbe
r
102
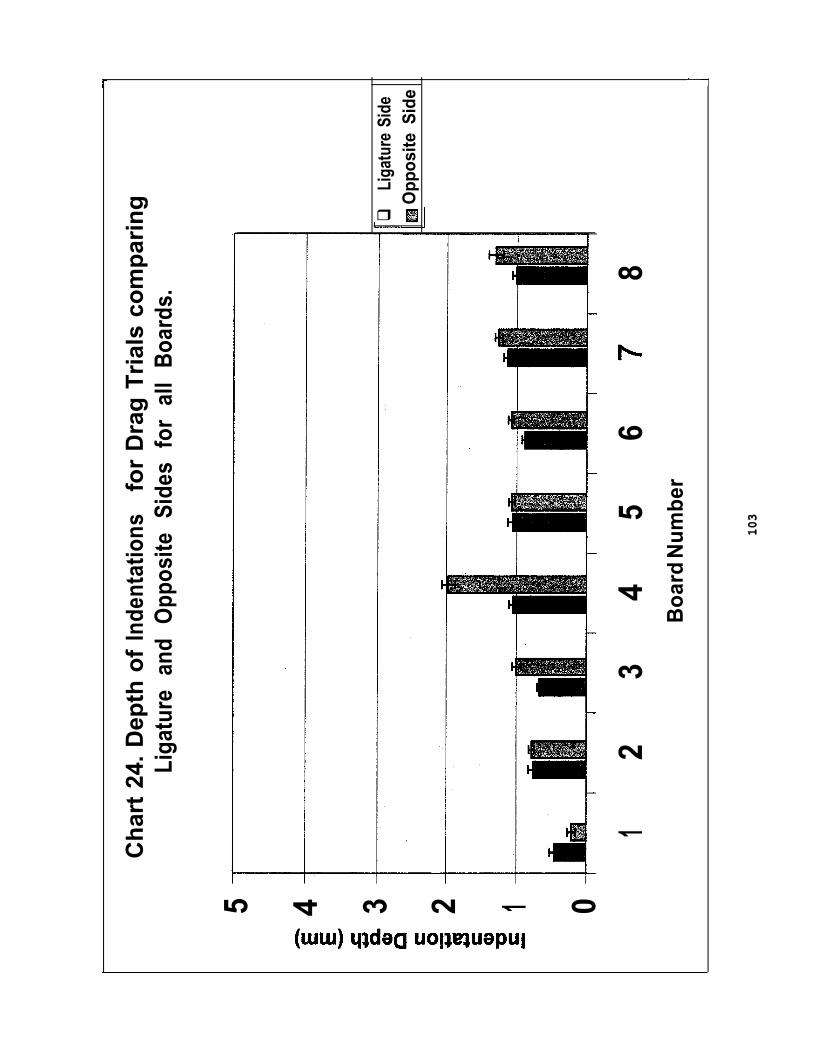
5 4 3 2 1 0
Ch
art
24.
Dep
th o
f In
dent
atio
ns f
or
Dra
g T
rial
s co
mp
arin
gLi
gatu
re a
nd O
ppos
ite S
ides
for
all
Boa
rds.
12
34
56
Boa
rd N
umbe
r
8
!
Liga
ture
Sid
eO
ppos
ite S
ide
103
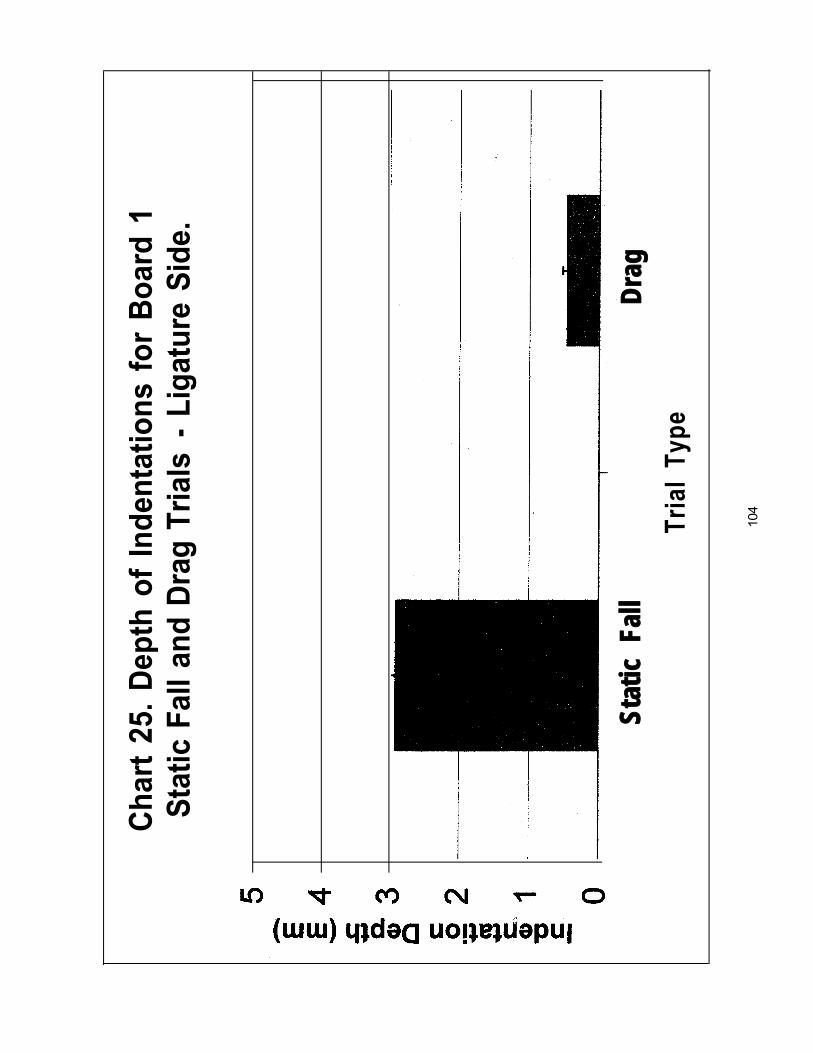
Cha
rt 2
5. D
epth
of
Inde
ntat
ions
for
Boa
rd 1
Sta
tic F
all a
nd D
rag
Tria
ls -
Lig
atur
e S
ide.
Stat
ic F
all
Tria
l Ty
pe
Drag
104
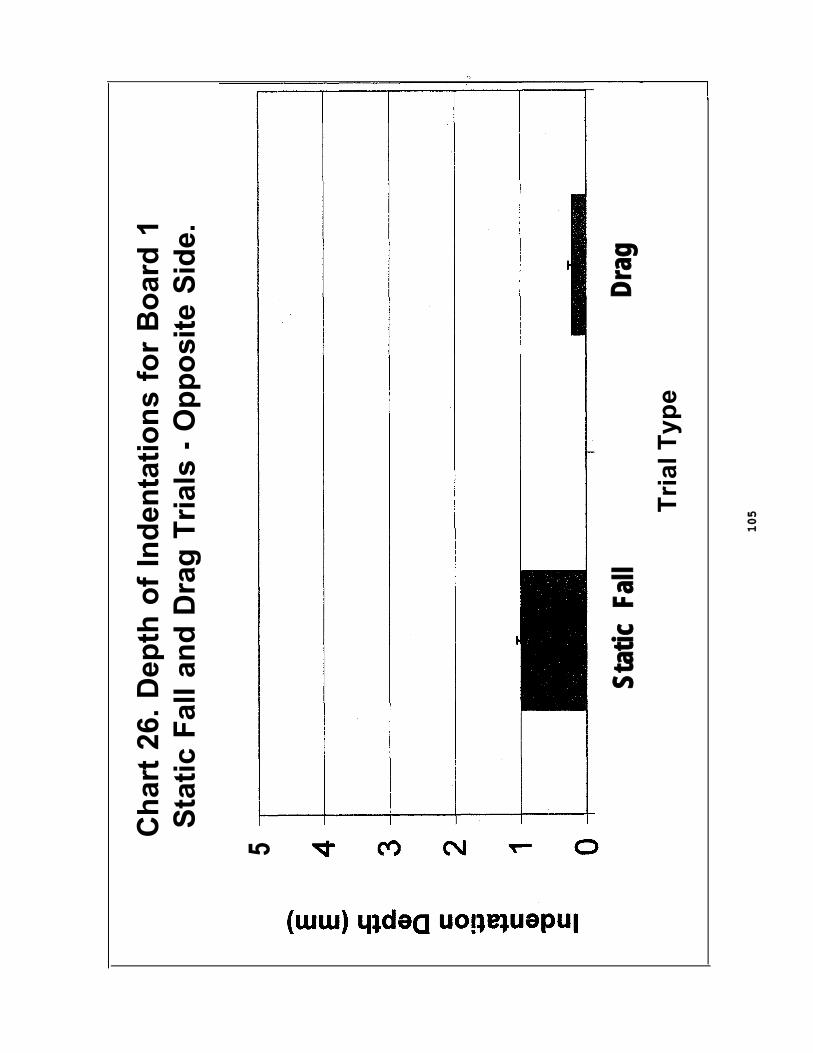
5
Ch
art
26.
Dep
th o
f In
den
tati
on
s fo
r B
oar
d 1
Sta
tic
Fal
l an
d D
rag
Tri
als
- O
pp
osi
te S
ide.
Stat
ic F
all
Tri
al T
ype
Drag
105

5 4 3 2 1 0
Ch
art
27. D
epth
of
Ind
enta
tio
ns
for
Bo
ard
2 S
tati
c F
all a
nd
Dra
g Tr
ials
- L
igat
ure
Sid
e.
Sta
tic F
all
Tria
l Typ
e
106
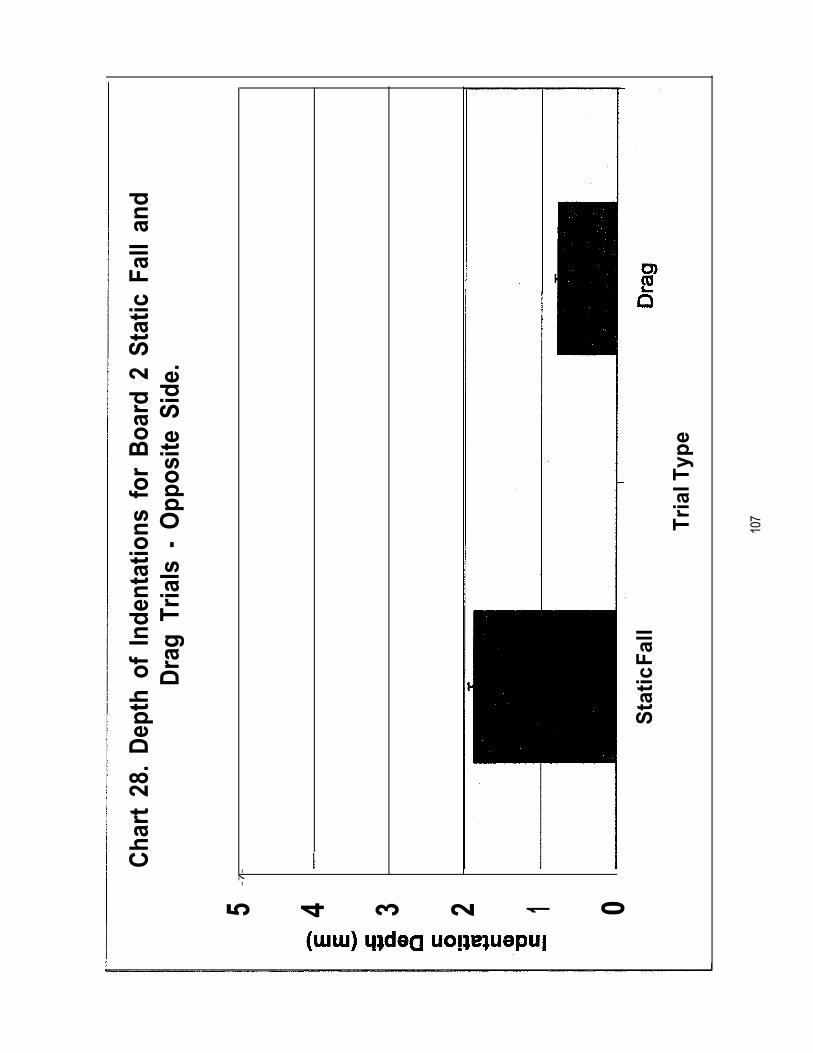
5 4 3 2 1 0
-7
-
Cha
rt 2
8. D
epth
of
Inde
ntat
ions
for
Boa
rd 2
Sta
tic F
all
and
Dra
g Tr
ials
- O
ppos
ite S
ide.
Sta
tic F
all
Tria
l Typ
e
107
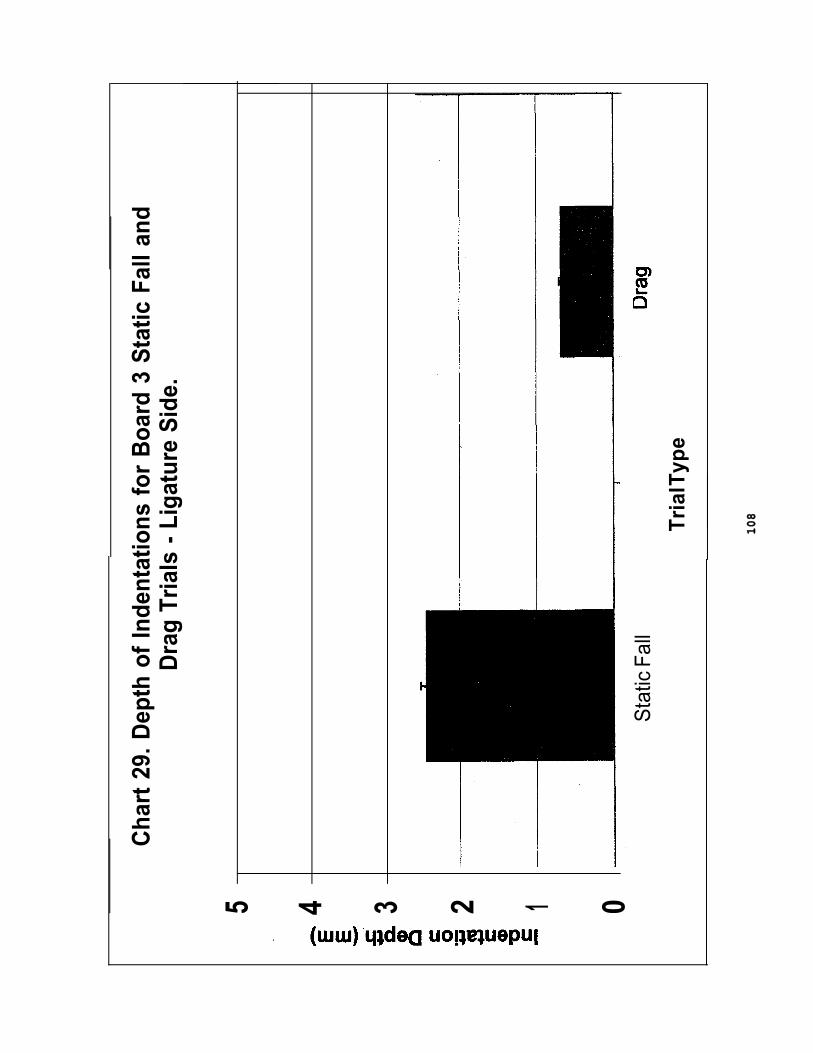
5 4 3 2 1 0
Cha
rt 2
9. D
epth
of
Inde
ntat
ions
for
Boa
rd 3
Sta
tic F
all a
ndD
rag
Tria
ls -
Lig
atur
e S
ide.
Sta
tic F
all
Tria
l Typ
e
108
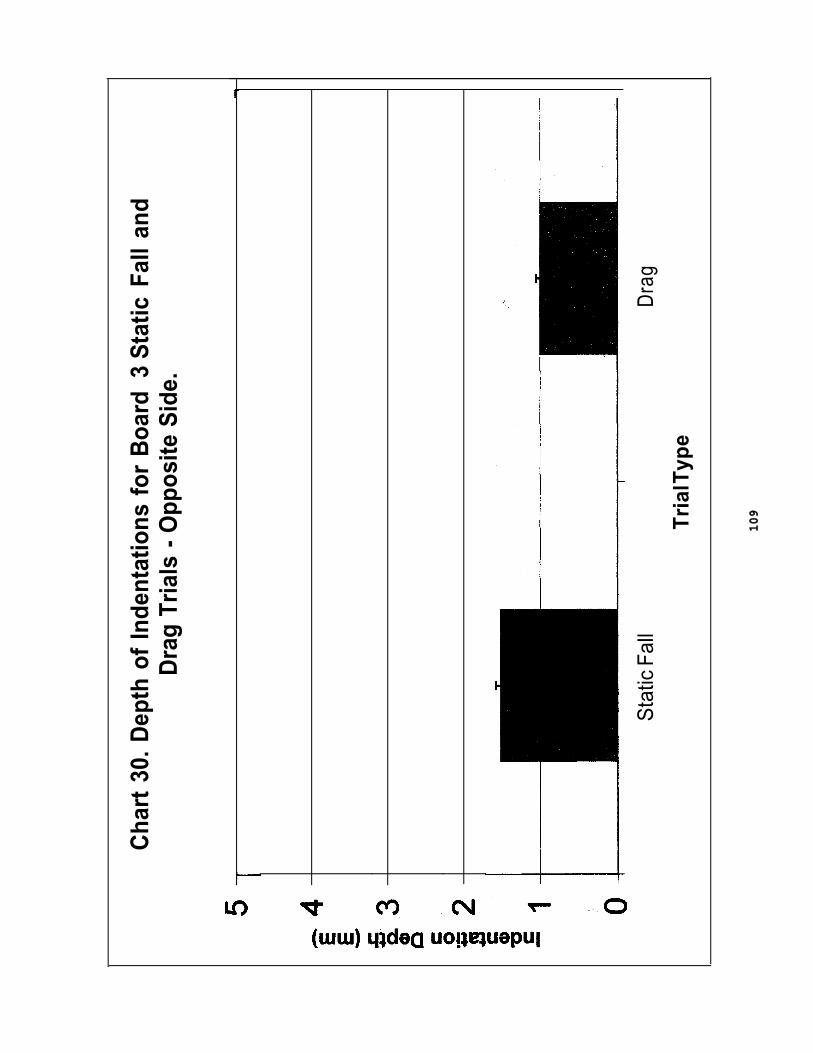
Cha
rt 3
0. D
epth
of
Inde
ntat
ions
for
Boa
rd 3
Sta
tic F
all
and
Dra
g Tr
ials
- O
ppos
ite S
ide.
Sta
tic F
all
Tria
l Typ
e
Dra
g
109
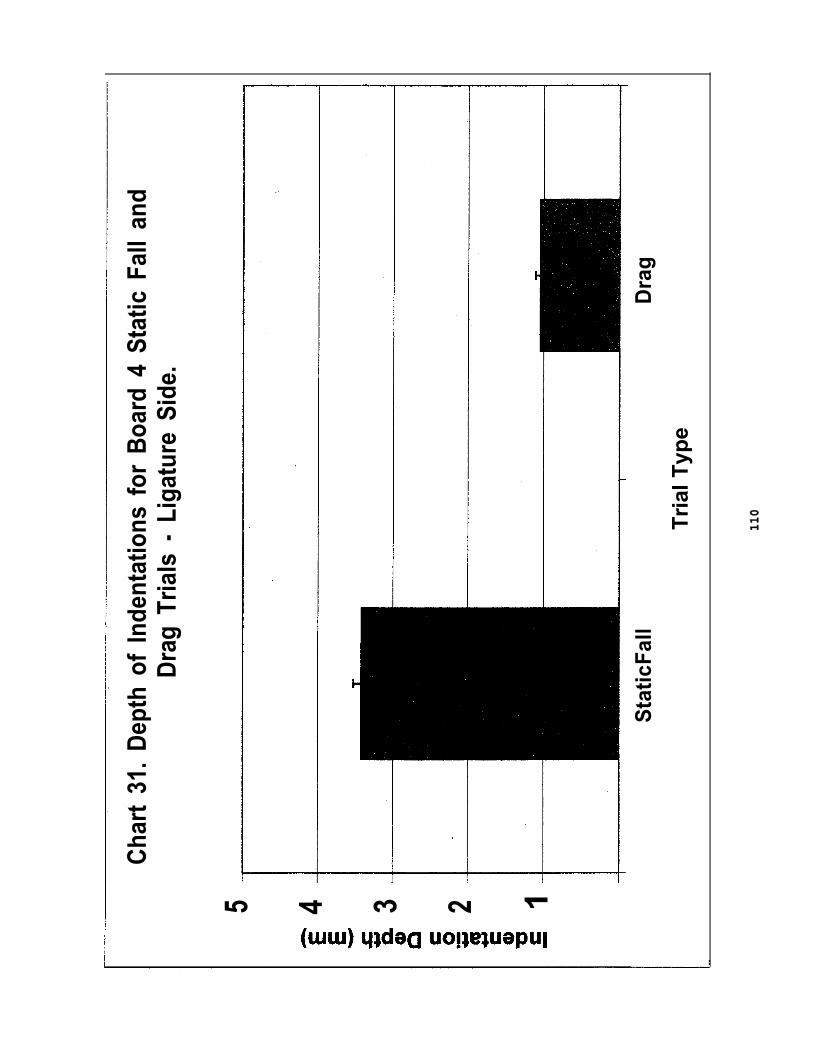
Cha
rt 3
1. D
epth
of
Inde
ntat
ions
for
Boa
rd 4
Sta
tic F
all
and
Dra
g Tr
ials
- L
igat
ure
Side
.
5 4 3 2 1
Sta
tic F
all
Tri
al T
ype
Dra
g
110
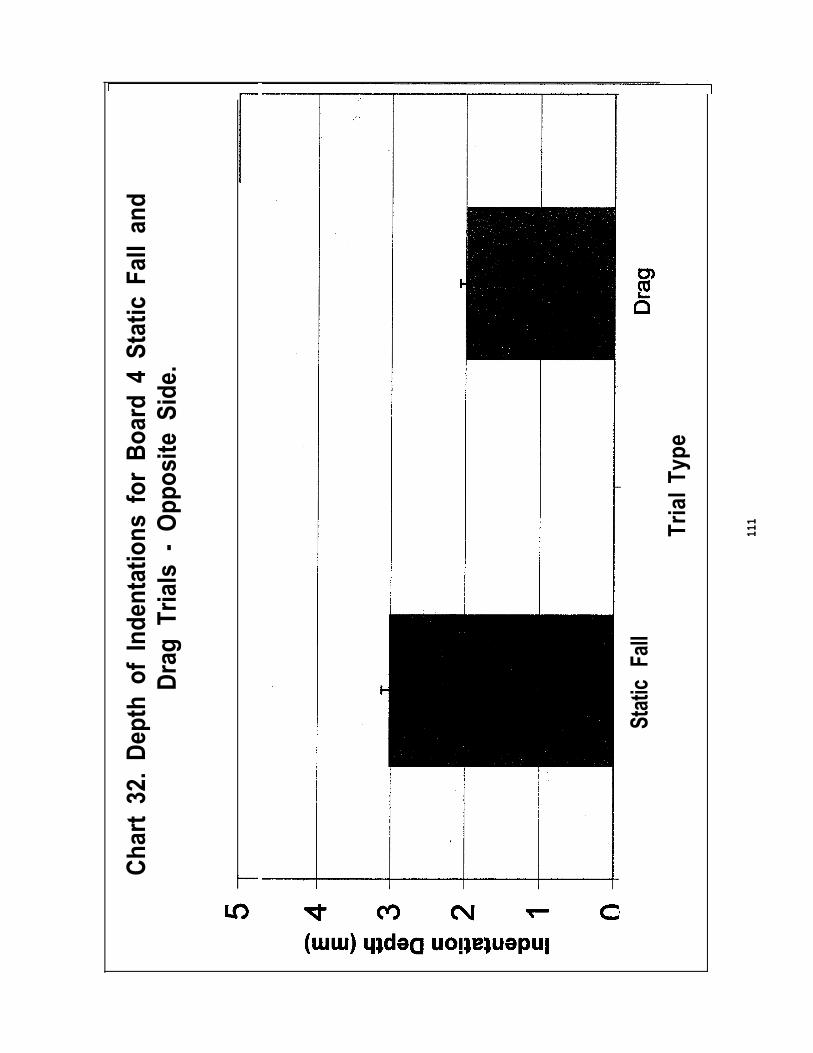
Cha
rt 3
2. D
epth
of
Inde
ntat
ions
for
Boa
rd 4
Sta
tic F
all
and
Dra
g Tr
ials
- O
ppos
ite S
ide.
Stat
ic F
all
Tria
l Ty
pe
111
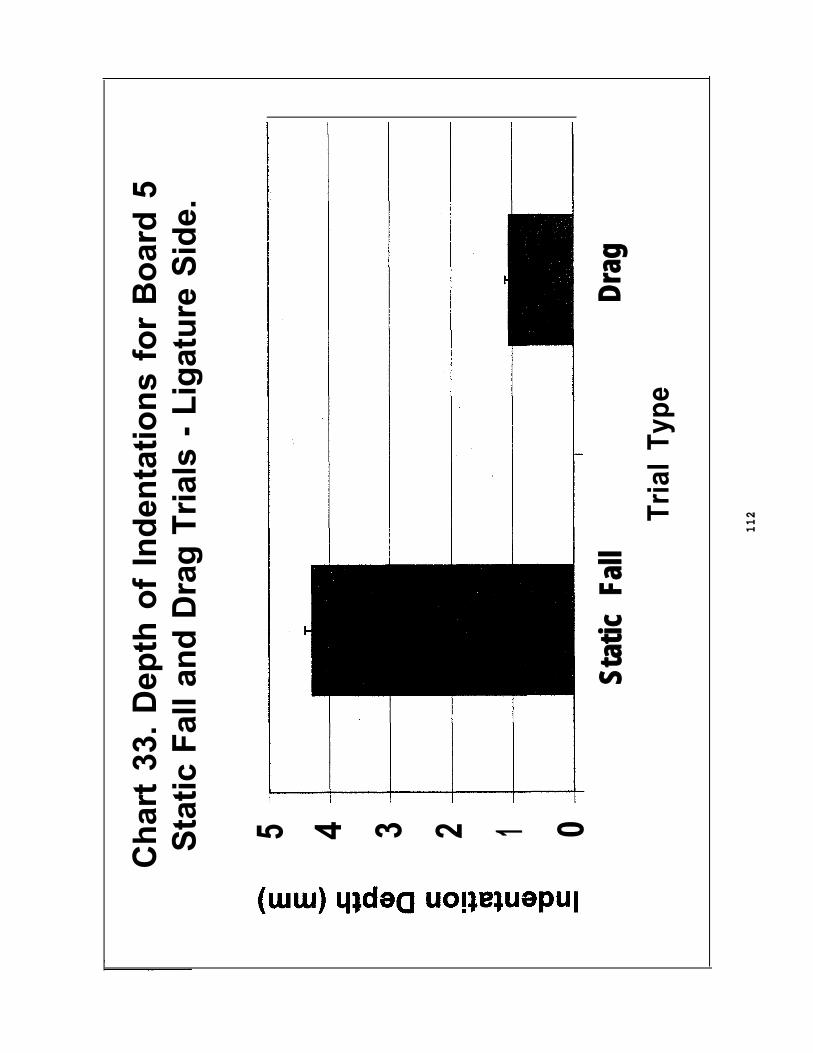
Ch
art
33.
Dep
th o
f In
den
tati
on
s fo
r B
oar
d 5
Sta
tic
Fal
l an
d D
rag
Tri
als
- L
igat
ure
Sid
e.
5 4 3 2 1 0St
atic
Fal
lDr
agTr
ial
Type
112
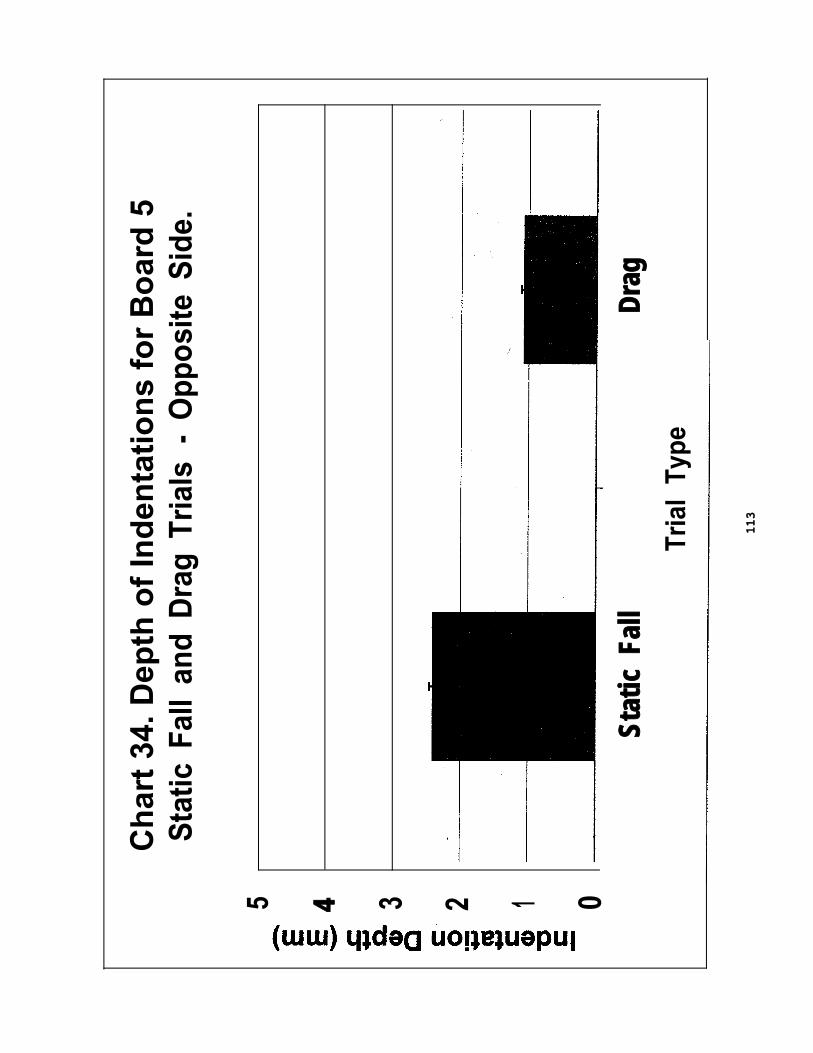
5 4 3 2 1 0
Ch
art
34. D
epth
of
Ind
enta
tio
ns
for
Bo
ard
5S
tatic
Fal
l an
d D
rag
Tria
ls -
Opp
osite
Sid
e.
Stat
ic F
all
Drag
Tria
l Ty
pe
113
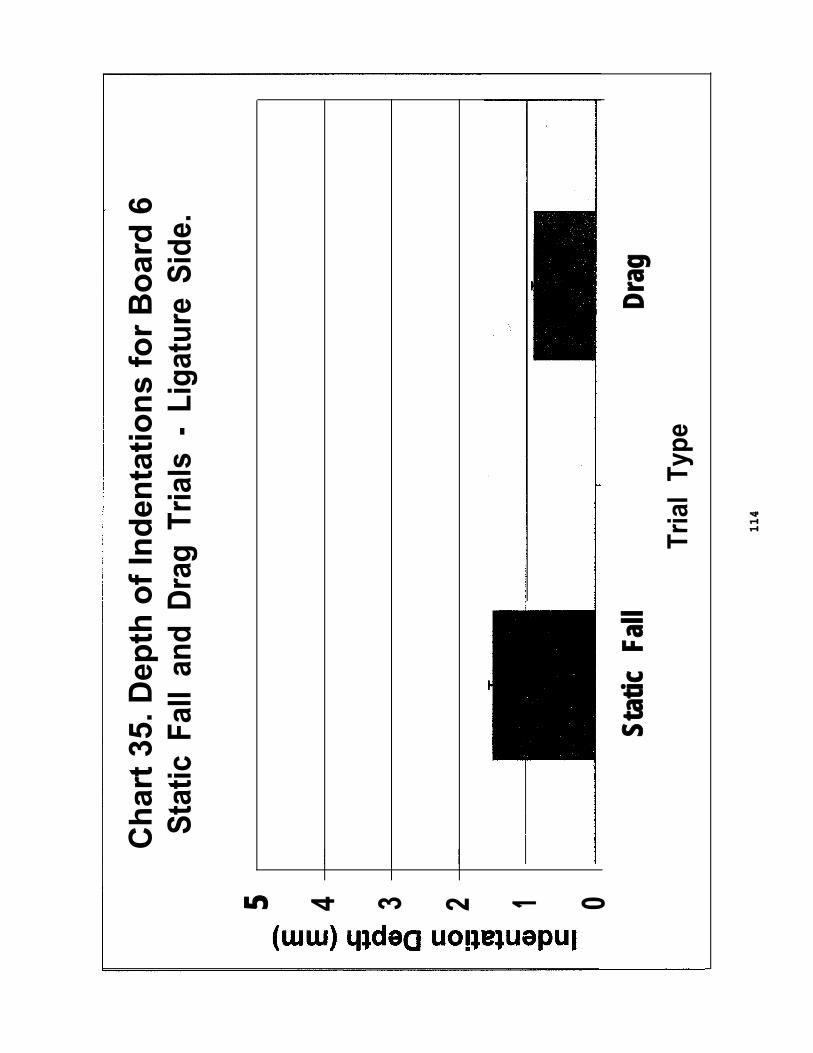
5 4 3 2 1 0
Ch
art
35. D
epth
of
Ind
enta
tio
ns
for
Bo
ard
6S
tatic
Fal
l an
d D
rag
Tria
ls -
Lig
atur
e S
ide.
Stat
ic F
all
Drag
Tria
l Ty
pe
114
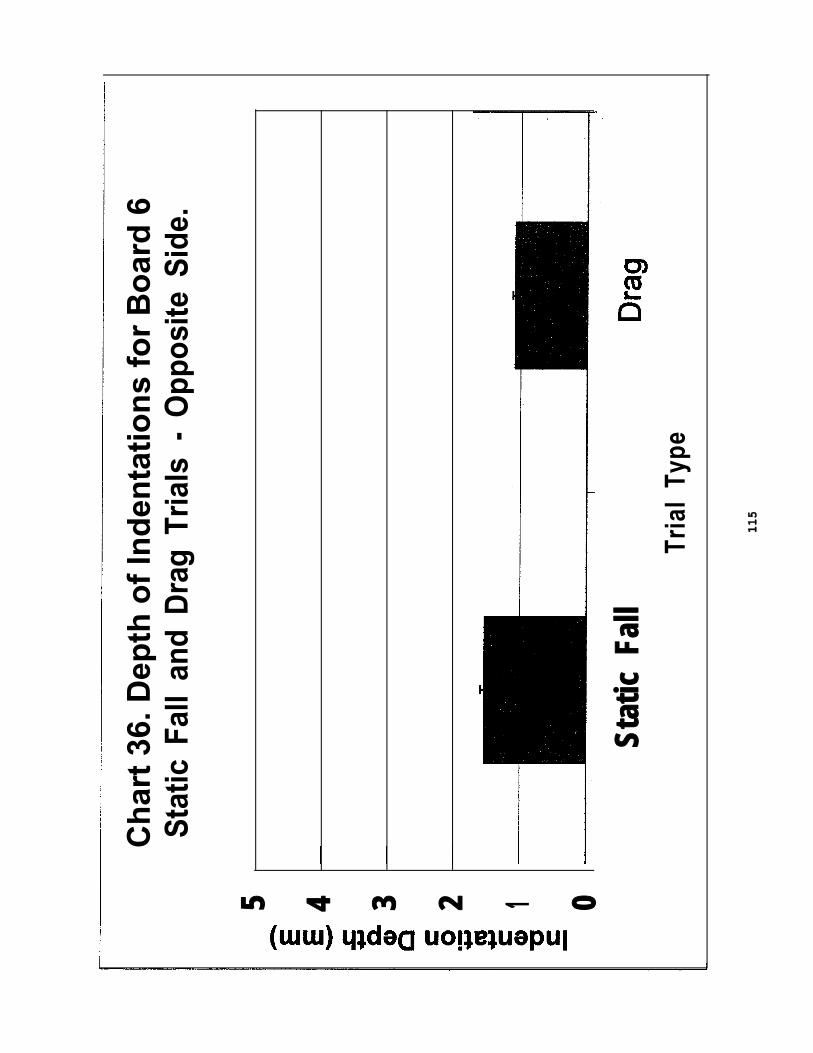
5 4 3 2 1 0
Ch
art
36. D
epth
of
Ind
enta
tio
ns
for
Bo
ard
6S
tatic
Fal
l an
d D
rag
Tria
ls -
Opp
osite
Sid
e.
Stat
ic F
all
Tria
l Ty
pe
115
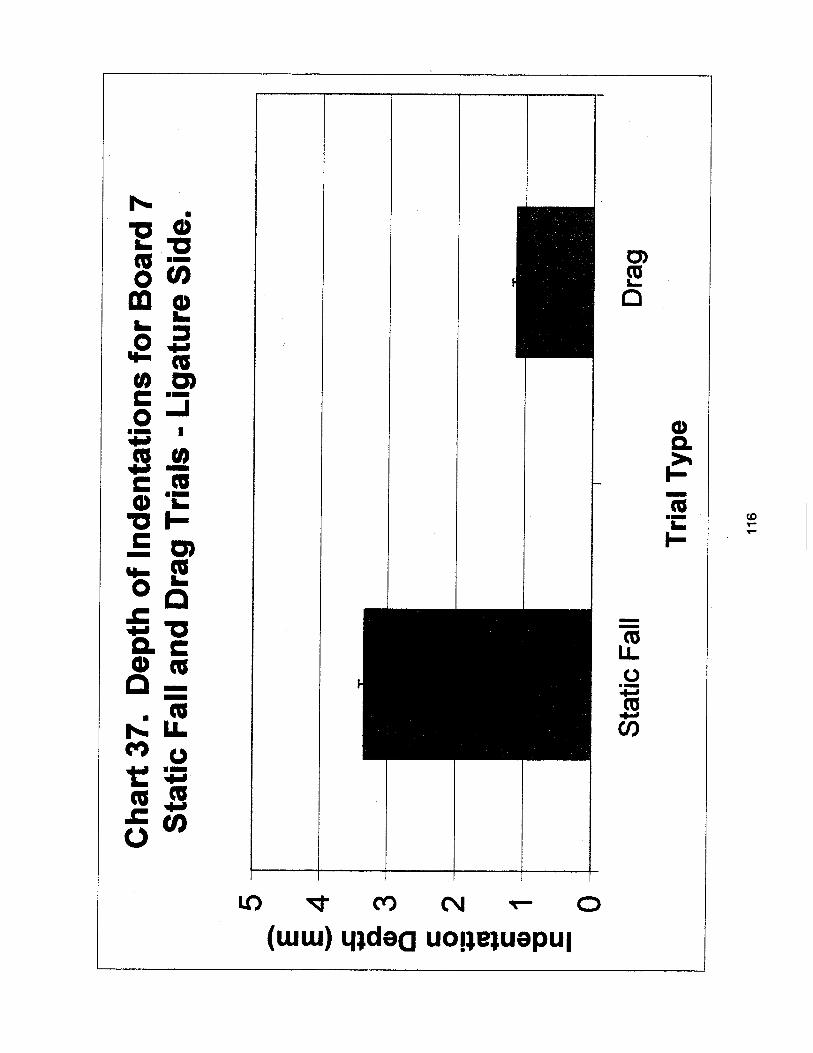
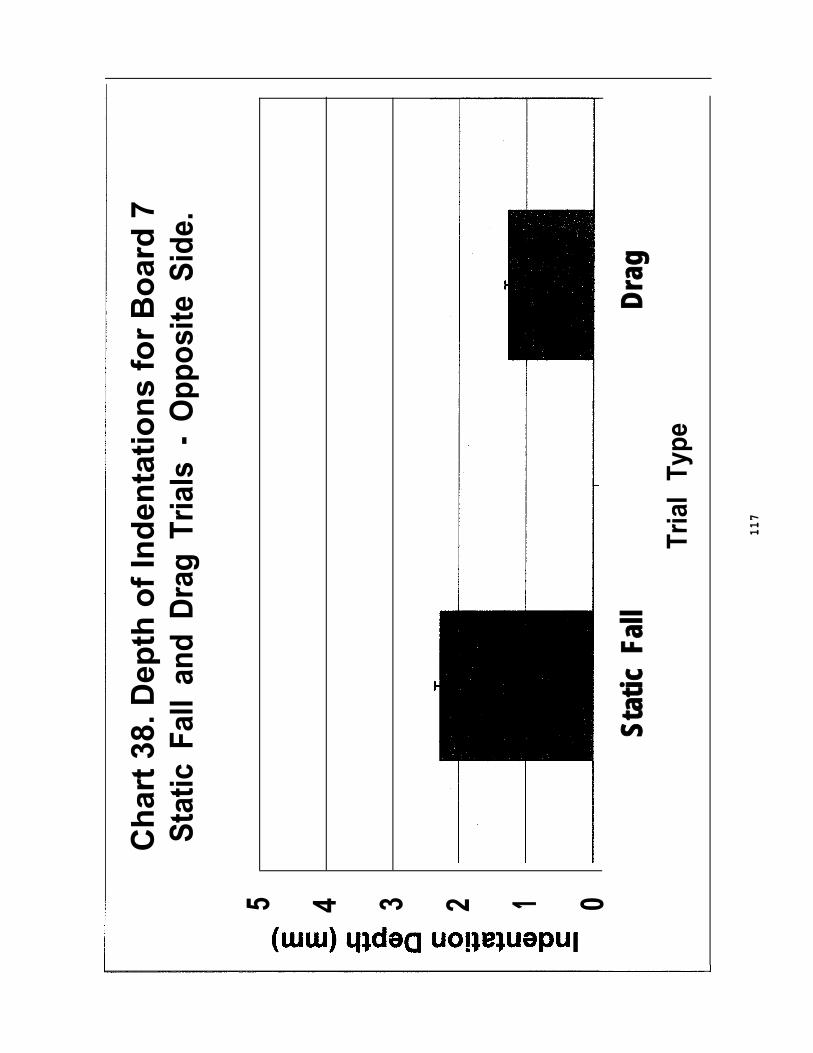
5 4 3 2 1 0
Ch
art
38. D
epth
of
Ind
enta
tio
ns
for
Bo
ard
7S
tatic
Fal
l an
d D
rag
Tria
ls -
Opp
osite
Sid
e.
Stat
ic F
all
Drag
Tria
l Ty
pe
117

Ch
art
39. D
epth
of
Ind
enta
tio
ns
for
Bo
ard
8S
tatic
Fal
l an
d D
rag
Tria
ls -
Lig
atur
e S
ide.
5 4 3 2 1 0St
atic
Fal
lTr
ial
Type
Drag
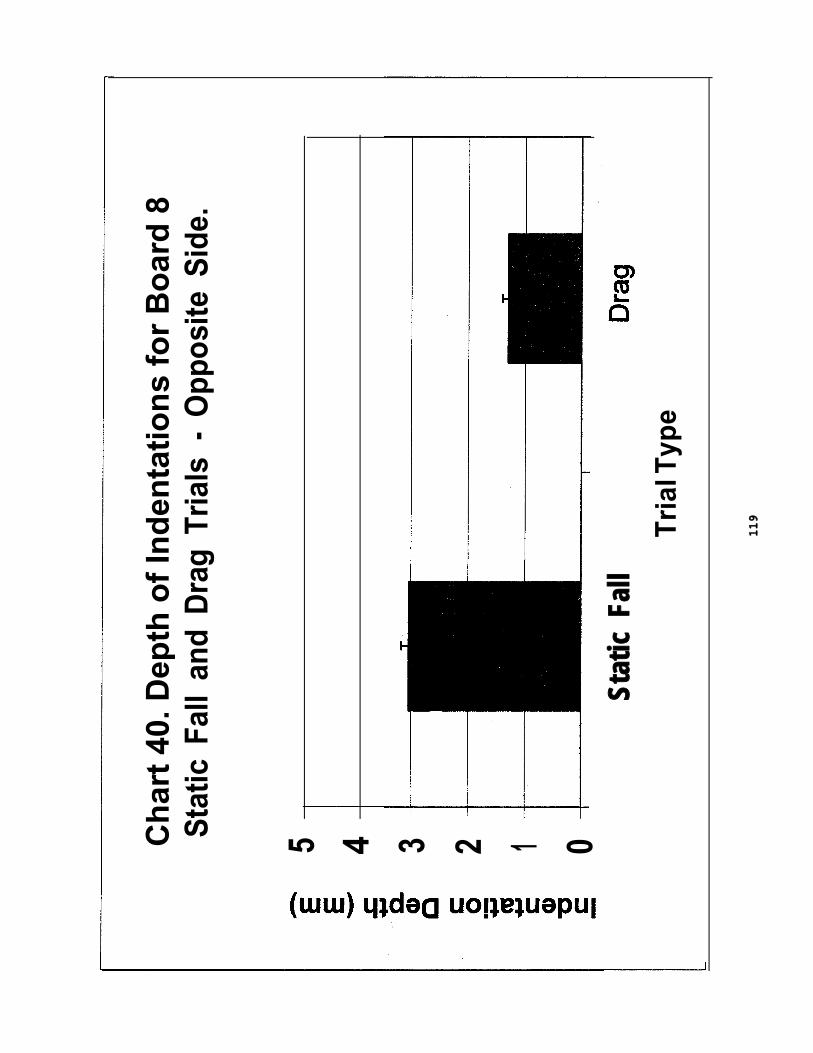
Ch
art
40. D
epth
of
Ind
enta
tio
ns
for
Bo
ard
8S
tatic
Fal
l an
d D
rag
Tria
ls -
Opp
osite
Sid
e.
5 4 3 2 1 0St
atic
Fal
lTr
ial T
ype
119

APPENDIX E - OMPPAC SURVEY 1998 AND 1999
120
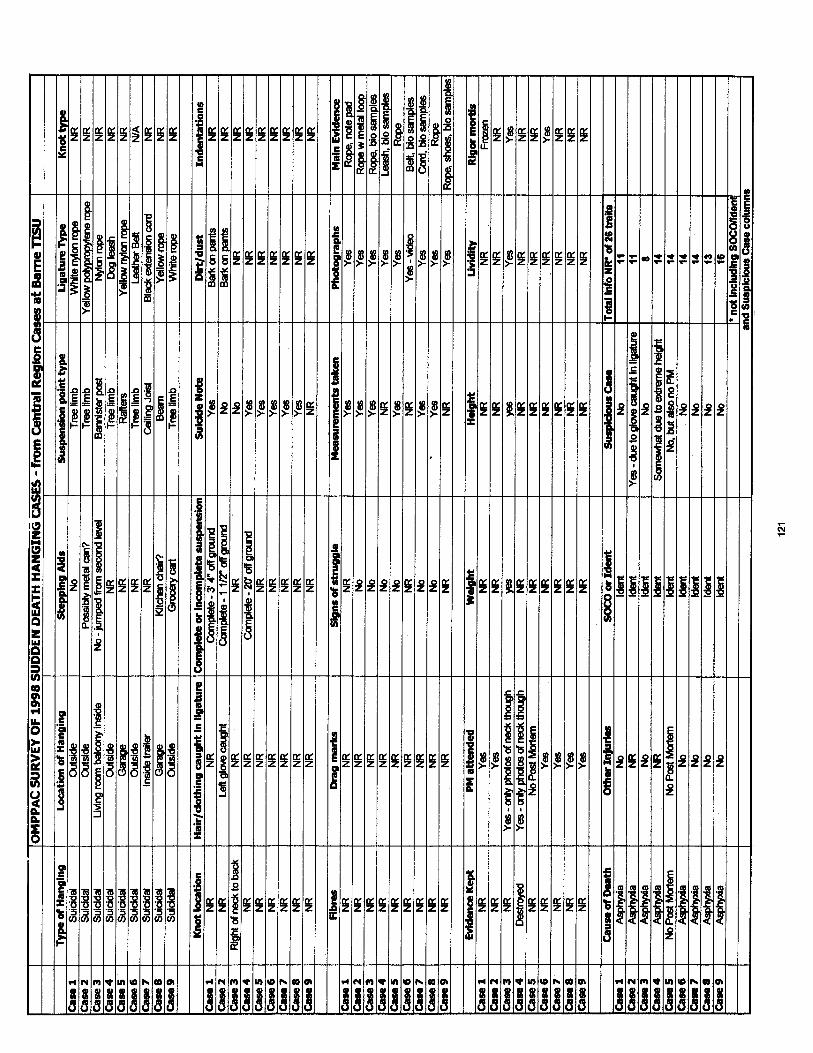
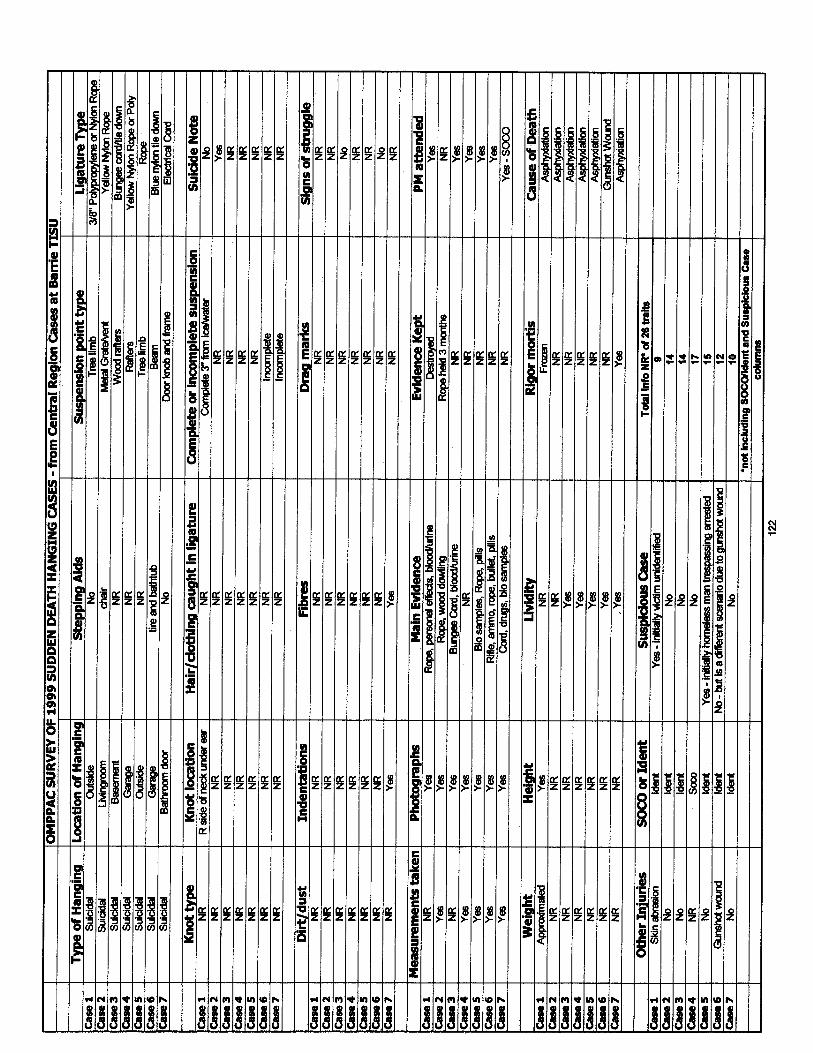

123
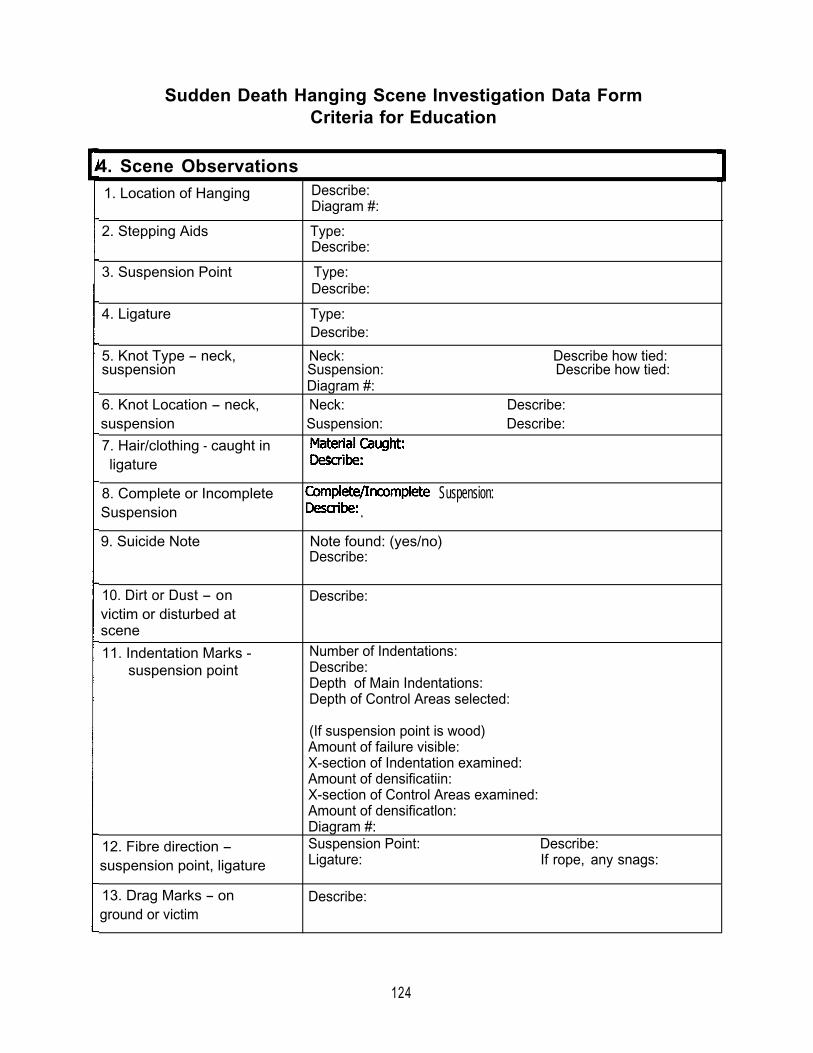
Sudden Death Hanging Scene Investigation Data FormCriteria for Education
4. Scene Observations1. Location of Hanging
2. Stepping Aids
Describe:Diagram #:
Type:Describe:
3. Suspension Point Type:Describe:
4. Ligature Type:Describe:
5. Knot Type - neck, Neck: Describe how tied:suspension Suspension: Describe how tied:
Diagram #:6. Knot Location - neck, Neck: Describe:suspension Suspension: Describe:
7. Hair/clothing - caught in ligature
..
8. Complete or Incomplete Suspension:Suspension ..9. Suicide Note Note found: (yes/no)
Describe:
10. Dirt or Dust - onvictim or disturbed atscene
11. Indentation Marks -suspension point
Describe:
Number of Indentations:Describe:Depth of Main Indentations:Depth of Control Areas selected:
12. Fibre direction -suspension point, ligature
13. Drag Marks - onground or victim
(If suspension point is wood)Amount of failure visible:X-section of Indentation examined:Amount of densificatiin:X-section of Control Areas examined:Amount of densificatlon:Diagram #:Suspension Point: Describe:Ligature: If rope, any snags:
Describe:
124

14. Signs of struggle Describe:
15. Taping - of Describe:
suspension beam at main Calculated Area:
indentation, ligature side Calculated Perimeter:
16. Underside of ligature - Any compression areas: (yes/no)
in contact with suspension Describe:beam17. Collect - suspension Describe:beam, ligature, controlsamples if possible18. Other Describe:
19. Other
1 2 5

B. Photographs - other than regular scene and body photos , 1. Knot type and location Photo:- suspension and neck2. Indentations and Photo:normal area on suspension3. Fibres - suspension and Photo:ligature, and normal areas4. Other Photo:
5. Other Photo:
126

C . Measurements I1. Height of victim When hanging:
At autopsy:
2. Distance from groundto victim’s feet
3. Distance from groundto knot at neck4. Distance from knot atneck to Suspension point5. Distance from groundto suspension point6. Height of stepping aid
To Top of suspension:To Bottom of suspension:
7. Distance from top stepping aid to victim’s feet8. Dimensions of Length:suspension beam Width:
Height:9. Other
10. Other
127

D. Evidence Collected at Scene1. What collected?
2. Where stored?
3. Other
4. Other
1 2 8

E. Post Mortem Examin1. Livor mortis (yes/no)
Does correspond to hanging position?
(yes/no)Does correspond to hanging position?
(yes/no)Describe: I
4. Other injuries present
5. Time since death
6. Cause of death
7. Measurements
8. Evidence collected
9. Photographs taken
Length of time hanging?
1 2 9

APPENDIX G - DESCRIPTIVE STATISTICS
130
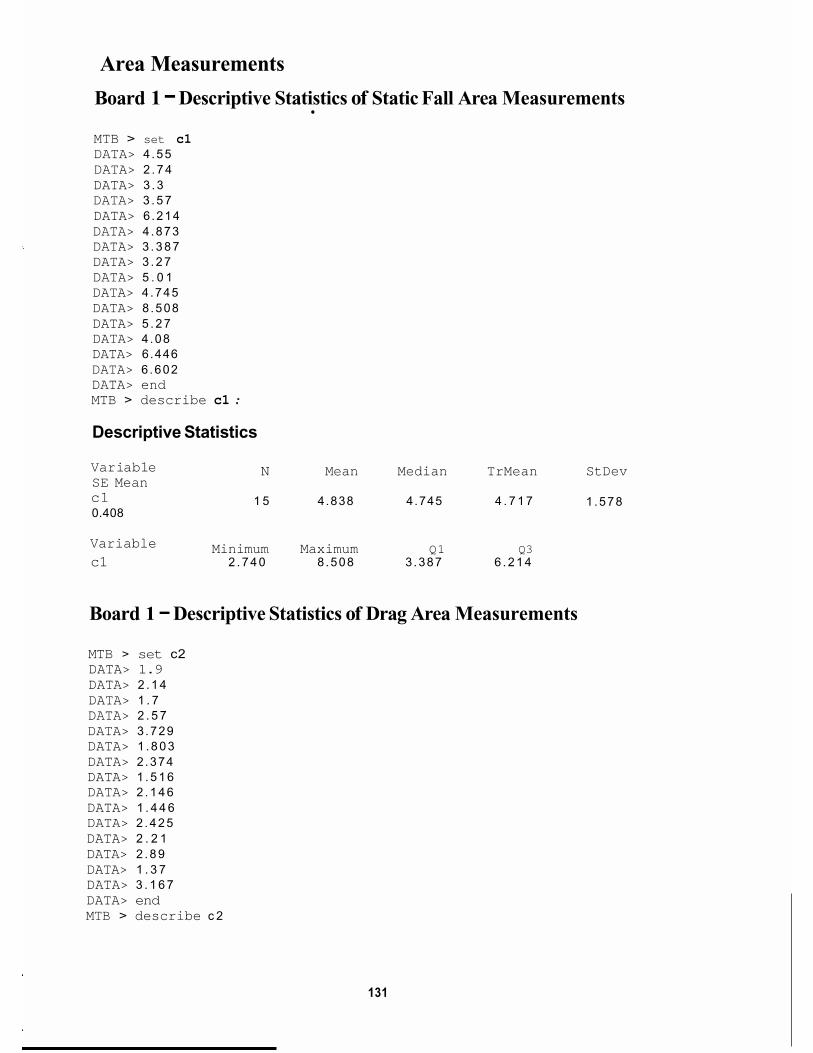
Area Measurements
Board 1 - Descriptive Statistics of Static Fall Area Measurements
MTB > set c1 DATA> 4.55 DATA> 2 .74 DATA> 3 .3 DATA> 3 .57 DATA> 6.214 DATA> 4.873 DATA> 3 .387 DATA> 3 .27 DATA> 5 . 0 1 DATA> 4.745 DATA> 8.508 DATA> 5 .27 DATA> 4.08 DATA> 6.446 DATA> 6.602 DATA> end MTB > describe c1 .-
Descriptive Statistics
Var i ab 1 e SE Mean c1 0.408
N Mean Median TrMean StDev
1.578 1 5 4.838 4.745 4 . 7 1 7
Minimum Maximum Q1 Q3 Variable c1 2 .740 8 .508 3 .387 6 .214
Board 1 - Descriptive Statistics of Drag Area Measurements
MTB > set c2 DATA> 1.9 DATA> 2 .14 DATA> 1 . 7 DATA> 2 . 5 7 DATA> 3.729 DATA> 1 .803 DATA> 2.374 DATA> 1 .516 DATA> 2 .146 DATA> 1 . 4 4 6 DATA> 2 .425 DATA> 2 . 2 1 DATA> 2 .89 DATA> 1 . 3 7 DATA> 3 . 1 6 7 DATA> end MTB > describe c 2
131
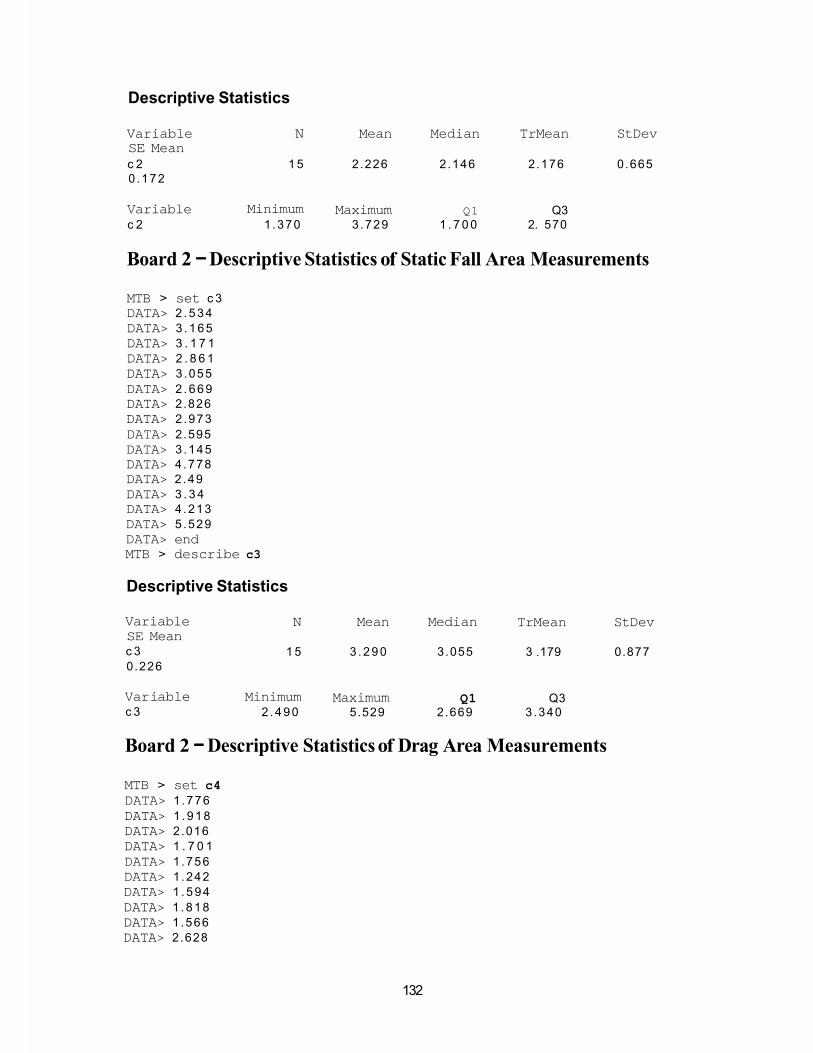
Descriptive Statistics
Variable N Mean Median TrMean StDev SE Mean c 2 1 5 2.226 2.146 2.176 0.665 0 .172
Variable Minimum Maximum Q1 Q3 c 2 1 .370 3 .729 1 . 7 0 0 2. 570
Board 2 - Descriptive Statistics of Static Fall Area Measurements
MTB > set c 3 DATA> 2 .534 DATA> 3 .165 DATA> 3 . 1 7 1 DATA> 2 . 8 6 1 DATA> 3.055 DATA> 2 .669 DATA> 2.826 DATA> 2.973 DATA> 2.595 DATA> 3.145 DATA> 4.778 DATA> 2.49 DATA> 3 . 3 4 DATA> 4.213 DATA> 5.529 DATA> end MTB > describe c3
Descriptive Statistics
Variable SE Mean c 3 0.226
N Mean Median TrMean StDev
1 5 3 .290 3.055 3 .179 0.877
Var i abl e Minimum Maximum Q1 Q3 c 3 2 .490 5.529 2.669 3 .340
Board 2 - Descriptive Statistics of Drag Area Measurements
MTB > set c4 DATA> 1.776 DATA> 1 .918 DATA> 2.016 DATA> 1 . 7 0 1 DATA> 1.756 DATA> 1.242 DATA> 1 .594 DATA> 1 .818 DATA> 1.566 DATA> 2.628
132
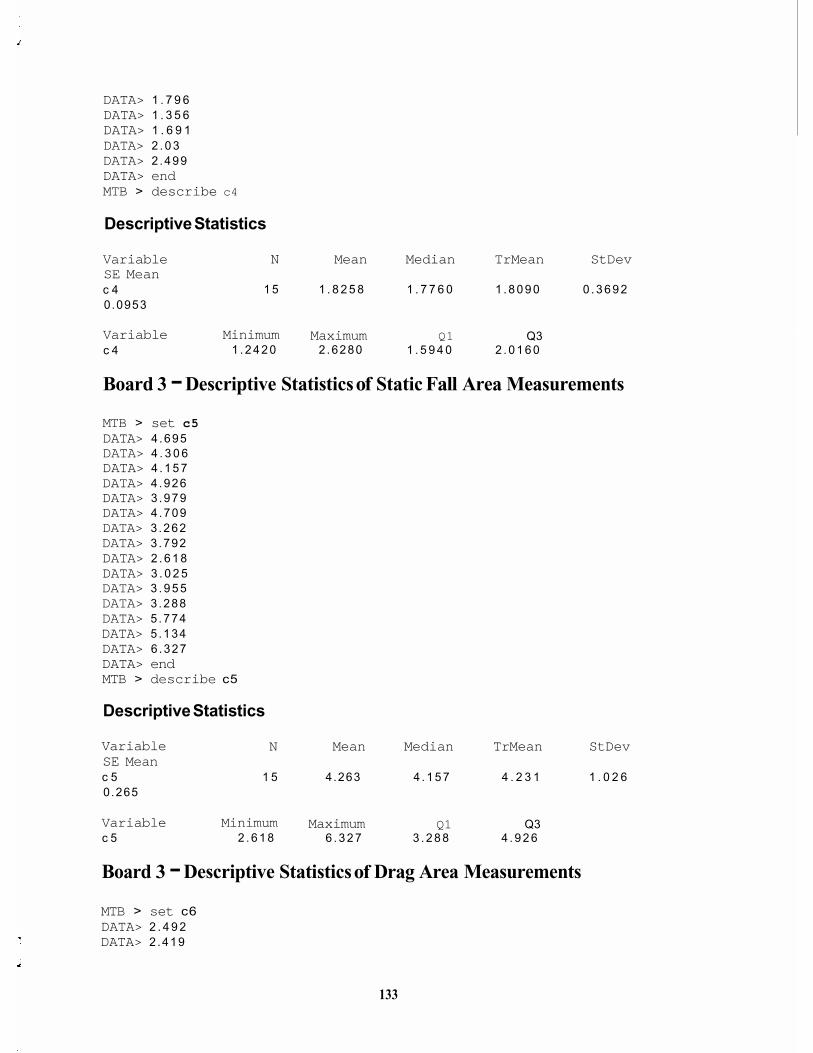
DATA> 1 . 7 9 6 DATA> 1 . 3 5 6 DATA> 1 . 6 9 1 DATA> 2 . 0 3 DATA> 2 .499 DATA> end MTB > describe c4
Descriptive Statistics
Variable SE Mean c 4 0 .0953
N Mean Median TrMean StDev
1 5 1 . 8 2 5 8 1 . 7 7 6 0 1 . 8 0 9 0 0 . 3 6 9 2
Variable Minimum Maximum Q1 Q3 c 4 1 . 2 4 2 0 2 .6280 1 . 5 9 4 0 2 . 0 1 6 0
Board 3 - Descriptive Statistics of Static Fall Area Measurements
MTB > set c5 DATA> 4 .695 DATA> 4 . 3 0 6 DATA> 4 . 1 5 7 DATA> 4 .926 DATA> 3 .979 DATA> 4 .709 DATA> 3 .262 DATA> 3 .792 DATA> 2 . 6 1 8
DATA> 3 . 9 5 5 DATA> 3 .288 DATA> 5 .774 DATA> 5 .134 DATA> 6 .327 DATA> end MTB > describe c5
DATA> 3 . 0 2 5
Descriptive Statistics
Variable SE Mean c 5 0 .265
N Mean Median TrMean StDev
1 5 4.263 4 . 1 5 7 4 . 2 3 1 1 . 0 2 6
Variable Minimum Maximum Q1 Q3 c 5 2 . 6 1 8 6 . 3 2 7 3 . 2 8 8 4 . 9 2 6
Board 3 - Descriptive Statistics of Drag Area Measurements
MTB > set c6 DATA> 2 . 4 9 2 DATA> 2 .419
133
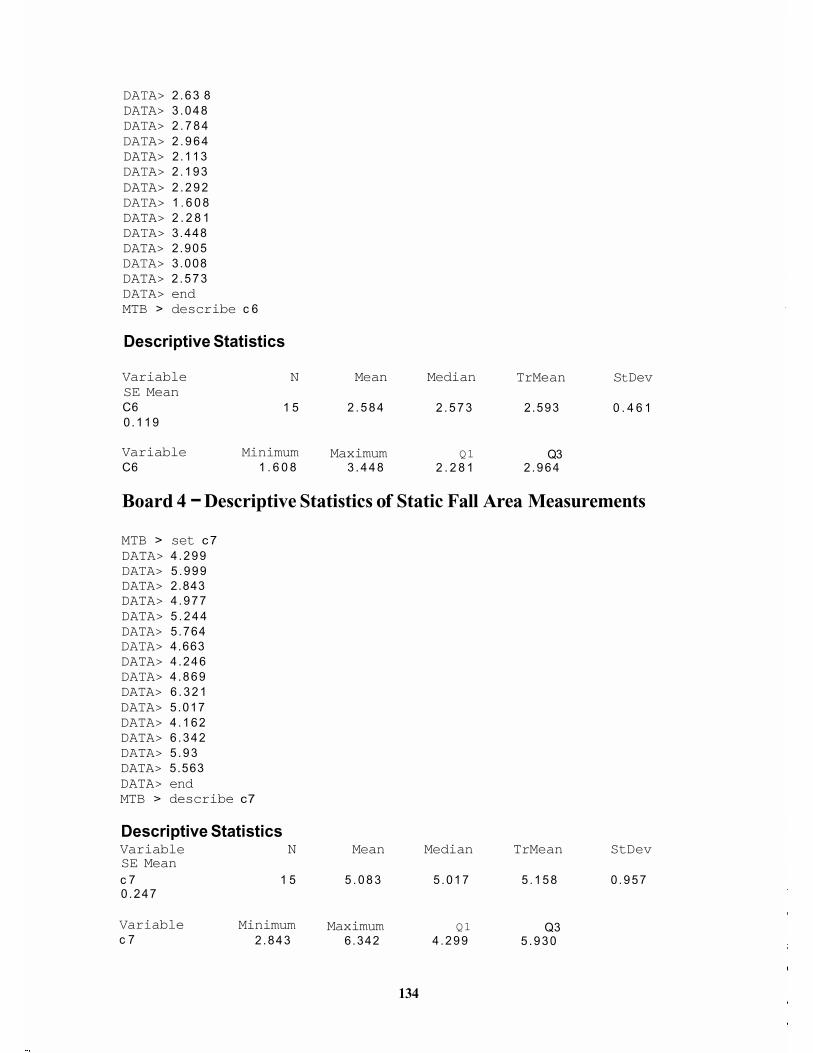
DATA> 2 .63 8 DATA> 3 .048 DATA> 2 . 7 8 4 DATA> 2 . 9 6 4 DATA> 2.113 DATA> 2 .193 DATA> 2 . 2 9 2 DATA> 1 . 6 0 8 DATA> 2 . 2 8 1 DATA> 3.448 DATA> 2.905 DATA> 3.008 DATA> 2 .573 DATA> end MTB > describe c 6
Descriptive Statistics
Variable SE Mean C6 0 .119
N Mean Median TrMean S t Dev
1 5 2 . 5 8 4 2 . 5 7 3 2 .593 0 . 4 6 1
Variable Minimum Maximum Q1 Q3 C6 1 . 6 0 8 3 . 4 4 8 2 . 2 8 1 2 .964
Board 4 - Descriptive Statistics of Static Fall Area Measurements
MTB > set c7 DATA> 4 .299 DATA> 5 .999 DATA> 2.843 DATA> 4 .977 DATA> 5 . 2 4 4 DATA> 5.764 DATA> 4.663 DATA> 4 .246 DATA> 4 .869 DATA> 6 . 3 2 1 DATA> 5.017 DATA> 4 .162 DATA> 6 .342 DATA> 5 .93 DATA> 5.563 DATA> end MTB > describe c7
Descriptive Statistics Variable N Mean Median TrMean StDev SE Mean c 7 1 5 5 . 0 8 3 5 .017 5 .158 0 .957 0 .247
Variable Minimum Maximum Q1 Q3 c 7 2 .843 6 .342 4 .299 5 .930
134
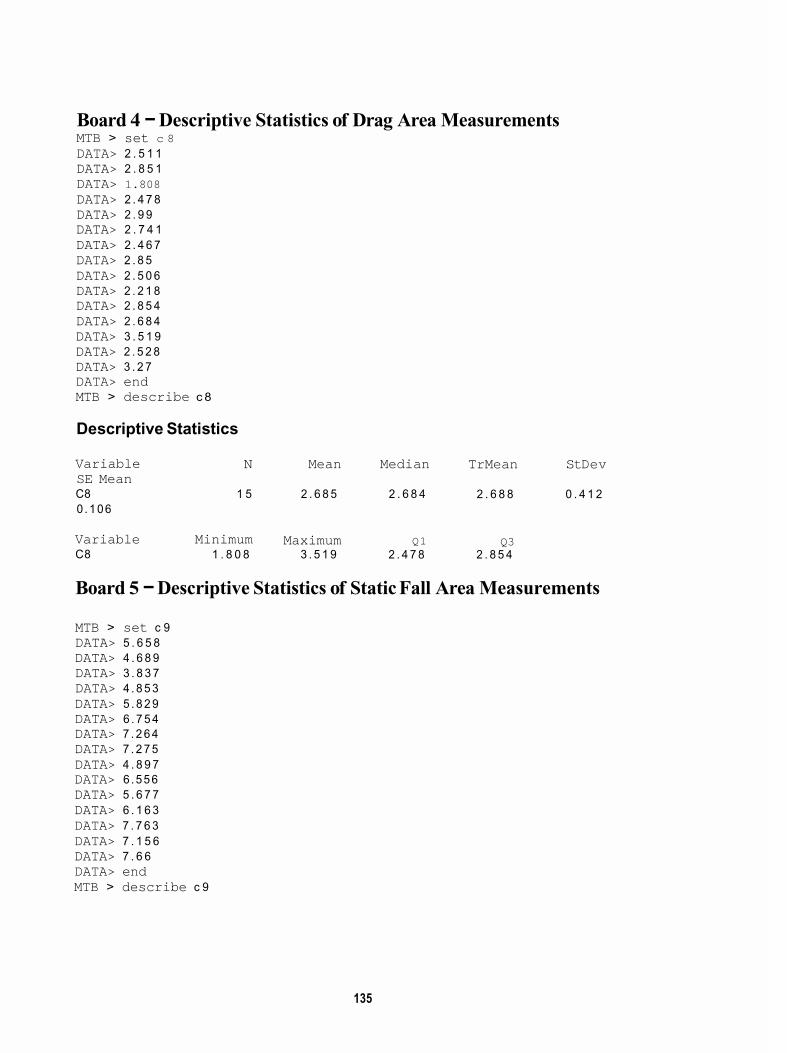
Board 4 - Descriptive Statistics of Drag Area Measurements MTB > set c 8 DATA> 2 . 5 1 1 DATA> 2 . 8 5 1 DATA> 1.808 DATA> 2 . 4 7 8 DATA> 2 . 9 9 DATA> 2 . 7 4 1 DATA> 2 . 4 6 7 DATA> 2 . 8 5 DATA> 2 . 5 0 6 DATA> 2 . 2 1 8 DATA> 2 . 8 5 4 DATA> 2 . 6 8 4 DATA> 3 . 5 1 9 DATA> 2 . 5 2 8 DATA> 3 . 2 7 DATA> end MTB > describe c 8
Descriptive Statistics
Variable SE Mean C8 0 .106
N Mean Median TrMean S t Dev
1 5 2 . 6 8 5 2 . 6 8 4 2 . 6 8 8 0 . 4 1 2
Variable Minimum Maximum Q1 Q3 C8 1 . 8 0 8 3 . 5 1 9 2 . 4 7 8 2 . 8 5 4
Board 5 - Descriptive Statistics of Static Fall Area Measurements
MTB > set c 9 DATA> 5 . 6 5 8 DATA> 4 . 6 8 9 DATA> 3 . 8 3 7 DATA> 4 . 8 5 3 DATA> 5 . 8 2 9 DATA> 6 . 7 5 4 DATA> 7 . 2 6 4 DATA> 7 . 2 7 5 DATA> 4 . 8 9 7 DATA> 6 .556 DATA> 5 . 6 7 7 DATA> 6 . 1 6 3 DATA> 7 . 7 6 3 DATA> 7 . 1 5 6 DATA> 7 . 6 6 DATA> end MTB > describe c 9
135
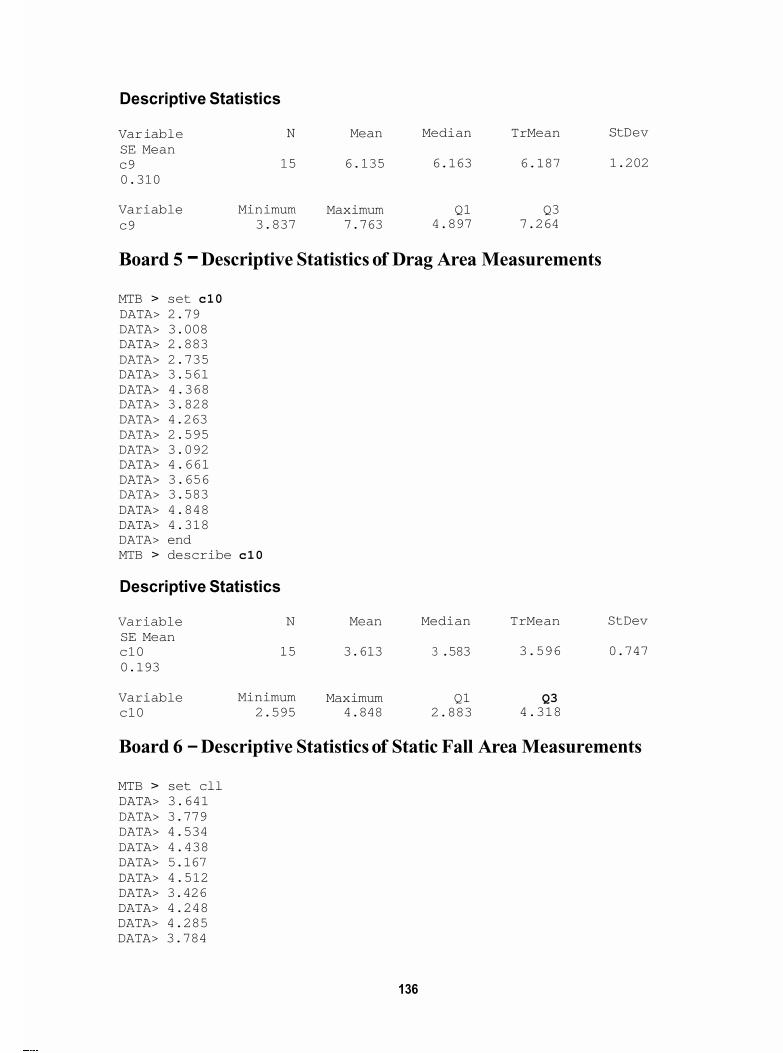
Descriptive Statistics
Var i abl e SE Mean c9 0.310
N Mean Median TrMean S t Dev
15 6.135 6.163 6.187 1.202
Variable Minimum Maximum Q1 Q3 c9 3.837 7.763 4.897 7.264
Board 5 - Descriptive Statistics of Drag Area Measurements
MTB > set c10 DATA> 2.79 DATA> 3.008 DATA> 2.883 DATA> 2.735 DATA> 3.561 DATA> 4.368 DATA> 3.828 DATA> 4.263 DATA> 2.595 DATA> 3.092 DATA> 4.661 DATA> 3.656 DATA> 3.583 DATA> 4.848 DATA> 4.318 DATA> end MTB > describe c10
Descriptive Statistics
Variable SE Mean c10 0.193
N Mean Median TrMean StDev
15 3.613 3 .583 3.596 0.747
Variable Minimum Maximum Q1 Q3 c10 2.595 4.848 2.883 4.318
Board 6 - Descriptive Statistics of Static Fall Area Measurements
MTB > set cll DATA> 3.641 DATA> 3.779 DATA> 4.534 DATA> 4.438 DATA> 5.167 DATA> 4.512 DATA> 3.426 DATA> 4.248 DATA> 4.285 DATA> 3.784
136
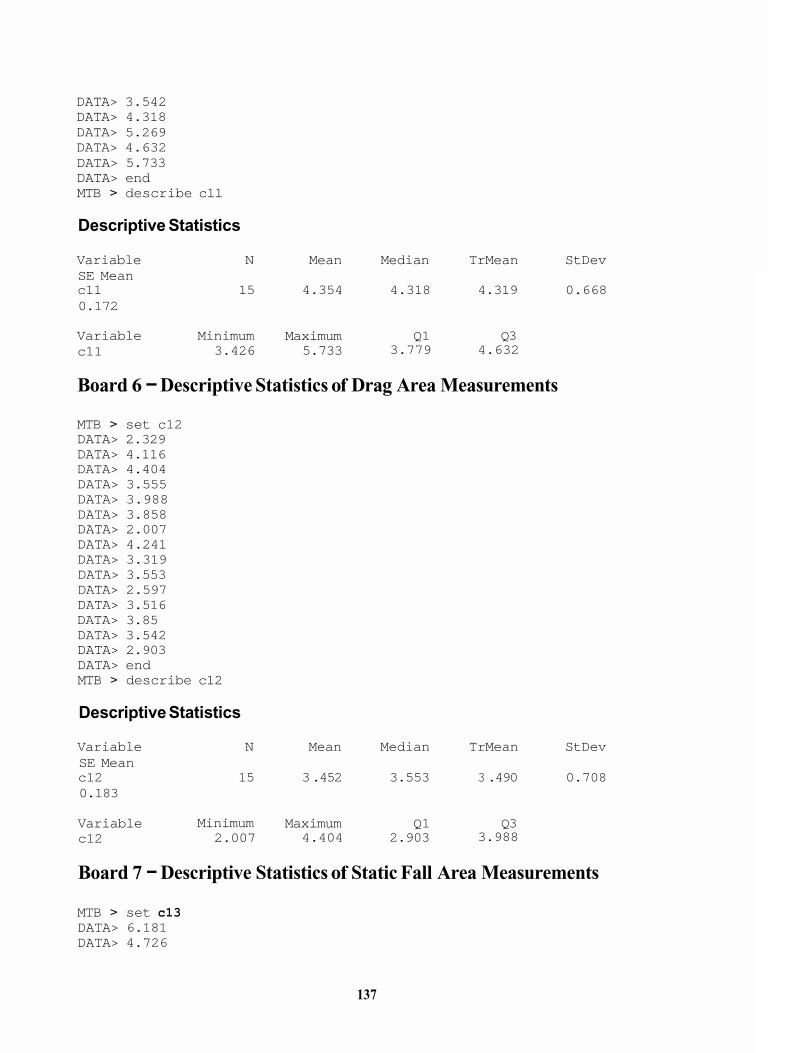
DATA> 3.542 DATA> 4.318 DATA> 5.269 DATA> 4.632 DATA> 5.733 DATA> end MTB > describe cll
Descriptive Statistics
Variable N Mean Median TrMean StDev SE Mean c11 15 4.354 4.318 4.319 0.668 0.172
Variable Minimum Maximum Q1 Q3 c11 3.426 5.733 3.779 4.632
Board 6 - Descriptive Statistics of Drag Area Measurements
MTB > set c12 DATA> 2.329 DATA> 4.116 DATA> 4.404 DATA> 3.555 DATA> 3.988 DATA> 3.858 DATA> 2.007 DATA> 4.241 DATA> 3.319 DATA> 3.553 DATA> 2.597 DATA> 3.516 DATA> 3.85 DATA> 3.542 DATA> 2.903 DATA> end MTB > describe c12
Descriptive Statistics
Variable N Mean Median TrMean StDev SE Mean c12 15 3 .452 3.553 3 .490 0.708 0.183
Variable Minimum Maximum Q1 Q3 c12 2.007 4.404 2.903 3.988
Board 7 - Descriptive Statistics of Static Fall Area Measurements
MTB > set c13 DATA> 6.181 DATA> 4.726
137
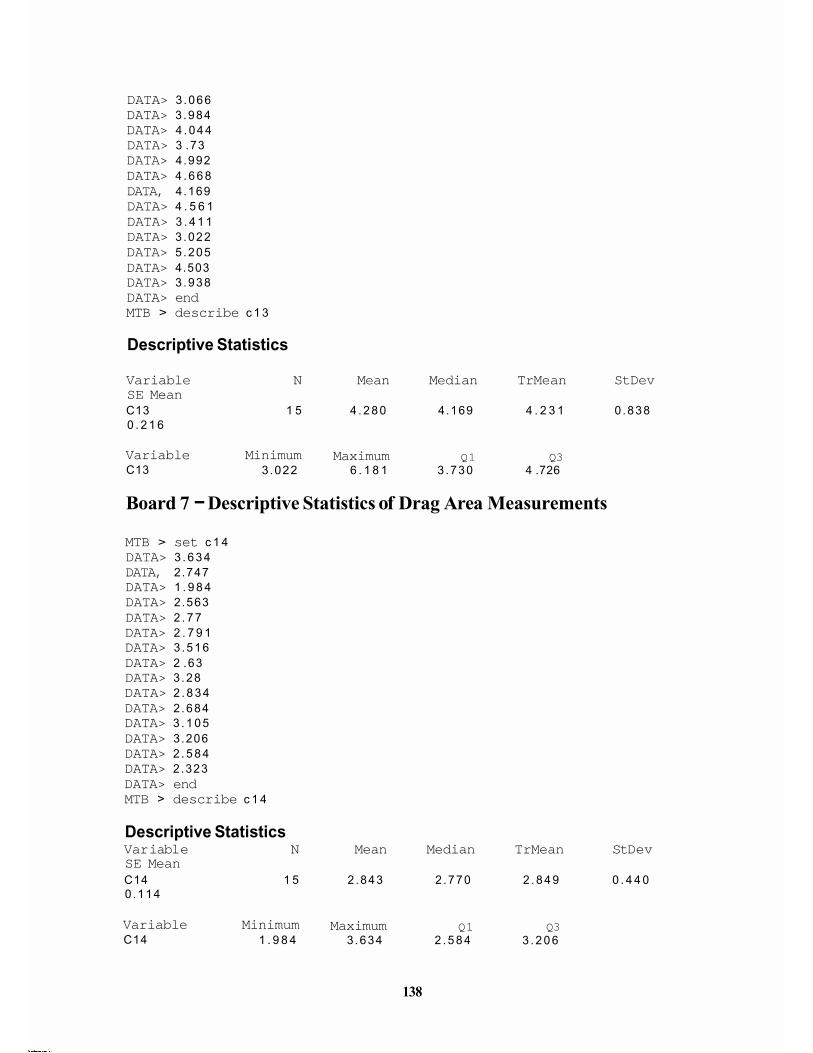
DATA> 3 .066 DATA> 3 .984 DATA> 4 . 0 4 4 DATA> 3 .73 DATA> 4.992 DATA> 4 . 6 6 8 DATA, 4.169 DATA> 4 . 5 6 1
DATA> 3 .022 DATA> 5 .205 DATA> 4.503 DATA> 3 .938 DATA> end MTB > describe c 1 3
DATA> 3 . 4 1 1
Descriptive Statistics
Variable N Mean Median TrMean StDev SE Mean C13 1 5 4 . 2 8 0 4 .169 4 . 2 3 1 0 .838 0 . 2 1 6
Variable Minimum Maximum Q1 Q3 C13 3.022 6 . 1 8 1 3 .730 4 .726
Board 7 - Descriptive Statistics of Drag Area Measurements
MTB > set c 1 4 DATA> 3 . 6 3 4 DATA, 2.747 DATA> 1 . 9 8 4 DATA> 2.563 DATA> 2 . 7 7 DATA> 2 . 7 9 1 DATA> 3 .516 DATA> 2 .63 DATA> 3 .28 DATA> 2 . 8 3 4 DATA> 2 .684 DATA> 3 . 1 0 5 DATA> 3.206 DATA> 2 . 5 8 4 DATA> 2.323 DATA> end MTB > describe c 1 4
Descriptive Statistics Var i a bl e N Mean Median TrMean S t Dev SE Mean C14 1 5 2 .843 2 .770 2 . 8 4 9 0 . 4 4 0 0 .114
Variable Minimum Maximum Q1 Q3 C14 1 . 9 8 4 3 .634 2 . 5 8 4 3 . 2 0 6
138
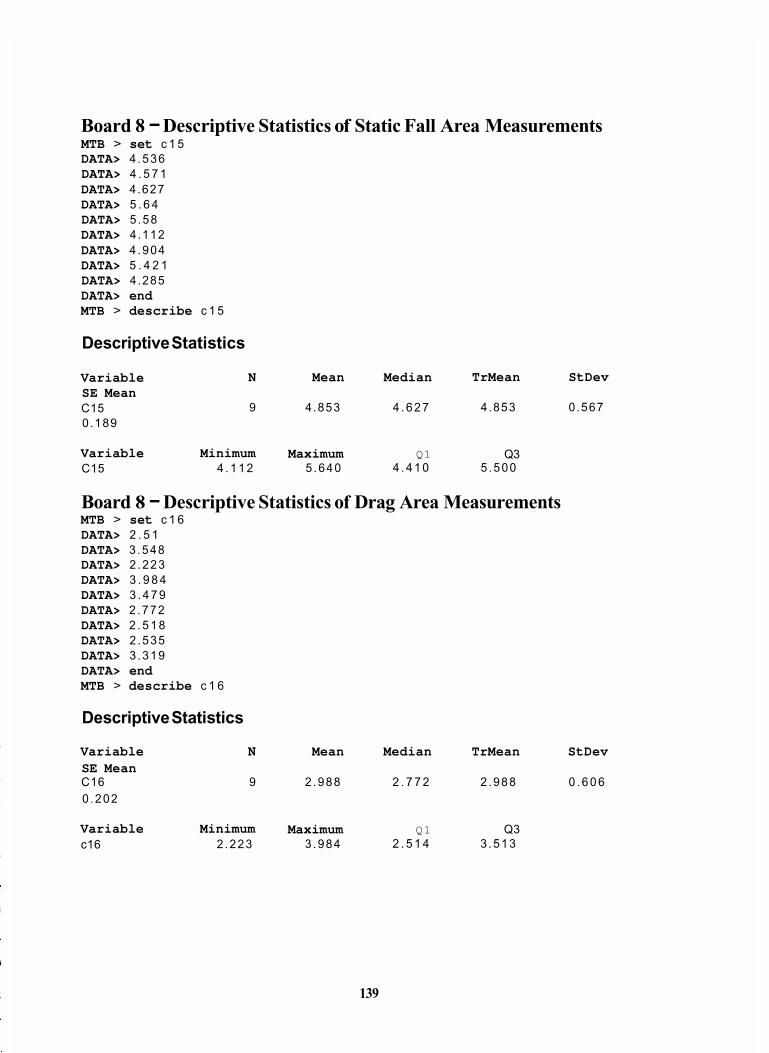
Board 8 - Descriptive Statistics of Static Fall Area Measurements MTB > set c 1 5 DATA> 4 .536 DATA> 4 . 5 7 1 DATA> 4.627 DATA> 5 . 6 4 DATA> 5 .58 DATA> 4.112 DATA> 4 .904 DATA> 5 . 4 2 1 DATA> 4.285 DATA> end MTB > describe c 1 5
Descriptive Statistics
Variable SE Mean C15 0.189
N Mean Median TrMean StDev
9 4.853 4 . 6 2 7 4 .853 0 .567
Variable Minimum Maximum Q1 Q3 C15 4 . 1 1 2 5 .640 4 . 4 1 0 5 .500
Board 8 - Descriptive Statistics of Drag Area Measurements MTB > set c 1 6 DATA> 2 . 5 1 DATA> 3 .548 DATA> 2 .223 DATA> 3 . 9 8 4 DATA> 3 . 4 7 9 DATA> 2 .772 DATA> 2 . 5 1 8 DATA> 2 .535 DATA> 3 .319 DATA> end MTB > describe c 1 6
Descriptive Statistics
Variable N Mean Median TrMean StDev SE Mean C16 9 2 .988 2 . 7 7 2 2 .988 0 . 6 0 6 0 .202
Variable Minimum Maximum Q1 Q3 c16 2 .223 3 .984 2 . 5 1 4 3 .513
139
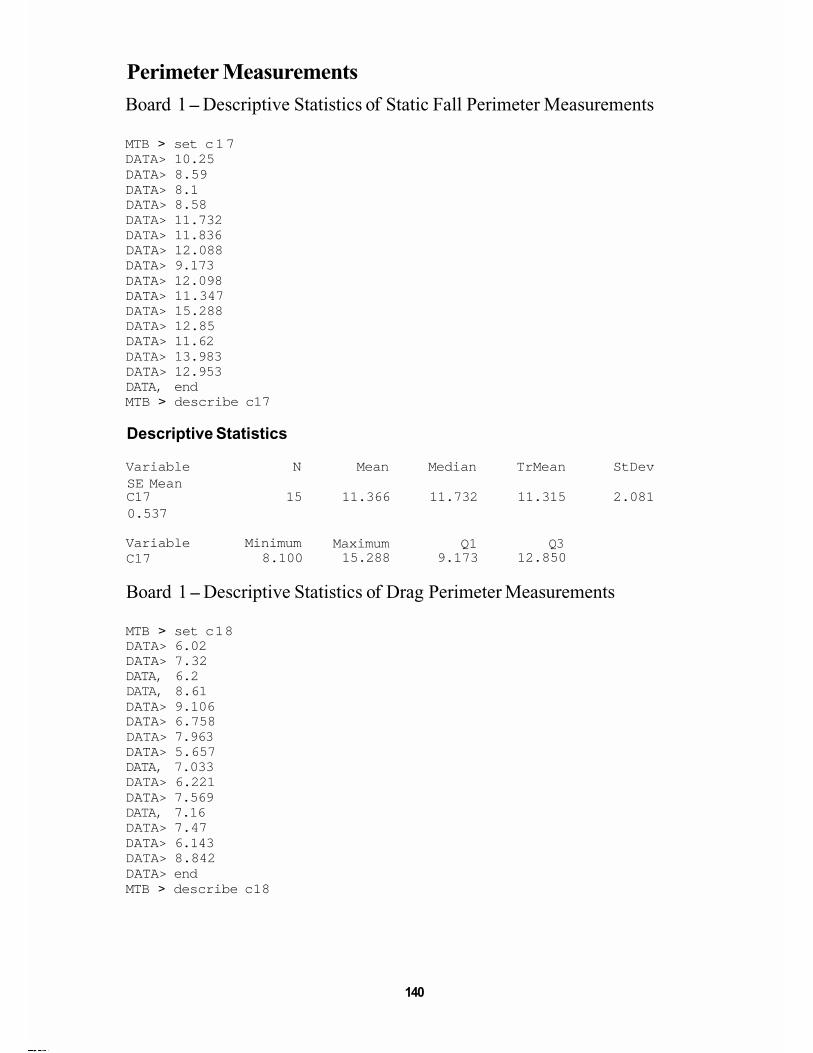
Perimeter Measurements Board 1 - Descriptive Statistics of Static Fall Perimeter Measurements
MTB > set c17 DATA> 10.25 DATA> 8.59 DATA> 8.1 DATA> 8.58 DATA> 11.732 DATA> 11.836 DATA> 12.088 DATA> 9.173 DATA> 12.098 DATA> 11.347 DATA> 15.288 DATA> 12.85 DATA> 11.62 DATA> 13.983 DATA> 12.953 DATA, end MTB > describe c17
Descriptive Statistics
Variable N Mean Median TrMean StDev SE Mean
2.081 C17 15 11.366 11.732 11.315 0.537
Variable Minimum Maximum Q1 Q3 C17 8.100 15.288 9.173 12.850
Board 1 - Descriptive Statistics of Drag Perimeter Measurements
MTB > set c18 DATA> 6.02 DATA> 7.32 DATA, 6.2 DATA, 8.61 DATA> 9.106 DATA> 6.758 DATA> 7.963 DATA> 5.657 DATA, 7.033 DATA> 6.221 DATA> 7.569 DATA, 7.16 DATA> 7.47 DATA> 6.143 DATA> 8.842 DATA> end MTB > describe c18
140
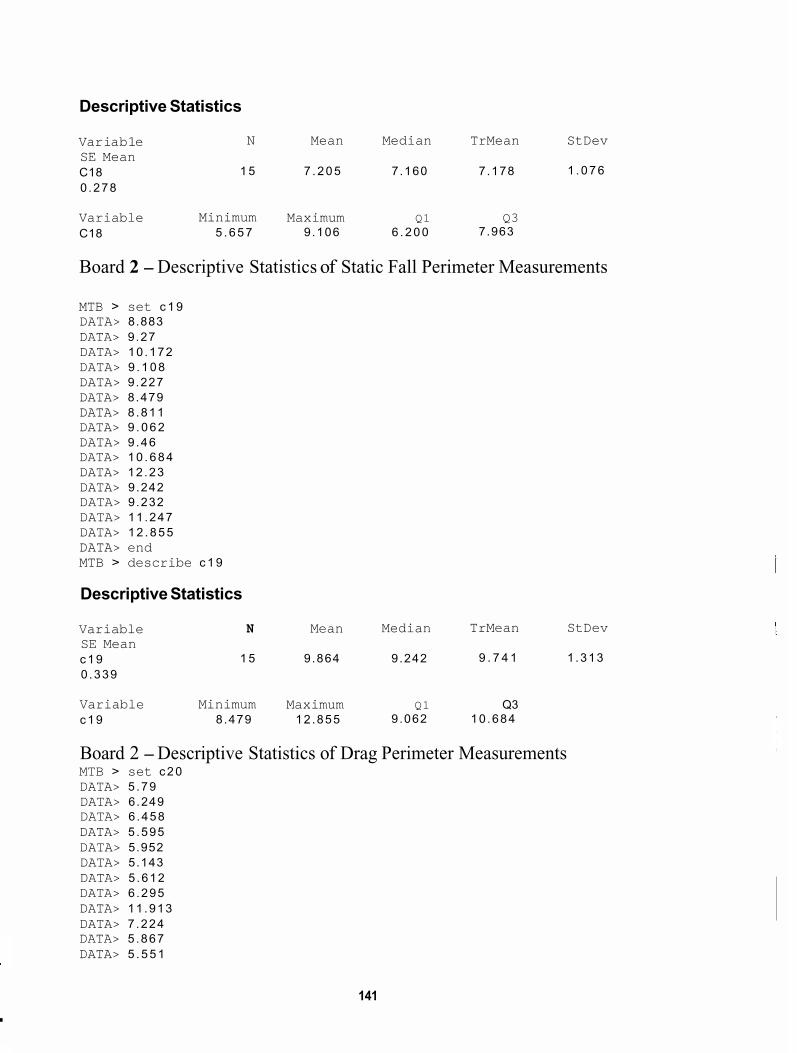
Descriptive Statistics
Var iab 1 e SE Mean C18 0 .278
N Mean Median TrMean StDev
1 .076 1 5 7 .205 7.160 7.178
Variable Minimum Maximum Q1 Q3C18 5 .657 9.106 6 .200 7.963
Board 2 - Descriptive Statistics of Static Fall Perimeter Measurements
MTB > set c 1 9 DATA> 8.883 DATA> 9.27 DATA> 10.172 DATA> 9 .108 DATA> 9.227 DATA> 8.479 DATA> 8.811 DATA> 9 .062 DATA> 9.46 DATA> 10 .684 DATA> 12.23 DATA> 9.242 DATA> 9.232 DATA> 11.247 DATA> 12 .855 DATA> end MTB > describe c 1 9
Descriptive Statistics
Variable SE Mean c19 0 .339
N Mean Median TrMean StDev
1 5 9.864 9.242 9 . 7 4 1 1 .313
Variable Minimum Maximum Q1 Q3 c19 8.479 12 .855 9.062 10 .684
Board 2 - Descriptive Statistics of Drag Perimeter Measurements MTB > set c20 DATA> 5.79 DATA> 6.249 DATA> 6.458 DATA> 5.595 DATA> 5.952 DATA> 5.143 DATA> 5.612 DATA> 6.295 DATA> 11.913 DATA> 7.224 DATA> 5.867 DATA> 5 .551
L 141
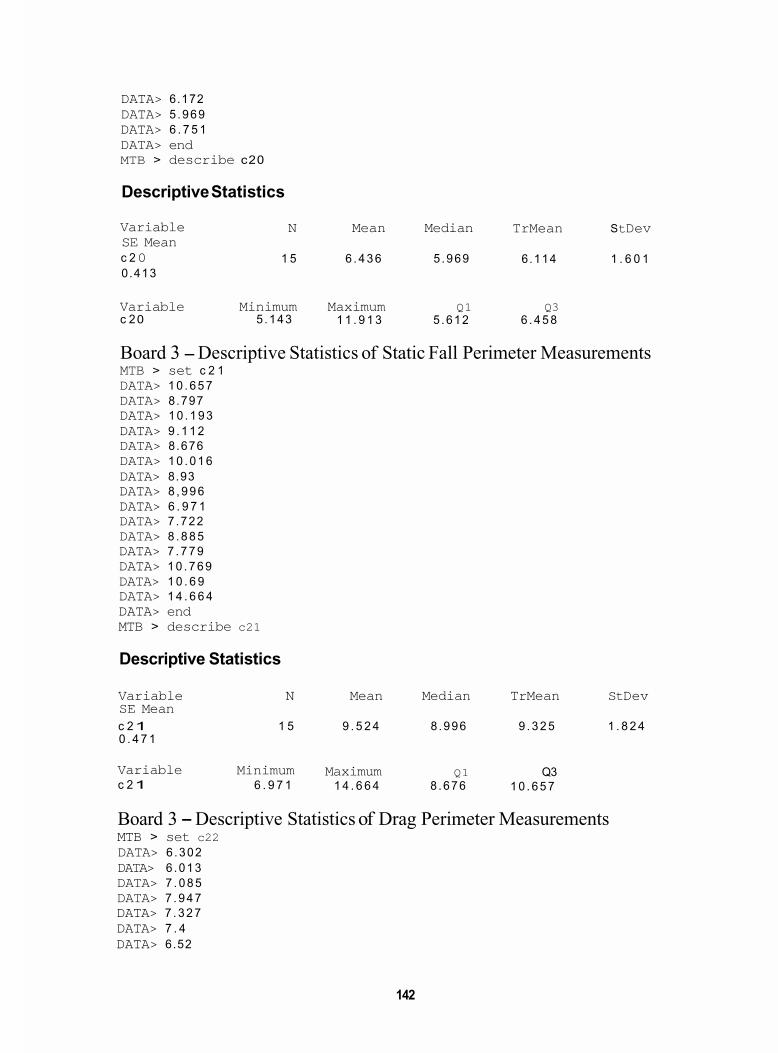
DATA> 6.172 DATA> 5 .969 DATA> 6 . 7 5 1 DATA> end MTB > describe c20
Descriptive Statistics
Variable SE Mean c 2 0 0.413
N Mean Median TrMean S t Dev
1 5 6 . 4 3 6 5 .969 6 .114 1 . 6 0 1
Variable Minimum Maximum Q1 Q3 1 1 . 9 1 3 5 .612 6 . 4 5 8 c 2 0 5 .143
Board 3 - Descriptive Statistics of Static Fall Perimeter Measurements MTB > set c 2 1 DATA> 1 0 . 6 5 7 DATA> 8.797 DATA> 1 0 . 1 9 3 DATA> 9 . 1 1 2 DATA> 8.676 DATA> 1 0 . 0 1 6 DATA> 8.93 DATA> 8 , 9 9 6 DATA> 6 . 9 7 1 DATA> 7 .722 DATA> 8 . 8 8 5 DATA> 7 . 7 7 9 DATA> 1 0 . 7 6 9 DATA> 1 0 . 6 9 DATA> 1 4 . 6 6 4 DATA> end MTB > describe c21
Descriptive Statistics
Variable N Mean Median TrMean S t Dev SE Mean c 2 1 1 5 9 . 5 2 4 8 .996 9 . 3 2 5 1 . 8 2 4 0 . 4 7 1
Variable Minimum Maximum Q1 Q3 c 2 1 6 . 9 7 1 1 4 . 6 6 4 8 .676 1 0 . 6 5 7
Board 3 - Descriptive Statistics of Drag Perimeter Measurements MTB > set c22 DATA> 6 .302 DATA> 6 .013 DATA> 7 . 0 8 5 DATA> 7 . 9 4 7 DATA> 7 . 3 2 7 DATA> 7 . 4 DATA> 6.52
142
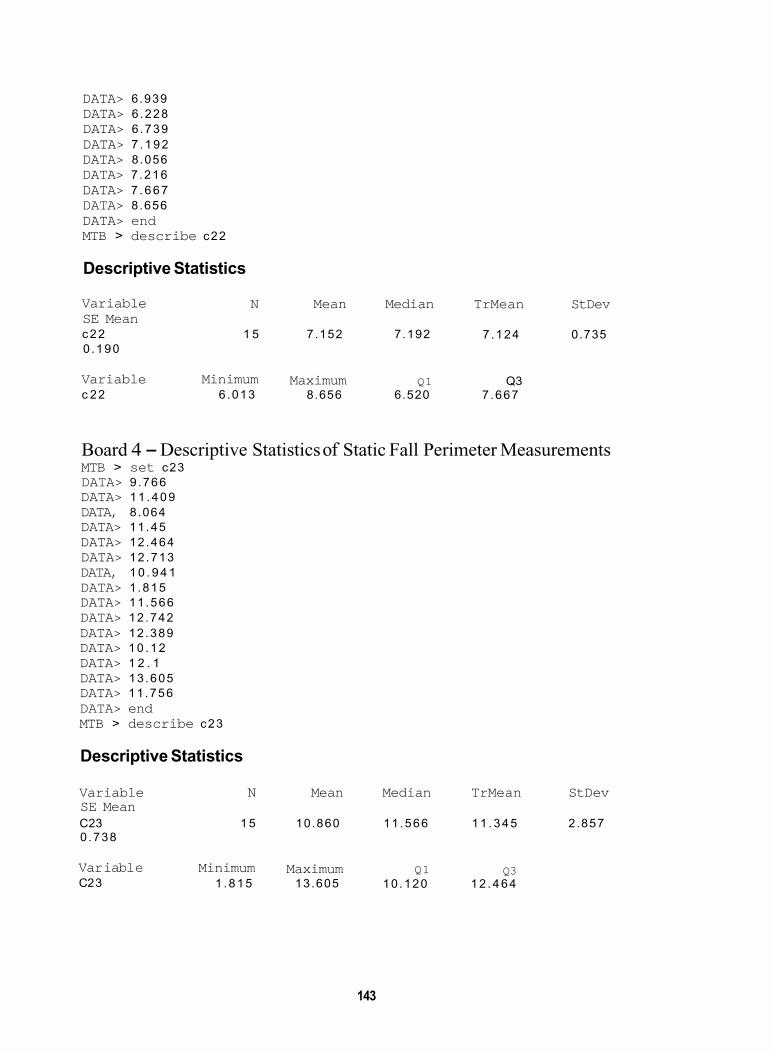
DATA> 6.939 DATA> 6.228 DATA> 6.739 DATA> 7 .192 DATA> 8.056 DATA> 7.216 DATA> 7 .667 DATA> 8.656 DATA> end MTB > describe c22
Descriptive Statistics
Variable SE Mean c22 0 .190
N Mean Median TrMean StDev
1 5 7.152 7.192 7 .124 0.735
Variable Minimum Maximum Q1 Q3 c 2 2 6 .013 8.656 6.520 7 .667
Board 4 - Descriptive Statistics of Static Fall Perimeter Measurements MTB > set c23 DATA> 9.766 DATA> 11 .409 DATA, 8.064 DATA> 11.45 DATA> 12.464 DATA> 12.713 DATA, 1 0 . 9 4 1 DATA> 1.815 DATA> 11.566 DATA> 12.742 DATA> 12.389 DATA> 10 .12 DATA> 1 2 . 1 DATA> 13.605 DATA> 11.756 DATA> end MTB > describe c23
Descriptive Statistics
Variable N Mean Median TrMean StDev SE Mean C23 1 5 10.860 11 .566 11 .345 2.857 0 .738
Var i a bl e Minimum Maximum Q1 Q3 C2 3 1 .815 13.605 10 .120 12 .464
143
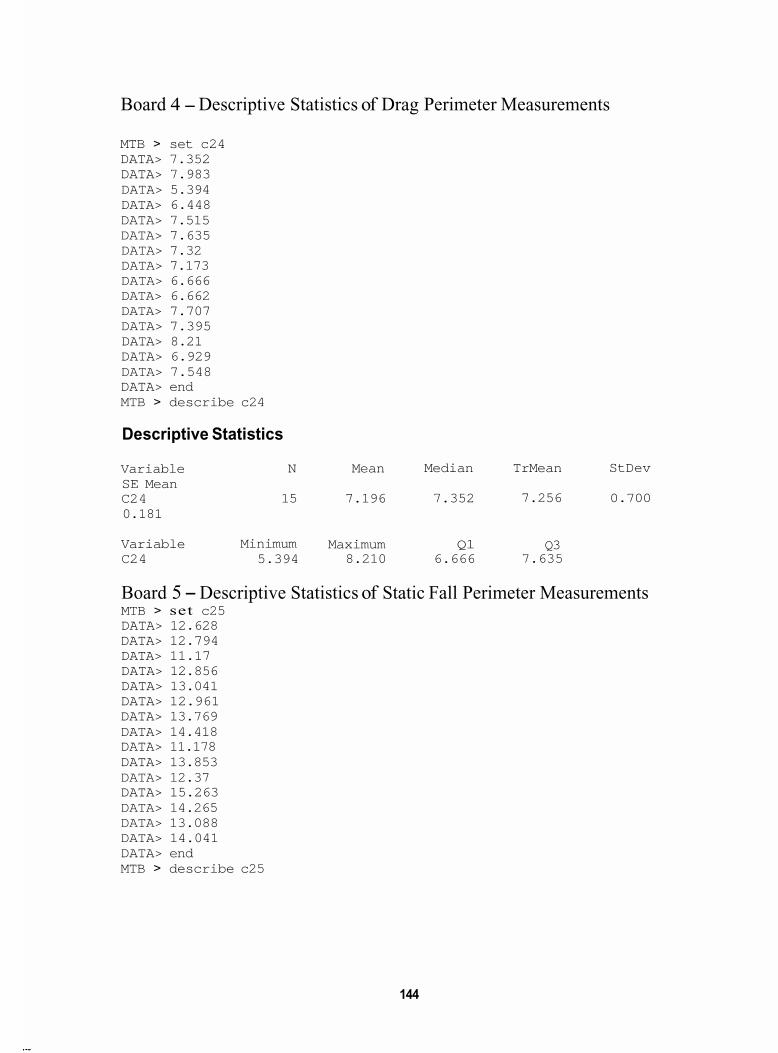
Board 4 - Descriptive Statistics of Drag Perimeter Measurements
MTB > set c24 DATA> 7.352 DATA> 7.983 DATA> 5.394 DATA> 6.448 DATA> 7.515 DATA> 7.635 DATA> 7.32 DATA> 7.173 DATA> 6.666 DATA> 6.662 DATA> 7.707 DATA> 7.395 DATA> 8.21 DATA> 6.929 DATA> 7.548 DATA> end MTB > describe c24
Descriptive Statistics
Variable SE Mean C2 4 0.181
N Mean Median TrMean StDev
15 7.196 7.352 7.256 0.700
Variable Minimum Maximum Q1 Q3 C2 4 5.394 8.210 6.666 7.635
Board 5 - Descriptive Statistics of Static Fall Perimeter Measurements MTB > set c25 DATA> 12.628 DATA> 12.794 DATA> 11.17 DATA> 12.856 DATA> 13.041 DATA> 12.961 DATA> 13.769 DATA> 14.418 DATA> 11.178 DATA> 13.853 DATA> 12.37 DATA> 15.263 DATA> 14.265 DATA> 13.088 DATA> 14.041 DATA> end MTB > describe c25
144
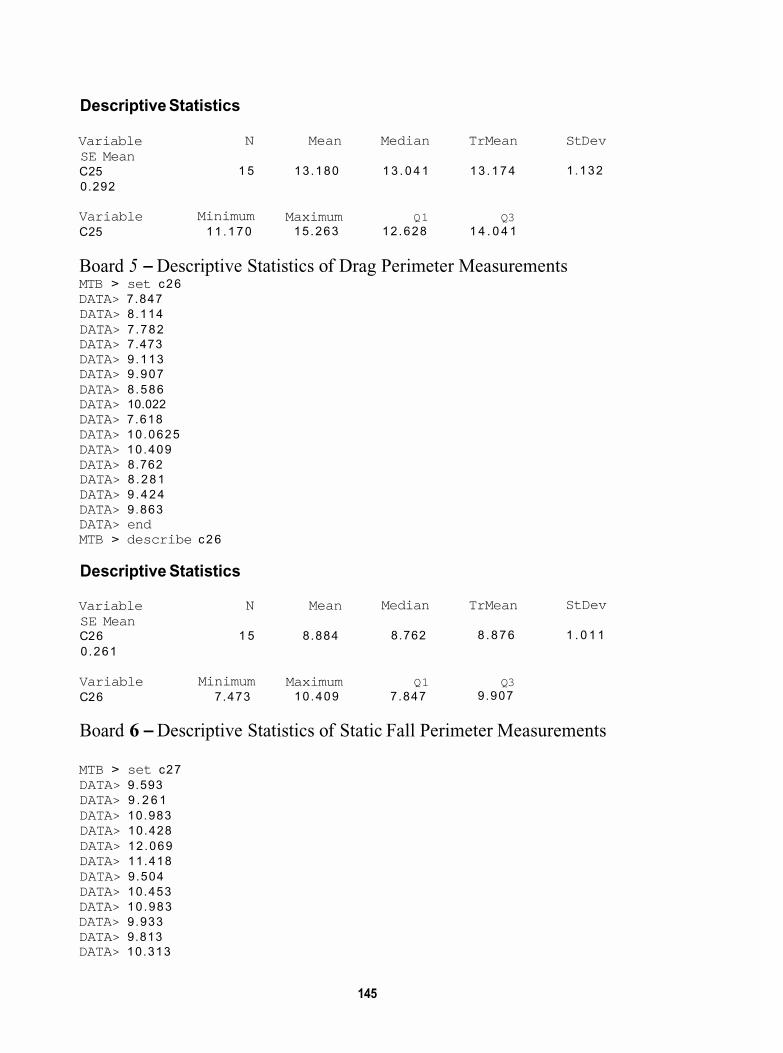
Descriptive Statistics
Variable SE Mean C25 0.292
N Mean Median TrMean S t Dev
1.132 1 5 13 .180 1 3 . 0 4 1 13 .174
Variable Minimum Maximum Q1 Q3 C25 11 .170 15 .263 12 .628 1 4 . 0 4 1
Board 5 - Descriptive Statistics of Drag Perimeter Measurements MTB > set c26 DATA> 7.847 DATA> 8.114 DATA> 7.782 DATA> 7.473 DATA> 9.113 DATA> 9.907 DATA> 8.586 DATA> 10.022 DATA> 7.618 DATA> 10.0625 DATA> 10.409 DATA> 8.762 DATA> 8 .281 DATA> 9 .424 DATA> 9.863 DATA> end MTB > describe c26
Descriptive Statistics
Variable SE Mean C2 6 0 .261
N Mean Median TrMean StDev
1 5 8.884 8.762 8 .876 1 . 0 1 1
Variable Minimum Maximum Q1 Q3 C2 6 7.473 10 .409 7.847 9.907
Board 6 - Descriptive Statistics of Static Fall Perimeter Measurements
MTB > set c27 DATA> 9.593 DATA> 9 . 2 6 1 DATA> 10.983 DATA> 10.428 DATA> 12.069 DATA> 11.418 DATA> 9.504 DATA> 10.453 DATA> 10.983 DATA> 9.933 DATA> 9.813 DATA> 10.313
145
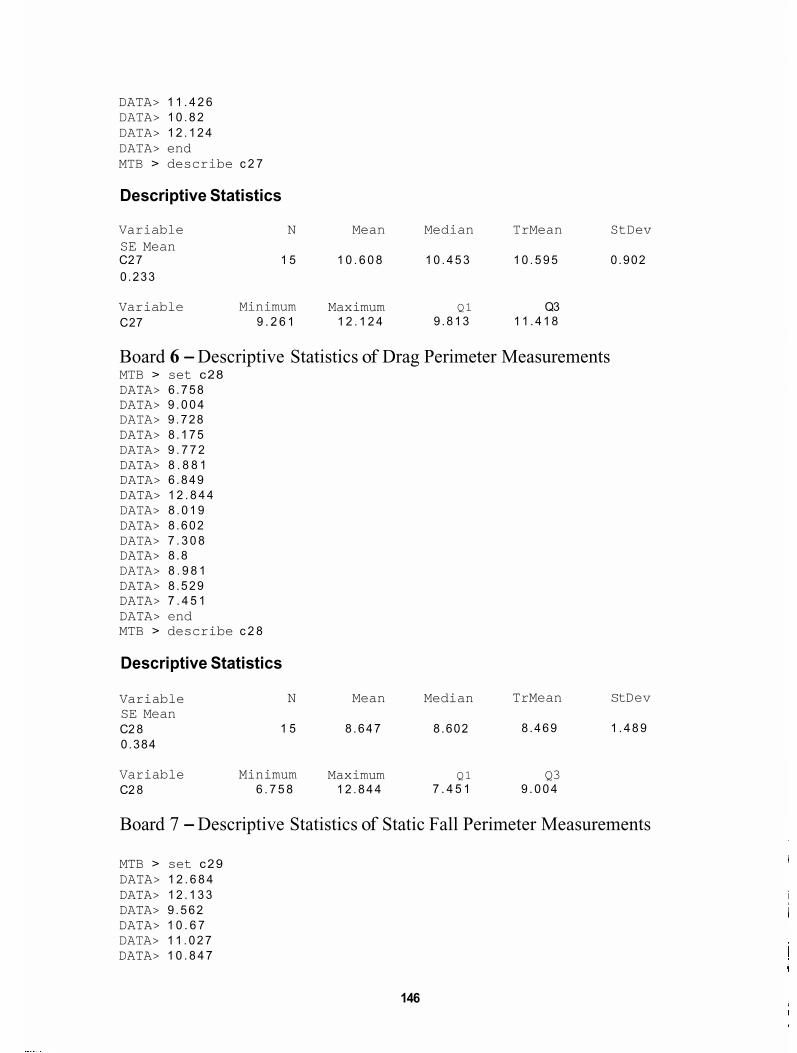
DATA> 1 1 . 4 2 6 DATA> 1 0 . 8 2 DATA> 1 2 . 1 2 4 DATA> end MTB > describe c 2 7
Descriptive Statistics
Variable N Mean Median TrMean StDev SE Mean C2 7 1 5 1 0 . 6 0 8 1 0 . 4 5 3 1 0 . 5 9 5 0 .902 0 .233
Variable Minimum Maximum Q1 Q3 C27 9 . 2 6 1 1 2 . 1 2 4 9 .813 1 1 . 4 1 8
Board 6 - Descriptive Statistics of Drag Perimeter Measurements MTB > set c28 DATA> 6 .758 DATA> 9 . 0 0 4 DATA> 9 .728 DATA> 8 .175 DATA> 9 . 7 7 2 DATA> 8 . 8 8 1 DATA> 6 .849 DATA> 1 2 . 8 4 4 DATA> 8 . 0 1 9 DATA> 8 .602 DATA> 7 . 3 0 8 DATA> 8 .8 DATA> 8 . 9 8 1 DATA> 8 .529 DATA> 7 . 4 5 1 DATA> end MTB > describe c 2 8
Descriptive Statistics
Variable SE Mean C2 8 0 .384
N Mean Median TrMean S t Dev
1 5 8 .647 8 .602 8 .469 1 . 4 8 9
Variable Minimum Maximum Q1 Q3 C2 8 6 . 7 5 8 1 2 . 8 4 4 7 . 4 5 1 9 . 0 0 4
Board 7 - Descriptive Statistics of Static Fall Perimeter Measurements
MTB > set c29 DATA> 1 2 . 6 8 4 DATA> 1 2 . 1 3 3 DATA> 9 .562 DATA> 1 0 . 6 7 DATA> 1 1 . 0 2 7 DATA> 1 0 . 8 4 7
146
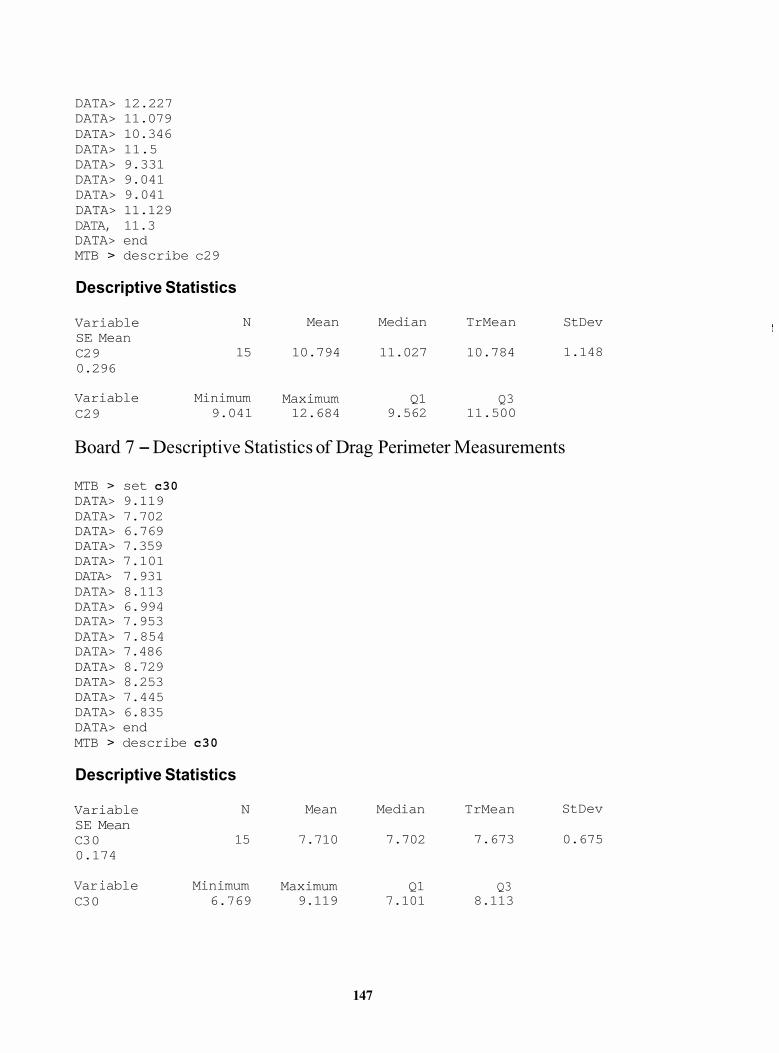
L
L
DATA> 12.227 DATA> 11.079 DATA> 10.346 DATA> 11.5 DATA> 9.331 DATA> 9.041 DATA> 9.041 DATA> 11.129 DATA, 11.3 DATA> end MTB > describe c29
Descriptive Statistics
Variable SE Mean C2 9 0.296
N Mean Median TrMean StDev
1.148 15 10.794 11.027 10.784
Variable Minimum Maximum Q1 Q3 C2 9 9.041 12.684 9.562 11.500
Board 7 - Descriptive Statistics of Drag Perimeter Measurements
MTB > set c30 DATA> 9.119 DATA> 7.702 DATA> 6.769 DATA> 7.359 DATA> 7.101 DATA> 7.931 DATA> 8.113 DATA> 6.994 DATA> 7.953 DATA> 7.854 DATA> 7.486 DATA> 8.729 DATA> 8.253 DATA> 7.445 DATA> 6.835 DATA> end MTB > describe c30
Descriptive Statistics
Variable SE Mean C3 0 0.174
N Mean Median TrMean StDev
15 7.710 7.702 7.673 0.675
Var i abl e Minimum Maximum Q1 Q3 C3 0 6.769 9.119 7.101 8.113
147
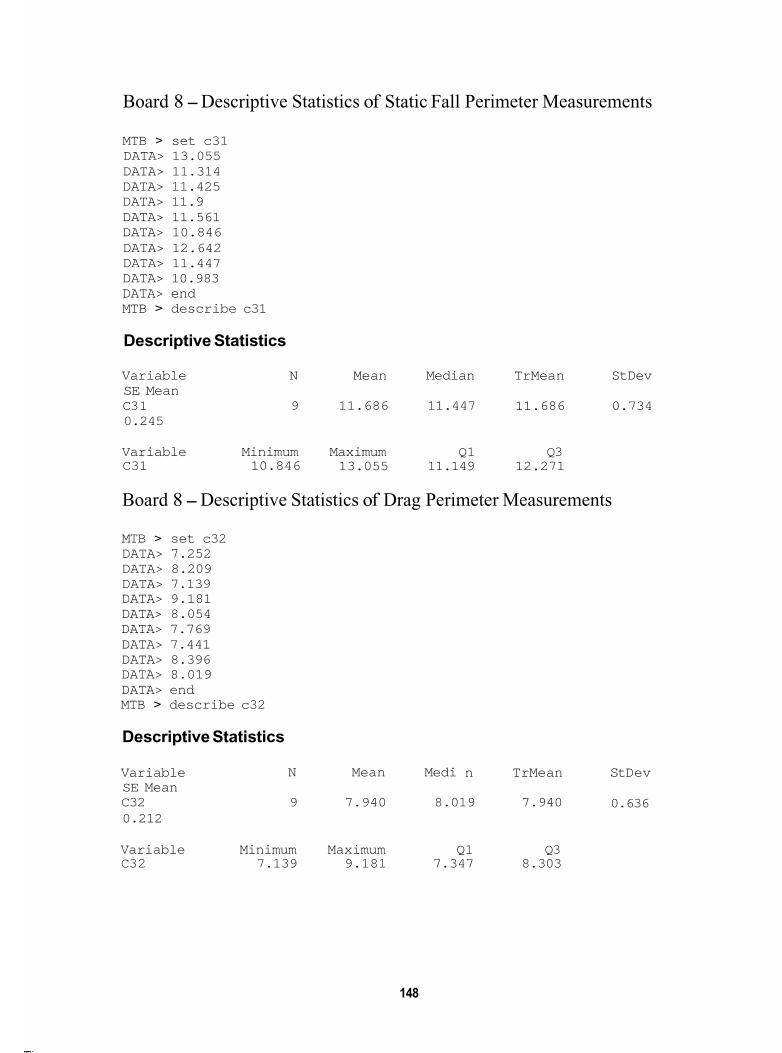
Board 8 - Descriptive Statistics of Static Fall Perimeter Measurements
MTB > set c31 DATA> 13.055 DATA> 11.314 DATA> 11.425 DATA> 11.9 DATA> 11.561 DATA> 10.846 DATA> 12.642 DATA> 11.447 DATA> 10.983 DATA> end MTB > describe c31
Descriptive Statistics
Variable SE Mean C3 1 0.245
N Mean Median TrMean StDev
9 11.686 11.447 11.686 0.734
Variable Minimum Maximum Q1 Q3 13.055 11.149 12.271 C31 10.846
Board 8 - Descriptive Statistics of Drag Perimeter Measurements
MTB > set c32 DATA> 7.252 DATA> 8.209 DATA> 7.139 DATA> 9.181 DATA> 8.054 DATA> 7.769 DATA> 7.441 DATA> 8.396 DATA> 8.019 DATA> end MTB > describe c32
Descriptive Statistics
Variable SE Mean
N Mean Medi n TrMean S t Dev
0.636 C32 9 7.940 8.019 7.940 0.212
Variable Minimum Maximum Q1 Q3 C3 2 7.139 9.181 7.347 8.303
148
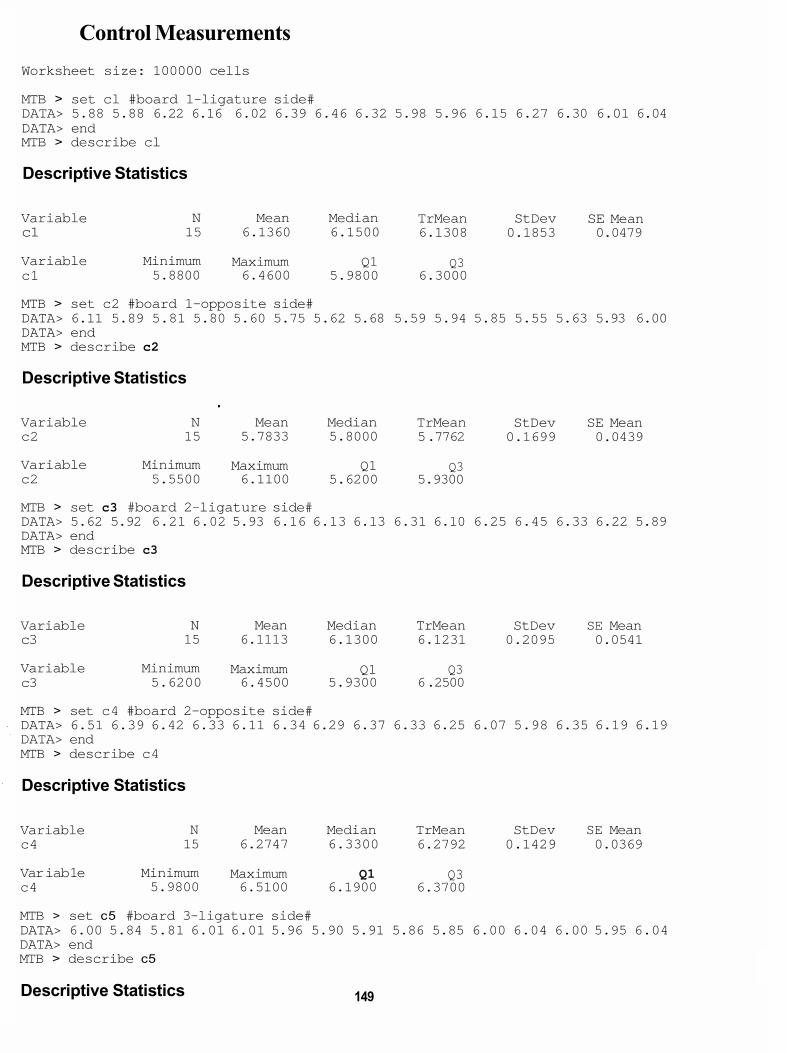
Control Measurements
Worksheet size: 100000 cells
MTB > set cl #board 1-ligature side# DATA> 5.88 5.88 6.22 6.16 6.02 6.39 6.46 6.32 5.98 5.96 6.15 6.27 6.30 6.01 6.04 DATA> end MTB > describe cl
Descriptive Statistics
Variable c1
N Mean Median TrMean StDev SE Mean 15 6.1360 6.1500 6.1308 0.1853 0.0479
Variable Minimum Maximum Q1 Q3 c1 5.8800 6.4600 5.9800 6.3000
MTB > set c2 #board 1-opposite side# DATA> 6.11 5.89 5.81 5.80 5.60 5.75 5.62 5.68 5.59 5.94 5.85 5.55 5.63 5.93 6.00 DATA> end MTB > describe c2
Descriptive Statistics
Variable c2
. N Mean Median TrMean StDev SE Mean 15 5.7833 5.8000 5 .7762 0.1699 0.0439
Variable Minimum Maximum Q1 Q3 c2 5.5500 6.1100 5.6200 5.9300
MTB > set c3 #board 2-ligature side# DATA> 5.62 5.92 6.21 6.02 5.93 6.16 6.13 6.13 6.31 6.10 6.25 6.45 6.33 6.22 5.89 DATA> end MTB > describe c3
Descriptive Statistics
Variable N Mean Median TrMean StDev SE Mean c3 15 6.1113 6.1300 6.1231 0.2095 0.0541
Variable Minimum Maximum Q1 Q3 c3 5.6200 6.4500 5.9300 6 .2500
MTB > set c4 #board 2-opposite side# DATA> 6.51 6.39 6.42 6.33 6.11 6.34 6.29 6.37 6.33 6.25 6.07 5.98 6.35 6.19 6.19 DATA> end MTB > describe c4
Descriptive Statistics
Variable N Mean Median TrMean StDev SE Mean c4 15 6.2747 6.3300 6.2792 0.1429 0.0369
Var i ab 1 e Minimum Maximum Q1 Q3 c4 5.9800 6.5100 6.1900 6.3700
MTB > set c5 #board 3-ligature side# DATA> 6.00 5.84 5.81 6.01 6.01 5.96 5.90 5.91 5.86 5.85 6.00 6.04 6.00 5.95 6.04 DATA> end MTB > describe c5
Descriptive Statistics 149
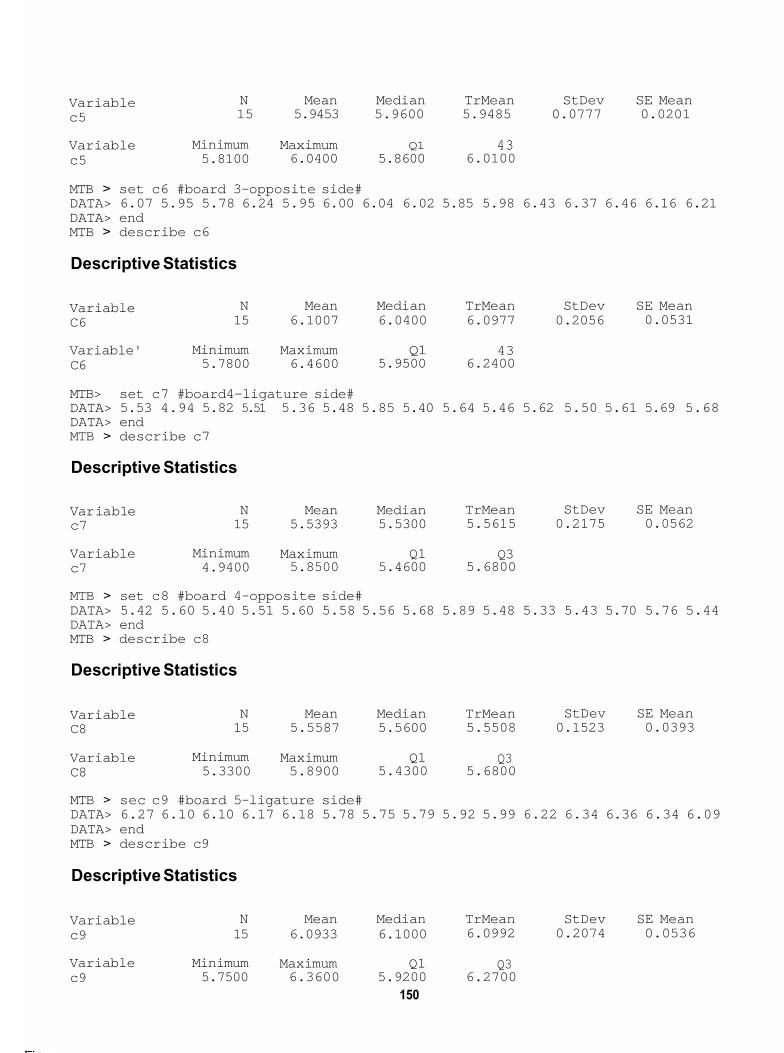
Variable c5
N Mean Median TrMean StDev SE Mean 15 5.9453 5.9600 5.9485 0.0777 0.0201
Variable Minimum Maximum Q1 43 c5 5.8100 6.0400 5.8600 6.0100
MTB > set c6 #board 3-opposite side# DATA> 6.07 5.95 5.78 6.24 5.95 6.00 6.04 6.02 5.85 5.98 6.43 6.37 6.46 6.16 6.21 DATA> end MTB > describe c6
Descriptive Statistics
Variable C6
N Mean Median TrMean StDev SE Mean 0.0531 15 6.1007 6.0400 6.0977 0.2056
Variable' Minimum Maximum Q1 43 C6 5.7800 6.4600 5.9500 6.2400
MTB> set c7 #board4-ligature side# DATA> 5.53 4.94 5.82 5.51 5.36 5.48 5.85 5.40 5.64 5.46 5.62 5.50 5.61 5.69 5.68 DATA> end MTB > describe c7
Descriptive Statistics
Var i ab 1 e c7
N Mean Median TrMean StDev SE Mean 15 5.5393 5.5300 5.5615 0.2175 0.0562
Variable Minimum Maximum Q1 Q3 c7 4.9400 5.8500 5.4600 5.6800
MTB > set c8 #board 4-opposite side# DATA> 5.42 5.60 5.40 5.51 5.60 5.58 5.56 5.68 5.89 5.48 5.33 5.43 5.70 5.76 5.44 DATA> end MTB > describe c8
Descriptive Statistics
Variable C8
Variable C8
N Mean Median TrMean StDev SE Mean 15 5.5587 5.5600 5.5508 0.1523 0.0393
Minimum Maximum Q1 Q3 5.3300 5.8900 5.4300 5.6800
MTB > sec c9 #board 5-ligature side# DATA> 6.27 6.10 6.10 6.17 6.18 5.78 5.75 5.79 5.92 5.99 6.22 6.34 6.36 6.34 6.09 DATA> end MTB > describe c9
Descriptive Statistics
Variable c9
N Mean Median TrMean StDev SE Mean 6.0992 0.2074 0.0536 15 6.0933 6.1000
Variable Minimum Maximum Q1 Q3 c9 5.7500 6.3600 5.9200 6.2700
150
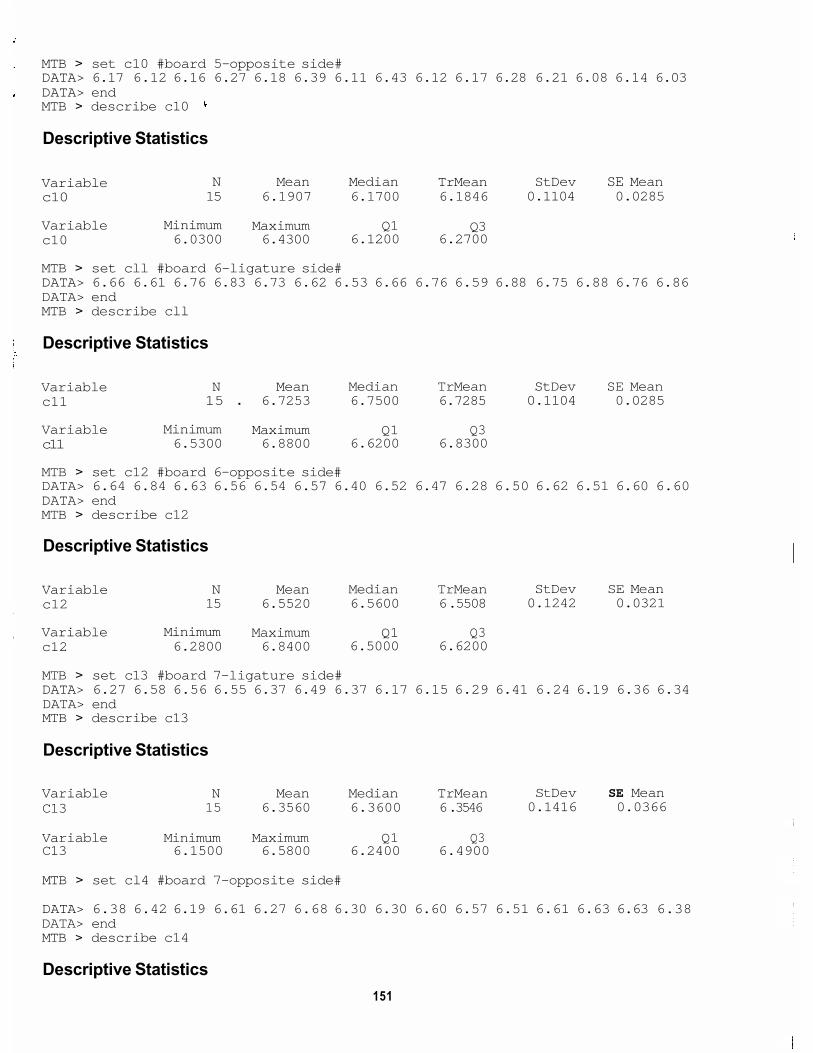
MTB > set c10 #board 5-opposite side# DATA> 6.17 6.12 6.16 6.27 6.18 6.39 6.11 6.43 6.12 6.17 6.28 6.21 6.08 6.14 6.03 DATA> end MTB > describe c10
Descriptive Statistics
Variable c10
N Mean Median TrMean StDev SE Mean 15 6.1907 6.1700 6.1846 0.1104 0.0285
Variable Minimum Maximum Q1 Q3 c10 6.0300 6.4300 6.1200 6.2700
MTB > set cll #board 6-ligature side# DATA> 6.66 6.61 6.76 6.83 6.73 6.62 6.53 6.66 6.76 6.59 6.88 6.75 6.88 6.76 6.86 DATA> end MTB > describe cll
Descriptive Statistics
Variable c11
N Mean Median TrMean StDev SE Mean 15 . 6.7253 6.7500 6.7285 0.1104 0.0285
Variable Minimum Maximum Q1 Q3 c11 6.5300 6.8800 6.6200 6.8300
MTB > set c12 #board 6-opposite side# DATA> 6.64 6.84 6.63 6.56 6.54 6.57 6.40 6.52 6.47 6.28 6.50 6.62 6.51 6.60 6.60 DATA> end MTB > describe c12
Descriptive Statistics
Variable N Mean Median TrMean c12 15 6.5520 6.5600 6 .5508
StDev SE Mean 0.1242 0.0321
Variable Minimum Maximum Q1 Q3 c12 6.2800 6.8400 6.5000 6.6200
MTB > set c13 #board 7-ligature side# DATA> 6.27 6.58 6.56 6.55 6.37 6.49 6.37 6.17 6.15 6.29 6.41 6.24 6.19 6.36 6.34 DATA> end MTB > describe c13
Descriptive Statistics
Variable N Mean Median TrMean 15 6.3560 6.3600 6 .3546 C13
Variable Minimum Maximum Q1 Q3 C13 6.1500 6.5800 6.2400 6.4900
S t Dev SE Mean 0.1416 0.0366
MTB > set cl4 #board 7-opposite side#
DATA> 6.38 6.42 6.19 6.61 6.27 6.68 6.30 6.30 6.60 6.57 6.51 6.61 6.63 6.63 6.38 DATA> end MTB > describe c14
Descriptive Statistics
151
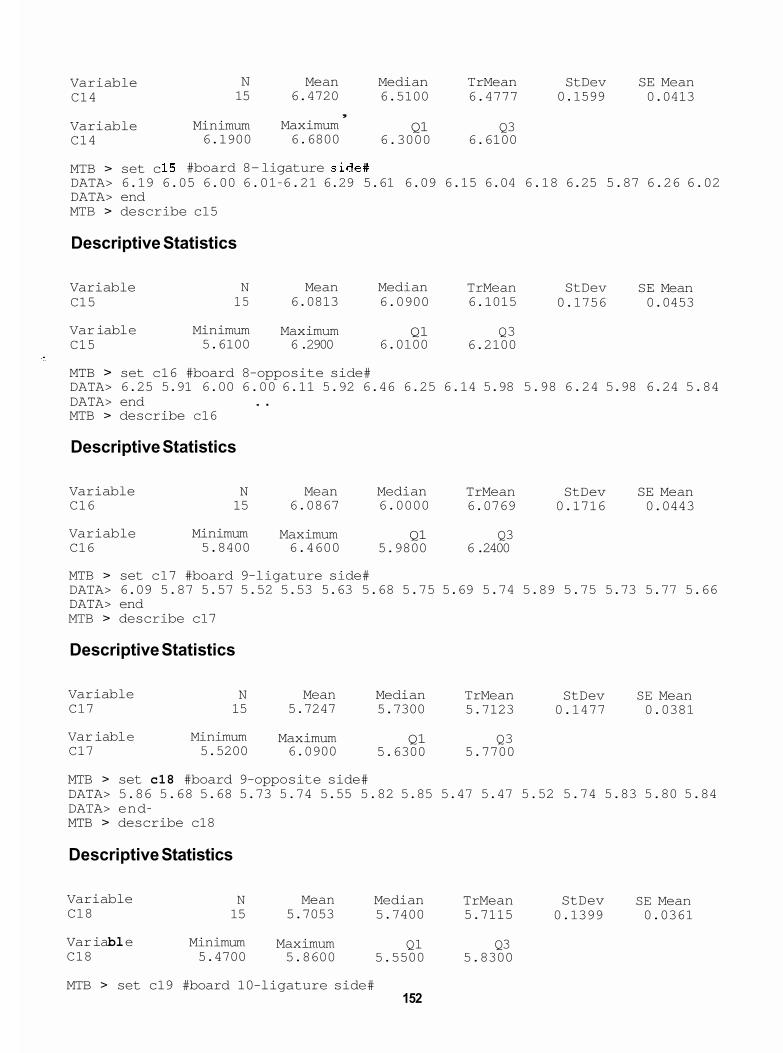
Variable C14
Variable C14
MTB > set c
N 15
Minimum 6.1900
#board 8-
Mean 6.4720
Maximum 6.6800
,
ligature
Median TrMean StDev SE Mean 6.5100 6.4777 0.1599 0.0413
Q1 Q3 6.3000 6.6100
DATA> 6.19 6.05 6.00 6.01-6.21 6.29 5.61 6.09 6.15 6.04 6.18 6.25 5.87 6.26 6.02 DATA> end MTB > describe c15
Descriptive Statistics
Variable C15
N Mean Median TrMean StDev SE Mean 15 6.0813 6.0900 6.1015 0.1756 0.0453
Var i a bl e Minimum Maximum Q1 Q3 C15 5.6100 6 .2900 6.0100 6.2100
MTB > set c16 #board 8-opposite side# DATA> 6.25 5.91 6.00 6.00 6.11 5.92 6.46 6.25 6.14 5.98 5.98 6.24 5.98 6.24 5.84
MTB > describe c16 DATA> end . .
Descriptive Statistics
Variable C16
N Mean Median TrMean StDev SE Mean 15 6.0867 6.0000 6.0769 0.1716 0.0443
Variable Minimum Maximum Q1 Q3 C16 5.8400 6.4600 5.9800 6 .2400
MTB > set c17 #board 9-ligature side# DATA> 6.09 5.87 5.57 5.52 5.53 5.63 5.68 5.75 5.69 5.74 5.89 5.75 5.73 5.77 5.66 DATA> end MTB > describe c17
Descriptive Statistics
Variable C17
N Mean Median TrMean StDev SE Mean 15 5.7247 5.7300 5.7123 0.1477 0.0381
Var i a bl e Minimum Maximum Q1 Q3 C17 5.5200 6.0900 5.6300 5.7700
MTB > set c18 #board 9-opposite side# DATA> 5.86 5.68 5.68 5.73 5.74 5.55 5.82 5.85 5.47 5.47 5.52 5.74 5.83 5.80 5.84 DATA> end- MTB > describe c18
Descriptive Statistics
Variable C18
N Mean Median TrMean StDev SE Mean 15 5.7053 5.7400 5.7115 0.1399 0.0361
Var i a bl e Minimum Maximum Q1 Q3 C18 5.4700 5.8600 5.5500 5.8300
MTB > set c19 #board 10-ligature side# 152
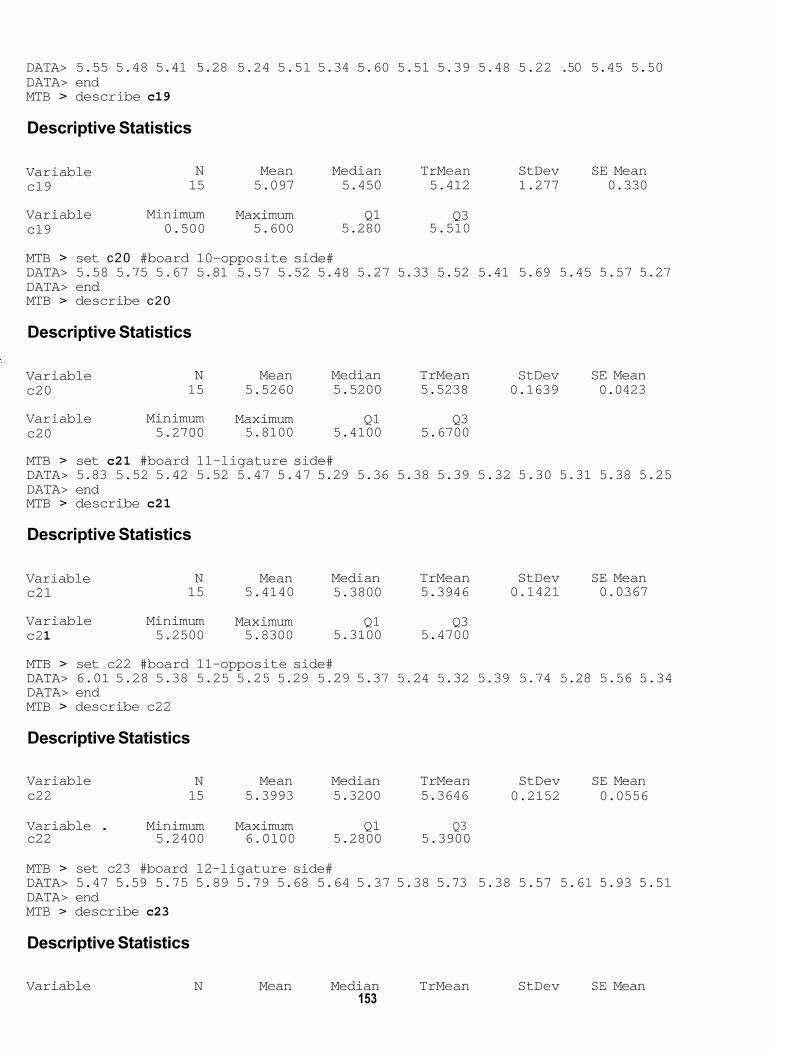
DATA> 5.55 5.48 5.41 5.28 5.24 5.51 5.34 5.60 5.51 5.39 5.48 5.22 .50 5.45 5.50 DATA> end MTB > describe c19
Descriptive Statistics
Variable c19
N Mean Median TrMean StDev SE Mean 15 5.097 5.450 5.412 1.277 0.330
Variable Minimum Maximum Q1 Q3 c19 0.500 5.600 5.280 5.510
MTB > set c20 #board 10-opposite side# DATA> 5.58 5.75 5.67 5.81 5.57 5.52 5.48 5.27 5.33 5.52 5.41 5.69 5.45 5.57 5.27 DATA> end MTB > describe c20
Descriptive Statistics
Variable N Mean Median TrMean StDev SE Mean c2 0 15 5.5260 5.5200 5.5238 0.1639 0.0423
Variable Minimum Maximum Q1 Q3 c2 0 5.2700 5.8100 5.4100 5.6700
MTB > set c21 #board 11-ligature side# DATA> 5.83 5.52 5.42 5.52 5.47 5.47 5.29 5.36 5.38 5.39 5.32 5.30 5.31 5.38 5.25 DATA> end MTB > describe c21
Descriptive Statistics
Variable c2 1
N Mean Median TrMean StDev SE Mean 15 5.4140 5.3800 5.3946 0.1421 0.0367
Variable Minimum Maximum Q1 Q3 c2 1 5.2500 5.8300 5.3100 5.4700
MTB > set c22 #board 11-opposite side# DATA> 6.01 5.28 5.38 5.25 5.25 5.29 5.29 5.37 5.24 5.32 5.39 5.74 5.28 5.56 5.34 DATA> end MTB > describe c22
Descriptive Statistics
Variable N Mean Median TrMean StDev SE Mean 0.2152 0.0556 c22 15 5.3993 5.3200 5.3646
Variable . Minimum Maximum Q1 Q3 c22 5.2400 6.0100 5.2800 5.3900
MTB > set c23 #board 12-ligature side# DATA> 5.47 5.59 5.75 5.89 5.79 5.68 5.64 5.37 5.38 5.73 5.38 5.57 5.61 5.93 5.51 DATA> end MTB > describe c23
Descriptive Statistics
Variable N Mean Median TrMean StDev SE Mean 153

C2 3 15 5.6193 5.6100 5.6146 0.1786 0.0461
Variable Minimum Maximum Q1 Q3 C23 5.3700 5.9300 5.4700 5.7500
MTB > set c24 #board 12-opposite side# DATA> 5.83 5.88 5.70 5.47 5.65 5.66 5.69 5.77 5.68 5.70 5.75 5.71 5.73 5.74 5.82 DATA> end MTB > describe c24
Descriptive Statistics
SE Mean Variable N Mean Median TrMean C24 15 5.7187 5.7100 5.7254 0.0949 0.0245
S t Dev
Variable Minimum Maximum Q1 Q3 C24 5.4700 5.8800 5.6800 5.7700
MTB > set c25 #board 13-ligature side# DATA> 5.79 5.91 5.69 5.57 5.70 5.87 6.00 5.76 5.96 5.82 6.04 6.08 6.12 6.00 5.99 DATA> end MTB > describe c25
Descriptive Statistics
Variable C25
N Mean Median TrMean 15 5.8867 5.9100 5.8931
StDev SE Mean 0.1607 0.0415
Variable Minimum Maximum Q1 Q3 C2 5 5.5700 6.1200 5.7600 6.0000
MTB > set c26 #board 13-opposite side# DATA> 5.67 6.10 5.87 5.87 5.90 5.86 5.78 5.95 5.70 5.88 5.94 6.12 5.75 5.95 5.97 DATA> end MTB > describe c26
Descriptive Statistics
Variable C2 6
N Mean Median TrMean StDev SE Mean 15 5.8873 5.8800 5.8862 0.1285 0.0332
Variable Minimum Maximum Q1 Q3 C2 6 5.6700 6.1200 5.7800 5.9500
MTB >
154
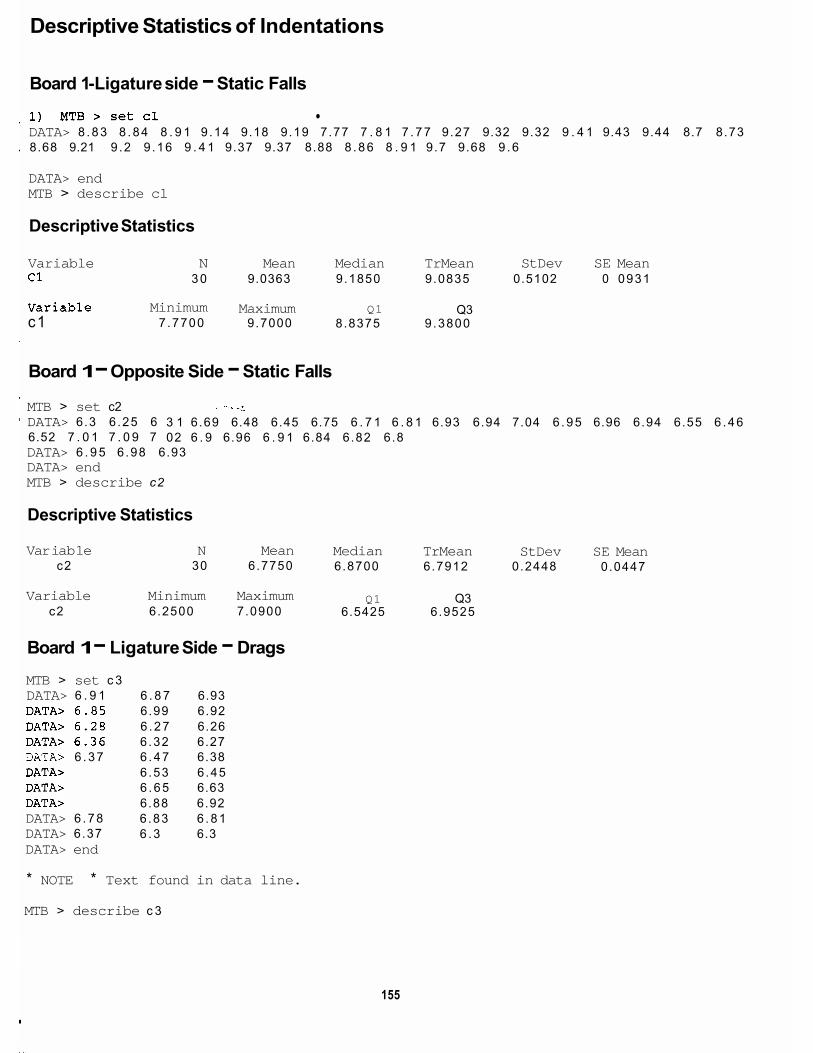
Descriptive Statistics of Indentations
Board 1 -Ligature side - Static Falls
DATA> 8 .83 8 .84 8 . 9 1 9 .14 9.18 9.19 7.77 7 . 8 1 7 .77 9.27 9.32 9.32 9 . 4 1 9.43 9.44 8.7 8.73 8.68 9.21 9 .2 9 .16 9 . 4 1 9.37 9.37 8.88 8 .86 8 . 9 1 9.7 9.68 9 .6
DATA> end MTB > describe cl
Descriptive Statistics
Variable N Mean Median TrMean StDev SE Mean 30 9.0363 9.1850 9.0835 0.5102 0 0931
Minimum Maximum Q1 Q3 c1 7 .7700 9.7000 8.8375 9 .3800
Board 1 - Opposite Side - Static Falls
MTB > set c2 DATA> 6.3 6 .25 6 6.52 7 . 0 1 7 . 0 9 7
3 1 6.69 6.48 6.45 6.75 6 . 7 1 6 . 8 1 6.93 6.94 7.04 6 .95 6.96 6.94 6.55 6 .46 02 6 . 9 6.96 6 . 9 1 6.84 6.82 6.8
DATA> 6 . 9 5 6 .98 6.93 DATA> end MTB > describe c2
Descriptive Statistics
Var i a b 1 e N Mean c2 30 6.7750
Variable Minimum Maximum c2 6 .2500 7.0900
Board 1 - Ligature Side - Drags
MTB > set c 3 DATA> 6 . 9 1
6 .37
DATA> 6 .78 DATA> 6.37 DATA> end
6 . 8 7 6.93 6.99 6.92 6 .27 6.26 6 .32 6.27 6 .47 6.38 6 .53 6 .45 6 .65 6.63 6.88 6.92 6 .83 6 .81 6 .3 6.3
* NOTE * Text found in data line.
MTB > describe c 3
L
Median TrMean StDev SE Mean 6.8700 6.7912 0.2448 0.0447
Q1 Q3 6.5425 6.9525
155
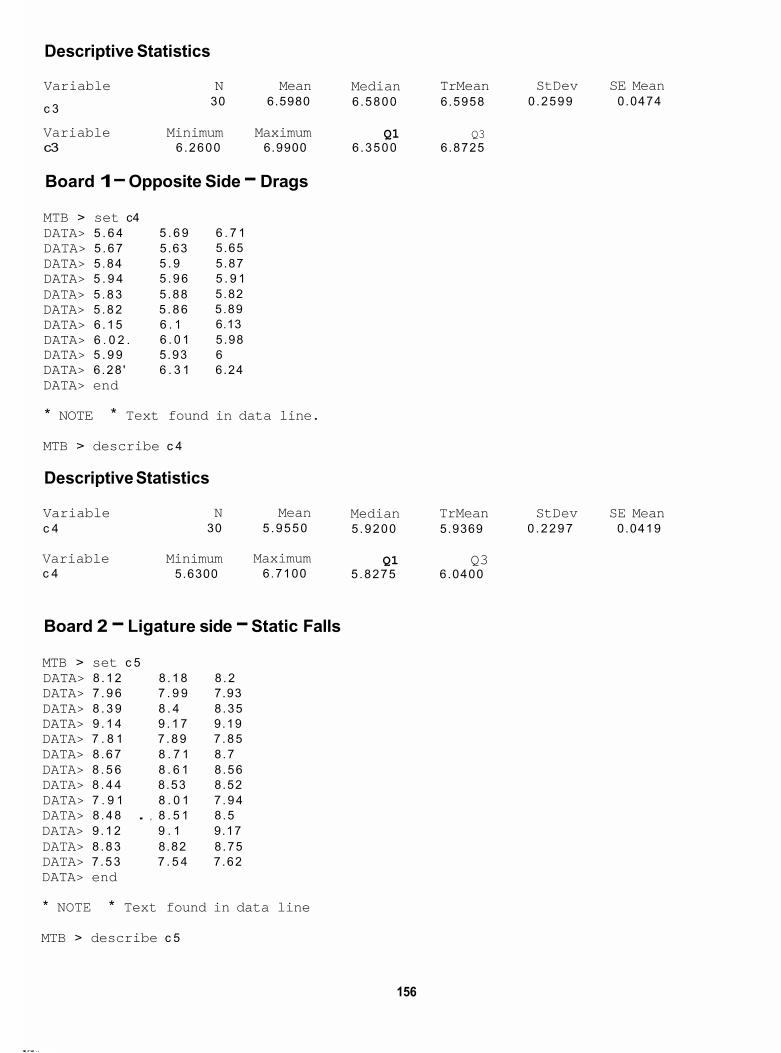
Descriptive Statistics
Variable N Mean 30 6.5980
Variable Minimum Maximum c3 6 .2600 6.9900
c 3
Board 1 - Opposite Side - Drags
MTB > set c4 DATA> 5 . 6 4 DATA> 5 .67 DATA> 5.84 DATA> 5 . 9 4 DATA> 5 .83 DATA> 5 .82 DATA> 6 .15 DATA> 6 . 0 2 .
DATA> 6.28 ' DATA> end
DATA> 5 . 9 9
5 . 6 9 6 . 7 1 5.63 5.65 5 . 9 5.87 5 .96 5 . 9 1 5 .88 5.82 5 .86 5.89 6 . 1 6.13 6 . 0 1 5.98 5.93 6 6 . 3 1 6.24
* NOTE * Text found in data line.
MTB > describe c 4
Descriptive Statistics
Variable c 4
N Mean 30 5 .9550
Variable Minimum Maximum c 4 5.6300 6.7100
Board 2 - Ligature side - Static Falls
MTB > set c 5 DATA> 8 .12 8 .18 8 .2 DATA> 7 . 9 6 7 . 9 9 7.93 DATA> 8 . 3 9 8 . 4 8 .35 DATA> 9 . 1 4 9 . 1 7 9.19 DATA> 7 . 8 1 7 .89 7 .85 DATA> 8 .67 8 . 7 1 8 .7 DATA> 8 . 5 6 8 . 6 1 8 .56 DATA> 8 . 4 4 8.53 8.52
8 . 0 1 7 .94 DATA> 7 . 9 1 DATA> 8 .48 . , 8 . 5 1 8 .5 DATA> 9 .12 9 . 1 9.17 DATA> 8 .83 8.82 8 .75 DATA> 7 .53 7 . 5 4 7 .62 DATA> end
* NOTE * Text found in data line
Median TrMean StDev SE Mean 6.5800 6.5958 0 .2599 0.0474
Q1 Q3 6.3500 6.8725
Median TrMean StDev SE Mean 5.9200 5.9369 0 .2297 0.0419
Q1 Q35.8275 6.0400
MTB > describe c 5
156
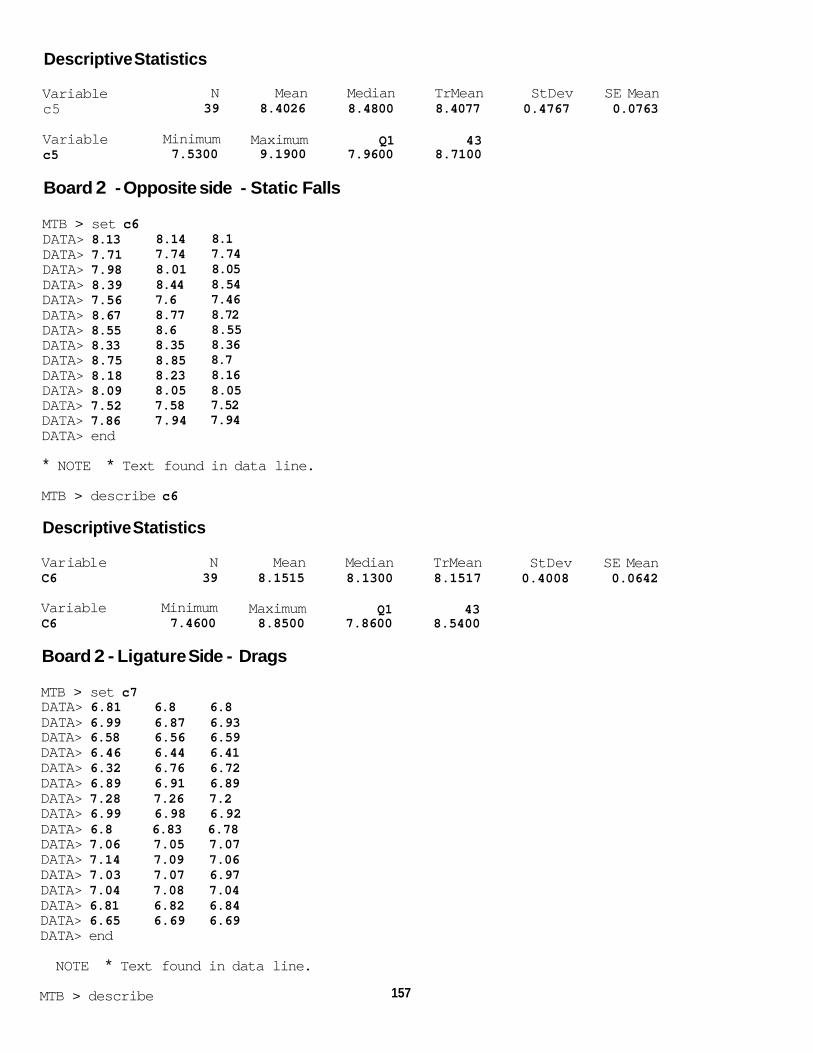
Descriptive Statistics
Variable c5
N Mean Median TrMean StDev SE Mean 39 8.4026 8.4800 8.4077 0.4767 0.0763
Variable Minimum Maximum Q1 43 c5 7.5300 9.1900 7.9600 8.7100
Board 2 - Opposite side - Static Falls
MTB > set c6 DATA> 8.13 DATA> 7.71 DATA> 7.98 DATA> 8.39 DATA> 7.56 DATA> 8.67 DATA> 8.55 DATA> 8.33 DATA> 8.75 DATA> 8.18 DATA> 8.09 DATA> 7.52 DATA> 7.86 DATA> end
8.14 7.74 8.01 8.44 7.6 8.77 8.6 8.35 8.85 8.23 8.05 7.58 7.94
8.1 7.74 8.05 8.54 7.46 8.72 8.55 8.36 8.7 8.16 8.05 7.52 7.94
* NOTE * Text found in data line.
MTB > describe c6
Descriptive Statistics
Var ia bl e C6
N Mean Median TrMean StDev SE Mean 39 8.1515 8.1300 8.1517 0.4008 0.0642
Variable Minimum Maximum Q1 43 C6 7.4600 8.8500 7.8600 8.5400
Board 2 - Ligature Side - Drags
MTB > set c7 DATA> 6.81 6.8 6.8 DATA> 6.99 6.87 6.93 DATA> 6.58 6.56 6.59 DATA> 6.46 6.44 6.41 DATA> 6.32 6.76 6.72 DATA> 6.89 6.91 6.89 DATA> 7.28 7.26 7.2 DATA> 6.99 6.98 6.92 DATA> 6.8 6.83 6.78 DATA> 7.06 7.05 7.07 DATA> 7.14 7.09 7.06 DATA> 7.03 7.07 6.97 DATA> 7.04 7.08 7.04 DATA> 6.81 6.82 6.84 DATA> 6.65 6.69 6.69 DATA> end
NOTE * Text found in data line.
MTB > describe c7 157
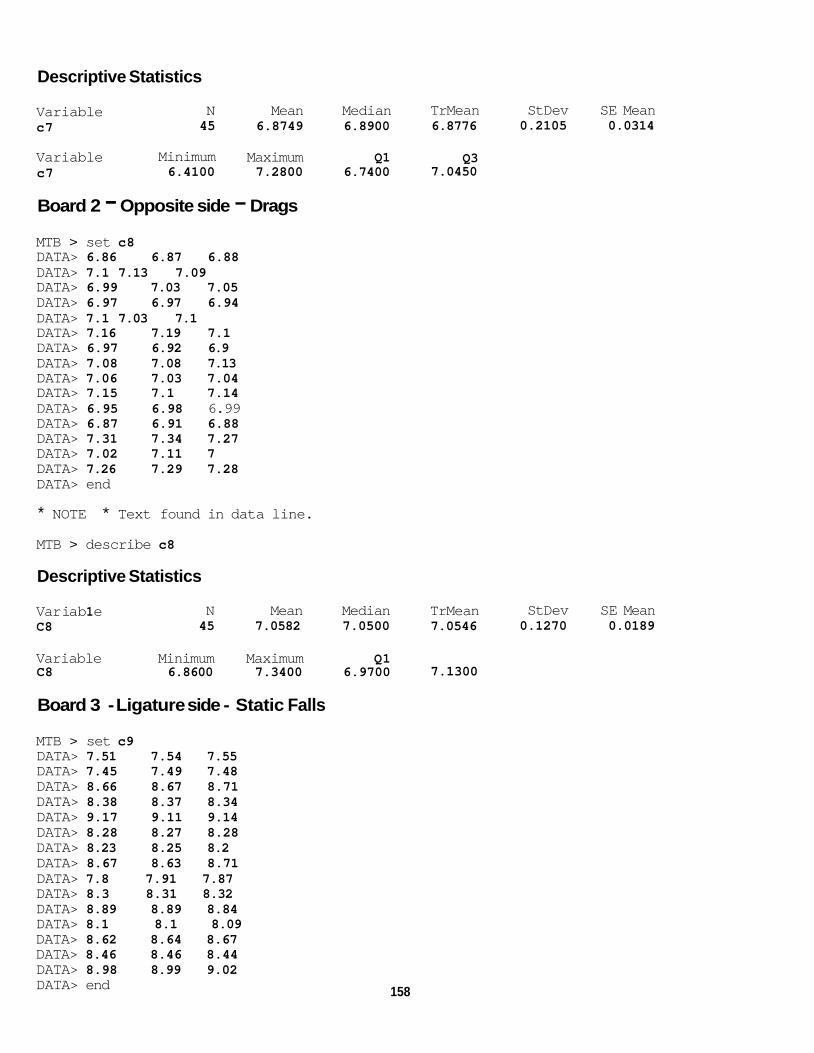
Descriptive Statistics
Variable c7
N Mean Median 45 6.8749 6.8900
Variable Minimum Maximum Q1 c7 6.4100 7.2800 6.7400
Board 2 - Opposite side - Drags
MTB > set c8 DATA> 6.86 6.87 6.88 DATA> 7.1 7.13 7.09 DATA> 6.99 7.03 7.05 DATA> 6.97 6.97 6.94 DATA> 7.1 7.03 7.1 DATA> 7.16 7.19 7.1 DATA> 6.97 6.92 6.9 DATA> 7.08 7.08 7.13 DATA> 7.06 7.03 7.04 DATA> 7.15 7.1 7.14 DATA> 6.95 6.98 6.99 DATA> 6.87 6.91 6.88 DATA> 7.31 7.34 7.27 DATA> 7.02 7.11 7 DATA> 7.26 7.29 7.28 DATA> end
* NOTE * Text found in data line.
MTB > describe c8
Descriptive Statistics
Var i ab 1 e C8
N Mean Median 45 7.0582 7.0500
Variable Minimum Maximum Q1 C8 6.8600 7.3400 6.9700
Board 3 - Ligature side - Static Falls
MTB > set c9 DATA> 7.51 7.54 7.55 DATA> 7.45 7.49 7.48 DATA> 8.66 8.67 8.71 DATA> 8.38 8.37 8.34 DATA> 9.17 9.11 9.14 DATA> 8.28 8.27 8.28 DATA> 8.23 8.25 8.2 DATA> 8.67 8.63 8.71 DATA> 7.8 7.91 7.87 DATA> 8.3 8.31 8.32 DATA> 8.89 8.89 8.84 DATA> 8.1 8.1 8.09 DATA> 8.62 8.64 8.67 DATA> 8.46 8.46 8.44 DATA> 8.98 8.99 9.02 DATA> end 158
TrMean StDev SE Mean 6.8776 0.2105 0.0314
Q3 7.0450
TrMean StDev SE Mean 7.0546 0.1270 0.0189
Q3 7.1300
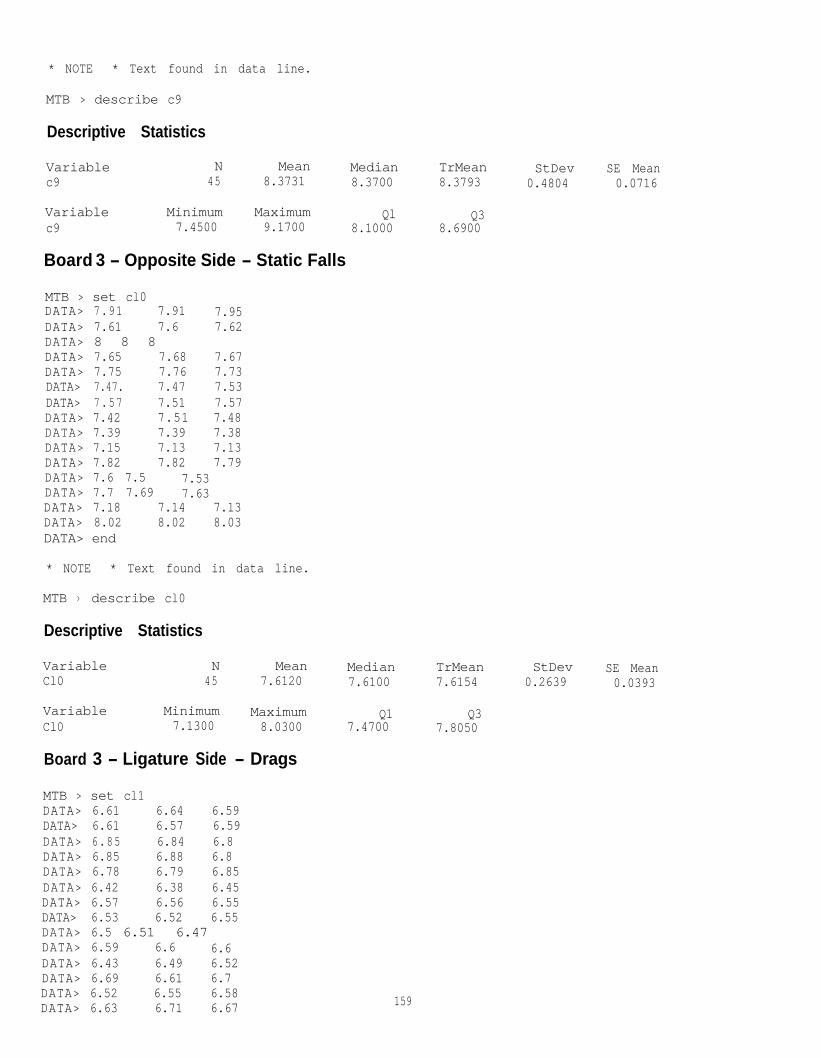
* NOTE * Text found in data line.
MTB > describe c9
Descriptive Statistics
Variable N Mean Medianc9 45 8.3731 8.3700
Variablec9
Minimum Maximum Ql Q37.4500 9.1700 8.1000 8.6900
Board 3 - Opposite Side - Static Falls
MTB > set cl0DATA> 7.91 7.91 7.95DATA> 7.61 7.6 7.62DATA> 8 8 8DATA> 7.65 7.68 7.67DATA> 7.75 7.76 7.73DATA> 7.47. 7.47 7.53DATA> 7.57 7.51 7.57DATA> 7.42 7.51 7.48DATA> 7.39 7.39 7.38DATA> 7.15 7.13 7.13DATA> 7.82 7.82 7.79DATA> 7.6 7.5 7.53DATA> 7.7 7.69 7.63DATA> 7.18 7.14 7.13DATA> 8.02 8.02 8.03DATA> end
* NOTE * Text found in data line.
MTB > describe cl0
Descriptive Statistics
VariableCl0
N Mean Median45 7.6120 7.6100
VariableCl0
Minimum Maximum Q1 Q37.1300 8.0300 7.4700 7.8050
Board 3 - Ligature Side - Drags
MTB > set cl1DATA> 6.61 6.64 6.59DATA> 6.61 6.57 6.59DATA> 6.85 6.84 6.8DATA> 6.85 6.88 6.8DATA> 6.78 6.79 6.85DATA> 6.42 6.38 6.45DATA> 6.57 6.56 6.55DATA> 6.53 6.52 6.55DATA> 6.5 6.51 6.47DATA> 6.59 6.6 6.6DATA> 6.43 6.49 6.52DATA> 6.69 6.61 6.7DATA> 6.52 6.55 6.58DATA> 6.63 6.71 6.67 159
TrMean StDev SE Mean8.3793 0.4804 0.0716
TrMean StDev SE Mean7.6154 0.2639 0.0393
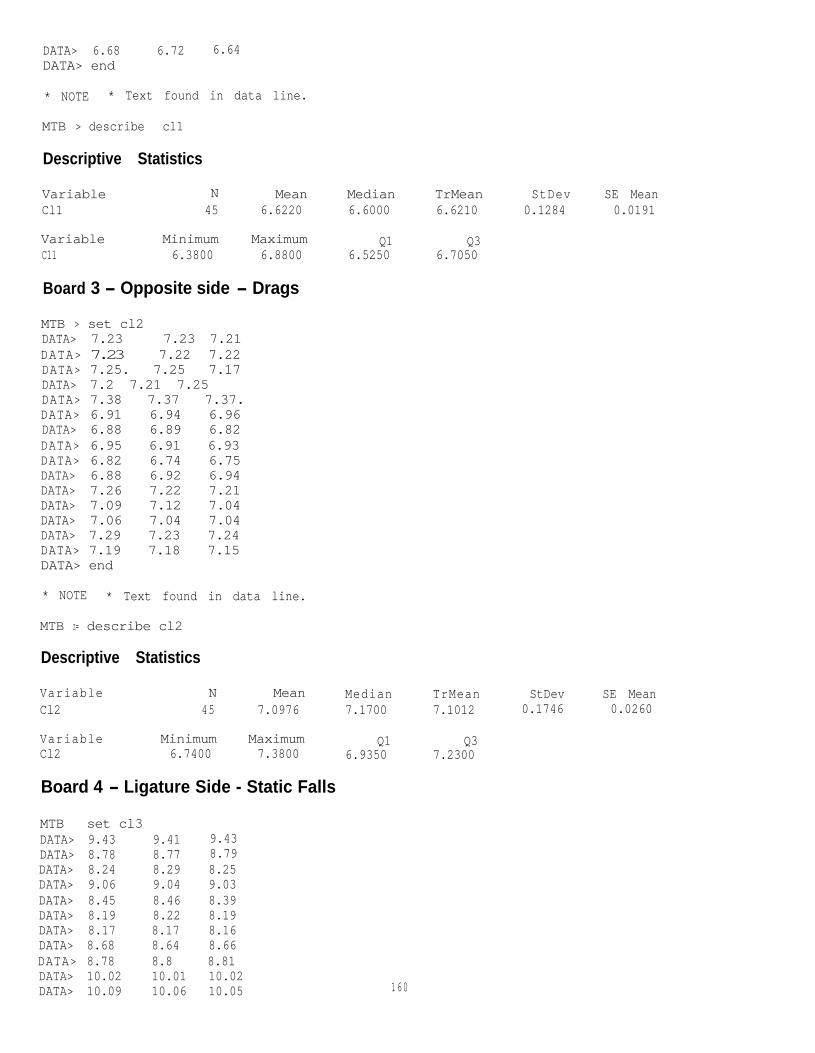
DATA> 6.68 6.72 6.64DATA> end
* NOTE * Text found in data line.
MTB > describe cl1
Descriptive Statistics
VariableCl1
N Mean Median TrMean StDev SE Mean45 6.6220 6.6000 6.6210 0.1284 0.0191
VariableC11
Minimum Maximum Q1 Q36.3800 6.8800 6.5250 6.7050
Board 3 - Opposite side - Drags
MTB > set cl2DATA> 7.23 7.23 7.21DATA> 7.23 7.22 7.22DATA> 7.25. 7.25 7.17DATA> 7.2 7.21 7.25DATA> 7.38 7.37 7.37.DATA> 6.91 6.94 6.96DATA> 6.88 6.89 6.82DATA> 6.95 6.91 6.93DATA> 6.82 6.74 6.75DATA> 6.88 6.92 6.94DATA> 7.26 7.22 7.21DATA> 7.09 7.12 7.04DATA> 7.06 7.04 7.04DATA> 7.29 7.23 7.24DATA> 7.19 7.18 7.15DATA> end
* NOTE * Text found in data line.
MTB z= describe cl2
Descriptive Statistics
Variable N Mean Median TrMean StDev SE MeanCl2 45 7.0976 7.1700 7.1012 0.1746 0.0260
VariableCl2
Minimum Maximum Q1 Q36.7400 7.3800 6.9350 7.2300
Board 4 - Ligature Side - Static Falls
MTB > set cl3DATA> 9.43 9.41DATA> 8.78 8.77DATA> 8.24 8.29DATA> 9.06 9.04DATA> 8.45 8.46DATA> 8.19 8.22DATA> 8.17 8.17DATA> 8.68 8.64DATA> 8.78 8.8DATA> 10.02 10.01DATA> 10.09 10.06
9.438.798.259.038.398.198.168.668.8110.0210.05 160
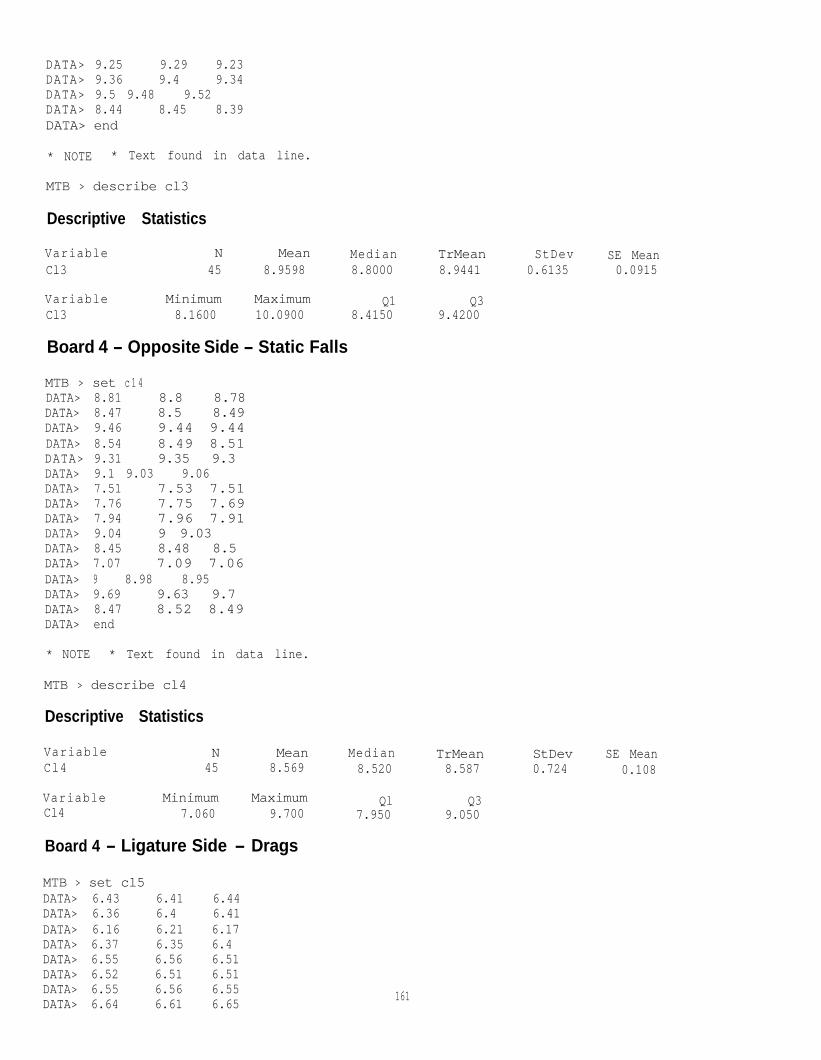
DATA> 9.25 9.29 9.23DATA> 9.36 9.4 9.34DATA> 9.5 9.48 9.52DATA> 8.44 8.45 8.39DATA> end
* NOTE * Text found in data line.
MTB > describe cl3
Descriptive Statistics
Variable N Mean Median TrMean StDev SE MeanCl3 45 8.9598 8.8000 8.9441 0.6135 0.0915
Variable Minimum Maximum Q1 Q3Cl3 8.1600 10.0900 8.4150 9.4200
Board 4 - Opposite Side - Static Falls
MTB > set c1 4DATA> 8.81 8.8 8.78DATA> 8.47 8.5 8.49DATA> 9.46 9.44 9.44DATA> 8.54 8.49 8.51DATA> 9.31 9.35 9.3DATA> 9.1 9.03 9.06DATA> 7.51 7.53 7.51DATA> 7.76 7.75 7.69DATA> 7.94 7.96 7.91DATA> 9.04 9 9.03DATA> 8.45 8.48 8.5DATA> 7.07 7.09 7.06DATA> 9 8.98 8.95DATA> 9.69 9.63 9.7DATA> 8.47 8.52 8.49DATA> end
* NOTE * Text found in data line.
MTB > describe cl4
Descriptive Statistics
VariableCl4
N Mean Median TrMean45 8.569 8.520 8.587
VariableCl4
Minimum Maximum Ql Q37.060 9.700 7.950 9.050
Board 4 - Ligature Side - Drags
MTB > set cl5DATA> 6.43 6.41 6.44DATA> 6.36 6.4 6.41DATA> 6.16 6.21 6.17DATA> 6.37 6.35 6.4DATA> 6.55 6.56 6.51DATA> 6.52 6.51 6.51DATA> 6.55 6.56 6.55DATA> 6.64 6.61 6.65 161
StDev SE Mean0.724 0.108
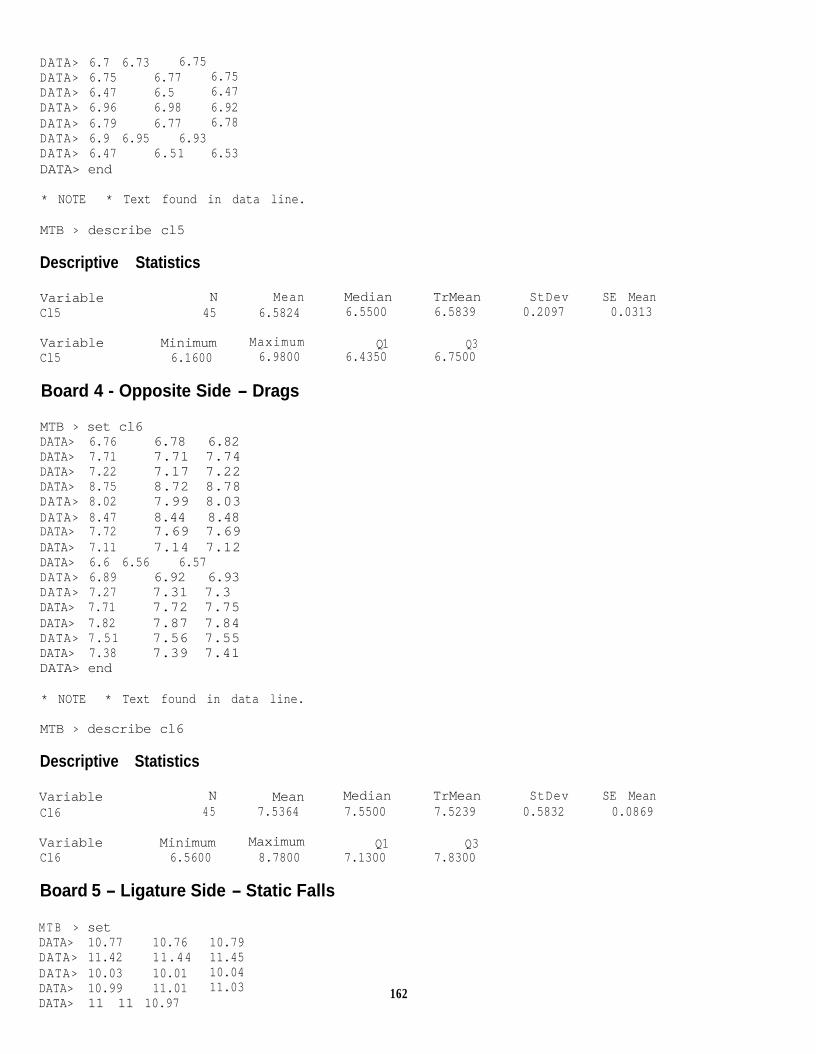
DATA> 6.7 6.73 6.75DATA> 6.75 6.77 6.75DATA> 6.47 6.5 6.47DATA> 6.96 6.98 6.92DATA> 6.79 6.77 6.78DATA> 6.9 6.95 6.93DATA> 6.47 6.51 6.53DATA> end
* NOTE * Text found in data line.
MTB > describe cl5
Descriptive Statistics
Variable N Mean Median TrMean StDev SE MeanCl5 45 6.5824 6.5500 6.5839 0.2097 0.0313
Variable Minimum Maximum Q1 Q3Cl5 6.1600 6.9800 6.4350 6.7500
Board 4 - Opposite Side - Drags
MTB > set cl6DATA> 6.76 6.78 6.82DATA> 7.71 7.71 7.74DATA> 7.22 7.17 7.22DATA> 8.75 8.72 8.78DATA> 8.02 7.99 8.03DATA> 8.47 8.44 8.48DATA> 7.72 7.69 7.69DATA> 7.11 7.14 7.12DATA> 6.6 6.56 6.57DATA> 6.89 6.92 6.93DATA> 7.27 7.31 7.3DATA> 7.71 7.72 7.75DATA> 7.82 7.87 7.84DATA> 7.51 7.56 7.55DATA> 7.38 7.39 7.41DATA> end
* NOTE * Text found in data line.
MTB > describe cl6
Descriptive Statistics
VariableCl6
N Mean Median TrMean StDev SE Mean45 7.5364 7.5500 7.5239 0.5832 0.0869
VariableCl6
Minimum Maximum Q1 Q36.5600 8.7800 7.1300 7.8300
Board 5 - Ligature Side - Static Falls
M T B > set cl7DATA> 10.77 10.76 10.79DATA> 11.42 11.44 11.45DATA> 10.03 10.01 10.04DATA> 10.99 11.01 11.03DATA> 11 11 10.97 162
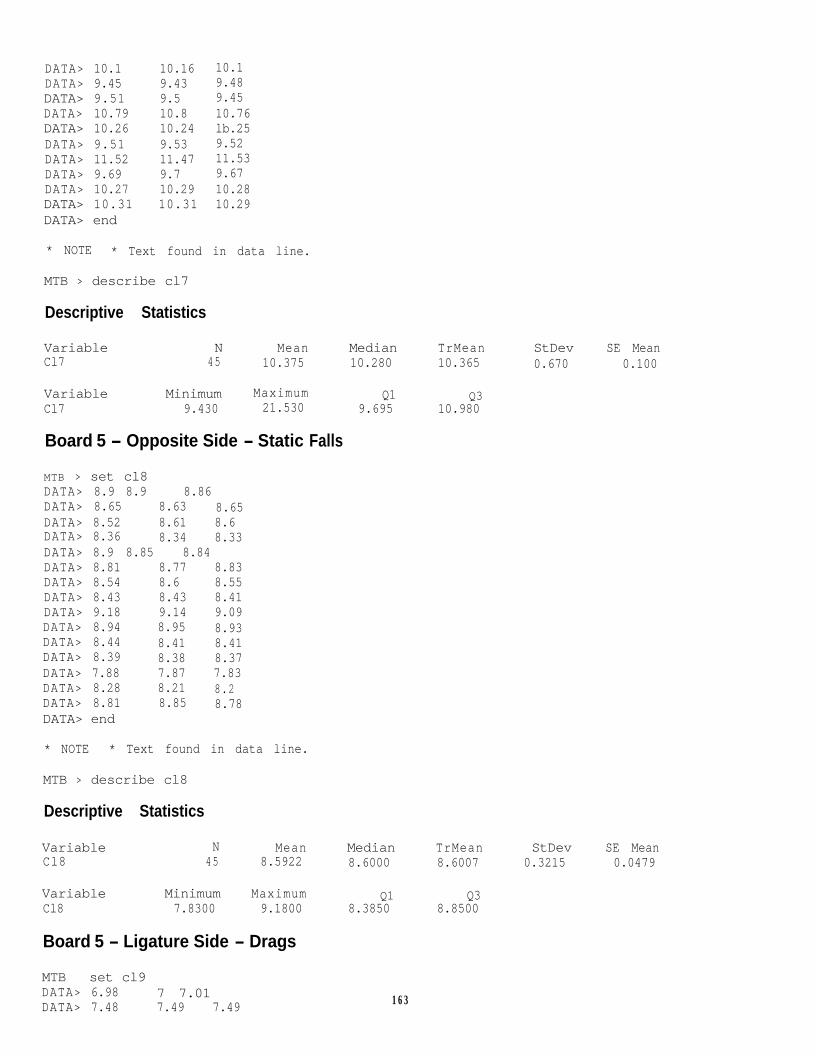
DATA> 10.1DATA> 9.45DATA> 9.51DATA> 10.79DATA> 10.26DATA> 9.51DATA> 11.52DATA> 9.69DATA> 10.27DATA> 10.31DATA> end
10.16 10.19.43 9.489.5 9.4510.8 10.7610.24 lb.259.53 9.5211.47 11.539.7 9.6710.29 10.2810.31 10.29
* NOTE * Text found in data line.
MTB > describe cl7
Descriptive Statistics
Variable N Mean Median TrMean StDev SE MeanCl7 45 10.375 10.280 10.365 0.670 0.100
VariableCl7
Minimum Maximum Q1 Q39.430 21.530 9.695 10.980
Board 5 - Opposite Side - Static Falls
MTB > set cl8DATA> 8.9 8.9 8.86DATA> 8.65 8.63 8.65DATA> 8.52 8.61 8.6DATA> 8.36 8.34 8.33DATA> 8.9 8.85 8.84DATA> 8.81 8.77 8.83DATA> 8.54 8.6 8.55DATA> 8.43 8.43 8.41DATA> 9.18 9.14 9.09DATA> 8.94 8.95 8.93DATA> 8.44 8.41 8.41DATA> 8.39 8.38 8.37DATA> 7.88 7.87 7.83DATA> 8.28 8.21 8.2DATA> 8.81 8.85 8.78DATA> end
* NOTE * Text found in data line.
MTB > describe cl8
Descriptive Statistics
VariableCl8
N Mean Median TrMean StDev SE Mean45 8.5922 8.6000 8.6007 0.3215 0.0479
VariableCl8
Minimum Maximum Q1 Q37.8300 9.1800 8.3850 8.8500
Board 5 - Ligature Side - Drags
MTB > set cl9DATA> 6.98 7 7.01DATA> 7.48 7.49 7.49 163
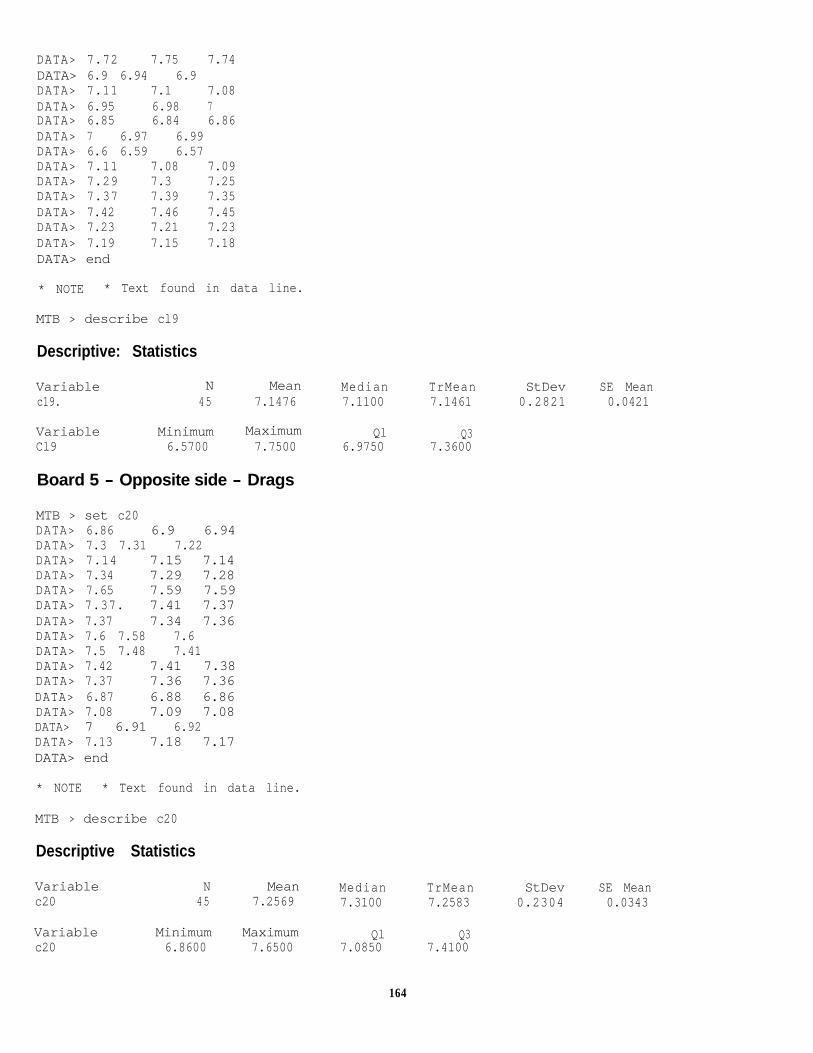
DATA> 7.72 7.75 7.74DATA> 6.9 6.94 6.9DATA> 7.11 7.1 7.08DATA> 6.95 6.98 7DATA> 6.85 6.84 6.86DATA> 7 6.97 6.99DATA> 6.6 6.59 6.57DATA> 7.11 7.08 7.09DATA> 7.29 7.3 7.25DATA> 7.37 7.39 7.35DATA> 7.42 7.46 7.45DATA> 7.23 7.21 7.23DATA> 7.19 7.15 7.18DATA> end
* NOTE * Text found in data line.
MTB > describe cl9
Descriptive: Statistics
Variable N Mean Median TrMeanc19. 45 7.1476 7.1100 7.1461
Variable Minimum Maximum Ql Q3Cl9 6.5700 7.7500 6.9750 7.3600
Board 5 - Opposite side - Drags
MTB > set c20DATA> 6.86 6.9 6.94DATA> 7.3 7.31 7.22DATA> 7.14 7.15 7.14DATA> 7.34 7.29 7.28DATA> 7.65 7.59 7.59DATA> 7.37. 7.41 7.37DATA> 7.37 7.34 7.36DATA> 7.6 7.58 7.6DATA> 7.5 7.48 7.41DATA> 7.42 7.41 7.38DATA> 7.37 7.36 7.36DATA> 6.87 6.88 6.86DATA> 7.08 7.09 7.08DATA> 7 6.91 6.92DATA> 7.13 7.18 7.17DATA> end
* NOTE * Text found in data line.
MTB > describe c20
Descriptive Statistics
Variablec20
N Mean Median TrMean45 7.2569 7.3100 7.2583
StDev SE Mean0.2821 0.0421
StDev SE Mean0.2304 0.0343
Variablec20
Minimum Maximum Ql Q36.8600 7.6500 7.0850 7.4100
164
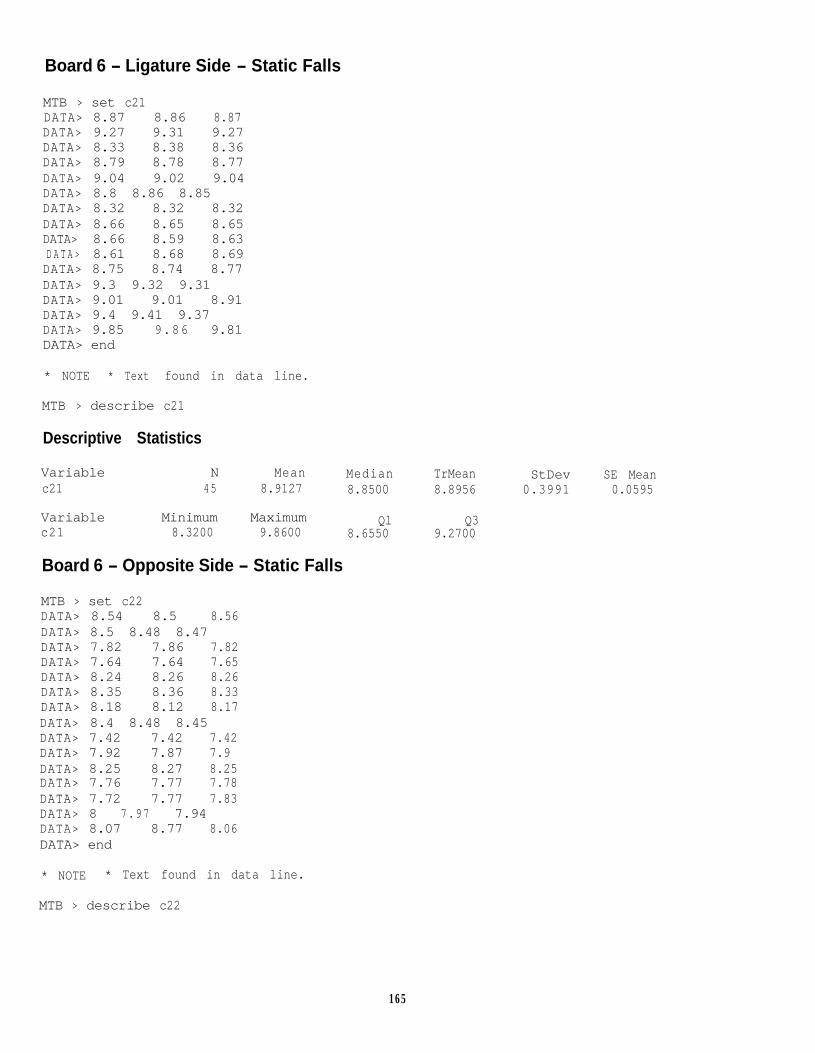
Board 6 - Ligature Side - Static Falls
MTB > set c21DATA> 8.87 8.86 8.87DATA> 9.27 9.31 9.27DATA> 8.33 8.38 8.36DATA> 8.79 8.78 8.77DATA> 9.04 9.02 9.04DATA> 8.8 8.86 8.85DATA> 8.32 8.32 8.32DATA> 8.66 8.65 8.65DATA> 8.66 8.59 8.63D A T A > 8.61 8.68 8.69DATA> 8.75 8.74 8.77DATA> 9.3 9.32 9.31DATA> 9.01 9.01 8.91DATA> 9.4 9.41 9.37DATA> 9.85 9.86 9.81DATA> end
* NOTE * Text found in data line.
MTB > describe c21
Descriptive Statistics
Variable N Mean Median TrMean StDev SE Meanc21 45 8.9127 8.8500 8.8956 0.3991 0.0595
Variablec21
Minimum Maximum Ql Q38.3200 9.8600 8.6550 9.2700
Board 6 - Opposite Side - Static Falls
MTB > set c22DATA> 8.54 8.5 8.56DATA> 8.5 8.48 8.47DATA> 7.82 7.86 7.82DATA> 7.64 7.64 7.65DATA> 8.24 8.26 8.26DATA> 8.35 8.36 8.33DATA> 8.18 8.12 8.17DATA> 8.4 8.48 8.45DATA> 7.42 7.42 7.42DATA> 7.92 7.87 7.9DATA> 8.25 8.27 8.25DATA> 7.76 7.77 7.78DATA> 7.72 7.77 7.83DATA> 8 7.97 7.94DATA> 8.07 8.77 8.06DATA> end
* NOTE * Text found in data line.
MTB > describe c22
1 6 5
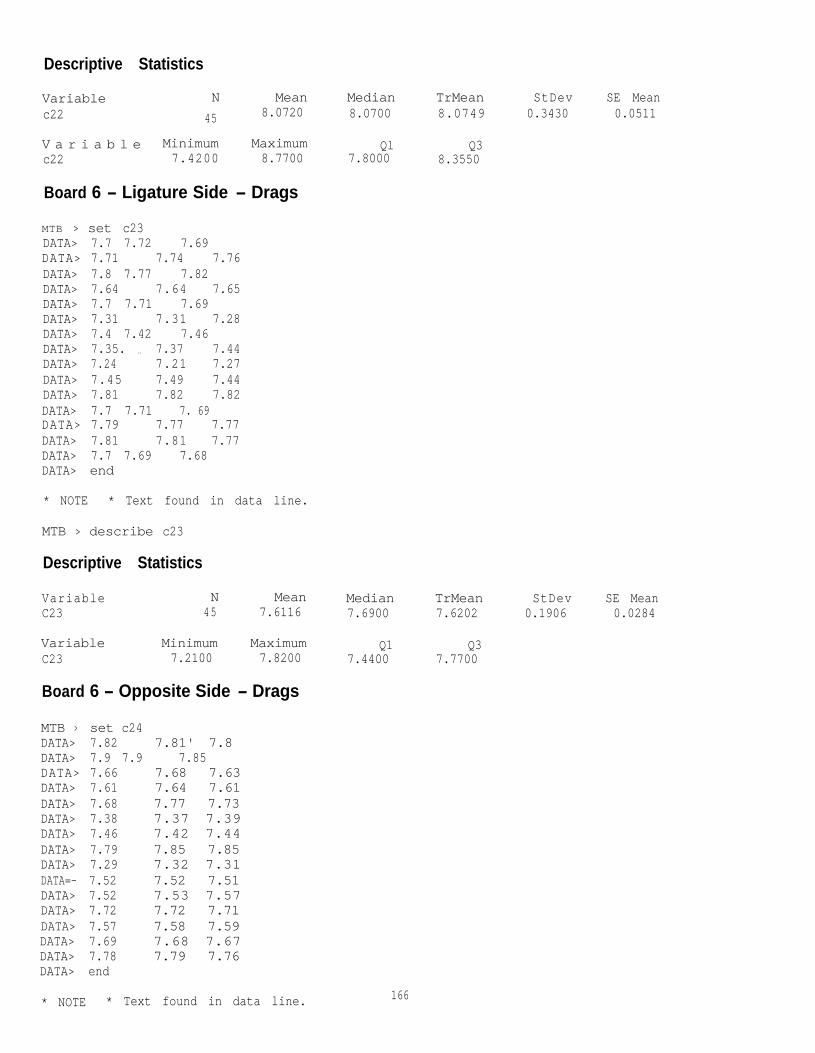
Descriptive Statistics
Variable N Meanc22 45 8.0720
V a r i a b l e Minimum Maximumc22 7.4200 8.7700
Board 6 - Ligature Side - Drags
MTB > set c23DATA> 7.7 7.72 7.69DATA> 7.71 7.74 7.76DATA> 7.8 7.77 7.82DATA> 7.64 7.64 7.65DATA> 7.7 7.71 7.69DATA> 7.31 7.31 7.28DATA> 7.4 7.42 7.46DATA> 7.35. . . 7.37 7.44DATA> 7.24 7.21 7.27DATA> 7.45 7.49 7.44DATA> 7.81 7.82 7.82DATA> 7.7 7.71 7. 69 DATA> 7.79 7.77 7.77DATA> 7.81 7.81 7.77DATA> 7.7 7.69 7.68DATA> end
* NOTE * Text found in data line.
MTB > describe c23
Descriptive Statistics
VariableC23
N Mean45 7.6116
VariableC23
Minimum Maximum7.2100 7.8200
Board 6 - Opposite Side - Drags
MTB > set c24DATA> 7.82 7.81' 7.8DATA> 7.9 7.9 7.85DATA> 7.66 7.68 7.63DATA> 7.61 7.64 7.61DATA> 7.68 7.77 7.73DATA> 7.38 7.37 7.39DATA> 7.46 7.42 7.44DATA> 7.79 7.85 7.85DATA> 7.29 7.32 7.31DATA=- 7.52 7.52 7.51DATA> 7.52 7.53 7.57DATA> 7.72 7.72 7.71DATA> 7.57 7.58 7.59DATA> 7.69 7.68 7.67DATA> 7.78 7.79 7.76DATA> end
* NOTE * Text found in data line.
Median8.0700
TrMean StDev SE Mean8.0749 0.3430 0.0511
Ql Q37.8000 8.3550
Median7.6900
TrMean StDev SE Mean7.6202 0.1906 0.0284
Q1 Q37.4400 7.7700
166
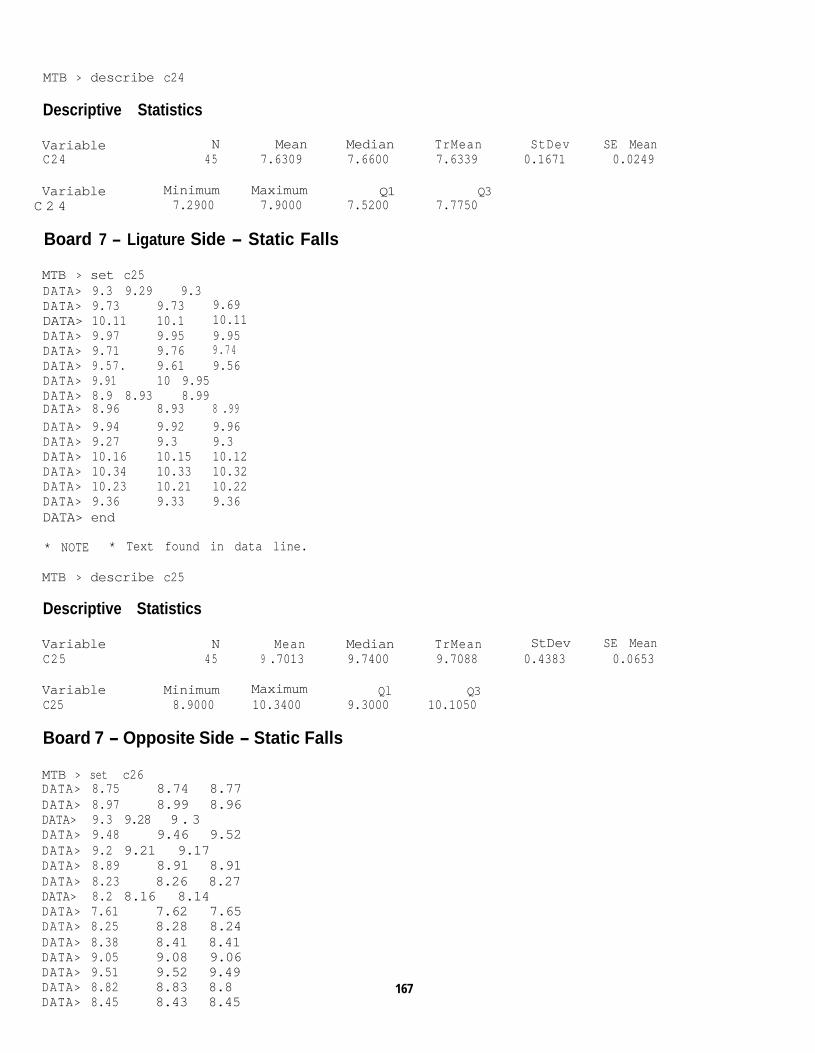
MTB > describe c24
Descriptive Statistics
Variable N Mean Median TrMean StDev SE MeanC24 45 7.6309 7.6600 7.6339 0.1671 0.0249
VariableC 2 4
Minimum Maximum Q1 Q37.2900 7.9000 7.5200 7.7750
Board 7 - Ligature Side - Static Falls
MTB > set c25DATA> 9.3 9.29 9.3DATA> 9.73 9.73 9.69DATA> 10.11 10.1 10.11DATA> 9.97 9.95 9.95DATA> 9.71 9.76 9.74DATA> 9.57. 9.61 9.56DATA> 9.91 10 9.95DATA> 8.9 8.93 8.99DATA> 8.96 8.93 8 . 99 DATA> 9.94 9.92 9.96DATA> 9.27 9.3 9.3DATA> 10.16 10.15 10.12DATA> 10.34 10.33 10.32DATA> 10.23 10.21 10.22DATA> 9.36 9.33 9.36DATA> end
* NOTE * Text found in data line.
MTB > describe c25
Descriptive Statistics
VariableC25
N Mean Median TrMean StDev SE Mean45 9 .7013 9.7400 9.7088 0.4383 0.0653
VariableC25
Minimum Maximum Ql Q38.9000 10.3400 9.3000 10.1050
Board 7 - Opposite Side - Static Falls
MTB > set c26DATA> 8.75 8.74 8.77DATA> 8.97 8.99 8.96DATA> 9.3 9.28 9 . 3DATA> 9.48 9.46 9.52DATA> 9.2 9.21 9.17DATA> 8.89 8.91 8.91DATA> 8.23 8.26 8.27DATA> 8.2 8.16 8.14DATA> 7.61 7.62 7.65DATA> 8.25 8.28 8.24DATA> 8.38 8.41 8.41DATA> 9.05 9.08 9.06DATA> 9.51 9.52 9.49DATA> 8.82 8.83 8.8DATA> 8.45 8.43 8.45
167
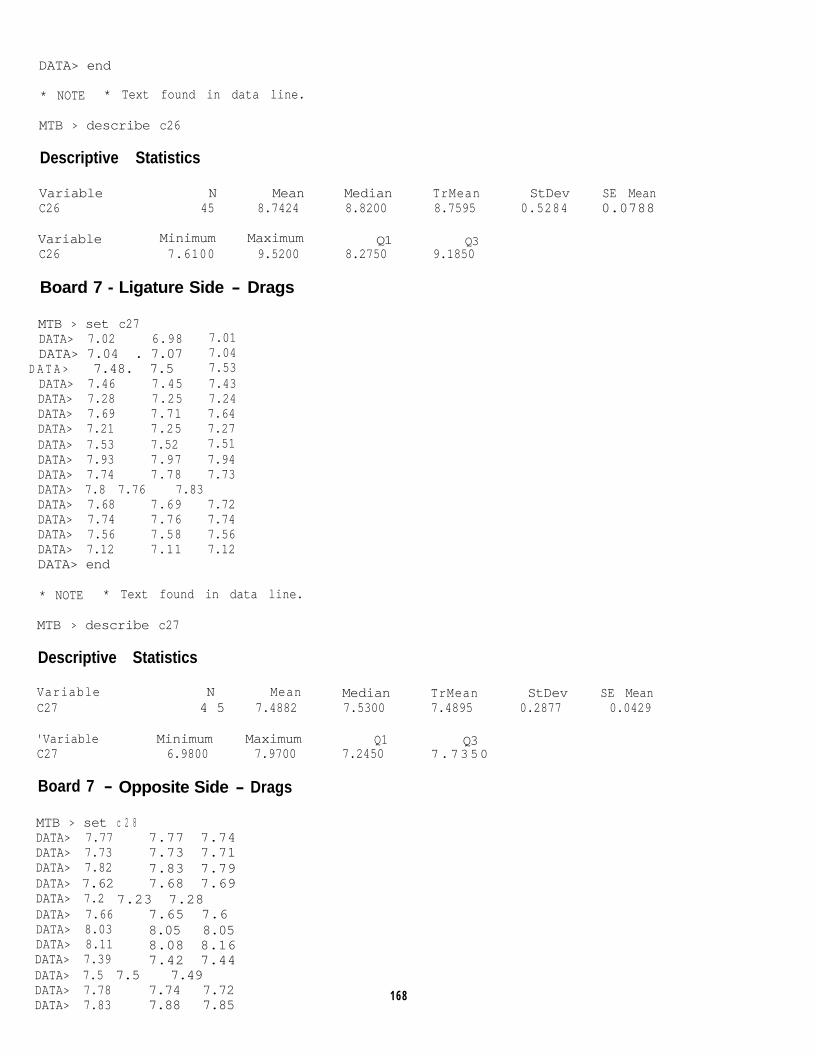
DATA> end
* NOTE * Text found in data line.
MTB > describe c26
Descriptive Statistics
VariableC26
N Mean Median45 8.7424 8.8200
VariableC26
Minimum Maximum7.6100 9.5200
Board 7 - Ligature Side - Drags
MTB > set c27DATA> 7.02 6.98 7.01DATA> 7.04 . 7.07 7.04
D A T A > 7.48. 7.5 7.53DATA> 7.46 7.45 7.43DATA> 7.28 7.25 7.24DATA> 7.69 7.71 7.64DATA> 7.21 7.25 7.27DATA> 7.53 7.52 7.51DATA> 7.93 7.97 7.94DATA> 7.74 7.78 7.73DATA> 7.8 7.76 7.83DATA> 7.68 7.69 7.72DATA> 7.74 7.76 7.74DATA> 7.56 7.58 7.56DATA> 7.12 7.11 7.12DATA> end
* NOTE * Text found in data line.
MTB > describe c27
Descriptive Statistics
VariableC27
N Mean4 5 7.4882
'VariableC27
Minimum Maximum6.9800 7.9700
Board 7 - Opposite Side - Drags
MTB > set c 2 8DATA> 7.77 7.77 7.74DATA> 7.73 7.73 7.71DATA> 7.82 7.83 7.79DATA> 7.62 7.68 7.69DATA> 7.2 7.23 7.28DATA> 7.66 7.65 7.6DATA> 8.03 8.05 8.05DATA> 8.11 8.08 8.16DATA> 7.39 7.42 7.44DATA> 7.5 7.5 7.49DATA> 7.78 7.74 7.72DATA> 7.83 7.88 7.85
Q18.2750
Median7.5300
Q17.2450
1 6 8
TrMean StDev SE Mean8.7595 0.5284 0.0788
Q39.1850
TrMean StDev SE Mean7.4895 0.2877 0.0429
Q37.7350

DATA> 7.81 7.8 7.78DATA> 7.92 7.95 7.94DATA> 7.76 7.73 7.81DATA> end
* NOTE * Text found in data line.
MTB > describe c28
Descriptive Statistics
Variable N Mean MedianC28 45 7.7338 7.7600
VariableC28
Minimum Maximum Q17.2000 8.1600 7.6350
Board 8 - Ligature Side - Static Falls
MTB > set c29DATA> 9.54' 9.57 9.58DATA> 8.81 8.8 8.83DATA> 10.3 10.33 10.34 DATA> 9.61 9.68 9.67DATA> 10.22 10.21 10.23DATA> 9.41 9.44 9.42DATA> 10.11 10.1 10.17DATA> 8.91 8.9 8.91DATA> end
* NOTE * Text found in data line.
MTB > describe c29
Descriptive Statistics
Variablec29
N24
Mean9.629
Median9.595
Variablec29
Minimum Maximum Q18.800 10.340 9.035
Board 8 - Opposite Side - Static Falls
MTB > set c30DATA> 9.3 9.32 9.27DATA> 8.56 8.57 8.57DATA> 8.17 8.16 8.11DATA> 9.31 9.32 9.36DATA> 9.77 9.72 9.73DATA> 8.96 9.02 8.97DATA> 10.02 10.06 10DATA> 8.9 8.93 8.91DATA> end
TrMean StDev SE Mean7.7395 0.2240 0.0334
Q37.8400
TrMean9.634
Q310.200
StDev SE Mean0.550 0.112
* NOTE * Text found in data line.
MTB > describe c30
169
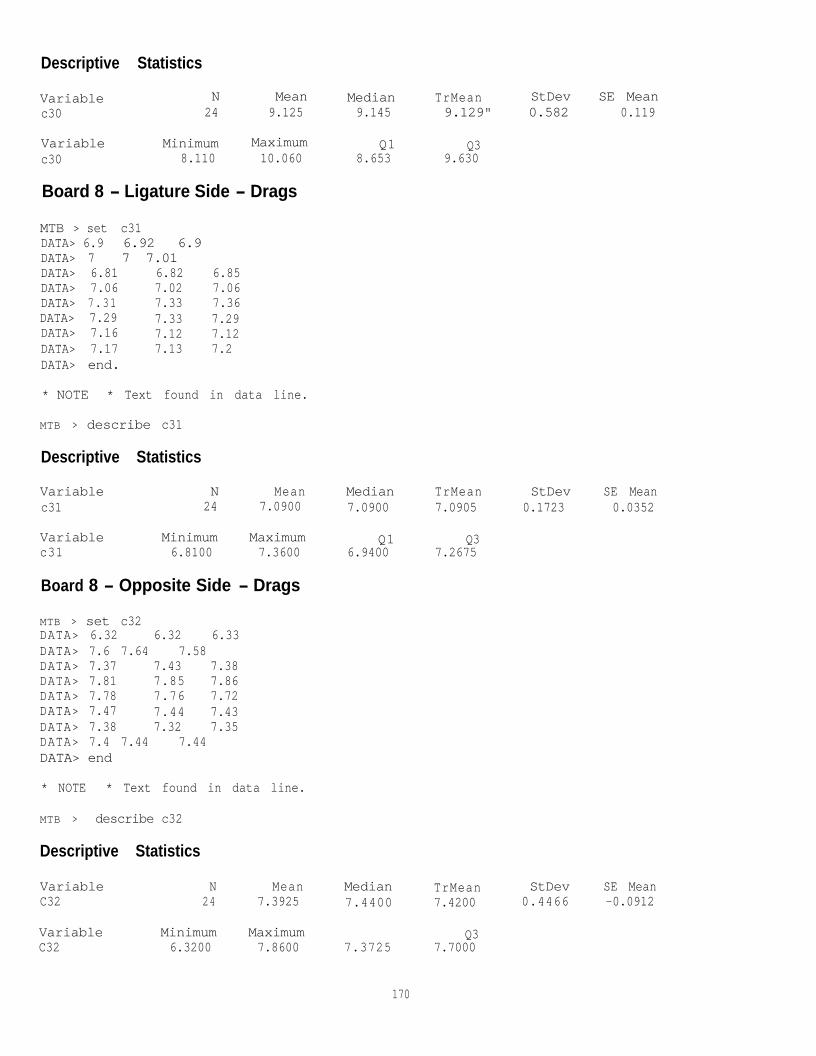
Descriptive Statistics
Variablec30
N Mean24 9.125
Variablec30
Minimum Maximum8.110 10.060
Board 8 - Ligature Side - Drags
MTB > set c31DATA> 6.9 6.92 6.9DATA> 7 7 7.01DATA> 6.81 6.82 6.85DATA> 7.06 7.02 7.06DATA> 7.31 7.33 7.36DATA> 7.29 7.33 7.29DATA> 7.16 7.12 7.12DATA> 7.17 7.13 7.2DATA> end.
* NOTE * Text found in data line.
MTB > describe c31
Descriptive Statistics
Variable N Meanc31 24 7.0900
Variablec31
Minimum Maximum6.8100 7.3600
Board 8 - Opposite Side - Drags
MTB > set c32DATA> 6.32 6.32 6.33DATA> 7.6 7.64 7.58DATA> 7.37 7.43 7.38DATA> 7.81 7.85 7.86DATA> 7.78 7.76 7.72DATA> 7.47 7.44 7.43DATA> 7.38 7.32 7.35DATA> 7.4 7.44 7.44DATA> end
* NOTE * Text found in data line.
MTB > describe c32
Descriptive Statistics
VariableC32
N Mean24 7.3925
VariableC32
Minimum Maximum6.3200 7.8600
Median TrMean StDev SE Mean9.145 9.129" 0.582 0.119
Q1 Q38.653 9.630
Median TrMean StDev SE Mean7.0900 7.0905 0.1723 0.0352
Q1 Q36.9400 7.2675
Median TrMean StDev SE Mean7.4400 7.4200 0.4466 -0.0912
Ql Q37.3725 7.7000
170

APPENDIX H - REFERENCES CITED
171

REFERENCES CITED
Boltz, W. (1956) Mord durch Erhängen oder fahrlässige Tötung? Archiv Für Kriminologie.Vol 117: 133-139.
Budworth, G. (1985) Knots and Crime. Police Review Publishing Company: London.
Cooke, Clive T., Cadden, Gerard A, and Hilton, John M.N. (1988) Unusual HangingDeaths. The American Journal of Forensic Medicine and Pathology. 9(4): 277-282.
Davison, A., and Marshall, T. K. (1986) Hanging in Northern Ireland - A Survey.Medicine, Science, and the Law. 26 ( 1): 23-28.
Fisher, B. A. J. (1993) Techniques of Crime Scene Investigation. Fifth edition. CRCPress Inc: Florida.
Goddefroy, E. V. (1923) Selbstmord durch Erhängen oder Mord mit nachfolgender Aufhängungder Leiche, urn Selbstmord vorzutäuschen? Archiv Für Kriminologie. Vo175: 226-227.
Health Canada (1994) Suicide in Canada: Update of the Report of the Task Force onSuicide in Canada. Sponsored by the Mental Health Division. Health ServicesDirectorate. Health Programs and Services Branch, Health Canada.http://www.hc-sc.gc.ca/hppb/mentalhealth/pdfs/suicide.pdf
Hucker, S. J., and R. Blanchard. (1992) Death Scene Characteristics in 118 Fatal CasesOf Autoerotic Asphyxia compared with Suicidal Asphyxia. Behavioural Sciencesand the Law. Vol 10: 509-523.
Jaffe, F. A. (1999) A Guide to Pathological Evidence: For Lawvers and Police Officers.Fourth Edition. Thomson Canada Limited. Ontario, Canada.
Kipper, F. (1926) Mord durch Erhängen. Archiv Fiir Kriminologie. Vo178: 213-228.
Klauer, H. (1933) Untersuchung von Strangwerkzeug und Aufhängeort beim fraglichenErhängungstod. Dtsch. Z Gerichtl. Med. Vol 20: 375-385.
Leth, P., and A. Vesterby. (1997) Homicidal hanging masquerading as suicide. ForensicScience International. 85: 65-71.
Lew, E.O. (1988) Homicidal Hanging in a Dyadic Death. The American Journal ofForensic Medicine and Pathology. 9(4): 283-286.
Mueller, B. (1932) Ein Beitrag zur kriminalistischen Bedeutung der Berufsknoten. Archiv FürKriminologie. Vol 9 1: 175- 18 1.
Nicholls, T. (2000) Hangings - A Practical Study of Ligatures and Suspension PointMorphology. (B.Sc. thesis, unpublished), University of Toronto at Mississauga.
172

Popp, G. (193 1) Mord oder Selbstmord bei aufgehängten Leichen. Archiv Für Kriminologie.Vo188: 78-81.
Ptischel, K., Holtz., W., Hildebrande, E., Naeves, W., and Brinkmann B. (1984)Hanging: Suicide or Criminal Offence? Criminology Archives. 174(6): 141-153.
Radian I. And Radovici, L. (1957) Sur un cas d’homicide par pendaison. Annales de MédicineLégale et de Criminologie. Seance du 8 Juillet 1957, p. 232-236.
Rooks, G. (1935) Selbstmord durch Erhängen oder mord mit darauffolgendem Aufhängen derleiche? Archiv Für Kriminologie Vo197: 104-l 10.
Shearer, Don (2000) Personal communication regarding coroner’s inquest into asuspicious hanging death
Simon, R. (1998) Murder Masquerading as Suicide: Postmortem Assessment of Suicide RiskFactors at the Time of Death. Journal of Forensic Sciences. 43(6): 1119-l 123.
Spitz, W. U., and Fisher, R. S. (1980) Medicolegal Investigation of Death: Guidelinesfor the Application of Patholoav to Crime Investigation. Second Edition. Charles C.Thomas: Illinois.
Vieira, D.M., Pinto, A.E., and Oliveira Sá, F. (1988) Homicidal Hanging. The AmericanJournal of Forensic Medicine and Pathology. 9(4): 287-289.
Webster, P. (2001) Unpublished B.Sc. Thesis, Forensic Science Mentorship, Hanging Study.University of Toronto at Mississauga.
Weimann, W. (1929) Mord an der Ehefrau und Vortäuschung eines Selbstmordes durchnachträgliches Erhängen. Archiv Fiir Kriminologie. Vo184: 135-144.
173