Embed Size (px)
Citation preview
1
HARVEST MANAGEMENT OF TIFTON 85 BERMUDAGRASS
By
JOSE ALEJANDRO CLAVIJO MICHELANGELI
A THESIS PRESENTED TO THE GRADUATE SCHOOL OF THE UNIVERSITY OF FLORIDA IN PARTIAL FULFILLMENT
OF THE REQUIREMENTS FOR THE DEGREE OF MASTER OF SCIENCE
UNIVERSITY OF FLORIDA
2009
2
© 2009 José Alejandro Clavijo Michelangeli

3
To Claret, Pepe Padre, Tati (my role model) and JP
4
ACKNOWLEDGMENTS
First of all, I would like to thank my parents, sister, godmother and brother in-law
for their endless love, encouragement, and constant support. They are my motivation
and source of strength and joy.
I want to thank Dr. Yoana Newman, my committee chair, for her confidence in my
possibilities as a graduate student and for making me a part of the Gator Nation. I also
want to thank Dr. Leonardo Ortega for his insight, assistance, and especially for putting
in his free time and weekends guiding my work. I also would like to acknowledge Drs.
Sollenberger and Staples for their positive criticism, support and patience throughout
my program, and for giving me the flexibility to pursue my interests at UF.
Big thanks go out to the extended Agronomy Department family: Paula, Theresa,
Cynthia, Katie, Christina, Kim, Dr. Rose Koenig, Dr. Ken Buhr, Judy, and Micah. They
made my time at Newell Hall and Building 737 fun and very memorable. Thanks also go
out to Richard Fethiere for his assistance in processing samples and for sharing his
knowledge about history, sports, and forage chemical analysis. I would like to
acknowledge Drs. Jason Ferrell and Greg McDonald for their help in weed control and
identification.
This study was supported by a grant from the Florida Milk Check-off. Special
thanks go to Mr. Don Bennick, from North Florida Holsteins, and to Mr. Don Quincey,
from Quincey Cattle Co., and their respective crews for facilitating the study sites. Their
support, assistance, and knowledge of the land and farming showed me how
progressive farmers bring meat and milk to Floridian’s tables.
I would also like to thank the good friends that made my time at UF an incredible
experience. I am very thankful to Dr. Peter Hildebrand for his mentorship, inspiration,

5
and help developing the linear program model, but most importantly, for his friendship,
guidance, and knowledge that have led me to view agronomy from a different angle and
to think about the broader implications of the work we do. Our many early morning
meetings over coffee will stay with me the rest of my life. Drs. Scott Robinson and Dave
Steadman from the Florida Museum of Natural History gave me a second home on
campus, treated me as one of their own, and allowed me to keep my passion for birds
alive and well. I would also like to thank Dr. Howard Frank for his friendship and support
in getting me to UF and throughout my program. Finally, big thanks go to Johnny, Nick,
Martijn, Walid, Linda, and Marlene for enriching my academic experience, and for being
with me in the good and bad.
6
TABLE OF CONTENTS page
ACKNOWLEDGMENTS .................................................................................................. 4
LIST OF TABLES ............................................................................................................ 8
ABSTRACT ................................................................................................................... 12
CHAPTER
1 INTRODUCTION .................................................................................................... 14
2 LITERATURE REVIEW .......................................................................................... 17
‘Tifton 85’ Bermudagrass ........................................................................................ 17Forage Responses to Defoliation ............................................................................ 19
Effects on dry matter yields .............................................................................. 19Effects on nutritive value .................................................................................. 21
Tifton 85 Bermudagrass Use as Harvested Forage ................................................ 24Removal of Nutrients .............................................................................................. 26Forage Budgets ...................................................................................................... 28Dairy Manure Costs ................................................................................................ 30Least-Cost Ration Linear Programming Models for Dairy Cattle ............................ 32
3 HARVEST MANAGEMENT EFFECTS ON FORAGE DRY MATTER PRODUCTION AND NUTRIENT REMOVAL OF TIFTON 85 BERMUDAGRASS . 34
Introduction ............................................................................................................. 34Materials and Methods ............................................................................................ 36
Study site description ....................................................................................... 36Harvest management and sampling ................................................................. 37Experimental design ......................................................................................... 38Data analysis .................................................................................................... 40
Results and Discussion ........................................................................................... 40Weather conditions ........................................................................................... 40Total DM yields ................................................................................................. 42Seasonal (by harvest) DM yields ...................................................................... 44Tifton 85 bermudagrass nutrient removal ......................................................... 48Weed assessment ............................................................................................ 51
Summary and Conclusions ..................................................................................... 51
4 HARVEST MANAGEMENT EFFECTS OF TIFTON 85 BERMUDAGRASS ON HERBAGE NUTRITIVE VALUE .............................................................................. 54
Introduction ............................................................................................................. 54Materials and Methods ............................................................................................ 55
7
Study site description ....................................................................................... 55Treatments ....................................................................................................... 55Herbage sampling and processing ................................................................... 56Laboratory analysis .......................................................................................... 56Statistical analysis ............................................................................................ 56
Results and Discussion ........................................................................................... 57Crude protein .................................................................................................... 57Phosphorus ...................................................................................................... 59In vitro digestible organic matter ....................................................................... 63Neutral detergent fiber ...................................................................................... 67
Summary and Conclusions ..................................................................................... 67
5 ECONOMIC ANALYSIS OF TIFTON 85 GREENCHOP INCORPORATION INTO DAIRY RATIONS .......................................................................................... 70
Introduction ............................................................................................................. 70Materials and Methods ............................................................................................ 71
Tifton 85 bermudagrass greenchop production cost ........................................ 71Determination of machinery costs .................................................................... 73Developing budgets based on results from agronomic trials ............................ 74Calculation of manure and irrigation cost for forage production budget ........... 74Least-cost ration linear program model ............................................................ 75
Results and Discussion ........................................................................................... 80Tifton 85 bermudagrass establishment budget ................................................. 80Tifton 85 bermudagrass greenchop production budgets .................................. 81Least-cost linear program model results ........................................................... 83
Conclusions and Recommendations ...................................................................... 96
6 SUMMARY AND CONCLUSIONS .......................................................................... 99
APPENDIX: RESULTS OF LEAST-COST RATIONS FORMULATED WITH TIFTON 85 BERMUDAGRASS GREENCHOP HARVESTED AT DIFFERENT HARVEST INTERVALS ........................................................................................ 104
LIST OF REFERENCES ............................................................................................. 114
BIOGRAPHICAL SKETCH .......................................................................................... 125
8
LIST OF TABLES
Table
page
3-1 Current interpretation for Mehlich-1 soil test results for agronomic and vegetable crops. ................................................................................................. 37
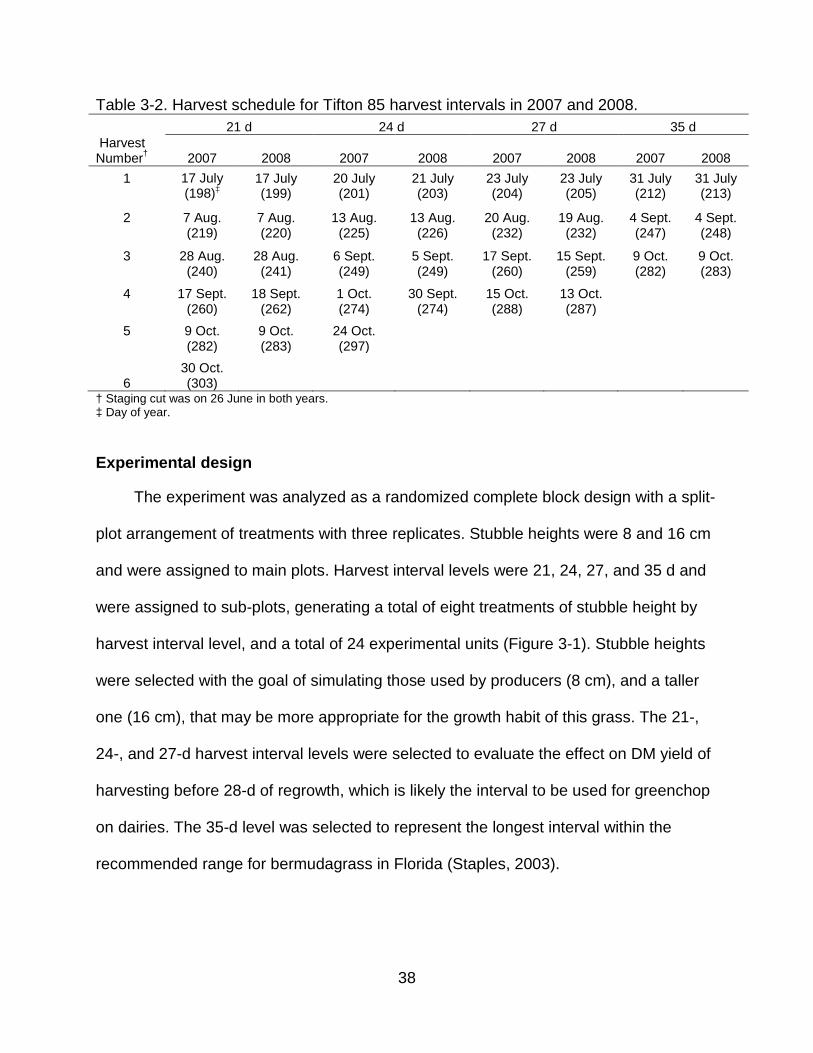
3-2 Harvest schedule for Tifton 85 harvest intervals in 2007 and 2008. ................... 38
3-3 Observed significance level (P value) from mixed models for the effects of harvest interval (HARVEST), stubble height (STUBBLE) and year on total DM yields (Mg DM ha-1 ). ..................................................................................... 42
3-4 Comparison of DM yield means as affected by harvest interval (HARVEST) and stubble height (STUBBLE) in 2007 and 2008. ............................................. 43
3-5 Observed significance level (P value) from mixed models of the effects of stubble height (STUBBLE) and harvest event (HE) on total DM yield analyzed by harvest interval (HARVEST) in 2007 and 2008. ............................. 44
3-6 Stubble height (STUBBLE) × harvest event effects on DM yield analyzed by harvest interval (HARVEST) in 2007. ................................................................. 47
3-7 Stubble height (STUBBLE) × harvest event effects on DM yield, analyzed by harvest interval (HARVEST) in 2008. ................................................................. 47
3-8 Observed significance level (P value) from mixed models of the effects of harvest interval (HARVEST) and stubble height (STUBBLE) on total N and P removal, analyzed by year. ................................................................................. 49
3-9 Yield, nutrient concentration, and nutrient removal of Tifton 85 bermudagrass in response to increasing harvest interval (HARVEST) and two stubble heights (STUBBLE) in 2007 and 2008. ............................................................... 49
4-1 Observed significance level (P value) from mixed models of the effects of stubble height (STUBBLE) and harvest interval (HARVEST) on Tifton 85 herbage CP, P, IVDOM and NDF concentrations in 2007and 2008. .................. 58
4-2 Comparison of total (year) herbage crude protein (CP) and phosphorous (P) means as affected by harvest interval (HARVEST) for 2007 and 2008. ............. 60
4-3 Comparison of total (year) in vitro digestible organic matter (IVDOM) means as affected by the stubble height × harvest interval interaction. ......................... 64
5-1 Nutritional requirements of lactating Holstein dairy cows used in linear program model ................................................................................................... 77
5-2 Selected constraint levels utilized in linear program model. ............................... 78
9
5-3 Prices of readily available feedstuffs to dairy producers in Florida ..................... 79
5-4 Establishment budget for Tifton 85 bermudagrass using vegetative tops. .......... 82
5-5 Production costs of Tifton 85 bermudagrass greenchop with 3 harvests per season (35 d interval) and dairy manure as fertilizer source during 2007. ......... 84
5-6 Cost of DM, crude protein and net energy for lactation using T85 greenchop with 3 harvests per season (35-d harvest interval) during 2007. ........................ 84
5-7 Production costs of Tifton 85 bermudagrass greenchop with 4 harvests per season (24- and 27-d interval) and dairy manure as fertilizer source during 2007. .................................................................................................................. 85
5-8 Cost of DM, crude protein and net energy for lactation using T85 greenchop with 4 harvests per season (24- and 27-d harvest interval) during 2007. ........... 85
5-9 Production costs of Tifton 85 bermudagrass greenchop with 5 harvests per season (21-d interval) and dairy manure as fertilizer source during 2007. ......... 86
5-10 Cost of DM, crude protein and net energy for lactation using T85 greenchop with 5 harvests per season (21-d harvest interval) during 2007. ........................ 86
5-11 Production budget for Tifton 85 bermudagrass greenchop with 3 harvests per season (35-d harvest interval) during 2008. ....................................................... 87
5-12 Cost of DM, crude protein and net energy for lactation using T85 greenchop with 3 harvests per season (35-d harvest interval) during 2008. ........................ 87
5-13 Production budget for Tifton 85 bermudagrass greenchop with 4 harvests per season (24- and 27-d harvest intervals) during 2008. ........................................ 88
5-14 Cost of DM, crude protein and net energy for lactation using T85 greenchop with 4 harvests per season (24- and 27-d harvest interval) during 2008. ........... 88
5-15 Production budget for Tifton 85 bermudagrass greenchop with 5 harvests (21-d interval) per season during 2008. .............................................................. 89
5-16 Cost of DM, crude protein and net energy for lactation using T85 greenchop with 5 harvests per season (21-d harvest interval) during 2008. ........................ 89
5-17 Relevant information from Tifton 85 greenchop field trials and production cost. .................................................................................................................... 90
5-18 Average cost of daily rations for lactating dairy cows grouped by production level formulated with different forages. ............................................................... 91
5-19 Average cost of forage DM, crude protein and net energy (NEL) for lactation in purchased forages and T85 greenchop treatments. ....................................... 92
10
5-20 Ration costs of least cost linear program model using Tifton 85 greenchop harvested in 2007 and 2008 growing seasons. .................................................. 94
5-21 Ration profile and costs of least-cost linear program model using Tifton 85 greenchop harvested in 2008 for selected cow profiles. ..................................... 96
A-1 Ingredients and costs of rations formulated for selected lactating dairy cows using T85 greenchop harvested at 21-d intervals (2007). ................................ 104
A-2 Ingredients and costs of rations formulated for selected lactating dairy cows using T85 greenchop harvested 24-d intervals (2007) ..................................... 105
A-3 Ingredients and costs of rations formulated for selected lactating dairy cows using T85 greenchop harvested 27-d intervals (2007) ..................................... 106
A-4 Ingredients and costs of rations formulated for selected lactating dairy cows using T85 greenchop harvested 35-d intervals (2007). .................................... 107
A-5 Ingredients and costs of rations formulated for selected lactating dairy cows using T85 greenchop harvested 21-d intervals (2008). .................................... 108
A-6 Ingredients and costs of rations formulated for selected lactating dairy cows using T85 greenchop harvested 24-d intervals (2008). .................................... 109
A-7 Ingredients and costs of rations formulated for selected lactating dairy cows using T85 greenchop harvested 27-d intervals (2008). .................................... 110
A-8 Ingredients and costs of rations formulated for selected lactating dairy cows using T85 greenchop harvested 35-d intervals (2008). .................................... 111
A-9 Ingredients and costs of rations formulated for selected lactating dairy cows using alfalfa hay. ............................................................................................... 112
A-10 Ingredients and costs of rations formulated for selected lactating dairy cows using purchased Tifton 85 hay. ......................................................................... 113
11
LIST OF FIGURES Figure
page
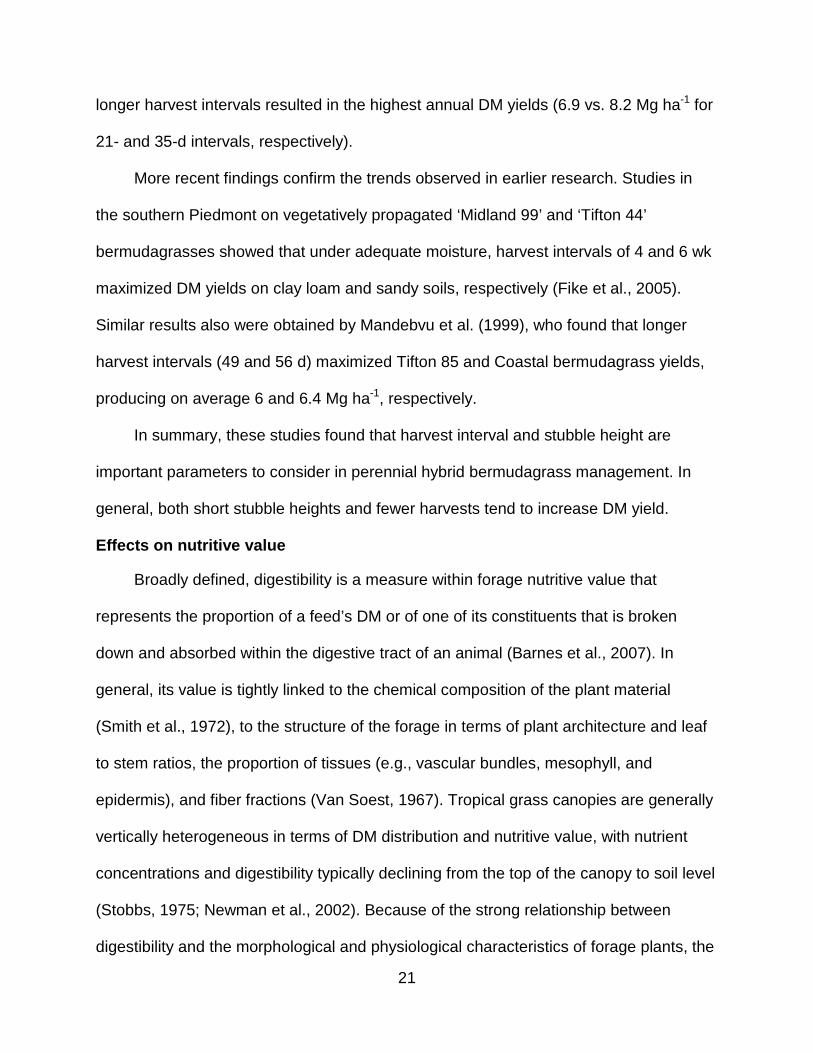
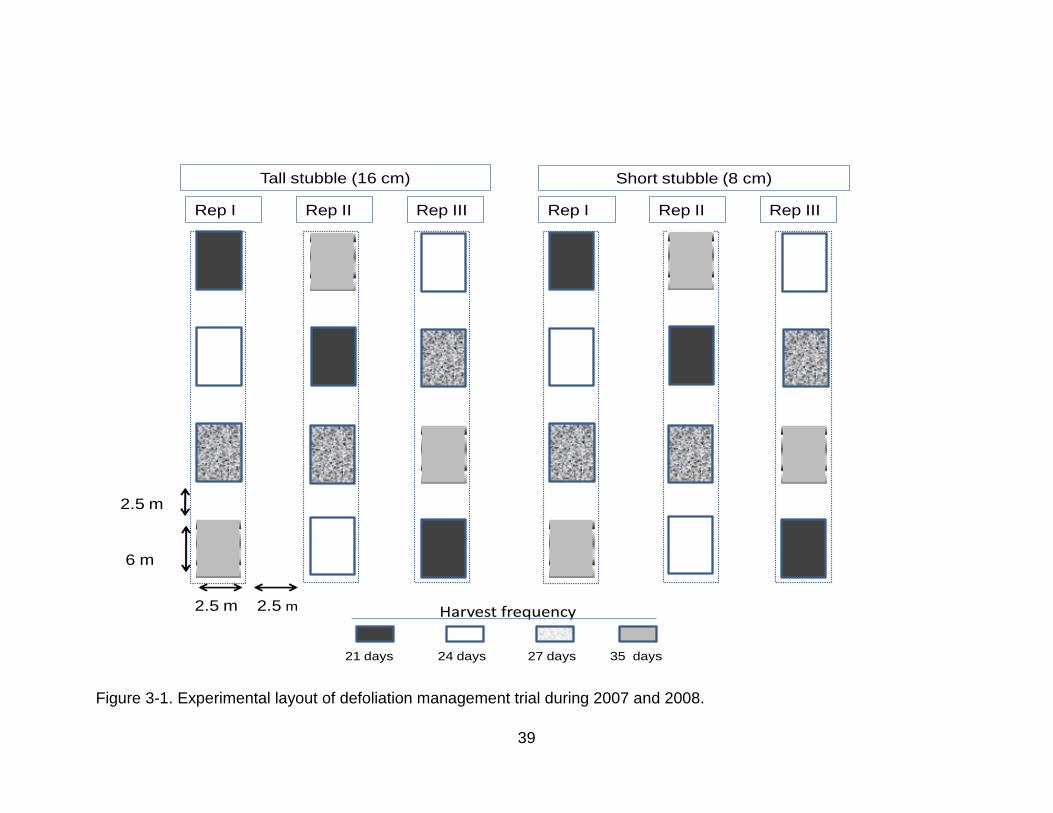
3-1 Experimental layout of defoliation management trial during 2007 and 2008. ..... 39
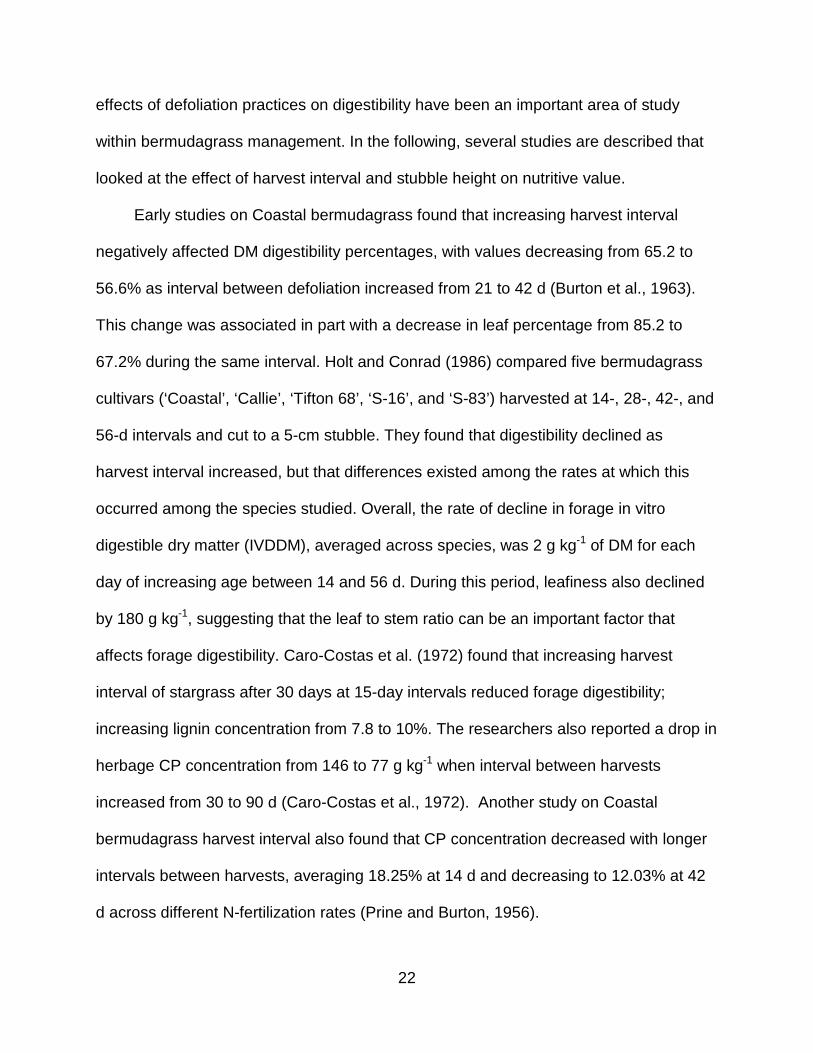
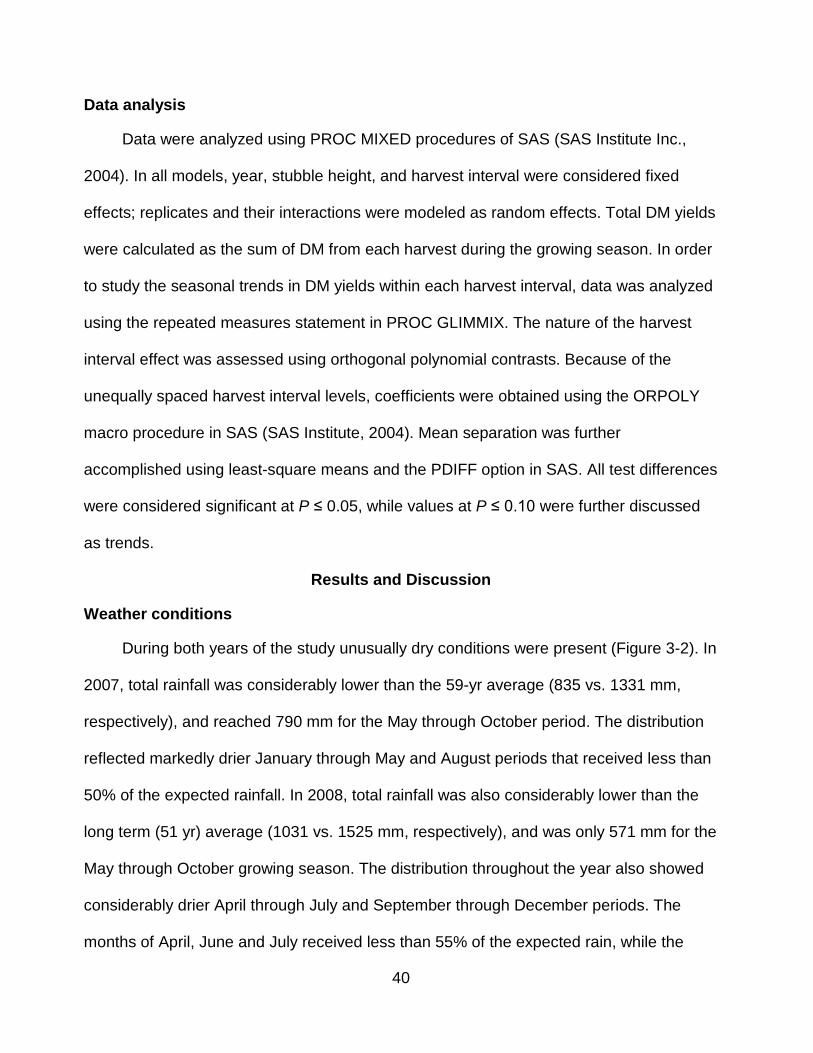
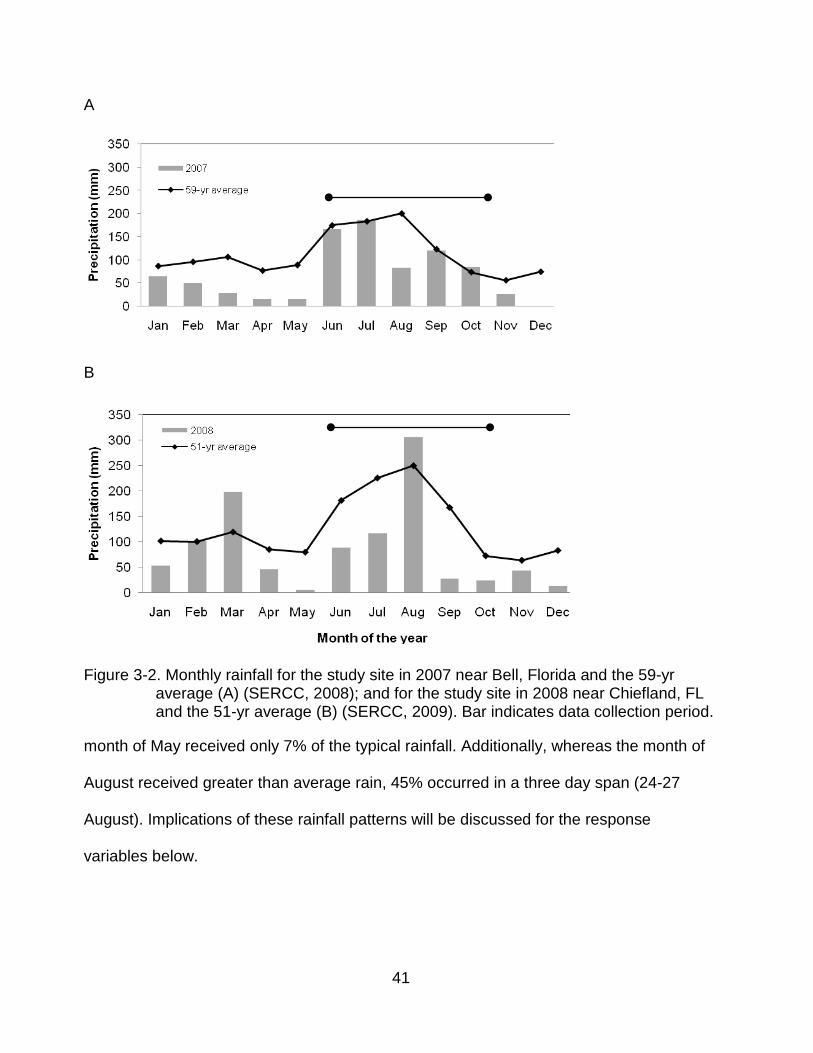
3-2 Monthly rainfall for the study site in 2007 near Bell, Florida and for the study site in 2008 near Chiefland, FL. .......................................................................... 41
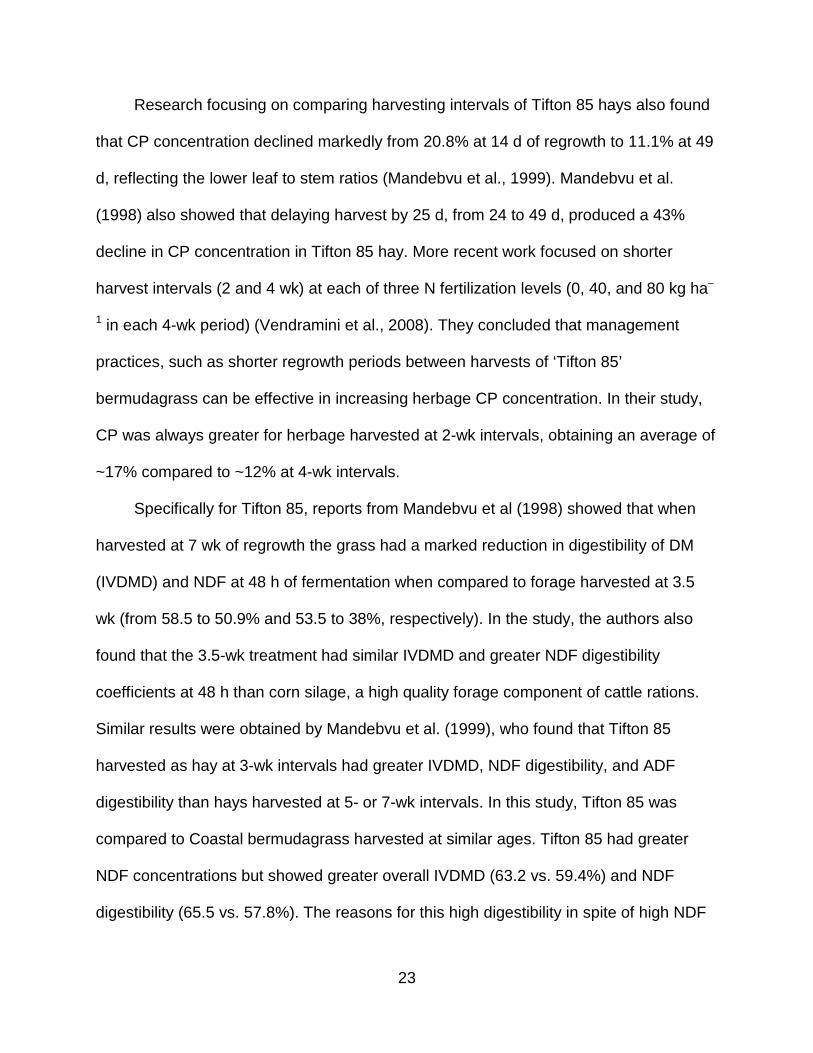
3-3 Dry matter yield response of Tifton 85 bermudagrass to harvest event by harvest interval (HARVEST) in 2007. ................................................................. 45
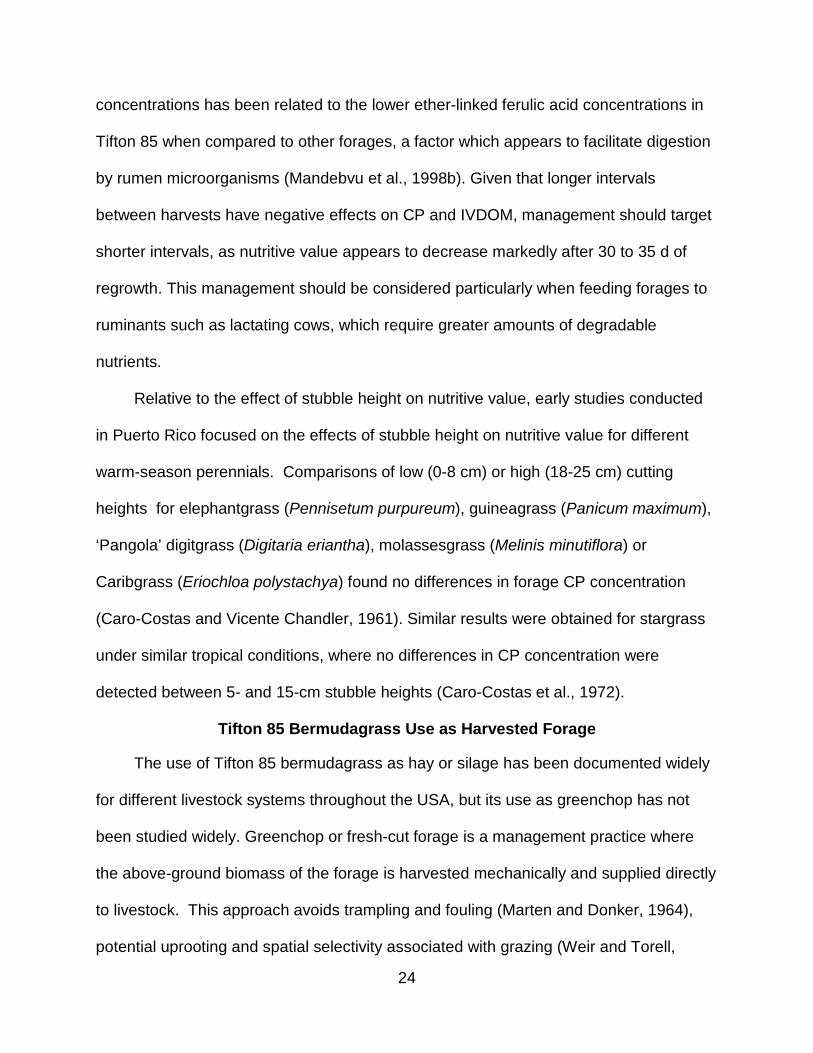
3-4 Dry matter yield response of Tifton 85 bermudagrass to harvest event by harvest interval (HARVEST) interaction in 2008. ................................................ 46
4-1 Crude protein (CP) response of Tifton 85 bermudagrass to harvest event by harvest interval levels in 2007. ........................................................................... 61
4-2 Crude protein (CP) response of Tifton 85 bermudagrass to harvest event by harvest interval levels in 2008.. .......................................................................... 62
4-3 In vitro digestible organic matter (IVDOM) response of Tifton 85 bermudagrass to harvest event by harvest interval levels in 2007. .................... 65
4-4 In vitro digestible organic matter (IVDOM) response of Tifton 85 bermudagrass to harvest event by harvest interval levels in 2008. .................... 66
12
Abstract of Thesis Presented to the Graduate School of the University of Florida in Partial Fulfillment of the Requirements for the Degree of Master of Science
HARVEST MANAGEMENT OF TIFTON 85 BERMUDAGRASS
By
José Alejandro Clavijo Michelangeli
December 2009
Chair: Yoana C. Newman Major: Agronomy
Harvest management is critical in hay or greenchop systems to sustain high yields
of superior nutritive value. Tifton 85 bermudagrass (Cynodon spp.) is a high-quality,
high-yielding warm-season perennial grass that has stimulated interest among dairy
producers for use as hay, silage, and pasture. Despite the increasing adoption of this
grass and the potential for utilization in rations of lactating cows, harvest management
practices and the economic implications of Tifton 85 as a component of rations have not
been studied widely. Morphological features of this plant compared to other grasses
used in the region suggest the adoption of a more conservative harvest stubble may be
needed. During 2007 and 2008, a field study was conducted with the objective of
determining the effects of harvest management of Tifton 85 on forage yields, nutritive
value, and nutrient removal. A second objective was to examine the feasibility of
incorporating Tifton 85 greenchop into lactating dairy cow diets. To meet the first
objective, different harvest intervals (21, 24, 27, and 35 d) and stubble heights (8 and 16
cm) were compared using established Tifton 85 bermudagrass fields. Dry matter (DM)
yield, nitrogen (N) and phosphorus (P) removal by the grass, and herbage
concentrations of crude protein (CP), P, neutral detergent fiber (NDF) and in vitro
13
digestible organic matter (IVDOM) were measured. To meet the second objective, a
least-cost ration formulation linear program was developed using data from the field
study.
Results from the harvest management trial and least-cost ration formulation
indicate that Tifton 85 can be included in diets of milking herds when appropriate
management is used. The field trials suggest that highest yields occur with lower
harvest intervals (35 d) when adequate moisture is present, and when shorter stubble
heights (8 cm) are used. Nevertheless, shorter stubble heights (8 cm) were associated
with greater weed encroachment and are generally not recommended. Also,
management for greater nutritive value and stand persistence can be met generally with
more frequent defoliation at 24- to 27-d intervals. When Tifton 85 greenchop was
included in the ration formulation model and compared to other widely used forage
options in the state, such as alfalfa (Medicago sativa L.) hay, Tifton 85 hay, and corn
(Zea mays L.) silage, ration costs were reduced for a range of production levels of
lactating dairy cows. Future research should use animal trials to estimate the impacts of
incorporating greenchop on milk production, and the assessment of the economic
impact of using Tifton 85 greenchop at the whole-farm level. Also, forage management
trials incorporating the different harvest management treatments under different N
fertilization rates and sources, and the impact on the environment should be
considered.
14
CHAPTER 1 INTRODUCTION
Recent estimates indicate that over 68% of all agricultural lands in the USA are
used for forage production, as rangeland, planted pasture, or for mechanical harvest
(USDA-NASS, 2009). Grasslands sustain the livestock industry and are one of the most
important land uses in the country. Forage production is pivotal for Florida’s agriculture
and economy. For example, in 2007 alone, beef and dairy farming generated more than
$900 million in cash receipts (USDA-NASS, 2009b). These industries rely heavily on the
2.1 million ha of pastureland in the state, of which more than 300,000 ha are planted
forages for mechanical harvest (USDA-NASS, 2009b). The prominence of grassland
agriculture emphasizes the importance of developing forages and management
practices adapted to Florida farming conditions.
Of the forage species grown in the state, warm-season perennial grasses provide
the basis for livestock production (Pitman, 2007). Among the species planted, hybrid
bermudagrasses have a prominent role because of their adaptability to grazing and
mechanical harvest, high yields, and quality (Chambliss et al., 2006). Among the
bermudagrasses developed, Tifton 85 bermudagrass has gained acceptance since its
release in 1993 throughout the southern USA and particularly in Florida as harvested
forage and in grazing systems (Hill et al., 2001). Additionally, it has shown potential in
excess nutrient removal from effluent sprayfields (Newton et al., 2003; Woodard et al.,
2003, 2007), becoming a preferred option for soil nutrient management in intensive
animal-feeding operations.
Forage research results suggest that Tifton 85 can be used as a source of
digestible fiber to supplement high energy diets for lactating dairy cows when harvested
15
at early growth stages (West et al., 1998). Because of the lower costs associated with
using local or on-farm grown forage (Hill et al., 2001), use of Tifton 85 may be a viable
alternative to using alfalfa (West et al., 1997) or corn silage (Mandebvu et al., 1998) in
dairy animal rations. Although its benefits in grazing, silage, and hay production are
known, further research is needed to assess its potential use as greenchop in confined
dairy systems. Greenchop is a management practice where the above-ground biomass
of the forage is mechanically harvested and fed fresh to livestock; an approach that
avoids the problems of hay-making in humid environments.
In order for producers to take advantage of the potential of bermudagrasses for
use as harvested forage or in nutrient extraction from soil, management practices must
be tailored to specific environmental and farming conditions. Among these practices,
management of defoliation is perhaps one of the most important aspects that producers
control, because of its marked effects on yield, nutritive value, and stand persistence. In
general for bermudagrasses, longer harvest intervals tend to maximize dry matter yields
but decrease herbage nutritive value (Monson and Burton, 1982; Holt and Conrad,
1986; Johnson et al., 2001; Burns and Fisher, 2007), whereas more intensive
defoliation increases yields but can compromise persistence over multiple seasons
(Mislevy and Everett, 1981). Thus, it is important to understand the effects of harvest
interval and stubble height on yields and nutritive value of bermudagrasses, and to
evaluate the economic feasibility of different forage utilization alternatives in order to
generate specific management guidelines for producers in the Southeast USA.
The objectives of this study were to quantify the effects of varying harvest interval
and stubble height on dry matter yield, nutritive value, and N and P removal of Tifton 85
16
bermudagrass, and to estimate the impact of incorporating Tifton 85 greenchop on cost
of lactating dairy cow rations. The research can provide valuable information to
producers about harvest management of Tifton 85 under Florida conditions, as well as
provide insight into its potential use as greenchop for milking herd rations.
17
CHAPTER 2 LITERATURE REVIEW
‘Tifton 85’ Bermudagrass
Bermudagrass [Cynodon dactylon (L.) Pers.] is a tropical, stoloniferous forage
plant native to tropical east Africa that has naturalized throughout the tropics and
subtropics and is one of the most widespread and widely used genera of grasses in the
world (Hanna and Sollenberger, 2007). This warm-season perennial grass is used for
hay production and grazing in the southern USA because of its high biomass
production, rapid establishment, and tolerance to defoliation and drought (Hill et al.,
2001; Redfearn and Nelson, 2003). Currently, it is planted on approximately 15 million
hectares in the USA (Taliaferro et al., 2004).
There are several cultivars of bermudagrass. They range from the low producing
common to the high yielding and high quality hybrids (Hill et al., 2001). Among the many
hybrid bermudagrasses developed and released in the southeastern USA, Tifton 85 is
one of the most recent (Burton et al., 1993). Others include ‘Coastal’ bermudagrass, the
first released for use in southern forage programs (Burton, 1986), ‘Tifton 44’, one of the
most cold-tolerant hybrids (Monson and Burton, 1982), and several others such as
‘Callie’, ‘Tifton 78’, ‘Florakirk’, ‘Coast Cross I’, and ‘Coast Cross II’.
The high nutritive value and upright growth habit characteristic of Tifton 85 can be
attributed to its lineage. This grass is the result of a cross between a tall, highly-
digestible African stargrass (‘Tifton 68’; C. nlemfuensis hybrid), and an armyworm-
resistant bermudagrass accession from South Africa (PI 290884; C. dactylon) (Burton,
2001). Morphologically, Tifton 85 is taller, has a more erect growth habit, thicker stems
and stolons, and wider leaves than previous bermudagrass releases. It also produces
18
larger but fewer rhizomes than Coastal bermudagrass (Burton et al., 1993). Together
with the robust growth, these morphological traits have important implications in
determining the defoliation management for long-term persistence of Tifton 85. In
addition, it has shown greater drought tolerance (Marsalis et al., 2007) and late-season
dry matter (DM) production (Evers et al., 2004) than other hybrid or seeded
bermudagrasses; and while it is less cold-tolerant than Tifton 44 bermudagrass,
successful stands have been maintained as far north as North Carolina (Burns and
Fisher, 2007). Sexual seed production is minimal, and like most hybrids, propagation is
through vegetative material as stolons or rhizomes (Hill et al., 2001).
Since its release in 1993, Tifton 85 has gained acceptance throughout the
southern USA as harvested forage (Hill et al., 2001). This plant showed promise in its
initial small plot trials, producing 20, 19, and 22% more DM ha-1 than Coastal, Tifton 44
and Tifton 68, respectively (Burton et al., 1993). More recently DM yields of Tifton 85
have been reported in the 16 to 26 Mg ha-1 yr-1
The high nutritive value of Tifton 85 has been demonstrated in multiple studies
throughout the Southeast USA (Hill et al., 2001; Mandebvu et al., 1999; Mislevy and
Martin, 2006). The crude protein (CP) concentrations of this grass are greater than most
tropical grasses grown in the region (Mislevy and Martin, 2006; Johnson et al., 2001;
Marsalis et al., 2007), frequently exceeding 160 g kg
range (Woodard et al., 2007; Marsalis et
al., 2007).Yields of this magnitude have been associated with removal of large
quantities of nutrients from effluent sprayfields (Newton et al., 2003; Woodard et al.,
2003, 2007), and Tifton 85 is considered an attractive option for good soil nutrient
management in animal-feeding operations in the Southeast.
-1. Likewise, the digestibility is
19
considered better when compared to other warm- or cool-season forages used
throughout Florida. Although Tifton 85 has a high fiber concentration like most tropical
grasses, neutral detergent fiber (NDF) digestibility is greater than most of the warm-
season grasses grown in the region. It is this attribute that makes Tifton 85 a viable
option for lactating dairy cow rations (Mandebvu et al., 1999; Mandebvu et al., 1998;
West et al., 1997).
Forage Responses to Defoliation
Defoliation has marked effects on the physiological and morphological processes
that occur in plants. In the short term, forages rely on mechanisms such as increased
photosynthate allocation to shoots over roots (Nelson, 2000) and remobilization of
stored C and N to sites of active photosynthesis and growth in order to rapidly
reestablish the photosynthetic area of the plant (Thornton et al., 2000). Some forage
species also can increase the photosynthetic ability of the leaves that remain on the
plant after defoliation, a process known as compensatory photosynthesis (Richards,
1993). Plants also can modify their morphology in order to both reduce the probability of
future defoliation events and to better withstand them as they occur. This is
accomplished in certain species by altering leaf growth, rate of tillering, and orientation
of tillers and leaves in positions that are less likely to be harvested, i.e. favoring
horizontal and lower growth (Nelson, 2000).
Effects on dry matter yields
Early studies on Coastal bermudagrass (Ethredge et al., 1973) suggest that both
harvest interval and stubble height are important criteria to consider in hybrid
bermudagrass management. These studies point to effects not only in terms of biomass
20
production and leaf to stem ratios, but also to their effects on stand persistence
throughout subsequent growing seasons.
One of the early studies that looked at the effects of harvest interval is that of Prine
and Burton (1956). The authors reported that increasing harvest interval increased
cumulative DM yield over 70%, from 5.1 Mg ha-1 at 14 d to 8.7 Mg ha-1
In another study Holt and Lancaster (1968), focused on the effects of stubble
height on N-fertilized Coastal bermudagrass. They found that defoliating to a 5-cm
stubble height and harvesting when the canopy was 35- to 40-cm tall produced DM
yields of 15.3 Mg ha
at 42 d, but this
reduced leaf percentage from 86 to 63%. A study conducted in Puerto Rico by Caro-
Costas et al. (1972) on stargrass (Cynodon nlemfuensis Vanderyst) also reported that
increasing harvest interval from 30 to 90 d increased DM yield, but no reduction in the
leaf to stem ratio was detected.
-1; the highest observed in the trial. The authors noted that grass
managed under tall stubble heights (13 cm) had greater root mass accumulation than
those under the short stubble (5 cm) regime. They also found that more infrequent
harvest treatments resulted in lower stand densities compared to those under more
frequent cutting. Holt and Conrad (1986) evaluating various clipping treatments reported
that total annual forage yield of Coastal increased 0.15 Mg ha-1 for each day that
harvest was delayed after 14 d of regrowth. Forage yield was 58% greater when
harvested every 56 d than when harvested every 14 d. Ethredge et al. (1973) found that
both harvest interval and stubble height had a major influence on Coastal DM yields,
noting that shorter cutting heights (0 cm) resulted in greater DM yield than taller stubble
(14 cm) (9.6 vs. 6.5 Mg ha-1 for 0 and 14 cm, respectively). Likewise, they found that
21
longer harvest intervals resulted in the highest annual DM yields (6.9 vs. 8.2 Mg ha-1
More recent findings confirm the trends observed in earlier research. Studies in
the southern Piedmont on vegetatively propagated ‘Midland 99’ and ‘Tifton 44’
bermudagrasses showed that under adequate moisture, harvest intervals of 4 and 6 wk
maximized DM yields on clay loam and sandy soils, respectively (Fike et al., 2005).
Similar results also were obtained by Mandebvu et al. (1999), who found that longer
harvest intervals (49 and 56 d) maximized Tifton 85 and Coastal bermudagrass yields,
producing on average 6 and 6.4 Mg ha
for
21- and 35-d intervals, respectively).
-1
In summary, these studies found that harvest interval and stubble height are
important parameters to consider in perennial hybrid bermudagrass management. In
general, both short stubble heights and fewer harvests tend to increase DM yield.
, respectively.
Effects on nutritive value
Broadly defined, digestibility is a measure within forage nutritive value that
represents the proportion of a feed’s DM or of one of its constituents that is broken
down and absorbed within the digestive tract of an animal (Barnes et al., 2007). In
general, its value is tightly linked to the chemical composition of the plant material
(Smith et al., 1972), to the structure of the forage in terms of plant architecture and leaf
to stem ratios, the proportion of tissues (e.g., vascular bundles, mesophyll, and
epidermis), and fiber fractions (Van Soest, 1967). Tropical grass canopies are generally
vertically heterogeneous in terms of DM distribution and nutritive value, with nutrient
concentrations and digestibility typically declining from the top of the canopy to soil level
(Stobbs, 1975; Newman et al., 2002). Because of the strong relationship between
digestibility and the morphological and physiological characteristics of forage plants, the
22
effects of defoliation practices on digestibility have been an important area of study
within bermudagrass management. In the following, several studies are described that
looked at the effect of harvest interval and stubble height on nutritive value.
Early studies on Coastal bermudagrass found that increasing harvest interval
negatively affected DM digestibility percentages, with values decreasing from 65.2 to
56.6% as interval between defoliation increased from 21 to 42 d (Burton et al., 1963).
This change was associated in part with a decrease in leaf percentage from 85.2 to
67.2% during the same interval. Holt and Conrad (1986) compared five bermudagrass
cultivars (‘Coastal’, ‘Callie’, ‘Tifton 68’, ‘S-16’, and ‘S-83’) harvested at 14-, 28-, 42-, and
56-d intervals and cut to a 5-cm stubble. They found that digestibility declined as
harvest interval increased, but that differences existed among the rates at which this
occurred among the species studied. Overall, the rate of decline in forage in vitro
digestible dry matter (IVDDM), averaged across species, was 2 g kg-1 of DM for each
day of increasing age between 14 and 56 d. During this period, leafiness also declined
by 180 g kg-1, suggesting that the leaf to stem ratio can be an important factor that
affects forage digestibility. Caro-Costas et al. (1972) found that increasing harvest
interval of stargrass after 30 days at 15-day intervals reduced forage digestibility;
increasing lignin concentration from 7.8 to 10%. The researchers also reported a drop in
herbage CP concentration from 146 to 77 g kg-1 when interval between harvests
increased from 30 to 90 d (Caro-Costas et al., 1972). Another study on Coastal
bermudagrass harvest interval also found that CP concentration decreased with longer
intervals between harvests, averaging 18.25% at 14 d and decreasing to 12.03% at 42
d across different N-fertilization rates (Prine and Burton, 1956).
23
Research focusing on comparing harvesting intervals of Tifton 85 hays also found
that CP concentration declined markedly from 20.8% at 14 d of regrowth to 11.1% at 49
d, reflecting the lower leaf to stem ratios (Mandebvu et al., 1999). Mandebvu et al.
(1998) also showed that delaying harvest by 25 d, from 24 to 49 d, produced a 43%
decline in CP concentration in Tifton 85 hay. More recent work focused on shorter
harvest intervals (2 and 4 wk) at each of three N fertilization levels (0, 40, and 80 kg ha–
1
Specifically for Tifton 85, reports from Mandebvu et al (1998) showed that when
harvested at 7 wk of regrowth the grass had a marked reduction in digestibility of DM
(IVDMD) and NDF at 48 h of fermentation when compared to forage harvested at 3.5
wk (from 58.5 to 50.9% and 53.5 to 38%, respectively). In the study, the authors also
found that the 3.5-wk treatment had similar IVDMD and greater NDF digestibility
coefficients at 48 h than corn silage, a high quality forage component of cattle rations.
Similar results were obtained by Mandebvu et al. (1999), who found that Tifton 85
harvested as hay at 3-wk intervals had greater IVDMD, NDF digestibility, and ADF
digestibility than hays harvested at 5- or 7-wk intervals. In this study, Tifton 85 was
compared to Coastal bermudagrass harvested at similar ages. Tifton 85 had greater
NDF concentrations but showed greater overall IVDMD (63.2 vs. 59.4%) and NDF
digestibility (65.5 vs. 57.8%). The reasons for this high digestibility in spite of high NDF
in each 4-wk period) (Vendramini et al., 2008). They concluded that management
practices, such as shorter regrowth periods between harvests of ‘Tifton 85’
bermudagrass can be effective in increasing herbage CP concentration. In their study,
CP was always greater for herbage harvested at 2-wk intervals, obtaining an average of
~17% compared to ~12% at 4-wk intervals.
24
concentrations has been related to the lower ether-linked ferulic acid concentrations in
Tifton 85 when compared to other forages, a factor which appears to facilitate digestion
by rumen microorganisms (Mandebvu et al., 1998b). Given that longer intervals
between harvests have negative effects on CP and IVDOM, management should target
shorter intervals, as nutritive value appears to decrease markedly after 30 to 35 d of
regrowth. This management should be considered particularly when feeding forages to
ruminants such as lactating cows, which require greater amounts of degradable
nutrients.
Relative to the effect of stubble height on nutritive value, early studies conducted
in Puerto Rico focused on the effects of stubble height on nutritive value for different
warm-season perennials. Comparisons of low (0-8 cm) or high (18-25 cm) cutting
heights for elephantgrass (Pennisetum purpureum), guineagrass (Panicum maximum),
‘Pangola’ digitgrass (Digitaria eriantha), molassesgrass (Melinis minutiflora) or
Caribgrass (Eriochloa polystachya) found no differences in forage CP concentration
(Caro-Costas and Vicente Chandler, 1961). Similar results were obtained for stargrass
under similar tropical conditions, where no differences in CP concentration were
detected between 5- and 15-cm stubble heights (Caro-Costas et al., 1972).
Tifton 85 Bermudagrass Use as Harvested Forage
The use of Tifton 85 bermudagrass as hay or silage has been documented widely
for different livestock systems throughout the USA, but its use as greenchop has not
been studied widely. Greenchop or fresh-cut forage is a management practice where
the above-ground biomass of the forage is harvested mechanically and supplied directly
to livestock. This approach avoids trampling and fouling (Marten and Donker, 1964),
potential uprooting and spatial selectivity associated with grazing (Weir and Torell,
25
1959), and provides an alternative to haying, particularly in environments where rain
distribution in the summer is an important factor associated with nutrient loss
(Scarbrough et al., 2005). Early studies in the southern USA compared milk production
and forage and land utilization of fresh cut and grazing systems. Stone (1959)
concluded that cows fed greenchop produced at least as much milk as cows under
either strip or rotational grazing, while gaining more weight than cows under either
pasture system. Additionally, this system appeared to reduce forage losses associated
with trampling and uneven grazing pressure in pastures. Also, this practice allowed
producers to use lands that were farther away within their farms that would be
unfeasible under grazing. While this work was done over 50 years ago under less
intensive farming systems than the ones currently used in Florida, the benefits of using
greenchop appear relevant today when producers are forced to find alternative forage
management strategies to produce high quality forages to meet the requirements of the
herds.
Bermudagrasses in general are well suited for mechanical harvest, given their high
yield, rapid regrowth, and high nutritive value under frequent harvest (Taliaferro et al.,
2004). Studies have shown that Tifton 85 hay or silage can be used as a source of
digestible fiber in high energy diets for lactating cows (West et al., 1998; Mandebvu et
al., 1999), and that its high nutritive value and yields make it a viable alternative to other
harvested forages. Early studies that used Tifton 85 bermudagrass as silage found that
material harvested at 5-wk could be an economically feasible substitute to using corn
silage, given its lower costs of incorporation to the dairy cow rations and its high NDF
digestibility (Ruiz et al., 1995). Additionally, in a study comparing dairy rations with

26
Tifton 85 (harvested at 3.5-wk) or alfalfa hays, CP concentrations were similar (16.6 vs.
17.3%, respectively), but the NDF digestibility was considerably greater for diets
containing Tifton 85 (ranging from 58.4 vs. 39.1%, respectively), resulting in equal dry
matter intake (DMI) of lactating Holstein cows (West et al., 1997). When compared with
Coastal bermudagrass at different harvest ages (3, 4, 5, 6, 7, and 8 wk), Tifton 85
produced 7.1% more DM (4,500 vs. 4,200 kg ha-1
Similar results were obtained when comparing ‘Alicia’ bermudagrass with Tifton
85, where hays harvested at 5 and 7 wk from fields receiving poultry litter (18 t ha
), had significantly greater IVDMD
(58.7 vs. 54.8%), and had greater NDF digestibility (55.7 vs. 48%) and ADF digestibility
(41.4 vs. 32.5%). These values show 9% greater DM digestion and 13.3% greater NDF
digestibility for Tifton 85 than Coastal (Mandebvu et al., 1999).
-1) and
commercial fertilizer (269 kg ha-1 of N and 56 kg K2O ha-1) (Hill et al., 2001). The
authors reported that CP, ADF and NDF were similar among species, but IVDMD was
greater for Tifton 85 samples at both growth stages (Hill et al., 2001). When compared
to stargrass in South Florida, Tifton 85 forage had similar CP (10.2 vs. 10%) and 11.9%
greater IVDOM when both were harvested at 4 wk, without receiving fertilization
throughout the experiment (Arthington and Brown, 2005). These results suggest that
Tifton 85 bermudagrass is a premium forage relative to other C4
Removal of Nutrients
grasses, and that it can
be adopted for high-quality hay production.
The use of forage production in effluent sprayfields can help reduce potential
nutrient leaching (Rotz et al., 2002; Pant et al., 2004). Under Florida conditions, C4
grasses managed intensively can be effective options for removal of soil nutrients,
particularly N (Woodard et al., 2002) and P (Newman et al., 2009; Newman et al.,
27
2009b). Among the forages available, Tifton 85 has shown promise for use in soil
nutrient remediation from impacted sites throughout the Southeast USA. Multi-forage
cropping systems that contained Tifton 85 extracted 86% of applied N during the
cropping season, which was greater than those based on warm-season annuals
(Woodard et al., 2002). Studies in northern Florida suggest that systems based on this
forage are appropriate for dairy sprayfields since they extract large amounts of N from
the soils, in addition to producing high-yields of forage with high CP concentration
(Macoon et al., 2002). Modeling of North Florida farms, where crop models were run for
43 years of daily weather data, also suggest that forage systems containing
bermudagrass were among the best options for reducing N leaching (Cabrera et al.,
2006). Woodard et al. (2003) studied corn-bermudagrass-rye (Secale cereale L.) and
corn-rhizoma peanut (Arachis glabrata Benth.)-rye forage rotations, and determined that
for N removal, the system containing Tifton 85 bermudagrass had the lowest NO3-N
levels and highest N harvest (191 kg ha-1
Woodard et al. (2007) determined that Tifton 85 was the best warm-season
component of year-round forage systems in North Florida dairies for P extraction, with
high P removal (67 kg ha
), despite a sustained decline in production
after the first of three cycles.
-1) associated with high yields (3,800 kg ha-1). However,
previous work (Woodard et al., 2003) found that stand persistence can decline
considerably in intensive year-round forage systems, possibly because of water,
nutrient, and light competition issues with the other components of the rotation (i.e.,
corn and rye).
28
After reviewing the literature, an important conclusion from these studies is that
DM yield, nutritive value, and nutrient removal cannot be maximized simultaneously by
manipulating harvest interval, requiring a compromise between them under any
management situation. Given that the responses of forages to defoliation are expressed
differently at different time periods and affect various physiological and morphological
processes, it is important to study how warm-season grass species perform under
different defoliation regimes, and how defoliation affects yield, herbage nutritive value,
and soil nutrient removal. Understanding these processes can guide the development of
forage management practices that fit the ecological and farming conditions of producers
in the region, and allow for alternative forage uses to be evaluated for their economic
feasibility.
Forage Budgets
Budgets are the financial layout for a given enterprise, with which the feasibility of
alternative production technologies and management practices can be evaluated, aiding
the decision-making process for resource-use optimization (Olson, 2004). Budgeting
options exist that allow producers to analyze different components and aspects of their
businesses, from the whole-farm scale to specific farming activities. Enterprise or unit
budgets are projections of income and expenses that specify the quantities, prices, and
relationships for a given meaningful unit of production, such as a hectare of pasture
(James and Eberle, 2000); allowing farmers to plan ahead and gain insight into the
potential economic outcomes of specific activities. Also, by conducting the analysis on a
unit (i.e., per hectare) basis, the input-use efficiency can be estimated more accurately
than if total farm budgets are used (Olson, 2004).
29
The use of forage budgets is a practice that managers and university extension
specialists use throughout the country, providing a framework to estimate the costs and
profitability of a given forage production system, and greatly enhancing the decision-
making process of choosing the best cropping alternative or farm management
practices (Schuler, 2005; Pflueger, 2005; Miller et al., 2003; Landblom et al., 2005).
As with other financial instruments, budgeting strongly depends on using accurate
and adequately classified information about the proposed enterprise (Kay et al., 2004).
The data used to create these budgets can be placed into two broadly defined
categories, those relating to the physical relationships of transforming materials into
products, or input-output relationships, and those that refer to the prices of these inputs
and outputs (James and Eberle, 2000). When arranging a cost structure, operational
(variable) and ownership (fixed) costs need to be considered. Operational costs are
those that occur only if production takes place, and vary with the volume of production
during the time period for which the budget is developed. Most forage budgets include
fertilizer, agrochemicals (herbicide, insecticide), costs of vegetative establishment
(propagating material and incorporation), machinery and labor costs, as well as the
price of land rent. In turn, ownership costs refer to those that do not vary during the
given time period of the study, even if no production takes place (Simpson, 1989; Kay et
al., 2004), and would typically include depreciation, insurance, interests and housing
costs of machinery and equipment, as well as taxes and other administrative costs
(Olson, 2004; AAAE, 2000). Because of the large amounts of manure that are
generated in confined-housing dairy farms, it is also important to consider its potential
30
use as a nutrient source for forage crops, and thus, analyze the economic impact of its
management.
Dairy Manure Costs
Traditionally, manure has been considered a valuable resource in agricultural
systems as a byproduct that has use as fertilizer for crops (Keplinger and Hauck, 2006).
On the other hand, the rapid decline in overall farm numbers in recent decades,
accompanied by an increase in operation specialization and size, and the advent of
relatively inexpensive synthetic fertilizers and stricter environmental regulations has led
to the increasing view of manure as an undesired waste product (Ribaudo et al., 2003;
Keplinger and Hauck, 2006). This situation has forced farmers to pay close attention to
all aspects of manure management, from animal nutrition and feeding strategies to
handling, application, and cost estimation.
Although the value of manure has decreased with time, particularly in relation to
commercial fertilizers, it is still widely considered an important source of crop nutrients
in many livestock-centered farms, including dairy enterprises. Utilization of dairy
manures generated on-farm for forage production is one such example where
producers, particularly in the Southeast, have taken advantage of the availability of this
by-product in fertilization regimes. This approach reduces the potential leaching of
excess N and P (MEQB, 2002; Rotz et al., 2002), and can provide significant amounts
of forage that can help reduce feeding costs and nutrient imports into the system (Pant
et al., 2004).
Although the application of manures for forage production is viewed frequently
simply as taking advantage of a waste product (Keplinger and Hauck, 2006), the
incurred costs must be incorporated into farm budgets in order to adequately estimate
31
the economic impact of their utilization in milk production systems (Ribaudo and
Agapoff, 2005). Intrinsic characteristics of dairy excreta make their usage for crops
more difficult and in some aspects more costly than traditional fertilizers. The low
mass:value ratios of manure markedly increases its handling, transportation, and
application costs when compared to typical purchased fertilizer (Keplinger and Hauck,
2006). Additionally, use of manure at agronomic rates is complicated by the fact that the
manure nutrients occur in proportions that do not match crop requirements (Feinerman
et al., 2004). Applications based on plant N requirements typically result in a buildup of
P (Toth et al., 2006), given the difference in N:P ratios between those found in plant
tissue (generally in the 5-6:1 range) and those supplied by livestock manure (typically
approaching 2:1) (Toth et al. 2006; Dou et al., 2002; Elliot et al., 2002). Thus,
applications based on plant N requirements may have negative environmental impacts,
while those done based on P requirements typically require larger amounts of land for
disposal of all farm-generated wastes (particularly in operations with high animal
densities) and frequently result in insufficient N being applied.
Overall, any analysis of the fertilizer value of manure depends critically on
assumptions about the concentration of N, P, and K in manure, crop requirements,
commercial fertilizer prices, and application costs (Koehler and Lazarus, 2007). The two
most important factors that determine the net value of manure are its nutrient content
and the distance it needs to be hauled before it is used, with greater nutrient content
enhancing manure value and longer transportation distance reducing it (Ribaudo and
Agapoff, 2005). Given the number of factors that affect the calculation of manure-use
costs, best estimates are obtained utilizing producer-specific values, that can capture
32
the differences in manure production and nutrient content, land available, and crop
demands, as well as manure handling equipment available, among others (Koehler and
Lazarus, 2007).
Least-Cost Ration Linear Programming Models for Dairy Cattle
Linear programming is a quantitative method that deals with the analysis of
optimization problems where the relationships between production factors are lineal
(McCarl and Spreen, 1996; Simpson, 1989). Since its development in 1958, its use in
agricultural economics has been widespread (Simpson, 1989; Pesti and Seila, 1999),
serving as a complement to budgeting and as an analytical tool to analyze the feasibility
of livestock enterprises (Simpson et al., 1989). In general, linear programming is
considered an optimization procedure where a given response variable (e.g., ration
cost) is maximized or minimized under a set of constraints or restrictions (e.g., amount
of DM intake, CP, energy required in ration).
Use of this approach in determining least-cost rations has been widespread in
dairy production systems throughout the USA (Eastridge, 2006). One of the most
important challenges in feeding dairy cows is finding the optimum balance between
starch and fiber to meet their nutritional requirements and maintain rumen health. With
the shift towards the use of total mixed rations (TMR) in the past 25 yr, producers
increasingly have opted to use computerized systems to control diet composition and
cost (VandeHaar and St.-Pierre, 2006), many of which are least-cost and ration
evaluation programs such as the Spartan ration evaluator/balancer from Michigan State
University, Cornell University’s CPM Dairy Program, or the PCDairy2 software from the
University of California, Davis.
33
Initial studies have found that this type of software constitutes a user-friendly and
accurate means of formulating rations for lactating dairy cows (Howard et al, 1968;
Chandler and Walker, 1972; Black and Hlubik, 1980). An additional benefit is that these
tools are adaptable to multiple research and producer management questions, such as
the feasibility of incorporation of certain concentrates or forages in the ration. Recent
studies also have used this application for the evaluation of dairy farm management
activities, such as manure disposal costs (Hadrich et al., 2008), adjustment of CP levels
in dairy heifer rations (Tozer, 2000), or dairy grazing management (Duru et al., 2007).
In the following chapters, harvest management strategies for Tifton 85
bermudagrass will be evaluated. The effects of stubble height and harvest interval will
be examined in detail. Responses measured and reported include DM production and
nutrient removal (Chapter 3) and herbage nutritive value (Chapter 4). In addition, an
assessment of the impact on ration cost of incorporating Tifton 85 bermudagrass
greenchop as a forage source for lactating dairy cows is presented (Chapter 5).
34
CHAPTER 3 HARVEST MANAGEMENT EFFECTS ON FORAGE DRY MATTER PRODUCTION
AND NUTRIENT REMOVAL OF TIFTON 85 BERMUDAGRASS
Introduction
‘Tifton 85’ bermudagrass (Cynodon spp.) is an important warm-season forage
grass for use in the southeastern USA. The greater yields and quality of this grass
compared to other Cynodon hybrids make it an ideal forage for livestock farming in the
region, particularly for dairy and beef production (West et al., 1998; Hill et al., 2001).
Tifton 85 has consistently produced dry matter (DM) yields that have been in the
upper tier when evaluated against a number of other grasses under diverse
management and environmental conditions (Sistani et al., 2004; Woodard et al., 2007;
Marsalis et al., 2007). Also, the above average nutritive value makes it an increasingly
accepted subtropical forage option for dairies in the southern USA (Hill et al., 2001).
While it has shown greater DM yields than other bermudagrass hybrids such as
‘Coastal’ (Mandebvu et al., 1999; Marsalis et al., 2007), ‘Tifton 78’ (Hill et al., 1993), and
‘Tifton 44’ (Hill et al., 2001), as well as seeded bermudagrass varieties including
‘Wrangler’, ‘Cheyenne’, ‘Sahara’, and ‘Giant’ (Marsalis et al., 2007), the effects of
mechanical defoliation on DM yields under sandy soil conditions in Florida have not
been documented widely.
Harvest interval and stubble height affect DM production and stand persistence
(Mislevy and Everett, 1981). In general, infrequent cuttings of hybrid bermudagrasses
have been shown to maximize DM yield (Holt and Lancaster, 1968; Holt and Conrad,
1986; Mandebvu et al., 1999) and lower leaf to stem ratios (Prine and Burton, 1956).
The literature indicates that low stubble heights are associated with maximization of
35
yield (Ethredge et al., 1973), but it also shows how lower stubbles can affect negatively
the persistence of some species (Mislevy and Everett, 1981).
The morphological characteristics of Tifton 85, particularly a more upright growth
habit than Coastal bermudagrass (Burton et al., 1993), may require a different
defoliation management approach than the close defoliation widely established for
Coastal bermudagrass and other warm-season perennial grasses (Holt and Lancaster,
1968).
Additionally, DM yields of warm-season perennial grasses and particularly
Cynodon species have shown a high potential for removal of N and P (Newman et al.,
2009). Newton et al. (2003) and Woodard et al. (2003) found that Tifton 85 removed 86
and 73% of N applied, respectively. Woodard et al. (2007) concluded that Tifton 85
would be the best warm-season option for P removal from dairy effluent sprayfields in
Florida after analyzing the P-extraction potential of forage systems that included corn
plants (Zea mays L.), perennial peanut (Arachis glabrata Benth.), and forage sorghum
[Sorghum bicolor (L.) Moench.] as warm-season components. Thus, understanding the
effects of harvest interval and stubble height on DM yields is needed to determine the
potential for excess soil nutrient removal by Tifton 85, and for establishing management
guidelines for long-term persistence. Based on the literature, the hypothesis of the study
is that longer harvests and shorter stubble heights of Tifton 85 bermudagrass should
produce greater DM yields.
Specific objectives of this study were to i) quantify the DM production of Tifton 85
bermudagrass in response to harvest intervals and stubble heights and ii) determine the
36
N and P removal under different harvest interval by stubble height treatment
combinations.
Materials and Methods
Study site description
This study was conducted during 2007 and 2008 on established hayfields of Tifton
85 bermudagrass in North Central Florida. In 2007, the study was located on a
commercial dairy farm near Bell in Gilchrist County, within the Suwannee River basin
(29°43'N and 82°51'W). The soils are excessively drained Kershaw fine sands (thermic,
uncoated Typic Quartzipsamment), characterized by a very rapid permeability, slow
surface runoff, water table below a depth of 10 m, and gently rolling topography (Soil
Service Staff, 2006). Soil pH was 7.4. Mehlich I extractable P, K, Ca, and Mg at the site
were classified as either high or very high (Table 3-1), with values of 597, 175, 1993,
and 220 mg kg-1, respectively. Organic matter was 22.5 g kg-1. During the period of the
study (May to October), the experimental area received applications of solid manure
and manure water at rates of 47.2 Mg DM ha-1 and 1.7 ML ha-1, respectively. These
applications totaled to 144 kg ha-1 of P and 148 kg ha-1
In 2008, the study was conducted approximately 16 miles south of the first
location, also within the Suwannee River basin in North Central Florida (29°30'37.38"N,
82°48'49.04"W). The soils were also moderately to excessively well drained Otella-
Candler fine sands (loamy, siliceous, semiactive, thermic Grossarenic Paleudalfs)
characterized by a rapid permeability, slow surface runoff, water table below a depth of
1.4 m, and gently rolling topography (Soil Service Staff, 2006). Soil pH was 6.0. Mehlich
I extractable P, K, Ca, and Mg at the site were 83, 44, 424, and 66 mg kg
of N.
-1,
respectively. Organic matter was 15.4 g kg-1. Whereas no fertilizer was applied during
37
the experiment, the field served as a feed lot for feeder calves during the fall and spring
prior to initiation of this experiment.
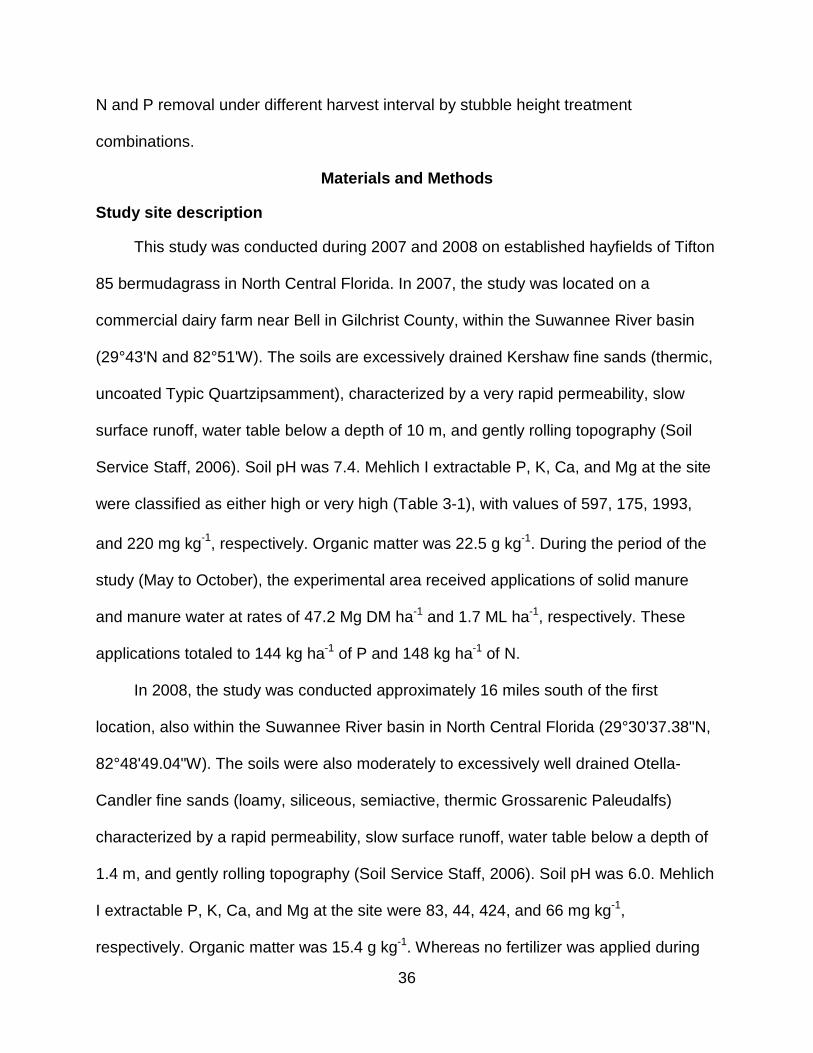
Table 3-1. Current interpretation for Mehlich-1 soil test results for agronomic and vegetable crops.
Very Low Low Medium High Very High
------------------------------ppm------------------------------
P <10 10-15 16-30 31-60 >60 K <20 20-35 36-60 61-125 >125 Mg -- <15 15-30 >30
Harvest management and sampling
At both locations, the experimental area was a 35- × 30-m (1050 m2) section of an
established Tifton 85 bermudagrass hay field. The staging cut to initiate the experiment
occurred on 26 June in both years. Experimental units were 6- × 2.5-m (14.9 m2), with
2.5 m borders on each side. Sampling units consisted of a 6- × 1.25-m (7.6 m2) strip
from the center of the plot. Plots were harvested according to treatment (Table 3-2)
during afternoon hours using a flail-type mower. Stubble heights were achieved by
adjusting the harvester to the desired height for each experimental unit. Fresh weight
was measured, and subsamples of approximately 400- to 500-g were taken from the
harvested material for dry weight determination by oven drying for 48 h at 55°C.
Samples were ground to pass a 1-mm screen in a Wiley mill, and tissue N and P
concentrations were determined by semiautomated colorimetry (Hambleton, 1977).
Nitrogen and P removal (kg ha-1) was calculated as the product of DM yield (kg ha-1) by
herbage tissue concentration (g kg-1
herbage). Additionally a weed assessment was
conducted, where summer weeds present in the plots at the time of harvest were
removed manually, counted and classified as either grass, broadleaf or Amaranthus sp.
38
Table 3-2. Harvest schedule for Tifton 85 harvest intervals in 2007 and 2008. 21 d 24 d 27 d 35 d Harvest Number 2007 † 2008 2007 2008 2007 2008 2007 2008
1
17 July (198)
17 July ‡ (199)
20 July (201)
21 July (203)
23 July (204)
23 July (205)
31 July (212)
31 July (213)
2
7 Aug. (219)
7 Aug. (220)
13 Aug. (225)
13 Aug. (226)
20 Aug. (232)
19 Aug. (232)
4 Sept. (247)
4 Sept. (248)
3
28 Aug. (240)
28 Aug. (241)
6 Sept. (249)
5 Sept. (249)
17 Sept. (260)
15 Sept. (259)
9 Oct. (282)
9 Oct. (283)
4
17 Sept. (260)
18 Sept. (262)
1 Oct. (274)
30 Sept. (274)
15 Oct. (288)
13 Oct. (287)
5
9 Oct. (282)
9 Oct. (283)
24 Oct. (297)
6 30 Oct. (303)
† Staging cut was on 26 June in both years. ‡ Day of year.
Experimental design
The experiment was analyzed as a randomized complete block design with a split-
plot arrangement of treatments with three replicates. Stubble heights were 8 and 16 cm
and were assigned to main plots. Harvest interval levels were 21, 24, 27, and 35 d and
were assigned to sub-plots, generating a total of eight treatments of stubble height by
harvest interval level, and a total of 24 experimental units (Figure 3-1). Stubble heights
were selected with the goal of simulating those used by producers (8 cm), and a taller
one (16 cm), that may be more appropriate for the growth habit of this grass. The 21-,
24-, and 27-d harvest interval levels were selected to evaluate the effect on DM yield of
harvesting before 28-d of regrowth, which is likely the interval to be used for greenchop
on dairies. The 35-d level was selected to represent the longest interval within the
recommended range for bermudagrass in Florida (Staples, 2003).
39
2.5 m 2.5 m
6 m
2.5 m
Tall stubble (16 cm) Short stubble (8 cm)
Rep I
21 days 27 days 35 days24 days
Rep II Rep III Rep I Rep II Rep III
Harvest frequency
Figure 3-1. Experimental layout of defoliation management trial during 2007 and 2008.
40
Data analysis
Data were analyzed using PROC MIXED procedures of SAS (SAS Institute Inc.,
2004). In all models, year, stubble height, and harvest interval were considered fixed
effects; replicates and their interactions were modeled as random effects. Total DM yields
were calculated as the sum of DM from each harvest during the growing season. In order
to study the seasonal trends in DM yields within each harvest interval, data was analyzed
using the repeated measures statement in PROC GLIMMIX. The nature of the harvest
interval effect was assessed using orthogonal polynomial contrasts. Because of the
unequally spaced harvest interval levels, coefficients were obtained using the ORPOLY
macro procedure in SAS (SAS Institute, 2004). Mean separation was further
accomplished using least-square means and the PDIFF option in SAS. All test differences
were considered significant at P ≤ 0.05, while values at P ≤ 0.10 were further discussed
as trends.
Results and Discussion
Weather conditions
During both years of the study unusually dry conditions were present (Figure 3-2). In
2007, total rainfall was considerably lower than the 59-yr average (835 vs. 1331 mm,
respectively), and reached 790 mm for the May through October period. The distribution
reflected markedly drier January through May and August periods that received less than
50% of the expected rainfall. In 2008, total rainfall was also considerably lower than the
long term (51 yr) average (1031 vs. 1525 mm, respectively), and was only 571 mm for the
May through October growing season. The distribution throughout the year also showed
considerably drier April through July and September through December periods. The
months of April, June and July received less than 55% of the expected rain, while the
41
A
B
Figure 3-2. Monthly rainfall for the study site in 2007 near Bell, Florida and the 59-yr average (A) (SERCC, 2008); and for the study site in 2008 near Chiefland, FL and the 51-yr average (B) (SERCC, 2009). Bar indicates data collection period.
month of May received only 7% of the typical rainfall. Additionally, whereas the month of
August received greater than average rain, 45% occurred in a three day span (24-27
August). Implications of these rainfall patterns will be discussed for the response
variables below.
42
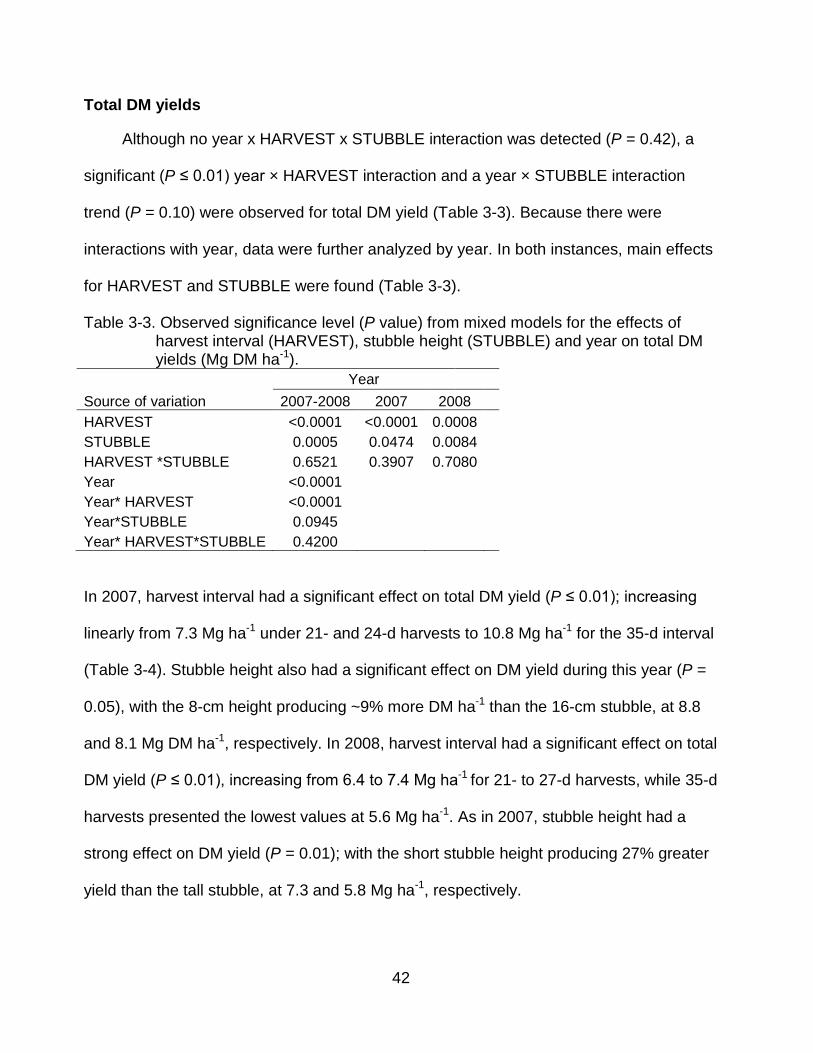
Total DM yields
Although no year x HARVEST x STUBBLE interaction was detected (P = 0.42), a
significant (P ≤ 0.01) year × HARVEST interaction and a year × STUBBLE interaction
trend (P = 0.10) were observed for total DM yield (Table 3-3). Because there were
interactions with year, data were further analyzed by year. In both instances, main effects
for HARVEST and STUBBLE were found (Table 3-3).
Table 3-3. Observed significance level (P value) from mixed models for the effects of harvest interval (HARVEST), stubble height (STUBBLE) and year on total DM yields (Mg DM ha-1
).
Year Source of variation 2007-2008 2007 2008 HARVEST <0.0001 <0.0001 0.0008 STUBBLE 0.0005 0.0474 0.0084 HARVEST *STUBBLE 0.6521 0.3907 0.7080 Year <0.0001 Year* HARVEST <0.0001 Year*STUBBLE 0.0945 Year* HARVEST*STUBBLE 0.4200
In 2007, harvest interval had a significant effect on total DM yield (P ≤ 0.01); increasing
linearly from 7.3 Mg ha-1 under 21- and 24-d harvests to 10.8 Mg ha-1 for the 35-d interval
(Table 3-4). Stubble height also had a significant effect on DM yield during this year (P =
0.05), with the 8-cm height producing ~9% more DM ha-1 than the 16-cm stubble, at 8.8
and 8.1 Mg DM ha-1, respectively. In 2008, harvest interval had a significant effect on total
DM yield (P ≤ 0.01), increasing from 6.4 to 7.4 Mg ha-1 for 21- to 27-d harvests, while 35-d
harvests presented the lowest values at 5.6 Mg ha-1. As in 2007, stubble height had a
strong effect on DM yield (P = 0.01); with the short stubble height producing 27% greater
yield than the tall stubble, at 7.3 and 5.8 Mg ha-1, respectively.
43
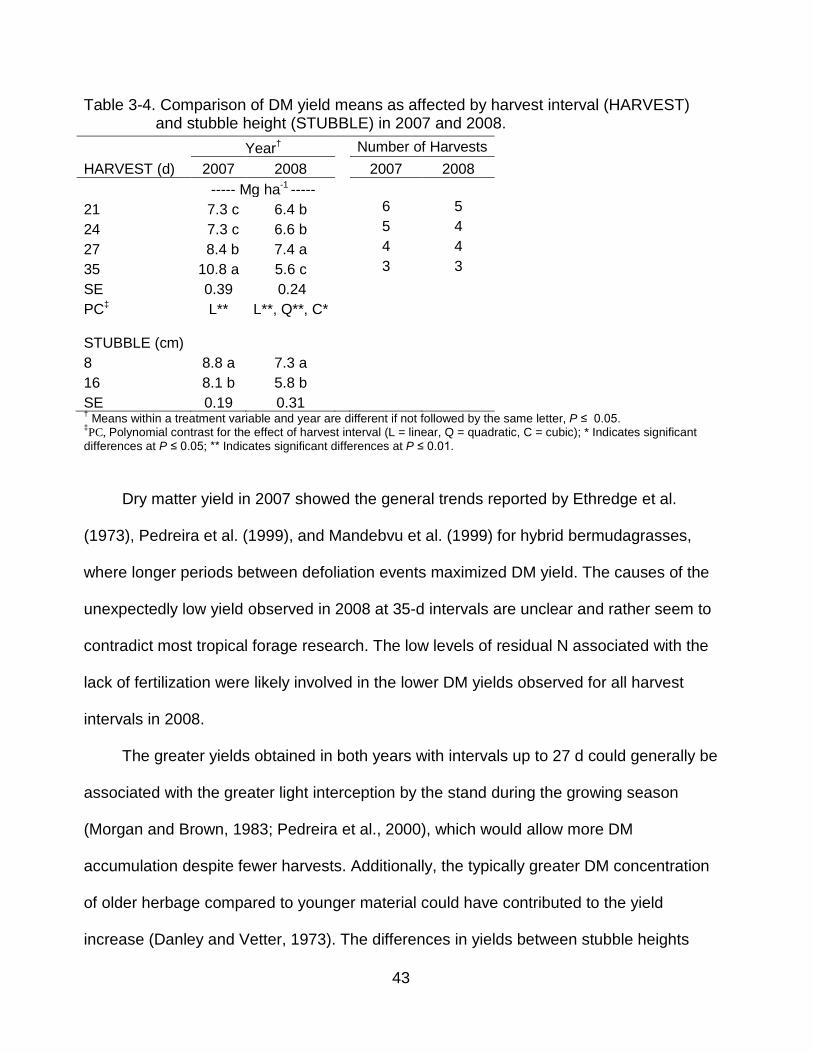
Table 3-4. Comparison of DM yield means as affected by harvest interval (HARVEST) and stubble height (STUBBLE) in 2007 and 2008.
† Means within a treatment variable and year are different if not followed by the same letter, P ≤ 0.05. ‡
PC, Polynomial contrast for the effect of harvest interval (L = linear, Q = quadratic, C = cubic); * Indicates significant differences at P ≤ 0.05; ** Indicates significant differences at P ≤ 0.01.
Dry matter yield in 2007 showed the general trends reported by Ethredge et al.
(1973), Pedreira et al. (1999), and Mandebvu et al. (1999) for hybrid bermudagrasses,
where longer periods between defoliation events maximized DM yield. The causes of the
unexpectedly low yield observed in 2008 at 35-d intervals are unclear and rather seem to
contradict most tropical forage research. The low levels of residual N associated with the
lack of fertilization were likely involved in the lower DM yields observed for all harvest
intervals in 2008.
The greater yields obtained in both years with intervals up to 27 d could generally be
associated with the greater light interception by the stand during the growing season
(Morgan and Brown, 1983; Pedreira et al., 2000), which would allow more DM
accumulation despite fewer harvests. Additionally, the typically greater DM concentration
of older herbage compared to younger material could have contributed to the yield
increase (Danley and Vetter, 1973). The differences in yields between stubble heights
Year † Number of Harvests HARVEST (d) 2007 2008 2007 2008 ----- Mg ha-1 ----- 21 7.3 c 6.4 b 6 5 24 7.3 c 6.6 b 5 4 27 8.4 b 7.4 a 4 4 35 10.8 a 5.6 c 3 3 SE 0.39 0.24 PC L** ‡ L**, Q**, C* STUBBLE (cm)
8 8.8 a 7.3 a 16 8.1 b 5.8 b SE 0.19 0.31
44
also follow the trends described in studies across different hybrid bermudagrasses, which
suggest that leaving shorter residual stubble heights after defoliation results in greater
yields throughout the year (Holt and Lancaster, 1968; Ethredge et al., 1973).
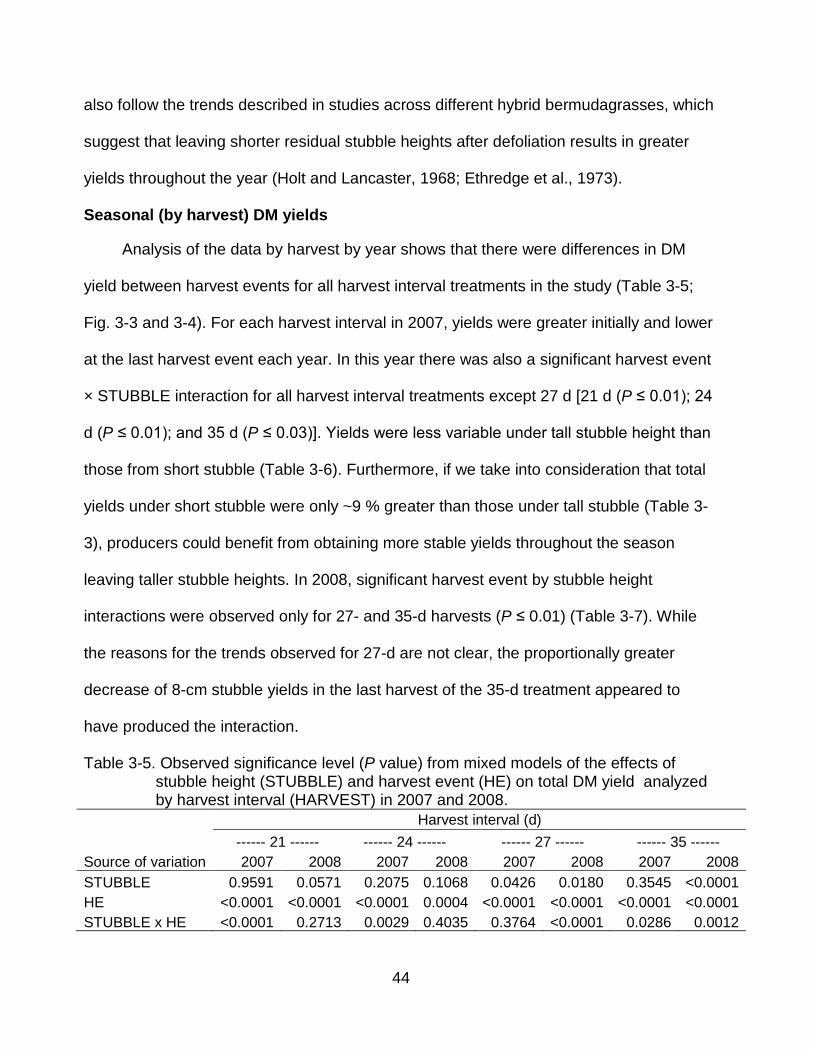
Seasonal (by harvest) DM yields
Analysis of the data by harvest by year shows that there were differences in DM
yield between harvest events for all harvest interval treatments in the study (Table 3-5;
Fig. 3-3 and 3-4). For each harvest interval in 2007, yields were greater initially and lower
at the last harvest event each year. In this year there was also a significant harvest event
× STUBBLE interaction for all harvest interval treatments except 27 d [21 d (P ≤ 0.01); 24
d (P ≤ 0.01); and 35 d (P ≤ 0.03)]. Yields were less variable under tall stubble height than
those from short stubble (Table 3-6). Furthermore, if we take into consideration that total
yields under short stubble were only ~9 % greater than those under tall stubble (Table 3-
3), producers could benefit from obtaining more stable yields throughout the season
leaving taller stubble heights. In 2008, significant harvest event by stubble height
interactions were observed only for 27- and 35-d harvests (P ≤ 0.01) (Table 3-7). While
the reasons for the trends observed for 27-d are not clear, the proportionally greater
decrease of 8-cm stubble yields in the last harvest of the 35-d treatment appeared to
have produced the interaction.
Table 3-5. Observed significance level (P value) from mixed models of the effects of stubble height (STUBBLE) and harvest event (HE) on total DM yield analyzed by harvest interval (HARVEST) in 2007 and 2008.
Harvest interval (d) ------ 21 ------ ------ 24 ------ ------ 27 ------ ------ 35 ------ Source of variation 2007 2008 2007 2008 2007 2008 2007 2008 STUBBLE 0.9591 0.0571 0.2075 0.1068 0.0426 0.0180 0.3545 <0.0001 HE <0.0001 <0.0001 <0.0001 0.0004 <0.0001 <0.0001 <0.0001 <0.0001 STUBBLE x HE <0.0001 0.2713 0.0029 0.4035 0.3764 <0.0001 0.0286 0.0012
45
0
1
2
3
4
5
6
1 2 3 4 5 6
DM
yie
ld (M
g ha
-1)
21 d
Short
Tall
††
0
1
2
3
4
5
6
1 2 3 4 5
24 d
Short
Tall†
††
0
1
2
3
4
5
6
1 2 3 4
DM
yie
ld (M
g ha
-1)
Harvest
27 d
ab
c c
0
1
2
3
4
5
6
1 2 3
Harvest
35 d
Short
Tall†
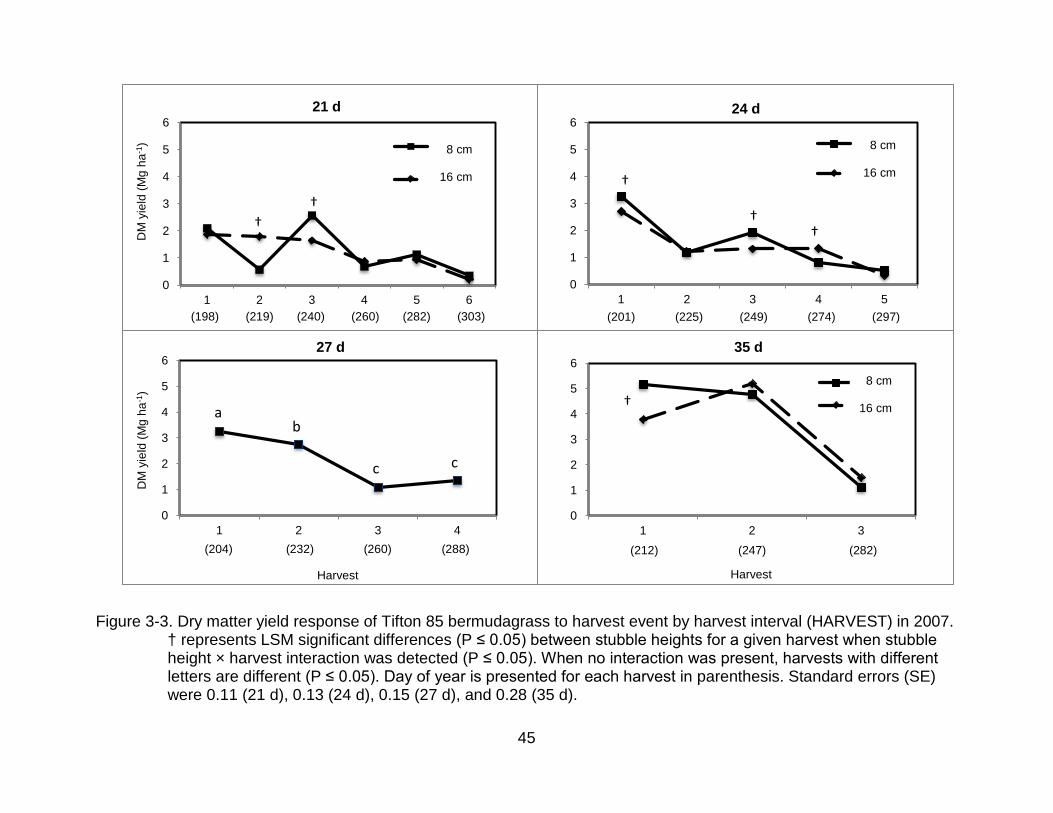
Figure 3-3. Dry matter yield response of Tifton 85 bermudagrass to harvest event by harvest interval (HARVEST) in 2007. † represents LSM significant differences (P ≤ 0.05) between stubble heights for a given harvest when stubble height × harvest interaction was detected (P ≤ 0.05). When no interaction was present, harvests with different letters are different (P ≤ 0.05). Day of year is presented for each harvest in parenthesis. Standard errors (SE) were 0.11 (21 d), 0.13 (24 d), 0.15 (27 d), and 0.28 (35 d).
(198) (219) (240) (260) (282) (303)
(212) (247) (282)
(201) (225) (249) (274) (297)
(204) (232) (260) (288)
8 cm 16 cm
8 cm 16 cm
8 cm 16 cm
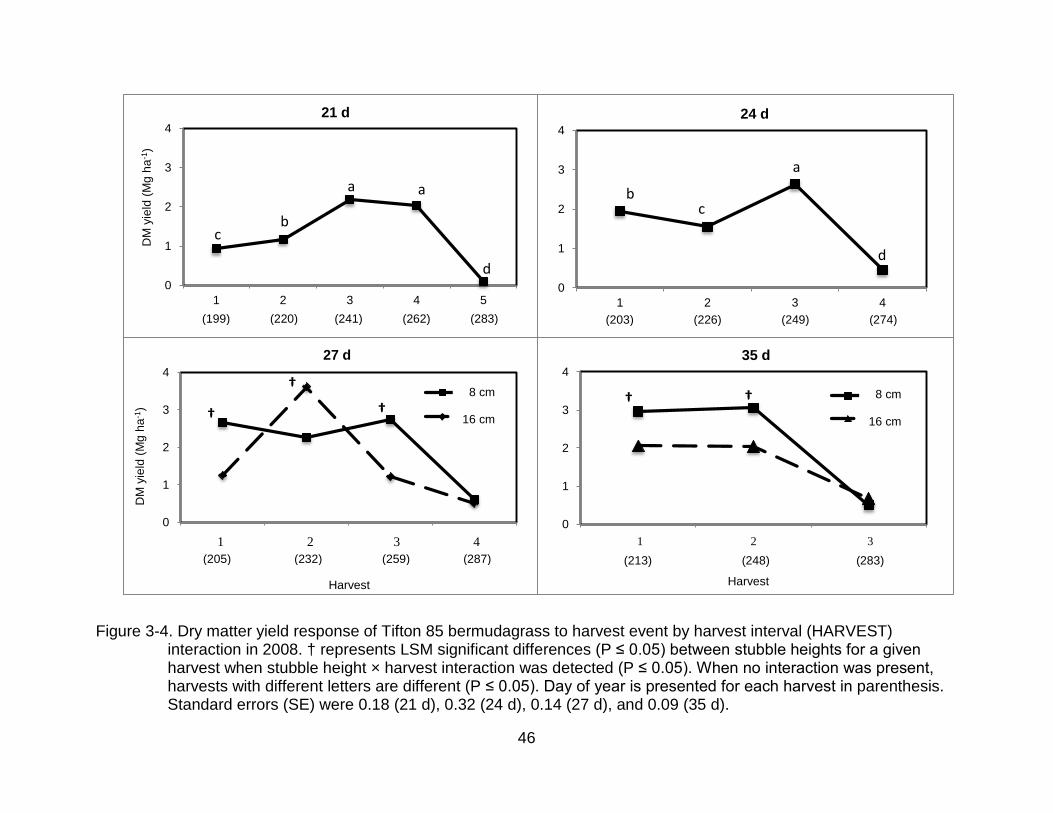
46
0
1
2
3
4
1 2 3 4 5
DM
yie
ld (M
g ha
-1)
21 d
a
bc
d
a
0
1
2
3
4
27 54 81 108
DM
yie
ld (M
g ha
-1)
Harvest
27 d
Short
Tall
1 2 3 4
†
†
†
0
1
2
3
4
1 2 3 4
24 d
a
bc
d
0
1
2
3
4
35 70 105
Harvest
35 d
Short
Tall
1 2 3
† †
Figure 3-4. Dry matter yield response of Tifton 85 bermudagrass to harvest event by harvest interval (HARVEST) interaction in 2008. † represents LSM significant differences (P ≤ 0.05) between stubble heights for a given harvest when stubble height × harvest interaction was detected (P ≤ 0.05). When no interaction was present, harvests with different letters are different (P ≤ 0.05). Day of year is presented for each harvest in parenthesis. Standard errors (SE) were 0.18 (21 d), 0.32 (24 d), 0.14 (27 d), and 0.09 (35 d).
(199) (220) (241) (262) (283) (203) (226) (249) (274)
(205) (232) (259) (287) (213) (248) (283)
8 cm 16 cm
8 cm 16 cm
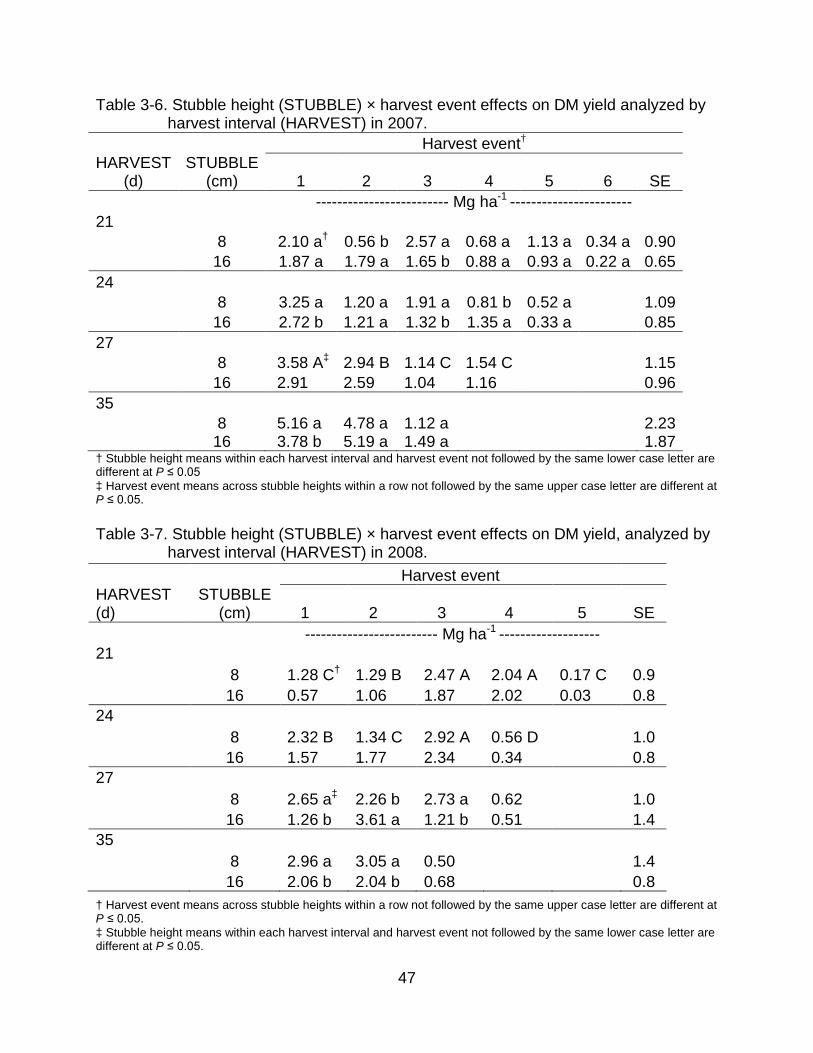
47
Table 3-6. Stubble height (STUBBLE) × harvest event effects on DM yield analyzed by harvest interval (HARVEST) in 2007.
Harvest event† HARVEST
(d) STUBBLE
(cm) 1 2 3 4 5 6 SE ------------------------- Mg ha-1 ----------------------- 21 8 2.10 a 0.56 b † 2.57 a 0.68 a 1.13 a 0.34 a 0.90 16 1.87 a 1.79 a 1.65 b 0.88 a 0.93 a 0.22 a 0.65 24 8 3.25 a 1.20 a 1.91 a 0.81 b 0.52 a 1.09 16 2.72 b 1.21 a 1.32 b 1.35 a 0.33 a 0.85 27 8 3.58 A 2.94 B ‡ 1.14 C 1.54 C 1.15 16 2.91 2.59 1.04 1.16 0.96 35 8 5.16 a 4.78 a 1.12 a 2.23 16 3.78 b 5.19 a 1.49 a 1.87 † Stubble height means within each harvest interval and harvest event not followed by the same lower case letter are different at P ≤ 0.05 ‡ Harvest event means across stubble heights within a row not followed by the same upper case letter are different at P ≤ 0.05. Table 3-7. Stubble height (STUBBLE) × harvest event effects on DM yield, analyzed by
harvest interval (HARVEST) in 2008.
† Harvest event means across stubble heights within a row not followed by the same upper case letter are different at P ≤ 0.05. ‡ Stubble height means within each harvest interval and harvest event not followed by the same lower case letter are different at P ≤ 0.05.
Harvest event HARVEST (d)
STUBBLE (cm) 1 2 3 4 5 SE
------------------------- Mg ha-1 ------------------- 21 8 1.28 C 1.29 B † 2.47 A 2.04 A 0.17 C 0.9 16 0.57 1.06 1.87 2.02 0.03 0.8 24 8 2.32 B 1.34 C 2.92 A 0.56 D 1.0 16 1.57 1.77 2.34 0.34 0.8 27 8 2.65 a 2.26 b ‡ 2.73 a 0.62 1.0 16 1.26 b 3.61 a 1.21 b 0.51 1.4 35 8 2.96 a 3.05 a 0.50 1.4 16 2.06 b 2.04 b 0.68 0.8
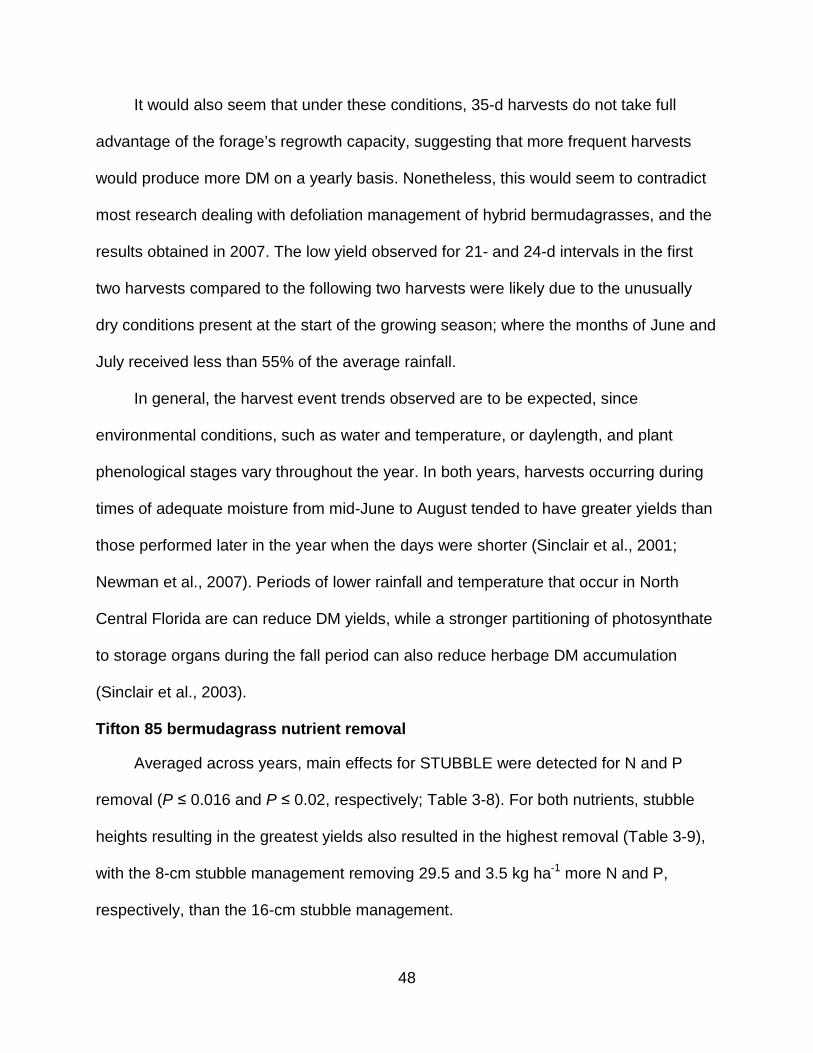
48
It would also seem that under these conditions, 35-d harvests do not take full
advantage of the forage’s regrowth capacity, suggesting that more frequent harvests
would produce more DM on a yearly basis. Nonetheless, this would seem to contradict
most research dealing with defoliation management of hybrid bermudagrasses, and the
results obtained in 2007. The low yield observed for 21- and 24-d intervals in the first
two harvests compared to the following two harvests were likely due to the unusually
dry conditions present at the start of the growing season; where the months of June and
July received less than 55% of the average rainfall.
In general, the harvest event trends observed are to be expected, since
environmental conditions, such as water and temperature, or daylength, and plant
phenological stages vary throughout the year. In both years, harvests occurring during
times of adequate moisture from mid-June to August tended to have greater yields than
those performed later in the year when the days were shorter (Sinclair et al., 2001;
Newman et al., 2007). Periods of lower rainfall and temperature that occur in North
Central Florida are can reduce DM yields, while a stronger partitioning of photosynthate
to storage organs during the fall period can also reduce herbage DM accumulation
(Sinclair et al., 2003).
Tifton 85 bermudagrass nutrient removal
Averaged across years, main effects for STUBBLE were detected for N and P
removal (P ≤ 0.016 and P ≤ 0.02, respectively; Table 3-8). For both nutrients, stubble
heights resulting in the greatest yields also resulted in the highest removal (Table 3-9),
with the 8-cm stubble management removing 29.5 and 3.5 kg ha-1
more N and P,
respectively, than the 16-cm stubble management.
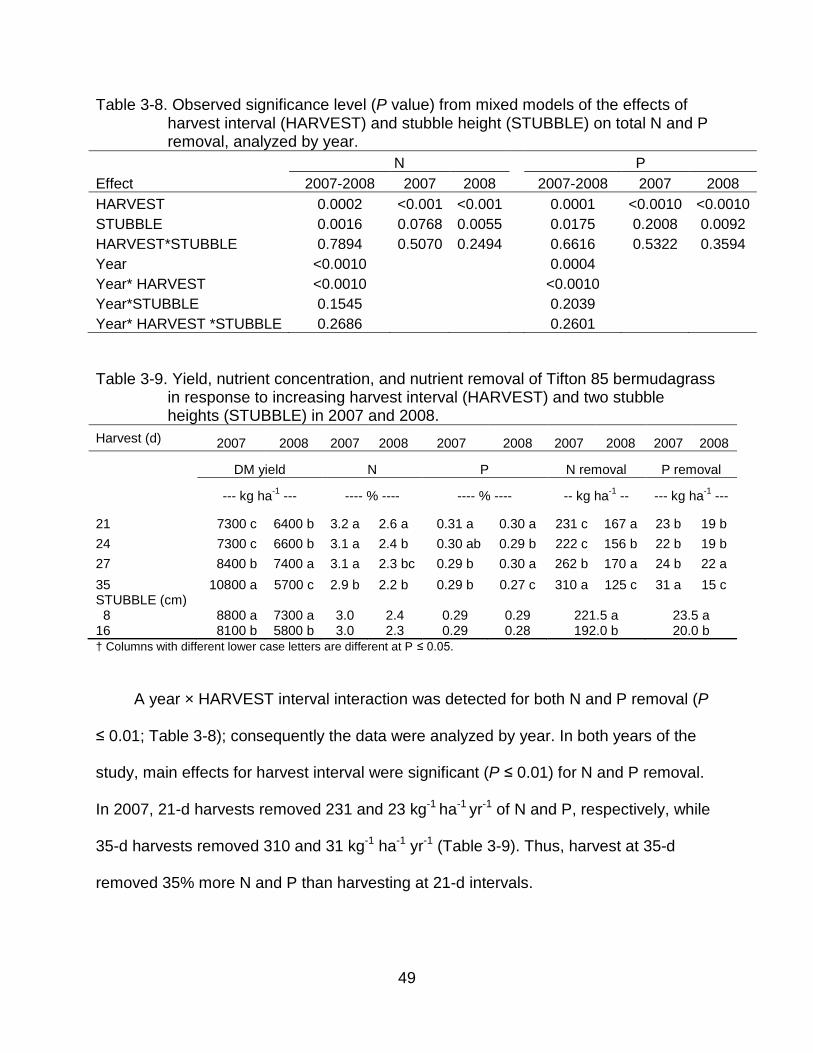
49
Table 3-8. Observed significance level (P value) from mixed models of the effects of harvest interval (HARVEST) and stubble height (STUBBLE) on total N and P removal, analyzed by year.
N P Effect 2007-2008 2007 2008 2007-2008 2007 2008 HARVEST 0.0002 <0.001 <0.001 0.0001 <0.0010 <0.0010 STUBBLE 0.0016 0.0768 0.0055 0.0175 0.2008 0.0092 HARVEST*STUBBLE 0.7894 0.5070 0.2494 0.6616 0.5322 0.3594 Year <0.0010 0.0004 Year* HARVEST <0.0010 <0.0010 Year*STUBBLE 0.1545 0.2039 Year* HARVEST *STUBBLE 0.2686 0.2601
Table 3-9. Yield, nutrient concentration, and nutrient removal of Tifton 85 bermudagrass in response to increasing harvest interval (HARVEST) and two stubble heights (STUBBLE) in 2007 and 2008.
Harvest (d) 2007 2008 2007 2008 2007 2008 2007 2008 2007 2008 DM yield N P N removal P removal --- kg ha-1 ---- % ---- --- ---- % ---- -- kg ha-1 --- kg ha -- -1 ---
21 7300 c 6400 b 3.2 a 2.6 a 0.31 a 0.30 a 231 c 167 a 23 b 19 b 24 7300 c 6600 b 3.1 a 2.4 b 0.30 ab 0.29 b 222 c 156 b 22 b 19 b 27 8400 b 7400 a 3.1 a 2.3 bc 0.29 b 0.30 a 262 b 170 a 24 b 22 a 35 10800 a 5700 c 2.9 b 2.2 b 0.29 b 0.27 c 310 a 125 c 31 a 15 c STUBBLE (cm) 8 8800 a 7300 a 3.0 2.4 0.29 0.29 221.5 a 23.5 a 16 8100 b 5800 b 3.0 2.3 0.29 0.28 192.0 b 20.0 b † Columns with different lower case letters are different at P ≤ 0.05.
A year × HARVEST interval interaction was detected for both N and P removal (P
≤ 0.01; Table 3-8); consequently the data were analyzed by year. In both years of the
study, main effects for harvest interval were significant (P ≤ 0.01) for N and P removal.
In 2007, 21-d harvests removed 231 and 23 kg-1 ha-1 yr-1 of N and P, respectively, while
35-d harvests removed 310 and 31 kg-1 ha-1 yr-1 (Table 3-9). Thus, harvest at 35-d
removed 35% more N and P than harvesting at 21-d intervals.
50
Overall, these findings coincide with previous research involving Tifton 85.
Woodard et al. (2003) studied forage systems on dairy sprayfields in North Florida and
found that Tifton 85 as a component of a corn-bermudagrass-rye forage system
removed on average 191 kg ha-1 of N in two cuttings at a 3-cm stubble. In a similar
study, Woodard et al. (2007) reported that Tifton 85 harvested four to five times as a
part of a bermudagrass-rye forage system removed 33 kg ha-1 of P from dairy manure
sprayfields receiving an average of 120 kg P ha-1 yr-1. These authors also reported that
Tifton 85 removed only an average of 8 kg P ha-1 when a component of a corn-
bermudagrass-rye system that was harvested twice during the warm season under the
same effluent rate. Brink et al. (2004) reported annual removal rates of 220 and 33 kg
ha-1 yr-1of N and P, respectively, for Tifton 85 receiving swine effluent at average rates
of 39 and 202 kg ha-1 yr-1
An important consideration when studying the phytoremediation potential of forage
grasses is the proportion of nutrients applied that were removed in the herbage. When
the amounts of solid manure and manure irrigation water applied during the 2007
growing season are taken into consideration, 35-d harvests extracted 22% of P and
approximately 2.1 times as much N as was applied. Although the nutrient application
data does not take into consideration the amounts already available in the soil from
previous applications, the results highlight the potentially benefits of using Tifton 85
bermudagrass for excess nutrient extraction.
of P and N, respectively. A common conclusion from these
studies is that forages with greater DM yields typically removed the most nutrients from
sprayfields.
51
Weed assessment
Summer weed count data taken on each plot during the 2008 season proved
insufficient for further statistical analysis, since very little weed presence was detected.
The few observations recorded did not follow any discernible harvest interval or stubble
height pattern. Nevertheless, a plot weed coverage estimation conducted in winter (5
Mar. 2009) revealed that experimental units under the short stubble height had on
average 48 ± 16% weed cover, compared to plots with a taller stubble which had 17±
6.9% weed cover. Main species present included cudweed (Gnaphalium sp.), golden
rod (Solidago sp.) and an unidentified broadleaf in the Brassica genus.
Summary and Conclusions
These results
suggests that the lower residual leaf coverage in plots of shorter stubble height likely
allowed more light penetration, increasing the number of weeds germinating from seed.
This highlights another potential benefit of harvesting Tifton 85 at higher stubble, since
less weed coverage could lead to fewer herbicide applications, as well as overall
greater yields and nutritive value.
Tifton 85 bermudagrass is considered a high quality warm-season grass for
livestock production in the Southeast USA. It has been known to produce greater DM
yield than other widely grown hybrid bermudagrasses under various environmental and
management conditions. Results from the defoliation management trial that tested the
effects of harvest interval (21, 24, 27, and 35 d) and stubble height (8 and 16 cm) on
herbage DM yield lead to the following conclusions:
Under 2007 conditions, total yields were consistently greater as the interval
increased from 21 and 24 d to 35 d, suggesting that longer periods between harvests
maximize total DM yields. In 2008, overall yields were probably affected by water stress
52
and lack of N fertilization, and presented unusually low yields for the 35-d harvest
interval. Across years, the short stubble height produced more DM than the tall level,
although this difference was considerably more pronounced under the water and N-
restricted conditions in 2008.
In terms of seasonality of DM production, in both years greater yields were
typically present when environmental conditions were most conducive to vegetative
growth, particularly in terms of water availability. In 2007, harvest event × stubble height
interactions were present for all but the 27-d level, and while significant differences were
found between stubble heights for a given harvest, these were usually not of great
magnitude. In addition, tall stubble management tended to result in more consistent
yields throughout the season, possibly suggesting a management that may be more
beneficial for producers, because of the dependability of yields. In addition, the lower
stubble management could hinder persistence through multiple growing seasons due to
the high incidence of weeds observed during winter. In 2008, interactions between
harvest interval and stubble height were observed only for 27- and 35-d harvests. While
the causes of the unusual fluctuations in yields during the initial harvests under 27 d are
not clear, they are likely due to the differential effects of water stress and low soil N
levels on the treatments.
Patterns of removal N and P followed that of DM yield patterns in both years.
While no significant harvest interval × stubble height interactions were detected, harvest
interval by year interactions were detected for N and P removal. The 35- and 27-d
harvests removed the most N and P in 2007 and 2008, respectively. Stubble height
main effects were found for both N and P removal, with the short stubble removing 29.5
53
and 3.5 kg ha-1
Overall, the results suggest that both harvest interval and stubble affect DM yields
and soil nutrient removal of Tifton 85 bermudagrass. While longer intervals and shorter
stubble heights seem to increase DM production and excess soil nutrient removal, using
taller stubble heights in North Central Florida conditions may be necessary in order to
guarantee stand persistence.
more N and P, respectively, than the taller stubble. In addition, 35-d
harvests in 2007 removed 22% of applied P and 2.1 times as much N as was applied in
either manure or manure irrigation water, suggesting that Tifton 85 can be a an
important tool for phytoremediation in dairy sprayfields.
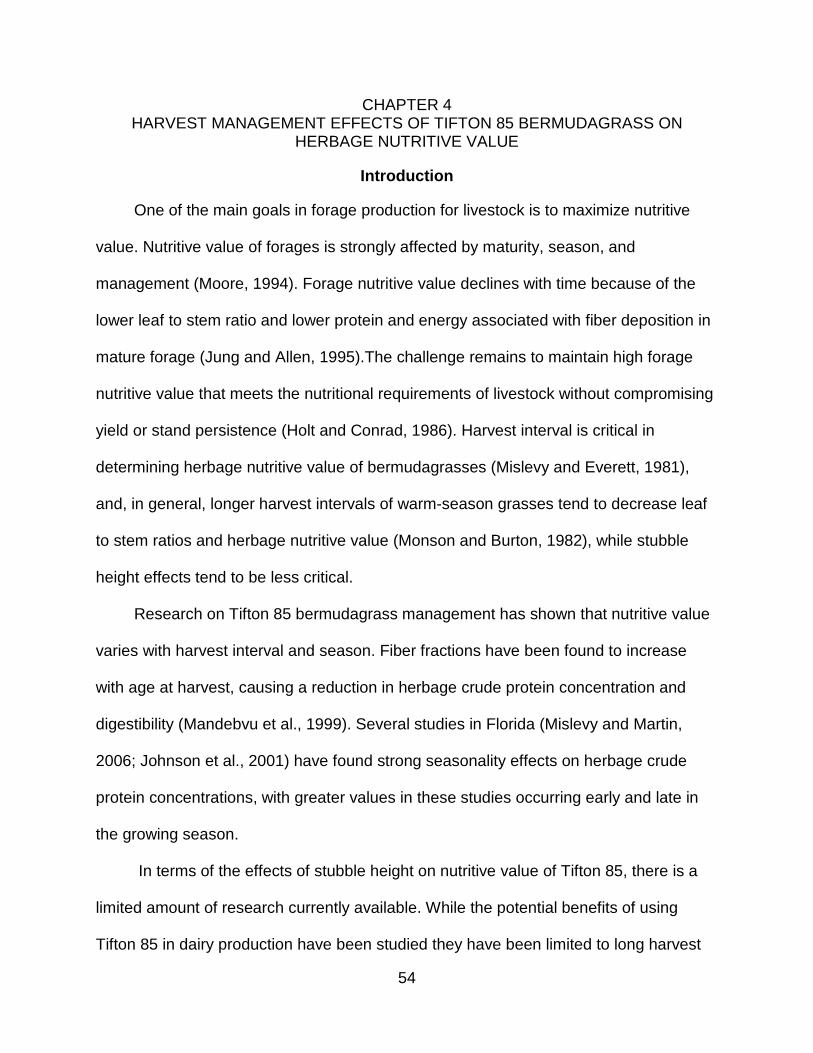
54
CHAPTER 4 HARVEST MANAGEMENT EFFECTS OF TIFTON 85 BERMUDAGRASS ON
HERBAGE NUTRITIVE VALUE
Introduction
One of the main goals in forage production for livestock is to maximize nutritive
value. Nutritive value of forages is strongly affected by maturity, season, and
management (Moore, 1994). Forage nutritive value declines with time because of the
lower leaf to stem ratio and lower protein and energy associated with fiber deposition in
mature forage (Jung and Allen, 1995).The challenge remains to maintain high forage
nutritive value that meets the nutritional requirements of livestock without compromising
yield or stand persistence (Holt and Conrad, 1986). Harvest interval is critical in
determining herbage nutritive value of bermudagrasses (Mislevy and Everett, 1981),
and, in general, longer harvest intervals of warm-season grasses tend to decrease leaf
to stem ratios and herbage nutritive value (Monson and Burton, 1982), while stubble
height effects tend to be less critical.
Research on Tifton 85 bermudagrass management has shown that nutritive value
varies with harvest interval and season. Fiber fractions have been found to increase
with age at harvest, causing a reduction in herbage crude protein concentration and
digestibility (Mandebvu et al., 1999). Several studies in Florida (Mislevy and Martin,
2006; Johnson et al., 2001) have found strong seasonality effects on herbage crude
protein concentrations, with greater values in these studies occurring early and late in
the growing season.
In terms of the effects of stubble height on nutritive value of Tifton 85, there is a
limited amount of research currently available. While the potential benefits of using
Tifton 85 in dairy production have been studied they have been limited to long harvest
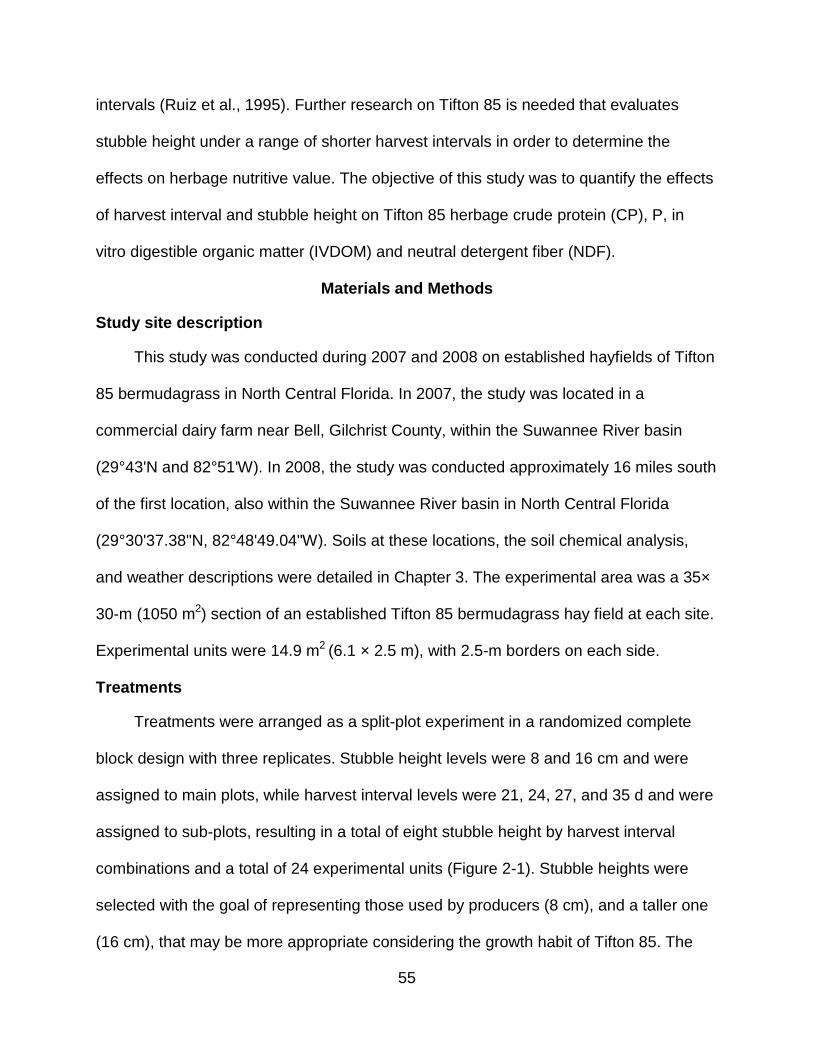
55
intervals (Ruiz et al., 1995). Further research on Tifton 85 is needed that evaluates
stubble height under a range of shorter harvest intervals in order to determine the
effects on herbage nutritive value. The objective of this study was to quantify the effects
of harvest interval and stubble height on Tifton 85 herbage crude protein (CP), P, in
vitro digestible organic matter (IVDOM) and neutral detergent fiber (NDF).
Materials and Methods
Study site description
This study was conducted during 2007 and 2008 on established hayfields of Tifton
85 bermudagrass in North Central Florida. In 2007, the study was located in a
commercial dairy farm near Bell, Gilchrist County, within the Suwannee River basin
(29°43'N and 82°51'W). In 2008, the study was conducted approximately 16 miles south
of the first location, also within the Suwannee River basin in North Central Florida
(29°30'37.38"N, 82°48'49.04"W). Soils at these locations, the soil chemical analysis,
and weather descriptions were detailed in Chapter 3. The experimental area was a 35×
30-m (1050 m2) section of an established Tifton 85 bermudagrass hay field at each site.
Experimental units were 14.9 m2
Treatments
(6.1 × 2.5 m), with 2.5-m borders on each side.
Treatments were arranged as a split-plot experiment in a randomized complete
block design with three replicates. Stubble height levels were 8 and 16 cm and were
assigned to main plots, while harvest interval levels were 21, 24, 27, and 35 d and were
assigned to sub-plots, resulting in a total of eight stubble height by harvest interval
combinations and a total of 24 experimental units (Figure 2-1). Stubble heights were
selected with the goal of representing those used by producers (8 cm), and a taller one
(16 cm), that may be more appropriate considering the growth habit of Tifton 85. The
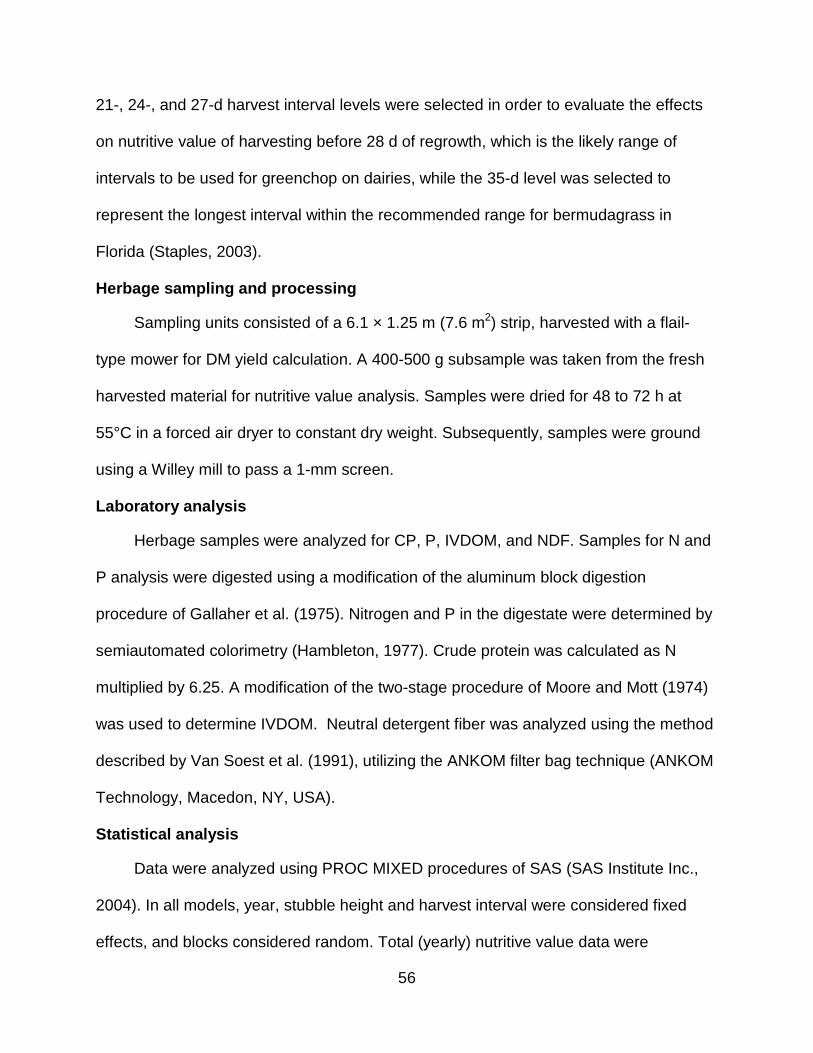
56
21-, 24-, and 27-d harvest interval levels were selected in order to evaluate the effects
on nutritive value of harvesting before 28 d of regrowth, which is the likely range of
intervals to be used for greenchop on dairies, while the 35-d level was selected to
represent the longest interval within the recommended range for bermudagrass in
Florida (Staples, 2003).
Herbage sampling and processing
Sampling units consisted of a 6.1 × 1.25 m (7.6 m2
Laboratory analysis
) strip, harvested with a flail-
type mower for DM yield calculation. A 400-500 g subsample was taken from the fresh
harvested material for nutritive value analysis. Samples were dried for 48 to 72 h at
55°C in a forced air dryer to constant dry weight. Subsequently, samples were ground
using a Willey mill to pass a 1-mm screen.
Herbage samples were analyzed for CP, P, IVDOM, and NDF. Samples for N and
P analysis were digested using a modification of the aluminum block digestion
procedure of Gallaher et al. (1975). Nitrogen and P in the digestate were determined by
semiautomated colorimetry (Hambleton, 1977). Crude protein was calculated as N
multiplied by 6.25. A modification of the two-stage procedure of Moore and Mott (1974)
was used to determine IVDOM. Neutral detergent fiber was analyzed using the method
described by Van Soest et al. (1991), utilizing the ANKOM filter bag technique (ANKOM
Technology, Macedon, NY, USA).
Statistical analysis
Data were analyzed using PROC MIXED procedures of SAS (SAS Institute Inc.,
2004). In all models, year, stubble height and harvest interval were considered fixed
effects, and blocks considered random. Total (yearly) nutritive value data were
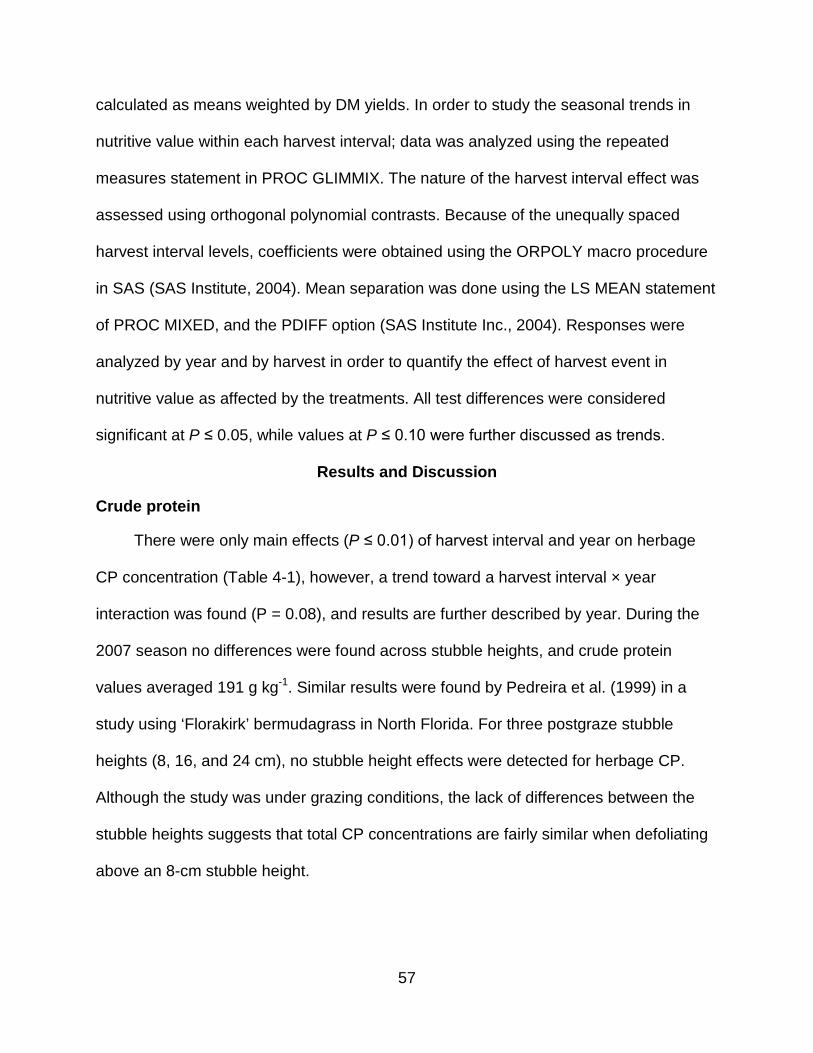
57
calculated as means weighted by DM yields. In order to study the seasonal trends in
nutritive value within each harvest interval; data was analyzed using the repeated
measures statement in PROC GLIMMIX. The nature of the harvest interval effect was
assessed using orthogonal polynomial contrasts. Because of the unequally spaced
harvest interval levels, coefficients were obtained using the ORPOLY macro procedure
in SAS (SAS Institute, 2004). Mean separation was done using the LS MEAN statement
of PROC MIXED, and the PDIFF option (SAS Institute Inc., 2004). Responses were
analyzed by year and by harvest in order to quantify the effect of harvest event in
nutritive value as affected by the treatments. All test differences were considered
significant at P ≤ 0.05, while values at P ≤ 0.10 were further discussed as trends.
Results and Discussion
Crude protein
There were only main effects (P ≤ 0.01) of harvest interval and year on herbage
CP concentration (Table 4-1), however, a trend toward a harvest interval × year
interaction was found (P = 0.08), and results are further described by year. During the
2007 season no differences were found across stubble heights, and crude protein
values averaged 191 g kg-1. Similar results were found by Pedreira et al. (1999) in a
study using ‘Florakirk’ bermudagrass in North Florida. For three postgraze stubble
heights (8, 16, and 24 cm), no stubble height effects were detected for herbage CP.
Although the study was under grazing conditions, the lack of differences between the
stubble heights suggests that total CP concentrations are fairly similar when defoliating
above an 8-cm stubble height.
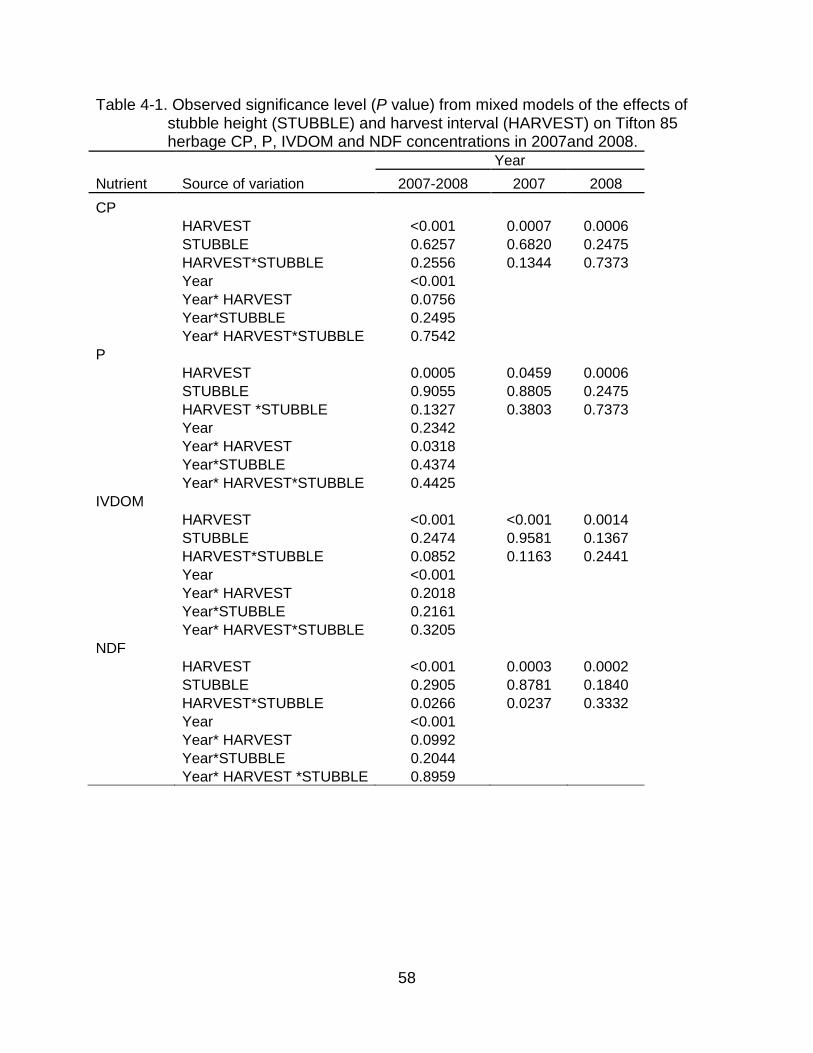
58
Table 4-1. Observed significance level (P value) from mixed models of the effects of stubble height (STUBBLE) and harvest interval (HARVEST) on Tifton 85 herbage CP, P, IVDOM and NDF concentrations in 2007and 2008.
Year Nutrient Source of variation 2007-2008 2007 2008 CP HARVEST <0.001 0.0007 0.0006 STUBBLE 0.6257 0.6820 0.2475 HARVEST*STUBBLE 0.2556 0.1344 0.7373 Year <0.001 Year* HARVEST 0.0756 Year*STUBBLE 0.2495 Year* HARVEST*STUBBLE 0.7542 P HARVEST 0.0005 0.0459 0.0006 STUBBLE 0.9055 0.8805 0.2475 HARVEST *STUBBLE 0.1327 0.3803 0.7373 Year 0.2342 Year* HARVEST 0.0318 Year*STUBBLE 0.4374 Year* HARVEST*STUBBLE 0.4425 IVDOM HARVEST <0.001 <0.001 0.0014 STUBBLE 0.2474 0.9581 0.1367 HARVEST*STUBBLE 0.0852 0.1163 0.2441 Year <0.001 Year* HARVEST 0.2018 Year*STUBBLE 0.2161 Year* HARVEST*STUBBLE 0.3205 NDF HARVEST <0.001 0.0003 0.0002 STUBBLE 0.2905 0.8781 0.1840 HARVEST*STUBBLE 0.0266 0.0237 0.3332 Year <0.001 Year* HARVEST 0.0992 Year*STUBBLE 0.2044 Year* HARVEST *STUBBLE 0.8959
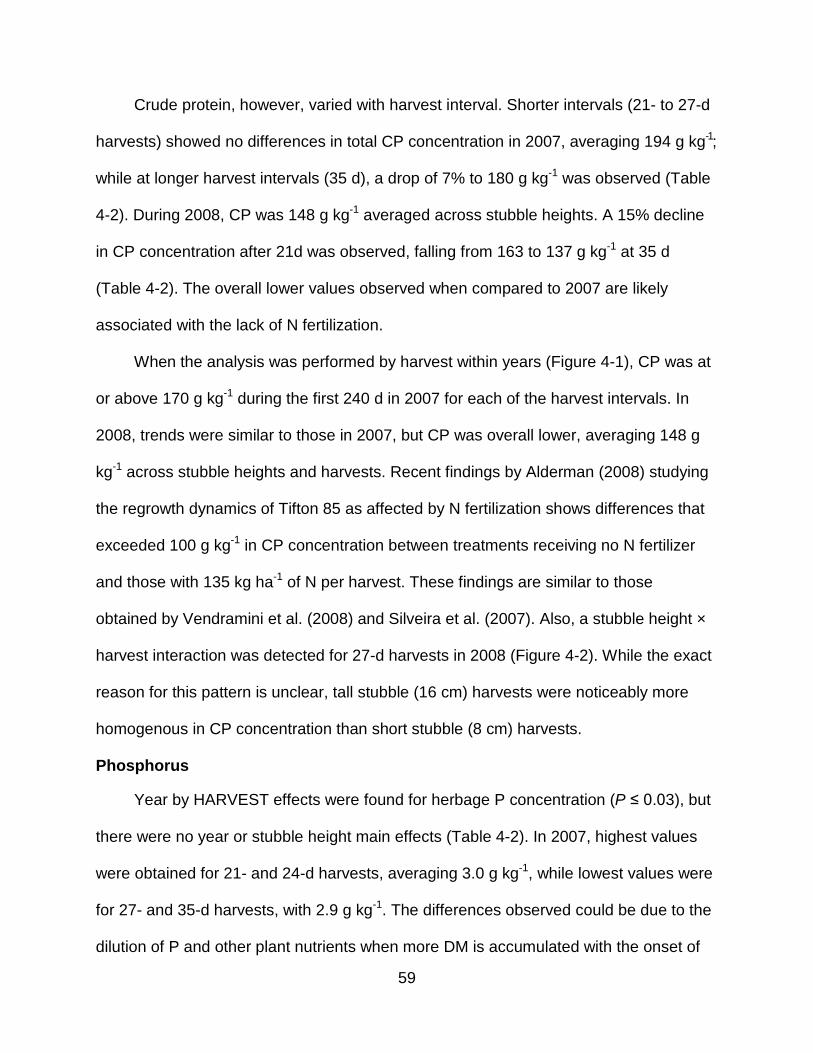
59
Crude protein, however, varied with harvest interval. Shorter intervals (21- to 27-d
harvests) showed no differences in total CP concentration in 2007, averaging 194 g kg-1;
while at longer harvest intervals (35 d), a drop of 7% to 180 g kg-1 was observed (Table
4-2). During 2008, CP was 148 g kg-1 averaged across stubble heights. A 15% decline
in CP concentration after 21d was observed, falling from 163 to 137 g kg-1
When the analysis was performed by harvest within years (Figure 4-1), CP was at
or above 170 g kg
at 35 d
(Table 4-2). The overall lower values observed when compared to 2007 are likely
associated with the lack of N fertilization.
-1 during the first 240 d in 2007 for each of the harvest intervals. In
2008, trends were similar to those in 2007, but CP was overall lower, averaging 148 g
kg-1 across stubble heights and harvests. Recent findings by Alderman (2008) studying
the regrowth dynamics of Tifton 85 as affected by N fertilization shows differences that
exceeded 100 g kg-1 in CP concentration between treatments receiving no N fertilizer
and those with 135 kg ha-1
Phosphorus
of N per harvest. These findings are similar to those
obtained by Vendramini et al. (2008) and Silveira et al. (2007). Also, a stubble height ×
harvest interaction was detected for 27-d harvests in 2008 (Figure 4-2). While the exact
reason for this pattern is unclear, tall stubble (16 cm) harvests were noticeably more
homogenous in CP concentration than short stubble (8 cm) harvests.
Year by HARVEST effects were found for herbage P concentration (P ≤ 0.03), but
there were no year or stubble height main effects (Table 4-2). In 2007, highest values
were obtained for 21- and 24-d harvests, averaging 3.0 g kg-1, while lowest values were
for 27- and 35-d harvests, with 2.9 g kg-1. The differences observed could be due to the
dilution of P and other plant nutrients when more DM is accumulated with the onset of
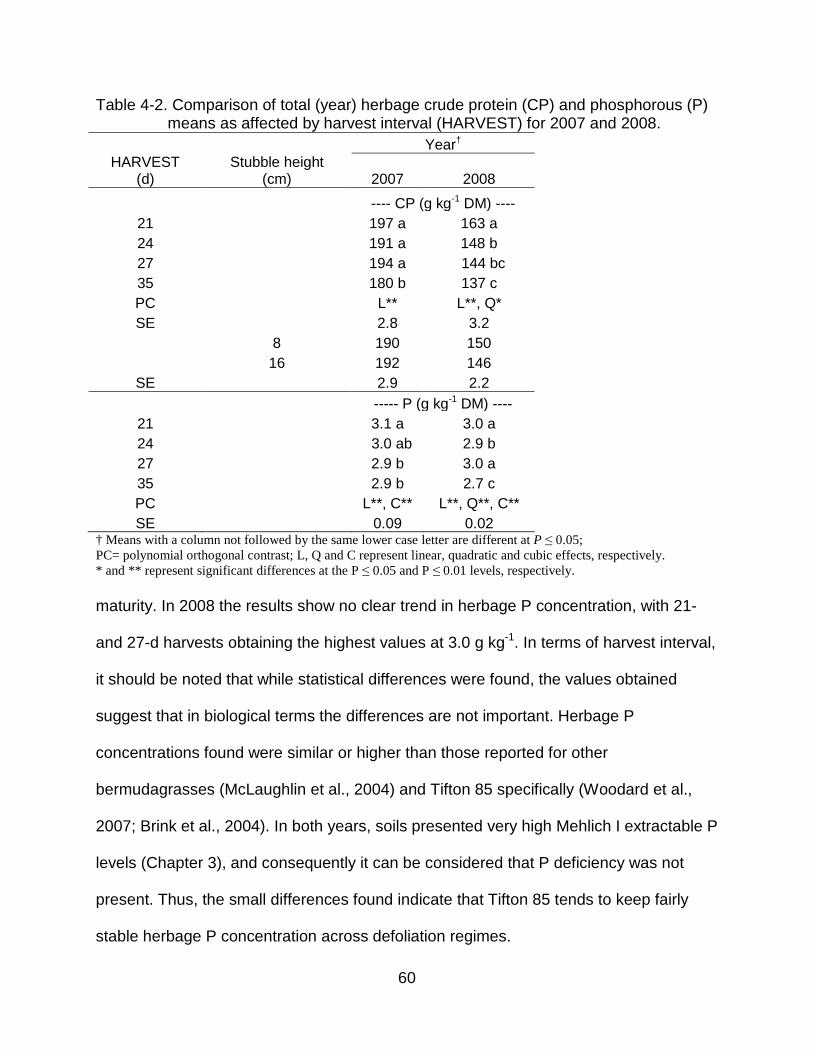
60
Table 4-2. Comparison of total (year) herbage crude protein (CP) and phosphorous (P) means as affected by harvest interval (HARVEST) for 2007 and 2008.
Year† HARVEST
(d) Stubble height
(cm) 2007 2008 ---- CP (g kg-1 DM) ----
21 197 a 163 a 24 191 a 148 b 27 194 a 144 bc 35 180 b 137 c PC L** L**, Q* SE 2.8 3.2
8 190 150 16 192 146
SE 2.9 2.2 ----- P (g kg-1 DM) ----
21 3.1 a 3.0 a 24 3.0 ab 2.9 b 27 2.9 b 3.0 a 35 2.9 b 2.7 c PC L**, C** L**, Q**, C** SE 0.09 0.02
† Means with a column not followed by the same lower case letter are different at P ≤ 0.05; PC= polynomial orthogonal contrast; L, Q and C represent linear, quadratic and cubic effects, respectively. * and ** represent significant differences at the P ≤ 0.05 and P ≤ 0.01 levels, respectively. maturity. In 2008 the results show no clear trend in herbage P concentration, with 21-
and 27-d harvests obtaining the highest values at 3.0 g kg-1. In terms of harvest interval,
it should be noted that while statistical differences were found, the values obtained
suggest that in biological terms the differences are not important. Herbage P
concentrations found were similar or higher than those reported for other
bermudagrasses (McLaughlin et al., 2004) and Tifton 85 specifically (Woodard et al.,
2007; Brink et al., 2004). In both years, soils presented very high Mehlich I extractable P
levels (Chapter 3), and consequently it can be considered that P deficiency was not
present. Thus, the small differences found indicate that Tifton 85 tends to keep fairly
stable herbage P concentration across defoliation regimes.
61
100
120
140
160
180
200
220
240
1 2 3 4
CP
(g k
g-1)
Harvest
27 d
a
bbab
100
120
140
160
180
200
220
240
1 2 3 4 5 6
CP
(g k
g-1)
21 d
aaa
bb
a
100
120
140
160
180
200
220
240
1 2 3 4 5
24 d
100
120
140
160
180
200
220
240
1 2 3
Harvest
35 d
a
b b
Figure 4-1. Crude protein (CP) response of Tifton 85 bermudagrass to harvest event by harvest interval levels in 2007. Harvests with different lower case letters are different at P ≤ 0.05. Day of year is presented for each harvest in parenthesis. Standard errors (SE) were 6.8 (21 d), 6.2 (24 d), 4.7 (27 d), and 4.4 (35 d).
(198) (219) (240) (260) (282) (303) (201) (225) (249) (274) (297)
(204) (232) (260) (288) (212) (247) (282)
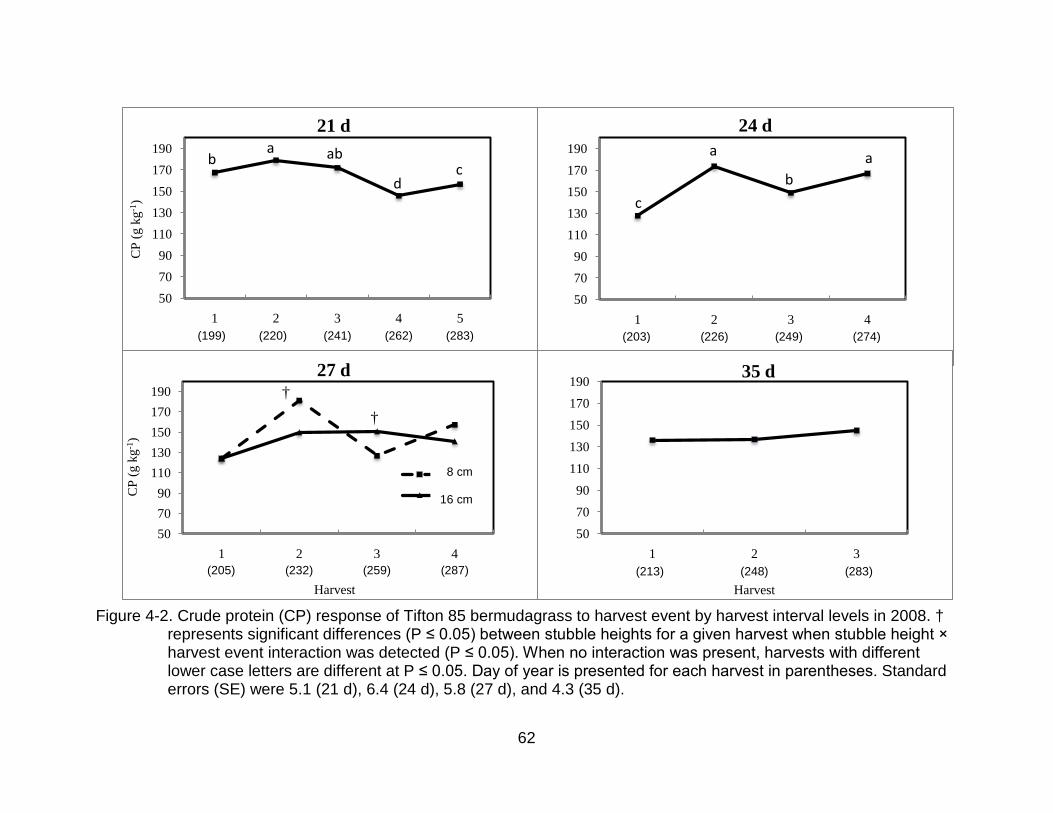
62
507090
110130150170190
1 2 3 4 5
CP
(g k
g-1)
21 d
b abac
d
507090
110130150170190
1 2 3 4
24 d
baa
c
507090
110130150170190
1 2 3 4
CP
(g k
g-1)
Harvest
27 d
Short
Tall
††
507090
110130150170190
1 2 3
Harvest
35 d
Figure 4-2. Crude protein (CP) response of Tifton 85 bermudagrass to harvest event by harvest interval levels in 2008. † represents significant differences (P ≤ 0.05) between stubble heights for a given harvest when stubble height × harvest event interaction was detected (P ≤ 0.05). When no interaction was present, harvests with different lower case letters are different at P ≤ 0.05. Day of year is presented for each harvest in parentheses. Standard errors (SE) were 5.1 (21 d), 6.4 (24 d), 5.8 (27 d), and 4.3 (35 d).
(199) (220) (241) (262) (283) (203) (226) (249) (274)
(205) (232) (259) (287) (213) (248) (283)
8 cm 16 cm
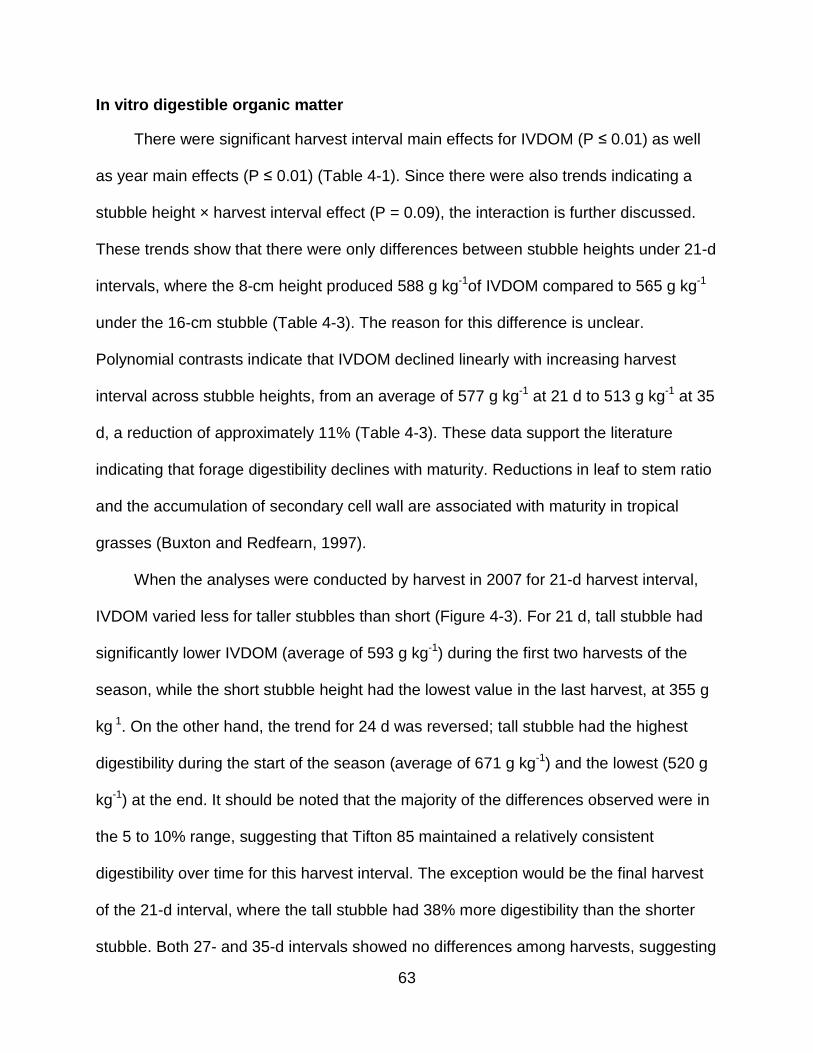
63
In vitro digestible organic matter
There were significant harvest interval main effects for IVDOM (P ≤ 0.01) as well
as year main effects (P ≤ 0.01) (Table 4-1). Since there were also trends indicating a
stubble height × harvest interval effect (P = 0.09), the interaction is further discussed.
These trends show that there were only differences between stubble heights under 21-d
intervals, where the 8-cm height produced 588 g kg-1of IVDOM compared to 565 g kg-1
under the 16-cm stubble (Table 4-3). The reason for this difference is unclear.
Polynomial contrasts indicate that IVDOM declined linearly with increasing harvest
interval across stubble heights, from an average of 577 g kg-1 at 21 d to 513 g kg-1
When the analyses were conducted by harvest in 2007 for 21-d harvest interval,
IVDOM varied less for taller stubbles than short (Figure 4-3). For 21 d, tall stubble had
significantly lower IVDOM (average of 593 g kg
at 35
d, a reduction of approximately 11% (Table 4-3). These data support the literature
indicating that forage digestibility declines with maturity. Reductions in leaf to stem ratio
and the accumulation of secondary cell wall are associated with maturity in tropical
grasses (Buxton and Redfearn, 1997).
-1) during the first two harvests of the
season, while the short stubble height had the lowest value in the last harvest, at 355 g
kg 1. On the other hand, the trend for 24 d was reversed; tall stubble had the highest
digestibility during the start of the season (average of 671 g kg-1) and the lowest (520 g
kg-1) at the end. It should be noted that the majority of the differences observed were in
the 5 to 10% range, suggesting that Tifton 85 maintained a relatively consistent
digestibility over time for this harvest interval. The exception would be the final harvest
of the 21-d interval, where the tall stubble had 38% more digestibility than the shorter
stubble. Both 27- and 35-d intervals showed no differences among harvests, suggesting
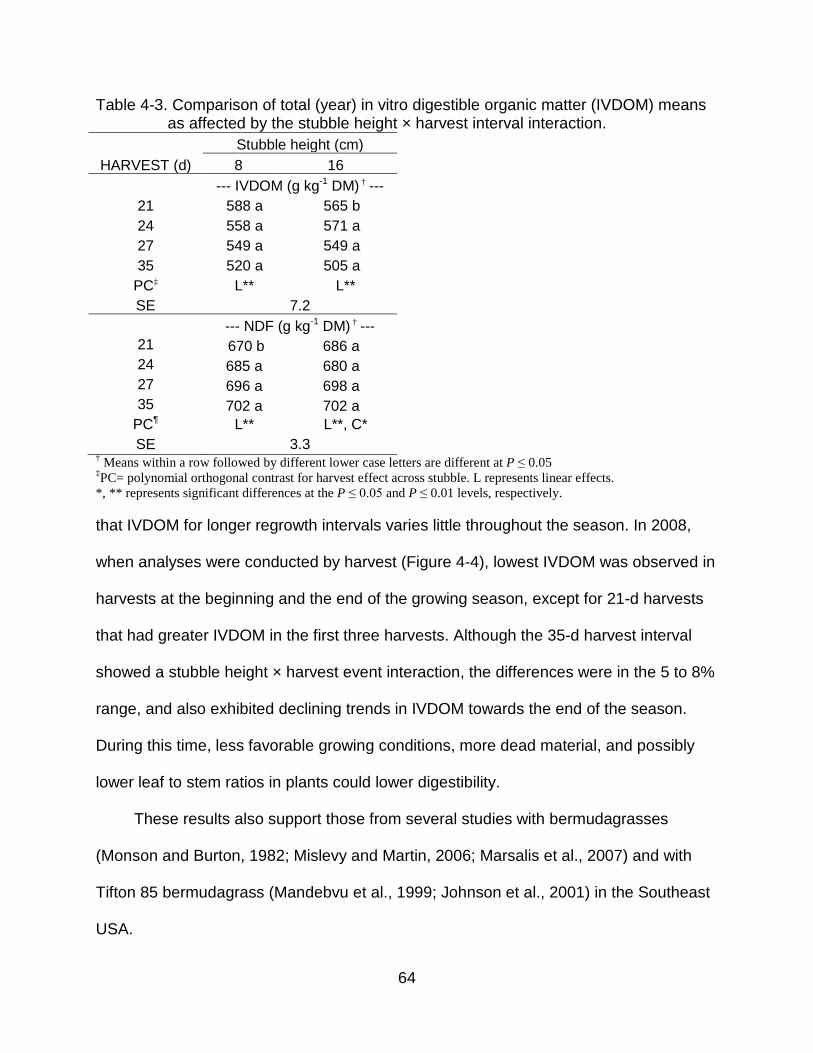
64
Table 4-3. Comparison of total (year) in vitro digestible organic matter (IVDOM) means as affected by the stubble height × harvest interval interaction.
Stubble height (cm) HARVEST (d) 8 16
--- IVDOM (g kg-1 DM) † --- 21 588 a 565 b 24 558 a 571 a 27 549 a 549 a 35 520 a 505 a
PC L** ‡ L** SE 7.2
--- NDF (g kg-1 DM) † --- 21 670 b 686 a 24 685 a 680 a 27 696 a 698 a 35 702 a 702 a
PC L** ¶ L**, C* SE 3.3
† Means within a row followed by different lower case letters are different at P ≤ 0.05 ‡
*, ** represents significant differences at the P ≤ 0.05 and P ≤ 0.01 levels, respectively. PC= polynomial orthogonal contrast for harvest effect across stubble. L represents linear effects.
that IVDOM for longer regrowth intervals varies little throughout the season. In 2008,
when analyses were conducted by harvest (Figure 4-4), lowest IVDOM was observed in
harvests at the beginning and the end of the growing season, except for 21-d harvests
that had greater IVDOM in the first three harvests. Although the 35-d harvest interval
showed a stubble height × harvest event interaction, the differences were in the 5 to 8%
range, and also exhibited declining trends in IVDOM towards the end of the season.
During this time, less favorable growing conditions, more dead material, and possibly
lower leaf to stem ratios in plants could lower digestibility.
These results also support those from several studies with bermudagrasses
(Monson and Burton, 1982; Mislevy and Martin, 2006; Marsalis et al., 2007) and with
Tifton 85 bermudagrass (Mandebvu et al., 1999; Johnson et al., 2001) in the Southeast
USA.
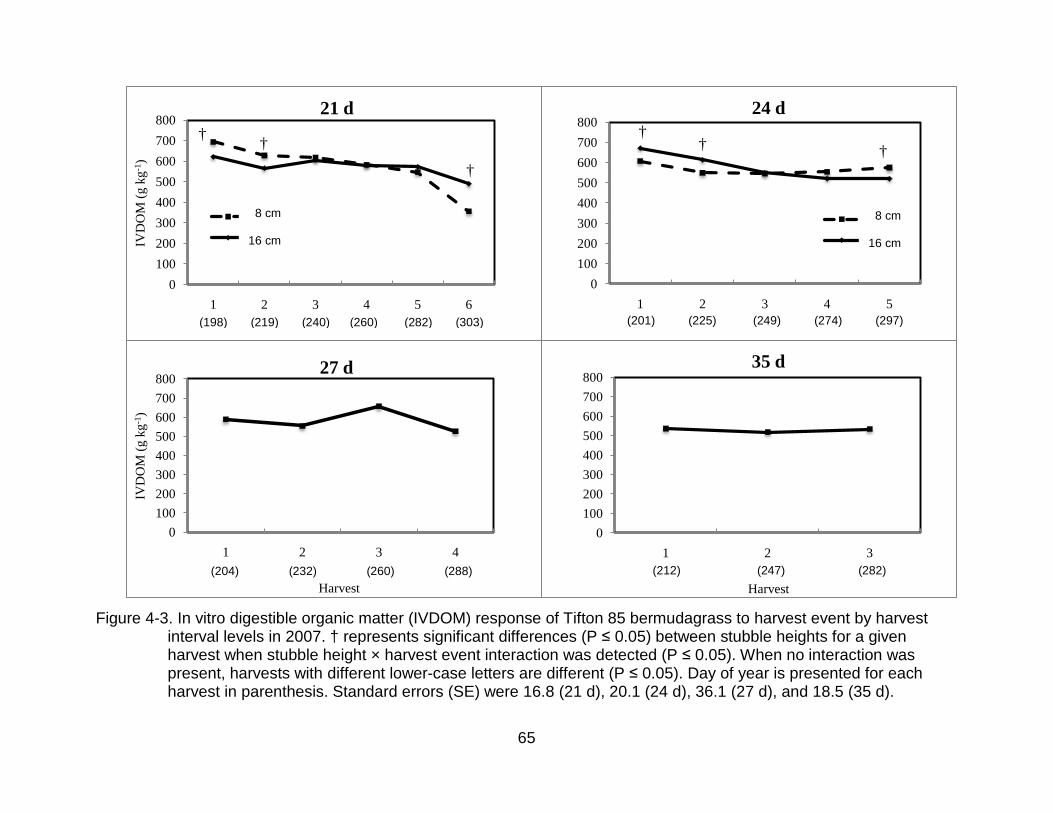
65
0100200300400500600700800
1 2 3 4 5 6
IVD
OM
(g k
g-1)
21 d
Short
Tall
† †
†
0100200300400500600700800
1 2 3 4
IVD
OM
(g k
g-1)
Harvest
27 d
0100200300400500600700800
1 2 3 4 5
24 d
Short
Tall
††
†
0100200300400500600700800
1 2 3
Harvest
35 d
Figure 4-3. In vitro digestible organic matter (IVDOM) response of Tifton 85 bermudagrass to harvest event by harvest interval levels in 2007. † represents significant differences (P ≤ 0.05) between stubble heights for a given harvest when stubble height × harvest event interaction was detected (P ≤ 0.05). When no interaction was present, harvests with different lower-case letters are different (P ≤ 0.05). Day of year is presented for each harvest in parenthesis. Standard errors (SE) were 16.8 (21 d), 20.1 (24 d), 36.1 (27 d), and 18.5 (35 d).
(198) (219) (240) (260) (282) (303) (201) (225) (249) (274) (297)
(204) (232) (260) (288) (212) (247) (282)
8 cm 16 cm
8 cm 16 cm
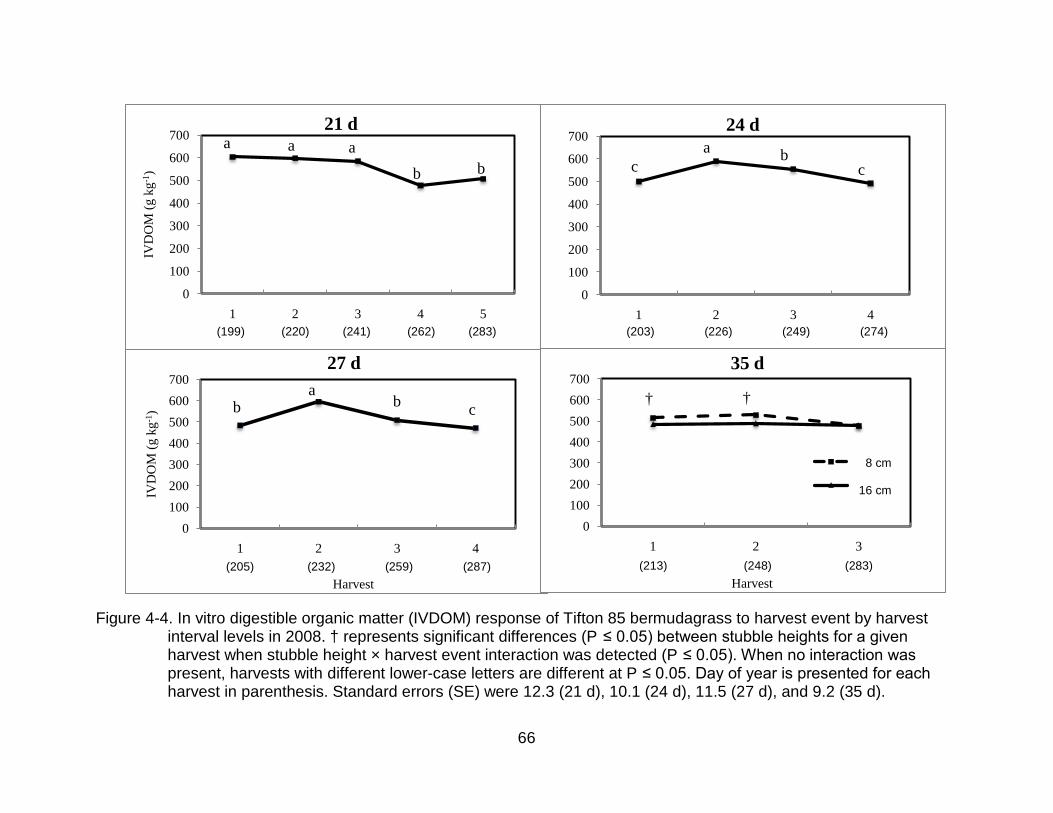
66
0
100
200
300
400
500
600
700
1 2 3 4 5
IVD
OM
(g k
g-1)
21 da aa
b b
0
100
200
300
400
500
600
700
1 2 3 4
24 da b
c c
0100200300400500600700
1 2 3 4
IVD
OM
(g k
g-1)
Harvest
27 da
bb c
0100200300400500600700
1 2 3
Harvest
35 d
Short
Tall
††
Figure 4-4. In vitro digestible organic matter (IVDOM) response of Tifton 85 bermudagrass to harvest event by harvest interval levels in 2008. † represents significant differences (P ≤ 0.05) between stubble heights for a given harvest when stubble height × harvest event interaction was detected (P ≤ 0.05). When no interaction was present, harvests with different lower-case letters are different at P ≤ 0.05. Day of year is presented for each harvest in parenthesis. Standard errors (SE) were 12.3 (21 d), 10.1 (24 d), 11.5 (27 d), and 9.2 (35 d).
(199) (220) (241) (262) (283) (203) (226) (249) (274)
(205) (232) (259) (287) (213) (248) (283)
8 cm 16 cm
67
Neutral detergent fiber
Fiber concentration measured by NDF presented stubble height × harvest interval
interaction effects (P ≤ 0.03). Neutral detergent fiber was 16 units greater for the 16 cm
than the 8 cm stubble height at 21 d (Table 4-3). No differences were observed among
stubble heights for all other harvest intervals in the study. Polynomial contrasts across
stubble heights suggest that NDF concentration increases with increasing harvest
interval and maturity. Harvests at 21 d had an average NDF concentration of 678 g kg-1,
while those done at 35-d intervals were 3.4% greater, averaging 718 g kg-1. Although
the reasons for greater NDF concentrations under 16 cm vs. 8 cm stubble heights for
21-d harvests are unclear, the greater NDF values observed under longer harvest
intervals coincides with research in forage management. Overall, longer regrowth
periods are associated with greater secondary plant cell wall deposition and reduced
digestibility (Buxton and Redfearn, 1997). Additionally, with longer intervals between
harvests we can typically expect leaf to stem ratios to lower, since more DM is
accumulated in stems than in leaves with increasing maturity, raising the proportion of
lignified tissue in herbage (Buxton and Redfearn, 1997). These results are also
consistent with previous findings for Tifton 85 by Mandebvu et al. (1999), which also
found an increase in NDF concentration from 21- to 35-d harvests, while Johnson et al.
(2001) reported values that were in the 745 to 788 g kg-1
Summary and Conclusions
range, and that only showed
differences between 7- and 35-d harvest intervals.
Results from the defoliation management trial that tested the effects of harvest
interval (21, 24, 27, and 35 d) and stubble height (8- and 16-cm stubble) on herbage
nutritive value lead to the following conclusions:
68
Across years, total CP concentration was highest at 21 d but lowest at 35 d
intervals. In 2008, CP declined as interval between harvests increased beyond 21 d,
while a decline was only detected at 35-d harvests in 2007. No differences were
detected due to stubble height in either year. Seasonally, more variability in CP levels
was detected in 2008 than in 2007, likely a consequence of the lower soil nutrient levels
and more marked water stress conditions in 2008. It should be noted that overall, CP
levels were highest in 2007 and decreased only for the longest harvest interval (35 d),
further highlighting the benefits of supplying fertilization and irrigation.
Phosphorus concentration was affected by harvest intervals in both years.
Nonetheless, levels remained fairly stable and corresponded to values reported in other
bermudagrass studies (Pierzynski and Logan, 1993; Woodard et al., 2007) suggesting a
narrow variation of P concentration in herbage tissue.
Concerning digestibility, a stubble height × harvest interval interaction trend was
present due to differences between stubble heights at the 21-d harvest interval. In
addition, IVDOM decreased gradually and at similar rates from 21- to 35-d intervals
across years. No significant differences were found between stubble heights in either
year. In general, the relatively low variability of IVDOM values observed across harvest
intervals and stubble heights suggests that under contrasting growing conditions, Tifton
85 bermudagrass can produce dependably high digestible herbage for lactating dairy
cow use.
In terms of fiber analysis, trends suggest that increasing harvest interval from 21 to
35 d increases NDF concentrations, which can be expected since with increased
maturity more secondary cell wall accumulates. As with IVDOM, no stubble height main
69
effects were found in either year. Overall, it should also be noted that the magnitude of
the increase in NDF concentration across harvest intervals, when present, never
surpassed 4%, indicating that even when significant differences were found, these were
relatively small. This homogeneity throughout the season is an important advantage for
producers utilizing Tifton 85 in dairy cow rations; no major adjustments in formulation
would need to be made in order to maintain optimum NDF diet levels.
70
CHAPTER 5 ECONOMIC ANALYSIS OF TIFTON 85 GREENCHOP INCORPORATION INTO
DAIRY RATIONS
Introduction
Dairy production in Florida is centered around confined housing systems, which
depend on purchased concentrate feeds and forages to meet the nutritional demands of
the herds (Pitman, 2007). Currently, feeding represents approximately 75% of the
operational expenditures of dairies in the state, with an estimated 80% of these costs
going into purchased feedstuffs (USDA-NASS, 2009). Because of the importance of
feeding on dairy profitability, producers are seeking alternative feedstuffs, as well as
management and cropping options that can help reduce costs.
Hay production in Florida during the warm-season months is strongly influenced
by the high temperatures and humidity that can negatively affect drying and baling
activities, increase dry matter (DM) losses and negatively impact forage nutritive value
(Scarborough et al., 2005). Thus, livestock systems that depend on mechanically
harvested forages produced on-farm are generally interested in developing alternative
forage utilization methods. Harvesting for hay, silage, and haylage allows producers to
store forages for feeding at times when herbage availability can be limiting. Conserving
forage however can be challenging to implement effectively because of forage drying
issues under frequent precipitation and the costs involved in establishing and
maintaining the infrastructure necessary for silage or haylage production. A possible
alternative is using forages as greenchop, which is a management practice where the
herbage is mechanically harvested and fed fresh to livestock. This approach can avoid
the dry matter and nutritive value losses inherent in hay or ensiled forages. Additionally,
production costs under this management can be lower, not only because of reduced
71
field losses, but also due to the reduced costs incurred as less machinery,
infrastructure, and their related activities (i.e., baling, storing) are required.
To determine the feasibility of using greenchop in the rations for milking herds, the
cost of producing greenchop and the feeding requirements of different lactating dairy
cows must be considered. While budgets project the income and expenses for a unit of
production, such as a hectare of forage for greenchop, least-cost ration formulation
programs can estimate the combination of forages and other feedstuffs that can
minimize feed costs while meeting the requirements of the dairy animals. These
programs can be adapted to different feedstuffs, prices and nutrient profiles, as well as
different animal requirements, making them a powerful and dynamic tool for feeding
management (Tozer, 2000).
The main objective of this analysis was to assess the economic impact of
incorporating Tifton 85 bermudagrass greenchop in lactating dairy cow rations. Specific
objectives were i) to determine the establishment and production costs of Tifton 85
under different harvest interval practices, and ii) to determine the least expensive
combination of forages, including Tifton 85 greenchop harvest interval scenarios, and
concentrate feeds available to producers in the state.
The hypothesis of the study is that Florida dairy farmers can reduce the cost of
lactating dairy cow rations by utilizing locally harvested, warm-season perennial grasses
such as Tifton 85 greenchop.
Materials and Methods
Tifton 85 bermudagrass greenchop production cost
In order to develop the production cost of Tifton 85 greenchop, establishment and
production budgets were developed. Greenchop management activities differ from
72
those of hay production, since the herbage is simply harvested and transported fresh to
livestock, and no field drying, baling, or storing activities are required. This reduces
machinery operating and ownership costs, as well as labor requirements. One
difference with this management strategy is that a forage wagon is included in
greenchop operations to collect the material that is harvested by the rotary mower. This
implement is usually pulled behind the harvesting equipment, or is operated by a truck
that runs parallel to the harvester.
Within the establishment budget developed, costs of vegetative planting of
bermudagrass using above ground stems were obtained from custom operators in
North Florida and South Georgia, given that this is an activity that is not frequently done
directly by producers. The cost of this activity also is considered in the production
budgets, included as a 10-yr prorated cost of establishment. Thus, the cost of
establishing the stand is divided by the expected life of the stand (years) and allocated
to the production budgets as fixed costs. This value serves as a base estimate for stand
survival of vegetatively propagated bermudagrasses, although well-maintained stands
could last considerably longer.
Because of the interest in determining the effects of producing Tifton 85
greenchop under different harvest management options, production budgets were
calculated with three, four, and five harvests per season, corresponding to 35-, 27-, 24-,
and 21-d harvest intervals, as suggested by the agronomic trial results (Chapters 3 and
4). The differences in costs between these different harvest intervals reflect the
increased machinery and labor use when more harvests are done.
73
Determination of machinery costs
Operating and ownership costs for the machinery were estimated using
spreadsheet-based machinery cost calculator developed by researchers at the
University of Minnesota (Lazarus, 2009). The spreadsheet uses American Society of
Agricultural and Biological Engineer (ASABE) formulas and coefficients to calculate
depreciation, maintenance and repair, fuel, insurance, interest and housing costs for the
required operations and machines. One important consideration that Lazarus (2009)
utilizes in calculating costs is that depreciation is classified as an operating expense,
with the justification that to some extent, these costs are use-related since increased
usage decreases years of life and potential salvage value. Although this approach is
somewhat contrasting to traditional cost allocation schemes that considered
depreciation to be an exclusively fixed cost (AAAE, 2000), it has been adopted widely
by extension economists in calculating farming budgets in the United States, such as
those of the University of Wisconsin (Schuler, 2005), South Dakota State University
(Pflueger, 2005) Iowa State University (Miller et al., 2003) and North Dakota State
University (Landblom et al., 2005), among others.
Input, land and labor costs used in the spreadsheet are those that best reflect
conditions in North Central Florida. These included diesel prices at $0.66 per liter
(average price for Levy County gas stations in October 2009), and utilizing the average
price for unskilled agricultural field workers in Florida at $9.18 per hour (USDA-NASS,
2009c). While dairy farm size in Florida is variable (DeVries et al., 2006), area was
adjusted to 202 ha (~500 acres), a value that approaches the average pasture and crop
area reported. Assumptions on time of year and number of passes over each unit area
of land varied depending on activity requirement and harvest schedule, and are
74
specified in each budget. Land rent values were set at $44.46 ha-1(~$18 acre-1
Developing budgets based on results from agronomic trials
),
corresponding to those reported for Florida in 2009 (USDA-NASS, 2009). Additionally,
insurance and housing were calculated at 1.5% of average machinery or equipment
investment, lubrication costs were estimated at 10% of fuel costs, while no sales tax or
inflation rate was included.
Fertilization costs used in the study reflect the fertilization management applied
during each year of the agronomic trials (Chapters 3 and 4). Thus, 2007 greenchop
production budgets included manure application costs to match the 144 kg ha-1 of P and
148 kg ha-1 of N applied via solid manure and manure irrigation water during the length
of the growing season (May to October). In 2008, greenchop production budgets were
calculated with no fertilization. While prior applications of manure or commercial
fertilizer may have contributed to plant nutrition during the study in both years, they
were not included in the fertilization costs because of a lack of adequate data on the
amounts applied and their availability to plants. Establishment fertilization rates were
those in the UF-IFAS recommendations for bermudagrass (Mylavarapu et al., 2009),
that suggest a split application of 112 kg ha-1
Calculation of manure and irrigation cost for forage production budget
of N. Fertilizer prices used were obtained
from averages of three retailers in the area of study in November 2009, and
corresponded with $0.93, $0.53 and $1.15 per kg of N (average of prices of urea,
ammonium nitrate and ammonium sulfate), P (diammonium phosphate) and K (uriate of
potash), respectively.
Cost of liquid slurry dairy manure application was estimated using the
spreadsheet-based method developed by Koehler et al. (2009), which incorporates the
75
variable (i.e. labor, fuel) and fixed costs (machinery depreciation) related to hauling,
transporting and spreading manure.
Data inputs used reflect the liquid manure applications equivalent to 144 kg ha-1 of
P and 148 kg ha-1 of N during the 2007 season, calculated for 202 ha (~500 acres) of
land by rapid broadcast. Since manure nutrient concentration and availability can vary
widely depending on animal factors (i.e. type dairy cow, diet fed, and production level),
environmental conditions (i.e. soil type, temperature, soil water status) and manure
handling (Van Horn et al., 2003), values were selected from a range of reported values
(Zublena et al., 1997). Thus, concentrations of total N, and K2O per 1000 gal were set
to 45-25-27, with 70-80-90 (%) availability coefficients, respectively. Nitrogen and P2O5
As with other farming activities, estimation of irrigation costs is highly variable and
is best done utilizing actual farm operating and fixed costs. Because of the possible
sources of variation and the lack of adequate farm-level data to calculate the cost of
irrigation during the 2007 season, values were taken from hybrid bermudagrass hay
production budgets developed by the University of Georgia (Lacy and Morgan, 2008),
adapted with current fuel ($0.66 L
coefficients were those estimated for north Florida conditions from producer data by
Van Horn et al., (2003). The K availability coefficient was that used by Koehler et al.
(2009).
-1) and Florida labor costs (9.18 h-1
Least-cost ration linear program model
). Irrigation cost
was estimated for a center pivot system using a diesel-powered pump, applying 127
mm of water per ha during the growing season.
To evaluate the feasibility of incorporating Tifton 85 greenchop in lactating dairy
cow rations, a least-cost ration linear program model was developed using the Solver®
76
(5-1)
(5-2)
function of Microsoft Excel®. In algebraic terms, the linear program model used had the
following form:
where Y = ration cost per cow per day, cj = feedstuff j cost, xj = quantity of
feedstuff j, aij = quantity of nutrient i in ingredient j, and h1 = required amount of nutrient
i in the ration. The equality or inequality signs are determined by the nutrient of interest.
Equation 5-1 represents the objective function of the model, which in our case seeks to
minimize the cost of the ration (Y), which is reached by the sum of the product of the
quantity and cost of the selected feedstuffs that combined meet a series of nutritional
constraints (Equation 5-2). Thus, data inputs to the model can be grouped broadly into:
a) lactating dairy cow requirements, b) feedstuff nutritive profile and cost, and c)
greenchop nutritive value and cost. In order to test the potential use of greenchop for a
wide range of lactating dairy cow nutritional requirements, 12 different scenarios were
evaluated, using NRC (2001) nutrient requirements of dairy cattle guidelines for 12
lactating Holstein dairy cows, classified by different stages of lactation and production
levels: cows in 1st and 3rd lactation, at 60 and 120 d into milk and producing 18, 36 and
54 kg d-1 of milk (Table 5-1). Thus, the daily dry matter intake (DMI) crude protein (CP),
P, Ca, K and net energy for lactation (NEL) requirements were set as constraints to the
model. Maximum allowable limits of CP and P (10% above NRC recommendation), also
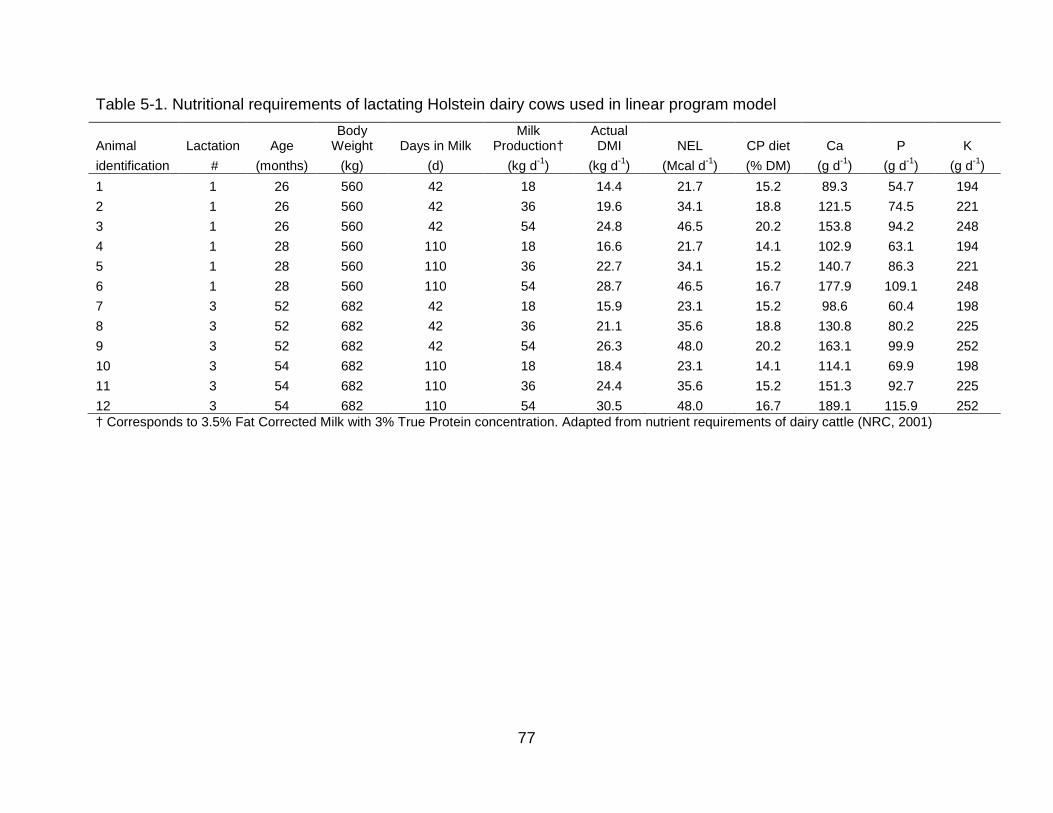
77
Table 5-1. Nutritional requirements of lactating Holstein dairy cows used in linear program model
† Corresponds to 3.5% Fat Corrected Milk with 3% True Protein concentration. Adapted from nutrient requirements of dairy cattle (NRC, 2001)
Animal Lactation Age Body
Weight Days in Milk Milk
Production† Actual DMI NEL CP diet Ca P K
identification # (months) (kg) (d) (kg d-1) (kg d-1) (Mcal d-1) (% DM) (g d-1) (g d-1) (g d-1) 1 1 26 560 42 18 14.4 21.7 15.2 89.3 54.7 194 2 1 26 560 42 36 19.6 34.1 18.8 121.5 74.5 221 3 1 26 560 42 54 24.8 46.5 20.2 153.8 94.2 248 4 1 28 560 110 18 16.6 21.7 14.1 102.9 63.1 194 5 1 28 560 110 36 22.7 34.1 15.2 140.7 86.3 221 6 1 28 560 110 54 28.7 46.5 16.7 177.9 109.1 248 7 3 52 682 42 18 15.9 23.1 15.2 98.6 60.4 198 8 3 52 682 42 36 21.1 35.6 18.8 130.8 80.2 225 9 3 52 682 42 54 26.3 48.0 20.2 163.1 99.9 252 10 3 54 682 110 18 18.4 23.1 14.1 114.1 69.9 198 11 3 54 682 110 36 24.4 35.6 15.2 151.3 92.7 225 12 3 54 682 110 54 30.5 48.0 16.7 189.1 115.9 252
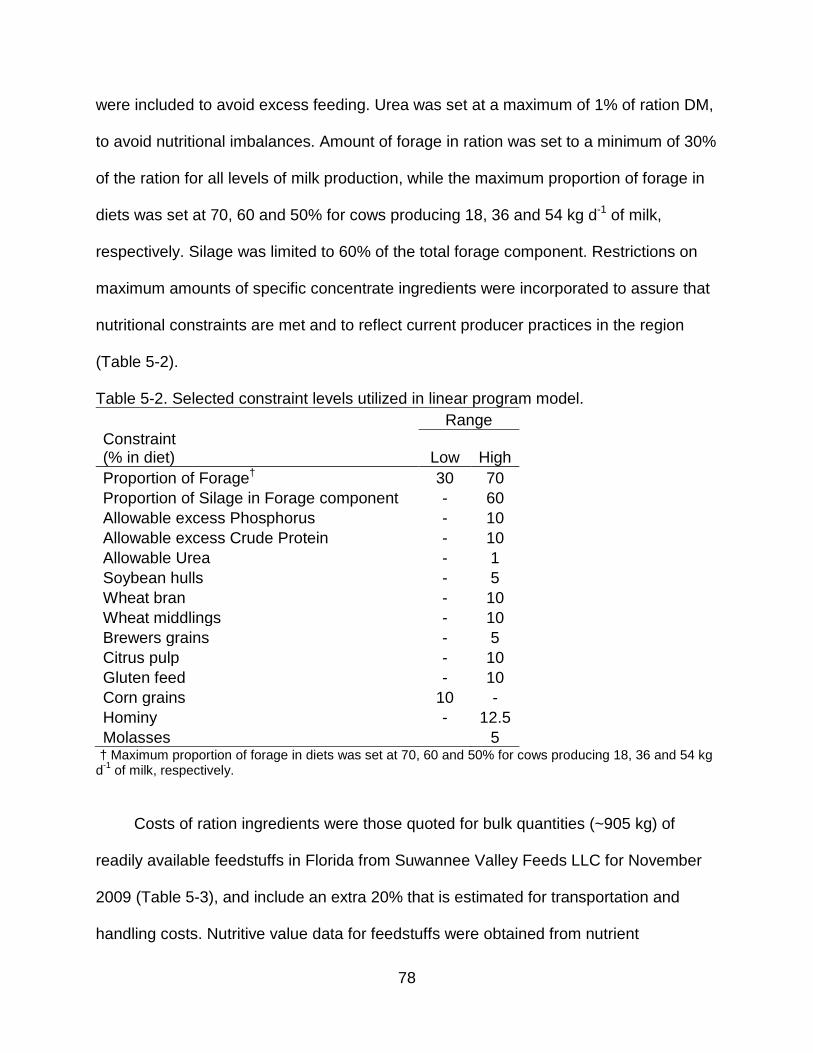
78
were included to avoid excess feeding. Urea was set at a maximum of 1% of ration DM,
to avoid nutritional imbalances. Amount of forage in ration was set to a minimum of 30%
of the ration for all levels of milk production, while the maximum proportion of forage in
diets was set at 70, 60 and 50% for cows producing 18, 36 and 54 kg d-1
Table 5-2. Selected constraint levels utilized in linear program model.
of milk,
respectively. Silage was limited to 60% of the total forage component. Restrictions on
maximum amounts of specific concentrate ingredients were incorporated to assure that
nutritional constraints are met and to reflect current producer practices in the region
(Table 5-2).
Range Constraint (% in diet) Low High Proportion of Forage† 30 70 Proportion of Silage in Forage component - 60 Allowable excess Phosphorus - 10 Allowable excess Crude Protein - 10 Allowable Urea - 1 Soybean hulls - 5 Wheat bran - 10 Wheat middlings - 10 Brewers grains - 5 Citrus pulp - 10 Gluten feed - 10 Corn grains 10 - Hominy - 12.5 Molasses 5
† Maximum proportion of forage in diets was set at 70, 60 and 50% for cows producing 18, 36 and 54 kg d-1
of milk, respectively.
Costs of ration ingredients were those quoted for bulk quantities (~905 kg) of
readily available feedstuffs in Florida from Suwannee Valley Feeds LLC for November
2009 (Table 5-3), and include an extra 20% that is estimated for transportation and
handling costs. Nutritive value data for feedstuffs were obtained from nutrient
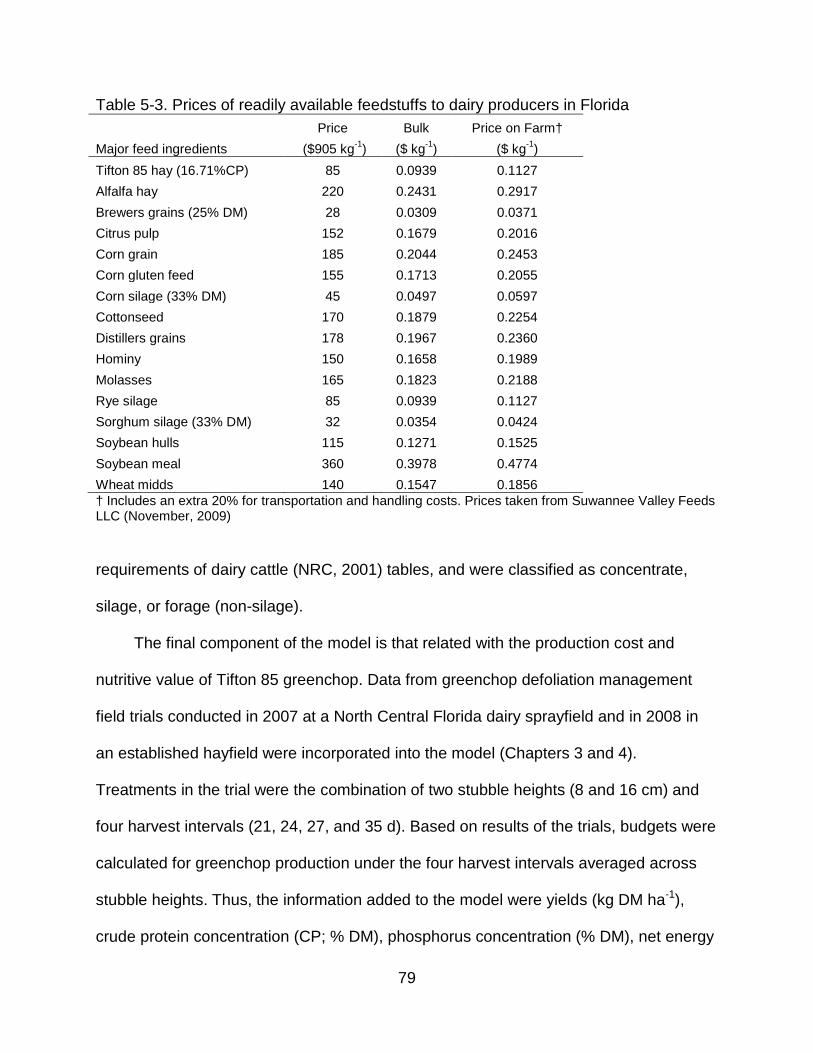
79
Table 5-3. Prices of readily available feedstuffs to dairy producers in Florida Price Bulk Price on Farm† Major feed ingredients ($905 kg-1 ($ kg) -1 ($ kg) -1
Tifton 85 hay (16.71%CP) )
85 0.0939 0.1127 Alfalfa hay 220 0.2431 0.2917 Brewers grains (25% DM) 28 0.0309 0.0371 Citrus pulp 152 0.1679 0.2016 Corn grain 185 0.2044 0.2453 Corn gluten feed 155 0.1713 0.2055 Corn silage (33% DM) 45 0.0497 0.0597 Cottonseed 170 0.1879 0.2254 Distillers grains 178 0.1967 0.2360 Hominy 150 0.1658 0.1989 Molasses 165 0.1823 0.2188 Rye silage 85 0.0939 0.1127 Sorghum silage (33% DM) 32 0.0354 0.0424 Soybean hulls 115 0.1271 0.1525 Soybean meal 360 0.3978 0.4774 Wheat midds 140 0.1547 0.1856 † Includes an extra 20% for transportation and handling costs. Prices taken from Suwannee Valley Feeds LLC (November, 2009)
requirements of dairy cattle (NRC, 2001) tables, and were classified as concentrate,
silage, or forage (non-silage).
The final component of the model is that related with the production cost and
nutritive value of Tifton 85 greenchop. Data from greenchop defoliation management
field trials conducted in 2007 at a North Central Florida dairy sprayfield and in 2008 in
an established hayfield were incorporated into the model (Chapters 3 and 4).
Treatments in the trial were the combination of two stubble heights (8 and 16 cm) and
four harvest intervals (21, 24, 27, and 35 d). Based on results of the trials, budgets were
calculated for greenchop production under the four harvest intervals averaged across
stubble heights. Thus, the information added to the model were yields (kg DM ha-1),
crude protein concentration (CP; % DM), phosphorus concentration (% DM), net energy
80
(5-3)
for lactation (NEL; Mcal kg-1) and cost ($ kg-1
NEL �Mcal kg-1�= 0.0245 × TDN(%) - 0.12
) per harvest interval. Crude protein is
essential for dairy cow nutrition, since when absorbed from the digestive tract it provides
the amino acid building blocks for the synthesis of proteins that are vital to the
maintenance, growth, reproduction and lactation of dairy cattle (NRC, 2001). Net energy
for lactation is the representation of the energy required for maintenance and milk
production of dairy cows. It is calculated as a function of the total digestible nutrients
(TDN) of the forage or feedstuff, which in turn depends on the crude protein, ether
extract, ash and non-fiber carbohydrate fraction (NRC, 2001). The current equation
used by NRC (2001) for the estimation of NEL from TDN is as follows:
Total digestible nutrients were not determined analytically for the Tifton 85
samples taken in either 2007 or 2008. Thus, TDN (%) was estimated based on the
relationship suggested by Moore (1994), which considers TDN to be numerically
equivalent to IVDOM (%) if the ether extract fraction is negligible, as is the case with
most tropical forages. Calculated NEL values for harvest interval means are presented
in Table 5-17.
Results and Discussion
Tifton 85 bermudagrass establishment budget
The budgets formulated for establishment of Tifton 85 for use as greenchop are
not different from those developed for other hybrid bermudagrasses. Analyzing the cost
structure, it should be noted that most of the expenditures went to planting and
fertilization, essentially because of the high costs of inputs (commercial fertilizer and
vegetative planting material) and the high machinery requirement for these activities
81
(Table 5-4). Overall, planting accounted for approximately 44% of total costs, whereas
fertilization represented 32%. The proportion of total establishment costs allocated to
planting and fertilization coincide with those calculated for hybrid bermudagrasses in
north Florida in 2006 (Hewitt, 2006) and Georgia in 2008 (Lacy and Morgan, 2008).
Producers interviewed at the study sites also confirmed these findings, highlighting that
fertilization and plating related costs are one of the most important items to consider
when establishing forages, and further stress the importance of adequate nutrient
management and utilization of alternative fertilizer sources.
Tifton 85 bermudagrass greenchop production budgets
Overall, when analyzing the activities required to produce hybrid bermudagrasses
as greenchop or hay, we find that the former requires less use of machinery and
implements than the latter, since after the forage is cut, under greenchop use the
material is taken directly to the livestock, whereas when used for hay additional
activities must be undertaken in the field to assure the material is adequately dried,
baled and stored. Although the comparison may not be entirely justified, since hay can
be used at other times when no fresh material is available, harvesting warm-season
grasses as greenchop could be advantageous, given its lower production costs and
apparently lower field losses.
Comparing production budgets in both years, the costs of producing greenchop in
2007 (Tables 5-5, 5-7 and 5-9) were over four times greater than in 2008 (Tables 5-11,
5-13 and 5-15), because no fertilizer or irrigation were used. Within each year, the
difference in costs between harvest intervals was related solely to the increase or
decrease in machinery, labor and associated costs.
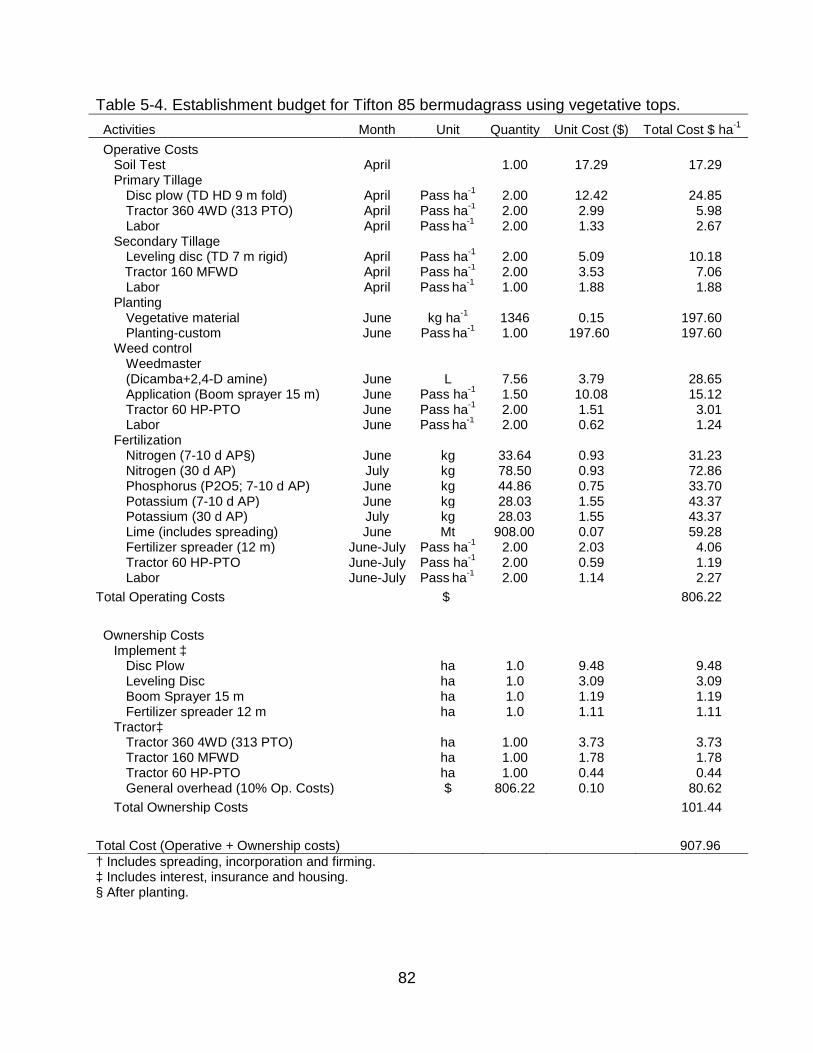
82
Table 5-4. Establishment budget for Tifton 85 bermudagrass using vegetative tops. Activities Month Unit Quantity Unit Cost ($) Total Cost $ ha-1 Operative Costs Soil Test April 1.00 17.29 17.29 Primary Tillage Disc plow (TD HD 9 m fold) April Pass ha 2.00 -1 12.42 24.85 Tractor 360 4WD (313 PTO) April Pass ha 2.00 -1 2.99 5.98 Labor April Pass ha 2.00 -1 1.33 2.67 Secondary Tillage Leveling disc (TD 7 m rigid) April Pass ha 2.00 -1 5.09 10.18 Tractor 160 MFWD April Pass ha 2.00 -1 3.53 7.06 Labor April Pass ha 1.00 -1 1.88 1.88 Planting Vegetative material June kg ha 1346 -1 0.15 197.60 Planting-custom June Pass ha 1.00 -1 197.60 197.60 Weed control
Weedmaster (Dicamba+2,4-D amine) June L 7.56 3.79 28.65
Application (Boom sprayer 15 m) June Pass ha 1.50 -1 10.08 15.12 Tractor 60 HP-PTO June Pass ha 2.00 -1 1.51 3.01 Labor June Pass ha 2.00 -1 0.62 1.24 Fertilization Nitrogen (7-10 d AP§) June kg 33.64 0.93 31.23 Nitrogen (30 d AP) July kg 78.50 0.93 72.86 Phosphorus (P2O5; 7-10 d AP) June kg 44.86 0.75 33.70 Potassium (7-10 d AP) June kg 28.03 1.55 43.37 Potassium (30 d AP) July kg 28.03 1.55 43.37 Lime (includes spreading) June Mt 908.00 0.07 59.28 Fertilizer spreader (12 m) June-July Pass ha 2.00 -1 2.03 4.06 Tractor 60 HP-PTO June-July Pass ha 2.00 -1 0.59 1.19 Labor June-July Pass ha 2.00 -1 1.14 2.27 Total Operating Costs $ 806.22 Ownership Costs Implement ‡ Disc Plow ha 1.0 9.48 9.48 Leveling Disc ha 1.0 3.09 3.09 Boom Sprayer 15 m ha 1.0 1.19 1.19 Fertilizer spreader 12 m ha 1.0 1.11 1.11 Tractor‡ Tractor 360 4WD (313 PTO) ha 1.00 3.73 3.73 Tractor 160 MFWD ha 1.00 1.78 1.78 Tractor 60 HP-PTO ha 1.00 0.44 0.44 General overhead (10% Op. Costs) $ 806.22 0.10 80.62 Total Ownership Costs 101.44 Total Cost (Operative + Ownership costs) 907.96 † Includes spreading, incorporation and firming. ‡ Includes interest, insurance and housing. § After planting.
83
Consequently, this caused the price per unit weight of greenchop to vary only
from 0.083 to 0.124 $ kg DM-1 in 2007 (Tables 5-6, 5-8 and 5-10), and from 0.028 to
0.036 $ kg DM-1
Least-cost linear program model results
in 2008 (Tables 5-12, 5-14 and 5-16). As with the case of the
establishment budgets, manure fertilization was the activity that had the highest
associated costs across harvest intervals in 2007, averaging 30% of total production
costs. Irrigation costs were also considerably high, amounting to 18% of total costs. It is
important to note that calculating costs in 2008 without use of fertilizer or irrigation was
done to reflect the experimental conditions from which the agronomic data was
obtained, and that reaching comparable yields or nutritive value, and a healthy stand in
subsequent years without use of fertilizer would be unlikely. Thus, agronomic fertilizer
prices are important determinants of forage production profitability, and can constitute
strong incentives for producers to utilize alternative fertilizer sources, such as cattle
manure. Nonetheless, the economic, environmental and agronomic effects of using
cattle manure for Tifton 85 nutrition should be studied further. Of special concern are
the amounts of P being applied, particularly when manure is applied to meet crop N
requirements. Manure applications can be an important non-point source of excess P
that can leach and reach below ground water sources; emphasizing the importance of
closely monitoring soil nutrient levels, manure nutrient concentration and application
methods to ensure that the resource is used as best as possible without causing
important environmental impacts.
Data on greenchop yield, nutritive value and production cost for both years of the
field trials are summarized in Table 5-17. These values were those used in the model,
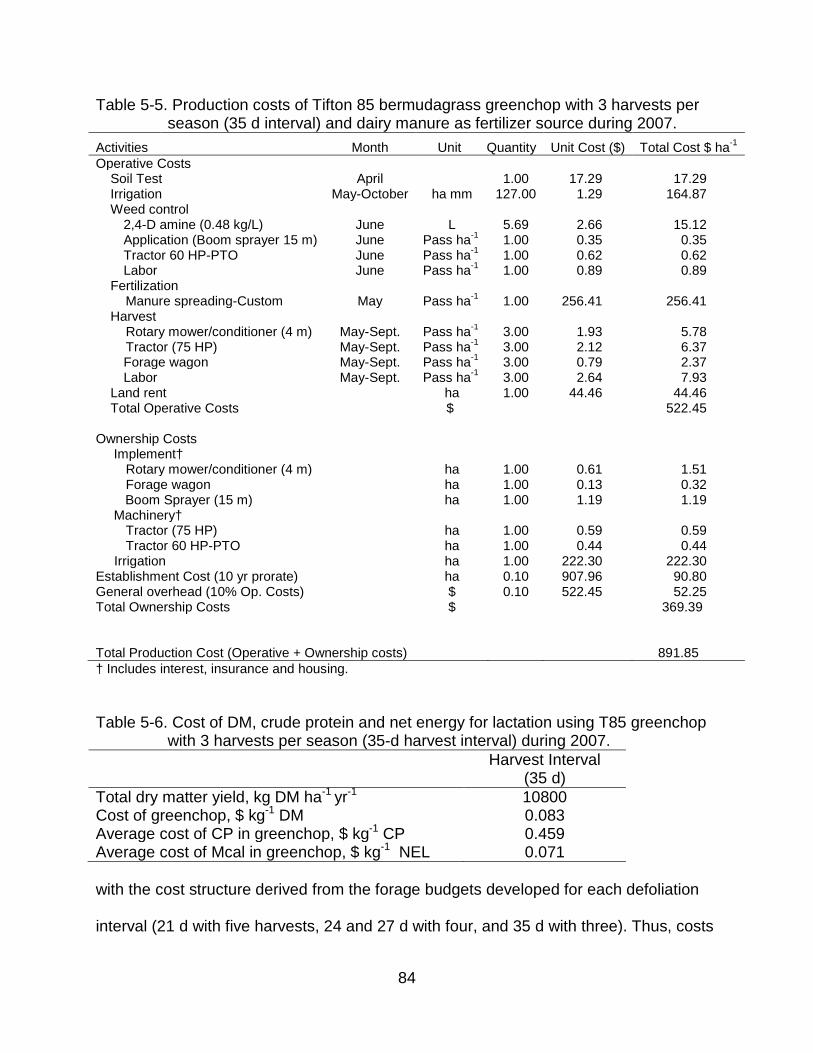
84
Table 5-5. Production costs of Tifton 85 bermudagrass greenchop with 3 harvests per season (35 d interval) and dairy manure as fertilizer source during 2007.
Activities Month Unit Quantity Unit Cost ($) Total Cost $ ha-1 Operative Costs Soil Test April 1.00 17.29 17.29 Irrigation May-October ha mm 127.00 1.29 164.87 Weed control 2,4-D amine (0.48 kg/L) June L 5.69 2.66 15.12 Application (Boom sprayer 15 m) June Pass ha 1.00 -1 0.35 0.35 Tractor 60 HP-PTO June Pass ha 1.00 -1 0.62 0.62 Labor June Pass ha 1.00 -1 0.89 0.89 Fertilization Manure spreading-Custom May Pass ha 1.00 -1 256.41 256.41 Harvest
Rotary mower/conditioner (4 m) May-Sept. Pass ha 3.00 -1 1.93 5.78 Tractor (75 HP) May-Sept. Pass ha 3.00 -1 2.12 6.37
Forage wagon May-Sept. Pass ha 3.00 -1 0.79 2.37 Labor May-Sept. Pass ha 3.00 -1 2.64 7.93 Land rent ha 1.00 44.46 44.46 Total Operative Costs $ 522.45 Ownership Costs
Implement† Rotary mower/conditioner (4 m) ha 1.00 0.61 1.51 Forage wagon ha 1.00 0.13 0.32
Boom Sprayer (15 m) ha 1.00 1.19 1.19 Machinery†
Tractor (75 HP) ha 1.00 0.59 0.59 Tractor 60 HP-PTO ha 1.00 0.44 0.44
Irrigation ha 1.00 222.30 222.30 Establishment Cost (10 yr prorate) ha 0.10 907.96 90.80 General overhead (10% Op. Costs) $ 0.10 522.45 52.25 Total Ownership Costs $ 369.39
Total Production Cost (Operative + Ownership costs) 891.85
† Includes interest, insurance and housing.
Table 5-6. Cost of DM, crude protein and net energy for lactation using T85 greenchop with 3 harvests per season (35-d harvest interval) during 2007.
Harvest Interval (35 d)
Total dry matter yield, kg DM ha-1 yr 10800 -1 Cost of greenchop, $ kg-1 0.083 DM Average cost of CP in greenchop, $ kg-1 0.459 CP Average cost of Mcal in greenchop, $ kg-1 0.071 NEL with the cost structure derived from the forage budgets developed for each defoliation
interval (21 d with five harvests, 24 and 27 d with four, and 35 d with three). Thus, costs
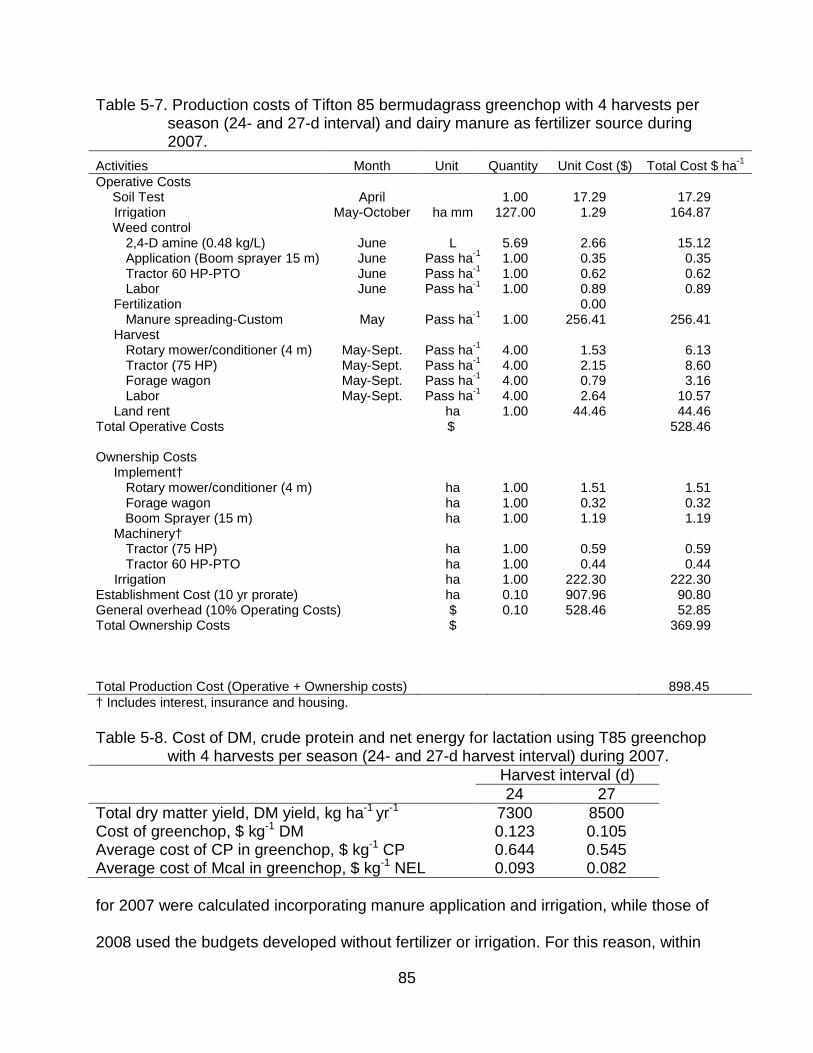
85
Table 5-7. Production costs of Tifton 85 bermudagrass greenchop with 4 harvests per season (24- and 27-d interval) and dairy manure as fertilizer source during 2007.
Activities Month Unit Quantity Unit Cost ($) Total Cost $ ha-1 Operative Costs
Soil Test April 1.00 17.29 17.29 Irrigation May-October ha mm 127.00 1.29 164.87
Weed control 2,4-D amine (0.48 kg/L) June L 5.69 2.66 15.12 Application (Boom sprayer 15 m) June Pass ha 1.00 -1 0.35 0.35 Tractor 60 HP-PTO June Pass ha 1.00 -1 0.62 0.62 Labor June Pass ha 1.00 -1 0.89 0.89
Fertilization 0.00 Manure spreading-Custom May Pass ha 1.00 -1 256.41 256.41
Harvest Rotary mower/conditioner (4 m) May-Sept. Pass ha 4.00 -1 1.53 6.13 Tractor (75 HP) May-Sept. Pass ha 4.00 -1 2.15 8.60 Forage wagon May-Sept. Pass ha 4.00 -1 0.79 3.16 Labor May-Sept. Pass ha 4.00 -1 2.64 10.57
Land rent ha 1.00 44.46 44.46 Total Operative Costs $ 528.46 Ownership Costs
Implement† Rotary mower/conditioner (4 m) ha 1.00 1.51 1.51 Forage wagon ha 1.00 0.32 0.32
Boom Sprayer (15 m) ha 1.00 1.19 1.19 Machinery†
Tractor (75 HP) ha 1.00 0.59 0.59 Tractor 60 HP-PTO ha 1.00 0.44 0.44
Irrigation ha 1.00 222.30 222.30 Establishment Cost (10 yr prorate) ha 0.10 907.96 90.80 General overhead (10% Operating Costs) $ 0.10 528.46 52.85 Total Ownership Costs $ 369.99
Total Production Cost (Operative + Ownership costs)
898.45
† Includes interest, insurance and housing. Table 5-8. Cost of DM, crude protein and net energy for lactation using T85 greenchop
with 4 harvests per season (24- and 27-d harvest interval) during 2007. Harvest interval (d) 24 27 Total dry matter yield, DM yield, kg ha-1 yr 7300 -1 8500 Cost of greenchop, $ kg-1 0.123 DM 0.105 Average cost of CP in greenchop, $ kg-1 0.644 CP 0.545 Average cost of Mcal in greenchop, $ kg-1 0.093 NEL 0.082 for 2007 were calculated incorporating manure application and irrigation, while those of
2008 used the budgets developed without fertilizer or irrigation. For this reason, within
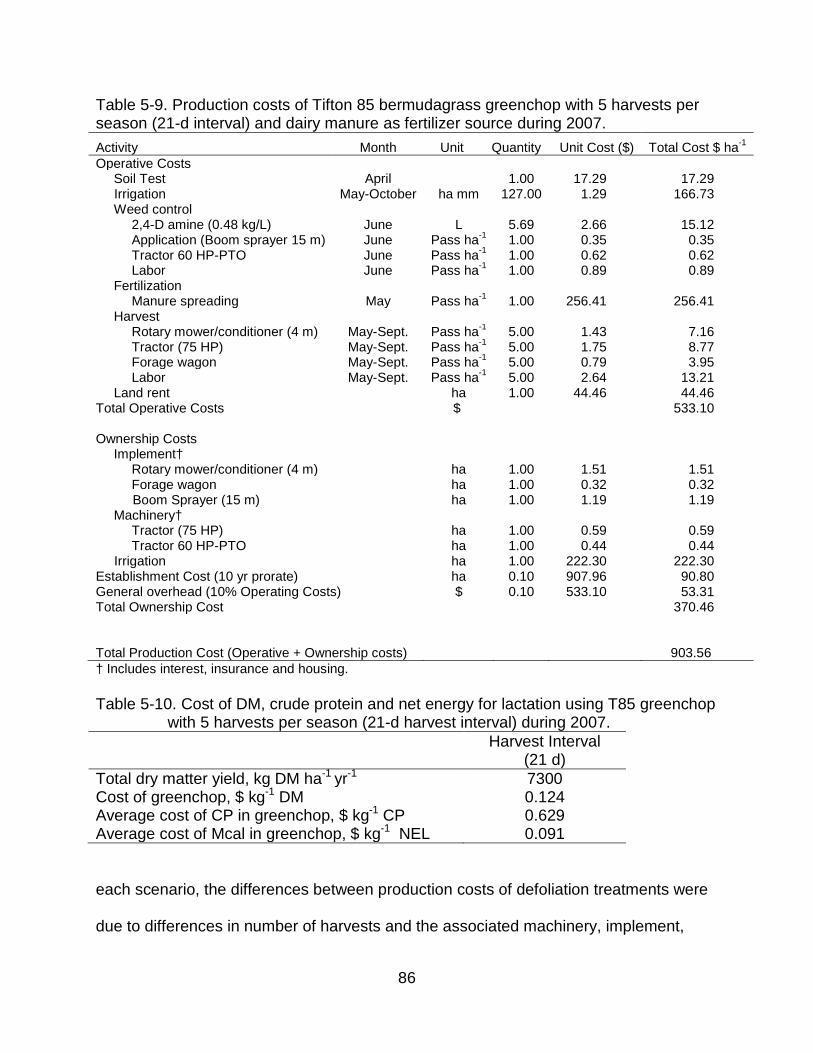
86
Table 5-9. Production costs of Tifton 85 bermudagrass greenchop with 5 harvests per season (21-d interval) and dairy manure as fertilizer source during 2007. Activity Month Unit Quantity Unit Cost ($) Total Cost $ ha-1 Operative Costs
Soil Test April 1.00 17.29 17.29 Irrigation May-October ha mm 127.00 1.29 166.73
Weed control 2,4-D amine (0.48 kg/L) June L 5.69 2.66 15.12 Application (Boom sprayer 15 m) June Pass ha 1.00 -1 0.35 0.35 Tractor 60 HP-PTO June Pass ha 1.00 -1 0.62 0.62 Labor June Pass ha 1.00 -1 0.89 0.89
Fertilization Manure spreading May Pass ha 1.00 -1 256.41 256.41
Harvest Rotary mower/conditioner (4 m) May-Sept. Pass ha 5.00 -1 1.43 7.16 Tractor (75 HP) May-Sept. Pass ha 5.00 -1 1.75 8.77 Forage wagon May-Sept. Pass ha 5.00 -1 0.79 3.95 Labor May-Sept. Pass ha 5.00 -1 2.64 13.21
Land rent ha 1.00 44.46 44.46 Total Operative Costs $ 533.10 Ownership Costs
Implement† Rotary mower/conditioner (4 m) ha 1.00 1.51 1.51 Forage wagon ha 1.00 0.32 0.32
Boom Sprayer (15 m) ha 1.00 1.19 1.19 Machinery†
Tractor (75 HP) ha 1.00 0.59 0.59 Tractor 60 HP-PTO ha 1.00 0.44 0.44
Irrigation ha 1.00 222.30 222.30 Establishment Cost (10 yr prorate) ha 0.10 907.96 90.80 General overhead (10% Operating Costs) $ 0.10 533.10 53.31 Total Ownership Cost 370.46
Total Production Cost (Operative + Ownership costs) 903.56
† Includes interest, insurance and housing. Table 5-10. Cost of DM, crude protein and net energy for lactation using T85 greenchop
with 5 harvests per season (21-d harvest interval) during 2007. Harvest Interval
(21 d) Total dry matter yield, kg DM ha-1 yr 7300 -1 Cost of greenchop, $ kg-1 0.124 DM Average cost of CP in greenchop, $ kg-1 0.629 CP Average cost of Mcal in greenchop, $ kg-1 0.091 NEL
each scenario, the differences between production costs of defoliation treatments were
due to differences in number of harvests and the associated machinery, implement,
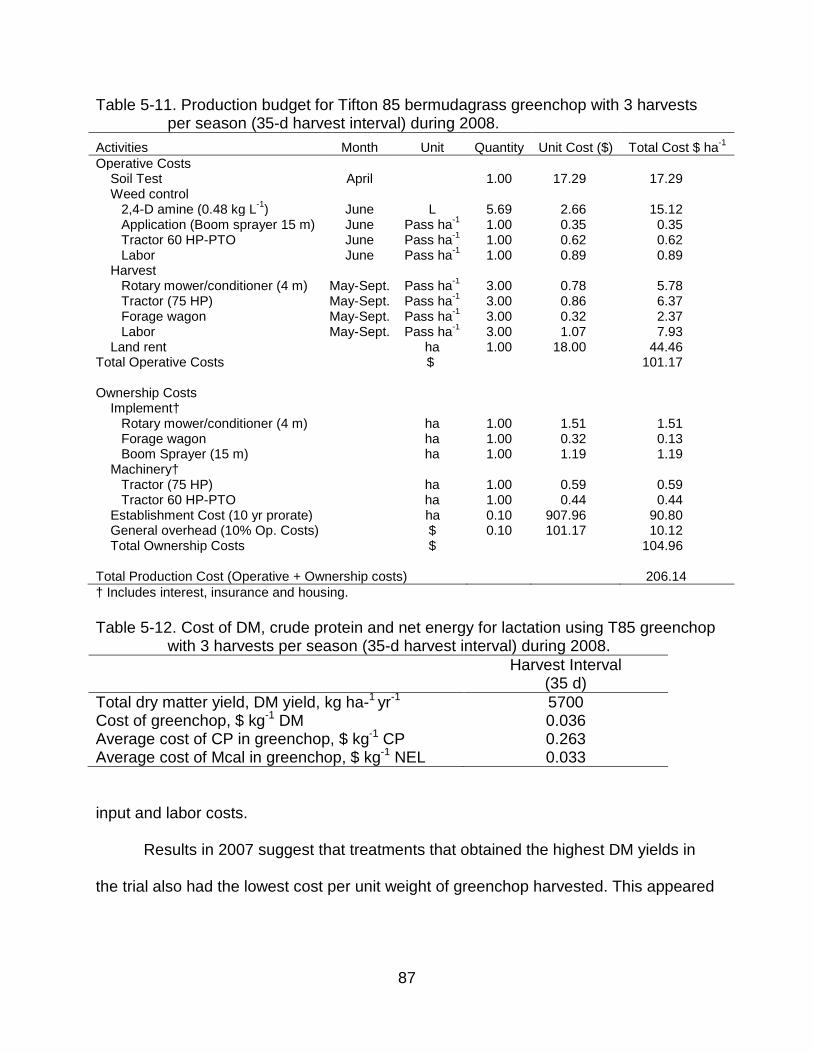
87
Table 5-11. Production budget for Tifton 85 bermudagrass greenchop with 3 harvests per season (35-d harvest interval) during 2008.
Activities Month Unit Quantity Unit Cost ($) Total Cost $ ha-1 Operative Costs Soil Test April 1.00 17.29 17.29 Weed control 2,4-D amine (0.48 kg L-1 June ) L 5.69 2.66 15.12 Application (Boom sprayer 15 m) June Pass ha 1.00 -1 0.35 0.35 Tractor 60 HP-PTO June Pass ha 1.00 -1 0.62 0.62 Labor June Pass ha 1.00 -1 0.89 0.89 Harvest Rotary mower/conditioner (4 m) May-Sept. Pass ha 3.00 -1 0.78 5.78 Tractor (75 HP) May-Sept. Pass ha 3.00 -1 0.86 6.37 Forage wagon May-Sept. Pass ha 3.00 -1 0.32 2.37 Labor May-Sept. Pass ha 3.00 -1 1.07 7.93 Land rent ha 1.00 18.00 44.46 Total Operative Costs $ 101.17 Ownership Costs Implement† Rotary mower/conditioner (4 m) ha 1.00 1.51 1.51 Forage wagon ha 1.00 0.32 0.13 Boom Sprayer (15 m) ha 1.00 1.19 1.19 Machinery† Tractor (75 HP)
Tractor 60 HP-PTO ha 1.00 0.59 0.59
ha 1.00 0.44 0.44 Establishment Cost (10 yr prorate) ha 0.10 907.96 90.80 General overhead (10% Op. Costs) $ 0.10 101.17 10.12 Total Ownership Costs $ 104.96 Total Production Cost (Operative + Ownership costs) 206.14 † Includes interest, insurance and housing. Table 5-12. Cost of DM, crude protein and net energy for lactation using T85 greenchop
with 3 harvests per season (35-d harvest interval) during 2008. Harvest Interval
(35 d) Total dry matter yield, DM yield, kg ha-1 yr 5700 -1 Cost of greenchop, $ kg-1 0.036 DM Average cost of CP in greenchop, $ kg-1 0.263 CP Average cost of Mcal in greenchop, $ kg-1 0.033 NEL
input and labor costs.
Results in 2007 suggest that treatments that obtained the highest DM yields in
the trial also had the lowest cost per unit weight of greenchop harvested. This appeared
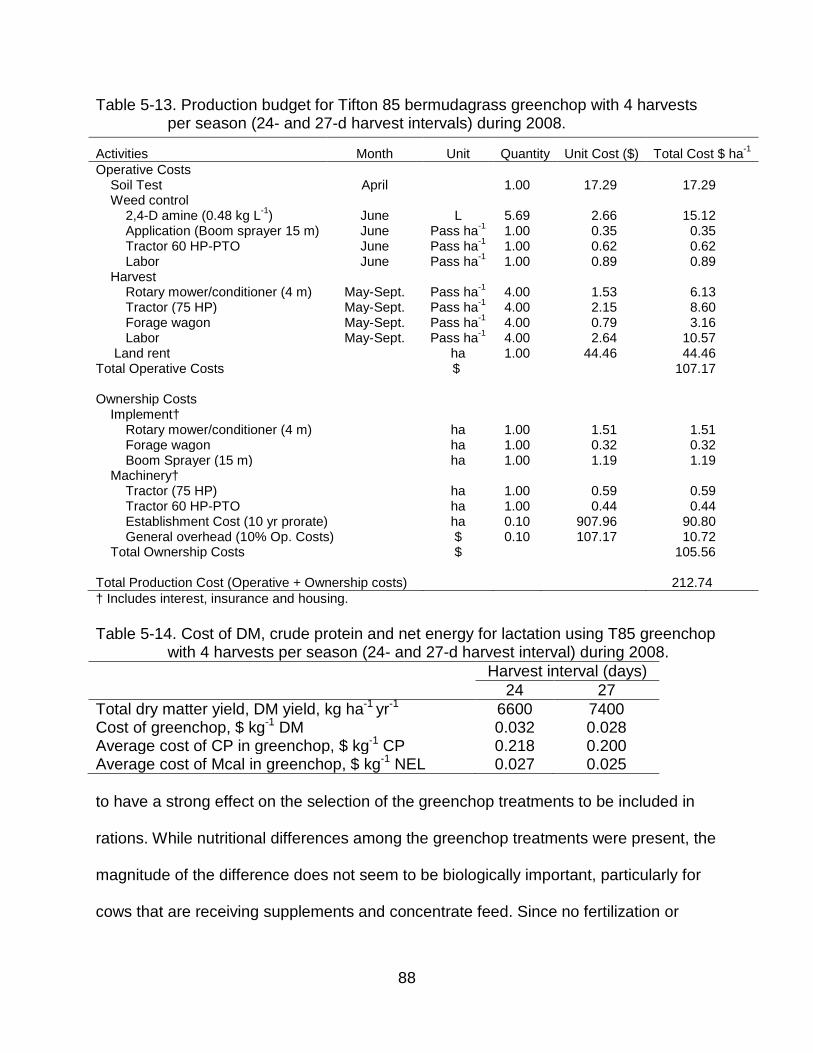
88
Table 5-13. Production budget for Tifton 85 bermudagrass greenchop with 4 harvests per season (24- and 27-d harvest intervals) during 2008.
† Includes interest, insurance and housing. Table 5-14. Cost of DM, crude protein and net energy for lactation using T85 greenchop
with 4 harvests per season (24- and 27-d harvest interval) during 2008. Harvest interval (days) 24 27 Total dry matter yield, DM yield, kg ha-1 yr 6600 -1 7400 Cost of greenchop, $ kg-1 0.032 DM 0.028 Average cost of CP in greenchop, $ kg-1 0.218 CP 0.200 Average cost of Mcal in greenchop, $ kg-1 0.027 NEL 0.025 to have a strong effect on the selection of the greenchop treatments to be included in
rations. While nutritional differences among the greenchop treatments were present, the
magnitude of the difference does not seem to be biologically important, particularly for
cows that are receiving supplements and concentrate feed. Since no fertilization or
Activities Month Unit Quantity Unit Cost ($) Total Cost $ ha-1 Operative Costs Soil Test April 1.00 17.29 17.29 Weed control 2,4-D amine (0.48 kg L-1 June ) L 5.69 2.66 15.12 Application (Boom sprayer 15 m) June Pass ha 1.00 -1 0.35 0.35 Tractor 60 HP-PTO June Pass ha 1.00 -1 0.62 0.62 Labor June Pass ha 1.00 -1 0.89 0.89 Harvest Rotary mower/conditioner (4 m) May-Sept. Pass ha 4.00 -1 1.53 6.13 Tractor (75 HP) May-Sept. Pass ha 4.00 -1 2.15 8.60 Forage wagon May-Sept. Pass ha 4.00 -1 0.79 3.16 Labor May-Sept. Pass ha 4.00 -1 2.64 10.57 Land rent ha 1.00 44.46 44.46 Total Operative Costs $ 107.17 Ownership Costs Implement† Rotary mower/conditioner (4 m) ha 1.00 1.51 1.51 Forage wagon ha 1.00 0.32 0.32 Boom Sprayer (15 m) ha 1.00 1.19 1.19 Machinery† Tractor (75 HP) ha 1.00 0.59 0.59 Tractor 60 HP-PTO ha 1.00 0.44 0.44 Establishment Cost (10 yr prorate) ha 0.10 907.96 90.80 General overhead (10% Op. Costs) $ 0.10 107.17 10.72 Total Ownership Costs $ 105.56 Total Production Cost (Operative + Ownership costs) 212.74
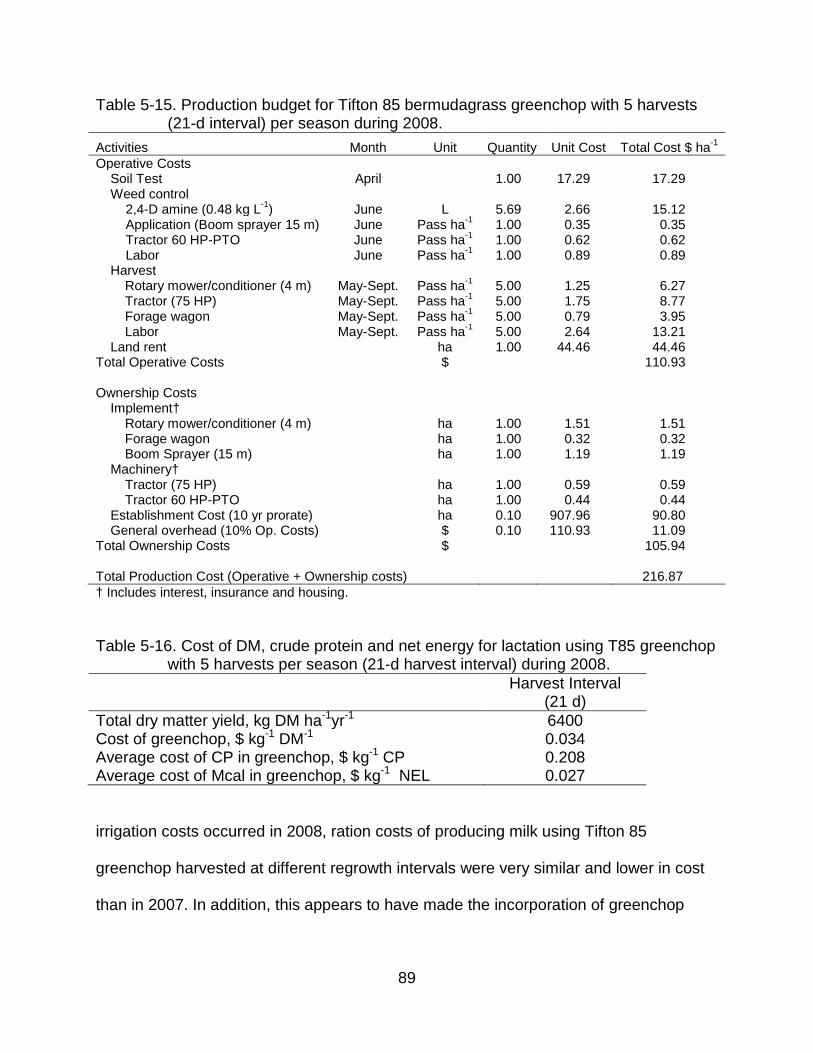
89
Table 5-15. Production budget for Tifton 85 bermudagrass greenchop with 5 harvests (21-d interval) per season during 2008.
Activities Month Unit Quantity Unit Cost Total Cost $ ha-1 Operative Costs Soil Test April 1.00 17.29 17.29 Weed control 2,4-D amine (0.48 kg L-1 June ) L 5.69 2.66 15.12 Application (Boom sprayer 15 m) June Pass ha 1.00 -1 0.35 0.35 Tractor 60 HP-PTO June Pass ha 1.00 -1 0.62 0.62 Labor June Pass ha 1.00 -1 0.89 0.89 Harvest Rotary mower/conditioner (4 m) May-Sept. Pass ha 5.00 -1 1.25 6.27 Tractor (75 HP) May-Sept. Pass ha 5.00 -1 1.75 8.77 Forage wagon May-Sept. Pass ha 5.00 -1 0.79 3.95 Labor May-Sept. Pass ha 5.00 -1 2.64 13.21 Land rent ha 1.00 44.46 44.46 Total Operative Costs $ 110.93 Ownership Costs Implement† Rotary mower/conditioner (4 m) ha 1.00 1.51 1.51 Forage wagon ha 1.00 0.32 0.32 Boom Sprayer (15 m) ha 1.00 1.19 1.19 Machinery† Tractor (75 HP) ha 1.00 0.59 0.59 Tractor 60 HP-PTO ha 1.00 0.44 0.44 Establishment Cost (10 yr prorate) ha 0.10 907.96 90.80 General overhead (10% Op. Costs) $ 0.10 110.93 11.09 Total Ownership Costs $ 105.94 Total Production Cost (Operative + Ownership costs) 216.87 † Includes interest, insurance and housing.
Table 5-16. Cost of DM, crude protein and net energy for lactation using T85 greenchop with 5 harvests per season (21-d harvest interval) during 2008.
Harvest Interval (21 d)
Total dry matter yield, kg DM ha-1yr 6400 -1 Cost of greenchop, $ kg-1 DM 0.034 -1 Average cost of CP in greenchop, $ kg-1 0.208 CP Average cost of Mcal in greenchop, $ kg-1 0.027 NEL
irrigation costs occurred in 2008, ration costs of producing milk using Tifton 85
greenchop harvested at different regrowth intervals were very similar and lower in cost
than in 2007. In addition, this appears to have made the incorporation of greenchop
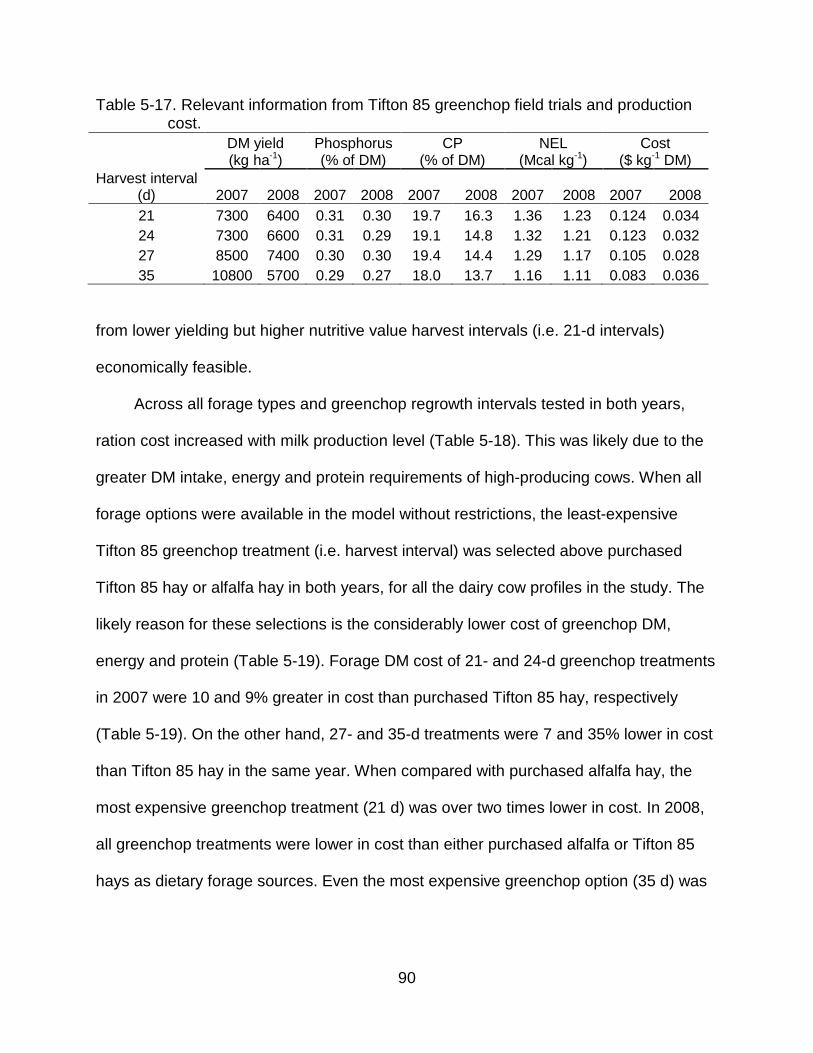
90
Table 5-17. Relevant information from Tifton 85 greenchop field trials and production cost.
DM yield (kg ha-1
Phosphorus ) (% of DM)
CP (% of DM)
NEL (Mcal kg-1
Cost ) ($ kg-1 DM)
Harvest interval (d) 2007 2008 2007 2008 2007 2008 2007 2008 2007 2008 21 7300 6400 0.31 0.30 19.7 16.3 1.36 1.23 0.124 0.034 24 7300 6600 0.31 0.29 19.1 14.8 1.32 1.21 0.123 0.032 27 8500 7400 0.30 0.30 19.4 14.4 1.29 1.17 0.105 0.028 35 10800 5700 0.29 0.27 18.0 13.7 1.16 1.11 0.083 0.036
from lower yielding but higher nutritive value harvest intervals (i.e. 21-d intervals)
economically feasible.
Across all forage types and greenchop regrowth intervals tested in both years,
ration cost increased with milk production level (Table 5-18). This was likely due to the
greater DM intake, energy and protein requirements of high-producing cows. When all
forage options were available in the model without restrictions, the least-expensive
Tifton 85 greenchop treatment (i.e. harvest interval) was selected above purchased
Tifton 85 hay or alfalfa hay in both years, for all the dairy cow profiles in the study. The
likely reason for these selections is the considerably lower cost of greenchop DM,
energy and protein (Table 5-19). Forage DM cost of 21- and 24-d greenchop treatments
in 2007 were 10 and 9% greater in cost than purchased Tifton 85 hay, respectively
(Table 5-19). On the other hand, 27- and 35-d treatments were 7 and 35% lower in cost
than Tifton 85 hay in the same year. When compared with purchased alfalfa hay, the
most expensive greenchop treatment (21 d) was over two times lower in cost. In 2008,
all greenchop treatments were lower in cost than either purchased alfalfa or Tifton 85
hays as dietary forage sources. Even the most expensive greenchop option (35 d) was
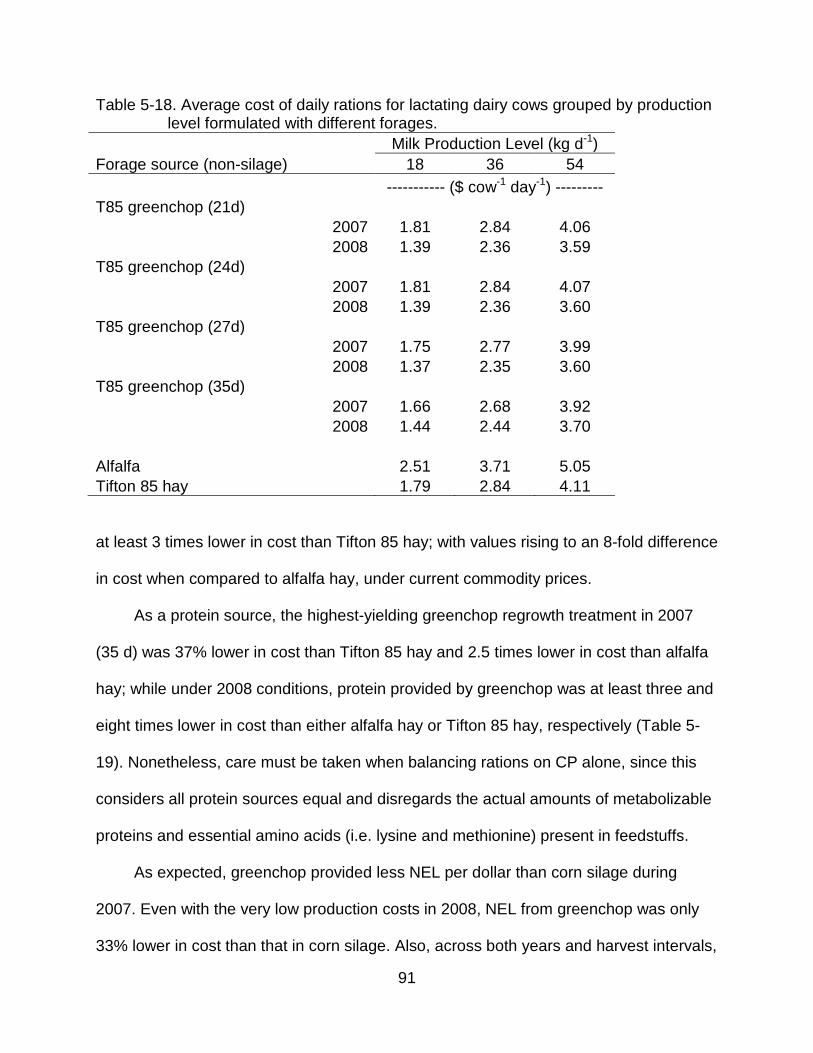
91
Table 5-18. Average cost of daily rations for lactating dairy cows grouped by production level formulated with different forages.
Milk Production Level (kg d-1) Forage source (non-silage) 18 36 54 ----------- ($ cow-1 day-1) --------- T85 greenchop (21d)
2007 1.81 2.84 4.06 2008 1.39 2.36 3.59
T85 greenchop (24d) 2007 1.81 2.84 4.07 2008 1.39 2.36 3.60
T85 greenchop (27d) 2007 1.75 2.77 3.99 2008 1.37 2.35 3.60
T85 greenchop (35d) 2007 1.66 2.68 3.92 2008 1.44 2.44 3.70
Alfalfa 2.51 3.71 5.05 Tifton 85 hay 1.79 2.84 4.11
at least 3 times lower in cost than Tifton 85 hay; with values rising to an 8-fold difference
in cost when compared to alfalfa hay, under current commodity prices.
As a protein source, the highest-yielding greenchop regrowth treatment in 2007
(35 d) was 37% lower in cost than Tifton 85 hay and 2.5 times lower in cost than alfalfa
hay; while under 2008 conditions, protein provided by greenchop was at least three and
eight times lower in cost than either alfalfa hay or Tifton 85 hay, respectively (Table 5-
19). Nonetheless, care must be taken when balancing rations on CP alone, since this
considers all protein sources equal and disregards the actual amounts of metabolizable
proteins and essential amino acids (i.e. lysine and methionine) present in feedstuffs.
As expected, greenchop provided less NEL per dollar than corn silage during
2007. Even with the very low production costs in 2008, NEL from greenchop was only
33% lower in cost than that in corn silage. Also, across both years and harvest intervals,
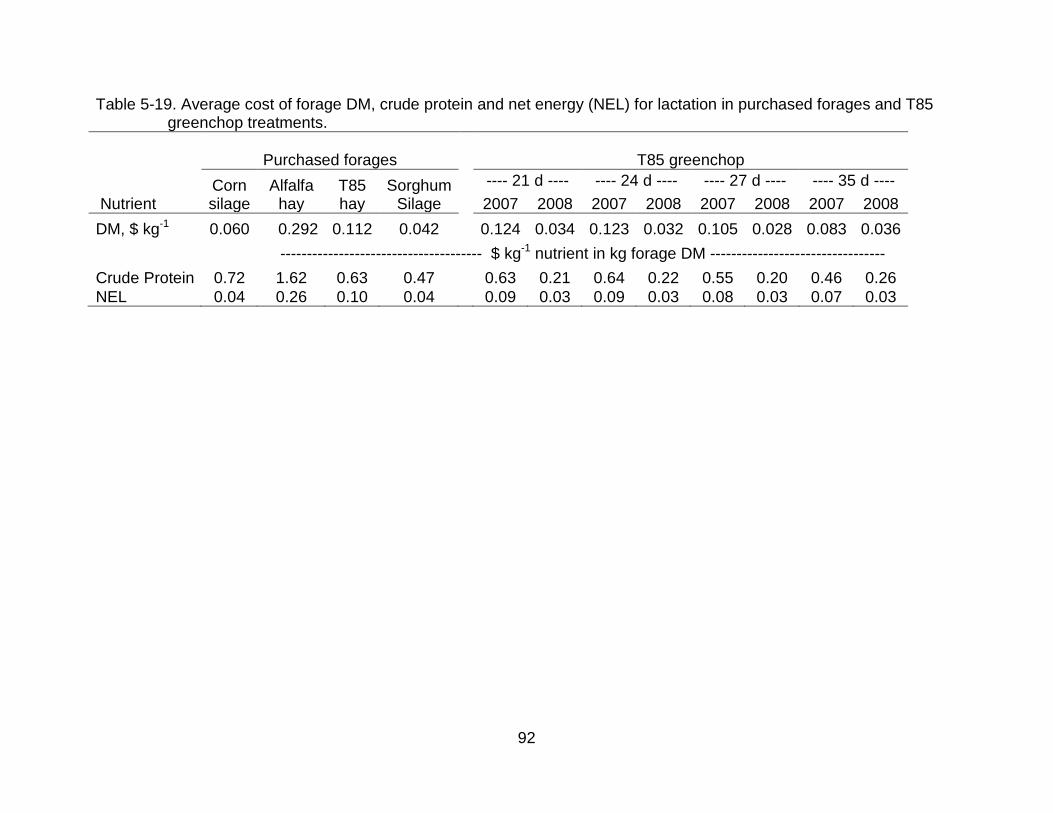
92
Table 5-19. Average cost of forage DM, crude protein and net energy (NEL) for lactation in purchased forages and T85 greenchop treatments.
Purchased forages
T85 greenchop Corn
silage Alfalfa
hay T85 hay
Sorghum Silage
---- 21 d ---- ---- 24 d ---- ---- 27 d ---- ---- 35 d ---- Nutrient 2007 2008 2007 2008 2007 2008 2007 2008 DM, $ kg-1 0.060 0.292 0.112 0.042 0.124 0.034 0.123 0.032 0.105 0.028 0.083 0.036
-------------------------------------- $ kg-1 nutrient in kg forage DM ---------------------------------
Crude Protein 0.72 1.62 0.63 0.47 0.63 0.21 0.64 0.22 0.55 0.20 0.46 0.26 NEL 0.04 0.26 0.10 0.04 0.09 0.03 0.09 0.03 0.08 0.03 0.07 0.03
93
purchased alfalfa hay and Tifton 85 hay were more expensive sources of NEL than
greenchop (Table 5-19). These low NEL costs suggests that Tifton 85 bermudagrass
greenchop treatments have the potential to at least partially substitute other high-quality
purchased forages in dairy rations, such as corn silage, alfalfa hay or Tifton 85 hay;
coinciding with previous findings by West et al. (1997) and Mandebvu et al. (1998) that
suggested that Tifton 85 can be an alternative to using alfalfa hay or corn silage.
Greenchop treatments selected by the program in 2007 (35 d) indicate that for
dairy production, harvest intervals that maximized DM yields were most profitable for
inclusion in dairy rations (Table 5-20). It is also important to mention that this treatment
was generally among the lowest in terms of CP and NEL, although the decline observed
in these parameters as harvest intervals increased was generally small (Table 5-17).
This suggests that for formulating rations for lactating dairy cows (under the 2007 cost
structure), the small decline in nutritive value attributed to longer harvest intervals of
Tifton 85 greenchop does not offset the greater DM yields obtained, possibly because
the rations already include high energy (e.g. corn silage) and protein (e.g. brewer’s
grains) feedstuffs. This hypothesis can be supported by results from dairy grazing trials.
When working with heavily supplemented dairy cows, Fontaneli et al. (2005) found that
Tifton 85 was of equal or superior economic value than pearl millet, a high-quality
summer annual grass, because of its longer growing season, high DM yields, lower
costs and reduced benefits of feeding greater quality forages to cows receiving
concentrates. Also, Fike et al. (2003) found that cows grazing Tifton 85 pastures
produced 29% more milk per unit land area than those grazing rhizoma peanut, a high-
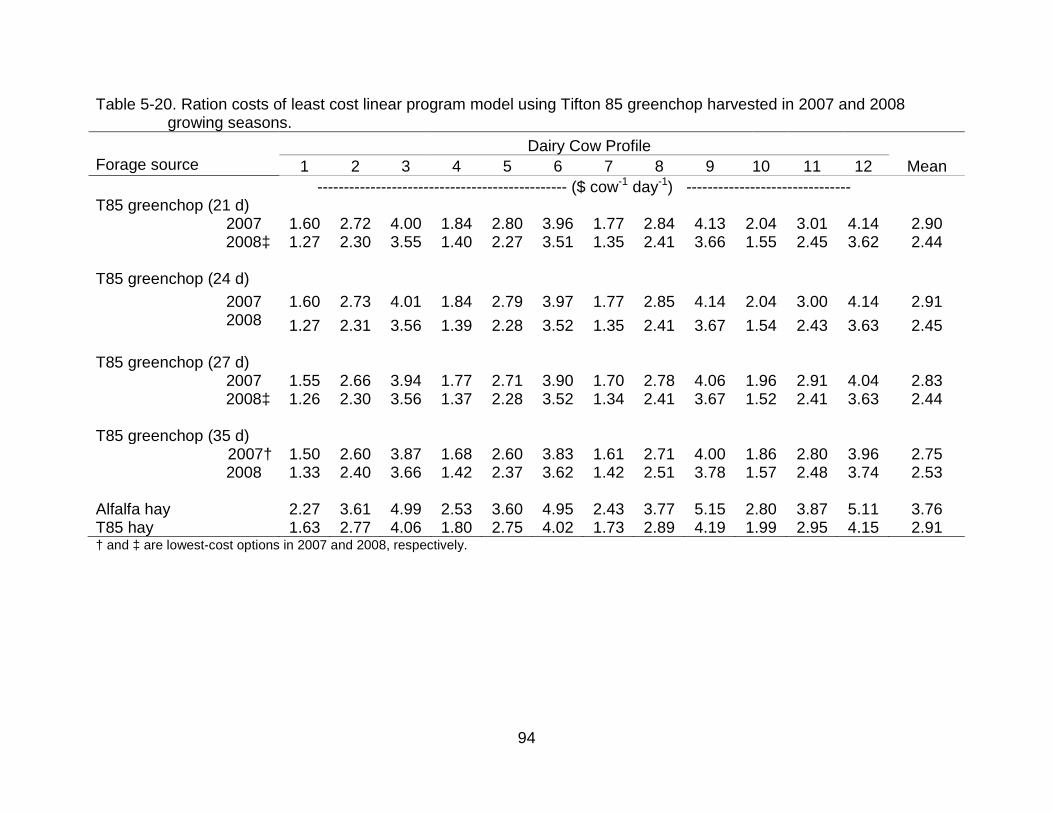
94
Table 5-20. Ration costs of least cost linear program model using Tifton 85 greenchop harvested in 2007 and 2008 growing seasons.
Dairy Cow Profile Forage source 1 2 3 4 5 6 7 8 9 10 11 12 Mean
----------------------------------------------- ($ cow-1 day-1 ) ------------------------------- T85 greenchop (21 d)
2007 1.60 2.72 4.00 1.84 2.80 3.96 1.77 2.84 4.13 2.04 3.01 4.14 2.90 2008‡ 1.27 2.30 3.55 1.40 2.27 3.51 1.35 2.41 3.66 1.55 2.45 3.62 2.44
T85 greenchop (24 d)
2007 1.60 2.73 4.01 1.84 2.79 3.97 1.77 2.85 4.14 2.04 3.00 4.14 2.91 2008 1.27 2.31 3.56 1.39 2.28 3.52 1.35 2.41 3.67 1.54 2.43 3.63 2.45
T85 greenchop (27 d)
2007 1.55 2.66 3.94 1.77 2.71 3.90 1.70 2.78 4.06 1.96 2.91 4.04 2.83 2008‡ 1.26 2.30 3.56 1.37 2.28 3.52 1.34 2.41 3.67 1.52 2.41 3.63 2.44
T85 greenchop (35 d)
2007† 1.50 2.60 3.87 1.68 2.60 3.83 1.61 2.71 4.00 1.86 2.80 3.96 2.75 2008 1.33 2.40 3.66 1.42 2.37 3.62 1.42 2.51 3.78 1.57 2.48 3.74 2.53
Alfalfa hay 2.27 3.61 4.99 2.53 3.60 4.95 2.43 3.77 5.15 2.80 3.87 5.11 3.76 T85 hay 1.63 2.77 4.06 1.80 2.75 4.02 1.73 2.89 4.19 1.99 2.95 4.15 2.91 † and ‡ are lowest-cost options in 2007 and 2008, respectively.
95
quality summer perennial legume, because of its high dry matter yields, tolerance to
grazing and high nutritive value.
In 2008, greenchop was selected over purchased forage options, although the
greenchop treatment selected depended on the production level of the dairy cow (Table
5-21). The model selected greenchop harvested at 27-d intervals for cows producing 18
kg milk d-1, while rations for cows producing 54 kg milk d-1 were formulated using
greenchop harvested at 21 d. For the intermediate milk producing level (36 kg milk d-1),
the model selected 21-d greenchop as the most feasible alternative for all profiles
except for profile 11, which refers to 3rd
Overall, average ration cost for high producing cows (54 kg d
lactation cows at 110 days into milk production.
Overall, the results suggest that because of the low production costs of Tifton 85
bermudagrass during 2008, the higher nutritive value of greenchop harvested at 21 d
offset its slightly higher DM costs (+ $0.006) compared to the lowest-cost harvest
interval, 27 d.
-1 of milk) when
greenchop was included ranged from $3.60 to $4.07 cow-1 day-1 (average = $3.79),
resulting in an average cost reduction of 25 and 8% when compared to rations
formulated using purchased alfalfa hay or Tifton 85 hay, respectively (Table 5-18). In
addition, ration costs for low producing cows (18 kg d-1
The reductions in ration costs observed are important for dairy profitability in
Florida, since rising feed costs have been identified as one of the most important issues
currently facing dairy producers in the state (Giesy et al., 2008). Currently, feed
of milk), were lowered on
average by 52 and 12% by using greenchop instead of alfalfa or Tifton 85 hay,
respectively.
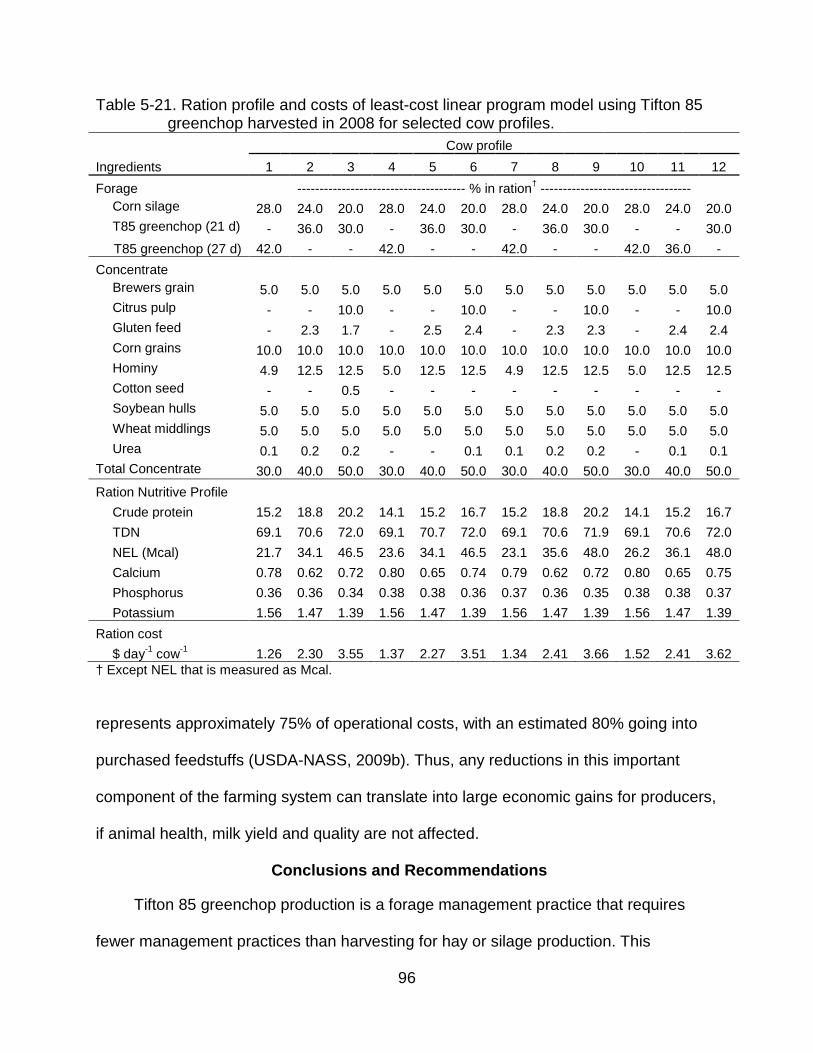
96
Table 5-21. Ration profile and costs of least-cost linear program model using Tifton 85 greenchop harvested in 2008 for selected cow profiles.
Cow profile Ingredients 1 2 3 4 5 6 7 8 9 10 11 12 Forage -------------------------------------- % in ration† ----------------------------------
Corn silage 28.0 24.0 20.0 28.0 24.0 20.0 28.0 24.0 20.0 28.0 24.0 20.0 T85 greenchop (21 d) - 36.0 30.0 - 36.0 30.0 - 36.0 30.0 - - 30.0 T85 greenchop (27 d) 42.0 - - 42.0 - - 42.0 - - 42.0 36.0 -
Concentrate Brewers grain 5.0 5.0 5.0 5.0 5.0 5.0 5.0 5.0 5.0 5.0 5.0 5.0 Citrus pulp - - 10.0 - - 10.0 - - 10.0 - - 10.0 Gluten feed - 2.3 1.7 - 2.5 2.4 - 2.3 2.3 - 2.4 2.4 Corn grains 10.0 10.0 10.0 10.0 10.0 10.0 10.0 10.0 10.0 10.0 10.0 10.0 Hominy 4.9 12.5 12.5 5.0 12.5 12.5 4.9 12.5 12.5 5.0 12.5 12.5 Cotton seed - - 0.5 - - - - - - - - - Soybean hulls 5.0 5.0 5.0 5.0 5.0 5.0 5.0 5.0 5.0 5.0 5.0 5.0 Wheat middlings 5.0 5.0 5.0 5.0 5.0 5.0 5.0 5.0 5.0 5.0 5.0 5.0 Urea 0.1 0.2 0.2 - - 0.1 0.1 0.2 0.2 - 0.1 0.1
Total Concentrate 30.0 40.0 50.0 30.0 40.0 50.0 30.0 40.0 50.0 30.0 40.0 50.0 Ration Nutritive Profile
Crude protein 15.2 18.8 20.2 14.1 15.2 16.7 15.2 18.8 20.2 14.1 15.2 16.7 TDN 69.1 70.6 72.0 69.1 70.7 72.0 69.1 70.6 71.9 69.1 70.6 72.0 NEL (Mcal) 21.7 34.1 46.5 23.6 34.1 46.5 23.1 35.6 48.0 26.2 36.1 48.0 Calcium 0.78 0.62 0.72 0.80 0.65 0.74 0.79 0.62 0.72 0.80 0.65 0.75 Phosphorus 0.36 0.36 0.34 0.38 0.38 0.36 0.37 0.36 0.35 0.38 0.38 0.37 Potassium 1.56 1.47 1.39 1.56 1.47 1.39 1.56 1.47 1.39 1.56 1.47 1.39
Ration cost
$ day-1 cow-1 1.26 2.30 3.55 1.37 2.27 3.51 1.34 2.41 3.66 1.52 2.41 3.62 † Except NEL that is measured as Mcal.
represents approximately 75% of operational costs, with an estimated 80% going into
purchased feedstuffs (USDA-NASS, 2009b). Thus, any reductions in this important
component of the farming system can translate into large economic gains for producers,
if animal health, milk yield and quality are not affected.
Conclusions and Recommendations
Tifton 85 greenchop production is a forage management practice that requires
fewer management practices than harvesting for hay or silage production. This
97
translates into lower production costs, since less machinery, inputs and labor are
required. From an agronomic perspective, fewer yield losses can be expected under
this form of utilization, since the forage is not left to dry in the field, as in hay production,
or placed in silos or other structures for preservation for further use. While the
comparison between haying and ensiling and greenchop may not be justified
completely, since they can have different purposes in feeding management, harvesting
Tifton 85 bermudagrass as greenchop is a potentially attractive alternative during the
summer growing season. In terms of production cost (per unit of DM weight),
differences existed between the budgets calculated with different harvest intervals.
Overall, more harvests imply more machinery, input and labor costs, and not always
lead to increased yields or biologically significant differences in nutritive value. Also,
given the high proportion of costs that go into fertilization, the source (manure vs.
inorganic fertilizer) can be an important consideration for producers wishing to maximize
the use of the resources at their disposal to reduce feeding costs.
With the lower production costs and high nutritive value that can be obtained with
managing Tifton 85 as greenchop, it is not surprising that its use can reduce the cost of
formulating rations for lactating dairy cows. This is mainly due to its high DM production
and nutritive value, which make it a relatively inexpensive source of energy for lactation
and protein, compared to other widely used purchased forage options. In addition,
greater amounts of forage can be fed to dairy cows using Tifton 85 greenchop than with
the other alternatives in the study, suggesting that this forage management practice can
be a viable alternative in Florida dairies.
98
Further research is warranted, particularly to understand the long-term effects of
this management on stand persistence, as well as evaluating the effects of fertilizer
source. Animal trials would also be critical to determine if high milk production levels
can be sustained using rations formulated with significant proportions of Tifton 85
greenchop, since previous research has show that silage from bermudagrass harvested
at 35-d regrowth intervals can reduce milk yields compared to cows fed elephantgrass
silage or corn silage (Ruiz et al., 1995). Also, comparative economical analysis of this
forage use should be made with other cropping systems and feeding alternatives.
99
CHAPTER 6 SUMMARY AND CONCLUSIONS
Defoliation management of forages is one of the most important activities that
producers control to obtain high yields and quality. Harvest interval and stubble height
are known to affect the accumulation of DM, the herbage nutritive value and the stand
persistence of hybrid bermudagrasses, but more information is needed to help guide
harvest management practices for producers in Florida. Thus, studies were conducted
during 2007 and 2008 to determine the effects of harvest interval and stubble height on
DM yields, soil N and P removal and herbage nutritive value of Tifton 85 bermudagrass.
In addition, a least-cost ration formulation linear program was developed in order to
assess the economic impact of incorporating Tifton 85 greenchop in lactating dairy cow
rations.
In terms of DM yields, year by stubble height and year by harvest interval
interactions were detected. Across years, the 8-cm stubble height produced more DM
than the 16-cm level, although this difference was greater under the water and N-
restricted conditions in 2008, where the short stubble produced 30% more DM than the
tall stubble, compared to a 9% difference between heights in 2007. In 2007, total yields
were consistently greater as the harvest interval was reduced from 21 to 35 d (linear
effect), suggesting that longer periods between harvests maximize DM yields. In
contrast, during 2008 yields showed a cubic response to harvest interval, with the
highest values observed for 27 d and lowest under 35-d intervals.
Also, DM yields varied throughout the year in response to varying environmental
conditions. Overall, greater yields were typically present when conditions were most
conducive to vegetative growth, particularly in terms of water availability. While harvest
100
event × stubble height interactions were present in both years, the differences between
stubble heights for a given harvest event tended to be of a lower magnitude in 2007
than in 2008. In addition, DM yields obtained by leaving 16-cm stubble tended to be
more consistent throughout the season, possibly suggesting a management that may
be more beneficial for producers, because of greater dependability of yields.
Removal of N and P was highest for treatments with high DM yields in both years.
Consequently, 35- and 27-d harvests removed the most N and P in 2007 and 2008,
respectively. Stubble height main effects were found for N and P removal, with shorter
stubble heights removing more N and P. Furthermore, 35-d harvests in 2007 removed
22% of applied P and 2.1 times as much N as was applied in either manure or manure
irrigation water, suggesting that Tifton 85 can be a an important tool for
phytoremediation in dairy sprayfields.
Across both years of the study, herbage nutritive value tended to decline with
longer harvest intervals, while appearing to be fairly homogenous between the stubble
heights tested, even when grown under contrasting fertilization and soil moisture
regimes. Also, total crude protein concentration was lowest at 35 d intervals, although
values dropped only after 27 d in 2007, while in 2008 the decline began after 21-d
harvests. Seasonally, more variability in CP concentrations was detected in 2008 than
in 2007, likely a consequence of the lower soil nutrient levels and more marked water
stress conditions. It also should be noted that overall, CP concentrations were highest
under 2007 conditions than in 2008, further highlighting the benefits of supplying
fertilization and irrigation. In relation to phosphorus concentration, although differences
were found among harvest intervals, in both years concentrations remained fairly stable,
101
and corresponded to values reported in other bermudagrass studies. Concerning
digestibility, IVDOM decreased linearly and at similar rates from 21- to 35-d intervals in
both years. Nonetheless, the decline in digestibility between these harvest intervals did
not surpass 11%. Additionally, no differences were found between stubble heights in
either year. Although some harvest events × stubble height interactions were detected
within harvest interval, the variation in digestibility was relatively low for the most part. In
general, IVDOM was greater and more stable in 2007, suggesting that greater nutrient
availability and better soil moisture favor forage digestibility. Also the low variability
observed across stubble heights and harvest intervals throughout the season suggests
that across different growing conditions, Tifton 85 bermudagrass can produce
dependably highly digestible herbage that could help meet the nutritional requirements
of lactating dairy cows.
Neutral detergent fiber concentrations increased with decreasing harvest interval
from 21- to 35-d, and were greater for 16-cm stubble than 8-cm stubble at 21-d
harvests. While the reasons for the difference between stubble heights at 21-d harvests
is unclear, the differences among harvest intervals could be explained by a greater
accumulation of secondary cell wall components, a larger proportion of senescing or
dead material, or a reduction in leaf to stem ratio with the onset of maturity. Overall, the
increase in NDF concentration with longer harvest intervals, when present, was
relatively small. This homogeneity between intervals can be an important advantage for
producers utilizing Tifton 85 in lactating dairy cow rations, since no major adjustments in
formulation would need to be made in order to maintain optimum NDF diet
102
concentrations, although the NEL concentration will likely decline between 21- and 35-d
intervals.
When compared to other harvest options, greenchop production requires fewer
activities than harvesting for hay or silage production. This translates into lower
production costs, since less machinery, inputs and labor are required. Also feeding
freshly cut forage avoids the yield losses associated with conserved forages. However,
utilizing forages as greenchop does little to solve forage availability issues in seasons of
low forge production. Nonetheless, Tifton 85 bermudagrass used as greenchop is a
potentially attractive alternative during the summer growing season. In terms of
production costs (per unit weight), more harvests per season resulted in more
machinery, input and labor costs, and did not always result in significant improvements
in nutritive value. Also, given the high proportion of costs that go to supplying crop
nutrients, the source of fertilizer can be an important consideration for producers
wishing to lower production costs. Producers should take advantage of the readily-
available manure.
Compared to the purchased forage options available to producers in the state
based on 2009 prices, incorporating on-farm grown Tifton 85 greenchop can reduce
ration costs for a wide range of lactating dairy cows. This is mainly due to its high DM
production and nutritive value, which make it a relatively inexpensive source of energy
and protein for lactation, suggesting that this forage management practice can be a
viable alternative in Florida dairies.

103
Dairymen could potentially decrease feeding cost by substituting a portion of the
rations with on-farm grown Tifton 85 greenchop, and in the process reduce nutrient
inputs and remove excess N and P from dairy sprayfields.
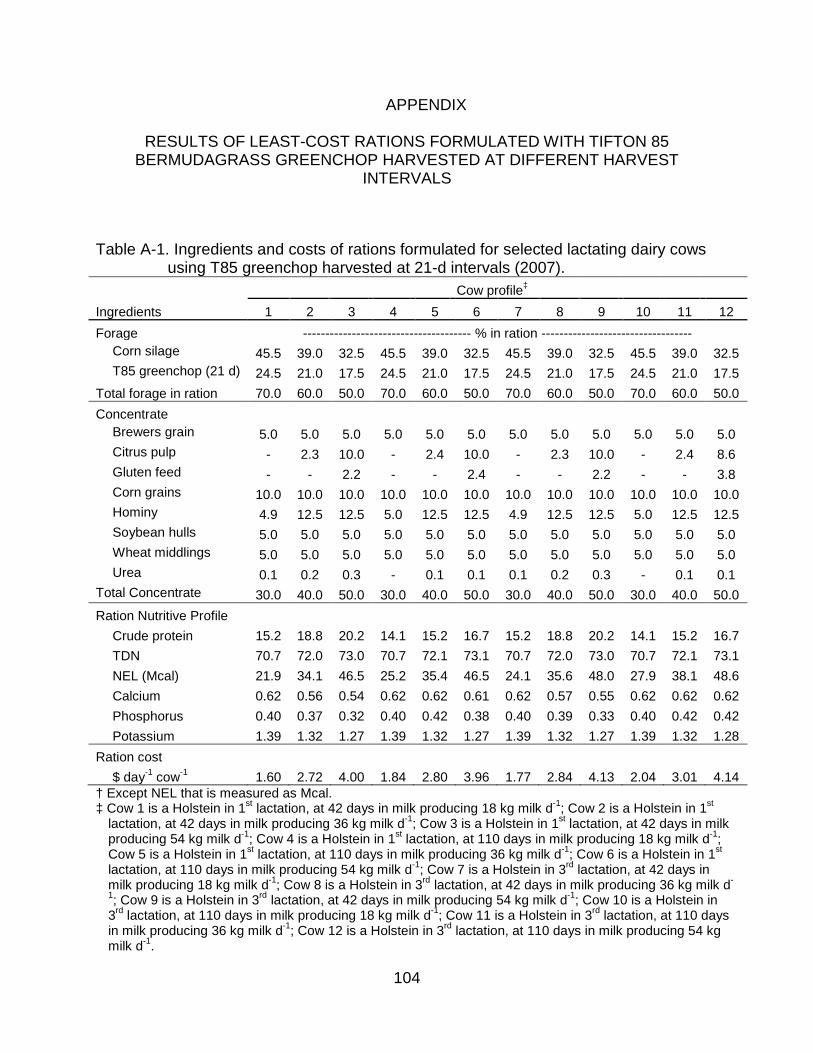
104
APPENDIX
RESULTS OF LEAST-COST RATIONS FORMULATED WITH TIFTON 85 BERMUDAGRASS GREENCHOP HARVESTED AT DIFFERENT HARVEST
INTERVALS
Table A-1. Ingredients and costs of rations formulated for selected lactating dairy cows using T85 greenchop harvested at 21-d intervals (2007).
Cow profile‡ Ingredients 1 2 3 4 5 6 7 8 9 10 11 12 Forage -------------------------------------- % in ration ----------------------------------
Corn silage 45.5 39.0 32.5 45.5 39.0 32.5 45.5 39.0 32.5 45.5 39.0 32.5 T85 greenchop (21 d) 24.5 21.0 17.5 24.5 21.0 17.5 24.5 21.0 17.5 24.5 21.0 17.5
Total forage in ration 70.0 60.0 50.0 70.0 60.0 50.0 70.0 60.0 50.0 70.0 60.0 50.0 Concentrate
Brewers grain 5.0 5.0 5.0 5.0 5.0 5.0 5.0 5.0 5.0 5.0 5.0 5.0 Citrus pulp - 2.3 10.0 - 2.4 10.0 - 2.3 10.0 - 2.4 8.6 Gluten feed - - 2.2 - - 2.4 - - 2.2 - - 3.8 Corn grains 10.0 10.0 10.0 10.0 10.0 10.0 10.0 10.0 10.0 10.0 10.0 10.0 Hominy 4.9 12.5 12.5 5.0 12.5 12.5 4.9 12.5 12.5 5.0 12.5 12.5 Soybean hulls 5.0 5.0 5.0 5.0 5.0 5.0 5.0 5.0 5.0 5.0 5.0 5.0 Wheat middlings 5.0 5.0 5.0 5.0 5.0 5.0 5.0 5.0 5.0 5.0 5.0 5.0 Urea 0.1 0.2 0.3 - 0.1 0.1 0.1 0.2 0.3 - 0.1 0.1
Total Concentrate 30.0 40.0 50.0 30.0 40.0 50.0 30.0 40.0 50.0 30.0 40.0 50.0 Ration Nutritive Profile
Crude protein 15.2 18.8 20.2 14.1 15.2 16.7 15.2 18.8 20.2 14.1 15.2 16.7 TDN 70.7 72.0 73.0 70.7 72.1 73.1 70.7 72.0 73.0 70.7 72.1 73.1 NEL (Mcal) 21.9 34.1 46.5 25.2 35.4 46.5 24.1 35.6 48.0 27.9 38.1 48.6 Calcium 0.62 0.56 0.54 0.62 0.62 0.61 0.62 0.57 0.55 0.62 0.62 0.62 Phosphorus 0.40 0.37 0.32 0.40 0.42 0.38 0.40 0.39 0.33 0.40 0.42 0.42 Potassium 1.39 1.32 1.27 1.39 1.32 1.27 1.39 1.32 1.27 1.39 1.32 1.28
Ration cost
$ day-1 cow-1 1.60 2.72 4.00 1.84 2.80 3.96 1.77 2.84 4.13 2.04 3.01 4.14 † Except NEL that is measured as Mcal. ‡ Cow 1 is a Holstein in 1st lactation, at 42 days in milk producing 18 kg milk d-1; Cow 2 is a Holstein in 1st
lactation, at 42 days in milk producing 36 kg milk d-1; Cow 3 is a Holstein in 1st lactation, at 42 days in milk producing 54 kg milk d-1; Cow 4 is a Holstein in 1st lactation, at 110 days in milk producing 18 kg milk d-1; Cow 5 is a Holstein in 1st lactation, at 110 days in milk producing 36 kg milk d-1; Cow 6 is a Holstein in 1st lactation, at 110 days in milk producing 54 kg milk d-1; Cow 7 is a Holstein in 3rd lactation, at 42 days in milk producing 18 kg milk d-1; Cow 8 is a Holstein in 3rd lactation, at 42 days in milk producing 36 kg milk d-
1; Cow 9 is a Holstein in 3rd lactation, at 42 days in milk producing 54 kg milk d-1; Cow 10 is a Holstein in 3rd lactation, at 110 days in milk producing 18 kg milk d-1; Cow 11 is a Holstein in 3rd lactation, at 110 days in milk producing 36 kg milk d-1; Cow 12 is a Holstein in 3rd lactation, at 110 days in milk producing 54 kg milk d-1.

105
Table A-2. Ingredients and costs of rations formulated for selected lactating dairy cows using T85 greenchop harvested 24-d intervals (2007)
Cow profile‡ Ingredients 1 2 3 4 5 6 7 8 9 10 11 12 Forage -------------------------------------- % in ration ----------------------------------
Corn silage 45.5 39.0 32.5 45.5 39.0 32.5 45.5 39.0 32.5 45.5 39.0 32.5 T85 greenchop (24 d) 24.5 21.0 17.5 24.5 21.0 17.5 24.5 21.0 17.5 24.5 21.0 17.5
Total forage in ration 70.0 60.0 50.0 70.0 60.0 50.0 70.0 60.0 50.0 70.0 60.0 50.0 Concentrate
Brewers grain 5.0 5.0 5.0 5.0 5.0 5.0 5.0 5.0 5.0 5.0 5.0 5.0 Citrus pulp - 2.3 10.0 - 2.4 10.0 - 2.3 10.0 - 2.4 8.5 Gluten feed - - 2.2 - - 2.4 - - 2.2 - - 3.8 Corn grains 10.0 10.0 10.0 10.0 10.0 10.0 10.0 10.0 10.0 10.0 10.0 10.0 Hominy 4.9 12.5 12.5 5.0 12.5 12.5 4.9 12.5 12.5 5.0 12.5 12.5 Soybean hulls 5.0 5.0 5.0 5.0 5.0 5.0 5.0 5.0 5.0 5.0 5.0 5.0 Wheat middlings 5.0 5.0 5.0 5.0 5.0 5.0 5.0 5.0 5.0 5.0 5.0 5.0 Urea 0.1 0.2 0.3 - 0.1 0.1 0.1 0.2 0.3 - 0.1 0.1
Total Concentrate 30.0 40.0 50.0 30.0 40.0 50.0 30.0 40.0 50.0 30.0 40.0 50.0 Ration Nutritive Profile
Crude protein 15.2 18.8 20.2 14.1 15.2 16.7 15.2 18.8 20.2 14.1 15.2 16.7 TDN 70.7 72.0 73.0 70.7 72.1 73.1 70.7 72.0 73.0 70.7 72.1 73.1 NEL (Mcal) 21.7 34.1 46.5 25.1 35.3 46.5 24.0 35.6 48.0 27.8 37.9 48.4 Calcium 0.62 0.55 0.54 0.62 0.62 0.61 0.62 0.57 0.55 0.62 0.62 0.62 Phosphorus 0.40 0.37 0.32 0.40 0.42 0.37 0.40 0.38 0.33 0.40 0.42 0.42 Potassium 1.39 1.32 1.27 1.39 1.32 1.27 1.39 1.32 1.27 1.39 1.32 1.28
Ration cost
$ day-1 cow-1 1.60 2.73 4.01 1.84 2.79 3.97 1.77 2.85 4.14 2.04 3.00 4.14 † Except NEL that is measured as Mcal. ‡ Cow 1 is a Holstein in 1st lactation, at 42 days in milk producing 18 kg milk d-1; Cow 2 is a Holstein in 1st
lactation, at 42 days in milk producing 36 kg milk d-1; Cow 3 is a Holstein in 1st lactation, at 42 days in milk producing 54 kg milk d-1; Cow 4 is a Holstein in 1st lactation, at 110 days in milk producing 18 kg milk d-1; Cow 5 is a Holstein in 1st lactation, at 110 days in milk producing 36 kg milk d-1; Cow 6 is a Holstein in 1st lactation, at 110 days in milk producing 54 kg milk d-1; Cow 7 is a Holstein in 3rd lactation, at 42 days in milk producing 18 kg milk d-1; Cow 8 is a Holstein in 3rd lactation, at 42 days in milk producing 36 kg milk d-
1; Cow 9 is a Holstein in 3rd lactation, at 42 days in milk producing 54 kg milk d-1; Cow 10 is a Holstein in 3rd lactation, at 110 days in milk producing 18 kg milk d-1; Cow 11 is a Holstein in 3rd lactation, at 110 days in milk producing 36 kg milk d-1; Cow 12 is a Holstein in 3rd lactation, at 110 days in milk producing 54 kg milk d-1.
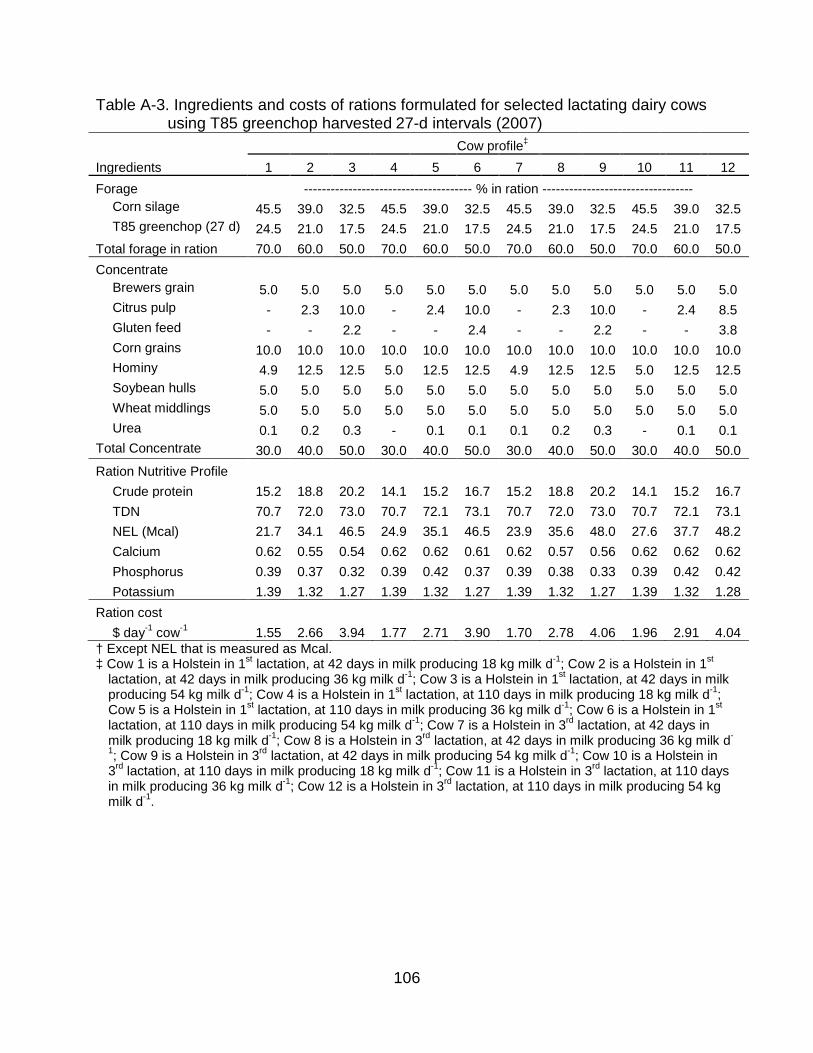
106
Table A-3. Ingredients and costs of rations formulated for selected lactating dairy cows using T85 greenchop harvested 27-d intervals (2007)
Cow profile‡ Ingredients 1 2 3 4 5 6 7 8 9 10 11 12 Forage -------------------------------------- % in ration ----------------------------------
Corn silage 45.5 39.0 32.5 45.5 39.0 32.5 45.5 39.0 32.5 45.5 39.0 32.5 T85 greenchop (27 d) 24.5 21.0 17.5 24.5 21.0 17.5 24.5 21.0 17.5 24.5 21.0 17.5
Total forage in ration 70.0 60.0 50.0 70.0 60.0 50.0 70.0 60.0 50.0 70.0 60.0 50.0 Concentrate
Brewers grain 5.0 5.0 5.0 5.0 5.0 5.0 5.0 5.0 5.0 5.0 5.0 5.0 Citrus pulp - 2.3 10.0 - 2.4 10.0 - 2.3 10.0 - 2.4 8.5 Gluten feed - - 2.2 - - 2.4 - - 2.2 - - 3.8 Corn grains 10.0 10.0 10.0 10.0 10.0 10.0 10.0 10.0 10.0 10.0 10.0 10.0 Hominy 4.9 12.5 12.5 5.0 12.5 12.5 4.9 12.5 12.5 5.0 12.5 12.5 Soybean hulls 5.0 5.0 5.0 5.0 5.0 5.0 5.0 5.0 5.0 5.0 5.0 5.0 Wheat middlings 5.0 5.0 5.0 5.0 5.0 5.0 5.0 5.0 5.0 5.0 5.0 5.0 Urea 0.1 0.2 0.3 - 0.1 0.1 0.1 0.2 0.3 - 0.1 0.1
Total Concentrate 30.0 40.0 50.0 30.0 40.0 50.0 30.0 40.0 50.0 30.0 40.0 50.0 Ration Nutritive Profile
Crude protein 15.2 18.8 20.2 14.1 15.2 16.7 15.2 18.8 20.2 14.1 15.2 16.7 TDN 70.7 72.0 73.0 70.7 72.1 73.1 70.7 72.0 73.0 70.7 72.1 73.1 NEL (Mcal) 21.7 34.1 46.5 24.9 35.1 46.5 23.9 35.6 48.0 27.6 37.7 48.2 Calcium 0.62 0.55 0.54 0.62 0.62 0.61 0.62 0.57 0.56 0.62 0.62 0.62 Phosphorus 0.39 0.37 0.32 0.39 0.42 0.37 0.39 0.38 0.33 0.39 0.42 0.42 Potassium 1.39 1.32 1.27 1.39 1.32 1.27 1.39 1.32 1.27 1.39 1.32 1.28
Ration cost
$ day-1 cow-1 1.55 2.66 3.94 1.77 2.71 3.90 1.70 2.78 4.06 1.96 2.91 4.04 † Except NEL that is measured as Mcal. ‡ Cow 1 is a Holstein in 1st lactation, at 42 days in milk producing 18 kg milk d-1; Cow 2 is a Holstein in 1st
lactation, at 42 days in milk producing 36 kg milk d-1; Cow 3 is a Holstein in 1st lactation, at 42 days in milk producing 54 kg milk d-1; Cow 4 is a Holstein in 1st lactation, at 110 days in milk producing 18 kg milk d-1; Cow 5 is a Holstein in 1st lactation, at 110 days in milk producing 36 kg milk d-1; Cow 6 is a Holstein in 1st lactation, at 110 days in milk producing 54 kg milk d-1; Cow 7 is a Holstein in 3rd lactation, at 42 days in milk producing 18 kg milk d-1; Cow 8 is a Holstein in 3rd lactation, at 42 days in milk producing 36 kg milk d-
1; Cow 9 is a Holstein in 3rd lactation, at 42 days in milk producing 54 kg milk d-1; Cow 10 is a Holstein in 3rd lactation, at 110 days in milk producing 18 kg milk d-1; Cow 11 is a Holstein in 3rd lactation, at 110 days in milk producing 36 kg milk d-1; Cow 12 is a Holstein in 3rd lactation, at 110 days in milk producing 54 kg milk d-1
.

107
Table A-4. Ingredients and costs of rations formulated for selected lactating dairy cows using T85 greenchop harvested 35-d intervals (2007).
Cow profile‡
Ingredients 1 2 3 4 5 6 7 8 9 10 11 12 Forage -------------------------------------- % in ration ----------------------------------
Corn silage 45.5 39.0 32.5 45.5 39.0 32.5 45.5 39.0 32.5 45.5 39.0 32.5 T85 greenchop (35 d) 24.5 21.0 17.5 24.5 21.0 17.5 24.5 21.0 17.5 24.5 21.0 17.5
Total forage in ration 70.0 60.0 50.0 70.0 60.0 50.0 70.0 60.0 50.0 70.0 60.0 50.0 Concentrate
Brewers grain 5.0 5.0 5.0 5.0 5.0 5.0 5.0 5.0 5.0 5.0 5.0 5.0 Citrus pulp - 2.3 10.0 - 2.4 10.0 - 2.3 10.0 - 2.4 10.0 Gluten feed - - 2.2 - - 2.4 - - 2.2 - - 2.4 Corn grains 10.0 10.0 10.0 10.0 10.0 10.0 10.0 10.0 10.0 10.0 10.0 10.0 Hominy 4.9 12.5 12.5 5.0 12.5 12.5 4.9 12.5 12.5 5.0 12.5 12.5 Soybean hulls 5.0 5.0 5.0 5.0 5.0 5.0 5.0 5.0 5.0 5.0 5.0 5.0 Wheat middlings 5.0 5.0 5.0 5.0 5.0 5.0 5.0 5.0 5.0 5.0 5.0 5.0 Urea 0.1 0.2 0.3 - 0.1 0.1 0.1 0.2 0.3 - 0.1 0.1
Total Concentrate 30.0 40.0 50.0 30.0 40.0 50.0 30.0 40.0 50.0 30.0 40.0 50.0 Ration Nutritive Profile
Crude protein 15.2 18.8 20.2 14.1 15.2 16.7 15.2 18.8 20.2 14.1 15.2 16.7 TDN 70.7 72.0 73.0 70.7 72.1 73.1 70.7 72.0 73.0 70.7 72.1 73.1 NEL (Mcal) 21.7 34.1 46.5 24.4 34.5 46.5 23.4 35.6 48.0 27.1 37.1 48.0 Calcium 0.60 0.54 0.54 0.62 0.62 0.60 0.62 0.56 0.55 0.62 0.62 0.62 Phosphorus 0.38 0.36 0.32 0.39 0.42 0.37 0.39 0.38 0.32 0.39 0.42 0.38 Potassium 1.39 1.32 1.27 1.39 1.32 1.27 1.39 1.32 1.27 1.39 1.32 1.27
Ration cost $ day-1 cow-1 1.50 2.60 3.87 1.68 2.60 3.83 1.61 2.71 4.00 1.86 2.80 3.96
† Except NEL that is measured as Mcal. ‡ Cow 1 is a Holstein in 1st lactation, at 42 days in milk producing 18 kg milk d-1; Cow 2 is a Holstein in 1st
lactation, at 42 days in milk producing 36 kg milk d-1; Cow 3 is a Holstein in 1st lactation, at 42 days in milk producing 54 kg milk d-1; Cow 4 is a Holstein in 1st lactation, at 110 days in milk producing 18 kg milk d-1; Cow 5 is a Holstein in 1st lactation, at 110 days in milk producing 36 kg milk d-1; Cow 6 is a Holstein in 1st lactation, at 110 days in milk producing 54 kg milk d-1; Cow 7 is a Holstein in 3rd lactation, at 42 days in milk producing 18 kg milk d-1; Cow 8 is a Holstein in 3rd lactation, at 42 days in milk producing 36 kg milk d-
1; Cow 9 is a Holstein in 3rd lactation, at 42 days in milk producing 54 kg milk d-1; Cow 10 is a Holstein in 3rd lactation, at 110 days in milk producing 18 kg milk d-1; Cow 11 is a Holstein in 3rd lactation, at 110 days in milk producing 36 kg milk d-1; Cow 12 is a Holstein in 3rd lactation, at 110 days in milk producing 54 kg milk d-1
.

108
Table A-5. Ingredients and costs of rations formulated for selected lactating dairy cows using T85 greenchop harvested 21-d intervals (2008).
Cow profile‡
Ingredients 1 2 3 4 5 6 7 8 9 10 11 12 Forage -------------------------------------- % in ration ----------------------------------
Corn silage 28.0 24.0 20.0 28.0 24.0 20.0 28.0 24.0 20.0 28.0 24.0 20.0 T85 greenchop (21d) 42.0 36.0 30.0 42.0 36.0 30.0 42.0 36.0 30.0 42.0 36.0 30.0
Total forage in ration 70.0 60.0 50.0 70.0 60.0 50.0 70.0 60.0 50.0 70.0 60.0 50.0 Concentrate
Brewers grain 5.0 5.0 5.0 5.0 5.0 5.0 5.0 5.0 5.0 5.0 5.0 5.0 Citrus pulp - - 10.0 - 0.0 10.0 - - 10.0 - - 10.0 Gluten feed - 2.3 1.7 - 2.5 2.4 - 2.3 2.3 - 2.5 2.4 Corn grains 10.0 10.0 10.0 10.0 10.0 10.0 10.0 10.0 10.0 10.0 10.0 10.0 Hominy 4.9 12.5 12.5 5.0 12.5 12.5 4.9 12.5 12.5 5.0 12.5 12.5 Soybean hulls 5.0 5.0 5.0 5.0 5.0 5.0 5.0 5.0 5.0 5.0 5.0 5.0 Wheat middlings 5.0 5.0 5.0 5.0 5.0 5.0 5.0 5.0 5.0 5.0 5.0 5.0 Urea - 0.2 0.2 - - 0.1 - 0.2 0.2 - - 0.1
Total Concentrate 30.0 40.0 50.0 30.0 40.0 50.0 30.0 40.0 50.0 30.0 40.0 50.0 Ration Nutritive Profile
Crude protein 15.2 18.8 20.2 14.1 15.2 16.7 15.2 18.8 20.2 14.1 15.2 16.7 TDN 69.1 70.6 72.0 69.2 70.7 72.0 69.1 70.6 71.9 69.2 70.7 72.0 NEL (Mcal) 21.7 34.1 46.5 24.1 34.1 46.5 23.1 35.6 48.0 26.7 36.7 48.0 Calcium 0.79 0.62 0.72 0.80 0.65 0.74 0.80 0.62 0.72 0.80 0.65 0.75 Phosphorus 0.37 0.36 0.34 0.38 0.38 0.36 0.38 0.36 0.35 0.38 0.38 0.37 Potassium 1.56 1.47 1.39 1.56 1.47 1.39 1.56 1.47 1.39 1.56 1.47 1.39
Ration cost $ day-1 cow-1 1.27 2.30 3.55 1.40 2.27 3.51 1.35 2.41 3.66 1.55 2.45 3.62
† Except NEL that is measured as Mcal. ‡ Cow 1 is a Holstein in 1st lactation, at 42 days in milk producing 18 kg milk d-1; Cow 2 is a Holstein in 1st
lactation, at 42 days in milk producing 36 kg milk d-1; Cow 3 is a Holstein in 1st lactation, at 42 days in milk producing 54 kg milk d-1; Cow 4 is a Holstein in 1st lactation, at 110 days in milk producing 18 kg milk d-1; Cow 5 is a Holstein in 1st lactation, at 110 days in milk producing 36 kg milk d-1; Cow 6 is a Holstein in 1st lactation, at 110 days in milk producing 54 kg milk d-1; Cow 7 is a Holstein in 3rd lactation, at 42 days in milk producing 18 kg milk d-1; Cow 8 is a Holstein in 3rd lactation, at 42 days in milk producing 36 kg milk d-
1; Cow 9 is a Holstein in 3rd lactation, at 42 days in milk producing 54 kg milk d-1; Cow 10 is a Holstein in 3rd lactation, at 110 days in milk producing 18 kg milk d-1; Cow 11 is a Holstein in 3rd lactation, at 110 days in milk producing 36 kg milk d-1; Cow 12 is a Holstein in 3rd lactation, at 110 days in milk producing 54 kg milk d-1
.

109
Table A-6. Ingredients and costs of rations formulated for selected lactating dairy cows using T85 greenchop harvested 24-d intervals (2008).
Cow profile‡
Ingredients 1 2 3 4 5 6 7 8 9 10 11 12 Forage -------------------------------------- % in ration ----------------------------------
Corn silage 28.0 24.0 20.0 28.0 24.0 20.0 28.0 24.0 20.0 28.0 24.0 20.0 T85 greenchop (24 d) 42.0 36.0 30.0 42.0 36.0 30.0 42.0 36.0 30.0 42.0 36.0 30.0
Total forage in ration 70.0 60.0 50.0 70.0 60.0 50.0 70.0 60.0 50.0 70.0 60.0 50.0 Concentrate
Brewers grain 5.0 5.0 5.0 5.0 5.0 5.0 5.0 5.0 5.0 5.0 5.0 5.0 Citrus pulp - - 10.0 - - 10.0 - - 10.0 - - 10.0 Gluten feed - 2.3 2.0 - 2.4 2.4 - 2.3 2.2 - 2.4 2.4 Corn grains 10.0 10.0 10.0 10.0 10.0 10.0 10.0 10.0 10.0 10.0 10.0 10.0 Hominy 4.9 12.5 12.5 5.0 12.5 12.5 4.9 12.5 12.5 5.0 12.5 12.5 Soybean hulls 5.0 5.0 5.0 5.0 5.0 5.0 5.0 5.0 5.0 5.0 5.0 5.0 Wheat middlings 5.0 5.0 5.0 5.0 5.0 5.0 5.0 5.0 5.0 5.0 5.0 5.0 Urea 0.1 0.2 0.3 - 0.1 0.1 0.1 0.2 0.3 - 0.1 0.1
Total Concentrate 30.0 40.0 50.0 30.0 40.0 50.0 30.0 40.0 50.0 30.0 40.0 50.0 Ration Nutritive Profile
Crude protein 15.2 18.8 20.2 14.1 15.2 16.7 15.2 18.8 20.2 14.1 15.2 16.7 TDN 69.1 70.6 71.9 69.1 70.6 72.0 69.1 70.6 71.9 69.1 70.6 72.0 NEL (Mcal) 21.7 34.1 46.5 23.9 34.1 46.5 23.1 35.6 48.0 26.5 36.4 48.0 Calcium 0.79 0.62 0.72 0.81 0.65 0.74 0.81 0.62 0.72 0.81 0.66 0.76 Phosphorus 0.36 0.35 0.34 0.38 0.38 0.36 0.38 0.35 0.34 0.38 0.38 0.37 Potassium 1.56 1.47 1.39 1.56 1.47 1.39 1.56 1.47 1.39 1.56 1.47 1.39
Ration cost $ day-1 cow-1 1.27 2.31 3.56 1.39 2.28 3.52 1.35 2.41 3.67 1.54 2.43 3.63
† Except NEL that is measured as Mcal. ‡ Cow 1 is a Holstein in 1st lactation, at 42 days in milk producing 18 kg milk d-1; Cow 2 is a Holstein in 1st
lactation, at 42 days in milk producing 36 kg milk d-1; Cow 3 is a Holstein in 1st lactation, at 42 days in milk producing 54 kg milk d-1; Cow 4 is a Holstein in 1st lactation, at 110 days in milk producing 18 kg milk d-1; Cow 5 is a Holstein in 1st lactation, at 110 days in milk producing 36 kg milk d-1; Cow 6 is a Holstein in 1st lactation, at 110 days in milk producing 54 kg milk d-1; Cow 7 is a Holstein in 3rd lactation, at 42 days in milk producing 18 kg milk d-1; Cow 8 is a Holstein in 3rd lactation, at 42 days in milk producing 36 kg milk d-
1; Cow 9 is a Holstein in 3rd lactation, at 42 days in milk producing 54 kg milk d-1; Cow 10 is a Holstein in 3rd lactation, at 110 days in milk producing 18 kg milk d-1; Cow 11 is a Holstein in 3rd lactation, at 110 days in milk producing 36 kg milk d-1; Cow 12 is a Holstein in 3rd lactation, at 110 days in milk producing 54 kg milk d-1
.
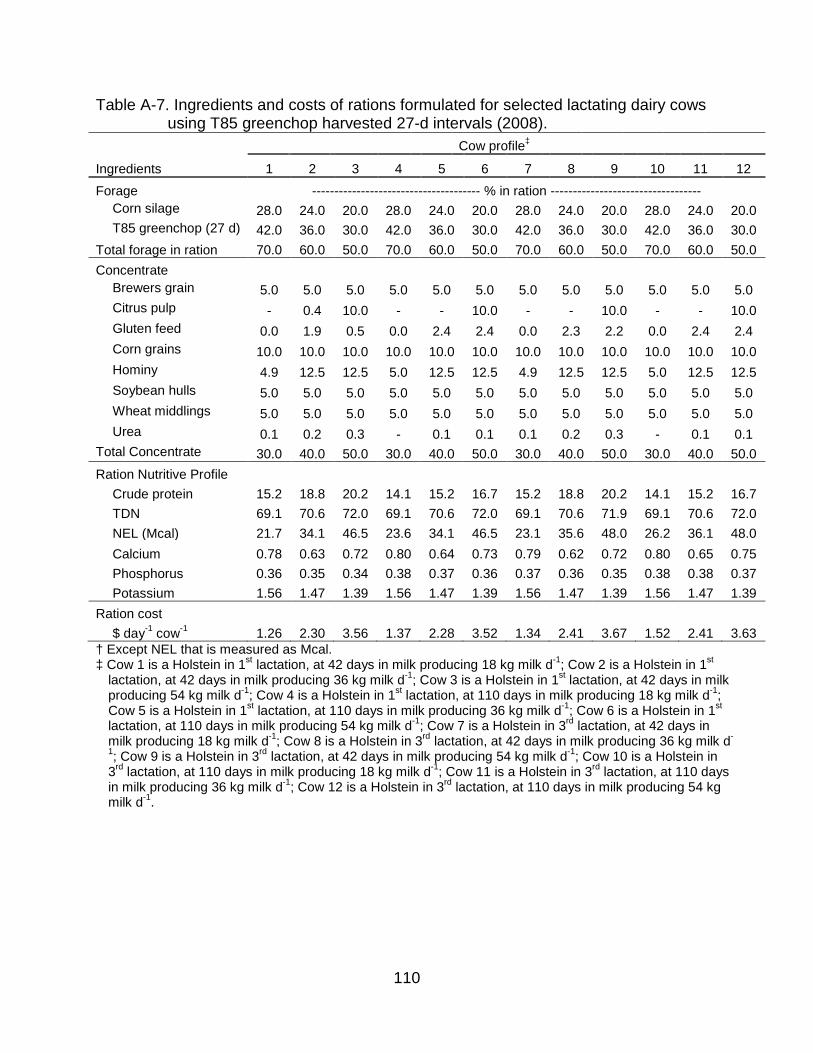
110
Table A-7. Ingredients and costs of rations formulated for selected lactating dairy cows using T85 greenchop harvested 27-d intervals (2008).
Cow profile‡
Ingredients 1 2 3 4 5 6 7 8 9 10 11 12 Forage -------------------------------------- % in ration ----------------------------------
Corn silage 28.0 24.0 20.0 28.0 24.0 20.0 28.0 24.0 20.0 28.0 24.0 20.0 T85 greenchop (27 d) 42.0 36.0 30.0 42.0 36.0 30.0 42.0 36.0 30.0 42.0 36.0 30.0
Total forage in ration 70.0 60.0 50.0 70.0 60.0 50.0 70.0 60.0 50.0 70.0 60.0 50.0 Concentrate
Brewers grain 5.0 5.0 5.0 5.0 5.0 5.0 5.0 5.0 5.0 5.0 5.0 5.0 Citrus pulp - 0.4 10.0 - - 10.0 - - 10.0 - - 10.0 Gluten feed 0.0 1.9 0.5 0.0 2.4 2.4 0.0 2.3 2.2 0.0 2.4 2.4 Corn grains 10.0 10.0 10.0 10.0 10.0 10.0 10.0 10.0 10.0 10.0 10.0 10.0 Hominy 4.9 12.5 12.5 5.0 12.5 12.5 4.9 12.5 12.5 5.0 12.5 12.5 Soybean hulls 5.0 5.0 5.0 5.0 5.0 5.0 5.0 5.0 5.0 5.0 5.0 5.0 Wheat middlings 5.0 5.0 5.0 5.0 5.0 5.0 5.0 5.0 5.0 5.0 5.0 5.0 Urea 0.1 0.2 0.3 - 0.1 0.1 0.1 0.2 0.3 - 0.1 0.1
Total Concentrate 30.0 40.0 50.0 30.0 40.0 50.0 30.0 40.0 50.0 30.0 40.0 50.0 Ration Nutritive Profile
Crude protein 15.2 18.8 20.2 14.1 15.2 16.7 15.2 18.8 20.2 14.1 15.2 16.7 TDN 69.1 70.6 72.0 69.1 70.6 72.0 69.1 70.6 71.9 69.1 70.6 72.0 NEL (Mcal) 21.7 34.1 46.5 23.6 34.1 46.5 23.1 35.6 48.0 26.2 36.1 48.0 Calcium 0.78 0.63 0.72 0.80 0.64 0.73 0.79 0.62 0.72 0.80 0.65 0.75 Phosphorus 0.36 0.35 0.34 0.38 0.37 0.36 0.37 0.36 0.35 0.38 0.38 0.37 Potassium 1.56 1.47 1.39 1.56 1.47 1.39 1.56 1.47 1.39 1.56 1.47 1.39
Ration cost $ day-1 cow-1 1.26 2.30 3.56 1.37 2.28 3.52 1.34 2.41 3.67 1.52 2.41 3.63
† Except NEL that is measured as Mcal. ‡ Cow 1 is a Holstein in 1st lactation, at 42 days in milk producing 18 kg milk d-1; Cow 2 is a Holstein in 1st
lactation, at 42 days in milk producing 36 kg milk d-1; Cow 3 is a Holstein in 1st lactation, at 42 days in milk producing 54 kg milk d-1; Cow 4 is a Holstein in 1st lactation, at 110 days in milk producing 18 kg milk d-1; Cow 5 is a Holstein in 1st lactation, at 110 days in milk producing 36 kg milk d-1; Cow 6 is a Holstein in 1st lactation, at 110 days in milk producing 54 kg milk d-1; Cow 7 is a Holstein in 3rd lactation, at 42 days in milk producing 18 kg milk d-1; Cow 8 is a Holstein in 3rd lactation, at 42 days in milk producing 36 kg milk d-
1; Cow 9 is a Holstein in 3rd lactation, at 42 days in milk producing 54 kg milk d-1; Cow 10 is a Holstein in 3rd lactation, at 110 days in milk producing 18 kg milk d-1; Cow 11 is a Holstein in 3rd lactation, at 110 days in milk producing 36 kg milk d-1; Cow 12 is a Holstein in 3rd lactation, at 110 days in milk producing 54 kg milk d-1
.
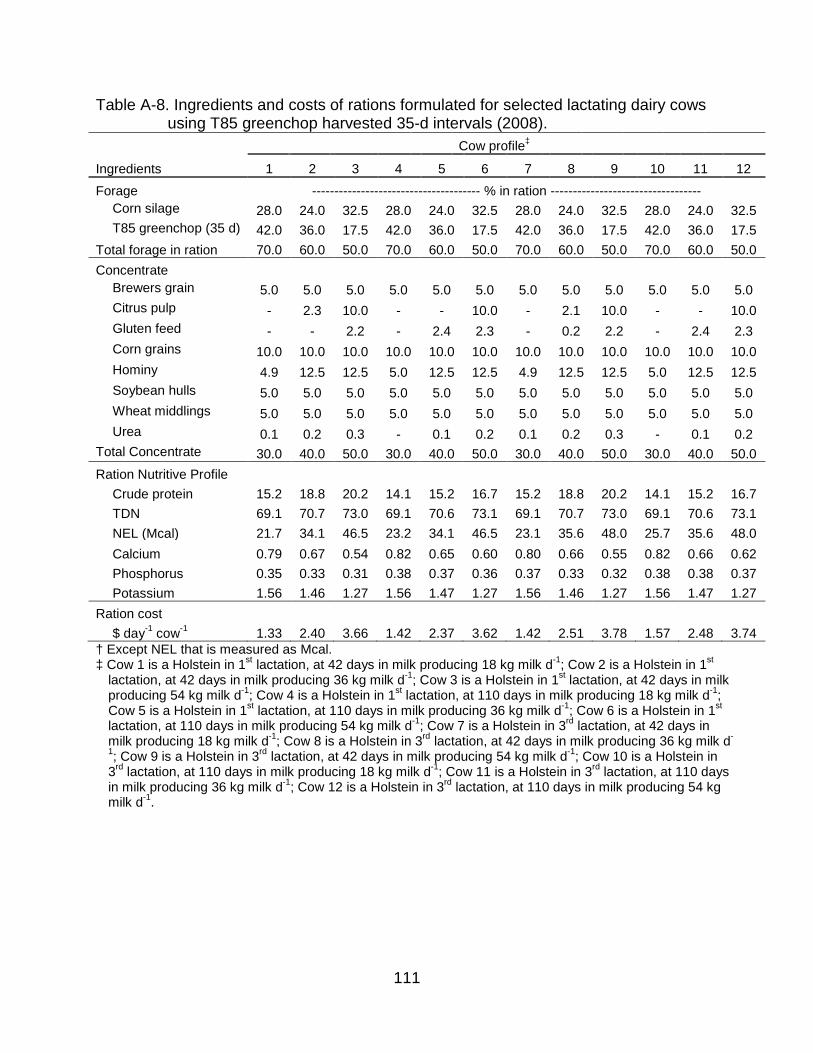
111
Table A-8. Ingredients and costs of rations formulated for selected lactating dairy cows using T85 greenchop harvested 35-d intervals (2008).
Cow profile‡
Ingredients 1 2 3 4 5 6 7 8 9 10 11 12 Forage -------------------------------------- % in ration ----------------------------------
Corn silage 28.0 24.0 32.5 28.0 24.0 32.5 28.0 24.0 32.5 28.0 24.0 32.5 T85 greenchop (35 d) 42.0 36.0 17.5 42.0 36.0 17.5 42.0 36.0 17.5 42.0 36.0 17.5
Total forage in ration 70.0 60.0 50.0 70.0 60.0 50.0 70.0 60.0 50.0 70.0 60.0 50.0 Concentrate
Brewers grain 5.0 5.0 5.0 5.0 5.0 5.0 5.0 5.0 5.0 5.0 5.0 5.0 Citrus pulp - 2.3 10.0 - - 10.0 - 2.1 10.0 - - 10.0 Gluten feed - - 2.2 - 2.4 2.3 - 0.2 2.2 - 2.4 2.3 Corn grains 10.0 10.0 10.0 10.0 10.0 10.0 10.0 10.0 10.0 10.0 10.0 10.0 Hominy 4.9 12.5 12.5 5.0 12.5 12.5 4.9 12.5 12.5 5.0 12.5 12.5 Soybean hulls 5.0 5.0 5.0 5.0 5.0 5.0 5.0 5.0 5.0 5.0 5.0 5.0 Wheat middlings 5.0 5.0 5.0 5.0 5.0 5.0 5.0 5.0 5.0 5.0 5.0 5.0 Urea 0.1 0.2 0.3 - 0.1 0.2 0.1 0.2 0.3 - 0.1 0.2
Total Concentrate 30.0 40.0 50.0 30.0 40.0 50.0 30.0 40.0 50.0 30.0 40.0 50.0 Ration Nutritive Profile
Crude protein 15.2 18.8 20.2 14.1 15.2 16.7 15.2 18.8 20.2 14.1 15.2 16.7 TDN 69.1 70.7 73.0 69.1 70.6 73.1 69.1 70.7 73.0 69.1 70.6 73.1 NEL (Mcal) 21.7 34.1 46.5 23.2 34.1 46.5 23.1 35.6 48.0 25.7 35.6 48.0 Calcium 0.79 0.67 0.54 0.82 0.65 0.60 0.80 0.66 0.55 0.82 0.66 0.62 Phosphorus 0.35 0.33 0.31 0.38 0.37 0.36 0.37 0.33 0.32 0.38 0.38 0.37 Potassium 1.56 1.46 1.27 1.56 1.47 1.27 1.56 1.46 1.27 1.56 1.47 1.27
Ration cost $ day-1 cow-1 1.33 2.40 3.66 1.42 2.37 3.62 1.42 2.51 3.78 1.57 2.48 3.74
† Except NEL that is measured as Mcal. ‡ Cow 1 is a Holstein in 1st lactation, at 42 days in milk producing 18 kg milk d-1; Cow 2 is a Holstein in 1st
lactation, at 42 days in milk producing 36 kg milk d-1; Cow 3 is a Holstein in 1st lactation, at 42 days in milk producing 54 kg milk d-1; Cow 4 is a Holstein in 1st lactation, at 110 days in milk producing 18 kg milk d-1; Cow 5 is a Holstein in 1st lactation, at 110 days in milk producing 36 kg milk d-1; Cow 6 is a Holstein in 1st lactation, at 110 days in milk producing 54 kg milk d-1; Cow 7 is a Holstein in 3rd lactation, at 42 days in milk producing 18 kg milk d-1; Cow 8 is a Holstein in 3rd lactation, at 42 days in milk producing 36 kg milk d-
1; Cow 9 is a Holstein in 3rd lactation, at 42 days in milk producing 54 kg milk d-1; Cow 10 is a Holstein in 3rd lactation, at 110 days in milk producing 18 kg milk d-1; Cow 11 is a Holstein in 3rd lactation, at 110 days in milk producing 36 kg milk d-1; Cow 12 is a Holstein in 3rd lactation, at 110 days in milk producing 54 kg milk d-1.
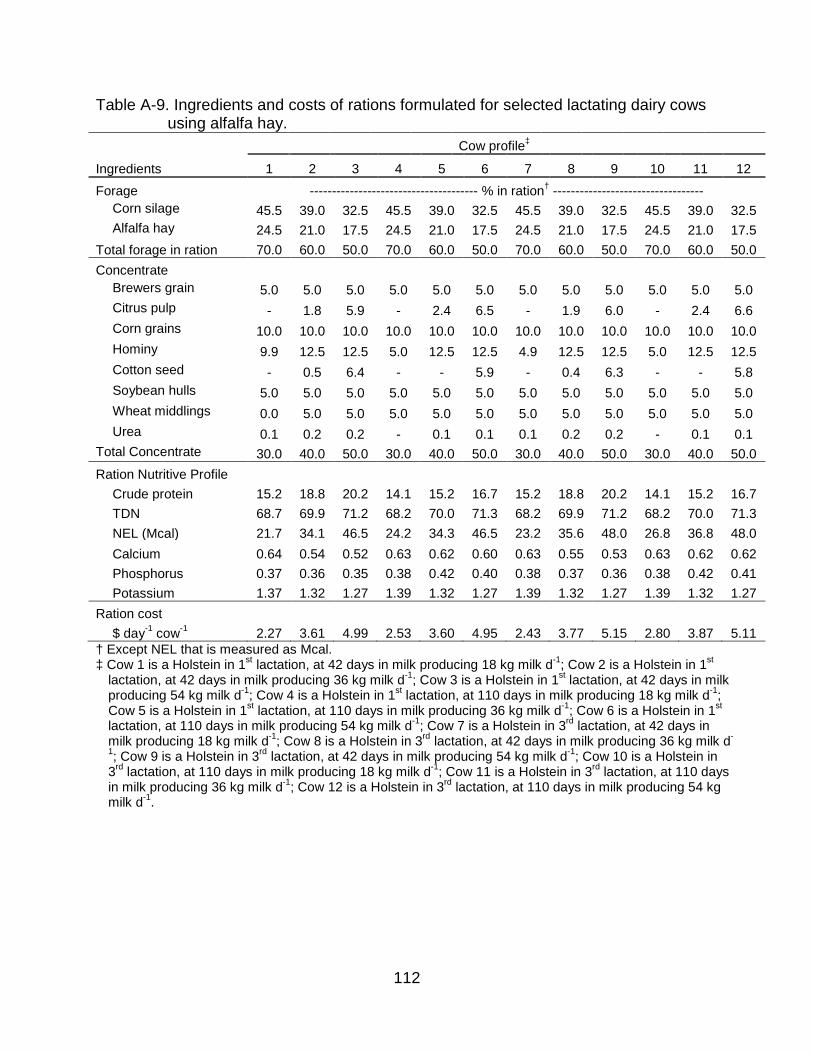
112
Table A-9. Ingredients and costs of rations formulated for selected lactating dairy cows using alfalfa hay.
Cow profile‡
Ingredients 1 2 3 4 5 6 7 8 9 10 11 12 Forage -------------------------------------- % in ration† ----------------------------------
Corn silage 45.5 39.0 32.5 45.5 39.0 32.5 45.5 39.0 32.5 45.5 39.0 32.5 Alfalfa hay 24.5 21.0 17.5 24.5 21.0 17.5 24.5 21.0 17.5 24.5 21.0 17.5
Total forage in ration 70.0 60.0 50.0 70.0 60.0 50.0 70.0 60.0 50.0 70.0 60.0 50.0 Concentrate
Brewers grain 5.0 5.0 5.0 5.0 5.0 5.0 5.0 5.0 5.0 5.0 5.0 5.0 Citrus pulp - 1.8 5.9 - 2.4 6.5 - 1.9 6.0 - 2.4 6.6 Corn grains 10.0 10.0 10.0 10.0 10.0 10.0 10.0 10.0 10.0 10.0 10.0 10.0 Hominy 9.9 12.5 12.5 5.0 12.5 12.5 4.9 12.5 12.5 5.0 12.5 12.5 Cotton seed - 0.5 6.4 - - 5.9 - 0.4 6.3 - - 5.8 Soybean hulls 5.0 5.0 5.0 5.0 5.0 5.0 5.0 5.0 5.0 5.0 5.0 5.0 Wheat middlings 0.0 5.0 5.0 5.0 5.0 5.0 5.0 5.0 5.0 5.0 5.0 5.0 Urea 0.1 0.2 0.2 - 0.1 0.1 0.1 0.2 0.2 - 0.1 0.1
Total Concentrate 30.0 40.0 50.0 30.0 40.0 50.0 30.0 40.0 50.0 30.0 40.0 50.0 Ration Nutritive Profile
Crude protein 15.2 18.8 20.2 14.1 15.2 16.7 15.2 18.8 20.2 14.1 15.2 16.7 TDN 68.7 69.9 71.2 68.2 70.0 71.3 68.2 69.9 71.2 68.2 70.0 71.3 NEL (Mcal) 21.7 34.1 46.5 24.2 34.3 46.5 23.2 35.6 48.0 26.8 36.8 48.0 Calcium 0.64 0.54 0.52 0.63 0.62 0.60 0.63 0.55 0.53 0.63 0.62 0.62 Phosphorus 0.37 0.36 0.35 0.38 0.42 0.40 0.38 0.37 0.36 0.38 0.42 0.41 Potassium 1.37 1.32 1.27 1.39 1.32 1.27 1.39 1.32 1.27 1.39 1.32 1.27
Ration cost $ day-1 cow-1 2.27 3.61 4.99 2.53 3.60 4.95 2.43 3.77 5.15 2.80 3.87 5.11
† Except NEL that is measured as Mcal. ‡ Cow 1 is a Holstein in 1st lactation, at 42 days in milk producing 18 kg milk d-1; Cow 2 is a Holstein in 1st
lactation, at 42 days in milk producing 36 kg milk d-1; Cow 3 is a Holstein in 1st lactation, at 42 days in milk producing 54 kg milk d-1; Cow 4 is a Holstein in 1st lactation, at 110 days in milk producing 18 kg milk d-1; Cow 5 is a Holstein in 1st lactation, at 110 days in milk producing 36 kg milk d-1; Cow 6 is a Holstein in 1st lactation, at 110 days in milk producing 54 kg milk d-1; Cow 7 is a Holstein in 3rd lactation, at 42 days in milk producing 18 kg milk d-1; Cow 8 is a Holstein in 3rd lactation, at 42 days in milk producing 36 kg milk d-
1; Cow 9 is a Holstein in 3rd lactation, at 42 days in milk producing 54 kg milk d-1; Cow 10 is a Holstein in 3rd lactation, at 110 days in milk producing 18 kg milk d-1; Cow 11 is a Holstein in 3rd lactation, at 110 days in milk producing 36 kg milk d-1; Cow 12 is a Holstein in 3rd lactation, at 110 days in milk producing 54 kg milk d-1.
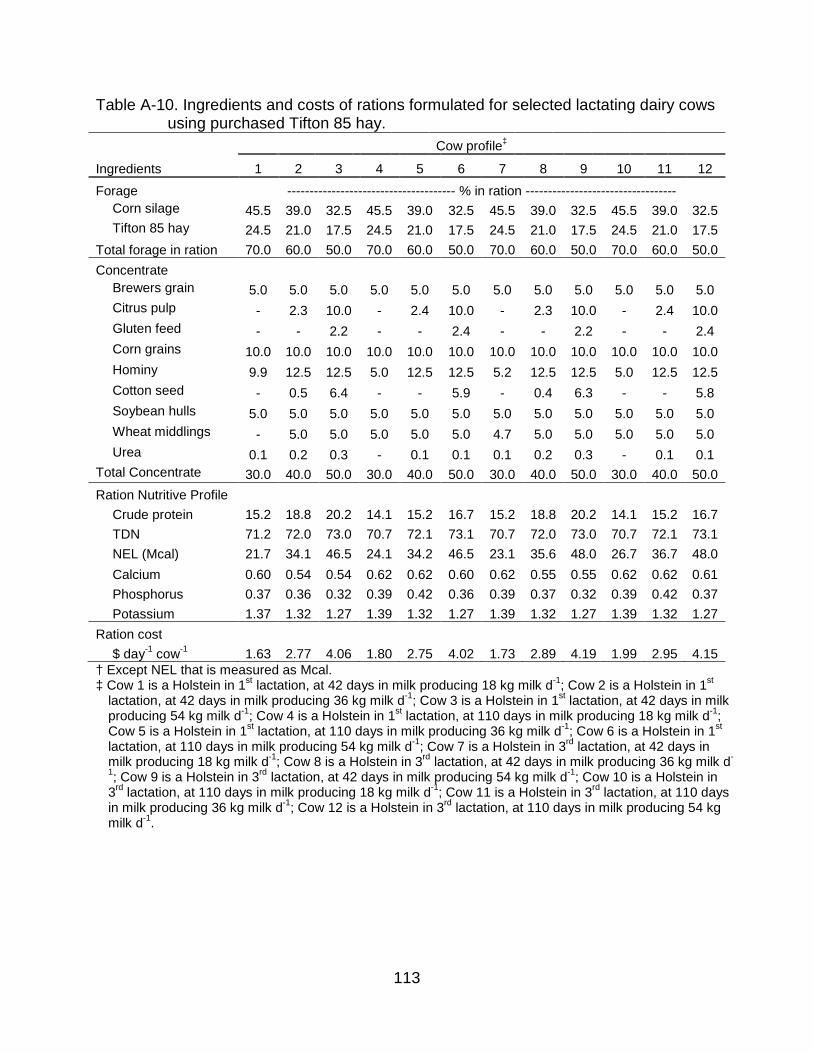
113
Table A-10. Ingredients and costs of rations formulated for selected lactating dairy cows using purchased Tifton 85 hay.
Cow profile‡
Ingredients 1 2 3 4 5 6 7 8 9 10 11 12 Forage -------------------------------------- % in ration ----------------------------------
Corn silage 45.5 39.0 32.5 45.5 39.0 32.5 45.5 39.0 32.5 45.5 39.0 32.5 Tifton 85 hay 24.5 21.0 17.5 24.5 21.0 17.5 24.5 21.0 17.5 24.5 21.0 17.5
Total forage in ration 70.0 60.0 50.0 70.0 60.0 50.0 70.0 60.0 50.0 70.0 60.0 50.0 Concentrate
Brewers grain 5.0 5.0 5.0 5.0 5.0 5.0 5.0 5.0 5.0 5.0 5.0 5.0 Citrus pulp - 2.3 10.0 - 2.4 10.0 - 2.3 10.0 - 2.4 10.0 Gluten feed - - 2.2 - - 2.4 - - 2.2 - - 2.4 Corn grains 10.0 10.0 10.0 10.0 10.0 10.0 10.0 10.0 10.0 10.0 10.0 10.0 Hominy 9.9 12.5 12.5 5.0 12.5 12.5 5.2 12.5 12.5 5.0 12.5 12.5 Cotton seed - 0.5 6.4 - - 5.9 - 0.4 6.3 - - 5.8 Soybean hulls 5.0 5.0 5.0 5.0 5.0 5.0 5.0 5.0 5.0 5.0 5.0 5.0 Wheat middlings - 5.0 5.0 5.0 5.0 5.0 4.7 5.0 5.0 5.0 5.0 5.0 Urea 0.1 0.2 0.3 - 0.1 0.1 0.1 0.2 0.3 - 0.1 0.1
Total Concentrate 30.0 40.0 50.0 30.0 40.0 50.0 30.0 40.0 50.0 30.0 40.0 50.0 Ration Nutritive Profile
Crude protein 15.2 18.8 20.2 14.1 15.2 16.7 15.2 18.8 20.2 14.1 15.2 16.7 TDN 71.2 72.0 73.0 70.7 72.1 73.1 70.7 72.0 73.0 70.7 72.1 73.1 NEL (Mcal) 21.7 34.1 46.5 24.1 34.2 46.5 23.1 35.6 48.0 26.7 36.7 48.0 Calcium 0.60 0.54 0.54 0.62 0.62 0.60 0.62 0.55 0.55 0.62 0.62 0.61 Phosphorus 0.37 0.36 0.32 0.39 0.42 0.36 0.39 0.37 0.32 0.39 0.42 0.37 Potassium 1.37 1.32 1.27 1.39 1.32 1.27 1.39 1.32 1.27 1.39 1.32 1.27
Ration cost $ day-1 cow-1 1.63 2.77 4.06 1.80 2.75 4.02 1.73 2.89 4.19 1.99 2.95 4.15
† Except NEL that is measured as Mcal. ‡ Cow 1 is a Holstein in 1st lactation, at 42 days in milk producing 18 kg milk d-1; Cow 2 is a Holstein in 1st
lactation, at 42 days in milk producing 36 kg milk d-1; Cow 3 is a Holstein in 1st lactation, at 42 days in milk producing 54 kg milk d-1; Cow 4 is a Holstein in 1st lactation, at 110 days in milk producing 18 kg milk d-1; Cow 5 is a Holstein in 1st lactation, at 110 days in milk producing 36 kg milk d-1; Cow 6 is a Holstein in 1st lactation, at 110 days in milk producing 54 kg milk d-1; Cow 7 is a Holstein in 3rd lactation, at 42 days in milk producing 18 kg milk d-1; Cow 8 is a Holstein in 3rd lactation, at 42 days in milk producing 36 kg milk d-
1; Cow 9 is a Holstein in 3rd lactation, at 42 days in milk producing 54 kg milk d-1; Cow 10 is a Holstein in 3rd lactation, at 110 days in milk producing 18 kg milk d-1; Cow 11 is a Holstein in 3rd lactation, at 110 days in milk producing 36 kg milk d-1; Cow 12 is a Holstein in 3rd lactation, at 110 days in milk producing 54 kg milk d-1.
114
LIST OF REFERENCES
Alderman, P.D. 2008. Simulating the regrowth dynamics of Tifton 85 bermudagrass as affected by nitrogen fertilization. MSc. Thesis. University of Florida, Gainesville, Florida.
American Association of Agricultural Engineers. 2000. Commodity costs and returns estimation handbook. Ames, Iowa
Arthington, J.D. and W.F. Brown. 2005. Estimation of feeding value of four tropical forage species at two stages of maturity. J. Anim. Sci. 83:1726-1731.
Barnes, R.F., C.J., Nelson, M. Collins, and K.J. Moore. 2007. Forages. vol. 2, the science of grassland agriculture. Iowa State University Press; Ames, Iowa; Oxford.
Black, J.R. and J. Hlubik. 1980. Basics of computerized linear programs for ration formulation. J. Dairy Sci. 63:1366-1378.
Brink, G.E., K.R. Sistani and D.E. Rowe. 2004. Nutrient uptake of hybrid and common bermudagrass fertilized with broiler litter. Agron. J. 96:1509-1515.
Burns, J.C. and D.S. Fisher. 2007. Dry matter intake and digestibility of 'coastal', 'tifton 44', and 'tifton 85' bermudagrass hays grown in the U.S. upper south. Crop Sci. 47:795-808.
Burton, G.W. 1986. Developing better forages for the south. J. Anim. Sci. 63:955-961.
Burton, G.W., R.N. Gates and G.M. Hill. 1993. Registration of 'tifton 85' bermudagrass. Crop Sci. 33:644-a; 645.
Burton, G.W. 2001. Tifton 85 bermudagrass--early history of its creation, selection, and evaluation. Crop Sci. 41:5-6.
Burton, G.W., J.E. Jackson and R.H. Hart. 1963. Effects of cutting frequency and nitrogen on yield, in vitro digestibility, and protein, fiber, and carotene content of coastal bermudagrass. Agron. J. 55:500-502.
Buxton, D.R. and D.D. Redfearn. 1997. Plant limitations to fiber digestion and utilization. J. Nutr. 127:814S.
Cabrera, V.E., P.E. Hildebrand, J.W. Jones, D. Letson and A. de Vries. 2006. An integrated north florida dairy farm model to reduce environmental impacts under seasonal climate variability. Agric. Ecosyst. Environ. 113:82-97
Caro-Costas, R. and J. Vicente-Chandler. 1961. Effects of two cutting heights on yields of five tropical grasses. J. Agric. Univ. P. R. 45:46-49.
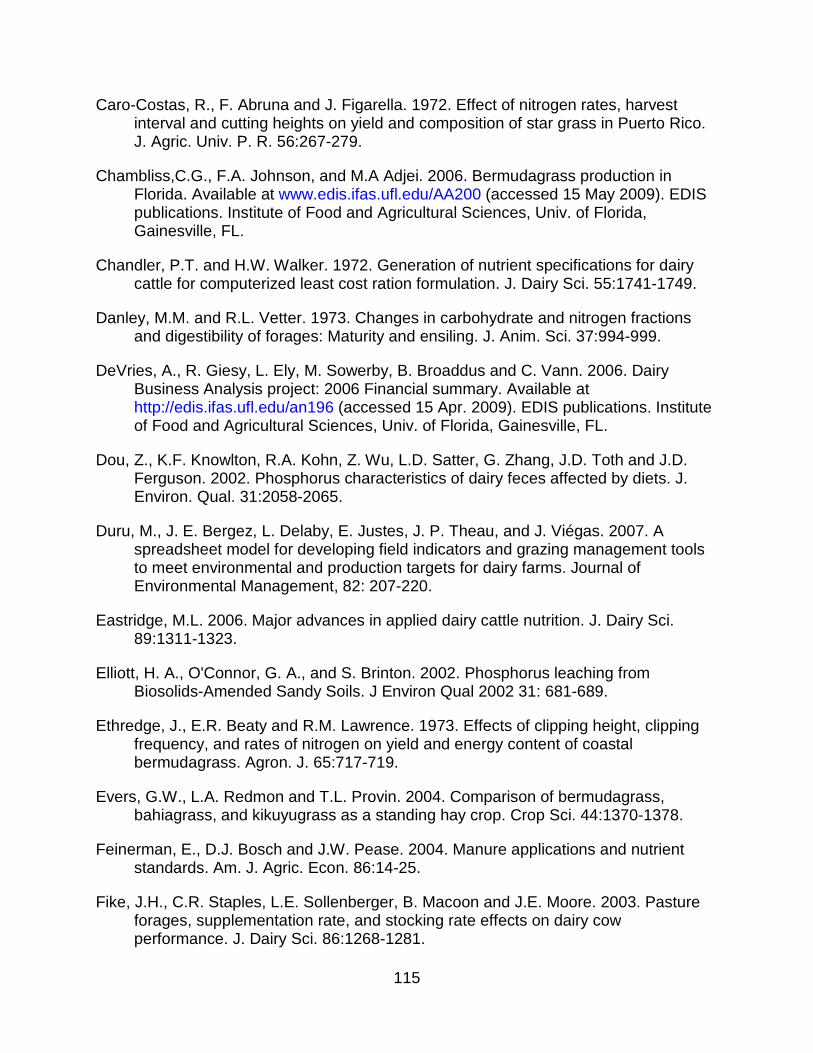
115
Caro-Costas, R., F. Abruna and J. Figarella. 1972. Effect of nitrogen rates, harvest interval and cutting heights on yield and composition of star grass in Puerto Rico. J. Agric. Univ. P. R. 56:267-279.
Chambliss,C.G., F.A. Johnson, and M.A Adjei. 2006. Bermudagrass production in Florida. Available at www.edis.ifas.ufl.edu/AA200 (accessed 15 May 2009). EDIS publications. Institute of Food and Agricultural Sciences, Univ. of Florida, Gainesville, FL.
Chandler, P.T. and H.W. Walker. 1972. Generation of nutrient specifications for dairy cattle for computerized least cost ration formulation. J. Dairy Sci. 55:1741-1749.
Danley, M.M. and R.L. Vetter. 1973. Changes in carbohydrate and nitrogen fractions and digestibility of forages: Maturity and ensiling. J. Anim. Sci. 37:994-999.
DeVries, A., R. Giesy, L. Ely, M. Sowerby, B. Broaddus and C. Vann. 2006. Dairy Business Analysis project: 2006 Financial summary. Available at http://edis.ifas.ufl.edu/an196 (accessed 15 Apr. 2009). EDIS publications. Institute of Food and Agricultural Sciences, Univ. of Florida, Gainesville, FL.
Dou, Z., K.F. Knowlton, R.A. Kohn, Z. Wu, L.D. Satter, G. Zhang, J.D. Toth and J.D. Ferguson. 2002. Phosphorus characteristics of dairy feces affected by diets. J. Environ. Qual. 31:2058-2065.
Duru, M., J. E. Bergez, L. Delaby, E. Justes, J. P. Theau, and J. Viégas. 2007. A spreadsheet model for developing field indicators and grazing management tools to meet environmental and production targets for dairy farms. Journal of Environmental Management, 82: 207-220.
Eastridge, M.L. 2006. Major advances in applied dairy cattle nutrition. J. Dairy Sci. 89:1311-1323.
Elliott, H. A., O'Connor, G. A., and S. Brinton. 2002. Phosphorus leaching from Biosolids-Amended Sandy Soils. J Environ Qual 2002 31: 681-689.
Ethredge, J., E.R. Beaty and R.M. Lawrence. 1973. Effects of clipping height, clipping frequency, and rates of nitrogen on yield and energy content of coastal bermudagrass. Agron. J. 65:717-719.
Evers, G.W., L.A. Redmon and T.L. Provin. 2004. Comparison of bermudagrass, bahiagrass, and kikuyugrass as a standing hay crop. Crop Sci. 44:1370-1378.
Feinerman, E., D.J. Bosch and J.W. Pease. 2004. Manure applications and nutrient standards. Am. J. Agric. Econ. 86:14-25.
Fike, J.H., C.R. Staples, L.E. Sollenberger, B. Macoon and J.E. Moore. 2003. Pasture forages, supplementation rate, and stocking rate effects on dairy cow performance. J. Dairy Sci. 86:1268-1281.
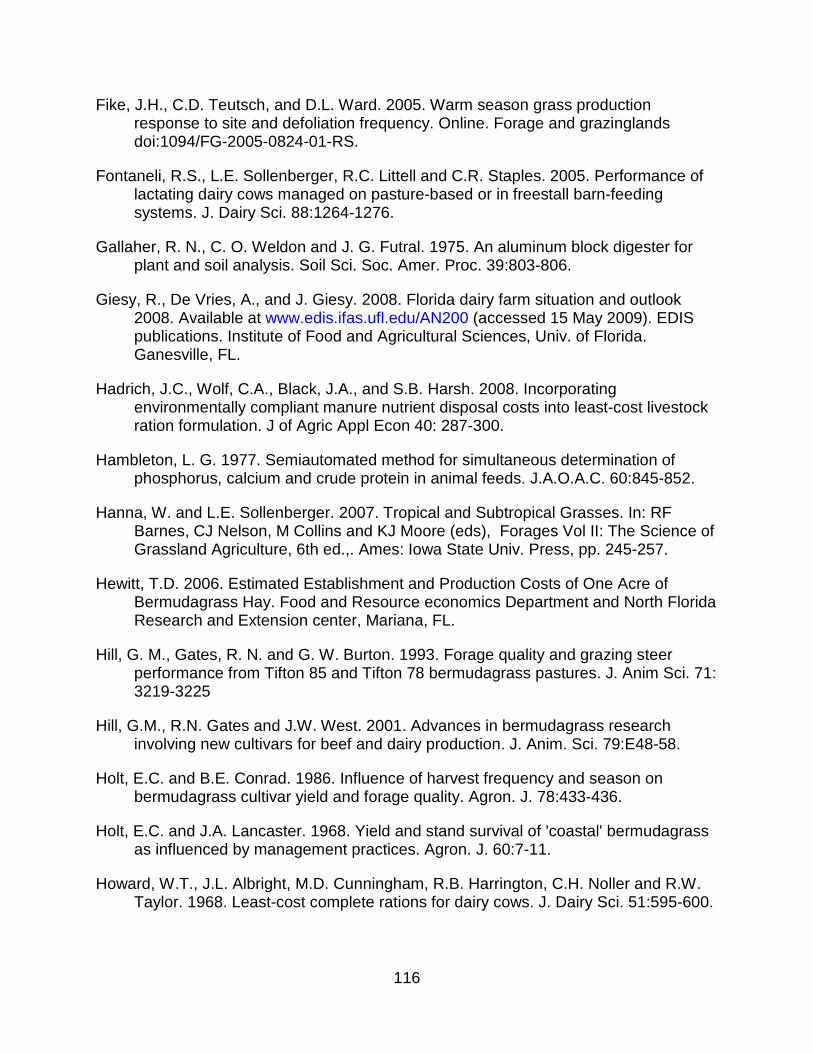
116
Fike, J.H., C.D. Teutsch, and D.L. Ward. 2005. Warm season grass production response to site and defoliation frequency. Online. Forage and grazinglands doi:1094/FG-2005-0824-01-RS.
Fontaneli, R.S., L.E. Sollenberger, R.C. Littell and C.R. Staples. 2005. Performance of lactating dairy cows managed on pasture-based or in freestall barn-feeding systems. J. Dairy Sci. 88:1264-1276.
Gallaher, R. N., C. O. Weldon and J. G. Futral. 1975. An aluminum block digester for plant and soil analysis. Soil Sci. Soc. Amer. Proc. 39:803-806.
Giesy, R., De Vries, A., and J. Giesy. 2008. Florida dairy farm situation and outlook 2008. Available at www.edis.ifas.ufl.edu/AN200 (accessed 15 May 2009). EDIS publications. Institute of Food and Agricultural Sciences, Univ. of Florida. Ganesville, FL.
Hadrich, J.C., Wolf, C.A., Black, J.A., and S.B. Harsh. 2008. Incorporating environmentally compliant manure nutrient disposal costs into least-cost livestock ration formulation. J of Agric Appl Econ 40: 287-300.
Hambleton, L. G. 1977. Semiautomated method for simultaneous determination of phosphorus, calcium and crude protein in animal feeds. J.A.O.A.C. 60:845-852.
Hanna, W. and L.E. Sollenberger. 2007. Tropical and Subtropical Grasses. In: RF Barnes, CJ Nelson, M Collins and KJ Moore (eds), Forages Vol II: The Science of Grassland Agriculture, 6th ed.,. Ames: Iowa State Univ. Press, pp. 245-257.
Hewitt, T.D. 2006. Estimated Establishment and Production Costs of One Acre of Bermudagrass Hay. Food and Resource economics Department and North Florida Research and Extension center, Mariana, FL.
Hill, G. M., Gates, R. N. and G. W. Burton. 1993. Forage quality and grazing steer performance from Tifton 85 and Tifton 78 bermudagrass pastures. J. Anim Sci. 71: 3219-3225
Hill, G.M., R.N. Gates and J.W. West. 2001. Advances in bermudagrass research involving new cultivars for beef and dairy production. J. Anim. Sci. 79:E48-58.
Holt, E.C. and B.E. Conrad. 1986. Influence of harvest frequency and season on bermudagrass cultivar yield and forage quality. Agron. J. 78:433-436.
Holt, E.C. and J.A. Lancaster. 1968. Yield and stand survival of 'coastal' bermudagrass as influenced by management practices. Agron. J. 60:7-11.
Howard, W.T., J.L. Albright, M.D. Cunningham, R.B. Harrington, C.H. Noller and R.W. Taylor. 1968. Least-cost complete rations for dairy cows. J. Dairy Sci. 51:595-600.
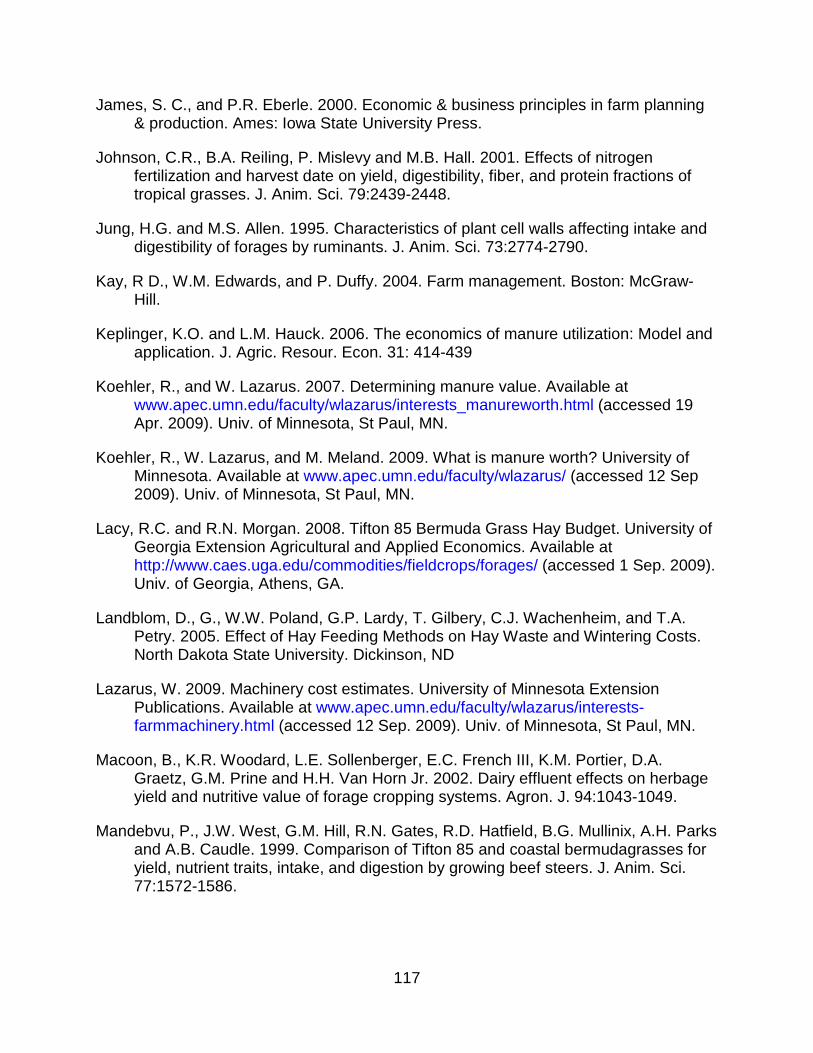
117
James, S. C., and P.R. Eberle. 2000. Economic & business principles in farm planning & production. Ames: Iowa State University Press.
Johnson, C.R., B.A. Reiling, P. Mislevy and M.B. Hall. 2001. Effects of nitrogen fertilization and harvest date on yield, digestibility, fiber, and protein fractions of tropical grasses. J. Anim. Sci. 79:2439-2448.
Jung, H.G. and M.S. Allen. 1995. Characteristics of plant cell walls affecting intake and digestibility of forages by ruminants. J. Anim. Sci. 73:2774-2790.
Kay, R D., W.M. Edwards, and P. Duffy. 2004. Farm management. Boston: McGraw-Hill.
Keplinger, K.O. and L.M. Hauck. 2006. The economics of manure utilization: Model and application. J. Agric. Resour. Econ. 31: 414-439
Koehler, R., and W. Lazarus. 2007. Determining manure value. Available at www.apec.umn.edu/faculty/wlazarus/interests_manureworth.html (accessed 19 Apr. 2009). Univ. of Minnesota, St Paul, MN.
Koehler, R., W. Lazarus, and M. Meland. 2009. What is manure worth? University of Minnesota. Available at www.apec.umn.edu/faculty/wlazarus/ (accessed 12 Sep 2009). Univ. of Minnesota, St Paul, MN.
Lacy, R.C. and R.N. Morgan. 2008. Tifton 85 Bermuda Grass Hay Budget. University of Georgia Extension Agricultural and Applied Economics. Available at http://www.caes.uga.edu/commodities/fieldcrops/forages/ (accessed 1 Sep. 2009). Univ. of Georgia, Athens, GA.
Landblom, D., G., W.W. Poland, G.P. Lardy, T. Gilbery, C.J. Wachenheim, and T.A. Petry. 2005. Effect of Hay Feeding Methods on Hay Waste and Wintering Costs. North Dakota State University. Dickinson, ND
Lazarus, W. 2009. Machinery cost estimates. University of Minnesota Extension Publications. Available at www.apec.umn.edu/faculty/wlazarus/interests-farmmachinery.html (accessed 12 Sep. 2009). Univ. of Minnesota, St Paul, MN.
Macoon, B., K.R. Woodard, L.E. Sollenberger, E.C. French III, K.M. Portier, D.A. Graetz, G.M. Prine and H.H. Van Horn Jr. 2002. Dairy effluent effects on herbage yield and nutritive value of forage cropping systems. Agron. J. 94:1043-1049.
Mandebvu, P., J.W. West, G.M. Hill, R.N. Gates, R.D. Hatfield, B.G. Mullinix, A.H. Parks and A.B. Caudle. 1999. Comparison of Tifton 85 and coastal bermudagrasses for yield, nutrient traits, intake, and digestion by growing beef steers. J. Anim. Sci. 77:1572-1586.
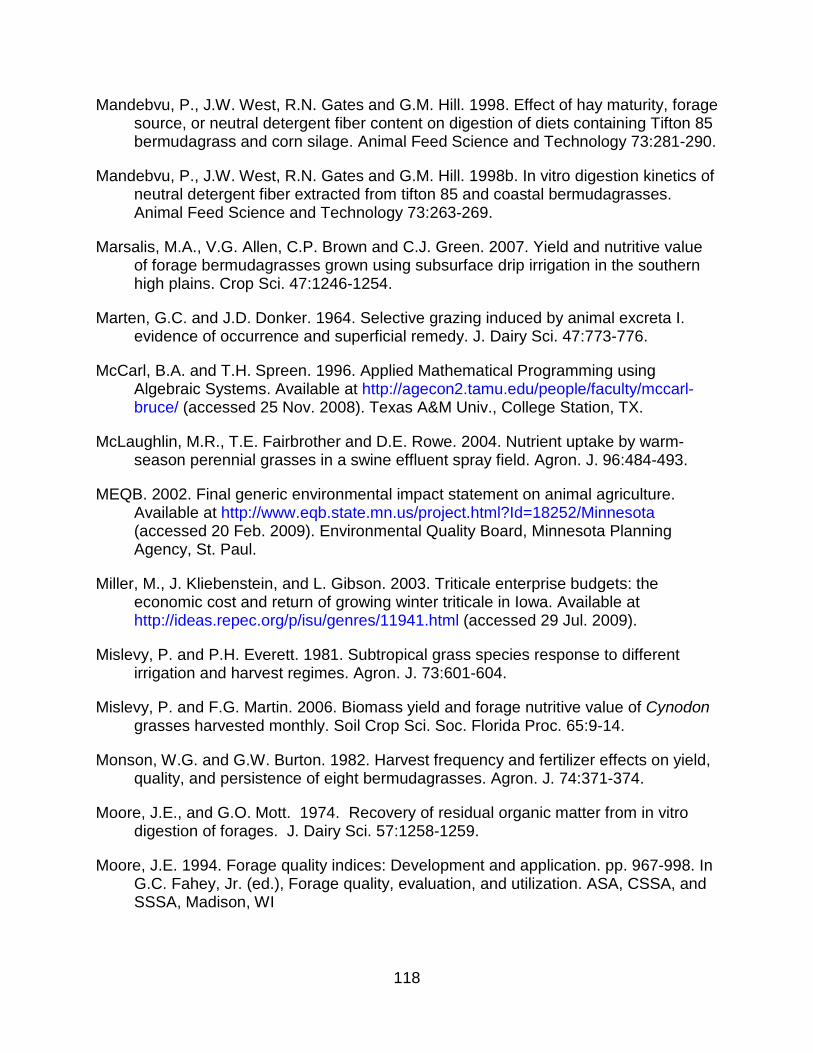
118
Mandebvu, P., J.W. West, R.N. Gates and G.M. Hill. 1998. Effect of hay maturity, forage source, or neutral detergent fiber content on digestion of diets containing Tifton 85 bermudagrass and corn silage. Animal Feed Science and Technology 73:281-290.
Mandebvu, P., J.W. West, R.N. Gates and G.M. Hill. 1998b. In vitro digestion kinetics of neutral detergent fiber extracted from tifton 85 and coastal bermudagrasses. Animal Feed Science and Technology 73:263-269.
Marsalis, M.A., V.G. Allen, C.P. Brown and C.J. Green. 2007. Yield and nutritive value of forage bermudagrasses grown using subsurface drip irrigation in the southern high plains. Crop Sci. 47:1246-1254.
Marten, G.C. and J.D. Donker. 1964. Selective grazing induced by animal excreta I. evidence of occurrence and superficial remedy. J. Dairy Sci. 47:773-776.
McCarl, B.A. and T.H. Spreen. 1996. Applied Mathematical Programming using Algebraic Systems. Available at http://agecon2.tamu.edu/people/faculty/mccarl-bruce/ (accessed 25 Nov. 2008). Texas A&M Univ., College Station, TX.
McLaughlin, M.R., T.E. Fairbrother and D.E. Rowe. 2004. Nutrient uptake by warm-season perennial grasses in a swine effluent spray field. Agron. J. 96:484-493.
MEQB. 2002. Final generic environmental impact statement on animal agriculture. Available at http://www.eqb.state.mn.us/project.html?Id=18252/Minnesota (accessed 20 Feb. 2009). Environmental Quality Board, Minnesota Planning Agency, St. Paul.
Miller, M., J. Kliebenstein, and L. Gibson. 2003. Triticale enterprise budgets: the economic cost and return of growing winter triticale in Iowa. Available at http://ideas.repec.org/p/isu/genres/11941.html (accessed 29 Jul. 2009).
Mislevy, P. and P.H. Everett. 1981. Subtropical grass species response to different irrigation and harvest regimes. Agron. J. 73:601-604.
Mislevy, P. and F.G. Martin. 2006. Biomass yield and forage nutritive value of Cynodon grasses harvested monthly. Soil Crop Sci. Soc. Florida Proc. 65:9-14.
Monson, W.G. and G.W. Burton. 1982. Harvest frequency and fertilizer effects on yield, quality, and persistence of eight bermudagrasses. Agron. J. 74:371-374.
Moore, J.E., and G.O. Mott. 1974. Recovery of residual organic matter from in vitro digestion of forages. J. Dairy Sci. 57:1258-1259.
Moore, J.E. 1994. Forage quality indices: Development and application. pp. 967-998. In G.C. Fahey, Jr. (ed.), Forage quality, evaluation, and utilization. ASA, CSSA, and SSSA, Madison, WI
119
Morgan, J.A. and R.H. Brown. 1983. Photosynthesis and growth of bermudagrass swards. I. carbon dioxide exchange characteristics of swards mowed at weekly and monthly intervals. Crop Sci. 23:347-352.
Mylavarapu, R., D. Wright, G. Kidder and C.G. Chambliss. 2009. UF/IFAS Standardized Fertilization Recommendations for Agronomic Crops. Available at www.edis.ifas.ufl.edu/pdffiles/SS/SS16300.pdf (accessed 10 Oct. 2009). EDIS publications. Institute of Food and Agricultural Sciences, Univ. of Florida, Gainesville, FL.
National Research Council. 2001. Nutrient Requirements of Dairy Cattle. 7th rev. ed. Natl. Acad. Sci., Washington, DC.
Nelson, CJ. 2000. Shoot Morphological Plasticity of Grasses: Leaf Growth vs. Tillering. In: Lemaire, G., Hodgson, J., de Moraes, A., Carvalho, PC de F. , and Nabinger, C. (eds), Grassland Ecophysiology and Grazing Ecology. CABI pub. Oxford, pp.101-127.
Newman, Y.C., L.E. Sollenberger, W.E. Kunkle and C.G. Chambliss. 2002. Canopy height and nitrogen supplementation effects on performance of heifers grazing limpograss. Agron. J. 94:1375-1380.
Newman, Y.C., T.R. Sinclair, A.S. Blount, M.L. Lugo and E. Valencia. 2007. Forage production of tropical grasses under extended daylength at subtropical and tropical latitudes. Environ. Exp. Bot. 61:18-24.
Newman, Y.C., S. Agyin-Birikorang, M.B. Adjei, J.M. Scholberg, M.L. Silveira, J.M.B. Vendramini, J.E. Rechcigl and L.E. Sollenberger. 2009. Nitrogen fertilization effect on phosphorus remediation potential of three perennial warm-season forages. Agron. J. 101:1243-1248.
Newman, Y.C., S. Agyin-Birikorang, M.B. Adjei, J.M. Scholberg, M.L. Silveira, J.M.B. Vendramini, J.E. Rechcigl, L.E. Sollenberger and M. Chrysostome. 2009 b. Enhancing phosphorus phytoremedation potential of two warm-season perennial grasses with nitrogen fertilization. Agron. J. 101:1345-1351.
Newton, G. L., Bernard, J. K., Hubbard, R. K., Allison, J. R., Lowrance, R. R., Gascho, G. J., Gates, R. N., and G. Vellidis. 2003. Managing Manure Nutrients Through Multi-crop Forage Production. J. Dairy Sci. 2003 86: 2243-2252
Olson, K.D. 2004. Farm management: principles and strategies. Ames, Iowa: Iowa State Press.
Pant, H.K., P. Mislevy and J.E. Rechcigl. 2004. Effects of phosphorus and potassium on forage nutritive value and quantity: Environmental implications. Agron. J. 96:1299-1305.
120
Pedreira, C.G.S., L.E. Sollenberger and P. Mislevy. 1999. Productivity and nutritive value of `Florakirk' bermudagrass as affected by grazing management. Agron. J. 91:796-801.
Pedreira, C.G.S., L.E. Sollenberger and P. Mislevy. 2000. Botanical composition, light interception, and carbohydrate reserve status of grazed `Florakirk' bermudagrass. Agron. J. 92:194-199.
Pesti, G.M. and A.F. Seila. 1999. The use of an electronic spreadsheet to solve linear and non-linear "stochastic" feed formulation problems. J Appl Poult Res 8:110-121.
Pflueger, B. 2005. How to calculate machinery ownership and operating costs. South Dakota Cooperative Extension Service. Pub. EC920e. Available at www.agbiopubs.sdstate.edu/articles/EC920e.pdf (accessed 9 Aug. 2009)
Pierzynski, G.M., and T.L. Logan. 1993. Crop, soil, and management effects on phosphorus soil test levels. J. Prod. Agric. 6:513–520.
Pitman, W.D. 2007. Forage Systems for Warm Humid Areas. In: Barnes, R.F., Nelson, C.J., Moore, K.J., Collins, M. editors. Forages, The Science of Grassland Agriculture. Volume II, Sixth Edition. Ames, Iowa: Blackwell Publishing Professional. p. 303-311.
Prine, G.M. and G.W. Burton. 1956. The effect of nitrogen rate and clipping frequency upon the yield, protein content and certain morphological characteristics of coastal bermudagrass (Cynodon dactylon, (L) pers.). Agron. J. 48:296-301.
Redfearn, D. and C.J. Nelson. 2003. Grasses for Southern Areas. In: RF Barnes, CJ Nelson, M Collins and KJ Moore (eds), Forages Vol I: An Introduction to Grassland Agriculture, 6th ed., Ames: Iowa State Univ. Press. pp. 149-171.
Ribaudo, M. and J. Agapoff. 2005. Importance of cost offsets for dairy farms meeting a nutrient application standard. Agricultural and Resource Economics Review 34:173-184.
Ribaudo, M., N. Gollehon, M. Aillery, J. Kaplan, R. Johansson, J. Agapoff, L. Christensen, V. Breneman and M. Peters. 2003. Manure management for water quality: Costs to animal feeding operations of applying manure nutrients to land. U.S. Department of Agriculture, Economic Research Service. Agricultural Economic Report No. 8244.
Richards, J.H. 1993. Physiology of plants recovering from defoliation. pp. 45-54. In M. J. Baker (ed.), Grasslands for our world. Wellington, N.Z.: SIR Pub.
Rotz, C.A., A.N. Sharpley, L.D. Satter, W.J. Gburek and M.A. Sanderson. 2002. Production and feeding strategies for phosphorus management on dairy farms. J. Dairy Sci. 85:3142-3153.
121
Ruiz, T.M., E. Bernal, C.R. Staples, L.E. Sollenberger and R.N. Gallaher. 1995. Effect of dietary neutral detergent fiber concentration and forage source on performance of lactating cows. J. Dairy Sci. 78:305-319.
Scarbrough, D. A., W. K. Coblentz, J. B. Humphry, K. P. Coffey, T. C. Daniel, T. J. Sauer, J. A. Jennings, J. E. Turner, and D. W. Kellogg. 2005. Evaluation of dry matter loss, nutritive value, and in situ dry matter disappearance for wilting orchardgrass and bermudagrass forages damaged by simulated rainfall. Agron J 97:604-14.
Schuler, R. 2005. Estimating Agricultural Machinery Costs and Operating Expenses. Available at www.uwex.edu/CES/crops/uwforage/EstAgFieldMachineCosts.doc (accessed 28 Sep. 2008). University of Wisconsin-Extension. Madison, WI.
SERCC. 2008. Southeast Regional Climate Center Historical Climate Summaries of Florida: High Springs. Available at www.sercc.com/cgi-bin/sercc/cliMAIN.pl?fl3956 (accessed 10 Jan. 2009).
SERCC. 2009. Southeast Regional Climate Center Historical Climate Summaries of Florida: Usher Tower. Available at www.sercc.com/cgi-bin/sercc/cliMAIN.pl?fl9120 (accessed 10 Jan. 2009).
Silveira, M.L., V.A. Haby and A.T. Leonard. 2007. Response of coastal bermudagrass yield and nutrient uptake efficiency to nitrogen sources. Agron. J. 99:707-714.
Simpson, J. R. 1989. Economia de sistemas de produccion ganadera en America Latina. Gainesville, Fla: Editorial Agropecuaria Latinoamericana.
Sinclair, T.R., P. Mislevy and J.D. Ray. 2001. Short photoperiod inhibits winter growth of subtropical grasses. Planta 213:488-491.
Sinclair, T.R., J.D. Ray, P. Mislevy and L.M. Premazzi. 2003. Growth of subtropical forage grasses under extended photoperiod during short-daylength months. Crop Sci. 43:618-623.
Sistani, K.R., G.E. Brink, A. Adeli, H. Tewolde and D.E. Rowe. 2004. Year-round soil nutrient dynamics from broiler litter application to three bermudagrass cultivars. Agron. J. 96:525-530.
Smith, L.W., H.K. Goering and C.H. Gordon. 1972. Relationships of forage compositions with rates of cell wall digestion and indigestibility of cell walls. J. Dairy Sci. 55:1140-1147.
Soil Service Staff, Web Soil Survey. 2006. Available at websoilsurvey.nrcs.usda.gov/ app/HomePage.htm (accessed 15 Apr. 2008). Natural Resources Conservation Service, United States Department of Agriculture.
122
Staples, C.R. 2003. Bermudagrass: Growing, Storing, and Feeding for Dairy Animals. Available at www.edis.ifas.ufl.edu/pdffiles/DS/DS13100.pdf (accessed 6 Jul. 2009). EDIS publications. Institute of Food and Agricultural Sciences. Univ. of Florida, Gainesville, FL.
Statistical Analysis Institute. 2004. SAS/STAT User's Guide Release. Release 9.0. Statistical Analysis Institute, Cary, NC.
Stobbs, T.H.1975. Factors limiting the nutritional value of grazed tropical pastures for beef and milk production. Tropical Grasslands, 9: 141-149.
Stone, E.J. 1959. Effectiveness of various systems of forage utilization in the south. J. Dairy Sci. 42:885-890.
Taliaferro, C.M. F.M. Rouquette Jr. and P. Mislevy. 2004. Bermudagrass and stargrass. In: Moser, Z.Z., B.L. Burson, L.E. Sollenberger (Eds.), Warm-Season (C4) Grasses. Monograph No. 45. American Society of Agronomy, Crop Science Society of America, Soil Science Society of America, Madison, WI, USA, pp. 417–475.
Thornton, B., P. Milliard, and U. Bausenwein. 2000. Reserve Formation and Recycling of Carbon and Nitrogen during Regrowth of Defoliated Plants. In: Lemaire, G., Hodgson, J., de Moraes, A., Carvalho, PC de F. , and Nabinger, C. (eds), Grassland Ecophysiology and Grazing Ecology. CABI pub. Oxford, pp.85-101.
Toth, J.D., Z. Dou, J.D. Ferguson, D.T. Galligan and C.F. Ramberg Jr. 2006. Nitrogen- vs. phosphorus-based dairy manure applications to field crops: Nitrate and phosphorus leaching and soil phosphorus accumulation. J. Environ. Qual. 35:2302-2312.
Tozer, P.R. 2000. Least-cost ration formulations for holstein dairy heifers by using linear and stochastic programming. J. Dairy Sci. 83:443-451.
United States Department of Agriculture - National Agricultural Statistics Service (USDA-NASS). 2009. United States 2007 Census of Agriculture Vol 1: Summary and State Data. Available at www.agcensus.usda.gov/Publications/2007/ Full_Report/usv1.pdf (accessed 1 Oct. 2009).
United States Department of Agriculture - National Agricultural Statistics Service (USDA-NASS). 2009b. Livestock, Dairy and Poultry Outlook-Florida: June 2009. Available at www.nass.usda.gov/Statistics_by_State/Florida/index.asp (accessed 1 Nov. 2009).
United States Department of Agriculture - National Agricultural Statistics Service (USDA-NASS). 2009c. Farm Labor: Florida. Available at www.nass.usda.gov/ Statistics_by_State/Florida/index.asp (accessed 12 Nov. 2009).
123
Van Horn, H.H., G.L. Newton, R.A. Nordstedt, E.C. French, G. Kidder, D.A. Graetz, and C.F. Chambliss. 2003. Dairy Manure Management: Strategies for Recycling Nutrients to Recover Fertilizer Value and Avoid Environmental Pollution. Available at www.edis.ifas.ufl.edu/DS096 (accessed 12 Sep. 2009). EDIS publications. Institute of Food and Agricultural Sciences. Univ. of Florida, Gainesville, FL.
Van Soest, P.J. 1967. Development of a comprehensive system of feed analyses and its application to forages. J. Anim. Sci. 26:119-128.
Van Soest, P.J., J.B. Robertson, and B.A. Lewis. 1991. Methods for Dietary Fiber, Neutral Detergent Fiber, and Nonstarch Polysaccharides in Relation to Animal Nutrition. J. Dairy Science 74:3583-3597.
VandeHaar, M.J. and N. St-Pierre. 2006. Major advances in nutrition: Relevance to the sustainability of the dairy industry. J. Dairy Sci. 89:1280-1291.
Vendramini, J.M.B., L.E. Sollenberger, A.T. Adesogan, J.C.B. Dubeux Jr., S.M. Interrante, R.L. Stewart Jr. and J.D. Arthington. 2008. Protein fractions of tifton 85 and rye-ryegrass due to sward management practices. Agron. J. 100:463-469.
Weir, W.C. and D.T. Torell. 1959. Selective grazing by sheep as shown by a comparison of the chemical composition of range and pasture forage obtained by hand clipping and that collected by esophageal-fistulated sheep. J. Anim. Sci. 18:641-649.
West, J.W., P. Mandebvu, G.M. Hill and R.N. Gates. 1998. Intake, milk yield, and digestion by dairy cows fed diets with increasing fiber content from bermudagrass hay or silage. J. Dairy Sci. 81:1599-1607.
West, J.W., G.M. Hill, R.N. Gates and B.G. Mullinix. 1997. Effects of dietary forage source and amount of forage addition on intake, milk yield, and digestion for lactating dairy cows. J. Dairy Sci. 80:1656-1665.
Woodard, K.R., L.E. Sollenberger, L.A. Sweat, D.A. Graetz, S.J. Rymph and Y. Joo. 2007. Five year-round forage systems in a dairy effluent sprayfield: Phosphorus removal. J. Environ. Qual. 36:175-183.
Woodard, K.R., E.C. French, L.A. Sweat, D.A. Graetz, L.E. Sollenberger, B. Macoon, K.M. Portier, S.J. Rymph, B.L. Wade, G.M. Prine and H.H. Van Horn. 2003. Nitrogen removal and nitrate leaching for two perennial, sod-based forage systems receiving dairy effluent. J. Environ. Qual. 32:996-1007.
Woodard, K.R., E.C. French, L.A. Sweat, D.A. Graetz, L.E. Sollenberger, B. Macoon, K.M. Portier, B.L. Wade, S.J. Rymph, G.M. Prine and H.H. Van Horn. 2002. Nitrogen removal and nitrate leaching for forage systems receiving dairy effluent. J. Environ. Qual. 31:1980-1992.
124
Zublena, J. P., J. C. Barker, and D. P. Wessen. 1997. Dairy Manure as a fertilizer Source. Soil Facts. North Carolina Cooperative Extension Service. Available at www.soil.ncsu.edu/publications/Soilfacts/AG-439-28/AG-439-28.pdf (accessed 11 Nov. 2009). North Carolina State Univ., Raleigh, NC.
125
BIOGRAPHICAL SKETCH
José Alejandro Clavijo Michelangeli (a.k.a. Pepe) was born in the town of
Maracay, north-central Venezuela in 1982. He spent his early years living in Montreal,
Canada from 1986 to 1991 and Gainesville, FL from 1995 to 1996 with his family. He
settled back in his hometown to finish middle and high school at the Unidad Educativa
“Calicantina”, graduating in the 2000 class. That same year he began his undergraduate
degree as an Agronomical Engineer at the Universidad Central de Venezuela. As an
undergraduate, he was a teaching assistant in Statistics and Experimental Design, an
ecotourism guide working for national and international birdwatching companies, an
intern in an environmental consulting agency and a cattle ranching consortium, and an
assistant in several research programs spanning molecular biology, entomology and
ornithology.
Upon graduation in 2006, he continued to work in ecotourism and ornithology
research until he began his Master of Science degree in agronomy at the University of
Florida in January 2008, under the mentorship of Dr. Yoana Newman. During this time,
he has been a research assistant in the forage extension program, and participated as a
student research assistant in the Ornithology Laboratory of the Florida Museum of
Natural History during 2008. Upon completing his MSc degree, Pepe will pursue a PhD
degree focusing on natural resource policy. After his graduate studies, he plans on
working for governments or non-government organizations developing sustainable land-
use policies for developing nations.