Embed Size (px)
Citation preview

Business Statistics for Competitive Advantagewith Excel 2007

Basics, Model Building,
Cynthia FraserUniversity of Virginia, McIntire School of Commerce
and Cases
for Competitive Advantagewith Excel 2007
Business Statistics

Cynthia FraserUniversity of VirginiaCharlottesville, VA, USA
ISBN: 978-0-387-74402-4 e-ISBN: 978-0-387-74403-2DOI: 10.1007/978-0-387-74403-2
Printed on acid-free paper
springer.com
the publisher (Springer Science+Business Media, LLC, 233 Spring Street, New York, NY 10013, USA), except for brief excerpts in connection with reviews or scholarly analysis. Use in connection with any form of information storage and retrieval, electronic adaptation, computer software, or by similar or dissimilar methodology now known or hereafter developed is forbidden.
identified as such, is not to be taken as an expression of opinion as to whether or not they are subject to proprietary rights.
All rights reserved. This work may not be translated or copied in whole or in part without the written permission of
The use in this publication of trade names, trademarks, service marks, and similar terms, even if they are not
While the advice and information in this book are belived to be true and accurate at the date of going to press, neither
be made. The publisher makes no warranty, express or implied, with respect to the material contained herein.the authors nor the editors nor the publisher can accept any legal responsibility for any errors or omissions that may
© Springer Science+Business Media, LLC 2009
Library of Congress Control Number: 2008939440

To Len Lodish, who introduced me to the competitive advantages of modeling.
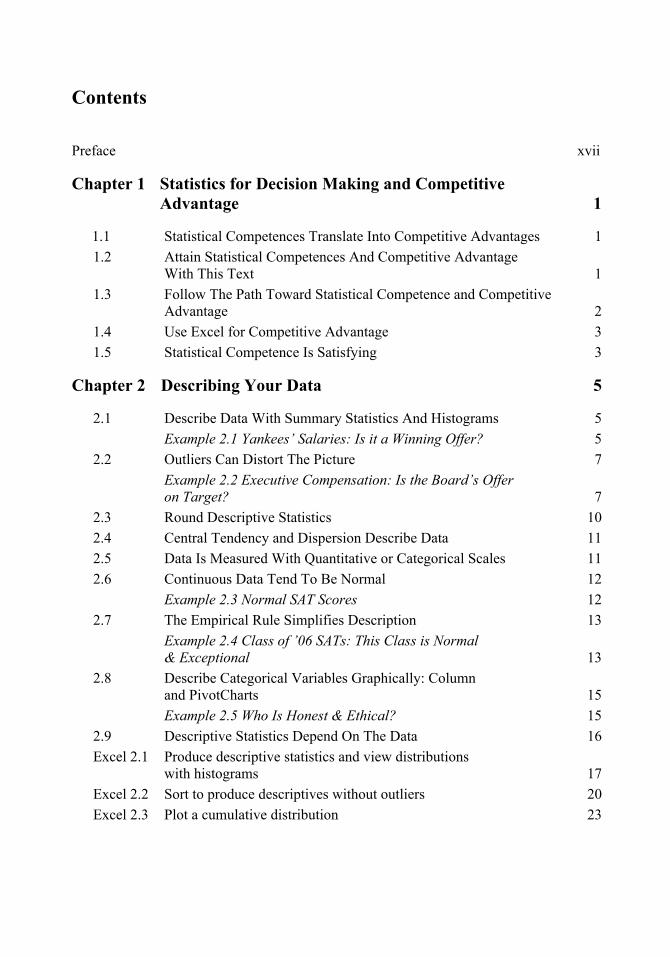
Contents Preface xvii
Chapter 1 Statistics for Decision Making and Competitive Advantage 1
1.1 Statistical Competences Translate Into Competitive Advantages 1 1.2 Attain Statistical Competences And Competitive Advantage
With This Text 1 1.3 Follow The Path Toward Statistical Competence and Competitive
Advantage 2 1.4 Use Excel for Competitive Advantage 3 1.5 3
Chapter 2 Describing Your Data 5
2.1 Describe Data With Summary Statistics And Histograms 5 Example 2.1 Yankees’ Salaries: Is it a Winning Offer? 5 2.2 Outliers Can Distort The Picture 7 Example 2.2 Executive Compensation: Is the Board’s Offer
on Target? 7 2.3 Round Descriptive Statistics 10 2.4 Central Tendency and Dispersion Describe Data 11 2.5 Data Is Measured With Quantitative or Categorical Scales 11 2.6 Continuous Data Tend To Be Normal 12 Example 2.3 Normal SAT Scores 12 2.7 The Empirical Rule Simplifies Description 13 Example 2.4 Class of ’06 SATs: This Class is Normal
& Exceptional 13 2.8 Describe Categorical Variables Graphically: Column
and PivotCharts 15 2.9 Descriptive Statistics Depend On The Data 16 Excel 2.1 Produce descriptive statistics and view distributions
with histograms 17 Excel 2.2 Sort to produce descriptives without outliers 20 Excel 2.3 Plot a cumulative distribution 23
Example 2.5 Who Is Honest & Ethical? 15
Statistical Competence Is Satisfying
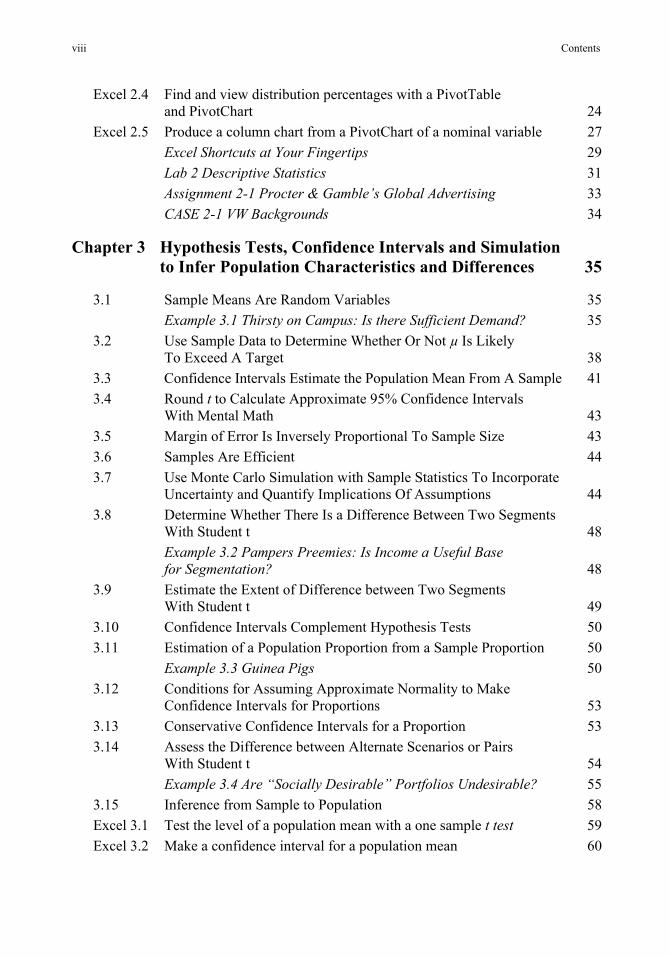
viii Contents
Excel 2.4 Find and view distribution percentages with a PivotTable and PivotChart 24
Excel 2.5 Produce a column chart from a PivotChart of a nominal variable 27 Excel Shortcuts at Your Fingertips 29 Lab 2 Descriptive Statistics 31 Assignment 2-1 Procter & Gamble’s Global Advertising 33 CASE 2-1 VW Backgrounds 34
Chapter 3 Hypothesis Tests, Confidence Intervals and Simulation 35
3.1 Sample Means Are Random Variables 35 Example 3.1 Thirsty on Campus: Is there Sufficient Demand? 35 3.2 Use Sample Data to Determine Whether Or Not µ Is Likely
To Exceed A Target 38 3.3 Confidence Intervals Estimate the Population Mean From A Sample 41 3.4 Round t to Calculate Approximate 95% Confidence Intervals
43 3.5 43 3.6 Samples Are Efficient 44 3.7 Use Monte Carlo Simulation with Sample Statistics To Incorporate
44 3.8 Determine Whether There Is a Difference Between Two Segments
With Student t 48 Example 3.2 Pampers Preemies: Is Income a Useful Base
for Segmentation? 48 3.9
With Student t 49 3.10 Confidence Intervals Complement Hypothesis Tests 50 3.11 Estimation of a Population Proportion from a Sample Proportion 50 Example 3.3 Guinea Pigs 50 3.12 Conditions for Assuming Approximate Normality to Make
Confidence Intervals for Proportions 53 3.13 Conservative Confidence Intervals for a Proportion 53 3.14 Assess the Difference between Alternate Scenarios or Pairs
With Student t 54 Example 3.4 Are “Socially Desirable” Portfolios Undesirable? 55 3.15 Inference from Sample to Population 58 Excel 3.1 Test the level of a population mean with a one sample t test 59 Excel 3.2 Make a confidence interval for a population mean 60
to Infer Population Characteristics and Differences
With Mental Math Margin of Error Is Inversely Proportional To Sample Size
Uncertainty and Quantify Implications Of Assumptions
Estimate the Extent of Difference between Two Segments

Contents ix
Excel 3.3 Illustrate population confidence intervals with a clustered column chart 61
Excel 3.4 Conduct a Monte Carlo simulation with Crystal Ball 65 Excel 3.5 Test the difference between two segments with a two sample t test 69 Excel 3.6 Construct a confidence interval for the difference between
two segments 70 Excel 3.7 Illustrate the difference between two segment means
with a column chart 71 Excel 3.8 Construct a pie chart of shares Excel 3.9 Test the difference in levels between alternate scenarios
or pairs with a paired t test 74 Excel 3.10 Construct a confidence interval for the difference between
alternate scenarios or pairs 76 Excel Shortcuts at Your Fingertips 78 Lab Practice 3 Inference 80 Lab 3 Inference 82 Assignment 3-1 Bottled Water Possibilities 83 Assignment 3-2 Immigration in the U.S. 84 Assignment 3-3 McLattes 84 Assignment 3-4 A Barbie Duff in Stuff 85 CASE 3-1 Yankees v Marlins: The Value of a Yankee Uniform 85 CASE 3-2 Gender Pay 86 CASE 3-3 Polaski Vodka: Can a Polish Vodka Stand Up
to the Russians? 86 CASE 3-4 American Girl in Starbucks 88
Chapter 4 Quantifying the Influence of Performance Drivers and Forecasting: Regression 91
4.1 The Simple Linear Regression Equation Describes the Line Relating 91
Example 4.1 HitFlix Movie Rentals 92 4.2 F Tests the Significance of the Hypothesized Linear Relationship,
RSquare Summarizes Its Strength and Standard Error Reflects Forecasting Precision 93
4.3 The Population Slope Is Tested And Inferred From Our Sample 96 4.4 Analyze Residuals To Learn Whether Assumptions Have Been Met 98 4.5 95% Prediction Intervals Acknowledge That Individual
Elements Differ 99 4.6 Use Sensitivity Analysis to Explore Alternative Scenarios 101
72
A Decision Variable to Performance

x Contents
4.7 95% Conditional Mean Prediction Intervals Of Average Performance Gauge Average Performance Response To A Driver 101
4.8 Explanation And Prediction Create A Complete Picture 102 4.9 Present Regression Results In Concise Format 103 4.10 We Make Assumptions When We Use Linear Regression 104 4.11 Correlation Is A Standardized Covariance 105 Example 4.2 HitFlix Movie Rentals 105 4.12 Correlation Coefficients Are Key Components Of Regression
Slopes 109 Example 4.3 Pampers 110 4.13 Correlation Summarizes Linear Association 113 4.14 Linear Regression Is Doubly Useful 113 Excel 4.1 Fit a simple linear regression model 114 Excel 4.2 Construct prediction and conditional mean prediction intervals 118 Excel 4.3 Find correlations between variable pairs 124 Excel Shortcuts at Your Fingertips 126 Lab 4 Regression 128 CASE 4-1 GenderPay (B) 130
Chapter 5 Marketing Segmentation with Descriptive Statistics,
5.1 Guide to Effective PowerPoint Presentations and Writing
Memos that your Audience will Read 5.2 Write Memos that Encourage Your Audience to Read
and Use Results MEMO Re: Importance of Fit Drives Trial Intention
Chapter 6 Finance Application: Portfolio Analysis with a Market Index as a Leading Indicator in Simple Linear Regression
6.1 Rates of Return Reflect Expected Growth of Stock Prices 6.2 Investors Trade Off Risk And Return 6.3 Beta Measures Risk
Inference, Hypothesis Tests and Regression
Assignment 4-1 Impact of Defense Spending on Economic Growth 133
135
CASE 5-1 Segmentation of the Market for Preemie Diapers 135
145
147 148
149
149 Example 6.1 Goldman Sachs and Yahoo Returns 149
152 152
Example 6.2 Four diverse stocks 153
CASE 4-2 GM Revenue Forecast 131

Contents xi
6.4 Averages of Individual Stocks
Better Portfolios Define The Efficient Frontier MEMO Re: Recommended Portfolios Include Lockheed
Martin and Apple
Excel 6.1 Estimate portfolio expected rate of return and risk Excel 6.2 Plot return by risk to identify dominant portfolios and the Efficient
Assignment 6-2 Expected Returns and Beta Estimates of Alternate
Chapter 7 Association between Two Categorical Variables: Contingency Analysis with Chi Square
7.1 When Conditional Probabilities Differ From Joint Probabilities,
7.2 Chi Square Tests Association between Two Categorical Variables 7.3 Chi Square Is Unreliable If Cell Counts Are Sparse 7.4 Simpson’s Paradox Can Mislead MEMO Re: Country of Manufacture Does Not Affect Older
Buyers’ Choices 7.5 Contingency Analysis Is Demanding 7.6 Contingency Analysis Is Quick, Easy, and Readily Understood Excel 7.1 Construct crosstabulations and assess association between
categorical variables with PivotTables and PivotCharts Excel 7.2 Use chi square to test association Excel 7.3 Conduct contingency analysis with summary data
A Portfolio’s Expected Return, Risk and Beta Are Weighted
6.5
6.6 Portfolio Risk Depends On the Covariances between Individual
There Is Evidence of Association
Stocks’ Rates of Return and The Market Rate Of Return
158 Example 6.3 Four Alternate Portfolios 158
161
162
163 164
Frontier 166 Assignment 6-1 Individual Stocks’ Beta Estimates 169
Portfolios 169 Assignment 6-3 Portfolio Comparison 170
171
171Example 7.1 Recruiting Stars 172
174 175 177
Example 7.2 American Cars 177
183 184 184
185 187 190
Excel Shortcuts at Your Fingertips 193 Assignment 7-1 747s and Jets 195 Assignment 7-2 Fit Matters 195 Assignment 7-3 Allied Airlines 196 CASE 7-1 Hybrids for American Car 197 CASE 7-2 Tony’s GREAT Advertising 198

xii Contents
Chapter 8 Building Multiple Regression Models
8.1 Multiple Regression Models Identify Drivers and Forecast 8.2 Use Your Logic to Choose Model Components 8.3 Multicollinear Variables Are Likely When Few Variable
Combinations Are Popular In a Sample 8.4 F Tests the Joint Significance of the Set of Independent Variables 8.5 Insignificant Parameter Estimates Signal Multicollinearity 8.6 Combine or Eliminate Collinear Predictors 8.7 Partial F Tests the Significance of Changes in Model Power 8.8 Sensitivity Analysis Quantifies the Marginal Impact Of Drivers MEMO Re: Light, responsive, fuel efficient cars with smaller
engines are cleanest 8.9 Model Building Begins With Logic and Considers
Multicollinearity Excel 8.1 Build and fit a multiple linear regression model Excel 8.2 Use sensitivity analysis to compare the marginal impacts
of drivers
Chapter 9 Model Building and Forecasting with Multicollinear Time Series
9.1 Time Series Models Include Decision Variables, External Forces, Leading Indicators, And Inertia
9.2 Indicators of Economic Prosperity Lead Business Performance 9.3 Inertia from Loyal Customers Drives Performance 9.4 Compare Scatterplots across Time to Choose Length of Lags
For Drivers of Delayed Response: Visual Inspection 9.5 Hide the Two Most Recent Datapoints to Validate a Time Series
9.6 Correlations Guide Choice of Lags 9.7 9.8 Assess Residuals to Identify Unaccounted For Trend or Cycles 9.9 Forecast the Recent, Hidden Points to Assess Predictive Validity
The Durbin Watson Statistics Identifies Autocorrelation
201
201201
Example 8.1 Sakura Motors Quest for Cleaner Cars 202
203204205205207211
214
215216
221Lab Practice 8 228 Lab 8 Model Building with Multiple Regression 230Assignment 8-1 233
235
237Example 9.1 Home Depot Revenues 238
238238
239
Model 241241242 243246
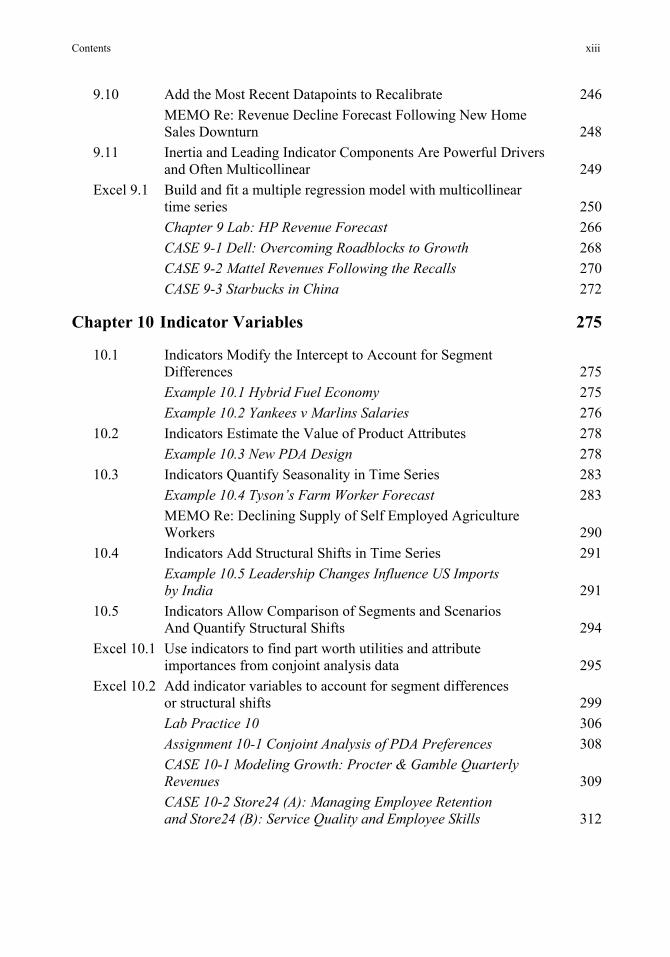
Contents xiii
9.10 Add the Most Recent Datapoints to Recalibrate MEMO Re: Revenue Decline Forecast Following New Home
Sales Downturn 9.11 Inertia and Leading Indicator Components Are Powerful Drivers
and Often Multicollinear Excel 9.1 Build and fit a multiple regression model with multicollinear
time series
Chapter 10 Indicator Variables
10.1 Indicators Modify the Intercept to Account for Segment
10.2 10.3 Indicators Quantify Seasonality in Time Series MEMO Re: Declining Supply of Self Employed Agriculture
10.4 Indicators Add Structural Shifts in Time Series Example 10.5 Leadership Changes Influence US Imports
10.5 Indicators Allow Comparison of Segments and Scenarios And Quantify Structural Shifts
Excel 10.1 Use indicators to find part worth utilities and attribute importances from conjoint analysis data
Excel 10.2 Add indicator variables to account for segment differences or structural shifts
CASE 10-1 Modeling Growth: Procter & Gamble Quarterly
CASE 10-2 Store24 (A): Managing Employee Retention
Indicators Estimate the Value of Product Attributes
246
248
249
250Chapter 9 Lab: HP Revenue Forecast 266CASE 9-1 Dell: Overcoming Roadblocks to Growth 268CASE 9-2 Mattel Revenues Following the Recalls 270CASE 9-3 Starbucks in China 272
Differences 275Example 10.1 Hybrid Fuel Economy 275Example 10.2 Yankees v Marlins Salaries 276
283 Example 10.4 Tyson’s Farm Worker Forecast 283
Workers 290291
by India 291
294
295
299Lab Practice 10 306Assignment 10-1 Conjoint Analysis of PDA Preferences 308
Revenues 309
and Store24 (B): Service Quality and Employee Skills 312
Example 10.3 New PDA Design 278
275
278

xiv Contents
Chapter 11 Nonlinear Multiple Regression Models
11.1 Consider a Nonlinear Model When Response Is Not Constant 11.2 Tukey’s Ladder of Powers 11.3 Rescaling y Builds in Synergies 11.4 Sensitivity Analysis Reveals the Relative Strength of Drivers
MEMO Re: Executive Compensation Driven by Firm Performance and Age
11.5 Gains from Nonlinear Rescaling Are Significant 11.6 Nonlinear Models Offer the Promise of Better Fit
and Better Behavior Excel 11.1 Rescale to build and fit nonlinear regression models with linear
Excel 11.2 Consider synergies in sensitivity analysis with a nonlinear model
CASE 11-1 Global Emissions Segmentation: Markets Where
Chapter 12 Indicator Interactions for Structural Differences or Changes in Response
12.1 Indicator Interaction with a Continuous Influence Alters Its Partial Slope
MEMO Re: Women are Paid More than Men at Slam’s Club
12.2 Indicator Interactions Capture Segment Differences or Structural
Differences in Response Excel 12.1 Add indicator interactions to capture segment differences
or structural differences in response
Chapter 13 Logit Regression for Bounded Responses
13.1 Rescaling Probabilities or Shares to Odds Improves Model Validity MEMO Re: Fuel Efficiency Drives Hybrid Owner Satisfaction
313
313313315
Example 11.1 Executive Compensation 315320
323324
325
regression 326334
Lab Practice 11 338
Hybrids Might Have Particular Appeal 339
343
343Example 12.1 Gender Discrimination at Slams Club 344
350Example 12.2 Car Sales in China 351
358
359Lab Practice 12 370CASE 12-1 Explain and Forecast Defense Spending for Rolls-Royce 372CASE 12-2 Haier’s U.S. Refrigerator Strategy 375
377
377Example 13.1 The Import Challenge 378
385Example 13.2 Presidential Approval Proportion 386

Contents xv
13.2 Logit Models Provide the Means to Build Valid Models of Shares And Proportions
Excel 13.1 Rescale a limited dependent variable to logits
CASE 13-1 Alltel’s Plans to Capture Share in the Cell Phone
CASE 13-2 Pilgrim Bank (A): Profitability and Pilgrim
390391
Assignment 13-1 Big Drug Co Scripts 399
Service Market 400
Bank (B): Customer Retention 403
Index 405

Preface
Exceptional managers know that they can create competitive advantages by basingdecisions on performance response under alternative scenarios. To create these advantages, managers need to understand how to use statistics to provide information on performance response under alternative scenarios. Statistics are created to make better decisions. Statistics are essential and relevant. Statistics must be easily and quickly produced using widely available software, Excel. Then results must be translated into general business language and illustrated with compelling graphics to make them understandable and usable by decision makers.
This book helps students master this process of using statistics to create competitive advantages as decision makers. Statistics are essential, relevant, easy to produce, easy to understand, valuable, and fun, when used to create competitive advantage. The Examples, Assignments, And Cases Used To Illustrate Statistics For Decision Making Come From Business Problems McIntire Corporate Sponsors and Partners, such as Rolls-Royce, Procter & Gamble, andDell, and the industries that they do business in, provide many realistic examples. The book also features a number of examples of global business problems, including those from important emerging markets in China and India. It is exciting to see how statistics are used to improve decision making in real and important business decisions. This makes it easy to see how statistics can be used to create competitive advantages in similarapplications in internships and careers. Learning Is Hands On With Excel and Shortcuts Each type of analysis is introduced with one or more examples. First, the story of what exactly statistics can provide to decision makers is revealed. Following are examples illustrating the ways that statistics could actually be used to improve decision making. Analyses from Excel is shown and translated so that it is easy to see what the numbers mean to decision makers.
Included in Excel sections which follow are screenshots of an example analysis. Step by step instructions with screen shots allow easy master Excel. Featured are a number of popular Excel shortcuts, which are, themselves, a competitive advantage. Following Excel examples are lab practice problems, designed to closely resemble the chapter examples. Assignments and cases follow, with additional applications to new decision problems.
Powerful PivotTables and PivotCharts are introduced early and used throughout the
book. Results are illustrated with graphics from Excel.

xviii Preface
Beginning in Chapter 9, Harvard Business School cases are suggested which provide additional opportunities to use statistics to advantage. Focus Is On What Statistics Mean to Decision Makers and How to Communicate Results From the beginning, results are translated into English. In Chapter 5, results are con-densed and summarized in memos, the standard of communication in businesses. Later chapters include example memos for students to use as templates, making communication of statistics for decision making an easy skill to master.
Instructors, give your students the powerful skills that they will use to create com-petitive advantages as decision makers. Students, be prepared to discover that statistics are a powerful competitive advantage. Your mastery of the essential skills of creating and communicating statistics for improved decision making will enhance your career and make numbers fun. Acknowledgements Preliminary editions of Business Statistics for Competitive Advantage were used at The McIntire School, University of Virginia, and I thank the many bright, motivated and enthusiastic students who provided comments and suggestions. Special thanks to Senior Associate Dean Rick Netemeyer, The McIntire School, University of Virginia, for his helpful suggestions, support, encouragement and camaraderie, and to Professor Tony Baglioni, also The McIntire School, University of Virginia, for many excellent comments and suggestions.
My appreciation and gratitude goes to John Kimmel, Springer, for sharing my vision and making this text a reality.
Cynthia Fraser Charlottesville, VA