Embed Size (px)
Citation preview
Business Overview and Opportunities
1
Philip J. Hawk, Chairman and CEO
Ted W. Owen, EVP and CFO
November 2010
Updated November 2, 2010

2
Safe Harbor Statement
Statements and projections in this presentation that relate to future results and
events are forward-looking statements within the meaning of the Private Securities
Litigation Reform Act of 1995 and are based upon our current expectations. Such
forward-looking statements and projections involve estimates, assumptions,
judgments and uncertainties. We have made reasonable efforts to ensure that the
information, assumptions and beliefs upon which these forward-looking statements
and projections are based are current, reasonable and complete. However, there
are a variety of known and unknown factors that could cause our actual results or
outcomes to differ materially from the projections, anticipated results or other
expectations expressed in this release. Such known factors are detailed in our
Annual Report on Form 10-K for the year ended May 31, 2010 and in our other
filings with the Securities and Exchange Commission. Accordingly, there can be no
assurance that the forward-looking statements and projections contained will occur
or that our objectives will be achieved. We assume no obligation to publicly update
or revise any forward-looking statements made today or any other forward-looking
statements made by the company, whether as a result of new information, future
events or otherwise.
3
Discussion Topics
Review Team’s business focus, strategy and recent
performance
Discuss Team’s recent purchase of Quest Integrity Group
Provide Team’s financial information and guidance
4
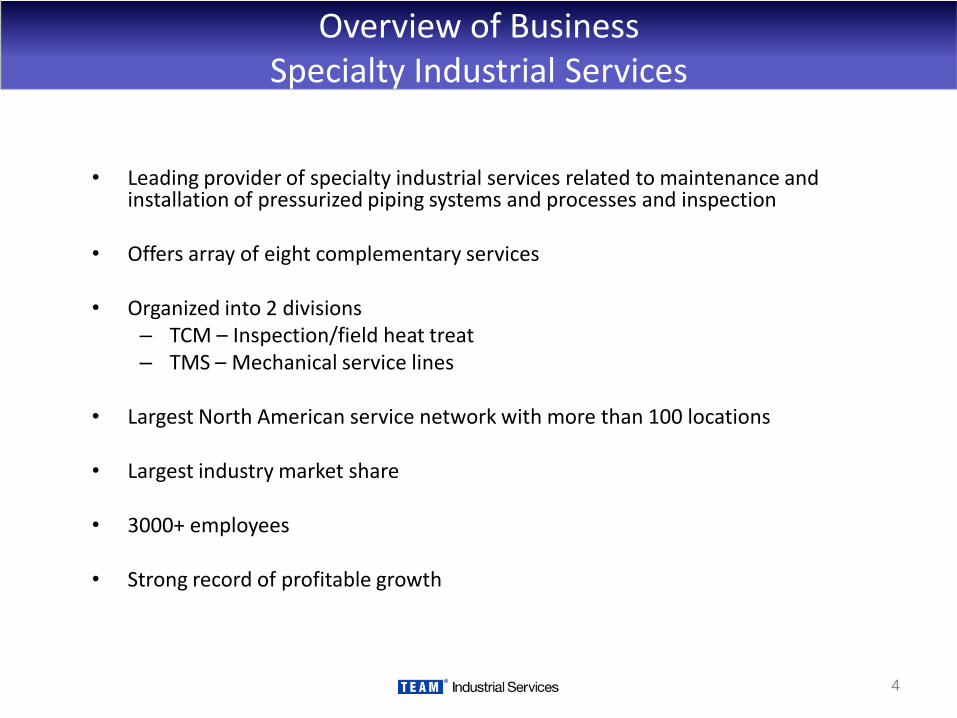
Overview of BusinessSpecialty Industrial Services
• Leading provider of specialty industrial services related to maintenance and installation of pressurized piping systems and processes and inspection
• Offers array of eight complementary services
• Organized into 2 divisions– TCM – Inspection/field heat treat– TMS – Mechanical service lines
• Largest North American service network with more than 100 locations
• Largest industry market share
• 3000+ employees
• Strong record of profitable growth
5
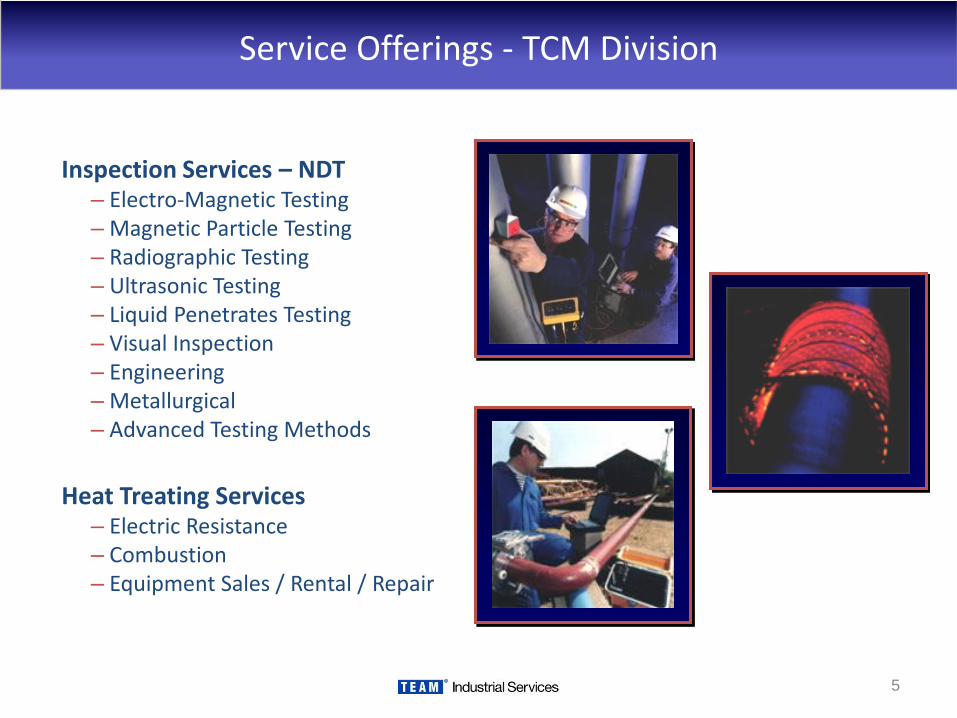
Inspection Services – NDT– Electro-Magnetic Testing – Magnetic Particle Testing– Radiographic Testing– Ultrasonic Testing– Liquid Penetrates Testing– Visual Inspection– Engineering– Metallurgical– Advanced Testing Methods
Heat Treating Services– Electric Resistance– Combustion– Equipment Sales / Rental / Repair
Service Offerings - TCM Division

6
Service Offerings - TMS Division
Mechanical On-Stream Services
– Leak Repair Services
– Hot Tapping Services
Leak Detection & Repair Services (LDAR)
Turnaround / Outage Services
– Field Machining Services
– Technical Bolting Services
– Valve Repair Services
– Pipe Isolation Services

7
US Service Locations
Mobile
BeaumontCorpus Christi
Houston
Texas City
Lake Charles
Lafayette
Baton Rouge
New Orleans
Los Angeles
San Francisco
Seattle
Billings
Salt Lake City
Denver
Minneapolis
Borger
Tulsa
St. Louis
ChicagoToledo
CincinnatiCharleston
Pittsburgh
Richmond
Syracuse
Philadelphia
New York City
Manchester
Odessa
Chattanooga
DecaturAugusta
Wilmington
Tampa
Columbus
Phoenix
Jacksonville
Cleveland
Detroit
Hammond
Hartford
Milwaukee
Branch Office
Branch Office and Equipment Center
Rumford
Longview
Kansas City
CharlotteMemphis
Missoula
Crown Point
8
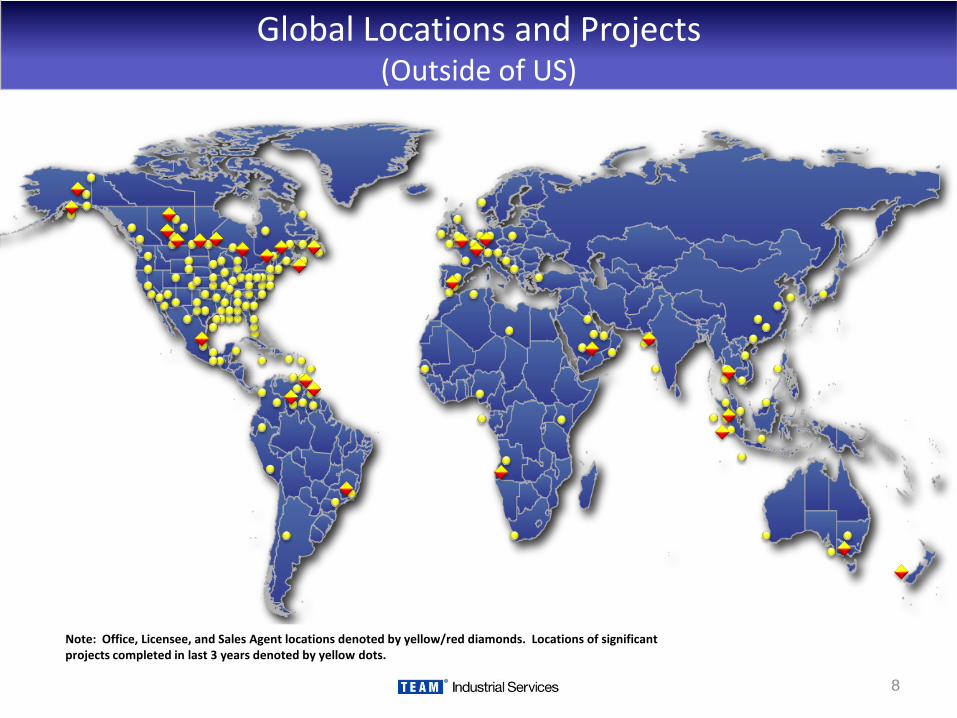
Global Locations and Projects (Outside of US)
Note: Office, Licensee, and Sales Agent locations denoted by yellow/red diamonds. Locations of significant projects completed in last 3 years denoted by yellow dots.
9
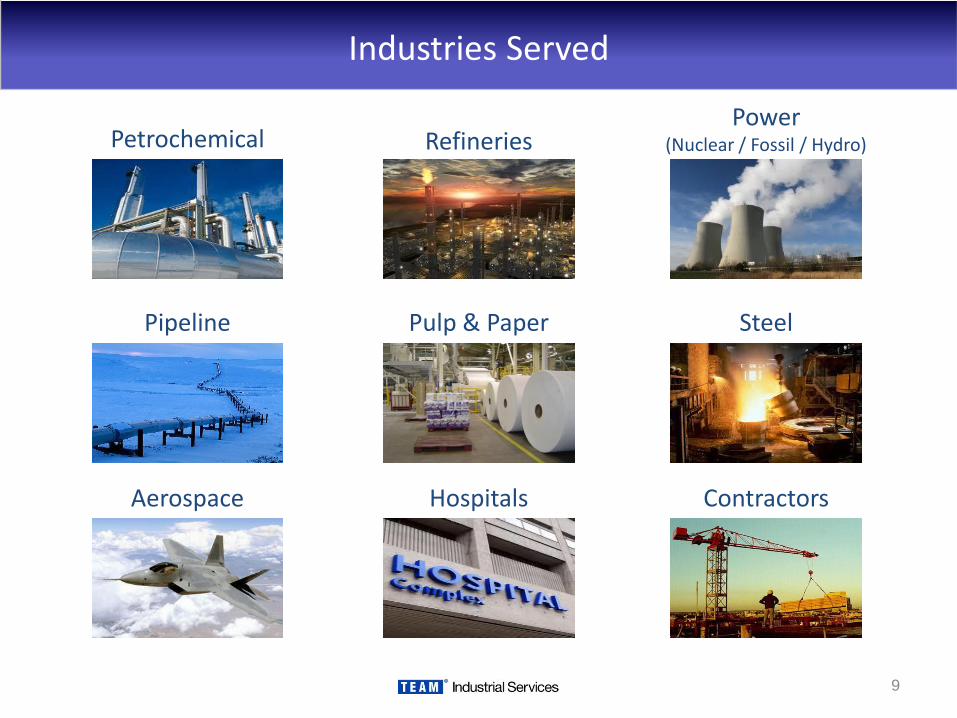
Industries Served
Petrochemical RefineriesPower
(Nuclear / Fossil / Hydro)
Pipeline Pulp & Paper Steel
Aerospace Hospitals Contractors
10
Team’s Performance Summary
• Team’s 10 Year Performance History has been very attractive:
– Revenue Growth
• 2001 – 2010 Total Revenue CAGR 20%
• 2001 – 2010 Organic CAGR 14%
– Net income Growth 2001-2010 CAGR 19%
• Team’s performance results of the last 18 months, however,
reflecting the severe recession, have been disappointing.
11
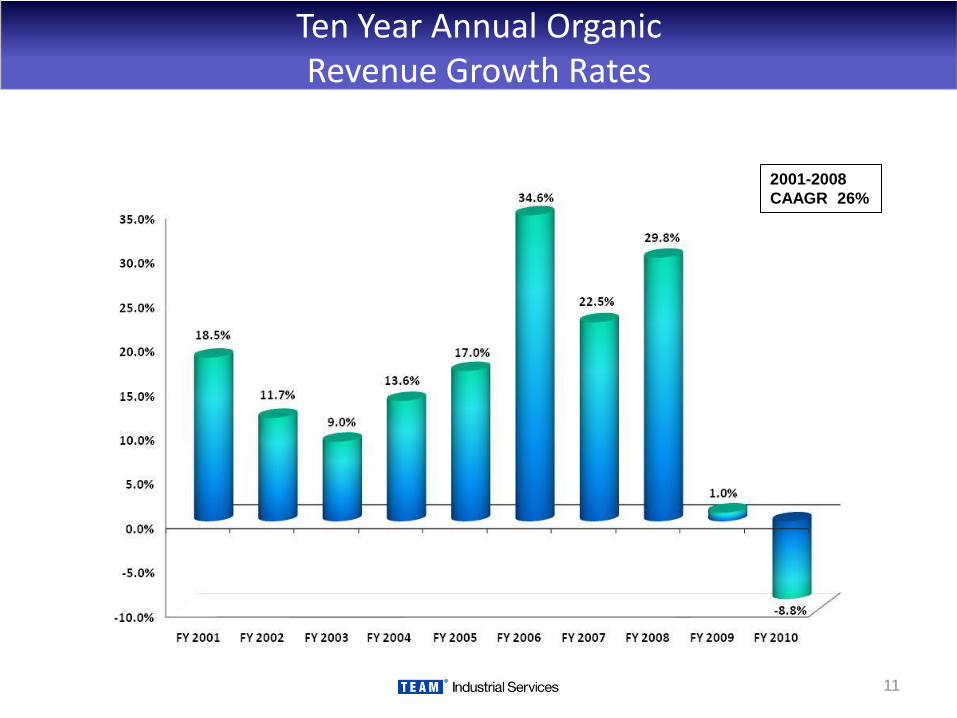
Ten Year Annual Organic Revenue Growth Rates
2001-2008
CAAGR 26%
12
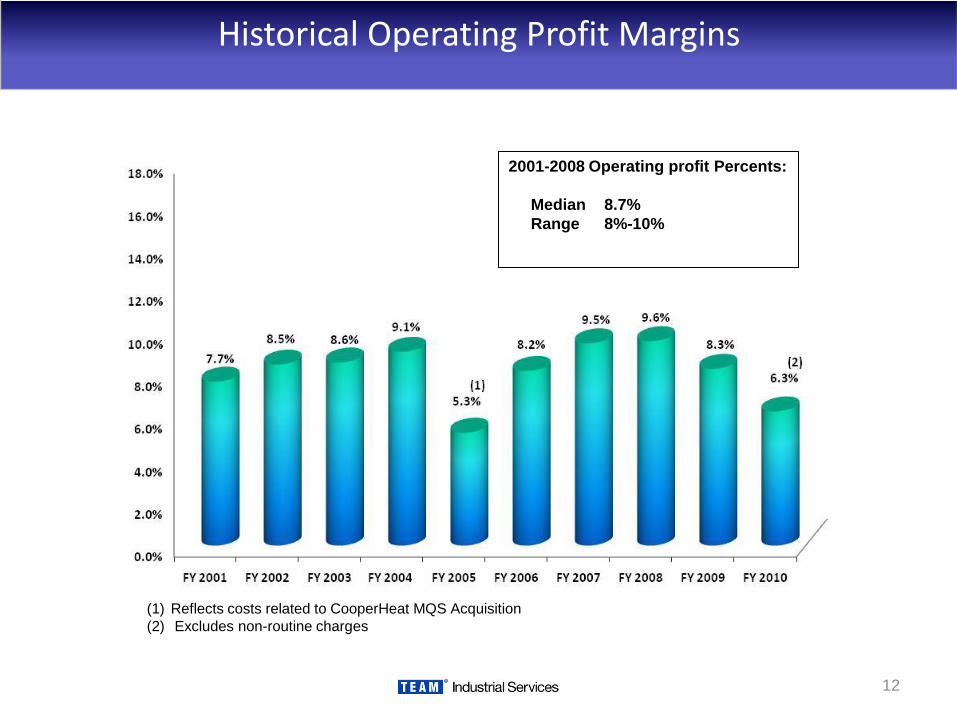
Historical Operating Profit Margins
(1) Reflects costs related to CooperHeat MQS Acquisition
(2) Excludes non-routine charges
2001-2008 Operating profit Percents:
Median 8.7%
Range 8%-10%

13
Key Investor Questions
• Can Team become a growth business again? How? When?
• Can Team’s historical profit margins be achieved and maintained in current market environment?
14
Team’s Answers
• Despite continuing difficult market conditions, Team expects revenue growth in the current fiscal year
• Team expects to achieve significant operating leverage from its near term growth and continued strong cash flow from operations
• Team’s longer term growth and performance prospects remain excellent
15
Our Perspective on Growth
• Despite continuing difficult market conditions, Team expects revenue growth in the current fiscal year– Demand for services has stabilized (but at a lower level)
– Team’s fundamental structural advantages are as relevant as ever
– Team has adapted its business development approach to reflect current market conditions and procurement processes
– New capabilities are creating supplemental growth opportunities
– We believe our growth began in last year’s fourth quarter
16
End Market Fundamentals
• Large, broad based market
– All plants/pipelines with pressurized piping systems require services – 10,000+ plants
– Overall market size - $2.5 billion in North America
• Stable demand – 85%+ of Business Related to Maintenance Activities
– Our services are required for uptime and safe operations – not discretionary over long-term
– Hydraulic, thermal, and corrosive stresses degrade piping systems
• No customer more than 5% of revenues
• Large number of competitors—still highly fragmented
17
Market and Competitive Overview
• Highly fragmented competitive landscape – Limited capital intensity, limited entry barriers historically – a
“service business”
– Business evolved locally as plants used local service personnel they knew
– Only a few service providers with multi-service and national presence
• Only one other national, multi-service line competitor
• More than 100 “Mom & Pop” competitors
18
Customer Procurement Trends
• Drive for continuing productivity improvement
• Push to reduce number of service vendors utilized- Shift toward sole source relationships- Combination of services from single service provider
• Emergence of multi-plant service management approaches
• Cross-plant benchmarking and best practices
• Reduced direct oversight by customer, requiring service companies to demonstrate “independent” capability
- Safety training and safety record- Service line experience and technician training - Documented procedures- Access to technical support and job planning resources
19
Recent Customer/Industry Trends
• Global Economic Recession
• New Project Activity Significantly Reduced
• Oil and Refining Beginning to Stabilize
• Increased Focus on Price/Rates
• Interest in New Pricing Arrangements
• Safety and Quality Expectations are Higher
20
Exciting New Capabilities
• Insert Valves
• Pipeline “Wyes”
• Advanced Inspection Technologies:
– GUL
– Phased Array
– AUT
– E-Mat
• Wireless and Induction Heat Services
• Laser Measurement Capabilities in Field Machining
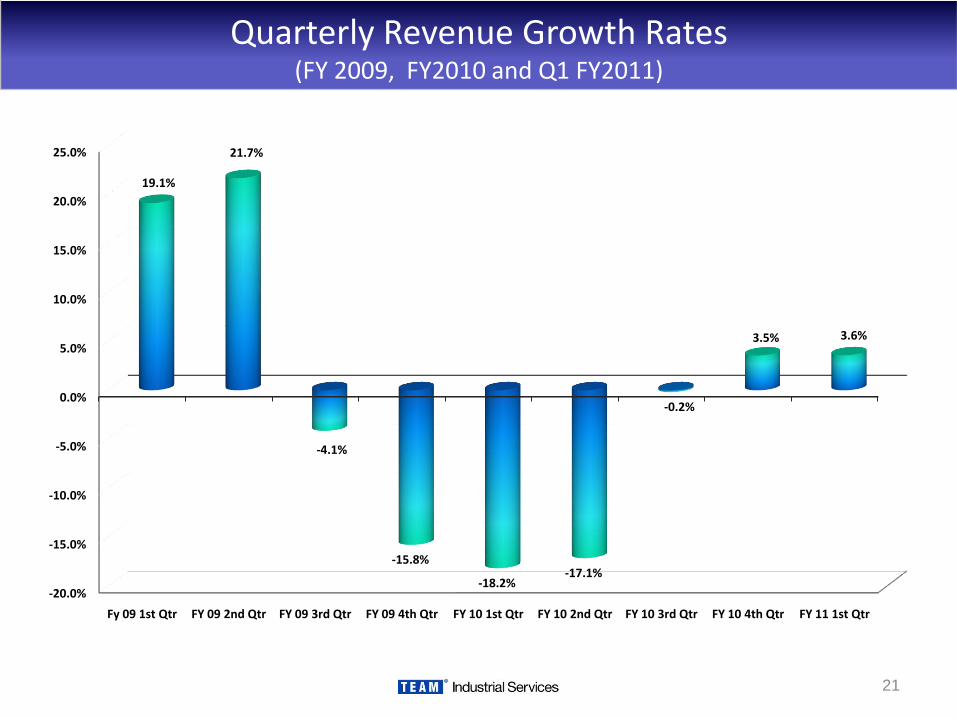
21
Quarterly Revenue Growth Rates(FY 2009, FY2010 and Q1 FY2011)
-20.0%
-15.0%
-10.0%
-5.0%
0.0%
5.0%
10.0%
15.0%
20.0%
25.0%
Fy 09 1st Qtr FY 09 2nd Qtr FY 09 3rd Qtr FY 09 4th Qtr FY 10 1st Qtr FY 10 2nd Qtr FY 10 3rd Qtr FY 10 4th Qtr FY 11 1st Qtr
19.1%
21.7%
-4.1%
-15.8%
-18.2%-17.1%
-0.2%
3.5% 3.6%
22
Our Perspective on Operating Leverage
• Despite continuing difficult market conditions, Team expects revenue growth in the current fiscal year
• Team expects to achieve significant operating leverage from its near term growth and continued strong cash flow from operations– Team has substantially reduced its cost base over the past couple of years
– Working Capital performance improvements have lowered the investment requirements of future growth
23
Cost Reduction Initiatives(FY2009 and FY2010)
• Eliminated more than 130 SGA and Indirect Cost positions since February 2009.
• Rolled back benefit plan contributions.
• Reduced guaranteed hours.
• Minimized compensation adjustments to salaried personnel.
• Resulting in $15 million of SGA and Indirect cost reductions over last two years….
• …..and a substantial reduction in outstanding debt and improved financial condition.
24
Our Perspective on Long Term Growth
• Despite continuing difficult market conditions, Team expects revenue growth in the current fiscal year
• Team expects to achieve significant operating leverage from its near term growth and continued strong cash flow from operations
• Team’s longer term growth and performance prospects remain excellent
– Current market share is less than 20%
– Potential growth in a number of exciting areas
– Corresponding profit growth/growth in business is highly leveraged.
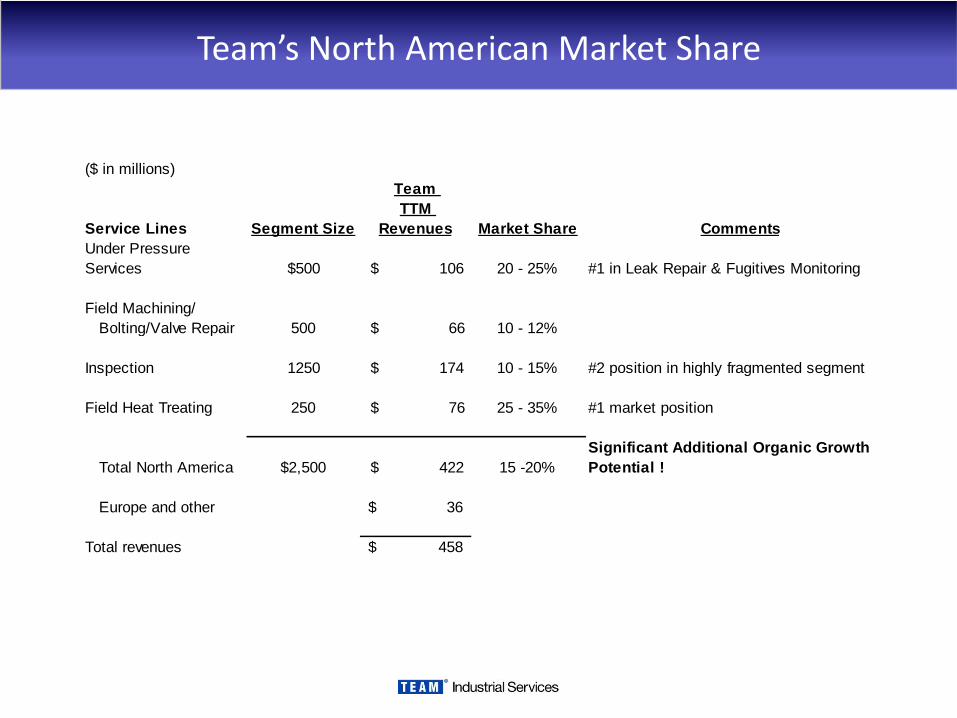
Team’s North American Market Share
($ in millions)
Team
TTM
Revenues
Under Pressure
Services $500 $ 106 20 - 25% #1 in Leak Repair & Fugitives Monitoring
Field Machining/
Bolting/Valve Repair
Inspection 1250 $ 174 10 - 15% #2 position in highly fragmented segment
Field Heat Treating 250 $ 76 25 - 35% #1 market position
Total North America $2,500 $ 422 15 -20%
Significant Additional Organic Growth
Potential !
Europe and other 36$
Total revenues 458$
Service Lines Segment Size Market Share Comments
500 $ 66 10 - 12%

26
Our Growth Strategy
• Continue to expand business by capitalizing on large, broad-based service network
– Extend service offering to complementary services– Continue pursuit of multi-service/multi-plant agreements in response to
procurement trends
• Supplement organic growth with opportunistic acquisitions– Complementary services– Geographic extensions
• Europe/Asia
• New markets for current services
• Bring revenue growth to the bottom-line– Manage job margins and supporting costs– Capture inherent operating leverage in business growth
• “Stay a great service company!”
27
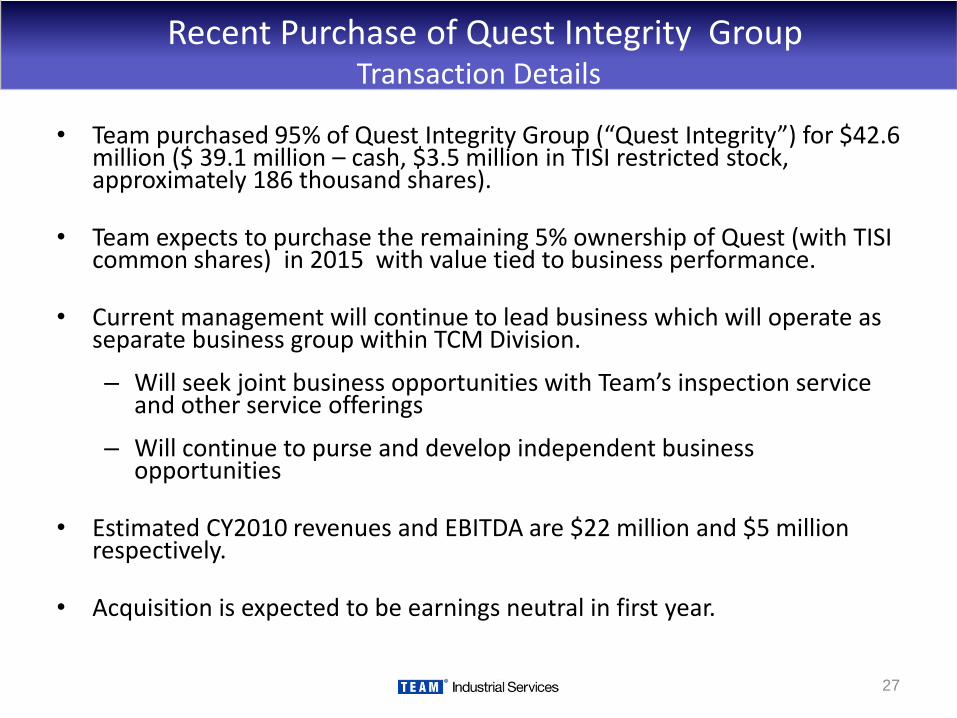
Recent Purchase of Quest Integrity GroupTransaction Details
• Team purchased 95% of Quest Integrity Group (“Quest Integrity”) for $42.6 million ($ 39.1 million – cash, $3.5 million in TISI restricted stock, approximately 186 thousand shares).
• Team expects to purchase the remaining 5% ownership of Quest (with TISI common shares) in 2015 with value tied to business performance.
• Current management will continue to lead business which will operate as separate business group within TCM Division.
– Will seek joint business opportunities with Team’s inspection service and other service offerings
– Will continue to purse and develop independent business opportunities
• Estimated CY2010 revenues and EBITDA are $22 million and $5 million respectively.
• Acquisition is expected to be earnings neutral in first year.
28
Strategic Goals for Quest Integrity Acquisition
• Expand the revenues and margins of Team’s inspection services business
– Enhance reputation to provide state-of-the-art, value-based solutions to customers
– Create growth opportunities in several new market segments and possibly accelerate growth opportunities in existing market segments
– Sustain strategic leadership in service segment via access to new and emerging technologies over time
• Capitalize on and accelerate, where appropriate, the future growth and performance of Quest Integrity Group
– Collaborate on North American market opportunities and increase market access/penetration for Quest Integrity Group services
– Provide appropriate corporate support and oversight for the high growth technology-enabled inspection services and capabilities
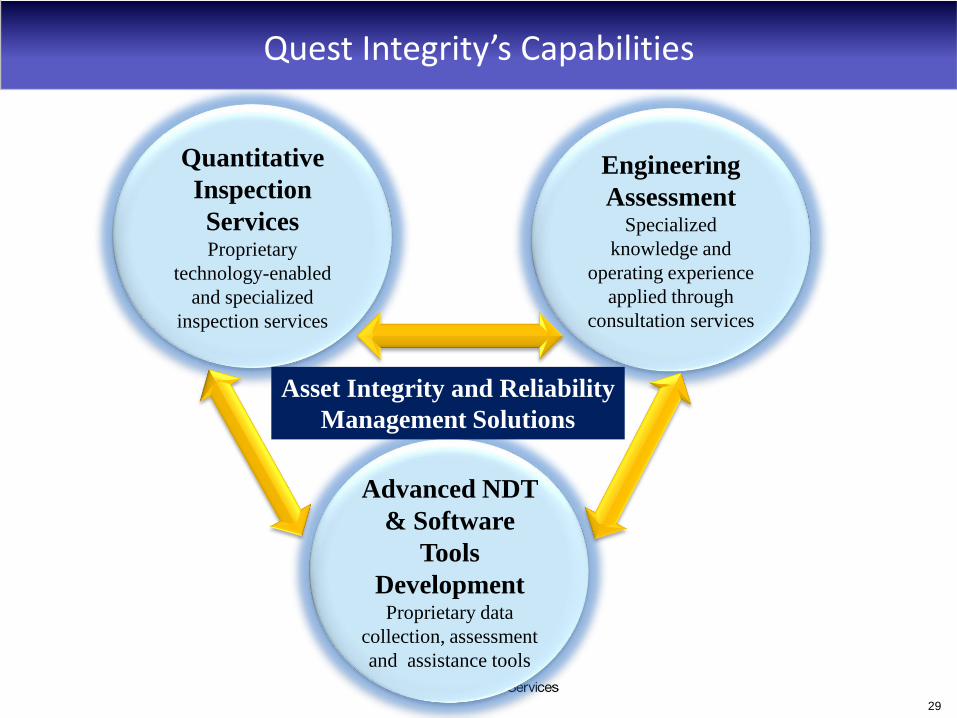
Quest Integrity’s Capabilities
29
Quantitative
Inspection
ServicesProprietary
technology-enabled
and specialized
inspection services
Engineering
AssessmentSpecialized
knowledge and
operating experience
applied through
consultation services
Advanced NDT
& Software
Tools
DevelopmentProprietary data
collection, assessment
and assistance tools
Asset Integrity and Reliability
Management Solutions
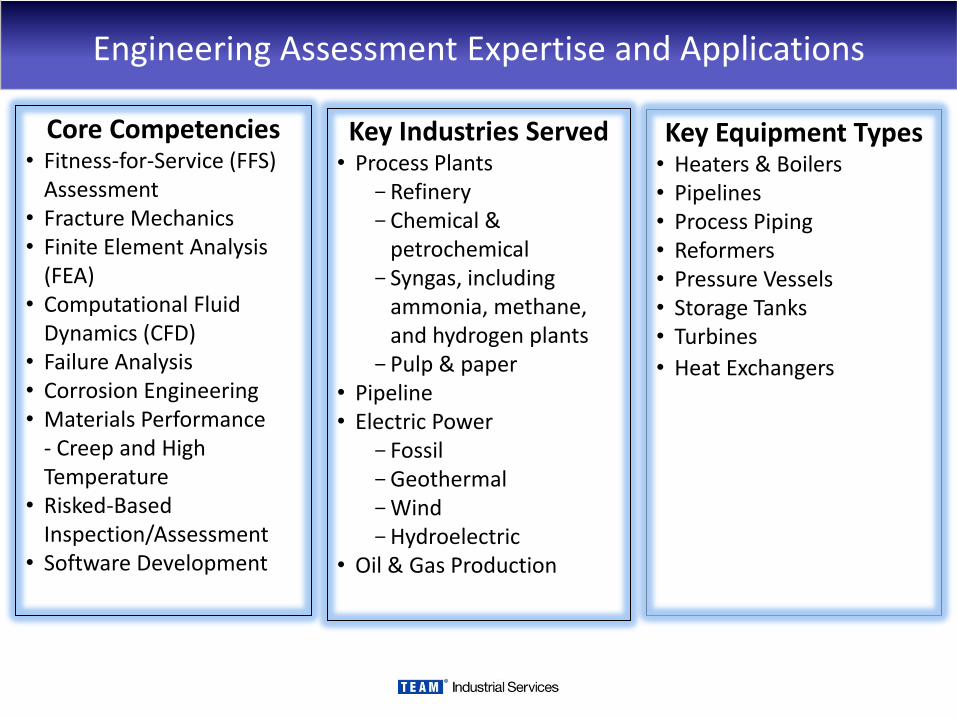
Engineering Assessment Expertise and Applications
Core Competencies • Fitness-for-Service (FFS)
Assessment• Fracture Mechanics• Finite Element Analysis
(FEA)• Computational Fluid
Dynamics (CFD)• Failure Analysis• Corrosion Engineering• Materials Performance
- Creep and High Temperature
• Risked-Based Inspection/Assessment
• Software Development
Key Industries Served• Process Plants
RefineryChemical &
petrochemicalSyngas, including
ammonia, methane, and hydrogen plants
Pulp & paper• Pipeline• Electric Power
FossilGeothermalWindHydroelectric
• Oil & Gas Production
Key Equipment Types• Heaters & Boilers• Pipelines• Process Piping• Reformers• Pressure Vessels• Storage Tanks• Turbines
• Heat Exchangers
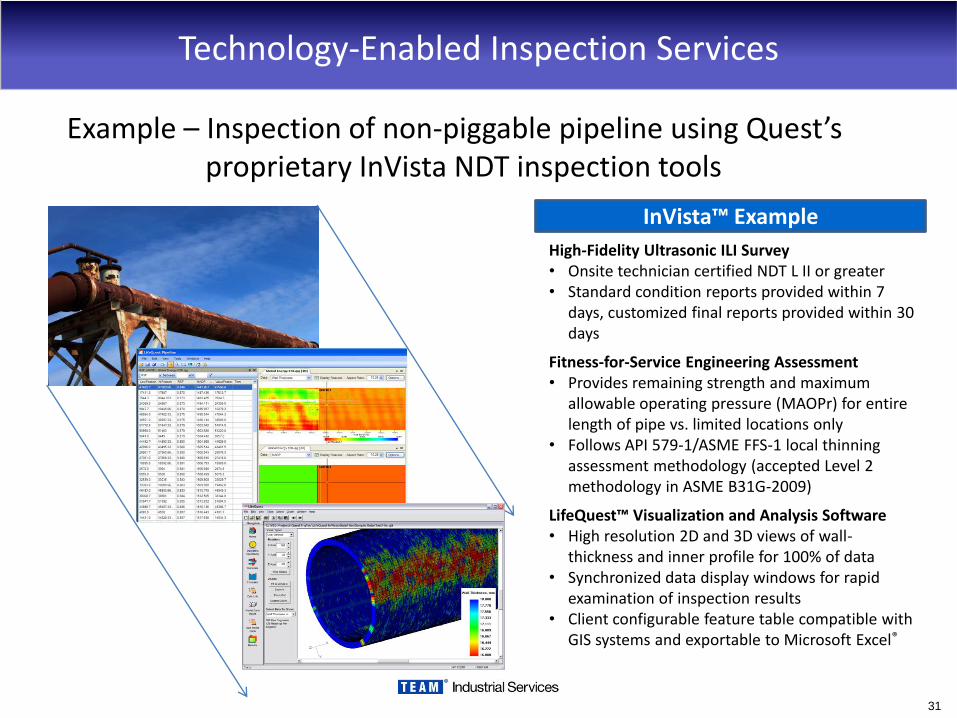
Technology-Enabled Inspection Services
Example – Inspection of non-piggable pipeline using Quest’s proprietary InVista NDT inspection tools
31
High-Fidelity Ultrasonic ILI Survey• Onsite technician certified NDT L II or greater• Standard condition reports provided within 7
days, customized final reports provided within 30 days
Fitness-for-Service Engineering Assessment• Provides remaining strength and maximum
allowable operating pressure (MAOPr) for entire length of pipe vs. limited locations only
• Follows API 579-1/ASME FFS-1 local thinning assessment methodology (accepted Level 2 methodology in ASME B31G-2009)
LifeQuest™ Visualization and Analysis Software• High resolution 2D and 3D views of wall-
thickness and inner profile for 100% of data• Synchronized data display windows for rapid
examination of inspection results• Client configurable feature table compatible with
GIS systems and exportable to Microsoft Excel®
InVista™ Example
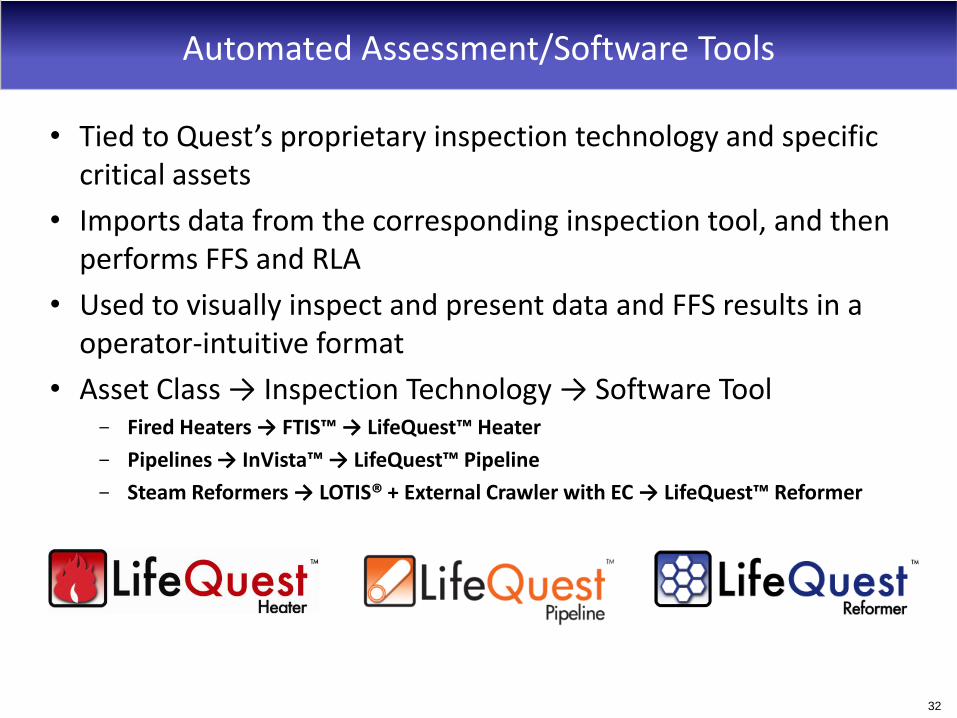
Automated Assessment/Software Tools
• Tied to Quest’s proprietary inspection technology and specific critical assets
• Imports data from the corresponding inspection tool, and then performs FFS and RLA
• Used to visually inspect and present data and FFS results in a operator-intuitive format
• Asset Class → Inspection Technology → Software Tool Fired Heaters → FTIS™ → LifeQuest™ Heater
Pipelines → InVista™ → LifeQuest™ Pipeline
Steam Reformers → LOTIS® + External Crawler with EC → LifeQuest™ Reformer
32

Quest Integrity Group Business Mix
2010YTD Revenue by Office 2010YTD Revenue by Division
USA 49.4%
New Zealand 18.9%
Canada 17.6%
Europe6.1%
Australia 6.0%
M. East 2.1%
Inspection 56.4%
Engineering Assessment
43.6%
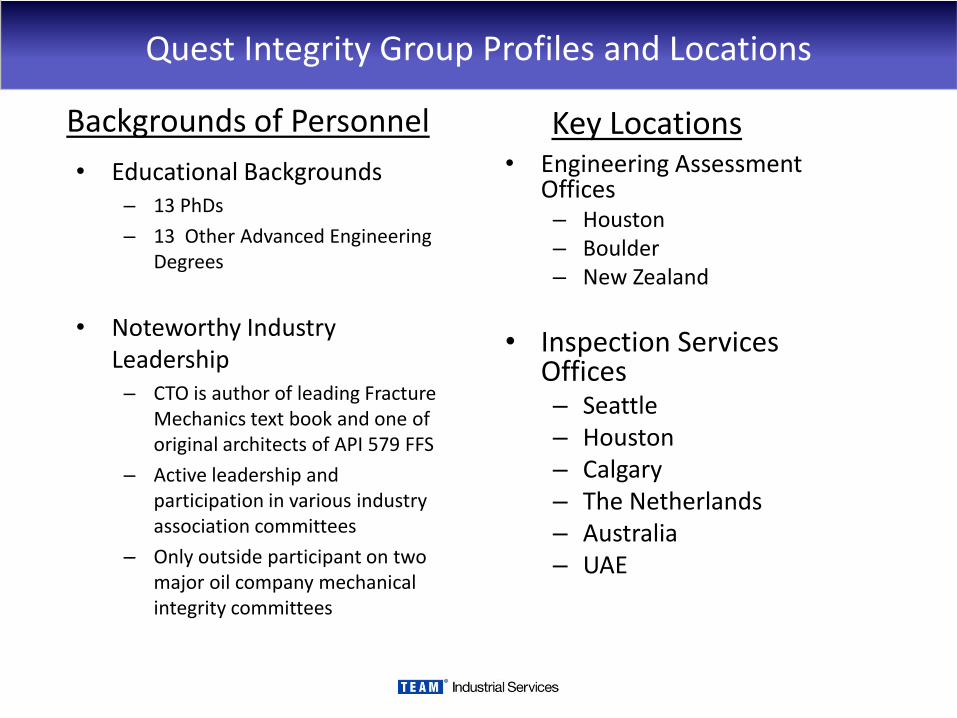
Quest Integrity Group Profiles and Locations
• Engineering Assessment Offices– Houston– Boulder– New Zealand
• Inspection Services Offices– Seattle– Houston– Calgary– The Netherlands– Australia– UAE
Key LocationsBackgrounds of Personnel
• Educational Backgrounds– 13 PhDs
– 13 Other Advanced Engineering Degrees
• Noteworthy Industry Leadership
– CTO is author of leading Fracture Mechanics text book and one of original architects of API 579 FFS
– Active leadership and participation in various industry association committees
– Only outside participant on two major oil company mechanical integrity committees
35
Wrap-Up
• Financial Summary
• FY2011 Guidance
• Our Values
36
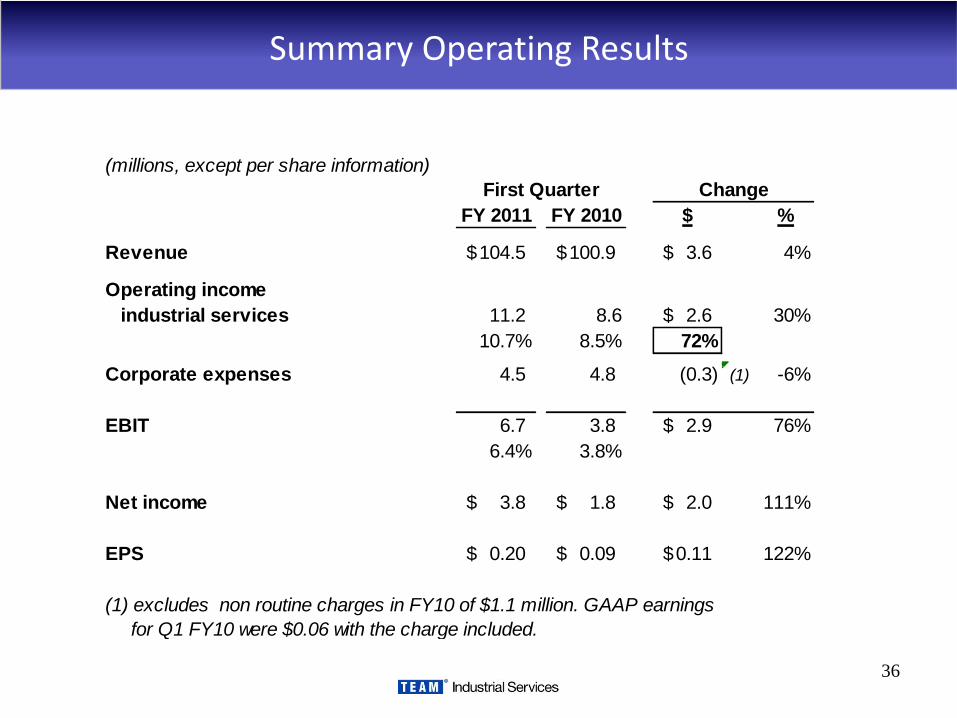
Summary Operating Results
(millions, except per share information)
FY 2011 FY 2010 $ %
Revenue 104.5$ 100.9$ 3.6$ 4%
Operating income
industrial services 11.2 8.6 2.6$ 30%
10.7% 8.5% 72%
Corporate expenses 4.5 4.8 (0.3) (1) -6%
EBIT 6.7 3.8 2.9$ 76%
6.4% 3.8%
Net income 3.8$ 1.8$ 2.0$ 111%
EPS 0.20$ 0.09$ 0.11$ 122%
(1) excludes non routine charges in FY10 of $1.1 million. GAAP earnings
for Q1 FY10 were $0.06 with the charge included.
First Quarter Change
37
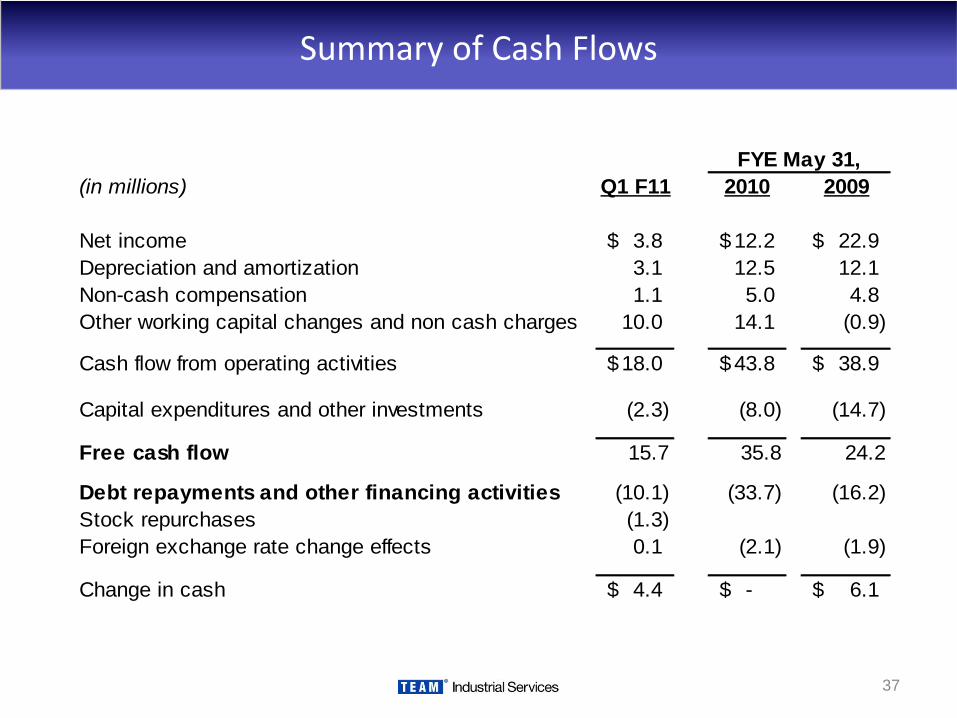
Summary of Cash Flows
(in millions) Q1 F11 2010 2009
Net income 3.8$ 12.2$ 22.9$
Depreciation and amortization 3.1 12.5 12.1
Non-cash compensation 1.1 5.0 4.8
Other working capital changes and non cash charges 10.0 14.1 (0.9)
Cash flow from operating activities 18.0$ 43.8$ 38.9$
Capital expenditures and other investments (2.3) (8.0) (14.7)
Free cash flow 15.7 35.8 24.2
Debt repayments and other financing activities (10.1) (33.7) (16.2)
Stock repurchases (1.3)
Foreign exchange rate change effects 0.1 (2.1) (1.9)
Change in cash 4.4$ -$ 6.1$
FYE May 31,

38
Summary Balance Sheets
(in millions) Quest Team May 31,
Team Pro-forma Pro-Forma 2010
Cash 17.1$ 1.2$ 18.3$ 12.6$
Accounts Receivable 93.2 4.0 97.2 109.4
Other current assets 27.4 0.6 28.0 28.3
Tota current assets 137.7 5.8 143.5 150.3 -
Non-current assets 114.1 45.1 159.2 114.7
Total assets 251.8$ 50.9$ 302.7$ 265.0$
Current debt 0.3 0.3 0.3
Other current liabilities 36.5$ 2.4$ 38.9$ 42.8$
Long-Term Debt 38.3 42.6 80.9 47.8
Other 8.5 8.5 8.9 -
Stockholders' equity 168.2 5.9 174.1 165.2
Total liabilities and equity 251.8$ 50.9$ 302.7$ 265.0$
Net debt 21.5$ 41.4$ 62.9$ 35.5$
Net debt to TTM EBITDA (1) 0.4 1.2 0.8
(1) excludes non routine charges
Aug. 31, 2010 unaudited, proforma
39
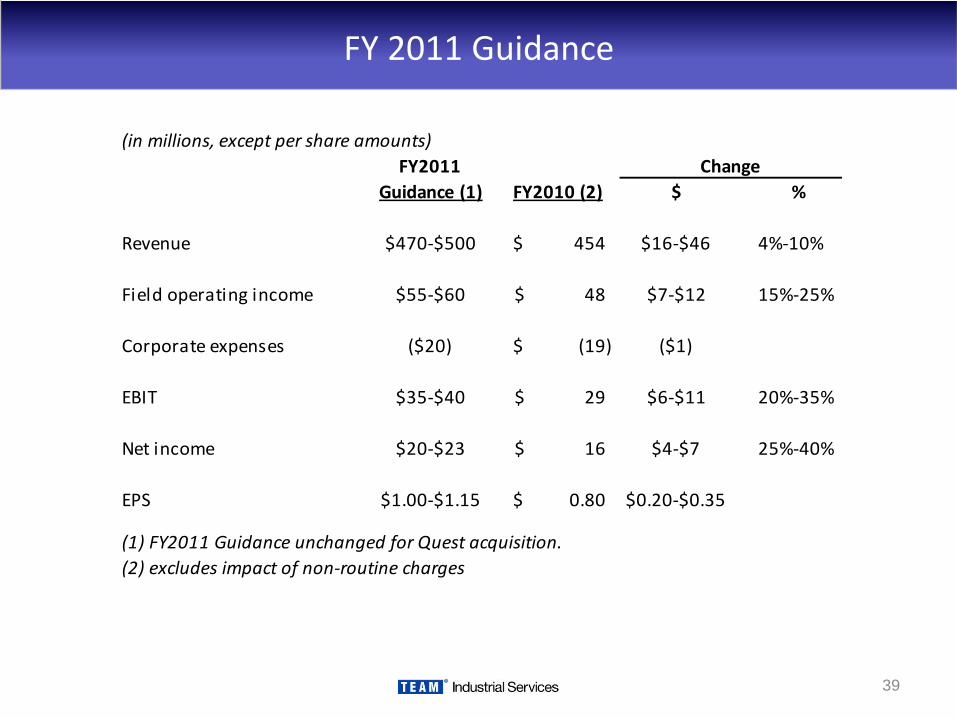
FY 2011 Guidance
(in millions, except per share amounts)
FY2011
Guidance (1) FY2010 (2) $ %
Revenue $470-$500 454$ $16-$46 4%-10%
Field operating income $55-$60 48$ $7-$12 15%-25%
Corporate expenses ($20) (19)$ ($1)
EBIT $35-$40 29$ $6-$11 20%-35%
Net income $20-$23 16$ $4-$7 25%-40%
EPS $1.00-$1.15 0.80$ $0.20-$0.35
(1) FY2011 Guidance unchanged for Quest acquisition.
(2) excludes impact of non-routine charges
Change
40
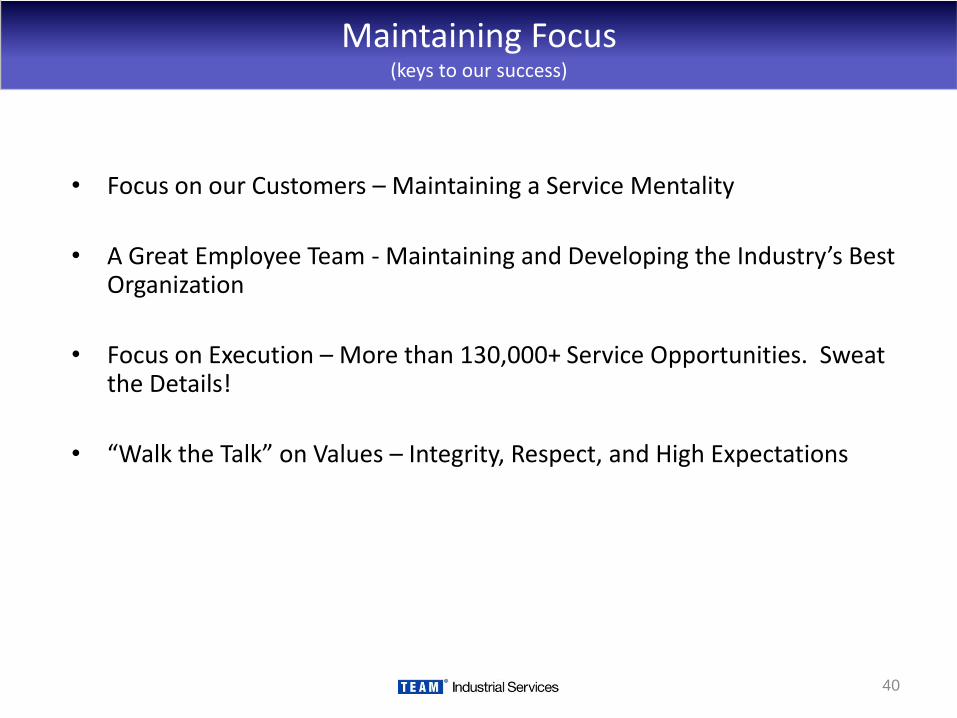
Maintaining Focus(keys to our success)
• Focus on our Customers – Maintaining a Service Mentality
• A Great Employee Team - Maintaining and Developing the Industry’s Best Organization
• Focus on Execution – More than 130,000+ Service Opportunities. Sweat the Details!
• “Walk the Talk” on Values – Integrity, Respect, and High Expectations
41
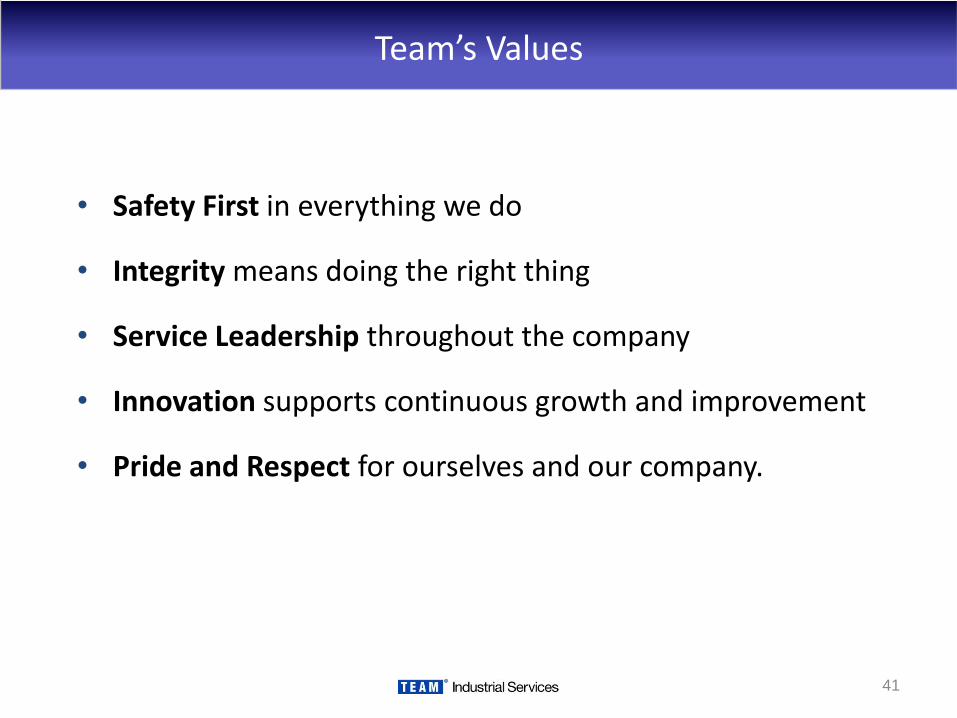
Team’s Values
• Safety First in everything we do
• Integrity means doing the right thing
• Service Leadership throughout the company
• Innovation supports continuous growth and improvement
• Pride and Respect for ourselves and our company.

42
Contact Information
Phil Hawk
281-388-5503
Ted Owen
281-388-5525