Embed Size (px)
Citation preview
INVESTOR MEETING 2011
Intel European Investor Meeting
Christian Morales
Vice President - Sales & Marketing, GM EMEA
INVESTOR MEETING 2011
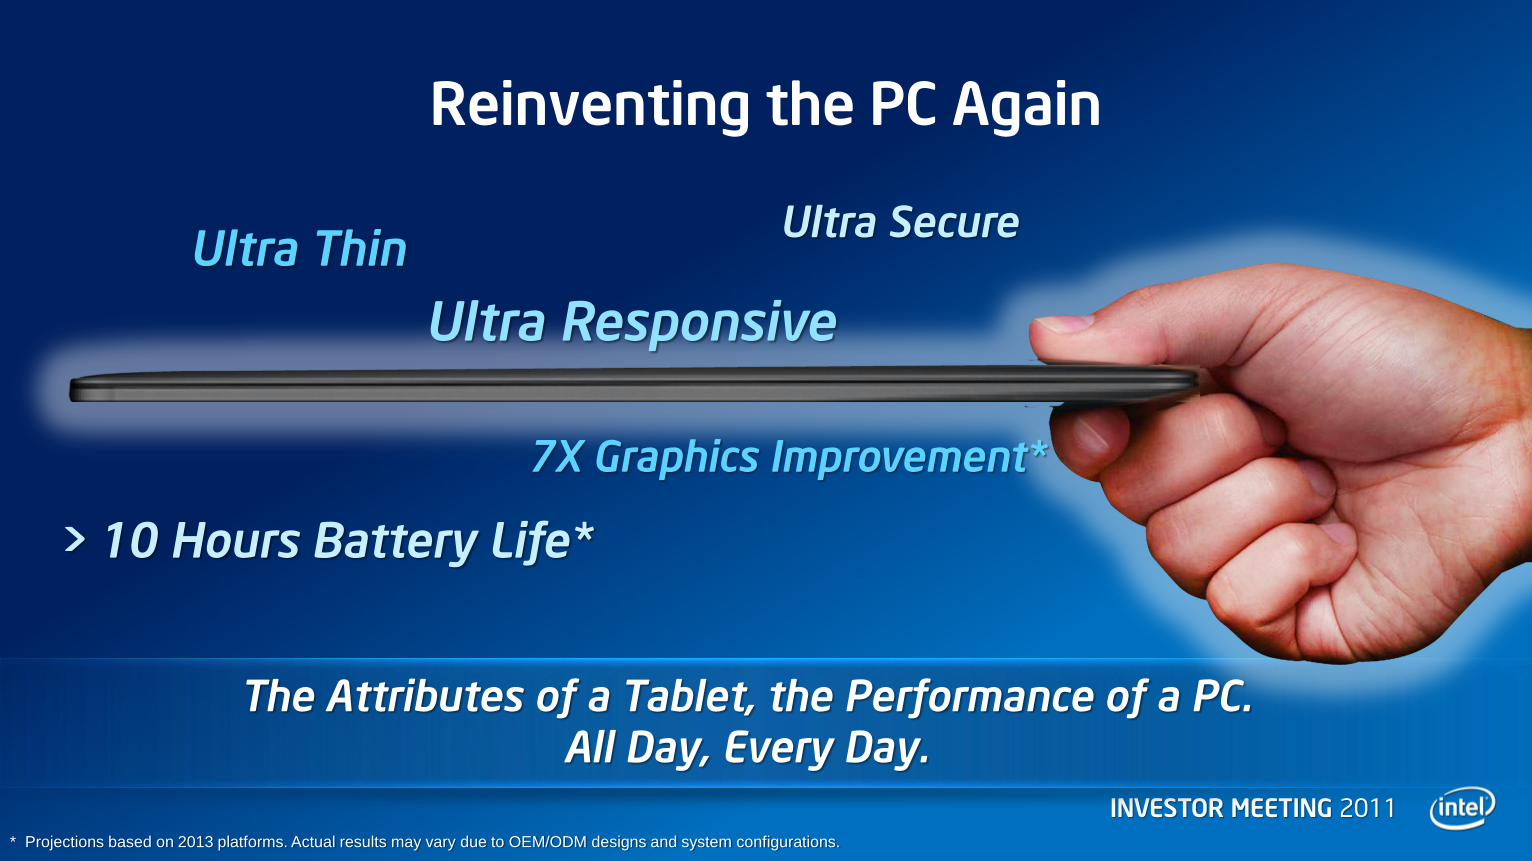
Reinventing the PC Again
The Attributes of a Tablet, the Performance of a PC. All Day, Every Day.
> 10 Hours Battery Life*
Ultra Secure Ultra Thin
Ultra Responsive
7X Graphics Improvement*
* Projections based on 2013 platforms. Actual results may vary due to OEM/ODM designs and system configurations.
INVESTOR MEETING 2011
2011 2012 2013 2014 2015
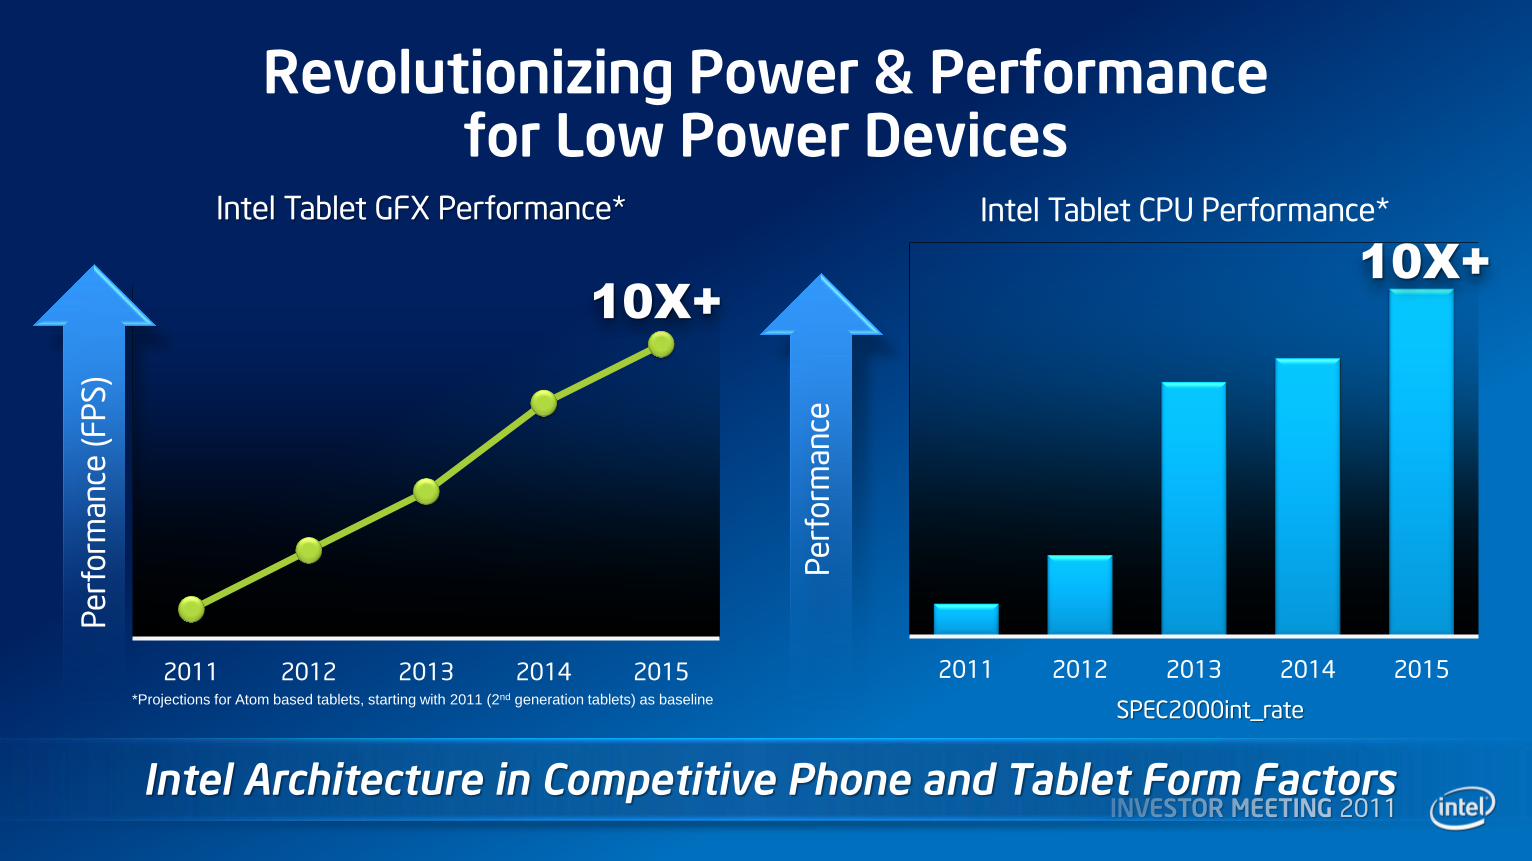
Revolutionizing Power & Performance for Low Power Devices
Intel Tablet GFX Performance*
Pe
rfo
rma
nce
(F
PS
)
Pe
rfo
rma
nce
*Projections for Atom based tablets, starting with 2011 (2nd generation tablets) as baseline SPEC2000int_rate
2011 2012 2013 2014 2015
Intel Tablet CPU Performance*
Intel Architecture in Competitive Phone and Tablet Form Factors
10X+
10X+
INVESTOR MEETING 2011
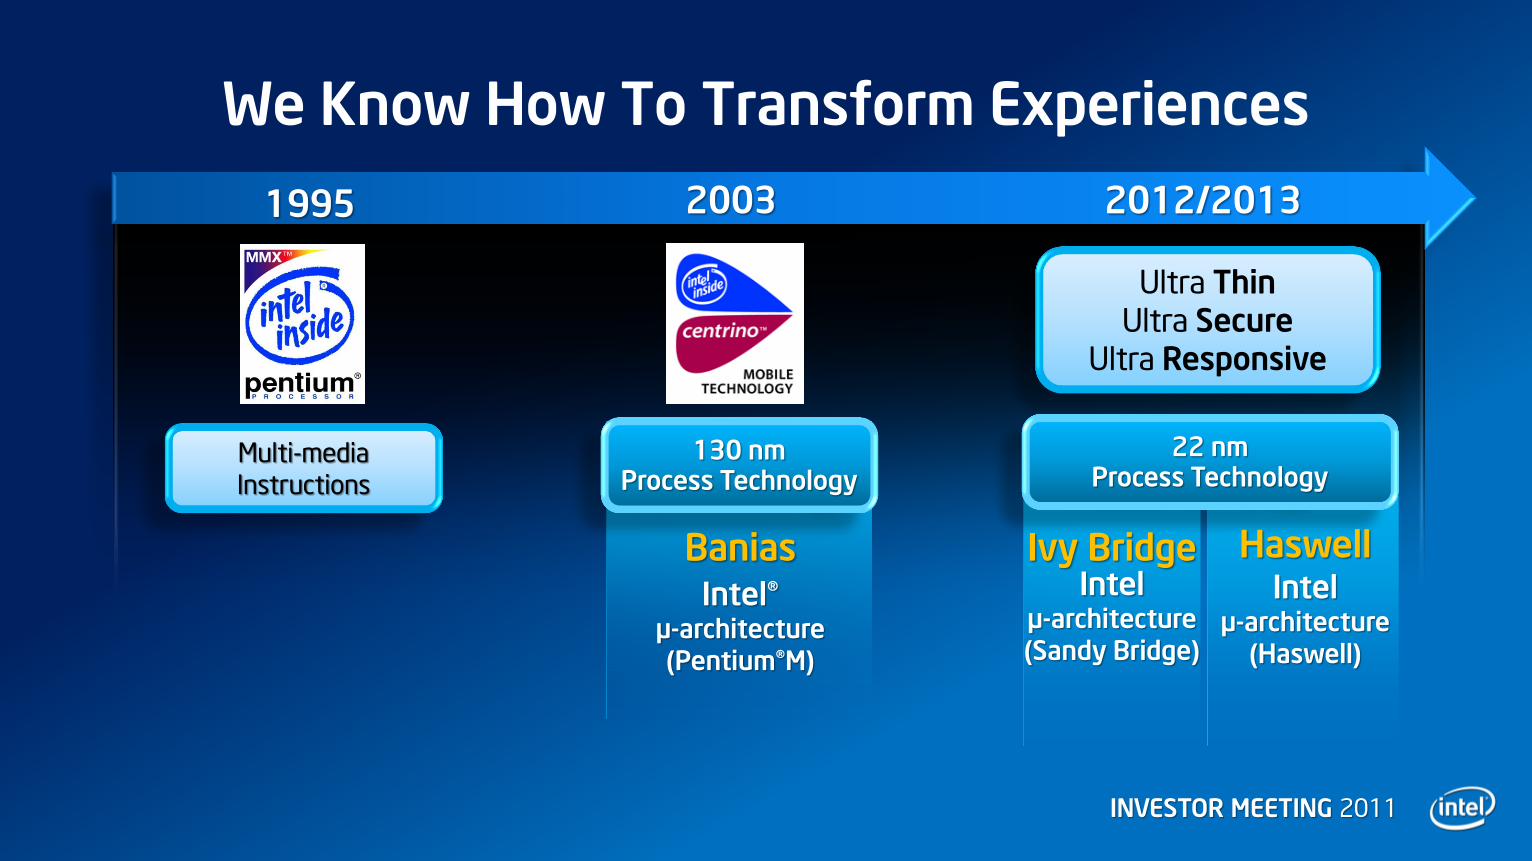
We Know How To Transform Experiences
1995 2003 2012/2013
Ultra Thin Ultra Secure
Ultra Responsive
22 nm Process Technology
Intel µ-architecture
(Haswell)
Ivy Bridge
130 nm Process Technology
Intel® µ-architecture (Pentium®M)
Banias
Multi-media
Instructions
Dadi: Do you want to use this slide as lead in?
Intel µ-architecture (Sandy Bridge)
Haswell

INVESTOR MEETING 2011
Translating Technology Leadership into
New Compelling Product Roadmaps
40W
20W
10W
5W
<1W
60W+
Power
New Notebook Design Target
Notebook Design Target
The result: A full spectrum of
products from milliwatts to
teraflops New
Expanded Range
Source: Intel Roadmap
SOC Design Target
INVESTOR MEETING 2011
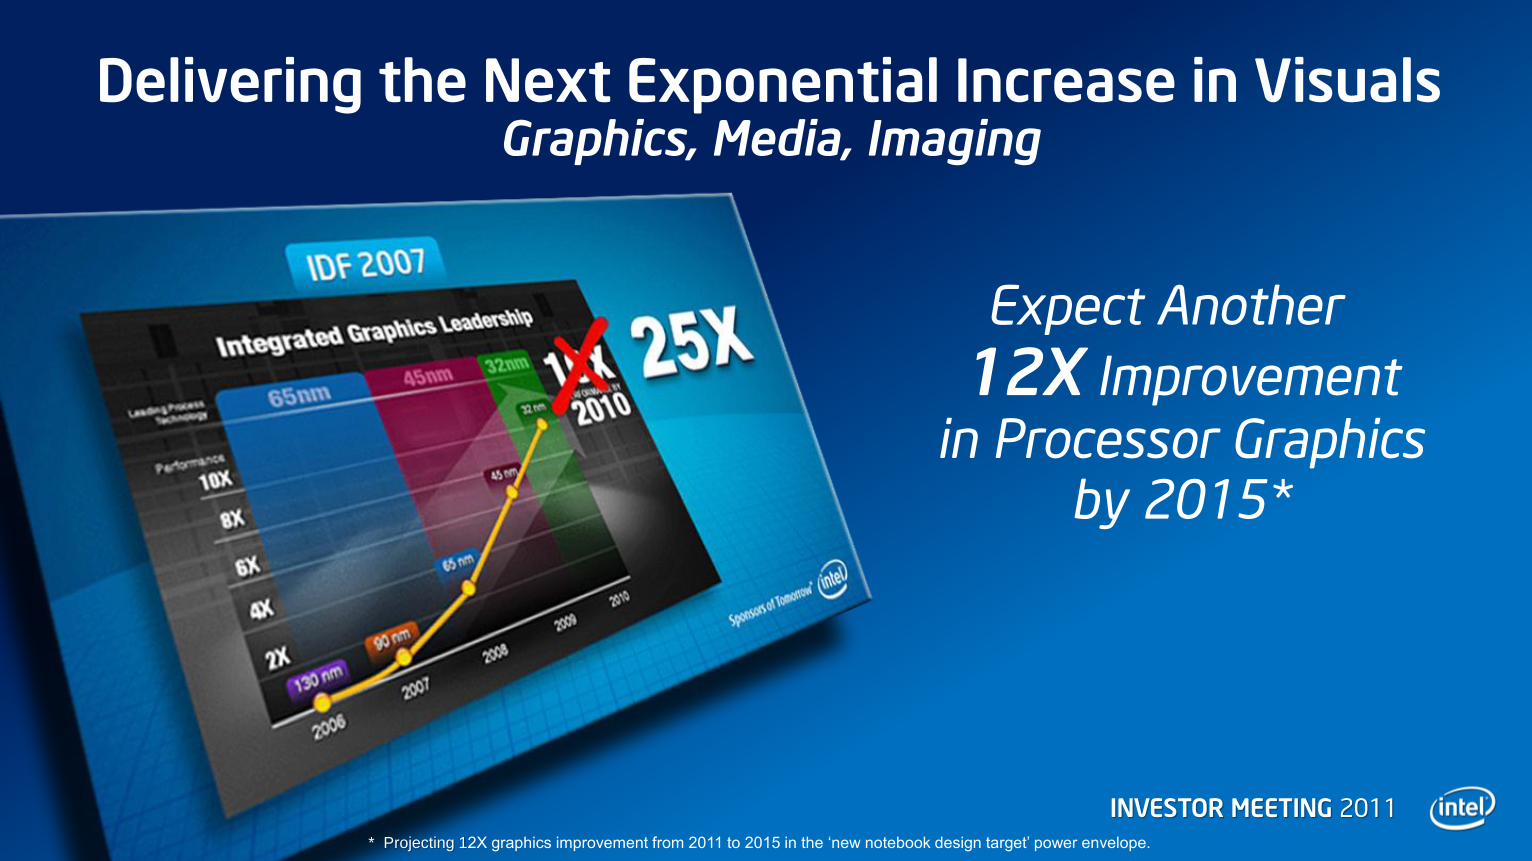
Delivering the Next Exponential Increase in Visuals Graphics, Media, Imaging
Expect Another
12X Improvement in Processor Graphics
by 2015*
* Projecting 12X graphics improvement from 2011 to 2015 in the ‘new notebook design target’ power envelope.
INVESTOR MEETING 2011
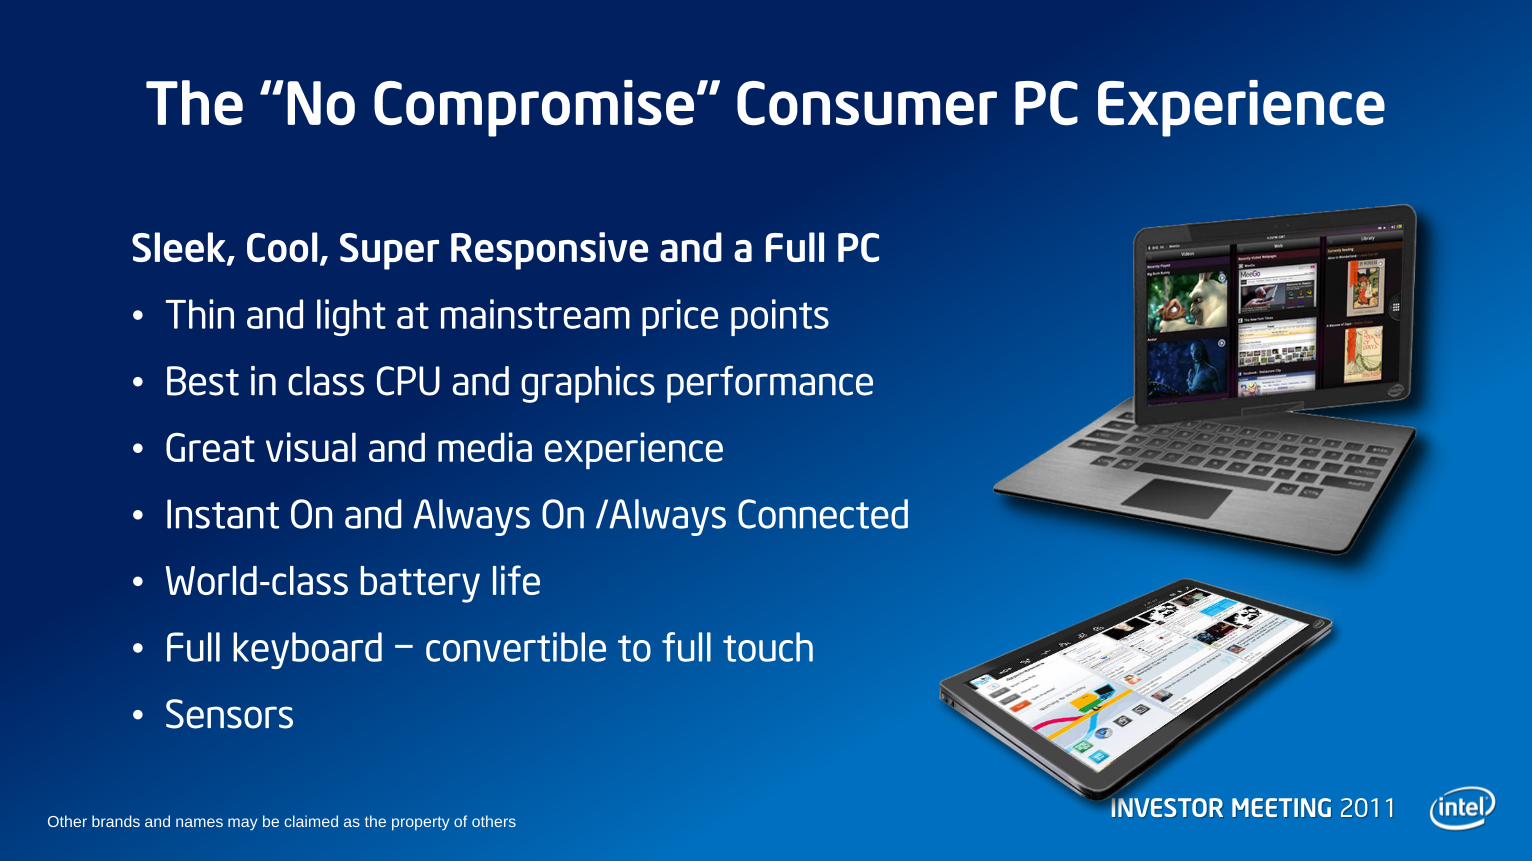
The “No Compromise” Consumer PC Experience
Sleek, Cool, Super Responsive and a Full PC
• Thin and light at mainstream price points
• Best in class CPU and graphics performance
• Great visual and media experience
• Instant On and Always On /Always Connected
• World-class battery life
• Full keyboard − convertible to full touch
• Sensors
Other brands and names may be claimed as the property of others
INVESTOR MEETING 2011
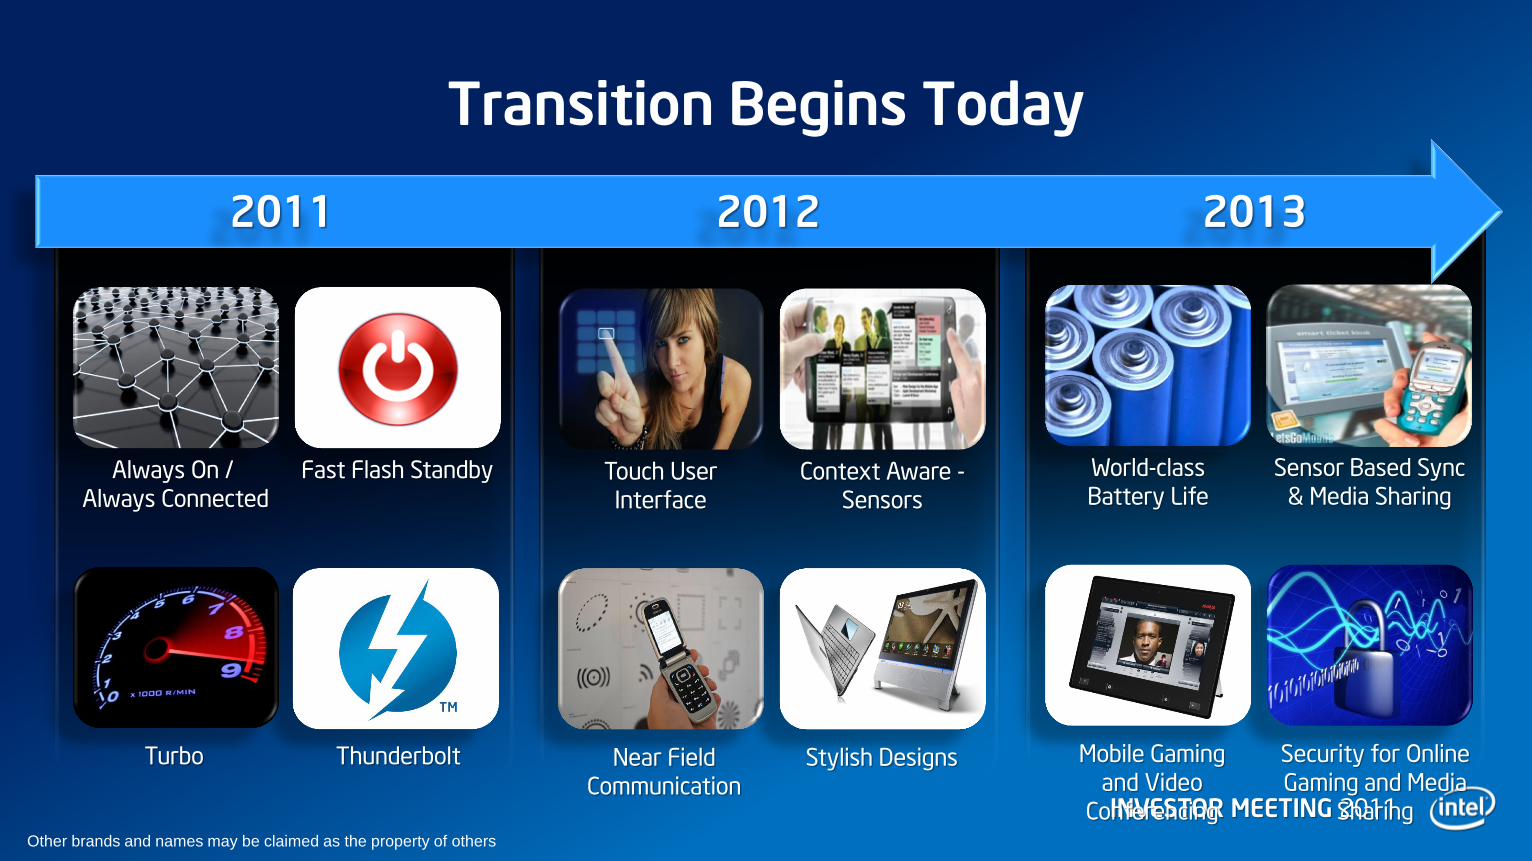
Transition Begins Today
2011 2013 2012
Fast Flash Standby
Turbo
Always On /
Always Connected
Stylish Designs
Context Aware -
Sensors
Near Field
Communication
Touch User
Interface
Security for Online
Gaming and Media
Sharing
Sensor Based Sync
& Media Sharing
Mobile Gaming
and Video
Conferencing
World-class
Battery Life
DEMO: FFS, AO/AC and PC Synch
Thunderbolt
Other brands and names may be claimed as the property of others
INVESTOR MEETING 2011
Delivering Extraordinary Devices and Experiences

INVESTOR MEETING 2011
> 50% reduction
0.1
1
Low
er
Act
ive P
ow
er
Act
ive
Po
we
r p
er
Tra
nsi
sto
r (n
orm
alize
d)
22 Nm Tri-gate Transistors Increase The Benefit From A New Technology Generation
65nm
Planar
45nm
Planar
32nm
Planar
22nm
Tri-Gate
Constant Performance
Energy-Efficient Performance Built on Moore’s Law
Source: Intel
32nm 45nm 1x
0.1x
0.01x
0.001x
65nm 22nm
Low
er
Tra
nsi
stor
Leakage
Higher Transistor Performance (Switching Speed)
* Projected
14nm*
Source: Intel
22 nm Benefits Smallest Handhelds to Powerful Cloud-based Servers

INVESTOR MEETING 2011
Taking Full Advantage of Our Process Technology in New Markets
Silvermont
22nm
Low Power Microarchitecture
Optimized Power Performance
Microarchitecture
Saltwell
32nm
Bonnell
45nm
14nm Future Product
14nm
Airmont
*All products, computer systems, dates, and figures specified are preliminary based on current expectations, and are subject to
change without notice. Intel product plans in this presentation do not constitute Intel plan of record product roadmaps. Please
contact your Intel representative to obtain Intel‟s current plan of record product roadmaps
Accelerating the Atom™ SoC Roadmap
Sandy Bridge Westmere Future Product Ivy Bridge 32nm 22nm
2011-2012
2013 2014
INVESTOR MEETING 2011
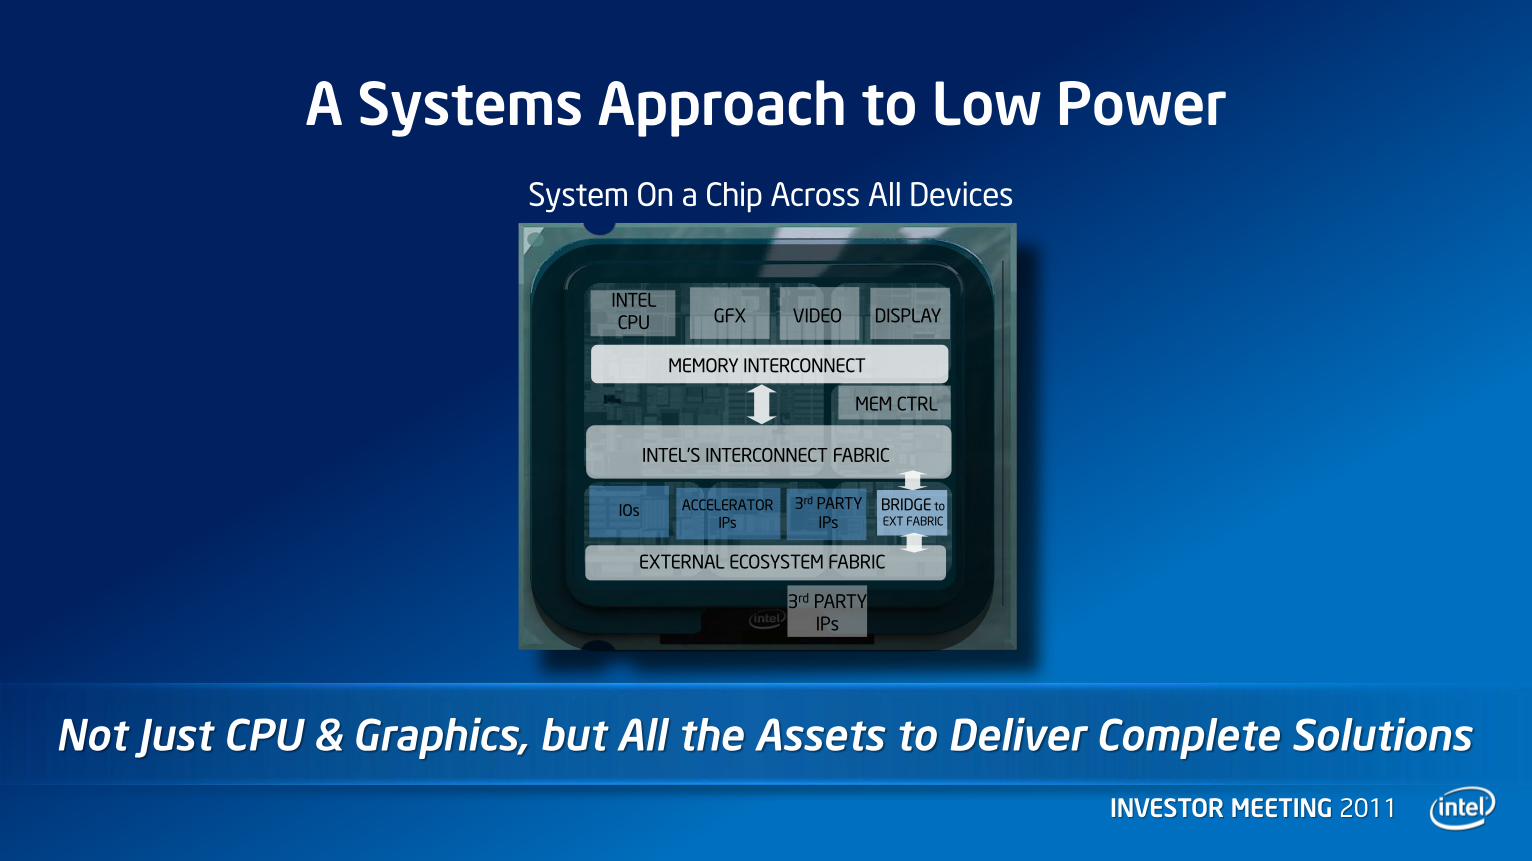
A Systems Approach to Low Power
INTEL CPU GFX VIDEO DISPLAY
INTEL‟S INTERCONNECT FABRIC
BRIDGE to
EXT FABRIC
EXTERNAL ECOSYSTEM FABRIC
MEM CTRL
MEMORY INTERCONNECT
IOs 3rd PARTY
IPs ACCELERATOR
IPs
3rd PARTY IPs
System On a Chip Across All Devices
Not Just CPU & Graphics, but All the Assets to Deliver Complete Solutions
INVESTOR MEETING 2011
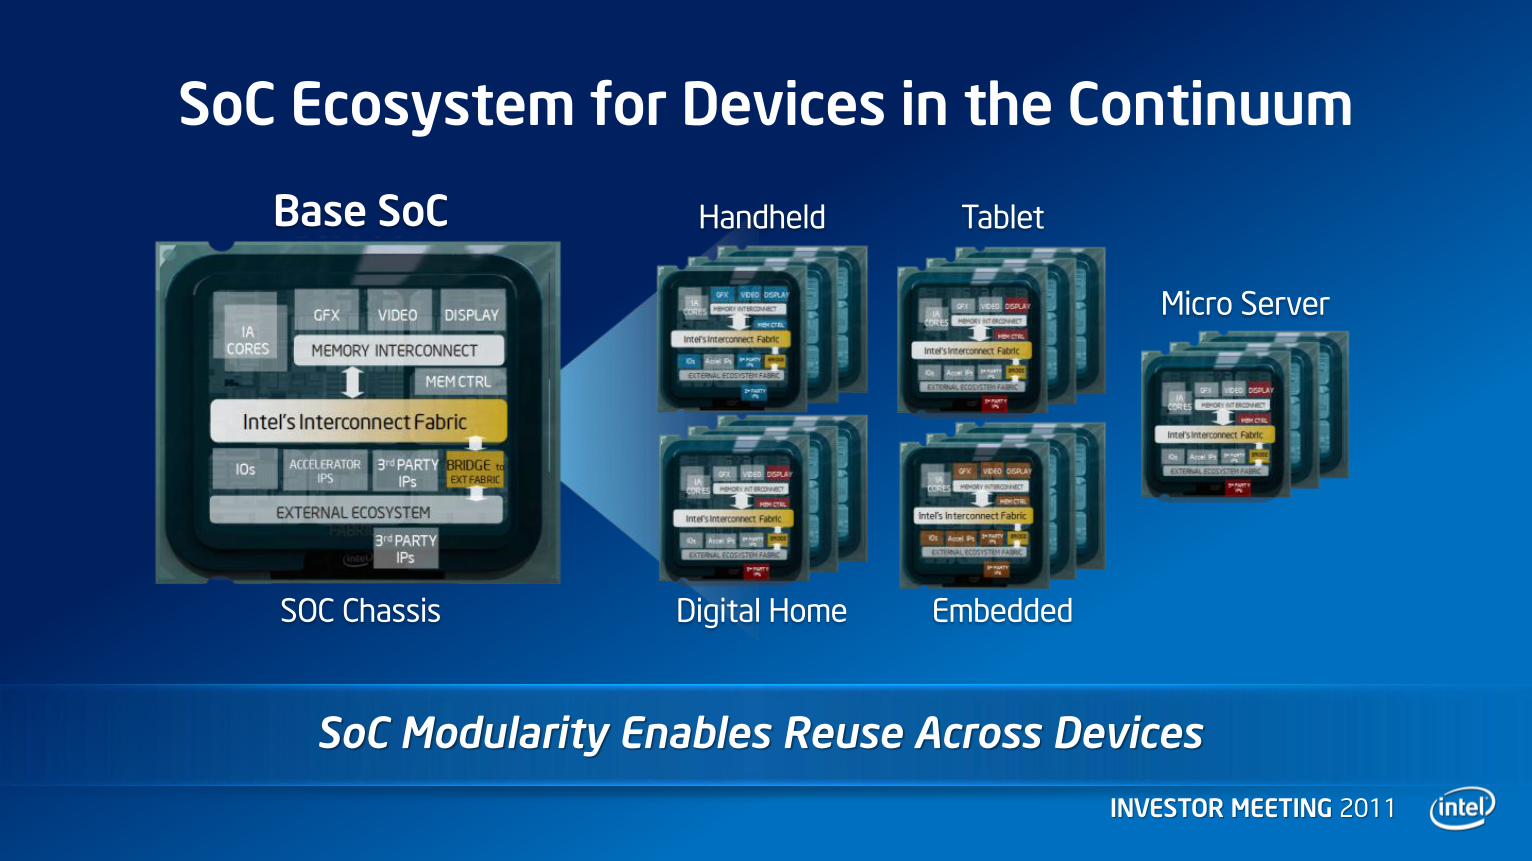
SoC Ecosystem for Devices in the Continuum
SOC Chassis
Base SoC
SoC Modularity Enables Reuse Across Devices
Handheld
Embedded Digital Home
Tablet
Micro Server
INVESTOR MEETING 2011
Consistency Across Platforms
INVESTOR MEETING 2011
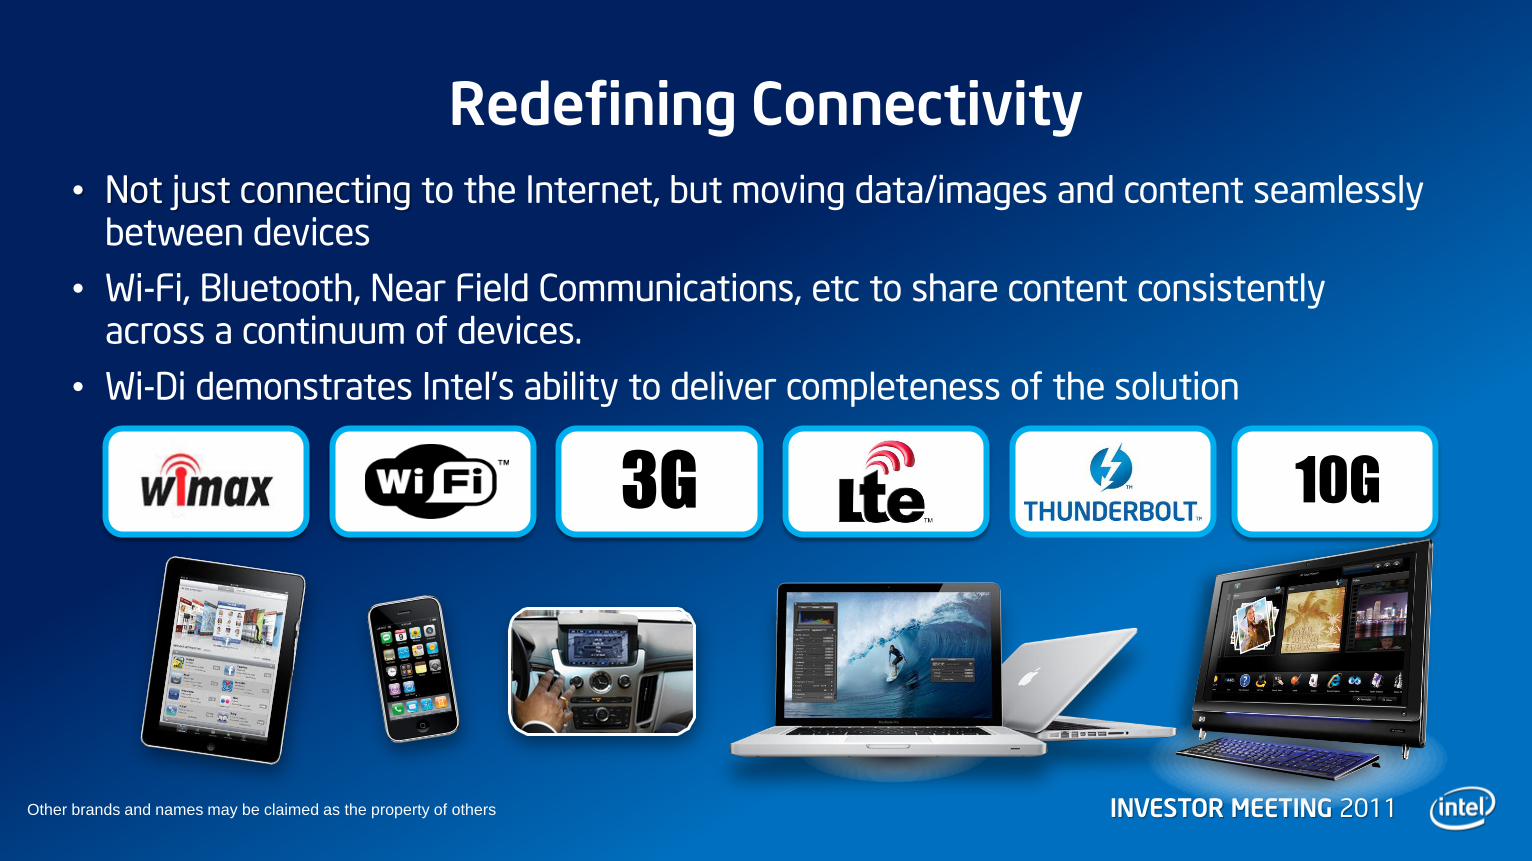
Redefining Connectivity
3G 10G
• Not just connecting to the Internet, but moving data/images and content seamlessly between devices
• Wi-Fi, Bluetooth, Near Field Communications, etc to share content consistently across a continuum of devices.
• Wi-Di demonstrates Intel‟s ability to deliver completeness of the solution
Other brands and names may be claimed as the property of others
INVESTOR MEETING 2011
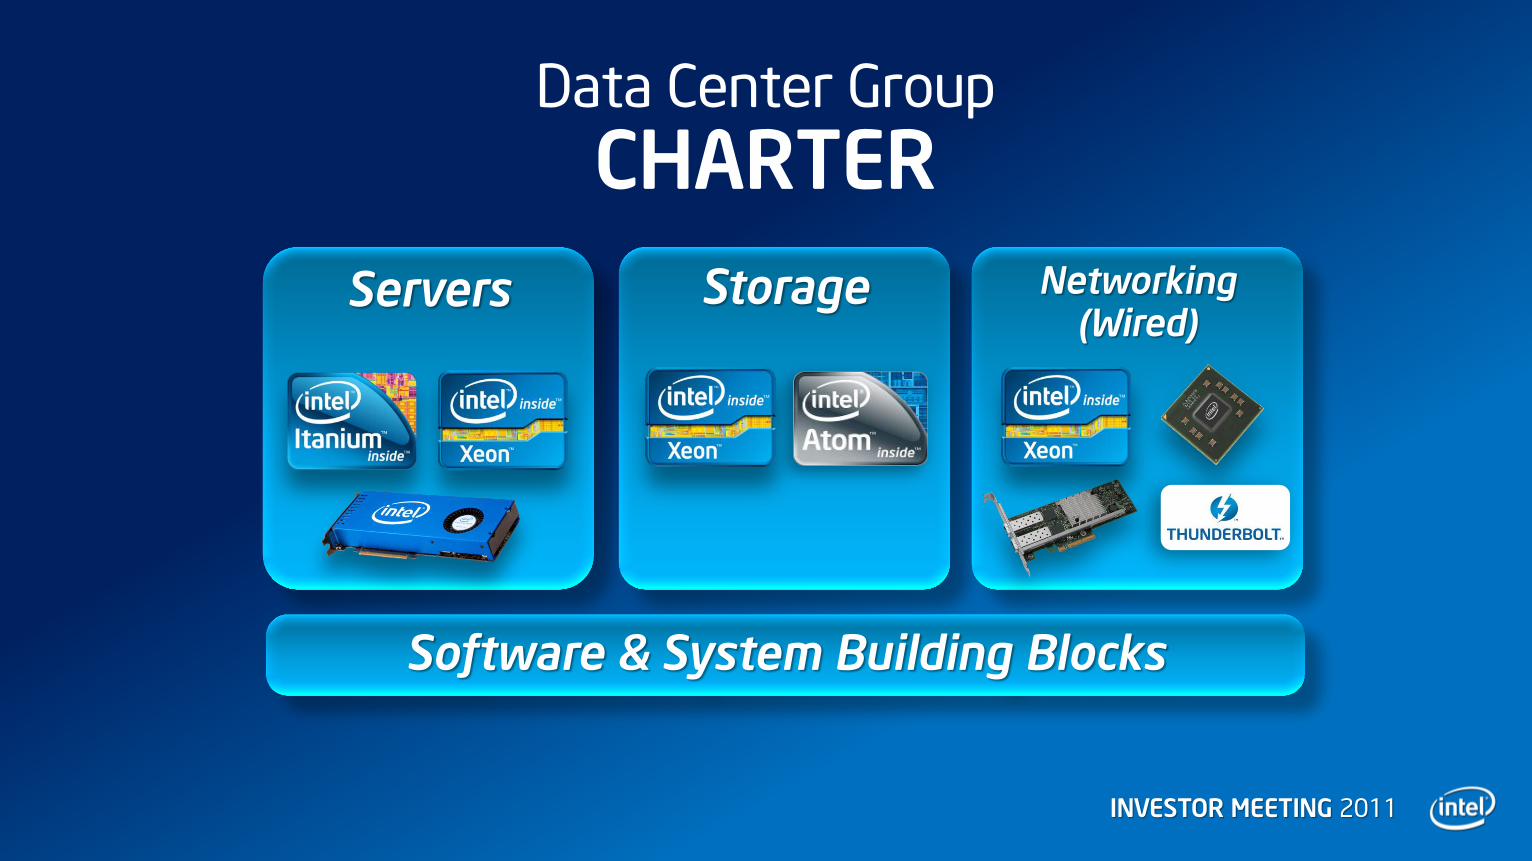
Data Center Group
CHARTER
Servers Storage Networking (Wired)
Software & System Building Blocks
INVESTOR MEETING 2011
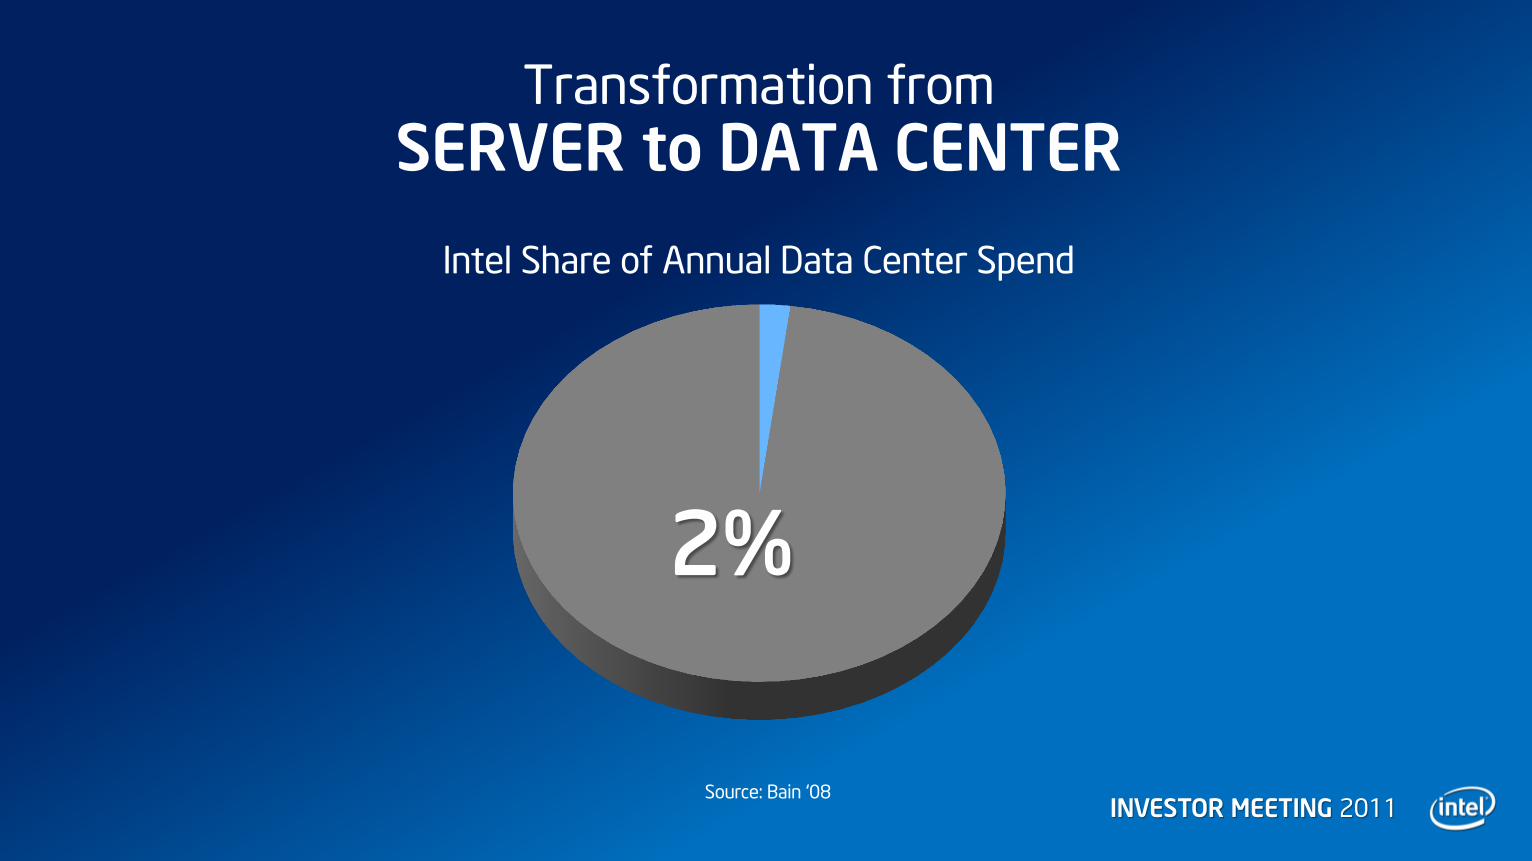
Transformation from
SERVER to DATA CENTER
Source: Bain „08
Intel Share of Annual Data Center Spend
2%
INVESTOR MEETING 2011
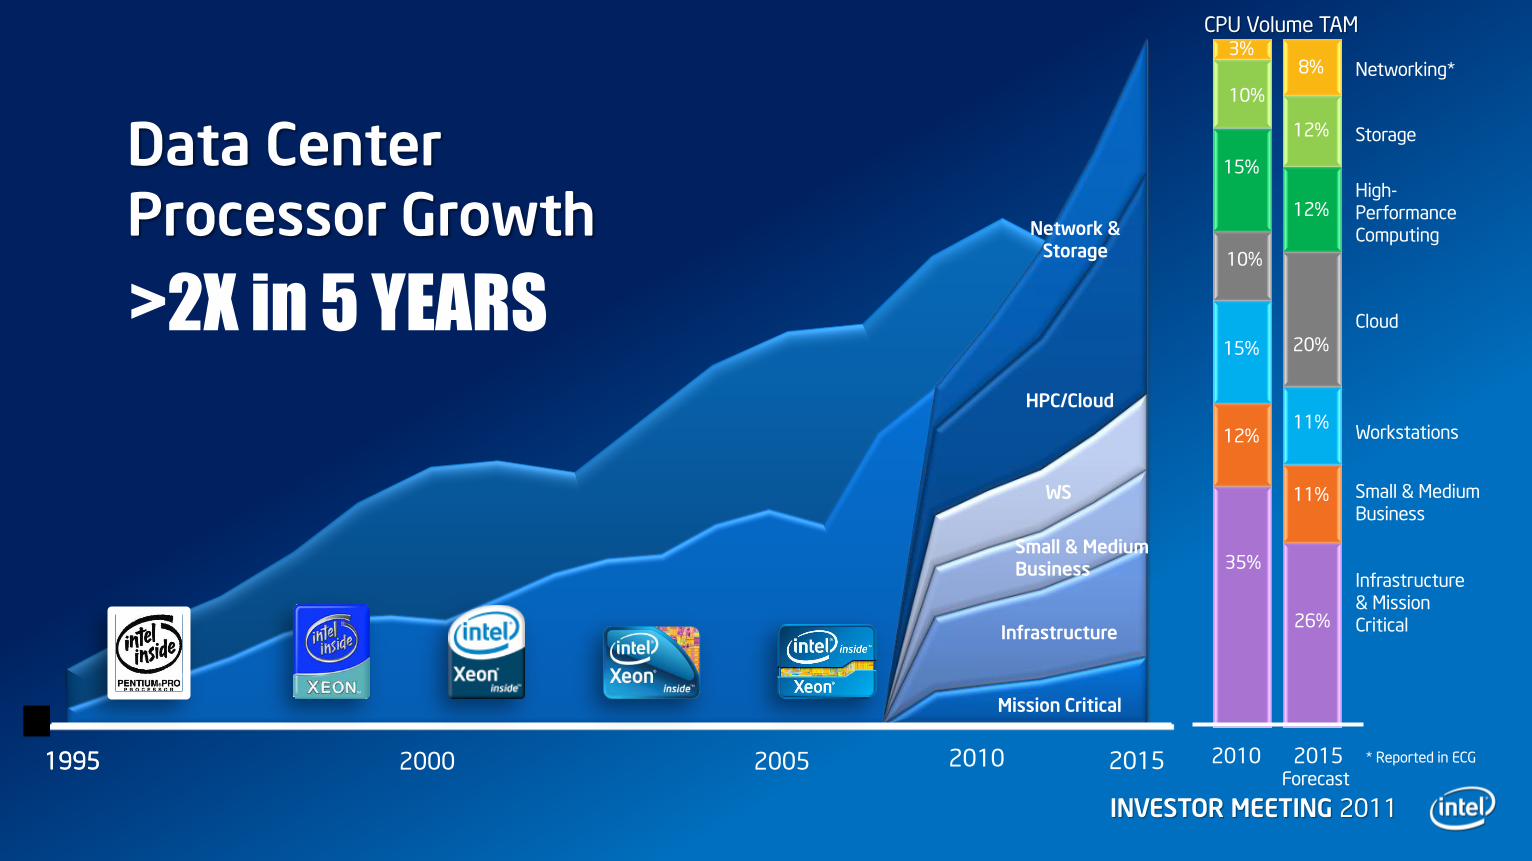
2010 2015
Mission Critical
Infrastructure
Small & Medium Business
WS
HPC/Cloud
Network & Storage
1995 1995 2000 2005
CPU Volume TAM
2010 2015
Networking*
Storage
High-Performance Computing
Cloud
Small & Medium Business
Infrastructure & Mission Critical
Workstations
3%
10%
15%
35%
10%
15%
12%
8%
12%
12%
20%
26%
11%
11%
Forecast
Data Center Processor Growth
>2X in 5 YEARS
* Reported in ECG

INVESTOR MEETING 2011
Rapid Growth in Supercomputing
0
1000
2000
3000
4000
5000
6000
7000
8000
9000
100
1,000
10,000
100,000
1,000,000
10,000,000
100,000,000
1,000,000,000
10,000,000,000
2004 2006 2008 2010 2012 2014 2016 2018 2020
Total CPU's in Top100
(X86 equiv in KU) rMAX for #1 System
Top 100 CPU TAM growth1
1 MILLION Units in 2013
2 MILLION Units in 2015
8 MILLION Units in 2019
Forecast
Source: Intel analysis and forecast list data from www.top500.org
INVESTOR MEETING 2011
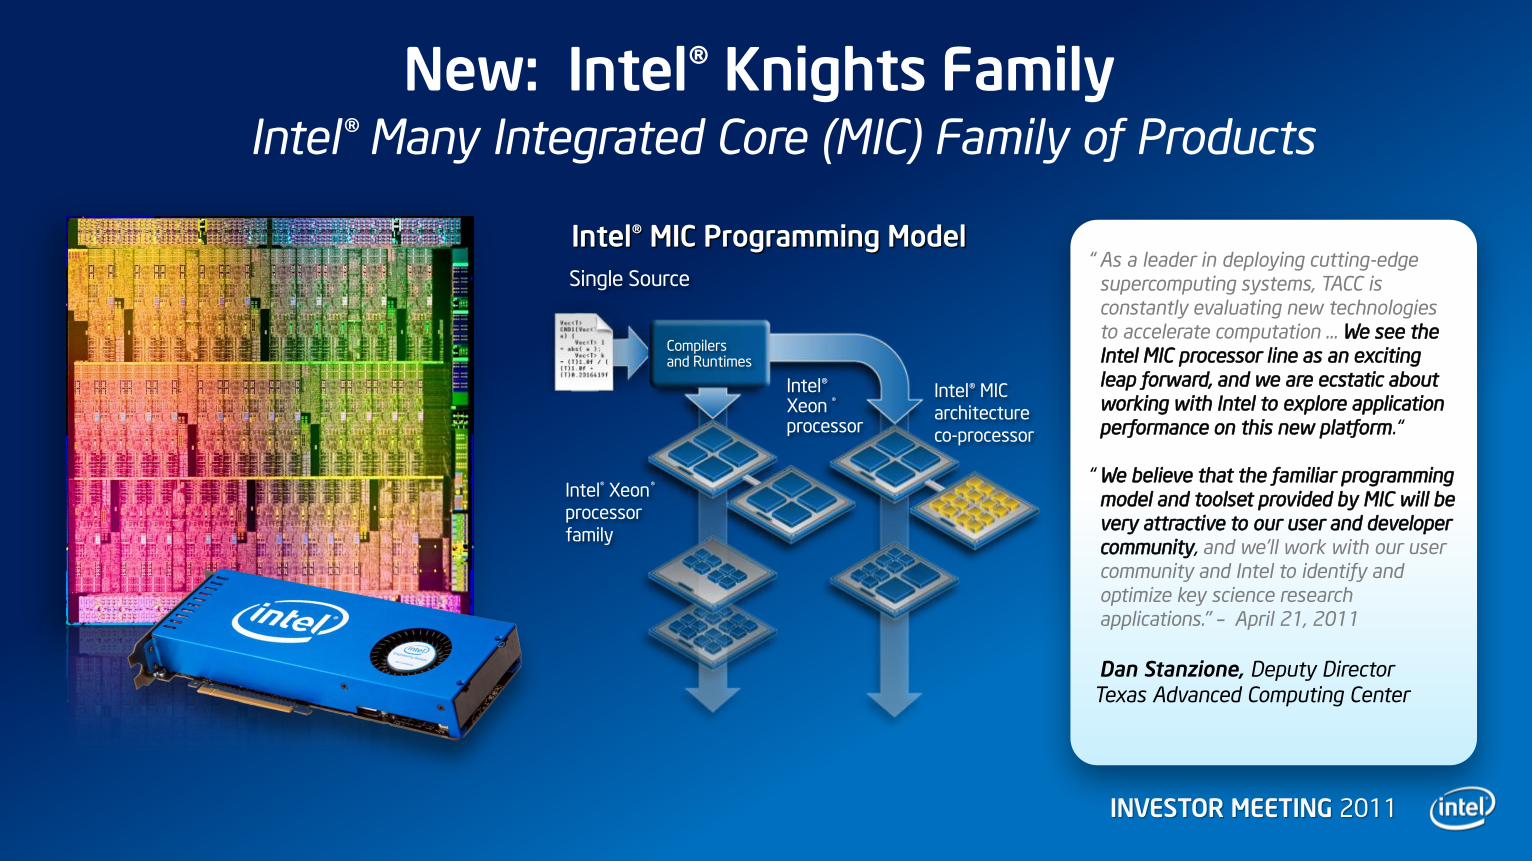
New: Intel® Knights Family Intel® Many Integrated Core (MIC) Family of Products
Intel® MIC Programming Model
Intel® Xeon® processor family
Intel® Xeon ® processor
Intel® MIC architecture co-processor
Single Source
Compilers and Runtimes
“ As a leader in deploying cutting-edge
supercomputing systems, TACC is
constantly evaluating new technologies
to accelerate computation … We see the
Intel MIC processor line as an exciting
leap forward, and we are ecstatic about
working with Intel to explore application
performance on this new platform.“
“ We believe that the familiar programming
model and toolset provided by MIC will be
very attractive to our user and developer
community, and we'll work with our user
community and Intel to identify and
optimize key science research
applications." – April 21, 2011
Dan Stanzione, Deputy Director
Texas Advanced Computing Center
INVESTOR MEETING 2011
Forecast Forecast
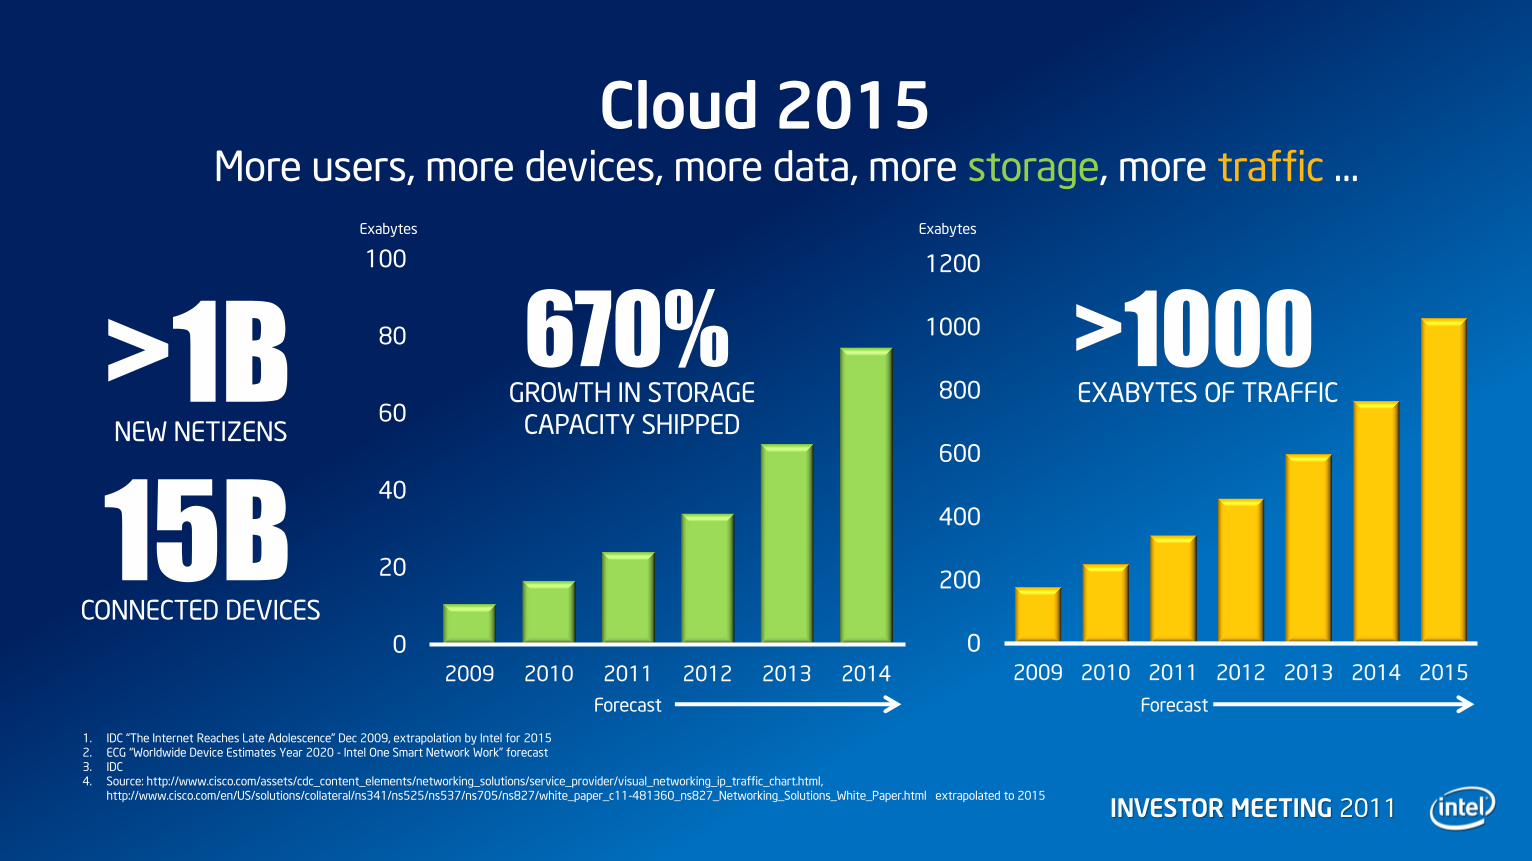
Cloud 2015 More users, more devices, more data, more storage, more traffic …
1. IDC “The Internet Reaches Late Adolescence” Dec 2009, extrapolation by Intel for 2015
2. ECG “Worldwide Device Estimates Year 2020 - Intel One Smart Network Work” forecast
3. IDC
4. Source: http://www.cisco.com/assets/cdc_content_elements/networking_solutions/service_provider/visual_networking_ip_traffic_chart.html,
http://www.cisco.com/en/US/solutions/collateral/ns341/ns525/ns537/ns705/ns827/white_paper_c11-481360_ns827_Networking_Solutions_White_Paper.html extrapolated to 2015
0
200
400
600
800
1000
1200
2009 2010 2011 2012 2013 2014 2015
15B
>1000 >1B NEW NETIZENS
CONNECTED DEVICES
EXABYTES OF TRAFFIC
0
20
40
60
80
100
2009 2010 2011 2012 2013 2014
670% GROWTH IN STORAGE
CAPACITY SHIPPED
Exabytes Exabytes
INVESTOR MEETING 2011
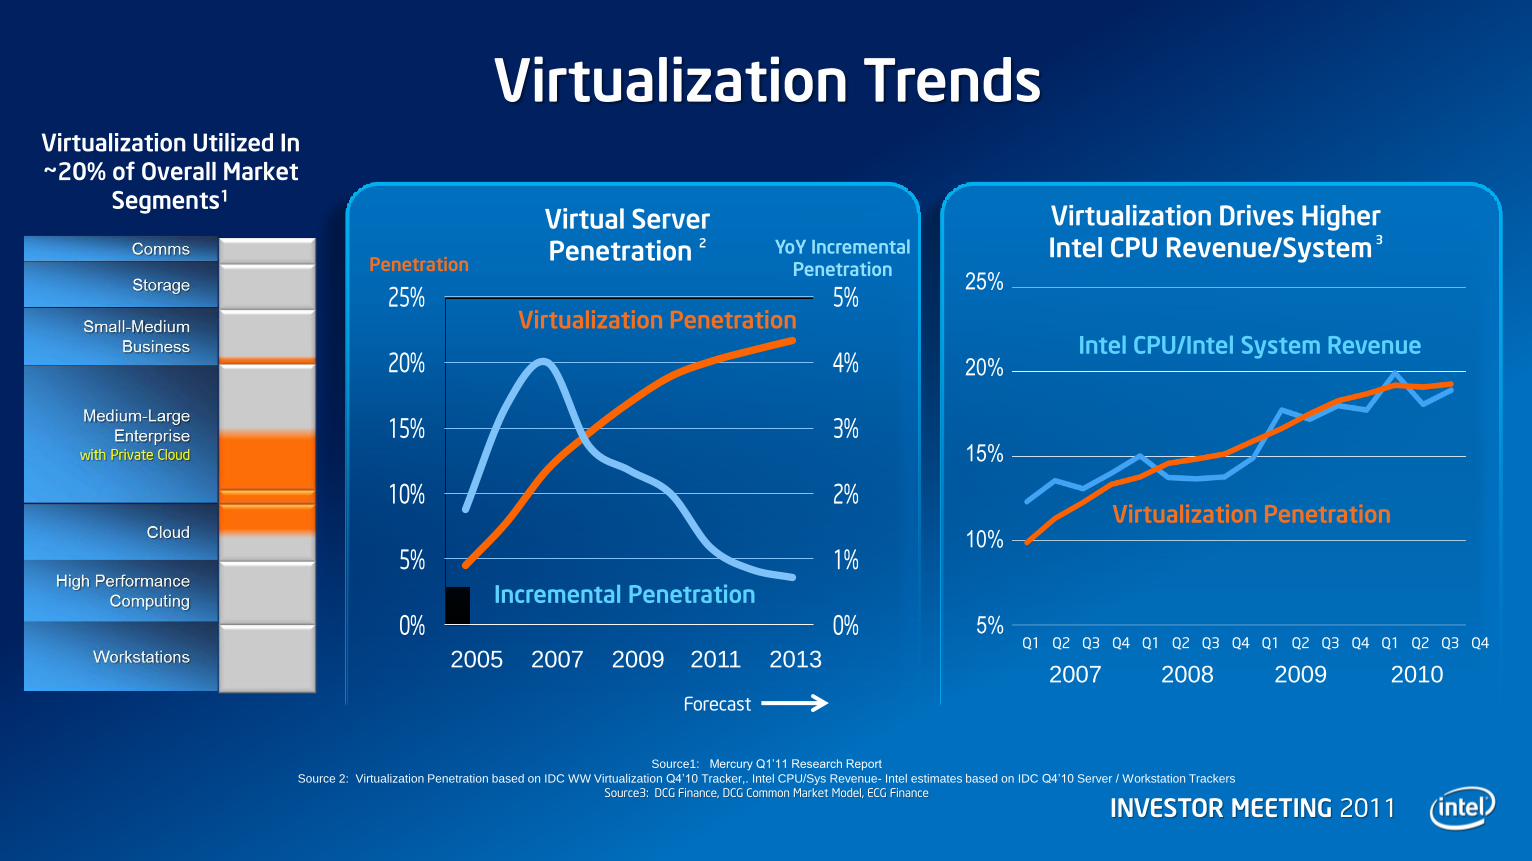
Virtualization Trends
Source1: Mercury Q1’11 Research Report
Source 2: Virtualization Penetration based on IDC WW Virtualization Q4’10 Tracker,. Intel CPU/Sys Revenue- Intel estimates based on IDC Q4’10 Server / Workstation Trackers
Source3: DCG Finance, DCG Common Market Model, ECG Finance
Virtualization Utilized In ~20% of Overall Market
Segments1
Virtualization Drives Higher Intel CPU Revenue/System
3
Intel CPU/Intel System Revenue
Virtualization Penetration
Q1 Q2 Q3 Q4 Q1 Q2 Q3 Q4 Q1 Q2 Q3 Q4 Q1 Q2 Q3 Q4
2007 2008 2009 2010
5%
10%
15%
20%
25%
Forecast
Intel CPU/System Revenue Share and Virtualization Penetration3
0%
5%
10%
15%
20%
25%
Q1
'07
Q2
'07
Q3
'07
Q4
'07
Q1
'08
Q2
'08
Q3
'08
Q4
'08
Q1
'09
Q2
'09
Q3
'09
Q4
'09
Intel CPU/ Intel System Revenue
Virtualization Penetration
Pe
ne
tra
tio
n
Yo
YIn
cre
me
nta
l P
en
etr
atio
n
Forecast
0%
1%
2%
3%
4%
5%
0%
5%
10%
15%
20%
25%
Virtual Server Penetration2
Virtualization Penetration
Incremental Penetration
Virtual Server Penetration
2
Virtualization Penetration
Incremental Penetration
2005 2007 2009 2011 2013
Penetration YoY Incremental
Penetration
INVESTOR MEETING 2011
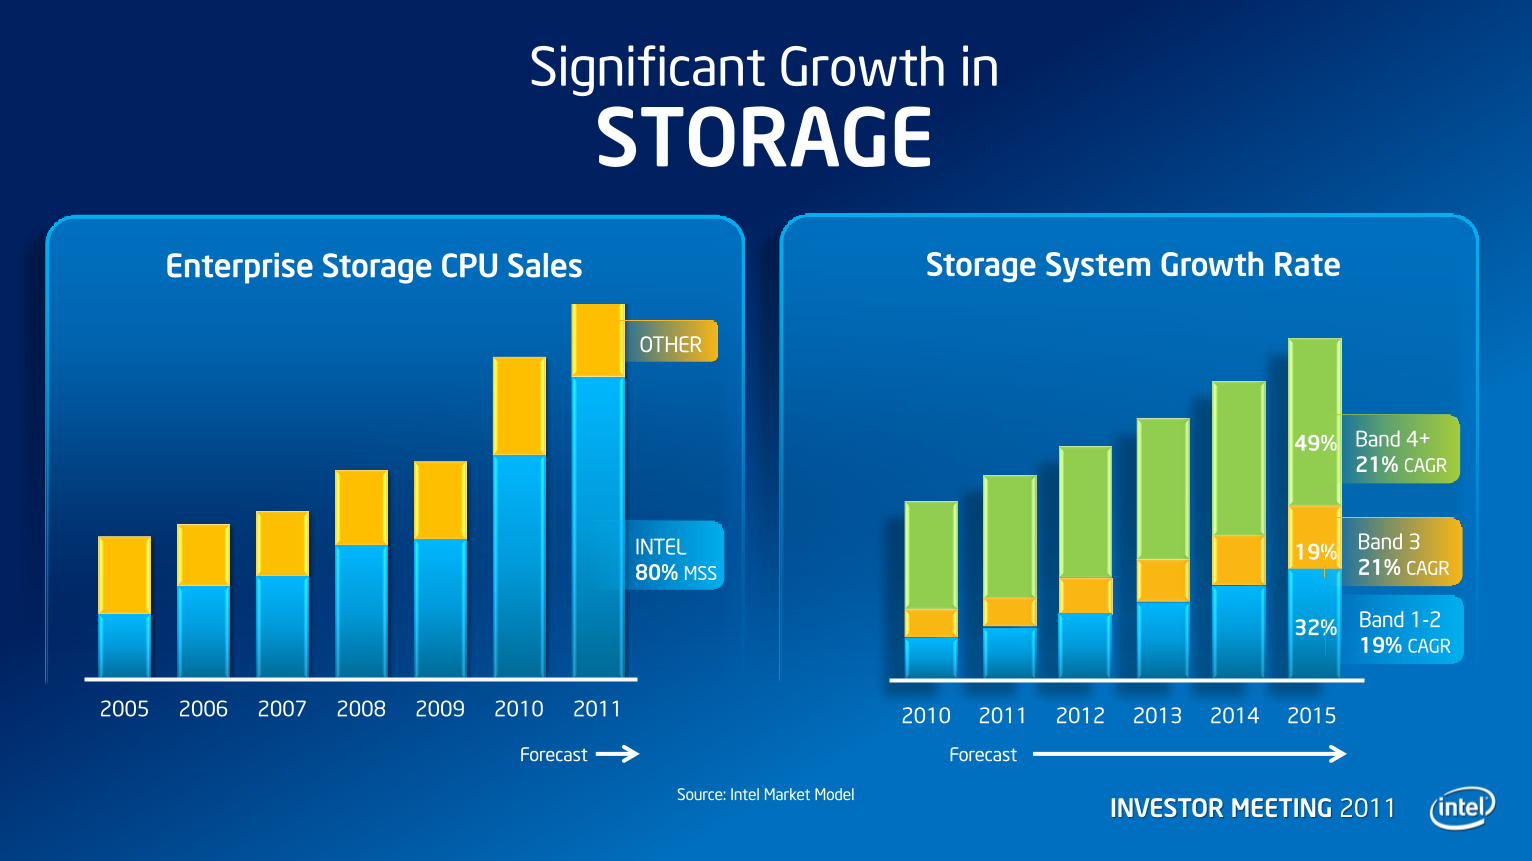
Significant Growth in
STORAGE
2010 2011 2012 2013 2014 2015
49%
19%
32% Band 1-2
19% CAGR
Band 3
21% CAGR
Band 4+
21% CAGR
Storage System Growth Rate
2005 2006 2007 2008 2009 2010 2011
Enterprise Storage CPU Sales
INTEL
80% MSS
OTHER
Forecast Forecast
Source: Intel Market Model
INVESTOR MEETING 2011
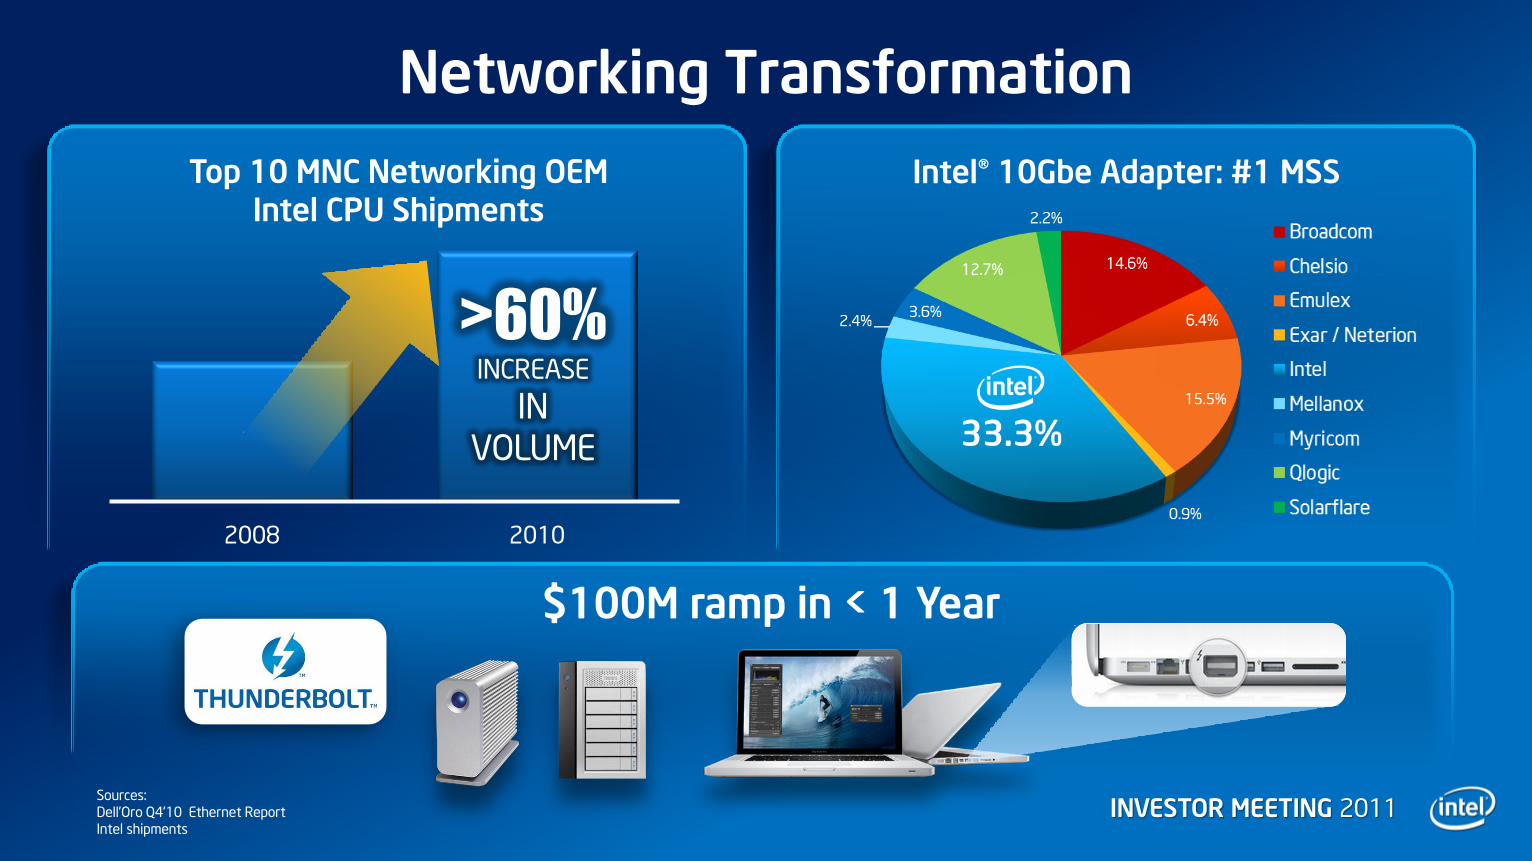
Networking Transformation
2008 2010
>60% INCREASE
IN
VOLUME
Sources:
Dell‟Oro Q4‟10 Ethernet Report
Intel shipments
Top 10 MNC Networking OEM Intel CPU Shipments
Intel® 10Gbe Adapter: #1 MSS
$100M ramp in < 1 Year
INVESTOR MEETING 2011
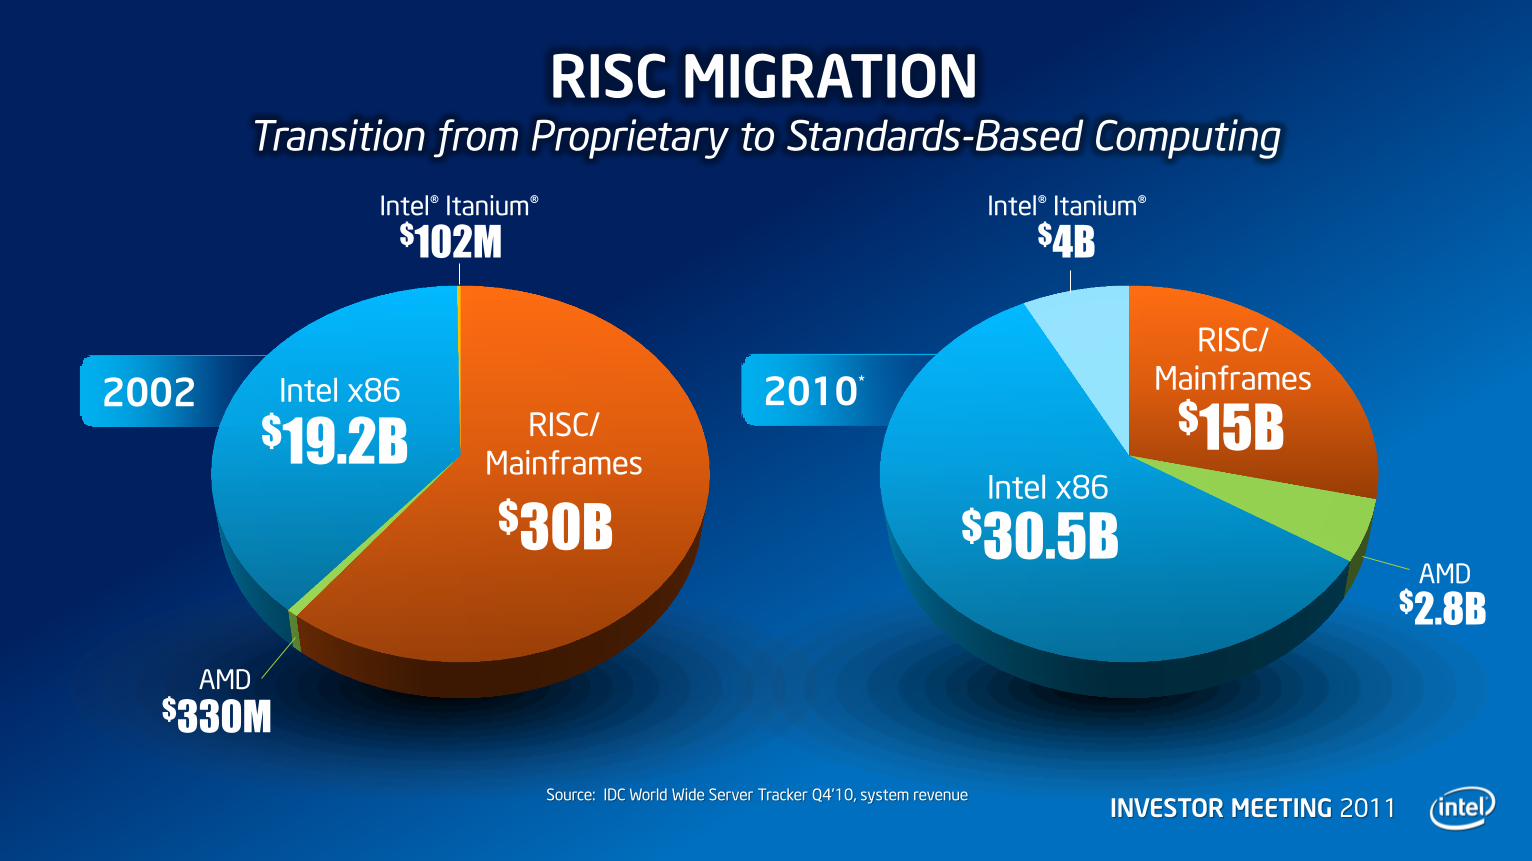
2010*
RISC MIGRATION Transition from Proprietary to Standards-Based Computing
Source: IDC World Wide Server Tracker Q4‟10, system revenue
RISC/
Mainframes
$30B
RISC/
Mainframes
$15B Intel x86
$19.2B Intel x86
$30.5B AMD
$2.8B
AMD $330M
$102M $4B
2002
Intel® Itanium® Intel® Itanium®
INVESTOR MEETING 2011 26
Risk Factors
The above statements and any others in this document that refer to plans and expectations for the second quarter, the year and the future are forward-looking statements that involve a number of risks and uncertainties. Words such as “anticipates,” “expects,” “intends,” “plans,” “believes,” “seeks,” “estimates,” “may,” “will,” “should,” and their variations identify forward-looking statements. Statements that refer to or are based on projections, uncertain events or assumptions also identify forward-looking statements. Many factors could affect Intel‟s actual results, and variances from Intel‟s current expectations regarding such factors could cause actual results to differ materially from those expressed in these forward-looking statements. Intel presently considers the following to be the important factors that could cause actual results to differ materially from the company‟s expectations. Demand could be different from Intel's expectations due to factors including changes in business and economic conditions, including supply constraints and other disruptions affecting customers; customer acceptance of Intel‟s and competitors‟ products; changes in customer order patterns including order cancellations; and changes in the level of inventory at customers. Potential disruptions in the high technology supply chain resulting from the recent disaster in Japan could cause customer demand to be different from Intel‟s expectations. Intel operates in intensely competitive industries that are characterized by a high percentage of costs that are fixed or difficult to reduce in the short term and product demand that is highly variable and difficult to forecast. Revenue and the gross margin percentage are affected by the timing of Intel product introductions and the demand for and market acceptance of Intel's products; actions taken by Intel's competitors, including product offerings and introductions, marketing programs and pricing pressures and Intel‟s response to such actions; and Intel‟s ability to respond quickly to technological developments and to incorporate new features into its products. The gross margin percentage could vary significantly from expectations based on capacity utilization; variations in inventory valuation, including variations related to the timing of qualifying products for sale; changes in revenue levels; product mix and pricing; the timing and execution of the manufacturing ramp and associated costs; start-up costs; excess or obsolete inventory; changes in unit costs; defects or disruptions in the supply of materials or resources; product manufacturing quality/yields; and impairments of long-lived assets, including manufacturing, assembly/test and intangible assets. Expenses, particularly certain marketing and compensation expenses, as well as restructuring and asset impairment charges, vary depending on the level of demand for Intel's products and the level of revenue and profits. The tax rate expectation is based on current tax law and current expected income. The tax rate may be affected by the jurisdictions in which profits are determined to be earned and taxed; changes in the estimates of credits, benefits and deductions; the resolution of issues arising from tax audits with various tax authorities, including payment of interest and penalties; and the ability to realize deferred tax assets. Gains or losses from equity securities and interest and other could vary from expectations depending on gains or losses on the sale, exchange, change in the fair value or impairments of debt and equity investments; interest rates; cash balances; and changes in fair value of derivative instruments. The majority of Intel‟s non-marketable equity investment portfolio balance is concentrated in companies in the flash memory market segment, and declines in this market segment or changes in management‟s plans with respect to Intel‟s investments in this market segment could result in significant impairment charges, impacting restructuring charges as well as gains/losses on equity investments and interest and other. Intel's results could be affected by adverse economic, social, political and physical/infrastructure conditions in countries where Intel, its customers or its suppliers operate, including military conflict and other security risks, natural disasters, infrastructure disruptions, health concerns and fluctuations in currency exchange rates. Intel‟s results could be affected by the timing of closing of acquisitions and divestitures. Intel's results could be affected by adverse effects associated with product defects and errata (deviations from published specifications), and by litigation or regulatory matters involving intellectual property, stockholder, consumer, antitrust and other issues, such as the litigation and regulatory matters described in Intel's SEC reports. An unfavorable ruling could include monetary damages or an injunction prohibiting us from manufacturing or selling one or more products, precluding particular business practices, impacting Intel‟s ability to design its products, or requiring other remedies such as compulsory licensing of intellectual property. A detailed discussion of these and other factors that could affect Intel‟s results is included in Intel‟s SEC filings, including the report on Form 10-Q for the quarter ended April 2, 2011.
Rev. 5/9/11