Embed Size (px)
Citation preview
1
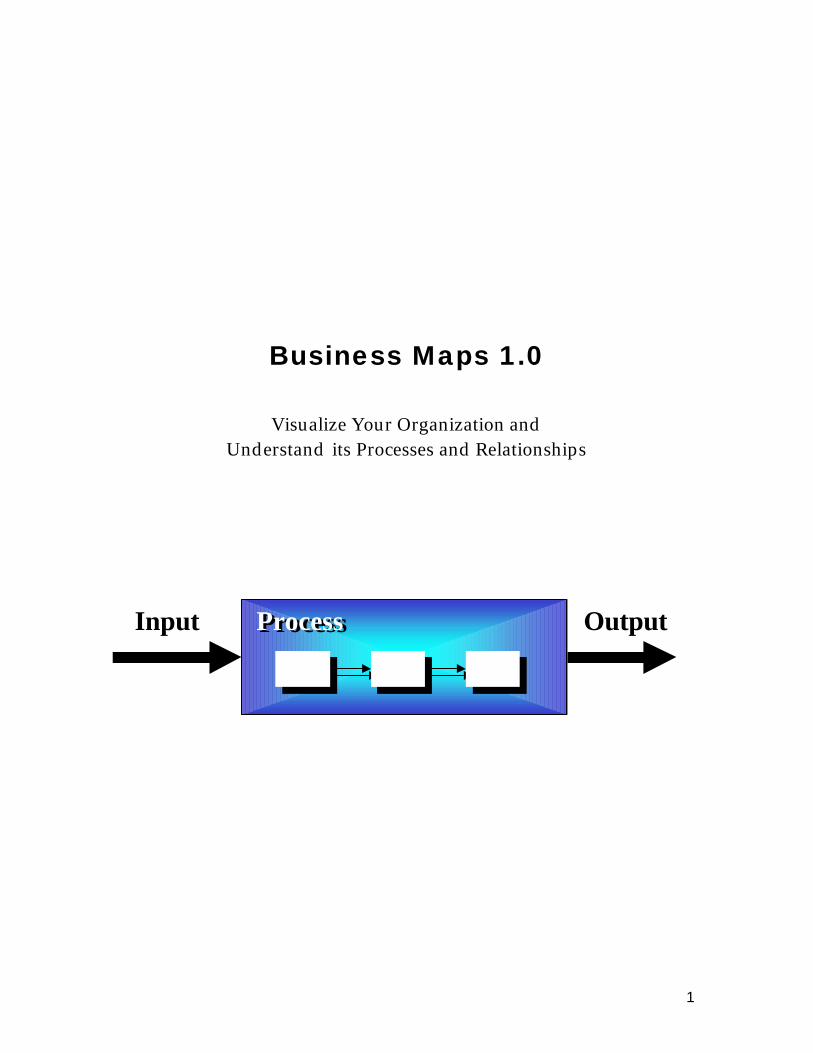
ProcessProcessInput Output
Business Maps 1.0
Visualize Your Organization and Understand its Processes and Relationships
2
Table of Contents Table of Contents ................................................................................................................ 2 Business Maps 1.0 Overview ............................................................................................. 3
What are Business Maps and Why Use Them?............................................................ 3 Several Types of Business Maps ................................................................................... 3 Organizing Principles of this Handbook ......................................................................... 4 Business Mapping Guidelines ........................................................................................ 5
Process Relationship Maps ................................................................................................ 6 What Are Process Relationship Maps?.......................................................................... 6 Why Use Process Relationship Maps? .......................................................................... 6 What Does a Basic Process Relationship Map Look Like? ........................................... 7 How to Create a Basic Process Relationship Map ........................................................ 7 What Does a Categorized Process Relationship Map Look Like? ............................... 9 How to Create a Categorized Process Relationship Map.............................................. 9 What Does a Functional Process Relationship Map Look Like? ................................. 12 How to Create a Functional Process Relationship Map............................................... 12 Process Relationship Maps and The Pritchett Rummler-Brache Improvement Methodology.................................................................................................................. 15 Summary Process Relationship Maps ......................................................................... 15
Process Maps ................................................................................................................... 16 What Are Process Maps?............................................................................................. 16 Why Use Process Maps? ............................................................................................. 16 What Do Linear Process Maps Look Like? .................................................................. 17 How to Create Linear Process Maps............................................................................ 17 What Do Cross-Functional Process Maps Look Like?................................................ 18 How to Create Cross-Functional Process Maps ......................................................... 20 Additional Process Mapping Conventions .................................................................... 22 Process Maps and The Pritchett Rummler-Brache Improvement Methodology ......... 25 Summary Process Maps............................................................................................... 26
Function Relationship Maps ............................................................................................. 27 What Are Function Relationship Maps?....................................................................... 27 Why Use Function Relationship Maps? ....................................................................... 27 What Do Function Relationship Maps Look Like? ....................................................... 28 How to Create Function Relationship Maps................................................................. 29 Function Relationship Maps and the Pritchett Rummler-Brache Improvement Methodology.................................................................................................................. 34 Summary Function Relationship Maps......................................................................... 34
Closing .............................................................................................................................. 34 Pritchett Rummler-Brache Improvement Methodology................................................ 34 Additional Material ........................................................................................................ 34
3
Business Maps 1.0 Overview
What are Business Maps and Why Use Them? Business Maps visually depict the system of relationships and processes within and around organizations. Used effectively, they generate common understanding of these processes and relationships. Business Maps also provide a framework for discussions about the way an organization currently works, identifying areas which could be improved and developing visions for the future. These discussions and common understandings enable organizations to learn how to effectively adapt to ever-changing conditions. Adaptability is responding to changing environmental variables quickly. The current business environment requires that organizations be highly adaptable. For an organization to be highly adaptable, the people within must have a deep understanding of how their organization works as a system and interacts with the surrounding business environment. Management teams with cross-functional, organization-wide perspectives are most effective at ensuring adaptability. Business Maps are tools for communicating and learning about the processes and relationships that are critical to an organization’s success.
Several Types of Business Maps Although there are many different types of Business Maps, this handbook will address three basic types that have proven particularly useful in improving organizational performance.
1 - Process Relationship Maps A Process Relationship Map represents a high-level view of an organization. In this case, it graphically depicts the relationships between the processes used by the organization as it seeks to deliver its products and/or services to customers. The Process Relationship Map shows - through inputs and outputs - how each process interacts with other processes.
2 - Process Maps A Process Map describes the way work is accomplished. It literally maps out the sequential steps involved in converting a specific input, into a specific output. A Cross-Functional Process Map graphically depicts how work gets done and which Functions in the organization are involved in accomplishing a given task.
3 - Function Relationship Maps A Function Relationship Map offers a high-level view of an organization. It is a picture of the key relationships, expressed as inputs or outputs, between the organization’s internal Functions (departments), and its customers and suppliers. These three types of Business Maps comprise a comprehensive set of tools for use during the definition, analysis, and design phases of the Pritchett Rummler-Brache Process Improvement Project. Used together or individually, the maps can significantly improve understanding of the system in which an individual works, and subsequently improve that system through enhanced efficiency.
4
Organizing Principles of this Handbook Business Maps are tools for understanding business. This handbook is intended to provide transfer of knowledge so that readers may begin to use these specific tools. The contents are organized accordingly. For each tool, the contents have been organized under the following headings:
What Are They? This is a brief description of the tool. This includes variations on the tool if they exist.
Why Use Them? This is a list of the generic uses of the tool.
What Do They Look Like? This section includes descriptions of the key graphical elements and examples.
How to Create Them This is a step-by-step instruction on the creation of the various maps
Business Maps and the Pritchett Rummler-Brache Improvement Methodologies This section describes how and when the tools may be used within the context of organizational and process improvement efforts. This handbook does not provide detail on the actual Pritchett Rummler-Brache Improvement Methodologies. Please reference the Closing section of this handbook for sources more information on these topics.
Summary Key features and uses for the tool.
5
Business Mapping Guidelines When preparing Business Maps, work typically progresses from rough, working versions to final, neater documents. Along the way, questions frequently arise as to where or how a box or line should be positioned on the map. While there are no “right” answers to such questions, there are some objectives that can provide guidance:
1 - Accuracy Is the map an accurate representation of the process/relationship?
2 - Clarity Is the map easy to understand with minimal instruction?
3 - Emphasis Is there a particular point or observation about this process/relationship that needs to be communicated? Does the map accomplish this? The first two objectives can be accomplished by reviewing the map with subject matter experts to validate its accuracy, and with “naive” observers to determine whether it can be readily understood. The third objective involves taking artistic license with the map in order to make a point. A valuable aspect of mapping is that, in addition to documenting processes and relationships, users can be specifically directed to key areas which are affecting performance. This can be accomplished by highlighting specific parts of the map with thicker borders or different colors.
6
Process Relationship Maps
What Are Process Relationship Maps? A Process Relationship Map is a snapshot of the major processes used by an organization to deliver its products and services to customers. In its most basic form, the Process Relationship Map displays the input-output relationships between the work processes. By varying the format, it is possible to convey different types and quantities of information. There are three types of Process Relationship Maps that provide users with different types of information in varying levels of detail.
1 - Basic Process Relationship Maps The processes are linked using inputs and outputs, with no attempt to supply additional information.
2 - Categorized Process Relationship Maps The processes are linked using inputs and outputs, and the map also identifies each process by category (management process, primary process, support process).
3 - Functional Process Relationship Maps The processes are linked using inputs and outputs, and the map indicates which Functions in the organization are involved in each process.
Why Use Process Relationship Maps? Process Relationship Maps can be of benefit in such activities as: ?? Developing an awareness of the network of processes through which the
organization’s work is accomplished. ?? Creating an inventory of the organization’s processes. ?? Identifying which processes are causing the organization to fall short of its goals. ?? Collecting process performance data in search of improvement opportunities. ?? Prioritizing Process Improvement Projects in the organization. ?? Developing a process-focused measurement system for the entire company. ?? Determining how other processes affect a specific process that has been targeted for
improvement. ?? Defining the output necessary to facilitate suitable input to the subject process. ?? Defining the output the subject process must provide as input to other processes. ?? Helping Process Design Team members understand (1) their project’s scope, goals,
inputs/outputs to/from other processes, and (2) the relationship of their project to other Process Improvement Projects in the organization (potential conflicts, potential synergies, etc.).
7
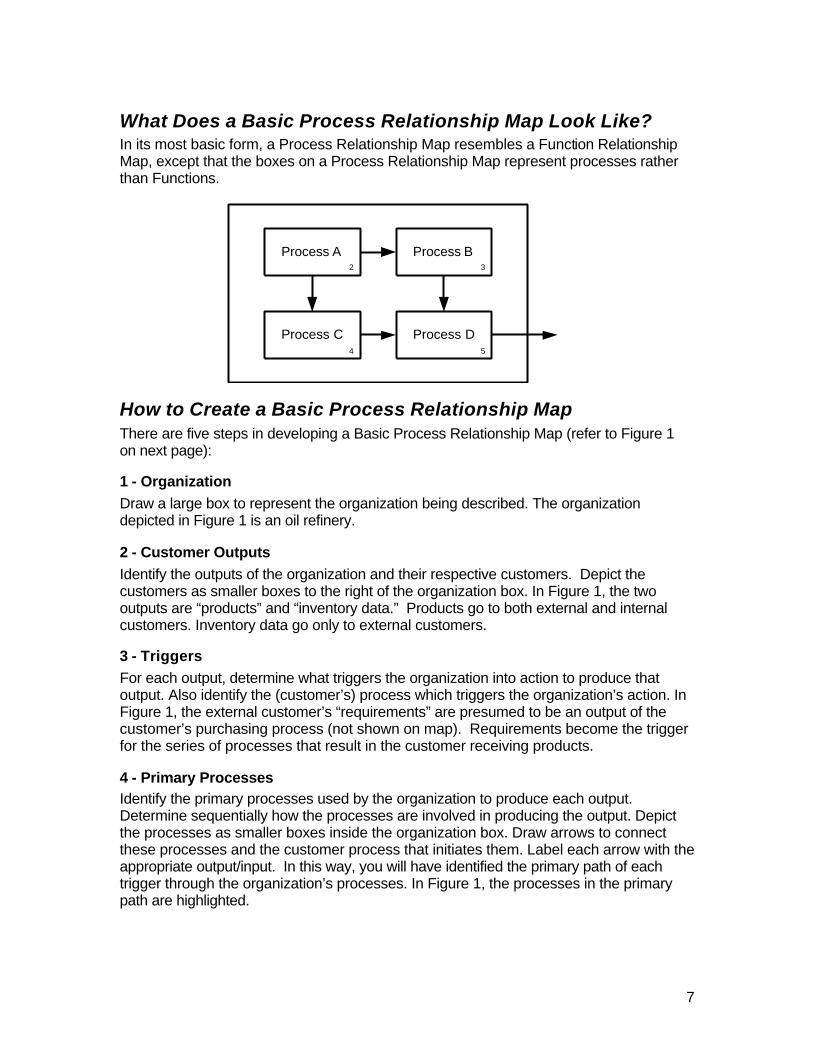
What Does a Basic Process Relationship Map Look Like? In its most basic form, a Process Relationship Map resembles a Function Relationship Map, except that the boxes on a Process Relationship Map represent processes rather than Functions.
How to Create a Basic Process Relationship Map There are five steps in developing a Basic Process Relationship Map (refer to Figure 1 on next page):
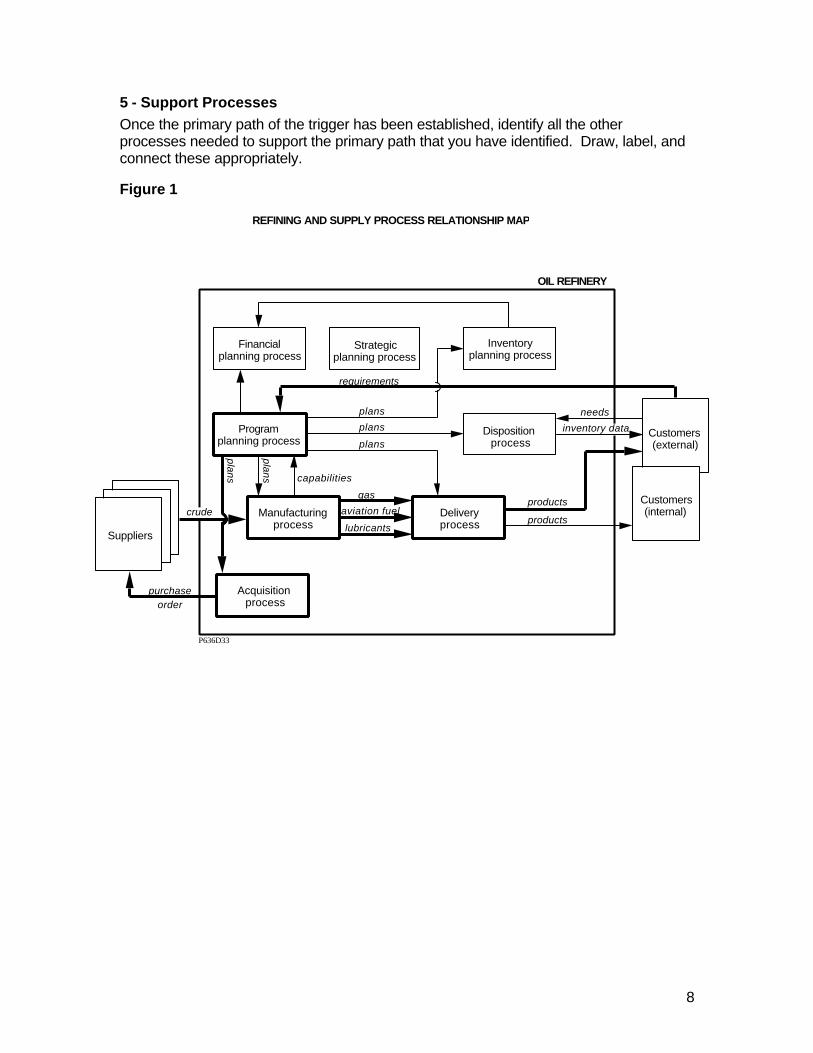
1 - Organization Draw a large box to represent the organization being described. The organization depicted in Figure 1 is an oil refinery.
2 - Customer Outputs Identify the outputs of the organization and their respective customers. Depict the customers as smaller boxes to the right of the organization box. In Figure 1, the two outputs are “products” and “inventory data.” Products go to both external and internal customers. Inventory data go only to external customers.
3 - Triggers For each output, determine what triggers the organization into action to produce that output. Also identify the (customer’s) process which triggers the organization’s action. In Figure 1, the external customer’s “requirements” are presumed to be an output of the customer’s purchasing process (not shown on map). Requirements become the trigger for the series of processes that result in the customer receiving products.
4 - Primary Processes Identify the primary processes used by the organization to produce each output. Determine sequentially how the processes are involved in producing the output. Depict the processes as smaller boxes inside the organization box. Draw arrows to connect these processes and the customer process that initiates them. Label each arrow with the appropriate output/input. In this way, you will have identified the primary path of each trigger through the organization’s processes. In Figure 1, the processes in the primary path are highlighted.
2
Process A 3
Process B
4
Process C 5
Process D
8
5 - Support Processes Once the primary path of the trigger has been established, identify all the other processes needed to support the primary path that you have identified. Draw, label, and connect these appropriately.
Figure 1
REFINING AND SUPPLY PROCESS RELATIONSHIP MAP
P636D33
Strategic planning process
Financial planning process
crude
purchase order
plans
Disposition process
Program planning process
aviation fuel Delivery process
Manufacturing process
Acquisition process
Customers (external)
Suppliers
OIL REFINERY
Inventory planning process
lubricants
gas
products
products Customers (internal)
plans
plans
inventory data
needs
requirements
plans
plans capabilities
9
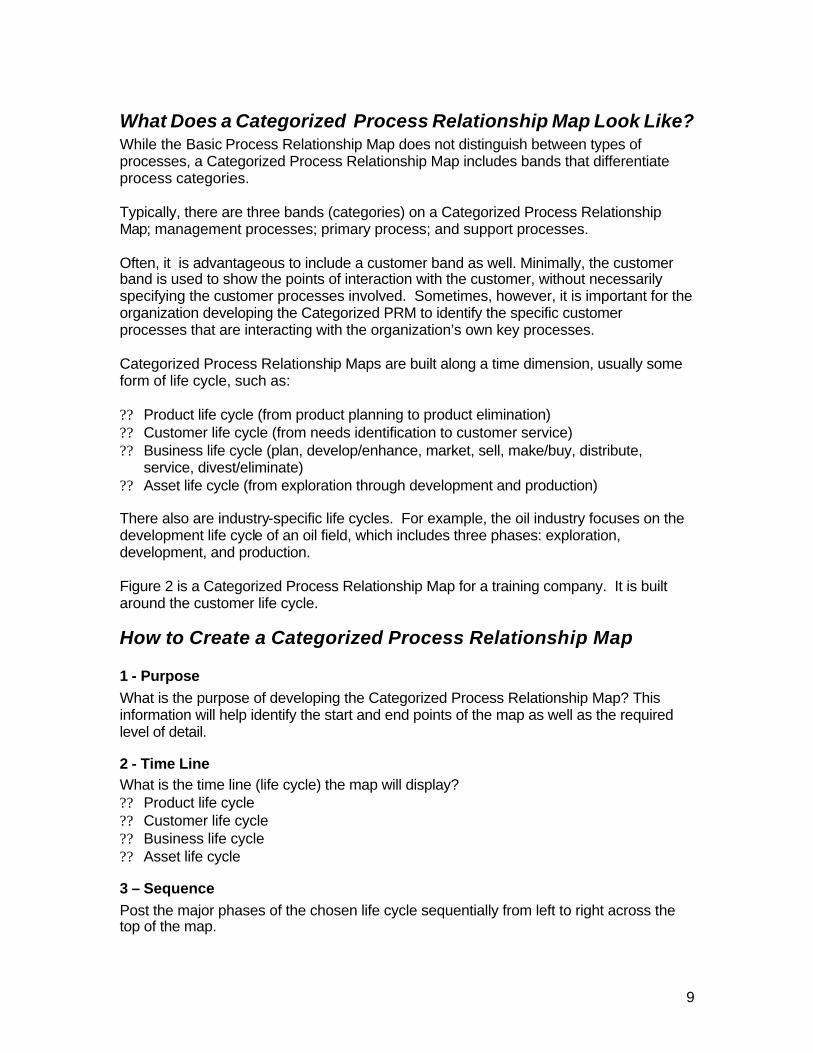
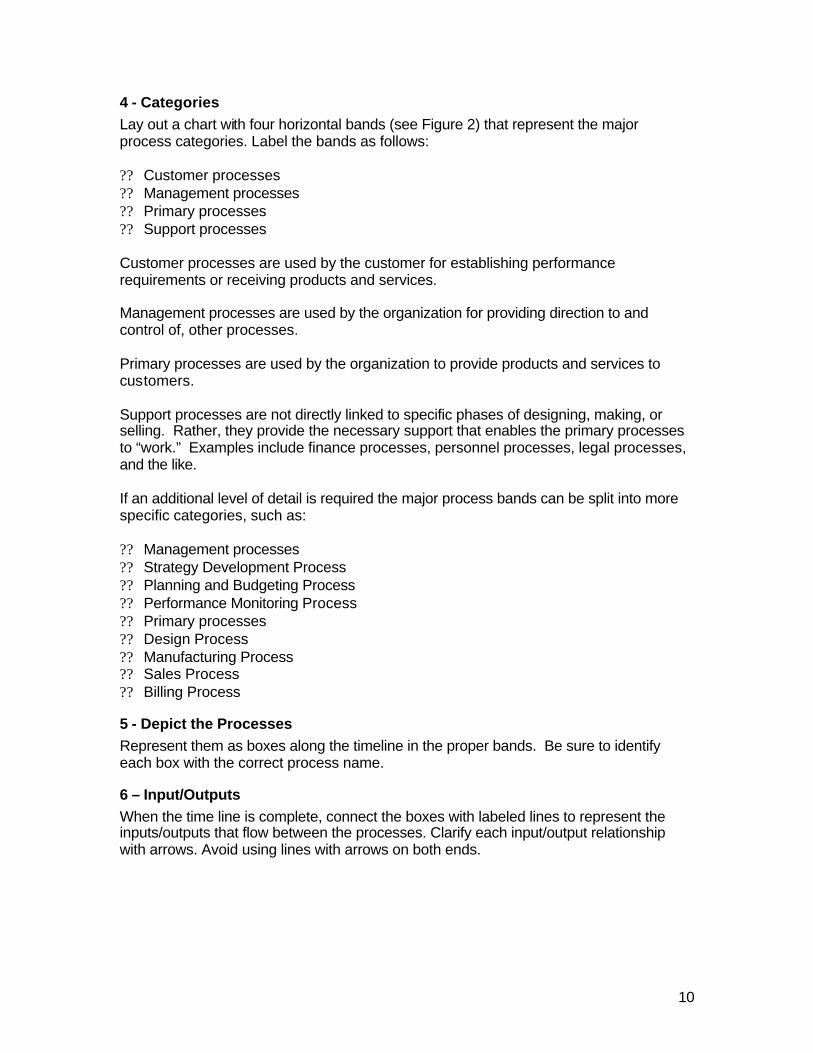
What Does a Categorized Process Relationship Map Look Like? While the Basic Process Relationship Map does not distinguish between types of processes, a Categorized Process Relationship Map includes bands that differentiate process categories. Typically, there are three bands (categories) on a Categorized Process Relationship Map; management processes; primary process; and support processes. Often, it is advantageous to include a customer band as well. Minimally, the customer band is used to show the points of interaction with the customer, without necessarily specifying the customer processes involved. Sometimes, however, it is important for the organization developing the Categorized PRM to identify the specific customer processes that are interacting with the organization’s own key processes. Categorized Process Relationship Maps are built along a time dimension, usually some form of life cycle, such as: ?? Product life cycle (from product planning to product elimination) ?? Customer life cycle (from needs identification to customer service) ?? Business life cycle (plan, develop/enhance, market, sell, make/buy, distribute,
service, divest/eliminate) ?? Asset life cycle (from exploration through development and production) There also are industry-specific life cycles. For example, the oil industry focuses on the development life cycle of an oil field, which includes three phases: exploration, development, and production. Figure 2 is a Categorized Process Relationship Map for a training company. It is built around the customer life cycle.
How to Create a Categorized Process Relationship Map
1 - Purpose What is the purpose of developing the Categorized Process Relationship Map? This information will help identify the start and end points of the map as well as the required level of detail.
2 - Time Line What is the time line (life cycle) the map will display? ?? Product life cycle ?? Customer life cycle ?? Business life cycle ?? Asset life cycle
3 – Sequence Post the major phases of the chosen life cycle sequentially from left to right across the top of the map.
10
4 - Categories Lay out a chart with four horizontal bands (see Figure 2) that represent the major process categories. Label the bands as follows: ?? Customer processes ?? Management processes ?? Primary processes ?? Support processes Customer processes are used by the customer for establishing performance requirements or receiving products and services. Management processes are used by the organization for providing direction to and control of, other processes. Primary processes are used by the organization to provide products and services to customers. Support processes are not directly linked to specific phases of designing, making, or selling. Rather, they provide the necessary support that enables the primary processes to “work.” Examples include finance processes, personnel processes, legal processes, and the like. If an additional level of detail is required the major process bands can be split into more specific categories, such as: ?? Management processes ?? Strategy Development Process ?? Planning and Budgeting Process ?? Performance Monitoring Process ?? Primary processes ?? Design Process ?? Manufacturing Process ?? Sales Process ?? Billing Process
5 - Depict the Processes Represent them as boxes along the timeline in the proper bands. Be sure to identify each box with the correct process name.
6 – Input/Outputs When the time line is complete, connect the boxes with labeled lines to represent the inputs/outputs that flow between the processes. Clarify each input/output relationship with arrows. Avoid using lines with arrows on both ends.
11
Figure 2 – Categorized Process Relationship Map
Market Development
Process
Planning and Budgeting
Process
MA
NA
GE
ME
NT
PR
IMA
RY
Sales Process
Technical Suppport Process
Customer Order Processes
plan
s, b
udge
ts
inqu
irie
s
Order Taking Production
Sales Forcasting
Process
market data
sales forcast
serviceorder
order
invoice
New Product Development
Process
Capital Management
Processes
SUPP
OR
T
Human Resources Processes
Procurement Process
88-250-DOM
new product specifications
materials
product
staff
capital
Order Entering
and Invoicing
Assembly and
Shipping
12
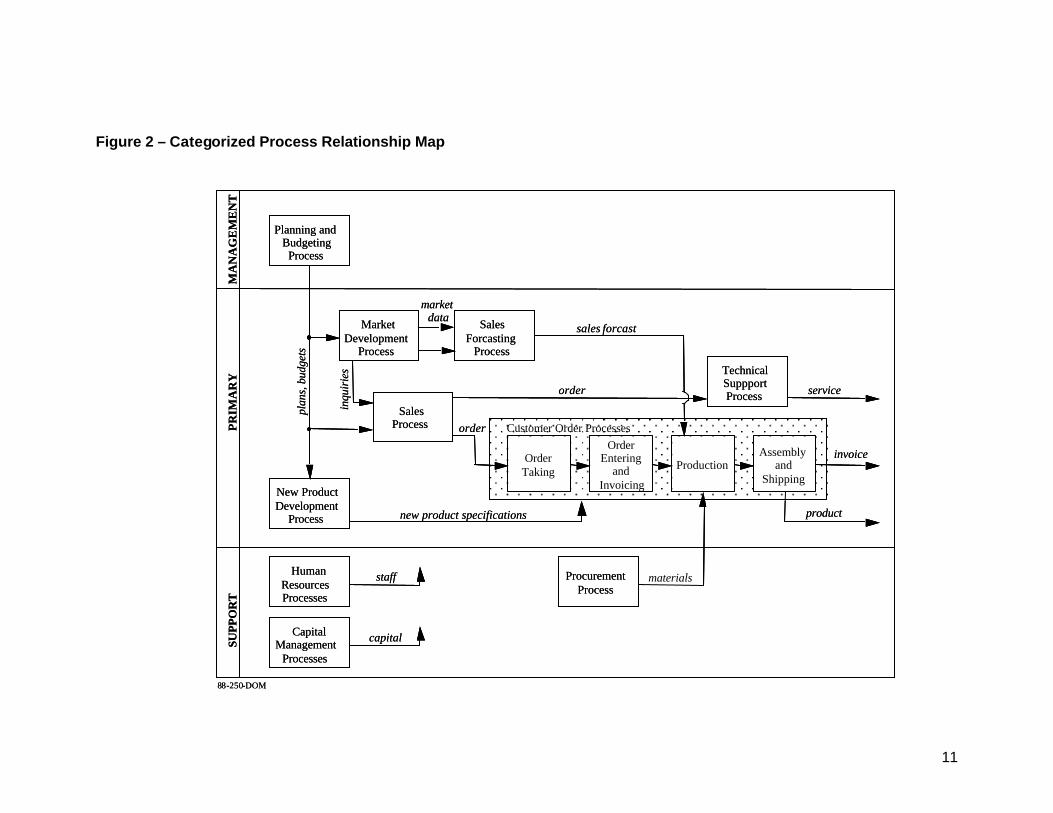
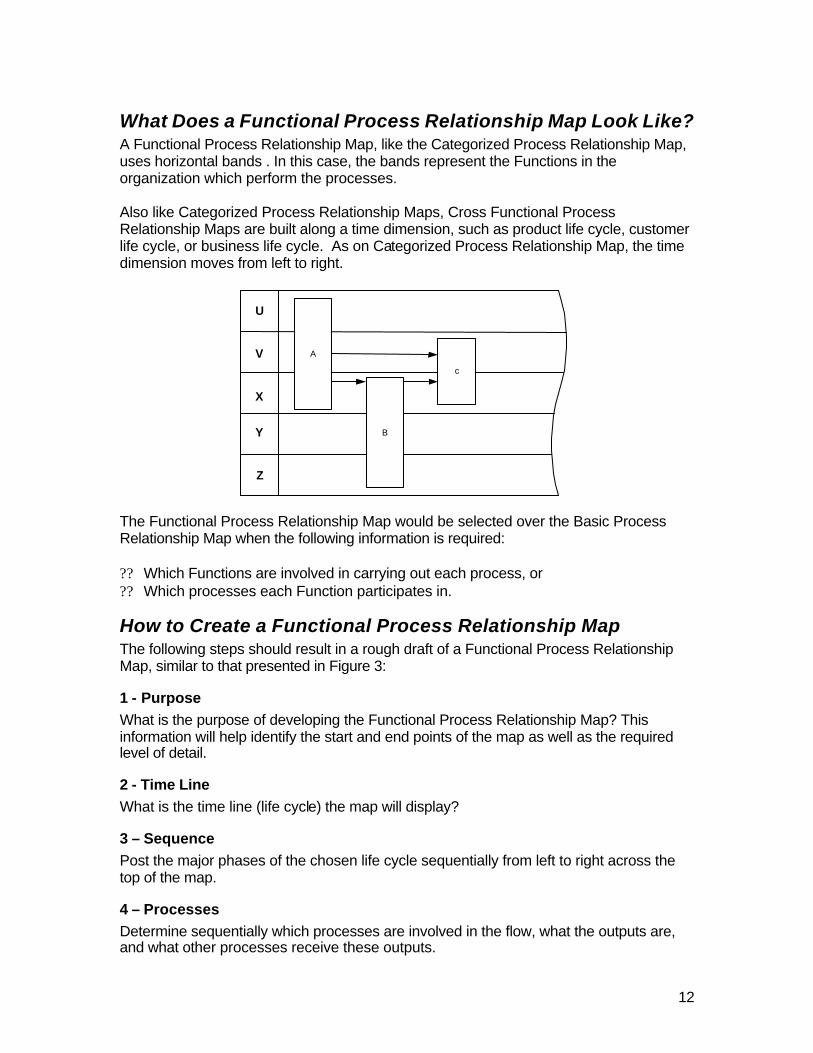
What Does a Functional Process Relationship Map Look Like? A Functional Process Relationship Map, like the Categorized Process Relationship Map, uses horizontal bands . In this case, the bands represent the Functions in the organization which perform the processes. Also like Categorized Process Relationship Maps, Cross Functional Process Relationship Maps are built along a time dimension, such as product life cycle, customer life cycle, or business life cycle. As on Categorized Process Relationship Map, the time dimension moves from left to right.
The Functional Process Relationship Map would be selected over the Basic Process Relationship Map when the following information is required: ?? Which Functions are involved in carrying out each process, or ?? Which processes each Function participates in.
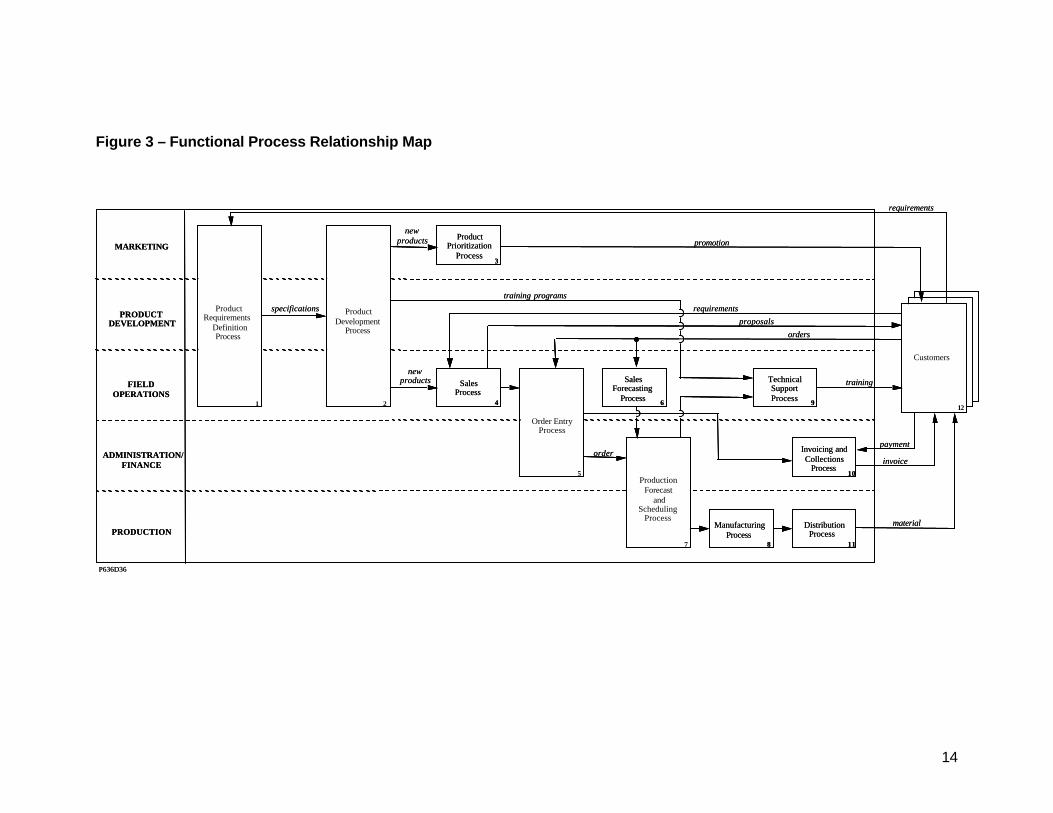
How to Create a Functional Process Relationship Map The following steps should result in a rough draft of a Functional Process Relationship Map, similar to that presented in Figure 3:
1 - Purpose What is the purpose of developing the Functional Process Relationship Map? This information will help identify the start and end points of the map as well as the required level of detail.
2 - Time Line What is the time line (life cycle) the map will display?
3 – Sequence Post the major phases of the chosen life cycle sequentially from left to right across the top of the map.
4 – Processes Determine sequentially which processes are involved in the flow, what the outputs are, and what other processes receive these outputs.
U
V
Y
X
Z
A
c
B
13
5 – Functions For each process identified, determine which Functions are involved. Label the bands with the appropriate Function names. Draw the process as a box that spans the appropriate Functions.
6 - Inputs/Outputs Link the process boxes with lines (arrows) and labels as needed.
14
Figure 3 – Functional Process Relationship Map
P636D36
MARKETING
PRODUCT DEVELOPMENT
FIELD OPERATIONS
ADMINISTRATION/ FINANCE
PRODUCTION
Product Prioritization
Process3
Sales Process
4
Sales Forecasting
Process 6
Technical Support Process 9
Manufacturing Process
8
Invoicing and Collections
Process10
Distribution Process
11
Product Requirements
Definition Process
1
Product Development
Process
2
specifications
new products
new products
Order Entry Process
5Production
Forecast and
Scheduling Process
7
material
invoice
payment
training
training programs
Customers
proposalsorders
requirements
promotion
requirements
12
order
15
Process Relationship Maps and The Pritchett Rummler-Brache Improvement Methodology Process Relationship Maps typically are developed prior to the Define phase, during the planning phase that precedes project work. Management groups find such maps particularly helpful in developing an inventory of critical processes and establishing priorities for improving processes. Accordingly, development of one or more Process Relationship Maps has become an important element of Pritchett Rummler-Brache Situational Analysis activities. Once developed, Process Relationship Maps can contribute importantly to work done in the “Is” and “Should” analysis and design phases.
Summary Process Relationship Maps Process relationship Maps depict the inputs and outputs that flow among the processes used by an organization to conduct its business. They are used to understand organizations from a process perspective. There are three types of Process Relationship Maps that may be used in order to generate more specific understanding.
1 - Basic Process Relationship Maps The processes are linked using inputs/outputs, with no attempt to supply additional information.
2 - Categorized Process Relationship Maps The processes are linked using inputs/outputs, and the map also identifies each process by category (management process, primary process, support process).
3 - Functional Process Relationship Maps The processes are linked using inputs/outputs, and the map also indicates which Functions in the organization participate in each process.
16
Process Maps
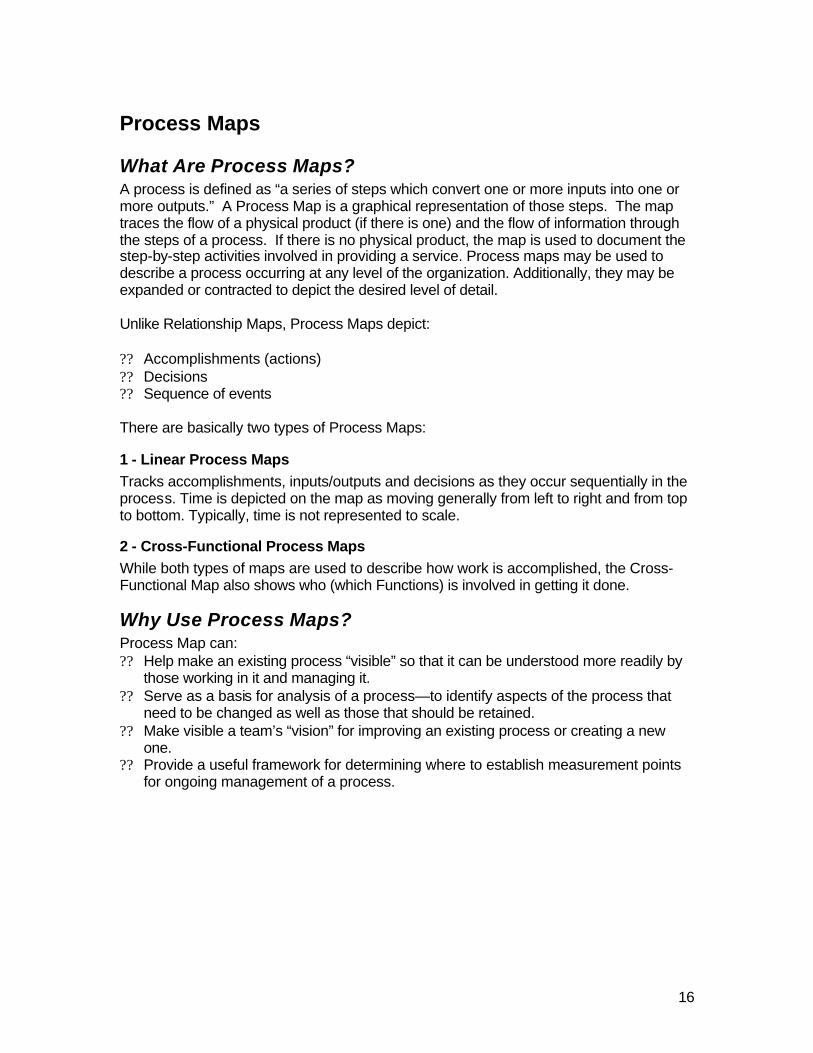
What Are Process Maps? A process is defined as “a series of steps which convert one or more inputs into one or more outputs.” A Process Map is a graphical representation of those steps. The map traces the flow of a physical product (if there is one) and the flow of information through the steps of a process. If there is no physical product, the map is used to document the step-by-step activities involved in providing a service. Process maps may be used to describe a process occurring at any level of the organization. Additionally, they may be expanded or contracted to depict the desired level of detail. Unlike Relationship Maps, Process Maps depict: ?? Accomplishments (actions) ?? Decisions ?? Sequence of events There are basically two types of Process Maps:
1 - Linear Process Maps Tracks accomplishments, inputs/outputs and decisions as they occur sequentially in the process. Time is depicted on the map as moving generally from left to right and from top to bottom. Typically, time is not represented to scale.
2 - Cross-Functional Process Maps While both types of maps are used to describe how work is accomplished, the Cross-Functional Map also shows who (which Functions) is involved in getting it done.
Why Use Process Maps? Process Map can: ?? Help make an existing process “visible” so that it can be understood more readily by
those working in it and managing it. ?? Serve as a basis for analysis of a process—to identify aspects of the process that
need to be changed as well as those that should be retained. ?? Make visible a team’s “vision” for improving an existing process or creating a new
one. ?? Provide a useful framework for determining where to establish measurement points
for ongoing management of a process.
17
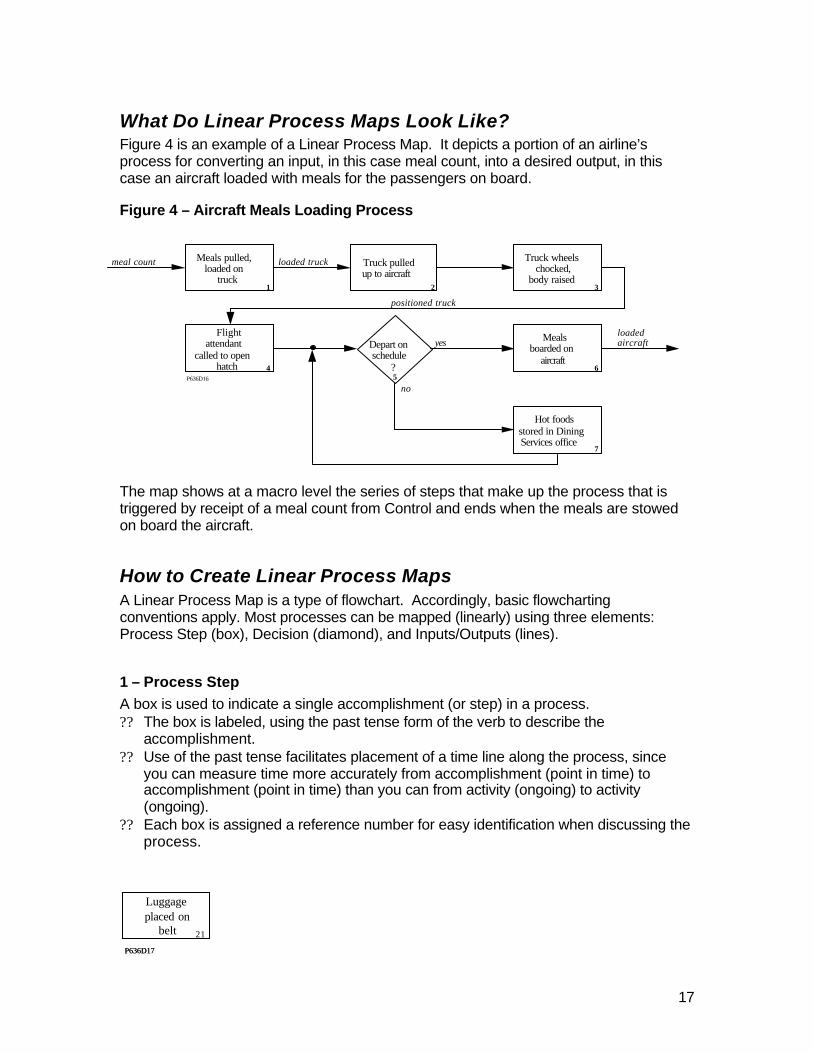
What Do Linear Process Maps Look Like? Figure 4 is an example of a Linear Process Map. It depicts a portion of an airline’s process for converting an input, in this case meal count, into a desired output, in this case an aircraft loaded with meals for the passengers on board.
Figure 4 – Aircraft Meals Loading Process
The map shows at a macro level the series of steps that make up the process that is triggered by receipt of a meal count from Control and ends when the meals are stowed on board the aircraft.
How to Create Linear Process Maps A Linear Process Map is a type of flowchart. Accordingly, basic flowcharting conventions apply. Most processes can be mapped (linearly) using three elements: Process Step (box), Decision (diamond), and Inputs/Outputs (lines).
1 – Process Step A box is used to indicate a single accomplishment (or step) in a process. ?? The box is labeled, using the past tense form of the verb to describe the
accomplishment. ?? Use of the past tense facilitates placement of a time line along the process, since
you can measure time more accurately from accomplishment (point in time) to accomplishment (point in time) than you can from activity (ongoing) to activity (ongoing).
?? Each box is assigned a reference number for easy identification when discussing the process.
P636D16
loaded truckMeals pulled, loaded on
truck
positioned truck
loaded aircraft
Truck pulled up to aircraft
Truck wheels chocked,
body raised
Flight attendant
called to open hatch
Depart on schedule
?
Meals boarded on
aircraft
Hot foods stored in Dining Services office
1 2 3
yes
45
6
no
7
meal count
Luggageplaced on
belt 21
P636D17
Luggageplaced on
belt 21
P636D17
18
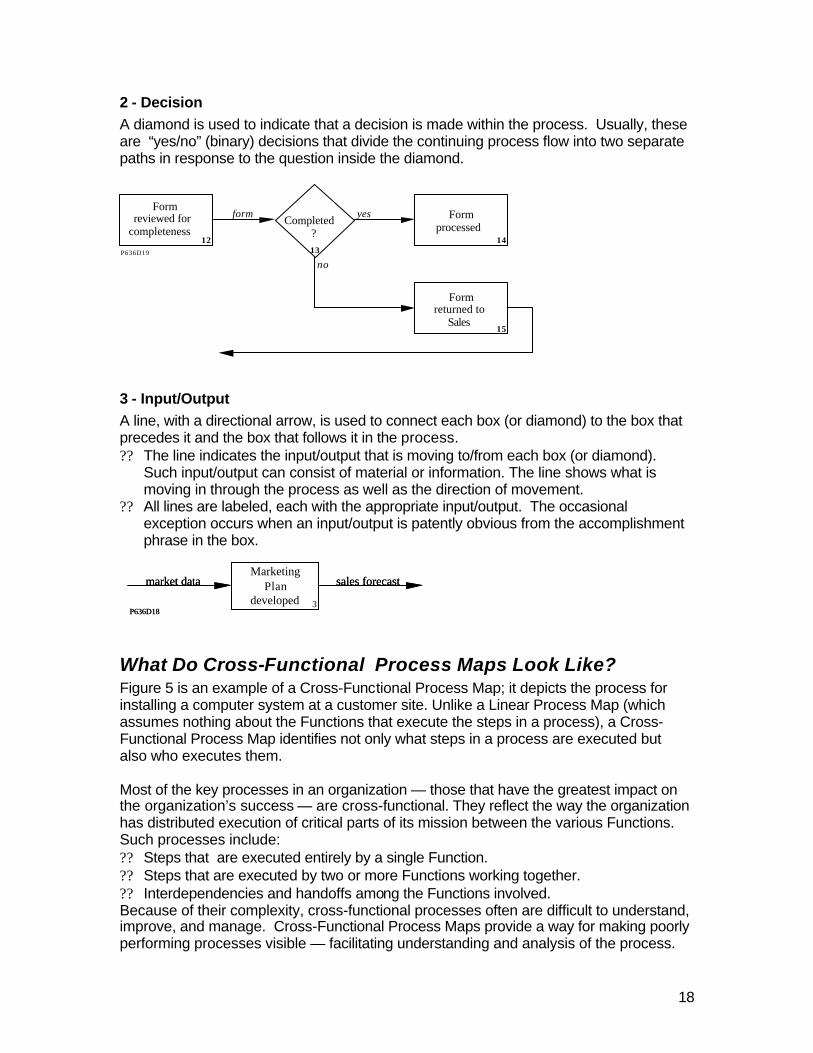
2 - Decision A diamond is used to indicate that a decision is made within the process. Usually, these are “yes/no” (binary) decisions that divide the continuing process flow into two separate paths in response to the question inside the diamond.
3 - Input/Output A line, with a directional arrow, is used to connect each box (or diamond) to the box that precedes it and the box that follows it in the process. ?? The line indicates the input/output that is moving to/from each box (or diamond).
Such input/output can consist of material or information. The line shows what is moving in through the process as well as the direction of movement.
?? All lines are labeled, each with the appropriate input/output. The occasional exception occurs when an input/output is patently obvious from the accomplishment phrase in the box.
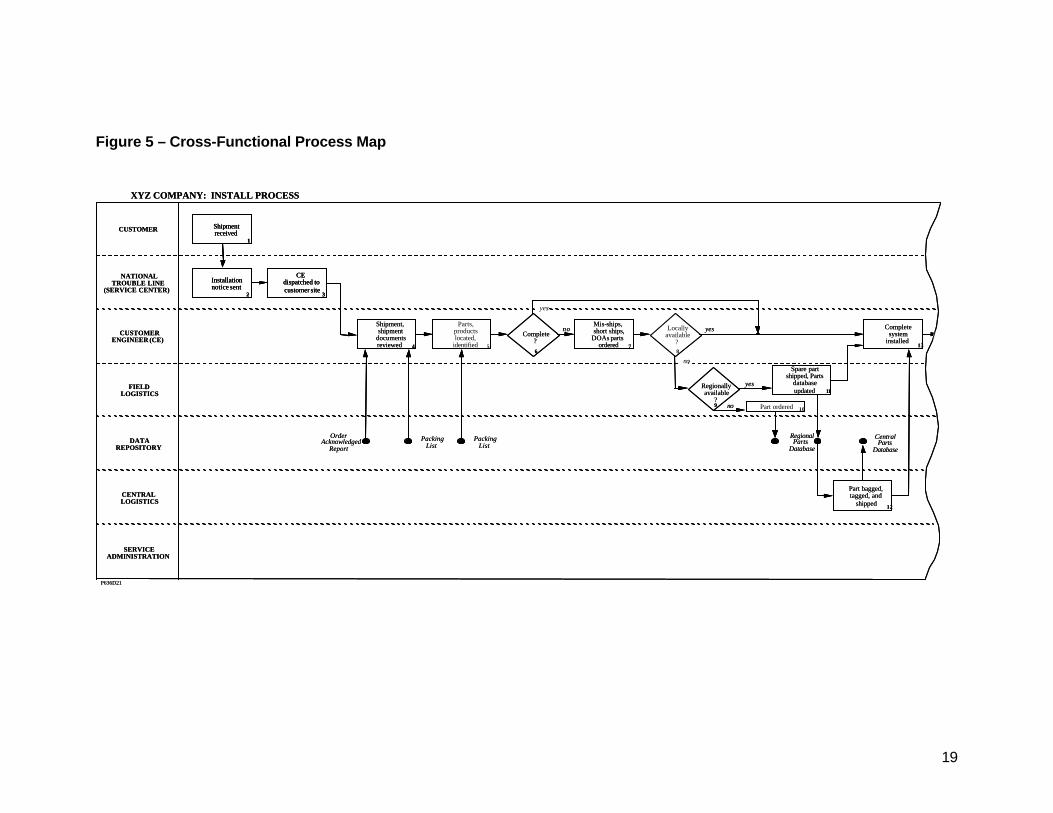
What Do Cross-Functional Process Maps Look Like? Figure 5 is an example of a Cross-Functional Process Map; it depicts the process for installing a computer system at a customer site. Unlike a Linear Process Map (which assumes nothing about the Functions that execute the steps in a process), a Cross-Functional Process Map identifies not only what steps in a process are executed but also who executes them. Most of the key processes in an organization — those that have the greatest impact on the organization’s success — are cross-functional. They reflect the way the organization has distributed execution of critical parts of its mission between the various Functions. Such processes include: ?? Steps that are executed entirely by a single Function. ?? Steps that are executed by two or more Functions working together. ?? Interdependencies and handoffs among the Functions involved. Because of their complexity, cross-functional processes often are difficult to understand, improve, and manage. Cross-Functional Process Maps provide a way for making poorly performing processes visible — facilitating understanding and analysis of the process.
P636D19
Form reviewed for
completenessCompleted
?
Form processed
Form returned to
Sales
yes
1213
14
no
15
form
MarketingPlan
developed 3P636D18
market data sales forecastMarketing
Plandeveloped 3
P636D18
market data sales forecast
19
Figure 5 – Cross-Functional Process Map
Regionally available
?
yes
9 no
Complete system
installed13
Regional Parts
Database
Central Parts
Database
Spare part shipped, Parts
database updated 11
Part bagged, tagged, and
shipped 12
P636D21
CUSTOMER
NATIONAL TROUBLE LINE
(SERVICE CENTER)
CUSTOMER ENGINEER (CE)
FIELD LOGISTICS
DATA REPOSITORY
CENTRAL LOGISTICS
SERVICE ADMINISTRATION
Shipment, shipment
documents reviewed 4
Mis-ships, short ships,
DOAs parts ordered 7
Shipment received
1
Installation notice sent
2
CE dispatched to customer site
3
Complete ?
yes
6
no yes
Order Acknowledged
ReportPacking
ListPacking
List
XYZ COMPANY: INSTALL PROCESS
Locally available
?8
no
Parts, products located,
identified 5
Part ordered 10
Regionally available
?
yes
9 no
Complete system
installed13
Regional Parts
Database
Central Parts
Database
Spare part shipped, Parts
database updated 11
Part bagged, tagged, and
shipped 12
P636D21
CUSTOMER
NATIONAL TROUBLE LINE
(SERVICE CENTER)
CUSTOMER ENGINEER (CE)
FIELD LOGISTICS
DATA REPOSITORY
CENTRAL LOGISTICS
SERVICE ADMINISTRATION
Shipment, shipment
documents reviewed 4
Mis-ships, short ships,
DOAs parts ordered 7
Shipment received
1
Installation notice sent
2
CE dispatched to customer site
3
Shipment received
1
Installation notice sent
2
CE dispatched to customer site
3
Complete ?
yes
6
no yes
Order Acknowledged
ReportPacking
ListPacking
List
XYZ COMPANY: INSTALL PROCESS
Locally available
?8
no
Parts, products located,
identified 5
Part ordered 10
20
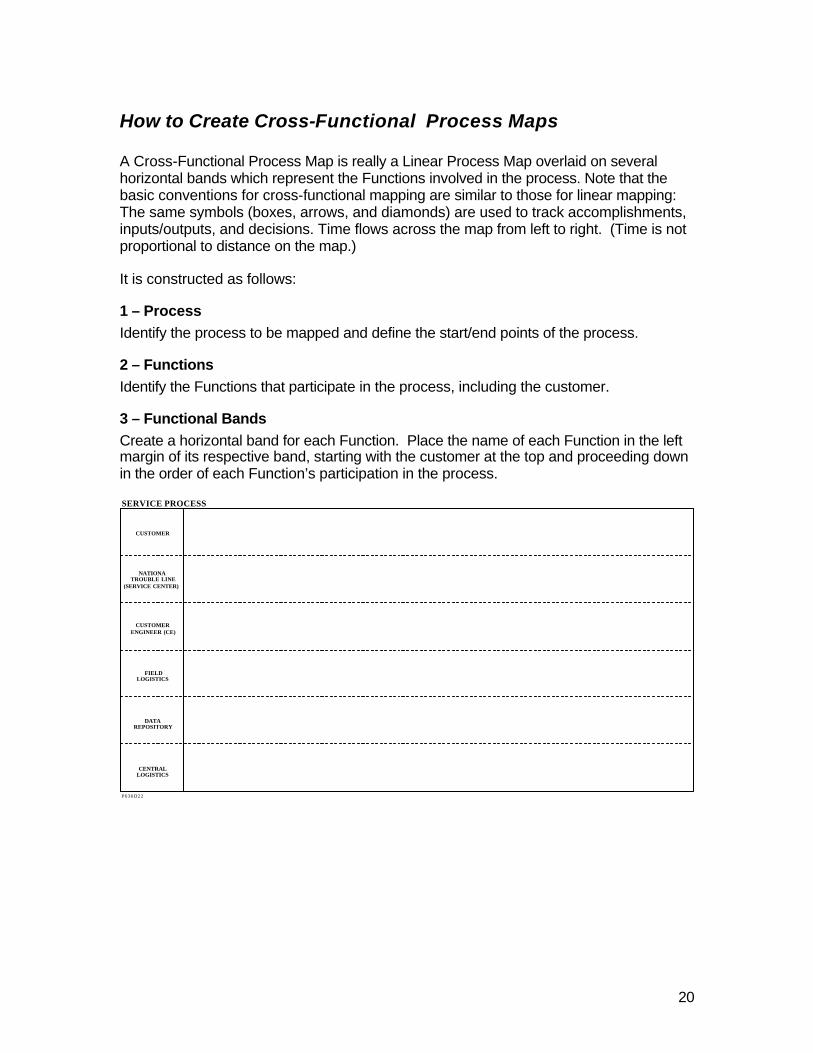
How to Create Cross-Functional Process Maps A Cross-Functional Process Map is really a Linear Process Map overlaid on several horizontal bands which represent the Functions involved in the process. Note that the basic conventions for cross-functional mapping are similar to those for linear mapping: The same symbols (boxes, arrows, and diamonds) are used to track accomplishments, inputs/outputs, and decisions. Time flows across the map from left to right. (Time is not proportional to distance on the map.) It is constructed as follows:
1 – Process Identify the process to be mapped and define the start/end points of the process.
2 – Functions Identify the Functions that participate in the process, including the customer.
3 – Functional Bands Create a horizontal band for each Function. Place the name of each Function in the left margin of its respective band, starting with the customer at the top and proceeding down in the order of each Function’s participation in the process.
P636D22
CUSTOMER
NATIONA TROUBLE LINE
(SERVICE CENTER)
CUSTOMER ENGINEER (CE)
FIELD LOGISTICS
DATA REPOSITORY
CENTRAL LOGISTICS
SERVICE PROCESS
21
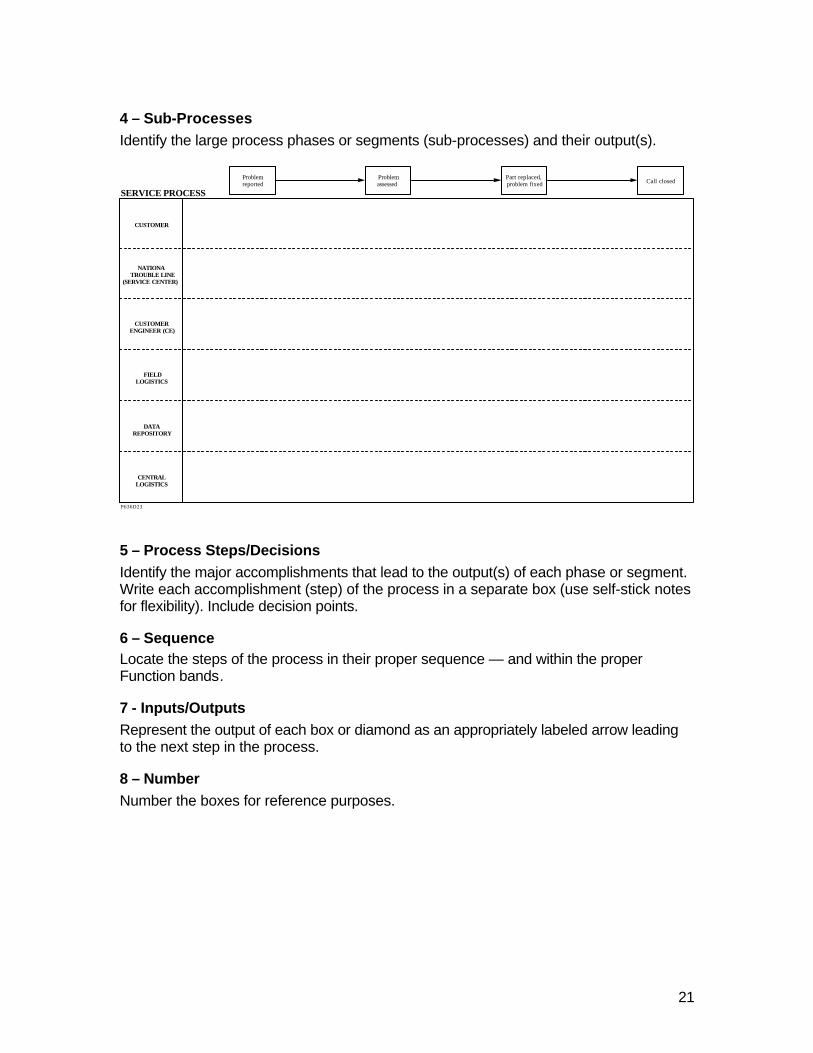
4 – Sub-Processes Identify the large process phases or segments (sub-processes) and their output(s).
5 – Process Steps/Decisions Identify the major accomplishments that lead to the output(s) of each phase or segment. Write each accomplishment (step) of the process in a separate box (use self-stick notes for flexibility). Include decision points.
6 – Sequence Locate the steps of the process in their proper sequence — and within the proper Function bands.
7 - Inputs/Outputs Represent the output of each box or diamond as an appropriately labeled arrow leading to the next step in the process.
8 – Number Number the boxes for reference purposes.
P636D23
CUSTOMER
CUSTOMER ENGINEER (CE)
FIELD LOGISTICS
DATA REPOSITORY
CENTRAL LOGISTICS
NATIONA TROUBLE LINE
(SERVICE CENTER)
SERVICE PROCESS
Problem reported
Problem assessed
Part replaced, problem fixed Call closed
22
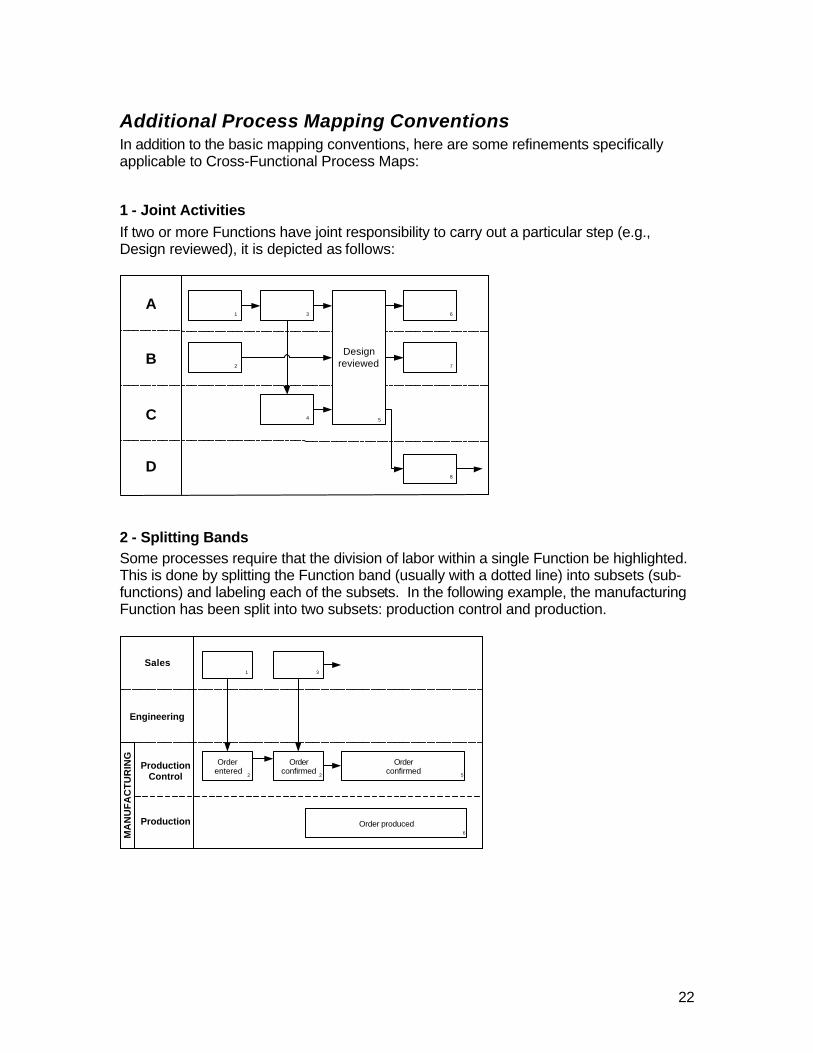
Additional Process Mapping Conventions In addition to the basic mapping conventions, here are some refinements specifically applicable to Cross-Functional Process Maps:
1 - Joint Activities If two or more Functions have joint responsibility to carry out a particular step (e.g., Design reviewed), it is depicted as follows:
2 - Splitting Bands Some processes require that the division of labor within a single Function be highlighted. This is done by splitting the Function band (usually with a dotted line) into subsets (sub-functions) and labeling each of the subsets. In the following example, the manufacturing Function has been split into two subsets: production control and production.
A
B
C
D
1
5
Designreviewed
3
2
4
7
6
8
Sales
Engineering
ProductionControl
Production
1 3
Orderentered
2
Orderconfirmed
2
Orderconfirmed
5
Order produced6M
AN
UF
AC
TU
RIN
G
23
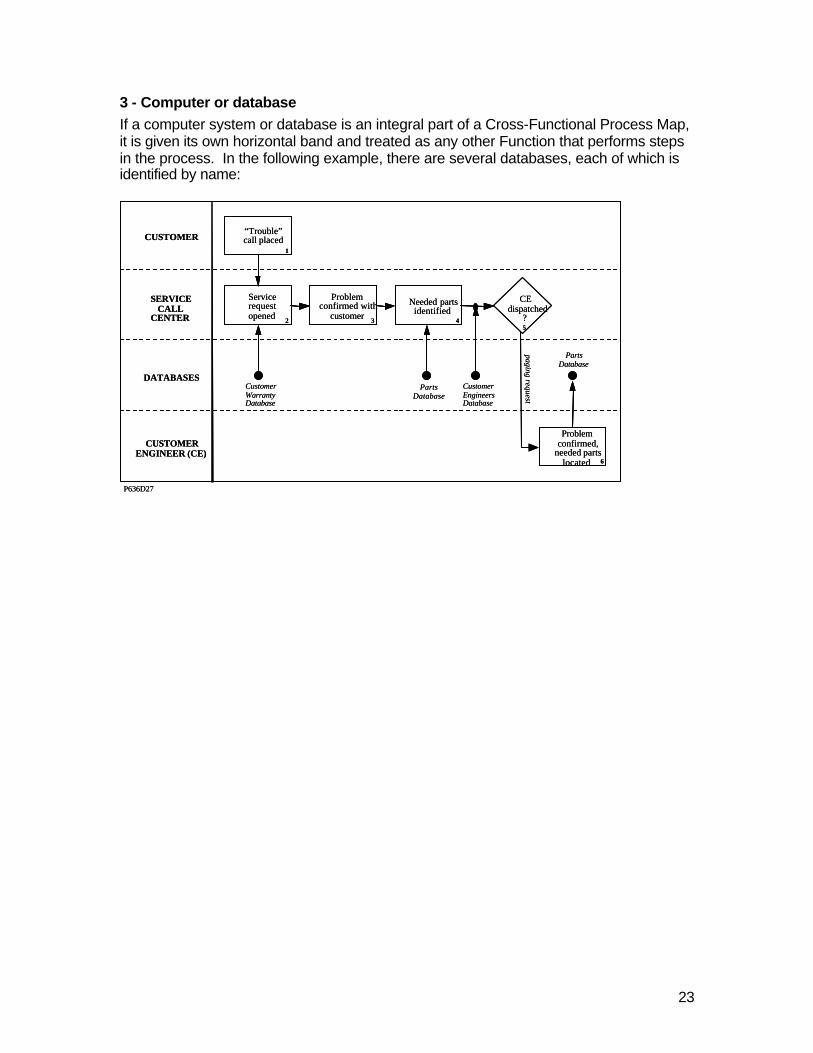
3 - Computer or database If a computer system or database is an integral part of a Cross-Functional Process Map, it is given its own horizontal band and treated as any other Function that performs steps in the process. In the following example, there are several databases, each of which is identified by name:
P636D27
CUSTOMER
SERVICE CALL
CENTER
DATABASES
CUSTOMER ENGINEER (CE)
“Trouble” call placed
1
Customer Warranty Database
Customer Engineers Database
Parts Database
Service request opened 2
Problem confirmed with
customer 3
Needed parts identified
4
CE dispatched
?5
Parts Database
Problem confirmed,
needed parts located 6
paging request
24
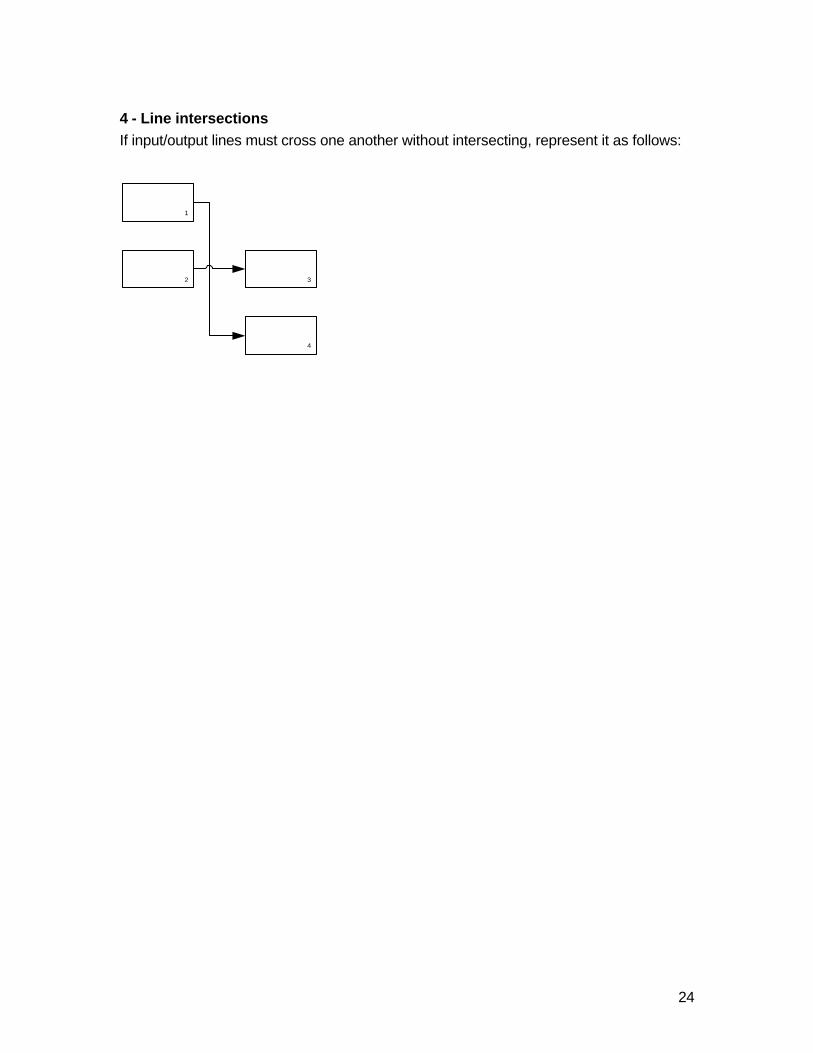
4 - Line intersections If input/output lines must cross one another without intersecting, represent it as follows:
1
2 3
4
25
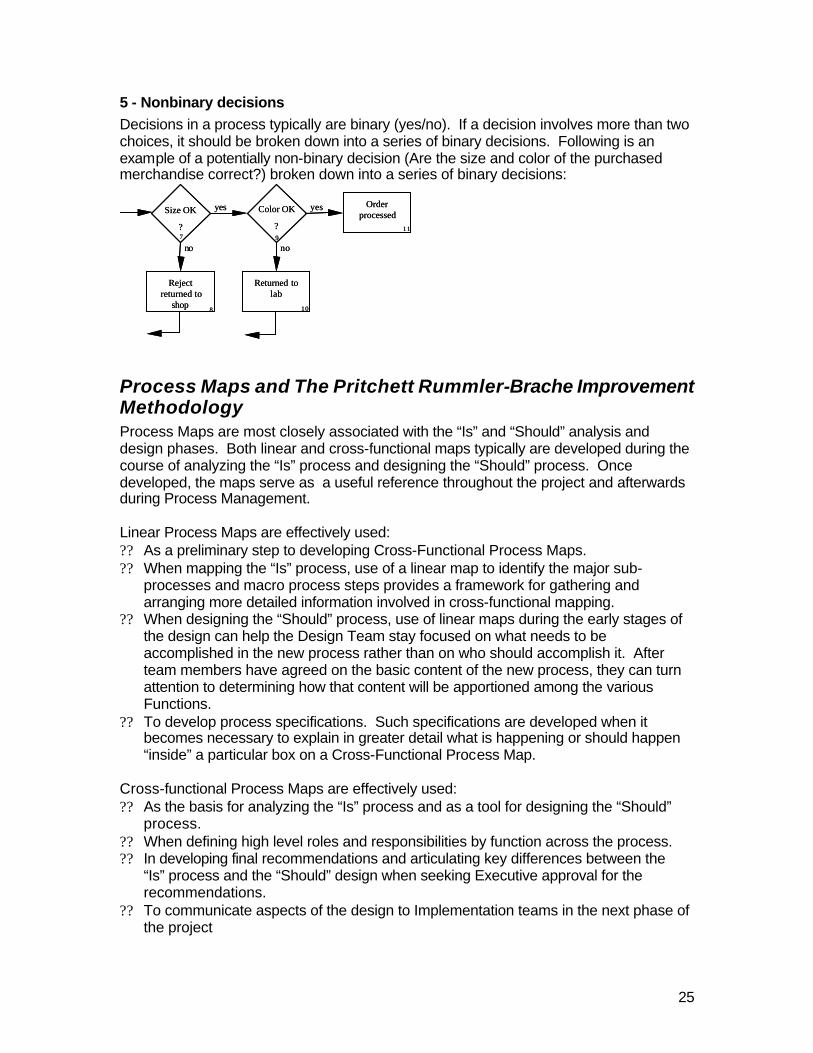
5 - Nonbinary decisions Decisions in a process typically are binary (yes/no). If a decision involves more than two choices, it should be broken down into a series of binary decisions. Following is an example of a potentially non-binary decision (Are the size and color of the purchased merchandise correct?) broken down into a series of binary decisions:
Process Maps and The Pritchett Rummler-Brache Improvement Methodology Process Maps are most closely associated with the “Is” and “Should” analysis and design phases. Both linear and cross-functional maps typically are developed during the course of analyzing the “Is” process and designing the “Should” process. Once developed, the maps serve as a useful reference throughout the project and afterwards during Process Management. Linear Process Maps are effectively used: ?? As a preliminary step to developing Cross-Functional Process Maps. ?? When mapping the “Is” process, use of a linear map to identify the major sub-
processes and macro process steps provides a framework for gathering and arranging more detailed information involved in cross-functional mapping.
?? When designing the “Should” process, use of linear maps during the early stages of the design can help the Design Team stay focused on what needs to be accomplished in the new process rather than on who should accomplish it. After team members have agreed on the basic content of the new process, they can turn attention to determining how that content will be apportioned among the various Functions.
?? To develop process specifications. Such specifications are developed when it becomes necessary to explain in greater detail what is happening or should happen “inside” a particular box on a Cross-Functional Process Map.
Cross-functional Process Maps are effectively used: ?? As the basis for analyzing the “Is” process and as a tool for designing the “Should”
process. ?? When defining high level roles and responsibilities by function across the process. ?? In developing final recommendations and articulating key differences between the
“Is” process and the “Should” design when seeking Executive approval for the recommendations.
?? To communicate aspects of the design to Implementation teams in the next phase of the project
Order processed
Returned to lab
Reject returned to
shop
Size OK
?
Color OK
?
no no
yesyes
7 911
108
Order processed
Returned to lab
Reject returned to
shop
Size OK
?
Color OK
?
no no
yesyes
7 911
108
26
Summary Process Maps Process maps depict the physical flow of goods and information through a process step by step. At any level of an organization, process maps are used to graphically represent: ?? Accomplishments (actions) ?? Decisions ?? Sequence of events There are two types of process maps. Linear Maps represent what is happening in a process. Cross-Functional Process Maps additionally show who is involved in the process.
27
Function Relationship Maps
What Are Function Relationship Maps? A Function Relationship Map is a picture of an organization as a system. That is, it depicts the organization as a group of interrelated Functions (divisions, departments, etc.) which take inputs from suppliers, and converts them into outputs for customers. The Function Relationship Map describes both: ?? External relationships (expressed as inputs/outputs) between the organization and its
customers and suppliers. ?? Internal relationships (expressed as inputs/outputs) between Functions within the
organization. There are two basic types of Function Relationship Maps:
1 - General Function Relationship Maps An organization is depicted as a whole. This map includes virtually all the major Functions within the organization — as well as suppliers and customers
2 – Critical Business Issue (CBI) based Function Relationship Maps These maps focus on relationships surrounding a particular CBI and/or the associated process(es). Such maps include only those Functions in the organization which affect or are effected by the CBI/process(es) — as well as related suppliers and customers.
Why Use Function Relationship Maps? Function Relationship Maps can be used to: ?? Help identify who (which Functions) should participate in the improvement efforts ?? Display the linkages (inputs/outputs) among the Functions associated with critical
issues or related processes ?? Help identify pivotal input/output linkages — those that represent important
opportunities for improvement. ?? Help clarify the scope and boundaries of improvement efforts. ?? Serve as a reference point for organizational structure redesign. ?? Help clarify the significance of the process being improved in relation to the
organization’s mission and major business goals
28
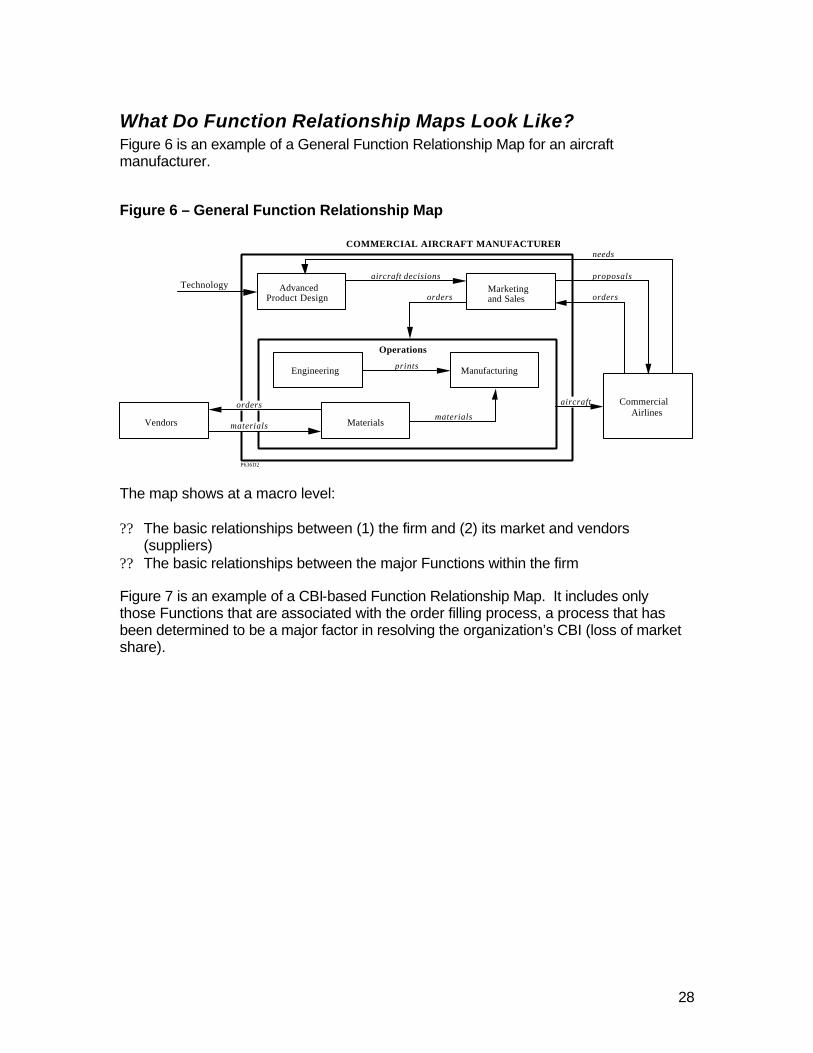
What Do Function Relationship Maps Look Like? Figure 6 is an example of a General Function Relationship Map for an aircraft manufacturer.
Figure 6 – General Function Relationship Map
The map shows at a macro level: ?? The basic relationships between (1) the firm and (2) its market and vendors
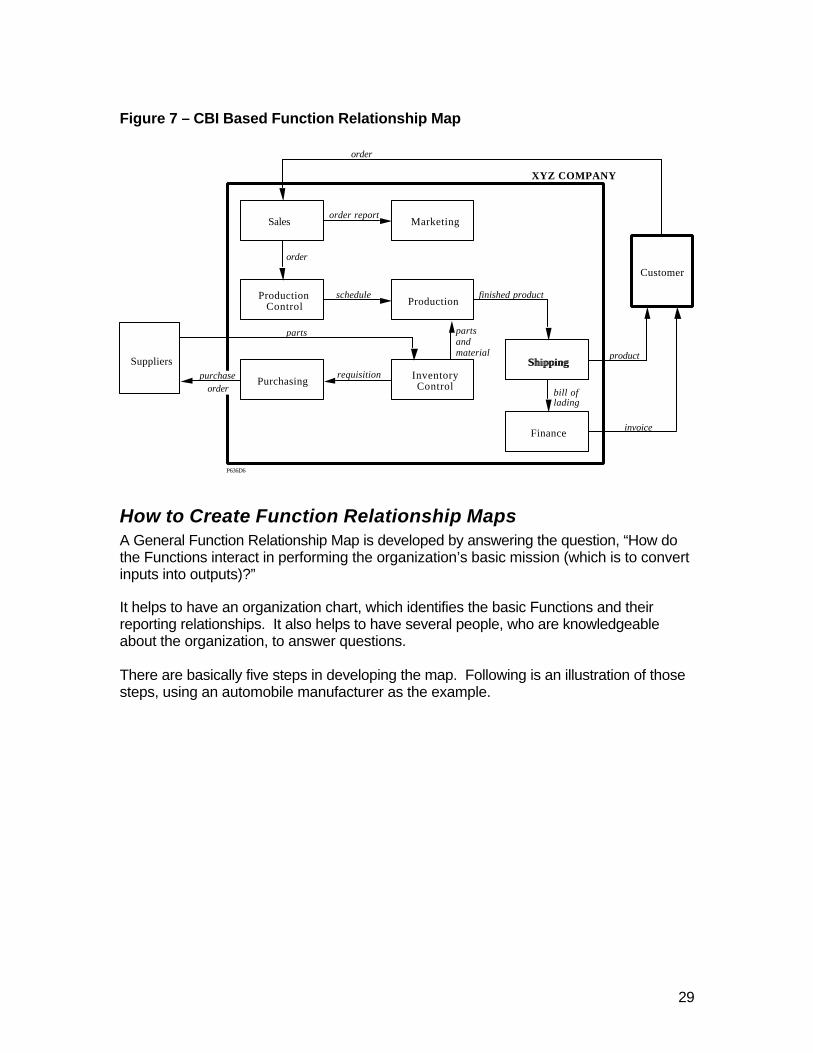
(suppliers) ?? The basic relationships between the major Functions within the firm Figure 7 is an example of a CBI-based Function Relationship Map. It includes only those Functions that are associated with the order filling process, a process that has been determined to be a major factor in resolving the organization’s CBI (loss of market share).
COMMERCIAL AIRCRAFT MANUFACTURER
P636D2
Technology
Vendors
aircraft decisionsMarketing and Sales
Engineering Manufacturing
Operations
prints
Materials
needs
orders
proposals
ordersAdvanced
Product Design
materials
Commercial Airlines
orders
materials
aircraft
29
Figure 7 – CBI Based Function Relationship Map
How to Create Function Relationship Maps A General Function Relationship Map is developed by answering the question, “How do the Functions interact in performing the organization’s basic mission (which is to convert inputs into outputs)?” It helps to have an organization chart, which identifies the basic Functions and their reporting relationships. It also helps to have several people, who are knowledgeable about the organization, to answer questions. There are basically five steps in developing the map. Following is an illustration of those steps, using an automobile manufacturer as the example.
XYZ COMPANY
P636D6
Suppliers
order reportMarketing
order
Sales
parts
purchase order
scheduleProductionProduction
Controlfinished product
requisition Inventory ControlPurchasing
parts and material
ShippingShipping
bill of lading
Finance
product
invoice
Customer
order
30
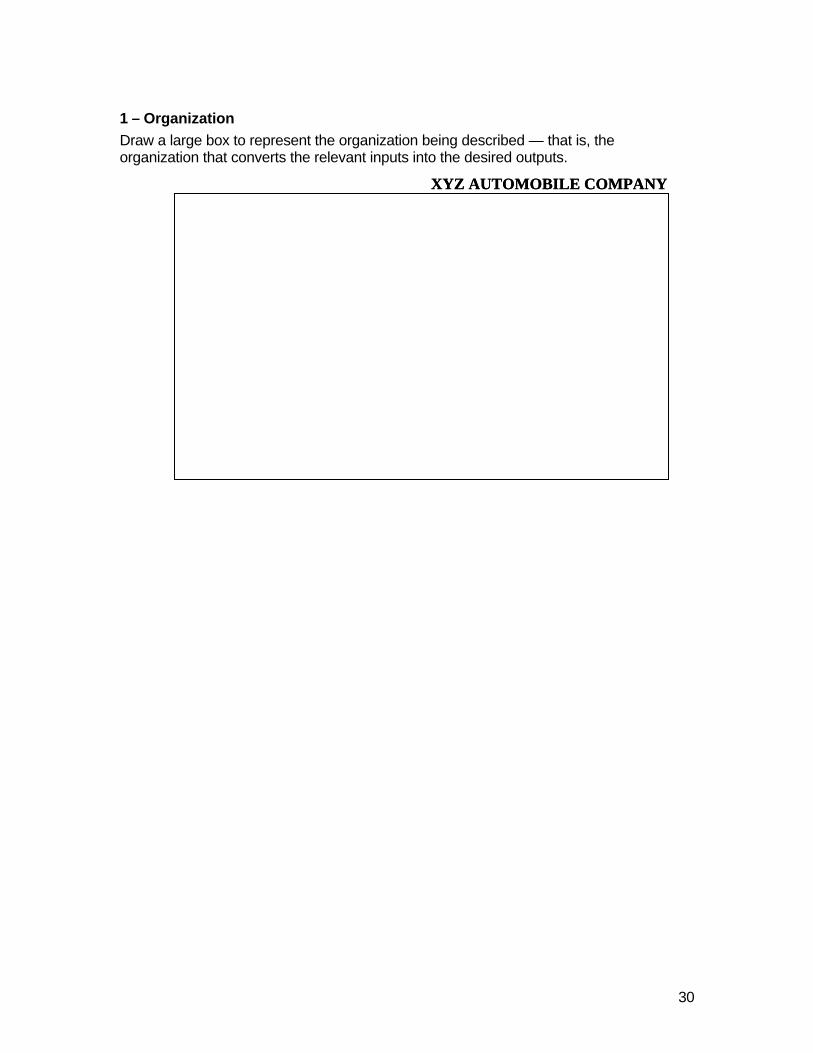
1 – Organization Draw a large box to represent the organization being described — that is, the organization that converts the relevant inputs into the desired outputs.
XYZ AUTOMOBILE COMPANYXYZ AUTOMOBILE COMPANY
31
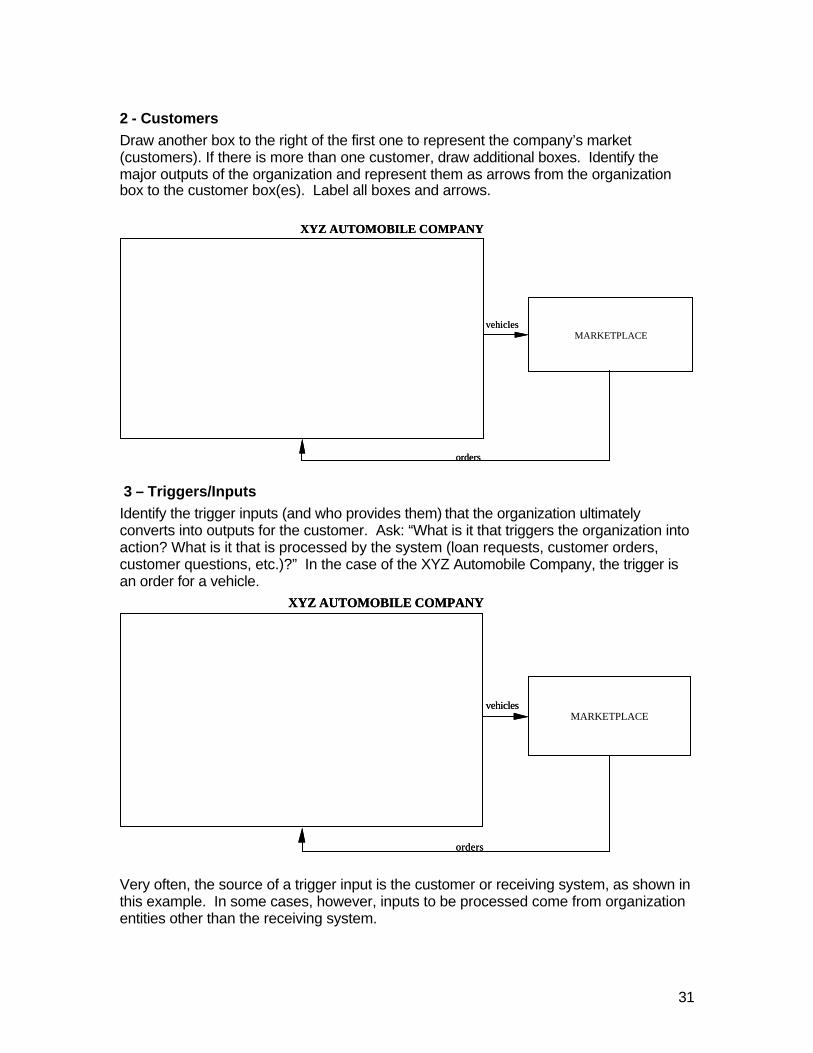
2 - Customers Draw another box to the right of the first one to represent the company’s market (customers). If there is more than one customer, draw additional boxes. Identify the major outputs of the organization and represent them as arrows from the organization box to the customer box(es). Label all boxes and arrows.
3 – Triggers/Inputs Identify the trigger inputs (and who provides them) that the organization ultimately converts into outputs for the customer. Ask: “What is it that triggers the organization into action? What is it that is processed by the system (loan requests, customer orders, customer questions, etc.)?” In the case of the XYZ Automobile Company, the trigger is an order for a vehicle.
Very often, the source of a trigger input is the customer or receiving system, as shown in this example. In some cases, however, inputs to be processed come from organization entities other than the receiving system.
MARKETPLACE
XYZ AUTOMOBILE COMPANY
vehicles
orders
MARKETPLACE
XYZ AUTOMOBILE COMPANY
vehicles
orders
MARKETPLACE
XYZ AUTOMOBILE COMPANY
vehicles
orders
MARKETPLACE
XYZ AUTOMOBILE COMPANY
vehicles
orders
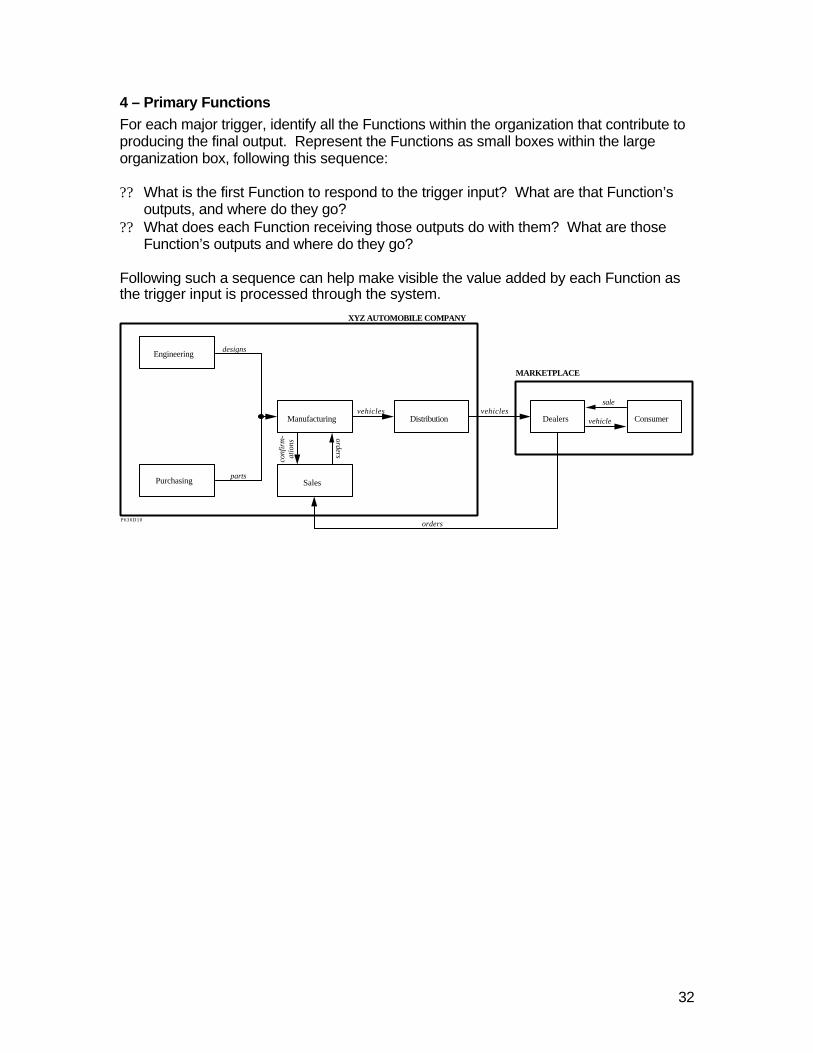
32
4 – Primary Functions For each major trigger, identify all the Functions within the organization that contribute to producing the final output. Represent the Functions as small boxes within the large organization box, following this sequence: ?? What is the first Function to respond to the trigger input? What are that Function’s
outputs, and where do they go? ?? What does each Function receiving those outputs do with them? What are those
Function’s outputs and where do they go? Following such a sequence can help make visible the value added by each Function as the trigger input is processed through the system.
XYZ AUTOMOBILE COMPANY
P636D10orders
designsEngineering
partsPurchasing
vehicles
orders
Manufacturing
Sales
Distribution
conf
irm
- at
ions
vehicles
MARKETPLACE
vehicleDealers Consumer
sale
33
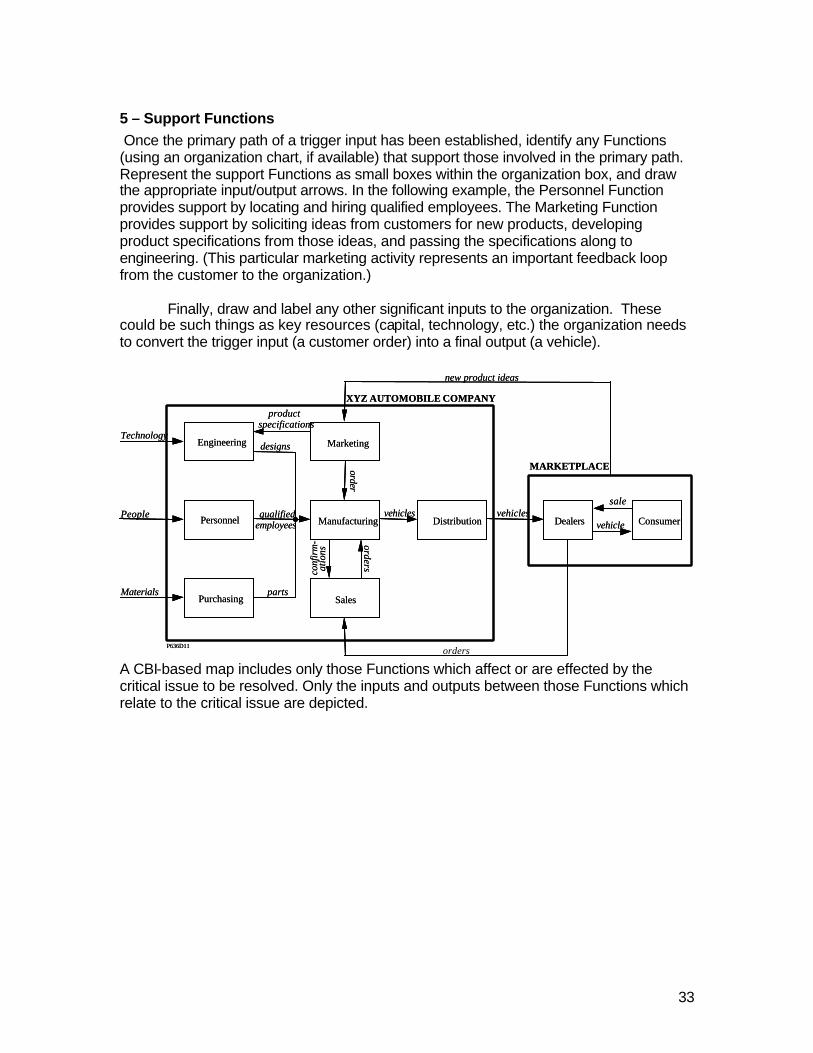
5 – Support Functions Once the primary path of a trigger input has been established, identify any Functions (using an organization chart, if available) that support those involved in the primary path. Represent the support Functions as small boxes within the organization box, and draw the appropriate input/output arrows. In the following example, the Personnel Function provides support by locating and hiring qualified employees. The Marketing Function provides support by soliciting ideas from customers for new products, developing product specifications from those ideas, and passing the specifications along to engineering. (This particular marketing activity represents an important feedback loop from the customer to the organization.) Finally, draw and label any other significant inputs to the organization. These could be such things as key resources (capital, technology, etc.) the organization needs to convert the trigger input (a customer order) into a final output (a vehicle).
A CBI-based map includes only those Functions which affect or are effected by the critical issue to be resolved. Only the inputs and outputs between those Functions which relate to the critical issue are depicted.
XYZ AUTOMOBILE COMPANY
P636D11 orders
new product ideas
designsEngineeringTechnology
qualified employeesPersonnelPeople
partsPurchasing
Materials
order
Marketing
vehicles
orders
Manufacturing
Sales
Distribution
product specifications
conf
irm
-at
ions
vehicles
MARKETPLACE
vehicleDealers Consumer
sale
34
Function Relationship Maps and the Pritchett Rummler-Brache Improvement Methodology Function Relationship Maps are particularly useful early in a project. Often they are developed prior to the Define phase during the planning that precedes project work. For example, among the deliverables of a Pritchett Rummler-Brache Performance Improvement Planning phase is one or more Function Relationship Maps. The maps are used in the Define phase to help scope the project and to identify who should be included on the Steering and Design Teams. They typically become reference documents to help with process mapping during the “Is” analysis phase of the project.
Summary Function Relationship Maps Function Relationship Maps are: • Relatively fast and easy to construct • Of value primarily for what is learned while constructing them. • A high-level view of the basic relationships in an organization
Closing
Pritchett Rummler-Brache Improvement Methodology Business maps are a valuable tool for understanding organizations and how they operate. Dr. Geary Rummler, author of Improving Performance: Managing the White Space on the Organizational Chart, summarized the inherent value of developing business maps with the simple phrase, “If you can’t draw it, you don’t understand it.” Pritchett Rummler-Brache has developed a methodology that has been used with equal success for radical redesign or for incremental improvement. It is a set of tools that can be applied to solve a broad range of problems and challenges. It is a model that people in any type of organization or any function within the organization can readily grasp, because it reflects the way work actually gets done and the way change is carried out. Whether the critical need is to increase market share, reduce cycle time, eliminate inefficiency or boost productivity, the solutions lie in improving performance. Our solutions begin with understanding and depicting where you are and where you want to go.
Additional Material Business Maps 1.0 is a sample of several tools employed by the Pritchett Rummler-Brache Improvement Methodology. To learn more about our tools and methodologies visit our website at http://www.pritchettnet.com/ or speak with one of our professionals at 1-800-992-5922.