Embed Size (px)
Citation preview
SERVICIO DE ESTUDIOS DEL BANCO DE ESPAÑA
DEPARTAMENTO DE COYUNTURA Y PREVISIÓN ECONÓMICA
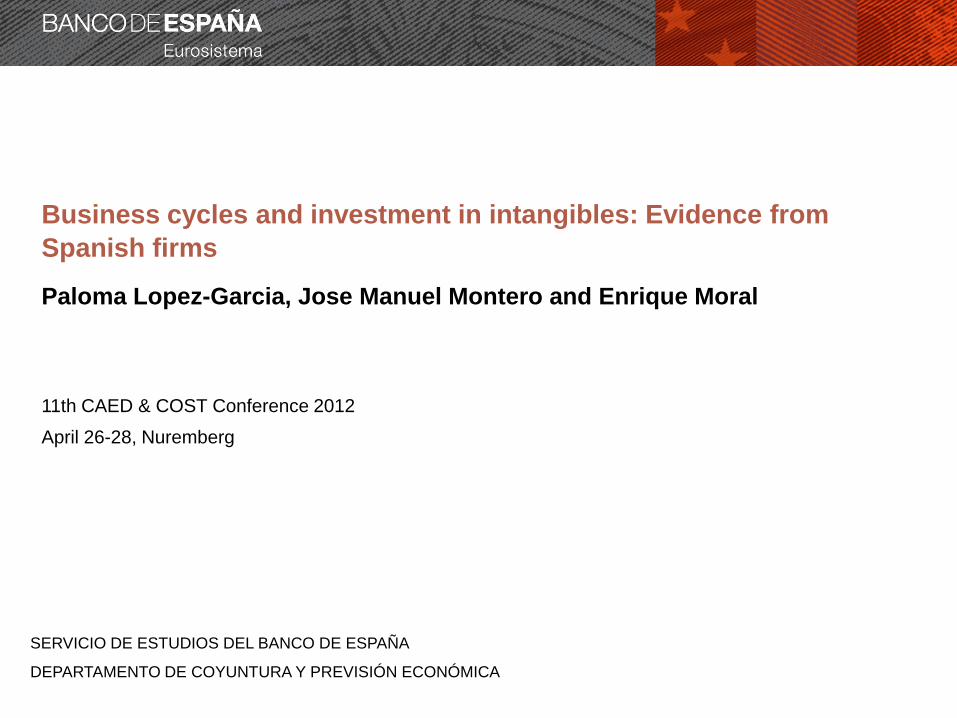
Business cycles and investment in intangibles: Evidence from
Spanish firms
Paloma Lopez-Garcia, Jose Manuel Montero and Enrique Moral
11th CAED & COST Conference 2012
April 26-28, Nuremberg
Departamento de Coyuntura y Previsión Económica 2
Content
1. Motivation
2. Data
3. Empirical results
4. Complementarity/substatibility of factors of production
5. Conclusions
Departamento de Coyuntura y Previsión Económica 3
Motivation
Business cycles and long-run growth
We start having a painful idea of the short-term consequences of the
current crisis; but what about its long-term impact?
For a very long time, cycles and long-run growth were seen as independent
phenomena
– Long-run growth depended on some exogenous technology growth whereas
short-term cycles were determined by demand shocks
The RBC theory and, above all, Romer’s endogenous growth theory at the
beginning of the 90s changed radically this dichotomy
– Technology growth depends on the optimal decision of agents on human
accumulation and R&D investment
– Those optimal decisions can be affected by the moment of the cycle…
Departamento de Coyuntura y Previsión Económica 4
Motivation
Business cycles and long-term growth (II)
There are several ways cycles can affect long-term growth
– Learning-by-doing (Arrow 1962): people have ideas on how to improve
production efficiency when they are producing
– Reallocation of resources:
• Creative destruction (Schumpeter 1934, Caballero and Hammour 1994):
Recessions have a cleansing effect (shift of productive resources across
production units)
• Opportunity-cost theory (Bean 1990, Hall 1990, Gali & Hammour 1993):
The forgone cost of investing in Productive-Enhancing Activities (PEA)
decreases during recessions, whereas its benefit is spread along time
Hence it is optimal to devote more of the limited resources to those PEA in
crisis, which would have a positive impact on long-run productivity growth
Empirical studies (VAR approach) testing for the impact of cycles on TFP
growth seem to support this theory
Departamento de Coyuntura y Previsión Económica 5
Motivation
Which Productive-Enhancing Activities?
Research and Development (R&D) is the most obvious productive-
enhancing activity of a firm
A pile of papers have been devoted to explore the cyclicality of R&D
– But most of them find a positive relation with the cycle!! –also in Spain
Why?
– Barlevy (2007): Existence of R&D spillovers
– Ouyang (2011): Aggregation bias
– Aghion et al (2005, 2007): Credit constraints
• The opportunity cost argument works when firms can borrow enough
funds to invest in R&D or reorganize activities
• With credit markets imperfections, firms are deterred from reorganizing
and investing in R&D, even if it optimal for them
• R&D can turn procyclical
Departamento de Coyuntura y Previsión Económica 6
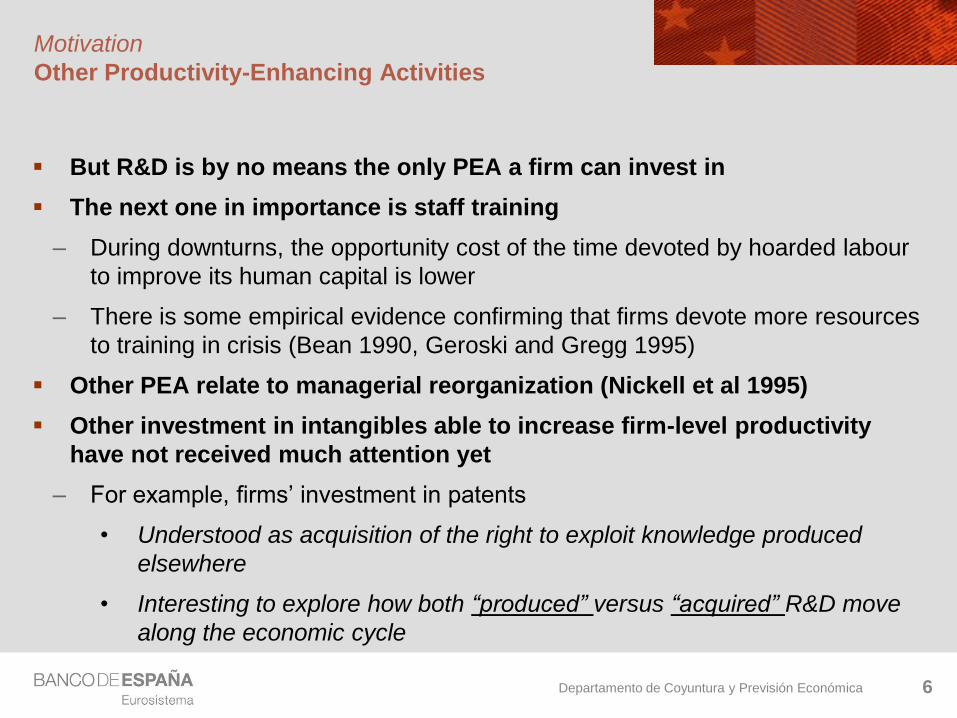
Motivation
Other Productivity-Enhancing Activities
But R&D is by no means the only PEA a firm can invest in
The next one in importance is staff training
– During downturns, the opportunity cost of the time devoted by hoarded labour
to improve its human capital is lower
– There is some empirical evidence confirming that firms devote more resources
to training in crisis (Bean 1990, Geroski and Gregg 1995)
Other PEA relate to managerial reorganization (Nickell et al 1995)
Other investment in intangibles able to increase firm-level productivity
have not received much attention yet
– For example, firms’ investment in patents
• Understood as acquisition of the right to exploit knowledge produced
elsewhere
• Interesting to explore how both “produced” versus “acquired” R&D move
along the economic cycle

Departamento de Coyuntura y Previsión Económica 7
Motivation
Our contribution
This paper contributes to the literature on cycles and long-term growth in
several ways:
1. It tests the opportunity-cost theory for Spain using firm-level data for the
period 1991-2010
2. As in Aghion et al (2005, 2007), it allows the impact of the cycle to differ for
credit constrained and unconstrained firms
– For that purpose, we construct a direct indicator of firm’s financial
obstacles from the survey information provided by PITEC
3. It looks at the investment devoted to R&D along the cycle by firms, but also at
other PEA:
– Training spending
– Purchase of patents
4. It studies the complementarity/substitution pattern of different production
inputs
– It pays special attention to different investment in intangibles
Departamento de Coyuntura y Previsión Económica 8
Content
1. Motivation
2. Data
3. Empirical results
4. Complementarity/substatibility of factors of production
5. Conclusions
Departamento de Coyuntura y Previsión Económica 9
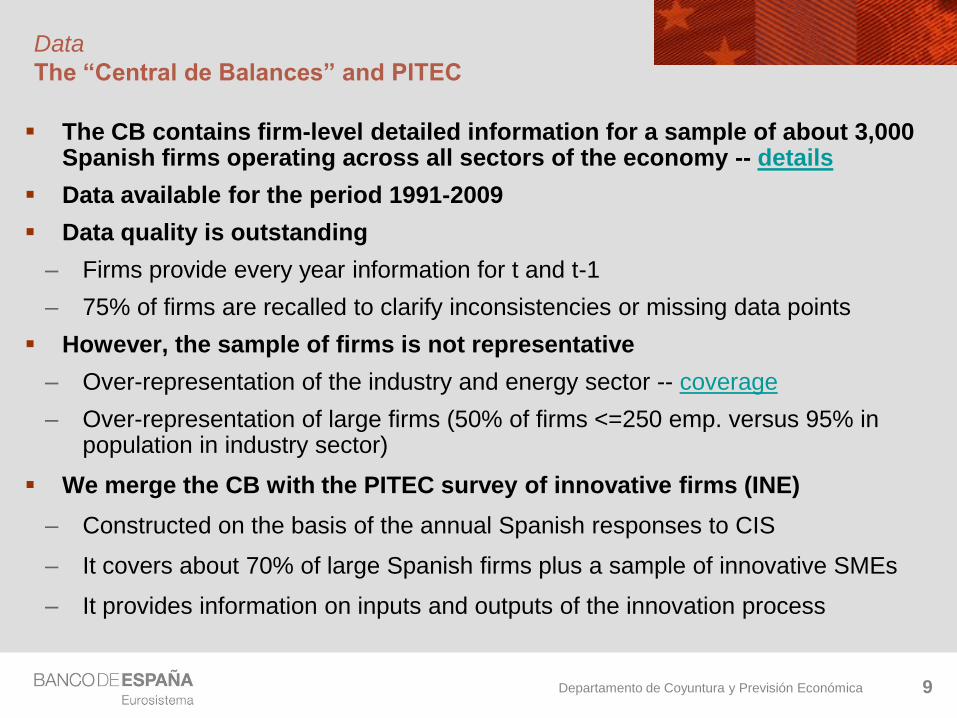
Data
The “Central de Balances” and PITEC
The CB contains firm-level detailed information for a sample of about 3,000 Spanish firms operating across all sectors of the economy -- details
Data available for the period 1991-2009
Data quality is outstanding
– Firms provide every year information for t and t-1
– 75% of firms are recalled to clarify inconsistencies or missing data points
However, the sample of firms is not representative
– Over-representation of the industry and energy sector -- coverage
– Over-representation of large firms (50% of firms <=250 emp. versus 95% in population in industry sector)
We merge the CB with the PITEC survey of innovative firms (INE)
– Constructed on the basis of the annual Spanish responses to CIS
– It covers about 70% of large Spanish firms plus a sample of innovative SMEs
– It provides information on inputs and outputs of the innovation process
Departamento de Coyuntura y Previsión Económica 10
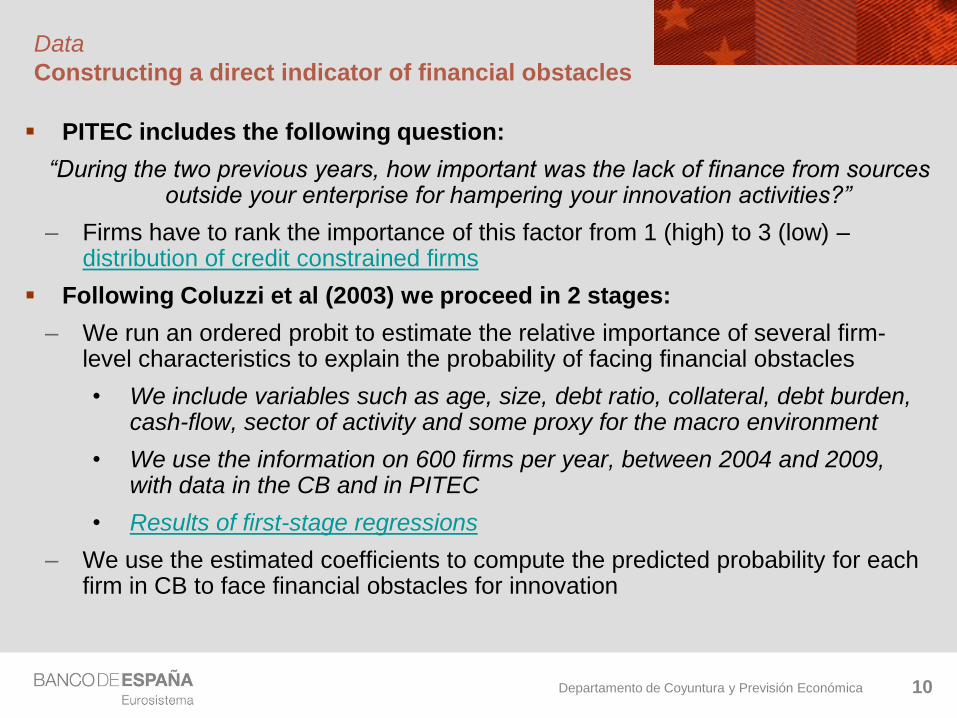
Data
Constructing a direct indicator of financial obstacles
PITEC includes the following question:
“During the two previous years, how important was the lack of finance from sources outside your enterprise for hampering your innovation activities?”
– Firms have to rank the importance of this factor from 1 (high) to 3 (low) – distribution of credit constrained firms
Following Coluzzi et al (2003) we proceed in 2 stages:
– We run an ordered probit to estimate the relative importance of several firm-level characteristics to explain the probability of facing financial obstacles
• We include variables such as age, size, debt ratio, collateral, debt burden, cash-flow, sector of activity and some proxy for the macro environment
• We use the information on 600 firms per year, between 2004 and 2009, with data in the CB and in PITEC
• Results of first-stage regressions
– We use the estimated coefficients to compute the predicted probability for each firm in CB to face financial obstacles for innovation

Departamento de Coyuntura y Previsión Económica 11
Content
1. Motivation
2. Data
3. Empirical results
4. Complementarity/substatibility of factors of production
5. Conclusions
Departamento de Coyuntura y Previsión Económica 12
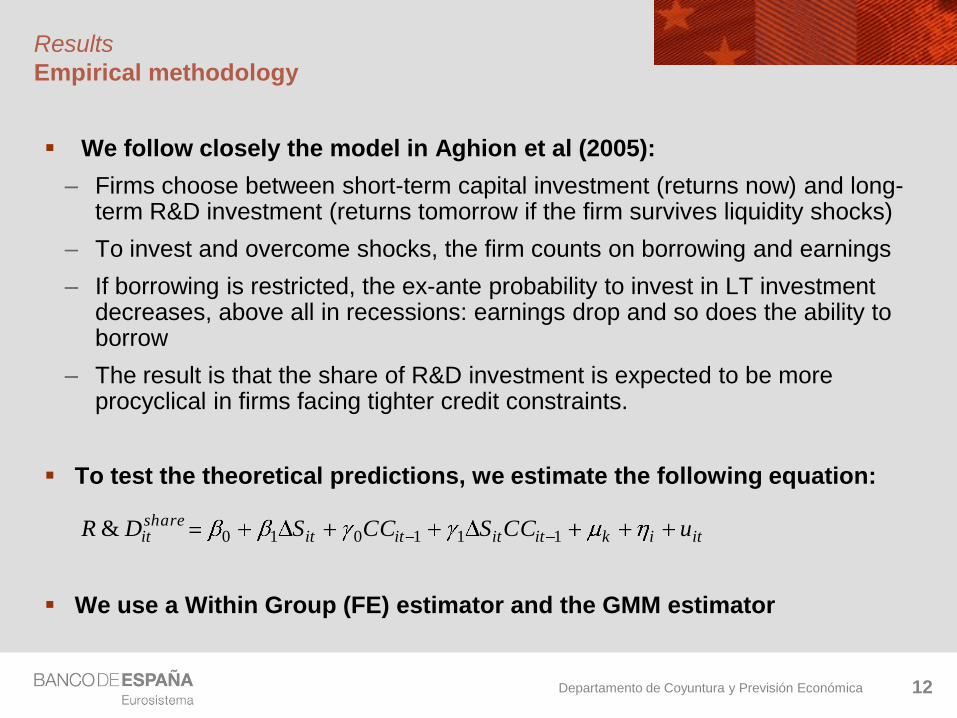
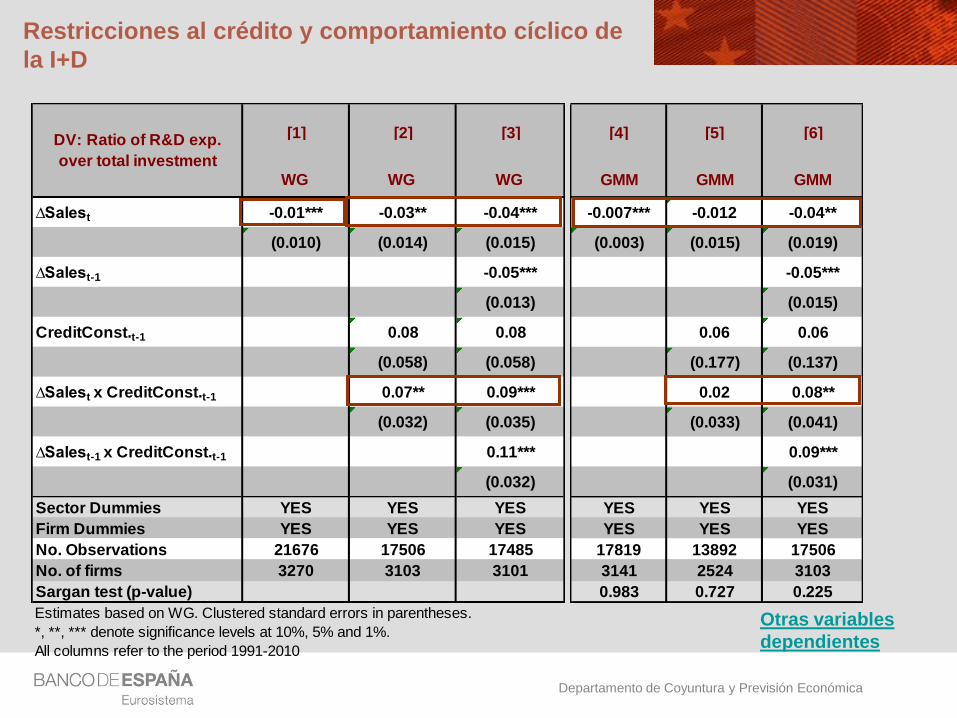
Results
Empirical methodology
We follow closely the model in Aghion et al (2005):
– Firms choose between short-term capital investment (returns now) and long-term R&D investment (returns tomorrow if the firm survives liquidity shocks)
– To invest and overcome shocks, the firm counts on borrowing and earnings
– If borrowing is restricted, the ex-ante probability to invest in LT investment decreases, above all in recessions: earnings drop and so does the ability to borrow
– The result is that the share of R&D investment is expected to be more procyclical in firms facing tighter credit constraints.
To test the theoretical predictions, we estimate the following equation:
We use a Within Group (FE) estimator and the GMM estimator
itikititititshareit uCCSCCSDR 111010&
Departamento de Coyuntura y Previsión Económica
Restricciones al crédito y comportamiento cíclico de
la I+D
Otras variables
dependientes
[1] [2] [3]
WG WG WG
∆Salest -0.01*** -0.03** -0.04***
(0.010) (0.014) (0.015)
∆Salest-1 -0.05***
(0.013)
CreditConst.t-1 0.08 0.08
(0.058) (0.058)
∆Salest x CreditConst.t-1 0.07** 0.09***
(0.032) (0.035)
∆Salest-1 x CreditConst.t-1 0.11***
(0.032)
Sector Dummies YES YES YES
Firm Dummies YES YES YES
No. Observations 21676 17506 17485
No. of firms 3270 3103 3101
Sargan test (p-value)
Estimates based on WG. Clustered standard errors in parentheses.
*, **, *** denote significance levels at 10%, 5% and 1%.
All columns refer to the period 1991-2010
DV: Ratio of R&D exp.
over total investment
[4] [5] [6]
GMM GMM GMM
-0.007*** -0.012 -0.04**
(0.003) (0.015) (0.019)
-0.05***
(0.015)
0.06 0.06
(0.177) (0.137)
0.02 0.08**
(0.033) (0.041)
0.09***
(0.031)
YES YES YES
YES YES YES
17819 13892 17506
3141 2524 3103
0.983 0.727 0.225
Departamento de Coyuntura y Previsión Económica
Otros intangibles
[1] [2]
∆Salest -0.001** -0.002*
(0.000) (0.001)
∆Salest-1 -0.00 -0.00
(0.000) (0.001)
CreditConst.t-1 -0.01
(0.001)
∆Salest x CreditConst.t-1 0.004
(0.002)
∆Salest-1 x CreditConst.t-1 0.001
(0.001)
Sector Dummies YES YES
Firm Dummies YES YES
No. Observations 15847 15528
No. of firms 2919 2877
Estimates based on WG. Clustered standard errors in parentheses.
*, **, *** denote significance levels at 10%, 5% and 1%.
Training expenditures/
salesDep. variable:
[3] [4] [5] [6]
-0.057*** -0.147*** -0.023 -0.034
(0.018) (0.051) (0.017) (0.042)
-0.027 -0.133*** -0.02 0.003
(0.018) (0.048) (0.015) (0.042)
0.158 0.187
(0.211) (0.193)
0.279** 0.023
(0.132) (0.115)
0.321*** -0.068
(0.120) (0.101)
YES YES YES YES
YES YES YES YES
9105 8934 9105 8934
2130 2101 2130 2101
2001-2009
R&D investment and IT
applications
Patent rights, licenses, and
others
Departamento de Coyuntura y Previsión Económica 15
Content
1. Motivation
2. Data
3. Empirical results
4. Complementarity/substatibility of factors of production
5. Conclusions
Departamento de Coyuntura y Previsión Económica 16
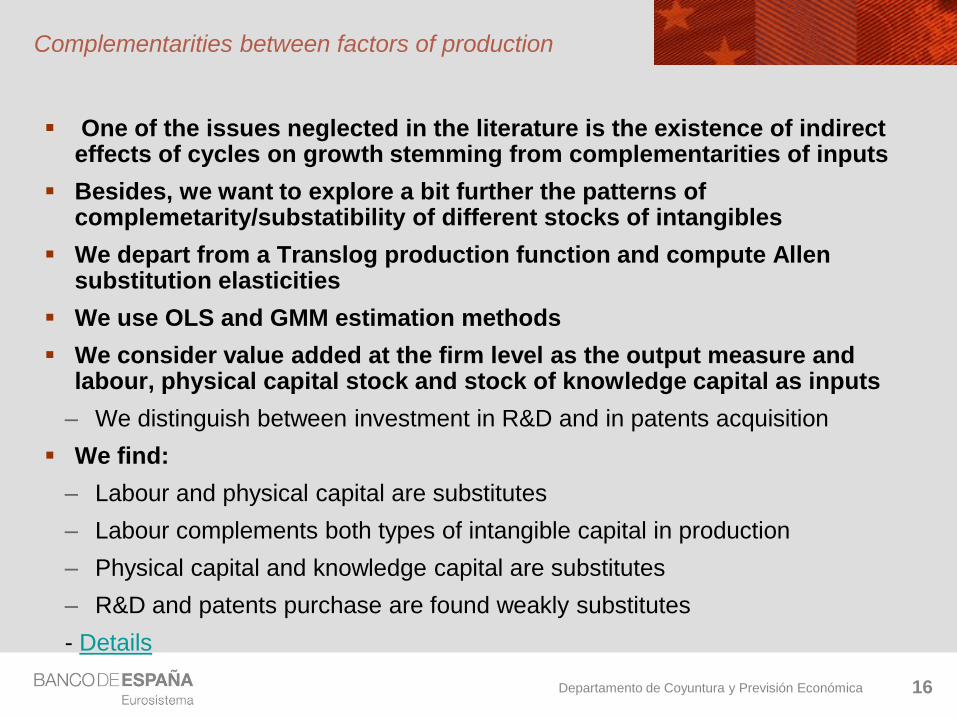
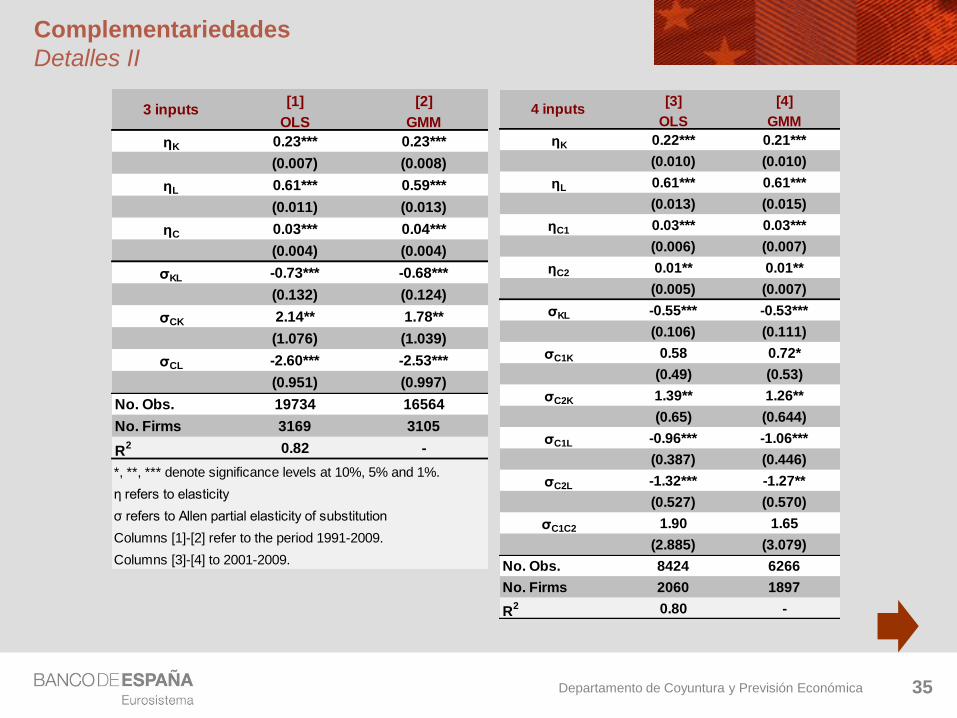
Complementarities between factors of production
One of the issues neglected in the literature is the existence of indirect effects of cycles on growth stemming from complementarities of inputs
Besides, we want to explore a bit further the patterns of complemetarity/substatibility of different stocks of intangibles
We depart from a Translog production function and compute Allen substitution elasticities
We use OLS and GMM estimation methods
We consider value added at the firm level as the output measure and labour, physical capital stock and stock of knowledge capital as inputs
– We distinguish between investment in R&D and in patents acquisition
We find:
– Labour and physical capital are substitutes
– Labour complements both types of intangible capital in production
– Physical capital and knowledge capital are substitutes
– R&D and patents purchase are found weakly substitutes
- Details
Departamento de Coyuntura y Previsión Económica 17
Content
1. Motivation
2. Data
3. Empirical results
4. Complementarity/substatibility of factors of production
5. Conclusions
Departamento de Coyuntura y Previsión Económica
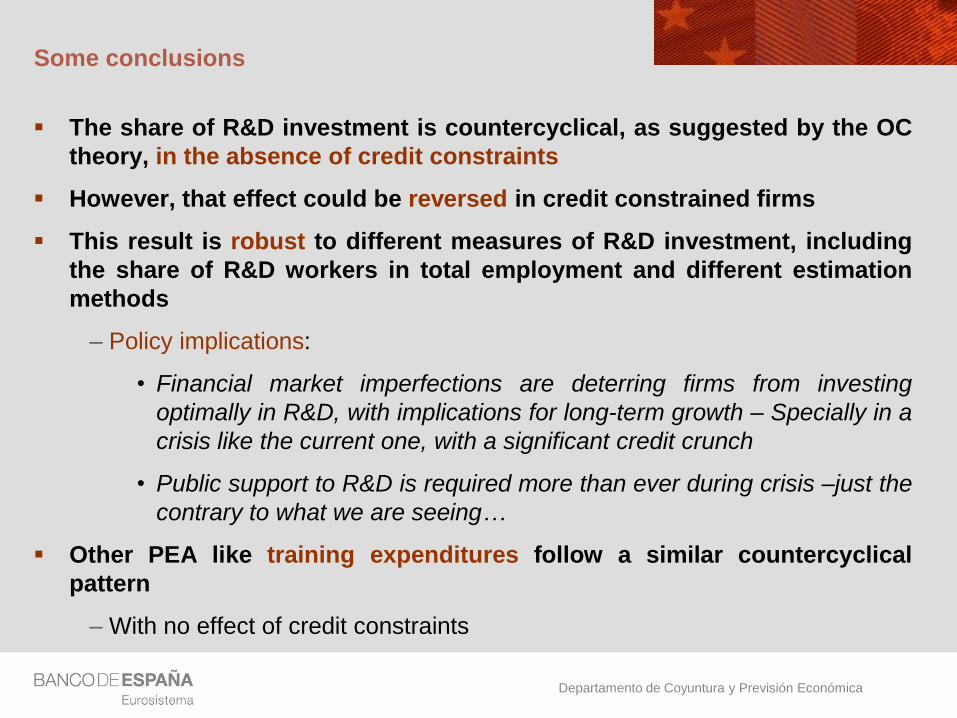
Some conclusions
The share of R&D investment is countercyclical, as suggested by the OC
theory, in the absence of credit constraints
However, that effect could be reversed in credit constrained firms
This result is robust to different measures of R&D investment, including
the share of R&D workers in total employment and different estimation
methods
– Policy implications:
• Financial market imperfections are deterring firms from investing
optimally in R&D, with implications for long-term growth – Specially in a
crisis like the current one, with a significant credit crunch
• Public support to R&D is required more than ever during crisis –just the
contrary to what we are seeing…
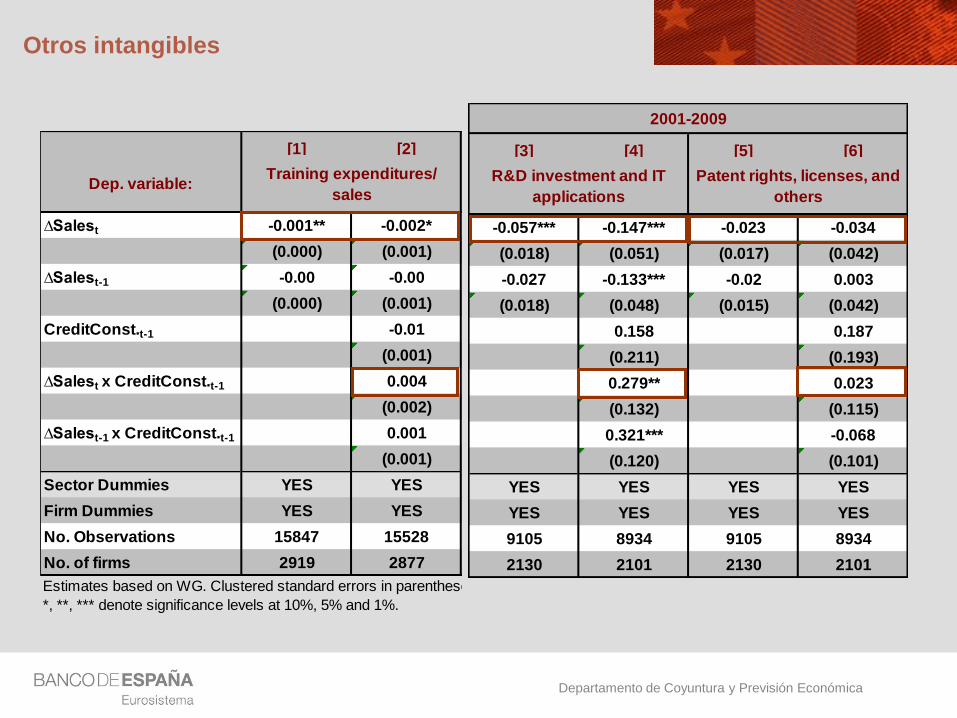
Other PEA like training expenditures follow a similar countercyclical
pattern
– With no effect of credit constraints
Departamento de Coyuntura y Previsión Económica
Some conclusions
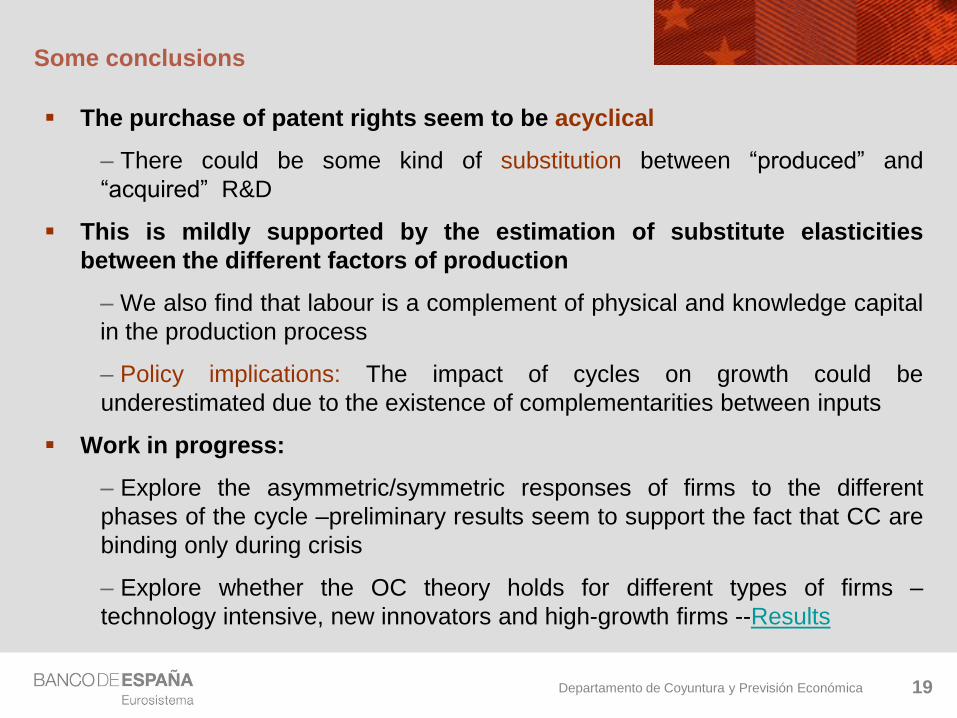
The purchase of patent rights seem to be acyclical
– There could be some kind of substitution between “produced” and
“acquired” R&D
This is mildly supported by the estimation of substitute elasticities
between the different factors of production
– We also find that labour is a complement of physical and knowledge capital
in the production process
– Policy implications: The impact of cycles on growth could be
underestimated due to the existence of complementarities between inputs
Work in progress:
– Explore the asymmetric/symmetric responses of firms to the different
phases of the cycle –preliminary results seem to support the fact that CC are
binding only during crisis
– Explore whether the OC theory holds for different types of firms –
technology intensive, new innovators and high-growth firms --Results
19

Departamento de Coyuntura y Previsión Económica
Y se acabó…
GRACIAS POR VUESTRA ATENCIÓN!!!!!!!!!!
20
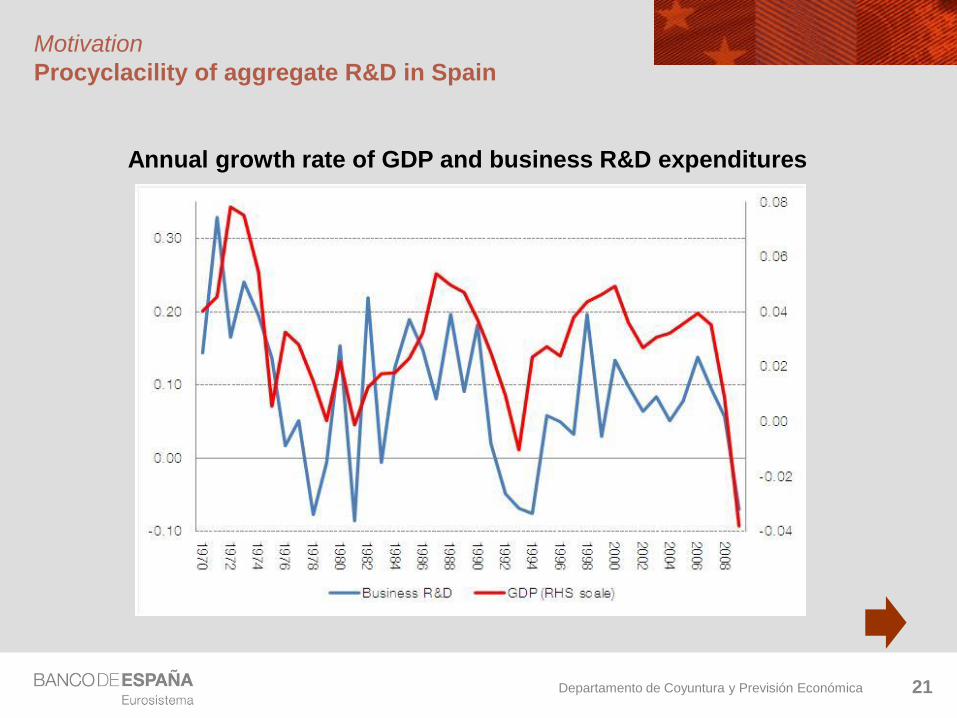
Departamento de Coyuntura y Previsión Económica 21
Motivation
Procyclacility of aggregate R&D in Spain
Annual growth rate of GDP and business R&D expenditures
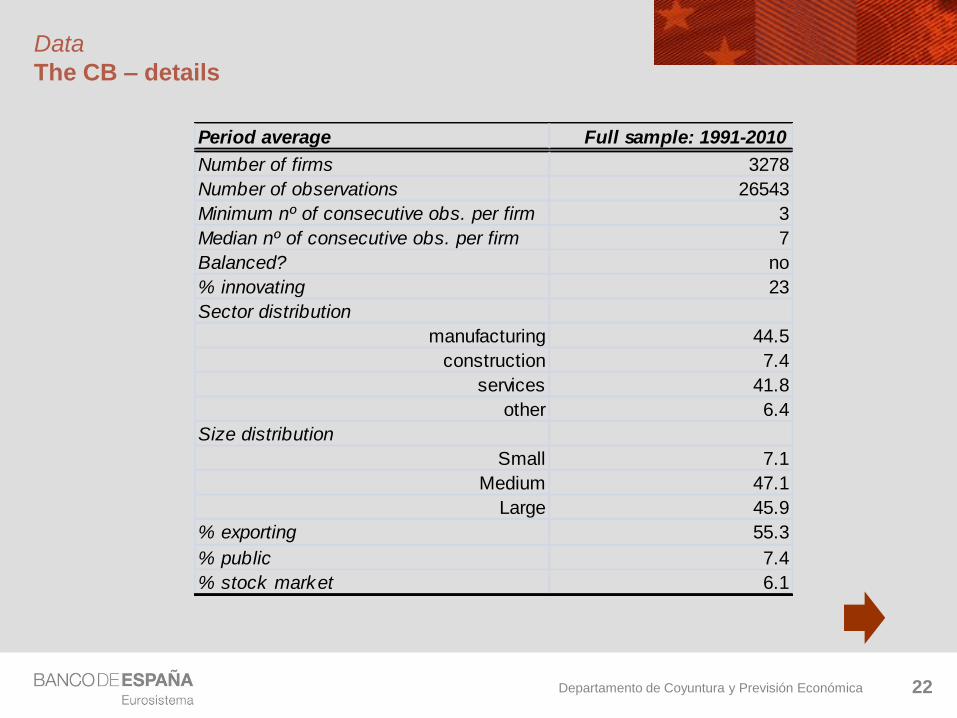
Departamento de Coyuntura y Previsión Económica 22
Data
The CB – details
Period average Full sample: 1991-2010
Number of firms 3278
Number of observations 26543
Minimum nº of consecutive obs. per firm 3
Median nº of consecutive obs. per firm 7
Balanced? no
% innovating 23
Sector distribution
manufacturing 44.5
construction 7.4
services 41.8
other 6.4
Size distribution
Small 7.1
Medium 47.1
Large 45.9
% exporting 55.3
% public 7.4
% stock market 6.1
Departamento de Coyuntura y Previsión Económica 23
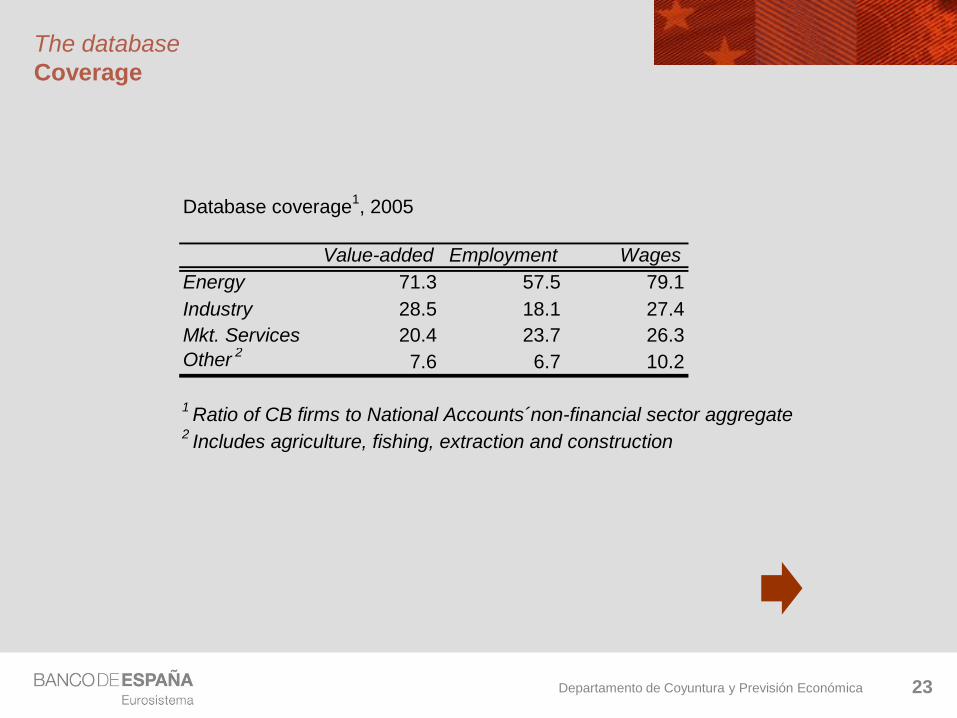
The database
Coverage
Database coverage1, 2005
Value-added Employment Wages
Energy 71.3 57.5 79.1
Industry 28.5 18.1 27.4
Mkt. Services 20.4 23.7 26.3
Other2
7.6 6.7 10.2
1Ratio of CB firms to National Accounts´non-financial sector aggregate
2Includes agriculture, fishing, extraction and construction
Departamento de Coyuntura y Previsión Económica 24
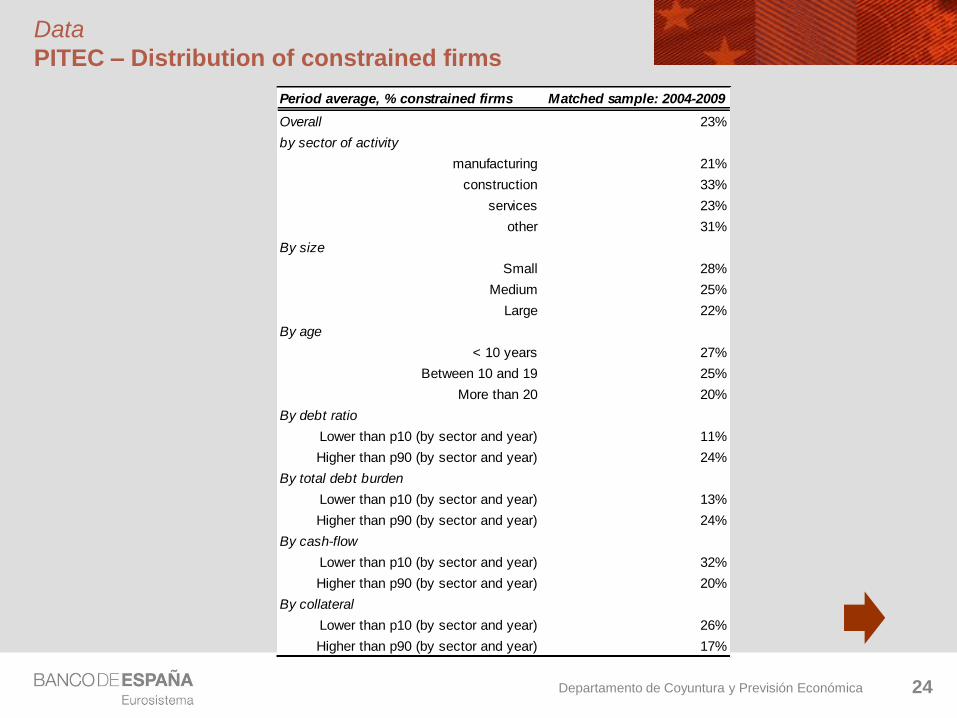
Data
PITEC – Distribution of constrained firms
Period average, % constrained firms Matched sample: 2004-2009
Overall 23%
by sector of activity
manufacturing 21%
construction 33%
services 23%
other 31%
By size
Small 28%
Medium 25%
Large 22%
By age
< 10 years 27%
Between 10 and 19 25%
More than 20 20%
By debt ratio
Lower than p10 (by sector and year) 11%
Higher than p90 (by sector and year) 24%
By total debt burden
Lower than p10 (by sector and year) 13%
Higher than p90 (by sector and year) 24%
By cash-flow
Lower than p10 (by sector and year) 32%
Higher than p90 (by sector and year) 20%
By collateral
Lower than p10 (by sector and year) 26%
Higher than p90 (by sector and year) 17%
Departamento de Coyuntura y Previsión Económica 25
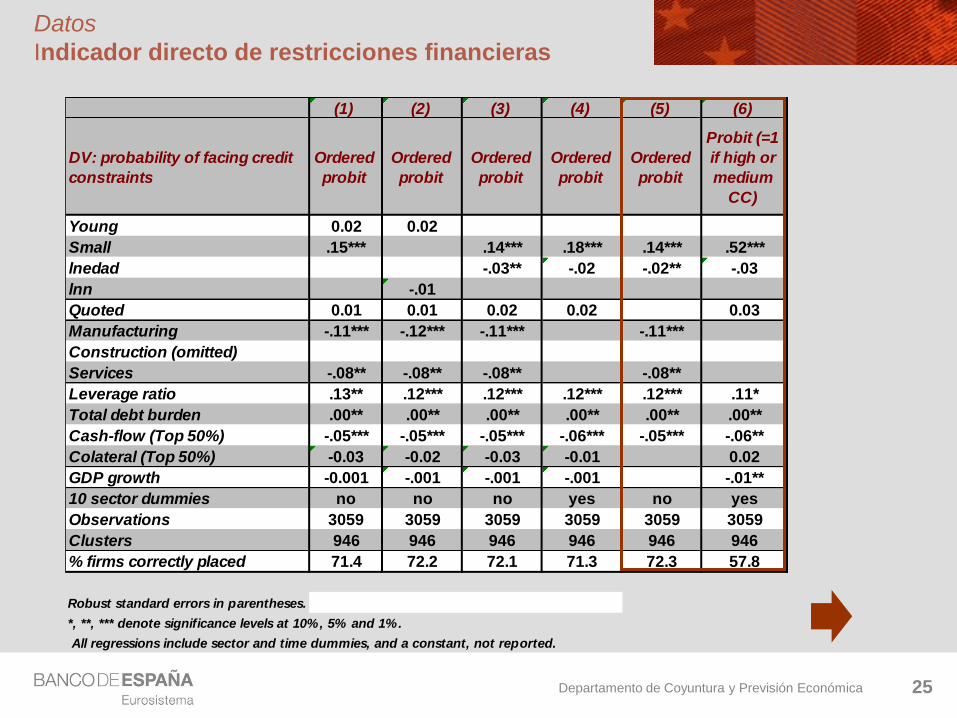
Datos
Indicador directo de restricciones financieras
(1) (2) (3) (4) (5) (6)
DV: probability of facing credit
constraints
Ordered
probit
Ordered
probit
Ordered
probit
Ordered
probit
Ordered
probit
Probit (=1
if high or
medium
CC)
Young 0.02 0.02
Small .15*** .14*** .18*** .14*** .52***
lnedad -.03** -.02 -.02** -.03
lnn -.01
Quoted 0.01 0.01 0.02 0.02 0.03
Manufacturing -.11*** -.12*** -.11*** -.11***
Construction (omitted)
Services -.08** -.08** -.08** -.08**
Leverage ratio .13** .12*** .12*** .12*** .12*** .11*
Total debt burden .00** .00** .00** .00** .00** .00**
Cash-flow (Top 50%) -.05*** -.05*** -.05*** -.06*** -.05*** -.06**
Colateral (Top 50%) -0.03 -0.02 -0.03 -0.01 0.02
GDP growth -0.001 -.001 -.001 -.001 -.01**
10 sector dummies no no no yes no yes
Observations 3059 3059 3059 3059 3059 3059
Clusters 946 946 946 946 946 946
% firms correctly placed 71.4 72.2 72.1 71.3 72.3 57.8
Robust standard errors in parentheses.
*, **, *** denote significance levels at 10%, 5% and 1%.
All regressions include sector and time dummies, and a constant, not reported.
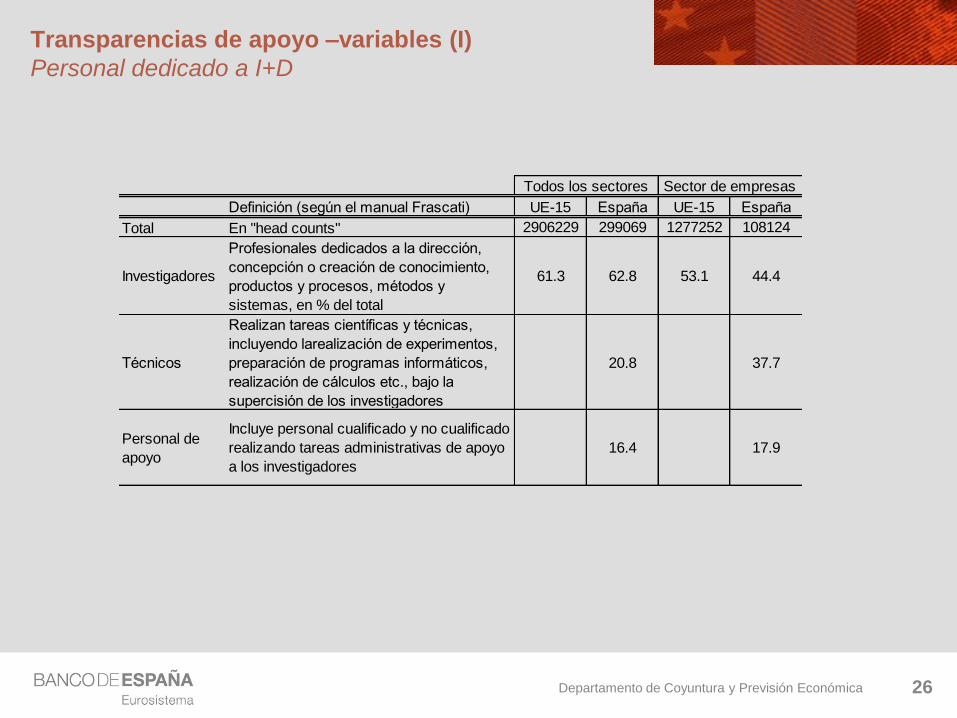
Departamento de Coyuntura y Previsión Económica 26
Definición (según el manual Frascati) UE-15 España UE-15 España
Total En "head counts" 2906229 299069 1277252 108124
Investigadores
Profesionales dedicados a la dirección,
concepción o creación de conocimiento,
productos y procesos, métodos y
sistemas, en % del total
61.3 62.8 53.1 44.4
Técnicos
Realizan tareas científicas y técnicas,
incluyendo larealización de experimentos,
preparación de programas informáticos,
realización de cálculos etc., bajo la
supercisión de los investigadores
20.8 37.7
Personal de
apoyo
Incluye personal cualificado y no cualificado
realizando tareas administrativas de apoyo
a los investigadores
16.4 17.9
Todos los sectores Sector de empresas
Transparencias de apoyo –variables (I)
Personal dedicado a I+D
Departamento de Coyuntura y Previsión Económica 27
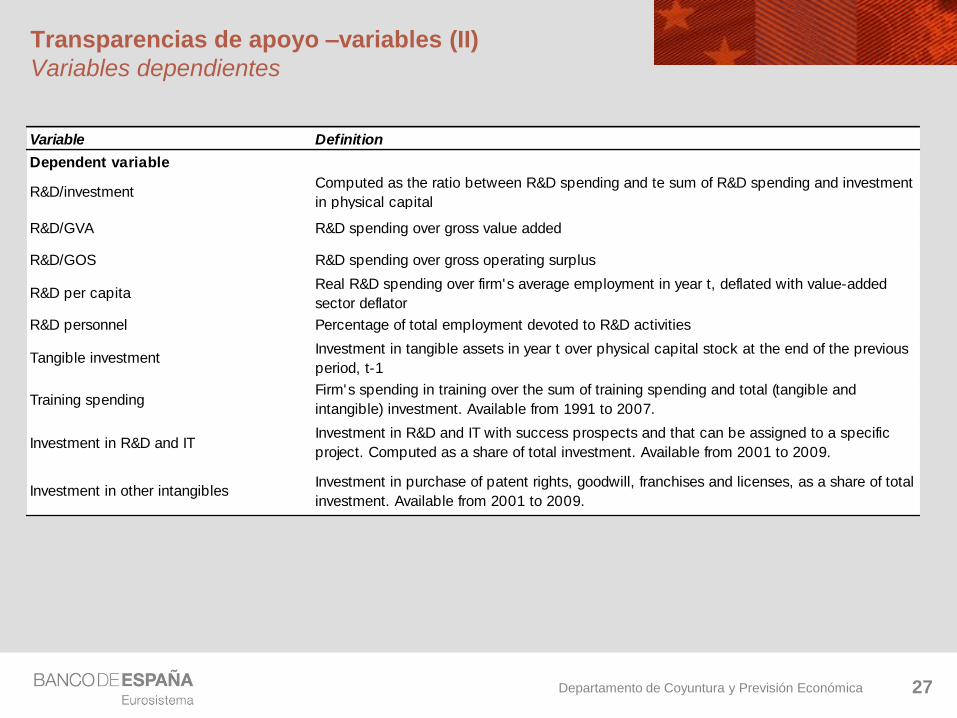
Transparencias de apoyo –variables (II)
Variables dependientes
Variable Definition
Dependent variable
R&D/investmentComputed as the ratio between R&D spending and te sum of R&D spending and investment
in physical capital
R&D/GVA R&D spending over gross value added
R&D/GOS R&D spending over gross operating surplus
R&D per capitaReal R&D spending over firm's average employment in year t, deflated with value-added
sector deflator
R&D personnel Percentage of total employment devoted to R&D activities
Tangible investmentInvestment in tangible assets in year t over physical capital stock at the end of the previous
period, t-1
Training spendingFirm's spending in training over the sum of training spending and total (tangible and
intangible) investment. Available from 1991 to 2007.
Investment in R&D and ITInvestment in R&D and IT with success prospects and that can be assigned to a specific
project. Computed as a share of total investment. Available from 2001 to 2009.
Investment in other intangiblesInvestment in purchase of patent rights, goodwill, franchises and licenses, as a share of total
investment. Available from 2001 to 2009.
Departamento de Coyuntura y Previsión Económica 28
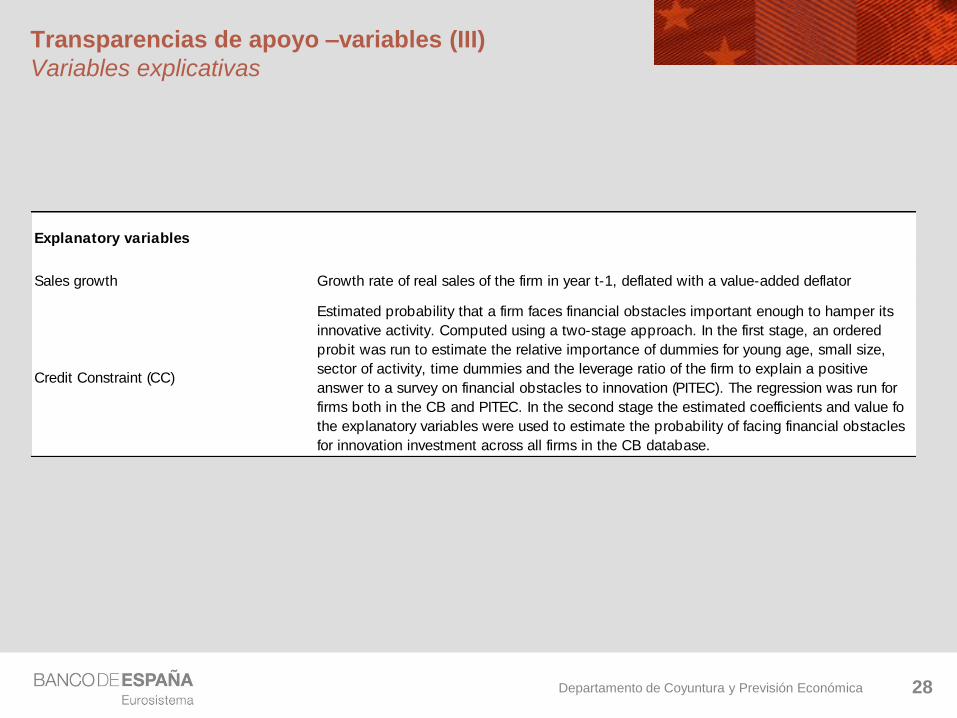
Transparencias de apoyo –variables (III)
Variables explicativas
Explanatory variables
Sales growth Growth rate of real sales of the firm in year t-1, deflated with a value-added deflator
Credit Constraint (CC)
Estimated probability that a firm faces financial obstacles important enough to hamper its
innovative activity. Computed using a two-stage approach. In the first stage, an ordered
probit was run to estimate the relative importance of dummies for young age, small size,
sector of activity, time dummies and the leverage ratio of the firm to explain a positive
answer to a survey on financial obstacles to innovation (PITEC). The regression was run for
firms both in the CB and PITEC. In the second stage the estimated coefficients and value fo
the explanatory variables were used to estimate the probability of facing financial obstacles
for innovation investment across all firms in the CB database.
Departamento de Coyuntura y Previsión Económica 29
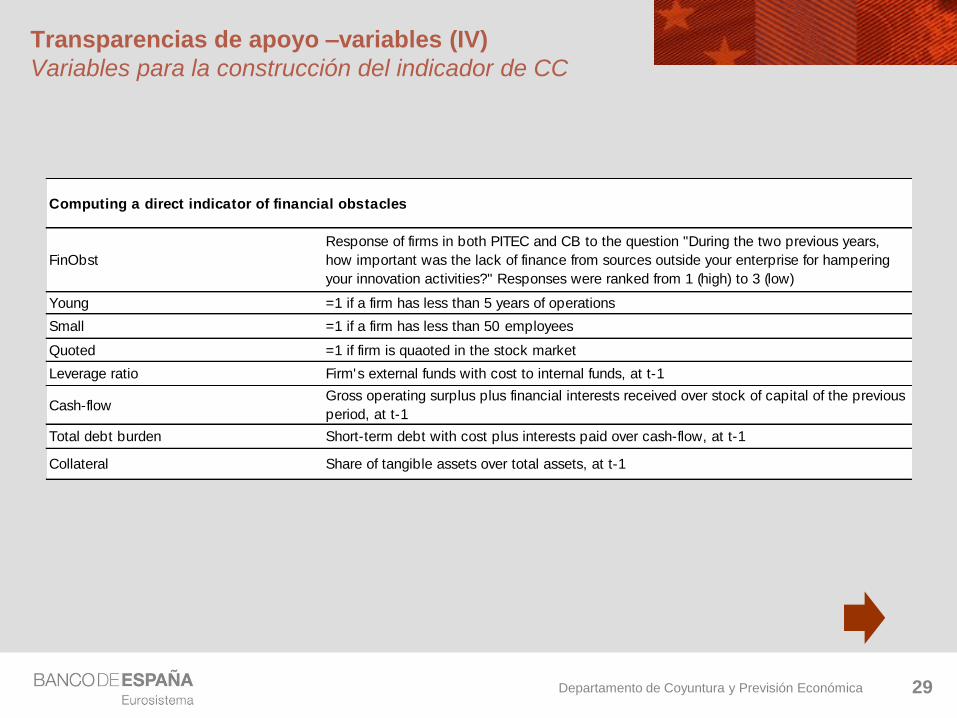
Transparencias de apoyo –variables (IV)
Variables para la construcción del indicador de CC
Computing a direct indicator of financial obstacles
FinObst
Response of firms in both PITEC and CB to the question "During the two previous years,
how important was the lack of finance from sources outside your enterprise for hampering
your innovation activities?" Responses were ranked from 1 (high) to 3 (low)
Young =1 if a firm has less than 5 years of operations
Small =1 if a firm has less than 50 employees
Quoted =1 if firm is quaoted in the stock market
Leverage ratio Firm's external funds with cost to internal funds, at t-1
Cash-flowGross operating surplus plus financial interests received over stock of capital of the previous
period, at t-1
Total debt burden Short-term debt with cost plus interests paid over cash-flow, at t-1
Collateral Share of tangible assets over total assets, at t-1
Departamento de Coyuntura y Previsión Económica 30
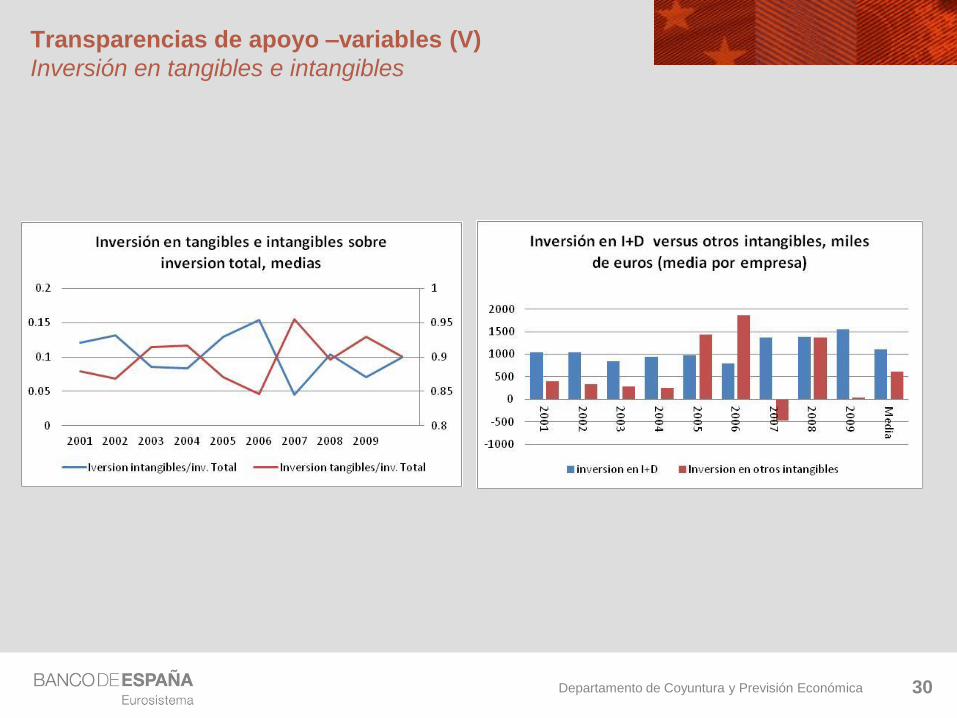
Transparencias de apoyo –variables (V)
Inversión en tangibles e intangibles
Departamento de Coyuntura y Previsión Económica
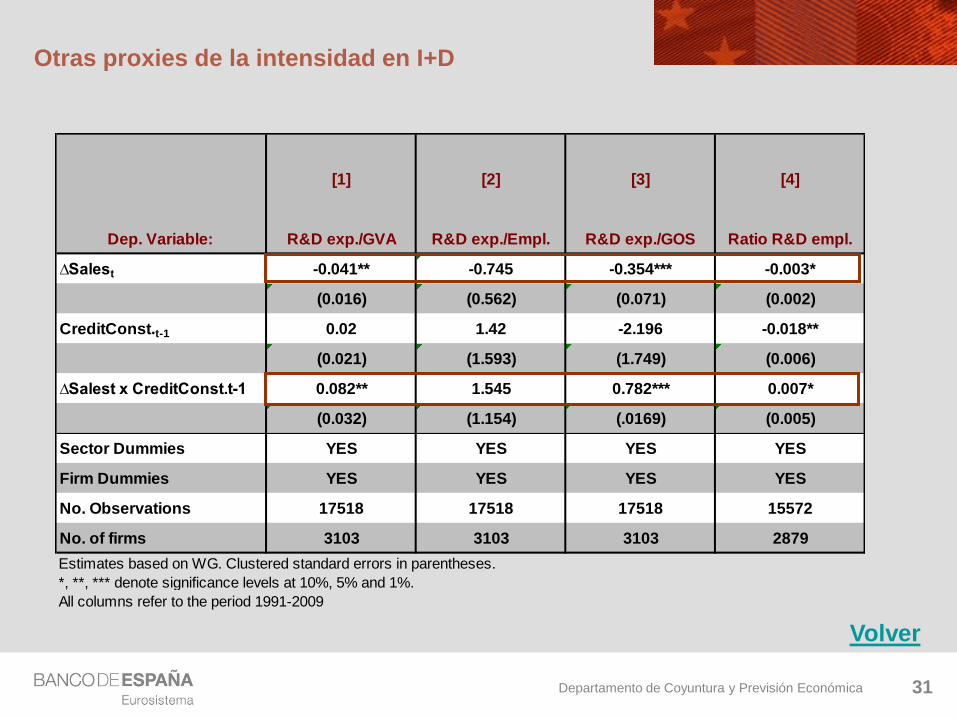
Otras proxies de la intensidad en I+D
31
Volver
[1] [2] [3] [4]
Dep. Variable: R&D exp./GVA R&D exp./Empl. R&D exp./GOS Ratio R&D empl.
∆Salest -0.041** -0.745 -0.354*** -0.003*
(0.016) (0.562) (0.071) (0.002)
CreditConst.t-1 0.02 1.42 -2.196 -0.018**
(0.021) (1.593) (1.749) (0.006)
∆Salest x CreditConst.t-1 0.082** 1.545 0.782*** 0.007*
(0.032) (1.154) (.0169) (0.005)
Sector Dummies YES YES YES YES
Firm Dummies YES YES YES YES
No. Observations 17518 17518 17518 15572
No. of firms 3103 3103 3103 2879
Estimates based on WG. Clustered standard errors in parentheses.
*, **, *** denote significance levels at 10%, 5% and 1%.
All columns refer to the period 1991-2009
Departamento de Coyuntura y Previsión Económica 32
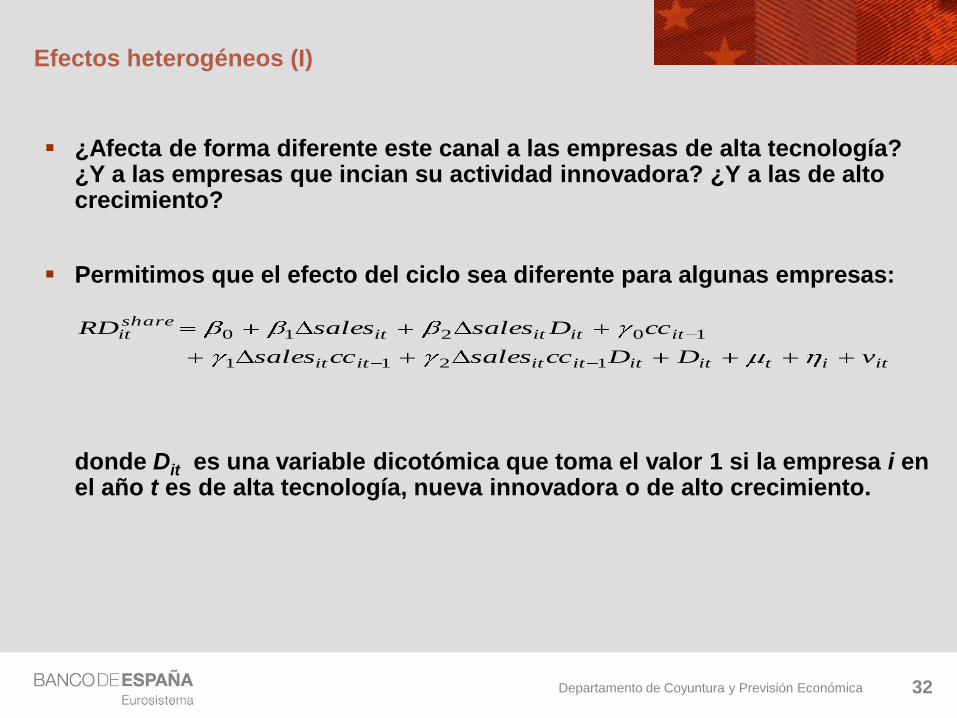
Efectos heterogéneos (I)
¿Afecta de forma diferente este canal a las empresas de alta tecnología? ¿Y a las empresas que incian su actividad innovadora? ¿Y a las de alto crecimiento?
Permitimos que el efecto del ciclo sea diferente para algunas empresas:
donde Dit es una variable dicotómica que toma el valor 1 si la empresa i en el año t es de alta tecnología, nueva innovadora o de alto crecimiento.
itititititititit
ititititshareit
vDDccsalesccsales
ccDsalessalesRD
1211
10210

Departamento de Coyuntura y Previsión Económica
Efectos heterogéneos (II)
[1] [2] [3] [4] [5] [6]
∆Salest -0.006** -0.018 -0.007** -0.024* -0.010*** -0.035**
(0.003) (0.012) (0.003) (0.014) (0.003) (0.015)
∆Salest x Dt -0111** -0.159 -0.111** -0.394 0.001 0.018
(0.040) (0.213) (0.057) (0.262) (0.014) (0.054)
CreditConst.t-1 0.08 0.077 0.080
(0.058) (0.058) (0.058)
∆Salest x CreditConst.t-1 0.038 0.051* 0.076**
(0.028) (0.031) (0.033)
∆Salest x CreditConst.t-1 x Dt 0.168 1.11 -0.072
(0.895) (0.939) (0.125)
Sector Dummies YES YES YES YES YES YES
Firm Dummies YES YES YES YES YES YES
No. Observations 21676 17506 21676 17506 21676 17506
No. of firms 3270 3103 3270 3103 3270 3103
Estimates based on WG. Clustered standard errors in parentheses.
*, **, *** denote significance levels at 10%, 5% and 1%.
All columns refer to the period 1991-2010
High Tech. Firms (Dt) New Innov. Firms (Dt) High Growth Firms (Dt)
Dep. variable: ratio of R&D exp.
over total investment
Departamento de Coyuntura y Previsión Económica 34
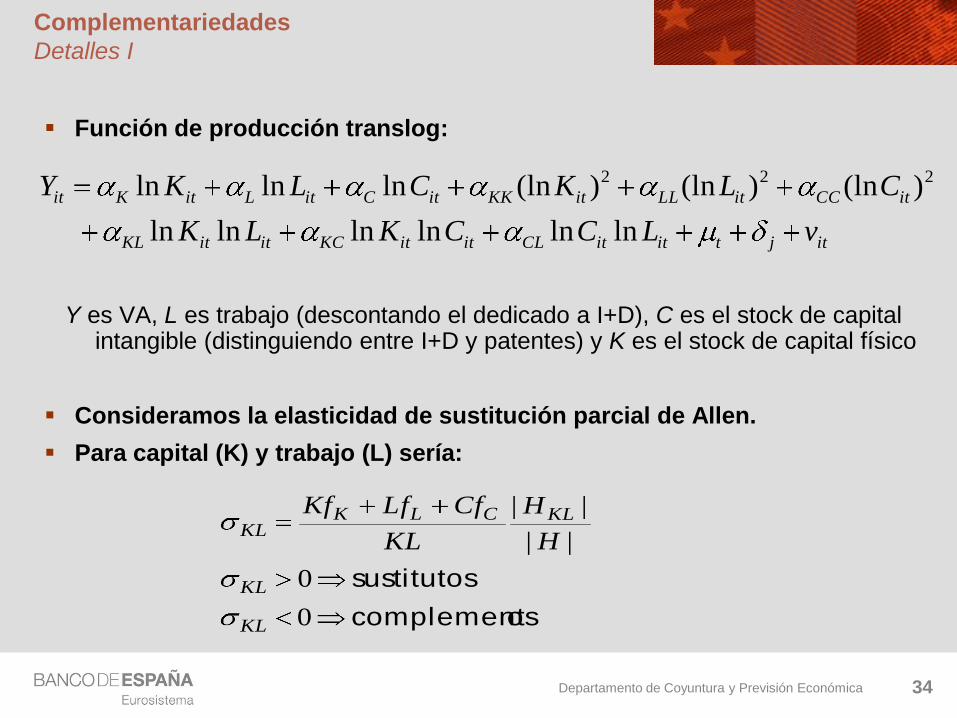
Complementariedades
Detalles I
Función de producción translog:
Y es VA, L es trabajo (descontando el dedicado a I+D), C es el stock de capital intangible (distinguiendo entre I+D y patentes) y K es el stock de capital físico
Consideramos la elasticidad de sustitución parcial de Allen.
Para capital (K) y trabajo (L) sería:
oscomplement
sustitutos
0
0
||
||
KL
KL
KLCLKKL
H
H
KL
CfLfKf
itjtititCLititKCititKL
itCCitLLitKKitCitLitKit
vLCCKLK
CLKCLKY
lnlnlnlnlnln
)(ln)(ln)(lnlnlnln 222
Departamento de Coyuntura y Previsión Económica 35
Complementariedades
Detalles II
OLS GMM
ηK 0.23*** 0.23***
(0.007) (0.008)
ηL 0.61*** 0.59***
(0.011) (0.013)
ηC 0.03*** 0.04***
(0.004) (0.004)
σKL -0.73*** -0.68***
(0.132) (0.124)
σCK 2.14** 1.78**
(1.076) (1.039)
σCL -2.60*** -2.53***
(0.951) (0.997)
No. Obs. 19734 16564
No. Firms 3169 3105
R2 0.82 -
*, **, *** denote significance levels at 10%, 5% and 1%.
η refers to elasticity
σ refers to Allen partial elasticity of substitution
Columns [1]-[2] refer to the period 1991-2009.
Columns [3]-[4] to 2001-2009.
3 inputs[2][1]
OLS GMM
ηK 0.22*** 0.21***
(0.010) (0.010)
ηL 0.61*** 0.61***
(0.013) (0.015)
ηC1 0.03*** 0.03***
(0.006) (0.007)
ηC2 0.01** 0.01**
(0.005) (0.007)
σKL -0.55*** -0.53***
(0.106) (0.111)
σC1K 0.58 0.72*
(0.49) (0.53)
σC2K 1.39** 1.26**
(0.65) (0.644)
σC1L -0.96*** -1.06***
(0.387) (0.446)
σC2L -1.32*** -1.27**
(0.527) (0.570)
σC1C2 1.90 1.65
(2.885) (3.079)
No. Obs. 8424 6266
No. Firms 2060 1897
R2 0.80 -
4 inputs[4][3]