Embed Size (px)
Citation preview

1
Business Accelerators: Evidence from Start-Up Chile1
Juanita Gonzalez-Uribe2 and Michael Leatherbee
3
April 2015
An increasingly important institutional form in the entrepreneurial ecosystem is business
accelerators: fixed-term, cohort-based, financial intermediaries that offer cash, shared office
space, and mentorship to start-ups. We investigate whether they add value by focusing on the
case of Start-Up Chile (SUP), an accelerator sponsored by the Chilean government. This
focus is useful for two reasons. Selection into the programme follows a rules-based approach,
which can be exploited to provide clean causal estimates that deal with potential selection
biases from heterogeneity in growth opportunities across start-ups. In addition, we can
distinguish the effect of mentorship from other accelerator services, because only 20% of
applicants are mentored, and selection process into the mentor arm is also rules-based. We
find that mentoring (bundled with cash) has a causal positive effect on performance, while
basic services apparently not—for borderline applicants. Additional results suggest that
rejected applicants, including borderline ones, are unable to secure financing and that
alternative sources of mentorship are scarce. We thus conclude that SUP adds value to the
entrepreneurial community. These results provide new insights about the selection skills of
accelerators, the causal effect of mentoring on start-up performance, and the value added role
of government-sponsored accelerators.
1We thank Start-up Chile for generous access to the data. We also thanks Ulf Axelson, Taylor Bengley, Shai
Bernstein, Vicente Cunat, Joan Farre-Mensa, Thomas Hellman, Stefan Lewellen, Ramanan Nanda, Daniel
Paravisini, Rui Silva, Moqi Xu, and the seminar participants at the Department of Finance at LSE, the NBER
Entrepreneurship Meeting 2014, the Adam Smith Conference and the UNC Junior Roundtable 2015. Su Wang
provided excellent research assistance. Financial support from Abraaj Group is gratefully acknowledged.
PRELIMINARY VERSION, DO NOT CITE WITHOUT PERMISSION. Corresponding author: Juanita
Gonzalez-Uribe: [email protected]. 2 London School of Economics, [email protected]
3 Pontificia Universidad Católica de Chile, [email protected]

2
Business accelerators have emerged as a new institutional form in the entrepreneurial
ecosystem. From only one in 2005—Y Combinator in Silicon Valley—there are now
potentially thousands worldwide, including Techstars which operates in several cities in the
U.S., and Seedcamp, originally London-based and currently pan-European (e.g., Cohen and
Hochberg, 2014). Accelerators are structured as fixed-term and cohort-based programmes,
which offer cash infusion, shared-office space and business education to participants, often in
the form of mentorship. To date, we know very little about the effectiveness of accelerators in
selecting and adding value, but according to practitioners, mentorship is the biggest source of
the latter.45
Recently, the model of business accelerators has been also adopted by
governments as an attempt to foster entrepreneurship: by 2007 16% of accelerators
worldwide were estimated to be sponsored by public funds (NBIA, 2007). The emergence of
this institutional form in the private and public sector is intriguing, and raises several
questions: do accelerators affect start-up performance, can governments implement them
effectively, and if so, do these programmes add value?
In this paper we explore these questions by focusing on the case of Start-up Chile
(SUP), a business accelerator promoted by the Chilean government since late 2010. The
policy objective of Start-up Chile is to instigate a cultural revolution in Chile towards start-up
creation by temporarily attracting foreign entrepreneurs to Chile. The program offers
participants a cash infusion of U$40,000 (equity free), a one year work visa (i.e., the
programme is open to Chilean and non-Chilean teams), shared office space for six months in
Santiago de Chile, and the option to be selected into the Highway: the mentoring arm of the
programme where participants are given additional access to top mentors.
4 Two recent papers have helped fill this gap: Fehder and Hochberg (2014) and Yu (2015). The first estimates
the effect of business accelerators in regional development and the second, focuses on the case of a privately
sponsored accelerator in the US. 5 See for example this opinion piece (http://avc.com/2011/06/financing-options-contestsprizesaccelerator-
programs/ of Fred Wilson, venture capital partner at Venture Square Ventures in NY and a revered blogger in
the start-up space.

3
Focusing on the case of Start-up Chile is useful because selection into the programme
follows a rules-based approach, which can be exploited to provide clean causal estimates that
deal with potential selection biases from heterogeneity in growth opportunities across start-
ups. In addition, the programme also allows us with the unique opportunity to distinguish the
effect of mentorship from other accelerator services, as only 20% of applicants are mentored,
and selection process into the mentor arm is also rules-based.
In detail, selection into the programme is based on an external ranking of applicants,
and a fixed size of 100 spots per cohort, as ex-ante determined based on the programme’s
budget. Each round, applications are scored and subsequently ranked by external judges using
three criteria: the quality of the founding team, the merits of the project, and the expected
impact of the project on Chile’s entrepreneurial environment. Based on this external ranking,
Chilean government officials then select from the pool of applicants (circa 650 every four
months) the final 100 participants: roughly the first 100 ranking start-ups.6 We estimate the
causal effect of the basic services of the accelerator on start-up performance using a fuzzy
regression discontinuity design (RDD) that compares performance of start-ups that rank
marginally above and marginally below the 100th
company threshold. For these close-call
applicants, selection is akin to an independent random event (it is “locally” exogenous) and
therefore uncorrelated to start-up growth opportunities. Intuitively, the average growth
opportunities of start-ups that rank 97 are similar to those that rank 103. However, this small
difference in rank leads to a discrete change in the probability that the start-up is accelerated:
start-ups ranking below 100th
are 14.5% more likely to participate in the accelerator.
Our estimate captures the effect of the discrete change in the probability of selection
at the 100th
ranked company threshold, and this estimate does not incorporate any observed or
6 Except in generation 2 were the SUP decided before the application round was opened to accept 150
participants.
4
unobserved confounding factors as long as their effects are continuous around the threshold.
We show that indeed, for start-ups that ranked closed to the 100th
company threshold,
selection is uncorrelated with observed start-up and founder characteristics. Hence, by
focusing on these start-ups, we can plausibly estimate a casual effect.
Our analysis exploits hand-collected data at the applicant level for start-ups that
applied to the accelerator during the 2010-2013 period. The accelerator provided us access to
confidential records of the companies that applied to the programme, the evaluation scores
from the panel of judges, and the selection decisions made. Based on these records, we
looked for several sources of information regarding start-up performance. We remark, that
most applicants are missing from standard business data sources as they are seldom legally
incorporated, and if they are, they rarely incorporate in Chile. In addition, the probability that
these early stage start-ups “pivot” is so large, that is challenging to even define, let alone
adequately measure, post-application performance. We overcome this challenge using two
different data collection methodologies: a web survey to all applicants, and extensive web-
searches on the businesses and the teams’ leaders in fund raising sites such as AngeList,
Techcrunch, social media sites like Facebook, Linkedin, and in web-page tracking sites like
Google Insights.
We find little evidence that the basic accelerator services (i.e., cash and desk) offered
by the government-sponsored accelerator have a causal effect on start-up performance.
However, the effect that we identify pertains, by definition, only to participants that have
observations around the discontinuity, which affects the degree to which one can extrapolate
the results of our analysis to others.
We then exploit the rules-based selection process into the mentor arm to estimate the
casual effect of mentoring on performance. In detail, selection into the mentor arm is based

5
on scores from a pitch competition. Two months into the accelerator, participants have the
choice to apply for participation into the Highway through a “pitch-day” during which they
formally present their businesses to judges, both external (i.e., staff at other private
accelerators in Chile such as Telefonica’s Wayra) and internal (i.e. staff at SUP). The judges
independently score the start-ups, and then based on that score the staff at the accelerator
selects roughly 20% of the participants into the mentoring arm. While there is no restriction
on the fixed number of participants accepted to the mentor arm in each round, we show that
probability of acceptance increases by 40% for participants scoring more than 3.6 (over 5).
Using a RDD that compares start-up performance across participants scoring closely above
and below the 3.6 pitch score threshold, we show that mentorship—bundled with the basic
services—casually increases performance.
We then explore whether taken together our findings suggest that government-funded
accelerators add value to the entrepreneurial ecosystem. We present an analytical framework
that shows how one can recover the added-value of basic accelerator services to participants
using our RDD estimates, as long as there is underinvestment in entrepreneurship and
rejected applicants cannot secure alternative sources of financing. These assumptions make
sure that government intervention does not create potential crowding-out of the public sector.
We then explore whether these assumptions appear to be true in practice by investigating in
detail whether rejected applicants, specially borderline applicants, are able to raise financing,
and we find that on average they do not.. We conclude that the selection skills of accelerators
appear to add value, while their treatment effect on performance of closely rejected applicants
apparently does not. We repeat the same analysis for mentoring. Based on reported mentor
scarcity by participants, we argue that our RDD estimates suggest that the accelerator also
adds value through mentorship; both, by selecting good participants into the mentor arm, and
by causally increasing performance of mentored start-ups.

6
Finally, we explore evidence that the programme also affects non-participants, by
analysing business creation inside Santiago de Chile and changes in the perception of Chile
as an entrepreneurial hub. Since the policy objective was to instigate a cultural revolution in
Chile, it would be incomplete to judge the success of the policy based only on the effects to
participants. We find preliminary evidence of higher business incorporation rates after the
creation of the programme in 2010 in neighbourhoods closely located around the
headquarters of Start-up Chile. There are also significant changes in the ranking of Chile as
an entrepreneurial hot-spot in the same period. We conclude that taken together, the results
suggest that Start-up Chile adds value to the entrepreneurial community (participants and
non-participants).
In future versions of the paper we plan to: 1. explore the real effects of acceleration
beyond start-up performance, by focusing on the potential effects on founders, 2. include
results from a detailed survey on applicants regarding their experience in SUP, and their
opinion on the most useful aspects of the programme. Finally, we will also present more
suggestive evidence of the more general impact of SUP on the Chilean entrepreneurial
ecosystem, by comparing registering rates of start-ups in Chile across industries targeted and
not targeted by SUP.
Our paper contributes to the general literature assessing the impact of early stage
financiers on firms (e.g., Hellman and Puri (2000); Sorensen (2007) Kortum and Lerner
(2000); Schoar, Kerr and Lerner (2010)) in two ways. First, we focus on a neglected type of
investor: business accelerators. Second, our methodology allows us to uncover casual
estimates. Our paper also contributes to our understanding on what types of services to start-
ups appear to add more value, especially when imparted by government-sponsored
programmes. Our results point to an important role of mentorship which complements studies

7
in other fields such as subsistence businesses in developed economies (McKenzie and
Woodruff (2008), De Mel et al. (2014)).
Our paper has policy implications, in particular regarding design of policies to
sponsor entrepreneurship. Our results suggest that if the policy objective is to accelerate
participants, then more resources should be allocated towards mentorship, perhaps by
reducing the size of the programme but making sure that all start-ups are mentored. This is
the standard structure of private accelerators which have 30 participants on average, all of
which are mentored. However, the policy objective may not be to accelerate. Indeed, the
founder of Start-up Chile, Nicolas Shea, argued in our interview “...To accelerate was never
the objective. What we wanted was a cultural change in Chile. To reach that goal all you need
is a group of highly qualified entrepreneurs. Making sure they came to Chile was our job,
making sure they succeeded was, and will always be, theirs … ” In that case conclusions may
differ. For example, if the policy objective is to instigate a cultural change, as was the
objective in Start-up Chile, then size may matter, and funding larger programmes, even at the
expense of providing mentorship to participants, may be more effective.
The rest of this paper is as follows. In Section 1 we describe the accelerator programme
and the data provided, and detail the selection process. In Section 2 we explain the analytical
framework and in Section 3 the identification strategy. In Section 3 we also present results,
which we interpret in Section 4. We discuss the effect of the program on the local
entrepreneurial ecosystem in Section 5, and we conclude in Section 6.

8
1. INSTITUTIONAL SETTING: START-UP CHILE
SUP is a government-sponsored program launched in August 2010 to attract early-stage,
high-potential entrepreneurs to bootstrap their ventures in Chile.7 The programme is run by
the Ministry of Economy and is executed by the Chilean Economic Development Agency
(CORFO), the leading organization for promoting innovation and entrepreneurship in the
country. Its main long-term goal is to convert Chile into an innovation and entrepreneurial
hub in Latin America not only by bringing in more entrepreneurs, but also by creating a much
better-developed ecosystem of supporting institutions—including venture capital firms and
angel investors.
SUP offers four main benefits to participants. First, SUP provides selected start-ups
with $40,000 equity-free seed capital. The capital is staged: 50% is delivered at the beginning
of the programme, and the remaining 50%, 3 months after. The second instalment is
conditional on pre-determined performance milestones.8 The staging of capital provides
incentives to entrepreneurs to provide effort, and accountability of participants’ expenditures.
Second, SUP sponsors a temporary one-year work visa for accepted participants in
order to attract foreign entrepreneurs. The programme also helps participants settle in Chile
through a “buddy system”. The buddy-system pairs entrepreneurs with local members of the
Santiago business community based on background interests and language. Local buddies
advice participants on opening Chilean bank accounts, registering with the police, obtaining a
local ID, and securing housing and mobile phones, in addition to checking in with
participants once or twice a month throughout the entrepreneurs’ stay in the country.
7 For more details on SUP see Applegate et al., (2012) and Gonzalez-Uribe (2014).
8 In the inception of the programme, capital disbursements were neither pre-expense nor staged. This system
was implemented in the first semester of 2013.

9
Third, SUP provides free, shared office space in downtown Santiago, equipped with
WiFi, for all start-ups. Workshops on think-tanking and pitch-training based on peer to- peer
teaching are held on-site. Start-ups also have access to SUP’s network of mentors.
Starting in 2012, SUP expanded its programme to include more accelerator-type
activities such as national and international pitch competitions. It created a mentoring arm
within the accelerator known as the Highway, which provides additional resources to
participants including access to the most renowned mentors and frequent monitoring by the
SUP staff. Participants are carefully selected into the Highway after a pitch competition, in
which external and internal judges rank participants. Roughly 20% of participants in each
generation have classified into the Highway since SUP’s fourth generation.
The SUP program, in turn, requires accepted entrepreneurs to stay in Chile for the
six-month duration of the program, and contribute to the building of an entrepreneurial
culture in Chile. During their stay, entrepreneurs have to accumulate 4,000 in “Return Value
Agenda” (RVA) points, a system to measure the social contribution of participants in the
Chilean entrepreneurial ecosystem. Participants have the option to attend, organize or
innovate in social-related activities. Attendance refers to participation in local events, such as
meetings and conferences at which entrepreneurs make themselves available to share
knowledge and to network with locals. Organization can include giving a talk at a school,
presenting a pitch to a local investor, or mentoring a local entrepreneur or student. Innovation
refers to initiatives that actively engage the Chilean business community, such as starting a
new business with a Chilean partner or patenting a product in Chile.
1.1. DATA
We were given access to applicant records for seven generations of SUP. In total we have
information on 3,258 applicants, 616 and 2,642 participants and non-participants,

10
respectively. Panel A of Table 1 displays the number of applications judged per generation
(i.e., not all applications are judged by YouNoodle as some are incomplete), the number of
applications selected (e.g., and offer is extended by the accelerator to the start-up) and the
number of applications that are formalized (e.g., the start-up accepts offer and reallocates to
Chile for the 6 month duration of the programme).9 Panels B through D, and E through G,
describe the composition of the sample by start-up and lead founder characteristics,
respectively. For the empirical analysis, we bundle together all generations. While the
average quality of start-ups on the accelerator is likely to change over time (e.g., as the
accelerator gains recognition better start-ups may apply), we are unable to analyse
generations separately due to power considerations. We address this concern in our empirical
strategy including generation fixed effects throughout.
[INSERT TABLE 1 HERE]
For the 3,258 start-ups that constitute our sample we hand-collect performance measures
using extensive web-searches during the second semester of 2013. Table A1. in the Appendix
has a list of the performance measures and their sources. Table 2 displays the summary
statistics of these web-based performance measures.
[INSERT TABLE 2 HERE]
9 Results from the Global Entrepreneurship Monitor (GEM) report provide a basis for comparison between the
entrepreneurs that apply to SUP, and the average Chilean entrepreneur. According to the latest GEM (2012), the
average Chilean entrepreneur is 37.5 years old, is twice as likely to be male than female, has studies beyond
those that are compulsory, and has a business that serves the consumer sector. The survey on micro
entrepreneurship (EME) also provides a basis of comparison for the composition of Chilean SUP entrepreneurs.
According to the EME of 2012 the average Chilean micro entrepreneur is male (69%), has between 45 and 59
years of age (39%), is responsible for a home (74%), has basic to mid-level education (67%) and its business
belongs to the sectors: retail, restaurant and hotel (34%), agriculture and fishing (24%) and manufacturing
(13%).

11
1.2. SELECTION INTO THE ACCELERATOR
Selection into SUP is a two-part process that takes place every four months. First,
entrepreneurs apply to the programme and their applications are ranked by external judges.
SUP outsources this first part to YouNoodle, a consulting start-up in California, which
provides and objective evaluation of the merit of the start-ups outside the particular context of
the Chilean economy.
Entrepreneurs fill in their applications through an open survey, and then YouNoodle
resorts to Silicon Valley experts (3-4 judges per application) who evaluate applications using
three criteria: the quality of the founding team, the merits of the project, and the impact that it
is likely to have on Chile’s entrepreneurial environment. Using the experts’ judging sheets,
applicants are ranked. No ties are permitted; if companies tie in their judges’ score they are
randomly ranked.
The second part of the selection process is handled by CORFO, which makes the final
decision based on YouNoodle’s ranking. A threshold is pre-specified each round (normally
100), and only companies that rank above the threshold are meant to be selected.10
The
threshold corresponds to the pre-determined size of the program and is decided on by the
government before the application process begins as a function of its budget.
The start-ups cannot precisely manipulate their ranking. Because start-ups do not
know the judges’ scoring rules, and are unlikely to learn about these rules from past SUP
participants, it is improbable that start-ups have room for manipulating their scores around
the 100-th company cut-off. In addition, the judges are unlikely to manipulate the scores, as
no judge evaluates all applications and only observe the very few he/she is asked to score.
10
The threshold has been 100 in every generation, except the second generation where the threshold was set at
150.

12
As it is common in government-sponsored programmes, however, the selection
committee at CORFO does not strictly follow the selection rule and thus not all participants
who rank above the 100th
company threshold end up participating in the programme. Indeed,
of the top 100 ranked applicants, about 75% of them are selected into SUP. The remaining
25% are selected by a committee among applicants ranked between 101 and 300 based on
qualitative attributes of the applications. Although there is no 100% compliance of the
selection rule, there is nonetheless a discrete jump in the probability of selection around the
rank cutoff as shown in Figure 1.
[INSERT FIGURE 1 HERE]
Figure 1 plots the fraction of participating applicants against the normalized rank, as
defined by the ranking of the start-up minus the predetermined size of the program of its
generation (i.e., 100 for all generations except 150 for generation 2). The figure includes
average participation rates by 10 applicant bins and the fitted value and 90% confidence
interval from the regression
(1) 𝑎𝑐𝑐𝑒𝑙𝑒𝑟𝑎𝑡𝑖𝑜𝑛𝑠 = 𝛿 + 𝛾𝑎𝑏𝑜𝑣𝑒𝑠 + 𝑓(𝑅𝑎𝑛𝑘𝑠 − 𝑐𝑢𝑡𝑜𝑓𝑓𝑔) + 휀𝑠,
where the outcome variable acceleration is an indicator variable that equals 1 if the applicant
participated in the accelerator, and 𝑓(𝑅𝑎𝑛𝑘𝑠 − 𝑐𝑢𝑡𝑜𝑓𝑓𝑔) is a 4th
degree polynomial of the
normalized rank.11
The vertical line represents the ranking cutoff normalized at 0. The
coefficient 𝛾, which in the plot corresponds to the difference in the vertical axis between the
points where the left and right polynomials intersect in the cutoff, is a measure of
11
The polynomial is evaluated on Ranks − cutoff g so that the coefficient on aboves corresponds to the effect of
the selection rule on participation at the cut-off. In unreported regressions we verified that alternative
parametrizations of 𝑓(. ) give similar results, including linear, quadratic and cubic polynomials. Different
subsamples were also used, and different weights for the observations near the cut-off. Standard errors are
robust. The standard RD implementation pools the data but allows the polynomials to differ on either side of the
cut-off by interacting the normalized rank with aboves. However, I potentially have too few points to the left of
the cut-off to estimate a control function separately on both sides. I verify, nonetheless, that results in Table 3
are robust to including different polynomials of 4 and 5 degrees, respectively, at the left and right side of the
cut-off.

13
discontinuity. As per visual inspection, there is a discontinuity in the probability of
participation around the cutoff, which is sizable and significant.
[INSERT TABLE 3 HERE]
Table 3 presents the coefficient on the constant, 𝛿, and the coefficient on 𝑎𝑏𝑜𝑣𝑒𝑠, 𝛾,
using different specifications of equation (1): including generation fixed effects (column (2)),
covariates (column (3)), and restricting the sample to a window of 48 observations around the
cutoff (as calculated using the optimal bandwidth procedure of Calonico et al., 2014) and
differentially weighting observations using a triangular kernel (column (4)). Across all
specifications there is a significant jump in the probability of participation around the 100th
company threshold. The estimate in column (3) implies that ranking above the cutoff
increases probability of acceleration by 19%. The coefficient 𝛾 is significant at the 1% level
and is stable across the first three columns. The estimate in column (4) implies that ranking
above the cutoff increases the probability of acceleration by 30%. The coefficient is much
larger as the observations included only correspond to those in a window of 48 ranks around
the cutoff, which excludes start-ups ranking between 150-160 which were abnormally likely
to participate as can been seen in the plot (i.e., the fit of the polynomial around the
normalized rank of 50 is relatively poor).12
This selection rule based on a “size-of-the-program” cutoff is useful in evaluating the
causal effect of acceleration on start-up performance, because this cutoff dramatically
changes the probability of acceleration but is likely continuously related to performance. For
government-based programs this alternative evaluation method is important as these agencies
are often unwilling to randomize based on ethical considerations. In the next section we
present a simple analytical framework that shows how to recover the value of acceleration by
12
One potential explanation is that judges check start-ups ranking between 150 and 160 as a final check on the
sample. Interviews CORFO officials mentioned that their perceived “checking threshold” was closer to 200.

14
focusing on applicants close to the cutoff. In section 3 we explain in detail how we exploit
this selection rule in practice to identify the causal effect of SUP.
2. ANALYTICAL FRAMEWORK
In this section, we present an analytical framework that shows how to recover the value of
acceleration by focusing on applicants ranking close to the cutoff. We show that a
discontinuity analysis is a simple way to deal with heterogeneity in unobserved growth
opportunities across applicants.
Denote as 𝑟 the ranking of the applicant and 𝑉(𝑟) the added-value of government-
funded accelerator services. For simplicity, we assume throughout that the outcome of the
selection process is binding, that the threshold for selection is 𝑟 ≤ 100, and that the value of
acceleration to the start-up is fixed (i.e. is independent of 𝑟), such that 𝑉(𝑟) = �̅� if 𝑟 ≤ 100
and 0 otherwise. The objective of the empirical analysis is to estimate �̅�, the value of
acceleration, which is not directly observable. Further assume that the underlying growth
opportunities of the applicants can be represented by a function of the ranking 𝑟, 𝐺(𝑟), that is
continuous around the 100th
company threshold. For highly ranked applicants, growth
opportunities are likely very high. Around the threshold, growth opportunities may not be as
high, but most importantly, are comparable across participants in either side of the threshold.
Since 𝐺(𝑟) is a continuous function of 𝑟, but 𝑉(𝑟) is discontinuous at the 100th
company threshold, the performance of the applicant that one observes after acceleration is
also discontinuous at the 100th
company threshold. This implies that the difference in the
performance at the 100th
company threshold, VA, between a start-up that barely ranks above
the 100th
company and one that barely ranks below is exactly the value added of acceleration.
Under the assumptions outlined before, 𝑉𝐴 = (�̅� − 𝐺(𝑟)) − (0 − 𝐺(𝑟)) = �̅�. Therefore, one

15
can recover the value of acceleration form the difference in performance across start-ups that
rank close to the discontinuity. The only two crucial identification assumptions are that the
distribution of start-up characteristics and growth opportunities is similar on both sides of the
discontinuity, and that the probability of selection changes discretely when the company
ranks below 100.
We made a number of additional assumptions in our example, some of which do not
necessarily hold in reality but are not crucial for identification. For example, as explained, the
government committee sometimes decides to accept start-ups that fail to rank below 100.
Hence, in this case one should expect 𝑉(𝑟) to be slightly positive to the right of the threshold
and thus, the average performance to the right of the threshold will be less negative than if the
selection rule were strictly binding. At the same time, start-ups may decide last minute to
reject the offer; thus, 𝑉(𝑟) will be below the effective value of acceleration to the left of the
threshold, and the average performance of start-ups in the left will be less positive than if
selection were binding. Still, provided that 𝐺(𝑟) is continuous and the probability of selection
is discontinuous around the threshold, 𝑉𝐴 can be used as a measure of the value of
acceleration to the start-up. In this case, the value estimated at the discontinuity, 𝑉𝐴, is not
equal to �̅�, as in the previous example. However, as Lee and Lemieux (2010) discuss the
identification strategy is still valid as long as there is a discrete jump in the probability of
selection at the 100th
company threshold (this is the fuzzy regression discontinuity setting).
The estimate recovered is the average effect of acceleration for start-ups ranking close to the
threshold. An important issue, thus, is that the degree to which we can make generalizations
based on our results, will depend on how different are the applicants ranking close to the
threshold from other applicants. We return to this point in the next section when we discuss
the results.

16
Other important questions that arise when trying to infer the value of government-
funded acceleration from differences in performance at the discontinuity are whether we
should expect any effect of acceleration on start-ups that barely rank below or above the
threshold, and whether these differences appropriately evaluate the policy performance. The
issues here are (i) alternative sources of funding for rejected applicants (ii) objective function
of the government-funded accelerator.
On the one hand, if we take at face value the assumption behind government
intervention that there is underinvestment in entrepreneurship, then we can assume that
rejected applicants will most likely not have access to alternative sources of finance. In that
case, differences in performance across start-ups ranking barely below and above the
threshold will reflect the effects of alleviating financial constraints, as well as the potential
value of additional services provided by the accelerators (e.g., knowledge spillovers from
other accelerated projects).
However, no differences may necessarily be detected if the policy objective is not to
fund positive private NPV projects. The government-funded accelerator may pick negative
private NPV projects if their social return is positive, e.g., these investments can spark a
cultural change that will help address future underinvestment in entrepreneurship. Sizable
differences in performance across similar participants in either side of the threshold may thus
constitute only a partial metric of welfare consequences.
Finally, if the assumption of underinvestment in entrepreneurship is not valid and the
objective function of the accelerator is to fund positive NPV projects, then rejected applicants
ranking barely below the cut-off will likely find funding elsewhere (as we have assumed that
start-ups in either side of the threshold have the same distribution of growth opportunities).
Thus, we should expect to see differences in performance across start-ups closely ranking in

17
either side of the cut-off, only if added value from early stage investors is not constant across
investors. Under these assumptions welfare analysis is also nuanced due to potential
crowding-out of private investment by the government funded-accelerator (e.g., Wallsten,
2000). If absent the government-funded accelerator accepted applicants would have been
funded by the private sector, and there is heterogeneity in growth opportunities of start-ups
such that those ranking far above the cut-off are on average better than those below, then
private equity investors are negatively affected by the public programme (i.e., the better start-
ups are funded with public funds). Sizable differences in performance across closely ranked
start-ups in either side of the cut-off, do not necessarily imply then that the public accelerator
is welfare improving.
We come back to this discussion in Section 4 where we focus on interpretation of
results.
3. METHODOLOGY AND IDENTIFICATION STRATEGY
We now describe the empirical approach to measure the causal effect of acceleration on start-
up performance. Suppose start-up 𝑠 applies to the accelerator and is ranked at 𝑟𝑠 relative to all
other start-ups in its generation. We code the indicator for participation in the accelerator as
𝑎𝑐𝑐𝑒𝑙𝑒𝑟𝑎𝑡𝑖𝑜𝑛𝑠 =1.
We are interested in the effect of acceleration on the performance of start-up 𝑠,
𝑜𝑢𝑡𝑐𝑜𝑚𝑒𝑠. We can write
(2) 𝑜𝑢𝑡𝑐𝑜𝑚𝑒𝑠 = 𝜋 + 𝛽𝑎𝑐𝑐𝑒𝑙𝑒𝑟𝑎𝑡𝑖𝑜𝑛𝑠 + 휀𝑠,
where the coefficient 𝛽 that we are interested in is the effect of acceleration on the
performance measure, for example, survival, and 휀𝑠 represents all other determinants of
performance (𝐸(휀𝑠) = 0). The problem with estimating a regression such as (2) directly is
that acceptance into the accelerator is a highly endogenous outcome, and 𝑎𝑐𝑐𝑒𝑙𝑒𝑟𝑎𝑡𝑖𝑜𝑛𝑠 is

18
unlikely to be independent of the error term (𝐸(𝑎𝑐𝑐𝑒𝑙𝑒𝑟𝑎𝑡𝑖𝑜𝑛𝑠 , 휀𝑠) ≠ 0), in which case the
estimate of 𝛽 will be biased.
To get a consistent estimate, we would ideally want participation in the accelerator to
be a randomly assigned variable. The regression discontinuity framework that exploits the
ranking by external judges helps us approximate this ideal setup because ranking in an
arbitrarily small interval around the cut-off, is random, however, the probability of
acceptance is dramatically different in either side of the cut-off in that small window.
Intuitively, the idea is to compare the outcome of start-ups that almost participated in the
accelerator as they barely ranked below the cut-off, with those that barely ranked above and
almost didn’t participate. We implement this comparison using a fuzzy RD design (Imbens
and Lenieux, 2007; Roberts and Whited, 2013). In order to conclude that any difference
between start-ups ranking closely in either side of the cut-off is caused by participation in the
accelerator, we assume that these two groups are statistically indistinguishable during the
application stage. In the fuzzy RD setting, this assumption is equivalent to a continuous
distribution of the unobserved residual at the ranking cut-off.
Following Lee and Lemieux (2010), we test whether the data rejects the identification
assumption by inspecting the cross-sectional distribution of predetermined variables at the
cutoff. We remark first that the distribution of applicants is by construction smooth at the
cutoff because the selection mechanism is based on ranking. A visual test as suggested by
McCrary (2008) is not very informative in this case. Moreover, as we argued, the start-ups
are unlikely to precisely manipulate their ranking, because they do not know the judges’
scoring rules, and are unlikely to learn about these rules from past SUP participants. Judges
are also unlikely to manipulate the scores, as no judge evaluates all applications and only
observe the very few he/she is asked to score.

19
We focus instead in testing whether at the time of application there were any
systematic differences in characteristics of start-ups of founders in either side of the cut-off.
In figure 2 we plot the averages for applicant’s characteristics at the time of application
grouped in bins of 10 applicants. Five plots are shown for the variables Age, Chilean (i.e., a
variable that equals one if the applicant leader is Chilean), Gender (i.e., a variable that equals
one if the applicant is a man), Money Raised (i.e., an indicator variable that equals one if the
start-up has raised external finance application), and Prototype (i.e., a variable that equals one
if the project already has a prototype). The plots also show the fitted values form the
applicant level regression of each of these variables on the polynomial 𝑓(. ) and the 𝑎𝑏𝑜𝑣𝑒𝑠
variable. Visual inspection suggests that there are no statistical discontinuities in the cross-
sectional distributions of any of these variables around the cut-off. This result provides
support for the identification assumption.
[INSERT FIGURE 2 HERE]
By substituting equation (1) into the regression model (2) and relabeling coefficients
and the functional form 𝑓(. ), we obtain the fuzzy RD reduced form:
(3) 𝑜𝑢𝑡𝑐𝑜𝑚𝑒𝑠 = 𝛼 + 𝛾 × 𝛽𝑎𝑏𝑜𝑣𝑒𝑠 + 𝑓(𝑅𝑎𝑛𝑘𝑠 − 𝑐𝑢𝑡𝑜𝑓𝑓𝑔) + 휀
As noted by Hahn et al., 2001, in its simplest form, the fuzzy RD setting implements a
Wald estimator for 𝛽. This estimator is equal to the coefficient of 𝑎𝑏𝑜𝑣𝑒𝑠 on regression (3),
𝛾 × 𝛽, divided by the coefficient of 𝑎𝑏𝑜𝑣𝑒𝑠 on regression (1), 𝛾. Thus the fuzzy RD
procedure is akin to a setting where, conditional on 𝑓(𝑅𝑎𝑛𝑘𝑠 − 𝑐𝑢𝑡𝑜𝑓𝑓𝑔), 𝑎𝑏𝑜𝑣𝑒𝑠 is an
instrumental variable for 𝑎𝑐𝑐𝑒𝑙𝑒𝑟𝑎𝑡𝑖𝑜𝑛𝑠. We estimate this regression using a two-stage least
squares (2SLS) procedure where (1) is the first stage and (2) (including an additional term for
the polynomial) is the second stage.13
13
To clarify the excluded instrument is only 𝑎𝑏𝑜𝑣𝑒𝑠, the polynomial on the normalized cut-off is a control in the
second stage.

20
An applicant ranking above the cut-off is more likely to participate in the accelerator,
but applicants are still endogenously chosen by the accelerator, and also endogenously self-
select into accepting an invitation to participate. Our main assumption is that crossing the cut-
off does not affect performance other tan through the change in the probability of
acceleration, and that all applicants ranking below the cut-off that are chosen by the
accelerator, would also be selected if they ranked above the cut-off (monotonicity). Then 𝛽
estimates the causal effect of acceleration on “compliers” of this instrument, that is, those
applicants that end up accelerated because they ranked above the cut-off, and thus the
estimate corresponds to a local average treatment effect (LATE). We remark that 𝛽 is
precisely the estimate of VA from section 2.
3.1. IMPLEMENTATION OF THE FUZZY RD
Implementations of RD inference vary considerably in the literature. Many researchers
control for high-degree polynomials of the underlying continuous forcing variable, where the
shape of the polynomial is often allowed to vary across the threshold, provided there are
enough observations in either side (e.g., Lee and Lemieux 2010). This method borrows
strength from observations far from the cut-off to estimate the average outcome for
observations near it. In practice, cubic or higher order polynomials are used, often based on
statistical information criteria or cross-validation to determine the degree of the polynomial.
Lee and Card (008) suggest a goodness-of-fit test to choose the polynomial degree. The
polynomial function is estimated including a full set of bin dummies. Additional polynomial
terms are added until the null hypothesis that the bin dummies are zero can no longer be
rejected. The drawback in using this first approach is the potential bias introduced by using
observations far from the cut-off.
Others prefer a local analysis, which discards observations above some bandwidth h
away from the cut-off, and estimates low-degree polynomial regressions on the remaining

21
observations (e.g., Gelman and Imbens, 2014). Several methods to choose the bandwidth
exist (e.g., Calonico et al., 2014). The drawback in using this second approach is the loss of
efficiency due to discarding observations. In this paper we do not take a stand on this
methodological discussion. Instead, we present results using both approaches.
3.2. RESULTS: ACCELERATION AND START-UP PERFORMANCE
Figure 3 shows the average start-up survival as measured by a listing in AngeList by 2013 in
bins of 10 applicants, and the fitted values of the reduced form regression (3). Visual
inspection reveals a discontinuity in survival: an AngeList listing is more likely for applicants
ranking above the cut-off relative to those ranking below. Given the identification
assumption, the discontinuity in this survival metric is attributed to acceleration.
[INSERT FIGURE 3 HERE]
We formalize the intuition conveyed by the figure with regression tests as
summarized in panel A of Table 4. Reported standard errors are heterosedasticity robust.14
Column (1) reports estimates from a simple OLS estimation of regression (2). The coefficient
is positive and statistically significant at the 1% level: applicants that are accelerated are 43%
more likely to survive.
Column (2) in Table 4 reports results from the fuzzy RD regression (3), the estimates
for the polynomial terms are not included in the table to conserve space. The coefficient
equals 0.49% and is statistically significant at the 1% level. The RD design does not require
conditioning on baseline covariates, but doing so can reduce sampling variability. In Column
(3) we present results after conditioning for selected covariates and generation fixed effects.
Results continue to hold. Column (4) presents estimates allowing the polynomials to differ on
either side of the threshold. The point estimate remains similar but is no longer significant,
likely because we have too few data points to the left of the cut-off to estimate a control
14
In unreported regressions we repeat the analysis clustering standard errors by generation and results continue
to hold. Consistent with potential small cluster bias (there are only 7 generations) we find that standard errors
are most conservative without clustering.

22
function separately on both sides. Finally, column (5) presents estimates using a local linear
regression approach using a bandwidth of 47, which was optimally estimated following the
procedure suggested by Calonico et al., (2014) (CCT). The coefficient remains positive, but
more than halves in magnitude and is no longer significant, likely because 708 observations
do not provide enough statistical power to distinguish an effect of size 0.12 (i.e., a power
estimation indicates that at least 750 observations are needed to distinguish an effect of that
magnitude if the mean is 0.2, the standard deviation 0.4, and the ratio between treated and
control observations is 0.2).
[INSERT TABLE 4 HERE]
We repeat the analysis to check the robustness of the results using other survival
metrics: listing in Crunchbase and listing in Linkedin, two other well-known platforms
recording fundraising activities and employee recruiting, respectively. Panel B in Table 4
shows that results are dramatically different when using these alternative survival measures.
In particular, while the OLS estimates continue to be positive and significant at the 1% level,
the Fuzzy RD estimates are not significant, and the point estimates are very small and
negative. In unreported regressions, we find similar results when using other RD
implementation methods including lower degree polynomials and local linear regressions,
and other web-based performance proxies start-up growth, employment and fundraising.
Results are similar across the different specifications, i.e., OLS estimates are positive and
significant and fuzzy RD estimates are not significant, quantitatively smaller than the OLS
estimates, and often negative.
3.3. INTERPRETATION OF RESULTS
One interpretation of the differences in the RDD results when using performance metrics is
that having a listing in AngeList is not a good measure of performance, in particular because

23
Start-up Chile uses AngeList as a platform of communication with alumni (see: Gonzalez-
Uribe, 2014). Hence, start-ups may be reluctant to close their profiles in AngeList, even in
the case of failure, if they think this will decrease their access to the Start-up Chile’s network.
Results thus suggest that Start-up Chile is successful at establishing a network of participants,
but not at having a positive causal effect on their performance—at least not for closely
rejected participants.
An alternative interpretation is that we don’t have enough power to reject the null
hypothesis. Using a simple power calculation, we estimate that to have a power of 80% in
ruling out an effect of -0.059% (-0.047%) in the probability of having a listing in
Crunchbase (Linkedin), we would need a sample of 3,457 (6,671) observations, assuming a
1/3 proportion of participants to rejected applicants. Because our sample size is 3,258 we may
then not have enough power. If we had a larger sample then we may find a causal effect on
performance, but one that albeit small, is negative. One potential interpretation is that the
accelerator helps entrepreneurs determine faster which ventures will not be successful and
accelerates exit. This alternative interpretation is actually consistent with other work in the
area (see Yu, 2015).
A final interpretation of the findings is that our measures of performance are not
capturing real effects. This should not be such a crucial concern as these web-based metrics
are the metrics used by investors in start-ups, so they are relevant for this type of company.
One natural argument would be that because the program is Chilean perhaps we should focus
on local networks. However, SUP has an international focus. As we have already argued an
important of participants is foreign (see table 2) and the vast majority do not end up in Chile.
The official language in SUP is English and the focus is international: this means that the
relevant networks are likely the foreign ones. Indeed, in one of the interviews the executives

24
mentioned than an internal exit via a local accelerator such as Wayra was considered a
failure. Another idea would be to use data form Chilean registry but this is not feasible: most
projects are registered abroad. However, we explore this alternative interpretation in more
detail by conducting a survey to collect non-web-based measures of performance. An
explanation of the surveys and results are presented next.
3.4. ANALYSIS OF SURVEY-BASED PERFORMANCE MEASURES
Choosing and measuring performance indicators for early stage startups is
challenging. Conventional measures used for established companies—such as profits,
achieving an IPO, or market capitalization—are not quite useful for fledgling organizations
(Delmar & Shane, 2003). For example, profits in early stage companies are highly dependent
on the company’s business model, industry and strategy. Many highly successful and visible
companies purposely postpone organizational profitability for several years, by reinvesting
revenues to fuel growth.
Measures of online activity (LinkedIn, Facebook and AngeList listings) are useful for
exploring entrepreneurial liveliness for companies whose strategies rely on internet exposure.
However, they are not perfect measures of performance. In order to construct a
complementary measure of entrepreneurial performance we conducted a survey aimed at
gathering data on aspects such as employee and revenue growth. These measures are widely
used in the strategy and entrepreneurship literatures (e.g., Eisenhardt & Schoonhoven, 1990;
Baum, Locke and Smith, 2001; Maurer and Ebers, 2006).
In October of 2014 we sent an email invitation to participate in the survey to all
applicants to Start-Up Chile from the first generation through the seventh. A total of 3,798
invitations were sent out, of which 184 bounced due to email addresses that no longer
existed. This is reasonable given that many individuals who applied to the program did so

25
using their startup’s internet domain name, which may cease to exist when the startup no
longer is pursued. We received responses from 448 participants, giving us an effective
response rate of 12.4%. Generation 1 applicants applied to the program in March of 2011 and
those from generation 7 did so in March of 2013. Generation 7 graduated from the program
in January of 2014. Therefore, all the surveyed population of startups had a considerable
amount of time since inception and graduation from Start-Up Chile.
Table 5 shows the distribution of participants that were contacted and those who
responded to the survey. With the exception of generation 7, the proportion of respondents
per generation mirrors the proportion of applicants per generation. This is reasonable given a
greater sense of commitment with Start-Up Chile for those more recently involved in it.
[INSERT TABLE 5 HERE]
One of the challenges of surveying startups is potential selection bias. Not only should
we be interested in the statistics of those startups that are still alive, but also learn about those
that no longer exist. Therefore, we first asked respondents to tell us about the fate of the
startup they applied with to Start-Up Chile. We categorized responses into four groups.
Namely, whether the startup was sold to- or merged with- another company; it was still
operational and the entrepreneur was currently working there; the entrepreneur had pivoted
into a new startup (either based on the same idea or a new idea); or the startup was shutdown.
The specific questions are listed in Table AII in the Appendix.
Table 6 shows the distribution by category for each generation. Of the total sample,
11% of startups exited, 50% are still alive, 30% pivoted and 10% were closed. Consistent
with the liability of senescence, there is a larger proportion of closed startups among the older
generations in our sample. Furthermore, Figure 4 reflects the distribution of the fate of the
startups that applied to the program contingent on their participation. A Kolmogorov-

26
Smirnov test indicates a significant difference in distribution of outcomes (p<0.001), whereas
non-participating applicants changed their business idea (aka pivoted) significantly more than
participants. This might be suggestive of the path-dependent effects that accelerators have on
an entrepreneur’s given business idea.
[INSERT TABLE 6 HERE]
[INSERT FIGURE 4 HERE]
To gauge startup performance, we asked respondents to answer a number of different
measures. That is, the level of implementation of the business idea (from “I have only a
vague idea” to “I have made sales with the idea”), the phase of development of the business
(from “I want to start a business but I have only an idea regarding the product or service” to
“My startup is already profitable”), jobs created, company growth in the last 6 months, pre-
money valuation, market share, how successful the respondent believed others considered
him or her to be as an entrepreneur (from “not at all successful” to “very successful”), the
extent to which the respondent had achieved his or her most important goals for the startup
(from “not at all” to “completely”), the capital raised, the accumulated sales during the last 6
months, the profit achieved in the last six months, and the key entrepreneurial milestones
achieved.
Table 7 shows the average performance responses to each of the aforementioned
questions contingent on participation in Start-Up Chile. Results are shown for the full sample,
regardless of the distance of the applicants to the cutoff score. From this birds-eye view, there
are clear differences in the performance outcomes of both groups. For all performance
measures short of market share, third party perceived success, sales, and profits, Start-Up
Chile participants have significantly higher levels of performance.

27
[INSERT TABLE 7 HERE]
However, there are limitations to this group-level comparison, because both groups
are hardly comparable for the purposes of inferring a performance-enhancing causal effect to
participation in the program. Figure 5 shows the distribution of applicants across the ranking
score for participants and non-participants. As expected, roughly half of non-participants
ranked higher than 375, which is likely to indicate high levels of heterogeneity in the quality
of the compared groups and limit their comparability. However, a relevant proportion of non-
participants ranked below 100. Likewise, a relevant proportion of participants ranked above
100.
[INSERT FIGURE 5 HERE]
We try to take advantage of this overlap, to the extent that participants who are
roughly 150 points away from the cutoff may be comparable to some degree. Evidence from
Leatherbee and del Sol (2015), who study the predictive capacity of the judging process of
Start-Up Chile on the subsequent performance of entrepreneurs, suggests that the ability of
the ranking score to discriminate between higher- and lower-potential startups is surprisingly
limited. Therefore, it may well be the case that—within a reasonably large ranking variable
bandwidth—startups are in fact comparable. In Figure 5 we can see that of all participants
who responded to our survey, the lowest ranked fall within 150 points from the cutoff. Hence
our choice.
Table 8 shows the average performance measures comparing non-participants and
participants. While participants score higher on most of the measures, they score significantly
higher on the level of key goals achieved, capital raised, sales, and profits (at a lower level of
confidence).

28
[INSERT TABLE 8 HERE]
We conducted the same analysis for a window of 75 points from the cutoff (not reported) and
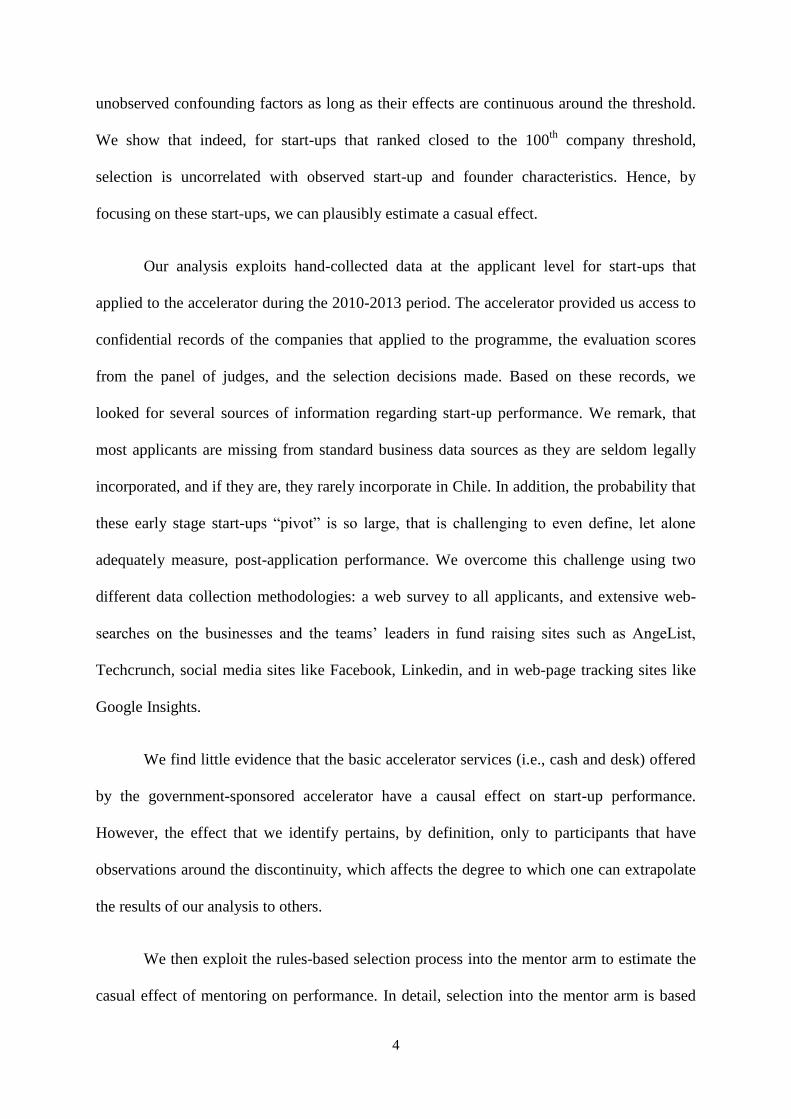
had consistent results. To illustrate, Figure 6 shows the proportion of participants who
achieved key entrepreneurial milestones for non-participants and participants within the 75-
points window. Consistent with what we may expect, a higher proportion of participants
appear to have achieved key milestones vis-à-vis non-participants.
[INSERT FIGURE 6 HERE]
4. CAUSAL EFFECT OF MENTORING ON START-UP PERFORMANCE
We exploit the unique opportunity of assessing the value of mentorship. Provision of this
service varies based on a selection rule that can be exploited to identify the causal effect, and
because mentorship is often an important part—usually not as easily scalable as monetary
resources—of these programmes. Understanding whether it adds value is important for policy
design, and possibly for our understanding of how accelerators affect performance more
generally.
4.1.1. SELECTION INTO THE MENTOR ARM
Participants in SUP have the option to join the Highway, the mentoring arm of the
programme, which provides access to top mentors. Two months into the accelerator the
application process for the mentor arm begins. It consists of a “pitch-day” in which start-ups
do a formal presentation of their businesses to judges, both external (i.e., staff at other private
accelerators in Chile such as Telefonica’s Wayra) and internal (i.e. staff at SUP) and a final
decision by staff at the accelerator in the days following the pitch competition. The judges
independently score the start-ups, and then based on that score the staff at the accelerator
selects roughly 20% of the participants. While in each generation the number of accepted

29
participants into the mentor arm is not strictly capped (in contrast to participation in the
accelerator), an implicit selection rule is evident in the data: there is a discrete jump in the
probability of selection into the mentoring arm of 34% if the start-up scores at least 3.6/5
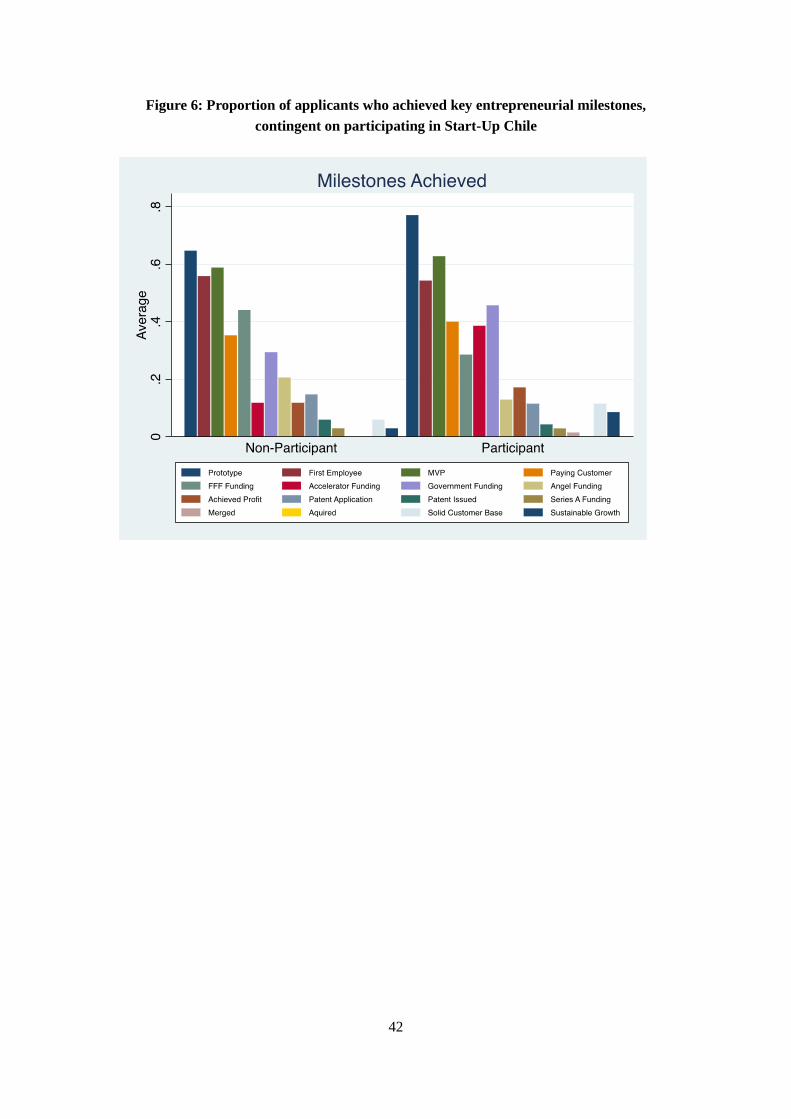
during the pitch-day. Figure 7 shows the fraction of applicants participating in the pitch-day
that are selected into the mentor arm. Visual inspection reveals this fraction is
discontinuously higher for those participants that scored above 3.6 in the pitch-day. The
figure also shows the ordinary least squares (OLS) fitted values and 90% confidence interval
of the regression
(4) 𝑚𝑒𝑛𝑡𝑜𝑟 = 𝜏 + 𝜇𝐴𝑏𝑜𝑣𝑒3.6 + 𝑔(𝑃𝑖𝑡𝑐ℎ_𝐷𝑎𝑦 𝑆𝑐𝑜𝑟𝑒) + 휀
where the outcome variable mentor is an indicator variable that equals 1 if the participant was
mentored, 𝐴𝑏𝑜𝑣𝑒3.6 is an indicator variable that equals one if the participant scored above 3.6
during the pitch-day, and 𝑔(𝑃𝑖𝑡𝑐ℎ_𝐷𝑎𝑦 𝑆𝑐𝑜𝑟𝑒) is a 4th degree polynomial of the pitch-day
score. The polynomial 𝑔(. ) depicted graphically as the smooth line on both sides of the cut-
off controls for any underlying relationship between the fraction of participants that are
mentored and the score of pitch-day. The coefficient 𝜇, which in the plot corresponds to the
difference in the vertical axis between the points where the left and right polynomials
intersect in the cut-off, is a measure of the size of the discontinuity. As per visual inspection,
and as confirmed in the regressions of Table 9, the discontinuity is large—34%—and
significant—1% level.
[INSERT FIGURE 7 HERE]
[INSERT TABLE 9 HERE]
We implement a fuzzy RD design to identify the value added of mentoring by first
confirming that the identification assumption of balanced covariates around the 3.6 score is

30
satisfied. Figure 8 shows that participants in either side of the 3.6 score threshold are
indistinguishable. The only significant difference is for the covariate Money Raised, i.e.,
selected participants into the mentor arm, which scored close to 3.6 in the pitch-day, are
significantly more likely to have secured external financing prior to joining the accelerator.
We deal with this issue by controlling for this covariate in the fuzzy RD regressions.
[INSERT FIGURE 8 HERE]
Table 10 documents differences in performance across start-ups in and out the mentor
arm using the OLS and the fuzzy RD approach based on the 3.6 score cut-off of the pitch-
day. The results in the table provide evidence, albeit weak, that mentoring has a positive
causal impact of start-up performance. There are no significant differences in survival as
measured by having a listing in AngeList, which is expected, as both, participants that are
mentored and those that are not, are encouraged to list their companies in AngeList by the
accelerator. However, there is evidence of impact on growth as measured by number of
Facebook likes and employment as measured by company size in Linkedin.
[INSERT TABLE 10 HERE]
One interpretation of these additional findings is that there is heterogeneity in impact
across services offered by the accelerator. While basic services such as cash infusion and
shared office space appear not to add value, mentoring appears to contribute more to start-up
growth.
5. DOES START-UP CHILE ADD VALUE TO THE ENTREPRENEURIAL
COMMUNITY?
We now explore whether taken together our findings suggest that government-funded
accelerators add value to the entrepreneurial ecosystem. In Section 3 we presented an

31
analytical framework that shows how one can recover the added-value of basic accelerator
services to participants using our RDD estimates, as long as there is underinvestment in
entrepreneurship and rejected applicants cannot secure alternative sources of financing. These
assumptions make sure that government intervention does not create potential crowding-out
of the public sector. We now explore whether these assumptions appear to be true in practice
by investigating in detail whether rejected applicants, specially borderline applicants, are able
to raise financing, and we find that on average they do not. We conclude that the selection
skills of accelerators appear to add value, while their treatment effect on performance of
closely rejected applicants apparently does not. We repeat the same analysis for mentoring.
Based on reported mentor scarcity by participants, we argue that our RDD estimates suggest
that the accelerator also adds value through mentorship; both, by selecting good participants
into the mentor arm, and by causally increasing performance of mentored start-ups.
5.1. FOUNDER AS THE UNIT OF ANALYSIS
Perhaps the correct unit of analysis should instead be the entrepreneur (founder) and not the
firm. Start-ups pivot a lot and failing is part of growing. What matters most is that
entrepreneur learns, tries again and is likely more to succeed after he is schooled in the
accelerator. The main challenge here is measuring outcomes at individual level. We
overcome this challenge by collecting information at the founder level from LinkedIn. In
future work we will summarize the results from analysis at the founder level.
5.2. REGIONAL EFFECTS
The policy objective was not to help accelerated start-ups. In fact, the founder of the
programme Nicolas Shea argued that the objective was to attract talent (not to be retained)
but instead to inspire Chileans to become entrepreneurs and start an internal mentality
revolution.

32
We explore evidence that the programme also affects non-participants, by analysing
business creation inside Santiago de Chile and changes in the perception of Chile as an
entrepreneurial hub. Since the policy objective was to instigate a cultural revolution in Chile,
it would be incomplete to judge the success of the policy based only on the effects to
participants. We find preliminary evidence of higher business incorporation rates after the
creation of the programme in 2010 in neighbourhoods closely located around the
headquarters of Start-up Chile. There are also significant changes in the ranking of Chile as
an entrepreneurial hot-spot in the same period. We conclude that taken together, the results
suggest that Start-up Chile adds value to the entrepreneurial community (participants and
non-participants). These results are consistent with Fehder and Hochberg (2014), who find
that there are subsequent local developments after accelerator programs. In future versions of
the paper we will summarize these additional results.
5.3. GOOD AT SELECTION
The differences in performance calculated using the OLS methodology indicate that the
accelerator is good at selecting. We explore this point further by investigating the correlation
between success and subsequent start-up performance. In future versions we will summarize
results from this analysis.
6. CONCLUSIONS
In this paper we provide new evidence performance of government sponsored programmes
that sponsor entrepreneurship. We focus on business accelerates a neglected yet increasingly
popular type of early stage financiers both in the public and the private sectors. We quantify
the causal impact of a government-funded accelerator in Chile, SUP, by simultaneously
exploiting novel, rich micro-data and addressing concerns about unobserved heterogeneity.
We find that mentoring (bundled with cash) has a causal positive effect on performance,

33
while basic services apparently not—for borderline applicants. Additional results suggest that
rejected applicants, including borderline ones, are unable to secure financing and that
alternative sources of mentorship are scarce. We thus conclude that SUP adds value to the
entrepreneurial community. These results provide new insights about the selection skills of
accelerators, the causal effect of mentoring on start-up performance, and the value added role
of government-sponsored accelerators.

34
References
Applegate, Lynda, William Kerr, Joshua Lerner, Dina D. Pomeranz, Gustavo herrero and
Cintra Scott. Start-up Chile. Harvard Business Review.
Baum, J.R., Locke, E.A., Smith, K.G., 2001. A Multidimensional Model of Venture Growth.
Acad. Manag. J.44, 292–303. doi:10.2307/3069456
Cohen, Susan and Yael Hochberg, 2014, Accelerating Startups: The Seed Accelerator
Phenomenon, available at: http://papers.ssrn.com/sol3/papers.cfm?abstract_id=2418000
Delmar F, Shane SA. 2003. Does business planning facilitate the development of new
ventures? Strategic Management Journal 24(April): 1165–1185.
Eisenhardt, K.M., Schoonhoven, C.B., 1990. Organizational Growth: Linking Founding
Team, Strategy, Environment, and Growth Among U.S. Semiconductor Ventures, 1978-1988.
Adm. Sci. Q. 35, 504–529.
Fehder, Daniel and Yael Hochberg, 2014, Accelerators and the Regional Supply of Venture
Capital Investment, available at: http://papers.ssrn.com/sol3/papers.cfm?abstract_id=2518668
Gonzalez-Uribe, Juanita, 2014, El caso de Start-up Chile. Programa de atracción de talento
para fomentar el emprendimiento, CAF, Development Bank of Latin America.
http://scioteca.caf.com/handle/123456789/685#sthash.3uyjaDPp.dpuf
Hahn, J., Todd, P., Van Der Klaauw, W., 2001. Identification and estimation of treatment
effects with a regression discontinuity design. Econometrica 69, 201–209
Hellmann, Thomas and Manju Puri, 2002, Venture Capital and the professionalization of
Start-Up Firms: Empirical Evidence, The Journal of Finance, pp. 169-198.
Kerr, William, Joshua Lerner and Antoinette Schoar, 2014, The Consequences of
Entrepreneurial Finance: Evidence from Angel Financings, Review of Financial Studies,
27(1) pp. 20-55.
Kortum, Samuel and Joshua Lerner, 2000, Assessing the Contribution of Venture Capital to
Innovation, RAND Journal of Economics 31(4), 674-692.
Lelarge, Claire, David Sraer and David Thesmar, 2013, Entrepreneurship and Credit
Constraints: Evidence from a French Loan Guarantee Program in NBER volume on
"International Differences in Entrepreneurship" edited by Joshua Lerner and Antoinette
Schoar, University of Chicago Press.
Maurer, I., Ebers, M., 2006. Dynamics of Social Capital and Their Performance Implications:
Lessons from Biotechnology Start-ups. Adm. Sci. Q. 51, 262–292. doi:10.2189/asqu.51.2.262
Lee, David and Thomas Lemieux, 2010. Regression Discontinuity Designs in
Economics, Journal of Economic Literature, vol. 48(2), pages 281-355, June.

35
Van Der Klaauw, W., 2002. Estimating the effect of financial aid offers on college
enrollment: a regression-discontinuity approach. International Economic Review 43, 1249–
1287.
Van Der Klaauw, W., 2008. Regression-Discontinuity Analysis: A Survey of Recent
Developments in Economics, Labour: Review of Labour Economics and Industrial Relations,
Vol. 22 (2), 2008, p.219-245.

36
Figure 1 – Fraction of accelerated applicants
The figure shows the average fraction of accelerated applicants in bins of 10 transformed ranks (i.e., 𝑧)
and the fitted values and 90% confidence interval from the regression mode: 𝑎𝑐𝑐𝑒𝑙𝑒𝑟𝑎𝑡𝑖𝑜𝑛 = 𝛿 +
𝛾𝑎𝑏𝑜𝑣𝑒 + 𝑓(𝑅𝑎𝑛𝑘 − 𝑐𝑢𝑡𝑜𝑓𝑓) + 휀, where the outcome variable acceleration is an indicator variable
that equals 1 if the applicant participated in the accelerator, and 𝑓(𝑅𝑎𝑛𝑘 − 𝑐𝑢𝑡𝑜𝑓𝑓) is a 4th
degree
polynomial of the transformed rank. The vertical line represents the ranking cutoff normalized at 0 for
the modified ranking.
0.2
.4.6
.8
-100 0 100 200z=Rank-cutoff

37
Figure 2 – Cross-sectional Covariates
The figure shows that predetermined variables are continuous at the cutoff for applicants. Five plots are
shown for the variables Age, Chilean (i.e., a variable that equals one if the applicant leader is Chilean),
Gender, Money Raised (pre application), and Prototype (i.e., a variable that equals one if the project
already has a prototype). All variables as of the application date. Plots show averages grouped in bins of
10 applicants. The plots also show the fitted values and 90% confidence interval of a modified versions
of the regression in equation (1), 𝑜𝑢𝑡𝑐𝑜𝑚𝑒 = 𝛼 + 𝛽𝑎𝑏𝑜𝑣𝑒 + 𝑓(𝑅𝑎𝑛𝑘 − 𝑐𝑢𝑡𝑜𝑓𝑓) + 휀, with each of
these variables as outcomes, on 𝑎𝑏𝑜𝑣𝑒, a variable that equals 1 if the applicant ranks above 100th in its
generation and 0 otherwise, and 𝑓(𝑅𝑎𝑛𝑘 − 𝑐𝑢𝑡𝑜𝑓𝑓) a 4th
degree polynomial of the modified rank (i.e.,
𝑧 = 𝑅𝑎𝑛𝑘 − 𝑐𝑢𝑡𝑜𝑓𝑓). The vertical line represents the ranking cutoff normalized at 0 for the modified
ranking.
28
30
32
34
36
-100 0 100 200z=Rank-cutoff
Age
.1.1
5.2
.25
.3.3
5
-100 0 100 200z=Rank-cutoff
Chilean
.2.3
.4.5
.6
-100 0 100 200z=Rank-cutoff
Gender
.15
.2.2
5.3
.35
.4
-100 0 100 200z=Rank-cutoff
Money_Raised.3
.4.5
.6.7
-100 0 100 200z=Rank-cutoff
Prototype

38
Figure 3 – Effect of participation in accelerator on listing in AngeList
The figure examines the effect of participation in the accelerator on having a listing in AngeList for all
applicants irrespective of whether they participated or not (i.e., the reduced form estimates). The plot
shows the average value of AngeList (i.e., a variable that equals 1 if the project has a listing on AngeList
by December 2013) in bins of 10 applicants. The plots also show the fitted values and 90% confidence
interval of a modified version of the regression in equation (1), 𝑜𝑢𝑡𝑐𝑜𝑚𝑒 = 𝛼 + 𝛽𝑎𝑏𝑜𝑣𝑒 + 𝑓(𝑅𝑎𝑛𝑘 −
𝑐𝑢𝑡𝑜𝑓𝑓) + 휀, with AngeList as outcome, on 𝑎𝑏𝑜𝑣𝑒, a variable that equals 1 if the applicant ranks above
100th
in its generation and 0 otherwise, and𝑓(𝑅𝑎𝑛𝑘 − 𝑐𝑢𝑡𝑜𝑓𝑓) a 4th
degree polynomial of the modified
rank (i.e., 𝑧 = 𝑅𝑎𝑛𝑘 − 𝑐𝑢𝑡𝑜𝑓𝑓). The vertical line represents the ranking cutoff normalized at 0 for the
modified ranking.
.1.2
.3.4
.5
-100 0 100 200z=Rank-cutoff

39
Figure 4 – Effect of participation in accelerator on alternative measures of performance
The figure examines the effect of participation in the accelerator on performance as measured by having
a listing in Crunchbase for all applicants irrespective of whether they participated or not (i.e., the reduced
form estimates). The plot shows the average value of Crunchbase (i.e., a variable that equals 1 if the
project has a listing on Crunchbase by December 2013) in bins of 10 applicants. The plots also show the
fitted values and 90% confidence interval of a modified version of the regression in equation (1),
𝑜𝑢𝑡𝑐𝑜𝑚𝑒 = 𝛼 + 𝛽𝑎𝑏𝑜𝑣𝑒 + 𝑓(𝑅𝑎𝑛𝑘 − 𝑐𝑢𝑡𝑜𝑓𝑓) + 휀 , with Crunchbase as outcome, on 𝑎𝑏𝑜𝑣𝑒 , a
variable that equals 1 if the applicant ranks above 100th in its generation and 0 otherwise, and𝑓(𝑅𝑎𝑛𝑘 −
𝑐𝑢𝑡𝑜𝑓𝑓) a 4th
degree polynomial of the modified rank (i.e., 𝑧 = 𝑅𝑎𝑛𝑘 − 𝑐𝑢𝑡𝑜𝑓𝑓). The vertical line
represents the ranking cutoff normalized at 0 for the modified ranking.
0.1
.2.3
.4
-100 0 100 200z=Rank-cutoff

40
Figure 4: Distribution of startup outcome among applicants
Kolmogorov-Smirnov exact test p< 0.001

41
Figure 5: Histogram of applicants across the ranking score contingent on
participation in Start-Up Chile
42
Figure 6: Proportion of applicants who achieved key entrepreneurial milestones,
contingent on participating in Start-Up Chile

43
Figure 7 – Fraction of mentored applicants
The figure shows the average fraction of mentored participants in bins of 0.2 scores by judges’
pitch-day scores, and the fitted values and 90% confidence interval from the regression: 𝑚𝑒𝑛𝑡𝑜𝑟 =
𝜏 + 𝜇𝐴𝑏𝑜𝑣𝑒3.6 + 𝑓(𝑃𝑖𝑡𝑐ℎ_𝐷𝑎𝑦 𝑆𝑐𝑜𝑟𝑒) + 휀 , where the outcome variable mentor is an indicator
variable that equals 1 if the participant was mentored, 𝐴𝑏𝑜𝑣𝑒3.6 is an indicator variable that equals
one if the participant scored above 3.6 during the pitch-day, and 𝑓(𝑃𝑖𝑡𝑐ℎ_𝐷𝑎𝑦 𝑆𝑐𝑜𝑟𝑒) is a 4th
degree
polynomial of the pitch-day score. The vertical line represents the implicit score cut-off of 3.6.
01
02
03
04
0
Num
ber
of p
art
icip
atio
ns in
0.2
score
bin
s
0.5
11
.5
0 1 2 3 4 5Pitch-Day Score

44
Figure 8- Cross-sectional covariates mentor arm
The figure shows that predetermined variables are continuous at the cutoff for applicants. Five plots are
shown for the variables Age, Chilean (i.e., a variable that equals one if the applicant leader is Chilean),
Gender, Money Raised (pre application), and Prototype (i.e., a variable that equals one if the project
already has a prototype). All variables as of the application date. Plots show averages grouped in bins of
10 applicants. The plots also show the fitted values and 90% confidence interval of a modified versions
of the regression in equation (1), 𝑚𝑒𝑛𝑡𝑜𝑟 = 𝜎 + 𝜔𝐴𝑏𝑜𝑣𝑒3.6 + 𝑓(𝑃𝑖𝑡𝑐ℎ_𝐷𝑎𝑦 𝑆𝑐𝑜𝑟𝑒) + 𝜖, with each of
these variables as outcomes, , 𝐴𝑏𝑜𝑣𝑒3.6 is an indicator variable that equals one if the participant scored
above 3.6 during the pitch-day, and 𝑓(𝑃𝑖𝑡𝑐ℎ_𝐷𝑎𝑦 𝑆𝑐𝑜𝑟𝑒) is a 4th
degree polynomial of the pitch-day
score. The vertical line represents the implicit score cut-off of 3.6.
20
30
40
50
0 1 2 3 4 5Pitch-Day Score
Age
0.2
.4.6
.81
0 1 2 3 4 5Pitch-Day Score
Chilean
0.5
1
0 1 2 3 4 5Pitch-Day Score
Gender
-.5
0.5
1
0 1 2 3 4 5Pitch-Day Score
Money Raised0
.51
0 1 2 3 4 5Pitch-Day Score
Prototype

45
Figure 9- Effect of mentoring on subsequent performance
The figure shows that predetermined variables are continuous at the cutoff for applicants. Five plots are
shown for the variables Age, Chilean (i.e., a variable that equals one if the applicant leader is Chilean),
Gender, Money Raised (pre application), and Prototype (i.e., a variable that equals one if the project
already has a prototype). All variables as of the application date. Plots show averages grouped in bins of
10 applicants. The plots also show the fitted values and 90% confidence interval of a modified versions
of the regression in equation (1), 𝑚𝑒𝑛𝑡𝑜𝑟 = 𝜎 + 𝜔𝐴𝑏𝑜𝑣𝑒3.6 + 𝑓(𝑃𝑖𝑡𝑐ℎ_𝐷𝑎𝑦 𝑆𝑐𝑜𝑟𝑒) + 𝜖, with each of
these variables as outcomes, , 𝐴𝑏𝑜𝑣𝑒3.6 is an indicator variable that equals one if the participant scored
above 3.6 during the pitch-day, and 𝑓(𝑃𝑖𝑡𝑐ℎ_𝐷𝑎𝑦 𝑆𝑐𝑜𝑟𝑒) is a 4th
degree polynomial of the pitch-day
score. The vertical line represents the implicit score cut-off of 3.6.
-10
12
0 1 2 3 4 5Pitch-Day Score
Facebook Likes
-20
02
04
06
0
0 1 2 3 4 5Pitch-Day Score
Employees Linkedin

46
Figure 6- Effect of acceleration on job creation
The figure compares job creation by non-participants and participants of Start-Up Chile. Graphs are
shown progressing from full sample until a window of 50 positions around the ranking threshold of
100.
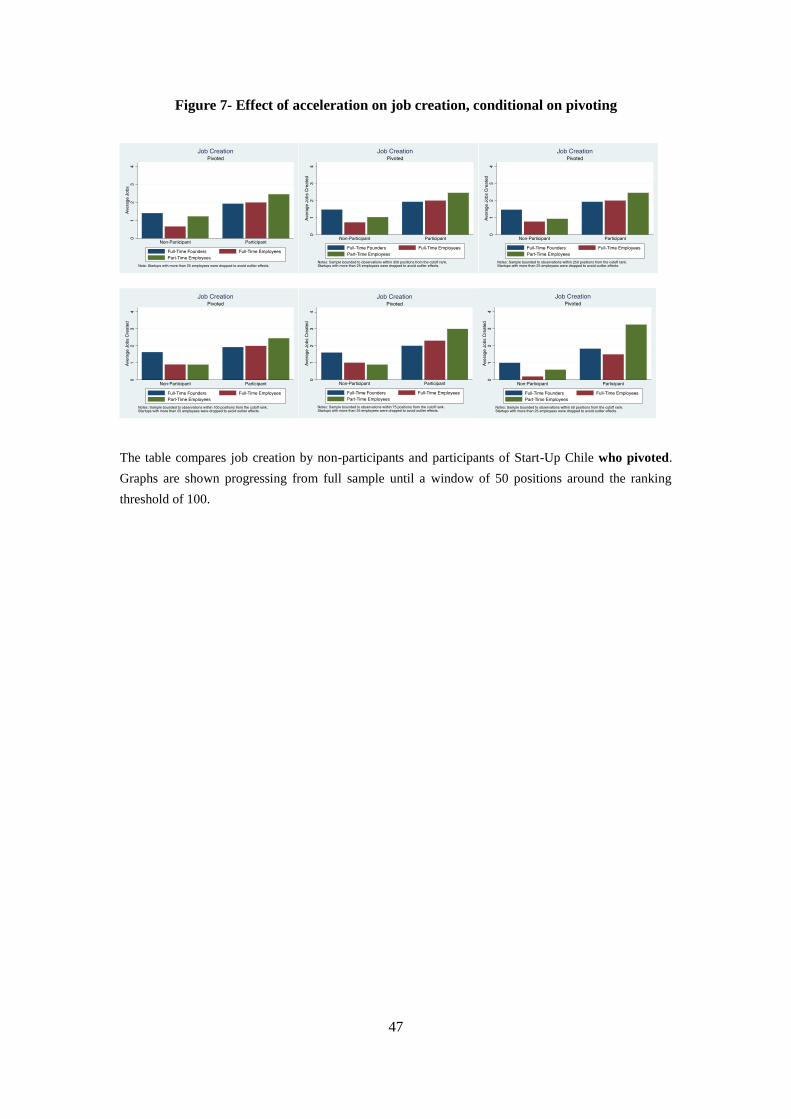
47
Figure 7- Effect of acceleration on job creation, conditional on pivoting
The table compares job creation by non-participants and participants of Start-Up Chile who pivoted.
Graphs are shown progressing from full sample until a window of 50 positions around the ranking
threshold of 100.

48
Figure 8 – Comunas in Santiago de Chile
The figure plots the names of the different Comunas in Santiago de Chile. SUP is located in the Santiago
Comuna.

49
Table 1 - Composition sample
Panel A: Selected and formalized start-ups by generation
Panel B: Capital raised before application by generation
Generation
1 2 3 4 5 6 7 Total
- 1 462 3 13 0 0 0 479
No (Bootsrapped) 107 10 290 354 492 450 357 2,060
< 50K 10 1 72 72 116 92 134 497
50 K to 100K 3 1 20 15 24 24 50 137
100K to 500K 5 0 0 0 0 0 0 5
500K to 1 M 0 0 7 13 19 11 14 64
<5M 0 0 2 5 4 4 1 16
Total 126 474 394 472 655 581 556 3,258
Panel C: Industry of start-up at application by generation
Generation
1 2 3 4 5 6 7 Total
- 5 95 64 135 206 83 347 935
Consulting 0 0 0 0 3 0 0 3
E-commerce 32 81 54 57 73 95 35 427
Education 0 0 36 26 45 32 25 164
Energy & Clean Technology 6 24 10 4 13 10 9 76
Finance 6 12 10 7 5 12 5 57
Healthcare & Biotechnology 5 0 12 16 15 21 12 81
IT & Enterprise Software 29 97 59 48 57 67 30 387
Media 0 0 17 22 15 33 7 94
Mobile & Wireless 12 53 24 25 42 36 20 212
Natural Resources - mining, food, lumber, etc. 0 0 6 4 13 10 2 35
Other 22 82 32 35 40 48 21 280
Social Enterprise 9 30 14 15 20 21 8 117
Industry 0 0 40 55 81 79 28 283
Social Media/Social Network 0 0 16 23 27 34 7 107
Total 126 474 394 472 655 581 556 3,258
Generation Selected Participated Total
Obs. Mean Std. Dev. Obs. Mean Std. Dev.
1 86 0.68 0.47 64 0.51 0.50 126
2 150 0.32 0.47 125 0.26 0.44 474
3 99 0.25 0.43 85 0.22 0.41 394
4 98 0.21 0.41 74 0.16 0.36 472
5 101 0.15 0.36 90 0.14 0.34 655
6 105 0.18 0.39 95 0.16 0.37 581
7 100 0.18 0.38 83 0.15 0.36 556
Total 739 0.23 0.42 616 0.19 0.39 3,258

50
Panel D: Stage of start-up at application by generation
Generation
1 2 3 4 5 6 7 Total
- 126 14 2 2 5 0 0 149
Concept 0 118 100 124 155 137 53 687
Functional Product with users 0 83 69 87 140 126 195 700
Scaling Sales 0 21 11 24 19 18 35 128
Working Prototype in Development 0 238 212 235 336 300 273 1,594
Total 126 474 394 472 655 581 556 3,258
Panel E: Start-up age at application by generation
Generation
1 2 3 4 5 6 7 Total
- 0 2 0 9 6 1 0 18
12-24 months 19 51 33 52 56 54 73 338
6-12 months 30 119 108 135 204 174 250 1,020
Less than 6 months 66 276 231 276 389 352 233 1,823
More than 2 years 11 26 22 0 0 0 0 59
Total 126 474 394 472 655 581 556 3,258
Panel F: Continent of leader by generation
Generation
1 2 3 4 5 6 7 Total
- 4 82 1 4 3 0 0 94
Africa 2 4 0 2 7 4 2 21
Asia 10 23 22 40 47 51 80 273
Europe 26 81 79 82 94 110 101 573
North America 56 142 118 122 112 106 103 759
Oceania 2 8 6 6 12 6 5 45
South America 26 134 168 216 380 304 265 1,493
Total 126 474 394 472 655 581 556 3,258
Panel G: Gender leader by generation
Generation
1 2 3 4 5 6 7 Total
- 5 97 76 305 439 83 347 1,352
Female 8 49 47 24 27 78 28 261
Male 113 328 271 143 189 420 181 1,645
Total 126 474 394 472 655 581 556 3,258
Table 1 describes the composition of the sample. The full sample includes 3,258 observations. Panel A
shows the composition of the sample including the fraction of selected and final participants in the
program. Panels B-E (F-I) describe the composition of the sample across characteristics of the
applicant start-ups (founders).

51
Table 2- Summary Statistics
Variable Obs. Mean Std. Dev. Min Max
Chilean 3,258 0.21 0.41 0 1
Age 1,582 30.33 6.76 19 84
Gender (male) 3,258 0.50 0.50 0 1
Start-up has a working prototype 3,258 0.49 0.50 0 1
Money raised before program 2,779 0.26 0.44 0 1
Listing in AngeList 3,258 0.2 0.4 0 1
Listing in Crunchbase 3,258 0.14 0.35 0 1
Listing in Linkedin 3,258 0.25 0.43 0 1
Listing in Facebook 3,258 0.35 0.48 0 1
Followers in Linkedin 814 68.96 279.46 0 4,001
Likes in Facebook (K) 1,151 0.65 5.36 0 118
Searches in Google 3,258 13.96 27.57 0 95
Global Ranking Alexa 3,258 2.03 5.74 0 186
Followers in AngeList 662 31.54 76.17 0 1,120
Table 1 presents the summary statistics of the main variables used in the empirical strategy. The full
sample includes 3,258 observations.

52
Table 3- Discontinuity probability of participation around ranking cutoff
(1) (2) (3) (4)
Above 0.166*** 0.172*** 0.190*** 0.306***
(0.041) (0.041) (0.047) (0.076)
Constant 0.311*** 0.255*** 0.259***
(0.022) (0.042) (0.042)
Observations 3,258 3,258 2,779 643
R-squared 0.399 0.401 0.427
Generation FE No Yes Yes No
Covariates No No Yes No
Estimate OLS OLS OLS CCT
This table shows the discontinuity in the probability of participation around the ranking cutoff.
Columns (1)-(3) report the constant ( 𝛿) and the coefficient of 𝑎𝑏𝑜𝑣𝑒 (𝛾) of the regression:
𝑎𝑐𝑐𝑒𝑙𝑒𝑟𝑎𝑡𝑖𝑜𝑛 = 𝛿 + 𝛾𝑎𝑏𝑜𝑣𝑒 + 𝑓(𝑅𝑎𝑛𝑘 − 𝑐𝑢𝑡𝑜𝑓𝑓) + 휀, where participation is a variable that equals
one if the applicant participated in the accelerator, on 𝑎𝑏𝑜𝑣𝑒, a variable that equals 1 if the applicant
ranks above 100th
in its generation and 0 otherwise, and 𝑓(𝑅𝑎𝑛𝑘 − 𝑐𝑢𝑡𝑜𝑓𝑓) a 4th
degree polynomial of
the modified rank (i.e., 𝑧 = 𝑅𝑎𝑛𝑘 − 𝑐𝑢𝑡𝑜𝑓𝑓). The estimated coefficients for the polynomial terms are
not presented in the table to conserve space. Columns (2) and (3) present the estimates when the
regression additionally includes generation fixed effects and covariates, respectively. The covariates
included are Chilean (i.e., a variable that equals one if the applicant leader is Chilean), Gender, Money
Raised (pre application), and Prototype (i.e., a variable that equals one if the project already has a
prototype). Column (4) reports the estimates when using a local linear estimation following Calonico et
al. (2014) (CCT). The optimal bandwidth selection algorithm produces three bandwidths based on
Ludwig and Miller (2007), Imbens and Kalyanaraman (2012) and Calonico et al. (2014) (CCT). The
estimated bandwidths range between 47 and 117 observations, results are presented for the bandwidth of
47 as estimated by the CCT method. Robust standard errors are presented in parenthesis. *, **, and ***
indicate statistical significance at the 10%, 5%, and 1% levels, respectively.
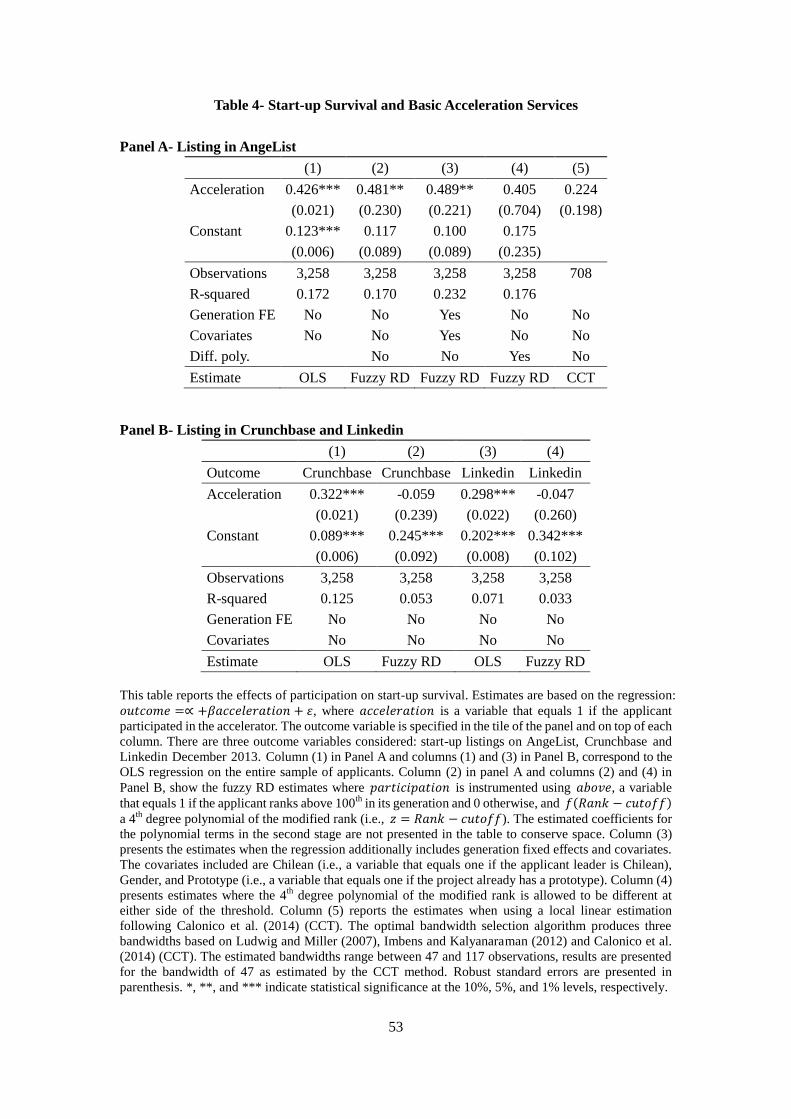
53
Table 4- Start-up Survival and Basic Acceleration Services
Panel A- Listing in AngeList
(1) (2) (3) (4) (5)
Acceleration 0.426*** 0.481** 0.489** 0.405 0.224
(0.021) (0.230) (0.221) (0.704) (0.198)
Constant 0.123*** 0.117 0.100 0.175
(0.006) (0.089) (0.089) (0.235)
Observations 3,258 3,258 3,258 3,258 708
R-squared 0.172 0.170 0.232 0.176
Generation FE No No Yes No No
Covariates No No Yes No No
Diff. poly. No No Yes No
Estimate OLS Fuzzy RD Fuzzy RD Fuzzy RD CCT
Panel B- Listing in Crunchbase and Linkedin
(1) (2) (3) (4)
Outcome Crunchbase Crunchbase Linkedin Linkedin
Acceleration 0.322*** -0.059 0.298*** -0.047
(0.021) (0.239) (0.022) (0.260)
Constant 0.089*** 0.245*** 0.202*** 0.342***
(0.006) (0.092) (0.008) (0.102)
Observations 3,258 3,258 3,258 3,258
R-squared 0.125 0.053 0.071 0.033
Generation FE No No No No
Covariates No No No No
Estimate OLS Fuzzy RD OLS Fuzzy RD
This table reports the effects of participation on start-up survival. Estimates are based on the regression:
𝑜𝑢𝑡𝑐𝑜𝑚𝑒 =∝ +𝛽𝑎𝑐𝑐𝑒𝑙𝑒𝑟𝑎𝑡𝑖𝑜𝑛 + 휀, where 𝑎𝑐𝑐𝑒𝑙𝑒𝑟𝑎𝑡𝑖𝑜𝑛 is a variable that equals 1 if the applicant
participated in the accelerator. The outcome variable is specified in the tile of the panel and on top of each
column. There are three outcome variables considered: start-up listings on AngeList, Crunchbase and
Linkedin December 2013. Column (1) in Panel A and columns (1) and (3) in Panel B, correspond to the
OLS regression on the entire sample of applicants. Column (2) in panel A and columns (2) and (4) in
Panel B, show the fuzzy RD estimates where 𝑝𝑎𝑟𝑡𝑖𝑐𝑖𝑝𝑎𝑡𝑖𝑜𝑛 is instrumented using 𝑎𝑏𝑜𝑣𝑒, a variable
that equals 1 if the applicant ranks above 100th
in its generation and 0 otherwise, and 𝑓(𝑅𝑎𝑛𝑘 − 𝑐𝑢𝑡𝑜𝑓𝑓)
a 4th
degree polynomial of the modified rank (i.e., 𝑧 = 𝑅𝑎𝑛𝑘 − 𝑐𝑢𝑡𝑜𝑓𝑓). The estimated coefficients for
the polynomial terms in the second stage are not presented in the table to conserve space. Column (3)
presents the estimates when the regression additionally includes generation fixed effects and covariates.
The covariates included are Chilean (i.e., a variable that equals one if the applicant leader is Chilean),
Gender, and Prototype (i.e., a variable that equals one if the project already has a prototype). Column (4)
presents estimates where the 4th
degree polynomial of the modified rank is allowed to be different at
either side of the threshold. Column (5) reports the estimates when using a local linear estimation
following Calonico et al. (2014) (CCT). The optimal bandwidth selection algorithm produces three
bandwidths based on Ludwig and Miller (2007), Imbens and Kalyanaraman (2012) and Calonico et al.
(2014) (CCT). The estimated bandwidths range between 47 and 117 observations, results are presented
for the bandwidth of 47 as estimated by the CCT method. Robust standard errors are presented in
parenthesis. *, **, and *** indicate statistical significance at the 10%, 5%, and 1% levels, respectively.

54
Table 5- Distribution of survey respondents
Contacted Responded
Generation Freq. Percent Cum. Freq. Percent Cum.
G1 250 6.92 6.92 20 4.46 4.46
G2 478 13.23 20.14 52 11.61 16.07
G3 422 11.68 31.82 41 9.15 25.22
G4 424 11.73 43.55 45 10.04 35.27
G5 570 15.77 59.32 66 14.73 50.00
G6 620 17.16 76.48 84 18.75 68.75
G7 850 23.52 100 140 31.25 100
Total 3,614 100 448 100
This table reports the distribution of survey respondents. An email invitation to participate in the
survey was sent in October of 2014 to all Start-up Chile applicants from the first generation through the
seventh. A total of 3,798 invitations were sent out. We received responses from 448 participants—12.4%
response rate. Generation 1 applicants applied to the program in March of 2011 and those from
generation 7 did so in March of 2013. Generation 7 graduated from the program in January of 2014.
Therefore, all the surveyed population of startups had a considerable amount of time since inception
and graduation from Start-Up Chile.

55
Table 6- Distribution of survey respondents by fate
Exit Alive Pivoted Closed
Generation Freq. Perc. Freq. Perc. Freq. Perc. Freq. Perc. Total
G1 2 10% 9 45% 6 30% 3 15% 20
G2 11 21% 20 38% 11 21% 10 19% 52
G3 3 7% 12 29% 19 46% 7 17% 41
G4 7 16% 23 51% 13 29% 2 4% 45
G5 6 9% 30 45% 24 36% 6 9% 66
G6 16 19% 38 45% 24 29% 6 7% 84
G7 5 4% 90 64% 36 26% 9 6% 140
Total 50 11% 222 50% 133 30% 43 10% 448
This table reports the distribution of survey respondents by fate. An email invitation to participate in
the survey was sent in October of 2014 to all Start-up Chile applicants from the first generation through
the seventh. A total of 3,798 invitations were sent out. We received responses from 448
participants—12.4% response rate.

56
Table 7: Differences in survey-based performance measures across participants
and non-participants
Non-Participant Participant Kolmogorov-
Smirnov Performance Measure Mean Obs. Mean Obs.
Level of Business Idea Implementation 7.21 277 7.95 99 0.049
Phase of Business Development 6.09 275 6.75 99 0.004
Full-Time Job Creation 3.38 172 4.23 62 0.055
Company Growth (%) 61.12 179 71.46 70 0.017
Pre-Money Valuation (USD) 12.59 163 13.14 67 0.061
Market Share (%) 22.37 112 12.78 54 0.448
Alter Perceived Success 5.52 200 6.01 71 0.280
Goal Attainment 5.02 155 5.47 59 0.191
Capital Raised (log USD) 10.27 175 11.33 79 0.000
Accumulated Sales (log USD) 9.13 115 9.41 43 0.770
Profit (USD) 8.62 80 9.05 28 0.745
This table reports differences in several survey-based performance measures. An email invitation to
participate in the survey was sent in October of 2014 to all Start-up Chile applicants from the first
generation through the seventh. A total of 3,798 invitations were sent out. We received responses from
448 participants—12.4% response rate.
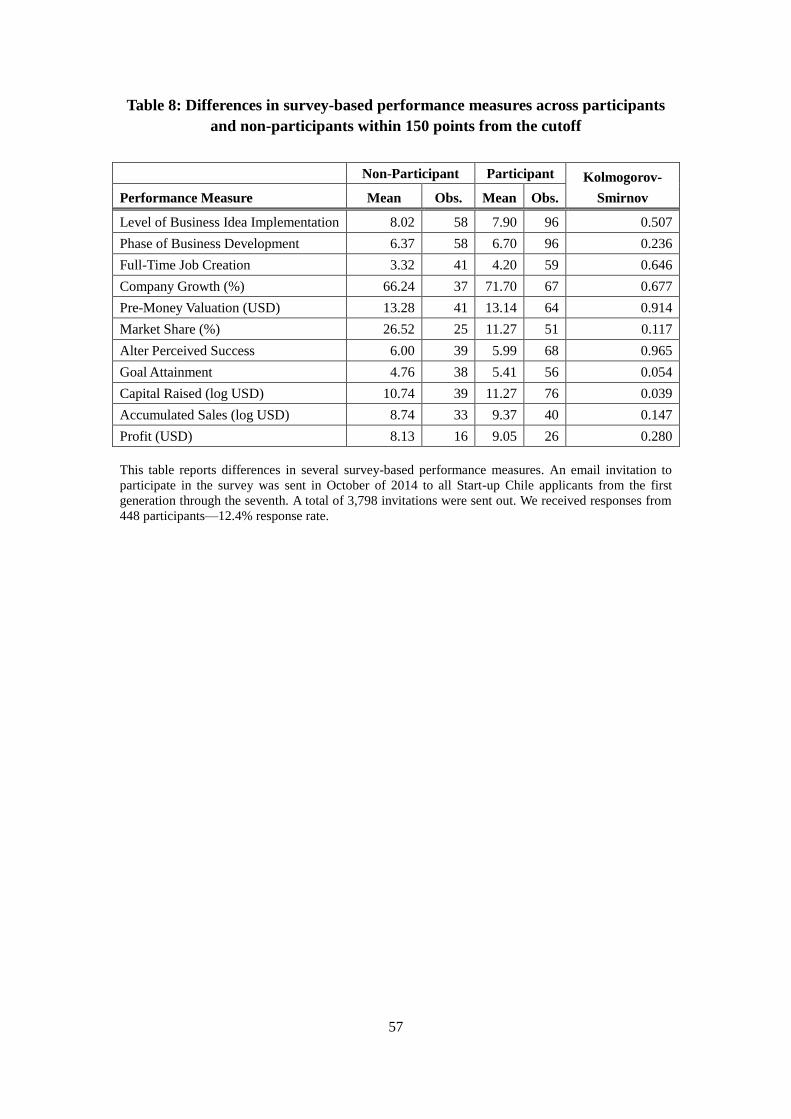
57
Table 8: Differences in survey-based performance measures across participants
and non-participants within 150 points from the cutoff
Non-Participant Participant Kolmogorov-
Smirnov Performance Measure Mean Obs. Mean Obs.
Level of Business Idea Implementation 8.02 58 7.90 96 0.507
Phase of Business Development 6.37 58 6.70 96 0.236
Full-Time Job Creation 3.32 41 4.20 59 0.646
Company Growth (%) 66.24 37 71.70 67 0.677
Pre-Money Valuation (USD) 13.28 41 13.14 64 0.914
Market Share (%) 26.52 25 11.27 51 0.117
Alter Perceived Success 6.00 39 5.99 68 0.965
Goal Attainment 4.76 38 5.41 56 0.054
Capital Raised (log USD) 10.74 39 11.27 76 0.039
Accumulated Sales (log USD) 8.74 33 9.37 40 0.147
Profit (USD) 8.13 16 9.05 26 0.280
This table reports differences in several survey-based performance measures. An email invitation to
participate in the survey was sent in October of 2014 to all Start-up Chile applicants from the first
generation through the seventh. A total of 3,798 invitations were sent out. We received responses from
448 participants—12.4% response rate.

58
Table 9- Discontinuity probability of mentoring around score of 3.6
(1) (2) (3)
Above 0.340*** 0.295** 0.271**
(0.117) (0.116) (0.116)
Constant -0.002 -0.120** -0.088
(0.003) (0.057) (0.071)
Observations 247 247 245
R-squared 0.497 0.528 0.550
Generation FE No Yes Yes
Covariates No No Yes
Estimate OLS OLS OLS
This table shows the discontinuity in the probability of participation around the ranking cutoff.
Columns (1)-(3) report the constant ( 𝛿) and the coefficient of 𝑎𝑏𝑜𝑣𝑒 (𝛾) of the regression:
𝑎𝑐𝑐𝑒𝑙𝑒𝑟𝑎𝑡𝑖𝑜𝑛 = 𝛿 + 𝛾𝑎𝑏𝑜𝑣𝑒 + 𝑓(𝑅𝑎𝑛𝑘 − 𝑐𝑢𝑡𝑜𝑓𝑓) + 휀, where participation is a variable that equals
one if the applicant participated in the accelerator, on 𝑎𝑏𝑜𝑣𝑒, a variable that equals 1 if the applicant
ranks above 100th
in its generation and 0 otherwise, and 𝑓(𝑅𝑎𝑛𝑘 − 𝑐𝑢𝑡𝑜𝑓𝑓) a 4th
degree polynomial of
the modified rank (i.e., 𝑧 = 𝑅𝑎𝑛𝑘 − 𝑐𝑢𝑡𝑜𝑓𝑓). The estimated coefficients for the polynomial terms are
not presented in the table to conserve space. Columns (2) and (3) present the estimates when the
regression additionally includes generation fixed effects and covariates, respectively. The covariates
included are Chilean (i.e., a variable that equals one if the applicant leader is Chilean), Gender, Money
Raised (pre application), and Prototype (i.e., a variable that equals one if the project already has a
prototype). Robust standard errors are presented in parenthesis. *, **, and *** indicate statistical
significance at the 10%, 5%, and 1% levels, respectively.
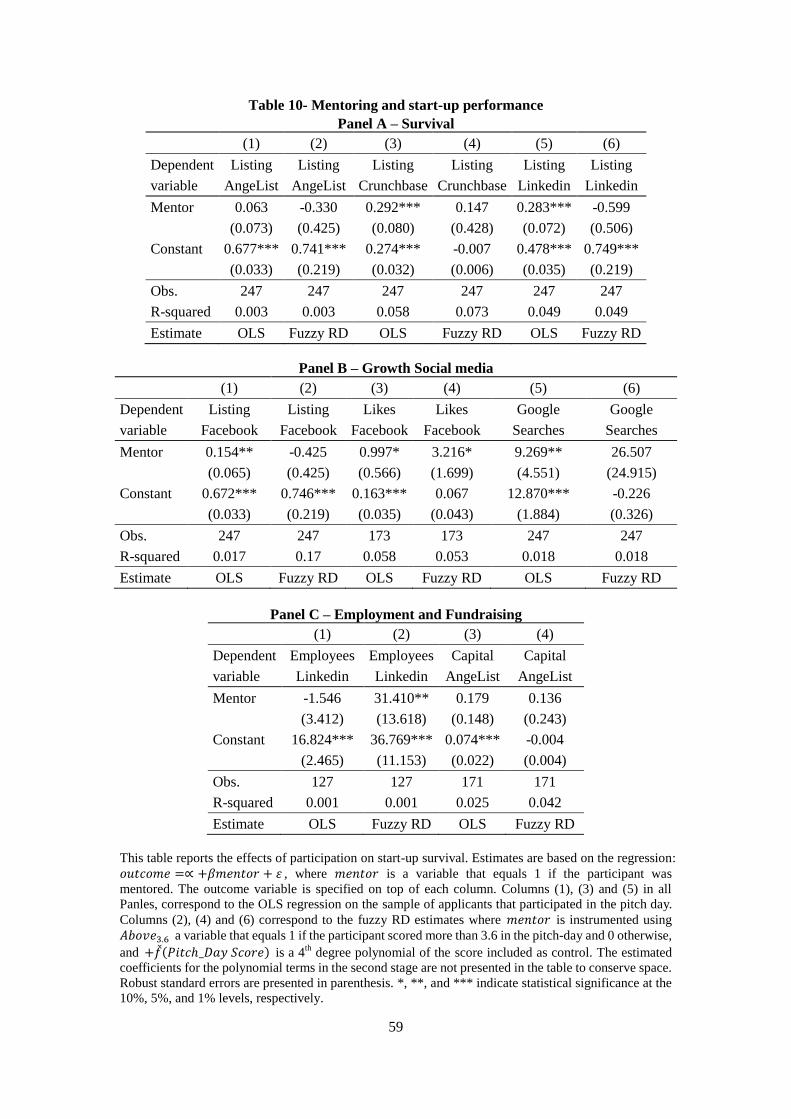
59
Table 10- Mentoring and start-up performance
Panel A – Survival
(1) (2) (3) (4) (5) (6)
Dependent
variable
Listing
AngeList
Listing
AngeList
Listing
Crunchbase
Listing
Crunchbase
Listing
Listing
Mentor 0.063 -0.330 0.292*** 0.147 0.283*** -0.599
(0.073) (0.425) (0.080) (0.428) (0.072) (0.506)
Constant 0.677*** 0.741*** 0.274*** -0.007 0.478*** 0.749***
(0.033) (0.219) (0.032) (0.006) (0.035) (0.219)
Obs. 247 247 247 247 247 247
R-squared 0.003 0.003 0.058 0.073 0.049 0.049
Estimate OLS Fuzzy RD OLS Fuzzy RD OLS Fuzzy RD
Panel B – Growth Social media
(1) (2) (3) (4) (5) (6)
Dependent
variable
Listing
Listing
Likes
Likes
Searches
Searches
Mentor 0.154** -0.425 0.997* 3.216* 9.269** 26.507
(0.065) (0.425) (0.566) (1.699) (4.551) (24.915)
Constant 0.672*** 0.746*** 0.163*** 0.067 12.870*** -0.226
(0.033) (0.219) (0.035) (0.043) (1.884) (0.326)
Obs. 247 247 173 173 247 247
R-squared 0.017 0.17 0.058 0.053 0.018 0.018
Estimate OLS Fuzzy RD OLS Fuzzy RD OLS Fuzzy RD
Panel C – Employment and Fundraising
(1) (2) (3) (4)
Dependent
variable
Employees
Employees
Capital
AngeList
Capital
AngeList
Mentor -1.546 31.410** 0.179 0.136
(3.412) (13.618) (0.148) (0.243)
Constant 16.824*** 36.769*** 0.074*** -0.004
(2.465) (11.153) (0.022) (0.004)
Obs. 127 127 171 171
R-squared 0.001 0.001 0.025 0.042
Estimate OLS Fuzzy RD OLS Fuzzy RD
This table reports the effects of participation on start-up survival. Estimates are based on the regression:
𝑜𝑢𝑡𝑐𝑜𝑚𝑒 =∝ +𝛽𝑚𝑒𝑛𝑡𝑜𝑟 + 휀 , where 𝑚𝑒𝑛𝑡𝑜𝑟 is a variable that equals 1 if the participant was
mentored. The outcome variable is specified on top of each column. Columns (1), (3) and (5) in all
Panles, correspond to the OLS regression on the sample of applicants that participated in the pitch day.
Columns (2), (4) and (6) correspond to the fuzzy RD estimates where 𝑚𝑒𝑛𝑡𝑜𝑟 is instrumented using
𝐴𝑏𝑜𝑣𝑒3.6 a variable that equals 1 if the participant scored more than 3.6 in the pitch-day and 0 otherwise,
and +𝑓(𝑃𝑖𝑡𝑐ℎ_𝐷𝑎𝑦 𝑆𝑐𝑜𝑟𝑒) is a 4th
degree polynomial of the score included as control. The estimated
coefficients for the polynomial terms in the second stage are not presented in the table to conserve space.
Robust standard errors are presented in parenthesis. *, **, and *** indicate statistical significance at the
10%, 5%, and 1% levels, respectively.

60
Table AI. Definition of Variables
Name of variable Definition
Covariates
Age Leader’s age at the application date
Chilean Indicator variable that equals 1 if start-up’s leader is Chilean
Gender Indicator variable that equals 1 if start-up’s leader is female
Money Raised Indicator variable that equals 1 if start-up raised funds by the
application date
Prototype Indicator variable that equals 1 if start-up has a working prototype
at the application date
Outcomes
AngeList Listing Indicator variable that equals 1 if startup is listed in AngeList
Crunchbase Listing Indicator variable that equals 1 if startup is listed in Crunchbase
LinkedIn Listing Indicator variable that equals 1 if startup is listed in Linkedin
Followers AngelList Number of followers in AngeList
Followers LinkedIn Number of followers in LinkedIn
Facebook Likes Number of likes in Facebook
Google Searches Normalized number of company’s name searches in Google
Capital AngeList Capital raised as posted in AngeLIst
Employees Linkedin Company size as posted in LinkedIn
Table AII. Survey Questions
Fate of startup question
Please choose the statement that best describes what has happened to your startup since your
application to Start-Up Chile.
1. The company is alive, but I sold or gave my shares to someone else.
2. The company is alive, and I still own shares, but I no longer work primarily at that
company.
3. The company was sold to (or it merged with) another company, and it no longer exists
as an independent entity.
4. The company is alive and I am currently working there.
5. I pivoted this company into my current startup.
6. The startup is currently on stand-by while I am working on starting a new company.
7. I closed that company and have started a new company.
8. I closed that company and I am not currently working at my own startup.
9. The startup is currently on stand-by (nobody is working on it), and I am not currently
working at my own startup.
We categorized responses to questions 1, 2 and 3 as a startup that was sold to- or merged
with- another company (exit). We categorized responses to question 4 as a startup that was

61
still operational and working on the original opportunity, and the entrepreneur was currently
working there (alive). We categorized responses to questions 5, 6 and 7 as a pivot into a new
startup (pivoted). We categorized responses to questions 8 and 9 as a closed, unsuccessful
startup (closed).