Embed Size (px)
Citation preview

BURNHAMHOLDINGS, INC. 2020 ANNUAL REPORT
BU
RN
HA
M H
OLD
ING
S, IN
C.
20
20 A
nnua
l Rep
ort
LETT
ER T
O O
UR
STO
CK
HO
LDER
S
This letter typically begins with a review of Burnham Holdings’ (BHI) financial performance. However, since 2020 was not a typical year, we thought it would be more fitting to focus on the extraordinary efforts our co-workers at every level of the organization made to address the unique challenges of the COVID-19 pandemic.
The pandemic began to manifest itself in March while we were visiting our facilities in Ohio, Indiana and North Carolina to conduct our annual employee meetings. It quickly became clear the pandemic was going to have a significant impact on our businesses and operations. As a result, we cut our travels short as Ohio locked down and we returned to Lancaster from our visit to Casting Solutions. We spent the drive back discussing what actions needed to be quickly taken to operate our business in a way that protected our employees, shareholders and communities.
Because our businesses support the HVAC industry, all our operations were deemed “essential,” allowing for continued operation of all our facilities throughout the pandemic. Our first action was to expedite the return of a team of engineers from Italy, where they were working in collaboration with a vendor on
next-generation advanced combustion technology. Next, we immediately assembled a multidisciplined COVID Quick Response Team to develop a comprehensive set of decision protocols to help manage our response to various COVID-related situations. The team was led by Chris and comprised operational, finance, legal, risk management and human resources business leaders, who held daily video calls to assess and respond to the quickly changing landscape.
Ongoing communication with our co-workers and union leadership was critical as we developed and implemented new social distancing practices, issued personal protective equipment (PPE) and developed cleaning protocols in all plants. We also quickly transitioned to a work-from-home environment for those whose jobs allowed. All levels of the organization came together — driven by a shared common goal — to protect the safety of our co-workers, their families and our communities, while also working to assure the success of BHI.
Our product sales teams transitioned to a virtual environment, introducing a number of new products via video conference. Product development continued as the engineering groups adjusted to interrupted lab time and virtual meetings. Our manufacturing and assembly operations worked through COVID protocols that dictated quarantine restrictions, thus creating staffing challenges. We also implemented a number of cost control measures to assure our financial viability. We could not be prouder of our colleagues and how they responded to the COVID-created challenges.
The impact to our business volume was significant. Sales at our residential businesses were off considerably in the first half, as our primary markets went into complete lockdown, but fortunately started to rebound during the second half of the year. Alternately, commercial product sales were steady during the first half of 2020 as we worked through our substantial backlog for commercial boilers. However, COVID significantly slowed the pace of new non-residential projects under development, leading to a lag in commercial sales during the second half of the year.
Doug Brossman (left) and Chris Drew.
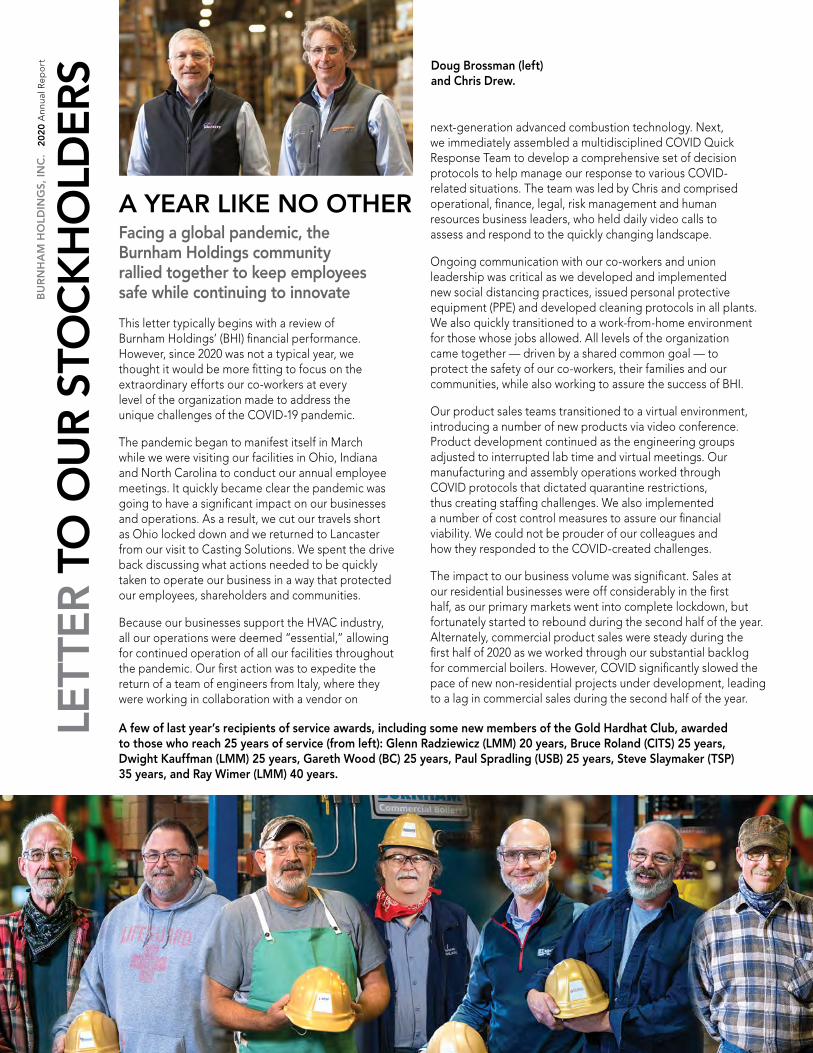
A few of last year’s recipients of service awards, including some new members of the Gold Hardhat Club, awarded to those who reach 25 years of service (from left): Glenn Radziewicz (LMM) 20 years, Bruce Roland (CITS) 25 years, Dwight Kauffman (LMM) 25 years, Gareth Wood (BC) 25 years, Paul Spradling (USB) 25 years, Steve Slaymaker (TSP) 35 years, and Ray Wimer (LMM) 40 years.
A YEAR LIKE NO OTHERFacing a global pandemic, the Burnham Holdings community rallied together to keep employees safe while continuing to innovate
2
TABLE OF CONTENTSLetter to Our Stockholders .............................................................................1
Company Profile ...............................................................................................3
Our Vision and Principles ................................................................................3
Company Subsidiaries & Locations ..............................................................3
Financial Highlights .........................................................................................4
Review of Operations ......................................................................................5
Certain Significant Estimates .........................................................................9
Management’s Report & Report of Independent Auditors ..................10
Consolidated Financial Statements ............................................................ 11
Notes to the Consolidated Financial Statements ...........................................15
Ten-Year Summary ..........................................................................................27
Investor & Stockholder Information ........................................................... 28
Directors & Officers .......................................................................................30
Although we are never happy to report lower sales and profits, we are — in light of the above efforts and challenges — very pleased with our financial performance in 2020. Net sales for the year were $187.5 million — a decrease of $24.8 million, or 11.7%, versus 2019. Although sales of both residential and commercial boiler products were lower, we did see sustained growth of our new high-efficiency condensing commercial products as they continued to gain broader acceptance in the marketplace.
Net income in 2020 was $6.5 million, or $1.43 per share. Net income for the year was down $2.2 million, or $0.48 per share, versus 2019. Finally, the board of directors declared a quarterly dividend of $0.22 per share at its February 2021 meeting.
We remain committed to meet the evolving needs of our customers for more sophisticated, high-efficiency products. We have made significant investments in our residential and commercial product development efforts. More recently, we have increased our investment in our operational and sales and marketing teams.
Examples of these investments and accomplishments include:
• Launch of the new Alta family of high-efficiency condensing residential boiler and combi products, which introduced first-of-its-kind “gas adaptive” combustion technology to North America. Alta’s world-class combustion system optimizes fuel/air ratios, providing incredibly clean, low-carbon emissions performance.
• The residential boiler engineering team enhanced the entire residential boiler product line to meet increased federal minimum efficiency regulations that became effective January 1, 2021.
• Thermal Solutions and Bryan Steam improved the combustion technology of their successful ARCTIC/FREEFLEX and AMP/BFIT™ product families of commercial condensing boilers, giving those products one of the lowest emission profiles in the industry. Overall, these high-efficiency products drove unit and share of market sales growth in 2020 for the third consecutive year.
• Our residential furnace business, Thermo Pride, delivered its eighth consecutive year of increased oil furnace sales and market share gains through expansion of its multibrand, multichannel strategy.
• Enviro Power, the energy technology company we invested in last year, continued to make progress on its innovative combined heat and power product — SmartWatt. The first “Alpha” units have been completed, with test installations scheduled in early 2021. This groundbreaking technology adds to our portfolio of high-efficiency, low-emission, carbon-reducing products.
We also announced several important director changes that will take effect at our annual meeting on April 26, 2021. George W. Hodges will retire from the board after 15 years of service as a director, including the last year as chairman. We have a deep appreciation and gratitude for George’s contributions over the years. In his one year as chair, George initiated efforts which had a significant and positive impact on the culture of our board and organization. He is a thoughtful, strategic leader, and his insights and leadership will be greatly missed.
Replacing George as chairman will be John W. Lyman. John has been a director since 2002 and has served on several board committees, including the Audit Committee, Corporate Compensation and Stock Option Committee and Nominating Committee. We look forward to the benefits of John’s long tenure with the company as we continue to execute our growth strategies.
We also want to take this opportunity to thank you, our shareholders, for your ongoing support and loyalty. Our future looks bright. We will continue our strategy of delivering the finest boilers and furnaces on the market through innovation, efficiency, industry leadership and — most of all — caring for our customers, employees and shareholders.
Finally, we want to end where we began, recognizing our colleagues and co-workers for their countless contributions during this year of extraordinary change. We are blessed to have an experienced workforce, with over 20% of our co-workers serving more than 25 years with our various companies. Unfortunately, the pandemic limited our ability to personally recognize the accomplishments of our colleagues, including our annual service award gathering, where we recognize our colleagues as they reach service milestones. Instead, we personally delivered the awards throughout our facilities. All told, we had over 90 employees who achieved service milestones last year, including 40 with over 25 years of service, one with 40 years of service and one with 45 years of service. Their experience and guidance to our younger co-workers is a big part of our legacy of success.
We welcome your questions and comments at any time. Thank you!
Sincerely,
Douglas S. Brossman Christopher R. Drew Vice Chairman & CEO President and COO
3
BU
RN
HA
M H
OLD
ING
S, IN
C.
20
20 A
nnua
l Rep
ort
HVAC
CO
MPA
NY
PR
OFI
LE
Bryan Steam, LLC Peru, INBurnham Casualty Insurance Co. Burlington, VTBurnham, LLC Lancaster, PABurnham Financial, LLC Wilmington, DEBurnham Services, Inc. Wilmington, DECasting Solutions, LLC Zanesville, OHCommercial and Industrial Thermal Solutions, LLC Lancaster, PACommercial Leasing and Services, LLC Lancaster, PACrown Boiler Co. Philadelphia, PAGovernale Company, Inc. Brooklyn, NYLancaster Metal Manufacturing, Inc. Lancaster, PANew Yorker Boiler Company, Inc. Hatfield, PANorwood Manufacturing, Inc. Norwood, NCThermal Solutions Products, LLC Lancaster, PAThermal Solutions Sales Company, LLC Lancaster, PAThermo Products, LLC Denton, NCU.S. Boiler Company, Inc. Lancaster, PAVelocity Boiler Works, LLC Philadelphia, PA
BU
RN
HA
M H
OLD
ING
S, IN
C.
20
20 A
nnua
l Rep
ortBurnham Holdings, Inc. (the Company) provides the Heating,
Ventilating, and Air Conditioning (HVAC) industry with thermal and interior comfort solutions used in a wide range of residential, commercial, and industrial applications.
Our subsidiaries are market leaders in the design, manufacture, and sale of boilers and related HVAC products and accessories, including advanced control systems, furnaces, radiators, and air conditioning systems. We offer a broad line of high-value, energy-efficient products, sold under well-established brand names. Products are manufactured at facilities in the East, South, and Midwestern United States.
Our residential subsidiaries drive customer value through highly efficient, innovative products, providing interior comfort solutions for homes and small buildings. U.S. Boiler Company, Velocity Boiler Works, New Yorker Boiler Company, and Governale collectively offer a full range of residential hydronic heating products, including cast iron, stainless steel, aluminum, and steel boilers, as well as cast iron and steel heat distribution products. Thermo Products offers warm air furnaces and central air conditioning systems for the residential heating and cooling markets.
Commercial and industrial heating and process needs are addressed by our commercial subsidiaries, including Burnham Commercial, Bryan Steam, and Thermal Solutions. Commercial heating applications include military bases, multi-unit residential buildings, health care, government, education, and hospital facilities. Industrial applications include any project where steam or hot water is needed. Product offerings encompass a
full range of cast iron, stainless steel, fire-tube, water-tube, and copper-tube boilers, as well as boiler room accessories, for commercial and industrial markets.
Vertical integration of our operations is provided by subsidiaries that manufacture key product components. Every year, Casting Solutions converts tens of thousands of tons of scrap metal into boiler castings and other gray and ductile iron castings. Painted light-gauge metal parts are made by Norwood Manufacturing and Lancaster Metal Manufacturing. Collectively, our affiliated companies offer more types and models of products and accessory equipment than any of our competitors. Our commitment to shareholder value through innovation has provided the foundation for our history of proven performance. Continued investment in HVAC technologies, as well as operational and product excellence, will continue to drive that foundation forward.
OUR VISIONTo be leaders in providing thermal solutions for residential, commercial, and industrial applications through highly efficient, dependable products and services.
OUR PRINCIPLESPerformance — Create shareholder value through industry leadership and operational excellence.
Innovation — Create customer solutions by applying advanced technology to create superior products and services.
Engagement — Committed to the success of our customers, colleagues, and community.
Integrity — We keep our promises.
COMPANY SUBSIDIARIES & LOCATIONSThe consolidated financial statements include the accounts of the Company and its subsidiaries. The Company does not have any unconsolidated legal entities, “special purpose” entities, or “off-balance-sheet” financial arrangements, nor is it a partner in any joint venture. The Company and its subsidiaries have approximately 780 employees nationwide, of which approximately 46% are union employees covered through separate collective bargaining agreements. Generally, the agreements are for a three-year period and expire at different times, including one agreement expiring within one year covering 48% of union employees. Major subsidiaries of the company and their locations are shown below.
4
HVAC1716 20 1716 20 1716 200
75
150
225
300
19 1919180
5
10
15
20
25
30
18
Net Sales(in millions)
Net Income (Loss)(in millions)
Total Debt(in millions)
0
–2
2
4
6
8
10
18 181716 2019
Basic Earnings (Loss) per Share (in dollars)
–0.5
0.0
0.5
1.0
1.5
2.0
Dividends per Share
0.88
(In millions, except per share data)
Percent Change
2019 2020 2019/2020
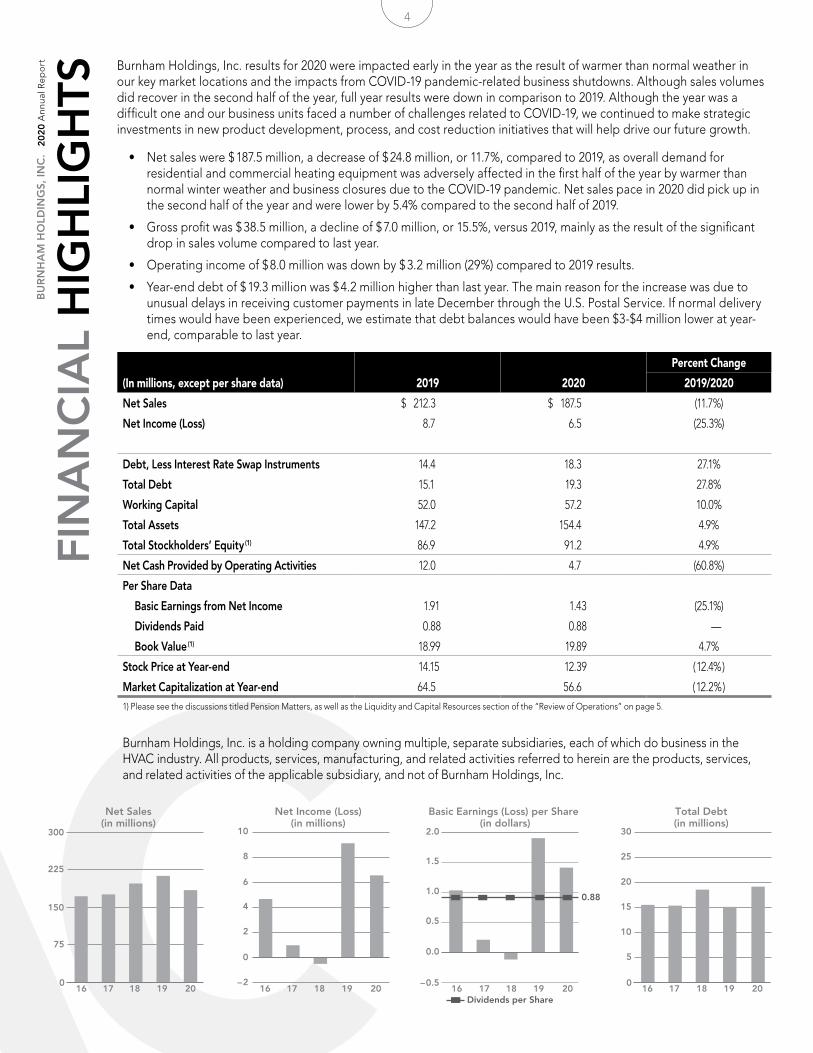
Net Sales $ 212.3 $ 187.5 (11.7%)
Net Income (Loss) 8.7 6.5 (25.3%)
Debt, Less Interest Rate Swap Instruments 14.4 18.3 27.1%
Total Debt 15.1 19.3 27.8%
Working Capital 52.0 57.2 10.0%
Total Assets 147.2 154.4 4.9%
Total Stockholders’ Equity (1) 86.9 91.2 4.9%
Net Cash Provided by Operating Activities 12.0 4.7 (60.8%)
Per Share Data
Basic Earnings from Net Income 1.91 1.43 (25.1%)
Dividends Paid 0.88 0.88 —
Book Value (1) 18.99 19.89 4.7%
Stock Price at Year-end 14.15 12.39 ( 12.4% )
Market Capitalization at Year-end 64.5 56.6 ( 12.2% )1) Please see the discussions titled Pension Matters, as well as the Liquidity and Capital Resources section of the “Review of Operations” on page 5.
FIN
AN
CIA
L H
IGH
LIG
HTS
Burnham Holdings, Inc. results for 2020 were impacted early in the year as the result of warmer than normal weather in our key market locations and the impacts from COVID-19 pandemic-related business shutdowns. Although sales volumes did recover in the second half of the year, full year results were down in comparison to 2019. Although the year was a difficult one and our business units faced a number of challenges related to COVID-19, we continued to make strategic investments in new product development, process, and cost reduction initiatives that will help drive our future growth.
• Net sales were $ 187.5 million, a decrease of $ 24.8 million, or 11.7%, compared to 2019, as overall demand for residential and commercial heating equipment was adversely affected in the first half of the year by warmer than normal winter weather and business closures due to the COVID-19 pandemic. Net sales pace in 2020 did pick up in the second half of the year and were lower by 5.4% compared to the second half of 2019.
• Gross profit was $ 38.5 million, a decline of $ 7.0 million, or 15.5%, versus 2019, mainly as the result of the significant drop in sales volume compared to last year.
• Operating income of $ 8.0 million was down by $ 3.2 million (29%) compared to 2019 results.
• Year-end debt of $ 19.3 million was $ 4.2 million higher than last year. The main reason for the increase was due to unusual delays in receiving customer payments in late December through the U.S. Postal Service. If normal delivery times would have been experienced, we estimate that debt balances would have been $3-$4 million lower at year-end, comparable to last year.
BU
RN
HA
M H
OLD
ING
S, IN
C.
20
20 A
nnua
l Rep
ort
Burnham Holdings, Inc. is a holding company owning multiple, separate subsidiaries, each of which do business in the HVAC industry. All products, services, manufacturing, and related activities referred to herein are the products, services, and related activities of the applicable subsidiary, and not of Burnham Holdings, Inc.
BU
RN
HA
M H
OLD
ING
S, IN
C.
20
20 A
nnua
l Rep
ort OVERVIEW OF RESULTS
2020 was a year of continued improvement for the Company despite the challenges of the COVID-19 pandemic. We completed multiple engineering projects, improved several manufacturing and assembly operations while maintaining our strong balance sheet. Although overall revenues were negatively impacted by the COVID pandemic, our commercial condensing and furnace businesses continued the strong performances of the last several years. Net sales for the year were $187.5 million, a decrease of 11.7% from last year.
The COVID-19 pandemic had an immediate impact on our business, particularly during the second quarter. As an essential business, Burnham Holdings and its subsidiaries were able to continue all operations with implementation of proper personal protection protocols. All operations quickly instituted social distancing, temperature checking, and cleaning protocols. The majority of the office staff transitioned to a work-from-home posture, which continued throughout the year. In conjunction with union leadership, guidelines and protocols were created to address employee safety concerns and react quickly as new issues arose. Overall, the operations successfully adapted to the new operating environment, delivering strong second half business results and minimizing operational disruptions. It was a significant team effort by the entire organization to keep our employees safe and healthy while continuing to meet the needs of our customers and the end users who rely on our products for their comfort and well-being.
PERFORMANCE PROVEN, TECHNOLOGY FORWARDIn providing interior comfort solutions to the Heating, Ventilating, and Air Conditioning (HVAC) industry for a multitude of residential, commercial, institutional, and industrial applications, the Company has proven its ability to grow value for stakeholders year after year. The installed base of residential and commercial heating products provides a stable revenue stream due to the consistent product replacement cycle. However, meeting the evolving needs of this marketplace requires continued investment in engineering and new product development to ensure new products are in the pipeline to meet future demand. Additionally, we continue to evaluate our future product lines in light of the important conversations around climate change and its impact on society and by extension our core heating markets.
The expectations of our end users continue to evolve. Our organization is constantly tracking emerging technologies to create a clear vision for meeting our customers’ current and future needs through innovative technologies, including more energy-efficient products, “green” products with lower emissions, and smarter controls. It is guided by the needs and desires of end users, homeowners, contractors, specifying engineers, sales representatives, and distributors. The resulting “vision” drives our product development and operational excellence. To this end, we are constantly seeking strategic opportunities in competitive and emerging technologies that benefit our stakeholders.
The end result is a forward-thinking product development strategy that meets exacting requirements today, while delivering new and innovative technologies that can meet the expectations of tomorrow. This philosophy continued to be borne out in 2020 as our engineering teams continued to execute our multi-year product
RE
VIE
W O
F O
PER
ATI
ON
S development strategy, which has resulted in the continued expansion of our current high-efficiency product offerings and the commercialization of a number of advanced heat exchanger, combustion, and control technologies.
2020 had a number of exciting new product introductions, reflecting the results of these investments.
In the Commercial Boiler space, we continued to invest in developing and launching new commercial products and to expand the manufacturing capabilities to support their assembly. Burnham Commercial completed a manufacturing cell to support the assembly of their line of specialized mobile boiler rooms used to provide temporary heat or process steam. Thermal Solutions Products continued its expansion into commercial water heating, completing the certification of four new sizes of commercial condensing water heaters that will be sold under both the Thermal Solutions and Bryan Steam brand names “AMP” or
“B-Fit.” These new models provide a broad range of high efficiency, low emissions water heaters for the commercial water heating market. The commercial engineering teams also introduced “Gen 2” combustion controls, improving turndown, efficiency and firing rate control.
In the Residential Boiler segment, the launch of the Alta/Phantom II combi product was a significant milestone after three years in development. This new residential condensing boiler platform introduces the most advanced
“Adaptive Combustion” platform in the world to the North American market. Offering a sophisticated self-tuning combustion system, this new family of condensing boilers simplifies installation for the contractor while its combustion system auto adapts to atmospheric and venting conditions, ensuring clean, efficient combustion regardless of installation conditions. The first units were installed in Q4 of 2020, with additional sizes launching later in 2021.
New Federal efficiency regulations that went into effect on January 1, 2021, required a refresh of many of our existing products. The residential engineering support teams reviewed, developed, and implemented changes to hundreds of boiler configurations to ensure all current products would meet the new Annual Fuel Utilization Efficiencies (AFUE) required by the new regulations. The engineering work was finished ahead of schedule and our complete residential product line is in compliance with the new regulations.
Our residential furnace business, Thermo Pride, continues to execute at a high level, delivering another solid year of oil and gas furnace sales and market share gains through continued expansion of its multi-brand, multi-channel strategy. During 2020, Thermo Pride refreshed several of its products, rationalizing their furnace SKUs to improve internal operational efficiency and reduce the complexity of the inventory requirements at their wholesale distributors. Their product development pipeline remains full, as they look ahead to expand their wholesale distribution product and enter some additional market segments in the coming years.
The capital investment program instituted among our operations to increase production efficiency and decrease costs over the past several years continued during 2020. We added additional improved metal cutting, forming, and machining capabilities across our businesses as part of a focused effort to increase overall manufacturing efficiency and support our continuous process improvement programs.
5
6
Finally, energy technology company, Enviro Power, in which we acquired a minority stake during 2019, continues to make progress developing their cutting-edge combined heat and power “Smart Watt” appliance. A number of joint engineering activities occurred during 2020, with the first 3 “Alpha” Smart Watt units being assembled and shipped from the Bryan Steam facilities late in the year. Enviro Power’s SmartWatt boiler design aligns extremely well with our core strengths in product engineering and manufacturing. This strategic investment fits with our long-term commitment to develop highly efficient, low-emission heating appliances that serve a broad array of residential and commercial applications.
FINANCIAL PERFORMANCENet sales in 2020 were $ 187.5 million, a decrease of 11.7% compared to the $ 212.3 million sales total achieved in 2019. The vast majority of Burnham Holdings, Inc. consolidated net sales revenue is derived from sales to customers located in the United States. International sales, including Canada and Mexico, were 1.1% of sales in 2020 and 1.4% of sales in 2019. Sales decreased in 2020 due to the mild winter weather early in the year and the impacts of COVID-19 pandemic related business closures that started in the second quarter of 2020. Sales of residential products, which comprised approximately 74% of total sales in 2020, decreased by 10.5% from 2019 levels. However, residential product sales did show improvement in the second half of 2020 with a 1.3% increase compared to 2019 second half sales. Sales of commercial boiler products decreased by 14.8% in 2020, as new project activity was depressed due to COVID-19 related closures of schools, hotels and other users of large commercial boilers. Although sales of commercial boiler products declined in total, sales of new high-efficiency boiler products in 2020 increased compared to 2019.
We remain optimistic about the long-term business outlook for all of our various business units. There is a sizeable installed base of hydronic heating equipment in the U.S. that will be replaced over time — either due to the age of the equipment or because the owner wants to improve the operating efficiency and lower the annual cost of operating the equipment. Due to the wide range of modern, high-efficiency residential and commercial products sold by our subsidiaries, we are able to meet the requirements of virtually any residential or commercial heating application.
Our subsidiaries continue to make investments in projects that will increase employee safety, improve their ability to design and manufacture high-quality value-added products, provide world class customer service, and increase manufacturing productivity. All of these efforts help our subsidiaries to consistently manufacture and market innovative products that are highly competitive in the markets they serve.
Gross profit (profit after deducting cost of goods sold (COGS) from net sales) in 2020 was $ 38.5 million, or 20.5% of net sales. This compares to gross profit of $ 45.5 million in 2019, which represented 21.4% of net sales. Gross profit as a percentage of sales in 2020 was impacted negatively by the decrease in sales volume, along with the impact of spreading fixed manufacturing expenses over a much lower sales volume. In general, raw material price inflation was moderate during most of 2020; however, we began to experience significant increases in certain commodity raw materials prices (scrap and steel) late in the fourth quarter of 2020. We will monitor material prices closely in 2021 and implement pricing actions if material inflation continues.
Selling, general, and administrative expenses (SG&A), shown on the Consolidated Statements of Income on page 11, were lower at $ 30.5 million in 2020 compared to $ 34.4 million in 2019,
a decrease of $ 3.9 million, or 11.3%. Although SG&A expenses were significantly lower in dollar terms, the amount in 2020 on a percentage of sales basis of 16.3% was slightly higher than the 16.2% of sales level of 2019. Income from operations decreased by $3.2 million in 2020 compared to last year.
Other income (expense) as shown on the Consolidated Statements of Income reflects an increase of $ 0.07 million compared to 2019 results. The net increase between years was mainly the result of lower interest rates on the revolving line of credit offset somewhat by lower interest and investment income.
The effective income tax rates for 2020 and 2019 as reported on the Consolidated Statements of Income were 22.7% and 24.4%, respectively. Reported net income in 2020 was $ 6.547 million, a return on net sales of 3.5%, and basic earnings per share of $1.43. This compared to a reported 2019 net income of $ 8.738 million, a return on net sales of 4.1%, and basic earnings per share of $ 1.91.
PENSION MATTERSSteps have been taken with the Company’s pension plan (the Plan) over the past years to protect benefits for retirees and eligible employees while reducing future uncertainty for the Company. Starting in 2003, the Plan was amended to state that newly hired, non-union employees would not be eligible to participate in the Plan. In the years following 2003, the benefit accrual was eliminated for all unionized new hires and active employees with the exception of a closed group of union production employees. While not 100% frozen, these actions have materially reduced the growth of the pension liability in future years. Additionally, the Plan prevents the Company from obtaining any surplus assets of the Plan during a three-year period immediately following a change in control.
The Plan is managed by independent third-party administrators under policies and guidelines established by the Employee Post-retirement Benefits Committee of the Board of Directors. It is a policy of the Committee for the pension trust not to invest directly in the Company stock. Obligations and actuarial assumptions are presented in Note 10 of the financial statements. While the Company believes its assumptions are reasonable based on current knowledge, variables such as future market conditions, investment returns, and employee experience could affect results.
Current pension accounting standards require that the liabilities of the Plan be compared to the fair value of the assets of the Plan as of December 31 of each year, and that any excess or shortfall be recorded as a non-cash asset or a liability, as the case may be, on the balance sheet of the Company. While this gives a snapshot of the health of the Plan at a point in time, it does not consider that the pension liability is honored in the form of retiree benefits paid over a very long period of time, or that the value of financial investments in the pension trust can swing significantly with the economy, or that the liability can change dramatically with relatively small changes in interest rate assumptions.
At the end of 2018, pension plan assets were $ 155.4 million compared to the projected benefit liability of $ 162.7 million, resulting in a recorded balance sheet liability of $ 7.3 million. Financial markets continued to experience significant swings throughout 2019 and 2020 that created both positive and negative impacts to the recorded pension liability, as explained more in the following paragraphs.
In 2019, due to actions taken by the Federal Reserve to lower U.S. interest rates, the discount rate that was used to value plan liabilities at December 31, 2019, was 110 basis points lower than the rate used at the end of 2018 (2.95% versus 4.05%). Since plan
7
BU
RN
HA
M H
OLD
ING
S, IN
C.
20
20 A
nnua
l Rep
ort liabilities move in an inverse relationship to the discount
rate, the amount of total plan liabilities at year-end was $11.9 million higher than at the end of 2018. However, due to the stellar results during 2019 of both U.S. equity and fixed income markets, the value of plan assets at the end of 2019 increased by $15.6 million, $3.7 million more than the increase in plan liabilities, which reduced the net pension liability to $3.7 million. This amount was recorded as a liability at year-end on the Company’s balance sheet.
During 2020, similar factors to 2019 continued to influence both the plan assets and liabilities. Due to the continued above average returns with respect to the Plan’s fixed income and equity investments, the value of plan assets grew by an additional $14.0 million, to end the year at a total of $184.9 million. On the liability side, long-term interest rates continued to decline in 2020 and the discount rate used to value plan liabilities declined an additional 80 basis points to 2.15%. This caused the value of plan liabilities to increase by $10.5 million to a total of $185.1 million. The changes in asset and liability values combined to decrease the net pension liability by $3.5 million during 2020, resulting in a minimal pension liability of $0.2 million at December 31, 2020. While the Plan would appear to be slightly under-funded from this limited, point-in-time accounting view, the Plan easily passes all ERISA funding targets (based on government-defined rates and methods).
The adjustments that are made to pension liabilities on an annual basis as discussed above are included in the Stockholders’ Equity section of the Company’s balance sheet in the subsection titled Accumulated Other Comprehensive Income (Loss) (AOCI). In addition to the pension liability changes, AOCI includes adjustments for other non-cash items, such as mark-to-market accounting for interest rate hedge instruments, currency contracts, and retiree health benefits.
Cash contributions to the Plan are tax-deductible and do not impact the Company’s earnings. Minimum mandatory contributions are determined by ERISA regulations as amended by the Pension Protection Act of 2006. The Plan assets significantly exceeded minimum required levels at the start of 2020 and 2019. The Company made voluntary contributions of $0.96 million during 2020 and no voluntary contributions during 2019. The Company believes any minimum required contributions in 2021 would not be material.
LIQUIDITY AND CAPITAL RESOURCESThe seasonal nature of our business requires the Company to maintain a sharp focus on the balance between working capital levels and the debt structure required to support the operating needs of the business. Cash flow generated from subsidiary operations provides the Company with a significant source of liquidity.
Net cash provided by operating activities in 2020 was $ 4.7 million compared to $12.0 million in 2019, a decrease of $7.3 million, or 61%. $2.2 million of the decrease was the result of the decline in operating income compared to 2019. The remaining unfavorable impacts to cash were the result of higher receivables balances ($4 million higher due to unusually long U.S. Postal Service delivery times for customer check payments), higher voluntary pension contributions, and
RE
VIE
W O
F O
PER
ATI
ON
S higher year-end inventory balances. All components of working capital are monitored closely and maintained at levels that are appropriate for the current operating levels of our subsidiaries.
Most importantly, the cash provided by operations in 2020 and 2019 supported the ability to fund normal operating expenses while also providing the funds to develop new products, make necessary investments in capital assets, maintain low debt levels, make contributions to the Company’s pension trust, and pay dividends to our stockholders.
Excluding the debt related to interest rate swap instruments, year-end “financed debt” for 2020 was $ 18.3 million, compared to $ 14.4 million at the end of 2019. The outstanding $ 18.3 million of debt for the Company and its subsidiaries is contained entirely on the Company’s revolving loan agreement (the Revolver). The debt related to interest rate instruments of $ 1.0 million (mark-to-market of interest rate swaps that will reverse themselves over the term of the agreements) was $ 0.4 million higher at year-end 2020 compared to 2019.
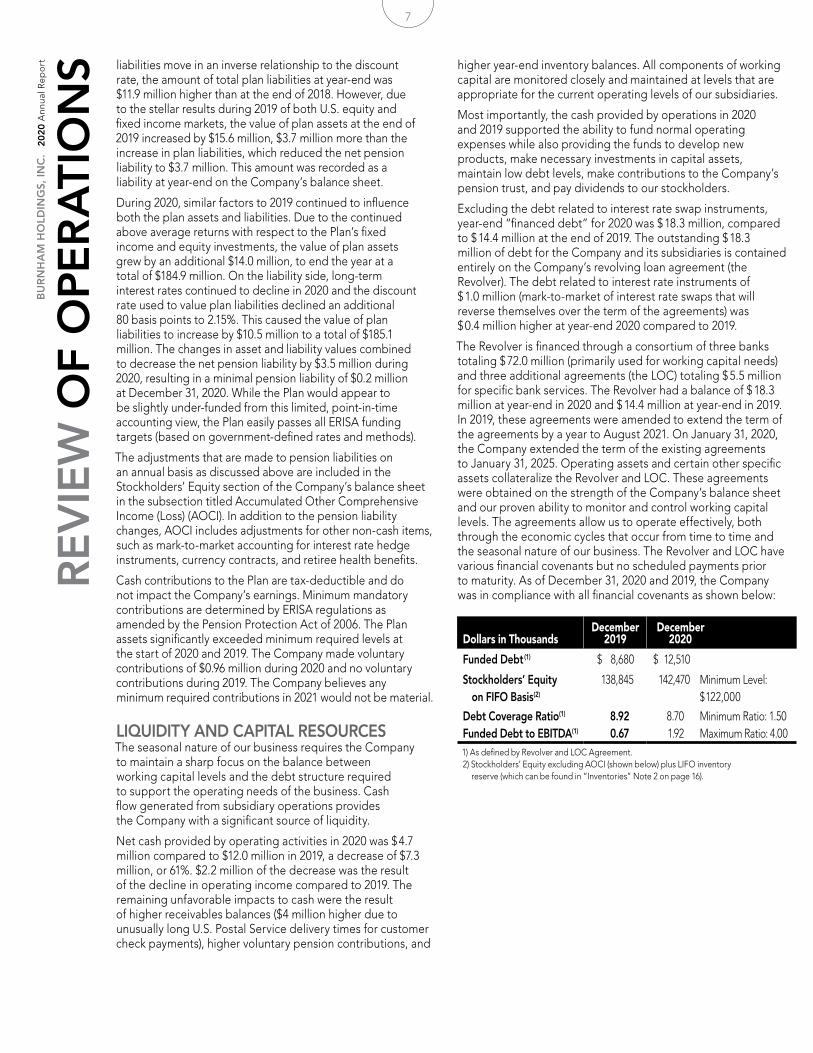
The Revolver is financed through a consortium of three banks totaling $ 72.0 million (primarily used for working capital needs) and three additional agreements (the LOC) totaling $ 5.5 million for specific bank services. The Revolver had a balance of $ 18.3 million at year-end in 2020 and $ 14.4 million at year-end in 2019. In 2019, these agreements were amended to extend the term of the agreements by a year to August 2021. On January 31, 2020, the Company extended the term of the existing agreements to January 31, 2025. Operating assets and certain other specific assets collateralize the Revolver and LOC. These agreements were obtained on the strength of the Company’s balance sheet and our proven ability to monitor and control working capital levels. The agreements allow us to operate effectively, both through the economic cycles that occur from time to time and the seasonal nature of our business. The Revolver and LOC have various financial covenants but no scheduled payments prior to maturity. As of December 31, 2020 and 2019, the Company was in compliance with all financial covenants as shown below:
Dollars in ThousandsDecember
2019 December
2020
Funded Debt (1) $ 8,680 $ 12,510
Stockholders’ Equity on FIFO Basis(2)
138,845 142,470 Minimum Level: $ 122,000
Debt Coverage Ratio(1)
Funded Debt to EBITDA(1)
8.92 0.67
8.70 Minimum Ratio: 1.50 1.92 Maximum Ratio: 4.00
1) As defined by Revolver and LOC Agreement.2) Stockholders’ Equity excluding AOCI (shown below) plus LIFO inventory
reserve (which can be found in “Inventories” Note 2 on page 16).
8
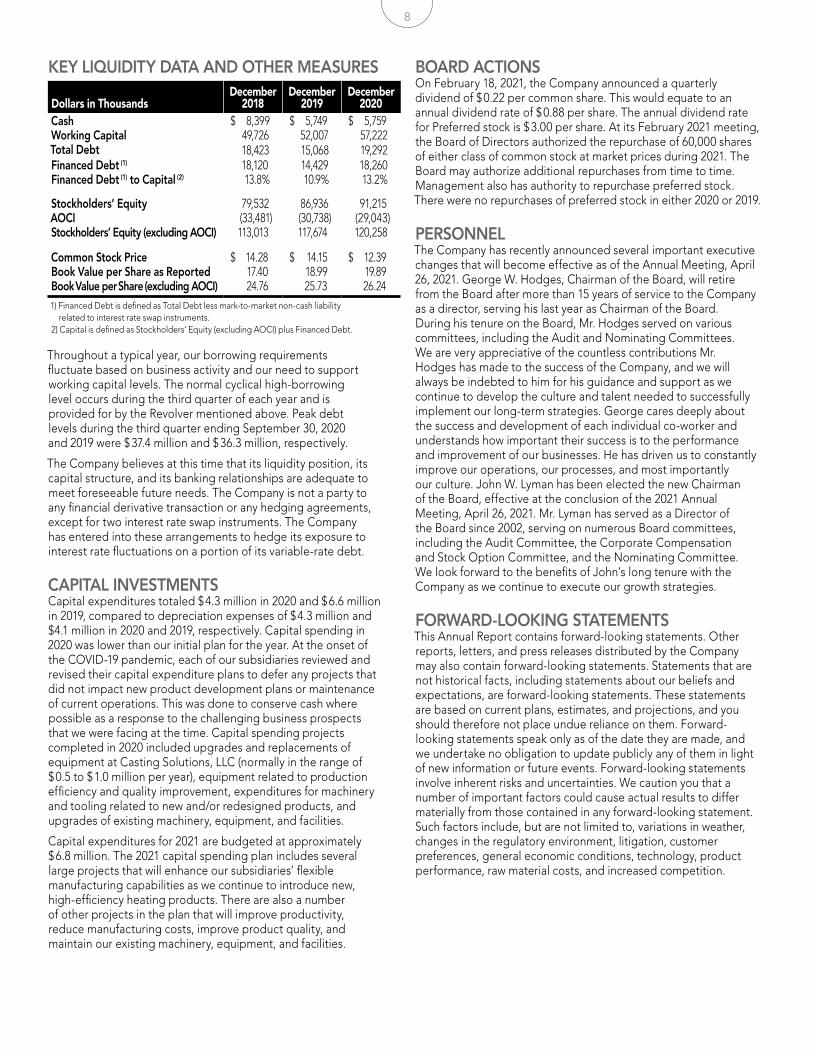
KEY LIQUIDITY DATA AND OTHER MEASURES
Dollars in ThousandsDecember
2018December
2019December
2020Cash $ 8,399 $ 5,749 $ 5,759Working Capital 49,726 52,007 57,222Total Debt 18,423 15,068 19,292Financed Debt (1) 18,120 14,429 18,260Financed Debt (1) to Capital (2) 13.8% 10.9% 13.2%
Stockholders’ Equity 79,532 86,936 91,215AOCI (33,481) (30,738) (29,043)Stockholders’ Equity (excluding AOCI) 113,013 117,674 120,258
Common Stock Price $ 14.28 $ 14.15 $ 12.39Book Value per Share as Reported 17.40 18.99 19.89Book Value per Share (excluding AOCI) 24.76 25.73 26.241) Financed Debt is defined as Total Debt less mark-to-market non-cash liability
related to interest rate swap instruments.2) Capital is defined as Stockholders’ Equity (excluding AOCI) plus Financed Debt.
Throughout a typical year, our borrowing requirements fluctuate based on business activity and our need to support working capital levels. The normal cyclical high-borrowing level occurs during the third quarter of each year and is provided for by the Revolver mentioned above. Peak debt levels during the third quarter ending September 30, 2020 and 2019 were $ 37.4 million and $ 36.3 million, respectively.
The Company believes at this time that its liquidity position, its capital structure, and its banking relationships are adequate to meet foreseeable future needs. The Company is not a party to any financial derivative transaction or any hedging agreements, except for two interest rate swap instruments. The Company has entered into these arrangements to hedge its exposure to interest rate fluctuations on a portion of its variable-rate debt.
CAPITAL INVESTMENTSCapital expenditures totaled $ 4.3 million in 2020 and $ 6.6 million in 2019, compared to depreciation expenses of $ 4.3 million and $4.1 million in 2020 and 2019, respectively. Capital spending in 2020 was lower than our initial plan for the year. At the onset of the COVID-19 pandemic, each of our subsidiaries reviewed and revised their capital expenditure plans to defer any projects that did not impact new product development plans or maintenance of current operations. This was done to conserve cash where possible as a response to the challenging business prospects that we were facing at the time. Capital spending projects completed in 2020 included upgrades and replacements of equipment at Casting Solutions, LLC (normally in the range of $ 0.5 to $ 1.0 million per year), equipment related to production efficiency and quality improvement, expenditures for machinery and tooling related to new and/or redesigned products, and upgrades of existing machinery, equipment, and facilities.
Capital expenditures for 2021 are budgeted at approximately $ 6.8 million. The 2021 capital spending plan includes several large projects that will enhance our subsidiaries’ flexible manufacturing capabilities as we continue to introduce new, high-efficiency heating products. There are also a number of other projects in the plan that will improve productivity, reduce manufacturing costs, improve product quality, and maintain our existing machinery, equipment, and facilities.
BOARD ACTIONSOn February 18, 2021, the Company announced a quarterly dividend of $ 0.22 per common share. This would equate to an annual dividend rate of $ 0.88 per share. The annual dividend rate for Preferred stock is $ 3.00 per share. At its February 2021 meeting, the Board of Directors authorized the repurchase of 60,000 shares of either class of common stock at market prices during 2021. The Board may authorize additional repurchases from time to time. Management also has authority to repurchase preferred stock. There were no repurchases of preferred stock in either 2020 or 2019.
PERSONNELThe Company has recently announced several important executive changes that will become effective as of the Annual Meeting, April 26, 2021. George W. Hodges, Chairman of the Board, will retire from the Board after more than 15 years of service to the Company as a director, serving his last year as Chairman of the Board. During his tenure on the Board, Mr. Hodges served on various committees, including the Audit and Nominating Committees. We are very appreciative of the countless contributions Mr. Hodges has made to the success of the Company, and we will always be indebted to him for his guidance and support as we continue to develop the culture and talent needed to successfully implement our long-term strategies. George cares deeply about the success and development of each individual co-worker and understands how important their success is to the performance and improvement of our businesses. He has driven us to constantly improve our operations, our processes, and most importantly our culture. John W. Lyman has been elected the new Chairman of the Board, effective at the conclusion of the 2021 Annual Meeting, April 26, 2021. Mr. Lyman has served as a Director of the Board since 2002, serving on numerous Board committees, including the Audit Committee, the Corporate Compensation and Stock Option Committee, and the Nominating Committee. We look forward to the benefits of John’s long tenure with the Company as we continue to execute our growth strategies.
FORWARD-LOOKING STATEMENTSThis Annual Report contains forward-looking statements. Other reports, letters, and press releases distributed by the Company may also contain forward-looking statements. Statements that are not historical facts, including statements about our beliefs and expectations, are forward-looking statements. These statements are based on current plans, estimates, and projections, and you should therefore not place undue reliance on them. Forward-looking statements speak only as of the date they are made, and we undertake no obligation to update publicly any of them in light of new information or future events. Forward-looking statements involve inherent risks and uncertainties. We caution you that a number of important factors could cause actual results to differ materially from those contained in any forward-looking statement. Such factors include, but are not limited to, variations in weather, changes in the regulatory environment, litigation, customer preferences, general economic conditions, technology, product performance, raw material costs, and increased competition.
9
BU
RN
HA
M H
OLD
ING
S, IN
C.
20
20 A
nnua
l Rep
ort Certain estimates are determined using historical information along
with assumptions about future events. Changes in assumptions for such items as warranties, medical costs, employment demographics, and legal actions, as well as changes in actual experience, could cause these estimates to change. Specific estimates are explained below in order to provide the basis for relevant expenses and reserves.
Medical Health Coverage: The Company and its subsidiaries are self-insured for most of the medical health benefits offered to its employees, limiting their maximum annual exposure to $ 200,000 per occurrence by purchasing third-party stop-loss coverage. The Company retains various third-party providers to support the effort required in the administration of its health coverage. The costs of these various plans and administrative charges are expensed monthly.
Retiree Health Benefits: For a number of years prior to 2006, the Company provided certain medical benefits to a closed group of Medicare-eligible retirees. Starting in 2006, the Company began to pay a fixed annual amount that assists this group in purchasing medical and/or prescription drug coverage from providers. Additionally, certain employees electing early retirement receive a fixed dollar amount based on years of employee service to assist them in covering medical costs. These obligations are accounted for within the financial statements.
Insurance: The Company and its subsidiaries maintain insurance to cover product liability, general liability, workers’ compensation, and property damage. Well-known and reputable insurance carriers provide current coverage. For these policies, which cover periods ending after mid-2021, the Company’s retained liability is for the first $ 100,000 per occurrence of product liability and environmental claims, a total exposure of $ 750,000 per occurrence for workers’ compensation in Ohio and Pennsylvania (fully insured for workers’ compensation in all other states), and for the first $ 50,000 per occurrence of property claims. All policies and corresponding deductible levels are reviewed on an annual basis. Third-party administrators, approved by the Company and the insurance carriers, handle claims and attempt to resolve them to the benefit of both the Company and its insurance carriers. The Company reviews claims periodically in conjunction with the administrators and adjusts recorded reserves as required. At this time, the Company believes that its insurance policies and associated reserves for product, general, workers’ compensation, and property liabilities are reasonable based on the information currently available.
General Litigation, Including Asbestos: In the normal course of business, certain subsidiaries of the Company have been named, and may in the future be named, as defendants in various legal actions including claims related to property damage and/or personal injury allegedly arising from products of the Company’s subsidiaries or their predecessors. A number of these claims allege personal injury arising from exposure to asbestos-containing material allegedly contained in certain boilers manufactured many years ago, or through the installation or removal of heating systems. The Company’s subsidiaries, directly and/or through insurance providers, are vigorously defending all open asbestos cases, many of which involve multiple claimants and many defendants, which may not be resolved for several years. Asbestos litigation is a national issue with thousands of companies defending claims. While the large majority of claims have historically been resolved prior to the completion of trial, from time to time some claims may be expected to proceed to a potentially substantial verdict against subsidiaries of the Company. Any such verdict would be subject to a potential reduction or reversal of verdict on appeal, any set-off rights, and/or a reduction of liability following allocation of liability among various defendants. For example, on July 23, 2013, and December 12, 2014, New York City State Court juries found numerous defendant companies, including a subsidiary of the Company, responsible for asbestos-related damages. The subsidiary, whose share of the verdicts amounted to $ 42 million and $ 6 million, respectively, before offsets, filed post-trial motions and appeals seeking to reduce and/or overturn the verdicts, and granting of new trials. On February 9, 2015, the trial court significantly reduced the 2013 verdicts, reducing the subsidiary’s
liability from $ 42 million to less than $ 7 million. Additionally, on May 15, 2015, the trial court reduced the subsidiary’s liability in the 2014 verdict to less than $ 2 million. On October 30, 2015, the subsidiary settled these verdicts for significantly less than the trial courts’ reduced verdicts, with all such settled amounts being covered by applicable insurance.
The Company believes, based upon its understanding of its available insurance policies and discussions with legal counsel, that all pending legal actions and claims, including asbestos, should ultimately be resolved (whether through settlements or verdicts) within existing insurance limits and reserves, or for amounts not material to the Company’s financial position or results of operations. However, the resolution of litigation generally entails significant uncertainties, and no assurance can be given as to the ultimate outcome of litigation or its impact on the Company and its subsidiaries. Furthermore, the Company cannot predict the extent to which new claims will be filed in the future, although the Company currently believes that the great preponderance of future asbestos claims will be covered by existing insurance. There can be no assurance that insurers will be financially able to satisfy all pending and future claims in accordance with the applicable insurance policies, or that any disputes regarding policy provisions will be resolved in favor of the Company.
Litigation Expense, Settlements, and Defense: The cost for settlements in 2020, 2019, and 2018, for all uninsured litigation of every kind, was $ 383,000, $ 956,000, and $ 1,250,000, respectively. Each of these years includes a self-insured asbestos claim. While it is unusual for an asbestos suit not to be covered by insurance, a few uninsured claims exist, depending on the alleged time period of asbestos exposure. Expenses for legal counsel, consultants, etc., in defending these various actions and claims have historically not been material to current year earnings. Such expenses in 2020, 2019, and 2018 were $ 104,000, $ 42,000, and $ 187,000, respectively.
Permitting Activities (Excluding Environmental): The Company’s subsidiaries are engaged in various matters with respect to obtaining, amending, or renewing permits required under various laws and associated regulations in order to operate each of its manufacturing facilities. Based on the information presently available, management believes it has all necessary material permits and expects that all permit applications currently pending will be routinely handled and approved.
Environmental Matters: The operations of the Company’s subsidiaries are subject to a variety of federal, state, and local environmental laws. Among other things, these laws require the Company’s subsidiaries to obtain and comply with the terms of a number of federal, state, and local environmental regulations and permits, including permits governing air emissions, wastewater discharges, and waste disposal. The Company’s subsidiaries periodically are required to apply for new permits, or to renew or amend existing permits, in connection with ongoing or modified operations. In addition, the Company generally tracks and tries to anticipate any changes in environmental laws that might relate to its ongoing operations. The Company believes its subsidiaries are in material compliance with all environmental laws and permits.
As with all manufacturing operations in the United States, the Company’s subsidiaries can potentially be responsible for remedial actions at disposal areas containing waste materials from their current or former operations. In the past five years, the Company has not received any notice that it or its subsidiaries might be responsible for new or additional remedial cleanup actions under government supervision. However, there is one older open matter that relates to a formerly owned site in Elizabeth, New Jersey. In 2000, a Company subsidiary entered into an agreement with the New Jersey Department of Environmental Protection to clean up portions of this site. To date, all costs associated with the cleanup have been reimbursed by insurance proceeds. In 2009, our insurance carrier established and funded a trust account to fund anticipated future site activities. While it is not possible to be certain whether or how any new or old matters will proceed, the Company does not presently have reason to anticipate incurring material costs in connection with any matters, and no reserves have been established.
BU
RN
HA
M H
OLD
ING
S, IN
C.
20
20 A
nnua
l Rep
ort
CE
RTA
IN S
IGN
IFIC
AN
T E
STIM
ATE
S
10
To the Board of Directors of Burnham Holdings, Inc.We have audited the accompanying consolidated financial statements of Burnham Holdings, Inc. and its subsidiaries, which comprise the consolidated balance sheets as of December 31, 2020 and 2019, and the related consolidated statements of income, comprehensive income, stockholders’ equity, and cash flows for the years then ended, and the related notes to the consolidated financial statements.
Management’s Responsibility for the Financial StatementsManagement is responsible for the preparation and fair presentation of these consolidated financial statements in accordance with accounting principles generally accepted in the United States of America; this includes the design, implementation, and maintenance of internal control relevant to the preparation and fair presentation of consolidated financial statements that are free from material misstatement, whether due to fraud or error.
Auditors’ ResponsibilityOur responsibility is to express an opinion on these consolidated financial statements based on our audits. We conducted our audits in accordance with auditing standards generally accepted in the United States of America. Those standards require that we plan and perform the audit to obtain reasonable assurance about whether the consolidated financial statements are free from material misstatement.
An audit involves performing procedures to obtain audit evidence about the amounts and disclosures in the consolidated financial statements. The procedures selected depend on the auditor’s judgment, including the assessment of the risks of material misstatement of the consolidated financial statements, whether due to fraud or error. In making those risk assessments, the auditor considers internal control relevant to the entity’s preparation and fair presentation of the consolidated financial statements in order to design audit procedures that are appropriate in the circumstances, but not for the purpose of expressing an opinion on the effectiveness of the entity’s internal control. Accordingly, we express no such opinion. An audit also includes evaluating the appropriateness of accounting policies used and the reasonableness of significant accounting estimates made by management, as well as evaluating the overall presentation of the consolidated financial statements.
We believe that the audit evidence we have obtained is sufficient and appropriate to provide a basis for our audit opinion.
OpinionIn our opinion, the consolidated financial statements referred to above present fairly, in all material respects, the financial position of Burnham Holdings, Inc. and its subsidiaries as of December 31, 2020 and 2019, and the results of their operations and their cash flows for the years then ended in accordance with accounting principles generally accepted in the United States of America.
Other MatterOur audits were conducted for the purpose of forming an opinion on the basic financial statements as a whole. The other information included in the Letter To Our Stockholders, Company Profile, Financial Highlights, Review of Operations, Certain Significant Estimates, Management’s Report, Ten-Year Summary, and Investor & Stockholder Information sections on pages 1–10 and pages 27–29 is presented for purposes of additional analysis and is not a required part of the basic financial statements. Such information has not been subjected to the auditing procedures applied in the audits of the basic financial statements and, accordingly, we do not express an opinion or provide any assurance on it.
Management is responsible for the preparation, as well as the integrity and objectivity, of the Burnham Holdings, Inc. financial statements. These financial statements have been prepared in conformity with accounting principles generally accepted in the United States of America and necessarily include amounts which represent the best estimates and judgments of management.
The Company maintains an accounting system and related system of internal controls to provide reasonable assurance that assets are safeguarded against loss from unauthorized use or disposition and that financial records are reliable for preparing financial statements and maintaining accountability for assets. Reasonable assurance recognizes that the cost of a system of internal controls should not exceed its benefits and that the evaluation of these factors requires estimates and judgments by management. The internal control system includes the selection and training of management and supervisory personnel; an organizational structure providing for delegation of authority and establishment of responsibilities; communication of requirements for compliance with approved accounting control and business practices throughout the organization; business planning and review; and a program of internal audit.
Baker Tilly US, LLP, independent auditors, are engaged to audit and report on these financial statements. Their audit is conducted in accordance with auditing standards generally accepted in the United States of America. Those standards require that they plan and perform the audit to obtain reasonable assurance about whether the financial statements are free from material misstatement.
The Audit Committee of the Board of Directors meets regularly with management, the internal audit manager, and the independent auditors to review matters relating to financial reporting, internal controls, and auditing. Management, the internal audit manager, and the independent auditors each have direct and confidential access to this Committee.
Douglas S. Brossman Dale R. Bowman Vice Chairman & CEO Vice President and CFO
BU
RN
HA
M H
OLD
ING
S, IN
C.
20
20 A
nnua
l Rep
ort
MA
NA
GE
ME
NT’
S R
EP
OR
T &
R
EP
OR
T O
F IN
DE
PEN
DE
NT
AU
DIT
OR
S
Baker Tilly US, LLP Lancaster, Pennsylvania March 2, 2021
11
BU
RN
HA
M H
OLD
ING
S, IN
C.
20
20 A
nnua
l Rep
ort CONSOLIDATED STATEMENTS OF INCOME
Years Ended December 31 (In thousands, except per share data)
2020 2019
Net sales $ 187,461 $ 212,257
Cost of goods sold 148,985 166,737
Gross profit 38,476 45,520
Selling, general, and administrative expenses 30,477 34,355
Operating income 7,999 11,165
Other income (expense):
Non-service related pension credit ,684 ,720
Interest and investment income ,719 ,822
Interest expense (930) (1,141)
Other income 473 401
Income before income taxes 8,472 11,566
Income tax expense 1,925 2,828
NET INCOME $ 6,547 $ 8,738
BASIC EARNINGS PER SHARE $ 1.43 $ 1.91
DILUTED EARNINGS PER SHARE $ 1.43 $ 1.91
CONSOLIDATED STATEMENTS OF COMPREHENSIVE INCOME
Years Ended December 31 (In thousands)
2020 2019
Components of comprehensive income:
Net income for the year $ 6,547 $ 8,738
Other comprehensive income (loss):
Change in fair value of derivatives, hedges, and investments (296) (251)
Pension liability adjustment 1,979 2,827
Post-retirement medical liability adjustment 12 6
Other comprehensive income 1,695 2,582
TOTAL COMPREHENSIVE INCOME $ 8,242 $ 11,320The accompanying notes are an integral part of these consolidated financial statements.
BU
RN
HA
M H
OLD
ING
S, IN
C.
20
20 A
nnua
l Rep
ort
CO
NSO
LID
ATE
D F
INA
NC
IAL
STA
TEM
EN
TS
12
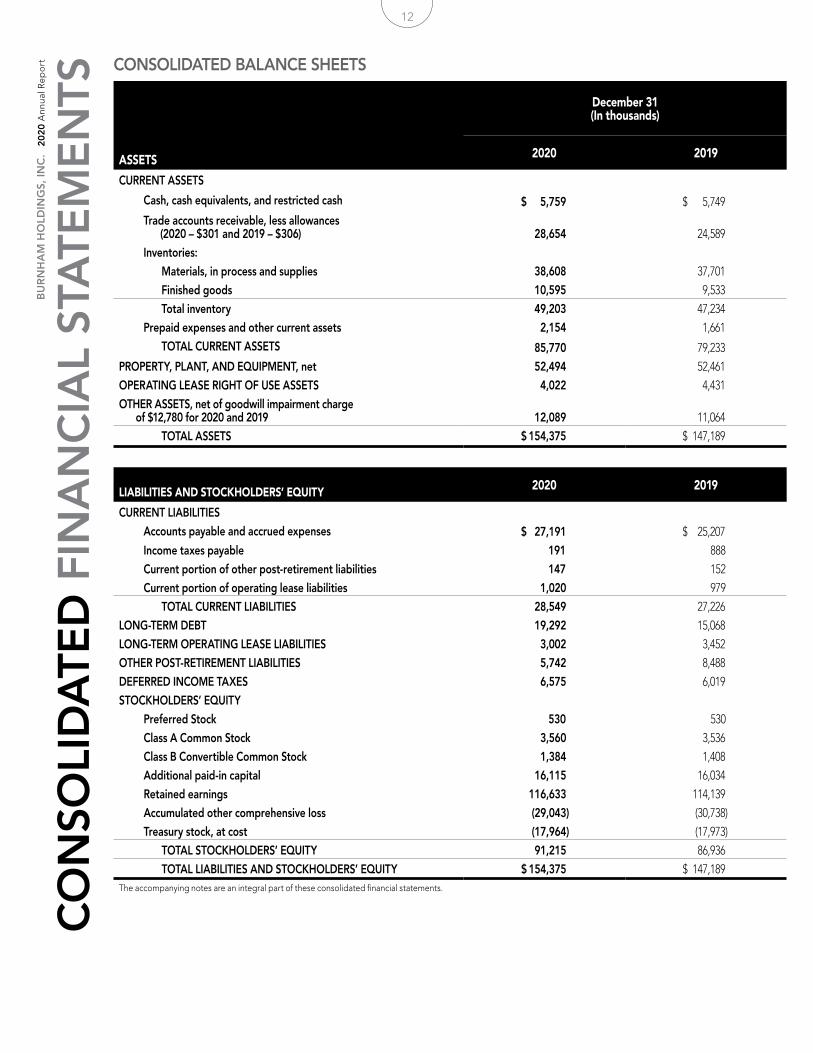
CONSOLIDATED BALANCE SHEETS
ASSETS
December 31 (In thousands)
2020 2019
CURRENT ASSETS
Cash, cash equivalents, and restricted cash $ 5,759 $ 5,749
Trade accounts receivable, less allowances (2020 – $301 and 2019 – $306) 28,654 24,589
Inventories:
Materials, in process and supplies 38,608 37,701
Finished goods 10,595 9,533
Total inventory 49,203 47,234
Prepaid expenses and other current assets 2,154 1,661
TOTAL CURRENT ASSETS 85,770 79,233
PROPERTY, PLANT, AND EQUIPMENT, net 52,494 52,461
OPERATING LEASE RIGHT OF USE ASSETS 4,022 4,431
OTHER ASSETS, net of goodwill impairment charge of $12,780 for 2020 and 2019 12,089 11,064
TOTAL ASSETS $ 154,375 $ 147,189
LIABILITIES AND STOCKHOLDERS’ EQUITY 2020 2019
CURRENT LIABILITIES
Accounts payable and accrued expenses $ 27,191 $ 25,207
Income taxes payable 191 888
Current portion of other post-retirement liabilities 147 152
Current portion of operating lease liabilities 1,020 979
TOTAL CURRENT LIABILITIES 28,549 27,226
LONG-TERM DEBT 19,292 15,068
LONG-TERM OPERATING LEASE LIABILITIES 3,002 3,452
OTHER POST-RETIREMENT LIABILITIES 5,742 8,488
DEFERRED INCOME TAXES 6,575 6,019
STOCKHOLDERS’ EQUITY
Preferred Stock 530 530
Class A Common Stock 3,560 3,536
Class B Convertible Common Stock 1,384 1,408
Additional paid-in capital 16,115 16,034
Retained earnings 116,633 114,139
Accumulated other comprehensive loss (29,043) (30,738)
Treasury stock, at cost (17,964) (17,973)
TOTAL STOCKHOLDERS’ EQUITY 91,215 86,936
TOTAL LIABILITIES AND STOCKHOLDERS’ EQUITY $ 154,375 $ 147,189 The accompanying notes are an integral part of these consolidated financial statements.
BU
RN
HA
M H
OLD
ING
S, IN
C.
20
20 A
nnua
l Rep
ort
CO
NSO
LID
ATE
D F
INA
NC
IAL
STA
TEM
EN
TS
13
BU
RN
HA
M H
OLD
ING
S, IN
C.
20
20 A
nnua
l Rep
ort
BU
RN
HA
M H
OLD
ING
S, IN
C.
20
20 A
nnua
l Rep
ort
CO
NSO
LID
ATE
D F
INA
NC
IAL
STA
TEM
EN
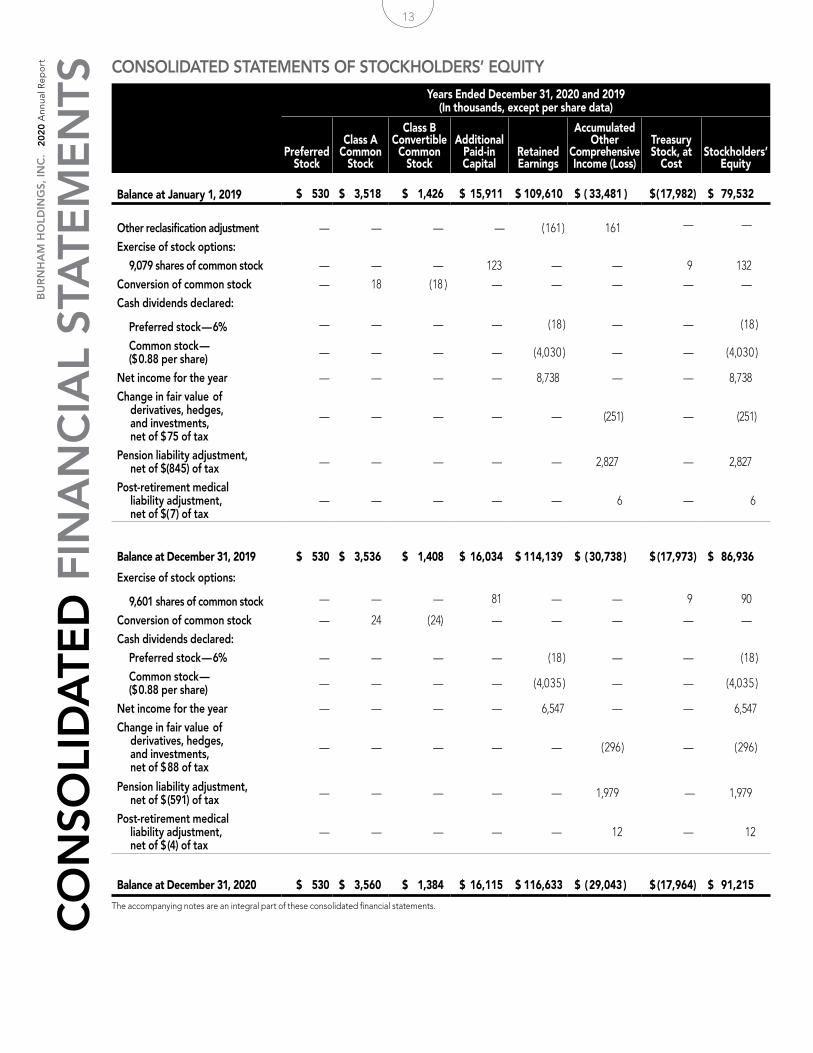
TSCONSOLIDATED STATEMENTS OF STOCKHOLDERS’ EQUITY
Years Ended December 31, 2020 and 2019 (In thousands, except per share data)
Preferred Stock
Class A Common
Stock
Class B Convertible
Common Stock
Additional Paid-in Capital
Retained Earnings
Accumulated Other
Comprehensive Income (Loss)
Treasury Stock, at
CostStockholders’
Equity
Balance at January 1, 2019 $ 530 $ 3,518 $ 1,426 $ 15,911 $ 109,610 $ ( 33,481 ) $ ( 17,982) $ 79,532
Other reclasification adjustment — — — — ( 161 ) 161 — —
Exercise of stock options:
9,079 shares of common stock — — — 123 — — (9 ) 132
Conversion of common stock — 18 ( 18 ) — — — — —
Cash dividends declared:
Preferred stock — 6% — — — — ( 18 ) — — ( 18 )
Common stock — ($ 0.88 per share) — — — — ( 4,030 ) — — ( 4,030 )
Net income for the year — — — — 8,738 — — 8,738
Change in fair value of derivatives, hedges, and investments, net of $ 75 of tax
— — — — — (251) — (251)
Pension liability adjustment, net of $(845) of tax — — — — — 2,827 — 2,827
Post-retirement medical liability adjustment, net of $( 7) of tax
— — — — — 6 — 6
Balance at December 31, 2019 $ 530 $ 3,536 $ 1,408 $ 16,034 $ 114,139 $ ( 30,738 ) $ (17,973 ) $ 86,936
Exercise of stock options:
9,601 shares of common stock — — — 81 — — (9 ) 90
Conversion of common stock — 24 ( 24) — — — — —
Cash dividends declared:
Preferred stock — 6% — — — — ( 18 ) — — ( 18 )
Common stock — ($ 0.88 per share) — — — — ( 4,035 ) — — ( 4,035 )
Net income for the year — — — — 6,547 — — 6,547
Change in fair value of derivatives, hedges, and investments, net of $ 88 of tax
— — — — — ( 296 ) — ( 296 )
Pension liability adjustment, net of $ (591) of tax — — — — — 1,979 — 1,979
Post-retirement medical liability adjustment, net of $ (4) of tax
— — — — — 12 — 12
Balance at December 31, 2020 $ 530 $ 3,560 $ 1,384 $ 16,115 $ 116,633 $ ( 29,043 ) $ (17,964) $ 91,215
The accompanying notes are an integral part of these consolidated financial statements.
14
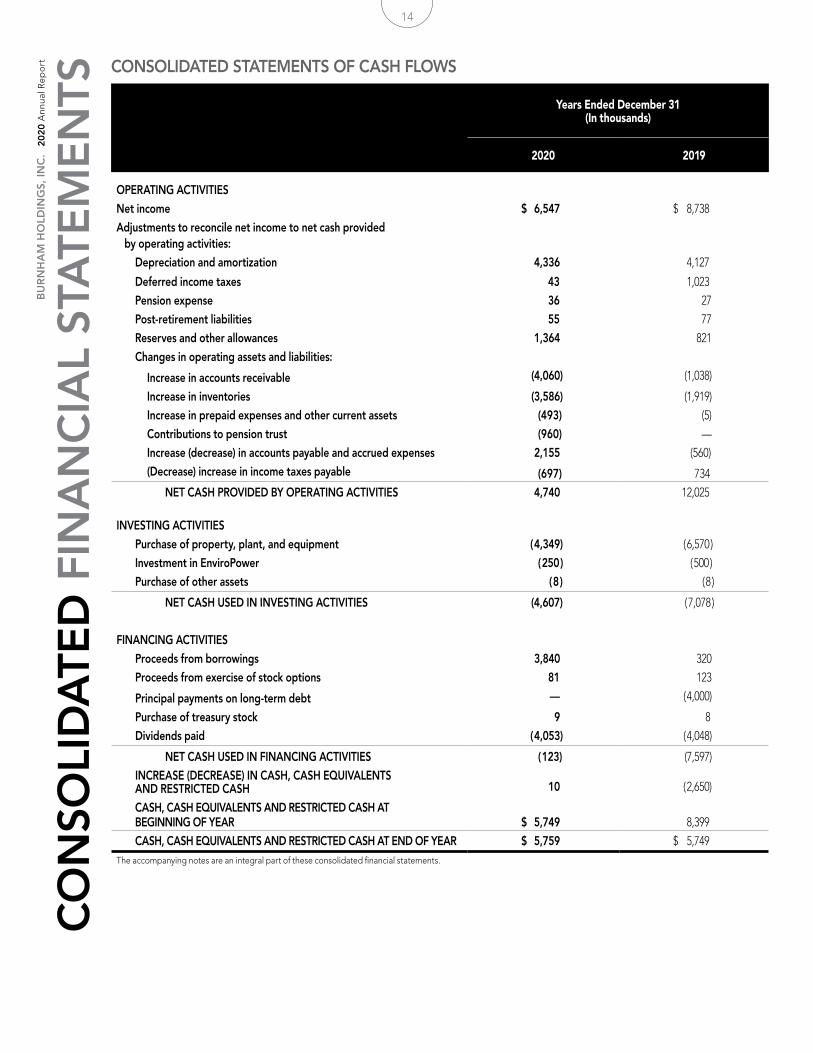
CONSOLIDATED STATEMENTS OF CASH FLOWS
Years Ended December 31 (In thousands)
2020 2019
OPERATING ACTIVITIES
Net income $ 6,547 $ 8,738
Adjustments to reconcile net income to net cash provided by operating activities:
Depreciation and amortization 4,336 4,127
Deferred income taxes 43 1,023
Pension expense 36 27
Post-retirement liabilities ,55 ,77
Reserves and other allowances 1,364 821
Changes in operating assets and liabilities:
Increase in accounts receivable (4,060) (1,038)
Increase in inventories (3,586) (1,919)
Increase in prepaid expenses and other current assets (493) (5)
Contributions to pension trust (960) ,—
Increase (decrease) in accounts payable and accrued expenses 2,155 (560)
(Decrease) increase in income taxes payable (697) 734
NET CASH PROVIDED BY OPERATING ACTIVITIES 4,740 12,025
INVESTING ACTIVITIES
Purchase of property, plant, and equipment ( 4,349) ( 6,570 )
Investment in EnviroPower ( 250 ) ( 500 )
Purchase of other assets ( 8 ) ( 8 )
NET CASH USED IN INVESTING ACTIVITIES (4,607) ( 7,078 )
FINANCING ACTIVITIES
Proceeds from borrowings 3,840 320
Proceeds from exercise of stock options 81 123
Principal payments on long-term debt ,— ( 4,000)
Purchase of treasury stock 9 ) 8 )
Dividends paid ( 4,053) ( 4,048)
NET CASH USED IN FINANCING ACTIVITIES ( 123) (7,597)
INCREASE (DECREASE) IN CASH, CASH EQUIVALENTS AND RESTRICTED CASH 10 ) ( 2,650)
CASH, CASH EQUIVALENTS AND RESTRICTED CASH AT BEGINNING OF YEAR $ 5,749 8,399
CASH, CASH EQUIVALENTS AND RESTRICTED CASH AT END OF YEAR $ 5,759 $ 5,749 The accompanying notes are an integral part of these consolidated financial statements.
BU
RN
HA
M H
OLD
ING
S, IN
C.
20
20 A
nnua
l Rep
ort
CO
NSO
LID
ATE
D F
INA
NC
IAL
STA
TEM
EN
TSCONSOLIDATED STATEMENTS OF STOCKHOLDERS’ EQUITY
Years Ended December 31, 2020 and 2019 (In thousands, except per share data)
Preferred Stock
Class A Common
Stock
Class B Convertible
Common Stock
Additional Paid-in Capital
Retained Earnings
Accumulated Other
Comprehensive Income (Loss)
Treasury Stock, at
CostStockholders’
Equity
Balance at January 1, 2019 $ 530 $ 3,518 $ 1,426 $ 15,911 $ 109,610 $ ( 33,481 ) $ ( 17,982) $ 79,532
Other reclasification adjustment — — — — ( 161 ) 161 — —
Exercise of stock options:
9,079 shares of common stock — — — 123 — — (9 ) 132
Conversion of common stock — 18 ( 18 ) — — — — —
Cash dividends declared:
Preferred stock — 6% — — — — ( 18 ) — — ( 18 )
Common stock — ($ 0.88 per share) — — — — ( 4,030 ) — — ( 4,030 )
Net income for the year — — — — 8,738 — — 8,738
Change in fair value of derivatives, hedges, and investments, net of $ 75 of tax
— — — — — (251) — (251)
Pension liability adjustment, net of $(845) of tax — — — — — 2,827 — 2,827
Post-retirement medical liability adjustment, net of $( 7) of tax
— — — — — 6 — 6
Balance at December 31, 2019 $ 530 $ 3,536 $ 1,408 $ 16,034 $ 114,139 $ ( 30,738 ) $ (17,973 ) $ 86,936
Exercise of stock options:
9,601 shares of common stock — — — 81 — — (9 ) 90
Conversion of common stock — 24 ( 24) — — — — —
Cash dividends declared:
Preferred stock — 6% — — — — ( 18 ) — — ( 18 )
Common stock — ($ 0.88 per share) — — — — ( 4,035 ) — — ( 4,035 )
Net income for the year — — — — 6,547 — — 6,547
Change in fair value of derivatives, hedges, and investments, net of $ 88 of tax
— — — — — ( 296 ) — ( 296 )
Pension liability adjustment, net of $ (591) of tax — — — — — 1,979 — 1,979
Post-retirement medical liability adjustment, net of $ (4) of tax
— — — — — 12 — 12
Balance at December 31, 2020 $ 530 $ 3,560 $ 1,384 $ 16,115 $ 116,633 $ ( 29,043 ) $ (17,964) $ 91,215
The accompanying notes are an integral part of these consolidated financial statements.
15
BU
RN
HA
M H
OLD
ING
S, IN
C.
20
20 A
nnua
l Rep
ort 1. NATURE OF OPERATIONS
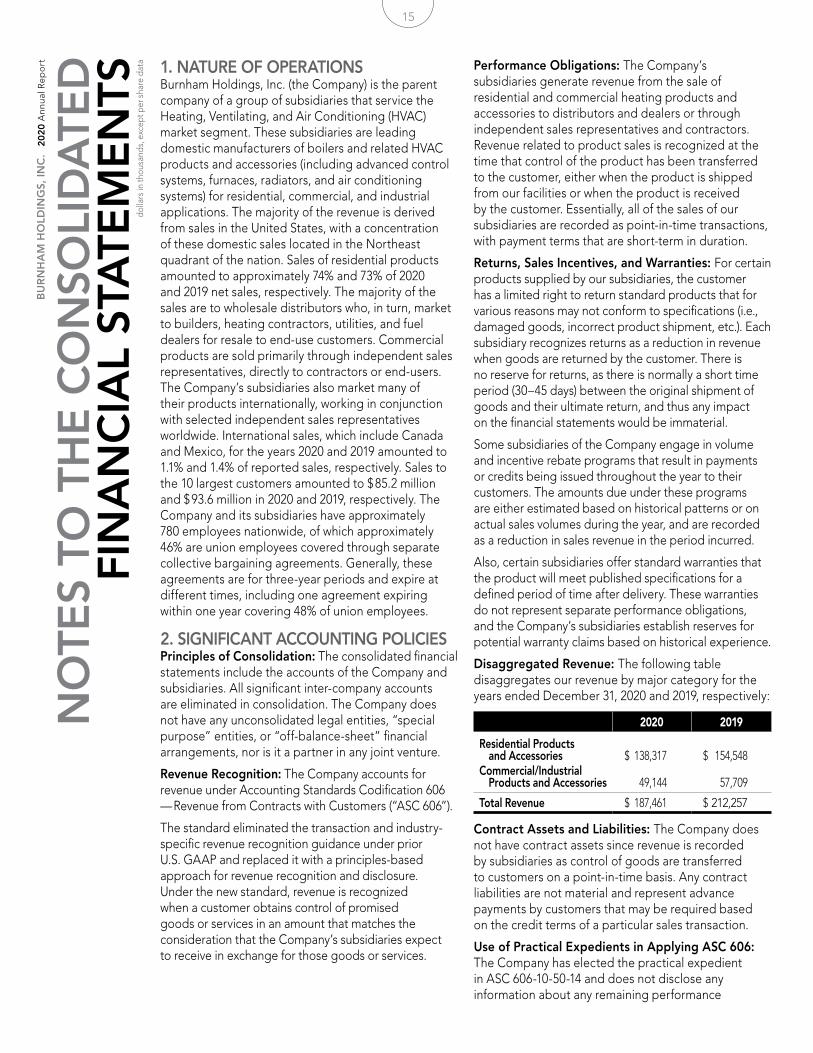
Burnham Holdings, Inc. (the Company) is the parent company of a group of subsidiaries that service the Heating, Ventilating, and Air Conditioning (HVAC) market segment. These subsidiaries are leading domestic manufacturers of boilers and related HVAC products and accessories (including advanced control systems, furnaces, radiators, and air conditioning systems) for residential, commercial, and industrial applications. The majority of the revenue is derived from sales in the United States, with a concentration of these domestic sales located in the Northeast quadrant of the nation. Sales of residential products amounted to approximately 74% and 73% of 2020 and 2019 net sales, respectively. The majority of the sales are to wholesale distributors who, in turn, market to builders, heating contractors, utilities, and fuel dealers for resale to end-use customers. Commercial products are sold primarily through independent sales representatives, directly to contractors or end-users. The Company’s subsidiaries also market many of their products internationally, working in conjunction with selected independent sales representatives worldwide. International sales, which include Canada and Mexico, for the years 2020 and 2019 amounted to 1.1% and 1.4% of reported sales, respectively. Sales to the 10 largest customers amounted to $ 85.2 million and $ 93.6 million in 2020 and 2019, respectively. The Company and its subsidiaries have approximately 780 employees nationwide, of which approximately 46% are union employees covered through separate collective bargaining agreements. Generally, these agreements are for three-year periods and expire at different times, including one agreement expiring within one year covering 48% of union employees.
2. SIGNIFICANT ACCOUNTING POLICIESPrinciples of Consolidation: The consolidated financial statements include the accounts of the Company and subsidiaries. All significant inter-company accounts are eliminated in consolidation. The Company does not have any unconsolidated legal entities, “special purpose” entities, or “off-balance-sheet” financial arrangements, nor is it a partner in any joint venture.
Revenue Recognition: The Company accounts for revenue under Accounting Standards Codification 606 — Revenue from Contracts with Customers (“ASC 606”).
The standard eliminated the transaction and industry-specific revenue recognition guidance under prior U.S. GAAP and replaced it with a principles-based approach for revenue recognition and disclosure. Under the new standard, revenue is recognized when a customer obtains control of promised goods or services in an amount that matches the consideration that the Company’s subsidiaries expect to receive in exchange for those goods or services.
Performance Obligations: The Company’s subsidiaries generate revenue from the sale of residential and commercial heating products and accessories to distributors and dealers or through independent sales representatives and contractors. Revenue related to product sales is recognized at the time that control of the product has been transferred to the customer, either when the product is shipped from our facilities or when the product is received by the customer. Essentially, all of the sales of our subsidiaries are recorded as point-in-time transactions, with payment terms that are short-term in duration.
Returns, Sales Incentives, and Warranties: For certain products supplied by our subsidiaries, the customer has a limited right to return standard products that for various reasons may not conform to specifications (i.e., damaged goods, incorrect product shipment, etc.). Each subsidiary recognizes returns as a reduction in revenue when goods are returned by the customer. There is no reserve for returns, as there is normally a short time period (30–45 days) between the original shipment of goods and their ultimate return, and thus any impact on the financial statements would be immaterial.
Some subsidiaries of the Company engage in volume and incentive rebate programs that result in payments or credits being issued throughout the year to their customers. The amounts due under these programs are either estimated based on historical patterns or on actual sales volumes during the year, and are recorded as a reduction in sales revenue in the period incurred.
Also, certain subsidiaries offer standard warranties that the product will meet published specifications for a defined period of time after delivery. These warranties do not represent separate performance obligations, and the Company’s subsidiaries establish reserves for potential warranty claims based on historical experience.
Disaggregated Revenue: The following table disaggregates our revenue by major category for the years ended December 31, 2020 and 2019, respectively:
2020 2019
Residential Products and Accessories $ 138,317 $ 154,548Commercial/Industrial Products and Accessories 49,144 57,709
Total Revenue $ 187,461 $ 212,257
Contract Assets and Liabilities: The Company does not have contract assets since revenue is recorded by subsidiaries as control of goods are transferred to customers on a point-in-time basis. Any contract liabilities are not material and represent advance payments by customers that may be required based on the credit terms of a particular sales transaction.
Use of Practical Expedients in Applying ASC 606: The Company has elected the practical expedient in ASC 606-10-50-14 and does not disclose any information about any remaining performance
NO
TES
TO T
HE
CO
NSO
LID
ATE
D
FIN
AN
CIA
L ST
ATE
ME
NTS
dolla
rs in
thou
sand
s, e
xcep
t per
sha
re d
ata
16
Fair Value of Financial Instruments: The Company follows the Financial Accounting Standards Board (FASB) statement related to Fair Value Measurements (FVM). FVM defines fair value, establishes a framework for measuring fair value in generally accepted accounting principles, and establishes a hierarchy that categorizes and prioritizes the sources to be used to estimate fair value. FVM also expands financial statement disclosures about fair value measurements.
Valuation Hierarchy: FVM establishes a valuation hierarchy for disclosure of the inputs to valuation used to measure fair value.
This hierarchy prioritizes the inputs into three broad levels as follows: Level 1 inputs are quoted prices (unadjusted) in active markets for identical assets or liabilities; Level 2 inputs are quoted prices for similar assets or liabilities in active markets, quoted prices in inactive markets for identical or similar assets, or inputs that are observable for the asset or liability, either directly or indirectly through market corroboration, for substantially the full term of the financial instrument; Level 3 inputs are unobservable inputs based on our own assumptions used to measure assets and liabilities at fair value. A financial asset or liability’s classification within the hierarchy is determined based on the lowest level input that is significant to the FVM.
The Company’s specific Level 2 FVM for its interest rate swaps has been derived from proprietary models of the third-party financial institution holding these instruments. This analysis reflects the contractual terms of the interest rate swaps, including the period to maturity, and uses observable market-based inputs. The Company’s Level 2 liability (payable) for its interest rate swaps carried at settlement value, which approximates fair value as of December 31, 2020 and 2019, was $ 1,023 and $ 639, respectively.
Valuation Techniques: FVM permits entities to choose to measure many financial instruments and certain other items at fair value. This statement also establishes presentation and disclosure requirements designed to facilitate comparisons between entities that choose different measurement attributes for similar types of assets and liabilities. Unrealized gains and losses on items for which the fair value option is elected would be reported in earnings.
The estimated fair values of cash and cash equivalents, trade accounts receivable, accounts payable, and accrued expenses approximate their carrying values at December 31, 2020 and 2019, due to their short-term nature. The fair value of debt approximates its carrying value based on the variable nature of interest rates and current market rates available to the Company, and is classified as Level 2 within the fair value hierarchy. The Company, from time to time, uses interest rate swaps to hedge its exposure to the impact of market interest rate fluctuations on its variable-rate debt. The Company follows the provisions of financial accounting standards specific to accounting for derivative instruments and hedging activities for all interest rate swap transactions as detailed in Note 6.
Inventories: Inventories are valued at the lower of cost or net realizable value, and 83% of the inventories were valued using the last-in, first-out method (LIFO) as of the end of both 2020 and 2019. If the subsidiaries had used the first-in,
obligations that have original expected durations of one year or less. The Company applies the practical expedient in ASC 340-40-25-4 and recognizes the incremental costs of obtaining contracts as selling expense when incurred when the amortization period over which the Company otherwise would have recognized is one year or less. The Company also applies the practical expedient in ASC 606-10-32-18 to not adjust the amount received in a contract for any financing component, as the Company expects all consideration to be received in one year or less at contract inception. Lastly, the Company applies the practical expedient in ASC 606-10-25-18B to treat shipping and handling costs as a fulfillment cost and not as a separate performance obligation.
Advertising: Costs are expensed as incurred.
Trade Accounts Receivable: Trade accounts receivable are recorded at the invoice price, net of allowances for doubtful accounts and discounts, and do not bear interest. The allowance for doubtful accounts is the Company’s best estimate of the amount of probable credit losses in accounts receivable. The Company reviews the allowance for doubtful accounts monthly. Receivable balances are written off against the allowance when management believes it is probable the receivable will not be recovered. The Company does not have any off-balance-sheet credit exposure related to its customers.
Shipping and Handling Costs: The subsidiaries charge certain customers shipping and handling fees. These revenues are recorded in net sales. Certain costs associated with receiving material and shipping goods to customers are recorded as cost of goods sold. For the years ended December 31, 2020 and 2019, these receiving and shipping costs were $ 8,102 and $ 9,480, respectively.
Cash, Cash Equivalents, and Restricted Cash: The Company considers all highly liquid investments with an original maturity of three months or less when purchased to be cash equivalents. The Company’s cash balances at times exceeded federally insured limits, including an excess of $ 625 and $ 786 at December 31, 2020 and 2019, respectively; the Company has not experienced any losses. Additionally, and reported as part of cash, were investments in short-term, liquid assets whose balances are based on costs which approximate current market values. The total of these investments were $ 5,078 and $ 4,961 at December 31, 2020 and 2019, respectively.
A portion of the Company’s cash may be restricted from time to time because of insurance regulatory requirements. As of December 31, 2020 and 2019, restricted cash in each year totaled $ 3,500.
The Company utilizes various zero-balancing bank accounts with certain financial institutions to manage its cash disbursements. From time to time, checks disbursed from these accounts result in a negative cash balance or book overdraft positions until funds are transferred into the accounts as checks are subsequently presented for payment. The Company includes these negative balances as a component of accounts payable. Book overdrafts of $ 0 were included in accounts payable as of December 31, 2020 and 2019, respectively.
17
Other intangible assets (primarily customer lists, non-compete agreements, and patents and trademarks) amounted to $ 4 and $ 13 at December 31, 2020 and 2019, respectively, net of accumulated amortization of $ 3,687 and $ 3,683 at December 31, 2020 and 2019, respectively, and are being amortized over 3 to 20 years using the straight-line method. Total amortization expense for 2020 and 2019 was $ 12 and $21, respectively. Future amortization expense is expected to be: $ 4 – 2021.
Income Taxes: Income taxes are accounted for under the asset and liability method. Deferred tax assets and liabilities are recognized for the estimated future tax consequences attributable to differences between (1) the financial statement carrying amounts of existing assets and liabilities and their respective tax bases and (2) operating losses and tax credit carry-forwards. Deferred tax assets and liabilities are measured using enacted tax rates in effect for the year in which those temporary differences are expected to be recovered or settled. Deferred income tax assets are reduced by a valuation allowance if, in the judgment of the Company’s management, it is more likely than not that such assets will not be realized.
The Company accounts for uncertainty in income taxes under the FASB guidance, which clarifies the recognition by prescribing the threshold a tax position is required to meet before being recognized in the financial statements. Tax benefits recognized in the statements are measured based on the largest benefit that cumulatively has a greater than 50% likelihood of being sustained in a tax examination, with a tax examination being presumed to occur.
Company Loans: Loans from the Company to any employee or director are prohibited as a matter of policy and by the Company’s charter, unless approved by shareholders who are not directors. There are no loans outstanding as of December 31, 2020 and 2019.
Use of Estimates: The preparation of financial statements in conformity with accounting principles generally accepted in the United States of America requires management to make estimates and assumptions that affect the reported amounts of assets and liabilities (and disclosure of contingent assets and liabilities) at the date of the financial statements and reported amounts of revenues and expenses during the reporting period. Actual results could differ from these estimates.
Consolidated Earnings per Share (EPS): For the years ended December 31, 2020 and 2019, basic and diluted earnings per share are computed as follows:
BU
RN
HA
M H
OLD
ING
S, IN
C.
20
20 A
nnua
l Rep
ort
NO
TES
TO T
HE
CO
NSO
LID
ATE
D F
INA
NC
IAL
STA
TEM
EN
TS (c
ont
.) first-out method (FIFO) of inventory accounting, inventories would have been $ 22,212 and $ 21,180 higher than reported at December 31, 2020 and 2019, respectively. The subsidiaries periodically review their inventories and make provisions as necessary for estimated obsolescence and slow-moving inventory items. The amount of such markdown is equal to the difference between cost of inventories and the estimated net realizable value based upon assumptions about future demands, selling prices, and market conditions.
During 2020 and 2019, inventory quantities were reduced either in total or at specific facilities. These reductions resulted in a liquidation of LIFO inventory quantities carried at different costs prevailing in prior years as compared with the cost of 2020 and 2019 purchases, the effect of which decreased cost of goods sold by approximately $ 141 in 2020 and decreased cost of goods sold by approximately $ 51 in 2019. These changes increased profits in 2020 by approximately $ 109, or $ 0.02 per share, and increased profits in 2019 by approximately $ 39, or $ 0.01 per share.
Impairment of Long-lived Assets: The Company evaluates long-lived assets whenever events and circumstances have occurred that indicate that the remaining estimated useful life of such assets may warrant revision or that the remaining balance may not be recoverable. These factors may include a significant deterioration of operating results, changes in business plans, or changes in anticipated cash flows. When factors indicate that an asset should be evaluated for possible impairment, the Company reviews long-lived assets to assess recoverability from future operations. Impairments are recognized in earnings to the extent that the carrying value exceeds fair value. There was no impairment of long-lived assets in 2020 or 2019.
Depreciation: Property, plant, and equipment are stated at cost less accumulated depreciation and amortization. Depreciation of plant and equipment is computed principally using the straight-line method (certain machinery and equipment are being depreciated using the units of production method) at rates adequate to depreciate the cost of applicable assets over their expected useful lives. Maintenance and repairs are charged to operations as incurred, and major improvements are capitalized. The cost of assets retired or otherwise disposed of and the accumulated depreciation thereon is removed from the accounts, with any gain or loss realized upon sale or disposal charged or credited to operations. Depreciation expense for 2020 and 2019 was $ 4,316 and $ 4,106 respectively.
Other Assets: Other assets primarily include goodwill and other intangible assets. Goodwill of $3,002 (net of accumulated impairment charges of $12,780) as of December 31, 2020 and 2019, and other indefinite-lived intangible assets of $ 3,640 as of December 31, 2020 and 2019, are reviewed annually for impairment. The Company accounts for goodwill in accordance with ASC 350, including the provisions of ASC 2017-04. No impairment charges were recorded related to goodwill or for other indefinite-lived intangible assets for 2020 or 2019.
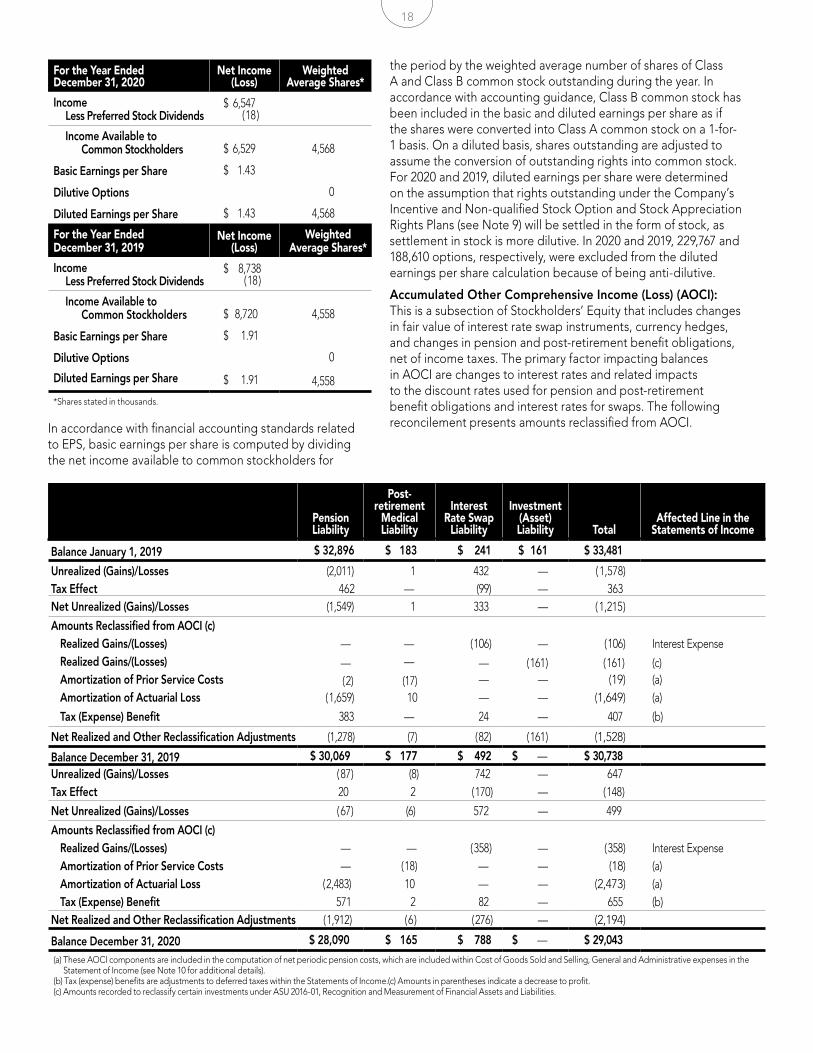
18
Pension Liability
Post- retirement
Medical Liability
Interest Rate Swap
Liability
Investment (Asset) Liability Total
Affected Line in the Statements of Income
Balance January 1, 2019 $ 32,896 $ 183 $ ,241 $ 161 $ 33,481
Unrealized (Gains)/Losses (2,011) 1 432 — ( 1,578) Tax Effect 462 — (99) — 363 Net Unrealized (Gains)/Losses (1,549) 1 333 — ( 1,215 )
Amounts Reclassified from AOCI (c) Realized Gains/(Losses) — — ( 106 ) — ( 106 ) Interest ExpenseRealized Gains/(Losses) — — — ( 161 ) ( 161 ) (c)Amortization of Prior Service Costs ( 2 ) (17) — — (19 ) (a)Amortization of Actuarial Loss ( 1,6 59) 10 — — (1,649 ) (a)
Tax (Expense) Benefit 383 — 24 — 407 ) (b)
Net Realized and Other Reclassification Adjustments (1,278) (7) ( 82 ) ( 161 ) (1,528 )
Balance December 31, 2019 $ 30,069 $ 177 $ ,492 $ — $ 30,738 Unrealized (Gains)/Losses ( 87 ) (8) 742 — 647 Tax Effect 20 2 ( 170 ) — ( 148 )
Net Unrealized (Gains)/Losses ( 67 ) (6) 572 — 499
Amounts Reclassified from AOCI (c) Realized Gains/(Losses) — — ( 358 ) — ( 358 ) Interest ExpenseAmortization of Prior Service Costs — ( 18 ) — — (18) (a)Amortization of Actuarial Loss ( 2,483) 10 ) — — (2,473 ) (a)Tax (Expense) Benefit 571 2 82 — 655 ) (b)
Net Realized and Other Reclassification Adjustments ( 1,912 ) ( 6 ) ( 276 ) — (2,194 )
Balance December 31, 2020 $ 28,090 $ 165 $ ,788 $ — $ 29,043
(a) These AOCI components are included in the computation of net periodic pension costs, which are included within Cost of Goods Sold and Selling, General and Administrative expenses in the Statement of Income (see Note 10 for additional details).
(b) Tax (expense) benefits are adjustments to deferred taxes within the Statements of Income.(c) Amounts in parentheses indicate a decrease to profit. (c) Amounts recorded to reclassify certain investments under ASU 2016-01, Recognition and Measurement of Financial Assets and Liabilities.
For the Year Ended December 31, 2020
Net Income (Loss)
Weighted Average Shares*
Income Less Preferred Stock Dividends
$ 6,547 ( 18 )
Income Available to Common Stockholders $ 6,529) 4,568
Basic Earnings per Share $ 1.43 ))
Dilutive Options 0
Diluted Earnings per Share $ 1.43 )) 4,568
For the Year Ended December 31, 2019
Net Income (Loss)
Weighted Average Shares*
Income Less Preferred Stock Dividends
$ 8,738 ( 18 )
Income Available to Common Stockholders $ 8,720 ) 4,558
Basic Earnings per Share $ 1.91)
Dilutive Options 0
Diluted Earnings per Share $ 1.91) 4,558
*Shares stated in thousands.
In accordance with financial accounting standards related to EPS, basic earnings per share is computed by dividing the net income available to common stockholders for
the period by the weighted average number of shares of Class A and Class B common stock outstanding during the year. In accordance with accounting guidance, Class B common stock has been included in the basic and diluted earnings per share as if the shares were converted into Class A common stock on a 1-for-1 basis. On a diluted basis, shares outstanding are adjusted to assume the conversion of outstanding rights into common stock. For 2020 and 2019, diluted earnings per share were determined on the assumption that rights outstanding under the Company’s Incentive and Non-qualified Stock Option and Stock Appreciation Rights Plans (see Note 9) will be settled in the form of stock, as settlement in stock is more dilutive. In 2020 and 2019, 229,767 and 188,610 options, respectively, were excluded from the diluted earnings per share calculation because of being anti-dilutive.
Accumulated Other Comprehensive Income (Loss) (AOCI): This is a subsection of Stockholders’ Equity that includes changes in fair value of interest rate swap instruments, currency hedges, and changes in pension and post-retirement benefit obligations, net of income taxes. The primary factor impacting balances in AOCI are changes to interest rates and related impacts to the discount rates used for pension and post-retirement benefit obligations and interest rates for swaps. The following reconcilement presents amounts reclassified from AOCI.
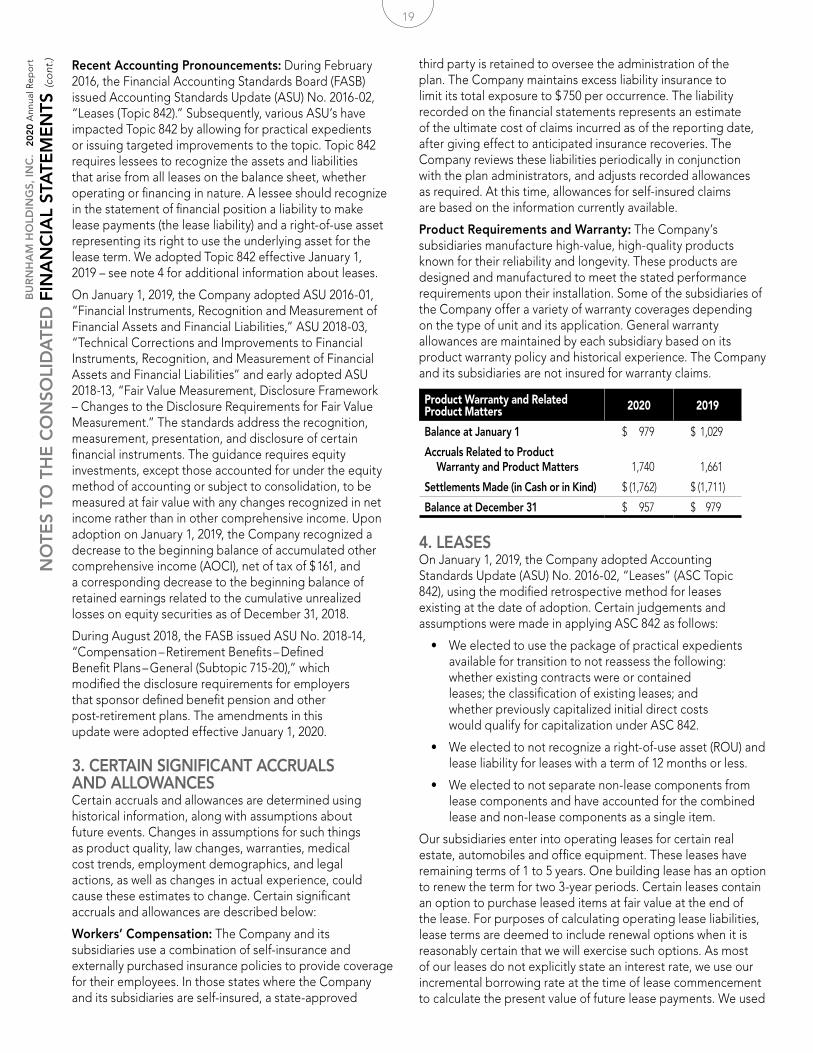
19
Recent Accounting Pronouncements: During February 2016, the Financial Accounting Standards Board (FASB) issued Accounting Standards Update (ASU) No. 2016-02, “Leases (Topic 842).” Subsequently, various ASU’s have impacted Topic 842 by allowing for practical expedients or issuing targeted improvements to the topic. Topic 842 requires lessees to recognize the assets and liabilities that arise from all leases on the balance sheet, whether operating or financing in nature. A lessee should recognize in the statement of financial position a liability to make lease payments (the lease liability) and a right-of-use asset representing its right to use the underlying asset for the lease term. We adopted Topic 842 effective January 1, 2019 – see note 4 for additional information about leases.
On January 1, 2019, the Company adopted ASU 2016-01, “Financial Instruments, Recognition and Measurement of Financial Assets and Financial Liabilities,” ASU 2018-03, “Technical Corrections and Improvements to Financial Instruments, Recognition, and Measurement of Financial Assets and Financial Liabilities” and early adopted ASU 2018-13, “Fair Value Measurement, Disclosure Framework – Changes to the Disclosure Requirements for Fair Value Measurement.” The standards address the recognition, measurement, presentation, and disclosure of certain financial instruments. The guidance requires equity investments, except those accounted for under the equity method of accounting or subject to consolidation, to be measured at fair value with any changes recognized in net income rather than in other comprehensive income. Upon adoption on January 1, 2019, the Company recognized a decrease to the beginning balance of accumulated other comprehensive income (AOCI), net of tax of $ 161, and a corresponding decrease to the beginning balance of retained earnings related to the cumulative unrealized losses on equity securities as of December 31, 2018.
During August 2018, the FASB issued ASU No. 2018-14, “Compensation – Retirement Benefits – Defined Benefit Plans – General (Subtopic 715-20),” which modified the disclosure requirements for employers that sponsor defined benefit pension and other post-retirement plans. The amendments in this update were adopted effective January 1, 2020.
3. CERTAIN SIGNIFICANT ACCRUALS AND ALLOWANCESCertain accruals and allowances are determined using historical information, along with assumptions about future events. Changes in assumptions for such things as product quality, law changes, warranties, medical cost trends, employment demographics, and legal actions, as well as changes in actual experience, could cause these estimates to change. Certain significant accruals and allowances are described below:
Workers’ Compensation: The Company and its subsidiaries use a combination of self-insurance and externally purchased insurance policies to provide coverage for their employees. In those states where the Company and its subsidiaries are self-insured, a state-approved
third party is retained to oversee the administration of the plan. The Company maintains excess liability insurance to limit its total exposure to $ 750 per occurrence. The liability recorded on the financial statements represents an estimate of the ultimate cost of claims incurred as of the reporting date, after giving effect to anticipated insurance recoveries. The Company reviews these liabilities periodically in conjunction with the plan administrators, and adjusts recorded allowances as required. At this time, allowances for self-insured claims are based on the information currently available.
Product Requirements and Warranty: The Company’s subsidiaries manufacture high-value, high-quality products known for their reliability and longevity. These products are designed and manufactured to meet the stated performance requirements upon their installation. Some of the subsidiaries of the Company offer a variety of warranty coverages depending on the type of unit and its application. General warranty allowances are maintained by each subsidiary based on its product warranty policy and historical experience. The Company and its subsidiaries are not insured for warranty claims.
Product Warranty and Related Product Matters 2020 2019
Balance at January 1 $ 979 $ 1,029
Accruals Related to Product Warranty and Product Matters
1,740
1,661
Settlements Made (in Cash or in Kind) $ (1,762) $ (1,711)
Balance at December 31 $ 957 $ 979
4. LEASESOn January 1, 2019, the Company adopted Accounting Standards Update (ASU) No. 2016-02, “Leases” (ASC Topic 842), using the modified retrospective method for leases existing at the date of adoption. Certain judgements and assumptions were made in applying ASC 842 as follows:
• We elected to use the package of practical expedients available for transition to not reassess the following: whether existing contracts were or contained leases; the classification of existing leases; and whether previously capitalized initial direct costs would qualify for capitalization under ASC 842.
• We elected to not recognize a right-of-use asset (ROU) and lease liability for leases with a term of 12 months or less.
• We elected to not separate non-lease components from lease components and have accounted for the combined lease and non-lease components as a single item.
Our subsidiaries enter into operating leases for certain real estate, automobiles and office equipment. These leases have remaining terms of 1 to 5 years. One building lease has an option to renew the term for two 3-year periods. Certain leases contain an option to purchase leased items at fair value at the end of the lease. For purposes of calculating operating lease liabilities, lease terms are deemed to include renewal options when it is reasonably certain that we will exercise such options. As most of our leases do not explicitly state an interest rate, we use our incremental borrowing rate at the time of lease commencement to calculate the present value of future lease payments. We used
BU
RN
HA
M H
OLD
ING
S, IN
C.
20
20 A
nnua
l Rep
ort
NO
TES
TO T
HE
CO
NSO
LID
ATE
D F
INA
NC
IAL
STA
TEM
EN
TS (c
ont
.)
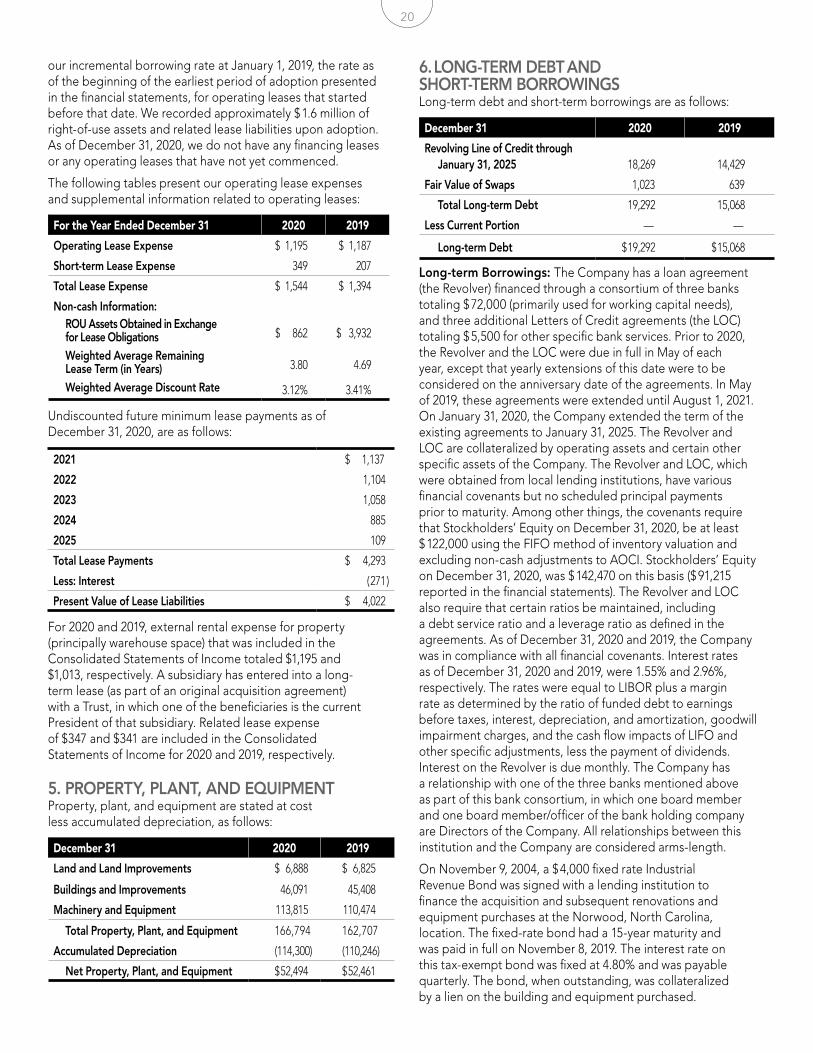
20
our incremental borrowing rate at January 1, 2019, the rate as of the beginning of the earliest period of adoption presented in the financial statements, for operating leases that started before that date. We recorded approximately $ 1.6 million of right-of-use assets and related lease liabilities upon adoption. As of December 31, 2020, we do not have any financing leases or any operating leases that have not yet commenced.
The following tables present our operating lease expenses and supplemental information related to operating leases:
For the Year Ended December 31 2020 2019
Operating Lease Expense $ 1,195 $ 1,187
Short-term Lease Expense 349 207
Total Lease Expense $ 1,544 $ 1,394
Non-cash Information:ROU Assets Obtained in Exchange for Lease Obligations $ 862 $ 3,932
Weighted Average Remaining Lease Term (in Years) 3.80 4.69
Weighted Average Discount Rate 3.12% 3.41%
Undiscounted future minimum lease payments as of December 31, 2020, are as follows:
2021 $ 1,137 )
2022 1,104 )
2023 1,058 )
2024 885 )
2025 109 )
Total Lease Payments $ 4,293 )
Less: Interest ( 271 )
Present Value of Lease Liabilities $ 4,022 )
For 2020 and 2019, external rental expense for property (principally warehouse space) that was included in the Consolidated Statements of Income totaled $1,195 and $1,013, respectively. A subsidiary has entered into a long-term lease (as part of an original acquisition agreement) with a Trust, in which one of the beneficiaries is the current President of that subsidiary. Related lease expense of $347 and $341 are included in the Consolidated Statements of Income for 2020 and 2019, respectively.
5. PROPERTY, PLANT, AND EQUIPMENTProperty, plant, and equipment are stated at cost less accumulated depreciation, as follows:
December 31 2020 2019
Land and Land Improvements $ 6,888 $ 6,825
Buildings and Improvements 46,091 45,408
Machinery and Equipment 113,815 110,474
Total Property, Plant, and Equipment 166,794 162,707
Accumulated Depreciation (114,300) (110,246)
Net Property, Plant, and Equipment $ 52,494 $ 52,461
6. LONG-TERM DEBT AND SHORT-TERM BORROWINGSLong-term debt and short-term borrowings are as follows:
December 31 2020 2019
Revolving Line of Credit through January 31, 2025 18,269 14,429
Fair Value of Swaps 1,023 639
Total Long-term Debt 19,292 15,068
Less Current Portion — —
Long-term Debt $ 19,292 $ 15,068
Long-term Borrowings: The Company has a loan agreement (the Revolver) financed through a consortium of three banks totaling $ 72,000 (primarily used for working capital needs), and three additional Letters of Credit agreements (the LOC) totaling $ 5,500 for other specific bank services. Prior to 2020, the Revolver and the LOC were due in full in May of each year, except that yearly extensions of this date were to be considered on the anniversary date of the agreements. In May of 2019, these agreements were extended until August 1, 2021. On January 31, 2020, the Company extended the term of the existing agreements to January 31, 2025. The Revolver and LOC are collateralized by operating assets and certain other specific assets of the Company. The Revolver and LOC, which were obtained from local lending institutions, have various financial covenants but no scheduled principal payments prior to maturity. Among other things, the covenants require that Stockholders’ Equity on December 31, 2020, be at least $ 122,000 using the FIFO method of inventory valuation and excluding non-cash adjustments to AOCI. Stockholders’ Equity on December 31, 2020, was $ 142,470 on this basis ($ 91,215 reported in the financial statements). The Revolver and LOC also require that certain ratios be maintained, including a debt service ratio and a leverage ratio as defined in the agreements. As of December 31, 2020 and 2019, the Company was in compliance with all financial covenants. Interest rates as of December 31, 2020 and 2019, were 1.55% and 2.96%, respectively. The rates were equal to LIBOR plus a margin rate as determined by the ratio of funded debt to earnings before taxes, interest, depreciation, and amortization, goodwill impairment charges, and the cash flow impacts of LIFO and other specific adjustments, less the payment of dividends. Interest on the Revolver is due monthly. The Company has a relationship with one of the three banks mentioned above as part of this bank consortium, in which one board member and one board member/officer of the bank holding company are Directors of the Company. All relationships between this institution and the Company are considered arms-length.
On November 9, 2004, a $ 4,000 fixed rate Industrial Revenue Bond was signed with a lending institution to finance the acquisition and subsequent renovations and equipment purchases at the Norwood, North Carolina, location. The fixed-rate bond had a 15-year maturity and was paid in full on November 8, 2019. The interest rate on this tax-exempt bond was fixed at 4.80% and was payable quarterly. The bond, when outstanding, was collateralized by a lien on the building and equipment purchased.
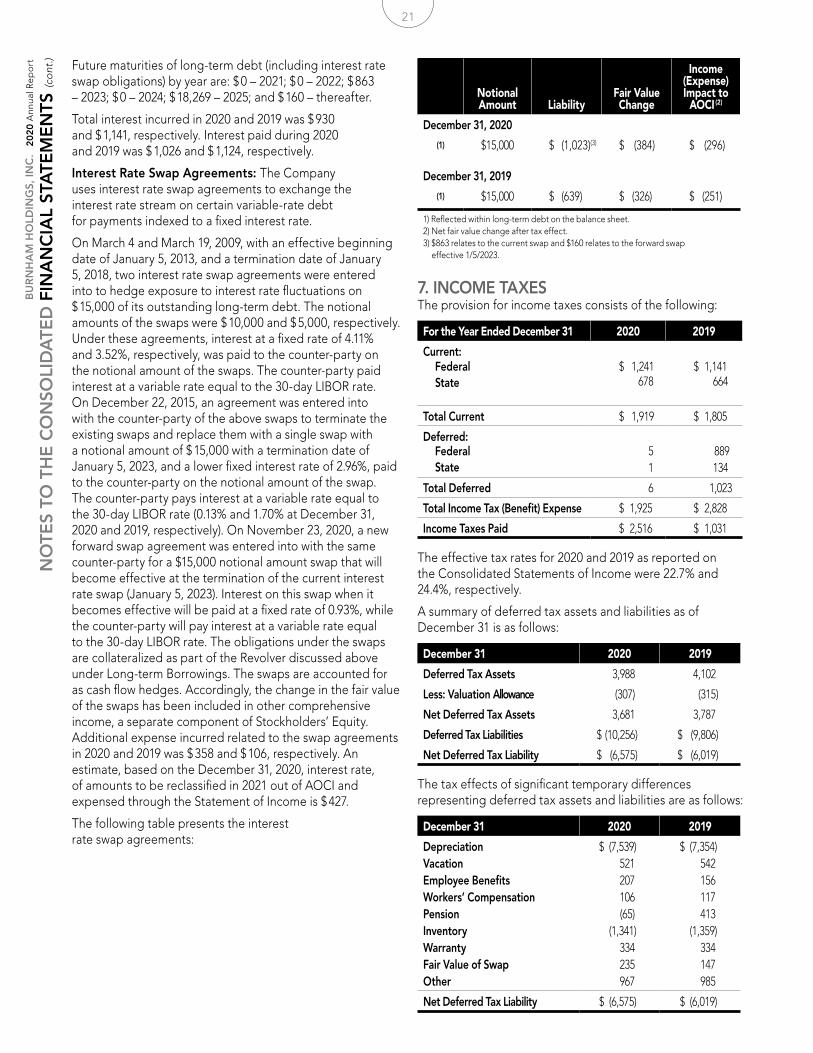
21
Future maturities of long-term debt (including interest rate swap obligations) by year are: $ 0 – 2021; $ 0 – 2022; $ 863 – 2023; $ 0 – 2024; $ 18,269 – 2025; and $ 160 – thereafter.
Total interest incurred in 2020 and 2019 was $ 930 and $ 1,141, respectively. Interest paid during 2020 and 2019 was $ 1,026 and $ 1,124, respectively.
Interest Rate Swap Agreements: The Company uses interest rate swap agreements to exchange the interest rate stream on certain variable-rate debt for payments indexed to a fixed interest rate.
On March 4 and March 19, 2009, with an effective beginning date of January 5, 2013, and a termination date of January 5, 2018, two interest rate swap agreements were entered into to hedge exposure to interest rate fluctuations on $ 15,000 of its outstanding long-term debt. The notional amounts of the swaps were $ 10,000 and $ 5,000, respectively. Under these agreements, interest at a fixed rate of 4.11% and 3.52%, respectively, was paid to the counter-party on the notional amount of the swaps. The counter-party paid interest at a variable rate equal to the 30-day LIBOR rate. On December 22, 2015, an agreement was entered into with the counter-party of the above swaps to terminate the existing swaps and replace them with a single swap with a notional amount of $ 15,000 with a termination date of January 5, 2023, and a lower fixed interest rate of 2.96%, paid to the counter-party on the notional amount of the swap. The counter-party pays interest at a variable rate equal to the 30-day LIBOR rate (0.13% and 1.70% at December 31, 2020 and 2019, respectively). On November 23, 2020, a new forward swap agreement was entered into with the same counter-party for a $15,000 notional amount swap that will become effective at the termination of the current interest rate swap (January 5, 2023). Interest on this swap when it becomes effective will be paid at a fixed rate of 0.93%, while the counter-party will pay interest at a variable rate equal to the 30-day LIBOR rate. The obligations under the swaps are collateralized as part of the Revolver discussed above under Long-term Borrowings. The swaps are accounted for as cash flow hedges. Accordingly, the change in the fair value of the swaps has been included in other comprehensive income, a separate component of Stockholders’ Equity. Additional expense incurred related to the swap agreements in 2020 and 2019 was $ 358 and $ 106, respectively. An estimate, based on the December 31, 2020, interest rate, of amounts to be reclassified in 2021 out of AOCI and expensed through the Statement of Income is $ 427.
The following table presents the interest rate swap agreements:
Notional Amount Liability
Fair Value Change
Income (Expense) Impact to
AOCI (2)
December 31, 2020
(1) $ 15,000 $ (1,023)(3) $ (384) $ (296)
December 31, 2019
(1) $ 15,000 $ (639) $ (326) $ (251)
1) Reflected within long-term debt on the balance sheet.2) Net fair value change after tax effect.3) $863 relates to the current swap and $160 relates to the forward swap
effective 1/5/2023.
7. INCOME TAXESThe provision for income taxes consists of the following:
For the Year Ended December 31 2020 2019
Current:FederalState
$ 1,241 678
$ 1,141 664
Total Current $ 1,919 $ 1,805
Deferred:FederalState
5 1
889 134
Total Deferred 6 1,023
Total Income Tax (Benefit) Expense $ 1,925 $ 2,828
Income Taxes Paid $ 2,516 $ 1,031
The effective tax rates for 2020 and 2019 as reported on the Consolidated Statements of Income were 22.7% and 24.4%, respectively.
A summary of deferred tax assets and liabilities as of December 31 is as follows:
December 31 2020 2019
Deferred Tax Assets 3,988 4,102
Less: Valuation Allowance (307) (315 )
Net Deferred Tax Assets 3,681 3,787
Deferred Tax Liabilities $ (10,256 ) $ (9,806 )
Net Deferred Tax Liability $ (6,575 ) $ (6,019 )
The tax effects of significant temporary differences representing deferred tax assets and liabilities are as follows:
December 31 2020 2019
Depreciation $ (7,539) $ (7,354)Vacation 521 542Employee Benefits 207 156Workers’ Compensation 106 117Pension (65) 413Inventory (1,341) (1,359)Warranty 334 334Fair Value of Swap 235 147Other 967 985
Net Deferred Tax Liability $ (6,575)) $ (6,019))
BU
RN
HA
M H
OLD
ING
S, IN
C.
20
20 A
nnua
l Rep
ort
NO
TES
TO T
HE
CO
NSO
LID
ATE
D F
INA
NC
IAL
STA
TEM
EN
TS (c
ont
.)
22
for key employees, including officers and directors. The 2013 Plan replaces the Company’s 1982 Incentive and Non-qualified Stock Option Plan and a Stock Appreciation Rights Plan (as amended through the April 2013 date), which was set to expire in 2014. This latter plan has vested remaining awards that will be exercised or expire over the next three years (last grant expires on May 14, 2022). The adoption of the 2013 Plan as the new governing document for future stock-based incentive compensation awards was intended to update the legal provisions applicable to the Company’s stock awards to reflect legal developments. The 2013 Plan gives the Board of Directors the ability to grant restricted stock awards (Restricted Shares), and other similar awards, in addition to stock options (Options) and stock appreciation rights (Rights), on terms and conditions set forth in the 2013 Plan. The 2013 Plan also increased the aggregate number of shares of the Company’s stock that may be delivered pursuant to awards to be granted under the 2013 Plan to the sum of (A) 350,000 plus (B) the number of shares available as of April 22, 2013, and as subsequently would have become available pursuant to the 1982 Plan, were such plan not terminated in connection with the adoption of this 2013 Plan (200,884 shares). Out of that sum, the aggregate number of shares that may be delivered pursuant to awards other than stock options, stock appreciation rights, and other similar awards, such as for example restricted stock awards, is limited to 225,000 shares of stock.
In general, Restricted Shares involve the delivery to participants of shares of stock that are subject to forfeiture conditions, such as continued employment or achievement of performance objectives. Deferred share awards are promises to deliver shares of stock, or cash based on the value of shares of stock, in the future, subject to specified conditions. Options, qualified or non-qualified, may be granted to purchase common shares at prices generally equal to the fair market value of the shares at the time the options are granted. Holders of Rights, on exercise, receive the excess of the fair market value of the common stock over the grant price in cash, common stock, or a combination thereof at the election of the Board of Directors. Shares issued under these plans can be either new, previously unissued shares, or treasury shares.
Restricted shares vest in annual installments of 33 1/3%, commencing one year after the date of grant (subject to forfeiture conditions) and are expensed over the three-year vesting period based on the fair market value of the Company’s stock.
Currently outstanding Options and Rights are exercisable in cumulative annual installments of 33 1/3%, commencing one year after the date of grant, and expire 10 years after grant. Additionally, while not required by the plans, these Rights and Options were issued in tandem, and the exercise of either serves to cancel the other. Effective January 1, 2006, the Company adopted the financial accounting provisions specific to Share-based Payments (SBP). The fair value of each of the Company’s stock option awards is re-measured at each
The Company adopted financial accounting standards related to accounting for uncertainty in income taxes on January 1, 2007. A reconcilement of the beginning and ending amount of unrecognized tax benefits is as follows:
For the Year Ended December 31 2020 2019
Balance at January 1 $ 53 $ 53
Gross Settlements (0) (0)
Balance at December 31 $ 53 $ 53
The Company recognizes interest and penalties related to uncertain tax positions in income tax expense. As of December 31, 2020 and 2019, no accrued interest or penalties related to uncertain tax positions were recorded in the consolidated balance sheets.
The total amount of unrecognized tax benefits that would affect the effective tax rate if recognized is $ 53 in both years. The tax years 2017 to 2020 remain open to examination by major taxing jurisdictions to which the Company is subject.
8. STOCKHOLDERS’ EQUITYThe Company’s Preferred Stock is 6% cumulative, voting, par value $ 50 a share; is redeemable at $ 52.50 a share; and is carried at its stated liquidation preference of $ 50 a share. There are 10,600 shares authorized and issued, including shares in Treasury Stock at December 31, 2020 and 2019, of 4,627.
The Company’s Class A common stock (Class A) has a par value of $ 1.00 per share; there are 9 million shares authorized. The Company’s Class B convertible common stock (Class B) has a par value of $ 1.00 per share; there are 4 million shares authorized.
Common stock shares outstanding were as follows:
December 31 2020 2019
Class A Stock Issued 3,559,993 3,536,389
Treasury Shares ( 373,031) ( 382,632 )
Class A Stock Outstanding 3,186,962 3,153,757
Class B Stock Outstanding 1,384,218 1,407,822
Total Stock Outstanding 4,571,180 4,561,579
Class A and Class B have similar rights except for voting rights and transferability. Class A has one vote per share. Class B has eight votes per share. A majority approval by the holders of Class B is required for certain corporate actions. Class B may be transferred only to Permitted Transferees, as defined in related documents, at the option of the holder of the Class B. Other transfers of Class B result in the automatic conversion of the transferred shares into an equal number of shares of Class A. Class B can be converted at any time into Class A at the option of the holder.
9. STOCK COMPENSATION PLANThe Company maintains a stock-based incentive compensation plan (the 2013 Plan), approved by stockholders on April 22, 2013,
23
reporting period using a Black-Scholes option-pricing model that uses the assumptions noted in the table below, as they are liability-classified awards. The fair value of the Company’s Options and Rights, which are subject to graded vesting, is expensed over the vesting life of the stock options. Expected volatility is based on an average of (1) historical volatility of the Company’s stock and (2) implied volatility from traded options on the Company’s stock. The risk-free rate for periods within the contractual life of the stock option award is based on the yield curve of a zero-coupon U.S. Treasury bond on the date the stock option award is granted, with a maturity equal to the expected term of the stock option award granted. The Company uses historical data to estimate stock option exercises and forfeitures within its valuation model. The expected life of stock option awards granted is derived from historical exercise experience under the Company’s share-based payment plans and represents the period of time that stock option awards granted are expected to be outstanding.
Compensation expenses related to the Company’s share-based awards recorded for the years ended December 31, 2020 and 2019, were $ 78 and $ 129, respectively. The estimated compensation expense for non-vested share-based awards as of December 31, 2020, is $ 243 and will be recognized over the next three years.
The significant weighted average assumptions related to Options and Rights were as follows:
For the Year Ended December 31 2020 2019
Dividend Yield 4.5% 4.5%
Volatility Rate 19.0% 18.0%
Risk-free Interest Rate 2.9% 3.4%
Expected Option Life (Years) 7.0 7.0
Transactions for 2020 and 2019 were as follows:
Options & Rights Awards
2020 2019
Shares
Weighted Average Exercise
Price Shares
Weighted Average Exercise
Price
Outstanding January 1 270,707 $ 16.78 235,107 $ 17.10
Granted — — 36,400 14.52
Exercised — — (800) 8.20
Lapsed (4,740) 14.72 — —
Outstanding December 31 265,967 $ 16.81 270,707 $ 16.78
Exercisable December 31 229,767 $ 17.15 188,610 $ 17.50
Restricted Stock
2020 2019
Shares
Weighted Average
Grant Price Shares
Weighted Average
Grant Price
Outstanding January 1 21,916 $ 14.94 21,061 $ 15.59
Granted 24,205 9.45 11,106 14.52
Vested (10,879) 15.25 (10,251) 15.82
Forfeited — — — —
Outstanding December 31 35,242 $ 11.07 21,916 $ 14.94
Options and Rights outstanding and exercisable at December 31, 2020, have exercise prices between $ 9.45 and $ 21.70. The weighted-average remaining contractual life of Options and Rights outstanding was 4.89 years and Options and Rights exercisable was 5.34 years. Shares available for grant at December 31, 2020 and 2019, were 412,251 and 431,716, respectively.
10. RETIREMENT PLANS AND OTHER POST-RETIREMENT BENEFIT ARRANGEMENTSDefined Benefit and Other Post-retirement Benefit Programs: The Company maintains a non-contributory defined benefit pension plan (the Plan) with substantial assets and liabilities. As required by current pension accounting standards, any excess or shortfall between the fair value of the assets and liabilities of the Plan are recorded on the balance sheet.
The Plan covers non-union employees hired before June 5, 2003, with final benefit accruals for non-union employees ending in 2006 and 2009 (based on age and service). The Plan also covers union employees, and during collective bargaining negotiations after 2004, the unions agreed that newly hired union employees would no longer have access to the Plan. There remains a limited, closed group of union employees still accruing benefits under the Plan.
Normal retirement age is 65, but provision is made for earlier retirement. Benefits for salaried employees are based on salary and years of service, while hourly employee benefits are based on average monthly compensation and years of service with negotiated minimum benefits. The Company’s funding policy is to make minimum annual contributions required by applicable regulations. The Company may, from time to time, also make voluntary contributions based on market fluctuations and the resulting impact on plan assets, and on changes in financial discount rates. Based on the funded position of the Plan at November 30, 2019, the Company did not have a minimum contribution required for 2020 but made a voluntary pre-tax contribution of $960 during 2020. In 2019, the Company did not make any voluntary contributions into
BU
RN
HA
M H
OLD
ING
S, IN
C.
20
20 A
nnua
l Rep
ort
NO
TES
TO T
HE
CO
NSO
LID
ATE
D F
INA
NC
IAL
STA
TEM
EN
TS (c
ont
.)
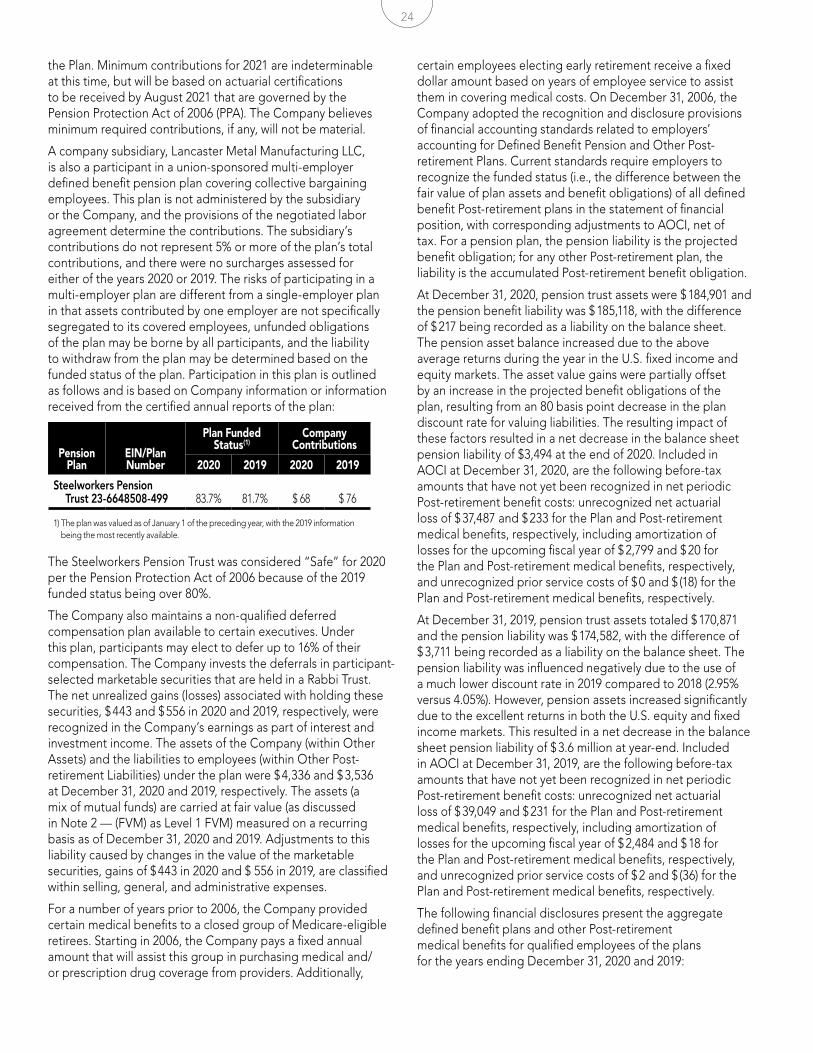
24
the Plan. Minimum contributions for 2021 are indeterminable at this time, but will be based on actuarial certifications to be received by August 2021 that are governed by the Pension Protection Act of 2006 (PPA). The Company believes minimum required contributions, if any, will not be material.
A company subsidiary, Lancaster Metal Manufacturing LLC, is also a participant in a union-sponsored multi-employer defined benefit pension plan covering collective bargaining employees. This plan is not administered by the subsidiary or the Company, and the provisions of the negotiated labor agreement determine the contributions. The subsidiary’s contributions do not represent 5% or more of the plan’s total contributions, and there were no surcharges assessed for either of the years 2020 or 2019. The risks of participating in a multi-employer plan are different from a single-employer plan in that assets contributed by one employer are not specifically segregated to its covered employees, unfunded obligations of the plan may be borne by all participants, and the liability to withdraw from the plan may be determined based on the funded status of the plan. Participation in this plan is outlined as follows and is based on Company information or information received from the certified annual reports of the plan:
Pension Plan
EIN/Plan Number
Plan Funded Status(1)
Company Contributions
2020 2019 2020 2019
Steelworkers PensionTrust 23-6648508-499 83.7% 81.7% $ 68 $ 76
1) The plan was valued as of January 1 of the preceding year, with the 2019 information being the most recently available.
The Steelworkers Pension Trust was considered “Safe” for 2020 per the Pension Protection Act of 2006 because of the 2019 funded status being over 80%.
The Company also maintains a non-qualified deferred compensation plan available to certain executives. Under this plan, participants may elect to defer up to 16% of their compensation. The Company invests the deferrals in participant-selected marketable securities that are held in a Rabbi Trust. The net unrealized gains (losses) associated with holding these securities, $ 443 and $ 556 in 2020 and 2019, respectively, were recognized in the Company’s earnings as part of interest and investment income. The assets of the Company (within Other Assets) and the liabilities to employees (within Other Post-retirement Liabilities) under the plan were $ 4,336 and $ 3,536 at December 31, 2020 and 2019, respectively. The assets (a mix of mutual funds) are carried at fair value (as discussed in Note 2 — (FVM) as Level 1 FVM) measured on a recurring basis as of December 31, 2020 and 2019. Adjustments to this liability caused by changes in the value of the marketable securities, gains of $ 443 in 2020 and $ 556 in 2019, are classified within selling, general, and administrative expenses.
For a number of years prior to 2006, the Company provided certain medical benefits to a closed group of Medicare-eligible retirees. Starting in 2006, the Company pays a fixed annual amount that will assist this group in purchasing medical and/or prescription drug coverage from providers. Additionally,
certain employees electing early retirement receive a fixed dollar amount based on years of employee service to assist them in covering medical costs. On December 31, 2006, the Company adopted the recognition and disclosure provisions of financial accounting standards related to employers’ accounting for Defined Benefit Pension and Other Post-retirement Plans. Current standards require employers to recognize the funded status (i.e., the difference between the fair value of plan assets and benefit obligations) of all defined benefit Post-retirement plans in the statement of financial position, with corresponding adjustments to AOCI, net of tax. For a pension plan, the pension liability is the projected benefit obligation; for any other Post-retirement plan, the liability is the accumulated Post-retirement benefit obligation.
At December 31, 2020, pension trust assets were $ 184,901 and the pension benefit liability was $ 185,118, with the difference of $ 217 being recorded as a liability on the balance sheet. The pension asset balance increased due to the above average returns during the year in the U.S. fixed income and equity markets. The asset value gains were partially offset by an increase in the projected benefit obligations of the plan, resulting from an 80 basis point decrease in the plan discount rate for valuing liabilities. The resulting impact of these factors resulted in a net decrease in the balance sheet pension liability of $3,494 at the end of 2020. Included in AOCI at December 31, 2020, are the following before-tax amounts that have not yet been recognized in net periodic Post-retirement benefit costs: unrecognized net actuarial loss of $ 37,487 and $ 233 for the Plan and Post-retirement medical benefits, respectively, including amortization of losses for the upcoming fiscal year of $ 2,799 and $ 20 for the Plan and Post-retirement medical benefits, respectively, and unrecognized prior service costs of $ 0 and $ (18) for the Plan and Post-retirement medical benefits, respectively.
At December 31, 2019, pension trust assets totaled $ 170,871 and the pension liability was $ 174,582, with the difference of $ 3,711 being recorded as a liability on the balance sheet. The pension liability was influenced negatively due to the use of a much lower discount rate in 2019 compared to 2018 (2.95% versus 4.05%). However, pension assets increased significantly due to the excellent returns in both the U.S. equity and fixed income markets. This resulted in a net decrease in the balance sheet pension liability of $ 3.6 million at year-end. Included in AOCI at December 31, 2019, are the following before-tax amounts that have not yet been recognized in net periodic Post-retirement benefit costs: unrecognized net actuarial loss of $ 39,049 and $ 231 for the Plan and Post-retirement medical benefits, respectively, including amortization of losses for the upcoming fiscal year of $ 2,484 and $ 18 for the Plan and Post-retirement medical benefits, respectively, and unrecognized prior service costs of $ 2 and $ (36) for the Plan and Post-retirement medical benefits, respectively.
The following financial disclosures present the aggregate defined benefit plans and other Post-retirement medical benefits for qualified employees of the plans for the years ending December 31, 2020 and 2019:
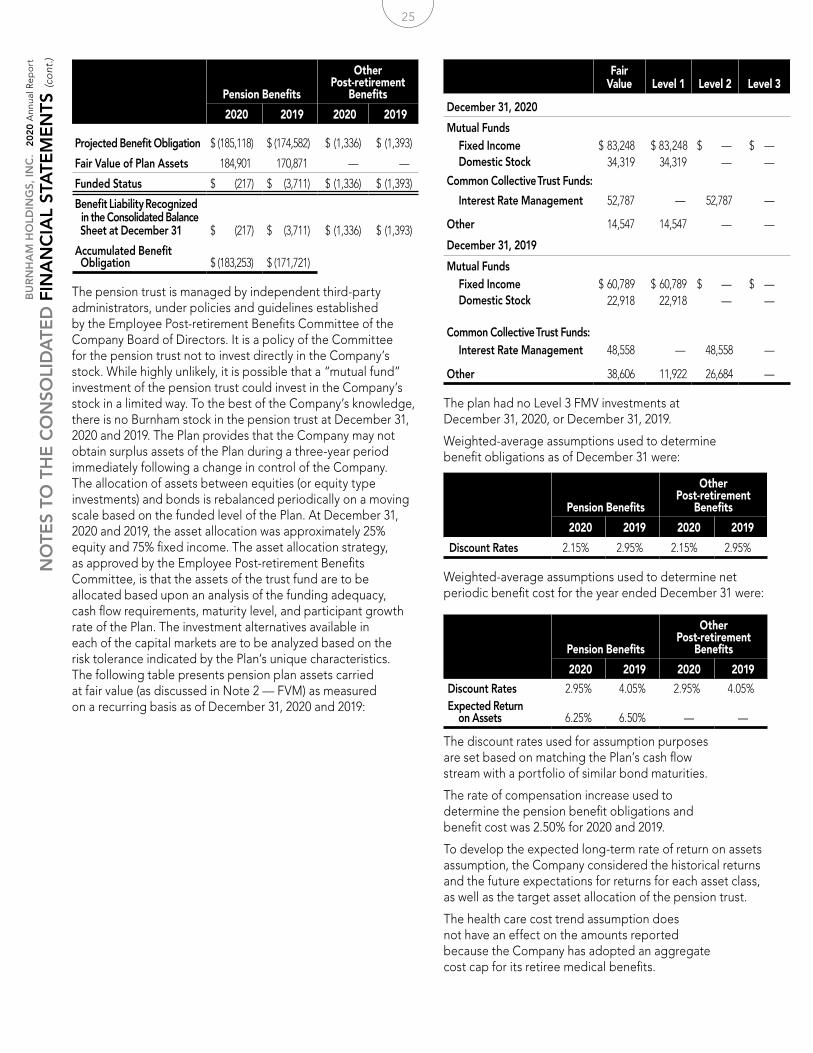
25
Pension Benefits
Other Post-retirement
Benefits
2020 2019 2020 2019
Projected Benefit Obligation $ (185,118) $ (174,582) $ (1,336) $ (1,393)
Fair Value of Plan Assets 184,901 170,871 — —
Funded Status $ (217) $ (3,711) $ (1,336) $ (1,393)
Benefit Liability Recognized in the Consolidated Balance Sheet at December 31 $ (217) $ (3,711) $ (1,336) $ (1,393)
Accumulated Benefit Obligation $ (183,253)) $ (171,721)) ) )
The pension trust is managed by independent third-party administrators, under policies and guidelines established by the Employee Post-retirement Benefits Committee of the Company Board of Directors. It is a policy of the Committee for the pension trust not to invest directly in the Company’s stock. While highly unlikely, it is possible that a “mutual fund” investment of the pension trust could invest in the Company’s stock in a limited way. To the best of the Company’s knowledge, there is no Burnham stock in the pension trust at December 31, 2020 and 2019. The Plan provides that the Company may not obtain surplus assets of the Plan during a three-year period immediately following a change in control of the Company. The allocation of assets between equities (or equity type investments) and bonds is rebalanced periodically on a moving scale based on the funded level of the Plan. At December 31, 2020 and 2019, the asset allocation was approximately 25% equity and 75% fixed income. The asset allocation strategy, as approved by the Employee Post-retirement Benefits Committee, is that the assets of the trust fund are to be allocated based upon an analysis of the funding adequacy, cash flow requirements, maturity level, and participant growth rate of the Plan. The investment alternatives available in each of the capital markets are to be analyzed based on the risk tolerance indicated by the Plan’s unique characteristics. The following table presents pension plan assets carried at fair value (as discussed in Note 2 — FVM) as measured on a recurring basis as of December 31, 2020 and 2019:
BU
RN
HA
M H
OLD
ING
S, IN
C.
20
20 A
nnua
l Rep
ort
NO
TES
TO T
HE
CO
NSO
LID
ATE
D F
INA
NC
IAL
STA
TEM
EN
TS (c
ont
.)
Fair Value Level 1 Level 2 Level 3
December 31, 2020
Mutual FundsFixed IncomeDomestic Stock
$ 83,248 34,319
$ 83,248 34,319
$ — —
$ — —
Common Collective Trust Funds:
Interest Rate Management 52,787 — 52,787 —
Other 14,547 14,547 — —
December 31, 2019
Mutual FundsFixed IncomeDomestic Stock
$ 60,789 22,918
$ 60,789 22,918
$ — —
$ — —
Common Collective Trust Funds:Interest Rate Management 48,558 — 48,558 —
Other 38,606 11,922 26,684 —
The plan had no Level 3 FMV investments at December 31, 2020, or December 31, 2019.
Weighted-average assumptions used to determine benefit obligations as of December 31 were:
Pension Benefits
Other Post-retirement
Benefits
2020 2019 2020 2019
Discount Rates 2.15% 2.95% 2.15% 2.95%
Weighted-average assumptions used to determine net periodic benefit cost for the year ended December 31 were:
Pension Benefits
Other Post-retirement
Benefits
2020 2019 2020 2019
Discount Rates 2.95% 4.05% 2.95% 4.05%Expected Return on Assets 6.25% 6.50% — —
The discount rates used for assumption purposes are set based on matching the Plan’s cash flow stream with a portfolio of similar bond maturities.
The rate of compensation increase used to determine the pension benefit obligations and benefit cost was 2.50% for 2020 and 2019.
To develop the expected long-term rate of return on assets assumption, the Company considered the historical returns and the future expectations for returns for each asset class, as well as the target asset allocation of the pension trust.
The health care cost trend assumption does not have an effect on the amounts reported because the Company has adopted an aggregate cost cap for its retiree medical benefits.
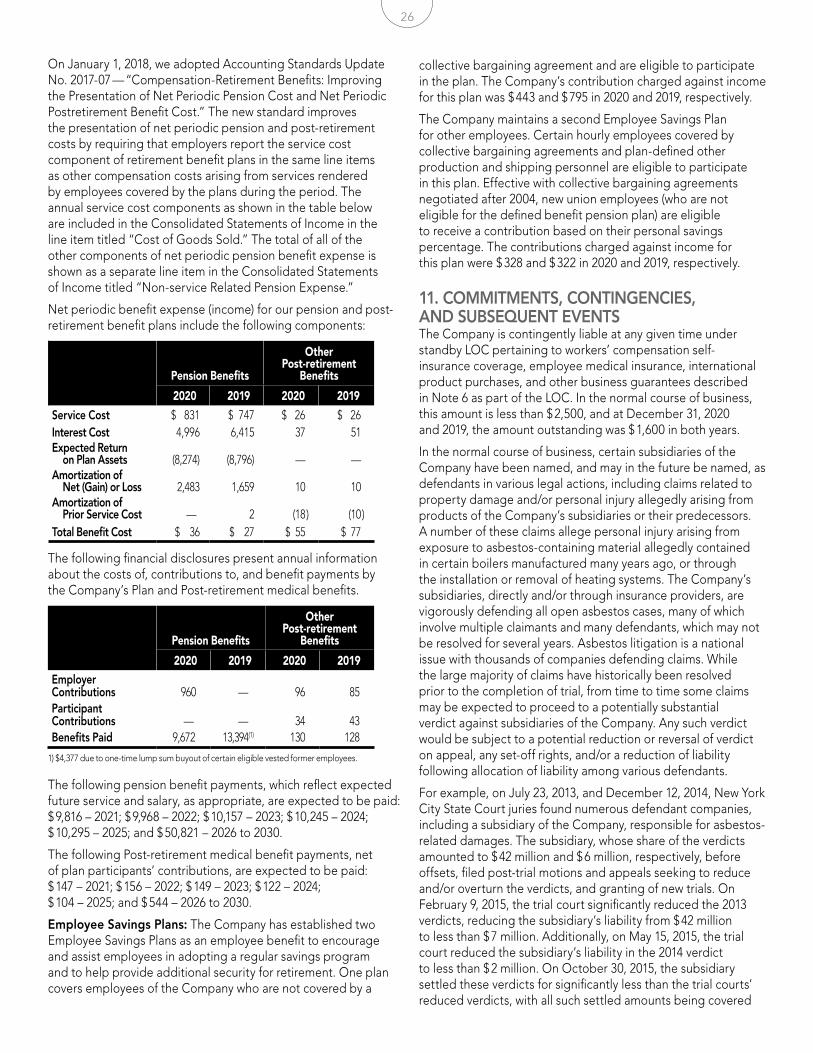
26
On January 1, 2018, we adopted Accounting Standards Update No. 2017-07 — “Compensation-Retirement Benefits: Improving the Presentation of Net Periodic Pension Cost and Net Periodic Postretirement Benefit Cost.” The new standard improves the presentation of net periodic pension and post-retirement costs by requiring that employers report the service cost component of retirement benefit plans in the same line items as other compensation costs arising from services rendered by employees covered by the plans during the period. The annual service cost components as shown in the table below are included in the Consolidated Statements of Income in the line item titled “Cost of Goods Sold.” The total of all of the other components of net periodic pension benefit expense is shown as a separate line item in the Consolidated Statements of Income titled “Non-service Related Pension Expense.”
Net periodic benefit expense (income) for our pension and post-retirement benefit plans include the following components:
Pension Benefits
Other Post-retirement
Benefits
2020 2019 2020 2019
Service Cost $ 831 $ 747 $ 26 ) $ 26 )Interest Cost 4,996 6,415 37 ) 51 )Expected Return on Plan Assets (8,274) (8,796) — ) — )Amortization of Net (Gain) or Loss 2,483 1,659 10 ) 10 )Amortization of Prior Service Cost — ) 2 (18 ) (10 )Total Benefit Cost $ 36 $ 27 $ 55 ) $ 77 )
The following financial disclosures present annual information about the costs of, contributions to, and benefit payments by the Company’s Plan and Post-retirement medical benefits.
Pension Benefits
Other Post-retirement
Benefits
2020 2019 2020 2019Employer Contributions 960 —) 96 85Participant Contributions —) —) 34 43Benefits Paid 9,672 13,394(1)) 130 128
1) $4,377 due to one-time lump sum buyout of certain eligible vested former employees.
The following pension benefit payments, which reflect expected future service and salary, as appropriate, are expected to be paid: $ 9,816 – 2021; $ 9,968 – 2022; $ 10,157 – 2023; $ 10,245 – 2024; $ 10,295 – 2025; and $ 50,821 – 2026 to 2030.
The following Post-retirement medical benefit payments, net of plan participants’ contributions, are expected to be paid: $ 147 – 2021; $ 156 – 2022; $ 149 – 2023; $ 122 – 2024; $ 104 – 2025; and $ 544 – 2026 to 2030.
Employee Savings Plans: The Company has established two Employee Savings Plans as an employee benefit to encourage and assist employees in adopting a regular savings program and to help provide additional security for retirement. One plan covers employees of the Company who are not covered by a
collective bargaining agreement and are eligible to participate in the plan. The Company’s contribution charged against income for this plan was $ 443 and $ 795 in 2020 and 2019, respectively.
The Company maintains a second Employee Savings Plan for other employees. Certain hourly employees covered by collective bargaining agreements and plan-defined other production and shipping personnel are eligible to participate in this plan. Effective with collective bargaining agreements negotiated after 2004, new union employees (who are not eligible for the defined benefit pension plan) are eligible to receive a contribution based on their personal savings percentage. The contributions charged against income for this plan were $ 328 and $ 322 in 2020 and 2019, respectively.
11. COMMITMENTS, CONTINGENCIES, AND SUBSEQUENT EVENTSThe Company is contingently liable at any given time under standby LOC pertaining to workers’ compensation self-insurance coverage, employee medical insurance, international product purchases, and other business guarantees described in Note 6 as part of the LOC. In the normal course of business, this amount is less than $ 2,500, and at December 31, 2020 and 2019, the amount outstanding was $ 1,600 in both years.
In the normal course of business, certain subsidiaries of the Company have been named, and may in the future be named, as defendants in various legal actions, including claims related to property damage and/or personal injury allegedly arising from products of the Company’s subsidiaries or their predecessors. A number of these claims allege personal injury arising from exposure to asbestos-containing material allegedly contained in certain boilers manufactured many years ago, or through the installation or removal of heating systems. The Company’s subsidiaries, directly and/or through insurance providers, are vigorously defending all open asbestos cases, many of which involve multiple claimants and many defendants, which may not be resolved for several years. Asbestos litigation is a national issue with thousands of companies defending claims. While the large majority of claims have historically been resolved prior to the completion of trial, from time to time some claims may be expected to proceed to a potentially substantial verdict against subsidiaries of the Company. Any such verdict would be subject to a potential reduction or reversal of verdict on appeal, any set-off rights, and/or a reduction of liability following allocation of liability among various defendants.
For example, on July 23, 2013, and December 12, 2014, New York City State Court juries found numerous defendant companies, including a subsidiary of the Company, responsible for asbestos-related damages. The subsidiary, whose share of the verdicts amounted to $ 42 million and $ 6 million, respectively, before offsets, filed post-trial motions and appeals seeking to reduce and/or overturn the verdicts, and granting of new trials. On February 9, 2015, the trial court significantly reduced the 2013 verdicts, reducing the subsidiary’s liability from $ 42 million to less than $ 7 million. Additionally, on May 15, 2015, the trial court reduced the subsidiary’s liability in the 2014 verdict to less than $ 2 million. On October 30, 2015, the subsidiary settled these verdicts for significantly less than the trial courts’ reduced verdicts, with all such settled amounts being covered
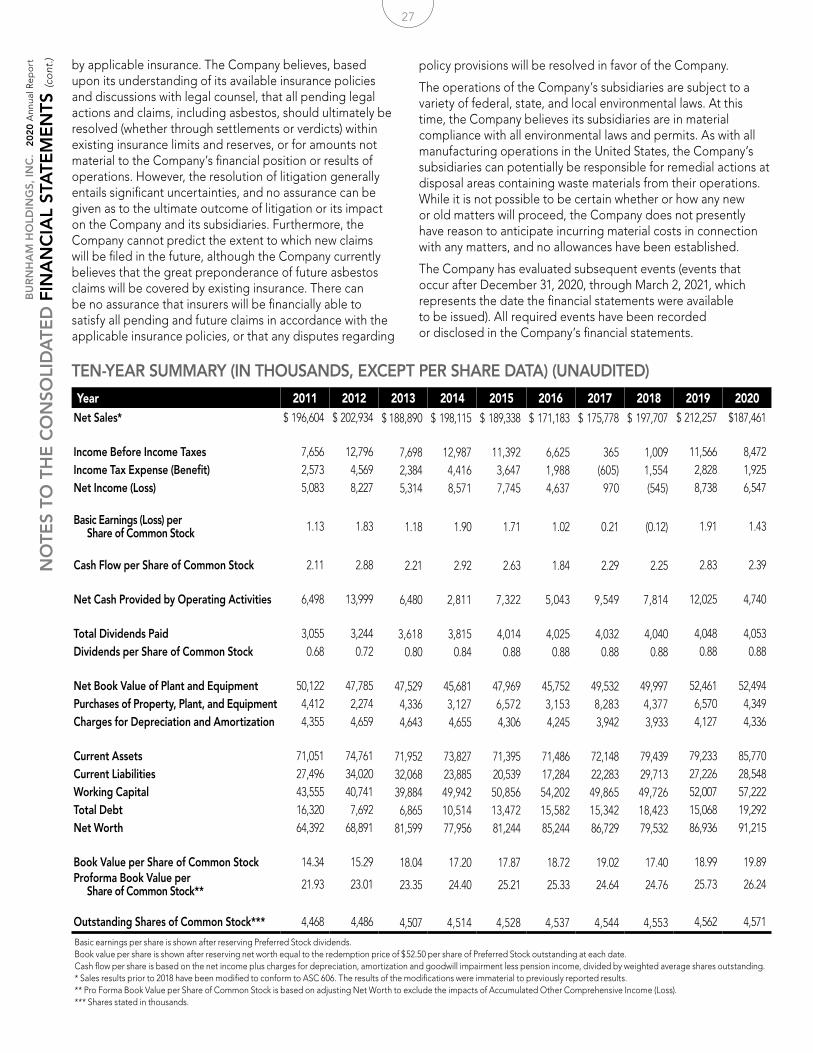
27
TEN-YEAR SUMMARY (IN THOUSANDS, EXCEPT PER SHARE DATA) (UNAUDITED)
Year 2011 2012 2013 2014 2015 2016 2017 2018 2019 2020Net Sales* $ 196,604 $ 202,934 $ 188,890 $ 198,115 $ 189,338 $ 171,183 $ 175,778 $ 197,707 $ 212,257 $187,461
Income Before Income Taxes 7,656 12,796 7,698 12,987 11,392 6,625 365 1,009 11,566 8,472 Income Tax Expense (Benefit) 2,573 4,569 2,384 4,416 3,647 1,988 (605) 1,554 2,828 1,925 Net Income (Loss) 5,083 8,227 5,314 8,571 7,745 4,637 970 (545) 8,738 6,547
Basic Earnings (Loss) per Share of Common Stock 1.13 1.83 1.18 1.90 1.71 1.02 0.21 (0.12) 1.91 1.43
Cash Flow per Share of Common Stock 2.11 2.88 2.21 2.92 2.63 1.84 2.29 2.25 2.83 2.39
Net Cash Provided by Operating Activities 6,498 13,999 6,480 2,811 7,322 5,043 9,549 7,814 12,025 4,740
Total Dividends Paid 3,055 3,244 3,618 3,815 4,014 4,025 4,032 4,040 4,048 4,053 Dividends per Share of Common Stock 0.68 0.72 0.80 0.84 0.88 0.88 0.88 0.88 0.88 0.88
Net Book Value of Plant and Equipment 50,122 47,785 47,529 45,681 47,969 45,752 49,532 49,997 52,461 52,494 Purchases of Property, Plant, and Equipment 4,412 2,274 4,336 3,127 6,572 3,153 8,283 4,377 6,570 4,349 Charges for Depreciation and Amortization 4,355 4,659 4,643 4,655 4,306 4,245 3,942 3,933 4,127 4,336
Current Assets 71,051 74,761 71,952 73,827 71,395 71,486 72,148 79,439 79,233 85,770 Current Liabilities 27,496 34,020 32,068 23,885 20,539 17,284 22,283 29,713 27,226 28,548 Working Capital 43,555 40,741 39,884 49,942 50,856 54,202 49,865 49,726 52,007 57,222 Total Debt 16,320 7,692 6,865 10,514 13,472 15,582 15,342 18,423 15,068 19,292 Net Worth 64,392 68,891 81,599 77,956 81,244 85,244 86,729 79,532 86,936 91,215
Book Value per Share of Common Stock 14.34 15.29 18.04 17.20 17.87 18.72 19.02 17.40 18.99 19.89 Proforma Book Value per Share of Common Stock** 21.93 23.01 23.35 24.40 25.21 25.33 24.64 24.76 25.73 26.24
Outstanding Shares of Common Stock*** 4,468 4,486 4,507 4,514 4,528 4,537 4,544 4,553 4,562 4,571
Basic earnings per share is shown after reserving Preferred Stock dividends.Book value per share is shown after reserving net worth equal to the redemption price of $ 52.50 per share of Preferred Stock outstanding at each date.Cash flow per share is based on the net income plus charges for depreciation, amortization and goodwill impairment less pension income, divided by weighted average shares outstanding.* Sales results prior to 2018 have been modified to conform to ASC 606. The results of the modifications were immaterial to previously reported results.** Pro Forma Book Value per Share of Common Stock is based on adjusting Net Worth to exclude the impacts of Accumulated Other Comprehensive Income (Loss).*** Shares stated in thousands.
BU
RN
HA
M H
OLD
ING
S, IN
C.
20
20 A
nnua
l Rep
ort
BU
RN
HA
M H
OLD
ING
S, IN
C.
20
20 A
nnua
l Rep
ort by applicable insurance. The Company believes, based
upon its understanding of its available insurance policies and discussions with legal counsel, that all pending legal actions and claims, including asbestos, should ultimately be resolved (whether through settlements or verdicts) within existing insurance limits and reserves, or for amounts not material to the Company’s financial position or results of operations. However, the resolution of litigation generally entails significant uncertainties, and no assurance can be given as to the ultimate outcome of litigation or its impact on the Company and its subsidiaries. Furthermore, the Company cannot predict the extent to which new claims will be filed in the future, although the Company currently believes that the great preponderance of future asbestos claims will be covered by existing insurance. There can be no assurance that insurers will be financially able to satisfy all pending and future claims in accordance with the applicable insurance policies, or that any disputes regarding
policy provisions will be resolved in favor of the Company.
The operations of the Company’s subsidiaries are subject to a variety of federal, state, and local environmental laws. At this time, the Company believes its subsidiaries are in material compliance with all environmental laws and permits. As with all manufacturing operations in the United States, the Company’s subsidiaries can potentially be responsible for remedial actions at disposal areas containing waste materials from their operations. While it is not possible to be certain whether or how any new or old matters will proceed, the Company does not presently have reason to anticipate incurring material costs in connection with any matters, and no allowances have been established.
The Company has evaluated subsequent events (events that occur after December 31, 2020, through March 2, 2021, which represents the date the financial statements were available to be issued). All required events have been recorded or disclosed in the Company’s financial statements.
NO
TES
TO T
HE
CO
NSO
LID
ATE
D F
INA
NC
IAL
STA
TEM
EN
TS (c
ont
.)
28
BU
RN
HA
M H
OLD
ING
S, IN
C.
20
20 A
nnua
l Rep
ort
INV
EST
OR
& S
TOC
KH
OLD
ER
IN
FOR
MA
TIO
N BUSINESS STRATEGYSubsidiaries of the Company provide high-value, high-quality HVAC products backed by superior service. This diverse product mix meets the various needs of most residential, commercial, and industrial applications. This diversification, combined with the critical need for thermal solutions, ensures consistent financial performance through fluctuating economic cycles. That’s how the Company provides consistent returns: We’re creating value in established market segments driven by a constant replacement cycle. Our strong earnings and dividend history, proven management team, diverse product mix, and continuing product demand represent an outstanding opportunity for stakeholders. The Company is a unique investment opportunity that creates stable value while delivering solid returns. The Company has also grown and will continue to grow through acquisitions. The Company is continually looking for appropriate acquisitions at appropriate prices.
REPORTING REQUIREMENTSThe Company is not currently required to register with the SEC (Securities and Exchange Commission) and therefore is not subject to the reporting requirements of an SEC-regulated public company. Individuals, trusts, and investment organizations hold shares of the Company. To the best of the Company’s knowledge, no one person owns more than 10% of the outstanding shares, irrespective of class or combination of classes (shares held by family relatives have not been combined in computing this percentage). While the Company has chosen not to voluntarily register and become subject to the costly reporting requirements of the SEC, the Company has always been committed to providing timely, complete, and accurate financial information consistent with generally accepted accounting principles, legal, and regulatory requirements. The Company issues periodic news releases, quarterly unaudited statements, a yearly Annual Report with audited financial statements, and a Proxy Statement. Interim consolidated financial statements should be read in conjunction with the audited financial statements and notes thereto for the year ended December 31, 2020. The results for any interim period are not necessarily indicative of results for the full year. Certain information and footnote disclosures normally included in audited financial statements have been omitted. As mentioned previously, the Company is not subject to SEC reporting requirements and therefore its quarterly interim consolidated financial statements are not subject to an interim review by independent auditors as prescribed by the SEC. This Annual Report contains forward-looking statements. Other reports, letters, and press releases distributed by the Company may also contain forward-looking statements. Statements that are not historical facts, including statements about our beliefs and expectations, are forward-looking statements. These statements are based on current plans, estimates, and projections, and therefore you should not place undue reliance on them. Forward-looking statements speak only as of the date they are made, and we undertake no obligation to update publicly any of them in light of new information or future events. Forward-looking statements involve inherent risks and uncertainties. We caution you that a number of important factors could cause actual results to differ materially from those contained in any forward-looking statement. Such factors include, but are not limited to, variations in weather, changes in the regulatory environment, raw material costs, litigation, customer preferences, general economic conditions, technology, product performance, and increased competition.
29
BU
RN
HA
M H
OLD
ING
S, IN
C.
20
20 A
nnua
l Rep
ort
BU
RN
HA
M H
OLD
ING
S, IN
C.
20
20 A
nnua
l Rep
ortCORPORATE GOVERNANCE
The Board of Directors (the Board) of the Company comprises ten members, eight of whom are considered “independent” directors (not an employee, not affiliated with the Company’s auditors, and not part of an interlocking directorate). The remaining two members of the Board are the Company’s Vice Chairman and Chief Executive Officer and the Company’s President and Chief Operating Officer. Directors are selected based on their individual qualifications and experience, the overall balance of the Board’s background and experience, and each individual’s willingness to fulfill their obligations and to contribute appropriately. Four directors are members of families, the extended members of which hold in the aggregate significant ownership interests in the Company.
Board members have complete access to Company information and personnel through meetings, reports, on-site operational reviews, and direct contact.
The total Board meets five times per year, with various additional Board committee meetings and special meetings held throughout the year. Board committees concentrate on important areas of responsibility. Standing committees of the Company consist of the Employee Post Retirement Benefits Committee, the Nominating and Governance Committee, the Audit and Risk Committee, and the Human Resources Committee. These committees have defined charters that address the committees’ purposes, goals, and responsibilities. All committees meet on a scheduled basis. Please refer to the proxy for more information on corporate governance, executive compensation, and security holders.IN
VE
STO
R &
STO
CK
HO
LDE
R
INFO
RM
ATI
ON
(c
ont
.)) INVESTOR AND STOCKHOLDER INFORMATION
Stockholder InquiriesQuestions concerning your account, dividend payments, address changes, consolidation of duplicate accounts, lost certificates, and related matters should be addressed to Burnham Holdings, Inc.’s transfer agent:
Fulton Financial Advisors, N.A. One Penn Square Lancaster, PA 17602 (717) 291-2562
Stock Exchange ListingThe Common Stock of the Company is traded under the symbol “BURCA” on the electronic Pink Sheets and is listed by the OTC Markets Group, Inc., reporting service for over-the-counter stocks. Stock quotation information is available through stock reporting services on the internet.
Two services that report on the Company are www.bloomberg.com and www.otcmarkets.com.
Annual MeetingBurnham Holdings, Inc.’s Annual Meeting will be held on Monday, April 26, 2021, beginning at 11:30 a.m. Due to the current COVID-19 pandemic, the Annual Meeting will be a virtual event. Further details will be provided in March, 2021, on our website, www.burnhamholdings.com.
Corporate DataBurnham Holdings, Inc., 1241 Harrisburg Avenue, Post Office Box 3245, Lancaster, PA 17604-3245
For further information, contact Dale R. Bowman, Vice President and Chief Financial Officer.
Telephone: (717) 390-7832 Fax: (717) 390-7852 Email: [email protected]
You can access Company information, including press releases, earnings announcements, history, and other information, through the internet by visiting the Burnham Holdings, Inc. website at www.burnhamholdings.com.

30
Philmer H. Rohrbaugh, John W. Lyman, E. Philip Wenger, Christopher R. Drew, Douglas S. Brossman, George W. Hodges, Laura T. Wand, William F. Dodge, II, Donald A. Stern, Elizabeth H. McMullan
Bradley C. Ehlert, Dale R. Bowman, Christopher R. Drew, Douglas S. Brossman, John A. Roda
AUDIT & RISK COMMITTEEPhilmer H. Rohrbaugh - ChairJohn W. LymanDonald A. SternLaura T. WandGeorge W. Hodges, ex officio
OFFICERS OF BURNHAM HOLDINGS, INC.Douglas S. Brossman Vice Chairman and Chief Executive OfficerChristopher R. Drew President and Chief Operating OfficerDale R. Bowman Vice President — Chief Financial Officer and Assistant SecretaryJohn A. Roda Vice President — General Counsel and SecretaryBradley C. Ehlert Controller
EMPLOYEE POST RETIREMENT BENEFITS COMMITTEE Elizabeth H. McMullan - ChairWilliam F. Dodge, IIDouglas S. Brossman Christopher R. DrewGeorge W. Hodges, ex officio
HUMAN RESOURCES COMMITTEEE. Phillip Wenger - ChairElizabeth H. McMullanJohn W. LymanDouglas S. BrossmanChristopher R. DrewDonald A. SternGeorge W. Hodges, ex officio
NOMINATING & GOVERNANCE COMMITTEE John W. Lyman - ChairElizabeth H. McMullanWilliam F. Dodge, II Christopher R. DrewPhilmer H. RohrbaughGeorge W. Hodges, ex officio
PROXY COMMITTEEWilliam F. Dodge, II - ChairElizabeth H. McMullanJohn W. LymanGeorge W. Hodges, ex officio
BU
RN
HA
M H
OLD
ING
S, IN
C.
20
20 A
nnua
l Rep
ort
DIR
EC
TOR
S &
OFF
ICE
RS
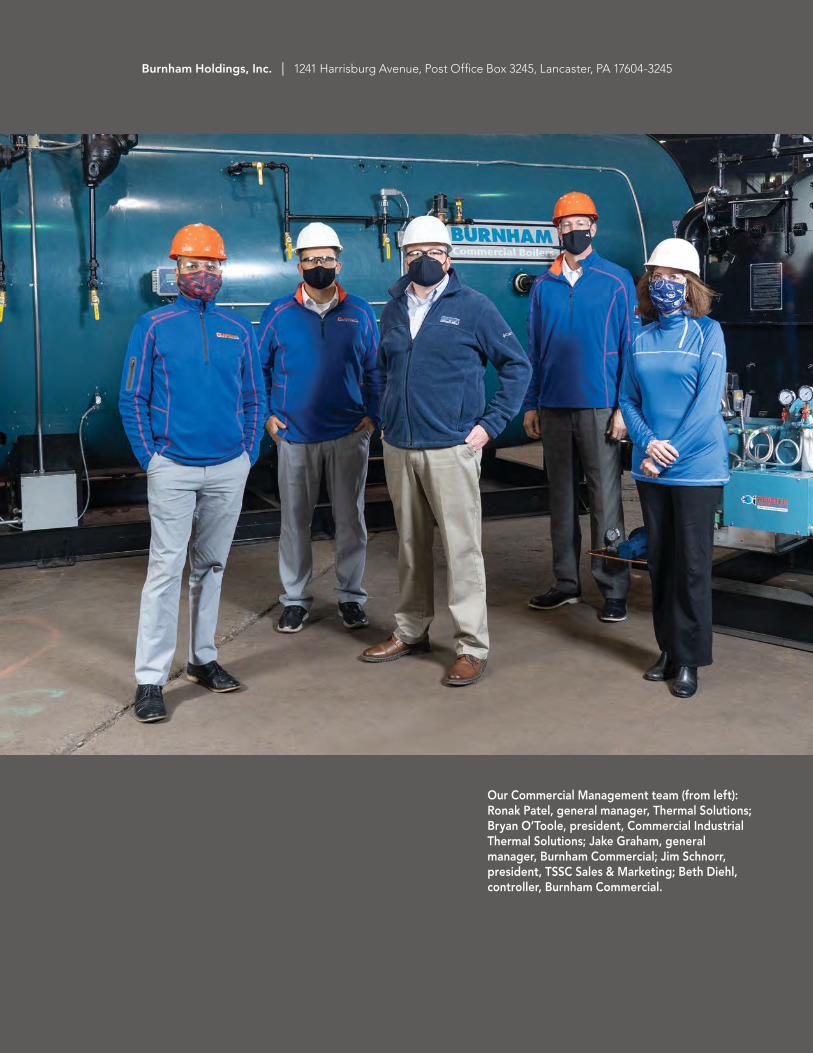
Burnham Holdings, Inc. | 1241 Harrisburg Avenue, Post Office Box 3245, Lancaster, PA 17604-3245
Our Commercial Management team (from left): Ronak Patel, general manager, Thermal Solutions; Bryan O’Toole, president, Commercial Industrial Thermal Solutions; Jake Graham, general manager, Burnham Commercial; Jim Schnorr, president, TSSC Sales & Marketing; Beth Diehl, controller, Burnham Commercial.
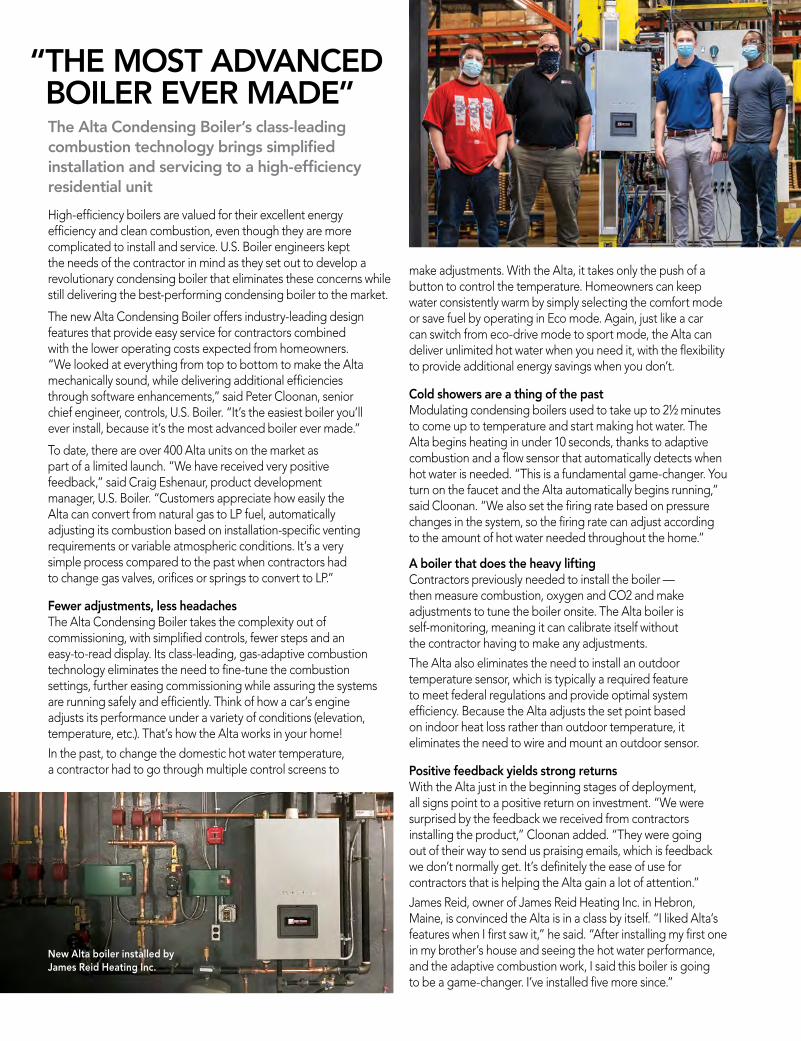
make adjustments. With the Alta, it takes only the push of a button to control the temperature. Homeowners can keep water consistently warm by simply selecting the comfort mode or save fuel by operating in Eco mode. Again, just like a car can switch from eco-drive mode to sport mode, the Alta can deliver unlimited hot water when you need it, with the flexibility to provide additional energy savings when you don’t.
Cold showers are a thing of the pastModulating condensing boilers used to take up to 2½ minutes to come up to temperature and start making hot water. The Alta begins heating in under 10 seconds, thanks to adaptive combustion and a flow sensor that automatically detects when hot water is needed. “This is a fundamental game-changer. You turn on the faucet and the Alta automatically begins running,” said Cloonan. “We also set the firing rate based on pressure changes in the system, so the firing rate can adjust according to the amount of hot water needed throughout the home.”
A boiler that does the heavy liftingContractors previously needed to install the boiler — then measure combustion, oxygen and CO2 and make adjustments to tune the boiler onsite. The Alta boiler is self-monitoring, meaning it can calibrate itself without the contractor having to make any adjustments.
The Alta also eliminates the need to install an outdoor temperature sensor, which is typically a required feature to meet federal regulations and provide optimal system efficiency. Because the Alta adjusts the set point based on indoor heat loss rather than outdoor temperature, it eliminates the need to wire and mount an outdoor sensor.
Positive feedback yields strong returnsWith the Alta just in the beginning stages of deployment, all signs point to a positive return on investment. “We were surprised by the feedback we received from contractors installing the product,” Cloonan added. “They were going out of their way to send us praising emails, which is feedback we don’t normally get. It’s definitely the ease of use for contractors that is helping the Alta gain a lot of attention.”
James Reid, owner of James Reid Heating Inc. in Hebron, Maine, is convinced the Alta is in a class by itself. “I liked Alta’s features when I first saw it,” he said. “After installing my first one in my brother’s house and seeing the hot water performance, and the adaptive combustion work, I said this boiler is going to be a game-changer. I’ve installed five more since.”
The Alta Condensing Boiler’s class-leading combustion technology brings simplified installation and servicing to a high-efficiency residential unit
“ THE MOST ADVANCED BOILER EVER MADE”
New Alta boiler installed by James Reid Heating Inc.
High-efficiency boilers are valued for their excellent energy efficiency and clean combustion, even though they are more complicated to install and service. U.S. Boiler engineers kept the needs of the contractor in mind as they set out to develop a revolutionary condensing boiler that eliminates these concerns while still delivering the best-performing condensing boiler to the market.
The new Alta Condensing Boiler offers industry-leading design features that provide easy service for contractors combined with the lower operating costs expected from homeowners. “We looked at everything from top to bottom to make the Alta mechanically sound, while delivering additional efficiencies through software enhancements,” said Peter Cloonan, senior chief engineer, controls, U.S. Boiler. “It’s the easiest boiler you’ll ever install, because it’s the most advanced boiler ever made.”
To date, there are over 400 Alta units on the market as part of a limited launch. “We have received very positive feedback,” said Craig Eshenaur, product development manager, U.S. Boiler. “Customers appreciate how easily the Alta can convert from natural gas to LP fuel, automatically adjusting its combustion based on installation-specific venting requirements or variable atmospheric conditions. It’s a very simple process compared to the past when contractors had to change gas valves, orifices or springs to convert to LP.”
Fewer adjustments, less headachesThe Alta Condensing Boiler takes the complexity out of commissioning, with simplified controls, fewer steps and an easy-to-read display. Its class-leading, gas-adaptive combustion technology eliminates the need to fine-tune the combustion settings, further easing commissioning while assuring the systems are running safely and efficiently. Think of how a car’s engine adjusts its performance under a variety of conditions (elevation, temperature, etc.). That’s how the Alta works in your home!
In the past, to change the domestic hot water temperature, a contractor had to go through multiple control screens to

BU
RN
HA
M H
OLD
ING
S, IN
C.
20
20 A
nnua
l Rep
ort
BURNHAM ENGINEERING TEAM REFLECTS ON HOW THEY OVERCAME A NEW SET OF CHALLENGES IN 2020In March 2020, many businesses, including Burnham Holdings, were forced to shutter their brick-and-mortar locations and send employees home to work remotely. This presented an extraordinary challenge for the Burnham Holdings engineering teams as they worked to complete a series of major new product development projects, from their various engineering labs dispersed throughout the U.S.
Recently, several members of the assorted engineering teams gathered for a virtual roundtable to discuss their thoughts on working through a pandemic and lessons learned along the way.
What was the initial reaction to the shutdown from the pandemic?Craig Eshenaur, Product Development Manager, U.S. Boiler: I think early in the lockdown there were quite a few of us that were uncertain as to how well we were going to be able to keep up with project timelines and how effectively everybody was going to be able to do their job.
Duane Breneman, Manager of Product Development, U.S. Boiler: Collaboration is a large part of how we operate, so initially it was a tough adjustment. Engineers are used to getting into a room together to brainstorm solutions. Now, we didn’t have that luxury.
What were some of the major challenges you faced working remotely?Paul Sohler, Director of Engineering, Velocity Boiler Works: When the lockdown took place in March 2020, we were in the process of working on two projects involving compliance with efficiency standards that went into effect later that month. We needed to create a solution allowing us to view a physical prototype and then share our findings via a group conference call. This led to a series of creative strategies to ensure deadlines were met. It wasn’t ideal, but it got the job done.
Craig Eshenaur: While the engineering teams were working from home, the laboratory technicians needed access to their testing equipment and were required to work on-site. Despite the need to wear layers of protective gear to remain safe, the team came through with the critical testing needed to complete development projects. We all came together to collaborate and get the work done on time. Engineers were at the assembly plant to oversee preproduction and received support from the manufacturing facility as well.
PERSEVERING THROUGH A PANDEMIC
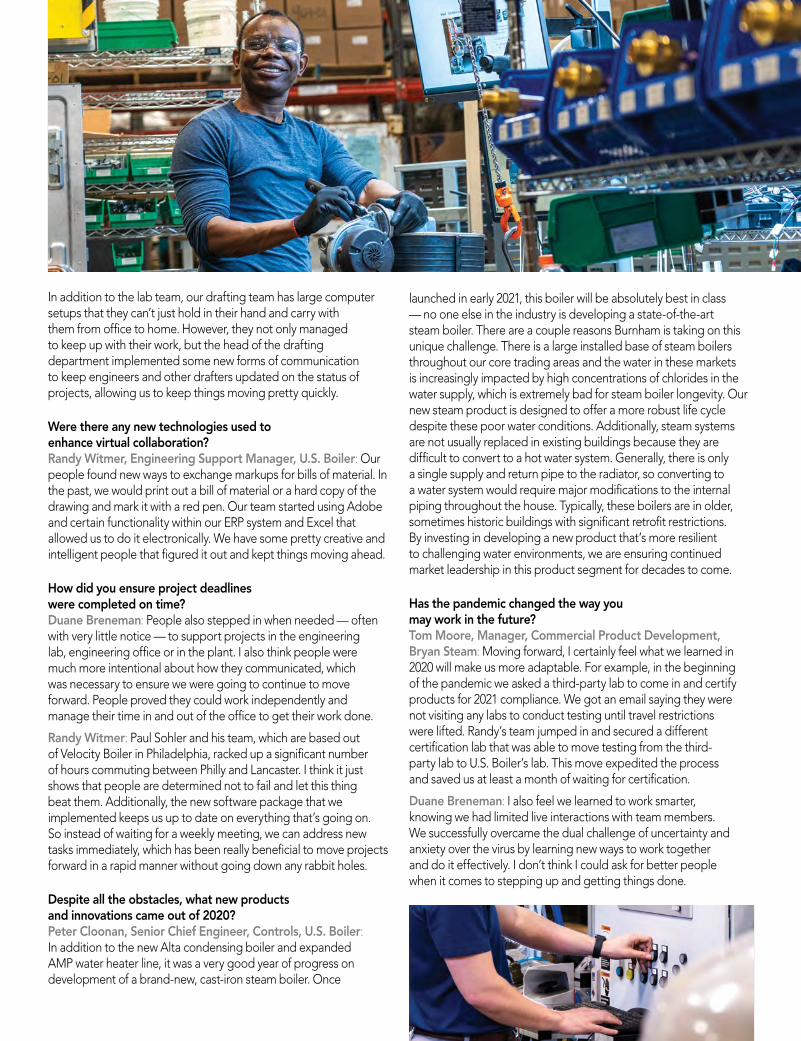
In addition to the lab team, our drafting team has large computer setups that they can’t just hold in their hand and carry with them from office to home. However, they not only managed to keep up with their work, but the head of the drafting department implemented some new forms of communication to keep engineers and other drafters updated on the status of projects, allowing us to keep things moving pretty quickly.
Were there any new technologies used to enhance virtual collaboration?Randy Witmer, Engineering Support Manager, U.S. Boiler: Our people found new ways to exchange markups for bills of material. In the past, we would print out a bill of material or a hard copy of the drawing and mark it with a red pen. Our team started using Adobe and certain functionality within our ERP system and Excel that allowed us to do it electronically. We have some pretty creative and intelligent people that figured it out and kept things moving ahead.
How did you ensure project deadlines were completed on time?Duane Breneman: People also stepped in when needed — often with very little notice — to support projects in the engineering lab, engineering office or in the plant. I also think people were much more intentional about how they communicated, which was necessary to ensure we were going to continue to move forward. People proved they could work independently and manage their time in and out of the office to get their work done.
Randy Witmer: Paul Sohler and his team, which are based out of Velocity Boiler in Philadelphia, racked up a significant number of hours commuting between Philly and Lancaster. I think it just shows that people are determined not to fail and let this thing beat them. Additionally, the new software package that we implemented keeps us up to date on everything that’s going on. So instead of waiting for a weekly meeting, we can address new tasks immediately, which has been really beneficial to move projects forward in a rapid manner without going down any rabbit holes.
Despite all the obstacles, what new products and innovations came out of 2020?Peter Cloonan, Senior Chief Engineer, Controls, U.S. Boiler: In addition to the new Alta condensing boiler and expanded AMP water heater line, it was a very good year of progress on development of a brand-new, cast-iron steam boiler. Once
launched in early 2021, this boiler will be absolutely best in class — no one else in the industry is developing a state-of-the-art steam boiler. There are a couple reasons Burnham is taking on this unique challenge. There is a large installed base of steam boilers throughout our core trading areas and the water in these markets is increasingly impacted by high concentrations of chlorides in the water supply, which is extremely bad for steam boiler longevity. Our new steam product is designed to offer a more robust life cycle despite these poor water conditions. Additionally, steam systems are not usually replaced in existing buildings because they are difficult to convert to a hot water system. Generally, there is only a single supply and return pipe to the radiator, so converting to a water system would require major modifications to the internal piping throughout the house. Typically, these boilers are in older, sometimes historic buildings with significant retrofit restrictions. By investing in developing a new product that’s more resilient to challenging water environments, we are ensuring continued market leadership in this product segment for decades to come.
Has the pandemic changed the way you may work in the future?Tom Moore, Manager, Commercial Product Development, Bryan Steam: Moving forward, I certainly feel what we learned in 2020 will make us more adaptable. For example, in the beginning of the pandemic we asked a third-party lab to come in and certify products for 2021 compliance. We got an email saying they were not visiting any labs to conduct testing until travel restrictions were lifted. Randy’s team jumped in and secured a different certification lab that was able to move testing from the third-party lab to U.S. Boiler’s lab. This move expedited the process and saved us at least a month of waiting for certification.
Duane Breneman: I also feel we learned to work smarter, knowing we had limited live interactions with team members. We successfully overcame the dual challenge of uncertainty and anxiety over the virus by learning new ways to work together and do it effectively. I don’t think I could ask for better people when it comes to stepping up and getting things done.
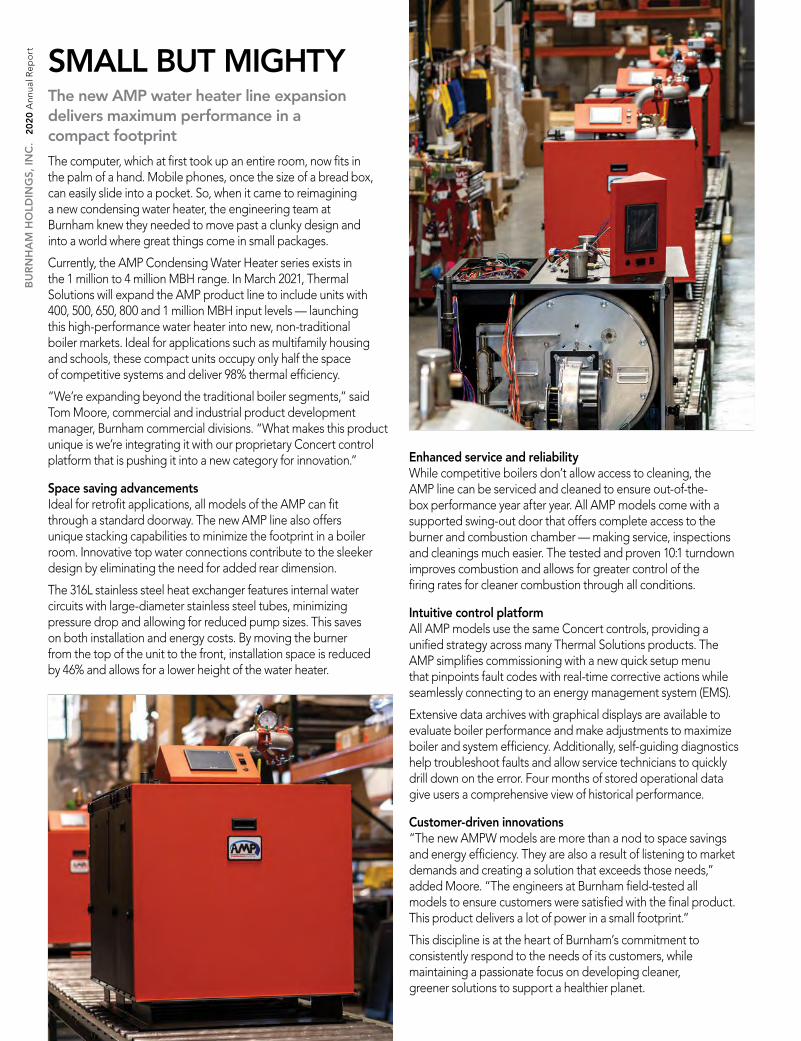
BU
RN
HA
M H
OLD
ING
S, IN
C.
20
20 A
nnua
l Rep
ort SMALL BUT MIGHTY
The computer, which at first took up an entire room, now fits in the palm of a hand. Mobile phones, once the size of a bread box, can easily slide into a pocket. So, when it came to reimagining a new condensing water heater, the engineering team at Burnham knew they needed to move past a clunky design and into a world where great things come in small packages.
Currently, the AMP Condensing Water Heater series exists in the 1 million to 4 million MBH range. In March 2021, Thermal Solutions will expand the AMP product line to include units with 400, 500, 650, 800 and 1 million MBH input levels — launching this high-performance water heater into new, non-traditional boiler markets. Ideal for applications such as multifamily housing and schools, these compact units occupy only half the space of competitive systems and deliver 98% thermal efficiency.
“We’re expanding beyond the traditional boiler segments,” said Tom Moore, commercial and industrial product development manager, Burnham commercial divisions. “What makes this product unique is we’re integrating it with our proprietary Concert control platform that is pushing it into a new category for innovation.”
Space saving advancementsIdeal for retrofit applications, all models of the AMP can fit through a standard doorway. The new AMP line also offers unique stacking capabilities to minimize the footprint in a boiler room. Innovative top water connections contribute to the sleeker design by eliminating the need for added rear dimension.
The 316L stainless steel heat exchanger features internal water circuits with large-diameter stainless steel tubes, minimizing pressure drop and allowing for reduced pump sizes. This saves on both installation and energy costs. By moving the burner from the top of the unit to the front, installation space is reduced by 46% and allows for a lower height of the water heater.
Enhanced service and reliabilityWhile competitive boilers don’t allow access to cleaning, the AMP line can be serviced and cleaned to ensure out-of-the-box performance year after year. All AMP models come with a supported swing-out door that offers complete access to the burner and combustion chamber — making service, inspections and cleanings much easier. The tested and proven 10:1 turndown improves combustion and allows for greater control of the firing rates for cleaner combustion through all conditions.
Intuitive control platformAll AMP models use the same Concert controls, providing a unified strategy across many Thermal Solutions products. The AMP simplifies commissioning with a new quick setup menu that pinpoints fault codes with real-time corrective actions while seamlessly connecting to an energy management system (EMS).
Extensive data archives with graphical displays are available to evaluate boiler performance and make adjustments to maximize boiler and system efficiency. Additionally, self-guiding diagnostics help troubleshoot faults and allow service technicians to quickly drill down on the error. Four months of stored operational data give users a comprehensive view of historical performance.
Customer-driven innovations“The new AMPW models are more than a nod to space savings and energy efficiency. They are also a result of listening to market demands and creating a solution that exceeds those needs,” added Moore. “The engineers at Burnham field-tested all models to ensure customers were satisfied with the final product. This product delivers a lot of power in a small footprint.”
This discipline is at the heart of Burnham’s commitment to consistently respond to the needs of its customers, while maintaining a passionate focus on developing cleaner, greener solutions to support a healthier planet.
The new AMP water heater line expansion delivers maximum performance in a compact footprint