Embed Size (px)
Citation preview

Built Environment Indicators Review: Summary Report
2
Acknowledgements The Research and Innovation team of Population and Public Health wishes to acknowledge the many individuals who contributed to the development of the Built Environment Indicators Review. In particular, we would like to express our appreciation to the following individuals for their invaluable contributions and support in the preparation of this report. Built Environment Health Promotion Strategy Indicators Committee:
• Nonie Fraser, Lead, Health Status Assessment, Population & Public Health
• Kaitlyn Hill, (Chair) Research Associate, Research and Innovation
• Brian Ladd, Population Health Consultant, Healthy Public Policy, Population & Public Health
• Graham Matsalla, Health Promotion Facilitator, Provincial Physical Activity Promotion, Chronic
Disease Prevention, Healthy Living, Population and Public Health,
• Gavin McCormack, Assistant Professor, Community Health Science, University of Calgary
• Deborah McNeil, Director, Research & Innovation, Population & Public Health
• Judy Seidel, Senior Scientist, Research & Innovation, Population & Public Health
Other AHS staff who contributed to the creation of this report includes: Monique Assi, Arden Jones, Silvia Koso Other contributors were as follows: Genevieve Montemurro
3
Table of Contents Executive Summary
List of Appendices
1.0 Introduction p. 7
2.0 Methods p. 8
2.1 Promising Indicators Review p. 8
2.1.1 Search Strategy p. 8
2.1.2 Selection Strategy p. 8
2.1.3 Critical Appraisal p. 9
2.1.4 Data Management and Extraction p. 10
2.1.5 Reviewer and Training p. 10
2.1.6 Determining Level of Promise p. 10
2.1.7 Limitations of Review p. 10
3.0 Results p. 11
3.1 Walkability p. 12
3.1.1 General Walkability Indices p. 12
3.1.2 Access to Active Transport, Destinations and Recreation Indices p. 15
3.1.3 Physical Neighbourhood Characteristics Indices p. 17
3.2 Food Environment p. 19
3.2.1 General Food Environment Indices p. 19
3.2.2 Food Accessibility and Proximity Indices p. 19
3.3 Food and Physical Activity Environments p. 19
3.4 Park and Recreation Environment p. 20
3.4.1 Park Accessibility and Proximity Indices p. 20
3.4.2 Trail Use p. 21
3.5 Housing p. 21
3.5.1 Built Structure Indices p. 22
3.5.2 Environmental Hazards p. 22
4.0 Data sources p. 23
5.0 Next Steps p. 24
6.0 Conclusions p. 25
7.0 Recommendations p. 26

4
List of Appendices Appendix A- Search Strategy
Appendix B- Inclusion & Exclusion Criteria
Appendix C- Original AACODS checklist
Appendix D- Revised AACODS Checklist
Appendix E- AHS Urban Rural Continuum
Appendix F- Reliability and Validity Appraisal
Appendix G- Feasibility Appraisal
Appendix H- Full Text Articles Reviewed
Appendix I- Descriptive Characteristics of Promising Indices
Appendix J- Summary of Interviews with Canadian Health Jurisdictions
5
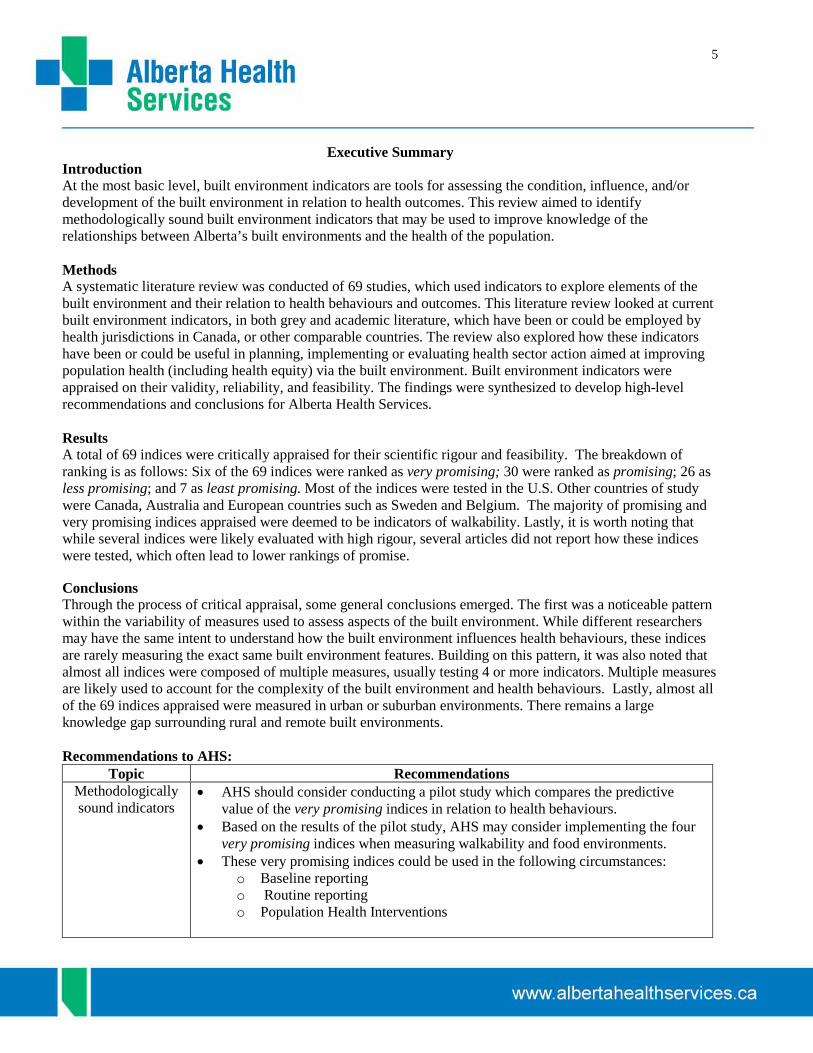
Executive Summary Introduction At the most basic level, built environment indicators are tools for assessing the condition, influence, and/or development of the built environment in relation to health outcomes. This review aimed to identify methodologically sound built environment indicators that may be used to improve knowledge of the relationships between Alberta’s built environments and the health of the population. Methods A systematic literature review was conducted of 69 studies, which used indicators to explore elements of the built environment and their relation to health behaviours and outcomes. This literature review looked at current built environment indicators, in both grey and academic literature, which have been or could be employed by health jurisdictions in Canada, or other comparable countries. The review also explored how these indicators have been or could be useful in planning, implementing or evaluating health sector action aimed at improving population health (including health equity) via the built environment. Built environment indicators were appraised on their validity, reliability, and feasibility. The findings were synthesized to develop high-level recommendations and conclusions for Alberta Health Services. Results A total of 69 indices were critically appraised for their scientific rigour and feasibility. The breakdown of ranking is as follows: Six of the 69 indices were ranked as very promising; 30 were ranked as promising; 26 as less promising; and 7 as least promising. Most of the indices were tested in the U.S. Other countries of study were Canada, Australia and European countries such as Sweden and Belgium. The majority of promising and very promising indices appraised were deemed to be indicators of walkability. Lastly, it is worth noting that while several indices were likely evaluated with high rigour, several articles did not report how these indices were tested, which often lead to lower rankings of promise. Conclusions Through the process of critical appraisal, some general conclusions emerged. The first was a noticeable pattern within the variability of measures used to assess aspects of the built environment. While different researchers may have the same intent to understand how the built environment influences health behaviours, these indices are rarely measuring the exact same built environment features. Building on this pattern, it was also noted that almost all indices were composed of multiple measures, usually testing 4 or more indicators. Multiple measures are likely used to account for the complexity of the built environment and health behaviours. Lastly, almost all of the 69 indices appraised were measured in urban or suburban environments. There remains a large knowledge gap surrounding rural and remote built environments. Recommendations to AHS:
Topic Recommendations Methodologically sound indicators
• AHS should consider conducting a pilot study which compares the predictive value of the very promising indices in relation to health behaviours.
• Based on the results of the pilot study, AHS may consider implementing the four very promising indices when measuring walkability and food environments.
• These very promising indices could be used in the following circumstances: o Baseline reporting o Routine reporting o Population Health Interventions
6
Pursue further research
• Built environment indices, such as Park and Recreation Environments, were not ranked as very promising.
• If the built environment is noted as an AHS priority in the future, and indicators outside of the walkability and food environment realm are needed, further research should be undertaken.
Use validated indices as a foundation
• Use validated indices as a foundation for creating other indices and furthering built environment indicator research.
• Validated indices found in this review: o Metro Vancouver Walkability Index (VWI), Frank et al. o Physical Activity Neighborhood Environment Scale (PANES) o Neighborhood Environment Walkability Scale-Abbreviated (NEWS-A)
Make rigour and
comprehensiveness a priority
• With further investigation into understanding the rigour with which several indices were measured, this review could become more meaningful and more useful to AHS and to the scientific community.
• If the author(s) do not reference other studies with more information on scientific rigour of indices, contact authors for further explanation and guidance.
• Indices that consider multiple built environment factors should be prioritized for study and/or use.
Supplement
Literature Review
• Supplement this review with a search of comparable health organizations. Explore their baseline measurements, surveillance data and annual reporting.
Build on Collaboration
• Build on the cursory interviews done with other health jurisdictions. • Conduct comprehensive, systematic interviews with other Canadian health
jurisdictions.
Availability of rural indicators
• Within this review, there was an obvious lack of built environment indicators which measure rural and remote geographies.
• The following studies may be useful as examples of promising built environment indices which have been explored in semi-rural and rural environmentsa
o Athens et al (Housing) :
o Clarke et al (Walkability) o Curran et al (Walkability)
Presenting the
findings • The new structure of Population and Public Health calls for the creation or
improvement of an environment of sharing and learning from colleagues. • The findings of this review may be useful to the following groups within AHS:
o Strategic Clinical Networks (specifically Obesity team) o Community Innovation Team within the Alberta Cancer Prevention Legacy
Fund (ACPLF) o Community Surveillance team
a These geographies have not been deemed as rural, by the AHS Rural-Urban Continuum.

7
1.0 Introduction The term built environment, characterized as the design, construction, and management of buildings, spaces and products that have been developed or altered by people, is a determinant of health.1 It relates to land uses, transportation systems, buildings, parks, traffic systems, trails, housing and so forth.2345
Built environment research over the past decade has sought to understand if characteristics of the built environment have significant effects on health; however, many causal pathways still need to be elucidated. It is possible that elements of the built environment may influence or increase the burden of chronic disease and injury in Alberta. It is this thinking which provided impetus for the development of this document in conjunction with the AHS Built Environment Health Promotion Strategy (BEHPS) document.
While a strict definition of what constitutes a ‘built environment indicator’ has yet to be clearly defined, for the purposes of this review the following was used: A built environment indicator is a single measure used to evaluate and interpret the condition, influence, and/or progression of the design, construction, and management of buildings, spaces and products in relation to health behaviours and outcomes. The purpose of this review was to identify current and scientifically rigorous built environment indicators. Identifying methodologically sound built environment indices can contribute to comprehensive surveillance, and provide a foundation for understanding Alberta’s built environments and their relationship to health. This report is one in a series of knowledge products developed to inform the BEHPS. Other products developed for this purpose were:
• BEHPS- Evidence Informed Recommendation • BEHPS- State of Evidence • BEHPS- Environmental Scan of Built Environment Initiatives in Alberta • BEHPS- Policy Scan • BEHPS- Alberta Context Review • Summary feedback from Zone engagement sessions
8
2.0 Methods 2.1 Promising Indicators Review The purpose of this review was to compile and appraise built environment indicators or indices employed by researchers and reported in grey and academic literature, and which have been or could be employed by health jurisdictions in Canada and comparable countries. Further, the review aimed to explore how these indicators have been or could be useful in planning, implementing or evaluating health sector action aimed at improving population health (including health equity) via the built environment. A systematic approach was taken to identify existing articles, reports, theses, dissertations, websites and publications that measured and reported on built environment indicators as they relate to 6 domains of health (physical activity, nutrition, injury prevention, environmental hazards, ultraviolet radiation and mental health). These domains of health are a legacy having been carried forth from previous work related to the BEHPS. A Built Environment Health Promotion Strategy Indicators Committee (Committee) was struck in January 2012 and provided guidance for the scope, methods, and deliverables of this project. Lastly, it is important to note that the indicators identified in this review will not necessarily be the most relevant or meaningful indicators of the built environment for a specific Alberta community, concerned about the contribution of the built environment to the health of its population. Further contextual knowledge would be required to draw this conclusion. 2.1.1 Search Strategy Four approaches were undertaken to ensure a comprehensive search was completed. 1. To identify potentially relevant indicators, a search strategy was developed in consultation with an
information scientist. Independent searches were conducted to identify publications relating to the three conceptual areas of the built environment: land use, transportation, and building design. To ensure our search was comprehensive, twelve distinct databases were searched using four different search strings (Appendix A).
2. A binder of possibly relevant indicator information and articles had been compiled over a year’s time, in
the course of previous work and in preliminary preparation for this review. 3. To ensure new or less accessible information was not missed, interviews were conducted with built
environment colleagues from across Canada. Interviews were aimed at seeking out documents to appraise for this Review that may have been missed by the search terms, or were not currently accessible online. The interviews also sought out general information such as source availability, and how built environment indicator work has progressed in their region or area. A summary of these interviews can be found in Appendix J.
4. The references of each article that met the Inclusion Criteria (discussed in the following section), as well as
the references of systematic reviews that came up throughout the search process, were scanned further, for possibly relevant articles.
2.1.2 Selection Strategy Articles identified from each of the four searches were first screened based on their title, then abstract, and then the full text document by a single reviewer to identify documents that were relevant to the pre-determined topics, as determined by the Committee. Full texts were then screened and articles were selected based on the pre-determined inclusion and exclusion criteria.

9
Table 1: Inclusion & Exclusion Criteria Inclusion Exclusion
o English language o Non-English language o Human or human relevant research o Non-human research o Articles published from 2002 forward o Articles published prior to 2002 o Any population or sub-population o Does NOT act upon the built environment or has
no potential to influence the built environment o Measures or addresses indicators of man-made
physical forms and processes o Produced by a non-reputable or questionable
organization o Relates to any of these health areas of interest:
- Physical Activity -Nutrition -UV Radiation -Mental Health -Injury Prevention -Environmental Hazards
o Relates to health domains outside of the six health domains identified; Or does not affect health whatsoever
o Affects of influences the following levels of health:
-Community/Neighbourhood -Institutional/Organizational -Social/Public Policy
o Affects individual or interpersonal levels of health
o All study designs, including review articles o Qualitative and Narrative studies o Research from the following geographical
areas: -North America -Western Europe -Australia -New Zealand -UK
o Research that has taken place outside of these countries
Once a study was identified as meeting the inclusion criteria, the legitimacy of each article was appraised using a revised version of the AACODS (Authority, Accuracy, Coverage, Objectivity, Date, and Significance) checklist (Appendices C & D). Based on the assumption that the search would yield both grey and academic literature, this checklist is effective for both types of documents. The original checklist was revised based on the specific needs of our project. The revised checklist scored articles out of 19 points. As a Committee, it was decided that if an article received 6.5 points or lower, it would not go on move forward for critical appraisal. 2.1.3 Critical Appraisal The critical appraisal process was composed of two parts. Each part was given a point value, which ultimately contributed to the ranking of promise for each article. The first component examined the reliability and validity of each indicator as reported in the articles reviewed. Face, construct, and criterion validity were appraised, as well as test-retest and internal consistency reliability (Appendix F). A total score of 6 points was possible for this appraisal. The second component of the appraisal examined the feasibility of the each index. The Committee created feasibility questions in an effort to add further context and focus to the indices. These questions inquired about the usefulness of the indicator, the setting it was evaluated in and if it was comparable to Alberta, as well as its ability to reduce health inequities (Appendix G). This component also amounted to a total of 6 points.

10
2.1.4 Data Management and Extraction An excel spreadsheet was created to house all pertinent information from each article, in a consistent and objective manner. Further, the spreadsheet also allowed for consistent appraisal and ranking of each indicator, by diminishing the chances of human error. Qualitative information such as citation, indicator theme and variable(s), data source, how the author characterized the setting and the limitations to instrument and/or study were collected for each article. Following the recording of qualitative information, critical appraisal results- reliability, validity and feasibility- were also recorded for each article. 2.1.5 Reviewer and Training A single reviewer completed the review and selection of each article. A second reviewer was used to help appraise full text articles. To ensure accuracy and consistency, 10% of articles were appraised by both reviewers. Discrepancies in scores were resolved by discussion between the reviewers. 2.1.6 Determining Level of Promise To determine the level of promise for each indicator, scientific rigour and feasibility were considered together. Therefore, high scientific rigour alone, would not ensure a high level of promise, as the feasibility of the indicator in an Albertan context was also important. Alternately, an indicator that was deemed to be very feasible would not be given a high ranking of promise if it was not considered methodologically sound. An indicator’s promise was determined by using the table below, adapted from the work of McNeil et al.67
Initially an indicator’s reliability and validity, and its feasibility were given scores out of 6 points. Based on Table X, each indicator received a score on a 5-point scale from least to most promising.
Table 2: An Indicator’s Level of Promise
Reliability & Validity (6 pts)
Feasibility(6 pts) Low (0-2) Mid (3-4) High (5-6)
High (5-6) Promising Very Promising Most Promising Mid (3-4) Less Promising Promising Very Promising Low (0-2) Least Promising Less Promising Promising
For the purposes of this review, all indicators were included in the data analysis and synthesis phase. However, only those indicators ranked “promising” or higher were used in the development of the recommendations for use by Alberta Health Services. 2.1.7 Limitations of Review The major limitation of this review is the lack of further investigation into the reliability and validity of indicators. Some studies provided references where further information regarding the scientific rigour of the index could be found. Other studies did not provide such a reference nor was enough information given to understand how indices were evaluated. Further investigation of these indices will be considered a next step for the use of this review. Another limitation of this review is the subjectivity of the feasibility appraisal. The feasibility questions, as outlined in Appendix G were highly subjective and based on the reviewer’s understanding of the study and contextual factors within Alberta. Discrepancies between feasibility scores were discussed and resolved between reviewers. However, it is important to note that although the Committee referred to this section as a feasibility appraisal, these questions do not necessarily reflect AHS organizational feasibility priorities. This component of the appraisal process was created strictly for the purposes of this Indicators Review. Lastly, it is important to note that the indices in this review were not appraised for their usefulness in communities, as tools for measuring the built environment. Further contextual knowledge, possibly through a qualitative study, would be required to understand the ability and readiness of the community, in properly applying and making meaning of the information gleaned.
11
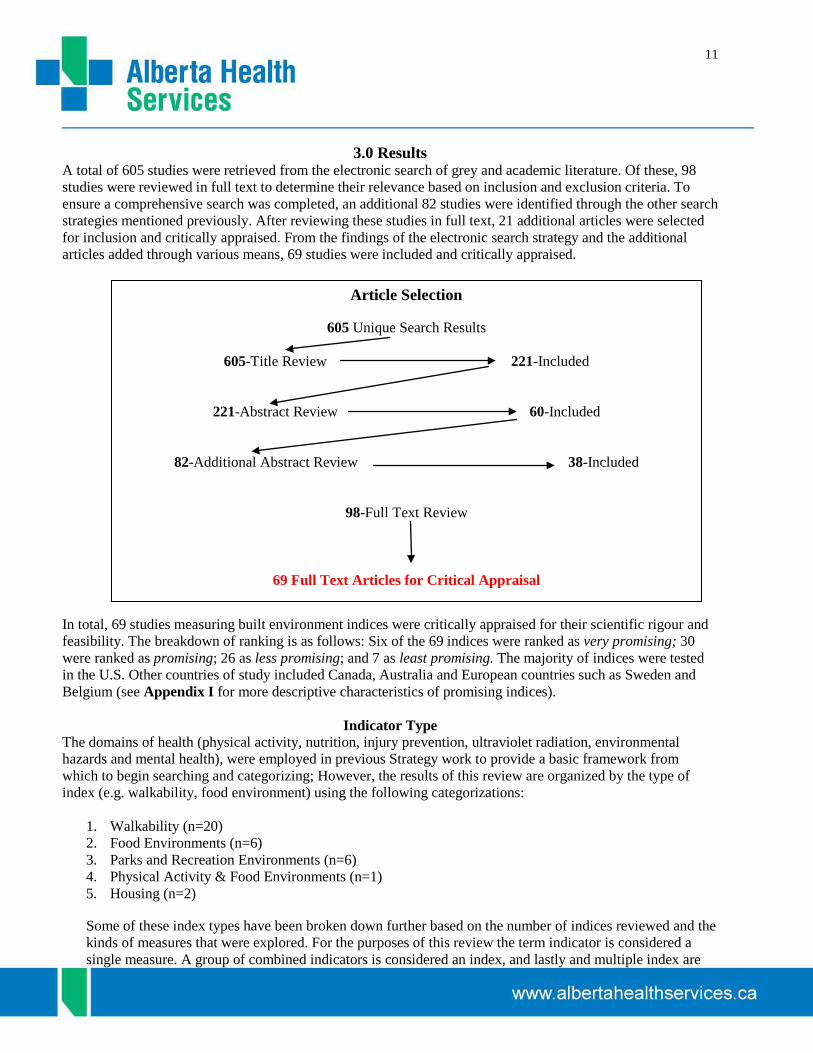
3.0 Results A total of 605 studies were retrieved from the electronic search of grey and academic literature. Of these, 98 studies were reviewed in full text to determine their relevance based on inclusion and exclusion criteria. To ensure a comprehensive search was completed, an additional 82 studies were identified through the other search strategies mentioned previously. After reviewing these studies in full text, 21 additional articles were selected for inclusion and critically appraised. From the findings of the electronic search strategy and the additional articles added through various means, 69 studies were included and critically appraised.
In total, 69 studies measuring built environment indices were critically appraised for their scientific rigour and feasibility. The breakdown of ranking is as follows: Six of the 69 indices were ranked as very promising; 30 were ranked as promising; 26 as less promising; and 7 as least promising. The majority of indices were tested in the U.S. Other countries of study included Canada, Australia and European countries such as Sweden and Belgium (see Appendix I for more descriptive characteristics of promising indices).
Indicator Type
The domains of health (physical activity, nutrition, injury prevention, ultraviolet radiation, environmental hazards and mental health), were employed in previous Strategy work to provide a basic framework from which to begin searching and categorizing; However, the results of this review are organized by the type of index (e.g. walkability, food environment) using the following categorizations:
1. Walkability (n=20) 2. Food Environments (n=6) 3. Parks and Recreation Environments (n=6) 4. Physical Activity & Food Environments (n=1) 5. Housing (n=2) Some of these index types have been broken down further based on the number of indices reviewed and the kinds of measures that were explored. For the purposes of this review the term indicator is considered a single measure. A group of combined indicators is considered an index, and lastly and multiple index are
Article Selection
605 Unique Search Results
605-Title Review 221-Included
221-Abstract Review 60-Included
82-Additional Abstract Review 38-Included
98-Full Text Review
69 Full Text Articles for Critical Appraisal

12
referred to as indices. The indices will be discussed in terms of the indicators they incorporated, and the scores each index received for reliability, validity and feasibility. Appendices F and G explain the scoring criteria in more detail.
3.1 Walkability In total, 20 walkability indices were critically appraised. Of the 20 walkability indices, four were ranked as very promising, and sixteen were considered promising. Based on the types of indicators that made up the index, indices were categorized into three types.
1. General Walkability: a. This type of index included basic indicators of the built environment, such as population
density, residential density, land use mix, and street connectivity; b. This type of index could be comprised of all three types of walkability indicators. Indices
comprised of all three types of indicators were still considered general walkability indices, as they did not focus specifically on one influence or characteristic of the built environment, but rather a array of different characteristics.
2. Walkability in relation to Active Transportation, Destinations, and Recreation:
a. This type of index includes indicators such as proximity or access to recreation facilities and park space, and access to destinations such as education centres and social and cultural centres.. These types of indices may also measure characteristics such as miles to the nearest bus stop or infrastructure presence and connectivity.
3. Walkability in relation to Neighbourhood Physical Characteristics:
a. This type of index included indicators like street width, presence and area of sidewalks, presence of absence of a house stoop or porch, etc.
3.1.1 General Walkability Indices The first very promising general walkability index was tested by Lovasi et al.8
• Residential density,
who explored characteristics of the built environment to examine walking for exercise in various communities throughout Western Washington. This index is comprised of the three types of indicators: general, active transportation (to destinations and for recreation), ands measures of neighbourhood physical characteristics. Lovasi et al. measured:
• Street connectivity, • Amount of sidewalk-lined streets, • Destination count within buffer, and • Amount of park space within buffer. Lovasi et al noted that several similar studies overestimated the ability to predict walking and wanted to provide a more accurate estimate. This was done by using a holdout approachb
b Holdout approach- by splitting a single population study into training and validation sets or developing and evaluating models in different populations
. Based on our appraisal, the index demonstrated strong construct and criterion validity, as well as fair reliability. Along with strong scientific rigour, the index also scored well within the feasibility appraisal by exploring characteristics between and within zip codes, census tracts and block groups. This demonstrated a concerted effort to unmask inequalities in the study population. Further this index was tested in areas of urban and suburban geography, which are comparable to several areas throughout Alberta. The combination of these qualities showed this index to be very promising.

13
The Frank al.9
• Land use mix,
index assessed how objectively measured levels of physical activity were related to aspects of the built environment around participant’s homes (findings from SMARTRAQ). The index was composed of the following indicators:
• Residential density, • Intersection density, and This index was found to be very promising because of demonstrated face and construct validity10
, as well as strong test-retest reliability. Further, the results of the index could be highly informative in creating evidence informed policy around increased land use mix and street connectivity.
Only one index focused on the issue of walkability and air pollution. This promising index by Marshall et al.11
• Net residential density
explored neighbourhoods of both high and low walkability, as well as high and low SES. The index was made up of the following measures:
• Intersection density • Retail floor area ratio • Average concentrations of two air pollutions, NO and O3. Their work showed that neighbourhoods with high levels of walkability and low air pollution were almost exclusively higher income areas. This index truly unmasks health inequalities in Vancouver B.C., and could also be useful in policy or decision making contexts.
Two very similar indices, tested by Frank et al.12
• Land use mix,
and Frank, Andresen and Schmid were given rankings of promising. Frank et al. measured the following indicators in relation to physical activity patterns:
• Residential density, • Intersection density, and • Ratio of retail floor area This promising index received acceptable scores for it rigour, as both construct validity and test-retest reliability were demonstrated. This index also received a fair feasibility score, as it was tested in urban areas of B.C., which could be comparable to parts of Alberta. The outcomes of the index also had potential implications for urban design and planning policies around creating environments that encourage healthy behaviours.
The promising index tested by Frank, Andresen and Schmid13
• Land use mix,
, measured the following characteristics of the built environment:
• Intersection density, and • Residential density. These basic measures were evaluated in relation to residences, travel patterns (walking and driving), and body mass index (BMI) and obesity. The index was found to have face validity; however other measures of rigour were not explicitly described. This general walkability index was considered \promising based on its strong feasibility score. The outcomes the index provided were found to support the rationale for the development of policy that promotes increased land-use mix, street connectivity and residential density as interventions that can have significant and durable benefits to population health. The index also looked at differences in gender and ethnicity classifications, and so there was an attempt to understand how built environment affects health inequality, contributing to the feasibility score.

14
Smith et al.’s14
• Density (population)
general walkability index used density, design and diversity measures- to explore the relationship between neighbourhood walkability and overweight or obese residents. The indicators measured were:
• Design (intersections) • Diversity (proportion of workers who walk to work) • Diversity (housing age in years) Smith et al. did not describe how this index was tested for rigour and so did not score well for reliability and validity. However, the index was deemed promising based on the ability of the index to satisfy feasibility questions. The index was used in urban and rural areas, which could be helpful when comparing or implementing this index into an Alberta context.
Neckerman et al.15
• Aesthetics (Percent with Natural features, Count of natural features per block, Percent with ornate or decorative architecture, Percent with public art or banners, Percent with excessive noise, Percent with unpleasant odor, Count of types of trash, Count of signs of disrepair or abandonment)
explored the attractiveness of environments between poor and non-poor neighbourhoods in New York City, as a support or hindrance to neighbourhood walkability. Neckerman et al.’s promising index measured:
• Safety (Number of lanes to cross at intersection, Average traffic speed, Percent in which police were observed, Percent in which fighting or hostile behaviour was observed)
• Infrastructure for Active Transportation (Percent with bicycle racks, Percent with bus stops, Percent with subway stops, Sidewalk width, Unobstructed sidewalk width)
• Sidewalk amenities (Percent with sidewalk cafes, Percent with any seating, Count of types of sidewalk conveniences)
This index was ranked as promising based on the distinct health equality focus. The focus on income inequality and its relation to the built environment and health is somewhat unique to the literature. The outcomes of the index were deemed to be potentially useful in policy formation around urban planning and development.
Sundquist et al.16
• Residential density
provides one of two European-tested indices. This particular promising index examined the relationship between neighbourhood walkability and walking for active transportation or leisure, as well as the variance of walking and physical activity outcomes attributed to neighbourhood-level differences in walkability. Sunquist et al.’s index contained the following measures:
• Street connectivity • Land use mix
The index was tested in a highly dense urban area and so the outcomes are limited in scope as it does not apply to all of Alberta. While both face and construct validity were present, other forms of validity and reliability were not referred to or identified. The authors did focus on disparities between income levels by using them as stratifications during analyses. This consideration of health equity in regards to neighbourhood walkability could be useful in a policy context.
Sallis et al.17’s promising index compared the test-retest and alternate-form reliability of the Physical Activity Neighbourhood Environment Scale (PANES) single item tool to that of the Neighbourhood Environment Walkability Scale- Abbreviated (NEWS-A). Both scales measure various types of indicators such as land use mix, residential density, and aesthetic qualities. Sallis et al. reported acceptable internal consistency and test-retest reliability, determining that the PANES single items related to land use mix, residential density, pedestrian infrastructure, aesthetic qualities, and safety from traffic and crime were
15
supported by NEWS-A subscales18 19
. Based on the concise format of PANES and its correlation to NEWS-A, this index may be useful in standard or annual reporting.
Tomalty and Haider’s20
• Net population density
promising general walkability index was used to test the hypothesis that the physical design of neighbourhoods affects cycling and walking in BC communities, and whether this impacts health measures such as BMI. The following indicators were measured:
• Street connectivity • Intersection density • Land use mix index • Access to parks and green space • Housing mix index • Sidewalks • Setbacks (Average distance from curb to front of house in metres) • Street width • Block lengths While the authors discussed how their findings were comparable to others and therefore valid, the measures of such validity were not demonstrated and thus this index did not score well for scientific rigor. However, the index did score well for its feasibility. Feasibility measures were satisfied by the index being tested in urban and rural areas
3.1.2 Walkability Access to Active Transport, Destinations and Recreation Koohsari21
endeavoured to observe whether objective access to public open spaces was equal across different SES areas of Melbourne. The term ‘public open spaces’ was used to describe areas such as parks and green spaces. Koohsari tested only one measure so this is to be considered a very promising indicator, rather than index. The indicator measured the access to facilities in five different quintiles based on SES. While scoring high for reliability and rigour, the index also met feasibility requirements. A negative correlation was seen between access to such spaces and SES areas, in that lower SES had poorer access compared to those of higher SES. Thus, Koohsari’s findings could be useful in guiding future development plans for the improvement or allocation of various public open spaces across SES areas. Further, while these indicators were tested in an urban environment, the resident population of Melbourne could be comparable to that of smaller cities throughout Alberta.
Alfonzo et al.22
• Total walking
measured three characteristics of the built environment, in an effort to understand which one of those attributes were most influential on walking behaviours of parents. The following indicators were created and measured using data from the total number of walks and walk types, reported by parents:
• Destination walking • Recreation walking Measures of validity and reliability were not reported, and could not be found in other studies; therefore only face validity was ascertained. This index was considered promising only based on its feasibility. The index was tested, and thus could be applied, to both urban and rural areas. Further, urban design features related to both accessibility and safety were found to be associated with the amount of walking adults do in their neighborhood. Based on this outcome, this index may be useful in policy formation around healthy school built environments for parents and children.
Clarke et al.23 explored how the built environment affects the aging population (65 years and older)
throughout a disablement process. This promising index was comprised of the following measures:
16
• Housing density • Land use diversity • Car dependent environments
Although the authors did not describe the methodological rigour in a way that would allow for a high score, the promising index looked at a large non-urban demographic, which many other indices did not. Based on the areas of testing, this index could be useful in Alberta given the large number of seniors living in some areas of the province.
Duncan et al.24
• Retail destinations (density)
assessed the validity of Walk Score© by comparing it to neighbourhood walkability metrics as measured through GIS in four regions of the United States (South, East, Mid-West and Pacific Northwest).The following neighbourhood indicators were measured:
• Service destinations (density) • Cultural/educational walking destinations (movie theatres, schools, libraries) per square km • Median pedestrian route directness • Intersection density • Highway density • Residential density • Population density
Duncan et al. demonstrated fair scientific rigour in finding that Walk Score was valid in measuring certain aspects of walkability. The most influential finding from this indicator was the indication of land use mix as a representation of healthy neighbourhoods. This finding could be very useful in health planning policy activities. This promising index also had fair scientific rigour and was tested in urban, suburban and rural areas.
Curran et al.25
• Population and household density
provide a promising Canadian index comprised of built environment indicators associated with walking and cycling behaviour for the purposes of transportation. The following indicators were measured:
• Employment density • Intensity of land use mix • Distribution of land us mix • Infrastructure presence • Infrastructure connectivity This index did not clearly demonstrate how indicators were valid and reliable, but they were tested in urban, suburban and rural areas, and could prove to be very useful in implementing built environment standards and policies. This index could also be potentially useful as a reference document, as this group was able to measure and evaluate 11 specific built environment indicators that they would recommend for implementation to understand health outcomes.
Witten et al.26
focused on walking access in relation to neighbourhood destinations- such as education, social, health, financial and cultural centres, as well as food and other retail outlets. The study did not describe measures taken to demonstrate reliability and validity; however, it was seen as promising for exploring urban and rural areas and for its strong focus on equality by comparing deprived and non-deprived neighbourhoods.

17
Hoehner et al.27
• Land Use
examined neighbourhood walkability and how it might affect body mass index (BMI) and cardiorespiratory fitness. The promising index was measured in two cities; one considered a low and one a highly walkable city (St. Louis, MO, and Savannah, GA, respectively). The index was composed of:
• Recreation facilities • Transportation environment
The authors provided a fair amount of information on the face and construct validity of the index, but did not provide or demonstrate reliability. In regards to examining its feasibility, the index was only tested in urban settings, but did explore high and low income areas in both cities. So while it may be limited to an urban context, health equity was considered in its measurement.
Frank et al.28
• Residential density
evaluated an index of walkability with health-related outcomes in King County Washington. The following indicators were measured:
• Street connectivity • Land use mix • Retail floor area ratio This index was deemed promising because of the demonstrated face and criterion validity, as well as test-retest reliability. This index was also given points for its feasibility in policy settings. For example, after controlling for potential demographic biases, the index account for 8.3% of variability in minutes of active transportation. This amount of variance could provide impetus for policy change. The outcomes of this index could help inform policymakers considering change in land use and development regulations to increase neighbourhood walkability.
3.1.3 Walkability in relation to Neighbourhood Physical Characteristics The very promising walkability index tested by Shay et al.29
• Within a 800 m. buffer zone:
looked at walkability indicators in relation to pedestrian support, such as the presence of sidewalks and crosswalks. The following indicators were measured:
• Presence of sidewalks • Good sidewalk conditions • Connections (# of connections to other sidewalks/paths) • Wide sidewalks (>4') • Crossing aid present (stop lights, stop signs, pedestrian island, pedestrian signage) • Crosswalk present The index showed face and construct reliability as well as test-retest reliability. However, the index demonstrated that the highest number of walking trips and steps was associated with supportive pedestrian infrastructure such as sidewalks in good condition and cross walks. This finding could have potential policy implications when planning for new urban developments and regulations.
A second study looked at similar elements to Shay et al. Joshu et al.30
• Sidewalks absent
endeavoured to determine if personal and neighbourhood barriers differs baesd on the level of urbanisation, They also tried to understand the relative importance of personal barriers, neighbourhood barriers and land-use development patterns measured though using a county-level sprawl index. The following indicators of neighbourhood environment were measured:
• Trails absent • Enjoyable scenery absent

18
• Heavy traffic • Hills absent • Streetlights absent • Unattended dogs • Foul Air from Cars/Factories This index was determined to be promising, as it had both face and construct validity. Further, thiese types of indicators could be useful in policy development for new communities or retro-fitting older communities. However, specific geographic details regarding what areas within the US these were tested were not provided, thus it was not known if this took place in a comparable region(s) to regions in Alberta.
3.2 Food Environment In total, 6 food environment indices were critically appraised. Of the 6 food environment indices, one was ranked as very promising, and five were considered promising. Based on the types of indicators that made up the index, indices were categorized into two type.- General Food Environment and Food Accessibility and Proximity. 3.2.1 General Food Environment The concept of food deserts in Montreal, Quebec was explored by a general food environment index tested
by Apparicio et al.31
• Proximity: distance to the nearest supermarket This promising index was comprised of the following indicators:
• Diversity: number of supermarkets within a distance of less than 1000 metres • Variety in terms of food and prices: average distance to the three closest different, chain name super
markets. This promising index was given this ranking based on a fair demonstration of reliability and validity, as well as a focus on health inequality. The outcomes of the index actually identified that food deserts in Montreal, did not exist. In fact, these indicators showed that the more central a person lives, the more accessibility they have to supermarkets.
3.2.2 Food Accessibility & Proximity Seliske’s32
• Location of food retailers
very promising index was used to examine the location of food retailers in relation to urban sprawl and obesity related behaviours. The indicators measured were:
• Total dwelling density • Percentage of single or detached dwellings • Percentage of population living in the urban core of each census metropolitan area The index Seliske tested was found to have fair reliability and validity. The appraisal of this article determined that this index has potential to unmask inequalities, such as accessibility to, and type of food retailers surrounding schools. Based on these outcomes of feasibility, this index could be highly useful in changing or developing policy around the type of food retailers around schools, and the distance within which they should be allowed.
Larsen and Gilliland’s33
• Nearest supermarket
promising index, similar to Apparicio et al., was also concerned with finding food deserts; however, this index was tested in London, Ontario. This index was composed of the following indicators:
• Number of supermarkets within 1000m • % population with access within 1000m • % population with bus access

19
They found that although supermarket access is poor throughout the city of London, food deserts do exist, particularly in East London neighbourhoods. This index, along with Apparicio et al, scored the same for reliability and validity; and very similar on feasibility. Both indices would be effective for future investigation on food deserts, but the distinction between which to use, could be based on what is to be measured.
Morland and Filomena’s34
promising index was used to exploring the availability of fruits and vegetables between racially segregated neighbourhoods, based on Brooklyn Community Districts (BCD’s)—a local political entity--by measuring the number of supermarkets, grocery stores, delicatessens and fruit and vegetable markets within each BCD. This index did not score very well for its reliability and validity, but received a rank of promising based on its feasibility score. The findings of this index illustrated a relationship between availability and variety of fresh produce and the racial composition of neighbourhoods. This finding could be useful in policy settings when amending or adding polices around development in new or existing neighbourhoods.
The promising index tested by Bader et al.35
• Number of accessible supermarkets adjusted for vehicle ownership
measured food environments in relation to disparity, while adjusting for -neighbourhood variation in characteristics such as rate of vehicle ownership. The following indicators were measured:
• Percentage of tracts with accessible supermarkets by tract mode and tract composition • Number of accessible supermarkets adjusted for homicide rates, by tract composition • Number of accessible supermarkets adjusted for expressway and accident density, by tract composition • Average kernel density of supermarkets, fruit and vegetable markets, and farmers’ markets by tract
composition This index scored fair for reliability, validity and feasibility. Bader et al. showed the index to have both face and construct validity, and further, the adjusted measures also showed to be related to unmasking health inequalities.
Chen et al.36
looked at food availability in Marion County, Indiana. While only using a single indicator around food availability (number of chain grocers within one mile radius of individual’s residence) and not elaborating on measures of reliability and validity, this indicator received a rank of promising. This index was deemed promising based on the geographical context of Marion County, Indiana, being comparable to Alberta in both urban and rural landscapes. Further, the indicator also demonstrated how increasing chain grocers in lower SES neighbourhoods decreased BMI by approximately 0.3. Based on this finding, this index could potentially be useful in the context of health policy and community planning.
3.3 Food and Physical Activity Environments Only one index evaluated both Food and Physical Activity Environments. It was ranked as a promising index. 3.3.1 Health Related Resources Smiley’s37
• Density of supermarkets
promising index, which was tested in Baltimore, New York City and Winston-Salem, was used to investigate the density of health-related resources, such as supermarkets and parks in relation to neighhbourhood racial composition. The index was made up of the following measures:
• Recreational facilities • Parks • Retail areas
20
This index was deemed promising for its ability to unmask inequalities. Smiley found that in all three cities, black people were more likely to live in block groups with multiple, low-resource density. The results of the index could play a role in creating future health policy around mixed land use in lower SES neighbourhoods. This index also showed acceptable face and construct validity.
3.4 Park and Recreation Environment In total, seven Park and Recreation Environment indices were critically appraised and all six were deemed promising. Based on the types of indicators the authors studied, indices were categorized into two types: Park Accessibility and Proximity, and Trail Use. 3.4.1 Park Accessibility and Proximity In the city of Los Angeles, Loukaitu-Sideris and Stieglitz38
• Park distribution by neighbourhood
examined different aspects of neighbourhood parks, such as:
• Park facilities provision The main conclusion for this promising index was that suburban parks were better maintained than those in inner-city Los Angeles. While this work focused indirectly on circumstances of inequality, the index was tested in a highly metropolitan area and not comparable to any city in Alberta. The authors did not elaborate on how the index was tested for scientific rigour, so it scored low.
Cohen et al.39
• Total parks within 0.5miles, 1 mile, and 0.5 to 1 mile
examined various park and neighbourhood features in relation to physical activity levels of adolescent girls in seven cities across the U.S. The promising index measured the following:
• Neighbourhood/community parks within 0.5 miles, 1 mile, and 0.5 to 1 mile • Street connectedness • Street segment When considering feasibility of this index, the urban focus cannot be compared to a large segment of Alberta. However, the index demonstrated a good level of validity and reliability. The index showed that girls who lived within walking distance to parks and amenities engaged in more leisure-time physical activity than those with worse access to parks. Based on this finding, Cohen et al.’s index could possibly be useful in providing evidence for the distribution of park space required in new communities.
Similar to Cohen et al, Wolch et al.’s40
• Traffic density
index was used to examine park and recreational facility proximity and its possible effect on childhood obesity. The promising index was composed of the following measures:
• Freeway proximity • Number of intersections • Park space (acres within a 500m buffer) This study took place in Southern California communities, which varied from low-density suburbs to higher density, older urban areas. Although the promising index could be deemed to only have face validity, there is potential policy implications based on the findings that park accessibility may reduce the risk of overweight and obesity in youth.
Another promising index by Epstein et al.41
• Housing units/residential acre
was used to explore whether neighbourhood characteristics were related to the substitution of physical activity for sedentary youth in the Buffalo-Niagara metro area. The index measured was comprised of these three measures:

21
• Number of intersections/length of street network in feet • Percentage of residential parcels
The index showed a positive relationship between park area and physical activity. Based on these results, this index could be relevant in creating health policy and land development regulations. While the index fared well for feasibility measures, it did not score well for reliability and validity.
The index tested by Weiss et al.42
• Number of parks
was used to study the relationship between physical neighbourhood characteristics and measures of park facilities, while controlling for variation in neighbourhood disamenities (e.g. pedestrian safety, crime). The index consisted of the following indicators:
• Park acreage • Number of facilities • Number of facilities type
While the index reliability and validity was not clearly demonstrated and it was solely urban centered, the index was considered promising. Its promise is based on the disparity focus between neighbourhoods, in regards to ethnic minorities and income level and the potential impact the index could have on policy around the spatial location of parks.
The last index of this type was tested by Bjork et al43
• Mean number of recreational values of the natural environment within 300 metres distance from residence
in a suburban and rural area of Southern Sweden called the Scania region. This group conducted a population based study to examine the association between recreational values of the natural environment and the corresponding neighbourhood satisfaction, as well as physical activity and obesity. Bjork et al. measured the following indicators:
• AND time spent on moderate physical activities and normal body mass index • AND self-rated physical and psychological health and vitality
This promising index scored moderately in both the feasibility and scientific rigour appraisals. The index showed face and content validity, but was not able to establish any proof of reliability. Also, while the authors stated that it was measured in suburban and rural areas of Sweden, there was no further geographical description so it is hard to understand if these are comparable to suburban and rural areas within Alberta.
3.4.2 Trail Use The only index measuring trails was tested by Sprujt-Metz et al.44
• Time and distance spent on the trail
They provided a promising example of evaluation on the psychometric characteristics of the Research on Urban Trail Environments (ROUTE) Trail Use Questionnaire. The index measured:
• Distance of trail from the home While the methodological rigour of the index was solid, and the potential to influence policy around obesity and trail use and availability is possible, the index was applied only in an urban setting.
3.5 Housing In total, two housing indices were critically appraised and were ranked very promising and promising. Based on the types of indicators evaluated, indices were categorized into two types in relation to housing: Built Structures and Environmental Hazards
22
3.5.1 Built Structures Brown et al.45
• Buildings that sat at least 0.3 metres above the level of the sidewalk
tested indicators of neighbourhood housing built structures, like porches, stoops and window, and how these features interact with elders’ physical functioning, which was shown to have a significant effect on the functioning health of this demographic. This unique index was composed of these measures:
• Present or absence of a stoop • Presence of absence of a porch • Proportion of building face composed of windows • Less that 0.91m from the sill of the dominant first window to the main level of the first floor • Ground floor of a multi-storey building dedicated to parking (hypothesized to be detrimental) • Distance from the building to the street. This study was conducted in a very specific area, East Little Havana, in Miami Florida. This community is predominantly Hispanic, low SES, and about 20% of the community is over 65 years of age. This index was deemed very promising because of its focus on inequality, which is a focus of feasibility. Also, the coding system used (University of Miami Built Environment Coding System) could likely be implemented in a variety of settings. The index showed that architectural features of the built environment that promote visual and social contacts among residents (i.e. stoop, porch, windows, etc.) were significantly associated with elders' physical functioning. The index was also supported by face and construct validity. This could be a very useful finding to Alberta based on the aging population and the idea of “aging in place”.
3.5.2 Environmental Hazards Only one study addressing indicators of environmental hazards and the built environment was identified as
promising. Athens et al.46
• Pre-1950’s housing explored:
• Radon risk • Commuting method • While the level of scientific rigour was not explicitly expressed, the index received a ranking of
promising based on the potential to apply in an Alberta context, as well as the focus on inequity. As the index was tested throughout Wisconsin in urban and rural areas, this setting is likely comparable to Alberta geographies. The authors state that one of their goals was to show where disparities exist in environmental health risks; in order to inform policy designed to address these disparities. The index demonstrated that while rural areas have better measures of environmental health, residents are frequently of lower socioeconomic status, have poorer access to health care, and display worse health behaviours.

23
4.0 Sources
The availability of current and comprehensive data sources is often a hindrance to work, around any type of indicators, and built environment indicators are no different. During the appraisal process, data sources for each index were recorded to identify common and potentially new or innovative data sources used for built environment related work. Table 3: Table of Identified Sources from Promising Indices Type of Source Examples Studies that used Data Source Government/Academic Studies & Surveys
Heart and Vascular Health (HVH) Study, Walkable and Bikeable Communities (WBC), Project, Canadian Community Health Survey
8, 9, 12, 16, 17, 20, 21, 25, 28, 35
Local, State/Provincial or National Data
Department of Transportation, Department of Planning, Tax Assessor Data, Stats Canada
10, 11, 12, 13, 14, 15, 18, 19, 22, 23, 29, 30, 31, 33, 34, 35, 36, 38, 41
Census Data 2000 US Census
9, 10, 12, 13, 17, 20, 21, 24, 28, 30, 31, 35, 37, 41
Geospatial Data Street network data, Regional land use data
8, 9, 11, 12, 13, 18, 21, 23, 34, 37
As Table 3 shows, the most commonly used source was government data at all levels. Census information was also highly used. Many studies used a combination of these data sources to glean all of the information they required.

24
5.0 Next Steps
As mentioned previously, this document is just one in a number of documents, which have or will contribute to the Strategy. Some possible ways of moving this work forward are as follows:
• Further investigation into the scientific rigour of indices that weren’t reported on within the study will be conducted. Following this investigation, the report will be revised to reflect these additional findings.
• This document will be disseminated to the Surveillance and Reporting Department for review. Comparing what measures of the built environment are currently measured, with other indices that were found to be promising or very promising, could help to clarify what is important to measure and report in the future.
• This work will be presented to various teams within Alberta Health Services to show what has been found and to make possible linkages with current work.

25
6.0 Conclusions
Through the process of critical appraisal, some general conclusions emerged. The first was a noticeable pattern within the variability of measures used to assess aspects of the built environment. While different researchers may have the same intent to understand how the built environment influences health behaviours, these indices are rarely measuring the exact same built environment features. Building on this pattern, it was also noted that almost all indices were composed of multiple measures, usually testing 4 or more indicators. Multiple measures are likely used to account for the complexity of the built environment and health behaviours. Lastly, almost all of the 69 indices appraised were measured in urban or suburban environments. There remains a large knowledge gap surrounding rural and remote built environments.

26
7.0 Recommendations
Recommendations to AHS Topic Recommendations Rationale
Methodologically sound indicators
• AHS should consider conducting a pilot study which compares the predictive value of the very promising indices in relation to health behaviours.
• Based on the results of the pilot study, AHS may consider implementing the four very promising indices when measuring walkability and food environments.
• These very promising indices could be used in the following circumstances: o Baseline reporting o Routine reporting o Population Health Interventions
• Already critically appraised • Variety of uses
Pursue further research
• Built environment indices, such as Park and Recreation Environments, were not ranked as very promising.
• If the built environment is noted as an AHS priority in the future, and indicators outside of the walkability and food environment realm are needed, further research should be undertaken.
• More research is necessary to understand if these indices should be use in reporting and surveillance
Use validated indices as a foundation
• Use validated indices as a foundation for creating other indices and furthering built environment indicator research.
• Validated indices found in this review: o Metro Vancouver Walkability Index
(VWI), Frank et al.c
o Physical Activity Neighborhood Environment Scale (PANES)
d
o Neighborhood Environment Walkability Scale-Abbreviated (NEWS-A)
e
• Already critically appraised and validated
Make rigour and comprehensiveness
a priority
• With further investigation into understanding the rigour with which several indices were measured, this review could become more meaningful and more useful to AHS and to the scientific community.
• Stronger, comprehensive indicators that will allow for greater comparability and wider use.
c Frank, L. D., Devlin, A., Johnstone, S., & van Loon, J. (2010). Neighbourhood design, travel, and health in Metro Vancouver: using a walkability index. Health and Community Design Lab, University of British Columbia, 10. d Sallis, J.F., Kerr, J., Carlson, J.A., Norman, G.J., Saelens, B.E., Durant, N., and Ainsworth, B.E. (2010). Evaluating a brief self-report measure of neighborhood environments for physical activity research and surveillance: Physical activity neighborhood environment scale (PANES). Journal of Physical Activity and Health, 7, 533-540. e Cerin, E., Saelens, B.E., Sallis, J.F., and Frank, L.D. (2006). Neighborhood environment walkability scale: Validity and development of a short form.Medicine and Science in Sports and Exercise, 38, 1682-1691.
27
• If the author(s) do not reference other studies with more information on scientific rigour of indices, contact authors for further explanation and guidance.
• Indices that consider multiple built environment factors should be prioritized for study and/or use.
Supplement
Literature Review • Supplement this review with a search of
comparable health organizations. Explore their baseline measurements, surveillance data and annual reporting.
• Learn from others success and challenges
Build on Collaboration
• Build on the cursory interviews done with other health jurisdictions.
• Conduct comprehensive, systematic interviews with other Canadian health jurisdictions.
• Interviews with other Canadian Health jurisdictions
Availability of rural indicators
• Within this review, there was an obvious lack of built environment indicators which measure rural and remote geographies.
• The following studies may be useful as examples of promising built environment indices which have been explored in semi-rural and rural environments f
o Athens et al:
g
o Clarke et al (Housing)
h
o Curran et al (Walkability)
i
(Walkability)
• Living in rural or remote areas could be considered disadvantageous to health due to inaccessibility to health resources, lack of travel options, etc.
• Need for a suite of built environment indicators relevant to all of Alberta’s communities and populations.
Presenting the findings
• The new structure of Population and Public Health calls for the creation or improvement of an environment of sharing and learning from colleagues.
• The findings of this review may be useful to the following groups within AHS: o Strategic Clinical Networks
(specifically Obesity team) o Community Innovation Team within
the Alberta Cancer Prevention Legacy Fund (ACPLF)
o Community Surveillance team
• Restructuring of Population and Public Health within AHS
f These geographies have not been deemed as rural, by the AHS Rural-Urban Continuum. They were described in this manner by the authors. g Athens J, Bekkedal M, Malecki K, Anderson H, Remington PL. Measuring the Environmental Health of Wisconsin's Counties. Wisconsin Medical Journal. 2008;107(4):169-175 h Clarke P, George LK. The role of the Built Environment in the Disablement Process. American Journal of Public Health. 2005;95(11):1933-1939 i Curran A, Grant J, Wood ME. Indicators for Community Action: Built Environment and Community Health. Journal of Rural and Community Development.2006;46(2):59-

28
References 1 Public Health Agency of Canada, Summary Report: Pan-Canadian Built Environment Indicator workshop. 2010. 2 Provincial Health Services Authority. Indicators for a Healthy Built Environment in B.C.- Final Report, July 2008 3 Sallis, JF, Glanz K. Physical Activity and Food Environments: Solutions to the Obesity Epidemic. The Milbank Quarterly 2009;87(1):123-154 4 Renalds A, Smith TH, Hale PJ. A Systematic Review of the Built Environment and Health. Fam Community Health 2012;33(1):68-78 5 Papas MA, Alberg AJ, Ewing R, Heizisour KJ, Gary TL, Klassen AC. The Built Environment and Obesity.Epidemiologic Reviews 2007;29:129-143 6 McNeil DA, Flynn MAT. Methods for defining best practice for population health approaches with obesity prevention as an example. Proceedings of the Nutrition Society. 2006;65:403-411 7 Swinburn B, Gill T, Kumanyika SK. Obesity prevention: a proposed framework for translating evidence into action. Obesity Reviews 2005;6;23-33 8 Lovasi GS, Moudon AV, Pearson AL, Hurvitz PM, Larson EB, Siscovick DS, Berke EM, Lumley T, Psaty BM. Using Built Environment Characteristics to Predict Walking for Exercise. International Journal of Health Geographics. 2008;7(10) 9 Frank LD, Schmid TL, Sallis JF, Chapman J, Saelens BE. Linking Objectively Measured Physical Activity with Objectively Measured Urban Form: Findings from SMARTRAQ. American Journal of Preventive Medicine.2005;28(2):117-125 10 De Bourdeaudhuij I, Sallis JF, Saelens BE. Environmental Correlates of Physical Activity in a Sample of Belgian Adults. American Journal of Health Promotion. 2003; 18(1): 83-92
11 Marshall JD, Brauer M, Frank LD. Healthy Neighbourhoods: Walkability and Air Pollution. Environmental Health Perspectives. 2009; 117(11);1752-1759. 12 Frank LD, Winters M, Patterson B, Craig CL. Promoting Physical Activity Through Healthy Community Design. 2009. UBC Active Transportation Collaboratory. Vancouver, B.C. 13 Frank LD, Andresen, MA, Schmid, TL. Obesity Relationships with Community Design, Physical Activity, and Time Spent in Cars. American Journal of Preventive Medicine. 2004;27(2):87-96 14 Smith KR, Brown BB, Yamada I, Kowaleski-Jones L, Zick CD, Fan JX. Walkability and Body Mass Index - Density, Design, and new Diversity Measures. American Journal of Preventive Medicine. 2008;35(3): 237-244 15 Neckerman KM, Lovasi GS, Davies S, Purciel M, Quinn J, Feder E, Raghunath N, Wasserman B,
Rundle, A. Disparities in Urban Neighborhood Conditions: Evidence from GIS Measures and Field Observation in New York City. Journal of Public Health Policy. 2009; 30: S264-S285. 16 Sundquist K, Eriksson U, Kawakami N, Skog L, Ohlsson H, Arvidsson D. Neighborhood Walkability, Physical Activity, and Walking Behaviour: The Swedish Neighborhood and Physical Activity (SNAP) Study. Social Science and Medicine. 2011;72(8):1266-1273.

29
17 Sallis JF, Kerr J, Carlson JA, Norman GJ, Saelens BE, Durant N, Ainsworth BE. Evaluating a Brief Self-Report Measure of Neighborhood Environments for Physical Activity Research and Surveillance: Physical Activity Neighborhood Environment Scale (PANES). Journal of Physical Activity & Health. 2010; 7(4): 533-540 18 Durant N, Kerr J, Harris SK, Saelens BE, Norman GJ, Sallis JF. Environmental and Safety Barriers to Youth Physical Activity in Neighborhood Parks and Streets: Reliability and Validity. Pediatric Exercise Science. 2009;21:86-99
19 Forman H, Kerr J, Norman GJ, Saelens BE, Durant NH, Harris SK, Sallis JF. Reliability and Validity of destination-specific barriers to walking and Cycling for Youth. Preventive Medicine. 2008; 46:311-316
20 Tomalty R, Haider M. BC Sprawl Report: Walkability and Health. City of Vancouver, City of Port Moody and District of Invermere. 2009. 21 Koohsari, M. J. Access to public open space: Is Distribution Equitable Across Different Socio-Economic Areas? Journal of Urban and Environmental Engineering. 2011;5(2) 22 Alfonzo MA, Boarnet MG, Day K, McMillan T, Anderson CL. The Relationship of Neighbourhood Built Environment Features and Adult Parents’ Walking. Journal of Urban Design. 2008;13(1):29-51. 23 Clarke P, George LK. The role of the Built Environment in the Disablement Process. American Journal of Public Health. 2005;95(11):1933-1939 24 Duncan, D T, Aldstadt J, Whalen J, Melly SJ, Gortmaker S L. Validation of Walk Score (R) for Estimating Neighborhood Walkability: An Analysis of Four US Metropolitan Areas. International Journal of Environmental Research and Public Health. 2011;8(11):4160-4179 25 Curran A, Grant J, Wood ME. Indicators for Community Action: Built Environment and Community Health. Journal of Rural and Community Development.2006;46(2):59-74 26 Witten KA, Pearce JB, DayPC. Neighbourhood Destination Accessibility Index: A GIS Tool for measuring Infrastructure Support for Neighbourhood Physical Activity. Environment and Planning. 2011;43(1); 205-223. 27 Hoehner CM, Handy SL, Yan Y, Blair SN, Berrigan D. Association between Neighborhood Walkability, Cardio-Respiratory Fitness and Body-Mass Index. Social Science and Medicine. 2011;73(12):1707-1716. 28 Frank L, Sallis J, Conway T, Chapman J, Saelens B. Many Pathways from Land Use to Health: Associations between Neighbourhood Walkability and Active Transportation, Body Mass Index and Air Quality. Journal of the American Planning Association. 2006;72(1):75-87 29 Shay E, Rodriguez DA, Cho G, Clifton KJ and Evenson KR. Comparing objective measures of environmental supports for pedestrian travel in adults. International Journal of Health Geographics 2009; 8:62. 30 Joshu CE, Boehmer TK, Brownson RC, Ewing R. Personal, Neighbourhood and Urban Factors Associated with Obesity in the United States. Journal of Epidemiology and Community Health.2008;62(3):202-208 31 Apparicio P, Cloutier, MS, Shearmur R. The Case of Montreal’s Missing Food Deserts- Evaluation of Accessibility to Food Supermarkets. International Journal of Health Geographics. 2007;6(4) 32 Seliske LM. The Built Environment and Obesity-Related Behaviours in Canadian Youth. PhD Dissertation: Community Health & Epidemiology Program; Queen's University, Kingston, Ontario. 2012
30
33 Larsen K, Gilliland J. Mapping the Evolution of “Food Deserts” in a Canadian City: Supermarket Accessibility in London, Ontario, 1961–2005. International Journal of Health Geographics. 2008;7(16) 34 Morland K, Filomena S. Disparities in the Availability of Fruits and Vegetables between Racially Segregated Urban Neighbourhoods. Public Health Nutrition. 2007; 10:1481–9. 35 Bader, MDM, Purciel M, Yousefzadeh P, Neckerman KM. Disparities in Neighborhood Food Environments: Implications of Measurement Strategies. Economic Geography. 2010; 86(4):409-430 36 Chen S., Florax RJGM, Snyder S, Miller CC. Obesity and Access to Chain Grocers. Economic Geography. 2010;86(4); 37 Smiley, M. (2011). Health-related characteristics of American urban environments: Description, measurement, and associations with healthy behaviours. (Ph.D., University of Michigan). , 111. 38 Loukaitou-Sideris A,Stieglitz O. Children in Los Angeles Parks: A Study of Equity, Quality and Children's Satisfaction with Neighbourhood Parks. The Town Planning Review. 2002;73(4); 467-488 39 Cohen DA, Scott Ashwood J, Scott MM, Overton A, Evenson KR, Staten LK, Porter D, McKensie TL, Catellier D. Public Parks and Physical Activity Among Adolescent Girls. Journal of the American Academy of Pediatrics. 2006;118(5):1381-1389 40 Wolch J, Jerrett M, Reynolds K, McConnell R, Chang R, Dahmann, N, Berhane, K. Childhood Obesity and Proximity to Urban Parks and Recreational Resources: A Longitudinal Cohort Study. Health & Place. 2011;17(1):207-214 41 Epstein LH, Raja S, Gold SS, Paluch R A, Pak Y, Roemmich JN. Reducing Sedentary Behaviour: The Relationship between Park Area and the Physical Activity of Youth. Psychological Science. 2006;17(8):654-659 42 Weiss CC, Purciel M, Bader M, Quinn JW, Lovasi G, Neckerman KM, Rundle AG. Reconsidering Access: Park Facilities and Neighborhood Disamenities in New York City. Journal of Urban Health. 2011;88(2):297-310 43 Bjork J, Albin M, Grahn P, Jacobsson H, Ardo J, Wadbro J, Ostergren PO, Skarback E. Recreational Values of the Natural Environment in Relation to Neighbourhood Satisfaction, Physical Activity, Obesity and Wellbeing. Journal of Epidemiology and Community Health. 2008;62(4):e2
44 Spruzjt-Metz D, Wolch J, Jerrett M, Byrne J, Hsieh S, Myles R, Xie B, Wang L, Chou C-P, Reynolds KD. Development, Reliability, and Validity of an Urban Trail Use Survey. American Journal of Health Promotion. 2010;25(1):2-11 45 Brown,SC, Mason CA, Perrino T, Lombard JL, Martinez F, Plater-Zyberk E, Spokane AR, Szapocznik, J. Built environment and Physical Functioning in Hispanic Elders: The Role of "Eyes on the Street". Environmental Health Perspectives. 2008;116(10):1300-1307 46 Athens J, Bekkedal M, Malecki K, Anderson H, Remington PL. Measuring the Environmental Health of Wisconsin's Counties. Wisconsin Medical Journal. 2008;107(4):169-175