Embed Size (px)
Citation preview

Building Our Future
HudBay Minerals 2009 Annual Report

“ Crews have been mobilized and ramp development is underway at Lalor.”
HudBay Minerals Inc. (TSX: HBM) is a Canadian integrated mining company with assets in North and Central America principally focused on the discovery, production and marketing of base metals. The company’s objective is to maximize shareholder value through efficient operations, organic growth and accretive acquisitions, while maintaining its financial strength. A member of the S&P/TSX Composite Index and the S&P/TSX Global Mining Index, HudBay is committed to high standards of corporate governance and sustainability.
All amounts in Canadian dollars unless otherwise noted.
Table of Contents
1 Investment Propositions 2 Financial Highlights 4 Operations at a Glance 6 Message from the CEO 9 Chairman’s Message 10 Corporate Governance 12 Lalor Project 14 Exploration 16 Management’s Discussion
and Analysis 69 Auditors’ Report 70 Consolidated Financial
Statements 74 Notes to the Consolidated
Financial Statements 113 Management114 Corporate Information
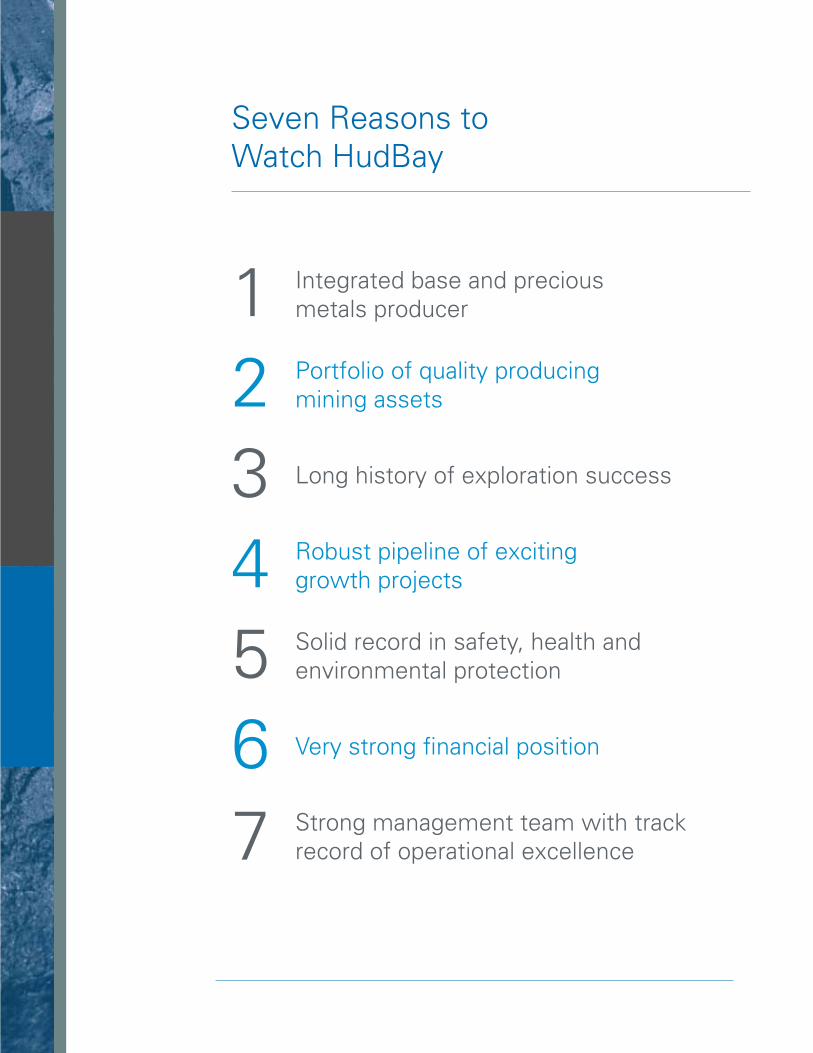
Integrated base and precious metals producer1Portfolio of quality producing mining assets2
Robust pipeline of exciting growth projects4Solid record in safety, health and environmental protection5
Strong management team with track record of operational excellence7
Very strong financial position6
Long history of exploration success3
Seven Reasons to Watch HudBay

150
120
90
60
30
$2.50
125.3
08
106.8
09
126.3
07
123.3
06
114.7
05
$2.00
$1.50
$1.00
$0.50
100
80
60
40
20
$3.75
08 09
90.0
07
88.2
06
86.3
05
$3.00
$2.25
$1.50
$0.75
58.6
74.7
Our results in 2009 were helped by record production from our flagship 777 mine. We ended the year with $887 million in cash and are well positioned to pursue our strategic objectives for 2010 and beyond.
Building Our Future
Financial Highlights
($ millions) For the years ended December 31 2009 2008 2007 2006
Revenue Zinc & zinc oxide $ 174.2 $ 200.2 $ 487.5 $ 409.8 Copper $ 351.3 $ 551.5 $ 668.8 $ 624.0 Gold $ 102.5 $ 93.5 $ 70.6 $ 56.3 Silver $ 34.5 $ 27.0 $ 17.8 $ 14.6 Other $ 58.2 $ 109.7 $ 25.2 $ 25.1
Total revenue $ 720.7 $ 981.9 $ 1,269.9 $ 1,129.0
Earnings before tax $ 141.9 $ 169.7 $ 365.5 $ 442.4
Net earnings $ 112.8 $ 73.4 $ 227.1 $ 564.0
Total assets $ 2,032.3 $ 1,918.4 $ 1,551.6 $ 1,318.5
Shareholders’ equity $ 1,702.4 $ 1,558.7 $ 1,191.2 $ 964.2
Cash and cash equivalents $ 886.8 $ 704.7 $ 757.6 $ 385.9
Cash and cash equivalents at the end of 2009:
$886,814,000
■ Copper Production (000 tonnes)
● LME Average Price (US $ per lb.)
■ Zinc Production (000 tonnes)
● LME Average Price (US $ per lb.)
2 HudBay Minerals Inc.
Financial Highlights
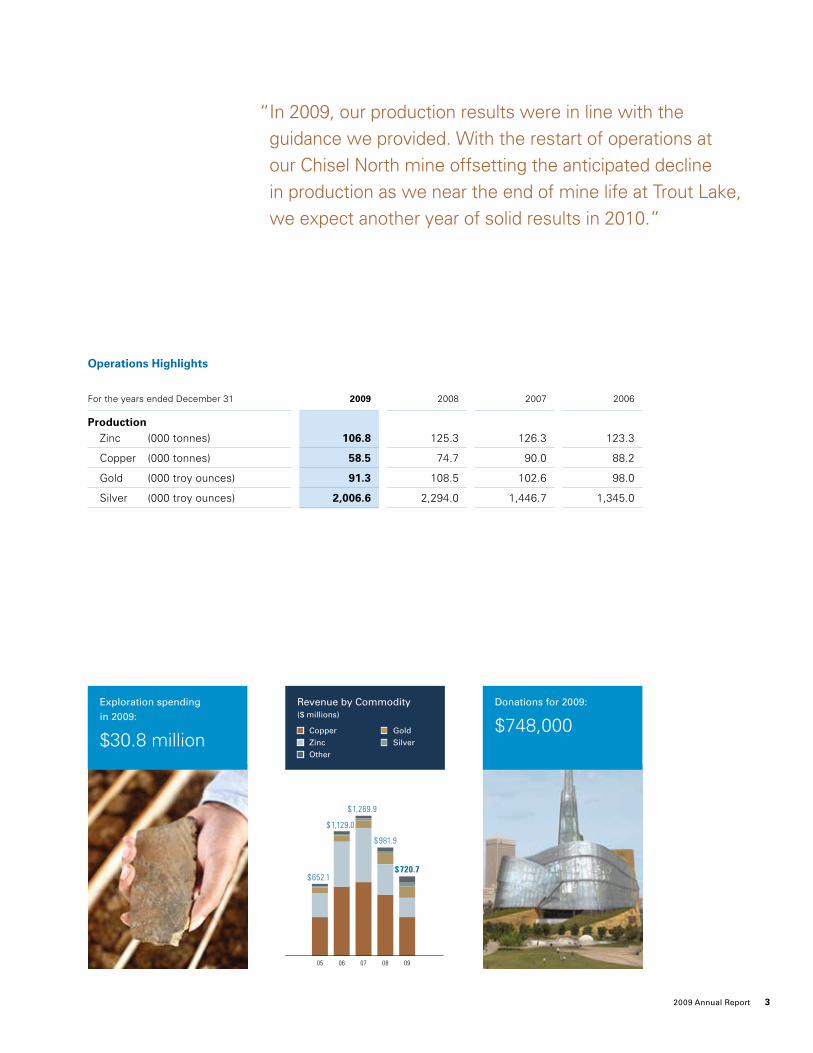
$ 981.9
08
$ 1,269.9
07
$ 1,129.0
06
$ 652.1
05
$ 720.7
09
“ In 2009, our production results were in line with the guidance we provided. With the restart of operations at our Chisel North mine offsetting the anticipated decline in production as we near the end of mine life at Trout Lake, we expect another year of solid results in 2010.”
Exploration spending in 2009:
$30.8 million
Operations Highlights
For the years ended December 31 2009 2008 2007 2006
Production Zinc (000 tonnes) 106.8 125.3 126.3 123.3
Copper (000 tonnes) 58.5 74.7 90.0 88.2
Gold (000 troy ounces) 91.3 108.5 102.6 98.0
Silver (000 troy ounces) 2,006.6 2,294.0 1,446.7 1,345.0
Donations for 2009:
$748,000Revenue by Commodity($ millions)
■ Copper ■ Gold
■ Zinc ■ Silver
■ Other
3 2009 Annual Report

As a fully integrated company, HudBay has operations that range from exploration, to mining, to metal production to the sale of finished products, including special high-grade zinc.
HudBay at a Glance
miNES
dEvElOPmENT PROJECTS
Trout lake mine Manitoba
The Trout Lake mine produces zinc, copper, gold and silver. It is located six kilometres from HudBay’s main ore concentrator and metallurgical complex in Flin Flon. Commercial production at the mine commenced in 1982 and is projected to end in 2012.
Chisel North mine Manitoba
The Chisel North mine produces zinc and is located 10 kilometres from HudBay’s Snow Lake ore concentrator, which is 215 kilometres from Flin Flon. Commercial production at the mine commenced in 2000 and is projected to end in 2012.
777 mine Manitoba
The 777 mine is HudBay’s premier mine and produces zinc, copper, gold and silver. Located in Flin Flon, 777 is situated immediately adjacent to the Company’s principal concentrator and metallurgical plants. Commercial production commenced in January 2004 and current reserves provide for continuous production through 2020.
In 2009, 777 achieved record ore production of 1,540,348 tonnes.
lalor Project Manitoba
HudBay’s Lalor project is located in the Chisel basin of the prolific Flin Flon Greenstone Belt, about 15 kilometres from the Snow Lake ore concentrator. The deposit was discovered in 2007 and intensive exploration since then has discovered separate and distinct zinc, gold and copper-gold zones. The base case pre-feasibility study is ongoing and is expected to be enhanced by conducting engineering and tradeoff studies to further refine the project design, while an underground ramp from the Chisel North mine to Lalor is currently under construction.
Record ore production
Fenix Nickel Project Guatemala
HudBay acquired the Fenix property in Guatemala in 2008. It was a fully operational nickel laterite mining and smelting operation until it was placed on care and maintenance in 1980. HudBay is currently updating the mine’s feasibility study with a focus on mine optimization and electrical power strategy as options for redevelopment are evaluated.
Back Forty Project Michigan
The Back Forty project is subject to an option and joint venture agree- ment signed with Aquila Resources Inc. in 2009. Located in the Upper Peninsula of Michigan, the property holds extensive reserves of zinc, gold, copper and silver. Work to prepare a feasibility study and project permitting applica-tions is underway, and HudBay has an option to acquire a majority interest and become the operator.
4 HudBay Minerals Inc.
Operations at a Glance

1 manitoba/ Saskatchewan
• 777Mine • ChiselNorthMine • TroutLakeMine • FlinFlonConcentrator • SnowLakeConcentrator • CopperSmelter • ZincPlant • LalorProject
2 michigan • WhitePineCopperRefinery • BackFortyProject
3 Ontario • HudBayHeadOffice • ZochemZincOxide
4 Guatemala • FenixNickelProject
1
32
4
mETalluRGiCal PlaNTCONCENTRaTORS
dEvElOPmENT PROJECTS
Snow lake Concentrator Manitoba
The Snow Lake concentrator processes ore from the Chisel North mine and will process ore from the Lalor Project, which is currently under construction. It produces zinc concentrate that is transported 215 kilometres to the zinc plant at Flin Flon for processing into finished metal. The concentrator’s ore capacity is 1.2 million tonnes per year.
Flin Flon Concentrator Manitoba
The Flin Flon concentrator produces zinc and copper concentrates from ore mined at the 777 and Trout Lake mines. Zinc concentrate is fed to the zinc plant at Flin Flon for processing into finished metal. Starting in mid-2010, copper concentrate will be transported to third-party copper smelters. The concentrator’s ore capacity is 2.2 million tonnes per year.
Zinc Plant Manitoba
HudBay’s zinc plant in Flin Flon uses advanced technologies to produce special high-grade metal from zinc concentrate. Feedstock consists of zinc concentrate from company concentrators at Flin Flon and Snow Lake, plus additional purchased third-party concentrate as required. The plant’s process includes a two-stage pressure leaching unit, four steps of solution purification, an electrolysis circuit and a casting facility. The zinc plant’s output capacity is 115,000 tonnes of refined zinc metal per year.
Reed lake Property Manitoba
In March 2010, HudBay signed a non-binding agreement with VMS Ventures Inc. to create a joint venture to develop HudBay’s Reed Lake property, a copper-rich deposit in the Flin Flon Greenstone Belt that can supply ore to HudBay’s existing concentrators. The property is currently under option to VMS and HudBay would have an option to acquire a majority interest in the joint venture.
Cold and lost Properties Manitoba
The Cold and Lost properties are located in the Sherridon VMS district in the Flin Flon Greenstone Belt. They are held by Halo Resources Ltd., with whom HudBay signed an agreement in 2009 that provides an option to acquire a majority joint venture interest. If mineable ore is located, it can be transported 110 kilometres to HudBay’s processing facilities at Flin Flon.
Renewed commitment to exploration
Of HudBay’s $42 million 2010 exploration program, $8 million has been earmarked for Lalor. The regional drill program is also being expanded, targeting prospective areas adjacent to the Lalor project.
5 2009 Annual Report
New leadership
The first quarter of 2009 was marked by a proxy contest that brought in the current board of directors, with G. Wesley Voorheis as chairman and Peter R. Jones as chief executive officer. Mr. Jones, who had been HudBay’s CEO from 2004 to early 2008, returned and helped with key strategic initiatives, including the Lalor project, until his retirement at the end of 2009. I thank Mr. Jones for his energy, dedication and service, as CEO and as a board member.
As HudBay searches for a new CEO, I have stepped into the role on an interim basis until an appropriate candidate is found. The changes to the board and executive in 2009 did not affect management at the operational level, and this continuity was a key contributor to the company’s ongoing profitability during the year.
active Operations management
HudBay’s active management of mining operations in 2009 reflected dramatic price movements on global metal markets. During 2008 zinc and copper prices plummeted, rendering the Chisel North mine and nearby Snow Lake zinc concentrator in Manitoba uneconomic, and these operations were placed on care and maintenance. In June 2009, it was announced that the 80-year-old Flin Flon copper smelter and our White Pine, Michigan copper refinery would cease operations by mid-2010. These changes demonstrated management’s willingness to take decisive action when faced with challenging operating conditions.
As metal prices recovered strongly during 2009, the Chisel North and Snow Lake operations returned to economic viability and in October we announced plans to restart them in the second quarter of 2010. In addition to profitably producing zinc concentrate
For HudBay, 2009 brought fresh perspectives and a renewed focus on shareholder value. There was new leadership at the company’s most senior levels, rapid progress at our Lalor development project and the formation of new growth initiatives with other companies. During this time we actively managed assets as metal prices dramatically declined and then strongly recovered amid the most severe economic recession in decades.
Production volumes during 2009 were in line with expectations, although impacted by the suspension of the Chisel North and Balmat mines due to slow metal markets early in the year. The other operations proceeded smoothly, with the flagship 777 Mine in Flin Flon, Manitoba setting a new production record. In 2009 we also surpassed our goal of reducing lost time accident frequency and achieved record performance with just 0.5 accidents per 200,000 hours worked.
Metal prices started 2009 at historic lows but improved during the year. Meanwhile, operating costs were held down by a combination of cost containment measures and the suspension of higher-cost operations. In 2009 HudBay sold its shares of Lundin Mining, resulting in a substantial one-time gain that was partly offset by higher costs generated by unusual events during the year.
As a result, while revenues declined by 27% from 2008 to $720.7 million in 2009, net earnings increased by 54% to $112.8 million, or $0.73 per share. HudBay maintained its exceptionally strong balance sheet, ending the year with $886.8 million in cash and no long-term debt.
HudBay is well positioned to take advantage of an improving global economic environment. Core operations are cash flow positive, our Lalor development project is firmly on track, we have promising joint ventures with other mining companies and our financial position is one of the strongest in the industry.
Renewed Opportunities
6 HudBay Minerals Inc.
Message from the CEO

feed for the zinc plant at Flin Flon, these operations will employ some of the employees from the Flin Flon copper smelter. Our Chisel North and Trout Lake mines have approximately two years of mineable reserves remaining. They will play a transitional role to provide zinc ore during the development of HudBay’s newest mine at our Lalor project, located near Snow Lake.
Strategic Growth
HudBay’s strategic growth plan, unveiled during 2009, provides for two main components. The first is to optimize and expand the company’s principal operating platform in Manitoba, while the second seeks accretive growth opportunities farther afield. Both components of the plan were advanced during the year with the groundwork laid for more achievements in 2010 and beyond.
In Manitoba, HudBay’s development centerpiece is Lalor. During 2009, exploration activities identified separate and distinct gold and copper-gold zones to our previously defined zinc zones. On the basis of current data, Lalor is expected to replace Chisel North and Trout Lake as a primary feed source for the Flin Flon zinc plant. Lalor is also expected to more than double HudBay’s gold output. In addition to the zinc and gold zones, the recently discovered copper-gold zone shows the potential for discovering additional mineralization at Lalor.
To expedite development of this resource, in late 2009 we began construction of a three-kilometre underground ramp to provide access from the Chisel North mine to the Lalor deposit. Access will facilitate early production of zinc ores while the mine is being developed, will allow full definition drilling of the gold zones and will enable follow-up exploration of the copper-gold zones. The property is being developed on an expedited basis as HudBay’s next big underground mine and it is currently our top priority.
Also during 2009, we signed an option agreement with Halo Resources Ltd. that allows HudBay to earn up to a 67.5% joint venture interest in Halo’s Cold and Lost zinc and copper exploration properties in northern Manitoba. In March 2010, we announced the signing of a letter of intent with VMS Ventures Inc. to create a joint venture to develop HudBay’s Reed Lake property near Flin Flon. Both of these initiatives hold considerable promise to profitably increase production in the Flin Flon area and optimize our operations in Manitoba.
In addition, HudBay entered into an agreement with Aquila Resources Inc. in 2009 that provides the right to acquire a majority interest in Aquila’s Back Forty project in Michigan. The property holds extensive zinc, gold, copper and silver mineralization, and is a promising production opportunity.
“ Both components of the strategic plan were advanced during the year with the groundwork laid for more achievements in 2010 and beyond.”
W. Warren Holmes Executive Vice Chairman and Interim Chief Executive Officer
7 2009 Annual Report

In Guatemala, we are currently re-evaluating key elements of the Fenix project. Over the past year the grade of the nickel mineral resource has been significantly increased, allowing an optimized mine plan to be developed. The revised resource, combined with development of an upgraded electrical energy supply strategy, are expected to significantly improve the project’s economics. The results of this work are being used to update the Fenix feasibility study in 2010 as we seek to maximize the property’s value. As part of this work, various options are being considered, including the possibility of adding a joint venture partner or a third-party off-take agreement.
In 2010 HudBay plans to invest approximately $42 million in exploration, of which $20 million has been earmarked for grassroots exploration in the prolific Flin Flon Greenstone Belt. Within that region, $8 million has been dedicated solely to the Lalor project. The remainder will be spent on underground exploration at our operating mines and at other areas, including the Back Forty and Fenix projects. HudBay has an enviable record of success for finding mines and we have a strong exploration team looking for new deposits.
Focused on Shareholder value
HudBay’s mission is to maximize shareholder value. During 2009 the Company’s TSX share price more than tripled, from $3.64 at the outset of 2009 to
$13.57 at year end. While this performance was partly due to the recovery in metal prices, it was also driven by the Lalor development and other fundamentals of the business.
Looking ahead to 2010, the recovering global economic environment is expected to further strengthen demand for base and precious metals. We are optimistic about the long-term prospects for metal prices as countries like China and India industrialize further and western economies return to their full potential. HudBay’s solid operational platform, exciting development prospects and robust financial position strongly position the company to continue profitable growth.
The success of HudBay in 2009 was due to the skills of our management and employees, the counsel of our board members, the business of our customers, the support of our communities and the faith of our shareholders. I thank them all and look forward to their continued support in 2010 and beyond.
(signed)
W. Warren Holmes
Executive Vice Chairman and Interim Chief Executive Officer
Hudbay’s operations at its flagship 777 mine in Flin Flon have gone 917 days without a lost time accident as of May 27, 2010.
8 HudBay Minerals Inc.
Message from the CEO

Building Shareholder Confidence
We believe high standards of corporate governance make good business sense because they result in better decisions and build confidence in HudBay’s leadership by stakeholders of all categories. Such standards also establish sound moral guideposts that apply at all levels of the enterprise.
We also implemented leading governance practices including share ownership targets for directors and officers and majority voting for directors. We also implemented a prior commitment to require shareholder approval for acquisitions involving the issuance of 25% or more of our common shares.
Priorities for 2010
Looking ahead, the board will continue its strong commitment to safety, health and environmental standards. These include meeting our ISO 14001, 18001 and Towards Sustainable Mining targets.
In addition, the board will work with management to achieve HudBay’s two-part growth strategy. We aim to strengthen our principal operating platform in Manitoba with an aggressive exploration program and the development of our Lalor project, while seeking other opportunities beyond the province’s borders.
The board also fully intends to pay close attention to corporate social responsibility. HudBay has always valued strong ties with the communities in which it operates and we believe the most effective way of building those lines is with well-established and meaningful lines of communication.
HudBay’s continued profitability amid the challenges of 2009 demonstrate the value of our mining properties, the efficiency of our operations and above all, the capabilities of our people. It is these assets that will propel HudBay forward as we meet the challenges and opportunities ahead with confidence, energy and strength.
(signed)
G.Wesley Voorheis
Chairman
Regaining Shareholder Confidence
The current board of directors assumed office on March 23, 2009 at the conclusion of a tumultuous period. The previous board had resigned two days prior to a special meeting of shareholders scheduled for March 25. We took on our new responsibilities with a determination to maintain shareholder confidence, and from that day onward we have applied our best efforts toward that objective.
Starting in the second quarter of 2009, the new board and our now retired CEO, Peter R. Jones, worked with management to redefine objectives, priorities and strategies. The board is pleased with HudBay’s performance and I believe the strong rise in shareholder value during 2009 indicates a corresponding measure of investor confidence.
One of the first priorities of the new board was to conduct a thorough review of HudBay’s governance policies and procedures. All aspects were covered, including the responsibilities of the board, the composition and charters of its committees, descrip-tions of key positions plus our policies on disclosure, confidentiality, insider trading, whistleblowing and ethical conduct.
G. Wesley voorheis Chairman
9 2009 Annual Report
Chairman’s Letter
High Standards of Governance
We believe that good governance is critical to our success as a publicly traded company and to securing investor confidence and trust. The principles of transparency and integrity that we’ve established will apply to every aspect of our operations and management of this company. Our governance policies are available on our website at www.hudbayminerals.com.
Board of directors
The board consists of eight directors, five of whom are independent, with a range of financial, legal and operational experience. For further details on the individual directors, please consult the management information circular dated May 14, 2010 for our 2010 annual meeting of shareholders.
HudBay Minerals Inc. is committed to excellence in corporate governance. Since its appointment on March 23, 2009 the board has refined the company’s governance framework to promote the interests of shareholders and the effective functioning of the board and its committees. The framework also establishes a common set of performance expectations for the board and the senior management team.
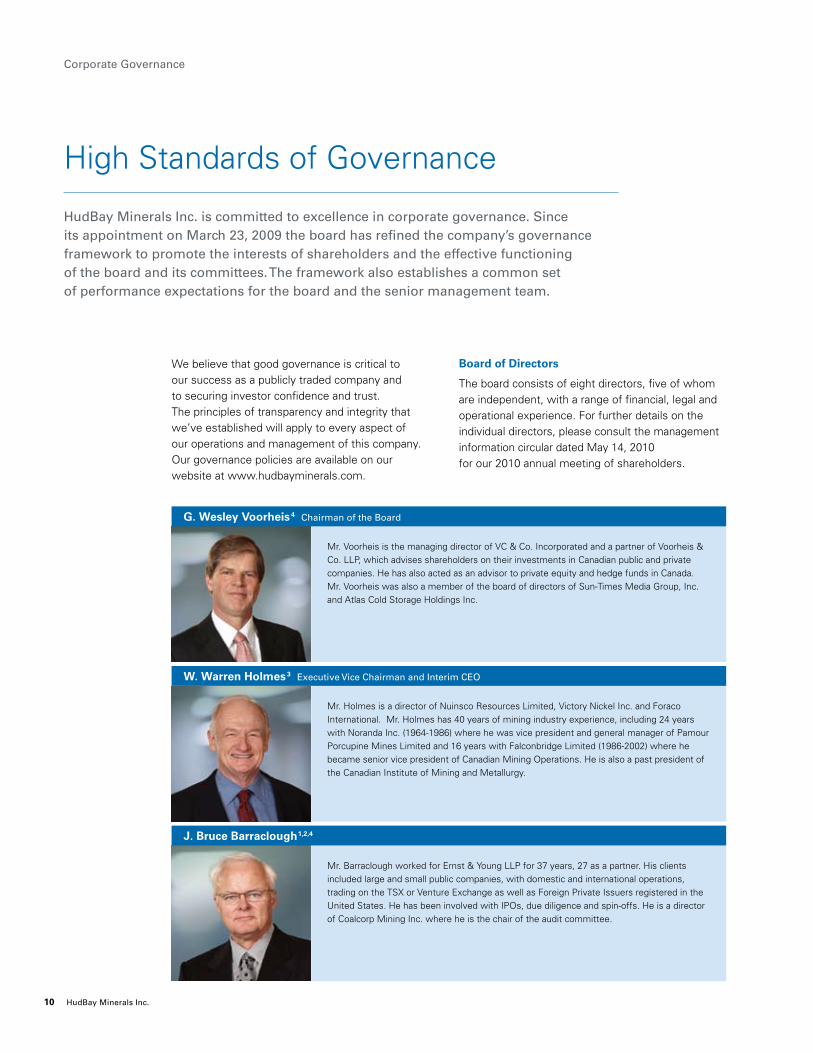
Mr. Voorheis is the managing director of VC & Co. Incorporated and a partner of Voorheis & Co. LLP, which advises shareholders on their investments in Canadian public and private companies. He has also acted as an advisor to private equity and hedge funds in Canada. Mr. Voorheis was also a member of the board of directors of Sun-Times Media Group, Inc. and Atlas Cold Storage Holdings Inc.
Mr. Holmes is a director of Nuinsco Resources Limited, Victory Nickel Inc. and Foraco International. Mr. Holmes has 40 years of mining industry experience, including 24 years with Noranda Inc. (1964-1986) where he was vice president and general manager of Pamour Porcupine Mines Limited and 16 years with Falconbridge Limited (1986-2002) where he became senior vice president of Canadian Mining Operations. He is also a past president of the Canadian Institute of Mining and Metallurgy.
Mr. Barraclough worked for Ernst & Young LLP for 37 years, 27 as a partner. His clients included large and small public companies, with domestic and international operations, trading on the TSX or Venture Exchange as well as Foreign Private Issuers registered in the United States. He has been involved with IPOs, due diligence and spin-offs. He is a director of Coalcorp Mining Inc. where he is the chair of the audit committee.
G. Wesley voorheis4 Chairman of the Board
W. Warren Holmes3 Executive Vice Chairman and Interim CEO
J. Bruce Barraclough1,2,4
10 HudBay Minerals Inc.
Corporate Governance
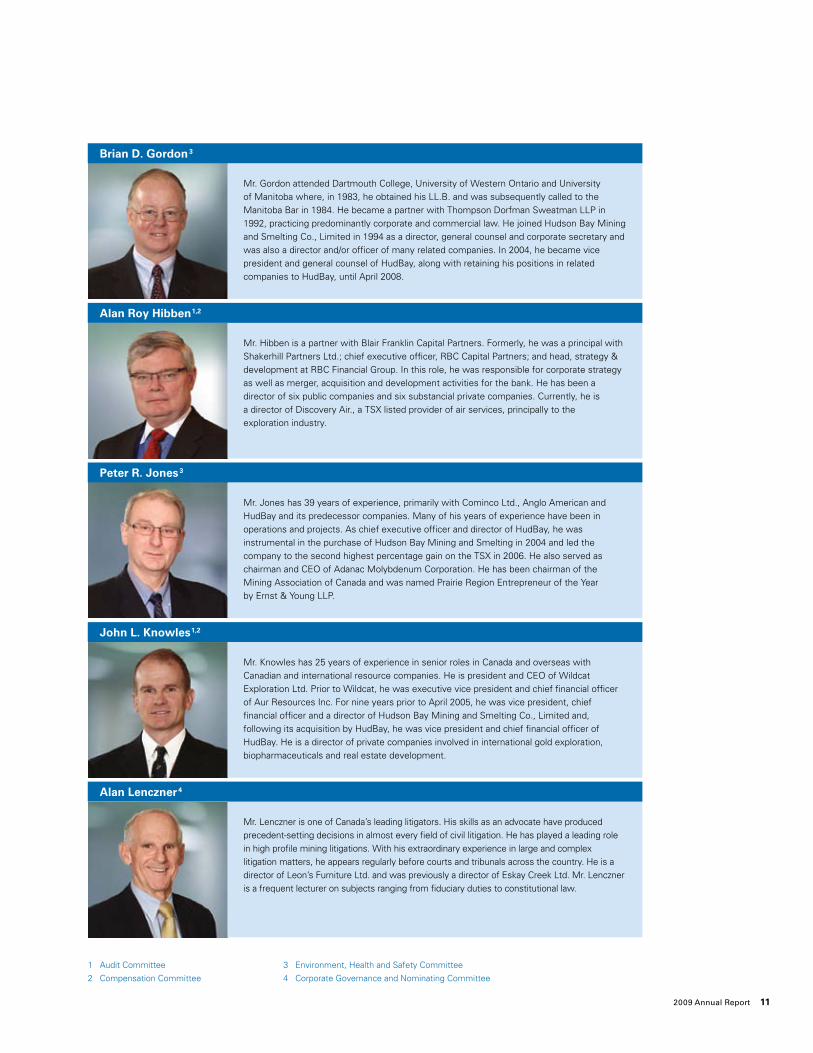
1 Audit Committee 3 Environment, Health and Safety Committee
2 Compensation Committee 4 Corporate Governance and Nominating Committee
Mr. Gordon attended Dartmouth College, University of Western Ontario and University of Manitoba where, in 1983, he obtained his LL.B. and was subsequently called to the Manitoba Bar in 1984. He became a partner with Thompson Dorfman Sweatman LLP in 1992, practicing predominantly corporate and commercial law. He joined Hudson Bay Mining and Smelting Co., Limited in 1994 as a director, general counsel and corporate secretary and was also a director and/or officer of many related companies. In 2004, he became vice president and general counsel of HudBay, along with retaining his positions in related companies to HudBay, until April 2008.
Mr. Hibben is a partner with Blair Franklin Capital Partners. Formerly, he was a principal with Shakerhill Partners Ltd.; chief executive officer, RBC Capital Partners; and head, strategy & development at RBC Financial Group. In this role, he was responsible for corporate strategy as well as merger, acquisition and development activities for the bank. He has been a director of six public companies and six substancial private companies. Currently, he is a director of Discovery Air., a TSX listed provider of air services, principally to the exploration industry.
Mr. Jones has 39 years of experience, primarily with Cominco Ltd., Anglo American and HudBay and its predecessor companies. Many of his years of experience have been in operations and projects. As chief executive officer and director of HudBay, he was instrumental in the purchase of Hudson Bay Mining and Smelting in 2004 and led the company to the second highest percentage gain on the TSX in 2006. He also served as chairman and CEO of Adanac Molybdenum Corporation. He has been chairman of the Mining Association of Canada and was named Prairie Region Entrepreneur of the Year by Ernst & Young LLP.
Mr. Knowles has 25 years of experience in senior roles in Canada and overseas with Canadian and international resource companies. He is president and CEO of Wildcat Exploration Ltd. Prior to Wildcat, he was executive vice president and chief financial officer of Aur Resources Inc. For nine years prior to April 2005, he was vice president, chief financial officer and a director of Hudson Bay Mining and Smelting Co., Limited and, following its acquisition by HudBay, he was vice president and chief financial officer of HudBay. He is a director of private companies involved in international gold exploration, biopharmaceuticals and real estate development.
Mr. Lenczner is one of Canada’s leading litigators. His skills as an advocate have produced precedent-setting decisions in almost every field of civil litigation. He has played a leading role in high profile mining litigations. With his extraordinary experience in large and complex litigation matters, he appears regularly before courts and tribunals across the country. He is a director of Leon’s Furniture Ltd. and was previously a director of Eskay Creek Ltd. Mr. Lenczner is a frequent lecturer on subjects ranging from fiduciary duties to constitutional law.
Brian d. Gordon3
alan Roy Hibben1,2
Peter R. Jones3
John l. Knowles1,2
alan lenczner4
11 2009 Annual Report

surveys and as many as six drills turning simultaneously on the property. This led to the discovery of a new copper-gold zone, adding to the previously identified base metals zone and gold zone. These three zones are structured in a classic volcanogenic massive sulfide mineralization sequence that mirrors geological characteristics of profitable mines at other locations within North America.
In October 2009, HudBay filed an updated NI 43-101 compliant mineral resource estimate for the base metals zone as well as a conceptual estimate of the mineralization in the gold zone.
At the same time, HudBay’s board of directors approved an $85 million capital investment for Phase I mine development. The funding provides for construction of an underground three-kilometer
Lalor is located in the Chisel Basin of the Flin Flon Greenstone Belt, a prolific zinc-copper-gold region in northern Manitoba where several other mines have been developed. In addition to its geologically favorable location, Lalor has the strategic advantage of being situated only three kilometres from HudBay’s existing Chisel North mine and 15 kilometres from the company’s Snow Lake concentrator, which generates zinc concentrate to the zinc plant in Flin Flon.
Since the deposit was discovered in March 2007, Lalor has been the focus of intensive exploration activity. Work in 2008 led to the discovery of a new gold zone in early 2009. During 2009 exploration spending on the project was doubled to $13 million, providing for additional electromagnetic geophysical
Opportunity at Lalor
The Lalor development project is poised to become HudBay’s next major underground mine. It contains one of the largest volcanogenic massive sulfide ore deposits ever discovered in the Flin Flon Greenstone Belt and is being developed on an expedited basis as a vital component of the company’s future.
Zn Rich
Au Rich
Cu-Au
0m 250m
Looking N70°W
Gold Exploration Platform
Cu-Au zone
Early Production
Ramp from Chisel
1250m
1000m
750m
500mVENT RAISES
PRODUCTION SHAFT10
31
3024
20
1
40
21
25
2627
Proposed development
Base metal resource
Gold potential mineralization
12 HudBay Minerals Inc.
Lalor Project

ramp from the Chisel North mine to the Lalor deposit, to enable early access to the base metals ore zone and establish an underground drilling platform in the gold zone. Ramp construction began at the end of 2009, with access to the base metals ore zone expected in 2012.
Development of the ramp will enable early production, which will coincide with the wind- down of operations at Chisel North in 2012, offering a continuous source of zinc feed until Lalor reaches full production in 2014. Other Phase I work at Lalor includes pre-feasibility stage work such as detailed engineering and trade-off studies and locating the ore hoist shaft.
Phase II, scheduled to begin during 2010, provides for the ordering of long-lead items such as ventilation, ore hoists and headframe. Also scheduled are completion of engineering and tradeoff studies that aim to enhance and refine the project design and assumptions. The proven shaft design at the 777 mine is expected to be utilized at Lalor, lessening project development time and reducing design risk.
Phase III, scheduled to commence in 2011, includes the sinking of a shaft, refurbishment of the Snow Lake zinc concentrator and construction of a separate gold circuit at the concentrator in preparation for full production.
The total cost of all three phases is currently estimated at $450 million, which can be funded from HudBay’s current cash balance.
Of HudBay’s $42 million 2010 exploration program, $8 million has been earmarked for Lalor. The copper-gold zone remains open down plunge to the north and west, and further drilling will continue from surface to further define the zone. Infill drilling in the gold zone will also proceed from surface to further define the continuity of the mineralization and to assist with design of the mine plan. The regional drilling program is also being expanded, targeting prospective areas adjacent to the Lalor project.
The combination of location, exploration results and mine development timing attach high strategic significance to Lalor. The property is expected to accelerate HudBay’s zinc production over the next four years and more than double overall gold production. In addition, current exploration data indicate considerable potential for further resource expansion. The property is also ideally located near HudBay’s existing processing facilities and transportation infrastructure in the Snow Lake mining camp. The convergence of these attributes make Lalor an extremely attractive development project and it is now HudBay’s top priority.
“ The Lalor property is also ideally located near HudBay’s existing processing facilities and transportation infrastructure in the Snow Lake mining camp.”
Hwy #393
Hwy #392
Hwy #395
Ore haul road
POWER LINE
3 km15 km to Snow Lake Concentrator
AndersonLake
SnowLake
WekuskaLake
TOWN OFSNOW LAKE
Chisel Pit Mine
Chisel LakeMine
Chisel NorthMine
Photo LakeMine
Snow Lake Concentrator
9.8 million tonnes of ore mined to date
Lalor Deposit
precambrian
volcanics
volcanicsOre
KILOMETRES
0 1
N
The Lalor project is located three kilometers from a nearby haul road and 15 kilometers from the Snow Lake concentrator.
13 2009 Annual Report

Commitment to Exploration
For 2010, HudBay has renewed its commitment to exploration in the Flin Flon Greenstone Belt. Difficult economic conditions in 2008 led to a decrease in 2009 exploration spending for HudBay. Our exploration teams overcame these challenges with success at Lalor that resulted in an updated resource for the base metals zone, a published conceptual estimate for the gold zone discovered in January 2009, and the discovery of a copper-gold zone in September of last year.
To help harness the potential of the Greenstone Belt, HudBay leverages its capabilities and properties by implementing a strategy of partnering with junior mining companies in the region. This strategy gives us access to new properties and encourages the exploration of more land than HudBay would be able to evaluate on its own. An option agreement signed with Halo Resources in late 2009 is an example of this strategy at work. This agreement allows HudBay to earn up to a 67.5% interest in Halo’s Cold and Lost properties in the Sherridon VMS District, about 110 kilometers by road from Flin Flon. If exploration results continue to be successful, this is an opportunity that could quickly be turned into a source of feed for HBMS. Similarly, the discovery of the Reed deposit by VMS Ventures resulted from our strategy of optioning properties to junior mining companies. Exploration of the Reed deposit is expected to be a key component to HudBay’s 2010 exploration plan.
Buoyed by this success, and encouraged by a rebound in metals prices, HudBay has committed nearly $42 million in exploration investment for 2010. Of the total, about $20 million in grassroots exploration will be invested in the Flin Flon Greenstone Belt, where HudBay’s land package totals more than 400,000 hectares. We view the Greenstone Belt as an underexplored region that presents a number of promising opportunities near our existing operations.
Much of the focus will be at Lalor, where $8 million has been committed for exploration in 2010. In-fill drilling in the gold zone is continuing to test the continuity of the mineralization and to assist with mine plan development, along with additional drilling of the copper-gold zone. Regional exploration is being carried out in close proximity to Lalor and near our existing mines in the Greenstone Belt.
(clockwise from left to right): Lalor drill crew, exploration team members at Fenix project.
14 HudBay Minerals Inc.
Exploration
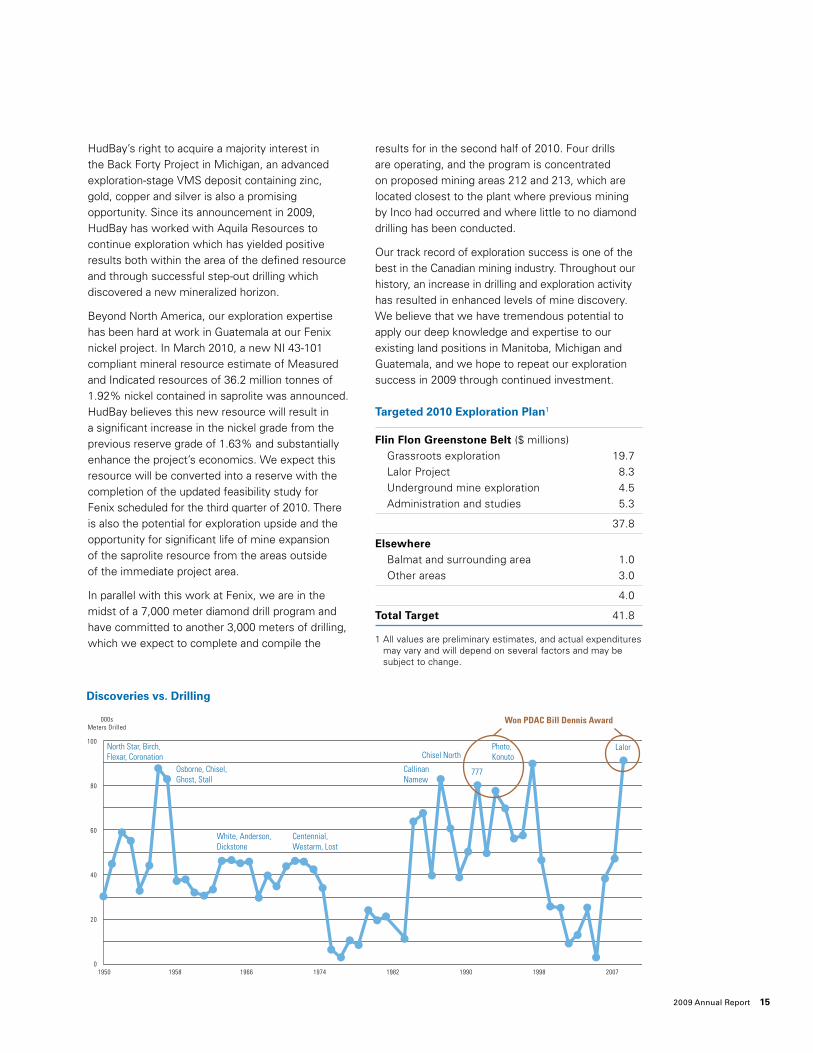
100
80
60
40
20
01950
000s Meters Drilled
1958 1966 1974 1982 1990 1998 2007
North Star, Birch, Flexar, Coronation
Osborne, Chisel, Ghost, Stall
White, Anderson, Dickstone
Centennial, Westarm, Lost
CallinanNamew
Chisel North
777
Photo, Konuto
Lalor
Won PDAC Bill Dennis Award
HudBay’s right to acquire a majority interest in the Back Forty Project in Michigan, an advanced exploration-stage VMS deposit containing zinc, gold, copper and silver is also a promising opportunity. Since its announcement in 2009, HudBay has worked with Aquila Resources to continue exploration which has yielded positive results both within the area of the defined resource and through successful step-out drilling which discovered a new mineralized horizon.
Beyond North America, our exploration expertise has been hard at work in Guatemala at our Fenix nickel project. In March 2010, a new NI 43-101 compliant mineral resource estimate of Measured and Indicated resources of 36.2 million tonnes of 1.92% nickel contained in saprolite was announced. HudBay believes this new resource will result in a significant increase in the nickel grade from the previous reserve grade of 1.63% and substantially enhance the project’s economics. We expect this resource will be converted into a reserve with the completion of the updated feasibility study for Fenix scheduled for the third quarter of 2010. There is also the potential for exploration upside and the opportunity for significant life of mine expansion of the saprolite resource from the areas outside of the immediate project area.
In parallel with this work at Fenix, we are in the midst of a 7,000 meter diamond drill program and have committed to another 3,000 meters of drilling, which we expect to complete and compile the
results for in the second half of 2010. Four drills are operating, and the program is concentrated on proposed mining areas 212 and 213, which are located closest to the plant where previous mining by Inco had occurred and where little to no diamond drilling has been conducted.
Our track record of exploration success is one of the best in the Canadian mining industry. Throughout our history, an increase in drilling and exploration activity has resulted in enhanced levels of mine discovery. We believe that we have tremendous potential to apply our deep knowledge and expertise to our existing land positions in Manitoba, Michigan and Guatemala, and we hope to repeat our exploration success in 2009 through continued investment.
Targeted 2010 Exploration Plan1
Flin Flon Greenstone Belt ($ millions) Grassroots exploration 19.7 Lalor Project 8.3 Underground mine exploration 4.5 Administration and studies 5.3
37.8
Elsewhere Balmat and surrounding area 1.0 Other areas 3.0
4.0
Total Target 41.8
1 All values are preliminary estimates, and actual expenditures may vary and will depend on several factors and may be subject to change.
discoveries vs. drilling
15 2009 Annual Report
2009 Financial Review
march 3, 2010
Unless the context otherwise suggests, references to “we”, “us”, “our” and similar terms, as well as references to “HudBay” or the “Company”, refer to HudBay Minerals Inc. and its subsidiaries. “HBMS” refers to Hudson Bay Mining and Smelting Co., Limited.
This Management’s Discussion and Analysis (“MD&A”) dated March 3, 2010 should be read in conjunction with the Company’s audited consolidated financial statements and related notes for the year ended December 31, 2009, which have been prepared in accordance with Canadian generally accepted accounting principles (“GAAP”). Additional information regarding the Company, including its most recent Annual Information Form (“AIF”), is available on SEDAR at www.sedar.com. All figures are in Canadian dollars unless otherwise noted.
management’s discussion and analysis
17 Our Business and Strategy 18 2009 Results Summary 19 Key Financial and Production Results 20 Recent Developments 24 Outlook 26 Commodity Markets 27 Sensitivity Analysis 28 Financial Review 36 Trend Analysis and Quarterly Review 37 Financial Condition,
Cash Flows, Liquidity and Capital Resources
40 Contractual Obligations and Commitments 41 Critical Accounting Estimates 43 Risk Management
Consolidated Financial Statements
69 Auditors’ Report 70 Consolidated Financial Statements 74 Notes to Consolidated Financial Statements
44 Environment, Health and Safety
45 Operations Overview52 Estimated Mineral Reserves
and Exploration53 Outstanding Share Data53 Adoption of New
Accounting Standards57 Disclosure Controls
and Procedures58 Non-GAAP Measures60 Risks, Uncertainties
and Other Information68 Forward-Looking
Information68 Documents Incorporated
by Reference
16 HudBay Minerals Inc.
Our Business
HudBay (TSX: HBM) is a Canadian‑based, integrated base metals mining, metallurgical processing and refining company with assets in North and Central America. We own zinc and copper mines, concentrators and metal production facilities in northern Manitoba and Saskatchewan, a zinc oxide production facility in Ontario, a copper refinery in Michigan and a nickel project in Guatemala. In addition to our primary products, zinc and copper, we also produce gold, silver and zinc oxide. Our objective is to increase shareholder value through efficient operations, organic growth and accretive acquisitions, while maintaining our financial strength.
Unless the context otherwise suggests, references to “HudBay” or the “Company” or “we”, “us”, “our” or similar terms refer to HudBay Minerals Inc. and its subsidiaries. “HBMS” refers to Hudson Bay Mining and Smelting Co., Limited, “WPCR” refers to the White Pine Copper Refinery Inc. and “HMI Nickel” refers to HMI Nickel Inc., all wholly owned subsidiaries of HudBay. “CGN” refers to Compañía Guatemalteca de Níquel, S.A., a 98.2%‑owned subsidiary, held indirectly through HMI Nickel.
Strategy
On June 19, 2009, following a strategic review of HudBay and our operations by management and the new board of directors, we announced the key elements of our strategic plan. Our strategy pursues two broad themes. First, we intend to optimize operations and grow our principal operating platform in northern Manitoba. This strategy includes aggressively pursuing development of the Lalor project, a zinc, gold and copper deposit located near Snow Lake, Manitoba (“Lalor Project” or “Lalor”), closing the Flin Flon copper smelter by July 1, 2010, reopening the Chisel North mine and continuing exploration in the Flin Flon Greenstone Belt.
The second key theme of our strategic plan is to grow beyond our Manitoba base. This includes our Fenix Project in Guatemala and pursuing potential joint venture and acquisition opportunities, such as the Back Forty Project in northern Michigan which we optioned from Aquila Resources Inc. in August 2009.
Our key strategic objectives for 2010 and early 2011 are to:
• Advance the Lalor Project, including additional exploration work to better define the new copper‑gold zone, continuing to drive the ramp from the Chisel North mine to Lalor, completing pre‑feasibility studies to support development of a production shaft and initiating development of the shaft;
• Execute the restart of the Chisel North mine;
• Complete the closure of the Flin Flon copper smelter and WPCR;
• Expand our grassroots exploration program in the Flin Flon Greenstone Belt;
• Update the Fenix Project feasibility study, evaluate financing alternatives for the project and make a decision on restarting construction;
• Advance the Back Forty Project towards completion of a feasibility study and the required permit applications.
While pursuing these objectives, we will continue to monitor the market for opportunities to add to our production base and growth pipeline through joint venture and acquisition opportunities.
17 2009 Financial Review

Management’s Discussion and Analysis
2009 Results Summary
2009 was a year of major change for HudBay and the mining industry. Metal prices and capital market conditions recovered strongly from depressed levels early in the year to buoyant conditions by the end of the year. This was due mainly to continued growth in China and concerted efforts by the world’s major central banks to provide substantial liquidity to financial markets.
In February, our proposed acquisition of Lundin Mining was terminated. In March our previous board of directors and Chief Executive Officer (“CEO”) resigned and our current board was appointed following the resolution of a proxy contest. Management and the new board reviewed our strategic plan and announced a revised plan in June at our annual general meeting.
In August, we entered into a joint venture agreement with Aquila Resources, granting us the option to acquire a majority interest in the Back Forty Project.
We made substantial progress on the Lalor Project in 2009. A revised National Instrument 43‑101 (“NI 43‑101”) compliant resource estimate for the zinc‑rich base metal zone was released. We also released an estimate of the potential gold mineralization and we intersected a new copper‑gold zone through exploration drilling. In addition, our board of directors approved an $85.0 million commitment to Phase 1 of the development of Lalor, including the construction of an access ramp from the Chisel North mine to Lalor.
After placing the Chisel North mine and Snow Lake concentrator on care and maintenance in January 2009 as a result of low zinc prices, we decided to restart these operations in October as a result of the recovery in prices together with a hedging program that was implemented to support the restart.
Operational performance was strong again in 2009. Ore production from HudBay’s 777 mine set a new annual record, and our unit operating costs for mines decreased by 12%. In addition, HudBay maintained our financial strength throughout 2009, ending the year with cash and cash equivalents of $886.8 million and no debt.
18 HudBay Minerals Inc.

Key Financial and Production Results
Financial Condition ($000s) Dec 31, 2009 Dec 31, 2008
Cash, cash equivalents and short‑term investments 886,814 704,668Working capital 949,589 763,677Cash (less debt)1 886,814 700,936Total assets 2,032,267 1,918,353Shareholders’ equity 1,702,349 1,558,700
Three months Three months ended ended Year ended Year ended ($000s except per share and cash cost per pound amounts) Dec 31, 2009 Dec 31, 2008 Dec 31, 2009 Dec 31, 2008
Financial PerformanceRevenue 166,673 178,781 720,722 981,894 Earnings before tax 9,666 24,614 141,902 169,651 Net earnings 7,339 15,819 112,771 73,353 EBITDA2 40,617 46,300 143,773 292,249 Basic and diluted net earnings per share 0.05 0.10 0.73 0.54 Operating cash flow2,3 33,792 38,805 124,843 234,661 Operating cash flow per share2,3 0.22 0.25 0.81 1.73 Cash cost per pound of zinc sold2 US 0.31 US 0.14 US 0.10 US (0.26)
Operating Highlights Production Zinc4 tonnes 28,715 25,943 106,782 125,323 Copper5 tonnes 12,501 18,859 58,551 74,682 Gold5 troy oz. 22,774 30,102 91,357 108,527 Silver5 troy oz. 473,028 702,173 2,006,638 2,293,862 Metal Sold Zinc6 tonnes 29,299 25,807 110,070 126,172 Copper tonnes 8,864 18,272 59,981 77,021 Gold troy oz. 19,342 32,760 94,263 103,511 Silver troy oz. 474,195 667,035 2,185,407 1,870,179
1. Cash and cash equivalents of $886,814 as at December 31, 2009. Cash, cash equivalents and short‑term investments of $704,668 less Senior secured notes and capital leases ($3,321 and $100 respectively) as at December 31, 2008.
2. EBITDA, operating cash flow before changes in non‑cash working capital, operating cash flow per share, and cash cost per pound of zinc sold are considered non‑GAAP measures (refer to page 36 for EBITDA and page 58 for non‑GAAP measures). For the reconciliation of operating cash flow before changes in non‑cash working capital and operating cash flow per share, refer to page 58. For the reconciliation of cash cost per pound of zinc sold, net of by‑product credits, refer to page 59.
3. Before changes in non‑cash working capital.
4. 2008 production includes Balmat payable metal in concentrate shipped.
5. Production excludes recycled spent anode and represents non‑recycled anode production only.
6. Zinc sales include sales to our Zochem facility of 6,168 tonnes in the fourth quarter of 2009. Zochem had sales of 7,275 tonnes of zinc oxide in the fourth quarter.
19 2009 Financial Review

Management’s Discussion and Analysis
Recent Developments
Lalor
On September 22, 2009, we announced new copper and gold drill hole intersections at the Lalor Project. These intersections suggest a new zone of significant copper‑gold rich mineralization, in addition to the previously announced Base Metal Zone and Separate and Contact Gold Zones. We are devoting five drills to further confirm the mineralization at Lalor.
On October 8, 2009, HudBay’s board of directors approved an $85.0 million expenditure for Phase 1 of the development of the Lalor Project. These funds will be used for the construction of an access ramp from the Chisel North mine to the Lalor Project. This ramp will facilitate additional underground exploration of the gold zone and, subject to completion of applicable regulatory approvals, is expected to enable early production of zinc‑rich ore. Construction of the ramp is currently underway, and the progress to February 21, 2010 was a total of 270 meters of rockwork, including 195 meters on the ramp itself, which will have a total length of approximately three kilometers.
Conceptual plans for Phase 2 and Phase 3 development of Lalor include site infrastructure, sinking of a production shaft, development of a critical underground infrastructure, and refurbishment of the existing Snow Lake concentrator. Our preliminary estimate of the total capital cost for all three phases is approximately $450 million.
On October 8, 2009, we released a NI 43‑101 compliant mineral resource estimate for the Lalor Project. The technical report was filed on SEDAR on November 20, 2009. The resource for the zinc rich base metal zones is adequate for pre‑feasibility design of the Lalor Project.
Zinc Rich Base Metal Mineral Resource Estimate
Category Tonnes (millions) Au (g/t) Ag (g/t) Cu (%) Zn (%)
Indicated 12.3 1.6 24.2 0.66 8.70Inferred 5.0 1.4 25.5 0.57 9.39
In addition to the above, we have also updated the mineral interpretation of the separate and contact gold zones which are comprised of five distinct gold lenses. The October 8, 2009 release also provided the potential quantity and grade, expressed as a range, of the potential of gold mineralization at Lalor. The ramp development from Chisel North mine will provide an exploration platform to confirm the continuity of the gold zone.
Gold Zones Potential Mineral Deposit
Zone Tonnes (millions) Au (g/t) Ag (g/t) Cu (%) Zn (%)
21 3.5 – 3.9 4.8 – 6.0 34 – 39 0.5 – 0.7 0.4 – 0.524 0.2 – 0.4 4.1 – 4.6 26 – 32 0.2 – 0.4 1.1 – 1.425 4.6 – 5.0 4.0 – 5.0 33 – 35 0.2 – 0.4 0.2 – 0.426 0.8 – 1.0 3.5 – 4.0 24 – 28 0.4 – 0.5 0.3 – 0.527 1.5 – 1.7 4.4 – 4.8 12 – 16 0.8 – 0.9 0.1 – 0.2
Total 10.6 – 12.0 4.3 – 5.2 30 – 33 0.4 – 0.6 0.3 – 0.4
The Lalor gold zones potential mineral deposit estimate is conceptual in nature and to date there has been insufficient exploration to define a mineral resource compliant with NI 43‑101. It is uncertain if further exploration will result in the target deposit being delineated as a mineral resource. Additional detail may be found in our press release dated October 8, 2009, available at www.sedar.com.
20 HudBay Minerals Inc.

The gold zones conceptual estimate was based on 66 gold mineralized drill holes. Diamond drilling and geological interpretation has identified five stacked mineralized gold zones either in contact with or entirely separate to the zinc rich base metal resource zones, 715 to 1,175 vertical metres below surface. The gold zones vary in east‑west dimension from 75 to 360 metres and in the north south dimension from 150 to 850 metres. Average thickness of the gold zones varies from 4 to 11.5 metres. The gold zones have been drilled at a spacing of 30 to 150 metres by near vertical parent holes from surface or by wedge offsets.
Assays from the gold zones were top cut based on statistical analysis of the data per each zone, where zones 21, 25, 27 were top cut at 30 g/t gold, zone 24 at 17.5 g/t and zone 26 at 25 g/t. Approximately 5% of the gold zone assay population was top cut. Assays from the gold zones were composited across hanging wall to footwall contacts and specific gravity weighted.
Three‑dimensional wireframes capturing each mineralized gold zone were separately created using MineSight resource modelling software. The gold zones conceptual estimate was based on an interpolation plan using inverse distance squared weighted methodology of the specific gravity weighted composites and wireframes with MineSight software.
The mineral resource and gold potential mineral deposits were prepared by Robert Carter, B.Sc. P.Eng, HBMS Senior Mines Analyst under the direct supervision of Kimberley Proctor, B.Sc. P.Geo, HBMS Superintendent Mines Technical Services, both qualified persons within the meaning of NI 43‑101. Ms. Proctor has reviewed and verified the technical information in this MD&A.
The base case pre‑feasibility study for Lalor is ongoing. Over the next six months, we intend to enhance the pre‑feasibility study by conducting a number of engineering and tradeoff studies which will further refine our project design and assumptions. We already have a proven shaft design in the 777 mine, which can be used for Lalor to accelerate project development time and help reduce design risk.
Currently, only the zinc‑rich base metal zones are sufficiently defined to merit inclusion in a feasibility study. Upgrading the gold zones to a NI 43‑101‑compliant measured and indicated resource will only be possible until after underground drilling has taken place. However, we have incorporated the gold zones into our internal evaluations.
Given our plans for accelerated project development, our substantial financial capacity, and the time required to upgrade the gold zones to a category suitable for feasibility‑level mine planning, preparation of a definitive feasibility study for Lalor is not expected to provide significant benefits to the project. Engineering and design work will be focused to ensure that key project decisions on design, scope and implementation are supported by the appropriate level of detail.
Aquila Resources Inc.
On August 6, 2009, we entered into an agreement (the “Agreement”) with Aquila Resources Inc. (“Aquila”) granting us the right to acquire a majority interest in Aquila’s Back Forty Project in Michigan, USA. Under the Agreement, we subscribed for 12,141,051 common shares of Aquila, a 14.9% ownership interest, at a price of $0.1827 per share. We have an option to acquire a 51% ownership interest in the Back Forty Project through the expenditure of US$10,000,000 within three years and the right to further increase our ownership interest to 65% by completing a feasibility study, submitting an application for permitting the Project and making certain option payments. Our interest can be further increased to 75% if the Back Forty Project is put into production and Aquila elects to have us fund their share of development costs.
21 2009 Financial Review

Management’s Discussion and Analysis
Halo Resources Ltd
On December 22, 2009, we entered into an option agreement with Halo Resources Ltd (“Halo”) allowing HudBay to earn up to a 67.5% joint venture interest in Halo’s Cold and Lost properties in the Sherridon VMS District in Manitoba, located approximately 110 kilometers by road from HudBay’s facilities in Flin Flon. We can acquire a 51% interest by making aggregate cash payments to Halo of $800,000 and completing work expenditures on the property of $1.35 million, in each case within the next 2 years. We can increase our interest to 60% by funding and completing a feasibility study within the next four years and paying $2 million in cash to Halo. We may further increase our interest to 67.5% by paying Halo an additional $2.5 million prior to commencement of commercial production. HudBay will act as operator of the joint venture and will purchase all ore produced by the joint venture.
Restart of Chisel North mine and Snow Lake concentrator
On January 9, 2009, we announced that we would place our Chisel North mine and Snow Lake concentrator on care and maintenance as a result of depressed base metals prices. On October 30, 2009 we announced that we would restart the mine and concentrator. Full production is expected to begin in the second quarter of 2010 and continue for approximately two years. In connection with the restart, we entered into a forward sale of approximately 50% of the anticipated zinc production, in compliance with our risk management policy.
Closure of the copper smelter
On June 18, 2009, we announced that we expect to close our Flin Flon copper smelter before July 1, 2010, and the WPCR shortly thereafter. The impact on our future financial results is not expected to be material, as the processing costs from the sale of concentrates are expected to be similar to existing costs. Further, the smelter is part of an integrated complex, and reclamation costs, which have been fully provided for on our balance sheet, will be required to be incurred only when the entire Flin Flon metallurgical complex ultimately shuts down. We anticipate position reductions as a result of the closure to be approximately 225 in Flin Flon and 65 at the WPCR, and have accrued pension termination benefits and a severance provision of approximately $6.1 million corresponding with the estimated contractual obligations upon severance. Actual severance costs may vary significantly from this amount depending on the implementation of employee reductions.
As part of the smelter closure process, we have developed a broader copper concentrate sales strategy which is intended to provide access to opportunities presented in the global copper concentrate market. To help maximize the commercial terms for the sale of copper concentrate, we intend to implement a dual‑track strategy that will see HudBay sell approximately 60 per cent of our anticipated copper concentrate through a contract that is based on benchmark terms for copper smelting and refining. The remainder, approximately 40 per cent of its anticipated copper concentrate production, will be available for sale as opportunities arise. A broad cross section of potential international buyers have expressed strong interest in purchasing the company’s anticipated copper concentrate production and we are confident this strategy will help to maximize sales revenues with an acceptable level of certainty on sales volumes. We expect to execute a contract for the sale of copper concentrate on benchmark terms in the near future.
NCIB
On September 29, 2009, the Toronto Stock Exchange (“TSX”) accepted our application for a normal course issuer bid (“NCIB”). The NCIB provides that we may purchase up to 13,655,000 of our common shares (representing approximately 10% of the public float) during the 12‑month period from October 1, 2009 to September 30, 2010. A maximum number of 379,100 shares may be repurchased during any trading day, representing 25% of the average daily trading volume of our shares on the TSX during the previous six months. The price paid will be the market price at the time of purchase. At December 31, 2009, we had repurchased 599,600 of our common shares, at a cost of $8.0 million.
22 HudBay Minerals Inc.
Lundin
On November 21, 2008, we entered into an arrangement agreement (the “Arrangement Agreement”) with Lundin Mining Corporation (“Lundin”) pursuant to which we would have acquired all of the issued and outstanding common shares of Lundin, subject to satisfaction of certain conditions, on the basis of 0.3919 of a HudBay common share for each Lundin common share. The transaction was to be completed in the first quarter of 2009.
Also on November 21, 2008, we entered into a subscription agreement (the “Subscription Agreement”) with Lundin whereby we agreed to acquire 96,997,492 common shares of Lundin at a price of $1.40 per share in a private placement (the “Private Placement”), with aggregate gross proceeds to Lundin of $135.8 million. The Private Placement was completed on December 11, 2008, and on completion we held 19.9% of the issued and outstanding Lundin common shares.
On January 23, 2009, the Ontario Securities Commission (“OSC”) set aside a decision of the TSX granting conditional approval for the listing of the HudBay common shares to be issued as consideration pursuant to the Arrangement Agreement. The OSC’s decision was that HudBay shareholder approval was required prior to the completion of the transaction contemplated by the Arrangement Agreement.
We entered into a termination agreement providing for the termination of the Arrangement Agreement with Lundin (the “Termination Agreement”) on February 23, 2009 after our board of directors concluded we were unlikely to receive the requisite shareholder approval.
On March 23, 2009, our previous board of directors resigned, and the nominees of SRM Global Master Fund Limited Partnership (“SRM”) were appointed to HudBay’s board. The transition in our board followed the resolution of a proxy contest initiated by SRM in December 2008. In connection with the board transition, Colin K. Benner resigned as interim chief executive officer and Peter R. Jones was appointed chief executive officer. Mr. Benner had replaced Allen J. Palmiere, who resigned as chief executive officer on March 9, 2009.
On May 26, 2009, we sold our stake in Lundin for cash proceeds of approximately $235.7 million, representing a gain of approximately $99.9 million. In connection with the sale, HudBay and Lundin agreed to terminate all continuing rights and obligations under the Termination Agreement, other than a mutual release and a reciprocal standstill covenant that expires February 23, 2010. HudBay and Lundin also agreed to terminate all continuing rights and obligations under the Subscription Agreement and entered into a mutual release in respect of any and all claims connected with or arising from the Subscription Agreement and certain representations and warranties under the Termination Agreement.
Management Changes
On November 12, 2009, we announced that Peter R. Jones would retire as our CEO effective December 31, 2009, and that Michael D. Winship, our President and Chief Operating Officer, had resigned to pursue other opportunities. W. Warren Holmes was appointed Executive Vice Chairman of HudBay and, upon Mr. Jones’ retirement, interim CEO. A search for a permanent CEO is underway.
Exploration
HudBay continues to invest in exploration. Currently five drills are operating at the Lalor Project. One of these drills is conducting infill drilling on the gold zones characterized in the October 8, 2009 news release. Two drills are concentrating efforts on the recent copper‑gold zone intersections as disclosed in the September 22, 2009 news release. Another drill is conducting regional exploration in areas immediate to the Lalor Project, and one drill is currently drilling a shaft pilot hole testing the competency and character of the rock in preparation for development at Lalor. Results will be disclosed as they are compiled and evaluated.
One drill remains operating in Flin Flon, Manitoba, testing near mine geophysical targets and trends and a continual underground exploration program is being carried out at both the Trout Lake and 777 mines.
23 2009 Financial Review

Management’s Discussion and Analysis
Outlook
This outlook includes forward‑looking information about HudBay’s operations and financial expectations that is subject to risks, uncertainties and assumptions. The outlook and financial targets are for 2010 only. The information provided in this section is forward‑looking, based on HudBay’s expectations and outlook and shall be effective only as of the date the targets were originally issued on March 3, 2010. Refer to “Forward‑looking Information” on page 68. The overall outlook, including targets, and our performance is generally subject to various risks and uncertainties which may impact future performance and our achievement of these targets. Refer to “Risks, Uncertainties and Other Information” section in this MD&A.
Current base metal prices have recovered substantially and are substantially higher than average prices in 2009. If these prices and current exchange rates are sustained during 2010 and our production and cost performance are as expected, our operating financial results are likely to improve substantially over 2009 results (excluding the 2009 gain on disposition of our investment in Lundin Mining).
For our sensitivity to metal prices and foreign exchange rates, refer to “Sensitivity Analysis” on page 27.
Material Assumptions
Our 2010 operational and financial performance will be influenced by a number of factors. At the macro‑level, the general performance of the North American and global economies will influence the demand for our products. The realized prices we achieve in the commodity markets significantly affects our performance. Our general expectations regarding prices for metals, electricity, heavy fuel oil and foreign exchange rates are included in the “Commodity Markets” and “Sensitivity Analysis” sections of this MD&A.
2010 Domestic Mine and Mill Production (Contained Metal in Concentrate)
Year ended Dec 31, 2009 2010 Forecast
Zinc (tonnes) 78,722 75,000 – 90,000Copper (tonnes) 48,397 45,000 – 55,000Gold (oz.) 92,201 85,000 – 100,000Silver (oz.) 1,004,624 800,000 – 900,000
Unlike our guidance from 2009 and prior years, which was based on metal produced from the refinery and smelter from both domestic and third‑party concentrates, our 2010 production guidance is based on metal contained in concentrates produced from our concentrators. This change is due to the pending closure of the Flin Flon copper smelter and our emphasis on domestic production rather than a combination of domestic and purchased metal.
In addition to our own concentrates, we expect to process zinc concentrates purchased from others which would contribute to zinc finished metal production. However, we do not plan to process any purchased copper concentrates as the smelter closure is planned for mid‑2010.
2010 Exploration Plan
We plan to increase exploration expenditures for 2010 to $41.8 million. Exploration targets will include programs in the Flin Flon Greenstone Belt, the Fenix nickel project in Guatemala, the Back Forty project in Michigan, Balmat and Chile.
The 2010 exploration plan in the Flin Flon Greenstone Belt will include additional drilling at the Lalor Project and structural re‑interpretations of mines and geophysical targets throughout the belt. We will also continue to explore within operating mines, in an effort to expand mineral reserves and resources.
24 HudBay Minerals Inc.

Targeted 2010 Exploration Plan1
($ millions)
Flin Flon Greenstone Belt Grassroots exploration 19.7 Lalor Project 8.3 Underground mine exploration 4.5 Administration and studies 5.3
37.8
Elsewhere Balmat and surrounding area 1.0 Other areas 3.0
4.0
Total Target 41.8
1. All values are preliminary estimates, and actual expenditures may vary and will depend on several factors and may be subject to change.
Our exploration properties include approximately 400,000 hectares in the prolific Flin Flon Greenstone Belt of Manitoba and Saskatchewan. The Company has also optioned mineral properties to seven other exploration companies as a means to leverage our expenditures in the Flin Flon Greenstone Belt. Four significant option agreements are with VMS Ventures, Murgor Resources, Halo Resources and Troymet Resources. In 2010 we expect to begin exercising back in rights on agreements with Troymet Resources regarding McClarty Lake and with VMS Ventures regarding Reed Lake. We also entered into an agreement with Halo Resources to earn up to a 67.5% interest in Halo’s Cold and Lost deposits near Sherridon, Manitoba.
Beyond the Flin Flon Greenstone Belt, we are planning additional exploration at the Fenix property in Guatemala. An exploration program drill testing new geophysical targets in our 20,000 hectares of exploration lands near Balmat started in 2009 will also continue. At our San Antonio copper project in Chile, we plan to evaluate and drill test geophysical targets in the third quarter of 2010. We are also funding exploration at the Back Forty Project located in northern Michigan pursuant to an agreement with Aquila Resources. We also own the Tom/Jason zinc/lead/silver mineral deposits in the Yukon and zinc exploration properties in southwestern Ontario.
Develop Lalor Project
We first issued a NI 43‑101 compliant resource estimate for Lalor in August 2008. Of the $41.8 million total expenditure planned for exploration in 2010, we plan to spend approximately $8.3 million to conduct diamond drilling of the periphery of Lalor and nearby geophysical anomalies, new geophysical surveys of the area and cementing of existing diamond drill holes in preparation for project development.
2010 Capital Expenditures
In response to weak metal prices, we took steps in 2009 to substantially reduce our capital expenditure budget while ensuring that the production capacity of our existing assets was sustained. Sustaining capital expenditures in 2010 are expected to return to more normal levels as compared to 2009. Our capital program in 2010 is expected to be approximately $207.9 million, consisting of sustaining capital of $101.1 million, expenditures associated with the preparations for future sale of concentrates of $28.0 million, and growth capital of $65.2 million for the Lalor Project and an aggregate of $13.7 million for the Back Forty and Fenix Projects. The growth capital amounts noted here may change materially if project plans change. This capital program will support ongoing strong levels of production from our mines and processing facilities. Refer to “Capital Expenditures” on page 39 for 2009 capital expenditures by mine and processing facility.
25 2009 Financial Review

Management’s Discussion and Analysis
Commodity Markets
In addition to HudBay’s production, financial performance is directly affected by a number of factors including metal prices, foreign exchange rates, and input costs including energy prices. In 2009, metal prices recovered dramatically, offset in part by the appreciation of the Canadian dollar in 2009.
The following market analysis has been developed from various information sources including analyst and industry experts.
Zinc
In 2009, the London Metal Exchange (“LME”) zinc price averaged US$0.75 per pound, increasing over the year from a low of US$0.48 per pound in February to a high of US$1.17 per pound in December. LME zinc inventories grew sharply in 2009, reflecting weakness in end‑use demand for zinc in the major industrialized economies.
The strong recovery in zinc prices has occurred notwithstanding the increase in LME inventories, reflecting strong investor demand for commodity investments during 2009. The recovery in prices has spurred the reopening of zinc production capacity that was suspended during the recession, including our own Chisel North mine. It is likely that continued strong economic growth in China, together with economic recovery in the industrialized world, will be needed to support current zinc prices over the next two years. However, third‑party forecasts for global zinc production highlight the expected closure of a number of major zinc producers starting in 2012 and an absence of new zinc projects to replace the lost production, which suggests a positive medium term outlook for zinc prices.
Copper
As a result of the global economic crisis, global copper consumption declined sharply in the fourth quarter of 2008, leading to substantial increases in LME stockpiles and a sharp decline in the LME price of copper. The LME copper price averaged US$2.34 per pound in 2009, with a range of US$1.38 per pound in January to US$3.33 per pound at the end of 2009.
Copper benefitted from strong demand in China in the first half of 2009, which was evidenced in a substantial draw‑down in the LME inventories that had accumulated in early 2009. LME inventories grew again in the second half of 2009, but the price of copper continued to rise, again due in part to investor demand for commodity investments. As with zinc, copper prices will likely require a continuation of global economic recovery to be sustained at current levels in the shorter term, but medium term supply‑demand fundamentals for copper remain positive assuming continued strong copper demand from China.
Gold
Gold prices averaged US$973 per ounce during 2009. The gold price appreciated sharply in the fourth quarter of 2009, reaching US$1,200 per ounce in early December before closing the year near US$1,100 per ounce. The price of gold has continued to benefit from concerns about the risk of rising inflation as a result of the aggressive monetary response to the global recession from the world’s major central banks.
Silver
Silver prices averaged US$14.65 per ounce during 2009. As with gold, silver prices reached a high of over US$19.00 per ounce in December, ending 2009 at US$16.88 per ounce.
26 HudBay Minerals Inc.

Foreign Exchange
As revenues from our principal products are substantially denominated in US dollars, we are affected by fluctuations in the Canadian/US dollar exchange rate. In general, a stronger Canadian dollar causes our revenue, and therefore earnings to decrease when our US dollar receipts are converted to Canadian dollars, because the majority of our operating costs are denominated in Canadian dollars. In addition, a stronger Canadian dollar may result in foreign exchange losses due to depreciation in the value of US dollar denominated cash balances.
After reaching a low of approximately C$1.30 per US dollar in March of 2009, the Canadian dollar appreciated sharply to near parity with the US dollar in the fourth quarter of 2009. As it was in 2008, the Canadian/US dollar exchange rate in 2009 was closely correlated with the price of commodities such as crude oil and base metals, which are important parts of Canada’s resource‑based economy.
Sensitivity Analysis
Net Earnings Sensitivity
The following table displays the approximate impact of changes in metal prices and exchange rates on HudBay’s 2010 net earnings.
Would change Would change 2010 net 2010 net earnings Change of 10%, earnings by2 per share by1 as represented by:2,3 (C$ million) (C$/share)
Zinc2 lb. US$ 0.08 9.5 0.06 Copper2 lb. US$ 0.28 18.4 0.12 Gold2 troy oz. US$ 100.00 5.4 0.04 Silver2 troy oz. US$ 1.60 1.1 0.01 Exchange Rates3 US$1 to C$ C$ 0.11 37.5 0.24
1. Based on common shares outstanding of 154.0 million.
2. Based on exchange rate of US$1 to C$1.1.
3. Based on metal prices of US$0.80/lb. zinc, US$2.75/lb. copper, US$1,000/oz. gold and $16.00/oz. silver.
27 2009 Financial Review

Management’s Discussion and Analysis
Financial Review
Earnings decreased in the fourth quarter of 2009
For the fourth quarter, net earnings were $7.3 million, reflecting a $8.5 million decrease from the fourth quarter of 2008. For the full year net earnings of $112.8 million reflect a $39.4 million increase from the same period in 2008.
Significant variances affecting the fourth quarter and year‑to‑date earnings compared to the same period in 2008 are as follows:
Three months ended Year ended ($ millions) Dec 31, 2009 Dec 31, 2009
Increase (decrease) in earnings components: Revenues (12.1) (261.2) Expenses Operating 49.7 179.8 Depreciation and amortization (7.3) (12.4) General and administrative (7.9) (13.6) Stock‑based compensation 1.0 7.3 Accretion of asset retirement obligations (0.1) (0.6) Foreign exchange gain/loss (36.2) (60.1) Exploration 1.7 18.0 Interest and other income (4.9) 81.1 Gain/loss on derivative instruments (2.0) (0.3) Asset impairment losses 3.2 30.4 Share of losses of equity investee – 3.9 Future taxes 19.8 47.1 Current taxes (13.4) 20.0
(Decrease) increase in net earnings (8.5) 39.4
Earnings were impacted in the fourth quarter of 2009 as a result of lower sales of our copper cathode and spent anode production and $6.9 million in executive severance costs. At the end of 2009, the Company had excess inventory of approximately 3,800 tonnes of copper. The North American copper cathode market was relatively strong in the second and third quarters of 2009 as a result of strong Chinese demand for scrap copper metal. However, Chinese scrap purchases in the fourth quarter were not a significant factor compared to earlier quarters and domestic demand in North America remained weak, reflecting economic conditions in the U.S. The Company chose not to sell inventory in those market conditions. If those inventories had been sold sat a copper price of $3.10 per pound (being the average realized price for copper during the fourth quarter of 2009), revenues and gross margin from the sale would have been approximately $27 million and $11 million, respectively. We expect to sell the majority of the excess inventory position together with new copper production in the first quarter of 2010.
28 HudBay Minerals Inc.

Revenue decreased in the fourth quarter of 2009
Total revenue for the fourth quarter was $166.7 million; $12.1 million lower than the same quarter last year. For the full year revenue was $720.7 million, $261.2 million lower than the same period in 2008. These variances are due to the following:
Three months ended Year ended (in $ millions) Dec 31, 2009 Dec 31, 2009
Metal prices Higher (lower) zinc prices 23.6 (37.1) Higher (lower) copper prices 57.2 (137.8) Higher gold prices 10.3 12.7 Sales volumes Higher zinc sales volumes 9.0 2.8 Lower copper sales volumes (68.2) (100.5)Lower gold sales volumes (15.2) (10.1)Other (Unfavourable) favourable change in foreign exchange (20.0) 63.2 Lower Balmat concentrate sales 0.5 (20.0) Disposal of interest in CMMSA1 (7.1) (26.1)Other volume and pricing differences (2.2) (8.3)
Decrease in net revenues in 2009 compared to 2008 (12.1) (261.2)
1. During 2009, we disposed of our 50% ownership in Considar Metal Marketing SA Inc. (“CMMSA”). The transaction did not have a material effect on our marketing activities.
Our revenue by significant product types is summarized as follows:
Three months Three months ended ended Year ended Year ended (in $ millions) Dec 31, 2009 Dec 31, 2008 Dec 31, 2009 Dec 31, 2008
Zinc 55.6 34.6 174.2 200.2 Copper 63.9 84.4 351.3 551.5 Gold 21.7 30.3 102.5 93.5 Silver 8.3 7.9 34.5 27.0 Other 17.2 21.6 58.2 109.8
Total revenue 166.7 178.8 720.7 982.0
29 2009 Financial Review
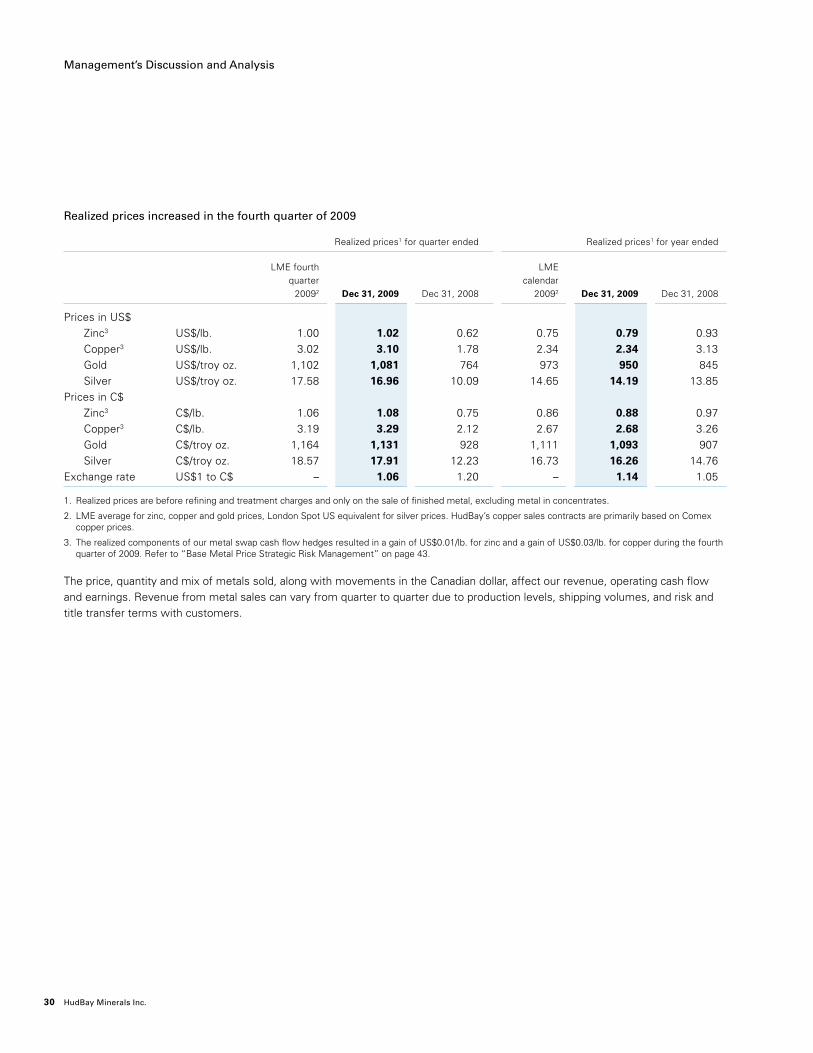
Management’s Discussion and Analysis
Realized prices increased in the fourth quarter of 2009
Realized prices1 for quarter ended Realized prices1 for year ended
LME fourth LME quarter calendar 20092 Dec 31, 2009 Dec 31, 2008 20092 Dec 31, 2009 Dec 31, 2008
Prices in US$ Zinc3 US$/lb. 1.00 1.02 0.62 0.75 0.79 0.93 Copper3 US$/lb. 3.02 3.10 1.78 2.34 2.34 3.13 Gold US$/troy oz. 1,102 1,081 764 973 950 845 Silver US$/troy oz. 17.58 16.96 10.09 14.65 14.19 13.85 Prices in C$ Zinc3 C$/lb. 1.06 1.08 0.75 0.86 0.88 0.97 Copper3 C$/lb. 3.19 3.29 2.12 2.67 2.68 3.26 Gold C$/troy oz. 1,164 1,131 928 1,111 1,093 907 Silver C$/troy oz. 18.57 17.91 12.23 16.73 16.26 14.76 Exchange rate US$1 to C$ – 1.06 1.20 – 1.14 1.05
1. Realized prices are before refining and treatment charges and only on the sale of finished metal, excluding metal in concentrates.
2. LME average for zinc, copper and gold prices, London Spot US equivalent for silver prices. HudBay’s copper sales contracts are primarily based on Comex copper prices.
3. The realized components of our metal swap cash flow hedges resulted in a gain of US$0.01/lb. for zinc and a gain of US$0.03/lb. for copper during the fourth quarter of 2009. Refer to “Base Metal Price Strategic Risk Management” on page 43.
The price, quantity and mix of metals sold, along with movements in the Canadian dollar, affect our revenue, operating cash flow and earnings. Revenue from metal sales can vary from quarter to quarter due to production levels, shipping volumes, and risk and title transfer terms with customers.
30 HudBay Minerals Inc.
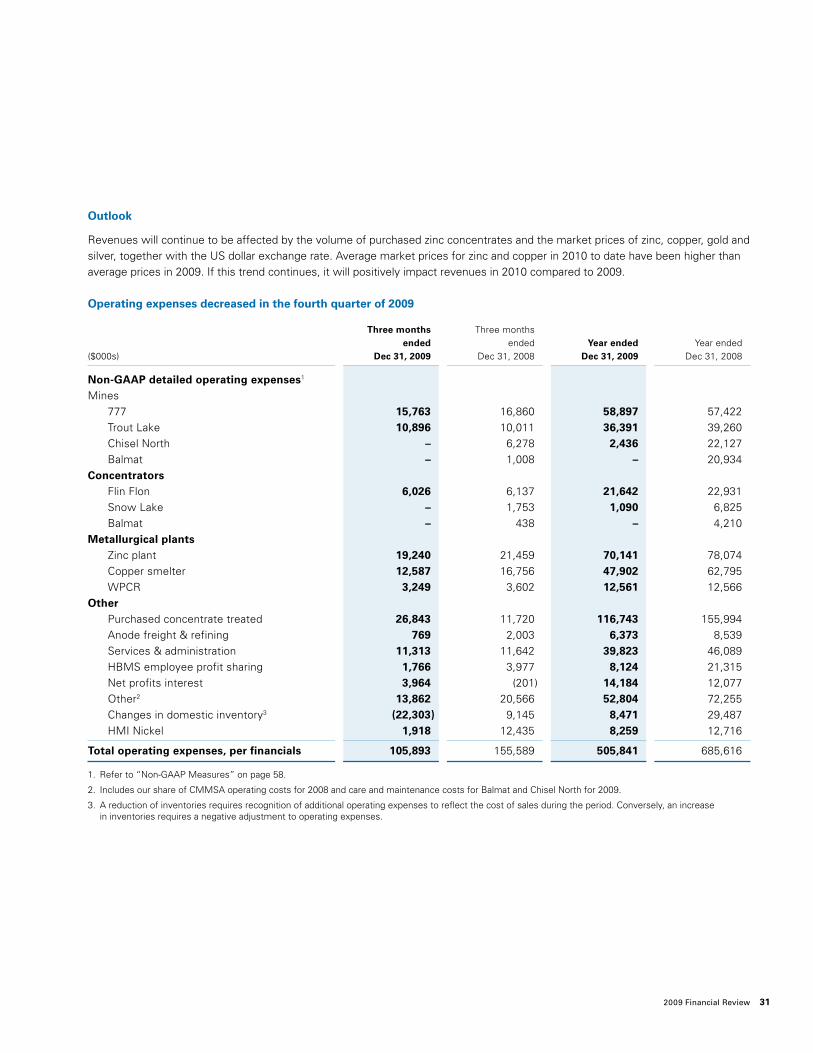
Outlook
Revenues will continue to be affected by the volume of purchased zinc concentrates and the market prices of zinc, copper, gold and silver, together with the US dollar exchange rate. Average market prices for zinc and copper in 2010 to date have been higher than average prices in 2009. If this trend continues, it will positively impact revenues in 2010 compared to 2009.
Operating expenses decreased in the fourth quarter of 2009
Three months Three months ended ended Year ended Year ended ($000s) Dec 31, 2009 Dec 31, 2008 Dec 31, 2009 Dec 31, 2008
Non‑GAAP detailed operating expenses1 Mines 777 15,763 16,860 58,897 57,422 Trout Lake 10,896 10,011 36,391 39,260 Chisel North – 6,278 2,436 22,127 Balmat – 1,008 – 20,934 Concentrators Flin Flon 6,026 6,137 21,642 22,931 Snow Lake – 1,753 1,090 6,825 Balmat – 438 – 4,210 Metallurgical plants Zinc plant 19,240 21,459 70,141 78,074 Copper smelter 12,587 16,756 47,902 62,795 WPCR 3,249 3,602 12,561 12,566 Other Purchased concentrate treated 26,843 11,720 116,743 155,994 Anode freight & refining 769 2,003 6,373 8,539 Services & administration 11,313 11,642 39,823 46,089 HBMS employee profit sharing 1,766 3,977 8,124 21,315 Net profits interest 3,964 (201) 14,184 12,077 Other2 13,862 20,566 52,804 72,255 Changes in domestic inventory3 (22,303) 9,145 8,471 29,487 HMI Nickel 1,918 12,435 8,259 12,716
Total operating expenses, per financials 105,893 155,589 505,841 685,616
1. Refer to “Non‑GAAP Measures” on page 58.
2. Includes our share of CMMSA operating costs for 2008 and care and maintenance costs for Balmat and Chisel North for 2009.
3. A reduction of inventories requires recognition of additional operating expenses to reflect the cost of sales during the period. Conversely, an increase in inventories requires a negative adjustment to operating expenses.
31 2009 Financial Review

Management’s Discussion and Analysis
For the fourth quarter of 2009, our operating expenses were $105.9 million; $49.7 million lower than the same quarter last year. For the full year operating expenses were $505.8 million, $179.8 million lower than the same period in 2008. These variances are due to the following:
Three months ended Year ended (in $ millions) Dec 31, 2009 Dec 31, 2009
Increased volumes of purchased zinc concentrate (19.4) (58.6)Decreased volumes of purchased copper concentrate 34.5 88.8 (Increased) decreased prices of purchased copper concentrate (12.4) 59.8 Decreased (increased) cost of concentrate due to unfavourable exchange rate 5.8 (16.0) Increased provisional pricing on zinc and copper concentrate (17.2) (26.8)Decreased input costs in metallurgical plants 6.7 22.8 Lower costs for HMI Nickel 10.5 4.5 Suspension of Balmat operations 5.8 37.8 Suspension of Chisel North operations 8.1 25.4 Disposal of interest in CMMSA1 6.7 20.7 Higher net profits interest (4.2) (2.1)Lower profit sharing 2.2 13.2 Other operating expenses and changes in volumes 22.6 10.3
Decrease in operating expenses in 2009 compared to 2008 49.7 179.8
1. As noted previously, we disposed of our interest in CMMSA.
Unit Operating Costs
Three months Three months ended ended Year ended Year ended Dec 31, 2009 Dec 31, 2008 Dec 31, 2009 Dec 31, 2008
Mines 777 $/tonne 42.85 45.75 38.24 39.05 Trout Lake $/tonne 67.24 53.37 53.57 50.58 Chisel North1 $/tonne – 76.48 50.02 68.05
Total Mines1 $/tonne 50.31 52.59 43.08 49.01 Concentrators Flin Flon $/tonne 11.04 10.82 9.63 10.16 Snow Lake1 $/tonne – 23.25 22.24 21.49 Metallurgical plants Zinc Plant $/lb. Zn 0.304 0.325 0.298 0.314 Copper Smelter $/lb. Cu 0.457 0.403 0.371 0.381 WPCR US$/lb. Cu 0.129 0.075 0.098 0.074
1. As production at our Chisel North mine was suspended, unit production costs for subsequent periods were not meaningful as a comparative tool and have not been presented. However, these costs are reflected within the weighted average unit costs presented for total mines.
32 HudBay Minerals Inc.

For the fourth quarter, other significant variances for 2009 versus 2008 were:
• Depreciation and amortization increased by $7.3 million, totalling $27.7 million for the fourth quarter of 2009, primarily as a result of increases in rates for operating assets, including accelerated depreciation for the smelter and refinery of approximately $9.0 million in light of the change in the economic life of these assets.
• General and administrative expenses increased by $7.9 million, totalling $16.4 million for the fourth quarter of 2009. General and administrative expense increased mainly due to $6.9 million of severance costs for key management employees.
• Stock‑based compensation decreased by $1.0 million to $1.2 million in the fourth quarter of 2009; no annual grant of options was issued in 2009, whereas an annual grant of options was issued in the first quarter of 2008. We expect to resume annual grants of stock‑based compensation to employees in 2010.
• Foreign exchange loss changed by $36.2 million to a loss of $1.4 million in the fourth quarter of 2009. Foreign exchange loss represents changes in the Canadian dollar value of our foreign currency denominated operating accounts (including certain cash, cash equivalents and short‑term investments, accounts receivable, accounts payable and derivatives) in response to changes in the value of the Canadian dollar relative to foreign currencies over the period. Our foreign currency denominated operating accounts are held primarily in US dollars; small amounts are held in Guatemalan quetzals. The value of the Canadian dollar relative to the US dollar increased over the fourth quarter of 2009, with exchange rates moving from $1.07 as at September 30, 2009 to $1.05 as at December 31, 2009, resulting in a foreign exchange loss of $1.4 million in the fourth quarter of 2009. Over the same period in the prior year, the value of the Canadian dollar decreased, with exchange rates moving from $1.06 as at September 30, 2008 to $1.22 as at December 31, 2008, which resulted in a foreign exchange gain of $34.8 million in the fourth quarter of 2008.
• Exploration expenses decreased by $1.7 million to $4.0 million for the fourth quarter of 2009 compared to $5.7 million in the fourth quarter of 2008. Refer to “Capital Expenditures” on page 39 for information on capitalized exploration expenditures.
• Interest and other income decreased earnings before tax by $4.9 million. Interest income was lower in the fourth quarter of 2009 due to lower interest rates.
• Asset impairment losses decreased by $30.4 million during the fourth quarter of 2009 because the Company did not record asset impairment losses compared to $30.4 million in 2008 arising from the write off of the Balmat assets.
For the year to date, other significant variances for 2009 versus 2008 were:
• Depreciation and amortization increased by $12.4 million, totalling $100.7 million for the full year 2009. Decreases of $8.9 million and $6.6 million from the suspension of our Balmat operations and Chisel North operations respectively were more than offset by increases in rates for operating assets, including accelerated depreciation for the smelter and refinery of approximately $22.0 million in light of the change in the economic life of these assets.
• General and administrative expenses increased by $13.6 million, totalling $44.2 million for the full year 2009. The increase resulted mainly from approximately $14.5 million for costs in 2009 related to the Lundin transaction, shareholder litigation, proxy solicitation and severance. Approximately $4.7 million of executive retirement and severance costs were included in the operating results of 2008.
• Stock‑based compensation decreased by $7.3 million to $4.7 million for the full year in 2009; no annual grant of options was issued in 2009, whereas an annual grant of options was issued in the first quarter of 2008. In lieu of stock‑based compensation grants for 2009, long‑term incentive cash payments were made to eligible employees in the third quarter of 2009 which increased general and administrative expense and reduced stock‑based compensation expense. We expect to resume annual grants of stock‑based compensation for employees in 2010.
33 2009 Financial Review
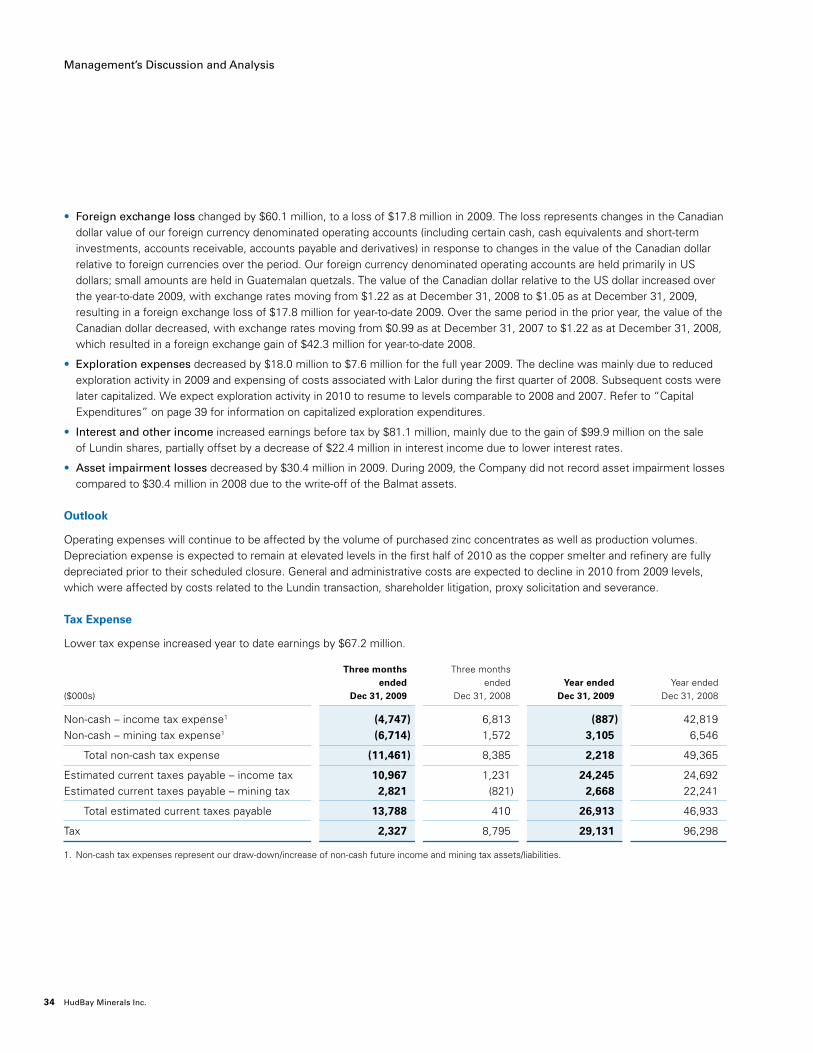
Management’s Discussion and Analysis
• Foreign exchange loss changed by $60.1 million, to a loss of $17.8 million in 2009. The loss represents changes in the Canadian dollar value of our foreign currency denominated operating accounts (including certain cash, cash equivalents and short‑term investments, accounts receivable, accounts payable and derivatives) in response to changes in the value of the Canadian dollar relative to foreign currencies over the period. Our foreign currency denominated operating accounts are held primarily in US dollars; small amounts are held in Guatemalan quetzals. The value of the Canadian dollar relative to the US dollar increased over the year‑to‑date 2009, with exchange rates moving from $1.22 as at December 31, 2008 to $1.05 as at December 31, 2009, resulting in a foreign exchange loss of $17.8 million for year‑to‑date 2009. Over the same period in the prior year, the value of the Canadian dollar decreased, with exchange rates moving from $0.99 as at December 31, 2007 to $1.22 as at December 31, 2008, which resulted in a foreign exchange gain of $42.3 million for year‑to‑date 2008.
• Exploration expenses decreased by $18.0 million to $7.6 million for the full year 2009. The decline was mainly due to reduced exploration activity in 2009 and expensing of costs associated with Lalor during the first quarter of 2008. Subsequent costs were later capitalized. We expect exploration activity in 2010 to resume to levels comparable to 2008 and 2007. Refer to “Capital Expenditures” on page 39 for information on capitalized exploration expenditures.
• Interest and other income increased earnings before tax by $81.1 million, mainly due to the gain of $99.9 million on the sale of Lundin shares, partially offset by a decrease of $22.4 million in interest income due to lower interest rates.
• Asset impairment losses decreased by $30.4 million in 2009. During 2009, the Company did not record asset impairment losses compared to $30.4 million in 2008 due to the write‑off of the Balmat assets.
Outlook
Operating expenses will continue to be affected by the volume of purchased zinc concentrates as well as production volumes. Depreciation expense is expected to remain at elevated levels in the first half of 2010 as the copper smelter and refinery are fully depreciated prior to their scheduled closure. General and administrative costs are expected to decline in 2010 from 2009 levels, which were affected by costs related to the Lundin transaction, shareholder litigation, proxy solicitation and severance.
Tax Expense
Lower tax expense increased year to date earnings by $67.2 million.
Three months Three months ended ended Year ended Year ended ($000s) Dec 31, 2009 Dec 31, 2008 Dec 31, 2009 Dec 31, 2008
Non‑cash – income tax expense1 (4,747) 6,813 (887) 42,819 Non‑cash – mining tax expense1 (6,714) 1,572 3,105 6,546
Total non‑cash tax expense (11,461) 8,385 2,218 49,365
Estimated current taxes payable – income tax 10,967 1,231 24,245 24,692 Estimated current taxes payable – mining tax 2,821 (821) 2,668 22,241
Total estimated current taxes payable 13,788 410 26,913 46,933
Tax 2,327 8,795 29,131 96,298
1. Non‑cash tax expenses represent our draw‑down/increase of non‑cash future income and mining tax assets/liabilities.
34 HudBay Minerals Inc.

Income Tax Expense
The statutory income tax rate decreased from approximately 33% for the full 2008 year to an estimated rate of 31.3% for the full 2009 year as a result of federal and provincial income tax rate reductions. Our effective income tax rate for year‑to‑date 2009 was approximately 16% (fourth quarter – 64%). Significant items causing our year‑to‑date effective income tax rate to be lower than the statutory income tax rate include:
• an effective capital gains tax rate of 16.5% applicable to the gain related to the disposition of Lundin shares; and
• recognition of tax assets of $14.2 million related to previously unrecognized tax deductions.
Significant items partially offsetting the effect of the above noted items include:
• non‑deductible stock based compensation expense of $4.7 million (fourth quarter – $1.2 million); and
• an increase in valuation allowance with respect to expenses incurred by certain foreign operations as well as costs associated with mine closure. These expenses cause temporary differences, which result in a future tax asset and a tax benefit. However, we determined it is not more likely than not that we will realize these future tax assets. Accordingly, we have increased our valuation allowance which offsets the future tax asset and tax benefit recorded. The net effect is an increase to our effective tax rate because we have recorded a loss for accounting purposes but have not recorded a corresponding tax benefit. Our valuation allowance with respect to future income tax assets increased by $7.2 million in 2009 (fourth quarter – increase of $0.8 million).
The fourth quarter income tax rate is higher than the statutory tax rate as a result of non‑deductible items, an increase in the valuation allowance as well as changes in estimate regarding the timing of the reversal of temporary differences. When compared to earnings for the quarter, the magnitude of these adjustments resulted in a higher tax rate.
Mining Tax Expense
The Province of Manitoba announced reductions to its mining tax rate in March 2009 which was substantively enacted in the second quarter. The mining tax rate was reduced to 10%, 15% or 17% from 18% depending on the amount of taxable mining profits. We have accumulated mining tax pools over the years and have recorded the related benefits as future mining tax assets. We consider some additional factors in estimating the required valuation allowance for mining tax assets, primarily because the rate of deductions is more restrictive for mining tax purposes. We review estimates for the valuation allowance each quarter and in so doing, consider uncertainties associated with future long‑term metal prices and foreign exchange rates. The Company’s mining tax valuation allowance provided for future mining tax assets expected to be realized beyond the next three years. We expect to realize our mining tax asset within three years. Consequently, no valuation allowance was recorded as of December 31, 2009. We estimate that the tax rate that will be applicable when temporary differences reverse will be 15% to 17%. During the fourth quarter, we recorded a future tax recovery of $7.2 million related to changes in the estimated tax rate that will be applicable when temporary differences reverse and to changes in our estimate of the valuation allowance. After applying our mining tax pools to current earnings and recording the adjustment of $7.2 million, the future mining tax asset was increased in the quarter by approximately $6.7 million.
Our effective rate for mining taxes was approximately 4.1% (fourth quarter – negative 40.2%) on our year‑to‑date income before tax. For the full 2008 year, mining taxes were approximately 17% on earnings before tax. Effective mining tax rates can vary significantly based on the composition of our earnings.
35 2009 Financial Review

Management’s Discussion and Analysis
EBITDA1
The following table presents our calculation of EBITDA for the three months and years ended December 31, 2009 and December 31, 2008.
Three months Three months ended ended Year ended Year ended ($000s) Dec 31, 2009 Dec 31, 2008 Dec 31, 2009 Dec 31, 2008
Earnings before tax, per financial statements 9,666 24,614 141,902 169,651 Adjustments: Depreciation and amortization 27,653 20,313 100,731 88,295 Exploration 3,994 5,697 7,609 25,583 Interest and other income (1,151) (5,881) (107,386) (26,217) Gain (loss) on derivative instruments 455 (1,639) 917 589 Asset impairment losses – 3,196 – 30,433 Share of losses of equity investee – – – 3,915
EBITDA1 40,617 46,300 143,773 292,249
1. Refer to “Non‑GAAP Measures” on page 58.
Trend Analysis and Quarterly Review
The following table sets forth selected consolidated financial information for each of our eight most recently completed quarters.
2009 2008
($000s) Q4 Q3 Q2 Q1 Q4 Q3 Q2 Q1
Revenue 166,673 194,608 197,657 161,784 178,781 247,441 284,035 271,637 EBITDA1 40,617 59,065 28,598 15,493 46,300 88,633 86,351 70,965 Operating cash flow2 33,792 48,214 28,865 13,972 38,805 54,484 70,721 70,651 Earnings (loss) before tax 9,666 32,811 104,705 (5,280) 24,614 33,898 64,542 46,597 Net earnings (loss) 7,339 19,975 89,415 (3,958) 15,819 2,780 33,202 21,552 Earnings (loss) per share: Basic 0.05 0.13 0.58 (0.03) 0.10 0.02 0.26 0.17 Diluted 0.05 0.13 0.58 (0.03) 0.10 0.02 0.26 0.17
1. EBITDA is considered a non‑GAAP measure (refer to “Non‑GAAP Measures” on page 58).
2. Before changes in non‑cash working capital (refer to “Non‑GAAP Measures” on page 58).
The price, quantity and mix of metals sold, along with movements in the Canadian dollar, affect our revenue, operating cash flow and earnings. Revenue from metal sales can vary from quarter to quarter due to production levels, shipping volumes, and risk and title transfer terms with customers.
Prices for zinc and copper fell dramatically in the fourth quarter of 2008 and have only partially recovered in 2009. As a result, our EBITDA and operating cash flow have declined substantially compared to the levels we enjoyed in 2008. A significant weakening of the Canadian dollar, which occurred at the same time as the decline in metals prices in the fourth quarter of 2008, partially offset this trend.
36 HudBay Minerals Inc.

In the third quarter of 2008, we recorded asset impairment losses on our Balmat mine assets of $27.2 million. In addition, we recorded a foreign exchange gain of $34.8 million in the fourth quarter of 2008. In the second quarter of 2009, we realized a gain of $99.9 million on the disposition of our interest in Lundin.
The following table sets forth selected consolidated financial information for each of the three most recently completed years.
($000s) 2009 2008 2007
Revenue 720,722 981,894 1,269,841 Earnings before tax 141,902 169,651 365,456 Operating cash flow1 124,843 234,661 477,890 Net earnings 112,771 73,353 277,139 Earnings per share: Basic 0.73 0.54 1.79 Diluted 0.73 0.54 1.77 Total assets 2,032,267 1,918,353 1,551,627 Total long‑term financial liabilities2 90,176 102,361 133,622
1. Before changes in non‑cash working capital. Refer to “Non‑GAAP Measures” on page 58.
2. Total long‑term financial liabilities consist of non‑current portions of long‑term debt, pension obligations, other employee future benefits, obligations under capital leases, and fair value of derivative liabilities.
Not including the gain from the sale of our interest in Lundin, our revenue, operating cash flow and earnings in 2008 and 2007 were significantly higher primarily due to higher metal prices and a better economic climate compared to 2009.
Financial Condition, Cash Flows, Liquidity and Capital Resources
Financial Condition at December 31, 2009 compared to Financial Condition as at December 31, 2008
Cash, cash equivalents and short‑term investments of $886.8 million as at December 31, 2009 reflected a $182.1 million increase from December 31, 2008. We have not invested in asset‑backed commercial paper, and our cash equivalents and short‑term investments are held in low‑risk, liquid investments with major Canadian banks. The increase in our cash, cash equivalents and short‑term investments during 2009 was due mainly to the realization of $235.7 million in proceeds from the disposition of our interest in Lundin, offset in part by the reclassification of $48.5 million to restricted cash in order to support letters of credit previously supported by our credit facility, which expired on February 27, 2009. The change in cash balances in 2009 has also been affected by negative changes in non‑cash working capital.
Working capital increased by $185.9 million to $949.6 million from December 31, 2008 to December 31, 2009. In addition to the higher cash, cash equivalents and short‑term investments position, inventory decreased by $15.5 million primarily due to lower volumes of copper and gold finished metals and receivables decreased by $13.9 million primarily due to the mark‑to‑market effect on provisional purchase contracts, due to the steep decline of base metal prices in late 2008. Payables decreased by $23.6 million, which reflected the settlement of project deferral costs of the Fenix Project and payment of Lundin transaction costs, offset by increases in trade payables due to prices and volumes of purchased concentrates. Taxes payable decreased due to timing of payments.
On January 15, 2009, we redeemed our remaining Senior Secured Notes with proceeds from our cash held in trust.
Our credit facility expired on February 27, 2009 and has not been renewed or replaced. We plan to establish a replacement credit facility once credit market conditions are more favourable for borrowers.
37 2009 Financial Review
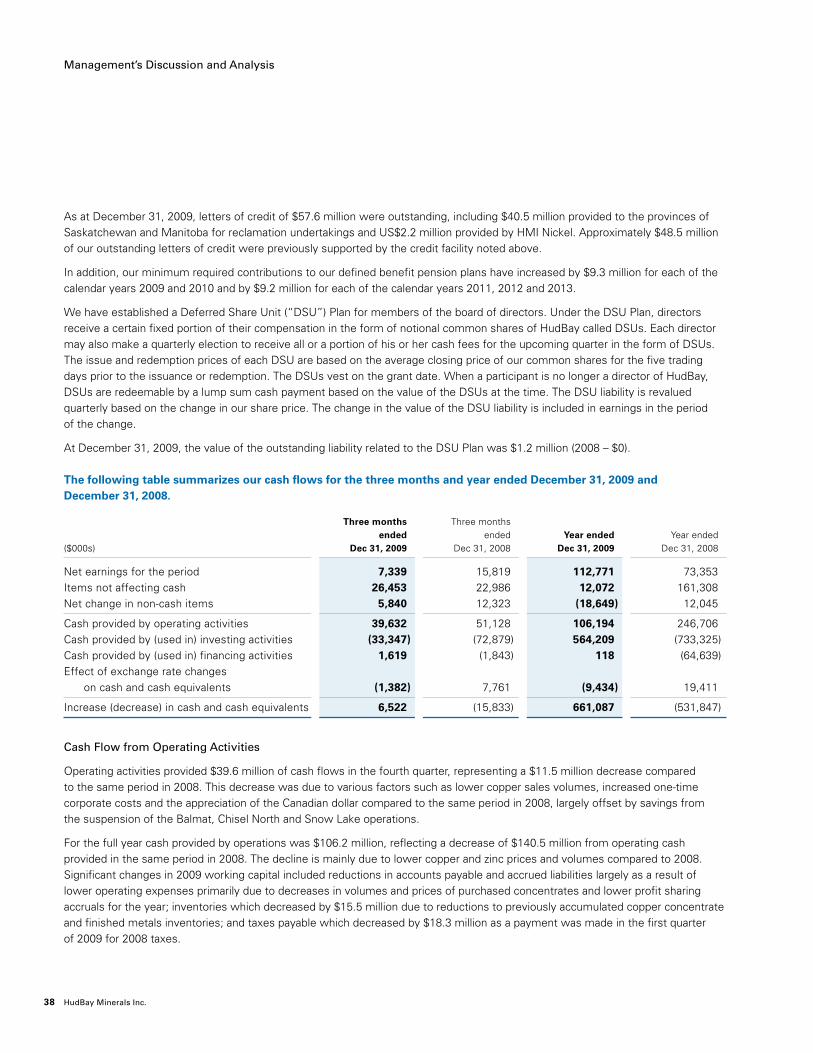
Management’s Discussion and Analysis
As at December 31, 2009, letters of credit of $57.6 million were outstanding, including $40.5 million provided to the provinces of Saskatchewan and Manitoba for reclamation undertakings and US$2.2 million provided by HMI Nickel. Approximately $48.5 million of our outstanding letters of credit were previously supported by the credit facility noted above.
In addition, our minimum required contributions to our defined benefit pension plans have increased by $9.3 million for each of the calendar years 2009 and 2010 and by $9.2 million for each of the calendar years 2011, 2012 and 2013.
We have established a Deferred Share Unit (“DSU”) Plan for members of the board of directors. Under the DSU Plan, directors receive a certain fixed portion of their compensation in the form of notional common shares of HudBay called DSUs. Each director may also make a quarterly election to receive all or a portion of his or her cash fees for the upcoming quarter in the form of DSUs. The issue and redemption prices of each DSU are based on the average closing price of our common shares for the five trading days prior to the issuance or redemption. The DSUs vest on the grant date. When a participant is no longer a director of HudBay, DSUs are redeemable by a lump sum cash payment based on the value of the DSUs at the time. The DSU liability is revalued quarterly based on the change in our share price. The change in the value of the DSU liability is included in earnings in the period of the change.
At December 31, 2009, the value of the outstanding liability related to the DSU Plan was $1.2 million (2008 – $0).
The following table summarizes our cash flows for the three months and year ended December 31, 2009 and December 31, 2008.
Three months Three months ended ended Year ended Year ended ($000s) Dec 31, 2009 Dec 31, 2008 Dec 31, 2009 Dec 31, 2008
Net earnings for the period 7,339 15,819 112,771 73,353 Items not affecting cash 26,453 22,986 12,072 161,308 Net change in non‑cash items 5,840 12,323 (18,649) 12,045
Cash provided by operating activities 39,632 51,128 106,194 246,706 Cash provided by (used in) investing activities (33,347) (72,879) 564,209 (733,325) Cash provided by (used in) financing activities 1,619 (1,843) 118 (64,639) Effect of exchange rate changes on cash and cash equivalents (1,382) 7,761 (9,434) 19,411
Increase (decrease) in cash and cash equivalents 6,522 (15,833) 661,087 (531,847)
Cash Flow from Operating Activities
Operating activities provided $39.6 million of cash flows in the fourth quarter, representing a $11.5 million decrease compared to the same period in 2008. This decrease was due to various factors such as lower copper sales volumes, increased one‑time corporate costs and the appreciation of the Canadian dollar compared to the same period in 2008, largely offset by savings from the suspension of the Balmat, Chisel North and Snow Lake operations.
For the full year cash provided by operations was $106.2 million, reflecting a decrease of $140.5 million from operating cash provided in the same period in 2008. The decline is mainly due to lower copper and zinc prices and volumes compared to 2008. Significant changes in 2009 working capital included reductions in accounts payable and accrued liabilities largely as a result of lower operating expenses primarily due to decreases in volumes and prices of purchased concentrates and lower profit sharing accruals for the year; inventories which decreased by $15.5 million due to reductions to previously accumulated copper concentrate and finished metals inventories; and taxes payable which decreased by $18.3 million as a payment was made in the first quarter of 2009 for 2008 taxes.
38 HudBay Minerals Inc.

Cash Flow from Investing and Financing Activities
During the fourth quarter, our investing and financing activities required cash of $31.7 million, primarily driven by capital expenditures of $38.1 million and the repurchase of common shares of $5 million. In 2008, our fourth quarter cash outflows consisted mainly of capital expenditures of $53.9 million.
For the full year cash provided by investing and financing activities was represented mainly by our $478.9 million net redemptions of short‑term investments in Canadian bankers’ acceptances and proceeds of $235.7 million from the disposition of the investment in Lundin. Partially offsetting the increases in cash were capital expenditures of $101.9 million and the increase of $48.5 million in restricted cash.
Capital Expenditures
The following summarizes cash additions to capital assets:
Three months Three months ended ended Year ended Year ended ($ millions) Dec 31, 2009 Dec 31, 2008 Dec 31, 2009 Dec 31, 2008
Plant and Equipment 9.8 13.9 27.5 40.9 Capital Development 11.0 13.4 38.9 58.8 Capitalized Exploration 7.6 5.2 21.2 18.2 Capitalized Fenix Project 0.1 18.9 14.3 26.8
Total 28.5 51.4 101.9 144.7
Our capital expenditures in the fourth quarter were $22.9 million lower than the same period in 2008, mainly due to reduced Fenix Project capital expenditures. Reduced sustaining capital expenditures were partially offset by capitalized expenditures on our Lalor Project and Fenix Project. The same factors explained a $42.8 million decline in capital expenditures for 2009 compared to 2008.
Three months Three months ended ended Year ended Year ended ($ millions) Dec 31, 2009 Dec 31, 2008 Dec 31, 2009 Dec 31, 2008
777 Mine 5.2 9.4 21.5 26.4 Trout Lake Mine 4.7 7.2 21.9 28.6 Chisel North Mine 1.9 2.5 1.8 8.5 Balmat Mine and Concentrator – – – 10.2 Flin Flon and Snow Lake Concentrators 0.6 0.9 2.1 3.2 Flin Flon and Snow Lake Other 3.1 2.6 5.3 10.8 Zinc Plant 1.0 3.7 4.7 12.2 Copper Smelter & WPCR1 5.0 0.8 10.7 2.9 Other 1.0 1.2 2.0 1.9
Sustaining capital expenditures 22.5 28.3 70.0 104.7
Lalor Project 5.9 4.2 17.6 13.2 Fenix Project2 0.1 18.9 14.3 26.8
Growth capital expenditures 6.0 23.1 31.9 40.0
Total 28.5 51.4 101.9 144.7
1. These amounts in 2009 relate primarily to capital expenditures associated with the preparations for future sales of concentrates.
2. In 2008, Fenix Project expenditures commenced with our acquisition of HMI Nickel on August 26, 2008.
39 2009 Financial Review
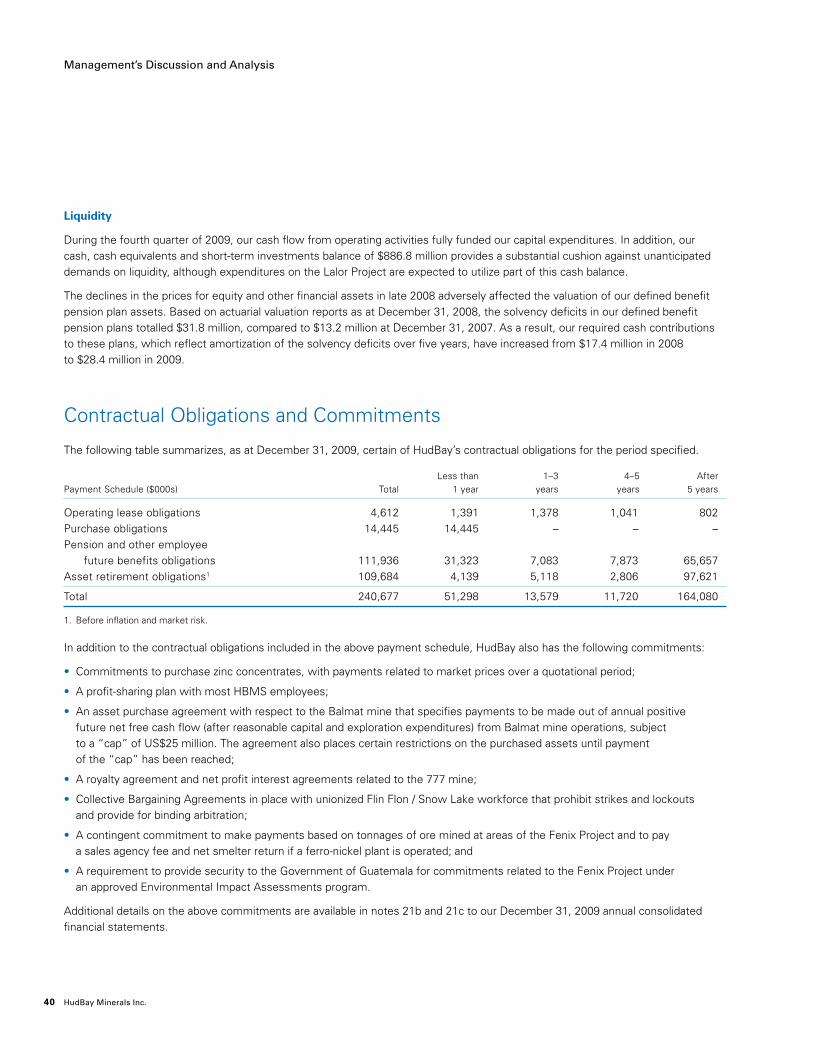
Management’s Discussion and Analysis
Liquidity
During the fourth quarter of 2009, our cash flow from operating activities fully funded our capital expenditures. In addition, our cash, cash equivalents and short‑term investments balance of $886.8 million provides a substantial cushion against unanticipated demands on liquidity, although expenditures on the Lalor Project are expected to utilize part of this cash balance.
The declines in the prices for equity and other financial assets in late 2008 adversely affected the valuation of our defined benefit pension plan assets. Based on actuarial valuation reports as at December 31, 2008, the solvency deficits in our defined benefit pension plans totalled $31.8 million, compared to $13.2 million at December 31, 2007. As a result, our required cash contributions to these plans, which reflect amortization of the solvency deficits over five years, have increased from $17.4 million in 2008 to $28.4 million in 2009.
Contractual Obligations and Commitments
The following table summarizes, as at December 31, 2009, certain of HudBay’s contractual obligations for the period specified.
Less than 1–3 4–5 After Payment Schedule ($000s) Total 1 year years years 5 years
Operating lease obligations 4,612 1,391 1,378 1,041 802 Purchase obligations 14,445 14,445 – – – Pension and other employee future benefits obligations 111,936 31,323 7,083 7,873 65,657 Asset retirement obligations1 109,684 4,139 5,118 2,806 97,621
Total 240,677 51,298 13,579 11,720 164,080
1. Before inflation and market risk.
In addition to the contractual obligations included in the above payment schedule, HudBay also has the following commitments:
• Commitments to purchase zinc concentrates, with payments related to market prices over a quotational period;
• A profit‑sharing plan with most HBMS employees;
• An asset purchase agreement with respect to the Balmat mine that specifies payments to be made out of annual positive future net free cash flow (after reasonable capital and exploration expenditures) from Balmat mine operations, subject to a “cap” of US$25 million. The agreement also places certain restrictions on the purchased assets until payment of the “cap” has been reached;
• A royalty agreement and net profit interest agreements related to the 777 mine;
• Collective Bargaining Agreements in place with unionized Flin Flon / Snow Lake workforce that prohibit strikes and lockouts and provide for binding arbitration;
• A contingent commitment to make payments based on tonnages of ore mined at areas of the Fenix Project and to pay a sales agency fee and net smelter return if a ferro‑nickel plant is operated; and
• A requirement to provide security to the Government of Guatemala for commitments related to the Fenix Project under an approved Environmental Impact Assessments program.
Additional details on the above commitments are available in notes 21b and 21c to our December 31, 2009 annual consolidated financial statements.
40 HudBay Minerals Inc.

Critical Accounting Estimates
The preparation of financial statements in accordance with Canadian GAAP requires management to make estimates and assumptions that affect the reported amount of assets and liabilities and disclosure of contingent assets and liabilities at the date of the consolidated financial statements and the reported amounts of revenues and expenses during the reporting period. Significant areas where management’s judgment is applied include ore reserve determinations used in amortization of certain property, plant and equipment, in‑process inventory quantities and provision for inventory obsolescence, plant and equipment estimated economic lives and salvage values, assessment of impairment, ultimate realization of capitalized exploration costs, fair value of certain assets and liabilities, purchase price allocations, contingent liabilities, future income and mining tax assets and valuation reserves, interpretation of tax legislation, allocation of revenue and costs to non‑Manitoba sourced ore for the purpose of computing Manitoba mining taxes payable, asset retirement obligations, stock‑based compensation, pension obligations and other employee future benefits. Actual results could differ from those estimates by material amounts. These estimates are reviewed at least annually, and changes in estimates are reported in earnings in the period in which they became known.
Mineral Reserves and Resources
HudBay estimates mineral reserves and resources to determine future recoverable mine production based on assessment of geological, engineering and metallurgical analyses, estimates of future production costs, capital costs and reclamation costs, as well as long‑term commodity prices and foreign exchange rates. Capitalized costs of mineral properties and mine development are amortized on a unit‑of‑production basis, based on related proven and probable mineral reserves.
Impairment
We review the carrying value of operating mines and plant and equipment for impairment when events or changes in circumstances indicate that the carrying amounts of related assets may not be recoverable. If total estimated future cash flows on an undiscounted basis are less than the carrying amount of the asset, we measure and record an impairment loss to write down the assets to fair value, which is normally the discounted value of future cash flows. Cash flows include the production of both mineral reserves and a portion of mineral resources based on management’s best estimate of the most probable production profile. Cash flows are also dependent on estimates of future production costs, capital expenditures, salvage values, closure costs, reclamation costs as well as long‑term commodity prices and foreign exchange rates.
In‑process Inventories
In‑process concentrates and metal inventory quantities comprise the majority of our inventories by value and represent materials that are in the process of being converted into saleable product. HudBay measures in‑process inventories based on assays of material received at metallurgical plants and estimates of recoveries in the production processes. We estimate the realizable value of in‑process inventories at financial statement dates and carry inventories at the lower of cost and estimated net realizable value. Where the net realizable value is less than the accumulated costs that have been allocated to that inventory, an impairment charge is reported as part of current period operating costs to reduce the carrying value of the inventory.
41 2009 Financial Review

Management’s Discussion and Analysis
Future Tax Assets and Liabilities
We use the asset and liability method of tax allocation for accounting for income taxes. Future income and mining tax assets and liabilities are determined based on differences between the financial reporting and tax bases of assets and liabilities. Future tax assets and liabilities are measured using substantively enacted tax rates expected to be in effect in the years that differences reverse. These determinations rely on management’s estimate of when temporary differences will reverse, as well as management’s interpretation of tax legislation. Future tax assets are reduced by a valuation allowance if it is more likely than not that some or all of the future tax assets will not be realized. We evaluate the carrying value of future tax assets on a quarterly basis and adjusts the amount of the valuation allowance as necessary.
Factors used to assess the likelihood of realization include forecasts of future taxable income and available tax planning strategies that could be implemented to realize future tax assets.
Asset Retirement Obligations
Asset retirement obligations are estimated based on environmental plans, in compliance with current environmental and regulatory requirements. We estimate and provide for decommissioning costs, and record a corresponding decommissioning asset, when a new mine or plant is placed into commercial production. Accretion expenses are accrued over the life of each associated operating mine or plant, such that at the end of the asset life the provision is equal to the balance estimated to be paid at that date. The decommissioning asset is amortized over the life of the related asset. Judgment is required to determine assumptions including credit adjusted risk‑free rates, expected timing of decommissioning costs, inflationary factors and market risks. Changes in cost estimates result in offsetting changes to the asset and liability and corresponding changes to the associated amortization and accretion rates. In view of the uncertainties concerning these future obligations, the ultimate timing and cost of reclamation and mine closure may differ materially from these estimates.
Pensions and Other Employee Future Benefits
Our post‑retirement obligations relate mainly to ongoing health care benefit plans. Obligations relating to these plans and pension plans are estimated based on actuarial determinations, which incorporate assumptions using management’s best estimates of factors including plan performance, salary escalation, retirement dates of employees and drug cost escalation rates.
Estimates in Determining Fair Value of Assets and Liabilities
We record various financial assets, financial liabilities and derivatives at fair value. Fair values are based on quoted market prices, where available. If market quotes are not available, we use internal valuation models with market‑based or independent information as inputs. These models could produce a fair value that may not be reflective of future fair value.
We separate and record at fair value embedded derivatives related to provisional pricing in concentrate purchase, concentrate sale, anode sale, and certain other sale contracts. Under the terms of these contracts, prices are subject to final adjustment at the end of a future period after title transfers based on quoted market prices during the quotational period specified in the contract. The period between provisional pricing and final pricing is typically up to three months. At each reporting date, provisionally priced metals are marked‑to‑market based on the forward market price for the quotational period stipulated in the contract, with changes in fair value recognized in revenues for sales contracts and in operating expenses for purchase concentrate contracts.
Where financial assets, other than those classified as fair value through earnings, show evidence of impairment, judgment is also required to conclude whether a decline in fair value is other than temporary. In making this assessment for available‑for‑sale investments, management considers the length and extent of a decline in fair value below its cost, the financial condition and environment of the issuer, and our ability and intention to hold the investment until its anticipated recovery.
42 HudBay Minerals Inc.

Purchase Price Allocation
In a purchase of a group of assets, the total purchase price is allocated to the assets acquired and the liabilities assumed based on their fair values at the time of acquisition. In determining these fair values, management must apply judgment in areas including mineral reserves and resources, future cash flows, metal prices, exchange rates and appropriate discount rates. Changes in such estimates and assumptions could result in significant differences in the purchase price allocation.
Stock‑based Compensation
We use the fair value based method to account for the grant of stock options. Under this method, compensation cost attributable to options granted is measured at fair value at the grant date. To determine the fair value of options, we use a Black‑Scholes option pricing model, which relies on estimates of the future risk‑free interest rate, future dividend payments, future stock price volatility and the expected average life of the options.
Risk Management
From time to time we maintain price protection programs and conduct commodity price risk management to reduce risk through the use of financial instruments.
Base Metal Price Strategic Risk Management
Our strategic objective is to provide our investors with exposure to base metal prices, unless a strategic reason exists to implement a hedging arrangement. We may hedge base metal prices from time to time to ensure we will have sufficient cash flow to meet our growth objectives, or to maximize debt capacity (and correspondingly minimize equity dilution) to the extent that third‑party financing may be needed to fund growth initiatives or to manage the risk of putting higher cost operations into production.
In October 2009, we implemented a price protection program for the restart of our Chisel North mine. We entered into zinc commodity swap contracts with an average volume of approximately 2.0 million pounds of zinc per month for the period May 2010 through July 2012, at an average price of approximately $1.01 per pound. This volume represents approximately 50% of the anticipated production from Chisel North. Hedge accounting was applied to these transactions.
For the fourth quarter of 2009, HudBay reclassified pre‑tax net loss of $1.6 million from other comprehensive income (“OCI”) to earnings as hedged anticipated zinc and copper sales occurred. Of the $7.0 million pre‑tax gain in accumulated other comprehensive income at December 31, 2009, losses of $0.4 million will be reclassified to earnings in the next twelve months.
Zinc and Zinc Oxide Customer Risk Management
To provide a service to customers who purchase zinc and zinc oxide from our plants and require known future prices, we enter into fixed price sales contracts. To ensure that we continue to receive a floating or unhedged realized zinc price, we enter into forward zinc purchase contracts that effectively offset the fixed price sales contracts with our customers.
Foreign Exchange Risk Management
In October 2009, we also entered into foreign exchange forwards to hedge anticipated US dollar revenues. We agreed to sell US dollars and purchase C$1.45 million per month for the same period as the zinc swap contracts described above, at an average rate of approximately C$1.07 per US dollar. Hedge accounting was applied to these transactions.
43 2009 Financial Review

Management’s Discussion and Analysis
Environment, Health and Safety
For the fourth quarter, we recorded a lost time accident frequency of 0.2 per 200,000 hours worked, including contractors, compared to 0.7 for the same quarter in 2008. For the full year, we recorded a lost time accident frequency of 0.5, compared to 1.0 for the same period in 2008.
The Environment
There were no significant environmental non‑compliances during the year.
All producing operations have management systems certified to both OHSAS 18001 for occupational health and safety and ISO 14001 for the environment. In addition, the production and supply of HBMS’ final products are registered to the ISO 9001 quality standard.
In the third quarter of 2007, Manitoba Conservation issued a report on its study of surface soils in Flin Flon, Manitoba and Creighton, Saskatchewan. The report identified some sample levels of metal in soils that exceeded Canadian Council of Ministers of the Environment guidelines. Additional assessment to determine if a human health risk exists is ongoing, and the report on the findings of this assessment is anticipated in the spring of 2010.
Addressing Evolving Environmental Regulations
In April 2006, the Canadian federal government issued a notice requiring the preparation and implementation of pollution prevention plans in respect of specified toxic substances released from base metal smelters and refineries. These plans must be fully implemented no later than December 31, 2015. We have prepared the required plan for the Flin Flon metallurgical complex. Annual interim progress reports will be provided to government until the plan is fully implemented.
The notice sets annual air release targets for the specified substances. The greatest emission from HudBay’s operations is sulphur dioxide, primarily from our copper smelter. The air release targets are divided into two phases, with the annual sulphur dioxide emission target for our operations reduced to 187,000 tonnes in 2008, and a further reduction to 33,500 tonnes for 2015.
For 2009, we achieved the target for sulphur dioxide. However, given the lower sulphur dioxide emissions target in 2015, together with other economic challenges, and in the absence of economically viable technological alternatives, we have determined that the copper smelter is no longer economically viable and will cease copper smelter operations by July 1, 2010.
We publish an annual sustainability report that specifies our environmental, health and safety performance. The 2008 report is available on our website at www.hudbayminerals.com.
44 HudBay Minerals Inc.
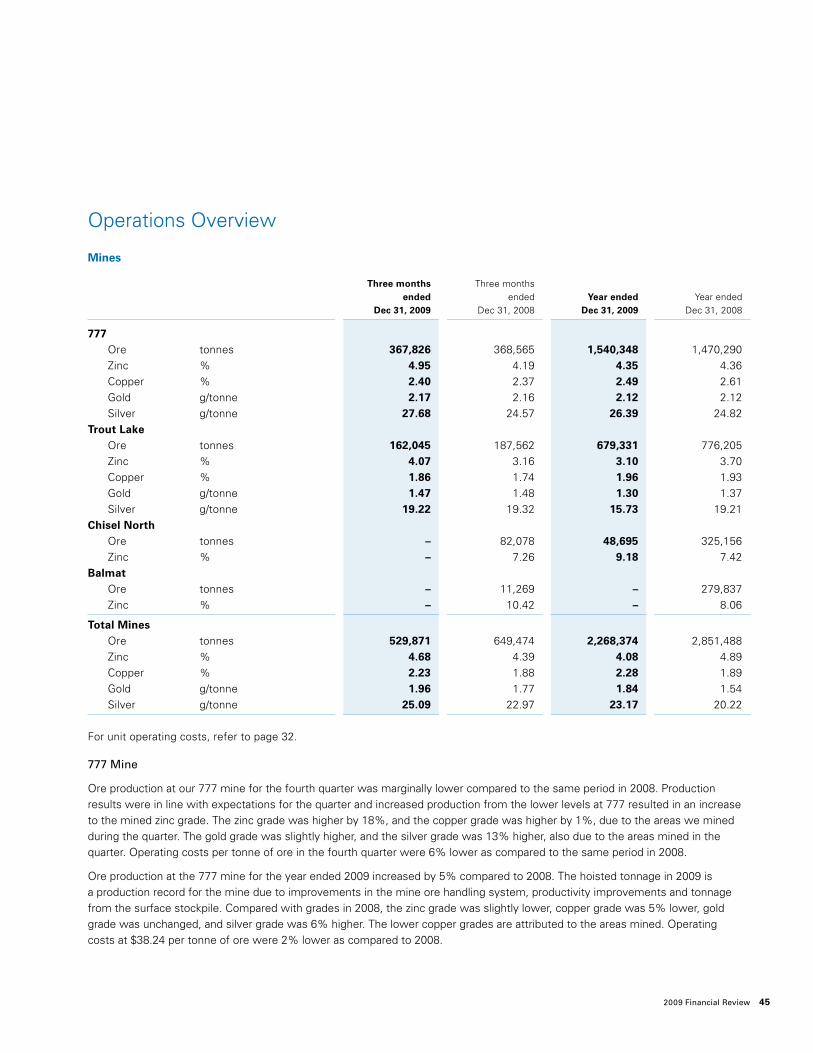
Operations Overview
Mines
Three months Three months ended ended Year ended Year ended Dec 31, 2009 Dec 31, 2008 Dec 31, 2009 Dec 31, 2008
777 Ore tonnes 367,826 368,565 1,540,348 1,470,290 Zinc % 4.95 4.19 4.35 4.36 Copper % 2.40 2.37 2.49 2.61 Gold g/tonne 2.17 2.16 2.12 2.12 Silver g/tonne 27.68 24.57 26.39 24.82 Trout Lake Ore tonnes 162,045 187,562 679,331 776,205 Zinc % 4.07 3.16 3.10 3.70 Copper % 1.86 1.74 1.96 1.93 Gold g/tonne 1.47 1.48 1.30 1.37 Silver g/tonne 19.22 19.32 15.73 19.21 Chisel North Ore tonnes – 82,078 48,695 325,156 Zinc % – 7.26 9.18 7.42 Balmat Ore tonnes – 11,269 – 279,837 Zinc % – 10.42 – 8.06
Total Mines Ore tonnes 529,871 649,474 2,268,374 2,851,488 Zinc % 4.68 4.39 4.08 4.89 Copper % 2.23 1.88 2.28 1.89 Gold g/tonne 1.96 1.77 1.84 1.54 Silver g/tonne 25.09 22.97 23.17 20.22
For unit operating costs, refer to page 32.
777 Mine
Ore production at our 777 mine for the fourth quarter was marginally lower compared to the same period in 2008. Production results were in line with expectations for the quarter and increased production from the lower levels at 777 resulted in an increase to the mined zinc grade. The zinc grade was higher by 18%, and the copper grade was higher by 1%, due to the areas we mined during the quarter. The gold grade was slightly higher, and the silver grade was 13% higher, also due to the areas mined in the quarter. Operating costs per tonne of ore in the fourth quarter were 6% lower as compared to the same period in 2008.
Ore production at the 777 mine for the year ended 2009 increased by 5% compared to 2008. The hoisted tonnage in 2009 is a production record for the mine due to improvements in the mine ore handling system, productivity improvements and tonnage from the surface stockpile. Compared with grades in 2008, the zinc grade was slightly lower, copper grade was 5% lower, gold grade was unchanged, and silver grade was 6% higher. The lower copper grades are attributed to the areas mined. Operating costs at $38.24 per tonne of ore were 2% lower as compared to 2008.
45 2009 Financial Review

Management’s Discussion and Analysis
Trout Lake Mine
Ore production at Trout Lake for the fourth quarter of 2009 was 14% lower as compared to the same quarter in 2008. The decrease in production follows the mine plan for the quarter as production will decline through 2010 and 2011 as the mine reserves are depleted. Going forward, mining tonnage per day will decrease due to a higher percentage of tonnage coming from deeper areas of the mine, smaller, narrower stoping blocks and pillar recovery mining. Zinc grade was 29% higher and copper grade was 7% higher, due to the areas mined during the quarter. With respect to the areas mined, gold and silver grades were marginally lower. Operating costs per tonne of ore were 26% higher as compared to the fourth quarter of 2008, primarily due to the reduced tonnage and higher rehabilitation costs to enter older sections of the mine.
Ore production at Trout Lake decreased by 12% for the year ended 2009 compared to the year ended 2008. This was partly due to the sixteen day production shutdown in July as a cost savings initiative. Zinc grade was 16% lower due to difficulty in mining some pillars in the higher grade zinc areas. Copper grade was 2% higher, gold grade was 5% lower and silver grade was 18% lower. Lower grades are being experienced and dilution has increased due to the narrower ore widths. Improved copper grades are expected as we extract more ore from the Deep West mining zone, along with dilution control initiatives that have been introduced to the mine plan. Operating costs per tonne of ore mined were 6% higher, due to reduced tonnage hoisted and increased ground support and rehabilitation of some of the mining areas.
Chisel North Mine
On October 9, 2009, we announced that we would restart operations at our Chisel North mine in Snow Lake effective immediately, with full production expected in the second quarter of 2010 and would continue for approximately two years. In connection with the restart, HudBay entered into a forward sale of approximately 50% of the anticipated production from Chisel North, in compliance with our risk management policy (Refer to “Base Metal Price Strategic Risk Management” on page 43). In November the mine started a process of re‑manning and restoration to bring the mine to a fully operational state, from care and maintenance. In December, 170.5 metres of lateral development was completed to access new ores for the planned production start.
Balmat Mine
On August 22, 2008, we announced the suspension of operations at our Balmat Mine as a result of lower prices for zinc metal and continued high operating costs. We placed the Balmat operation on care and maintenance and reduced the carrying values of Balmat’s property, plant and equipment to zero in 2008. Operations remained in a care and maintenance state throughout 2009.
46 HudBay Minerals Inc.

Concentrators
Three months Three months ended ended Year ended Year ended Dec 31, 2009 Dec 31, 2008 Dec 31, 2009 Dec 31, 2008
Flin Flon Concentrator Ore tonnes 545,925 567,357 2,248,143 2,255,918 Zinc % 4.61 3.92 3.95 4.17 Copper % 2.22 2.18 2.31 2.38 Gold g/tonne 1.92 1.94 1.86 1.87 Silver g/tonne 24.55 22.89 22.99 22.97 Zinc concentrate tonnes 40,952 36,455 142,647 155,132 Concentrate grade % Zn 51.86 52.11 52.22 52.06 Copper concentrate tonnes 47,219 46,362 197,739 203,525 Concentrate grade % Cu 23.75 24.64 24.47 24.64 Zinc recovery % 84.4 85.5 83.9 85.9 Copper recovery % 92.4 92.5 93.2 93.3 Gold recovery % 66.3 70.3 68.7 75.6 Silver recovery % 57.6 63.1 60.4 64.3 Snow Lake Concentrator Ore tonnes – 75,406 49,006 317,576 Zinc % – 7.15 8.96 7.41 Zinc concentrate tonnes – 10,328 8,646 43,812 Concentrate grade % Zn – 49.86 48.95 51.04 Zinc recovery % – 95.4 96.4 95.0 Balmat Ore tonnes – 13,927 – 281,101 Zinc % – 9.46 – 8.04 Zinc concentrate tonnes – 2,182 – 37,265 Concentrate grade % Zn – 58.51 – 57.27 Zinc recovery % – 93.2 – 94.4
For unit operating costs, refer to page 32.
Flin Flon Concentrator
For the fourth quarter of 2009, ore processed decreased by 4% compared to the same period in 2008. Zinc head grade was 18% higher, and copper head grade was 2% higher. The gold head grade was 1% lower, and the silver head grade was 7% higher. Recovery of zinc to concentrate was 1% lower, while recovery of copper to concentrate was slightly lower than the same period in 2008. Operating cost per tonne of ore processed increased by 2%, primarily related to higher maintenance costs and reduced throughput.
Ore processed for the year ended 2009 is similar to 2008 levels. Zinc head grade in 2009 was 5% lower than last year, while copper head grade was 3% lower, consistent with the ore received from the 777 and Trout Lake mines. Recovery of zinc to concentrate was 2% lower, and copper recovery was slightly lower than the same period in 2008. Operating costs per tonne of ore processed were 5% lower, primarily related to higher costs of grinding media in 2008.
47 2009 Financial Review

Management’s Discussion and Analysis
Snow Lake Concentrator
The Snow Lake concentrator ceased production of zinc concentrate in February 2009 and produced a lead/gold concentrate in March prior to closure. Suspension of operations was completed by the end of May 2009, and the operation was placed under care and maintenance. On October 30, 2009, we announced the restart of the Chisel North mine and concentrator effective immediately. Recommissioning has commenced with power supply and water, to allow pumped water re‑circulation through the tailings line prior to freeze up. A small maintenance crew has started to reconnect the piping throughout the plant and work has started on the concentrator crushing plant. The concentrator is expected to be operational in April 2010 once ore is available from the Chisel North mine.
Balmat Concentrator
As noted above, operations at the Balmat mine were suspended on August 22, 2008, with limited concentrator production during the latter part of 2008. Final concentrates were shipped in the first quarter of 2009.
48 HudBay Minerals Inc.
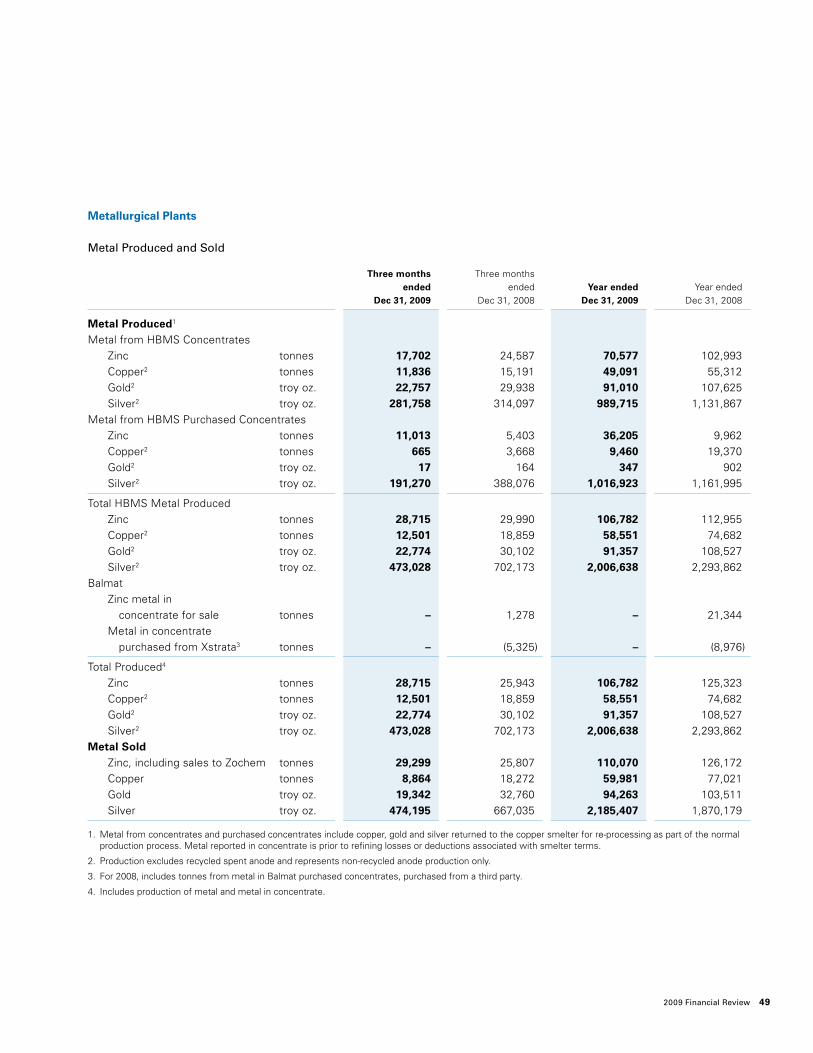
Metallurgical Plants
Metal Produced and Sold
Three months Three months ended ended Year ended Year ended Dec 31, 2009 Dec 31, 2008 Dec 31, 2009 Dec 31, 2008
Metal Produced1 Metal from HBMS Concentrates Zinc tonnes 17,702 24,587 70,577 102,993 Copper2 tonnes 11,836 15,191 49,091 55,312 Gold2 troy oz. 22,757 29,938 91,010 107,625 Silver2 troy oz. 281,758 314,097 989,715 1,131,867 Metal from HBMS Purchased Concentrates Zinc tonnes 11,013 5,403 36,205 9,962 Copper2 tonnes 665 3,668 9,460 19,370 Gold2 troy oz. 17 164 347 902 Silver2 troy oz. 191,270 388,076 1,016,923 1,161,995
Total HBMS Metal Produced Zinc tonnes 28,715 29,990 106,782 112,955 Copper2 tonnes 12,501 18,859 58,551 74,682 Gold2 troy oz. 22,774 30,102 91,357 108,527 Silver2 troy oz. 473,028 702,173 2,006,638 2,293,862 Balmat Zinc metal in concentrate for sale tonnes – 1,278 – 21,344 Metal in concentrate purchased from Xstrata3 tonnes – (5,325) – (8,976)
Total Produced4 Zinc tonnes 28,715 25,943 106,782 125,323 Copper2 tonnes 12,501 18,859 58,551 74,682 Gold2 troy oz. 22,774 30,102 91,357 108,527 Silver2 troy oz. 473,028 702,173 2,006,638 2,293,862 Metal Sold Zinc, including sales to Zochem tonnes 29,299 25,807 110,070 126,172 Copper tonnes 8,864 18,272 59,981 77,021 Gold troy oz. 19,342 32,760 94,263 103,511 Silver troy oz. 474,195 667,035 2,185,407 1,870,179
1. Metal from concentrates and purchased concentrates include copper, gold and silver returned to the copper smelter for re‑processing as part of the normal production process. Metal reported in concentrate is prior to refining losses or deductions associated with smelter terms.
2. Production excludes recycled spent anode and represents non‑recycled anode production only.
3. For 2008, includes tonnes from metal in Balmat purchased concentrates, purchased from a third party.
4. Includes production of metal and metal in concentrate.
49 2009 Financial Review

Management’s Discussion and Analysis
Metal Produced and Sold
Three months Three months ended ended Year ended Year ended Dec 31, 2009 Dec 31, 2008 Dec 31, 2009 Dec 31, 2008
Zinc Plant Zinc Concentrate Treated Domestic tonnes 34,214 49,462 139,312 207,621 Purchased tonnes 20,523 10,610 68,911 19,292
Total tonnes 54,737 60,072 208,223 226,913 Zinc Oxide Zinc from HudBay tonnes 6,168 6,244 20,549 26,155 Zinc from others tonnes – – 6 2,227
Total zinc consumption tonnes 6,168 6,244 20,555 28,382 Zinc oxide produced tonnes 7,532 7,709 25,107 34,705 Zinc oxide sold tonnes 7,275 7,194 25,930 33,982 Smelter Copper concentrate treated Domestic tonnes 52,508 57,982 197,022 233,975 Purchased tonnes 1,680 10,788 27,630 58,962
Total tonnes 54,188 68,770 224,652 292,937 WPCR Anodes received tonnes 12,076 20,118 60,396 84,494 Cathode produced tonnes 9,262 16,422 48,200 68,756 Spent anode produced tonnes 2,924 3,626 11,358 15,224 Liberator anode produced tonnes 341 195 1,091 1,220 Slimes produced tonnes 47 64 197 227
For unit operating costs, refer to page 32.
Zinc Plant
Our Flin Flon, Manitoba zinc plant uses leading‑edge technology to produce special high grade zinc and includes an oxygen plant, a two‑stage pressure leaching plant, a four‑step solution purification, an electrolysis plant and a casting plant.
Production of cast zinc in the fourth quarter of 2009 was 4% lower than the same quarter in 2008. Operating costs per pound of zinc metal produced were 6% lower. The lower production was the result of insufficient concentrate available in 2009 to allow for full production. Unit costs were lower during the fourth quarter of 2009 as a result of lower consumable costs and other cost containment actions.
For the full year of 2009, production was 106,782 tonnes of cast metal, 5% lower than in 2008 due to insufficient concentrate availability. Operating costs per pound were down 5% due to a reduction in materials and maintenance costs.
For the first quarter of 2010, we have entered into agreements to purchase zinc concentrate that, when combined with expected domestic concentrate production, should keep the zinc plant operating near capacity.
50 HudBay Minerals Inc.
Zinc Oxide Facility – Zochem
During the fourth quarter of 2009, Zochem consumed 6,168 tonnes of HBMS zinc and produced 7,532 tonnes of zinc oxide. In comparison to the fourth quarter of 2008, sales volumes increased by 1%, while production levels decreased by 2%. 2009 zinc oxide production was 25,107 tonnes, 28% lower than in 2008.
Copper Smelter
The smelter treats both copper concentrate from HudBay’s own mines and copper concentrate purchased from others. Approximately 3% of the concentrate we treated in the fourth quarter was purchased concentrate, down from 16% for the fourth quarter of 2008. Our main source of purchased concentrate has been from existing settled contracts originally scheduled to extend into 2009. Due to current low market prices for treating copper concentrates, we were not able to obtain favourable economic terms to purchase copper concentrate beyond early 2009 and exercised early termination rights on existing contracts. We have continued to purchase concentrates, priced previously and on favourable terms, from these suppliers in limited amounts during 2009.
In the past, the smelter has recycled copper from WPCR in the form of spent anodes and liberators and we have also sold the anodes to third parties. In light of lower volumes of purchased copper concentrate, we continue to process recycled copper from WPCR when operations allow. Spent copper anode was both sold to third parties and treated in Flin Flon during the fourth quarter.
Our non‑recycled copper production was 34% lower in the fourth quarter of 2009 compared to the same quarter in 2008, primarily due to the lack of economically purchased concentrate. Operating costs per pound of copper anode produced were equivalent to the fourth quarter of 2008.
For the full year, new copper in anode production was 22% lower than 2008, reflecting lower copper concentrate availability. For the full year operating costs per pound of copper were 3% lower in 2009 compared to 2008, primarily due to decreased costs of consumables including heavy fuel oil.
As announced, we expect to close the copper smelter before July 1, 2010 and WPCR shortly thereafter.
White Pine Copper Refinery
The refinery electro‑refines copper anode produced at our Flin Flon smelter into market standard copper cathode. During processing, anode slimes containing precious metals are recovered, dried and sold. Approximately 18% of the copper anode processed at the refinery, called spent anode, is returned to the smelter at Flin Flon for remelting or sold to a third party. We sell LME grade copper cathode to various customers in the business of making wire, tube and brass.
For the fourth quarter of 2009, copper cathode production decreased by 44% compared to the same quarter last year, mainly due to lower anode production. Operating costs per pound of copper cathode were 72% higher, also due to lower production levels.
Copper cathode production for the full year 2009 was 48,200 tonnes, 30% lower than in 2008, mainly due to the lower anode production. Operating costs per pound of copper cathode produced were 32% higher, primarily related to the lower throughput.
51 2009 Financial Review

Management’s Discussion and Analysis
Estimated Mineral Reserves (January 1, 2010)1 – Operating Properties
Tonnes Au (g/t) Ag (g/t) Cu (%) Zn (%)
HBMS 777 Proven 4,492,000 2.12 25.92 3.23 3.76 Probable 9,061,600 2.05 30.18 1.94 4.88 Trout Lake Proven 701,500 1.06 11.97 2.10 3.10 Probable 292,400 1.31 4.57 2.29 2.16 Chisel North Proven 276,500 – – – 8.64 Probable 257,800 – – – 8.06
Total Proven 5,470,000 1.88 22.82 2.92 3.92 Total Probable 9,611,800 1.97 28.59 1.90 4.88
Total Reserves 15,081,800 1.94 26.50 2.27 4.53
1. Diluted, recovered and economically tested.
The above 2010 estimated mineral reserves have been prepared under the supervision of Rob Carter, P.Eng., who is employed by HBMS as Senior Mining Analyst and a Qualified person under NI 43‑101, and Kim Proctor, B.Sc., P.Geo., who is employed by HBMS as Superintendent, Mining Technical Services and a Qualified Person under NI 43‑101.
Mineral reserves associated with the 777 and Trout Lake mines declined in 2009 as a result of depletion from mining. Long term metal prices, including premiums used to determine economic viability of the 2010 mineral reserves were US$1 to C$1.10, US$700/oz. gold, US$12.00/oz. silver, US$2.04/lb. copper and US$0.91/lb. zinc. In addition to the reserves in the above table, there are inferred mineral resources.
The Fenix Project remains on suspension, as published in the Company’s third quarter 2008 results. For full disclosure on the Mineral Reserve and Mineral Resource Statement, please refer to the November 19, 2008 Technical Report as filed on the SEDAR website at www.sedar.com.
Exploration
After two years of a very aggressive exploration program in Canada, we spent approximately $29.0 million on exploration in 2009 (2008 – $45.7 million).
In the fourth quarter of 2009, we continued exploration activities at Lalor and near the 777 mine and Trout Lake mines within the Flin Flon Greenstone Belt, as well as in our operating mines. We also began drill testing targets identified by a VTEM airborne electromagnetic survey in the Balmat area. Total exploration spending in the quarter, including capitalized exploration and amounts against which we recorded investment tax credits, was $11.7 million, compared to $11.2 million in the fourth quarter of 2008. For the full year, spending was $29.0 million, compared to $45.7 million in 2008.
In the Flin Flon Greenstone Belt, exploration activities continued to focus on our Lalor Project zinc discovery. In October 2009, we filed a new NI 43‑101 technical report on the Lalor Project including an estimate of the Indicated Resource of 12.3 million tonnes at a grade of 8.70% Zn, 0.66% Cu, 1.6 g/t Au and 24.2 g/t Ag, and the Inferred Resource of 5.0 million tonnes at a grade of 9.39% Zn, 0.57% Cu, 1.4 g/t Au and 25.5 g/t Ag. Capitalized exploration on the Lalor Project was $5.9 million in the quarter and $17.6 for the full year.
52 HudBay Minerals Inc.

In‑mine exploration in the operating mines represented approximately $0.8 million of our spending in the quarter and $2.4 million for the full year.
Fenix Project Overview
On August 26, 2008, we acquired HMI Nickel. The total purchase price, valued at $448.6 million, was allocated to the assets and liabilities acquired based on their fair values at the acquisition date. $333.0 million was allocated to mineral properties and property, plant and equipment. The fair values determined for the assets and liabilities acquired exceeded the consideration paid. Additional details on the acquisition are available in note 4 to our December 31, 2009 annual consolidated financial statements. HMI Nickel’s principal asset is the Fenix Project, a development stage ferro nickel project in Guatemala, which is owned through a 98.2% ownership interest in CGN.
CGN is a Guatemalan company that holds an exploration license and an exploitation license covering certain nickel properties in eastern Guatemala and also owns a pyrometallurgical nickel processing plant and related facilities that have been closed for approximately 29 years, but continuously maintained over that period. In October 2006, HMI Nickel received a completed feasibility study prepared by Hatch, and other consultants, of CGN’s Fenix Project, a nickel laterite project for a ferro nickel operation. This involved the refurbishment and expansion of the existing process plant to produce approximately 49 million pounds of nickel in a ferro nickel alloy per year, over the first 20 years of production after ramp‑up and an estimated 30 year mine life. An updated technical report on the Fenix Project was issued in September 2007.
Construction on the Fenix Project was initiated in 2008; however, because of the significant deterioration in metal prices and global economic uncertainty in the fall of 2008 construction was suspended in November 2008. Since then, we have continued to advance the Fenix Project through upgrading the road from Rio Dulce to El Estor, maintaining health care and educational initiatives in the local community, developing a revised power strategy for Fenix and an enhanced mine plan for the project.
During 2010, we intend to prepare a revised feasibility study for Fenix, incorporating the revised power strategy and mine plan. We also intend to evaluate financing alternatives for the project. We expect that these initiatives will lead to a decision on restarting construction on the Fenix Project later in 2010.
Outstanding Share Data
As of March 2, 2010, there were 153,925,193 common shares of HudBay issued and outstanding. In addition, options for a maximum aggregate of 4,209,725 common shares were outstanding.
Adoption of New Accounting Standards
For information on our adoption of new accounting standards, refer to notes 3a and 3b of the December 31, 2009 annual consolidated financial statements. Refer to note 3c for information regarding new accounting standards that will be applicable to HudBay in future years.
International Financial Reporting Standards (“IFRS”)
The Canadian Accounting Standards Board has set January 1, 2011 as the date that IFRS will replace existing Canadian GAAP for public companies with fiscal years beginning on or after that date, with comparative figures presented in these financial statements also required to comply with IFRS. Accordingly, our adoption date for IFRS is January 1, 2011, but our effective transition date is January 1, 2010 in order to accommodate IFRS comparative figures in our 2011 financial statements.
53 2009 Financial Review

Management’s Discussion and Analysis
We have engaged external consultants to assist us through this complex transition project, which involves individuals from many aspects of the business, including accounting and finance, tax, information technology, legal, investor relations, logistics and operations. We have conducted workshops and training. We have established a project structure, including a charter and a detailed project plan that includes phases for planning and assessment, design and implementation. The project plan includes activities related to subsidiaries in all jurisdictions. Our project team is providing regular status and informational updates to our IFRS Steering Committee and the Audit Committee of the board of directors.
To date, our IFRS Steering Committee and Audit Committee have reviewed our detailed assessment, which included identifying and prioritizing areas of differences between Canadian GAAP and IFRS. We have identified a dual reporting solution to maintain accounting records in accordance with each of the Canadian GAAP and IFRS for our 2010 transition year, and we have completed high level impact assessments related to key controls, key performance indicators, compensation plans and contracts. We have determined that the majority of our key controls are not expected to change during and after our transition to IFRS. As we make changes to systems and processes, we will address in detail related internal controls.
We have updated and revised our detailed project plan for the design and implementation phases based on our completion of the assessment phase. Our project team is progressing through the design phase, which includes preparing accounting technical papers and analyses, selecting accounting policies, drafting financial statement templates, calculating transition adjustments and designing changes to information technology (“IT”) systems. The design phase will continue into the second quarter of 2010 and will overlap with the beginning of our implementation phase, which includes implementing and testing changes identified in the design phase, making updates as needed to reflect changing standards, drafting the opening balance sheet as at January 1, 2010, drafting quarterly and annual IFRS financial statements for 2010 and reconciling them to our Canadian GAAP financial statements. Throughout the implementation phase, we will deliver training and knowledge transfer at appropriate points. The implementation phase will culminate with the issue of our 2011 IFRS financial statements.
Areas that may result in significant changes to our financial reporting or that require significant efforts include the following:
• IFRS 1, First-time Adoption of International Financial Reporting Standards
IFRS 1 applies when an entity adopts IFRS for the first time and generally requires that we retrospectively apply each standard in effect as at December 31, 2011, the date of our first annual IFRS financial statements, as if we had always applied those standards. However, IFRS 1 provides certain optional exemptions and mandatory exceptions to the principle of retrospective application. Most significant for us is the optional exemption for business combinations. Electing this exemption allows us to avoid retrospectively applying IFRS 3 (2008), Business Combinations, to business combinations prior to January 1, 2010, which would otherwise be a very significant undertaking. This exemption also applies to purchases accounted for as asset acquisitions under Canadian GAAP that would qualify as business combinations under IFRS 3 (2008), which contains a broader definition of a business. Other IFRS 1 exemptions that are applicable to HudBay are described below.
In accordance with the requirements of IFRS 1, First‑time Adoption of International Financial Reporting Standards, we will record transition adjustments where applicable against retained earnings as at January 1, 2010 for differences between our Canadian GAAP and IFRS accounting.
• Property, plant and equipment
IFRS requires depreciation to be calculated separately for individual components of an item of property, plant and equipment that have costs significant in relation to the total cost of the item. Requirements under Canadian GAAP, while similar, are less specific. Accordingly, in practice, IFRS may require more detailed component accounting. Under IFRS, components may be physical or non‑physical, such as costs of major inspections and overhauls. Identification of additional components that have significantly different useful lives from that of the item of property, plant and equipment could result in significant transition adjustments to accumulated depreciation and retained earnings, as well as IFRS adjustments during our 2010 transition year. This topic area
54 HudBay Minerals Inc.

requires significant effort. Our project team is working with staff from operations to analyze components and useful lives of our property, plant and equipment. We are also implementing a new fixed asset subledger, which will accommodate IFRS requirements for property, plant and equipment.
• Exploration for and evaluation of mineral resources
IFRS 6, Exploration for and Evaluation of Mineral Resources, applies to expenditures incurred on properties in the exploration and evaluation (“E&E”) phase, which begins when an entity obtains the legal rights to explore a specific area and ends when the technical feasibility and commercial viability of extracting a mineral resource are demonstrable. IFRS 6 requires entities to select and consistently apply an accounting policy specifying which E&E expenditures are capitalized and which are expensed. Our project team is developing a policy that includes defining the E&E phase and accounting for E&E expenditures. Differences between the IFRS policy selected and our existing Canadian GAAP policy may result in transition adjustments to mineral properties currently or historically in the E&E phase.
• Mine development
Our project team is reviewing our Canadian GAAP policies for capitalizing and amortizing mine development costs against IFRS requirements. As part of this analysis, we are determining whether all types of capitalized costs are directly attributable to bringing the asset to a working condition for its intended use, in accordance with IAS 16, Property, Plant and Equipment. To the extent that our IFRS policies and practices for mine development reflect differences from our existing Canadian GAAP policies and practices, we may require transition adjustments to mine development costs against retained earnings.
• Asset retirement obligations
Under Canadian GAAP, we apply a credit‑adjusted risk‑free rate to measure our asset retirement obligations (“AROs”), and we do not re‑measure AROs as a result of changes in the discount rate. Under IFRS, we will reflect risk in estimated future cash flows and apply a risk‑free rate when measuring our AROs and in subsequent periods we will re‑measure AROs to reflect changes in the discount rate. Differences between historical Canadian GAAP discount rates and current IFRS discount rates could result in significant IFRS transition adjustments.
Under Canadian GAAP, AROs are legal obligations, whereas under IFRS, they encompass legal and constructive obligations; this difference could result in recognition of new obligations on transition to IFRS. Recognition thresholds are also different, as IFRS currently requires recognition of AROs only when it is probable that an outflow of resources will be required, but Canadian GAAP requires recognition of all AROs at fair value regardless of their probability. In addition, there may be differences in interpretations of costs eligible for inclusion in AROs.
Our project team is in the process of analyzing our AROs, including consideration of discount rates, measurement models, recognition of obligations, and eligible costs. We expect to apply the IFRS 1 optional exemption in determining the amount of the ARO to be included in the cost and accumulated depreciation of property, plant and equipment as at January 1, 2010.
• Functional currency
IFRS requirements for determining the functional currency of an entity are more specific than those in Canadian GAAP. Although indicators considered in the determination of functional currency are similar, IFRS also provides a hierarchy for analyzing indicators in which primary factors are based on the currency that mainly influences sales prices for goods and services and labour, material and other costs of providing goods or services. In addition, IFRS requires functional currency to be determined for every entity, whereas Canadian GAAP does not specifically require such determinations to be made for domestic operations. This area requires significant judgment. Our project team is currently determining the functional currency for each of HudBay’s entities.
55 2009 Financial Review

Management’s Discussion and Analysis
• Employee benefits
Under IFRS, past service costs are recognized over the period to vesting, whereas Canadian GAAP allows recognition of past service costs over the expected average remaining service period. As a result, we will record a transition adjustment to charge unamortized past service costs to retained earnings. Further, we expect to elect the IFRS 1 optional exemption to reset unamortized actuarial gains and losses to zero as at January 1, 2010 with an adjustment against retained earnings. We do not anticipate any other adjustments related to employee benefits as at our January 1, 2010 transition date.
IFRS provides a policy choice for ongoing recognition of actuarial gains and losses. Entities may opt to recognize actuarial gains and losses in profit or loss, applying either the corridor method or an approach that results in faster recognition; alternately, entities may recognize actuarial gains and losses immediately in other comprehensive income.
Our project team is currently working on these analyses and finalizing our policy choice for recognizing actuarial gains and losses after transition to IFRS. The transition adjustments described above and the policy choice for ongoing recognition of actuarial gains and losses may also cause ongoing IFRS adjustments during our 2010 transition year.
• Impairment of long lived assets
Canadian GAAP applies a two‑step process for impairment analyses. When indicators of impairment exist for an asset group, we first test the asset group’s recoverability by comparing its carrying value to its undiscounted estimated future cash flows. If we determine the carrying value is not recoverable, we then measure an impairment loss by comparing the carrying value to fair value. In contrast, IFRS applies a one‑step process for impairment analyses. Under IFRS, when indicators of impairment exist for an asset or cash‑generating unit, we test for impairment by comparing the carrying value to the recoverable amount, which is the greater of fair value less costs to sell and value in use (discounted cash flows). As a result, impairments may be recorded more often or earlier under IFRS than under Canadian GAAP. Our project team is currently finalizing our identification of cash‑generating units and assessing indicators of impairment as at our IFRS transition date. We do not anticipate a significant transition adjustment as at January 1, 2010.
• Income taxes
Accounting for income tax under IFRS is addressed under IAS 12, Income Taxes, and differs significantly in many respects from Canadian GAAP. Our project team is currently analyzing the impact of these differences. The adoption of IFRS may have a significant impact on our tax accounting processes both in the year of adoption and in subsequent years.
We are continuing to monitor changing standards to enable us to assess their effect on the IFRS project and update the project plan as required.
As we analyze accounting topics during the design phase, we are developing an IT action plan, including changes to system business units, chart of accounts and financial reports. We are also continuing with the implementation of a new fixed asset subledger, which is in progress.
Accounting, reporting and procedural changes in areas affected by IFRS, including those described above, may also result in changes that will affect internal control over financial reporting (“ICFR”) and disclosure controls and procedures (“DC&P”). As noted above, our IFRS project plan includes the identification of areas where changes will be required to accounting policies, procedures and controls. These changes may result in new or changed controls, and we will evaluate these controls to confirm that the new or revised controls are operating effectively. This evaluation will include ongoing testing of the effectiveness of the operation of the controls.
56 HudBay Minerals Inc.

The IFRS project plan includes DC&P relating to IFRS disclosures in the MD&A as well as the preparation of regular updates to management, the Steering Committee, the Audit Committee and other stakeholders on the project plan progress and on the expected impact that transition to IFRS may have on our financial reporting and disclosure responsibilities. HudBay has a Disclosure Committee whose responsibilities include the designing, establishing and monitoring of controls and other procedures so that information that we are required to disclose is done so on a timely basis and in accordance with regulatory requirements. Our Chief Financial Officer (“CFO”) is a member of both the IFRS Steering Committee and the Disclosure Committee.
As our project progresses toward adoption of IFRS in 2011, we will provide additional insight into the expected impact of the transition to IFRS on our financial reporting, information technology and data systems, internal control over financial reporting, disclosure controls and procedures and business activities. We have not yet determined the financial impact of transition to IFRS on our financial statements.
Disclosure Controls and ProceduresThe Canadian Securities Administrators have issued National Instrument 52‑109, “Certification of Disclosure in Issuers’ Annual and Interim Filings” which requires Canadian public companies to submit annual and interim certificates relating to the design and operation of the disclosure controls and procedures that we use. Disclosure controls and procedures are designed to provide reasonable assurance that all relevant information is gathered and reported on a timely basis to senior management, including the CEO and the CFO, to enable this information to be reviewed and discussed so that appropriate decisions can be made regarding the timely public disclosure of the information.
As of December 31, 2009, management has evaluated the design and the operation of the disclosure controls and procedures as defined by National Instrument 52‑109. This evaluation was performed under the supervision of and with the participation of our CEO and CFO. Based on this evaluation, the CEO and CFO concluded that the design and operation of the disclosure controls and procedures were effective as of December 31, 2009.
Internal Control Over Financial Reporting
National Instrument 52‑109 also requires Canadian public companies to submit an annual certificate relating to the design and effectiveness of internal control over financial reporting (“ICFR”). ICFR is designed to provide reasonable assurance regarding the reliability of financial reporting and the preparation of financial statements for external purposes in accordance with Canadian generally accepted accounting principles. Management is responsible for establishing and maintaining ICFR and management, including the CEO and the CFO, has evaluated the design and effectiveness of ICFR at December 31, 2009. Based on this evaluation, management, with the participation of the CEO and CFO, has concluded that the design and operation of ICFR was effective as of December 31, 2009. We have used the Committee of Sponsoring Organizations of the Treadway Commission (“COSO”) internal control framework to evaluate and operation of ICFR.
Due to its inherent limitations, internal control over financial reporting may not prevent or detect misstatements on a timely basis as such systems can only be designed to provide reasonable as opposed to absolute assurance. Also projections of any evaluation of the effectiveness of ICFR to future periods are subject to the risk that the controls may become inadequate because of changes in conditions, or that the degree of compliance with the policies or procedures may deteriorate.
57 2009 Financial Review

Management’s Discussion and Analysis
Changes in Internal Control over Financial Reporting
National Instrument 52‑109 also requires Canadian public companies to disclose in their MD&A any change in ICFR during the most recent fiscal quarter that has materially affected, or is reasonably likely to materially affect our internal control over financial reporting. There were no changes to ICFR during the quarter ended December 31, 2009 that materially affected the Company’s ICFR. During 2010 and 2011, we intend to implement a new Enterprise Resource Planning (“ERP”) information system. The ERP implementation includes replacing our key financial systems, which could materially affect our internal control over financial reporting. As part of the ERP implementation project we intend to implement processes to ensure that our ICFR remains effective both during and after implementation of the new ERP system.
Non‑GAAP Measures
EBITDA, operating cash flow before changes in non‑cash working capital, operating cash flow per share, detailed operating expenses and cash cost per pound of zinc sold are included in this MD&A because these measures are performance indicators that we use internally to monitor performance. We use these measures to assess how well we are performing compared to plan and to assess the overall effectiveness and efficiency of mining, processing and refining operations. We believe that the inclusion of these measures in the MD&A helps an investor to assess performance “through the eyes of management” and that certain investors use these measures to assess our performance. These measures do not have a meaning presented by GAAP and should not be considered in isolation or as a substitute for measures prepared in accordance with GAAP. These measures are not necessarily indicative of operating profit or cash flow from operations as determined under GAAP. Other companies may calculate these measures differently.
Operating cash flow before changes in non‑cash working capital1 and operating cash flow per share1
The following table presents our calculations of operating cash flow before changes in non‑cash working capital and operating cash flow per share for the three months and year ended December 31, 2009 and December 31, 2008.
Three months Three months ended ended Year ended Year ended ($000s except share and per share amounts) Dec 31, 2009 Dec 31, 2008 Dec 31, 2009 Dec 31, 2008
Cash provided by operating activities, per financial statements 39,632 51,128 106,194 246,706 Adjustments: Changes in non‑cash working capital (5,840) (12,323) 18,649 (12,045)
Operating cash flow before changes in non‑cash working capital1 33,792 38,805 124,843 234,661 Weighted average shares outstanding 153,973,547 153,007,420 153,460,823 135,902,627
Operating cash flow per share1 $ 0.22 $ 0.25 $ 0.81 $ 1.73
1. Refer to “Non‑GAAP measures” above
58 HudBay Minerals Inc.

Cash cost per pound of zinc sold
Our cash cost per pound of zinc sold, net of by‑product credits, for the fourth quarter of 2009 was US$0.31 per pound, excluding costs and sales related to Balmat and HMI Nickel, as calculated in the following table.
Three months Three months ended ended Year ended Year ended ($000s except as noted) Dec 31, 2009 Dec 31, 2008 Dec 31, 2009 Dec 31, 2008
Operating expenses 105,893 155,589 505,841 685,616 General and administrative expenses 16,406 8,483 44,176 30,578
122,299 164,072 550,017 716,194 Exclude amounts related to Balmat and HMI Nickel (5,071) (18,060) (15,318) (51,826)
117,228 146,012 534,699 664,368 Less by‑product credits1 (96,398) (136,393) (505,938) (729,084)
Cash cost net of by‑products 20,830 9,619 28,761 (64,716) Exchange rate (US$1 to C$)2 1.056 1.213 1.142 1.067
Cash cost net of by‑products US 19,725 US 7,930 US 25,185 US (60,652) Zinc sales (000’s lbs.), excluding Balmat 64,593 57,121 240,895 237,534
Cash cost per pound of zinc sold*, net of by‑product credits in US$/lb.3 US 0.31 US 0.14 US 0.10 US (0.26)
* Refer to “Non‑GAAP measures” on page 58.
1. By‑product credits include revenues from sale of copper, gold, silver, the value added by converting zinc to zinc oxide, and by‑product sales.
2. Weighted average exchange rate for sales during the period.
For the fourth quarter, our cash cost per pound of zinc sold was US$0.31, a net increase of US$0.17 from the same period in 2008 and for the year‑to‑date was positive US$0.10, a net increase of US$0.36 from 2008. The increase in cost per pound was due primarily to lower by‑product copper credits arising from lower sales volumes in the fourth quarter and lower prices in the full year, together with higher general and administrative expense in 2009 related to costs of the Lundin transaction, shareholder litigation, proxy solicitation and severance.
Our calculation of cash cost per pound of zinc sold is significantly influenced by by‑product metal prices, which may fluctuate going forward.
59 2009 Financial Review

Management’s Discussion and Analysis
Risks, Uncertainties and Other Information
Market price and demand volatility
Our earnings and financial condition depend upon the market prices of metals, which can fluctuate widely. Metal prices ultimately depend on demand in the end markets for which metals are used. The principal end markets for zinc and copper are the steel and automotive industries and the electrical and electronics industries, respectively. These industries, as well as certain other industries that use zinc or copper, are cyclical in nature. Demand is affected by numerous factors beyond our control, including the overall state of the economy, general level of industrial production, interest rates, the rate of inflation, and the stability of exchange rates, any of which can cause significant fluctuations in zinc and copper prices. Such external economic factors are in turn influenced by changes in international investment patterns, monetary systems and political developments. The price of zinc, copper and other metals has fluctuated widely in recent years and recent declines have had the effect of reducing our profitability and caused us to suspend certain of our operations. In addition, future price declines may materially reduce our profitability and could cause us to reduce output at our operations (including, possibly, closing one or more of our mines or plants), all of which could reduce our cash flow from operations.
Furthermore, significantly decreased commodity prices may require us to revise our mineral reserve calculations and life‑of‑mine plans, which could result in material write downs of our investment in mining properties and increased amortization, reclamation and closure charges. In addition to adversely affecting our mineral reserve estimates and financial condition, declining commodity prices can affect operations by requiring a reassessment of the feasibility of a particular project. Such a reassessment may be the result of a management decision or may be required under financing arrangements related to a particular project. Even if the project is ultimately determined to be economically viable, the need to conduct such a reassessment may cause substantial delays or may interrupt operations until the reassessment can be completed.
We may engage in hedging activities, such as forward sales contracts and commodity put and call option contracts, to minimize the effect of declines in metal prices on our operating results. While these hedging activities may protect us, to some extent, against low metal prices, they may also limit the price we can receive on hedged products. As a result, we may be prevented from realizing possible revenues in the event that the market price of a metal exceeds the price stated in a forward sale or call option contract, which could adversely affect our results of operations.
Foreign Exchange
As our core operations are located in Canada, our costs are incurred primarily in Canadian dollars. However, our revenue is tied to market prices for zinc, copper, and other metals we produce, which are typically denominated in United States dollars. If the Canadian dollar appreciates in value against the United States dollar, our results of operations and financial condition could be materially adversely affected. Although we may use hedging strategies to limit our exposure to currency fluctuations, there can be no assurance that such hedging strategies will be successful or that they will mitigate the risk of such fluctuations.
Mining operations and insurance
Mining operations, including the exploration and development of mineral deposits, generally involve a high degree of risk and are subject to conditions and events beyond our control. Our operations are subject to all the hazards and risks normally encountered in the exploration, development and production of zinc and copper metal including: adverse environmental conditions; industrial accidents; metallurgical and other processing problems; unusual or unexpected rock formations; ground or slope failures; structural cave‑ins or slides; flooding or fires; seismic activity; rock bursts; equipment failures; and periodic interruptions due to inclement or hazardous weather conditions. These risks could result in damage to, or destruction of, mines and other producing facilities, resulting in partial or complete shutdowns, personal injury or death, environmental or other damage to our properties or the properties of others, delays in mining, monetary losses and potential legal liability. Milling operations are subject to hazards such as equipment failure or failure of retaining dams around tailings disposal areas that may result in environmental pollution and consequential liabilities.
60 HudBay Minerals Inc.

Our insurance will not cover all the potential risks associated with our operations. In addition, although certain risks are insurable, we may be unable to maintain insurance to cover these risks at economically feasible premiums. Moreover, insurance against risks such as environmental pollution or other hazards as a result of exploration and production is not generally available to us or to other companies in the mining industry on acceptable terms. We might also become subject to liability for pollution or other hazards that may not be insured against or that we may elect not to insure against because of premium costs or other reasons. Losses from these events may cause us to incur significant costs that could have a material adverse effect upon our financial performance and results of operations.
Sustaining and increasing production levels
Subject to any future expansion or other development, production from existing operations at our mines will typically decline over the life of mine. As a result, our ability to maintain our current production or increase our annual production of base metals and generate revenues therefrom will depend significantly upon our ability to discover or acquire and to successfully bring new mines into production and to expand mineral reserves at existing mines. Exploration and development of mineral properties involves significant financial risk. Very few properties that are explored are later developed into an operating mine. Substantial spending may be made on properties that are abandoned due to poor drilling results or an inability to define mineral reserves.
Developing a property involves many risks and uncertainties. These include establishing mineral reserves by drilling, completion of feasibility studies, obtaining and maintaining various permits, and approvals from governmental authorities, constructing mining and processing facilities, securing required surface or other land rights, finding or generating suitable sources of power and water, confirming the availability and suitability of appropriate local area infrastructure and obtaining adequate financing.
The capital expenditures and timeline needed to develop a new mine are considerable and the economics of and ability to complete a project can be affected by many factors, including: inability to complete construction and related infrastructure in a timely manner, changes in the legal and regulatory environment, currency fluctuations, industrial disputes, unavailability of parts, machinery or operators, delays in the delivery of major process plant equipment, inability to obtain, renew or maintain the necessary permits, licences or approvals, unforeseen natural events, political and other factors. Factors such as changes to technical specifications, failure to enter into agreements with contractors or suppliers in a timely manner, and shortage of capital, may also delay the completion of construction or commencement of production or require the expenditure of additional funds. Any delay in the development of our projects could have a material adverse impact on us. Many major mining projects constructed in the last several years, or under construction currently, have experienced cost overruns that substantially exceeded the capital cost estimated during the basic engineering phase of those projects, sometimes by as much as 50% or more. There can be no assurance that our Lalor and Fenix projects will be able to be successfully or economically developed or that they will not be subject to the development risks described above.
Zinc plant capacity
Production of zinc concentrate from our mines has not been sufficient to operate our zinc plant at full capacity, which has had an impact our profitability. We may attempt to fill the excess capacity at the zinc plant by purchasing concentrate from third parties; however, this is typically less profitable than processing domestic concentrate. The availability of concentrate is influenced by a number of factors, many of which are beyond our control. We may also seek to fill the excess capacity at the zinc plant by bringing new mines into production or expanding current mines, which also involves many risks and uncertainties, including those described above under “Sustaining and increasing production levels”.
61 2009 Financial Review

Management’s Discussion and Analysis
Production, costs and life‑of‑mine estimates
Failure to achieve production, cost or life‑of‑mine estimates could have an adverse impact on our future cash flows, profitability, results of operations and financial condition. Our actual production, costs and the productive life of a mine may vary from estimates for a variety of reasons, including actual ore mined varying from estimates of grade, tonnage, dilution and metallurgical and other characteristics, short‑term operating factors relating to the mineral reserves, such as the need for sequential development of ore bodies and the processing of new or different ore grades, revisions to mine plans, risks and hazards relating to mining and availability of and cost of labour and materials.
Energy prices and availability
Mining operations and facilities are intensive users of electricity and carbon based fuels. Energy prices can be affected by numerous factors beyond our control, including global and regional supply and demand, political and economic conditions, and applicable regulatory regimes. The prices of various sources of energy may increase significantly from current levels. An increase in energy prices could materially adversely affect our results of operations and financial condition. If we proceed with development of the Fenix Project, we will require a significant amount of cost‑efficient energy and any inability to secure such energy may negatively impact our ability to develop the project.
Disruption of transportation
At our mines in northern Manitoba and Saskatchewan, we are dependent upon a single railway and certain short‑line rail networks to transport purchased concentrate to our Flin Flon metallurgical complex and to transport products from the Flin Flon metallurgical complex for further processing or to our customers. In addition, the Fenix Project will require transportation improvements and access, which will require the cooperation of the Guatemalan government. We may have similar dependencies at future mining and processing operations. Inability to secure reliable and cost‑effective transportation, or disruption of these transportation services due to weather‑related problems, strikes, lock‑outs or other events could have a material adverse effect on our operations. If transportation for our products is or becomes unavailable, our ability to market our products could suffer. In addition, increases in our transportation costs relative to those of our competitors could make our operations less competitive and could affect our profitability.
We may not be able to acquire desirable mining assets in the future
One of our strategies is to grow our business by acquiring attractive, quality mining assets. We expect to selectively seek strategic acquisitions in the future. However, there can be no assurance that suitable acquisition opportunities will be identified. Our ability to consummate and to integrate effectively any future acquisitions on terms that are favourable may be limited by the number of attractive acquisition targets, internal demands on our resources, competition from other mining companies and, to the extent necessary, our ability to obtain financing on satisfactory terms, if at all.
Intense competition could reduce our market share or harm our financial performance
The mining industry is intensely competitive and we compete with many companies possessing greater financial and technical resources than us. Since mines have a limited life, we must compete with others who seek mineral reserves through the acquisition of new properties. In addition, we also compete for the technical expertise to find, develop, and operate such properties, the labour to operate the properties, and the capital for the purpose of funding such properties. Many competitors not only explore for and mine base metals, but conduct refining and marketing operations on a global basis. Such competition may result in us being unable to acquire desired properties, to recruit or retain qualified employees or to acquire the capital necessary to fund our operations and develop our properties. We also compete with manufacturers of substitute materials or products for which zinc and copper are typically used. Existing or future competition in the mining industry could materially adversely affect our prospects for mineral exploration and success in the future.
62 HudBay Minerals Inc.

Human Resources
We compete with other mining companies to attract and retain key executives and skilled and experienced employees. The mining industry is labour intensive and our success and ability to pursue our strategic objectives depends to a significant extent on our ability to attract, hire, train and retain qualified executives and employees, including our ability to attract employees with needed skills in the geographic areas in which we operate. In particular, we are currently conducting a search for a new Chief Executive Officer, and our success in hiring and retaining a suitably qualified individual will be key to our ability to achieve our strategic objectives.
We are also dependent on a number of key management and operating personnel, and our ability to manage activities, and hence our success, will depend in large part on the efforts of these individuals and our ability to retain them.
Although the labour stability agreement that is in place at our Flin Flon / Snow Lake operations effectively deals with resolving collective agreements that expire prior to July 1, 2012, effectively assuring no strike or lockout involving employees at these operations through December 2014, there can be no assurance that our business will not suffer from a work stoppage at any location where we operate. From time to time we may temporarily suspend or close certain of our operations and we may incur significant labour costs as a result of a suspension or closure if we are required to give employees notice prior to any layoff or pay severance. Further, temporary suspensions and closures may adversely affect our future access to skilled labour, as employees who are laid off may seek employment elsewhere.
Suspension of Operations
From time to time, we may have to temporarily suspend certain of our operations if they are no longer considered commercially viable. There are a number of factors that may cause our operations to be no longer commercially viable, many of which are beyond our control. These factors include decreases in the price and demand for zinc or copper or the market rates for treatment and refining charges, adverse changes in interest rates or currency exchange rates, increases in concentrate transportation costs, and increases in labour costs. During such temporary suspensions, we will have to continue to make expenditures to maintain the plant and equipment. We may also incur significant labour costs and be required to engage in environmental remediation, which would require us to incur additional costs. Given the costs involved in a temporary suspension of our operations, we may instead choose to continue to operate those operations at a loss. This could have a material adverse effect on our results of operations and financial condition.
Estimates of mineral reserves, mineral resources, and projected cash flows
There are numerous uncertainties inherent in estimating mineral reserves and mineral resources and the future cash flows that might be derived from their production. Accordingly, the figures for mineral reserves and mineral resources and future cash flows contained in our public disclosure are estimates only. Estimates of mineral reserves and mineral resources, and future cash flows to be derived from the production of such mineral reserves and mineral resources, necessarily depend upon a number of variable factors and assumptions, including, among others, ability to achieve anticipated tonnages and grade and the resulting cash flow therefrom, geological and mining conditions that may not be fully identified by available exploration data or that may differ from experience in current operations, historical production from the area compared with production from other producing areas, the assumed effects of regulation by governmental agencies and assumptions concerning metal prices, exchange rates, interest rates, inflation, operating costs, development and maintenance costs, reclamation costs, and the availability and cost of labour, equipment, raw materials and other services required to mine and refine the ore. In addition, there can be no assurance that mineral recoveries in small scale laboratory tests will be duplicated in larger scale tests under on‑site conditions or during production. For these reasons, estimates of our mineral reserves and mineral resources in our public disclosure, including classifications thereof based on probability of recovery, and any estimates of future cash flows expected from the production of those mineral reserves and mineral resources, prepared by different engineers or by the same engineers at different times may vary substantially. If our actual mineral reserves and mineral resources or cash flows are less than our estimates, our results of operations and financial condition may be materially impaired.
63 2009 Financial Review
Management’s Discussion and Analysis
Inferred mineral resources
Inferred mineral resources that are not mineral reserves do not have demonstrated economic viability. Due to the uncertainty which may attach to inferred mineral resources, there is no assurance that inferred mineral resources will be upgraded to proven and probable mineral reserves as a result of continued exploration.
We are subject to substantial government regulation
Our mining, processing, development and mineral exploration activities are subject to various laws governing prospecting, development, production, taxes, labour standards and occupational health, mine safety, toxic substances, protection of the environment and other matters. Although we believe that our activities are currently carried out in accordance with applicable rules and regulations, no assurance can be given that new rules and regulations will not be enacted or that existing rules and regulations will not be applied in a manner that could limit or curtail production or development of our properties. Amendments to current laws and regulations governing our operations and activities or more stringent implementation thereof could have a material adverse effect on our business, financial condition and results of operations, including increases in exploration expenses, remedial and reclamation obligations, capital expenditures and production costs, reduction in levels of production at producing properties, or abandonment or delays in development of new mining properties.
Environmental compliance obligations
All of our operations are subject to environmental regulations. Environmental legislation is evolving in a manner that will require stricter standards and enforcement, increased fines and penalties for non‑compliance, more stringent environmental assessments of proposed projects and a heightened degree of responsibility for companies and their officers, directors and employees. There can be no assurance that existing or future environmental regulation will not materially adversely affect our business, financial condition and results of operations. There is contamination on properties that we own or owned or for which we have or have had care, management or control and, in some cases on neighbouring properties, that may result in a requirement to remediate, which could involve material costs. In addition, environmental hazards may exist on the properties on which we hold interests that are unknown to us at present and that have been caused by previous or existing owners or operators of the properties. We may also acquire properties with environmental risks.
Any failure to comply with applicable laws, regulations and permitting requirements may result in enforcement actions, including orders issued by regulatory or judicial authorities causing operations to cease or be curtailed, and may include corrective measures requiring capital expenditures, installation of additional equipment, or remedial actions. Parties engaged in mining operations, including us, may be required to compensate those suffering loss or damage by reason of the mining activities and may have civil or criminal fines or penalties imposed for violations of applicable laws or regulations.
We are required to obtain government permits in order to conduct mining operations
Government approvals and permits are currently required in connection with all of our operations, and further approvals and permits will be required in the future, including for our Lalor project. We must obtain and maintain a variety of licences and permits including air quality control, water, electrical and municipal licences. The duration and success of our efforts to obtain permits are contingent upon many variables outside of our control. Obtaining governmental permits may increase costs and cause delays depending on the nature of the activity to be permitted and the interpretation of applicable requirements implemented by the permitting authority. There can be no assurance that all necessary permits will be obtained and, if obtained, that the costs involved will not exceed our estimates or that we will be able to maintain such permits. To the extent such approvals are required and not obtained or maintained, our operations may be curtailed or we may be prohibited from proceeding with planned exploration, development, or operation of mineral properties.
64 HudBay Minerals Inc.

Aboriginal rights
Governments in many jurisdictions must consult with aboriginal peoples with respect to grants of mineral rights and the issuance or amendment of project authorizations. Consultation and other rights of aboriginal people may require accommodations, including undertakings regarding employment and other matters. This may affect our ability to acquire within a reasonable time frame effective mineral titles in these jurisdictions, including in some parts of Manitoba and Saskatchewan in which aboriginal title is claimed, and may affect the timetable and costs of development of mineral properties in these jurisdictions.
The risk of unforeseen aboriginal title claims also could affect existing operations as well as development projects and future acquisitions. These legal requirements may affect our ability to expand or transfer existing operations or to develop new projects.
Climate change initiatives
Through its proposed Clean Air Act, the Government of Canada has indicated its intent to regulate greenhouse gas emissions. In addition, the Government of Manitoba has committed to take action in response to climate change through a Manitoba‑California memorandum of understanding signed on December 14, 2006. While the impact of these measures, and similar measures in jurisdictions in which we operate, cannot be quantified at this time, the likely effect will be to increase costs for fossil fuels, electricity and transportation, restrict industrial emission levels, impose added costs for emissions in excess of permitted levels and increase costs for monitoring and reporting. Compliance with these initiatives could have a material adverse effect on our results of operations and competitive position.
Reclamation and mine closure costs
In view of the uncertainties concerning future removal and site restoration costs on our properties, including those held by our subsidiaries, the ultimate timing of and costs for future removal and site restoration could differ from current estimates. Our estimates for this future liability are subject to change based on amendments to applicable laws and legislation, the nature of ongoing operations and technological innovations. Any future changes to our reclamation and mine closure costs (either in our estimates or in the actual costs) could have a material and adverse effect on our future operating results.
In addition, regulatory authorities in various jurisdictions require us to post financial assurances to secure in whole or in part future reclamation and restoration obligations in such jurisdictions. The amount and nature of the financial assurances are dependent upon a number of factors, including our financial condition and reclamation cost estimates. Changes to these amounts, as well as the nature of the collateral to be provided, could significantly increase our costs, making the maintenance and development of existing and new mines less economically feasible. There can be no guarantee that we will be able to maintain or add to our current level of financial assurance. We may not have sufficient capital resources to further supplement our existing security, and any capital resources we utilize for this purpose will reduce the resources available for our other operations and commitments. Although we accrue for future closure costs, we do not necessarily reserve cash in respect of these obligations or otherwise fund these obligations in advance. As a result, we will have significant cash costs when we are required to close and restore mine sites that may, among other things, affect our ability to satisfy our obligations under our indebtedness or other contractual commitments. Given the significance of these cash costs, we may not be able to fund them with cash from our operating activities or other available capital resources. We cannot provide assurance that we will be able to obtain financing on satisfactory terms to fund these costs. If we are unable to fund the removal and site restoration costs, regulatory authorities may realize on the financial assurance provided with respect to those obligations.
65 2009 Financial Review

Management’s Discussion and Analysis
Exploration activities
The exploration for and development of mineral deposits involves significant risks. Few properties that are explored are ultimately developed into producing mines. Whether a mineral deposit will be commercially viable depends on a number of factors, including: the particular attributes of the deposit, such as size, grade and proximity to infrastructure; metal prices, which are highly cyclical; and government regulation, including regulations relating to prices, taxes, royalties, land tenure, land use, importing and exporting of minerals and environmental protection. Even if we identify and acquire an economically viable ore body, several years may elapse from the initial stages of development. We may incur major expenses to locate and establish mineral reserves, to develop metallurgical processes and to construct mining and processing facilities. As a result, we cannot provide assurance that our exploration or development efforts will result in any new commercial mining operations or yield new mineral reserves to replace or expand current mineral reserves.
Title to mineral properties
The acquisition of title to mineral properties is a very detailed and time‑consuming process. Title to mineral concessions may be disputed. Although we believe we have taken reasonable measures to ensure proper title to our properties, there is no guarantee that title to any of our properties will not be challenged or impaired. Third parties may have valid claims underlying portions of our interests, including prior unregistered liens, agreements, transfers or claims, including aboriginal land claims, and title may be affected by, among other things, undetected defects or unforeseen changes to the boundaries of our properties by governmental authorities. As a result, we may be constrained in our ability to operate our properties or unable to enforce our rights with respect to our properties. An impairment to or defect in our title to our properties could have a material adverse effect on our business, financial condition or results of operations. In addition, such claims, whether or not valid, will involve additional cost and expense to defend or settle. Such costs and expenses could adversely affect our profitability.
Current global financial conditions
Global financial conditions have been subject to increased volatility and turmoil in recent years. This may affect our ability to obtain equity or debt financing in the future and, if obtained, on terms favourable to us. If increased levels of volatility and market turmoil return to the levels existing in 2008 and early 2009, our operations and the trading price of our common shares could be adversely affected.
Credit risk
We mitigate credit risk relating to customers of our copper, zinc, zinc oxide and precious metals by carrying out credit evaluations on our customers, making a significant portion of sales on a cash basis and maintaining insurance on accounts receivable. If customers default on the credit extended to them and our loss is not covered by insurance, results of operations could be materially adversely affected. Further, we may enter into offsetting derivative contracts for which we do not obtain collateral or other security. In the event of non‑performance by counterparties in connection with such derivative contracts, we are further exposed to credit risk.
Joint ventures
We may enter into one or more joint ventures in the future. Any failure of any joint venture partner to meet its obligations could have a material adverse effect on such joint ventures. In addition, we may be unable to exert influence over strategic decisions made in respect to properties subject of such joint ventures.
66 HudBay Minerals Inc.

Information systems
Information software and hardware can become obsolete over time or could fail to operate as intended for a variety of reasons. Any such failure could cause a physical stop to some of our operations or could cause a disruption in the flow of vital information, either of which could adversely affect our operations.
In addition, we have initiated a project to replace many of our information systems with a new enterprise resource management system. The new system may fail to operate as intended and it may be delayed or subject to cost overruns. During and following implementation of the new system, we will be dependant on a single vendor for support and upgrades of a critical business system.
Equipment and Infrastructure
Although we conduct extensive maintenance and incur significant costs to maintain and upgrade our fixed and mobile equipment and infrastructure, failures may occur that cause injuries or production loss, which could negatively affect our profit.
Market price of our common shares
Our share price may significantly be affected by short‑term changes in commodity prices or in our financial condition or results of operations as reflected in our quarterly earnings reports. Other factors unrelated to our performance that may have an effect on the price of our common shares include the following: the extent of analytical coverage available to investors concerning our business may be limited if investment banks with research capabilities do not continue to follow our securities; a lessening in trading volume and general market interest in our securities may affect an investor’s ability to trade significant numbers of our common shares; the size of our public float may limit the ability of some institutions to invest in our securities. As a result of any of these factors, the market price of our common shares at any given point in time may not accurately reflect our long‑term value. Securities class action litigation has been brought against companies following periods of volatility in the market price of their securities. We may in the future be the target of similar litigation. Securities litigation could result in substantial costs and damages and divert management’s attention and resources. Sales of a large number of our common shares in the public markets, or the potential for such sales, could decrease the trading price of our common shares and could impair our ability to raise capital through future sales of our common shares.
Potential for conflicts of interest
Certain directors and officers of HudBay may also serve as directors or officers of other companies involved in natural resource exploration and development and consequently there exists the possibility for such directors and officers to be in a position of conflict. We expect that any decision made by any of such directors and officers involving us will be made in accordance with their duties and obligations to deal fairly and in good faith with a view to the best interests of HudBay and our shareholders, but there can be no assurance in this regard. In addition, each of the directors is required to declare and refrain from voting on any matters in which such director may have a conflict of interest.
Social and political developments in Guatemala
Guatemalan governmental actions concerning the economy, including the expropriation of property and implementation of exchange controls which currently do not exist, could have a significant adverse impact on Guatemalan private sector entities in general, and on CGN and us in particular. The Government of Guatemala may increase royalties applicable to Fenix. In addition, Guatemala has a history of political unrest. Renewed political unrest or a political crisis in Guatemala could adversely affect our business and results of operations. Guatemala suffers from social problems, such as a high crime rate and uncertain land tenure for many indigenous people, which could have adverse effects on the Fenix Project. Such adverse effects could result from the local populations encroaching on Fenix Project land, challenging the boundaries of such land, impeding Fenix Project activities through roadblocks or other public manifestations or attacking Fenix Project assets or personnel. Exploration and mining operations in and around the Fenix Project will depend on the support of local communities.
67 2009 Financial Review

Management’s Discussion and Analysis
Forward‑looking Information
This MD&A contains “forward‑looking information”, within the meaning of applicable Canadian securities legislation. Forward‑looking information includes, but is not limited to, information with respect to HudBay’s exploration expenditures and activities and the possible success of such exploration activities, the estimation of mineral reserves and resources, the realization of mineral estimates, the timing and amount of estimated future production, costs of production, capital expenditures, estimate of salvage value, costs and timing of the development of new deposits, mineral pricing, reclamation costs, the economic outlook, currency fluctuations, government regulation of mining operations, environmental risks, mine life projections, the availability of third‑party concentrate for processing in HudBay’s facilities and the availability of third‑party processing facilities for HudBay’s concentrate, business and acquisition strategies and the timing and possible outcome of pending litigation. Often, but not always, forward‑looking information can be identified by the use of forward‑looking words like “plans”, “expects”, or “does not expect”, “is expected”, “budget”, “scheduled”, “estimates”, “forecasts”, “intends”, “understands”, “anticipates”, or “does not anticipate”, or “believes” or variations of such words and phrases or statements that certain actions, events or results “may”, “could”, “would”, “might”, or “will be taken”, “occur”, or “be achieved”. Forward‑looking information is based on the opinions and estimates of management as of the date such information is provided and is subject to known and unknown risks, uncertainties and other factors that may cause the actual results, level of activity, performance or achievements of HudBay to be materially different from those expressed or implied by such forward‑looking information, including risks associated with the mining industry such as economic factors (including future commodity prices, currency fluctuations and energy prices), failure of plant, equipment, processes and transportation services to operate as anticipated, dependence on key personnel and employee relations, environmental risks, government regulation, actual results of current exploration activities, possible variations in ore grade or recovery rates, permitting timelines, capital expenditures, reclamation activities, land titles, and social and political developments and other risks of the mining industry as well as those risk factors discussed or referred to in this MD&A under the heading “Risk Factors”. Although HudBay has attempted to identify important factors that could cause actual results to differ materially from those contained in forward‑looking information, there may be other factors that cause results not to be as anticipated, estimated or intended. There can be no assurance that forward‑looking information will prove to be accurate, as actual results and future events could differ materially from those anticipated in such information. Accordingly, readers should not place undue reliance on forward‑looking information. HudBay does not undertake to update any forward‑looking information, except as required by applicable securities laws, or to comment on analyses, expectations or statements made by third parties in respect of HudBay, its financial or operating results or its securities.
Documents Incorporated by Reference
Any statement contained in a document incorporated or deemed to be incorporated by reference herein shall be deemed to be modified or superseded for purposes of this MD&A to the extent that a statement contained herein, or in any other subsequently filed document that also is incorporated or is deemed to be incorporated by reference herein, modifies or supersedes such statement. The modifying or superseding statement need not state that it has modified or superseded a prior statement or include any other information set forth in the document that it modifies or supersedes. The making of a modifying or superseding statement will not be deemed an admission for any purposes that the modified or superseded statement, when made, constituted a misrepresentation, an untrue statement of a material fact or an omission to state a material fact that is required to be stated or that is necessary to make a statement not misleading in light of the circumstances in which it was made. Any statement so modified or superseded shall not, except as so modified or superseded, constitute a part of this MD&A after it has been modified or superseded.
68 HudBay Minerals Inc.

To the Shareholders, HudBay Minerals Inc.
We have audited the consolidated balance sheets of HudBay Minerals Inc. as at December 31, 2009 and 2008 and the consolidated statements of earnings, retained earnings, comprehensive income and cash flows for the years then ended. These consolidated financial statements are the responsibility of the Company’s management. Our responsibility is to express an opinion on these financial statements based on our audits.
We conducted our audits in accordance with Canadian generally accepted auditing standards. Those standards require that we plan and perform an audit to obtain reasonable assurance whether the financial statements are free of material misstatement. An audit includes examining, on a test basis, evidence supporting the amounts and disclosures in the financial statements. An audit also includes assessing the accounting principles used and significant estimates made by management, as well as evaluating the overall financial statement presentation.
In our opinion, these consolidated financial statements present fairly, in all material respects, the financial position of the Company as at December 31, 2009 and 2008 and the results of its operations and its cash flows for the years then ended in accordance with Canadian generally accepted accounting principles.
(signed Deloitte and Touche, LLP)
Chartered Accountants
Licensed Public Accountants
March 2, 2010
Auditors’ Report
69 2009 Financial Review

Consolidated Financial Statements
Years ended December 31, 2009 and 2008 (in thousands of Canadian dollars) 2009 2008
AssetsCurrent assets Cash, cash equivalents and short‑term investments (note 5) $ 886,814 $ 704,668 Accounts receivable 40,187 54,110 Income taxes receivable 14,894 14,769 Inventories (note 6) 131,128 146,645 Prepaid expenses and other current assets 7,990 8,196 Cash held in trust – 3,836 Future income and mining tax assets (note 16b) 23,152 21,217 Current portion of fair value of derivatives (note 20c) 1,106 4,198
1,105,271 957,639 Property, plant and equipment (note 8) 818,634 817,879 Available‑for‑sale investments (note 18) 27,249 118,960 Other assets (note 9) 81,113 23,875
$ 2,032,267 $ 1,918,353
Liabilities and Shareholders’ EquityCurrent liabilities Accounts payable and accrued liabilities $ 114,204 $ 137,776 Taxes payable 1,250 22,297 Current portion of other liabilities (note 10) 40,228 33,889
155,682 193,962 Pension obligations (note 12) 516 28,133 Other employee future benefits and deferred share units (notes 13, 17e) 81,287 74,128 Asset retirement obligations (note 14) 49,133 41,317 Other long‑term liabilities (note 15) 1,305 100 Future income tax liabilities (note 16b) 34,927 22,013 Fair value of derivatives (note 20c) 7,068 –
329,918 359,653
Shareholders’ equity Share capital: Common shares (note 17b) 644,127 632,380 Warrants (note 17c) – 20 Contributed surplus (note 17f) 26,717 32,345 Retained earnings 1,025,060 912,289 Accumulated other comprehensive income (loss) (note 18) 6,445 (18,334)
1,702,349 1,558,700
$ 2,032,267 $ 1,918,353
Commitments (note 21) and contingencies (note 22)
See accompanying notes to consolidated financial statements.
On behalf of the Board:
(signed) (signed)J. Bruce Barraclough, Director Alan R. Hibben, Director
Consolidated Balance Sheets
70 HudBay Minerals Inc.

Years ended December 31, 2009 and 2008 (in thousands of Canadian dollars, except share and per share amounts) 2009 2008
Revenue (note 24) $ 720,722 $ 981,894
Expenses Operating 505,841 685,616 Depreciation and amortization 100,731 88,295 General and administrative 44,176 30,578 Stock‑based compensation (note 17d,f) 4,692 11,952 Accretion of asset retirement obligations (note 14) 4,488 3,847 Foreign exchange loss (gain) 17,752 (42,348)
677,680 777,940
Earnings before the following: 43,042 203,954
Exploration (7,609) (25,583)Interest and other income (note 25) 107,386 26,217 Loss on derivative instruments (917) (589)Asset impairment losses (note 7) – (30,433) Share of losses of equity investee (note 4) – (3,915)
Earnings before tax 141,902 169,651 Tax expense (note 16a) 29,131 96,298
Net earnings for the year $ 112,771 $ 73,353
Earnings per share: Basic $ 0.73 $ 0.54 Diluted $ 0.73 $ 0.54 Weighted average number of common shares outstanding (note 17g): Basic 153,460,823 135,902,627 Diluted 154,067,282 136,713,080
See accompanying notes to consolidated financial statements.
Consolidated Statements of Earnings
71 2009 Financial Review

Consolidated Financial Statements
Years ended December 31, 2009 and 2008 (in thousands of Canadian dollars) 2009 2008
Cash provided by (used in): Operating activities: Net earnings for the year $ 112,771 $ 73,353 Items not affecting cash: Depreciation and amortization 100,731 88,295 Stock‑based compensation (note 17d,f) 4,692 11,952 Accretion on asset retirement obligations (note 14) 4,488 3,847 Foreign exchange loss (gain) 9,868 (19,298) Change in fair value of derivatives 74 (2,553) Asset impairment losses (note 7) – 30,433 Future tax expense (note 16a) 2,218 49,365 Net gains reclassified from OCI (note 18) (107,956) (843) Share of losses of equity investee (note 4) – 3,915 Other (2,043) (3,805)
124,843 234,661 Change in non‑cash working capital (note 23a) (18,649) 12,045
106,194 246,706
Investing activities: Additions to property, plant and equipment (101,914) (144,717) Purchase of short‑term investments – (602,824) Sale of short‑term investments 478,941 123,883 Proceeds from sale of investments 235,704 – Purchase of other non‑current investments (3,945) (240,414) Release of cash held in trust 3,885 – Disposals (additions) to restricted cash (48,462) – Cash acquired with HMI Nickel, net of cash paid (note 4) – 130,747
564,209 (733,325)
Financing activities: Repayment of Senior Secured Notes (3,764) – Repayment of loans payable (note 11) – (7,500) Repayment of obligations under capital leases (511) (4,470) Repurchase of common shares (note 17b) (5,000) (53,291) Proceeds on exercise of stock options 9,393 622
118 (64,639)
Effect of exchange rate changes on cash and cash equivalents (9,434) 19,411
Change in cash and cash equivalents 661,087 (531,847) Cash and cash equivalents, beginning of year 225,727 757,574
Cash and cash equivalents, end of year (note 5) 886,814 225,727 Short‑term investments – 478,941
Cash, cash equivalents and short‑term investments (note 5) $ 886,814 $ 704,668
For supplemental information, see note 23.See accompanying notes to consolidated financial statements.
Consolidated Statements of Cash Flows
72 HudBay Minerals Inc.

Years ended December 31, 2009 and 2008 (in thousands of Canadian dollars) 2009 2008
Retained earnings, beginning of year $ 912,289 $ 868,857 Net earnings for the year 112,771 73,353 Share repurchases – (29,921)
Retained earnings, end of year $ 1,025,060 $ 912,289
See accompanying notes to consolidated financial statements.
Years ended December 31, 2009 and 2008 (in thousands of Canadian dollars) 2009 2008
Net earnings for the year $ 112,771 $ 73,353
Other comprehensive income (loss), net of tax (note 18): Cash flow hedges (11,927) 12,372 Available‑for‑sale investments 36,729 (25,491) Currency translation adjustments (23) 186
24,779 (12,933)
Comprehensive income for the year $ 137,550 $ 60,420
See accompanying notes to consolidated financial statements.
Consolidated Statements of Retained Earnings
Consolidated Statements of Comprehensive Income
73 2009 Financial Review

Note 1 Nature of business
HudBay Minerals Inc. (the “Company” or “HudBay”) is a Canadian company continued under the Canada Business Corporations Act on October 25, 2005. HudBay is a Canadian‑based, integrated base metals mining, metallurgical processing and refining company with assets in North and Central America. HudBay owns zinc and copper mines, concentrators and metal production facilities in northern Manitoba and Saskatchewan, a zinc oxide production facility in Ontario, a copper refinery in Michigan and a nickel project in Guatemala. In addition to its primary products, zinc and copper, HudBay also produces gold, silver and zinc oxide.
Note 2 Significant accounting policies
(a) Basis of presentation:
These consolidated financial statements are prepared in accordance with Canadian generally accepted accounting principles (“Canadian GAAP”) and are presented in Canadian dollars (unless otherwise specified).
These consolidated financial statements include the financial statements of the Company, all of its subsidiaries, and the proportionate share of the assets and liabilities of any joint ventures in which the Company shares joint control. The significant subsidiaries include Hudson Bay Mining and Smelting Co., Limited (“HBMS”), Hudson Bay Exploration and Development Company Limited, White Pine Copper Refinery Inc., (“WPCR”), HudBay Marketing & Sales Inc., HMI Nickel Inc. (“HMI Nickel”), St. Lawrence Zinc Company LLC (“St. Lawrence”), HudBay Michigan Inc. and HudBay Metal Marketing Inc. (“HMMI”). Compañía Guatemalteca de Níquel, S.A. (“CGN”) is a 98.2%‑owned subsidiary of HMI Nickel.
(b) Use of estimates:
The preparation of financial statements in accordance with Canadian GAAP requires management to make estimates and assumptions that affect the reported amount of assets and liabilities and disclosure of contingent assets and liabilities at the date of the consolidated financial statements and the reported amounts of revenues and expenses during the reporting period. Significant areas where management’s judgment is applied include ore reserve determinations used in amortization of certain property, plant and equipment, in‑process inventory quantities and provision for inventory obsolescence, plant and equipment estimated economic lives and salvage values, assessment of impairment, ultimate realization of capitalized exploration costs, fair value of certain assets and liabilities, purchase price allocations, contingent liabilities, future income and mining tax assets and valuation reserves, interpretation of tax legislation, allocation of revenue and costs to non‑Manitoba sourced ore for the purpose of computing Manitoba mining taxes payable, asset retirement obligations, stock‑based compensation, pension obligations and other employee future benefits. Actual results could differ from those estimates by material amounts. These estimates are reviewed at least annually, and changes in estimates are reported in earnings in the period in which they became known.
Years ended December 31, 2009 and 2008
(In thousands of Canadian dollars, except where otherwise noted)
Notes to Consolidated Financial Statements
74 HudBay Minerals Inc.

(c) Translation of foreign currencies:
The Company’s reporting currency is the Canadian dollar.
Monetary assets and liabilities are translated at year‑end exchange rates, and non‑monetary assets and liabilities are translated at historical rates. Revenues and expenses are translated at monthly average exchange rates approximating those in effect at the transaction dates. Gains and losses on translation of monetary assets and monetary liabilities are reflected in earnings. Foreign currency gains and losses on available‑for‑sale financial assets and hedging items in effective cash flow or net investment hedges of foreign exchange risk are recorded in other comprehensive income.
The assets and liabilities of self‑sustaining foreign operations are translated at year‑end exchange rates, and revenue and expenses are translated at monthly average exchange rates. Differences arising from these foreign currency translations are recorded in accumulated other comprehensive income until they are realized by a reduction in the investment.
The monetary assets and liabilities of integrated foreign operations are translated at year‑end exchange rates, whereas non‑monetary items are translated at historical rates. Revenues and expenses are translated at monthly exchange rates, with the exception of depreciation and amortization, which are translated at historical rates. Differences arising from these foreign currency translations are recorded in foreign exchange loss (gain).
(d) Revenue recognition:
Sales are recognized and revenue is recorded at market prices when title and the rights and obligations of ownership pass to the customer, collection is reasonably assured and the price is reasonably determinable.
Under the terms of contracts with independent companies, the Company’s concentrate and certain other sales are “provisionally priced”. For these contracts, sales prices are subject to final adjustment at the end of a future period after shipment, based on quoted market prices during the quotational period specified in the contract. Revenues are recognized when title passes to the customers, using forward prices to estimate the fair value of the total consideration receivable. At each reporting date, the fair value of the final sales price adjustment is re‑estimated, and changes in fair value, metal weights and assays are recognized as adjustments to revenue.
(e) Cash and cash equivalents:
Cash and cash equivalents are classified as fair value through earnings and include cash and highly liquid investments with an original maturity of three months or less at the date of acquisition. Interest earned is included in interest and other income on the statements of earnings and in operating activities on the statements of cash flows.
(f) Inventories:
Inventories consist substantially of in‑process inventory (concentrates and metals), metal products and supplies. Concentrates, metals and all other saleable products are valued at the lower of cost and estimated net realizable value. Cost includes material, labour and amortization of all property, plant and equipment involved with the mining and production process. Costs are allocated based on estimations of net realizable value of the metal content of the inventories. In‑process inventories represent materials that are currently in the process of being converted to a saleable product. Conversion processes vary depending on the nature of the concentrate or metal. In‑process inventory is measured based on assays of the material fed to the processing plants and the projected recoveries of the respective plants, and is valued at the lower of cost and net realizable value. Cost of finished metal inventory represents the average cost of the in‑process inventory incurred prior to the refining process. Supplies are valued at the lower of cost and net realizable value. Cost is determined on an average basis.
75 2009 Financial Review

Notes to Consolidated Financial Statements
(g) Property, plant and equipment:
(i) Mineral properties:
(a) Mineral property and exploration expenditures, including expenditures incurred to earn an interest in a joint venture, are expensed as incurred except for certain expenditures determined by the Company on specified properties identified through pre‑feasibility or other assessments as having mineral reserves and/or resources with the potential of being developed into a mine.
(b) Mineral exploration properties capitalized as part of acquisitions are carried at initial fair value and are subject to an annual impairment review and evaluation, if indicators for potential impairment exist.
(ii) Mine development expenditures:
Development costs for properties deemed capable of economical commercial production are capitalized and amortized using the unit‑of‑production method after commencement of commercial production. Unit‑of‑production amortization is based on the related proven and probable tonnes of ore reserves and associated future development costs. The cost of underground development to provide access to a reserve at an operating mine is capitalized where that portion of the development is necessary to access more than one workplace or stope. Capital development includes shafts, ramps, track haulage drifts, ancillary drifts, sumps, electrical substations, refuge stations, ventilation raises, permanent manways, and ore and waste pass raises.
Ongoing repairs, maintenance and development expenditures are charged to operations as incurred. These include ore stope access drifts, footwall and hangingwall drifts in stopes, drawpoints, drill drifts, sublevels, slots, drill raises, stope manway access raises and definition diamond drilling.
(iii) Commercial production:
The decision on when commercial production is reached is based on a range of criteria that is considered relevant to the specific situation, including: a pre‑determined percentage of design capacity for the mine and mill; achievement of continuous production, ramp‑ups, or other output; and expected net margin during the pre‑production period. In a phased mining approach, consideration is given to milestones achieved at each phase of completion. Management assesses the operation’s ability to sustain production over a period of approximately one to three months, depending on the complexity related to the stability of continuous operation. Commercial production is considered to have commenced at the beginning of the month in which the criteria are met.
No amortization is provided in respect of mine development expenditures until commencement of economical commercial production. Any production revenue earned prior to commercial production, net of related costs, is offset against the development costs.
(iv) Plant and equipment:
Expenditures for plant and equipment additions, major replacements and improvements are capitalized at cost, net of applied investment tax credits. Plant and equipment, including assets under capital lease, are depreciated on either a unit‑of‑production or a straight‑line basis. The unit‑of‑production method is based on proven and probable tonnes of ore reserves. The assets using the straight‑line method are depreciated over the estimated useful economic lives of the assets, which extend up to approximately 10 years. The Company also considers salvage values in its determination of depreciation.
76 HudBay Minerals Inc.

(v) Capitalized interest:
Interest on borrowings related to the financing of major capital projects under construction is capitalized during the construction phase as part of the cost of the project.
(vi) Impairment of long‑lived assets:
The Company reviews and evaluates the carrying value of its operating mines and exploration and development properties for impairment when events or circumstances indicate that the carrying amounts of related assets or groups of assets may not be recoverable. If the total estimated future cash flows on an undiscounted basis are less than the carrying amount of the asset, an impairment loss is measured and assets are written down to fair value, which is normally the discounted value of future cash flows. Future cash flows are estimated based on estimated future recoverable mine production, expected sales prices (considering current and historical commodity prices, price trends and related factors), production levels, cash costs of production, and capital and reclamation costs, all based on detailed engineering life‑of‑mine plans. Future recoverable mine production is determined from reserves and resources after taking into account estimated dilution and recoveries during mining, and estimated losses during ore processing and treatment. Estimates of recoverable production from measured, indicated and inferred mineral resources are considered economically mineable and are based on management’s confidence in converting such resources to proven and probable reserves. Long‑lived assets are grouped for purposes of estimating future cash flows at the lowest level of assets and liabilities for which identifiable cash flows are largely independent of the cash flows of other assets. Assumptions underlying future cash flow estimates are subject to risks and uncertainties. It is possible that changes in estimates could occur which may affect the expected recoverability of the Company’s investments in mineral properties.
(h) Pension and other employee future benefits:
The Company has non‑contributory and contributory defined benefit pension plans for the majority of its Canadian employees. The benefits are based on years of service and final average salary for the salaried plans, and a flat dollar amount combined with years of service for the hourly plans. The Company provides long‑term disability income, health benefits and other post‑employment benefits to hourly employees and long‑term disability health benefits to salaried employees. The Company also provides non‑pension post‑retirement (other retirement) benefits to certain active employees and pensioners.
The Company accrues its obligations under the defined benefit plans as the employees render the services necessary to earn the pension and other retirement benefits. The actuarial determination of the accrued benefit obligations for pensions and other retirement benefits uses the projected benefit method prorated on service (which incorporates management’s best estimate of future salary levels, other cost escalation, retirement ages of employees and other actuarial factors). The measurement date of the plan assets and accrued benefit obligation coincides with the Company’s fiscal year. The most recent actuarial valuation for funding purposes for the two largest pension plans was performed in 2009 using data as of December 31, 2008.
Actuarial gains (losses) on plan assets arise from the difference between the actual return on plan assets for a period and the expected return on plan assets for that period. For the purpose of calculating the expected return on plan assets, those assets are valued at fair value. Actuarial gains (losses) on the accrued benefit obligation arise from differences between actual and expected experience and from changes in the actuarial assumptions used to determine the accrued benefit obligation. The average remaining service period of the active employees covered by the pension plans is 9.7 years. The average remaining service period of the active employees covered by the other retirement benefits plan is 12.6 years.
77 2009 Financial Review
Notes to Consolidated Financial Statements
The Company also has defined contribution plans providing pension benefits for certain of its salaried employees. The cost of the defined contribution plans is recognized based on the contributions required to be made during each period.
The Company also has defined contribution plans providing pension benefits for certain of its U.S. employees utilizing 401K plans. The cost of the defined contribution plans is recognized based on the contributions required to be made during each period.
(i) Financial instruments:
Financial assets, financial liabilities, and non‑financial derivative contracts are initially recognized at fair value on the balance sheet when the Company becomes a party to their contractual provisions. Measurement in subsequent periods depends on the financial instrument’s classification. The Company uses trade date accounting for regular‑way purchases or sales of financial assets. Transaction costs are added to the initial carrying value of financial instruments other than those classified as fair value through earnings.
(i) Non‑derivative financial instruments – classification:
Financial assets held‑to‑maturity, loans and receivables, and other financial liabilities are accounted for at amortized cost using the effective interest method of amortization. Gains and losses are recorded in earnings when the assets are derecognized or impaired, and through the amortization process.
Available‑for‑sale financial assets are measured at fair value with gains and losses recorded in other comprehensive income (“OCI”), except for impairment losses, until the assets are derecognized, at which time the cumulative gain or loss previously recognized in accumulated other comprehensive income (“AOCI”) is recognized in earnings. The Company has designated investments in listed shares as available‑for‑sale.
Financial assets and liabilities classified as held‑for‑trading are measured at fair value with changes in fair value recognized in earnings and are included in the category “fair value through earnings.” This category includes financial instruments acquired or incurred principally for the purpose of selling or repurchasing in the near term; however, other financial instruments may also be designated irrevocably as fair value through earnings on initial recognition. The Company chose to designate its Senior Secured Notes and cash held in trust in this category; these instruments were settled in January 2009.
(ii) Derivatives:
Derivative instruments, including those derivatives that are embedded in financial or non‑financial contracts and are not closely related to the host contracts, are measured at fair value on the balance sheet. All derivatives are classified as fair value through earnings unless they are accounted for as hedging items. The Company elected to identify embedded derivatives only in contracts entered into or amended on or after January 1, 2003 in accordance with the provisions of Canadian Institute of Chartered Accountants (“CICA”) Handbook Section 3855.
78 HudBay Minerals Inc.

(iii) Hedge accounting:
The Company may use derivatives and non‑derivative financial instruments to manage exposures to interest, currency, credit and other market risks. Where hedge accounting can be applied, a hedging relationship is designated as a fair value hedge, a cash flow hedge or a hedge of foreign currency exposure of a net investment in a self‑sustaining foreign operation. The purpose of hedge accounting is to ensure that gains, losses, revenues and expenses from effective hedging relationships are recorded in earnings in the same period.
At the inception of a hedge, the Company formally documents the hedging relationship and the risk management objective and strategy for undertaking the hedge. Such hedges are expected to be highly effective in achieving offsetting changes in fair value or cash flows. The Company tests effectiveness each period. Hedge accounting is discontinued prospectively when the derivative no longer qualifies as an effective hedge, or the derivative is terminated or sold, or upon the sale or early termination of the hedged item.
During the year ended December 31, 2009, the Company had only cash flow hedging relationships. In a cash flow hedging relationship, the effective portion of the change in the fair value of the hedging derivative is recognized in OCI, while the ineffective portion is recognized in earnings. When a hedged anticipated transaction subsequently occurs, the Company’s policy is to remove the associated gains and losses that were recognized in OCI and include them in the initial carrying amount of the asset acquired or liability incurred. When hedge accounting is discontinued, amounts previously recognized in AOCI are reclassified to earnings during the periods when the variability in the cash flows of the hedged item affects earnings. However, when a hedged item ceases to exist or when it is probable that an anticipated transaction will not occur, gains and losses previously recognized in AOCI are reclassified immediately to earnings. For contracts accounted for as a hedge of an identifiable current or anticipated position, the Company classifies the cash flows of the contract in the same manner as the cash flows of the position being hedged.
(iv) Fair values of financial instruments:
The fair value of a financial instrument is the amount of consideration that would be agreed upon in an arm’s‑length transaction between knowledgeable, willing parties who are under no compulsion to act. Fair values are based on quoted market prices, where available. If market quotes are not available, fair value is based on internal valuation models that use market‑based or independent information as inputs. These models could produce a fair value that may not be reflective of future fair value. The Company applies a hierarchy to classify valuation methods used to measure financial instruments carried at fair value. Level 1 represents quoted (unadjusted) prices in active markets for identical assets and liabilities. Level 2 valuation techniques use significant observable inputs, either directly (i.e., as prices) or indirectly (i.e., derived from prices). Level 3 valuation techniques use significant inputs that are not based on observable market data.
(v) Impairment:
Each balance sheet date, the Company reviews its financial assets, other than those classified as fair value through earnings, for objective evidence of impairment. In assessing available‑for‑sale investments, the Company considers the length and extent of a decline in fair value below its cost, the financial condition and environment of the issuer, and the Company’s ability and intention to hold the investment until its anticipated recovery. When objective evidence of impairment exists and a decline in value is other than temporary, the Company removes cumulative losses from AOCI and recognizes impairment losses in the statements of earnings.
79 2009 Financial Review

Notes to Consolidated Financial Statements
(j) Stock‑based compensation plans:
The Company’s stock‑based compensation plans are described in notes 17d and e. The Company accounts for all stock‑based compensation using the fair value based method. Under this method, compensation cost attributable to options granted is measured at fair value at the grant date and expensed over the vesting period, with a corresponding increase to contributed surplus. Any consideration paid on exercise of stock options or purchase of stock is credited to share capital.
(k) Income and mining taxes:
The Company accounts for income and mining taxes under the asset and liability method. Under this method of tax allocation, future income and mining tax assets and liabilities are determined based on differences between the financial statement carrying values and their respective tax bases (temporary differences). Future tax assets and liabilities are measured using the substantively enacted tax rates expected to apply when the asset is realized or the liability settled. A valuation allowance is recorded as a reduction against any future tax asset to the extent that the benefit of the future tax asset is not more likely than not to be realized. The effect on future tax assets and liabilities from a change in tax rates is included in income in the year in which the change is enacted or substantively enacted.
(l) Earnings per share:
Basic earnings per share is computed by dividing net earnings for the year by the weighted average number of common shares outstanding for the year. Diluted earnings per share is similar to basic earnings per share, except that the denominator is increased to include the number of additional common shares that would have been outstanding if the dilutive potential common shares had been issued using the treasury stock method. In applying this method, the Company determines the number of common shares that would be issued upon exercise of in‑the‑money options and warrants and assumes that the proceeds received upon exercise would be used to purchase additional common shares at the average market price during the year.
(m) Asset retirement obligations:
The Company’s accounting for asset retirement obligations applies to legal obligations associated with the retirement of long‑lived assets that result from the acquisition, construction, development and/or normal operation of a long‑lived asset.
The fair value of a liability for an asset retirement obligation is recorded in the period in which it is identified and a reasonable estimate of fair value can be made. When the liability is initially recorded, the cost is capitalized by increasing the carrying amount of the related long‑lived asset. Costs that relate to existing conditions caused by past operations and that do not contribute to current or future revenue generation are expensed. Upon settlement of the liability, a gain or loss is recorded. The Company records asset retirement obligations primarily associated with decommissioning and restoration costs. The Company assesses the reasonableness of its asset retirement obligation estimates when conditions change and revises those estimates accordingly. Changes in the respective asset and liability balances are expensed in future periods.
The long‑term asset retirement obligation is based on environmental plans, in compliance with the current environmental and regulatory requirements. Accretion expense is charged to the statements of earnings based on application of an interest component to the existing liability.
(n) Exploration costs:
The Company accounts for exploration expenditures by expensing such costs until management’s evaluation indicates, through pre‑feasibility or other assessments, that the property has mineral reserves and/or resources with the potential of being developed into a mine.
80 HudBay Minerals Inc.

(o) Non‑controlling interest:
Non‑controlling interest exists in a less than wholly‑owned subsidiary of the Company through the principles of consolidation and represents the third party’s interest in the carrying values of the subsidiary. The subsidiary’s earnings and losses are included in the Company’s net operations and are then adjusted to reflect the pro rata share of the non‑controlling interest.
Note 3 Adoption of new accounting standards
(a) Adopted in 2009:
As required by the Canadian Institute of Chartered Accountants (“CICA”), effective January 1, 2009, the Company adopted four new accounting standards addressing disclosure requirements:
Goodwill and Intangible Assets
On January 1, 2009, the Company adopted CICA Handbook Section 3064, Goodwill and Intangible Assets, which replaced Section 3062, Goodwill and Other Intangible Assets and Section 3450, Research and Development Costs. The new section establishes standards for the recognition, measurement, presentation and disclosure of goodwill subsequent to its initial recognition and of intangible assets by profit‑oriented enterprises. The Company’s adoption of this standard had no effect on the consolidated financial statements.
Credit Risk and the Fair Value of Financial Assets and Financial Liabilities
Effective January 1, 2009, the Company adopted Emerging Issues Committee (“EIC”) abstract 173 (“EIC‑173”), Credit Risk and the Fair Value of Financial Assets and Financial Liabilities. The abstract clarifies that an entity should take into account its own credit risk and counterparty credit risk in determining the fair value of financial assets and financial liabilities, including derivative instruments.
Mining Exploration Costs
Effective January 1, 2009, the Company adopted EIC‑174, Mining Exploration Costs, which clarifies guidance related to capitalization of exploration costs and impairment of capitalized costs. The Company’s adoption of this abstract had no effect on the consolidated financial statements.
Financial Instruments Disclosures
The Company has adopted the amendments to CICA Handbook Section 3862, Financial Instruments – Disclosures. The amendments set out new standards for disclosures about the fair value measurements of financial instruments and the nature and extent of liquidity risk. The amendments require an entity to classify fair value measurements using a fair value hierarchy in levels ranging from 1 to 3 that reflect the significance of the inputs used in making these measurements. These amendments are consistent with recent amendments to financial instrument disclosure standards under International Financial Reporting Standards (“IFRS”). Upon application by the Company, the fair value hierarchy level used in the determination of fair value of the Company’s financial instruments has been disclosed in note 20.
81 2009 Financial Review

Notes to Consolidated Financial Statements
(b) Adopted in 2008:
As required by the CICA, effective January 1, 2008, the Company adopted three new accounting standards addressing disclosure requirements:
Capital Disclosures and Financial Instruments – Disclosures and Presentation
CICA Handbook Section 1535, Capital Disclosures, specifies the disclosure of (i) an entity’s objectives, policies and processes for managing capital; (ii) qualitative information and summary quantitative data about what the entity manages as capital; (iii) whether the entity has complied with any externally imposed capital requirements; and (iv) if it has not complied, the consequences of such non‑compliance. Refer to note 19.
CICA Handbook Section 3862, Financial Instruments – Disclosures, and Section 3863, Financial Instruments – Presentation, replaced Section 3861, Financial Instruments – Disclosure and Presentation, revising and enhancing disclosure requirements, and carrying forward unchanged its presentation requirements. These new sections place increased emphasis on disclosures about the nature and extent of risks arising from financial instruments and how the entity manages those risks. Refer to note 20.
Inventories
On January 1, 2008, the Company adopted the new CICA Handbook Section 3031, Inventories, replacing the existing Section 3030. This section requires measurement of inventories at the lower of cost and net realizable value; clarifies allocation of overheads and other costs to inventory; requires consistent use of either first‑in, first‑out or weighted average to measure inventories; requires that insurance and capital spares be accounted for as property, plant and equipment; and requires reversal of any previous writedowns when there is a subsequent increase in the value of inventories. The Company’s adoption of this standard had no effect on the consolidated financial statements.
(c) Future accounting changes:
Business Combinations, Consolidated Financial Statements and Non‑Controlling Interests
In January 2009, the CICA issued Handbook Section 1582, Business Combinations, Section 1601, Consolidated Financial Statements, and Section 1602, Non‑controlling Interests which requires business acquisitions (including non‑controlling interests and contingent consideration) to be measured at fair value on the acquisition date, acquisition‑related costs to be expensed, gains from bargain purchases to be recorded in net earnings, and expands the definition of a business. Section 1601 establishes standards for the preparation of consolidated financial statements and Section 1602 requires that non‑controlling interest be presented as part of equity and that transactions between the Company and the non‑controlling interests be reported as equity transactions. As Section 1582 will apply only to future business combinations, it will not have an effect on the Company’s financial statements prior to any such acquisitions. The Company is assessing the effect of adoption of Section 1601 and Section 1602.
International Financial Reporting Standards
The Canadian Accounting Standards Board (“AcSB”) has confirmed that Canadian publicly accountable entities will be required to prepare their financial statements in accordance with IFRS for fiscal years beginning on or after January 1, 2011. As a result, IFRS will be adopted by the Company on January 1, 2011 and its first set of IFRS compliant financial statements will be for the quarter ending March 31, 2011, with comparative information presented on an IFRS basis. The Company is currently assessing the impact the adoption of IFRS will have on its consolidated financial statements.
82 HudBay Minerals Inc.

Note 4 Acquisition of HMI Nickel
On August 26, 2008, the Company acquired all of the issued and outstanding common shares of Skye Resources Inc. (since renamed HMI Nickel Inc.) pursuant to a court‑approved plan of arrangement. In exchange for each HMI Nickel common share, HMI Nickel shareholders received 0.61 of a HudBay common share plus $0.001 in cash. In addition, the Company exchanged HMI Nickel’s outstanding stock options and warrants for similar securities of HudBay at an exchange ratio of 0.61 and at a price equivalent to the original purchase price divided by 0.61. In total, HudBay issued as consideration 31,295,685 common shares, granted 1,864,404 stock options and assumed 1,894,050 warrants.
On June 27, 2008, the Company acquired 12,679,266 common shares of HMI Nickel at a total cost of $95,221 in a private placement. For the period prior to acquisition of control on August 26, 2008, the Company accounted for this investment using the equity method to reflect the strategic nature of the plan of arrangement. The difference between the Company’s carrying value of the investment and its proportionate share of HMI Nickel’s net book value was attributed to the Fenix nickel project in property, plant and equipment, held by CGN, HMI Nickel’s 98.2%‑owned subsidiary. HudBay recorded a loss of $3,915 to reflect its share of the results of HMI Nickel’s operations during the period that HudBay had significant influence over HMI Nickel.
The Company accounted for this two‑step acquisition as a purchase of assets, rather than a business combination, as HMI Nickel did not meet the definition of a business as defined by EIC‑124, Definition of a Business. Accordingly, the Company determined the cost of assets and liabilities acquired from HMI Nickel by allocating the purchase price for the group of assets to each item on the basis of its fair value at the time of acquisition. The fair values determined for the assets and liabilities acquired exceeded the consideration paid.
Purchase price:31.3 million HudBay common shares $ 341,436 Cash of $0.001 per HMI Nickel common share 51 1.9 million stock options issued by HudBay 6,309 1.9 million warrants issued by HudBay 19 Transaction costs 9,458
357,273 Private placement investment 95,221 Share of losses of equity investee (3,915)
$ 448,579
83 2009 Financial Review

Notes to Consolidated Financial Statements
The fair value of share consideration was measured based on HudBay’s closing common share price of $10.91 per share on August 25, 2008, the business day before the acquisition date. The options and warrants have been valued using the Black‑Scholes option pricing model. All options vested upon completion of the transaction.
The following table summarizes the allocation of the purchase price to assets and liabilities acquired:
Acquired through Share of private placement HMI Nickel loss Acquisition investment, prior to of control, Total June 27, 2008 acquisition of control Aug. 26, 2008 Aug. 26, 2008
Cash and cash equivalents $ 29,004 $ – $ 111,252 $ 140,256 Other current assets 161 – 924 1,085 Restricted cash 1,537 – 6,576 8,113 Property, plant and equipment 5,004 (288) 19,772 24,488 Mineral properties 63,036 (3,627) 249,090 308,499 Accounts payable and accrued liabilities (2,271) – (25,171) (27,442) Asset retirement obligations (1,250) – (5,170) (6,420)
$ 95,221 $ (3,915) $ 357,273 $ 448,579
The following summarizes net cash acquired on the acquisition:
Cash and cash equivalents acquired $ 140,256 Cash paid for transaction costs (9,458)Cash of $0.001 per HMI Nickel common share (51)
$ 130,747
Note 5 Cash, cash equivalents and short‑term investments
2009 2008
Cash and cash equivalents: Cash on hand and demand deposits $ 76,297 $ 225,727 Short‑term money market instruments with original maturities of three months or less 810,517 –
886,814 225,727
Short‑term investments: Short‑term bankers’ acceptances with original maturities within six months – 478,941
$ 886,814 $ 704,668
84 HudBay Minerals Inc.

Note 6 Inventories 2009 2008
Work‑in‑process $ 51,250 $ 59,138 Finished goods 59,595 68,067 Materials and supplies 20,283 19,440
$ 131,128 $ 146,645
Note 7 Balmat asset impairment losses
During 2008, the Company recorded an asset impairment loss of $30,433 on its Balmat zinc mine. In its second year of commercial production, the performance of the Balmat mine continued to fall short of the Company’s expectations, which had been revised as part of the previous asset impairment taken in the fourth quarter of 2007. Due to this operating shortfall and rapidly declining zinc prices, the Balmat mine operations were suspended on August 22, 2008.
Based on the anticipated expenses and deferral of operating cash flow associated with a period of care and maintenance, the Company completed a review of the discounted value of future cash flows and determined that the carrying value of Balmat’s assets was not likely to be recoverable. Therefore, the carrying value of the Balmat property, plant and equipment was written off. The carrying value of Balmat’s materials and supplies inventory was also written down to its net realizable value. The Company is currently continuing exploration on the Balmat property.
Note 8 Property, plant and equipment
Accumulated depreciation and Net book 2009 Cost amortization value
Buildings and equipment $ 470,350 $ 161,622 $ 308,728 Mine development 326,011 219,427 106,584 Mineral properties 403,322 – 403,322
$ 1,199,683 $ 381,049 $ 818,634
Accumulated depreciation and Net book 2008 Cost amortization value
Buildings and equipment $ 443,511 $ 105,904 $ 337,607 Mine development 284,376 171,979 112,397 Mineral properties 367,875 – 367,875
$ 1,095,762 $ 277,883 $ 817,879
Refer to note 4 for details on the Company’s acquisition of HMI Nickel. Fenix construction costs and mineral properties are not being amortized or depreciated as they are not in operation. The carrying value of other buildings and equipment under construction or development that is not being amortized was $48,729 (2008 – $26,734).
During the year, the Company terminated its capital leases. As at December 31, 2008, the carrying value of equipment under capital leases was $814.
85 2009 Financial Review
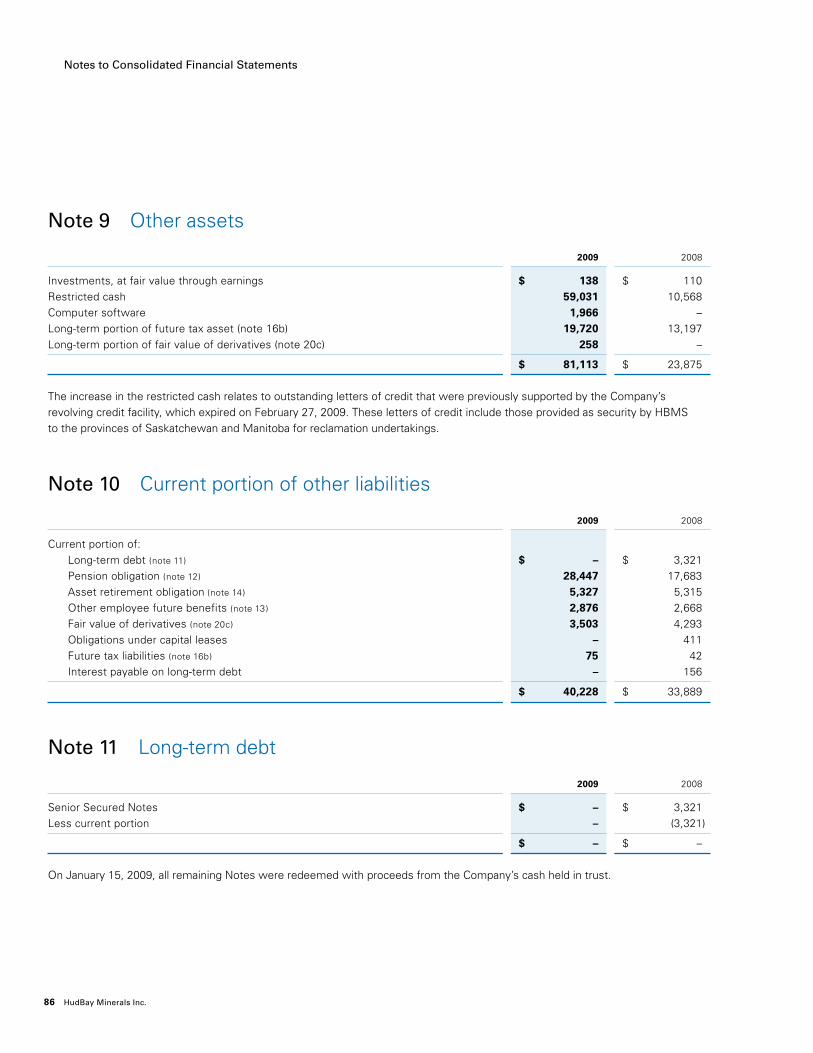
Notes to Consolidated Financial Statements
Note 9 Other assets
2009 2008
Investments, at fair value through earnings $ 138 $ 110 Restricted cash 59,031 10,568 Computer software 1,966 – Long‑term portion of future tax asset (note 16b) 19,720 13,197 Long‑term portion of fair value of derivatives (note 20c) 258 –
$ 81,113 $ 23,875
The increase in the restricted cash relates to outstanding letters of credit that were previously supported by the Company’s revolving credit facility, which expired on February 27, 2009. These letters of credit include those provided as security by HBMS to the provinces of Saskatchewan and Manitoba for reclamation undertakings.
Note 10 Current portion of other liabilities
2009 2008
Current portion of: Long‑term debt (note 11) $ – $ 3,321 Pension obligation (note 12) 28,447 17,683 Asset retirement obligation (note 14) 5,327 5,315 Other employee future benefits (note 13) 2,876 2,668 Fair value of derivatives (note 20c) 3,503 4,293 Obligations under capital leases – 411 Future tax liabilities (note 16b) 75 42 Interest payable on long‑term debt – 156
$ 40,228 $ 33,889
Note 11 Long‑term debt
2009 2008
Senior Secured Notes $ – $ 3,321 Less current portion – (3,321)
$ – $ –
On January 15, 2009, all remaining Notes were redeemed with proceeds from the Company’s cash held in trust.
86 HudBay Minerals Inc.
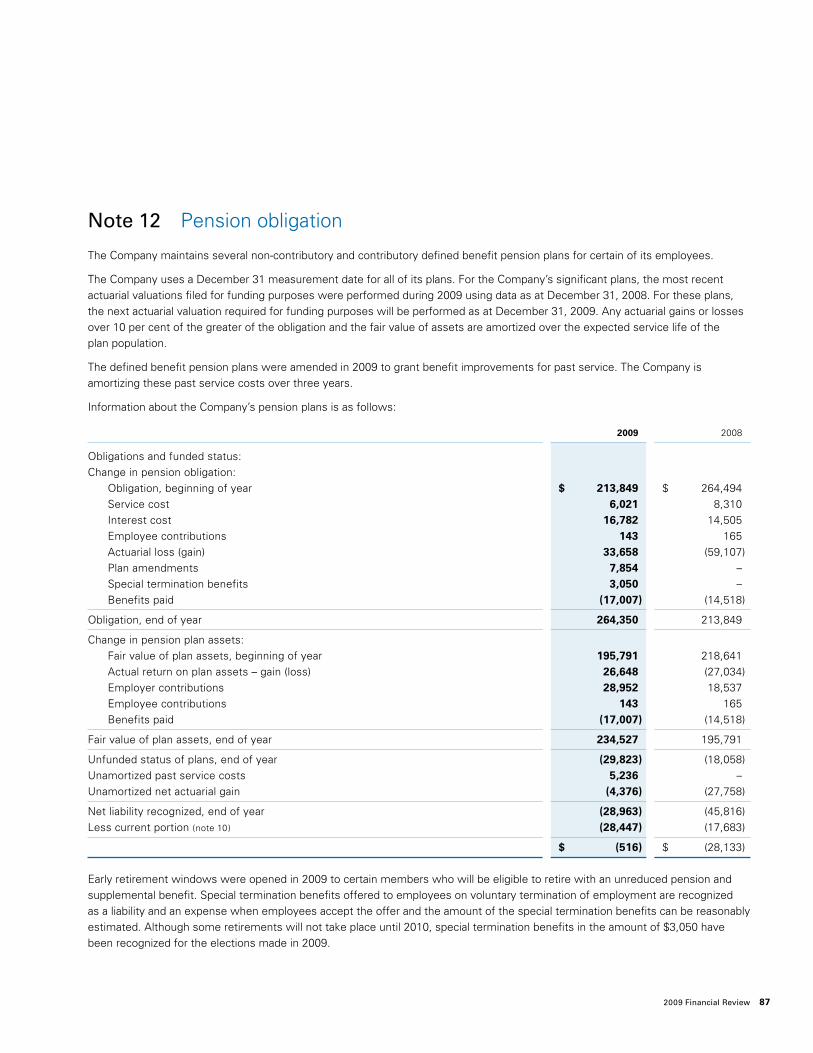
Note 12 Pension obligation
The Company maintains several non‑contributory and contributory defined benefit pension plans for certain of its employees.
The Company uses a December 31 measurement date for all of its plans. For the Company’s significant plans, the most recent actuarial valuations filed for funding purposes were performed during 2009 using data as at December 31, 2008. For these plans, the next actuarial valuation required for funding purposes will be performed as at December 31, 2009. Any actuarial gains or losses over 10 per cent of the greater of the obligation and the fair value of assets are amortized over the expected service life of the plan population.
The defined benefit pension plans were amended in 2009 to grant benefit improvements for past service. The Company is amortizing these past service costs over three years.
Information about the Company’s pension plans is as follows:
2009 2008
Obligations and funded status:Change in pension obligation: Obligation, beginning of year $ 213,849 $ 264,494 Service cost 6,021 8,310 Interest cost 16,782 14,505 Employee contributions 143 165 Actuarial loss (gain) 33,658 (59,107) Plan amendments 7,854 – Special termination benefits 3,050 – Benefits paid (17,007) (14,518)
Obligation, end of year 264,350 213,849
Change in pension plan assets: Fair value of plan assets, beginning of year 195,791 218,641 Actual return on plan assets – gain (loss) 26,648 (27,034) Employer contributions 28,952 18,537 Employee contributions 143 165 Benefits paid (17,007) (14,518)
Fair value of plan assets, end of year 234,527 195,791
Unfunded status of plans, end of year (29,823) (18,058)Unamortized past service costs 5,236 – Unamortized net actuarial gain (4,376) (27,758)
Net liability recognized, end of year (28,963) (45,816)Less current portion (note 10) (28,447) (17,683)
$ (516) $ (28,133)
Early retirement windows were opened in 2009 to certain members who will be eligible to retire with an unreduced pension and supplemental benefit. Special termination benefits offered to employees on voluntary termination of employment are recognized as a liability and an expense when employees accept the offer and the amount of the special termination benefits can be reasonably estimated. Although some retirements will not take place until 2010, special termination benefits in the amount of $3,050 have been recognized for the elections made in 2009.
87 2009 Financial Review

Notes to Consolidated Financial Statements
Pension expense includes the following components:
2009 2008
Costs arising in the year: Service cost $ 6,021 $ 8,310 Interest cost 16,782 14,505 Actual asset return – (gain) loss (26,648) 27,034 Actuarial loss (gain) 33,658 (59,107)
29,813 (9,258) Difference in costs arising and recognized in the year: Actual return on plan assets – loss (gain) 11,332 (42,693) Actuarial (gain) loss (34,713) 58,765 Plan amendments 2,618 4,107 Special termination benefits 3,050 –
Defined benefit pension expense 12,100 10,921 Defined contribution pension expense 666 1,247
$ 12,766 $ 12,168
Additional information:
The weighted average assumptions used in the determination of the accrued benefit expense and obligations were as follows:
2009 2008
To determine the net benefit expense for the year: Discount rate – defined benefit 7.50% 5.50% Discount rate – defined contribution 3.74% 4.17% Expected return on plan assets 7.50% 7.00% Rate of compensation increase* 1.75% 2.35%To determine the accrued benefit obligations at the end of the year: Discount rate – defined benefit 6.50% 7.50% Discount rate – defined contribution 3.74% 4.17% Rate of compensation increase* 2.25% 1.75%
*plus a merit and promotion scale
The Company’s pension cost is significantly affected by the discount rate used to measure obligations, the level of plan assets available to fund those obligations and the expected long‑term rate of return on plan assets.
The Company reviews the assumptions used to measure pension costs (including the discount rate) on an annual basis. Economic and market conditions at the measurement date impact these assumptions from year to year.
In determining the discount rate, the Company considers the duration of the pension plan liabilities.
In determining the expected future rate of return on pension assets, the Company considers the types of investment classes in which the plan assets are invested and the expected compound returns on those investment classes.
88 HudBay Minerals Inc.

The pension plan asset allocations, by asset category, are as follows:
2009 2008
Weighted Weighted average Target average Target
Equity securities 47% 50% 44% 50%Debt securities 53% 50% 56% 50%
100% 100% 100% 100%
The Company’s primary quantitative investment objectives are maximization of the long‑term real rate of return, subject to an acceptable degree of investment risk, and preservation of principal. Risk tolerance is established through consideration of several factors, including past performance, current market conditions and the funded status of the plan.
With the exception of fixed income investments, the plan assets are actively managed by investment managers, with the goal of attaining returns that potentially outperform passively managed investments. Within appropriate limits, the actual composition of the invested funds may vary from the prescribed investment mix.
Note 13 Other employee future benefits
The Company sponsors several post‑employment benefit plans and uses a December 31 measurement date. Information about the Company’s post‑retirement and other post‑employment benefits is as follows:
2009 2008
Obligations and funded status:Change in other employee future benefits obligation: Obligation, beginning of year $ 77,550 $ 79,610 Service cost 3,163 2,282 Interest cost 5,326 4,352 Actuarial loss (gain) 3,234 (6,696) Benefits paid (2,312) (1,998)
Obligation, end of year 86,961 77,550
Change in plan assets: Fair value of plan assets, beginning of year – – Employer contributions 2,312 1,998 Benefits paid (2,312) (1,998)
Fair value of plan assets, end of year – –
Unfunded status of plans, end of year (86,961) (77,550)Unamortized net actuarial loss 3,988 754
Net liability recognized, end of year (82,973) (76,796)Less current portion (note 10) (2,876) (2,668)
$ (80,097) $ (74,128)
89 2009 Financial Review

Notes to Consolidated Financial Statements
Other employee future benefits expense includes the following components:
2009 2008
Costs arising in the year: Service cost $ 3,163 $ 2,282 Interest cost 5,326 4,352 Actuarial loss (gain) 3,234 (6,696)
11,723 (62) Difference in costs arising and recognized in the year: Actuarial (gain) loss (3,234) 6,696
Other employee future benefits expense $ 8,489 $ 6,634
Additional information:
The weighted average assumptions used in the determination of other employee future benefits expense and obligations were as follows:
2009 2008
To determine the net benefit expense for the year: Discount rate 7.50% 5.50% Weighted average health care trend rate 8.30% 7.80%
To determine the benefit obligations at the end of the year: Discount rate 6.75% 7.50% Weighted average health care trend rate 8.01% 8.30%
The weighted average health care cost trend rate used in measuring other employee future benefits was assumed to begin at 8.0% in 2010, gradually declining to 4.5% by 2029 and remaining at those levels thereafter.
If the health care cost trend rate was increased by one percentage point, the accumulated post‑retirement benefit obligation and the aggregate service and interest cost would have increased as follows:
2009 2008
Accumulated post‑retirement benefit obligation $ 15,250 $ 16,106 Aggregate of service and interest cost 1,796 1,606
If the health care cost trend rate was decreased by one percentage point, the accumulated post‑retirement benefit obligation and the aggregate service and interest cost would have decreased as follows:
2009 2008
Accumulated post‑retirement benefit obligation $ 12,196 $ 12,702 Aggregate of service and interest cost 1,388 1,222
The Company’s post‑retirement and other post‑employment benefit cost is materially affected by the discount rate and health care cost trend rates used to measure obligations.
The Company reviews the assumptions used to measure post‑retirement and other post‑employment benefit costs (including the discount rate) on an annual basis.
Any actuarial gains or losses over 10 per cent of the obligation are amortized over the expected service life of the plan population.
90 HudBay Minerals Inc.

Note 14 Asset retirement obligations
The Company’s asset retirement obligations relate to the reclamation and closure of currently operating mines and metallurgical plants and closed properties.
2009 2008
Balance, beginning of year $ 46,632 $ 38,241 Obligations recognized during the year 6,804 199 Obligations recognized upon acquisition of HMI Nickel (note 4) – 6,420 Revisions in estimated cash flows (1,779) (778)Obligations settled during the year (1,685) (1,297)Accretion expense 4,488 3,847
Balance, end of year 54,460 46,632 Less current portion (note 10) 5,327 5,315
$ 49,133 $ 41,317
Total undiscounted future cash flows required to settle the decommissioning and restoration asset retirement obligations are estimated to be $109,726 (2008 – $105,255) before adjusting for inflation, market, and credit risk. Credit adjusted risk‑free rates ranging from 2.4% to 10.0% (2008 – 9.0% to 10.0%) have been used to determine the additional obligations recognized during the year. The Company’s asset retirement obligations were revised in 2009 to reflect changes in amounts and timing of estimated cash flows. Management anticipates that the asset retirement obligations relating to the Flin Flon operations will be substantially settled at or near the closure of the mining and processing facilities, anticipated to occur from 2010 to 2020.
The Company’s exploration and exploitation licences require that it reclaim any land covered by those licences which it disturbs during exploration and exploitation activities for the Fenix Project. Although the timing and the amount of the actual expenditures can be uncertain, and given that the Company chose to delay construction of the Fenix project due to low nickel prices at the time, the Company has estimated the present value of the future reclamation obligation arising from its activities relating to the Fenix Project as at December 31, 2009 to be $8,052 (2008 – $6,745).
In view of the uncertainties concerning environmental remediation, the ultimate cost of asset retirement obligations could differ materially from the estimated amounts provided. The estimate of the total liability for asset retirement obligation costs is subject to change based on amendments to laws and regulations and as new information concerning the Company’s operations becomes available. Future changes, if any, to the estimated total liability as a result of amended requirements, laws, regulations and operating assumptions may be significant and would be recognized prospectively as a change in accounting estimate, when applicable. Environmental laws and regulations are continually evolving in all regions in which the Company operates. The Company is not able to determine the impact, if any, of environmental laws and regulations that may be enacted in the future on its results of operations or financial position due to the uncertainty surrounding the ultimate form that such future laws and regulations may take.
91 2009 Financial Review

Notes to Consolidated Financial Statements
Note 15 Other long‑term liabilities
(a) Capital lease obligations
2009 2008
Lease obligations $ – $ 511 Less current portion – (411)
$ – $ 100
The capital lease average interest rate was 6.0% and all capital leases were terminated during 2009. Interest expense on capital leases in 2009 was $20 (2008 – $191).
(b) Non‑controlling interest
The non‑controlling amount of $1,305 represents the third party’s 1.8% interest in CGN.
Note 16 Income and mining taxes
(a) Tax expense:
2009 2008
Current – income taxes $ 24,245 $ 24,692 – mining taxes 2,668 22,241
$ 26,913 $ 46,933
Future – income taxes (887) 42,819 – mining taxes 3,105 6,546
2,218 49,365
Tax expense $ 29,131 $ 96,298
(b) Future tax assets and liabilities as represented on the balance sheet:
2009 2008
Future tax assets Current portion $ 23,152 $ 21,217 Long‑term portion (note 9) 19,720 13,197
42,872 34,414
Future tax liabilities Current portion (note 10) 75 42 Long‑term portion 34,927 22,013
35,002 22,055
$ 7,870 $ 12,359
92 HudBay Minerals Inc.
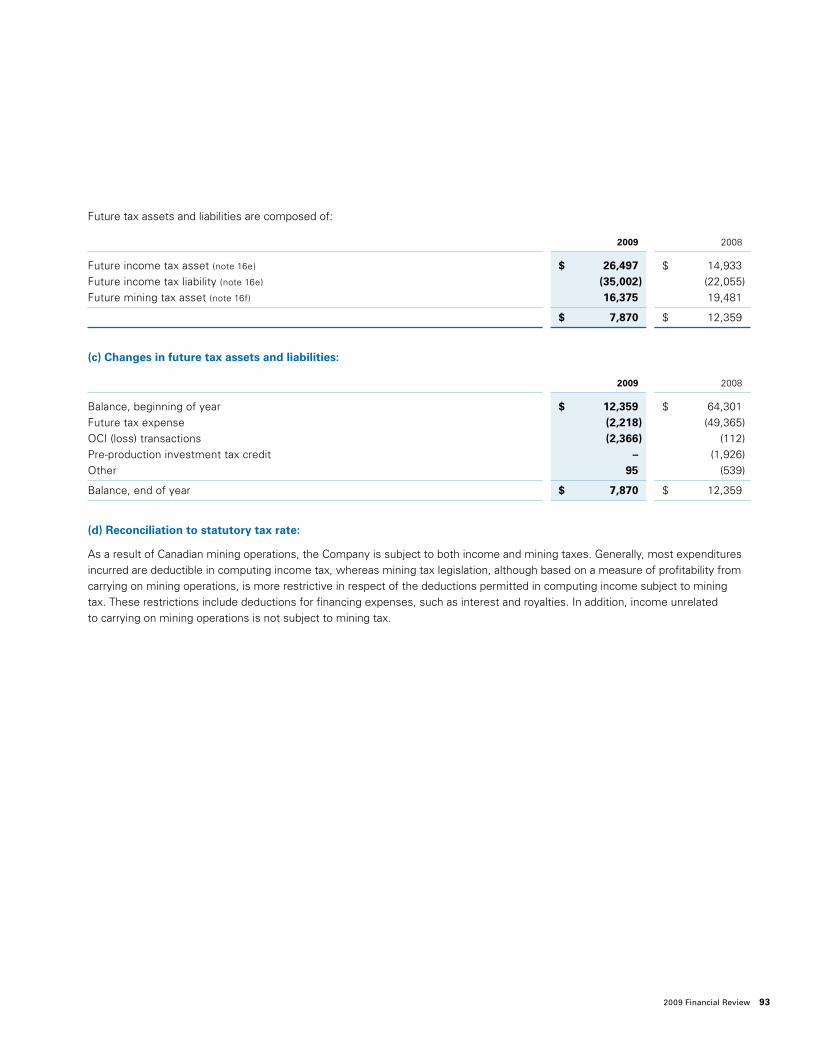
Future tax assets and liabilities are composed of:
2009 2008
Future income tax asset (note 16e) $ 26,497 $ 14,933 Future income tax liability (note 16e) (35,002) (22,055)Future mining tax asset (note 16f) 16,375 19,481
$ 7,870 $ 12,359
(c) Changes in future tax assets and liabilities:
2009 2008
Balance, beginning of year $ 12,359 $ 64,301 Future tax expense (2,218) (49,365)OCI (loss) transactions (2,366) (112)Pre‑production investment tax credit – (1,926) Other 95 (539)
Balance, end of year $ 7,870 $ 12,359
(d) Reconciliation to statutory tax rate:
As a result of Canadian mining operations, the Company is subject to both income and mining taxes. Generally, most expenditures incurred are deductible in computing income tax, whereas mining tax legislation, although based on a measure of profitability from carrying on mining operations, is more restrictive in respect of the deductions permitted in computing income subject to mining tax. These restrictions include deductions for financing expenses, such as interest and royalties. In addition, income unrelated to carrying on mining operations is not subject to mining tax.
93 2009 Financial Review

Notes to Consolidated Financial Statements
Income tax expense differs from the amount that would be computed by applying the statutory income tax rates to income before income taxes. A reconciliation of income taxes calculated at the statutory rates to the actual tax provision is as follows:
2009 2008
Statutory tax rate 31.29% 32.54%
Tax expense at statutory rate $ 44,401 $ 55,204 Effect of:Resource and depletion allowance, net of resource tax recovery (1,449) (9,571)
Adjusted income taxes 42,952 45,633 Mining taxes 5,773 28,787
48,725 74,420 Temporary income tax differences not recognized 7,274 17,387 Tax benefit not recognized – 10,739 Permanent differences related to: – capital items (13,448) (5,475) – stock‑based compensation 1,548 3,985 Other income tax permanent differences (427) 1,400 Recognition of prior years’ income tax temporary differences (14,224) (2,760)Impact related to reduction of tax rates (317) (3,398)
Tax expense $ 29,131 $ 96,298
Tax expense applicable to:Current taxes $ 26,913 $ 46,933 Future taxes 2,218 49,365
Tax expense $ 29,131 $ 96,298
94 HudBay Minerals Inc.
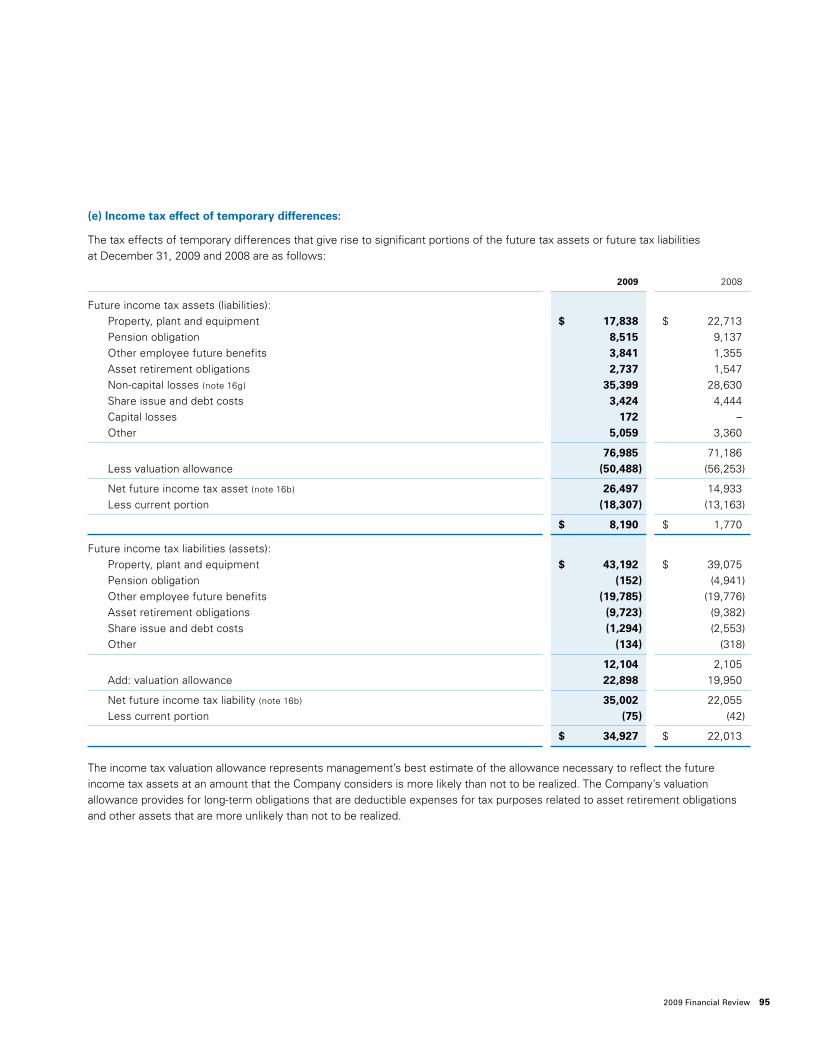
(e) Income tax effect of temporary differences:
The tax effects of temporary differences that give rise to significant portions of the future tax assets or future tax liabilities at December 31, 2009 and 2008 are as follows:
2009 2008
Future income tax assets (liabilities): Property, plant and equipment $ 17,838 $ 22,713 Pension obligation 8,515 9,137 Other employee future benefits 3,841 1,355 Asset retirement obligations 2,737 1,547 Non‑capital losses (note 16g) 35,399 28,630 Share issue and debt costs 3,424 4,444 Capital losses 172 – Other 5,059 3,360
76,985 71,186 Less valuation allowance (50,488) (56,253)
Net future income tax asset (note 16b) 26,497 14,933 Less current portion (18,307) (13,163)
$ 8,190 $ 1,770
Future income tax liabilities (assets): Property, plant and equipment $ 43,192 $ 39,075 Pension obligation (152) (4,941) Other employee future benefits (19,785) (19,776) Asset retirement obligations (9,723) (9,382) Share issue and debt costs (1,294) (2,553) Other (134) (318)
12,104 2,105 Add: valuation allowance 22,898 19,950
Net future income tax liability (note 16b) 35,002 22,055 Less current portion (75) (42)
$ 34,927 $ 22,013
The income tax valuation allowance represents management’s best estimate of the allowance necessary to reflect the future income tax assets at an amount that the Company considers is more likely than not to be realized. The Company’s valuation allowance provides for long‑term obligations that are deductible expenses for tax purposes related to asset retirement obligations and other assets that are more unlikely than not to be realized.
95 2009 Financial Review

Notes to Consolidated Financial Statements
(f) Mining tax effect of temporary differences:
The tax effects of temporary differences that give rise to significant portions of the future mining tax assets at December 31, 2009 and 2008 are as follows:
2009 2008
Future mining tax assets: Property, plant and equipment $ 16,375 $ 27,121 Less valuation allowance – (7,640)
Net future mining tax asset (note 16b) 16,375 19,481 Less current portion (4,844) (8,054)
$ 11,531 $ 11,427
The mining tax valuation allowance represents management’s best estimate of the allowance necessary to reflect the future tax assets at an amount that the Company considers is more likely than not to be realized. The Company’s mining tax valuation allowance provides for future mining tax assets expected to be realized beyond the next three years. This recognition period is considered appropriate due to the lower depreciation rate applied to assets for mining tax purposes, which extends the time frame for realization of future mining tax assets, as well as the uncertainties of future longer‑term metal prices and exchange rates, and will continue to be reviewed as circumstances change. The Company expects to realize its future mining tax assets within three years, therefore no valuation allowance has been recorded in 2009.
(g) Non‑capital losses:
At December 31, 2009, the Company had cumulative non‑capital losses of $75.4 million in Canada and net operating losses of US$42.5 million in the U.S. The benefit related to approximately $32.7 million of the Canadian non‑capital losses has been recognized on the balance sheet. The benefit of the U.S. net operating losses has not been recognized.
The Canadian non‑capital losses were incurred between 2004 and 2009 and expire between 2012 and 2029. The utilization of approximately $42.3 million of non‑capital losses is restricted as a result of a change in control. The U.S. net operating losses were incurred between 2004 and 2009 and have a 20‑year carry‑forward period.
(h) Other disclosure:
The tax rules and regulations applicable to mining companies are highly complex and subject to interpretation. The Company may be subject in the future to a review of its historic income and other tax filings, and in connection with such reviews, disputes can arise with the taxing authorities over the interpretation or application of certain tax rules and regulations to the Company’s business. These audits may alter the timing or amount of taxable income or deductions. The amount ultimately reassessed upon resolution of issues raised may differ from the amount accrued.
96 HudBay Minerals Inc.
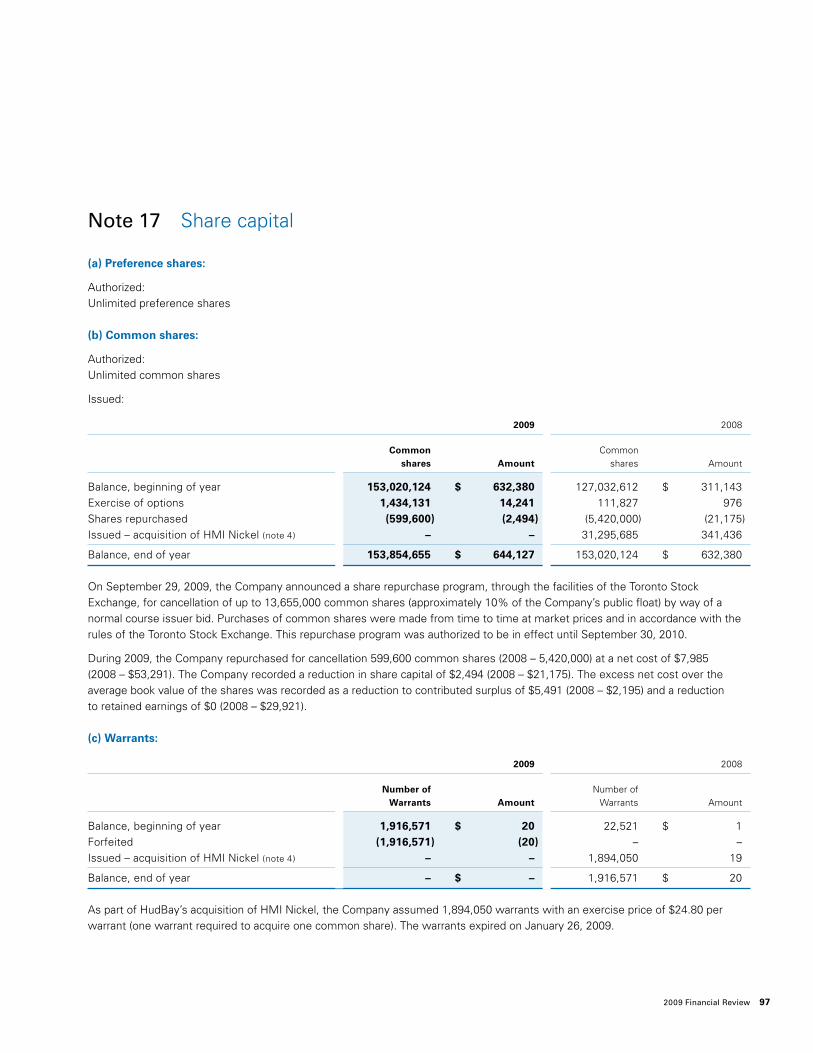
Note 17 Share capital
(a) Preference shares:
Authorized: Unlimited preference shares
(b) Common shares:
Authorized: Unlimited common shares
Issued:
2009 2008
Common Common shares Amount shares Amount
Balance, beginning of year 153,020,124 $ 632,380 127,032,612 $ 311,143 Exercise of options 1,434,131 14,241 111,827 976 Shares repurchased (599,600) (2,494) (5,420,000) (21,175) Issued – acquisition of HMI Nickel (note 4) – – 31,295,685 341,436
Balance, end of year 153,854,655 $ 644,127 153,020,124 $ 632,380
On September 29, 2009, the Company announced a share repurchase program, through the facilities of the Toronto Stock Exchange, for cancellation of up to 13,655,000 common shares (approximately 10% of the Company’s public float) by way of a normal course issuer bid. Purchases of common shares were made from time to time at market prices and in accordance with the rules of the Toronto Stock Exchange. This repurchase program was authorized to be in effect until September 30, 2010.
During 2009, the Company repurchased for cancellation 599,600 common shares (2008 – 5,420,000) at a net cost of $7,985 (2008 – $53,291). The Company recorded a reduction in share capital of $2,494 (2008 – $21,175). The excess net cost over the average book value of the shares was recorded as a reduction to contributed surplus of $5,491 (2008 – $2,195) and a reduction to retained earnings of $0 (2008 – $29,921).
(c) Warrants:
2009 2008
Number of Number of Warrants Amount Warrants Amount
Balance, beginning of year 1,916,571 $ 20 22,521 $ 1 Forfeited (1,916,571) (20) – – Issued – acquisition of HMI Nickel (note 4) – – 1,894,050 19
Balance, end of year – $ – 1,916,571 $ 20
As part of HudBay’s acquisition of HMI Nickel, the Company assumed 1,894,050 warrants with an exercise price of $24.80 per warrant (one warrant required to acquire one common share). The warrants expired on January 26, 2009.
97 2009 Financial Review
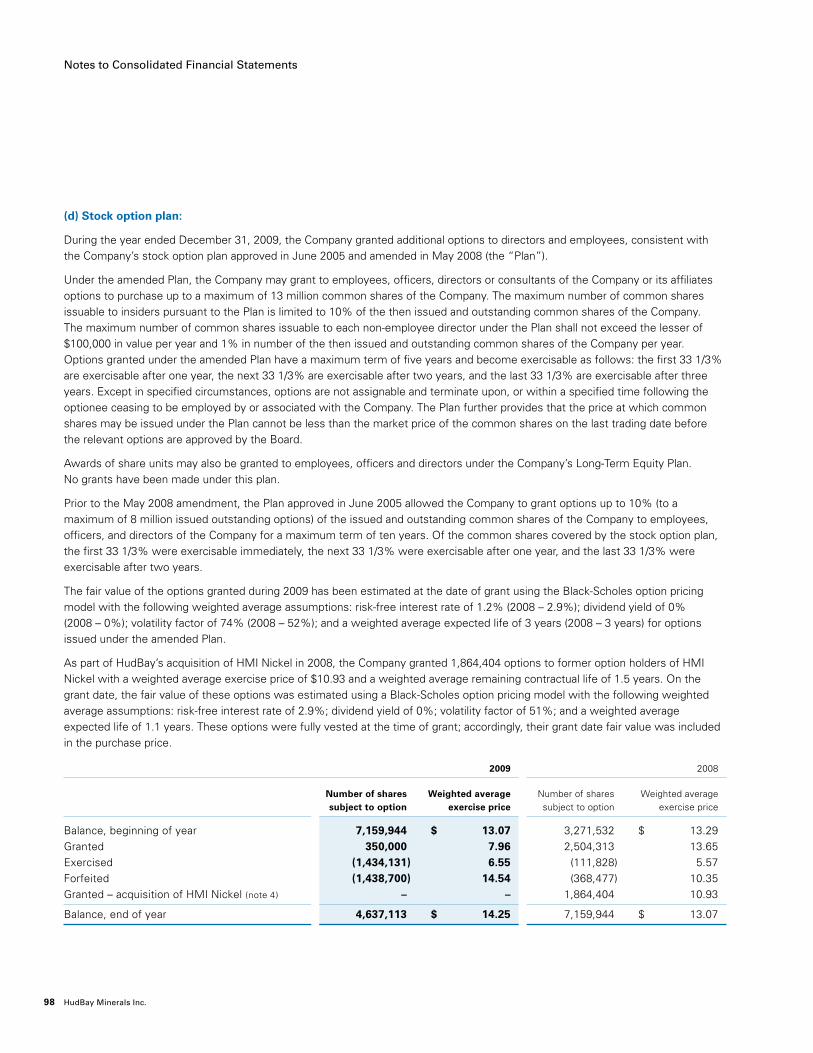
Notes to Consolidated Financial Statements
(d) Stock option plan:
During the year ended December 31, 2009, the Company granted additional options to directors and employees, consistent with the Company’s stock option plan approved in June 2005 and amended in May 2008 (the “Plan”).
Under the amended Plan, the Company may grant to employees, officers, directors or consultants of the Company or its affiliates options to purchase up to a maximum of 13 million common shares of the Company. The maximum number of common shares issuable to insiders pursuant to the Plan is limited to 10% of the then issued and outstanding common shares of the Company. The maximum number of common shares issuable to each non‑employee director under the Plan shall not exceed the lesser of $100,000 in value per year and 1% in number of the then issued and outstanding common shares of the Company per year. Options granted under the amended Plan have a maximum term of five years and become exercisable as follows: the first 33 1/3% are exercisable after one year, the next 33 1/3% are exercisable after two years, and the last 33 1/3% are exercisable after three years. Except in specified circumstances, options are not assignable and terminate upon, or within a specified time following the optionee ceasing to be employed by or associated with the Company. The Plan further provides that the price at which common shares may be issued under the Plan cannot be less than the market price of the common shares on the last trading date before the relevant options are approved by the Board.
Awards of share units may also be granted to employees, officers and directors under the Company’s Long‑Term Equity Plan. No grants have been made under this plan.
Prior to the May 2008 amendment, the Plan approved in June 2005 allowed the Company to grant options up to 10% (to a maximum of 8 million issued outstanding options) of the issued and outstanding common shares of the Company to employees, officers, and directors of the Company for a maximum term of ten years. Of the common shares covered by the stock option plan, the first 33 1/3% were exercisable immediately, the next 33 1/3% were exercisable after one year, and the last 33 1/3% were exercisable after two years.
The fair value of the options granted during 2009 has been estimated at the date of grant using the Black‑Scholes option pricing model with the following weighted average assumptions: risk‑free interest rate of 1.2% (2008 – 2.9%); dividend yield of 0% (2008 – 0%); volatility factor of 74% (2008 – 52%); and a weighted average expected life of 3 years (2008 – 3 years) for options issued under the amended Plan.
As part of HudBay’s acquisition of HMI Nickel in 2008, the Company granted 1,864,404 options to former option holders of HMI Nickel with a weighted average exercise price of $10.93 and a weighted average remaining contractual life of 1.5 years. On the grant date, the fair value of these options was estimated using a Black‑Scholes option pricing model with the following weighted average assumptions: risk‑free interest rate of 2.9%; dividend yield of 0%; volatility factor of 51%; and a weighted average expected life of 1.1 years. These options were fully vested at the time of grant; accordingly, their grant date fair value was included in the purchase price.
2009 2008
Number of shares Weighted average Number of shares Weighted average subject to option exercise price subject to option exercise price
Balance, beginning of year 7,159,944 $ 13.07 3,271,532 $ 13.29 Granted 350,000 7.96 2,504,313 13.65 Exercised (1,434,131) 6.55 (111,828) 5.57 Forfeited (1,438,700) 14.54 (368,477) 10.35 Granted – acquisition of HMI Nickel (note 4) – – 1,864,404 10.93
Balance, end of year 4,637,113 $ 14.25 7,159,944 $ 13.07
98 HudBay Minerals Inc.

The weighted average fair value of options granted during the year was $3.82 per option (2008 – $4.73) at the grant date. The following table summarizes the options outstanding at December 31, 2009:
Options outstanding Options exercisable
Weighted‑ average Weighted‑ Weighted‑ Number of remaining average Number of average Range of options contractual life exercise options exercise exercise prices outstanding (years) price exercisable price
$ 2.59 – 7.33 549,980 5.4 $ 2.62 549,980 $ 2.62 7.34 – 11.03 1,218,851 5.0 9.42 762,184 9.91 11.04 – 15.86 945,198 7.0 15.49 676,305 15.34 15.87 – 17.95 581,754 2.8 17.47 525,087 17.60 17.96 – 23.74 1,341,330 6.9 21.14 1,341,330 21.14
$ 2.59 – 23.74 4,637,113 5.70 $ 14.25 3,854,886 $ 14.78
(e) Deferred Share Unit plan:
The Company offers a Deferred Share Unit (“DSU”) plan for members of the Board of Directors. The issue and redemption prices of each DSU are based on the average closing price of the Company’s common shares for the five trading days prior to the issuance or redemption. The DSUs vest on the grant date. When a participant is no longer a director of the Company, DSUs are redeemable by a lump sum cash payment based on the value of the DSUs at the time.
At December 31, 2009, the value of the outstanding liability related to the DSU plan was $1,190 (2008 – $0). The DSU liability is revalued quarterly based on the change in the Company’s share price and is presented on the balance sheet with other employee future benefits. The change in the value of the DSU liability is included in earnings in the period of the change.
(f) Contributed surplus:
2009 2008
Balance, beginning of year $ 32,345 $ 16,633 Stock‑based compensation expense 4,692 11,952 Transfer to common shares on exercise of stock options (4,849) (354)Share repurchases (5,491) (2,195)Warrants forfeited 20 – Options granted – acquisition of HMI Nickel (note 4) – 6,309
Balance, end of year $ 26,717 $ 32,345
(g) Earnings per share data:
2009 2008
Net earnings available to common shareholders $ 112,771 $ 73,353
Weighted average common shares outstanding 153,460,823 135,902,627 Plus net incremental shares from assumed conversions: – Warrants – 496 – Stock options 606,459 809,957
Diluted weighted average common shares 154,067,282 136,713,080
99 2009 Financial Review
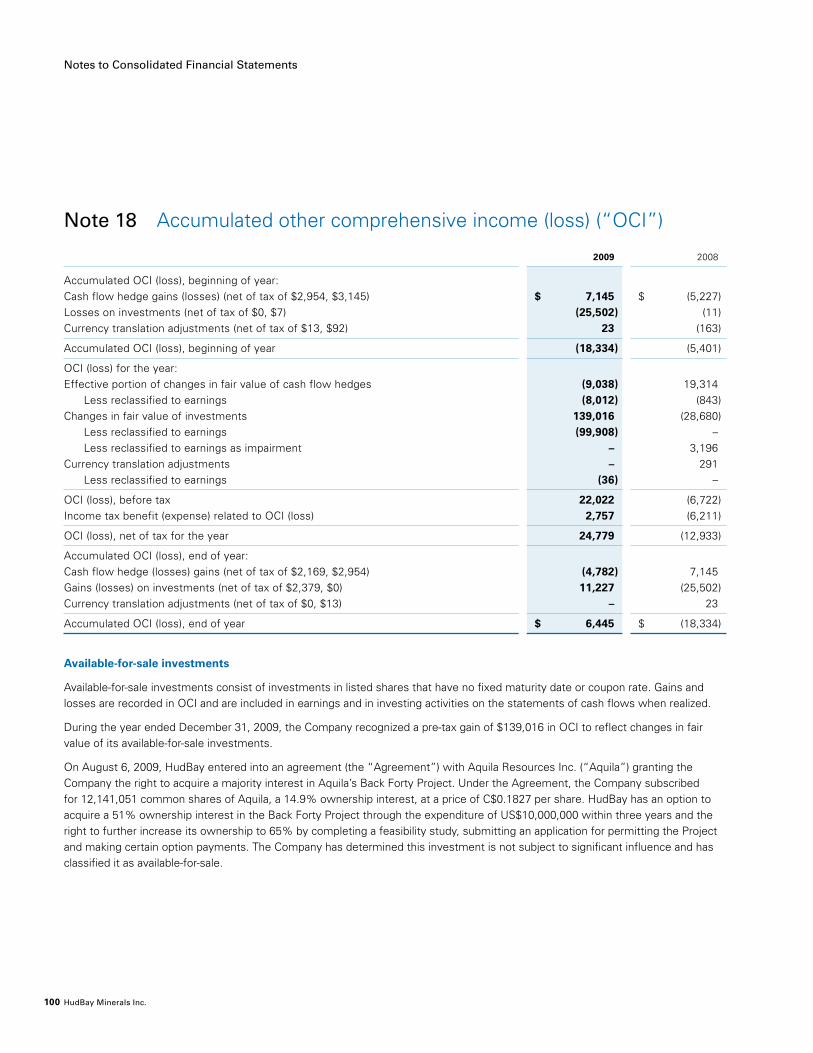
Notes to Consolidated Financial Statements
Note 18 Accumulated other comprehensive income (loss) (“OCI”)
2009 2008
Accumulated OCI (loss), beginning of year:Cash flow hedge gains (losses) (net of tax of $2,954, $3,145) $ 7,145 $ (5,227) Losses on investments (net of tax of $0, $7) (25,502) (11)Currency translation adjustments (net of tax of $13, $92) 23 (163)
Accumulated OCI (loss), beginning of year (18,334) (5,401)
OCI (loss) for the year:Effective portion of changes in fair value of cash flow hedges (9,038) 19,314 Less reclassified to earnings (8,012) (843)Changes in fair value of investments 139,016 (28,680) Less reclassified to earnings (99,908) – Less reclassified to earnings as impairment – 3,196 Currency translation adjustments – 291 Less reclassified to earnings (36) –
OCI (loss), before tax 22,022 (6,722) Income tax benefit (expense) related to OCI (loss) 2,757 (6,211)
OCI (loss), net of tax for the year 24,779 (12,933)
Accumulated OCI (loss), end of year:Cash flow hedge (losses) gains (net of tax of $2,169, $2,954) (4,782) 7,145 Gains (losses) on investments (net of tax of $2,379, $0) 11,227 (25,502) Currency translation adjustments (net of tax of $0, $13) – 23
Accumulated OCI (loss), end of year $ 6,445 $ (18,334)
Available‑for‑sale investments
Available‑for‑sale investments consist of investments in listed shares that have no fixed maturity date or coupon rate. Gains and losses are recorded in OCI and are included in earnings and in investing activities on the statements of cash flows when realized.
During the year ended December 31, 2009, the Company recognized a pre‑tax gain of $139,016 in OCI to reflect changes in fair value of its available‑for‑sale investments.
On August 6, 2009, HudBay entered into an agreement (the “Agreement”) with Aquila Resources Inc. (“Aquila”) granting the Company the right to acquire a majority interest in Aquila’s Back Forty Project. Under the Agreement, the Company subscribed for 12,141,051 common shares of Aquila, a 14.9% ownership interest, at a price of C$0.1827 per share. HudBay has an option to acquire a 51% ownership interest in the Back Forty Project through the expenditure of US$10,000,000 within three years and the right to further increase its ownership to 65% by completing a feasibility study, submitting an application for permitting the Project and making certain option payments. The Company has determined this investment is not subject to significant influence and has classified it as available‑for‑sale.
100 HudBay Minerals Inc.
On May 26, 2009, the Company disposed of 96,997,492 common shares of Lundin Mining Corporation (“Lundin”) for cash proceeds of $235,704 to GMP Securities L.P. (“GMP”) and recognized a gain of $99,908. The sale was completed pursuant to an agreement between GMP and HudBay dated May 11, 2009. In connection with its consent, Lundin agreed with HudBay to terminate all continuing rights and obligations under the previously announced termination agreement dated February 23, 2009 (other than the mutual release and the reciprocal standstill covenant that expires on February 23, 2010) and all continuing rights and obligations of HudBay and Lundin under the subscription agreement. HudBay and Lundin also agreed to a mutual release in respect of any and all claims connected with or arising from the subscription agreement and certain representations and warranties under the termination agreement.
Note 19 Capital disclosures
The Company’s objectives when managing capital are to maintain a strong capital base in order to:
• AdvancetheCompany’scorporatestrategiestocreatelong‑termvalueforitsstakeholders;and
• SustaintheCompany’soperationsandgrowththroughoutmetalsandmaterialscycles.
HudBay monitors its capital and capital structure on an ongoing basis to ensure they are sufficient to achieve the Company’s short‑term and long‑term strategic objectives. HudBay monitors its cash, cash equivalents and short‑term investments, which were $886,814 as at December 31, 2009. The Company does not currently have significant debt outstanding and is not subject to externally imposed capital requirements. Interest coverage ratios, debt‑to‑book capitalization ratios and debt to cash flow ratios are metrics that would also be evaluated during periods when financial leverage was employed as an element of the Company’s capital structure. Refer to note 17b for information on the Company’s share repurchase program.
101 2009 Financial Review

Notes to Consolidated Financial Statements
Note 20 Financial instruments
(a) Fair value and carrying value of financial instruments:
The following presents the fair value and carrying value of the Company’s financial instruments and non‑financial derivatives:
Classification Dec 31, 2009 Dec 31, 2008
Financial assets Cash, cash equivalents and short‑term investments1 FV through earnings $ 886,814 $ 704,668 Accounts receivable Trade and other receivables1 Loans & receivables 39,978 53,879 Embedded derivatives2 FV through earnings 209 231 Cash held in trust FV through earnings – 3,836 Derivative assets Hedging derivatives2 Hedging derivatives 390 – Non‑hedge derivative assets2 FV through earnings 974 4,198 Available‑for‑sale investments3 Available‑for‑sale 27,249 118,960 Investments at fair value through earnings3 FV through earnings 138 110 Restricted cash1 FV through earnings 59,031 10,568
$ 1,014,783 $ 896,450
Financial liabilities Accounts payable Trade payables & accrued liabilities1 Other financial liabilities $ 113,647 $ 132,320 Embedded derivatives2 FV through earnings 557 5,456 Interest payable1 Other financial liabilities – 156 Derivative liabilities Hedging derivatives2 Hedging derivatives 9,823 – Non‑hedge derivative liabilities2 FV through earnings 748 4,293 Senior Secured Notes FV through earnings – 3,321 Obligations under capital leases Other financial liabilities – 100
$ 124,775 $ 145,646
Net financial assets $ 890,008 $ 750,804
1. Carrying values of cash, cash equivalents and short‑term investments, accounts receivable, restricted cash, accounts payable and accrued liabilities and interest payable approximate their fair values due to their short‑term nature and thus have not been classified within the fair value hierarchy.
2. Derivatives and embedded provisional pricing derivatives are measured at fair value based on Level 2 inputs and are carried at their fair value. These are determined based on internal valuation models that reflect observable forward commodity prices and exchange rates, currency exchange rates and discount factors based on market US dollar interest rates. Transactions involving derivatives are with counterparties the Company believes to be creditworthy.
3. Available‑for‑sale investments are measured at fair value based on Level 1 inputs and are listed shares carried at their fair value, which is determined using quoted market bid prices in active markets. Investments at fair value through earnings are measured at fair value based on Level 2 inputs and consist of warrants to purchase common shares, which are carried at their fair value as determined using a Black‑Scholes model.
102 HudBay Minerals Inc.

(b) Financial risk management:
The Company’s financial risk management activities are governed by Board‑approved policies addressing risk identification, hedging authorization procedures and limits, and reporting. HudBay’s policy objective, when hedging activities are undertaken, is to reduce the volatility of future earnings and cash flow within the strategic and economic goals of the Company. The Company from time to time employs derivative financial instruments, including forward and option contracts, to manage risk originating from exposures to commodity price risk, foreign exchange risk and interest rate risk. Significant derivative transactions are approved by the Board of Directors, and hedge accounting is applied when certain criteria have been met. The Company does not use derivative financial instruments for trading or speculative purposes.
The following is a discussion of the Company’s risk exposures. Information on derivatives held by the Company as at December 31, 2009 is presented in note 20c.
(i) Market risk
Market risk is the risk that changes in market prices, including foreign exchange rates, commodity prices and interest rates, will cause fluctuations in the fair value or future cash flows of a financial instrument.
Foreign currency risk
The Company’s primary exposure to foreign currency risk arises from:
• TranslationofUSdollardenominatedrevenuesandexpensesand,toalesserextent,GuatemalanquetzalexpensesintoCanadian dollars. Substantially all of the Company’s revenues are denominated in US dollars, while less than half of its expenses are denominated in US dollars. As a result, appreciation of the Canadian dollar relative to the US dollar will reduce the Company’s earnings, and a weakening of the Canadian dollar will increase the Company’s earnings.
• TranslationofUSdollarandGuatemalanquetzaldenominatedoperatingaccounts,consistingmainlyofcertaincash,cashequivalents and short‑term investments, accounts receivable, accounts payable and derivatives. Cash balances in quetzals are restricted to amounts required to fund near‑term operating requirements. Appreciation of the Canadian dollar relative to the US dollar or quetzal will reduce the net asset value of these operating accounts once they have been translated to Canadian dollars, resulting in foreign currency translation losses on foreign currency denominated assets and gains on foreign currency denominated liabilities.
Based on HudBay’s financial instruments and non‑financial derivatives outstanding as at December 31, 2009, the Company had significant market risk sensitivity to reasonably possible changes in the USD/CAD exchange rate. At December 31, 2009, US$1 was worth $1.0510. If the USD/CAD exchange rate had been higher by C$0.40 with all other variables held constant, after‑tax net earnings would have been $15.5 million higher due to translation of operating accounts denominated in US dollars and OCI would have been lower by C$8.9 million due to the revaluation of the foreign currency hedge. An equal change in the opposite direction would have decreased the Company’s after‑tax net earnings by $15.5 million and increased the Company’s OCI by C$9.5 million.
The above sensitivity analysis relates solely to the financial instruments and non‑financial derivatives that were outstanding as at December 31, 2009; this analysis does not reflect the overall effect that changes in the USD/CAD exchange rate would have on the Company’s results of operations.
Commodity price risk
HudBay is exposed to market risk from prices for the commodities the Company produces and sells, such as zinc, copper, gold and silver. From time to time, the Company maintains price protection programs and conducts commodity price risk management through the use of derivative contracts.
103 2009 Financial Review
Notes to Consolidated Financial Statements
Based on HudBay’s financial instruments and non‑financial derivatives outstanding as at December 31, 2009, the Company’s net earnings and OCI had significant market risk sensitivity to reasonably possible changes in base metal prices. If copper prices at December 31, 2009 had been higher by US$1.50/lb. with all other variables held constant, after‑tax net earnings would have been $2.3 million higher due to the mark‑to‑market effect on the Company’s embedded provisional pricing derivatives. A reasonably possible downward change of US$1.50/lb. would have increased the Company’s after‑tax net earnings by $2.3 million.
If zinc prices at December 31, 2009 had been higher by US$0.50/lb. with all other variables held constant, after‑tax OCI would have been $2.3 million lower due to the mark‑to‑market effect on the Company’s commodity swap hedges. A reasonably possible downward change of US$0.50/lb. would have decreased the Company’s after‑tax net earnings by $18.7 million.
The above sensitivity analysis relates solely to financial instruments and non‑financial derivatives that were outstanding as at December 31, 2009; this analysis does not reflect the overall effect that changes in copper and zinc prices would have on the Company’s results of operations.
Share price risk
HudBay is exposed to market risk from shares prices as the Company holds investments in Canadian listed mineral resource companies. These investments are made to foster strategic relationships in connection with joint venture agreements and for investment purposes. Management monitors the value of these investments for the purposes of determining whether to add to or reduce the Company’s positions.
Based on HudBay’s investments held as at December 31, 2009, the Company had significant market risk sensitivity to reasonably possible changes in share prices. If share prices at December 31, 2009 had been higher by 50% with all other variables held constant, after‑tax OCI would have been $11.7 million higher. An equal change in the opposite direction would have decreased the Company’s after‑tax OCI by $11.7 million.
The above sensitivity analysis relates solely to the investments that were held as at December 31, 2009.
Interest rate risk
The Company is not exposed to significant interest rate risk other than cash flow interest rate risk on its cash, cash equivalents and short‑term investments. The Company invests its cash, cash equivalents and short‑term investments primarily in Canadian bankers’ acceptances, deposits at major Canadian banks, or treasury bills issued by the federal or provincial governments. These investments are liquid, interest‑bearing investments with original maturities of six months or less.
Based on HudBay’s financial instruments outstanding as at December 31, 2009, the Company’s net earnings had significant sensitivity to reasonably possible changes in interest rates. If interest rates at December 31, 2009 had been higher by 3.00% with all other variables held constant, after‑tax net earnings would have been $16.7 million higher related mainly to the Company’s cash, cash equivalents and short‑term investments. A reasonably possible downward change to interest rates of 0.25% would have decreased the Company’s after‑tax net earnings by $1.4 million.
The above sensitivity analysis relates solely to financial instruments that were outstanding as at December 31, 2009.
(ii) Credit risk:
Credit risk is the risk of financial loss to the Company if a customer or counterparty to a financial instrument fails to meet its obligations. The Company has taken into account its own credit risk in determining the fair value of its financial assets and liabilities. The Company’s maximum exposure to credit risk is represented by the carrying amount of each financial asset, including derivative assets, on the balance sheet.
104 HudBay Minerals Inc.

Management has a credit policy in place that requires the Company to obtain credit insurance from an investment grade credit insurance provider to mitigate exposure to credit risk in its receivables. The deductible and any additional exposure to credit risk is monitored and approved on an ongoing basis. Transactions involving derivatives are with counterparties the Company believes to be creditworthy. A deterioration of economic conditions could cause an increase in the rate of customer bad debts relative to historical experience, which may be mitigated by the credit insurance described above. The Company uses an allowance to provide for doubtful accounts receivable. During the year ended December 31, 2009, the allowance decreased by $305. As at December 31, 2009, less than 3% of the Company’s trade accounts receivable were past due.
One customer accounted for approximately 14% of total accounts receivable as at December 31, 2009.
(iii) Liquidity risk:
Liquidity risk is the risk that the Company will not be able to meet its obligations associated with financial liabilities. HudBay’s objective is to maintain sufficient liquid resources to meet operational and investing requirements. The Company’s investment policy requires it to comply with a list of approved investments, concentration and maturity limits, as well as credit quality. The Company has not invested in asset‑backed commercial paper. As at December 31, 2009, the Company had cash, cash equivalents and short‑term investments of $886,814. Substantially all of the Company’s financial liabilities and non‑financial derivative liabilities mature within one year.
(c) Derivatives:
Fair value of derivatives, as presented on the balance sheet:
Non‑hedge Cash flow US dollar derivative hedging December 31, 2009 put options zinc contracts derivatives Total
Derivative assets: Current portion $ – $ 974 $ 132 $ 1,106 Long‑term portion (note 9) – – 258 258
– 974 390 1,364 Current portion (note 10) – (748) (2,755) (3,503) Long‑term portion – – (7,068) (7,068)
– (748) (9,823) (10,571)
Net derivative asset (liability) $ – $ 226 $ (9,433) $ (9,207)
Non‑hedge Cash flow US dollar derivative hedging December 31, 2008 put options zinc contracts derivatives Total
Derivative assets: Current portion $ 92 $ 4,106 $ – $ 4,198 Derivative liabilities Current portion (note 10) – (4,293) – (4,293)
Net derivative asset (liability) $ 92 $ (187) $ – $ (95)
105 2009 Financial Review

Notes to Consolidated Financial Statements
Non-hedge derivative zinc contracts
HudBay enters into fixed price sales contracts with zinc and zinc oxide customers and, to ensure the Company continues to receive a floating or unhedged realized zinc price, enters into forward zinc purchase contracts that effectively offset the fixed price sales contracts. Forward purchases and forward customer sales of zinc are recorded as derivatives. Gains and losses on these contracts are recorded in revenues, and cash flows are classified in operating activities. However, forward customer sales of zinc oxide do not qualify as derivatives.
At December 31, 2009, the Company held contracts for forward zinc purchases of 450 tonnes that related to non‑derivative forward customer sales of zinc oxide. Prices ranged from US$1,153 to US$2,348 per tonne, and settlement dates extended out to eight months in the future. In addition, the Company held contracts for forward zinc purchases of 2,019 tonnes that substantially offset forward customer zinc sales of 2,019 tonnes, which have been recorded as derivatives.
Embedded provisional pricing derivatives
The Company records embedded derivatives (presented in accounts receivable and accounts payable) related to provisional pricing in concentrate purchase, concentrate sale, anode sale, and certain other sale contracts. Under the terms of these contracts, prices are subject to final adjustment at the end of a future period based on quoted market prices during the quotational period specified in the contract. The period between provisional pricing and final pricing is typically up to three months. At each reporting date, provisionally priced metals are marked to market based on the forward market price for the quotational period stipulated in the contract, with changes in fair value recognized in revenues for sales contracts and in operating expenses for purchase concentrate contracts. Cash flows are classified in operating activities. At December 31, 2009, the Company’s net position consisted of contracts awaiting final pricing for purchases of 4,511 tonnes of zinc, sales of 1,181 tonnes of copper, sales of 1,884 ounces of gold and purchases of 79,164 ounces of silver.
Cash flow hedges
In 2007, the Company applied hedge accounting to commodity swap contracts used to hedge prices for a portion of future sales of zinc and copper. During 2008, the Company terminated its remaining zinc and copper commodity swap contracts. The related hedging relationships were discontinued prospectively, and related gains and losses in AOCI are reclassified to earnings when the hedged anticipated future zinc sales occur.
For the year ended December 31, 2009, the Company reclassified pre‑tax net gains of $8,012 from OCI to earnings (presented in revenue) as hedged anticipated zinc and copper sales occurred. $532 of this amount related to the Company’s discontinued copper 2010 hedging relationship, as it is probable that certain of the 2010 hedged anticipated copper sales will not occur as a result of the Company’s plan to close its smelter. Of the $6,951 pre‑tax gain in AOCI relating to the discontinued hedges at December 31, 2009, losses of $436 will be reclassified to earnings in the next twelve months.
During 2009, the Company entered into a foreign exchange swap contract to hedge foreign exchange risk for future receipts of US dollars and commodity swap contracts to hedge prices for a portion of future sales of zinc. These contracts will expire in mid‑2012. The risk management objective for these hedging relationships is to mitigate the impact on the Company of fluctuating zinc prices and exchange rates. Cash flow hedge accounting has been applied to the hedging relationships. As at December 31, 2009, the zinc swap contracts have been recorded as hedging derivative liabilities at their fair value of $9,823 and the foreign exchange swap contract has been recorded as hedging derivative asset at its fair value of $390.
For the year ended December 31, 2009, the Company recorded pre‑tax net losses of $9,038 (2008 – gains of $19,314) to OCI for the effective portion of the cash flow hedges and recorded pre‑tax net losses of $876 (2008 – gains of $1,151) in earnings for the ineffective portion. Ineffective gains and losses are included in loss on derivative instruments. In 2009, the Company also recorded a gain on derivative instruments of $425 in earnings equal to the change in fair value between the trade date of the foreign exchange swap contracts and the designation date for the hedging relationships.
106 HudBay Minerals Inc.
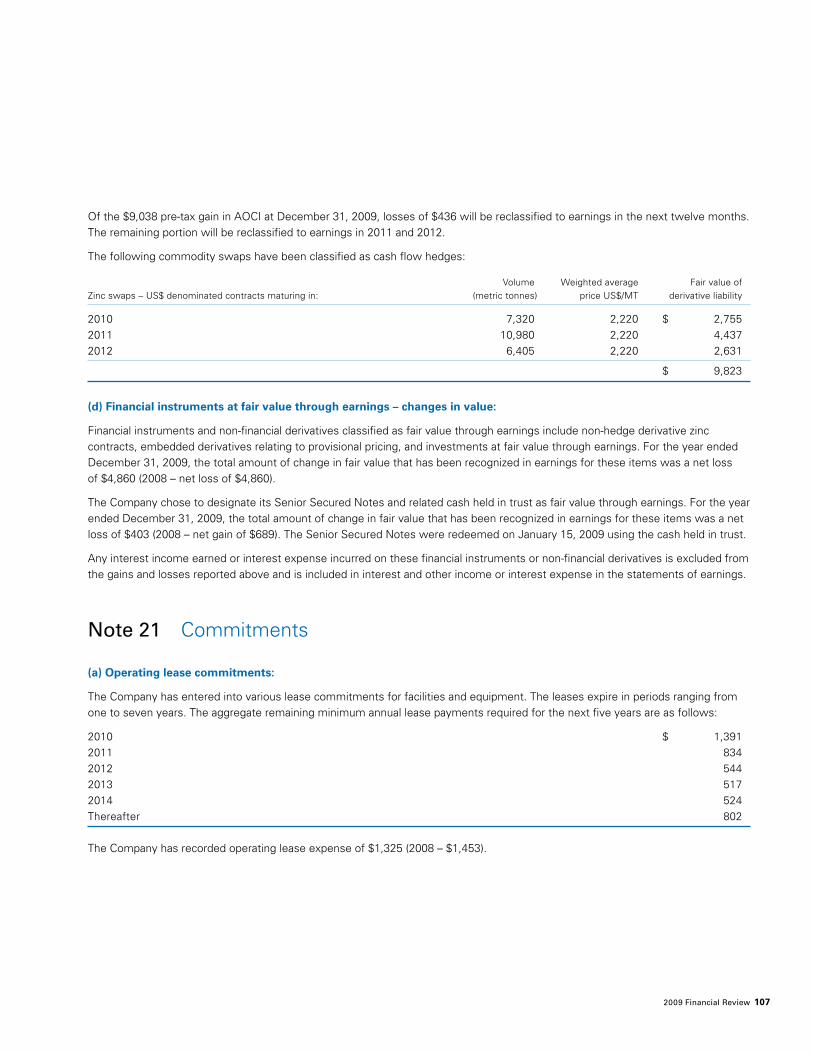
Of the $9,038 pre‑tax gain in AOCI at December 31, 2009, losses of $436 will be reclassified to earnings in the next twelve months. The remaining portion will be reclassified to earnings in 2011 and 2012.
The following commodity swaps have been classified as cash flow hedges:
Volume Weighted average Fair value of Zinc swaps – US$ denominated contracts maturing in: (metric tonnes) price US$/MT derivative liability
2010 7,320 2,220 $ 2,755 2011 10,980 2,220 4,4372012 6,405 2,220 2,631
$ 9,823
(d) Financial instruments at fair value through earnings – changes in value:
Financial instruments and non‑financial derivatives classified as fair value through earnings include non‑hedge derivative zinc contracts, embedded derivatives relating to provisional pricing, and investments at fair value through earnings. For the year ended December 31, 2009, the total amount of change in fair value that has been recognized in earnings for these items was a net loss of $4,860 (2008 – net loss of $4,860).
The Company chose to designate its Senior Secured Notes and related cash held in trust as fair value through earnings. For the year ended December 31, 2009, the total amount of change in fair value that has been recognized in earnings for these items was a net loss of $403 (2008 – net gain of $689). The Senior Secured Notes were redeemed on January 15, 2009 using the cash held in trust.
Any interest income earned or interest expense incurred on these financial instruments or non‑financial derivatives is excluded from the gains and losses reported above and is included in interest and other income or interest expense in the statements of earnings.
Note 21 Commitments
(a) Operating lease commitments:
The Company has entered into various lease commitments for facilities and equipment. The leases expire in periods ranging from one to seven years. The aggregate remaining minimum annual lease payments required for the next five years are as follows:
2010 $ 1,391 2011 834 2012 544 2013 517 2014 524 Thereafter 802
The Company has recorded operating lease expense of $1,325 (2008 – $1,453).
107 2009 Financial Review

Notes to Consolidated Financial Statements
(b) Buy‑sell commitments:
The Company has an agreement to purchase zinc concentrates to be delivered to Flin Flon. The contract contemplates delivery of up to 25,000 dry metric tonnes in 2010.
Payment for the above‑mentioned purchased concentrates is based on the market price of contained metal during a quotational period following delivery of the concentrate, less a fixed treatment and refining credit. If the Company cannot process the contracted tonnage in a timely manner, management believes the Company will be able to negotiate alternate arrangements for the sale or diversion of the tonnage.
The Company relies partly on processing purchased concentrates to contribute to operating earnings by covering a portion of fixed costs. The continued availability of such concentrates at economic terms beyond the expiry of current existing contracts cannot be determined at this time.
(c) Other commitments and agreements:
(i) With respect to the Callinan Mines Limited claims, the Company is subject to a royalty payment of $0.25 per ton of ore milled and, if aggregate cash flow for the year and cumulative cash flow are positive, a net profits interest of 6 2/3% of the net proceeds of production. During 2007, cumulative cash flow became positive. Payments are made according to the terms of the agreement.
(ii) HBMS has a profit‑sharing plan whereby 10% of HBMS’s after‑tax earnings (excluding provisions or recoveries for future income and mining tax) calculated in accordance with Canadian generally accepted accounting principles for any given fiscal year will be distributed to all eligible employees in the Flin Flon / Snow Lake operations, with the exception of executive officers and key management personnel. An expense of $8,124 (2008 – $21,315) has been included in these financial statements.
(iii) In the normal course of operations, the Company provides indemnifications that are often standard contractual terms to counterparties in transactions, such as purchase and sale contracts, service agreements and leasing transactions. These indemnification provisions may require the Company to compensate the counterparties for costs incurred as a result of various events, including environmental liabilities, changes in (or in the interpretation of) laws and regulations, or as a result of litigation claims or statutory sanctions that may be suffered by the counterparty as a consequence of the transaction. The terms of these indemnification provisions will vary based upon the contract, the nature of which prevents the Company from making a reasonable estimate of the maximum potential amount that could be required to pay to counterparties. Historically, the Company has not made any significant payments under such indemnification provisions. Management estimates that there are no significant liabilities with respect to these indemnification provisions.
(iv) The Company has outstanding letters of credit in the amount of $57,604. Of this amount, $40,479 represents security provided by HBMS to the Provinces of Saskatchewan and Manitoba for reclamation undertakings, and $2,454 represents letters of credit provided by HMI Nickel, as described in note 21(c)(viii).
(v) In 2003, the Company established St. Lawrence as a wholly‑owned subsidiary. St. Lawrence was incorporated in the State of New York for the purposes of acquiring the Balmat zinc mine. On September 24, 2003, St. Lawrence purchased the Balmat zinc mine and related assets located in upper New York State. The asset purchase agreement requires the Company to pay a cash purchase price of 30% of annual positive future net free cash flow from Balmat mine operations, after allowing for reasonable capital and exploration expenditures, subject to a “cap” of US$25 million. The agreement also places certain restrictions on the purchased assets until payment of the “cap” has been reached. The Company has placed the Balmat mine on care and maintenance. Based on the purchase agreement calculation, the mine has not generated positive cash flow, and no cash purchase price has been paid or accrued.
(vi) In the normal course of operations, the Company negotiates exploration option agreements with other companies whereby the Company and its subsidiaries may either grant options or obtain options on exploration properties.
108 HudBay Minerals Inc.

(vii) The Company’s subsidiary, HBMS, has Collective Bargaining Agreements (“CBA”) in place with its unionized Flin Flon / Snow Lake workforce. In 1998, HBMS entered into an Amending Agreement that prohibits strikes and lockouts and provides for binding arbitration through the negotiations of 2012 in the event that negotiated CBA settlements are not achieved.
(viii) As a result of the Company’s acquisition of HMI Nickel on August 26, 2008, the Company became subject to additional commitments, as follows:
• Throughitssubsidiaries,theCompanyenteredintoanumberofprocurementcontractsrelatedtotheconstructionoftheFenix project. As of December 31, 2009, the remaining purchase obligations associated with those contracts total US$2,173 and are due within one year.
• CGNandSkyeResources(B.V.I.)Inc.enteredintolong‑termagreementswithsubsidiariesofDukeEnergyInternational LLC for the supply of electrical power and construction of a new power transmission line for the Fenix project and its interconnection with the Guatemalan transmission grid. Under the terms of the agreements, the Company provided a letter of credit of US$5,000 supported by a restricted bank deposit. On February 27, 2009, these agreements were cancelled. The agreements included cancellation costs of approximately US$2,000 which were paid in 2009 and the letter of credit was cancelled. These agreements also specified a contingent obligation to purchase certain transmission line development assets upon contract cancellation and these assets were purchased in 2009 at a cost of US$5,000.
• TheCompanyhasacontingentcommitmenttomakepaymentstoValeIncobasedontonnagesoforeminedfromthemining licence areas at the Fenix project and, if a ferro‑nickel plant is operated, to pay a sales agency fee and make certain payments on any ferro‑nickel produced based on a net smelter return formula.
• TheCompanyisrequiredtoprovidebondstotheGovernmentofGuatemalainrespectofsecurityforCGN’scommitmentsunder an approved Environmental Impact Assessments program. As at December 31, 2009, these bonds are supported by a letter of credit of US$2,335, which in turn is supported by a restricted bank deposit.
Note 22 Contingencies
The Company and its subsidiaries are involved in various claims and litigation arising in the ordinary course and conduct of business. As the outcomes are uncertain, no amounts have been recorded in these consolidated financial statements. The significant claims and litigation matters are as follows:
(a) Statements of claim were filed against Saskatchewan Power Corporation (“SaskPower”), HBMS and Churchill River Power Company Limited (“CRP”) on February 10, 1995, seeking an aggregate of $1 billion in compensatory damages and in excess of $100 million in punitive damages. These claims were filed in connection with the use and operation of the Whitesand Dam and the Island Falls Hydro Electric Station in Saskatchewan, which were transferred by CRP, formerly a wholly‑owned subsidiary of HBMS, to SaskPower in 1981. Based on the current knowledge of management, the ultimate resolution of the claims will not be material to the Company’s financial position.
(b) On December 20, 2004, a Statement of Claim was filed by the Peter Ballantyne Cree Nation against SaskPower, the Government of Canada and the Province of Saskatchewan. The action claims damages alleged as a result of the operation and use of the Whitesand Dam and Island Falls Hydro‑Electric Station. HBMS and CRP have both been named as third parties in the action by SaskPower. It has come to HudBay’s attention that CRP, a former subsidiary of HBMS that was dissolved, has been revived by SaskPower for the purpose of taking legal action against CRP for alleged breaches by CRP of its obligations under a certain Purchase and Sale Agreement made in 1981. At present, the resolution of the claims against CRP and HBMS is not reasonably determinable.
(c) On March 2, 2007, a Statement of Claim was issued in the Manitoba Court of Queen’s Bench by Callinan Mines Limited against HBMS seeking declaratory relief, an accounting and an undisclosed amount of damages in connection with a Net Profits Interest and Royalty Agreement between HBMS and Callinan Mines Limited dated January 1, 1988. HBMS has retained legal counsel and the likelihood of success and materiality of this claim is not reasonably determinable. See note 21(c)(i) for more information.
109 2009 Financial Review
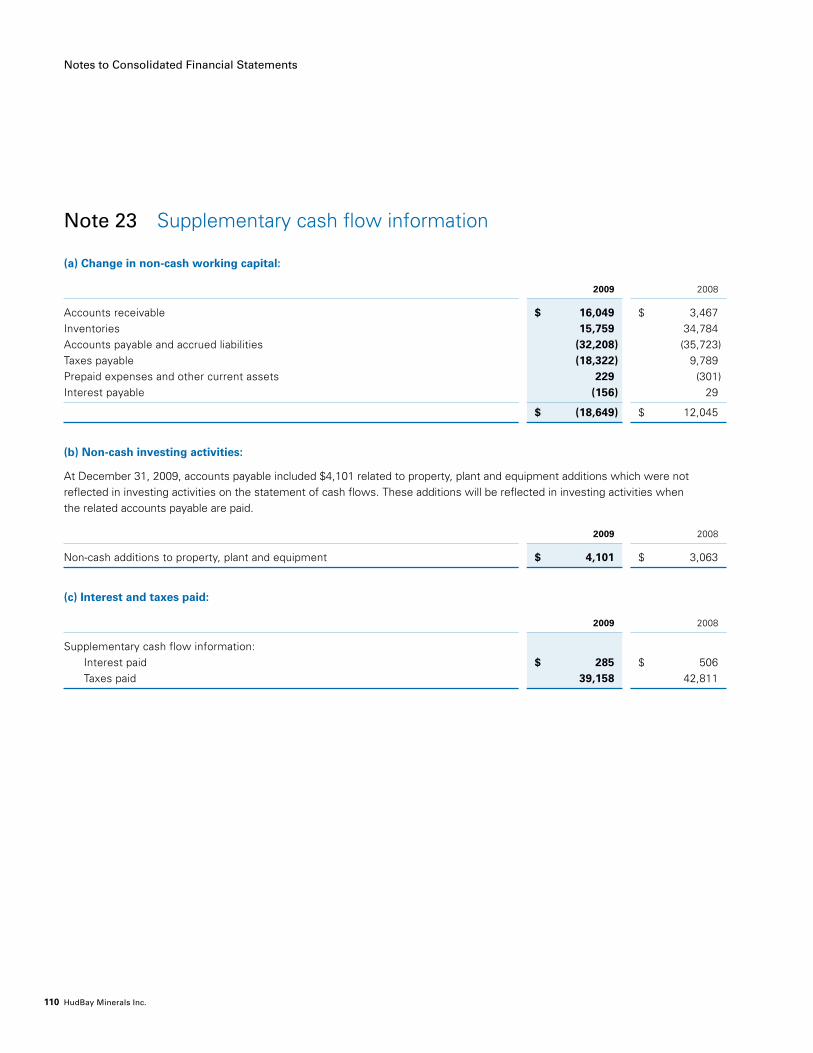
Notes to Consolidated Financial Statements
Note 23 Supplementary cash flow information
(a) Change in non‑cash working capital:
2009 2008
Accounts receivable $ 16,049 $ 3,467 Inventories 15,759 34,784 Accounts payable and accrued liabilities (32,208) (35,723)Taxes payable (18,322) 9,789 Prepaid expenses and other current assets 229 (301) Interest payable (156) 29
$ (18,649) $ 12,045
(b) Non‑cash investing activities:
At December 31, 2009, accounts payable included $4,101 related to property, plant and equipment additions which were not reflected in investing activities on the statement of cash flows. These additions will be reflected in investing activities when the related accounts payable are paid.
2009 2008
Non‑cash additions to property, plant and equipment $ 4,101 $ 3,063
(c) Interest and taxes paid:
2009 2008
Supplementary cash flow information: Interest paid $ 285 $ 506 Taxes paid 39,158 42,811
110 HudBay Minerals Inc.

Note 24 Segmented information
HudBay is a Canadian‑based, integrated base metals mining, metallurgical processing and refining company. When making decisions on expansions, opening or closing mines, as well as day‑to‑day operations, management evaluates the profitability of the overall operation of the Company. The Company’s main mining operations are located in Manitoba and Saskatchewan. Activities related to the Company’s HMI Nickel site in Guatemala and Balmat mine in New York State, due to their geographical distance, receive separate attention in certain areas. The HMI Nickel segment relates mainly to the Fenix nickel project. The Balmat segment consists of a zinc mine and concentrator, which have been on care and maintenance since August 22, 2008. Included in “Other” are the Company’s Manitoba, Saskatchewan, Michigan and Ontario locations, including head office activities. Accounting policies for all segments are the same as those described in note 2.
2009
HMI Nickel Balmat Other Total
Revenue from external customers $ 236 $ 1,402 $ 719,084 $ 720,722 Depreciation and amortization 175 – 100,556 100,731 (Loss) earnings before the following: (10,542) (6,390) 59,974 43,042 Exploration (205) (791) (6,613) (7,609)Interest and other income 34 2,576 104,776 107,386 Other – – (917) (917)
(Loss) earnings before tax (10,713) (4,605) 157,220 141,902 Tax (benefit) expense (2,421) – 31,552 29,131
Net (loss) earnings for the year (8,292) (4,605) 125,668 112,771
Total assets* 388,450 4,093 1,639,724 2,032,267 Property, plant and equipment 376,028 – 442,606 818,634 Additions to property, plant and equipment1 11,341 – 90,573 101,914
*Total assets do not reflect intercompany balances, which have been eliminated on consolidation.
1. Additions to property, plant and equipment represent cash additions only. For non‑cash additions, see note 23b.
2008
HMI Nickel Balmat Other Total
Revenue from external customers $ – $ 21,410 $ 960,484 $ 981,894 Depreciation and amortization 218 8,895 79,182 88,295 (Loss) earnings before the following: (10,707) (27,035) 241,696 203,954 Exploration (94) (2,298) (23,191) (25,583)Interest and other income 274 65 25,878 26,217 Asset impairment losses – (27,237) (3,196) (30,433) Share of losses of equity investee – – (3,915) (3,915) Other – – (589) (589)
(Loss) earnings before tax (10,527) (56,505) 236,683 169,651 Tax expense 15 – 96,283 96,298
Net (loss) earnings for the year (10,542) (56,505) 140,400 73,353
Total assets* 454,715 5,463 1,458,175 1,918,353 Property, plant and equipment 361,935 – 455,944 817,879 Additions to property, plant and equipment1 29,166 10,213 108,401 147,780
*Total assets do not reflect intercompany balances, which have been eliminated on consolidation.
1. Additions to property, plant and equipment represent cash additions only. For non‑cash additions, see note 23b.
111 2009 Financial Review

Notes to Consolidated Financial Statements
The Company’s revenue by significant product types:
2009 2008
Copper $ 351,275 $ 551,466 Zinc 174,219 200,185 Gold 102,482 93,480 Silver 34,526 26,973 Other 58,220 109,790
$ 720,722 $ 981,894
The above revenues include revenues from the sale of metal produced from purchase of concentrates of:
2009 2008
Copper $ 56,755 $ 143,032 Zinc 58,604 15,770 Gold 389 777 Silver 17,497 13,664
During the year ended December 31, 2009, one customer accounted for approximately 13% of total revenues.
Note 25 Interest and other income
2009 2008
Interest income $ 4,745 $ 27,174 Gain on sale of interest in Lundin 100,217 – Other income 2,578 – Interest expense (154) (957)
$ 107,386 $ 26,217
112 HudBay Minerals Inc.

W. Warren HolmesExecutive Vice Chairman and Interim CEO
Mr. Holmes is vice chairman and director of Atlanta Gold Inc. and a director of Nuinsco Resources Limited and Victory Nickel Inc., and Foraco International Mr. Holmes has 40 years of mining industry experience, including 24 years with Noranda Inc. (1964–1986) where he was vice president and general manager of Pamour Porcupine Mines Limited and 16 years with Falconbridge Limited (1986–2002) where he became senior vice president of Canadian Mining Operations. He is also a past president of the Canadian Institute of Mining and Metallurgy.
David S. Bryson, CFA Senior Vice President and Chief Financial Officer
Mr. Bryson joined HudBay in 2008 from Skye Resources Inc. where he held the position of chief financial officer. He has an extensive background in corporate treasury and development having had a lengthy career at Terasen Inc. where he served as its treasurer. Mr. Bryson holds a Bachelor of Commerce (Finance) from the University of British Columbia and is a Chartered Financial Analyst.
Tom A. Goodman Senior Vice President, Operations
Mr. Goodman is a graduate in Chemical and Metallurgical Technology from the British Columbia Institute of Technology. He has worked for HudBay for over 30 years in a wide variety of operational, technical, and management positions. Mr. Goodman is a member of the Canadian Institute of Mining, Metallurgy and Petroleum and the Minerals, Metals & Materials Society.
Alan T. C. HairSenior Vice President, Development
Mr. Hair graduated from the University of Leeds, England in 1983 with a Bachelor of Science Honours degree in Mineral Engineering. Since joining HudBay in 1996, Mr. Hair has held several management roles in HudBay. Prior to joining HudBay, he worked in European base metals and African platinum group operations.
H. Maura Lendon Senior Vice President, General Counsel and Corporate Secretary
Ms. Lendon has extensive experience in the areas of international business transactions, regulatory compliance, corporate governance and advocacy. Prior to joining HudBay, Ms. Lendon was chief counsel Canada, chief privacy officer – Canada for AT&T, a global telecommunications company. She holds a Master of Laws from Osgoode Hall Law School, a Master of Business Administration from the Richard Ivey School of Business and a Bachelor of Laws from University of Western Ontario. She has been a member of the Ontario Bar since 1990.
Brad W. Lantz Vice President, Mining
Mr. Lantz joined HudBay in 1987 and was appointed vice president, mining in September 2007. During his career, Mr. Lantz has held positions of progressively greater responsibility at the Ruttan, Trout Lake, Callinan and 777 mines. Prior to joining the company, Mr. Lantz worked with Sherritt Gordon Mines Limited. Mr. Lantz graduated from the University of Waterloo in 1982, with an Honours Bachelor of Science in Earth Sciences.
Cashel MeagherVice President, Exploration
Mr. Meagher joined Hudbay in November, 2008 and was promoted to the role of Vice President, Exploration in March, 2010. He has an extensive background in precious metal and base metal exploration, resource and reserve estimation, engineering studies and open pit and underground operations. Prior to joining Hudbay, Mr. Meagher held management positions with Vale Inco in exploration, technical services, business analysis and mine operations. He graduated in 1994 with a Bachelor of Science Joint Advanced Major degree in Geology and Chemistry from Saint Francis Xavier University, and he is a member in good standing with the Association of Professional Geoscientists of Ontario.
John VincicVice President, Investor Relations and Corporate Communications
Mr. Vincic joined HudBay in August, 2009 and he brings more than 15 years of combined experience in investor relations and corporate communications to this role. In this position he is also responsible for overseeing government relations, corporate social responsibility reporting and brand management. Most recently, he worked at one of Canada’s leading investor relations consulting firms where he advised a cross‑section of clients on issues that included ongoing investor engagement strategies, IPO communications, mergers and acquisitions and special situations.
John D. Bracale Country Manager, Guatemala and President, Compañía Guatemalteca de Níquel, S.A.
Mr. Bracale is an experienced mining executive with over 30 years experience in the mining industry in Latin America and the Pacific Rim. He was most recently a director and vice president of Latin America for Gold Hawk Resources Inc., as well as executive president of their Peruvian subsidiary Compania Minera San Juan. He has also served as vice president of Latin America for Breakwater Resources, Ltd.; senior vice president of Latin American Operations for Arimetco International, Inc.; and president of American Pacific Honduras Inc.
Strong Management
113 2009 Financial Review

Corporate and Shareholders’ Information
HudBay Minerals
Dundee Place 1 Adelaide Street East Suite 2501 Toronto, Ontario M5C 2V9
Telephone: 416 362‑8181 Facsimile: 416 362‑7844
Listing
Toronto Stock Exchange Trading Symbol: HBM
Investor and General Public Inquiries
John Vincic Vice President, Investor Relations and Corporate Communications
Telephone: 416 362‑0615 Facsimile: 416 362‑7844
Email: [email protected]
Transfer Agent
Equity Transfer & Trust Company 200 University Avenue Suite 400 Toronto, Ontario M5H 4H1
Telephone: 416 361‑0930 Toll Free: 1 866 393‑4891 Facsimile: 416 361‑0470
Auditors
Deloitte & Touche LLP 181 Bay Street Suite 1400 Toronto, Ontario M5J 2V1
Annual General Meeting
June 24, 2010 10 a.m. ET Toronto, Ontario
Cautionary Note Regarding Forward‑Looking InformationThis annual review contains “forward‑looking information”, within the meaning of applicable Canadian securities legislation. Forward‑looking information includes, but is not limited to, information with respect to HudBay’s ability to execute its strategic plan, exploration expenditures and activities and the possible success of such exploration activities, including at its Lalor deposit, the estimation of mineral reserves and resources, the realization of mineral estimates, the timing and amount of estimated future production, costs of production, capital expenditures, costs and timing of the development of new deposits and the ability to recommence suspended operations, mineral pricing, reclamation costs, the economic outlook, currency fluctuations, government regulation of mining operations, environmental risks, mine life projections, plans to close HudBay’s copper smelter, the availability of third party concentrate, business and acquisition strategies, and the ability to meet safety and environmental targets. Often, but not always, forward‑looking information can be identified by the use of forward‑looking words like “plans”, “expects”, or “does not expect”, “is expected”, “budget”, “scheduled”, “estimates”, “forecasts”, “intends”, “understands”, “anticipates”, or “does not anticipate”, or “believes” or variations of such words and phrases or statements that certain actions, events or results “may”, “could”, “would”, “might”, or “will be taken”, “occur”, or “be achieved”. Forward‑looking information is based on the opinions and estimates of management as of the date such information is provided and is subject to known and unknown risks, uncertainties and other factors that may cause the actual results, level of activity, performance or achievements of HudBay to be materially different from those expressed or implied by such forward‑looking information, including risks associated with the mining industry such as economic factors (including future commodity prices, currency fluctuations and energy prices), failure of plant, equipment, processes and transportation services to operate as anticipated, dependence on key personnel and employee relations, environmental risks, government regulation, actual results of current exploration activities, possible variations in ore grade or recovery rates, permitting timelines, capital expenditures, reclamation activities, land titles, and social and political developments and other risks of the mining industry as well as those risk factors discussed or referred to in HudBay’s Annual Information Form for the year ended December 31, 2009 under the heading “Risk Factors”. Although HudBay has attempted to identify important factors that could cause actual results to differ materially from those contained in forward‑looking information, there may be other factors that cause results not to be as anticipated, estimated or intended. There can be no assurance that forward‑looking information will prove to be accurate, as actual results and future events could differ materially from those anticipated in such information. Accordingly, readers should not place undue reliance on forward‑looking information. HudBay does not undertake to update any forward‑looking information, except as required by applicable securities laws, or to comment on analyses, expectations or statements made by third parties in respect of HudBay, its financial or operating results or its securities.
Cautionary Note to United States Investors Concerning Estimates of Measured, Indicated and Inferred ResourcesThis annual review uses the terms “measured”, “indicated” and “inferred” resources. United States investors are advised that while such terms are recognized and required by Canadian regulations, the United States Securities and Exchange Commission does not recognize them. “Inferred mineral resources” have a great amount of uncertainty as to their existence, and as to their economic and legal feasibility. It cannot be assumed that all or any part of an inferred mineral resource will ever be upgraded to a higher category. Under Canadian rules, estimates of Inferred Mineral Resources may not form the basis of feasibility or other economic studies. United States investors are cautioned not to assume that all or any part of measured or indicated mineral resources will ever be converted into Mineral Reserves. United States investors are also cautioned not to assume that all or any part of an Inferred Mineral Resource exists, or is economically or legally mineable.
114 HudBay Minerals Inc.

Des
ign:
Cra
ib D
esig
n &
Com
mun
icat
ions
w
ww
.cra
ib.c
om
Pri
nted
in C
anad
a

“ HudBay’s solid operational platform, exciting
development prospects and robust financial
position strongly position the company to
continue profitable growth.”
W. Warren Holmes
Executive Vice Chairman and Interim Chief Executive Officer
www.hudbayminerals.com


![Averroës decisive treatise [butterworth]](https://img.pdfslide.us/doc/110x75/5790572f1a28ab900c9c525b/averroes-decisive-treatise-butterworth.jpg)