Embed Size (px)
Citation preview
Centrum Wealth Research is also available on: Bloomberg: CBWM <GO>, Thomson Reuters, Capital IQ and Factset
Please refer to important disclosures/disclaimers inside
Wealth Research April 5, 2017
Initiation Vardhman Textiles Ltd
Building on better growth prospects Accumulate
Vardhman Textiles Ltd (VTL) is a leading textile manufacturing company having presence across a wide spectrum – from manufacturing yarns to fabrics. VTL is a leading manufacturer and exporter of cotton yarn in India. The company has expanded its product portfolio (forayed into fabric & threads) and has entered into strategic alliances with leading global textile players helping the company gain access to latest technology. This has been in synergy with VTL’s business and has helped it to introduce innovative and value-added products in the market, which are expected to drive business momentum. In order to focus on its core business of yarn and fabrics, VTL has sold 40% stake (of 51%) in its subsidiary Vardhman Yarns & Threads Ltd - VYTL (sewing threads business) to its JV partner for ₹396 crore. The company’s consolidation mode along with capacity expansion in the fabric space are key triggers for future business growth.
Valuation and View: With an aim to cater to the increasing demand and add more value to its products, VTL is currently amidst expanding its capacity mainly in the fabric segment. This will help tap the opportunity in the high margin fabric segment. The company enjoys steady EBITDA margins (~20%), low debt to equity (~0.6x) and decent return profile – RoE (~16%). Although the top-line for FY17 is likely to be subdued owing to the full capacity utilization and demonetization impact on domestic market, the same is likely to pick up FY18 onwards. Currently, VTL trades at 9x P/E on FY19E basis. We initiate coverage on the stock with an Accumulate rating and a target price of ₹1,641, valuing it at 11x its FY19E EPS.
Focus on prospects in the high margin fabric business: VTL’s core business – Yarn and Fabric contributed 51% and 30% to FY16 product sales. The company’s yarn business caters equally to the domestic, international and captive fabric consumption. This segment has been witnessing over capacity leading to restricted margins and low returns. With an aim to expand its product basket, VTL is now focussing on the fabric segment which offers value added products. We believe this will help maintain EBITDA margins of 20-21% going forward (from 19.8% in FY16).
Benefits of capacity expansion: VTL is currently operating at optimum capacity, which could result in muted revenue growth for FY17. As the yarn segment is more volatile, the company is looking at expanding capacity in the better margin fabric space. VTL plans to incur a capex of ₹1,000 crore over FY16-19, of which ₹600 crore is for fabric capacity expansion. Post the capex, grey fabric capacity will increase to 210 million metres (mm) from 170 mm currently and processed fabric capacity will increase to 150 mm from 110 mm now (including 18 mm of printed fabric line). We anticipate benefits of the capacity expansion to be seen over the next 2-3 years.
Despite capex, good balance sheet position: In spite of incurring a capex over the last 5 years, VTL has been able to reduce its debt/equity ratio from 1.2x in FY12 to 0.6x in FY16. In addition further capex entailed would not disturb the ratio as most of the debt is under TUF scheme. During FY17, VTL has sold 40% stake (of 51%) in its subsidiary VYTL to its JV partner for ₹396 crore. We anticipate this to help fund VTL’s business expansion plan.
Risk factors: 1) Lack of government policies (domestic and international), 2) Volatility in raw material prices, 3) Slower off-take in demand, 4) Lack of availability of skilled labour.
Key Data
Current Market Price (₹) 1,349
Target Price (₹) 1,641
Potential upside 21.7%
Sector Relative to Market In-line
Stock Relative to Sector In-line
Stock Information
BSE Code 502986 0POWERppphfkjhkj
h NSE Code VTL
Face Value (₹/Share) 10.0
No. of shares (Cr.)* 5.5
Market Cap (₹ Cr.) 7,738
Free float (₹ Cr.) 2,923
52 Week H / L (₹) 1,440 / 778
Avg. Daily turnover (12M, ₹ Cr.) 5.4
*Adjusted for buy back and treasury stock
Shareholding Pattern (%)
Dec-16 Dec-15
Promoters 62.2 61.9
Mutual Funds 11.5 11.7
FPIs 11.4 12.2
Others 14.9 14.2
Price Performance
80
100
120
140
160
180
Apr-16 Jul-16 Oct-16 Jan-17 Apr-17
Vardhman Textiles S&P BSE 500
Price Performance (%)
1M 3M 6M 12M
Vardhman Textiles 1.3 21.6 26.4 72.4
S&P BSE 500 5.2 15.0 6.9 25.0
Source: Bloomberg, Centrum Wealth Research
Mrinalini Chetty, Research Analyst
Siddhartha Khemka, Sr. VP Research
Financial Summary - Consolidated Y/E Mar (₹ Cr.) Revenue YoY (%) EBITDA EBITDA (%) Adj.PAT YoY (%) EPS (₹) P/E (x) EV/EBITDA (x) RoE (%)
FY15A 6,786 10.0 1,113 16.4 400 (44.3) 73.2 18.4 7.8 12.3 FY16A 6,637 (2.2) 1,315 19.8 579 44.6 105.9 12.7 6.9 16.0 FY17E 6,167 (7.1) 1,413 22.9 741 28.1 135.6 10.0 6.1 19.5 FY18E 6,649 7.8 1,390 20.9 718 -3.2 131.3 10.3 6.1 17.8 FY19E 7,437 11.9 1,534 20.6 815 13.6 149.2 9.0 5.2 17.6
Source: Company, Centrum Wealth Research
Vardhman Textiles Ltd.
Centrum Broking Ltd. 2
Centrum Wealth Research
About the company
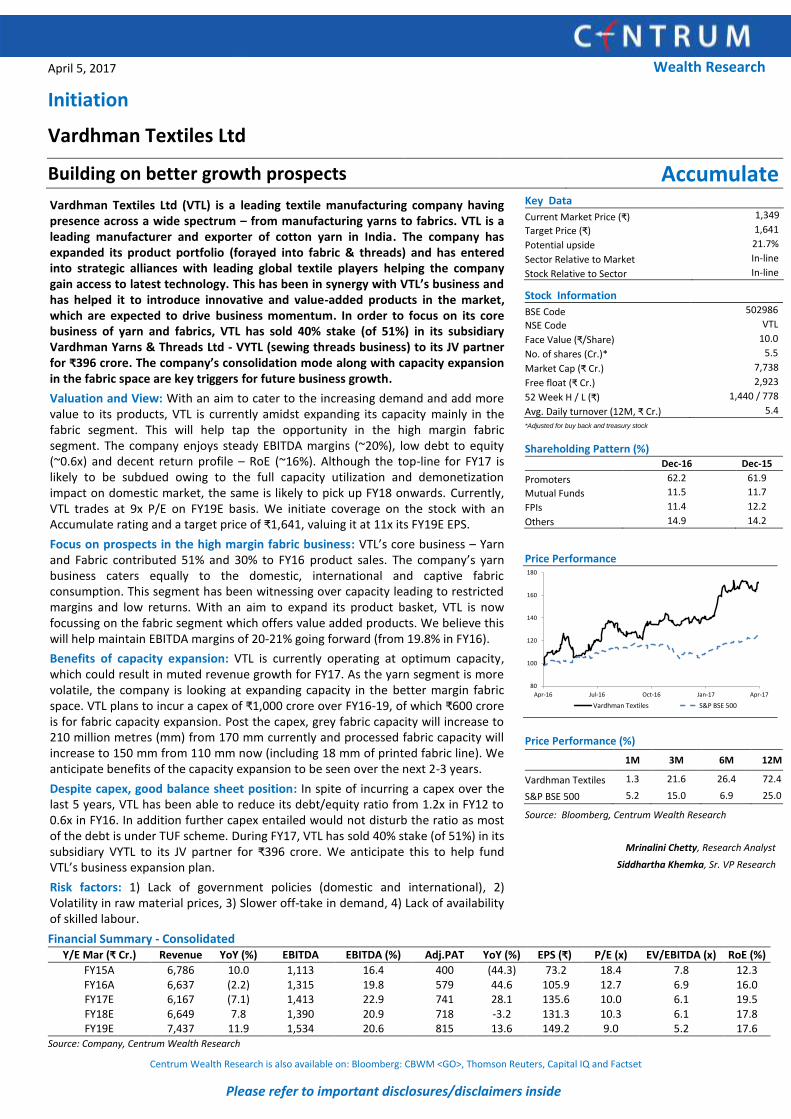
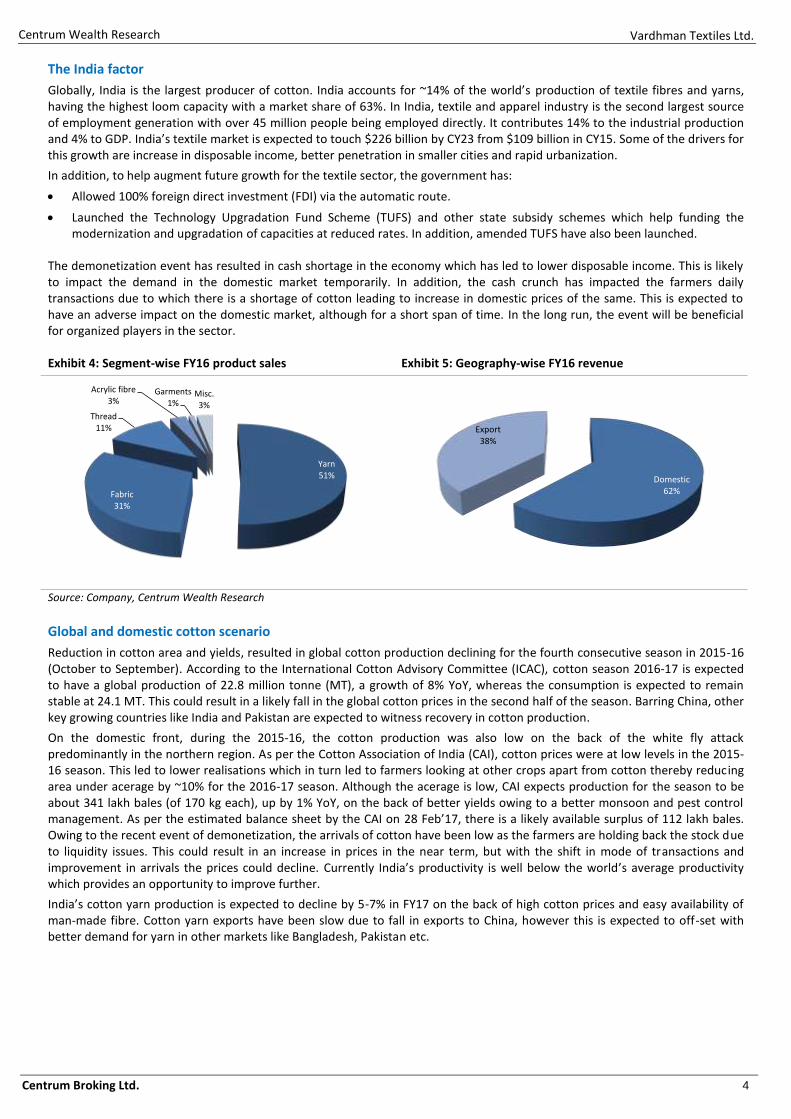
Vardhman Textiles Ltd (VTL), erstwhile Mahavir Spinning Mills Ltd, is one of the largest vertically integrated textile company in India having presence across the entire value chain – from manufacturing of fibres and yarns to sewing threads and fabrics. It’s business segments include Textiles (97% of FY16 revenue) and Fibre (3%). The company’s product portfolio includes Yarn (51% of FY16’s product sales), Processed fabric (25%), Thread (11%), Fabric (6%), Acrylic fibre and tow (3%), Garments (1%) and Miscellaneous (3%). Apart from the domestic market (62% of FY16 revenue), VTL caters to international markets like the European Union, the United States and the Far East.
VTL has 22 manufacturing facilities across India and is the largest yarn manufacturer having a capacity of over 1 million spindles (including 7,188 rotors) and 1,316 looms. It is also a leading manufacturer and exporter of cotton yarn as well as a leading manufacturer of piece-dyed fabric. VTL is also the second largest producer of sewing threads and market leader in the area of hand-knitted yarns. In order to expand its presence the company has formed strategic global alliances with leading textile companies like American & Efird Global LLC (USA), Marubeni Corporation, Japan and Nisshinbo Textile, Inc., Japan
Exhibit 1: Corporate Structure
Vardhman Textiles Ltd1973
Vardhman Yarn & Threads Vardhman Special SteelsVardhman Acrylics VMT Spinning Co.Vardhman Nisshinbo
Garments Co.
VTL Stake
Business
Capacity
FY16 Revenue
Collaborations
Market Status
51%*
RMG/ Industrial/ SpecialityThreads
41 TPD Threads, 71,000
₹728 crore
A&E, USA
Unlisted
70.75%
Acrylic Staple Fibre
20,000 TPA
₹412 crore
-
Listed on BSE & NSE
89%
100% Cotton Yarn
46,320 spindles
₹157 crore
Marubeni, Japan
Unlisted
31%
Special Steels
Rolling 150,000 TPA
₹656 crore
-
Listed on BSE & NSE
51%
Garments
1.8 million pieces
₹58 crore
Nisshinbo, Japan
Unlisted
Source: Company, Centrum Wealth Research, *Announced 40% stake sale, TPD – tonne per day, TPA – tonne per annum
Exhibit 2: Key Management Personnel Name Designation Profile
S .P. Oswal Chairman & Managing Director (MD)
Is a M.Com. Gold Medalist from Punjab University Chandigarh and also holds directorships in 22 other companies. For his extensive contribution to the trade & industry, he was bestowed the Padma Bhushan Award by the Government.
Sachit Jain Jt. MD and MD Vardhman Special Steels Is a B.Tech from IIT (Delhi) and an MBA from IIM Ahmedabad. Holds directorships in 21 other companies. He has a rich experience of more than 25 years in textiles industry and with the company.
Suchita Jain Director Is a Masters in Commerce from Punjab University Chandigarh. Holds directorships in 13 other companies and has over 20 years of experience in the textile industry.
B K Choudhary MD, Vardhman Acrylics Ltd. Is the Director, Operations at Vardhman Fabrics Division, Managing Director in Vardhman Acrylics Ltd. Masters in Commerce from Meerut University and MBA from University of Jodhpur.
D L Sharma MD ,Vardhman Yarns And Threads Ltd Holds a B.Sc (Engineering) and MBA from Punjab Agricultural University, Ludhiana. He has more than 40 years of experience in the field of textiles and sewing threads with the Group.
Neeraj Jain Joint Managing Director & Head (Yarn Business)
Is a Chartered Accountant and a Graduate in Commerce from Ludhiana. Has extensive experience in the finance and yarns businesses within the group. He has more than 22 years of experience in the textiles industry and with the Group.
Rajeev Thapar CFO, Vardhman Group Holds a degree in Bachelors of Commerce and is a Chartered Accountant. He is associated with the Group since 1990.
Source: Company, Centrum Wealth Research
Vardhman Textiles Ltd.
Centrum Broking Ltd. 3
Centrum Wealth Research
Improving prospects for India’s textile industry
The textile industry is divided into two segments – yarn & fibre and processed fabric & garments. Being one of the basic necessity products, the textile sector is one of the key contributors to economic growth, both on the international and domestic front. Developed countries like US and European Union concentrate more on the consumption side where as emerging markets like China, India, Bangladesh, Vietnam focus on manufacturing owing to lower cost in these regions.
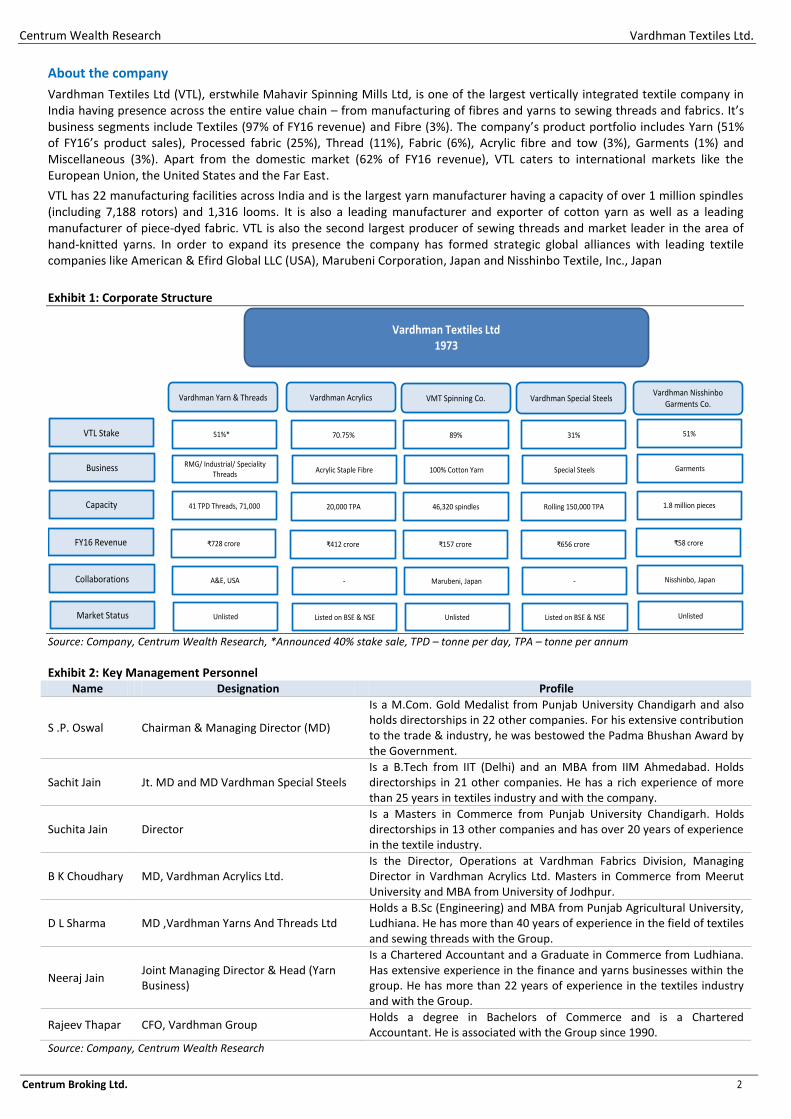
Among the emerging nations, currently China is a dominant player in the global textile trade. This however is likely to change owing to increasing labour and production cost in the region, offering a wide opportunity to India. In addition, the appreciation of Yuan against the USD vis a vis a depreciation of INR against the USD offers a competitive advantage to India in the export markets. We expect India to benefit from the cost competitiveness which could provide opportunities for the textile industry.
Exhibit 3: Top 10 exporters of textiles and clothing for CY15
109
64
17 1411 11 10 9 8 6
-2
-14
-6
-3
-13
-11
-6-7
-9
-3
-16
-14
-12
-10
-8
-6
-4
-2
0
0
20
40
60
80
100
120
China* EuropeanUnion (28)
India United States Turkey Republic ofKorea
ChineseTaipei
Hong Kong,China
Pakistan** Japan
(%)
($ B
illio
n)
Top 10 textile exporters
Exports (LHS) YoY Change (RHS)
175
112
26 22 18 18 15 7 6 6
-6
-11
6
10
-10
2
-9 -10
8
0
-15
-10
-5
0
5
10
15
0
50
100
150
200
China* EuropeanUnion (28)
Bangladesh** Vietnam** Hong Kong,China
India Turkey Indonesia** Cambodia** United States
(%)
($ B
illio
n)
Top 10 clothing exporters
Exports (LHS) YoY Change (RHS)
Source: World Trade Statistical Review, 2016,* Includes significant shipments through processing zones. **Includes Secretariat estimates
Vardhman Textiles Ltd.
Centrum Broking Ltd. 4
Centrum Wealth Research
The India factor
Globally, India is the largest producer of cotton. India accounts for ~14% of the world’s production of textile fibres and yarns, having the highest loom capacity with a market share of 63%. In India, textile and apparel industry is the second largest source of employment generation with over 45 million people being employed directly. It contributes 14% to the industrial production and 4% to GDP. India’s textile market is expected to touch $226 billion by CY23 from $109 billion in CY15. Some of the drivers for this growth are increase in disposable income, better penetration in smaller cities and rapid urbanization.
In addition, to help augment future growth for the textile sector, the government has:
Allowed 100% foreign direct investment (FDI) via the automatic route.
Launched the Technology Upgradation Fund Scheme (TUFS) and other state subsidy schemes which help funding the modernization and upgradation of capacities at reduced rates. In addition, amended TUFS have also been launched.
The demonetization event has resulted in cash shortage in the economy which has led to lower disposable income. This is likely to impact the demand in the domestic market temporarily. In addition, the cash crunch has impacted the farmers daily transactions due to which there is a shortage of cotton leading to increase in domestic prices of the same. This is expected to have an adverse impact on the domestic market, although for a short span of time. In the long run, the event will be beneficial for organized players in the sector.
Exhibit 4: Segment-wise FY16 product sales Exhibit 5: Geography-wise FY16 revenue
Yarn51%
Fabric31%
Thread 11%
Acrylic fibre3%
Garments 1%
Misc.3%
Domestic62%
Export38%
Source: Company, Centrum Wealth Research
Global and domestic cotton scenario
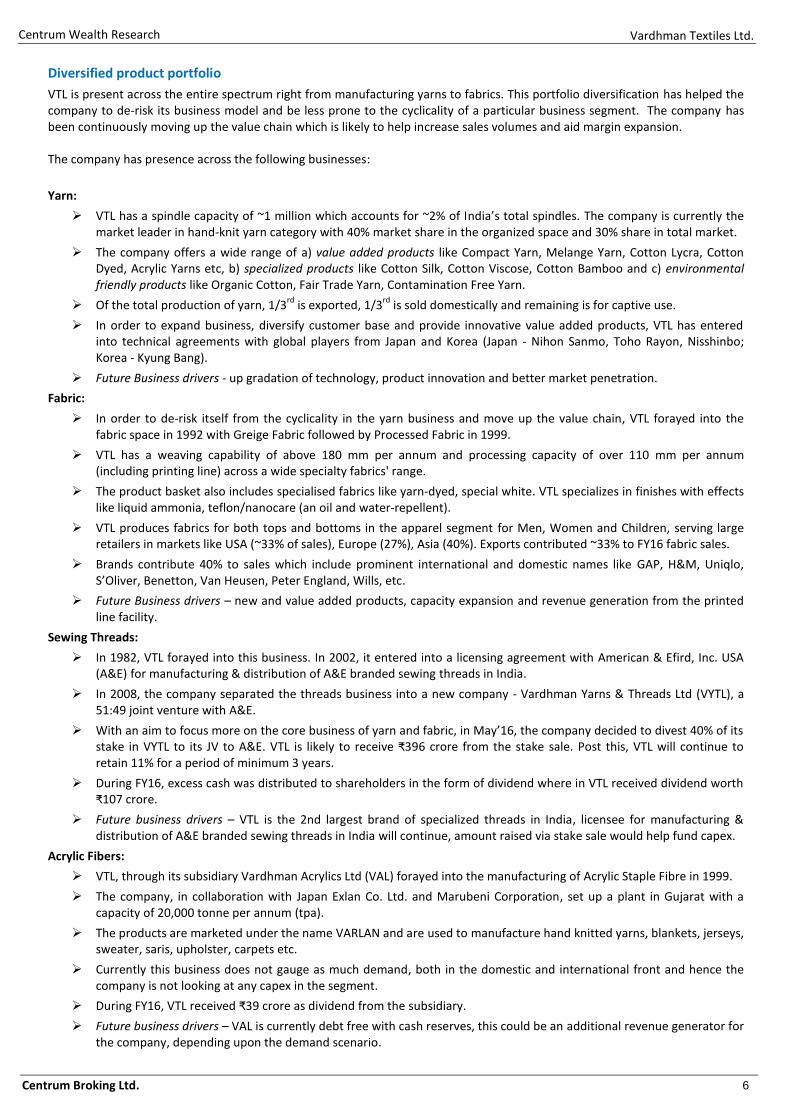
Reduction in cotton area and yields, resulted in global cotton production declining for the fourth consecutive season in 2015-16 (October to September). According to the International Cotton Advisory Committee (ICAC), cotton season 2016-17 is expected to have a global production of 22.8 million tonne (MT), a growth of 8% YoY, whereas the consumption is expected to remain stable at 24.1 MT. This could result in a likely fall in the global cotton prices in the second half of the season. Barring China, other key growing countries like India and Pakistan are expected to witness recovery in cotton production.
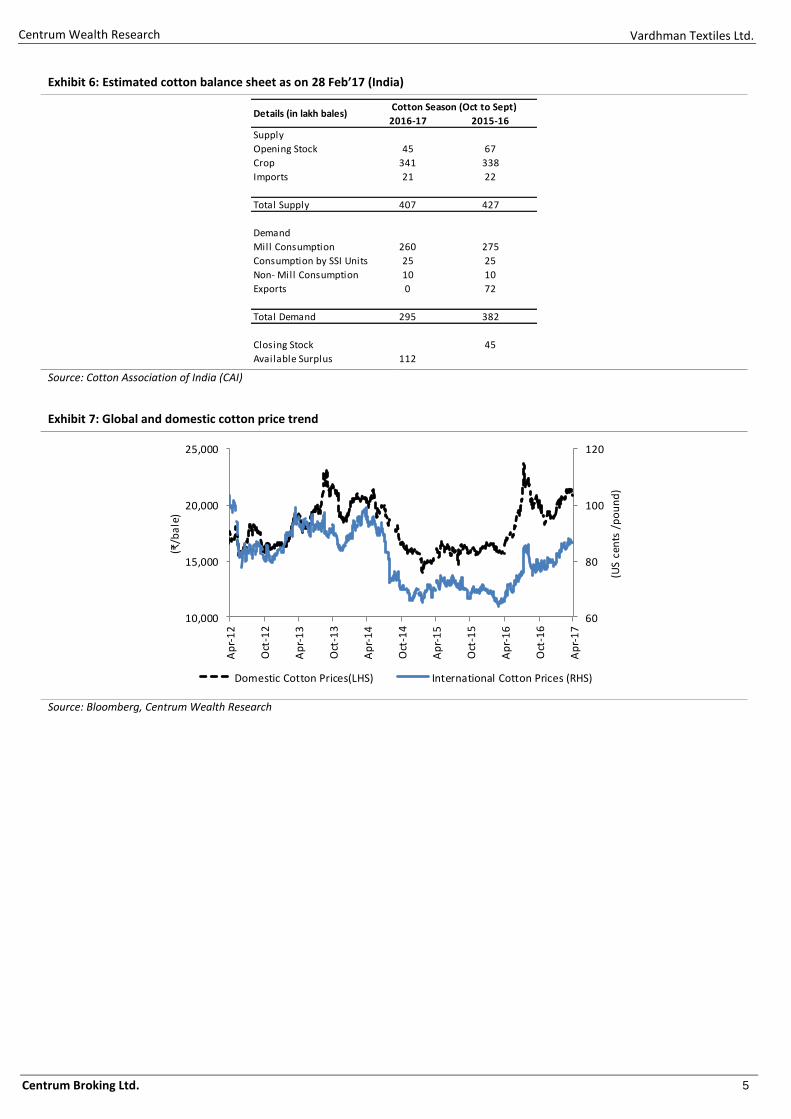
On the domestic front, during the 2015-16, the cotton production was also low on the back of the white fly attack predominantly in the northern region. As per the Cotton Association of India (CAI), cotton prices were at low levels in the 2015-16 season. This led to lower realisations which in turn led to farmers looking at other crops apart from cotton thereby reducing area under acerage by ~10% for the 2016-17 season. Although the acerage is low, CAI expects production for the season to be about 341 lakh bales (of 170 kg each), up by 1% YoY, on the back of better yields owing to a better monsoon and pest control management. As per the estimated balance sheet by the CAI on 28 Feb’17, there is a likely available surplus of 112 lakh bales. Owing to the recent event of demonetization, the arrivals of cotton have been low as the farmers are holding back the stock due to liquidity issues. This could result in an increase in prices in the near term, but with the shift in mode of transactions and improvement in arrivals the prices could decline. Currently India’s productivity is well below the world’s average productivity which provides an opportunity to improve further.
India’s cotton yarn production is expected to decline by 5-7% in FY17 on the back of high cotton prices and easy availability of man-made fibre. Cotton yarn exports have been slow due to fall in exports to China, however this is expected to off-set with better demand for yarn in other markets like Bangladesh, Pakistan etc.
Vardhman Textiles Ltd.
Centrum Broking Ltd. 5
Centrum Wealth Research
Exhibit 6: Estimated cotton balance sheet as on 28 Feb’17 (India)
2016-17 2015-16
Supply
Opening Stock 45 67
Crop 341 338
Imports 21 22
Total Supply 407 427
Demand
Mill Consumption 260 275
Consumption by SSI Units 25 25
Non- Mill Consumption 10 10
Exports 0 72
Total Demand 295 382
Closing Stock 45
Available Surplus 112
Details (in lakh bales)Cotton Season (Oct to Sept)
Source: Cotton Association of India (CAI)
Exhibit 7: Global and domestic cotton price trend
60
80
100
120
10,000
15,000
20,000
25,000
Ap
r-1
2
Oct
-12
Ap
r-1
3
Oct
-13
Ap
r-1
4
Oct
-14
Ap
r-1
5
Oct
-15
Ap
r-1
6
Oct
-16
Ap
r-1
7
(US
cen
ts /
po
un
d)
(₹/b
ale
)
Domestic Cotton Prices(LHS) International Cotton Prices (RHS)
Source: Bloomberg, Centrum Wealth Research
Vardhman Textiles Ltd.
Centrum Broking Ltd. 6
Centrum Wealth Research
Diversified product portfolio
VTL is present across the entire spectrum right from manufacturing yarns to fabrics. This portfolio diversification has helped the company to de-risk its business model and be less prone to the cyclicality of a particular business segment. The company has been continuously moving up the value chain which is likely to help increase sales volumes and aid margin expansion. The company has presence across the following businesses:
Yarn:
VTL has a spindle capacity of ~1 million which accounts for ~2% of India’s total spindles. The company is currently the market leader in hand-knit yarn category with 40% market share in the organized space and 30% share in total market.
The company offers a wide range of a) value added products like Compact Yarn, Melange Yarn, Cotton Lycra, Cotton Dyed, Acrylic Yarns etc, b) specialized products like Cotton Silk, Cotton Viscose, Cotton Bamboo and c) environmental friendly products like Organic Cotton, Fair Trade Yarn, Contamination Free Yarn.
Of the total production of yarn, 1/3rd
is exported, 1/3rd
is sold domestically and remaining is for captive use.
In order to expand business, diversify customer base and provide innovative value added products, VTL has entered into technical agreements with global players from Japan and Korea (Japan - Nihon Sanmo, Toho Rayon, Nisshinbo; Korea - Kyung Bang).
Future Business drivers - up gradation of technology, product innovation and better market penetration.
Fabric:
In order to de-risk itself from the cyclicality in the yarn business and move up the value chain, VTL forayed into the fabric space in 1992 with Greige Fabric followed by Processed Fabric in 1999.
VTL has a weaving capability of above 180 mm per annum and processing capacity of over 110 mm per annum (including printing line) across a wide specialty fabrics' range.
The product basket also includes specialised fabrics like yarn-dyed, special white. VTL specializes in finishes with effects like liquid ammonia, teflon/nanocare (an oil and water-repellent).
VTL produces fabrics for both tops and bottoms in the apparel segment for Men, Women and Children, serving large retailers in markets like USA (~33% of sales), Europe (27%), Asia (40%). Exports contributed ~33% to FY16 fabric sales.
Brands contribute 40% to sales which include prominent international and domestic names like GAP, H&M, Uniqlo, S’Oliver, Benetton, Van Heusen, Peter England, Wills, etc.
Future Business drivers – new and value added products, capacity expansion and revenue generation from the printed line facility.
Sewing Threads:
In 1982, VTL forayed into this business. In 2002, it entered into a licensing agreement with American & Efird, Inc. USA (A&E) for manufacturing & distribution of A&E branded sewing threads in India.
In 2008, the company separated the threads business into a new company - Vardhman Yarns & Threads Ltd (VYTL), a 51:49 joint venture with A&E.
With an aim to focus more on the core business of yarn and fabric, in May’16, the company decided to divest 40% of its stake in VYTL to its JV to A&E. VTL is likely to receive ₹396 crore from the stake sale. Post this, VTL will continue to retain 11% for a period of minimum 3 years.
During FY16, excess cash was distributed to shareholders in the form of dividend where in VTL received dividend worth ₹107 crore.
Future business drivers – VTL is the 2nd largest brand of specialized threads in India, licensee for manufacturing & distribution of A&E branded sewing threads in India will continue, amount raised via stake sale would help fund capex.
Acrylic Fibers:
VTL, through its subsidiary Vardhman Acrylics Ltd (VAL) forayed into the manufacturing of Acrylic Staple Fibre in 1999.
The company, in collaboration with Japan Exlan Co. Ltd. and Marubeni Corporation, set up a plant in Gujarat with a capacity of 20,000 tonne per annum (tpa).
The products are marketed under the name VARLAN and are used to manufacture hand knitted yarns, blankets, jerseys, sweater, saris, upholster, carpets etc.
Currently this business does not gauge as much demand, both in the domestic and international front and hence the company is not looking at any capex in the segment.
During FY16, VTL received ₹39 crore as dividend from the subsidiary.
Future business drivers – VAL is currently debt free with cash reserves, this could be an additional revenue generator for the company, depending upon the demand scenario.
Vardhman Textiles Ltd.
Centrum Broking Ltd. 7
Centrum Wealth Research
Garments:
VTL forayed into the garment business in 2010 in a 51:49 JV with Japan’s Nisshinbo Textiles Inc, called Vardhman Nisshinbo Garments Ltd (VNGL).
VNGL has a capacity of manufacturing over 1.8 million shirts per annum (catering to men).
These shirts are sold both in India and exported to US, Europe & Japan.
Currently this business is yet to pick up and make meaningful contribution to VTL’s performance.
Future business drivers – Being the upper product in the value chain, this business could provide better margins in the future, however given the current scenario the company is very cautious on this venture.
Steels:
Vardhman Special Steels Ltd (VSSL) was incorporated in 1973 as a part of the company’s diversification strategy.
Over the years VSSL has increased its production capacity from 35,000 tpa to 120,000 tpa.
In order to keep the core business intact, the company demerged its steel business into VSSL with effect from Jan’11.
VSSL caters to diverse requirements of Automotive, Engineering, Bearing and Allied Industries.
It is a preferred to leading OEMs like Maruti-Suzuki, Hero Moto Corp., Toyota, Bajaj, Hyundai etc.
Future business drivers – Mainly value addition and added revenue generator for VTL.
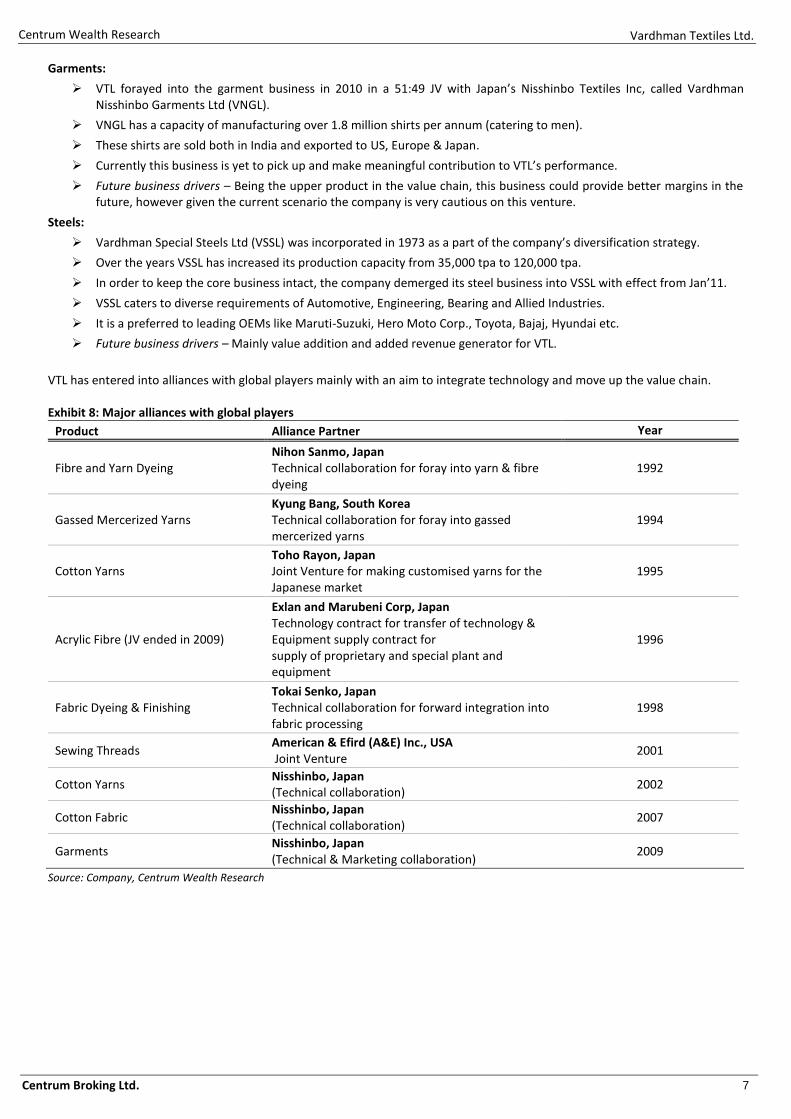
VTL has entered into alliances with global players mainly with an aim to integrate technology and move up the value chain. Exhibit 8: Major alliances with global players
Product Alliance Partner Year
Fibre and Yarn Dyeing Nihon Sanmo, Japan Technical collaboration for foray into yarn & fibre dyeing
1992
Gassed Mercerized Yarns Kyung Bang, South Korea Technical collaboration for foray into gassed mercerized yarns
1994
Cotton Yarns Toho Rayon, Japan Joint Venture for making customised yarns for the Japanese market
1995
Acrylic Fibre (JV ended in 2009)
Exlan and Marubeni Corp, Japan Technology contract for transfer of technology & Equipment supply contract for supply of proprietary and special plant and equipment
1996
Fabric Dyeing & Finishing Tokai Senko, Japan Technical collaboration for forward integration into fabric processing
1998
Sewing Threads American & Efird (A&E) Inc., USA Joint Venture
2001
Cotton Yarns Nisshinbo, Japan (Technical collaboration)
2002
Cotton Fabric Nisshinbo, Japan (Technical collaboration)
2007
Garments Nisshinbo, Japan (Technical & Marketing collaboration)
2009
Source: Company, Centrum Wealth Research
Vardhman Textiles Ltd.
Centrum Broking Ltd. 8
Centrum Wealth Research
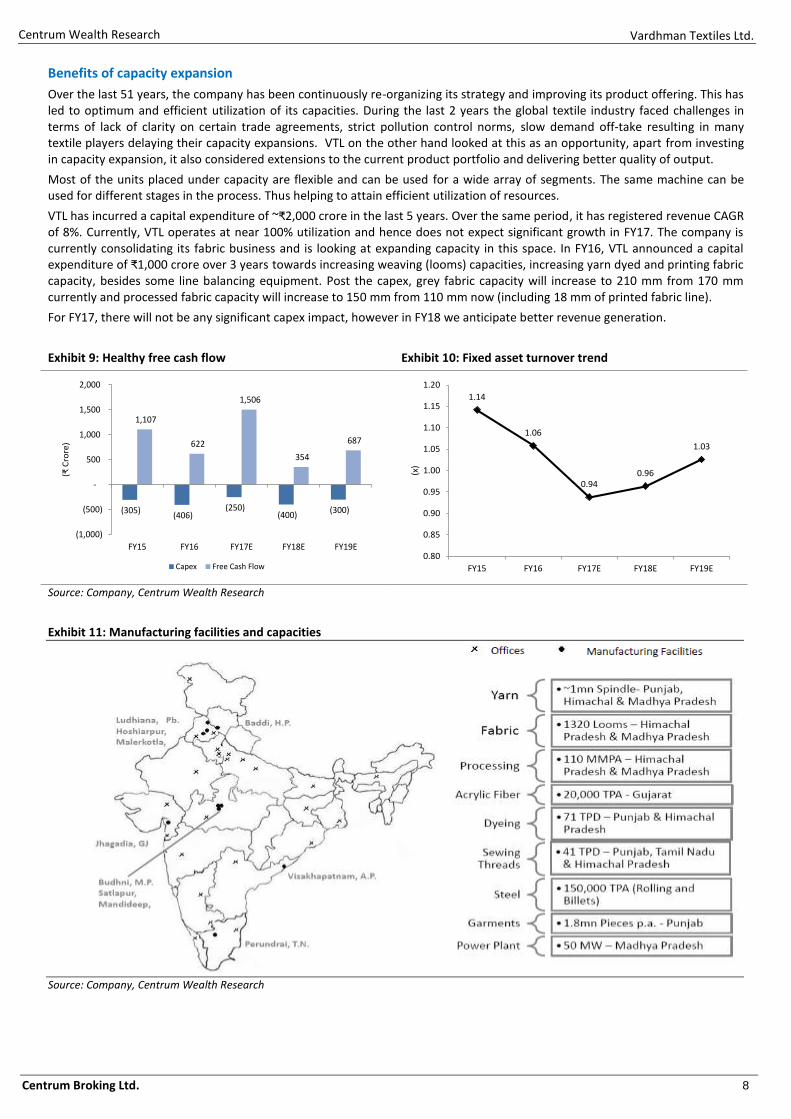
Benefits of capacity expansion
Over the last 51 years, the company has been continuously re-organizing its strategy and improving its product offering. This has led to optimum and efficient utilization of its capacities. During the last 2 years the global textile industry faced challenges in terms of lack of clarity on certain trade agreements, strict pollution control norms, slow demand off-take resulting in many textile players delaying their capacity expansions. VTL on the other hand looked at this as an opportunity, apart from investing in capacity expansion, it also considered extensions to the current product portfolio and delivering better quality of output.
Most of the units placed under capacity are flexible and can be used for a wide array of segments. The same machine can be used for different stages in the process. Thus helping to attain efficient utilization of resources.
VTL has incurred a capital expenditure of ~₹2,000 crore in the last 5 years. Over the same period, it has registered revenue CAGR of 8%. Currently, VTL operates at near 100% utilization and hence does not expect significant growth in FY17. The company is currently consolidating its fabric business and is looking at expanding capacity in this space. In FY16, VTL announced a capital expenditure of ₹1,000 crore over 3 years towards increasing weaving (looms) capacities, increasing yarn dyed and printing fabric capacity, besides some line balancing equipment. Post the capex, grey fabric capacity will increase to 210 mm from 170 mm currently and processed fabric capacity will increase to 150 mm from 110 mm now (including 18 mm of printed fabric line).
For FY17, there will not be any significant capex impact, however in FY18 we anticipate better revenue generation.
Exhibit 9: Healthy free cash flow Exhibit 10: Fixed asset turnover trend
(305)(406)
(250)(400)
(300)
1,107
622
1,506
354
687
(1,000)
(500)
-
500
1,000
1,500
2,000
FY15 FY16 FY17E FY18E FY19E
(₹ C
rore
)
Capex Free Cash Flow
1.14
1.06
0.940.96
1.03
0.80
0.85
0.90
0.95
1.00
1.05
1.10
1.15
1.20
FY15 FY16 FY17E FY18E FY19E
(x)
Source: Company, Centrum Wealth Research
Exhibit 11: Manufacturing facilities and capacities
Source: Company, Centrum Wealth Research
Vardhman Textiles Ltd.
Centrum Broking Ltd. 9
Centrum Wealth Research
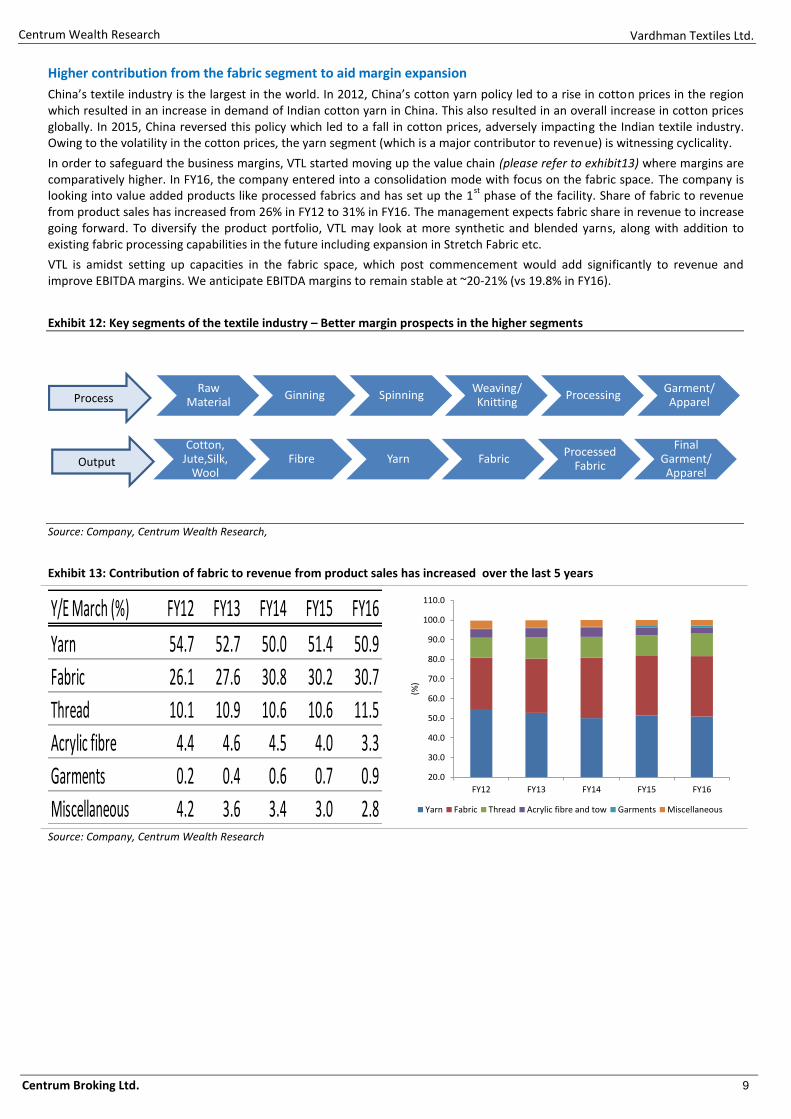
Higher contribution from the fabric segment to aid margin expansion
China’s textile industry is the largest in the world. In 2012, China’s cotton yarn policy led to a rise in cotton prices in the region which resulted in an increase in demand of Indian cotton yarn in China. This also resulted in an overall increase in cotton prices globally. In 2015, China reversed this policy which led to a fall in cotton prices, adversely impacting the Indian textile industry. Owing to the volatility in the cotton prices, the yarn segment (which is a major contributor to revenue) is witnessing cyclicality.
In order to safeguard the business margins, VTL started moving up the value chain (please refer to exhibit13) where margins are comparatively higher. In FY16, the company entered into a consolidation mode with focus on the fabric space. The company is looking into value added products like processed fabrics and has set up the 1
st phase of the facility. Share of fabric to revenue
from product sales has increased from 26% in FY12 to 31% in FY16. The management expects fabric share in revenue to increase going forward. To diversify the product portfolio, VTL may look at more synthetic and blended yarns, along with addition to existing fabric processing capabilities in the future including expansion in Stretch Fabric etc.
VTL is amidst setting up capacities in the fabric space, which post commencement would add significantly to revenue and improve EBITDA margins. We anticipate EBITDA margins to remain stable at ~20-21% (vs 19.8% in FY16).
Exhibit 12: Key segments of the textile industry – Better margin prospects in the higher segments
Raw Material
Ginning SpinningWeaving/ Knitting
ProcessingGarment/ Apparel
Cotton, Jute,Silk,
WoolFibre Yarn Fabric
Processed Fabric
Final Garment/ Apparel
Process
Output
Source: Company, Centrum Wealth Research,
Exhibit 13: Contribution of fabric to revenue from product sales has increased over the last 5 years
Y/E March (%) FY12 FY13 FY14 FY15 FY16
Yarn 54.7 52.7 50.0 51.4 50.9
Fabric 26.1 27.6 30.8 30.2 30.7
Thread 10.1 10.9 10.6 10.6 11.5
Acrylic fibre 4.4 4.6 4.5 4.0 3.3
Garments 0.2 0.4 0.6 0.7 0.9
Miscellaneous 4.2 3.6 3.4 3.0 2.8
20.0
30.0
40.0
50.0
60.0
70.0
80.0
90.0
100.0
110.0
FY12 FY13 FY14 FY15 FY16
(%)
Yarn Fabric Thread Acrylic fibre and tow Garments Miscellaneous
Source: Company, Centrum Wealth Research
Vardhman Textiles Ltd.
Centrum Broking Ltd. 10
Centrum Wealth Research
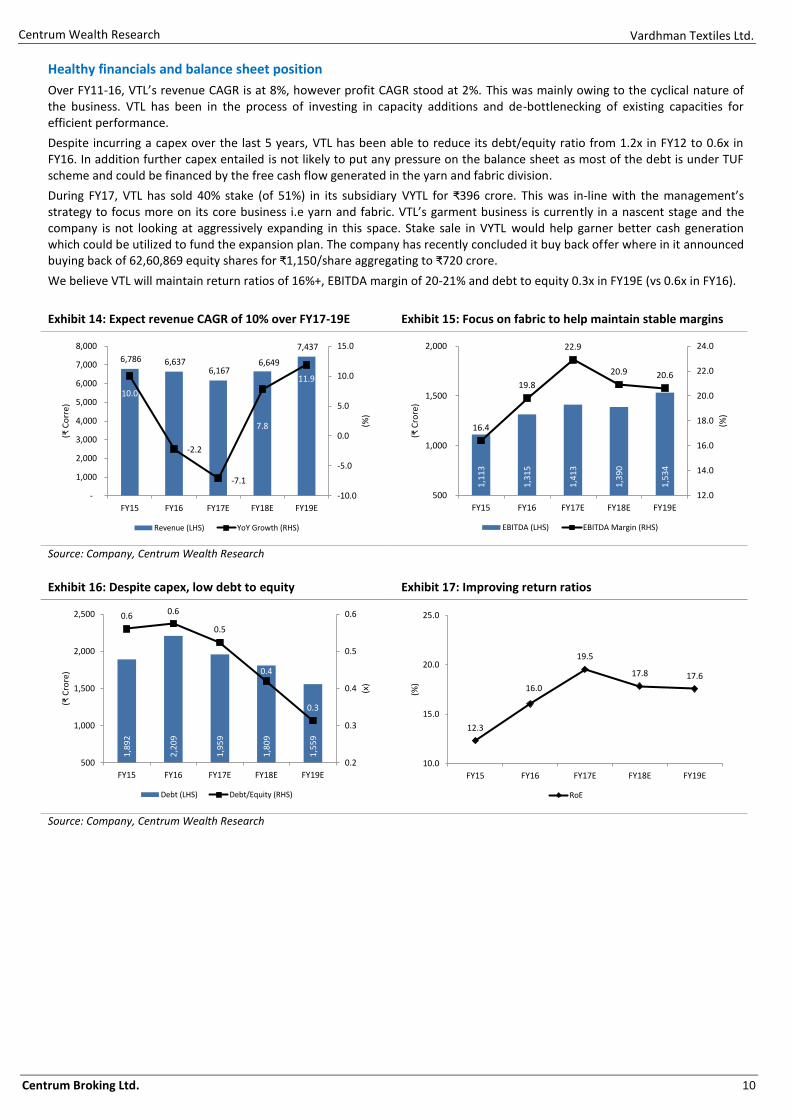
Healthy financials and balance sheet position
Over FY11-16, VTL’s revenue CAGR is at 8%, however profit CAGR stood at 2%. This was mainly owing to the cyclical nature of the business. VTL has been in the process of investing in capacity additions and de-bottlenecking of existing capacities for efficient performance.
Despite incurring a capex over the last 5 years, VTL has been able to reduce its debt/equity ratio from 1.2x in FY12 to 0.6x in FY16. In addition further capex entailed is not likely to put any pressure on the balance sheet as most of the debt is under TUF scheme and could be financed by the free cash flow generated in the yarn and fabric division.
During FY17, VTL has sold 40% stake (of 51%) in its subsidiary VYTL for ₹396 crore. This was in-line with the management’s strategy to focus more on its core business i.e yarn and fabric. VTL’s garment business is currently in a nascent stage and the company is not looking at aggressively expanding in this space. Stake sale in VYTL would help garner better cash generation which could be utilized to fund the expansion plan. The company has recently concluded it buy back offer where in it announced buying back of 62,60,869 equity shares for ₹1,150/share aggregating to ₹720 crore.
We believe VTL will maintain return ratios of 16%+, EBITDA margin of 20-21% and debt to equity 0.3x in FY19E (vs 0.6x in FY16).
Exhibit 14: Expect revenue CAGR of 10% over FY17-19E Exhibit 15: Focus on fabric to help maintain stable margins
6,786 6,637 6,167
6,649
7,437
10.0
-2.2
-7.1
7.8
11.9
-10.0
-5.0
0.0
5.0
10.0
15.0
-
1,000
2,000
3,000
4,000
5,000
6,000
7,000
8,000
FY15 FY16 FY17E FY18E FY19E
(%)
(₹ C
orr
e)
Revenue (LHS) YoY Growth (RHS)
1,1
13
1,3
15
1,4
13
1,3
90
1,5
34
16.4
19.8
22.9
20.9 20.6
12.0
14.0
16.0
18.0
20.0
22.0
24.0
500
1,000
1,500
2,000
FY15 FY16 FY17E FY18E FY19E
(%)
(₹ C
rore
)
EBITDA (LHS) EBITDA Margin (RHS)
Source: Company, Centrum Wealth Research
Exhibit 16: Despite capex, low debt to equity Exhibit 17: Improving return ratios
1,8
92
2,2
09
1,9
59
1,8
09
1,5
59
0.6 0.6
0.5
0.4
0.3
0.2
0.3
0.4
0.5
0.6
500
1,000
1,500
2,000
2,500
FY15 FY16 FY17E FY18E FY19E
(x)
(₹ C
rore
)
Debt (LHS) Debt/Equity (RHS)
12.3
16.0
19.5
17.8 17.6
10.0
15.0
20.0
25.0
FY15 FY16 FY17E FY18E FY19E
(%)
RoE
Source: Company, Centrum Wealth Research
Vardhman Textiles Ltd.
Centrum Broking Ltd. 11
Centrum Wealth Research
Exhibit 18: Better operating margin performance vs peers Exhibit 19: Low debt to equity vs peers
0.0
5.0
10.0
15.0
20.0
25.0
FY12 FY13 FY14 FY15 FY16
(%)
VTL Arvind RSWM
Raymond KPR Mill Sutlej Textiles
0.0
1.0
2.0
3.0
4.0
5.0
6.0
FY12 FY13 FY14 FY15 FY16
(x)
VTL Arvind RSWM
Raymond KPR Mill Sutlej Textiles
Source: Company, Centrum Wealth Research
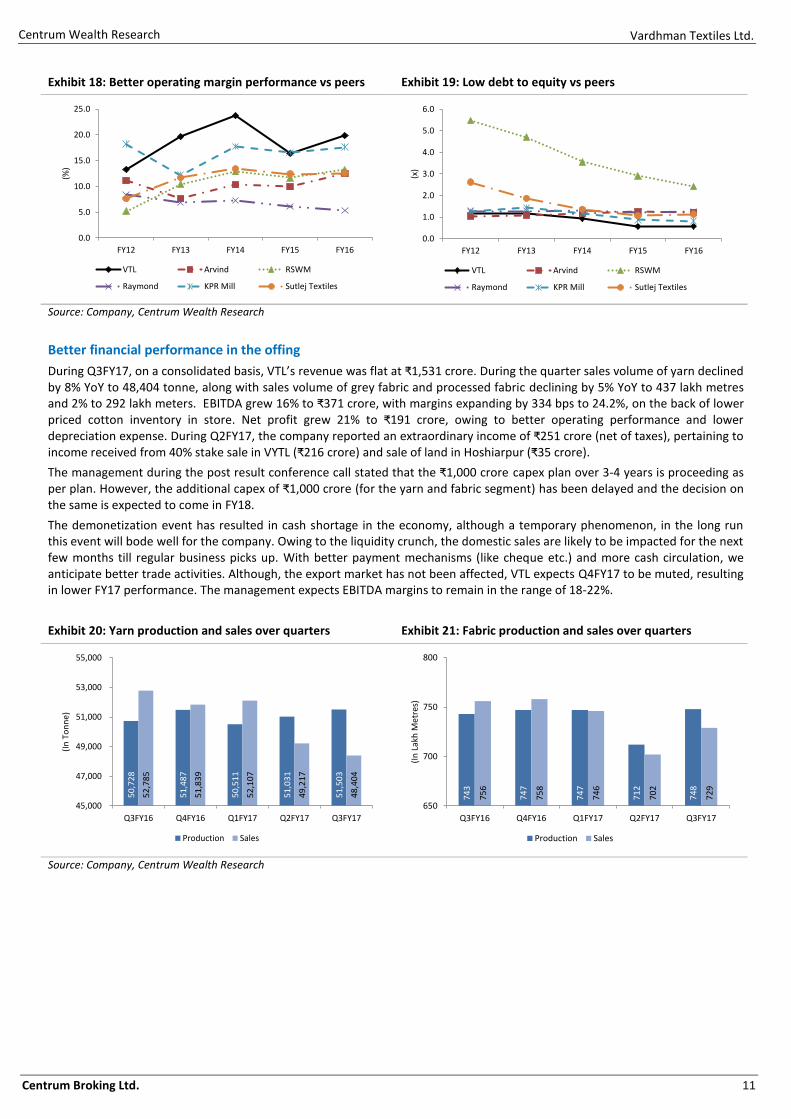
Better financial performance in the offing
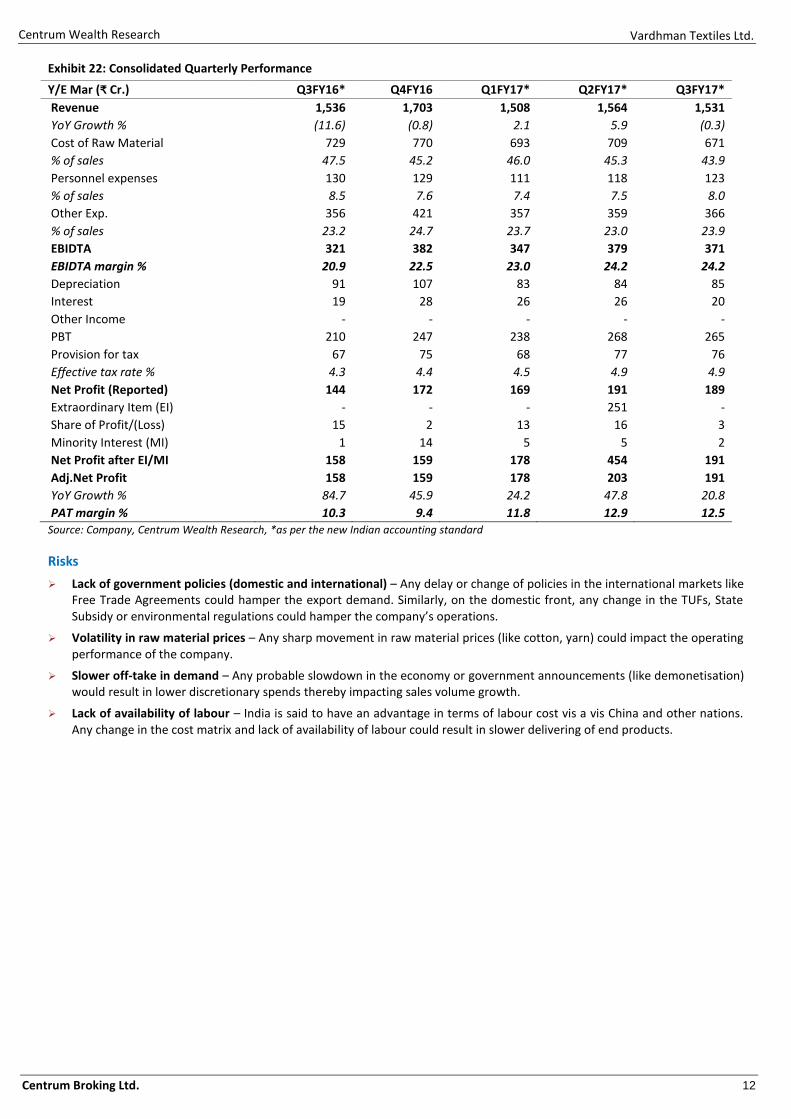
During Q3FY17, on a consolidated basis, VTL’s revenue was flat at ₹1,531 crore. During the quarter sales volume of yarn declined by 8% YoY to 48,404 tonne, along with sales volume of grey fabric and processed fabric declining by 5% YoY to 437 lakh metres and 2% to 292 lakh meters. EBITDA grew 16% to ₹371 crore, with margins expanding by 334 bps to 24.2%, on the back of lower priced cotton inventory in store. Net profit grew 21% to ₹191 crore, owing to better operating performance and lower depreciation expense. During Q2FY17, the company reported an extraordinary income of ₹251 crore (net of taxes), pertaining to income received from 40% stake sale in VYTL (₹216 crore) and sale of land in Hoshiarpur (₹35 crore).
The management during the post result conference call stated that the ₹1,000 crore capex plan over 3-4 years is proceeding as per plan. However, the additional capex of ₹1,000 crore (for the yarn and fabric segment) has been delayed and the decision on the same is expected to come in FY18.
The demonetization event has resulted in cash shortage in the economy, although a temporary phenomenon, in the long run this event will bode well for the company. Owing to the liquidity crunch, the domestic sales are likely to be impacted for the next few months till regular business picks up. With better payment mechanisms (like cheque etc.) and more cash circulation, we anticipate better trade activities. Although, the export market has not been affected, VTL expects Q4FY17 to be muted, resulting in lower FY17 performance. The management expects EBITDA margins to remain in the range of 18-22%.
Exhibit 20: Yarn production and sales over quarters Exhibit 21: Fabric production and sales over quarters
50
,72
8
51
,48
7
50
,51
1
51
,03
1
51
,50
3
52
,78
5
51
,83
9
52
,10
7
49
,21
7
48
,40
4
45,000
47,000
49,000
51,000
53,000
55,000
Q3FY16 Q4FY16 Q1FY17 Q2FY17 Q3FY17
(In
To
nn
e)
Production Sales
74
3
74
7
74
7
71
2
74
8
75
6
75
8
74
6
70
2
72
9
650
700
750
800
Q3FY16 Q4FY16 Q1FY17 Q2FY17 Q3FY17
(In
Lak
h M
etre
s)
Production Sales
Source: Company, Centrum Wealth Research
Vardhman Textiles Ltd.
Centrum Broking Ltd. 12
Centrum Wealth Research
Exhibit 22: Consolidated Quarterly Performance
Y/E Mar (₹ Cr.) Q3FY16* Q4FY16 Q1FY17* Q2FY17* Q3FY17*
Revenue 1,536 1,703 1,508 1,564 1,531
YoY Growth % (11.6) (0.8) 2.1 5.9 (0.3)
Cost of Raw Material 729 770 693 709 671
% of sales 47.5 45.2 46.0 45.3 43.9
Personnel expenses 130 129 111 118 123
% of sales 8.5 7.6 7.4 7.5 8.0
Other Exp. 356 421 357 359 366
% of sales 23.2 24.7 23.7 23.0 23.9
EBIDTA 321 382 347 379 371
EBIDTA margin % 20.9 22.5 23.0 24.2 24.2
Depreciation 91 107 83 84 85
Interest 19 28 26 26 20
Other Income - - - - -
PBT 210 247 238 268 265
Provision for tax 67 75 68 77 76
Effective tax rate % 4.3 4.4 4.5 4.9 4.9
Net Profit (Reported) 144 172 169 191 189
Extraordinary Item (EI) - - - 251 -
Share of Profit/(Loss) 15 2 13 16 3
Minority Interest (MI) 1 14 5 5 2
Net Profit after EI/MI 158 159 178 454 191
Adj.Net Profit 158 159 178 203 191
YoY Growth % 84.7 45.9 24.2 47.8 20.8
PAT margin % 10.3 9.4 11.8 12.9 12.5 Source: Company, Centrum Wealth Research, *as per the new Indian accounting standard
Risks
Lack of government policies (domestic and international) – Any delay or change of policies in the international markets like Free Trade Agreements could hamper the export demand. Similarly, on the domestic front, any change in the TUFs, State Subsidy or environmental regulations could hamper the company’s operations.
Volatility in raw material prices – Any sharp movement in raw material prices (like cotton, yarn) could impact the operating performance of the company.
Slower off-take in demand – Any probable slowdown in the economy or government announcements (like demonetisation) would result in lower discretionary spends thereby impacting sales volume growth.
Lack of availability of labour – India is said to have an advantage in terms of labour cost vis a vis China and other nations. Any change in the cost matrix and lack of availability of labour could result in slower delivering of end products.
Vardhman Textiles Ltd.
Centrum Broking Ltd. 13
Centrum Wealth Research
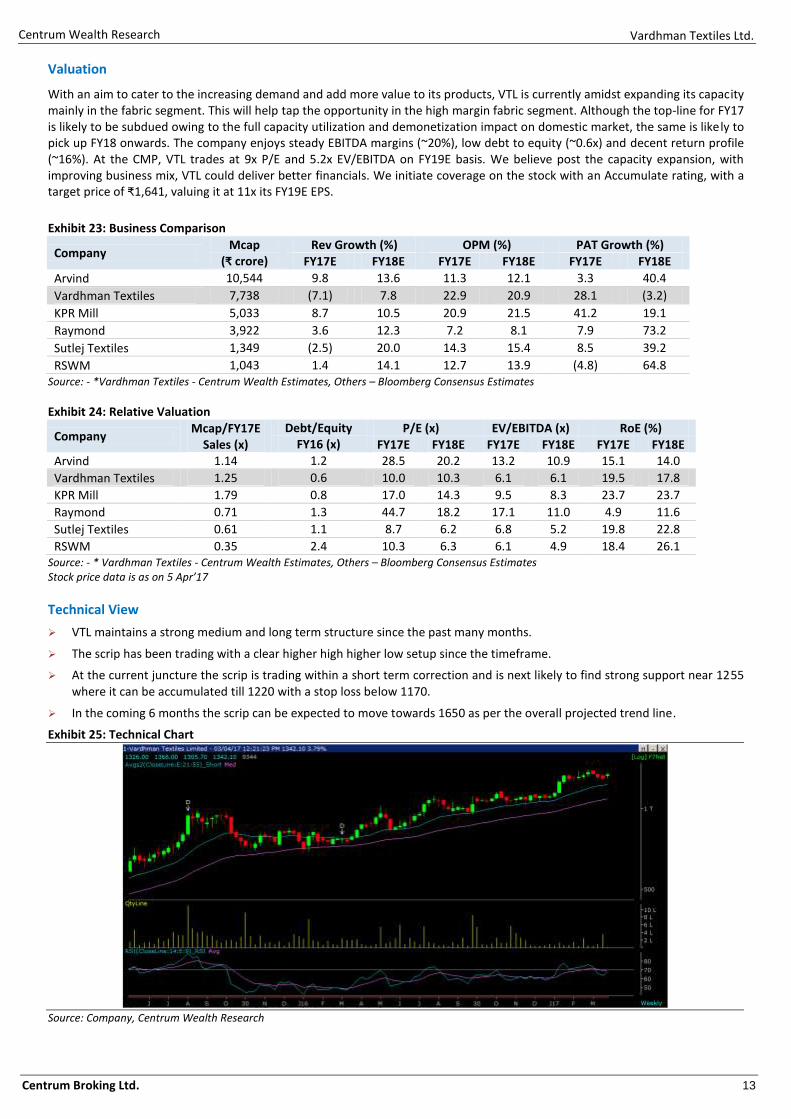
Valuation
With an aim to cater to the increasing demand and add more value to its products, VTL is currently amidst expanding its capacity mainly in the fabric segment. This will help tap the opportunity in the high margin fabric segment. Although the top-line for FY17 is likely to be subdued owing to the full capacity utilization and demonetization impact on domestic market, the same is likely to pick up FY18 onwards. The company enjoys steady EBITDA margins (~20%), low debt to equity (~0.6x) and decent return profile (~16%). At the CMP, VTL trades at 9x P/E and 5.2x EV/EBITDA on FY19E basis. We believe post the capacity expansion, with improving business mix, VTL could deliver better financials. We initiate coverage on the stock with an Accumulate rating, with a target price of ₹1,641, valuing it at 11x its FY19E EPS.
Exhibit 23: Business Comparison
Company Mcap
(₹ crore) Rev Growth (%) OPM (%) PAT Growth (%)
FY17E FY18E FY17E FY18E FY17E FY18E
Arvind 10,544 9.8 13.6 11.3 12.1 3.3 40.4
Vardhman Textiles 7,738 (7.1) 7.8 22.9 20.9 28.1 (3.2)
KPR Mill 5,033 8.7 10.5 20.9 21.5 41.2 19.1
Raymond 3,922 3.6 12.3 7.2 8.1 7.9 73.2
Sutlej Textiles 1,349 (2.5) 20.0 14.3 15.4 8.5 39.2
RSWM 1,043 1.4 14.1 12.7 13.9 (4.8) 64.8 Source: - *Vardhman Textiles - Centrum Wealth Estimates, Others – Bloomberg Consensus Estimates
Exhibit 24: Relative Valuation
Company Mcap/FY17E
Sales (x)
Debt/Equity P/E (x) EV/EBITDA (x) RoE (%) FY16 (x) FY17E FY18E FY17E FY18E FY17E FY18E
Arvind 1.14 1.2 28.5 20.2 13.2 10.9 15.1 14.0
Vardhman Textiles 1.25 0.6 10.0 10.3 6.1 6.1 19.5 17.8
KPR Mill 1.79 0.8 17.0 14.3 9.5 8.3 23.7 23.7
Raymond 0.71 1.3 44.7 18.2 17.1 11.0 4.9 11.6
Sutlej Textiles 0.61 1.1 8.7 6.2 6.8 5.2 19.8 22.8
RSWM 0.35 2.4 10.3 6.3 6.1 4.9 18.4 26.1 Source: - * Vardhman Textiles - Centrum Wealth Estimates, Others – Bloomberg Consensus Estimates Stock price data is as on 5 Apr’17
Technical View
VTL maintains a strong medium and long term structure since the past many months.
The scrip has been trading with a clear higher high higher low setup since the timeframe.
At the current juncture the scrip is trading within a short term correction and is next likely to find strong support near 1255 where it can be accumulated till 1220 with a stop loss below 1170.
In the coming 6 months the scrip can be expected to move towards 1650 as per the overall projected trend line.
Exhibit 25: Technical Chart
Source: Company, Centrum Wealth Research
Vardhman Textiles Ltd.
Centrum Broking Ltd. 14
Centrum Wealth Research
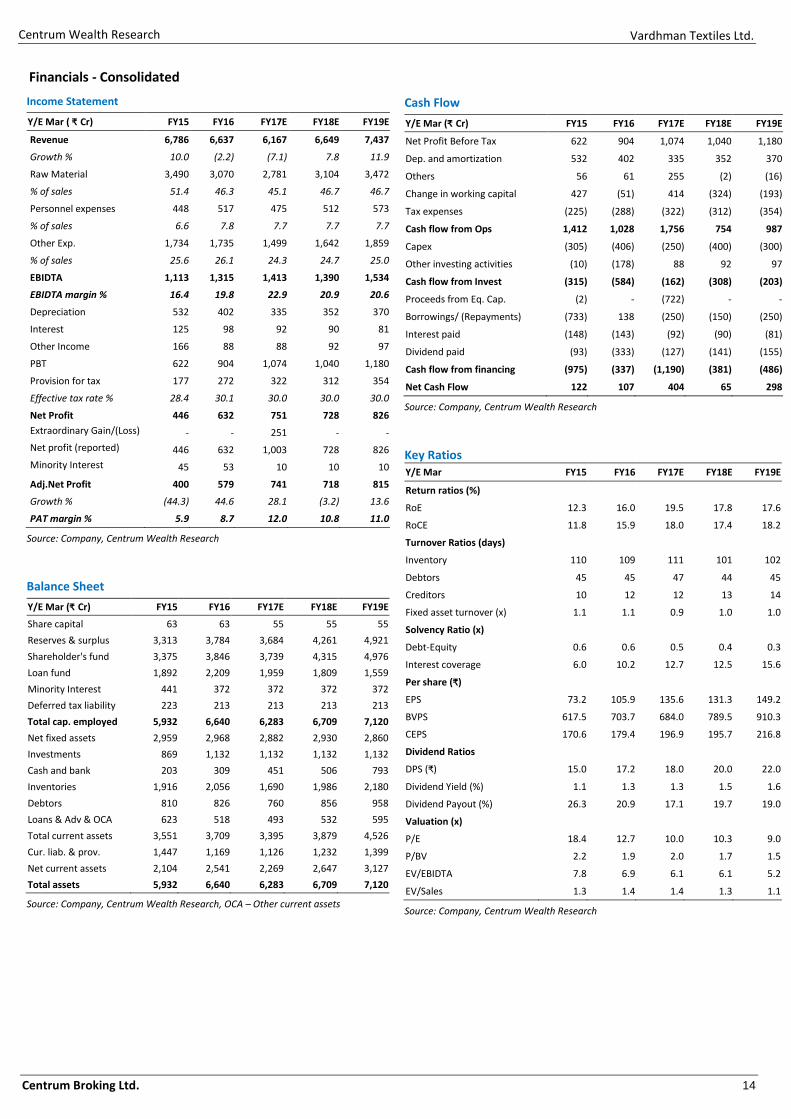
Financials - Consolidated
Income Statement
Y/E Mar ( ₹ Cr) FY15 FY16 FY17E FY18E FY19E
Revenue 6,786 6,637 6,167 6,649 7,437
Growth % 10.0 (2.2) (7.1) 7.8 11.9
Raw Material 3,490 3,070 2,781 3,104 3,472
% of sales 51.4 46.3 45.1 46.7 46.7
Personnel expenses 448 517 475 512 573
% of sales 6.6 7.8 7.7 7.7 7.7
Other Exp. 1,734 1,735 1,499 1,642 1,859
% of sales 25.6 26.1 24.3 24.7 25.0
EBIDTA 1,113 1,315 1,413 1,390 1,534
EBIDTA margin % 16.4 19.8 22.9 20.9 20.6
Depreciation 532 402 335 352 370
Interest 125 98 92 90 81
Other Income 166 88 88 92 97
PBT 622 904 1,074 1,040 1,180
Provision for tax 177 272 322 312 354
Effective tax rate % 28.4 30.1 30.0 30.0 30.0
Net Profit 446 632 751 728 826
Extraordinary Gain/(Loss) - - 251 - -
Net profit (reported) 446 632 1,003 728 826
Minority Interest 45 53 10 10 10
Adj.Net Profit 400 579 741 718 815
Growth % (44.3) 44.6 28.1 (3.2) 13.6
PAT margin % 5.9 8.7 12.0 10.8 11.0
Source: Company, Centrum Wealth Research
Balance Sheet
Y/E Mar (₹ Cr) FY15 FY16 FY17E FY18E FY19E
Share capital 63 63 55 55 55
Reserves & surplus 3,313 3,784 3,684 4,261 4,921
Shareholder's fund 3,375 3,846 3,739 4,315 4,976
Loan fund 1,892 2,209 1,959 1,809 1,559
Minority Interest 441 372 372 372 372
Deferred tax liability 223 213 213 213 213
Total cap. employed 5,932 6,640 6,283 6,709 7,120
Net fixed assets 2,959 2,968 2,882 2,930 2,860
Investments 869 1,132 1,132 1,132 1,132
Cash and bank 203 309 451 506 793
Inventories 1,916 2,056 1,690 1,986 2,180
Debtors 810 826 760 856 958
Loans & Adv & OCA 623 518 493 532 595
Total current assets 3,551 3,709 3,395 3,879 4,526
Cur. liab. & prov. 1,447 1,169 1,126 1,232 1,399
Net current assets 2,104 2,541 2,269 2,647 3,127
Total assets 5,932 6,640 6,283 6,709 7,120
Source: Company, Centrum Wealth Research, OCA – Other current assets
Cash Flow
Y/E Mar (₹ Cr) FY15 FY16 FY17E FY18E FY19E
Net Profit Before Tax 622 904 1,074 1,040 1,180
Dep. and amortization 532 402 335 352 370
Others 56 61 255 (2) (16)
Change in working capital 427 (51) 414 (324) (193)
Tax expenses (225) (288) (322) (312) (354)
Cash flow from Ops 1,412 1,028 1,756 754 987
Capex (305) (406) (250) (400) (300)
Other investing activities (10) (178) 88 92 97
Cash flow from Invest (315) (584) (162) (308) (203)
Proceeds from Eq. Cap. (2) - (722) - -
Borrowings/ (Repayments) (733) 138 (250) (150) (250)
Interest paid (148) (143) (92) (90) (81)
Dividend paid (93) (333) (127) (141) (155)
Cash flow from financing (975) (337) (1,190) (381) (486)
Net Cash Flow 122 107 404 65 298
Source: Company, Centrum Wealth Research
Key Ratios Y/E Mar FY15 FY16 FY17E FY18E FY19E
Return ratios (%)
RoE 12.3 16.0 19.5 17.8 17.6
RoCE 11.8 15.9 18.0 17.4 18.2
Turnover Ratios (days)
Inventory 110 109 111 101 102
Debtors 45 45 47 44 45
Creditors 10 12 12 13 14
Fixed asset turnover (x) 1.1 1.1 0.9 1.0 1.0
Solvency Ratio (x)
Debt-Equity 0.6 0.6 0.5 0.4 0.3
Interest coverage 6.0 10.2 12.7 12.5 15.6
Per share (₹)
EPS 73.2 105.9 135.6 131.3 149.2
BVPS 617.5 703.7 684.0 789.5 910.3
CEPS 170.6 179.4 196.9 195.7 216.8
Dividend Ratios
DPS (₹) 15.0 17.2 18.0 20.0 22.0
Dividend Yield (%) 1.1 1.3 1.3 1.5 1.6
Dividend Payout (%) 26.3 20.9 17.1 19.7 19.0
Valuation (x)
P/E 18.4 12.7 10.0 10.3 9.0
P/BV 2.2 1.9 2.0 1.7 1.5
EV/EBIDTA 7.8 6.9 6.1 6.1 5.2
EV/Sales 1.3 1.4 1.4 1.3 1.1
Source: Company, Centrum Wealth Research
Vardhman Textiles Ltd.
Centrum Broking Ltd. 15
Centrum Wealth Research
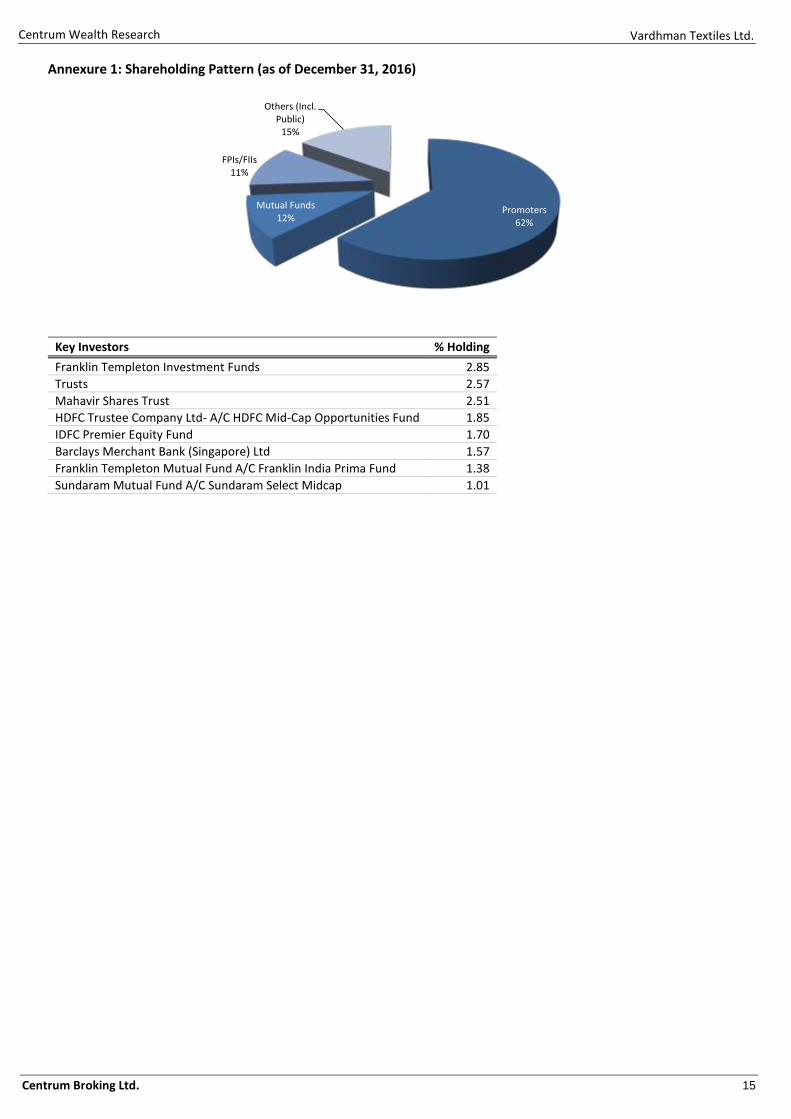
Annexure 1: Shareholding Pattern (as of December 31, 2016)
Promoters62%
Mutual Funds12%
FPIs/FIIs11%
Others (Incl. Public)
15%
Key Investors % Holding
Franklin Templeton Investment Funds 2.85
Trusts 2.57
Mahavir Shares Trust 2.51
HDFC Trustee Company Ltd- A/C HDFC Mid-Cap Opportunities Fund 1.85
IDFC Premier Equity Fund 1.70
Barclays Merchant Bank (Singapore) Ltd 1.57
Franklin Templeton Mutual Fund A/C Franklin India Prima Fund 1.38
Sundaram Mutual Fund A/C Sundaram Select Midcap 1.01
Vardhman Textiles Ltd.
Centrum Broking Ltd. 16
Centrum Wealth Research
Appendix
Disclaimer Centrum Broking Limited (“CBL”) is a full-service, Stock Broking Company and a member of The Stock Exchange, Mumbai (BSE), National Stock Exchange of India Ltd. (NSE) and MCX-SX Stock Exchange Limited (MCX-SX). One of our group companies, Centrum Capital Ltd is an investment banker and an underwriter of securities. As a group Centrum has Investment Banking, Advisory and other business relationships with a significant percentage of the companies covered by our Research Group. Our research professionals provide important inputs into the Group's Investment Banking and other business selection processes.
Recipients of this report should assume that our Group is seeking or may seek or will seek Investment Banking, advisory, project finance or other businesses and may receive commission, brokerage, fees or other compensation from the company or companies that are the subject of this material/report. Our Company and Group companies and their officers, directors and employees, including the analysts and others involved in the preparation or issuance of this material and their dependants, may on the date of this report or from, time to time have "long" or "short" positions in, act as principal in, and buy or sell the securities or derivatives thereof of companies mentioned herein. CBLor its affiliates do not own 1% or more in the equity of this company Our sales people, dealers, traders and other professionals may provide oral or written market commentary or trading strategies to our clients that reflect opinions that are contrary to the opinions expressed herein, and our proprietary trading and investing businesses may make investment decisions that are inconsistent with the recommendations expressed herein. We may have earlier issued or may issue in future reports on the companies covered herein with recommendations/ information inconsistent or different those made in this report. In reviewing this document, you should be aware that any or all of the foregoing, among other things, may give rise to or potential conflicts of interest. We and our Group may rely on information barriers, such as "Chinese Walls" to control the flow of information contained in one or more areas within us, or other areas, units, groups or affiliates of CBL. CBL and its affiliates do not make a market in the security of the company for which this report or any report was written. Further, CBL or its affiliates did not make a market in the subject company’s securities at the time that the research report was published.
This report is for information purposes only and this document/material should not be construed as an offer to sell or the solicitation of an offer to buy, purchase or subscribe to any securities, and neither this document nor anything contained herein shall form the basis of or be relied upon in connection with any contract or commitment whatsoever. This document does not solicit any action based on the material contained herein. It is for the general information of the clients of CBL. Though disseminated to clients simultaneously, not all clients may receive this report at the same time. Centrum will not treat recipients as clients by virtue of their receiving this report. It does not constitute a personal recommendation or take into account the particular investment objectives, financial situations, or needs of individual clients. Similarly, this document does not have regard to the specific investment objectives, financial situation/circumstances and the particular needs of any specific person who may receive this document. The securities discussed in this report may not be suitable for all investors. The securities described herein may not be eligible for sale in all jurisdictions or to all categories of investors. The countries in which the companies mentioned in this report are organized may have restrictions on investments, voting rights or dealings in securities by nationals of other countries. The appropriateness of a particular investment or strategy will depend on an investor's individual circumstances and objectives. Persons who may receive this document should consider and independently evaluate whether it is suitable for his/ her/their particular circumstances and, if necessary, seek professional/financial advice. Any such person shall be responsible for conducting his/her/their own investigation and analysis of the information contained or referred to in this document and of evaluating the merits and risks involved in the securities forming the subject matter of this document.
The projections and forecasts described in this report were based upon a number of estimates and assumptions and are inherently subject to significant uncertainties and contingencies. Projections and forecasts are necessarily speculative in nature, and it can be expected that one or more of the estimates on which the projections and forecasts were based will not materialize or will vary significantly from actual results, and such variances will likely increase over time. All projections and forecasts described in this report have been prepared solely by the authors of this report independently of the Company. These projections and forecasts were not prepared with a view toward compliance with published guidelines or generally accepted accounting principles. No independent accountants have expressed an opinion or any other form of assurance on these projectio ns or forecasts. You should not regard the inclusion of the projections and forecasts described herein as a representation or warranty by or on behalf of the Company, CBL, Centrum group, the authors of this report or any other person that these projections or forecasts or their underlying assumptions will be achieved. For these reasons, you should only consider the projections and forecasts described in this report after carefully evaluating all of the information in this report, including the assumptions underlying such projections and forecasts.
The price and value of the investments referred to in this document/material and the income from them may go down as well as up, and investors may realize losses on any investments. Past performance is not a guide for future performance. Future returns are not guaranteed and a loss of original capital may occur. Actual results may differ materially from those set forth in projections. Forward-looking statements are not predictions and may be subject to change without notice. We do not provide tax advice to our clients, and all investors are strongly advised to consult regarding any potential investment. CBL and its affiliates accept no liabilities for any loss or damage of any kind arising out of the use of this report. Foreign currencies denominated securities are subject to fluctuations in exchange rates that could have an adverse effect on the value or price of or income derived from the investment. In addition, investors in securities such as ADRs, the value of which are influenced by foreign currencies effectively assume currency risk. Certain transactions including those involving futures, options, and other derivatives as well as non-investment-grade securities give rise to substantial risk and are not suitable for all investors. Please ensure that you have read and understood the current risk disclosure documents before entering into any derivative transactions.
This report/document has been prepared by CBL, based upon information available to the public and sources, believed to be reliable. No representation or warranty, express or implied is made that it is accurate or complete. CBL has reviewed the report and, in so far as it includes current or historical information, it is believed to be reliable, although its accuracy and completeness cannot be guaranteed. The opinions expressed in this document/material are subject to change without notice and have no obligation to tell you when opinions or information in this report change.
This report or recommendations or information contained herein do/does not constitute or purport to constitute investment advice in publicly accessible media and should not be reproduced, transmitted or published by the recipient. The report is for the use and consumption of the recipient only. This publication may not be distributed to the public used by the public media without the express written consent of CBL. This report or any portion hereof may not be printed, sold or distributed without the written consent of CBL.
The distribution of this document in other jurisdictions may be restricted by law, and persons into whose possession this document comes should inform themselves about, and observe, any such restrictions. Neither CBL nor its directors, employees, agents or representatives shall be liable for any damages whether direct or indirect, incidental, special or consequential including lost revenue or lost profits that may arise from or in connection with the use of the information.
This document does not constitute an offer or invitation to subscribe for or purchase or deal in any securities and neither this document nor anything contained herein shall form the basis of any contract or commitment whatsoever. This document is strictly confidential and is being furnished to you solely for your information, may not be distributed to the press or other media and may not be reproduced or redistributed to any other person. The distribution of this report in other jurisdictions may be restricted by law and persons into whose possession this report comes should inform themselves about, and observe any such restrictions. By accepting this report, you agree to be bound by the fore going limitations. No representation is made that this report is accurate or complete.
The opinions and projections expressed herein are entirely those of the author and are given as part of the normal research activity of CBL and are given as of this date and are subject to change without notice. Any opinion estimate or projection herein constitutes a view as of the date of this report and there can be no assurance that future results or events will be consistent with any such opinions, estimate or projection.
This document has not been prepared by or in conjunction with or on behalf of or at the instigation of, or by arrangement with the company or any of its directors or any other person. Information in this document must not be relied upon as having been authorized or approved by the company or its directors or any other person. Any opinions and projections contained herein are entirely those of the authors. None of the company or its directors or any other person accepts any liability whatsoever for any loss arising from any use of this document or its contents or otherwise arising in connection therewith.
CBL and its affiliates have not managed or co-managed a public offering for the subject company in the preceding twelve months. CBL and affiliates have not received compensation from the companies mentioned in the report during the period preceding twelve months from the date of this report for service in respect of public offerings, corporate finance, debt restructuring, investment banking or other advisory services in a merger/acquisition or some other sort of specific transaction.
As per the declarations given by his/her, research analyst and the author of this report and/or any of his/her family members do not serve as an officer, director or any way connected to the company/companies mentioned in this report. Further, as declared by his/her, he/she has not received any compensation from the above companies in the preceding twelve months. Our entire research professionals are our employees and are paid a salary. They do not have any other material conflict of interest of the research analyst or member of which the research analyst knows of has reason to know at the time of publication of the research report or at the time of the public appearance.
While we would endeavor to update the information herein on a reasonable basis, CBL, its associated companies, their directors and employees are under no obligation to update or keep the information current. Also, there may be regulatory, compliance or other reasons that may prevent Centrum from doing so.
Non-rated securities indicate that rating on a particular security has been suspended temporarily and such suspension is in compliance with applicable regulations and/or Centrum policies, in circumstances where CBL is acting in an advisory capacity to this company, or any certain other circumstances.
This report is not directed to or intended for distribution to or use by, any person or entity who is a citizen or resident of or located in any locality, state, country or other jurisdiction where such distribution, publication, availability or use would be contrary to law or regulation or which would subject Centrum Broking Limited or its group companies to any registration or licensing requirement within such jurisdiction. Specifically, this document does not constitute an offer to or solicitation to any U.S. person for the purchase or sale of any financial instrument or as an official confirmation of any transaction to any U.S. person unless otherwise stated, this message should not be construed as official confirmation of any transaction. No part of this document may be distributed in Canada or used by private customers in United Kingdom.
The information contained herein is not intended for publication or distribution or circulation in any manner whatsoever and any unauthorized reading, dissemination, distribution or copying of this communication is prohibited unless otherwise expressly authorized. Please ensure that you have read “Risk Disclosure Document for Capital Market and Derivatives Segments” as prescribed by Securities and Exchange Board of India before investing in Indian Securities Market.
Vardhman Textiles Ltd.
Centrum Broking Ltd. 17
Centrum Wealth Research
Disclosures under the SEBI (Research Analysts) Regulations 2014
Disclosure of Interest Statement
1 Business activities of Centrum Broking Limited (CBL)
Centrum Broking Limited (hereinafter referred to as “CBL”) is a registered member of NSE (Cash, F&O and Currency Derivatives Segments), MCX-SX (Currency Derivatives Segment) and BSE (Cash segment), Depository Participant of CDSL and a SEBI registered Portfolio Manager.
2 Details of Disciplinary History of CBL CBL has not been debarred/ suspended by SEBI or any other regulatory authority from accessing /dealing in securities market.
3 Registration status of CBL CBL is registered with SEBI as a Research Analyst (SEBI Registration No. INH000001469)
4 Whether Research analysts or relatives’ have any financial interest in the subject company and nature of such financial interest
No
5 Whether Research analysts or relatives have actual / beneficial ownership of 1% or more in securities of the subject company at the end of the month immediately preceding the date of publication of the document.
No
6 Whether the research analysts or his relatives has any other material conflict of interest No
7 Whether research analysts have received any compensation from the subject company in the past 12 months and nature of products / services for which such compensation is received
No
8 Whether the Research Analysts have received any compensation or any other benefits from the subject company or third party in connection with the research report
No
9 Whether Research Analysts has served as an officer, director or employee of the subject company
No
10 Whether the Research Analysts has been engaged in market making activity of the subject company.
No
Member (and BSE)
Regn No.: CAPITAL MARKET SEBI REGN. NO.: BSE: INB011454239 CAPITAL MARKET SEBI REGN. NO.: NSE: INB231454233
DERIVATIVES SEBI REGN. NO.: NSE: INF231454233 (TRADING & CLEARING MEMBER)
CURRENCY DERIVATIVES: MCX-SX INE261454230 CURRENCY DERIVATIVES:NSE (TM & SCM) – NSE 231454233
Depository Participant (DP) CDSL DP ID: 120 – 12200
SEBI REGD NO. : CDSL : IN-DP-CDSL-661-2012
PORTFOLIO MANAGER
SEBI REGN NO.: INP000004383
Website: www.centrum.co.in Investor Grievance Email ID: [email protected]
Compliance Officer Details:
Kavita Ravichandran (022) 4215 9842; Email ID: [email protected]
Centrum Broking Ltd. (CIN: U67120MH1994PLC078125)
REGD. OFFICE Address Bombay Mutual Bldg.,
2nd Floor, Dr. D.N. Road,
Fort, Mumbai - 400 001
Corporate Office & Correspondence Address Centrum House
6th Floor, CST Road, Near Vidya Nagari Marg,
Kalina, Santacruz (E) Mumbai 400 098.
Tel: (022) 4215 9000 Fax: +91 22 4215 9344