Embed Size (px)
Citation preview

Full Terms & Conditions of access and use can be found athttp://www.tandfonline.com/action/journalInformation?journalCode=tres20
Download by: [Universiti Malaysia Terengganu] Date: 20 November 2016, At: 23:11
International Journal of Remote Sensing
ISSN: 0143-1161 (Print) 1366-5901 (Online) Journal homepage: http://www.tandfonline.com/loi/tres20
Building extraction in satellite images using activecontours and colour features
Gregoris Liasis & Stavros Stavrou
To cite this article: Gregoris Liasis & Stavros Stavrou (2016) Building extraction in satelliteimages using active contours and colour features, International Journal of Remote Sensing,37:5, 1127-1153, DOI: 10.1080/01431161.2016.1148283
To link to this article: http://dx.doi.org/10.1080/01431161.2016.1148283
Published online: 18 Feb 2016.
Submit your article to this journal
Article views: 167
View related articles
View Crossmark data
Citing articles: 1 View citing articles
Building extraction in satellite images using active contoursand colour featuresGregoris Liasis and Stavros Stavrou
Information and Communication Systems, Faculty of pure and Applied Sciences, Open University ofCyprus, Nicosia, Cyprus
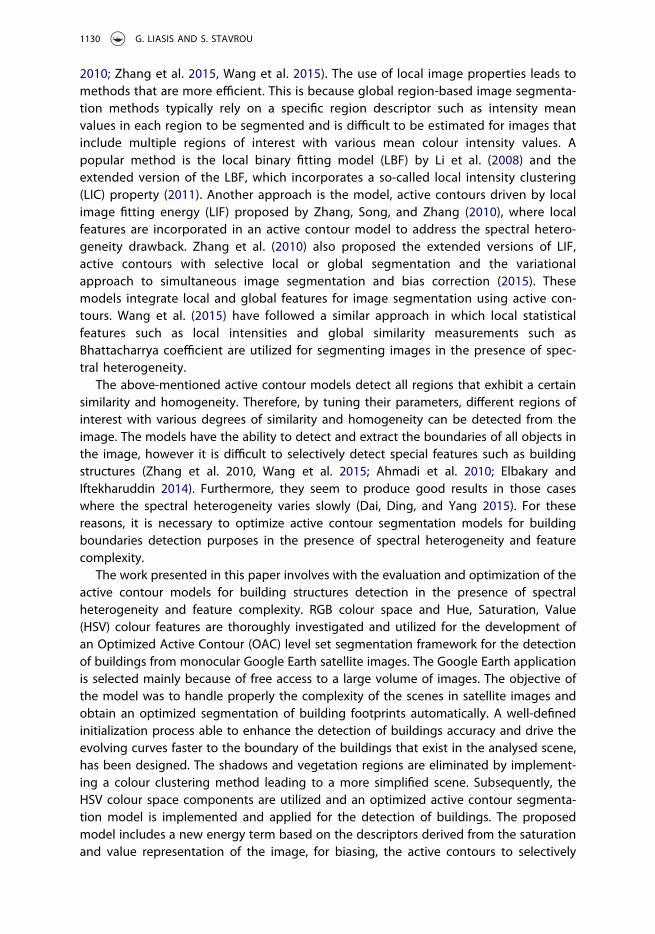
ABSTRACTObtaining the segmentation of building footprints from satelliteimages is a complex process since building areas and their sur-roundings are presented with various colour intensity values andcomplex features. Active contour region-based segmentationmethods can be used to establish the corresponding boundaryof building structures. Typically, these methods divide the imageinto regions that exhibit a certain similarity and homogeneity.However, using the traditional active contour algorithms for build-ing structures detection, in several cases where spectral hetero-geneity exists, over-detection or under-detection are usuallynoticed. In this work, the Red, Green and Blue (RGB) representationand the properties of the Hue, Saturation and Value (HSV) colourspace have been analysed and used to optimize the extraction ofbuildings from satellite images in an active contour segmentationframework. Initially, the satellite image was processed by applyinga clustering technique using colour features to eliminate vegeta-tion areas and shadows that may adversely affect the performanceof the algorithm. Subsequently, the HSV representation of theimage was used and a new active contour model was developedand applied for building extraction, utilizing descriptors derivedfrom the value and saturation images. A new energy term isencoded for biasing the contours to achieve better segmentationresults. An effective procedure has been designed and incorpo-rated in the proposed model for the active contour initialization.This process enhances the performance of the model, leading tolower computational cost and higher building detection accuracy.Additionally, statistical measures are used for designing optimummorphological filters to eliminate any misleading information thatmay still exist. Qualitative and quantitative measures are used forevaluating the performance of the proposed method.
ARTICLE HISTORYReceived 22 April 2015Accepted 24 January 2016
1. Introduction
Built-up areas on satellite images display diverse features, different colours and inten-sities. Furthermore, buildings may be obscured by environmental objects and mayocclude each other. For a successful segmentation and building extraction process,
CONTACT Gregoris Liasis [email protected] Department, Faculty of the Pure and Applied Sciences,Open University of Cyprus, PO Box 12794, 2252, Latsia, Nicosia, Cyprus
INTERNATIONAL JOURNAL OF REMOTE SENSING, 2016VOL. 37, NO. 5, 1127–1153http://dx.doi.org/10.1080/01431161.2016.1148283
© 2016 Taylor & Francis

this complexity has to be handled properly. Building detection from monocular satelliteimages can serve in land use analysis, creation and update of maps or GeographicInformation System (GIS) databases and development of urban monitoring applications.The manual processing of such images is tedious and time-consuming, thus veryexpensive. This leads to the need for designing effective methods for the automateddetection of buildings using remote sensing or satellite images.
Designing and implementing methods for detecting building structures is an activefield of research and a large number of studies have been reported in literature. Theexisting methods can be classified into two categories with respect to the type of theimages that are used. The first category includes the detection of buildings usingmonocular remote sensing images and the second category covers the detection ofbuildings using an additional channel of data such as height information. Detailedreviews can be found in Chen et al. (2013), Haala and Kada (2010), Baltsavias (2004),Ünsalan and Boyer (2005). Since this work deals with the detection of buildings throughsingle monocular optical remote sensing images, the discussion of the previous studieswill be focused on this domain.
Initial attempts in the monocular context mostly used edge-based methods andrelied on the extraction of features such as lines and corners (Huertas and Nevatia1988; Irvin and McKeown 1989). In these studies, the cast shadows were also utilisedfor the detection of the corresponding buildings. Shadow information was used forestimating the location, shape and height of buildings by Irvin and McKeown (1989).Liow and Pavlidis (1990) used an edge detector and features such as shadows forextracting building boundaries in aerial images. Furthermore, local edge informationand global shape information was utilized to eliminate the segmentation errors or toenhance the resultant contours. Shufelt and McKeown (1993) combined several sepa-rated systems relied on shadow information for the detection of a complete set ofbuilding boundaries. McGlone and Shufelt (1994) have used image orientation informa-tion and shadow evidence to verify a building hypothesis based on the projectivegeometry and vanishing point calculations. Shufelt (1999) performed a detailed evalua-tion and a comparison study of the edge-oriented methods. His work revealed that withedge oriented methods it is difficult to handle the entire building complexity becausethese methods utilize information from only a single band and are mostly based on asimple building shape hypothesis such as a parallelogram structure. Thus, new methodsare required to achieve better results.
The launch of remote sensors with the ability to acquire very high resolution (VHR)multispectral images, inspired many researchers to use information from the additionalbands in their proposed models. Classification methods were utilized in a number ofresearch works. Lee, Shan, and Bethel (2003) have developed a supervised classificationmethod, where Hough transformation was used in an automated building detectionprocess using imagery acquired from the earth observation satellite system IK-ONOS.Geometric image features were extracted and a Support Vector Machine (SVM) classifi-cation framework was used for detecting artificial objects in Inglada’s (2007) model.Texture features were utilized in an SVM framework by Koc-San and Turker (2014).Ghaffarian and Ghafffarian (2014a) collect training areas using shadow evidence anddesign an automated parallelepiped supervised classification method for detectingbuilding objects. Graph-based theory was also used in implementing methods for the
1128 G. LIASIS AND S. STAVROU
detection of buildings. The Scale Invariant Feature Transform (SIFT) was used in a graphcut model by Sirmacek and Unsalan (2009). A two level graph partitioning frameworkwas developed by Ok (2013), for increasing the performance of his previous proposedmodel (2013), which was based on fuzzy logic and Grab Cut.
Markov Random Fields (MRFs) were thoroughly investigated in building detectionmodels from satellite images. Krishnamachari and Chellappa (1996) used MRFs to groupline segments and in the later years Katartzis and Sahli (2008) extended this model bycreating a stochastic framework for detecting rooftops of the presented buildings.Independent component analysis (ICA) was utilized by Ghaffarian and Ghafffarian(2014b), for developing a model, named Purposive Fast-ICA (PFICA) to detect buildingsfrom monocular high-resolution images acquired from Google Earth. In this study, acolour-based fusion technique was proposed to approximate shadow, vegetation, baresoil, road and building patches. This information was then used to initialize the Fast-ICAalgorithm for detecting the presented buildings in a given image.
A number of studies reported in the literature used a different approach by analysingand incorporating multiple cue data to segment satellite images. Tsai (2006) analysedand evaluated the most common colour spaces for shadow detection in aerial imagesusing a threshold technique applied to the colour spaced transformed images. Sirmacekand Unsalan (2008) used invariant colour features and shadow information for buildingdetection. The red, green, blue (RGB) colour space was used and shadows were detectedby applying a threshold on the blue colour invariant image. In addition, buildings withred rooftops were detected by applying a similar method on the red colour invariantimage. The evaluation and subsequently the selection of the most appropriate featurescapable to characterize all or most of the buildings presented in the analysed scene, isimportant for the performance of all the above methods.
Building extraction is a demanding, however a fundamentally important process inmany telecommunication or remote sensing applications such as natural disaster mon-itoring, urban change detection, urban scene reconstruction, cartography update, urbaninventory and wireless planning (Hu, You, and Neumann 2003; Karantzalos and Paragios2010; Chen et al. 2012). Image segmentation becomes very difficult in the presence ofcomplex features and spectral heterogeneity that often occurs in satellite images due tofactors, such as spatial variations in illumination, the use of various surface materials andimperfections in the overall acquisition process. The problem becomes more compli-cated if the regions of interest in the analysed scene are presented with a large scale ofdifferent spectral characteristics, which is common in satellite images. Curve evolutionschemes such as the active contour without edges (Chan and Vese 2001), has the abilityto work well with natural images, however, in several cases multiple phases are neededto achieve good performance (Vese and Chan 2002). The more complexity and variety ofintensity scales exist in the regions of interest, the more phases are needed to beincorporated. This leads to the iteration of multiple partial differential equations (PDE)simultaneously for approximating the segmentation of a given image. This time-con-suming process limits the effectiveness of the method (Chan and Zhu 2003; Cremers,Sochen, and Schnörr 2006; Karantzalos and Paragios 2010).
In the recent years, the idea of evolving an active contour for segmenting images inthe presence of spectral heterogeneity using local instead of global image statisticshas become popular (Li et al. 2008, 2011, Zhang, Song, and Zhang 2010; Zhang et al.
INTERNATIONAL JOURNAL OF REMOTE SENSING 1129
2010; Zhang et al. 2015, Wang et al. 2015). The use of local image properties leads tomethods that are more efficient. This is because global region-based image segmenta-tion methods typically rely on a specific region descriptor such as intensity meanvalues in each region to be segmented and is difficult to be estimated for images thatinclude multiple regions of interest with various mean colour intensity values. Apopular method is the local binary fitting model (LBF) by Li et al. (2008) and theextended version of the LBF, which incorporates a so-called local intensity clustering(LIC) property (2011). Another approach is the model, active contours driven by localimage fitting energy (LIF) proposed by Zhang, Song, and Zhang (2010), where localfeatures are incorporated in an active contour model to address the spectral hetero-geneity drawback. Zhang et al. (2010) also proposed the extended versions of LIF,active contours with selective local or global segmentation and the variationalapproach to simultaneous image segmentation and bias correction (2015). Thesemodels integrate local and global features for image segmentation using active con-tours. Wang et al. (2015) have followed a similar approach in which local statisticalfeatures such as local intensities and global similarity measurements such asBhattacharrya coefficient are utilized for segmenting images in the presence of spec-tral heterogeneity.
The above-mentioned active contour models detect all regions that exhibit a certainsimilarity and homogeneity. Therefore, by tuning their parameters, different regions ofinterest with various degrees of similarity and homogeneity can be detected from theimage. The models have the ability to detect and extract the boundaries of all objects inthe image, however it is difficult to selectively detect special features such as buildingstructures (Zhang et al. 2010, Wang et al. 2015; Ahmadi et al. 2010; Elbakary andIftekharuddin 2014). Furthermore, they seem to produce good results in those caseswhere the spectral heterogeneity varies slowly (Dai, Ding, and Yang 2015). For thesereasons, it is necessary to optimize active contour segmentation models for buildingboundaries detection purposes in the presence of spectral heterogeneity and featurecomplexity.
The work presented in this paper involves with the evaluation and optimization of theactive contour models for building structures detection in the presence of spectralheterogeneity and feature complexity. RGB colour space and Hue, Saturation, Value(HSV) colour features are thoroughly investigated and utilized for the development ofan Optimized Active Contour (OAC) level set segmentation framework for the detectionof buildings from monocular Google Earth satellite images. The Google Earth applicationis selected mainly because of free access to a large volume of images. The objective ofthe model was to handle properly the complexity of the scenes in satellite images andobtain an optimized segmentation of building footprints automatically. A well-definedinitialization process able to enhance the detection of buildings accuracy and drive theevolving curves faster to the boundary of the buildings that exist in the analysed scene,has been designed. The shadows and vegetation regions are eliminated by implement-ing a colour clustering method leading to a more simplified scene. Subsequently, theHSV colour space components are utilized and an optimized active contour segmenta-tion model is implemented and applied for the detection of buildings. The proposedmodel includes a new energy term based on the descriptors derived from the saturationand value representation of the image, for biasing, the active contours to selectively
1130 G. LIASIS AND S. STAVROU
detect building structures. Finally, statistical measures are used for designing optimummorphological filters to eliminate any misleading information that may still exist on thesegmentation mask.
2. Active contour models for satellite image segmentation
The proposed building detection framework depends on optimizing the active contourwithout edges or Chan and Vese (CV) model (2001). Therefore, the traditional imple-mentation of the model is briefly introduced in the following section. More details canbe found in the corresponding referenced paper.
2.1 Chan-Vese active contour model
Active contours are piecewise polynomial curves that match a deformable model to animage by means of energy minimization (Kass, Witkin, and Terzopoulos 1988). In activecontour models, a parametric or non-parametric representation of an initial curve isevolved using explicit and implicit forces. By energy minimization, these models are ableto detect objects or obtain the image segmentation. The level set method for comput-ing and analysing the evolution of a contour using partial differential equations is a verypopular approach (Osher and Sethian 1988). The contour is implicitly represented, via atwo-dimensional continuous function φ x; y; tð Þ : Ω ! R, defined in the image domainwhere Ω denotes an open bounded subset of R. The function φ x; y; tð Þ, where x; yð Þ isthe coordinates in the image plane and t is the time, is called the level set function. Atany given time, the level set function define an edge contour and a segmentation of theimage. The edge contour is taken to be the zero level set where φ x; y; tð Þ ¼ 0 and thesegmentation is given by the two regions fφ > 0g and fφ < 0g. CV model is formulatedon level set and is a popular method for segmenting images containing objects withand/or without weak boundaries. This model uses a geometric representation of thecontour. The method does not use an edge function based on gradient information tostop the evolving curve. The CV is an energy based minimization segmentation modelthat separates the grey-scale single band representation of an image into regions basedon the mean intensities inside and outside the evolving curve. The optimal segmenta-tion is found by minimizing the Mumford-Shah energy functional (Mumford and Shah1989), for partitioning a given image Ι with a variable closed curve C using the followingequation:
E c1; c2; Cð Þ ¼ λ1
ðinside cð Þ
I x; yð Þ � c1j2�� dxdyþ λ2
ðoutside cð Þ
I x; yð Þ � c2j2�� dxdyþ μL Cj j þ νA Cj j
(1)
where λ1; λ2; μ; ν > 0 are fixed parameters responsible to weight the different terms inthe energy while c1, c2 are the intensity mean values of I inside and outside C respec-tively. In the CV model two regularization terms L Cj j and A Cj j are incorporated forcontrolling the smoothness of the detected boundaries. L and A represent the lengthand area of the variable closed curve C respectively.
INTERNATIONAL JOURNAL OF REMOTE SENSING 1131
The CV model has the ability to split and merge for detecting objects with variousmean intensities and delineate objects with or without weak boundaries. This attributemakes it a good choice for handling the complexity of the scenes in satellite images andextract the presented buildings.
In several remote sensing applications, among the various methods already discussed,curve evolution schemes like active contours, deformable models and level set were usedto segment satellite images. These methods revealed promising results due to their abilityto cope with topological changes (Samson et al. 2001; Besbes, Belhadj, and Boujemaa2006). Niu (2006) used a geometric active contour formulation, which was based on levelset methodology in a semi-automatic framework, where the initial curves were manuallydefined in order to detect certain objects like buildings. In this formulation, the energyminimization function is based on image edges or gradients, a process that can limit thesuccess of the method especially when the scenes are incorporating objects with weakboundaries. Cao, Yang, and Zhou (2005) used an energy function, which was based on amodified Mumford-Shah segmentation model for artificial objects detection from aerialimages. They used a coarse-to-fine strategy and a fractal error metric at the evolutionarystage of the algorithm in order to detect urban or semi urban areas in aerial images.Karantzalos and Argialas (2009) also proposed a region-based level set segmentationmethod for artificial object detection in aerial or satellite images. A variational geometriclevel set function based on active contours without edge formulation was used andartificial objects such as roads and buildings were detected. These methods in somecases are vulnerable to misleading information derived from the presence of a largescale of intensities, shadows or occlusions, which is a common scenario in satellite images.Several studies have been reported to address the above issues by incorporating priorbuilding shape information to label the segmented regions as buildings (Karantzalos andParagios 2009). These schemes depend on the efficiency of the pre-defined building shapetemplates. A different approach can be seen in Peng, Zhang, and Liu (2005) study, wherean improved active contour model is proposed by modifying the traditional snake to beattracted from the radiometric and geometric building features by customizing the snakeenergy function. In a similar approach, Ahmadi et al. (2010) design an innovative modelbased on active contours for extraction of building boundaries from high-resolution aerialimages where the radiometric properties of the building classes were predefined.
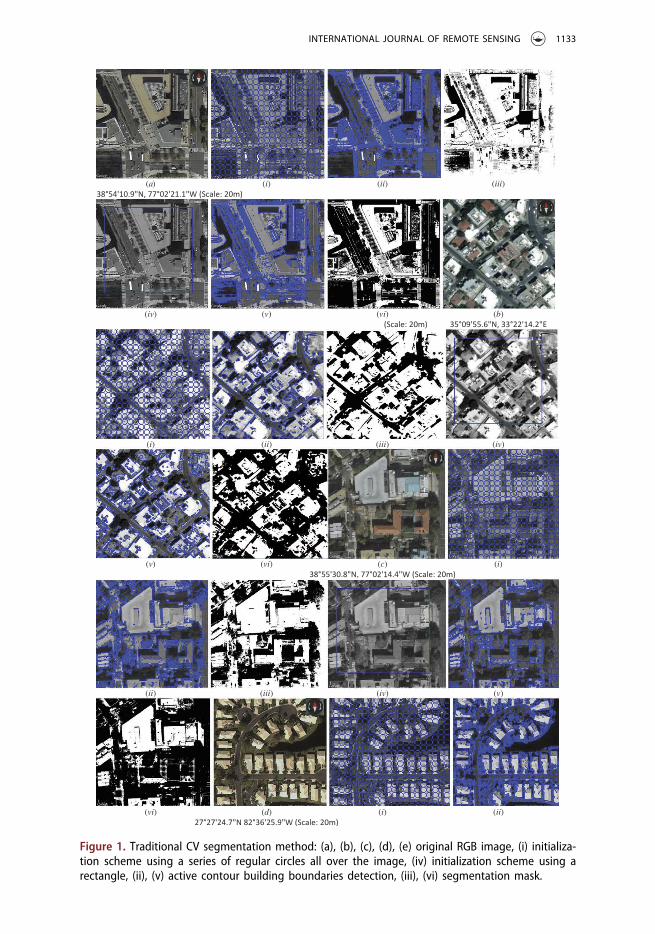
The CV model has been used extensively in literature for the detection of buildings.Despite the good results, it is associated with several limitations such as extensiveinitialization, under-detection and over-detection. The model depends on initial curveplacement and number. If the initial curves do not cover effectively, all buildingstructures that may exist in the analysed scene, some of them may be missed.Nevertheless, if the initial curves over-cover the whole scene including objects or regionsthat do not consist building structures, then this may lead to erroneous or over-segmentations. The initial curve placement and number in the CV model also influencesthe computation cost. Very few initial curves lead to higher computation cost.Furthermore, spectral heterogeneity also may lead to misleading segmentation ofbuilding structures. A typical urban area in satellite images includes a variety of classesof buildings presented with different colour intensity values that makes it difficult for thetraditional CV model to detect all buildings correctly. Several experiments have beenperformed in this work using the traditional CV model, with different initialization
1132 G. LIASIS AND S. STAVROU
(a) (i) (ii) (iii)38°54'10.9"N, 77°02'21.1"W (Scale: 20m)
(iv) (v) (vi) (b)(Scale: 20m) 35°09'55.6"N, 33°22'14.2"E
(i) (ii) (iii) (iv)
(v) (vi) (c) (i)38°55'30.8"N, 77°02'14.4"W (Scale: 20m)
(ii) (iii) (iv) (v)
(vi) (d) (i) (ii)27°27'24.7"N 82°36'25.9"W (Scale: 20m)
Figure 1. Traditional CV segmentation method: (a), (b), (c), (d), (e) original RGB image, (i) initializa-tion scheme using a series of regular circles all over the image, (iv) initialization scheme using arectangle, (ii), (v) active contour building boundaries detection, (iii), (vi) segmentation mask.
INTERNATIONAL JOURNAL OF REMOTE SENSING 1133

schemes and sample results of heterogeneous and complex scenes are presented inFigure 1. All the above conclusions about the performance of the CV model are also inline with the findings of Liasis and Stavrou (2013), Ahmadi et al. (2010), Karantzalos andParagios (2010) and Niu (2006) work.
The approach that this work follows to address the above limitations is based ondesigning an effective automated procedure for active contour initialization.Subsequently, the available information from colour features is utilized for enhancing
(iii) (iv) (v) (vi)
(e) (i)≈33°52'39.0"S 151°10'51.3"E (Scale: 20m)
(ii) (iii)
(iv) (v)
(vi)
Figure 1. (Continued)
1134 G. LIASIS AND S. STAVROU

the detection of buildings accuracy in an optimized active contour segmentation model.The proposed active contour model can be considered an extension of the CV model.The aim was to produce balanced results between true and false detections in anefficient computation cost.
3. The development of an optimized active contour model toautomatically detect buildings
3.1 Active contour initialization
The estimation of the optimal position of the initial curves can prove to be a difficult taskwithout prior knowledge of the scene and the objects to be detected. In the urbanbuilding boundary extraction process using active contours that was proposed byAhmadi et al. (2010), the initial curves were generated automatically as a series ofregular circles all over the image. The number and size of the initial curves wereexperimentally estimated. Karantzalos and Paragios (2009, 2010) used an arbitraryelliptical curve to initialize their proposed curve evolution scheme and a data termbased on prior knowledge of the analysed scene was incorporated to drive the evolvingcurve to the building boundaries. In the above publications, it was noticed that theinitialization schemes influence the models speed of execution and accuracy.
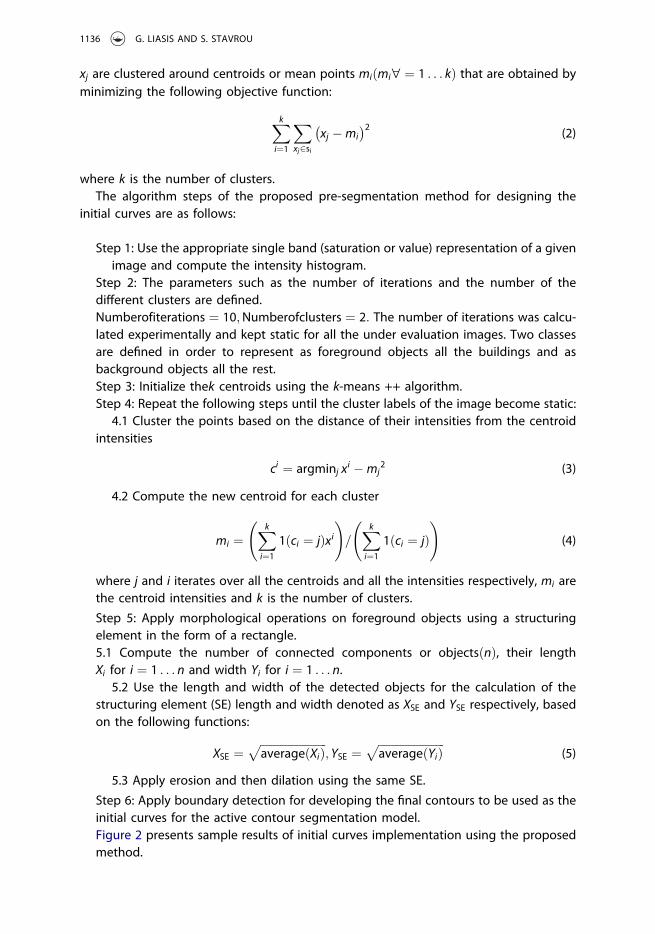
A k-means clustering algorithm which aims to segment n observations into k parti-tions, in which, each observation is assigned to the nearest partition (with respect topartition centre) can be incorporated and pre-segment the image (Hartigan and Wong1979). This information can be used to develop the initial curves of the level setsegmentation procedure for addressing the initialization issue. Using k-means algorithm,along with morphological operations erosion and dilation for the refinement of k-meansclustering result, the initial curves can be defined within or near the buildings that mayexist in the image and the active contour model may lead to a better building segmen-tation result. The form and the parameters of a small shape or template called structur-ing element (SE), to be used in erosion and dilation, are important for the success of theprocess. Since the aim was to detect buildings, which in most of the cases are presentedsquares, rectangles or a combination of the above, a structuring element in the form of arectangle is naturally more suitable. In this work, the length and width of the structuringelement are estimated using statistical measures based on the objects that have beendetected using k-means algorithm. After a number of experiments, it was found that thesquare root of the average length and width of the detected objects are optimum valuesfor the structuring element size. Figure 9 presents the results of these experiments.
The k-means algorithm calculates data features and tries to find the natural clusteringamong them (Lloyd 1982). The input data points si; i ¼ 1 . . . n where n is the totalnumber of points, are classified into multiple classes based on their inherent distancefrom each other. As has been noticed in literature this method is sensitive to initializa-tion (Peña, Lozano, and Larrañaga 1999) thus the method so-called k-means++ pro-posed by Arthur and Vassilvitskii (2007) has been incorporated for choosing initial clustercentroid positions or seeds. The k-means++ algorithm uses an heuristic to find centroidseeds for k-means clustering. According to Arthur and Vassilvitskii, k-means++ improvesthe running time of Lloyd’s algorithm, and the quality of the final solution. All the points
INTERNATIONAL JOURNAL OF REMOTE SENSING 1135
xj are clustered around centroids or mean points mi mi" ¼ 1 . . . kð Þ that are obtained byminimizing the following objective function:
Xki¼1
Xxj2si
xj �mi� �2
(2)
where k is the number of clusters.The algorithm steps of the proposed pre-segmentation method for designing the
initial curves are as follows:
Step 1: Use the appropriate single band (saturation or value) representation of a givenimage and compute the intensity histogram.
Step 2: The parameters such as the number of iterations and the number of thedifferent clusters are defined.Numberofiterations ¼ 10;Numberofclusters ¼ 2: The number of iterations was calcu-lated experimentally and kept static for all the under evaluation images. Two classesare defined in order to represent as foreground objects all the buildings and asbackground objects all the rest.Step 3: Initialize thek centroids using the k-means ++ algorithm.Step 4: Repeat the following steps until the cluster labels of the image become static:
4.1 Cluster the points based on the distance of their intensities from the centroidintensities
ci ¼ argminj xi �mj2 (3)
4.2 Compute the new centroid for each cluster
mi ¼Xki¼1
1ðci ¼ jÞxi !
=Xki¼1
1ðci ¼ jÞ !
(4)
where j and i iterates over all the centroids and all the intensities respectively, mi arethe centroid intensities and k is the number of clusters.
Step 5: Apply morphological operations on foreground objects using a structuringelement in the form of a rectangle.5.1 Compute the number of connected components or objects nð Þ, their lengthXi for i ¼ 1 . . . n and width Yi for i ¼ 1 . . . n.
5.2 Use the length and width of the detected objects for the calculation of thestructuring element (SE) length and width denoted as XSE and YSE respectively, basedon the following functions:
XSE ¼ffiffiffiffiffiffiffiffiffiffiffiffiffiffiffiffiffiffiffiffiffiffiffiffiaverage Xið Þ
p; YSE ¼
ffiffiffiffiffiffiffiffiffiffiffiffiffiffiffiffiffiffiffiffiffiffiffiffiaverage Yið Þ
p(5)
5.3 Apply erosion and then dilation using the same SE.
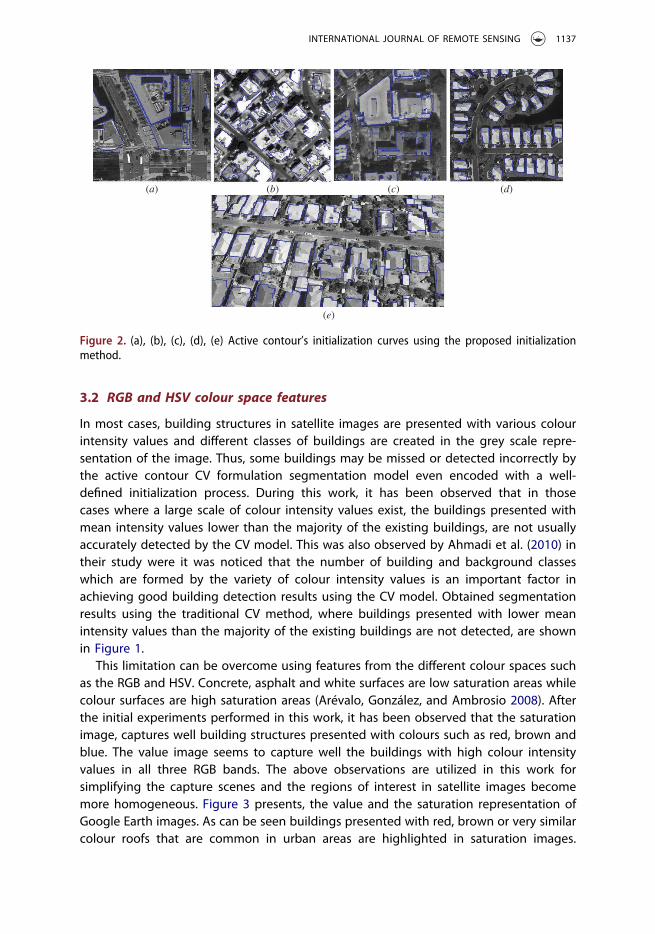
Step 6: Apply boundary detection for developing the final contours to be used as theinitial curves for the active contour segmentation model.Figure 2 presents sample results of initial curves implementation using the proposedmethod.
1136 G. LIASIS AND S. STAVROU
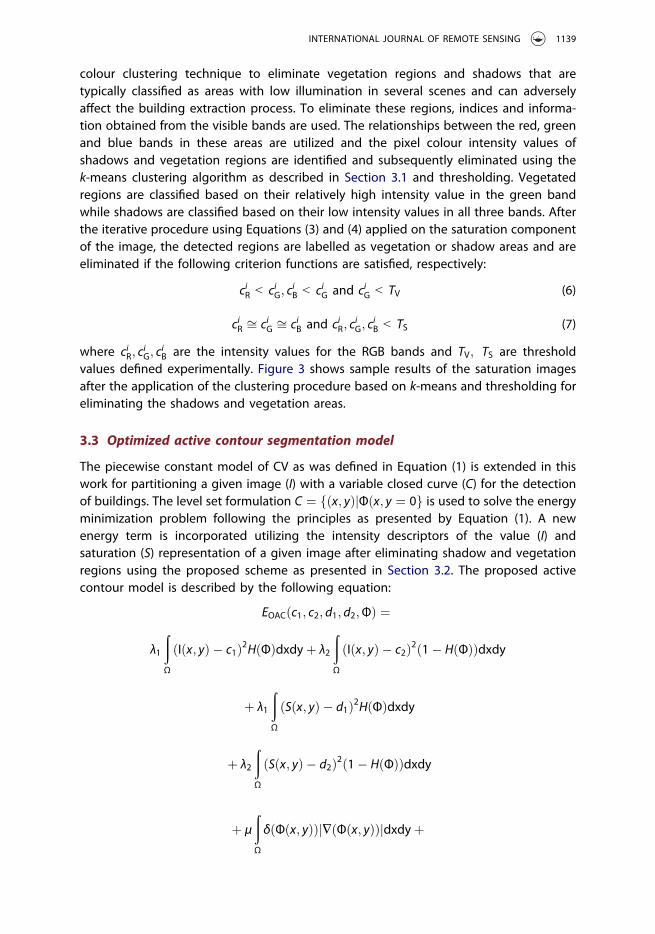
3.2 RGB and HSV colour space features
In most cases, building structures in satellite images are presented with various colourintensity values and different classes of buildings are created in the grey scale repre-sentation of the image. Thus, some buildings may be missed or detected incorrectly bythe active contour CV formulation segmentation model even encoded with a well-defined initialization process. During this work, it has been observed that in thosecases where a large scale of colour intensity values exist, the buildings presented withmean intensity values lower than the majority of the existing buildings, are not usuallyaccurately detected by the CV model. This was also observed by Ahmadi et al. (2010) intheir study were it was noticed that the number of building and background classeswhich are formed by the variety of colour intensity values is an important factor inachieving good building detection results using the CV model. Obtained segmentationresults using the traditional CV method, where buildings presented with lower meanintensity values than the majority of the existing buildings are not detected, are shownin Figure 1.
This limitation can be overcome using features from the different colour spaces suchas the RGB and HSV. Concrete, asphalt and white surfaces are low saturation areas whilecolour surfaces are high saturation areas (Arévalo, González, and Ambrosio 2008). Afterthe initial experiments performed in this work, it has been observed that the saturationimage, captures well building structures presented with colours such as red, brown andblue. The value image seems to capture well the buildings with high colour intensityvalues in all three RGB bands. The above observations are utilized in this work forsimplifying the capture scenes and the regions of interest in satellite images becomemore homogeneous. Figure 3 presents, the value and the saturation representation ofGoogle Earth images. As can be seen buildings presented with red, brown or very similarcolour roofs that are common in urban areas are highlighted in saturation images.
(a) (b) (c) (d)
(e)
Figure 2. (a), (b), (c), (d), (e) Active contour’s initialization curves using the proposed initializationmethod.
INTERNATIONAL JOURNAL OF REMOTE SENSING 1137
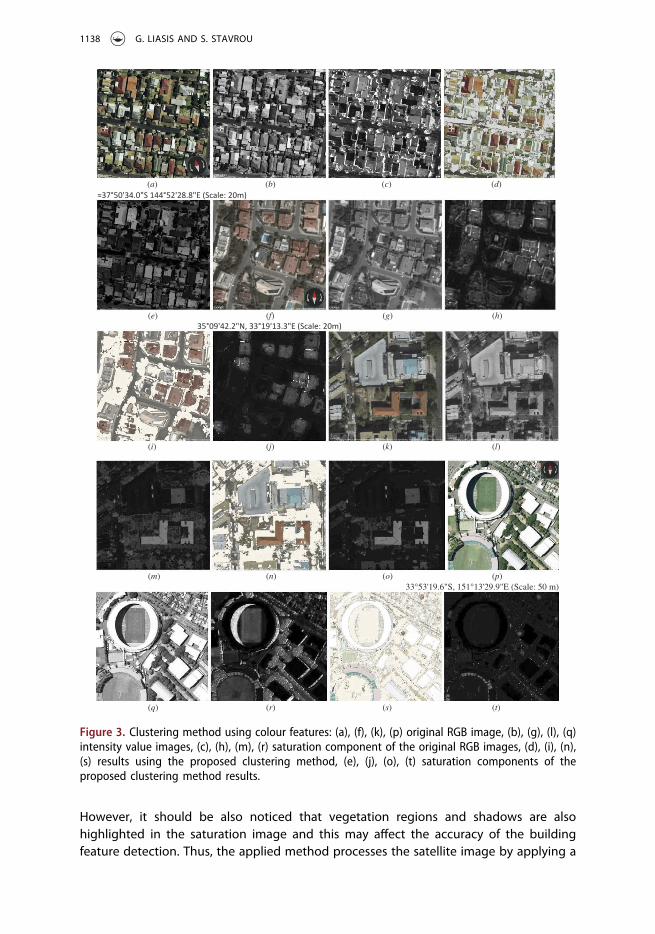
However, it should be also noticed that vegetation regions and shadows are alsohighlighted in the saturation image and this may affect the accuracy of the buildingfeature detection. Thus, the applied method processes the satellite image by applying a
(a) (b) (c) (d)
(e) (f) (g) (h)
(i) (j) (k) (l)
(m) (n) (o) (p)
(q) (r) (s) (t)
≈37°50'34.0"S 144°52'28.8"E (Scale: 20m)
35°09'42.2"N, 33°19'13.3"E (Scale: 20m)
33°53'19.6"S, 151°13'29.9"E (Scale: 50 m)
Figure 3. Clustering method using colour features: (a), (f), (k), (p) original RGB image, (b), (g), (l), (q)intensity value images, (c), (h), (m), (r) saturation component of the original RGB images, (d), (i), (n),(s) results using the proposed clustering method, (e), (j), (o), (t) saturation components of theproposed clustering method results.
1138 G. LIASIS AND S. STAVROU
colour clustering technique to eliminate vegetation regions and shadows that aretypically classified as areas with low illumination in several scenes and can adverselyaffect the building extraction process. To eliminate these regions, indices and informa-tion obtained from the visible bands are used. The relationships between the red, greenand blue bands in these areas are utilized and the pixel colour intensity values ofshadows and vegetation regions are identified and subsequently eliminated using thek-means clustering algorithm as described in Section 3.1 and thresholding. Vegetatedregions are classified based on their relatively high intensity value in the green bandwhile shadows are classified based on their low intensity values in all three bands. Afterthe iterative procedure using Equations (3) and (4) applied on the saturation componentof the image, the detected regions are labelled as vegetation or shadow areas and areeliminated if the following criterion functions are satisfied, respectively:
ciR < ciG; ciB < ciG and ciG < TV (6)
ciR ffi ciG ffi ciB and ciR; ciG; c
iB < TS (7)
where ciR; ciG; c
iB are the intensity values for the RGB bands and TV; TS are threshold
values defined experimentally. Figure 3 shows sample results of the saturation imagesafter the application of the clustering procedure based on k-means and thresholding foreliminating the shadows and vegetation areas.
3.3 Optimized active contour segmentation model
The piecewise constant model of CV as was defined in Equation (1) is extended in thiswork for partitioning a given image (Ι) with a variable closed curve (C) for the detectionof buildings. The level set formulation C ¼ x; yð ÞjΦðx; y ¼ 0f g is used to solve the energyminimization problem following the principles as presented by Equation (1). A newenergy term is incorporated utilizing the intensity descriptors of the value (I) andsaturation (S) representation of a given image after eliminating shadow and vegetationregions using the proposed scheme as presented in Section 3.2. The proposed activecontour model is described by the following equation:
EOAC c1; c2; d1; d2;Φð Þ ¼
λ1
ðΩ
I x; yð Þ � c1ð Þ2H Φð Þdxdyþ λ2
ðΩ
I x; yð Þ � c2ð Þ2 1� H Φð Þð Þdxdy
þ λ1
ðΩ
S x; yð Þ � d1ð Þ2H Φð Þdxdy
þ λ2
ðΩ
S x; yð Þ � d2ð Þ2 1� H Φð Þð Þdxdy
þ μ
ðΩ
δ Φ x; yð Þð Þ � Φ x; yð Þð Þj jdxdyþ
INTERNATIONAL JOURNAL OF REMOTE SENSING 1139
ν
ðΩ
H Φ x; yð Þð Þdxdy (8)
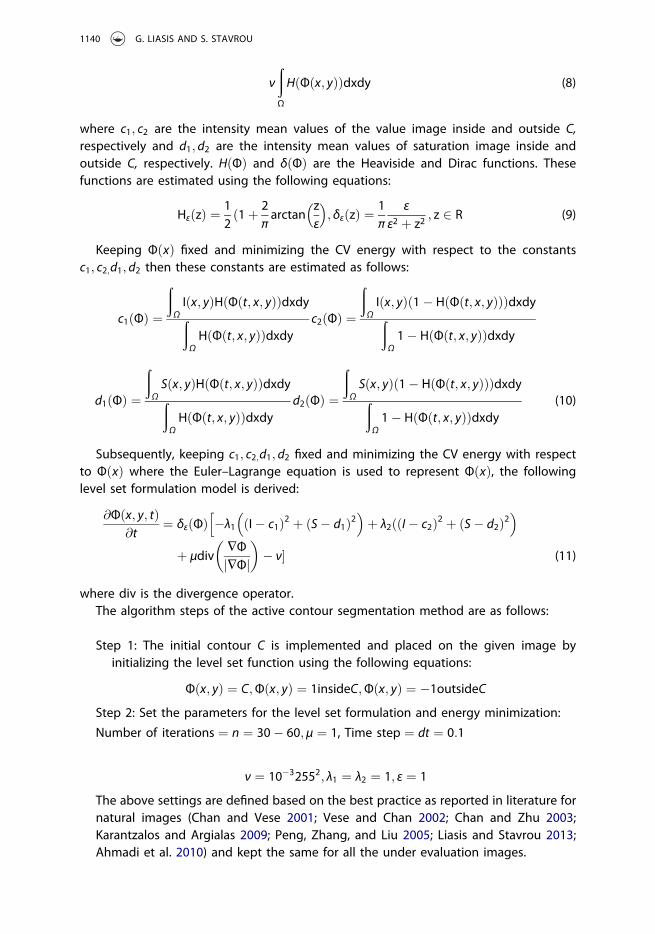
where c1; c2 are the intensity mean values of the value image inside and outside C,respectively and d1; d2 are the intensity mean values of saturation image inside andoutside C, respectively. H Φð Þ and δ Φð Þ are the Heaviside and Dirac functions. Thesefunctions are estimated using the following equations:
Hε zð Þ ¼ 12ð1þ 2
πarctan
zε
� �; δε zð Þ ¼ 1
π
ε
ε2 þ z2; z 2 R (9)
Keeping Φ xð Þ fixed and minimizing the CV energy with respect to the constantsc1; c2;d1; d2 then these constants are estimated as follows:
c1 Φð Þ ¼
ðΩI x; yð ÞH Φ t; x; yð Þð ÞdxdyðΩH Φ t; x; yð Þð Þdxdy
c2 Φð Þ ¼
ðΩI x; yð Þ 1� H Φ t; x; yð Þð Þð Þdxdyð
Ω1� H Φ t; x; yð Þð Þdxdy
d1 Φð Þ ¼
ðΩS x; yð ÞH Φ t; x; yð Þð ÞdxdyðΩH Φ t; x; yð Þð Þdxdy
d2 Φð Þ ¼
ðΩS x; yð Þ 1� H Φ t; x; yð Þð Þð Þdxdyð
Ω1� H Φ t; x; yð Þð Þdxdy
(10)
Subsequently, keeping c1; c2;d1; d2 fixed and minimizing the CV energy with respectto Φ xð Þ where the Euler–Lagrange equation is used to represent Φ xð Þ, the followinglevel set formulation model is derived:
@Φ x; y; tð Þ@t
¼ δε Φð Þ �λ1 I� c1ð Þ2 þ S� d1ð Þ2� �
þ λ2ð I � c2ð Þ2 þ S� d2ð Þ2h �
þ μdiv�Φ�Φj j
� � ν� (11)
where div is the divergence operator.The algorithm steps of the active contour segmentation method are as follows:
Step 1: The initial contour C is implemented and placed on the given image byinitializing the level set function using the following equations:
Φ x; yð Þ ¼ C;Φ x; yð Þ ¼ 1insideC;Φ x; yð Þ ¼ �1outsideC
Step 2: Set the parameters for the level set formulation and energy minimization:
Number of iterations ¼ n ¼ 30� 60; μ ¼ 1, Time step ¼ dt ¼ 0:1
ν ¼ 10�32552; λ1 ¼ λ2 ¼ 1; ε ¼ 1
The above settings are defined based on the best practice as reported in literature fornatural images (Chan and Vese 2001; Vese and Chan 2002; Chan and Zhu 2003;Karantzalos and Argialas 2009; Peng, Zhang, and Liu 2005; Liasis and Stavrou 2013;Ahmadi et al. 2010) and kept the same for all the under evaluation images.
1140 G. LIASIS AND S. STAVROU

Step 4: Evolve the level set function Φ according to Equation (11). At each time step,the level set function is reinitialized to be the signed distance function to its zero levelset curves (Sussman, Smereka, and Osher 1993) and the constants c1; c2; d1; d2 areupdated according to equations as presented in 10.Step 5: Extract the zero level set from Φt x; yð Þ if the level set evolution terminates.Step 6: Spatial morphological operations using a structuring element are applied onthe segmentation mask. The process aims to remove small areas that are not part of abuilding, as well to create better-structured buildings. The same approach as wasdiscussed in Section 3.1 for designing the morphological filter and specify its para-meters is followed.
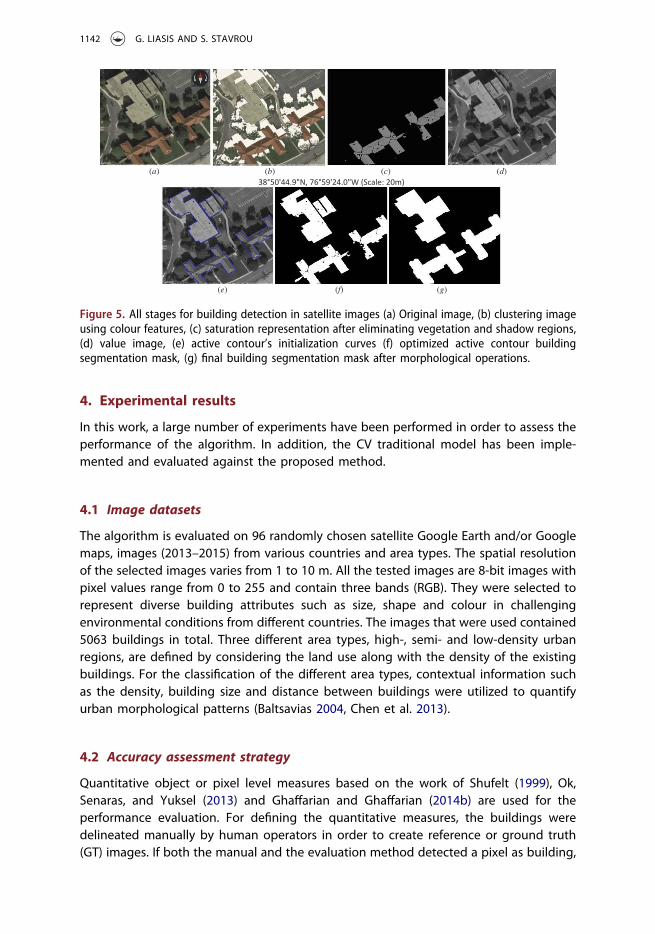
The suggested optimized active contour segmentation algorithm for building struc-tures detection is presented in Figure 4 and all the images derived from the differentprocessing steps are shown in Figure 5.
Satellite image (RGB)
Value Saturation
HSV colour conversion
Initial curves
OAC level set segmentation
The detection of buildings mask
Morphological post-processing
Final detection of buildings mask
k-means
Morphological
Threshold values
Figure 4. Segmentation algorithm flowchart.
INTERNATIONAL JOURNAL OF REMOTE SENSING 1141
4. Experimental results
In this work, a large number of experiments have been performed in order to assess theperformance of the algorithm. In addition, the CV traditional model has been imple-mented and evaluated against the proposed method.
4.1 Image datasets
The algorithm is evaluated on 96 randomly chosen satellite Google Earth and/or Googlemaps, images (2013–2015) from various countries and area types. The spatial resolutionof the selected images varies from 1 to 10 m. All the tested images are 8-bit images withpixel values range from 0 to 255 and contain three bands (RGB). They were selected torepresent diverse building attributes such as size, shape and colour in challengingenvironmental conditions from different countries. The images that were used contained5063 buildings in total. Three different area types, high-, semi- and low-density urbanregions, are defined by considering the land use along with the density of the existingbuildings. For the classification of the different area types, contextual information suchas the density, building size and distance between buildings were utilized to quantifyurban morphological patterns (Baltsavias 2004, Chen et al. 2013).
4.2 Accuracy assessment strategy
Quantitative object or pixel level measures based on the work of Shufelt (1999), Ok,Senaras, and Yuksel (2013) and Ghaffarian and Ghaffarian (2014b) are used for theperformance evaluation. For defining the quantitative measures, the buildings weredelineated manually by human operators in order to create reference or ground truth(GT) images. If both the manual and the evaluation method detected a pixel as building,
(a)
(e) (f) (g)
(b) (c) (d)38°50'44.9"N, 76°59'24.0"W (Scale: 20m)
Figure 5. All stages for building detection in satellite images (a) Original image, (b) clustering imageusing colour features, (c) saturation representation after eliminating vegetation and shadow regions,(d) value image, (e) active contour’s initialization curves (f) optimized active contour buildingsegmentation mask, (g) final building segmentation mask after morphological operations.
1142 G. LIASIS AND S. STAVROU
then the pixel is denoted as a true positive (TP). If both the manual and the underevaluation method detected a pixel as a non-building, then the pixel is denoted as atrue negative (TN). If the under evaluation method incorrectly presents a pixel asbuilding while the ground truth image presents it as a non-building, then the pixel isdenoted as a false positive (FP). Finally, if the under evaluation method incorrectlydetects a pixel as a non-building while the ground truth image presents it as a building,then the pixel is denoted as a false negative (FN). The following well-known pixel basedstatistical metrics, precision (p), recall (r) and weighted harmonic mean score F ofprecision and recall are computed to evaluate the performance of the proposed method:
p ¼ TPTPþ FP
� 100; r ¼ TPTPþ FN
� 100
F ¼ 1þ B2� � 2� p� r
B2 � pþ r� 100 (12)
where jj:jj denotes the number of pixels or objects assigned to each distinct categoryand B is a non-negative real constant parameter to trade-off the precision and recall.
The precision metric gives the percentage of the true detected pixels against the truepositive pixels along with the misclassified pixels as buildings. The recall metric, wherethe denominator stands for the total number of true building pixels, is the buildingdetection accuracy and indicates the percentage of building pixels correctly detected bythe evaluation algorithm. The weighted harmonic mean (F) of precision and recall valuesis an important measure since it combines these two metrics together into a single oneand can be thought as a quality metric. Metrics, precision and recall are equallyimportant in a detection of building structures process, thus specifying the B parameterequal to one is the most appropriate. The same metrics are applied to the object-basedassessment, where a building object is identified as TP if at least some percentage of itspixels is correctly detected. Subsequently, if a detected object corresponds to less thansome percentage of an object in the ground truth image, then is denoted as FN. Finally,a resulted object is identified as FP if it does not coincide with any of the buildingobjects in the ground truth image.
4.3 Results and discussion
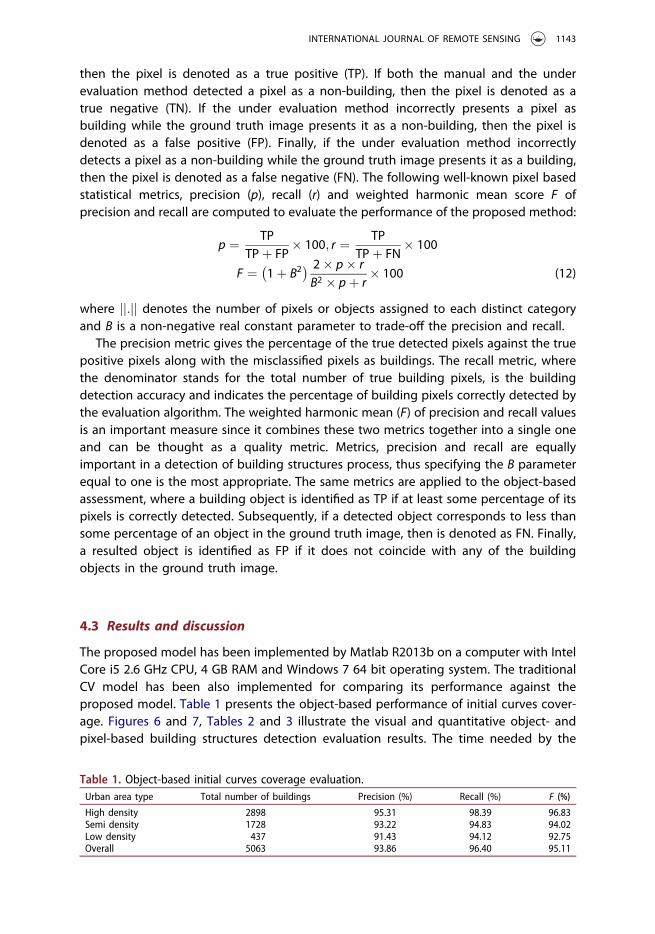
The proposed model has been implemented by Matlab R2013b on a computer with IntelCore i5 2.6 GHz CPU, 4 GB RAM and Windows 7 64 bit operating system. The traditionalCV model has been also implemented for comparing its performance against theproposed model. Table 1 presents the object-based performance of initial curves cover-age. Figures 6 and 7, Tables 2 and 3 illustrate the visual and quantitative object- andpixel-based building structures detection evaluation results. The time needed by the
Table 1. Object-based initial curves coverage evaluation.Urban area type Total number of buildings Precision (%) Recall (%) F (%)
High density 2898 95.31 98.39 96.83Semi density 1728 93.22 94.83 94.02Low density 437 91.43 94.12 92.75Overall 5063 93.86 96.40 95.11
INTERNATIONAL JOURNAL OF REMOTE SENSING 1143

traditional active contour and the proposed model to detect all the correspondingbuildings per image were recorded. The average time in seconds using all the testedimages is presented in Table 4.
In several cases, as can be seen in Figure 1, where multiple buildings with differentcolour intensity values exist in satellite images, darker than the average building roofs,are not usually detected using the traditional level set CV segmentation method appliedin the grey-scale representation of the image. In this work, it was observed that asaturation image is able to highlight building features that are presented with at leasta high-intensity colour value in one of the RGB bands. This was expected since the purecolour surfaces have high saturation representation (Tsai 2006, Arévalo, González, andAmbrosio 2008). However, in the case of vegetation regions and/or shadows, these werealso highlighted in several scenes on the saturation representation. By utilizing theintensity properties of the saturation representation of the image after eliminating thevegetation areas and shadows in the proposed active contour segmentation model thatalso encompass a well-defined initialization process, several buildings that were missedby the traditional CV active contour model were detected and extracted in most of theexamined cases. In this work, along with the general initialization k-means ++ schemethat has been utilized, additional steps such as threshold and morphological filters havebeen incorporated for refining further the results of the k-means clustering method . Thethreshold values TV and TS of the two criterion functions as presented in Equations (6)and (7) have been estimated using a training process. Samples of shadow and
(a) (b) (c) (d) (e)
(f) (g) (h) (i) (j)
(k) (l) (m) (n) (o)
38°55'35.2"N, 77°02'18.7"W (Scale: 20m)
40°22'49.2"N, 3°39'01.2"W (Scale: 20m)
Figure 6. Building detection in satellite images. (a), (f), (k) Original images of low-, semi- and high-density urban areas, respectively, (b), (g), (l), ground truth images, (c), (h), (m) clustering imagesusing colour features, (d), (i), (n) active contour building boundaries detection, (e), (j), (o) buildingsegmentation final masks using the propose method.
1144 G. LIASIS AND S. STAVROU
(a) (b) (c) (d)
(e) (f) (g) (h)21°32'14.4"N, 39°10'18.2"E 34°42'19.5"N, 33°05'11.3"E (Scale: 20m)
(i) (j) (k) (l)38°55'35.6"N 77°02'26.7"W (Scale: 20m)
(m) (n) (o) (p)37°50'24.9"S 144°55'58.2"E (Scale: 20m)
(q) (r) (s) (t)27°27'24.7"N 82°36'01.2"W 34°01'14.1"N, 118°12'31.9"W (Scale: 20m)
(w) (v)
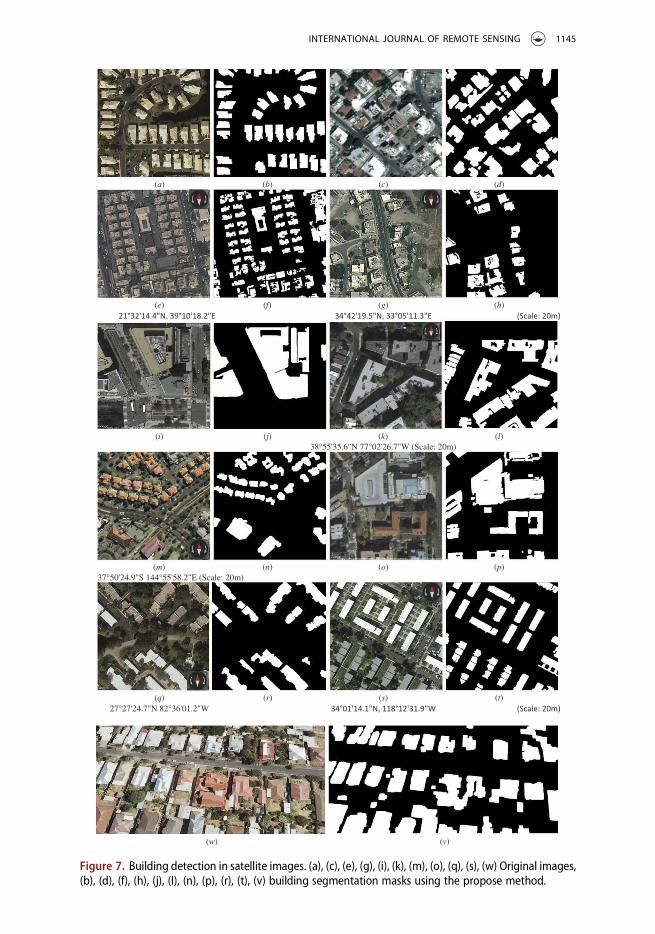
Figure 7. Building detection in satellite images. (a), (c), (e), (g), (i), (k), (m), (o), (q), (s), (w) Original images,(b), (d), (f), (h), (j), (l), (n), (p), (r), (t), (v) building segmentation masks using the propose method.
INTERNATIONAL JOURNAL OF REMOTE SENSING 1145
vegetation regions were used to define the range of the colour intensity values. It hasbeen observed that these values vary for different capture areas. However, the estima-tion of the most appropriate values is not a very difficult task since in Google Earthimages, large areas are presented with similar radiometric characteristics. Thus, therange of the threshold values can be estimated only once using a small number ofrepresentative images for each area. The median value of the observed range for eacharea is calculated and used as threshold value in the corresponding area. As can be seenin Figure 3, the proposed clustering method for eliminating shadows and vegetationregions works well in various scenes. Furthermore, buildings with green or variations ofgreen roofs are not affected when the elimination of vegetation and shadow regionsprocess is applied (Figure 3, Image a). This can be explained since the radiometriccharacteristics of green artificial objects as presented in satellite images are differentfrom the radiometric characteristics of vegetation regions. Nevertheless, some buildingsare not detected when they have very similar radiometric characteristics with shadows.These types of building structures are expected to be eliminated as shadows. However,this drawback is limited since only those buildings that entirely eliminated as shadowsare finally missed. The visual interpolation of all figures suggests that this type ofbuilding roofs is very rare in the evaluation scenes. As can be seen in Figure 6 Image(k), building structures with similar radiometric characteristics with shadows are success-fully detected if a small region of the corresponding building roofs still exists in thecluster image. The proposed active contour model achieves to detect such buildingstructures utilising more iterations in the curve propagation process (n � 60Þ, sinceinitial curves are created for these buildings by the proposed initialization scheme.
The segmentation results of the presented method demonstrate that the buildingdetection algorithm works well to satellite images of urban areas. Results presented in
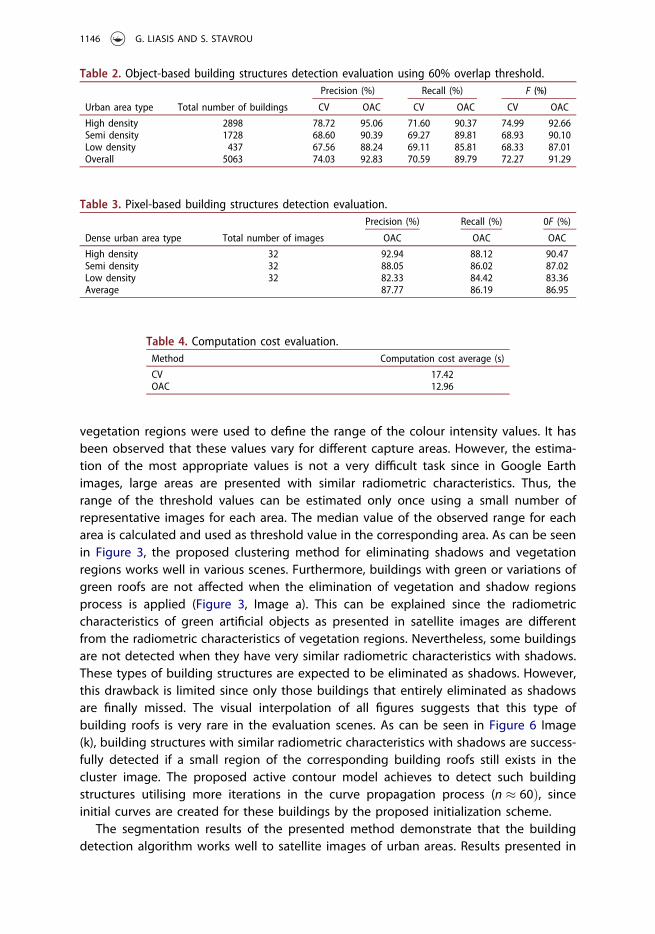
Table 2. Object-based building structures detection evaluation using 60% overlap threshold.
Urban area type Total number of buildings
Precision (%) Recall (%) F (%)
CV OAC CV OAC CV OAC
High density 2898 78.72 95.06 71.60 90.37 74.99 92.66Semi density 1728 68.60 90.39 69.27 89.81 68.93 90.10Low density 437 67.56 88.24 69.11 85.81 68.33 87.01Overall 5063 74.03 92.83 70.59 89.79 72.27 91.29
Table 3. Pixel-based building structures detection evaluation.
Dense urban area type Total number of images
Precision (%) Recall (%) 0F (%)
OAC OAC OAC
High density 32 92.94 88.12 90.47Semi density 32 88.05 86.02 87.02Low density 32 82.33 84.42 83.36Average 87.77 86.19 86.95
Table 4. Computation cost evaluation.Method Computation cost average (s)
CV 17.42OAC 12.96
1146 G. LIASIS AND S. STAVROU

all figures suggest that the proposed methodology can detect almost all the buildingsand their basic structure and shape, even when these buildings have irregular shapes,interact with environmental objects and occlude each other. In addition, the proposedmethod discards most of the non-building areas with similar building characteristics andany misleading artefacts. Applying optimized morphological post-processing functionsensure that the building shapes are retained.
The algorithm’s overall per object segmentation results, reach a building detectionaccuracy or recall of 89.79%, precision 92.83% and a radio F equal to 91.29% as seen inTable 2. The values in Table 2 correspond to 60% overlapping threshold. This value hasbeen selected following the best practice used in other studies in literature (Ghaffarianand Ghaffarian 2014b, Ok, Senaras, and Yuksel 2013). The algorithm performs well in allthe predefined density urban area types. The pixel-based evaluation results as can beseen in Table 3 reveals also good and balance results, which are in line with the object-based results. The recall metric estimated at 86.19%, the precision at 87.77% and the Fscore at 86.95%. All the results reveal that the performance of the algorithm decreases asbuilding density decreases. This has been expected since active contour models basedon CV formulation detect regions of interest that exhibit a certain similarity and homo-geneity. In high dense urban areas, the building structures are presented with greaterhomogeneity and similarity. In addition, the results revealed that the performance of theproposed method is superior when compared against the traditional CV model. Thecomputation cost is an important factor in the practical application of the method andhas been proved that for the proposed method it is significantly lower than the CVmodel (Table 4). After the application of the proposed initialization scheme, less itera-tions compared to the traditional CV model are needed to detect the building structuressince as can be seen in Figure 2, the initial contours are near the boundaries of thebuilding structures. The proposed initialization scheme also enforces the active contoursto avoid several misleading regions during the propagation process, leading to bettersegmentations. The coverage of the buildings as presented in the analysed scenes usingthe proposed initialization method has been thoroughly assessed. The aim of theinitialization development curves process was to create curves of any form and structurewithin or near the building objects. Thus, in this assessment if any part of the initialcurve coincides with a building in the ground truth image, it is considered as a TP. Aninitial curve is denoted as a FP if does not coincide with any of the building objects aspresented in the ground truth image. A FN object is denoted a building object pre-sented in the ground truth image whereas an initial curve has not been developed. Ascan be seen from Table 1, the overall recall accuracy has been calculated at 96.40%, theprecision at 93.86% and the F score at 95.11%.
Finally, it should also be noticed that if the image do not adhere to quality standardsthe resulting segmentation might suffer, as is the case with most of the buildingsegmentation algorithms (Ghaffarian and Ghaffarian 2014b, Ok, Senaras, and Yuksel2013; Karantzalos and Paragios 2010; Karantzalos and Argialas 2009; Peng, Zhang, andLiu 2005, Liasis and Stavrou 2013; Ahmadi et al. 2010). However, the algorithm has beenshown to work well even in such cases, as is shown in Figure 7 and the presented resultsfor the Images (e) and (h).
A limitation of the proposed method that should be noticed is that in high-densityurban environments, some non-building objects such as bridges and parking places or
INTERNATIONAL JOURNAL OF REMOTE SENSING 1147
even parts of the roads are classified as buildings. This behaviour is expected and isnoticed in other schemes proposed in literature (Sirmacek and Unsalan 2009; Ok 2013,Ghaffarian and Ghaffarian 2014b, Karantzalos and Paragios 2010), because of the simi-larity between these objects and the buildings. Finally, the results of this work revealedthat in some cases where two or more buildings are extremely closed to each other areclassified as a single building. This influences the object based results as reported inTable 2 for the TPs buildings where two or more merged buildings based on the 60%coverage threshold are classified as two or more TPs even though one of them mighthas less than 60% TP pixels. This has been observed mainly in high-density areas andvery few buildings less than 1.5% of all the existing buildings in all the tested imageswere affected. This percentage can be thought as the highest margin of error of theobject-based results.
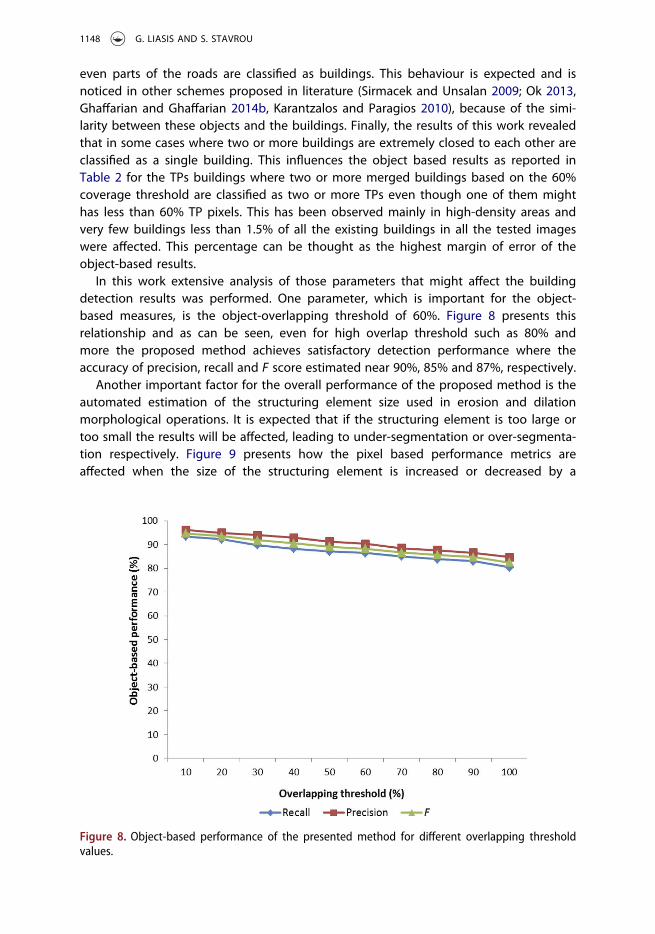
In this work extensive analysis of those parameters that might affect the buildingdetection results was performed. One parameter, which is important for the object-based measures, is the object-overlapping threshold of 60%. Figure 8 presents thisrelationship and as can be seen, even for high overlap threshold such as 80% andmore the proposed method achieves satisfactory detection performance where theaccuracy of precision, recall and F score estimated near 90%, 85% and 87%, respectively.
Another important factor for the overall performance of the proposed method is theautomated estimation of the structuring element size used in erosion and dilationmorphological operations. It is expected that if the structuring element is too large ortoo small the results will be affected, leading to under-segmentation or over-segmenta-tion respectively. Figure 9 presents how the pixel based performance metrics areaffected when the size of the structuring element is increased or decreased by a
Figure 8. Object-based performance of the presented method for different overlapping thresholdvalues.
1148 G. LIASIS AND S. STAVROU
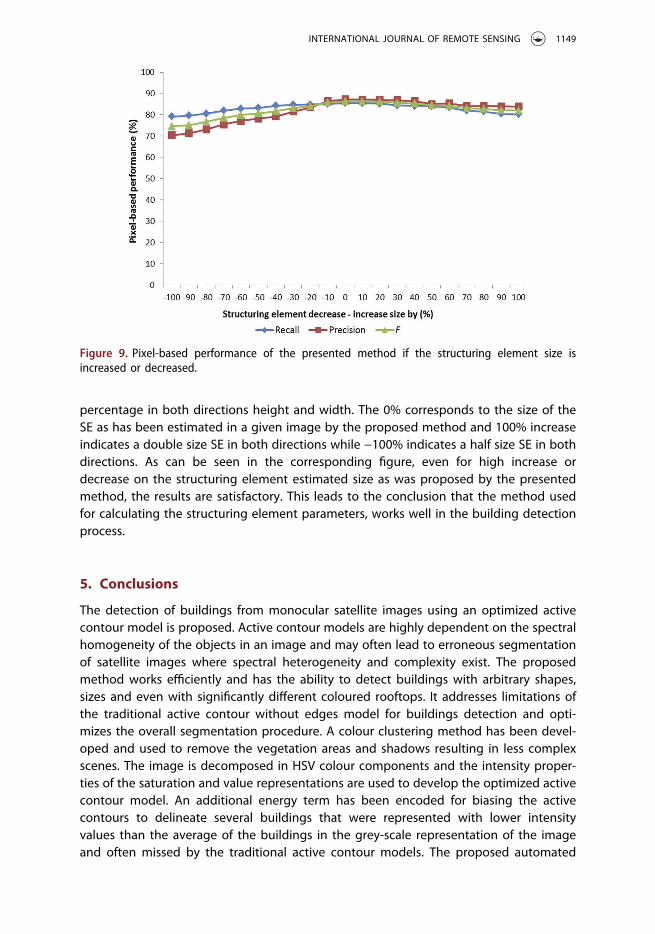
percentage in both directions height and width. The 0% corresponds to the size of theSE as has been estimated in a given image by the proposed method and 100% increaseindicates a double size SE in both directions while −100% indicates a half size SE in bothdirections. As can be seen in the corresponding figure, even for high increase ordecrease on the structuring element estimated size as was proposed by the presentedmethod, the results are satisfactory. This leads to the conclusion that the method usedfor calculating the structuring element parameters, works well in the building detectionprocess.
5. Conclusions
The detection of buildings from monocular satellite images using an optimized activecontour model is proposed. Active contour models are highly dependent on the spectralhomogeneity of the objects in an image and may often lead to erroneous segmentationof satellite images where spectral heterogeneity and complexity exist. The proposedmethod works efficiently and has the ability to detect buildings with arbitrary shapes,sizes and even with significantly different coloured rooftops. It addresses limitations ofthe traditional active contour without edges model for buildings detection and opti-mizes the overall segmentation procedure. A colour clustering method has been devel-oped and used to remove the vegetation areas and shadows resulting in less complexscenes. The image is decomposed in HSV colour components and the intensity proper-ties of the saturation and value representations are used to develop the optimized activecontour model. An additional energy term has been encoded for biasing the activecontours to delineate several buildings that were represented with lower intensityvalues than the average of the buildings in the grey-scale representation of the imageand often missed by the traditional active contour models. The proposed automated
Figure 9. Pixel-based performance of the presented method if the structuring element size isincreased or decreased.
INTERNATIONAL JOURNAL OF REMOTE SENSING 1149

active contour initialization process drives the contours to a better segmentation of theimage faster avoiding misleading regions. Post-processing operations for retaining thebuilding’s structure are also applied. The estimation of the parameters used in themorphological erosion and dilation operations proved to be appropriate for retainingthe shape of the detected buildings and remove any remaining small misleadingartefacts. Extensive experiments were performed on a large number of images and theproduced segmentation results for heterogeneous and complex satellite images verifythe efficiency of the suggested method. The proposed method achieves better accuracywhen compared to traditional active contour without edges segmentation model.Furthermore, the method is time efficient, there is no dependency on any additionaldata and user interaction is not needed.
Disclosure statement
No potential conflict of interest was reported by the authors.
ORCID
Gregoris Liasis http://orcid.org/0000-0002-7734-8385
References
Ahmadi, S., M. Zoej, H. Ebadi, H. A. Moghaddam, and A. Mohammadzadeh. 2010. “Automatic UrbanBuilding Boundary Extraction from High Resolution Aerial Images Using an Innovative Model ofActive Contours.” International Journal of Applied Earth Observation and Geoinformation 12 (3):150–157. doi:10.1016/j.jag.2010.02.001.
Arévalo, V., J. González, and G. Ambrosio. 2008. “Shadow Detection in Colour High- ResolutionSatellite Images.” International Journal of Remote Sensing 29 (7): 1945–1963. doi:10.1080/01431160701395302.
Arthur, D., and S. Vassilvitskii. 2007. “k-means++: The Advantages of Careful Seeding.” SODA ‘07:Proceedings of the Eighteenth Annual ACM-SIAM Symposium on Discrete Algorithms, NewOrleans, LA, January 7–9, 1027–1035.
Baltsavias, E. 2004. “Object Extraction and Revision by Image Analysis Using Existing Geodata andKnowledge: Current Status and Steps Towards Operational Systems.” ISPRS Journal ofPhotogrammetry and Remote Sensing 58 (3–4): 129–151. doi:10.1016/j.isprsjprs.2003.09.002.
Besbes, O., Z. Belhadj, and N. Boujemaa. 2006. “Adaptive Satellite Images Segmentation by LevelSet Multiregion Competition.” INRIA, Research Report 5855, 3–19.
Cao, G., X. Yang, and D. Zhou. 2005. “Mumford-Shah Model Based Man-Made Objects Detectionfrom Aerial Images.” Proceedings of the International Conference on Scale Space Theories inComputer Vision, Hofgeismar, April 7–9, 386–395.
Chan, T., and L. Vese. 2001. “Active Contours without Edges.” IEEE Transactions on Image Processing10 (2): 266–277. doi:10.1109/83.902291.
Chan, T., and W. Zhu. 2003. Level Set Based Shape Prior Segmentation. Technical Report 03-66,Computational Applied Mathematics, Los Angeles, CA: UCLA.
Chen, Z., Y. Zhang, B. Guindon, T. Esch, A. Roth, and J. Shang. 2013. “Urban Land Use MappingUsing High Resolution SAR Data Based on Density Analysis and Contextual Information.”Canadian Journal of Remote Sensing 38 (6): 738–749. doi:10.5589/m13-002.
Chen, L., S. Zhao, W. Han, and Y. Li. 2012. “Building Detection in an Urban Area Using Lidar Dataand Quickbird Imagery.” International Journal of Remote Sensing 33 (16): 5135–5148.doi:10.1080/01431161.2012.659355.
1150 G. LIASIS AND S. STAVROU
Cremers, D., N. Sochen, and C. Schnörr. 2006. “A Multiphase Dynamic Labeling Model forVariational Recognition-Driven Image Segmentation.” International Journal of Computer Vision66 (1): 67–81. doi:10.1007/s11263-005-3676-z.
Dai, L., J. Ding, and J. Yang. 2015. “Inhomogeneity-Embedded Active Contour for Natural ImageSegmentation.” Pattern Recognition 48: 2513–2529. doi:10.1016/j.patcog.2015.03.001.
Elbakary, M. I., and K. M. Iftekharuddin. 2014. “Shadow Detection of Man-Made Buildings in High-Resolution Panchromatic Satellite Images.” IEEE Transactions on Geoscience and Remote Sensing52 (9): 5374–5386. doi:10.1109/TGRS.2013.2288500.
Ghaffarian, S., and S. Ghaffarian. 2014a. “Automatic Building Detection Based on SupervisedClassification Using High Resolution Google Earth Images.” ISPRS Journal of Photogrammetryand Remote Sensing XL-3: 101–106.
Ghaffarian, S., and S. Ghaffarian. 2014b. “Automatic Building Detection Based on Purposive Fastica(PFICA) Algorithm Using Monocular High Resolution Google Earth Images.” ISPRS Journal ofPhotogrammetry and Remote Sensing 97: 152–159. doi:10.1016/j.isprsjprs.2014.08.017.
Haala, N., and M. Kada. 2010. “An Update on Automatic 3D Building Reconstruction.” ISPRS Journalof Photogrammetry and Remote Sensing 65 (6): 570–580. doi:10.1016/j.isprsjprs.2010.09.006.
Hartigan, J. A., and M. A. Wong. 1979. “Algorithm AS 136: A K-Means Clustering Algorithm.” AppliedStatistics 28: 100–108. doi:10.2307/2346830.
Hu, J., S. You, and U. Neumann. 2003. “Approaches to Large-Scale Urban Modeling.” IEEE ComputerGraphics and Applications 23 (6): 62–69. doi:10.1109/MCG.2003.1242383.
Huertas, A., and R. Nevatia. 1988. “Detecting Buildings in Aerial Images.” Computer Vision, Graphics,and Image Processing 41 (2): 131–152. doi:10.1016/0734-189X(88)90016-3.
Inglada, J. 2007. “Automatic Recognition of Man-Made Objects in High Resolution Optical RemoteSensing Images by SVM Classification of Geometric Image Features.” ISPRS Journal ofPhotogrammetry and Remote Sensing 62 (3): 236–248. doi:10.1016/j.isprsjprs.2007.05.011.
Irvin, R. B., and D. M. McKeown. 1989. “Methods for Exploiting the Relationship between Buildingsand Their Shadows in Aerial Imagery.” IEEE Transactions on Systems, Man, and Cybernetics 19 (6):1564–1575. doi:10.1109/21.44071.
Karantzalos, K., and D. Argialas. 2009. “A Region-Based Level Set Segmentation for AutomaticDetection of Man-Made Objects from Aerial and Satellite Images.” Photogrammetric Engineering& Remote Sensing 75 (6): 667–677. doi:10.14358/PERS.75.6.667.
Karantzalos, K., and N. Paragios. 2009. “Recognition-Driven Two-Dimensional Competing PriorsToward Automatic and Accurate Building Detection.” IEEE Transactions on Geoscience andRemote Sensing 47 (1): 133–144. doi:10.1109/TGRS.2008.2002027.
Karantzalos, K., and N. Paragios. 2010. “Large-Scale Building Reconstruction through InformationFusion and 3D Priors.” IEEE Transactions on Geoscience and Remote Sensing 48 (5): 2283–2296.doi:10.1109/TGRS.2009.2039220.
Kass, M., A. Witkin, and D. Terzopoulos. 1988. “Snakes: Active Contour Models.” InternationalJournal of Computer Vision 1: 321–331. doi:10.1007/BF00133570.
Katartzis, A., and H. Sahli. 2008. “A Stochastic Framework for the Identification of Building RooftopsUsing A Single Remote Sensing Image.” IEEE Transactions on Geoscience and Remote Sensing 46(1): 259–271. doi:10.1109/TGRS.2007.904953.
Koc-San, D., and M. Turker. 2014. “Support Vector Machines Classification for Finding BuildingPatches from IKONOS Imagery: The Effect of Additional Bands.” Journal Applications RemoteSensing 8 (1): 202–213. doi:10.1117/1.JRS.8.083694.
Krishnamachari, S., and R. Chellappa. 1996. “Delineating Buildings by Grouping Lines with Mrfs.”IEEE Transactions on Image Processing 5 (1): 164–168. doi:10.1109/83.481683.
Lee, D. S., J. Shan, and J. S. Bethel. 2003. “Class-Guided Building Extraction from Ikonos Imagery.”Photogrammetric Engineering & Remote Sensing 69 (2): 143–150. doi:10.14358/PERS.69.2.143.
Li, C., R. Huang, Z. Ding, J. C. Gatenby, D. N. Metaxas, and J. C. Gore. 2011. “A Level Set Method forImage Segmentation in the Presence of Intensity Inhomogeneities with Application to MRI.” IEEETransactions on Image Processing 20 (7): 2007–2016. doi:10.1109/TIP.2011.2146190.
INTERNATIONAL JOURNAL OF REMOTE SENSING 1151
Li, C., C.-Y. Kao, J. C. Gore, and Z. Ding. 2008. “Minimization of Region- Scalable Fitting Energy forImage Segmentation.” IEEE Transactions on Image Processing 17 (10): 1940–1949. doi:10.1109/TIP.2008.2002304.
Liasis, G., and S. Stavrou. 2013. “Optimizing Level Set Initialization for Satellite ImageSegmentation.” IEEE 20th International Conference on Telecommunications (ICT), Casablanca,May 6–8, 1–5.
Liow, Y.-T., and T. Pavlidis. 1990. “Use of Shadows for Extracting Buildings in Aerial Images.”Computer Vision, Graphics, and Image Processing 49 (2): 242–277. doi:10.1016/0734-189X(90)90139-M.
Lloyd, S. P. 1982. “Least Squares Quantization in PCM.” IEEE Transactions on Information Theory 28:129–137. doi:10.1109/TIT.1982.1056489.
McGlone, J. C., and J. A. Shufelt. 1994. “Projective and Object Space Geometry for MonocularBuilding Extraction.” In Proceedings IEEE Computation Social Conference CVPR 2486: 54–61.
Mumford, D., and J. Shah. 1989. “Optimal Approximations by Piecewise Smooth Functions andAssociated Variational Problems.” Commission Pure Applications Mathematical 42: 577–685.doi:10.1002/(ISSN)1097-0312.
Niu, X. 2006. “A Semi-Automatic Framework for Highway Extraction and Vehicle Detection Basedon A Geometric Deformable Model.” ISPRS Journal of Photogrammetry and Remote Sensing 61:170–186. doi:10.1016/j.isprsjprs.2006.08.004.
Ok, A. 2013. “Automated Detection of Buildings from Single VHR Multispectral Images UsingShadow Information and Graph Cuts.” ISPRS Journal of Photogrammetry and Remote Sensing86: 21–40. doi:10.1016/j.isprsjprs.2013.09.004.
Ok, A., C. Senaras, and B. Yuksel. 2013. “Automated Detection of Arbitrarily Shaped Buildings inComplex Environments from Monocular VHR Optical Satellite Imagery.” IEEE TransactionsGeoscience Remote Sensing 51 (3): 1701–1717.
Osher, S., and J. Sethian. 1988. “Fronts Propagating with Curvature Dependent Speed: AlgorithmsBased on Hamilton-Jacobi Formulations.” Journal of Computational Physics 79: 12–49.doi:10.1016/0021-9991(88)90002-2.
Peña, J. M., J. A. Lozano, and P. Larrañaga. 1999. “An Empirical Comparison of Four InitializationMethods for the K-Means Algorithm.” Pattern Recognition Letters 20 (10): 1027–1040.doi:10.1016/S0167-8655(99)00069-0.
Peng, J., D. Zhang, and Y. Liu. 2005. “An Improved Snake Model for Building Detection from UrbanAerial Images.” Pattern Recognition Letters 26 (5): 587–595. doi:10.1016/j.patrec.2004.09.033.
Samson, C., L. Blanc-Feraud, G. Aubert, and J. Zerubia. 2001. “Two Variational Models forMultispectral Image Classification.” In Proceedings of the Third International Workshop onEnergy Minimization Methods in Computer Vision and Pattern Recognition (Lecture Notes InComputer Science), Sophia Antipolis, September 3–5, 344–358.
Shufelt, J., and D. Mckeown. 1993. “Fusion of Monocular Cues to Detect Manmade Structures inAerial Imagery.” CVGIP: Image Understanding 57 (3): 307–330. doi:10.1006/ciun.1993.1021.
Shufelt, J. A. 1999. “Performance Evaluation and Analysis of Monocular Building Extraction fromAerial Imagery.” IEEE Transactions on Pattern Analysis and Machine Intelligence 21 (4): 311–326.doi:10.1109/34.761262.
Sirmacek, B., and C. Unsalan. 2008. “Building Detection from Aerial Images Using Invariant ColourFeatures and Shadow Information.” In 23rd International Symposium on Computer andInformation Sciences, Istanbul, October 27–29, 105–110.
Sirmacek, B., and C. Unsalan. 2009. “Urban-Area and Building Detection Using SIFT Keypoints andGraph Theory.” IEEE Transactions on Geoscience and Remote Sensing 47 (4): 1156–1167.doi:10.1109/TGRS.2008.2008440.
Sussman, M., P. Smereka, and S. Osher. 1993. “A Level Set Approach for Computing Solutions toIncompressible Two-Phase Flow.” UCLA CAM Report 114: 93–18.
Tsai, V. J. D. 2006. “A Comparative Study on Shadow Compensation of Color Aerial Images inInvariant Color Models.” IEEE Transactions on Geoscience and Remote Sensing 44 (6): 1661–1671.doi:10.1109/TGRS.2006.869980.
1152 G. LIASIS AND S. STAVROU

Ünsalan, C., and K. L. Boyer. 2005. “A System to Detect Houses and Residential Street Networks inMultispectral Satellite Images.” Computer Vision and Image Understanding 98 (3): 423–461.doi:10.1016/j.cviu.2004.10.006.
Vese, L., and T. Chan. 2002. “A Multiphase Level Set Framework for Image Segmentation Using theMumford and Shah Model.” International Journal of Computer Vision 50 (3): 271–293.doi:10.1023/A:1020874308076.
Wang, X.-F., H. Min, L. Zou, and Y.-G. Zhang. 2015. “A Novel Level Set Method for ImageSegmentation by Incorporating Local Statistical Analysis and Global Similarity Measurement.”Pattern Recognition 48: 189–204. doi:10.1016/j.patcog.2014.07.008.
Zhang, K., Q. Liu, H. Song, and X. Li. 2015. “A Variational Approach to Simultaneous ImageSegmentation and Bias Correction.” IEEE Transactions on Cybernetics 45 (8): 1426–1437.doi:10.1109/TCYB.2014.2352343.
Zhang, K., H. Song, and L. Zhang. 2010. “Active Contours Driven by Local Image Fitting Energy.”Pattern Recognition 43 (4): 1199–1206. doi:10.1016/j.patcog.2009.10.010.
Zhang, K., L. Zhang, H. Song, and W. Zhou. 2010. “Active Contours with Selective Local or GlobalSegmentation: A New Formulation and Level Set Method.” Image and Vision Computing 28 (4):668–676. doi:10.1016/j.imavis.2009.10.009.
INTERNATIONAL JOURNAL OF REMOTE SENSING 1153

本文献由“学霸图书馆-文献云下载”收集自网络,仅供学习交流使用。
学霸图书馆(www.xuebalib.com)是一个“整合众多图书馆数据库资源,
提供一站式文献检索和下载服务”的24 小时在线不限IP
图书馆。
图书馆致力于便利、促进学习与科研,提供最强文献下载服务。
图书馆导航:
图书馆首页 文献云下载 图书馆入口 外文数据库大全 疑难文献辅助工具