Embed Size (px)
Citation preview

mdrcB U I L D I N G K N O W L E D G E
T O I M P R O V E S O C I A L P O L I C Y
MDRC16 East 34th StreetNew York, NY 10016Tel: 212 532 3200
Regional Office475 14th StreetOakland, CA 94612Tel: 510 663 6372
www.mdrc.org
mdrc
Career
Academ
iesL
ON
G-T
ER
MIM
PA
CT
SO
NL
AB
OR
MA
RK
ET
OU
TC
OM
ES
,E
DU
CA
TIO
NA
LA
TT
AIN
ME
NT,
AN
DT
RA
NS
ITIO
NS
TO
AD
ULT
HO
OD
JUN
E20
08
Career AcademiesLONG-TERM IMPACTS ON LABOR MARKET OUTCOMES,
EDUCATIONAL ATTAINMENT, AND TRANSITIONS TO ADULTHOODJAMES J. KEMPLE
JUNE 2008
mdrcB U I L D I N G K N O W L E D G E
T O I M P R O V E S O C I A L P O L I C Y

Career Academies
Long-Term Impacts on Labor Market Outcomes, Educational Attainment, and Transitions to Adulthood
James J. Kemple
with
Cynthia J. Willner
June 2008
Funders of the Career Academies Evaluation
Alcoa Foundation
American Express Foundation*
Bristol-Myers Squibb Foundation
Center for Research on the Education
of Students Placed At Risk (CRESPAR)
Charles Stewart Mott Foundation*
Citigroup Foundation*
Ford Foundation
Richard King Mellon Foundation
Russell Sage Foundation
The Commonwealth Fund
The George Gund Foundation
The Grable Foundation
The James Irvine Foundation*
The Pew Charitable Trusts
The Rockefeller Foundation
The Wallace Foundation
U.S. Department of Education
U.S. Department of Labor*
Westinghouse Foundation
William T. Grant Foundation
*Denotes funders of this report.
Dissemination of MDRC publications is supported by the following funders that help finance
MDRC’s public policy outreach and expanding efforts to communicate the results and implications
of our work to policymakers, practitioners, and others: The Ambrose Monell Foundation, Bristol-
Myers Squibb Foundation, The Kresge Foundation, and The Starr Foundation. MDRC’s dissemina-
tion of its education-related work is supported by the Bill & Melinda Gates Foundation, Carnegie
Corporation of New York, and Citi Foundation. In addition, earnings from the MDRC Endowment
help sustain our dissemination efforts. Contributors to the MDRC Endowment include Alcoa Foun-
dation, The Ambrose Monell Foundation, Anheuser-Busch Foundation, Bristol-Myers Squibb
Foundation, Charles Stewart Mott Foundation, Ford Foundation, The George Gund Foundation, The
Grable Foundation, The Lizabeth and Frank Newman Charitable Foundation, The New York Times
Company Foundation, Jan Nicholson, Paul H. O’Neill Charitable Foundation, John S. Reed, The
Sandler Family Supporting Foundation, and The Stupski Family Fund, as well as other individual
contributors.
The findings and conclusions in this report do not necessarily represent the official positions or poli-
cies of the funders.
For information about MDRC and copies of our publications, see our Web site: www.mdrc.org.
Copyright © 2008 by MDRC. All rights reserved.
iii
Overview
Established more than 30 years ago, Career Academies have become a widely used high school reform
initiative that aims to keep students engaged in school and prepare them for successful transitions to post-
secondary education and employment. Typically serving between 150 and 200 students from grades 9 or
10 through grade 12, Career Academies are organized as small learning communities, combine academic
and technical curricula around a career theme, and establish partnerships with local employers to provide
work-based learning opportunities. There are estimated to be more than 2,500 Career Academies operating
around the country.
Since 1993, MDRC has been conducting a uniquely rigorous evaluation of the Career Academy approach
that uses a random assignment research design in a diverse group of nine high schools across the United
States. Located in medium- and large-sized school districts, the schools confront many of the educational
challenges found in low-income urban settings. The participating Career Academies were able to imple-
ment and sustain the core features of the approach, and they served a cross-section of the student popula-
tions in their host schools. This report describes how Career Academies influenced students’ labor market
prospects and postsecondary educational attainment in the eight years following their expected graduation.
The results are based on the experiences of more than 1,400 young people, approximately 85 percent of
whom are Hispanic or African-American.
Key Findings
The Career Academies produced sustained earnings gains that averaged 11 percent (or $2,088)
more per year for Academy group members than for individuals in the non-Academy group — a
$16,704 boost in total earnings over the eight years of follow-up (in 2006 dollars).
These labor market impacts were concentrated among young men, a group that has experienced a
severe decline in real earnings in recent years. Through a combination of increased wages, hours
worked, and employment stability, real earnings for young men in the Academy group increased
by $3,731 (17 percent) per year — or nearly $30,000 over eight years.
Overall, the Career Academies served as viable pathways to a range of postsecondary education
opportunities, but they do not appear to have been more effective than options available to the
non-Academy group. More than 90 percent of both groups graduated from high school or re-
ceived a General Educational Development (GED) certificate, and half completed a postsecon-
dary credential.
The Career Academies produced an increase in the percentage of young people living indepen-
dently with children and a spouse or partner. Young men also experienced positive impacts on
marriage and being custodial parents.
The findings demonstrate the feasibility of improving labor market preparation and successful school-
to-work transitions without compromising academic goals and preparation for college. Investments in
career-related experiences during high school can produce substantial and sustained improvements in
the labor market prospects and transitions to adulthood of youth. In fact, Career Academies are one of
the few youth-focused interventions that have been found to improve the labor market prospects of
young men. At the same time, Career Academies have proven to be challenging to implement on a large
scale with high levels of fidelity, and the evidence from this evaluation may not apply to programs that
are partially implemented or that use only selected features of the Academy approach. Further research
should be conducted to determine the effects of key Academy components.

Contents
Overview iii List of Exhibits vii Preface ix Acknowledgments xi Introduction 1 The Career Academies Evaluation 3 Impacts on High School Experiences and Outcomes 7 Long-Term Impacts on Labor Market Outcomes 11 Impacts on Educational Attainment 25 Impacts on Family Formation and Other Social Adjustment Outcomes 35 Discussion of the Findings 37 References 45 Earlier MDRC Publications on Career Academies 47 Technical Resources to accompany this report are available at: www.mdrc.org/publications/482/techresources.pdf
v

vii
List of Exhibits
1 Impacts on Average Monthly Earnings and Components of Earnings
for the Full Sample 13
2 Month-by-Month Impacts on Total Monthly Earnings for the Full
Sample 15
3 Impacts on Average Monthly Earnings and Components of Earnings
for Young Men 18
4 Impacts on Average Monthly Earnings and Components of Earnings
for Young Women 19
5 Month-by-Month Impacts on Total Monthly Earnings, by Gender 21
6 Month-by-Month Impacts on Total Monthly Earnings, by Risk
Subgroup 26
7 High School Completion Rates Eight Years After Scheduled
Graduation for the Evaluation Sample and the NELS Sample 28
8 Highest Postsecondary Credential Completed Eight Years After
Scheduled High School Graduation for the Evaluation Sample and the
NELS Sample 30
9 Impacts on Educational Attainment Eight Years After Scheduled High
School Graduation, by Gender 32
10 Impacts on Family Formation and Other Social Adjustment Outcomes
Eight Years After Scheduled High School Graduation for the Full
Sample 36
11 Impacts on Family Formation Eight Years After Scheduled High
School Graduation, by Gender 38

ix
Preface
In urban high schools, too many students who manage to graduate are unprepared for
postsecondary education or the world of work. And they often enter a labor market that offers
them few opportunities for good jobs. These new findings from MDRC’s long-term study of
Career Academies — a popular high school reform that combines academics with career devel-
opment opportunities — shows that the model produces sustained employment and earnings
gains, particularly among young men.
The report is the culmination of a 15-year random assignment study of Career Acade-
mies in nine urban high schools around the country that has followed students from when they
entered high school until eight years after their scheduled graduation. More than 80 percent of
students in the sample are black or Hispanic. The evaluation, which has been funded by the U.S.
Departments of Education and Labor and by 18 private foundations and organizations,
represents an admirable commitment to objective evidence on the part of the Career Academy
“movement.”
This study provides the most rigorous evidence to date that investing in career-oriented
programs and experiences for high school students can have a long-term payoff in the labor
market. Notably, the employment and earnings gains did not come at the expense of postsecon-
dary enrollment and completion; Academy participants and students in the control group had
similar levels of academic achievement. These findings suggest that pitting academic prepara-
tion against career development in high schools may be a false dichotomy.
As one of the few high school initiatives with rigorous evidence of effectiveness (albeit
concentrated on postsecondary labor market outcomes), the Career Academy model has at-
tained prominent stature in the field. But the programs represented in this study were selected in
part because they were judged to be good examples of the model. Of late, organizations that
support the development of Career Academies have come under increasing pressure to rely on
one or two of the model’s individual components — like small learning communities — with
the expectation that elements of the program can produce results similar to those found in this
study. However, until further research is conducted on the separate effects of specific compo-
nents, policymakers and practitioners hoping to achieve comparable impacts should look to im-
plement the full model with fidelity.
In sum, the employment and earnings effects of Career Academies are encouraging
news, particularly for young men of color, who are often left behind in the labor market. Career
Academies appear to offer these young men a boost — comparable to the earnings premium of
a year or two of postsecondary education — that puts them on a different earnings trajectory.
Gordon Berlin
President

xi
Acknowledgments
This report reflects more than 15 years of research on Career Academies and is the
product of a remarkable collaboration among staff at MDRC and the sites, funders, and advisers
who have supported the evaluation. This undertaking would not have been possible without the
vision and support of the funding organizations listed at the front of the report. Special gratitude
is also due the staff at the participating Career Academies, high schools, school districts, and
employer partners, as well as the young people who generously gave of their time to respond to
the surveys that MDRC and its partners have administered over the past eight years.
The survey for this report was administered by Survey Research Management (SRM),
led by Linda Kuhn and Ashley Bronzon. The survey team at SRM achieved an extraordinary
response rate and provided the study and the field with a rich source of information about the
young people who agreed to be part of this study. The report benefited greatly from the input of
key advisers to the evaluation. Ron Ferguson of the John F. Kennedy School of Government at
Harvard University, Harry Holzer of Georgetown University, Richard Murnane of the Harvard
Graduate School of Education, David Stern of the University of California at Berkeley, and
Andrew Sum of Northeastern University reviewed an early draft of the findings. They provided
invaluable advice regarding further analyses and offered insights into the results and their impli-
cations. MDRC’s Education Studies Committee reviewed an early draft of the report and of-
fered useful advice regarding the context and implications for the findings and guidance on fur-
ther analysis to be conducted for future papers. The committee includes Richard J. Murnane,
Kevin J. Dougherty, Ronald Ferguson, Charles M. Payne, Melissa Roderick, Cecilia Rouse,
Susan Sandler, and Susan Sclafani. Formal preparation of this report was preceded by briefings
and discussions with the project’s funders and several policy and practitioner groups. These ex-
changes yielded numerous suggestions for additional analyses, provided sources of contextual
material, and pointed to implications that the findings may have for policy and practice.
Staff from several organizations concerned with Career Academies have provided use-
ful guidance throughout the study and helpful comments on the findings — including Charles
Dayton, David Stern, and Susan Tidyman of the Career Academy Support Network; J. D. Hoye
and several of her colleagues at the National Academy Foundation; and Susan Katzman of the
National Career Academy Coalition.
Throughout the Career Academies Evaluation, Robert Ivry, MDRC’s Senior Vice Pres-
ident for Development and External Affairs, played a pivotal role in building partnerships with
the sites, funders, and advisers that form the foundation for the study. This report benefited
greatly from his insights and advice on how to sharpen the presentation of the findings and their
policy implications. Other MDRC staff members played key roles in acquiring and analyzing

xii
data for this report. In particular, Shirley James and the staff from MDRC’s data entry room
coordinated the information for the survey administration and data collection process with Sur-
vey Research Management.
Gordon Berlin, Rob Ivry, Fred Doolittle, Corinne Herlihy, Janet Quint, and Cynthia
Miller reviewed drafts and provided helpful technical and substantive guidance on the presenta-
tion of the findings. Thanks are due John Hutchins for his help in guiding the report’s organiza-
tion and production and to Robert Weber for his skillful editing. Finally, we are grateful to Da-
vid Sobel, who prepared the report for publication.
The Authors
1
Introduction
For nearly 40 years, Career Academies have offered high schools — particularly
those in urban communities — a systematic approach to addressing the challenges young
people face as they confront the demands of high school and prepare for postsecondary
education and the world of work. Typically serving between 150 and 200 students from
grades 9 or 10 through grade 12, Career Academies are defined by three distinguishing fea-
tures: (1) they are organized as small learning communities to create a more supportive,
personalized learning environment; (2) they combine academic and career and technical
curricula around a career theme to enrich teaching and learning; and (3) they establish part-
nerships with local employers to provide career awareness and work-based learning oppor-
tunities for students. There are estimated to be more than 2,500 Career Academies across
the country, operating either as a single program or as multiple programs within a larger
high school.
This report presents findings on the long-term effects of Career Academies on out-
comes associated with the transition from adolescence to adulthood –– particularly on labor
market participation, educational attainment, and family formation –– over the eight years
following scheduled graduation from high school. In summary, the Career Academies pro-
duced sustained employment and earnings gains, particularly among young men. While Ca-
reer Academies had no impact (positive or negative) on educational attainment, half of the
young people in both the Academy and non-Academy groups earned a postsecondary cre-
dential. The Career Academies also showed positive effects on increasing family stability.
Since 1993, MDRC has been conducting a uniquely rigorous evaluation of the Ca-
reer Academy approach in a diverse group of nine high schools across the country. The eval-
uation is being funded by the U.S. Departments of Education and Labor and by 18 private
foundations and organizations.
At least three features of the current educational and labor market landscape make
the long-term results presented in this report especially relevant to policymakers and practi-
tioners. First, the labor market for high school-age youth has continued a precipitous de-
cline since the 1990s.1 While civilian employment rates steadily increased through 2007,
young people have failed to capture any share of this overall gain. The decline accelerated
when the national job market began to deteriorate. By 2008, only about a third of the popu-
lation of young people ages 16 through 19 held jobs, compared with 45 percent in 2000.
Youth employment has been an important factor associated with many long-term positive
1See Sum, McLaughlin, and Khatiwada (2008).
2
outcomes, including staying in school, graduating, preventing teen pregnancy, and making
successful transitions to postsecondary education and employment.2 Findings from the Ca-
reer Academies evaluation provide further evidence of the potential effect of positive work-
related experiences during high school on successful transitions to adulthood.
The labor market prospects of young men of color, particularly African-Americans,
have been especially troubling. First of all, employment rates among all men declined be-
tween 1970 and 2000, but the decline was much steeper for men with a high school diploma
or less. At the same time, employment among less-educated women rose substantially.3
Employment rates for African-American men ages 20 to 24 have been declining steadily
since 1970, from around 77 percent in 1969 to only 56 percent in 2003, and the employment
gap between young African-American and white men hovered around 19 percentage points
throughout the past decade.4 Even in the peak economic period of 1999, African-American
and Hispanic males aged 16 to 24 were far more likely to be neither working nor enrolled in
school than white males of the same age (22.8 percent and 12.8 percent versus 8.7 percent,
respectively).5 Because more than 80 percent of the young people in the sample for the Ca-
reer Academies Evaluation are Hispanic (56 percent) and African-American (30 percent),
the findings can shed light on effective strategies for improving their labor market pros-
pects.
A second important trend is the increasing attention paid in high schools to high-
stakes testing of academic performance and to preparing students for college. This has been
accompanied by a lessening focus on other goals of high schools, including youth develop-
ment and preparation for postsecondary employment. This shift in emphasis reflects a
growing consensus that a high school diploma is no longer a viable terminal credential for
long-term success in the labor market and that all students must leave high school with the
skills and habits to succeed in some form of postsecondary education. For instance, com-
pleting two years of community college, compared to only graduating from high school,
was associated with more than a 10 percent increase in annual earnings for young men in
1999.6 Unfortunately, it appears that workforce preparation and college readiness have often
been positioned as ―either/or‖ choices, suggesting that high schools cannot help students in
both areas simultaneously. Evidence from the Career Academies evaluation suggests that
these goals do not need to be mutually exclusive.
2See Sum, Fogg, and Mangum (2000); and Gruber (2001).
3Edelman, Holzer, and Offner (2006), Table 5.2.
4Sum, Khatiwada, Ampaw, and Tobar (2004).
5Edelman, Holzer, and Offner (2006), Table 2.1.
6See Marcotte, Bailey, Borkoski, and Kienzl (2005).
3
Third, the Career Academy model has continued to proliferate across the country
both as a comprehensive approach to improving high school opportunities for young people
and as a framework for other approaches that incorporate some of the model’s component
parts. The Career Academy model stands at the crossroads of many recent initiatives aimed
at improving low-performing high schools. In fact, it predated many popular reforms, in-
cluding school-to-work initiatives of the early 1990s, the movement toward small schools
and smaller learning communities of the 2000s, and the more recent efforts to combine aca-
demic rigor and real-world relevance. Finally, the business community has a reinvigorated
interest in supporting high school improvement initiatives and, more specifically, in helping
young people gain access to high-quality learning opportunities in the workplace. The new
findings from the Career Academies Evaluation presented in this report, as well as reexami-
nation of findings presented in earlier reports, can shed light on the efficacy of these types
of reform efforts.
The remainder of this report — the seventh formal report from the study — de-
scribes the Career Academy approach and highlights the key features of the evaluation that
underlie its rigor and the relevance of its findings.7 The newest findings from the study are
based on a survey administered 11 to 12 years after the young people in the study sample
entered their Career Academies and a full eight years after their scheduled graduation from
high school.8
The Career Academies Evaluation
Several features of the Career Academies Evaluation make it distinctive. The high
schools are located in medium- and large-sized school districts and reflect many of the
stressful conditions found in urban settings. The participating Career Academies were able
to implement and sustain the core features of the approach, and they served a cross-section
of the student populations in their host high schools. The Career Academies Evaluation is
one of the few studies of a school reform initiative that uses the design of a randomized,
controlled field trial. Because more eligible and appropriate students applied for the Acad-
emy programs than could be served, applicants were randomly selected to enroll in the
7For a detailed discussion of the history and conceptual framework underlying the Career Academy
approach, see Stern, Dayton, and Raby (2003); Kemple (1997); Kemple, Poglinco, and Snipes (1999);
and Kemple and Snipes (2000). For a detailed discussion of the research design, the sites, the students in
the study sample, and other data sources used in the evaluation, see Kemple and Rock (1996); Kemple
(1997); Kemple and Snipes (2000); and Kemple (2001). 8For a more detailed discussion of the Career Academies Evaluation Eight-Year Post-High School
Follow-Up Survey response rates and analysis issues related to data availability, see Unit 1 in the Tech-
nical Resources for this report (Kemple and Willner, 2008), available at www.mdrc.org.
4
Academy group. The remaining applicants constitute the study’s non-Academy control
group. Subsequent differences in outcomes between the two groups provide valid estimates
of the Academies’ impacts. This type of research design is widely considered to be the most
reliable way to measure the effectiveness of interventions such as Career Academies. The
evaluation is also unusual among studies of school reforms for following both groups of
students from the beginning of high school through eight years after scheduled graduation.
Following is an overview of the key features of the study.
The Research Design
Using a random assignment research design is the best way to ensure that there are
initially no systematic differences between the two groups that make up the study sample.
Each of the students in the sample applied for a place in one of the participating Career
Academies and was deemed to be appropriate for the programs. Because more applicants
were appropriate than the programs could serve, a lottery was used to choose which stu-
dents would be invited to enroll. Approximately 55 percent of the students in the applicant
pool were randomly selected to enroll in a Career Academy, and they constitute the study’s
Academy group. The remaining students (about 45 percent of the applicant pool) continued
or enrolled in the high schools’ regular education programs and constitute the study’s non-
Academy control group. The outcomes for the non-Academy group are the best indicators
of how students in the Academy group would have fared if they had not had access to the
programs. Therefore, the impacts — that is, the differences in outcomes between the Acad-
emy and the non-Academy groups — represent the changes that the Career Academies pro-
duced over and above what students were likely to achieve in non-Academy environments.9
The Sites
Each of the nine high schools in this evaluation is located in or near a large urban
school district with substantially higher percentages of African-American and Hispanic stu-
dents than exist in school districts nationally, as well as higher dropout rates, higher unem-
ployment rates, and higher percentages of low-income families. The schools were selected
strategically on the basis of several criteria:10
9For a detailed description of how the random assignment procedures were implemented for the
evaluation, see Kemple and Rock (1996). 10
For a discussion of the criteria and process used to select sites for this study, see Kemple and Rock
(1996). The sites are located in the following school districts: Baltimore City School District; East Side
Union School District (two sites in San Jose, California); Miami-Dade School District; Pittsburgh Public
School District; Santa Ana (California) Unified School District; Socorro (Texas) Unified School District;
(continued)
5
The schools had implemented and sustained the core features of the Career
Academy approach for at least two years.
There was a clear contrast — along the core dimensions of the Academy
model — between the Career Academy and other programs within the high
school.
The Career Academy served a diverse population of students but made expli-
cit efforts to include students who were perceived to be at risk of dropping
out.
The high school and its Career Academy were willing and able to accommo-
date random assignment and other key features of the evaluation design.
As a group, the participating sites reflect many of the conditions under which Ca-
reer Academies had been implemented across the country in the mid to late 1990s. They
operated as single programs within larger comprehensive high schools, and while they were
inclusive of a range of students in their host high schools, they were targeted to students
who were seen as being at risk of being disengaged from or even dropping out of school. In
addition, each of the participating Academies was able to reach a threshold level of imple-
mentation for the three core components of the model: small learning communities, career-
themed curricula, and partnerships with employers. Individually the sites also capture much
of the variation in the Academy approach as it had been adapted to local needs and circum-
stances, including variation in the intensity of the three components.
It is important to note, however, that the Career Academies participating in this
evaluation may not be representative of Career Academies across the country today. Com-
peting pressures on high schools and on Academies, as well as the increasing focus on aca-
demic performance and college preparation, have pushed many Career Academies or Acad-
emy-like programs to deemphasize supports for academic and career-related course combi-
nations and to limit the availability of work-based learning and other career awareness and
development opportunities both in and outside school.
Students in the Study
The student populations in the participating Career Academies tend to reflect the
ethnic, gender, and socioeconomic characteristics of their host high schools, which are di-
verse. More than 50 percent of the sample are Hispanic, and another 30 percent are African-
Pajaro Valley (Watsonville, California) Unified School District; and Washington, DC, Public School Dis-
trict.
6
American. Students came to the programs with varying school-related experiences and edu-
cational aspirations. For example, based on their high attendance rates and grades in middle
school and their reports on a baseline survey of high engagement in school and high expec-
tations for going to college, it appears that some students were doing well in school when
they applied for the Academies. Key goals of Academies are to prepare such students for
college and to provide them with career-related learning experiences and credentials that
will make them more competitive in the labor market. Other Academy applicants, such as
those with low middle school attendance rates and grades, appeared to be on a path toward
dropping out or ending their education after high school. Academies aimed to ―reengage‖
such students, providing them with more applied learning experiences and encouraging
them to develop higher aspirations for education and employment.11
Data Sources
Since the study began in 1993, data for the Career Academies Evaluation were ob-
tained from sample members’ high school transcripts and from surveys administered during
high school and at three points during the first eight years following their scheduled gradua-
tion from high school. The primary data for the current report were obtained from a survey
administered to sample members approximately 96 months after their scheduled graduation
from high school (11 to 12 years after they entered the study). The Career Academies Eval-
uation’s Eight-Year Post-High School Follow-Up Survey focused on the fifth through
eighth years following scheduled graduation from high school and asked sample members:
Whether and when they graduated from high school or received a General
Educational Development (GED) certificate and whether and when they
enrolled in postsecondary education programs and institutions. Students who
were enrolled in postsecondary education programs were asked about the
programs’ characteristics, whether they completed the program, and what
degree or certificate, if any, they received.
Information about their work experiences during the previous four years, in-
cluding which month and year they started each job that they held during this
period, which month and year they left each job, the number of hours they
worked per week, the number of weeks they worked per month, and the
hourly wage they earned.
Information about the industries in which they worked for each job they held
during the previous four years, and the type of work they performed. For the
11
For a more complete listing of background characteristics of the full study sample, see Unit 1 in the
Technical Resources for this report (Kemple and Willner, 2008).
7
most recent jobs that respondents held, the survey also asked about the types
of skills they used, how their employment might have been connected to high
school experiences, and how their work experience might be preparing them
for the future.
Information about marital status, having children, living situations, and other
experiences in their lives and their plans for the future.
The newest findings in this report are based on data collected from 1,428 youth who
completed the Eight-Year Post-High School Follow-up Survey. This represents 81 percent
of the 1,764 young people in the full study sample: 82 percent of the Academy group and
80 percent of the non-Academy group. Response analysis indicates that there were no sys-
tematic differences in background characteristics between Academy and non-Academy
group members who responded to the survey. The relatively high response rates in both the
Academy and the non-Academy group — and the comparability of the Academy and non-
Academy group members who responded — afford a high degree of confidence that the
survey data yield valid estimates of the Career Academies’ impacts.12
Impacts on High School Experiences and Outcomes
To provide context for interpreting the impacts that Career Academies had on post-
secondary education and labor market outcomes, this section summarizes findings from
prior reports about how Career Academies influenced students’ high school experiences.
The first three reports from the Career Academies Evaluation describe the implementation
of the core elements of the Career Academy approach and assess the extent to which these
elements provided students, teachers, and employers with the types of supports and learning
opportunities promised by the Career Academy model.13 The fourth report examines the
impacts that the participating Academies had on students’ performance and engagement
through the end of their twelfth-grade year in high school.14
The findings from these earlier reports provide an essential context for understand-
ing the pattern of Career Academy effects on postsecondary educational attainment and la-
bor market outcomes that are discussed in this report. In particular, they shed light on the
12
For a more detailed discussion of the Career Academies Evaluation Eight-Year Post-High School
Follow-Up Survey response rates and analysis issues related to data availability, see Unit 1 in the Tech-
nical Resources for this report (Kemple and Willner, 2008). 13
See Kemple and Rock (1996); Kemple (1997); and Kemple, Poglinco, and Snipes (1999). 14
See Kemple and Snipes (2000). Also, Units 3 to 5 in the Technical Resources for this report (Kem-
ple and Willner, 2008) include tables that summarize the impacts on student performance and engage-
ment in high school for the Eight-Year Post-High School Follow-Up Survey sample.
8
facets of students’ high school experiences and outcomes that Career Academies affected or
did not affect. Differences (and the lack of differences) in the experiences of students in the
Academy group and the non-Academy group are fundamental antecedents to the effects that
Career Academies might have had as these young people moved beyond high school into
postsecondary education programs and the world of work.
Several findings reported previously indicate that the Career Academies in the eval-
uation changed students’ experiences during high school in ways that are strongly consis-
tent with the short-term goals of the Academy approach. For example, compared with their
non-Academy counterparts:
Students in the Academy group reported higher levels of interpersonal sup-
port from teachers and peers.
Academy students were more likely to build a high school transcript that
combined academic and career or technical courses.
Academy students were substantially more likely to be exposed to a range of
career awareness and development activities, both in and outside school, and
to work in jobs that were connected to school (for instance, they got a job as
part of a class or through a school connection).
For students who entered the programs at high risk of dropping out, the
Academies increased the likelihood of staying in school through the end of
the twelfth-grade year, improved attendance, and increased the number of
credits earned toward graduation.
For students at medium or low risk of dropping out, the Academies increased
career and technical course-taking and participation in career development
activities without reducing academic course-taking.
Previously reported findings also indicate several potential limitations of the Acad-
emies’ implementation and effectiveness:
Nearly one-third of the students who initially enrolled in the Academies left
the programs before the end of their twelfth-grade year.
The curricula and instructional strategies used in the Academies (in both aca-
demic and career or technical courses) were generally similar to those offered
in the rest of the high school and did not typically include integration of aca-
demic content and knowledge with career-related applications.
9
The Academies had no impact on scores from a standardized test adminis-
tered as part of the evaluation’s data collection effort.
Some Academies that did not substantially increase interpersonal supports
from teachers and peers led to reduced attendance rates and academic course-
taking for some students.
Not surprisingly, the Academies appear to have been most effective at influencing
those aspects of school functioning and student and teacher experiences that are closest to
the core features of the approach. For example, the Academies’ school-within-a-school or-
ganization appears to have created communities of support for teachers and students. In this
context, students were more highly engaged in school, which was reflected in high atten-
dance rates, low dropout rates, and — in the words of several students — a sense of being
in a ―family-like‖ atmosphere. Teachers, too, saw the Academies as a ―learning communi-
ty‖ in which they collaborated with colleagues and were able to give students more persona-
lized attention. The findings suggest that the school-within-a-school structure and the inter-
personal supports that evolved from it may have been important preconditions for the im-
plementation and effectiveness of other features of the Career Academy approach. In and of
themselves, however, these interpersonal supports do not appear to have had a direct impact
on student performance.
The Career Academies in this evaluation had the strongest and most pervasive ef-
fects on the engagement of high-risk students during the high school years. For these stu-
dents, the Academies increased attendance and credits earned in both academic and career
or technical courses, and they kept a higher proportion of those students enrolled in school
through the end of twelfth grade. For medium- and low-risk students, the Academies were
able to increase exposure to career-related courses and career development experiences
without reducing the likelihood of completing at least a basic academic core curriculum.
Employer partnerships — another key feature of the Career Academy approach —
offered employers structured, concrete opportunities to engage in the educational mission of
high schools. These partnerships provided students with a broad array of career awareness
and development experiences both in and outside school, including work-based learning
internships. Academy students were much more likely than their non-Academy counterparts
to be exposed to such experiences as job-shadowing, career fairs, guest speakers from local
businesses, and instruction in how to look for and apply for a job, prepare a résumé, and
interview. Academy students were also provided with increased exposure to individual em-
ployers as well as to information about the types of career opportunities in a given field.
The Academies in this evaluation appear to have had less influence on curricular
content and teachers’ instructional practice than on the measures mentioned above. Acade-
10
my students were more likely to take career-related courses than their non-Academy peers,
but the academic and career-related courses that they took were generally typical of those
offered in the regular school environment — probably because Academy teachers were
bound by the same requirements as their non-Academy counterparts regarding the scope
and sequence of the curriculum.
Similarly, although the Academies were more likely to expose students to applied
and work-related learning activities, they typically did not truly integrate academic and ca-
reer-related curricula and instructional practice in ways consistent with practices that have
been identified in other research.15 Such integration requires offering more extensive pro-
fessional development opportunities to teachers — over and above the in-service workshops
normally available through school and district resources — than most of the Academies
could provide. Other professional development opportunities, such as shared planning time
for teachers, were focused on student-related concerns and on coordinating the career de-
velopment and employer-related activities.
Given the similarity between Academy and non-Academy academic curricula and
instructional practice, it is not surprising that the Academies did not affect students’ stan-
dardized test scores. Still, Academy students performed at least as well as their non-
Academy counterparts on standardized tests, and they received the added benefits of partic-
ipating in a combined academic and career-related curriculum and in a series of career de-
velopment activities.
Finally, only 55 percent of students who were selected to enroll in the Career Acad-
emies remained in those programs through their scheduled graduation. About 15 percent of
the applicants who were randomly assigned to the Academy group never enrolled at all, and
another 30 percent enrolled but subsequently left the programs before their scheduled grad-
uation. Only a small percentage of those who left the Academies dropped out of high school
altogether. It is unclear how much of the attrition from the Academies could have been in-
fluenced or avoided by the programs themselves. Over 90 percent of the students who were
selected for the Academies but who never enrolled in one or who left the Academy before
graduation remained enrolled in other high school programs or high schools. Approximately
54 percent said that they did not enroll or left the programs because they did not like the
Academy or because they preferred other classes or programs that better suited their inter-
ests and needs. Student mobility — usually due to family circumstances beyond the control
of the programs — accounted for another 25 percent of students who either never enrolled
15
For a review of research on approaches for integrating academic and vocational education, see
Grubb (1995a, 1995b).
11
or left before graduation. The remaining students were asked to leave the Academies or
dropped out of high school altogether.
The high attrition rates may suggest, however, that there is not great demand for
Academies, at least under circumstances where students can choose to leave and staff can
ask them to leave. In any case, these are the circumstances under which Career Academies
typically operated in the 1990s and many continue to operate today. As a result, Academies
may be able to influence students’ behavior and performance for only a year or two before
students move on to other opportunities. In an effort to provide the most rigorous and poli-
cy-relevant information about Academies’ potential to affect students’ behavior, this evalu-
ation takes the reality of attrition squarely into account by including in the analysis all stu-
dents who were randomly assigned to Academies, whether they enrolled or not.
Long-Term Impacts on Labor Market Outcomes
This section of the report begins with a summary of the impacts that the Career
Academies had on labor market outcomes for the full study sample. The key labor market
outcomes include average monthly earnings and the core sources of monthly earnings:
months employed during the follow-up period, hours worked per week, and hourly wages.16
It includes information about impacts throughout the eight years following each sample
member’s scheduled graduation from high school and focuses special attention on the cha-
racteristics of jobs held at the end of the follow-up period.17 The section then discusses in
16
All information on job characteristics is self-reported. Monthly earnings were calculated by multip-
lying each sample member’s reported hourly wage by the hours worked per week and by the number of
weeks worked per month. For months in which sample members did not report being employed, zero
values were used for monthly earnings and the components of earnings. For all jobs except the current or
most recent job, hourly wages and weekly hours at the conclusion of the job were applied to the full dura-
tion of the job. Thus, if wages or hours increased or decreased during the job, these measures may over-
or underestimate true monthly earnings. Analyses conducted on the four-year post-high school data indi-
cated that the pattern of impacts was not sensitive to various assumptions about changes in wages or
hours. 17
Information about labor market outcomes during the first four years following scheduled high
school graduation is derived from the Career Academies Evaluation Four-Year Post-High School Survey
and the sample of students who completed that survey (N = 1,458). Information about labor market out-
comes during the second four years following scheduled high school graduation is derived from the Ca-
reer Academies Evaluation Eight-Year Post-High School Survey and the sample of students who com-
pleted that survey (N = 1,428). The estimates derived from these two samples are the most representative
of findings for the full sample of students in the evaluation for the respective time periods. Averages are
calculated across the two time periods, but, because of the different samples from which estimates were
derived, tests of statistical significance were not performed for these averages. Results using a common
overlapping sample from the two follow-up surveys (N = 1,275) yielded a similar pattern of results. See
Unit 1 of the Technical Resources for this report (Kemple and Willner, 2008).
12
more detail the labor market impacts for the subgroups of young men and young women. It
concludes with a brief review of the labor market impacts for subgroups defined by the
background characteristics associated with the risk of dropping out of high school. All dol-
lar values presented in this report are inflation-adjusted and are expressed as 2006 dollars.18
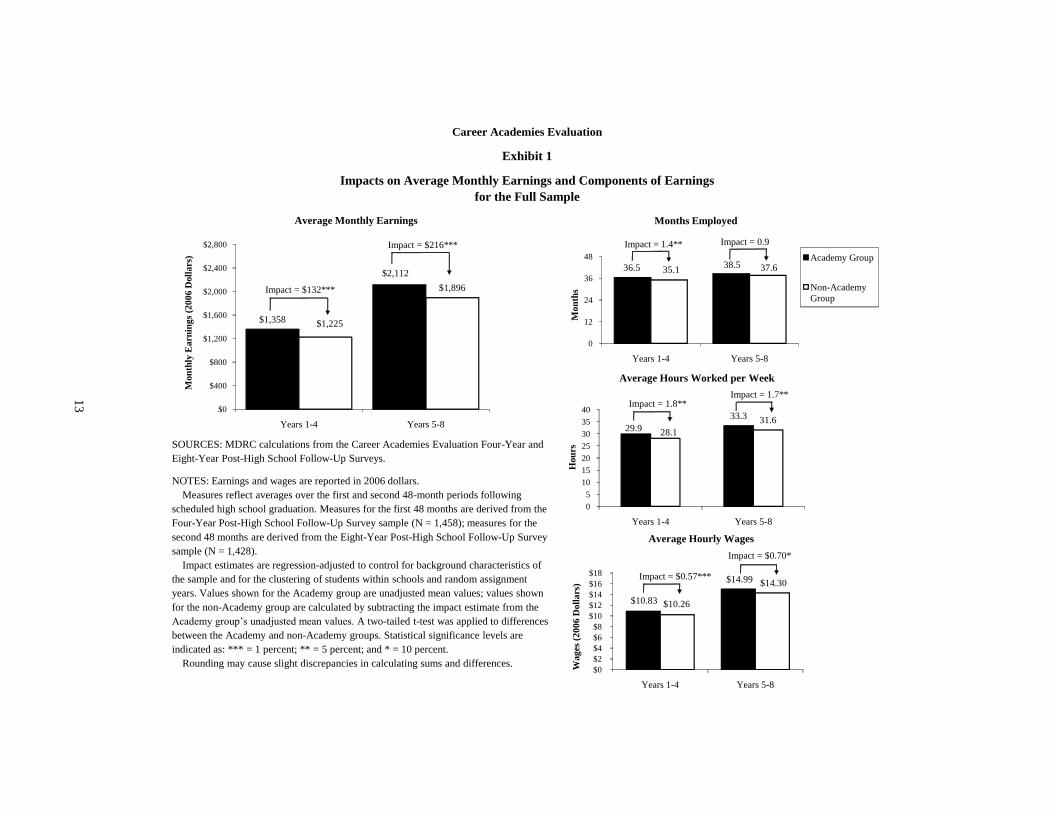
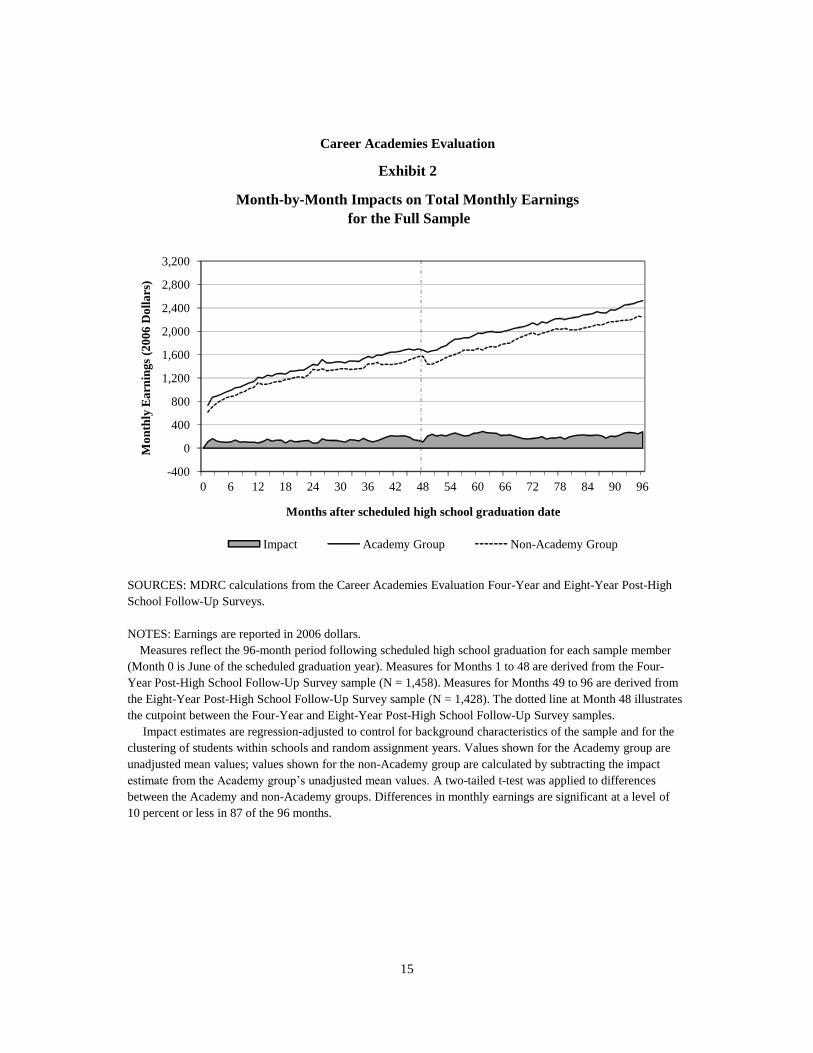
The Career Academies produced positive and sustained impacts on av-
erage monthly earnings throughout the eight-year follow-up period.
Exhibit 1 displays the impacts that Career Academies had on average monthly earn-
ings and on each of the key components of earnings (months employed, hours worked per
week, and hourly wages).19 The bars on the left side of each figure reflect averages over the
first four years following scheduled high school graduation. The bars on the right side of
each figure reflect averages over the next four years. The bar graph on the left side of the
exhibit shows that the Career Academies produced an increase in earnings of $132 per
month during the first four years of the follow-up period and $216 per month in the final
four years. Both of these results are statistically significant, meaning that it is unlikely that
the differences arose by chance.20 On average, this represents an increase of $174 per month
over the full eight years following scheduled high school graduation and an 11 percent in-
crease in monthly earnings over the non-Academy group’s average of $1,561 per month.
Over the eight-year follow-up period, this reflects an additional $2,088 in earnings per year
for the Academy group — or a total of $16,704 (in 2006 dollars).21 The three figures on the
right side of Exhibit 1 indicate that the impact on monthly earnings during both phases of
18
Values are adjusted for inflation using the 2007 Consumer Price Index for All Urban Consumers,
unadjusted for seasonal variation, from the U.S. Department of Labor, Bureau of Labor Statistics
(www.bls.gov/CPI). 19
Unit 3 of the Technical Resources for this report (Kemple and Willner, 2008) includes supplemen-
tary tables that provide more detailed labor market impact findings for the full study sample over the
eight-year follow-up period. 20
In the exhibits, the number of asterisks next to a particular impact estimate indicates the confidence
one should have that the margin of error around that estimate does not include zero. One asterisk indi-
cates that there is a probability of less than 10 percent that the given result would be observed if the im-
pact is truly zero; two asterisks indicates a probability of less than 5 percent; and three asterisks, a proba-
bility of less than 1 percent. The actual probability that random chance could have produced the given
result in the event that the impact is truly zero is shown in the ―p-value‖ column in the tables. 21
Results using the smaller, common overlapping sample from the two follow-up surveys (see footnote 17)
yielded a similar pattern, although the size of the impacts is somewhat smaller, especially for the first four years.
For the common sample, the Career Academies produced an increase of $104 per month during the first four
years of follow-up and $212 per month during the last four years. Over the entire eight-year follow-up period, the
Career Academies produced an impact of $158 per month, which amounts to an increase of $1,898 per year and
an accumulated $15,185 over all eight years (in 2006 dollars). The earnings impacts for all phases of the follow-
up period are statistically significant. Unit 1 of the Technical Resources for this report (Kemple and Willner,
2008) includes additional details about the robustness of the earnings impacts across samples.
Career Academies Evaluation
Exhibit 1
Impacts on Average Monthly Earnings and Components of Earnings
for the Full Sample
$1,358
$2,112
$1,225
$1,896
$0
$400
$800
$1,200
$1,600
$2,000
$2,400
$2,800
Years 1-4 Years 5-8
Mon
thly
Earn
ing
s (2
00
6 D
oll
ars
)
Average Monthly Earnings
36.5 38.535.1 37.6
0
12
24
36
48
Years 1-4 Years 5-8
Mon
ths
Months Employed
Academy Group
Non-Academy
Group
29.9
33.3
28.1
31.6
0
5
10
15
20
25
30
35
40
Years 1-4 Years 5-8
Hou
rs
Average Hours Worked per Week
Impact = 1.7**
Impact = 1.4** Impact = 0.9
Impact = $132***
Impact = 1.8**
$10.83
$14.99
$10.26
$14.30
$0
$2
$4
$6
$8
$10
$12
$14
$16
$18
Years 1-4 Years 5-8
Wag
es (
20
06
Doll
ars
)
Average Hourly Wages
Impact = $0.57***
Impact = $0.70*
SOURCES: MDRC calculations from the Career Academies Evaluation Four-Year and
Eight-Year Post-High School Follow-Up Surveys.
NOTES: Earnings and wages are reported in 2006 dollars.
Measures reflect averages over the first and second 48-month periods following
scheduled high school graduation. Measures for the first 48 months are derived from the
Four-Year Post-High School Follow-Up Survey sample (N = 1,458); measures for the
second 48 months are derived from the Eight-Year Post-High School Follow-Up Survey
sample (N = 1,428).
Impact estimates are regression-adjusted to control for background characteristics of
the sample and for the clustering of students within schools and random assignment
years. Values shown for the Academy group are unadjusted mean values; values shown
for the non-Academy group are calculated by subtracting the impact estimate from the
Academy group’s unadjusted mean values. A two-tailed t-test was applied to differences
between the Academy and non-Academy groups. Statistical significance levels are
indicated as: *** = 1 percent; ** = 5 percent; and * = 10 percent.
Rounding may cause slight discrepancies in calculating sums and differences.
Impact = $216***
13
14
the follow-up period was driven by a combination of increases in the number of months
employed, hours worked per week, and hourly wages.
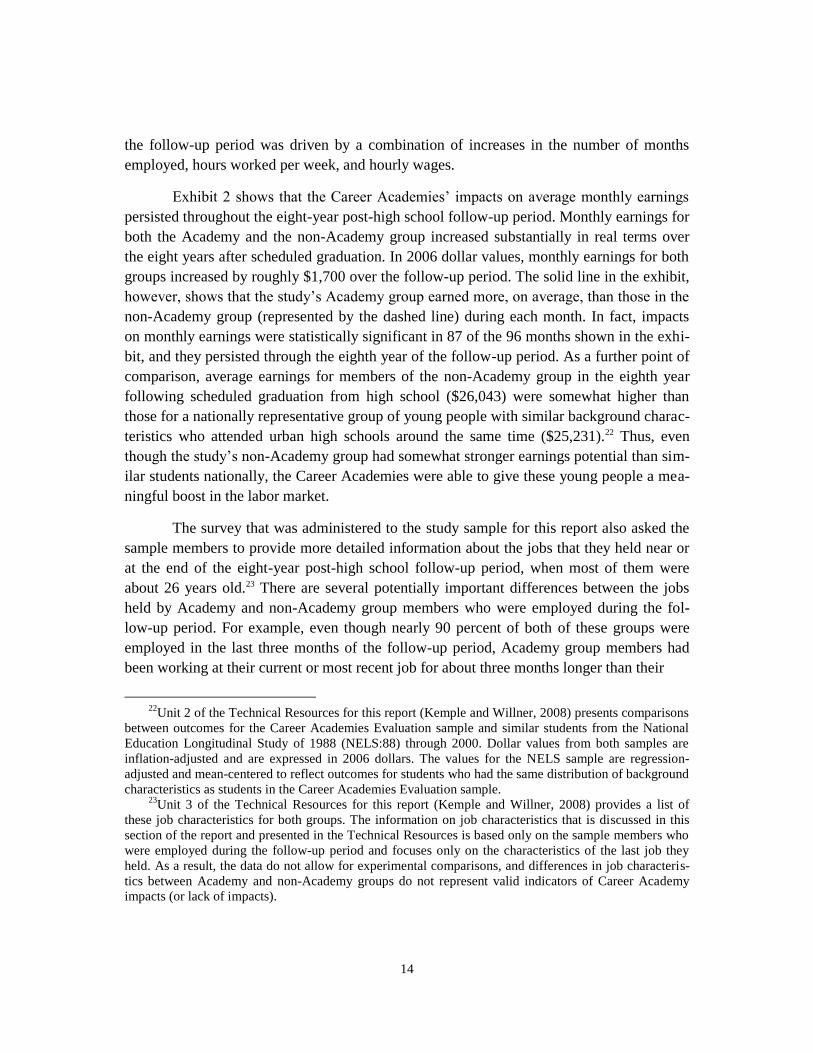
Exhibit 2 shows that the Career Academies’ impacts on average monthly earnings
persisted throughout the eight-year post-high school follow-up period. Monthly earnings for
both the Academy and the non-Academy group increased substantially in real terms over
the eight years after scheduled graduation. In 2006 dollar values, monthly earnings for both
groups increased by roughly $1,700 over the follow-up period. The solid line in the exhibit,
however, shows that the study’s Academy group earned more, on average, than those in the
non-Academy group (represented by the dashed line) during each month. In fact, impacts
on monthly earnings were statistically significant in 87 of the 96 months shown in the exhi-
bit, and they persisted through the eighth year of the follow-up period. As a further point of
comparison, average earnings for members of the non-Academy group in the eighth year
following scheduled graduation from high school ($26,043) were somewhat higher than
those for a nationally representative group of young people with similar background charac-
teristics who attended urban high schools around the same time ($25,231).22 Thus, even
though the study’s non-Academy group had somewhat stronger earnings potential than sim-
ilar students nationally, the Career Academies were able to give these young people a mea-
ningful boost in the labor market.
The survey that was administered to the study sample for this report also asked the
sample members to provide more detailed information about the jobs that they held near or
at the end of the eight-year post-high school follow-up period, when most of them were
about 26 years old.23 There are several potentially important differences between the jobs
held by Academy and non-Academy group members who were employed during the fol-
low-up period. For example, even though nearly 90 percent of both of these groups were
employed in the last three months of the follow-up period, Academy group members had
been working at their current or most recent job for about three months longer than their
22
Unit 2 of the Technical Resources for this report (Kemple and Willner, 2008) presents comparisons
between outcomes for the Career Academies Evaluation sample and similar students from the National
Education Longitudinal Study of 1988 (NELS:88) through 2000. Dollar values from both samples are
inflation-adjusted and are expressed in 2006 dollars. The values for the NELS sample are regression-
adjusted and mean-centered to reflect outcomes for students who had the same distribution of background
characteristics as students in the Career Academies Evaluation sample. 23
Unit 3 of the Technical Resources for this report (Kemple and Willner, 2008) provides a list of
these job characteristics for both groups. The information on job characteristics that is discussed in this
section of the report and presented in the Technical Resources is based only on the sample members who
were employed during the follow-up period and focuses only on the characteristics of the last job they
held. As a result, the data do not allow for experimental comparisons, and differences in job characteris-
tics between Academy and non-Academy groups do not represent valid indicators of Career Academy
impacts (or lack of impacts).
15
Career Academies Evaluation
Exhibit 2
Month-by-Month Impacts on Total Monthly Earnings
for the Full Sample
H:\K12\CA\Report 7\Publications\Round2_Edits\Exhibits\Ex.3-MALE Y1-8 Earnings bargraphs.xlsx, 6/18/08, CW
-400
0
400
800
1,200
1,600
2,000
2,400
2,800
3,200
0 6 12 18 24 30 36 42 48 54 60 66 72 78 84 90 96
Mo
nth
ly E
arn
ing
s (2
00
6 D
oll
ars
)
Months after scheduled high school graduation date
Impact Academy Group Non-Academy Group
SOURCES: MDRC calculations from the Career Academies Evaluation Four-Year and Eight-Year Post-High
School Follow-Up Surveys.
NOTES: Earnings are reported in 2006 dollars.
Measures reflect the 96-month period following scheduled high school graduation for each sample member
(Month 0 is June of the scheduled graduation year). Measures for Months 1 to 48 are derived from the Four-
Year Post-High School Follow-Up Survey sample (N = 1,458). Measures for Months 49 to 96 are derived from
the Eight-Year Post-High School Follow-Up Survey sample (N = 1,428). The dotted line at Month 48 illustrates
the cutpoint between the Four-Year and Eight-Year Post-High School Follow-Up Survey samples.
Impact estimates are regression-adjusted to control for background characteristics of the sample and for the
clustering of students within schools and random assignment years. Values shown for the Academy group are
unadjusted mean values; values shown for the non-Academy group are calculated by subtracting the impact
estimate from the Academy group’s unadjusted mean values. A two-tailed t-test was applied to differences
between the Academy and non-Academy groups. Differences in monthly earnings are significant at a level of
10 percent or less in 87 of the 96 months.
16
control group counterparts. Monthly earnings for the Academy group outpaced the earnings
of the non-Academy group at both the start and end of the job, and the Academy group ex-
perienced a 23 percent increase in real earnings over the time that they held their jobs (from
$2,272 per month to $2,798 per month), compared with about 21 percent for the non-
Academy group (from $2,106 to $2,547 per month). Just over 74 percent of workers in both
groups held jobs that provided a health insurance plan, and just over 81 percent of both
groups (81 percent of the Academy group and 82 percent of the non-Academy group) re-
ported working in a job that provided other benefits, such as sick and vacation days and a
retirement plan.
There were modest differences in the distribution of jobs across occupational sec-
tors. Nineteen percent of the Academy group, compared with 16 percent of the non-
Academy group, were employed in a management, business operations, or financial opera-
tions occupation (although this difference is not statistically significant), and 7 percent of
the Academy group, compared with less than 4 percent of the non-Academy group, were
employed in a computer, engineering, or media technology occupation. There was a slight
trend for Academy group members to have lower employment in other sectors, including
education, social services, law, and science occupations (8 percent versus 11 percent) and
sales, food, and personal services occupations (12 percent versus 14 percent). Overall, the
largest proportion of the Academy group, 24 percent, worked in an office or administrative
support occupation; 15 percent worked in a construction, production, maintenance, or trans-
portation occupation; and 9 percent worked in a health care, medical support, or medical
technology occupation. Similar percentages of the non-Academy group worked in each of
these sectors as well.
In addition to monthly earnings, hourly wages, and occupational sector, two other
characteristics differentiated the jobs held by the Academy group from those held by the
non-Academy group. First, sample members in the Academy group were more likely to be
working in a job that was directly related to the subjects and themes that they studied during
high school: 39 percent of the Academy group reported this to be the case, compared with
31 percent of the non-Academy group. Second, 46 percent of the Academy group indicated
that their current choice of occupational field was influenced by their high school expe-
riences, compared with 36 percent of the non-Academy group. Note, however, that the ma-
jority of those in the Academy group were not working in jobs related to the career theme
of the Academy program for which they were selected.
The impacts on labor market outcomes were concentrated among young
men in the study sample.
17
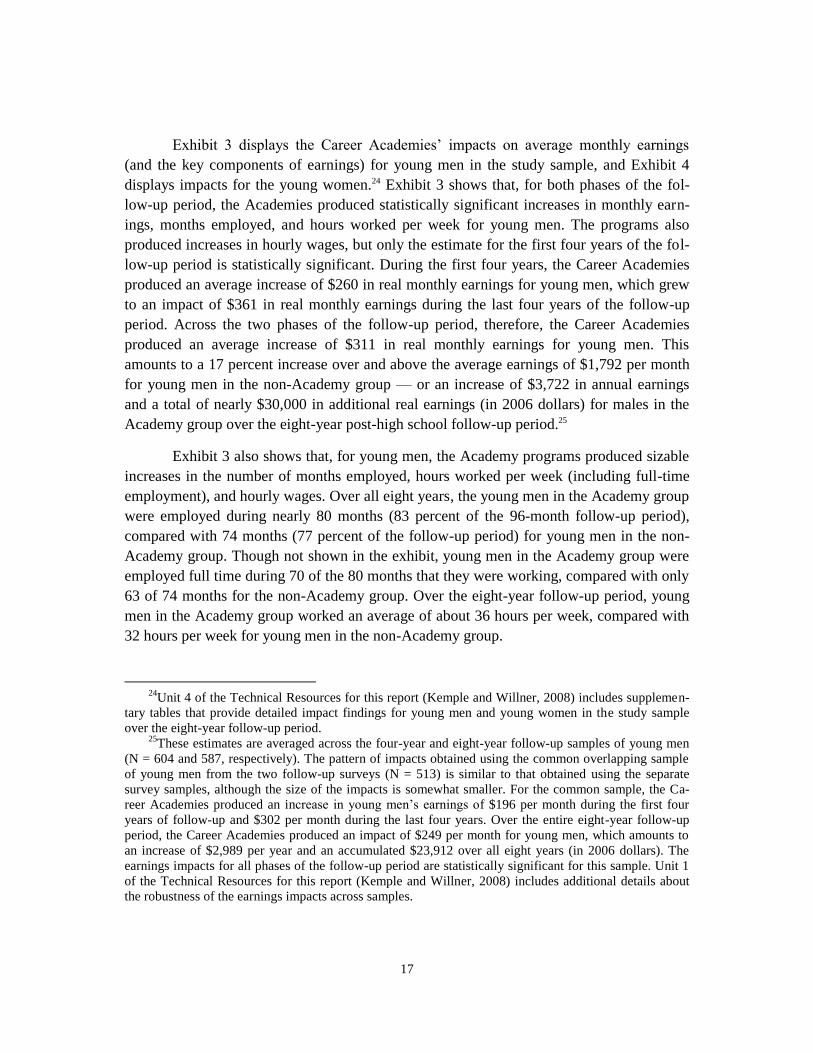
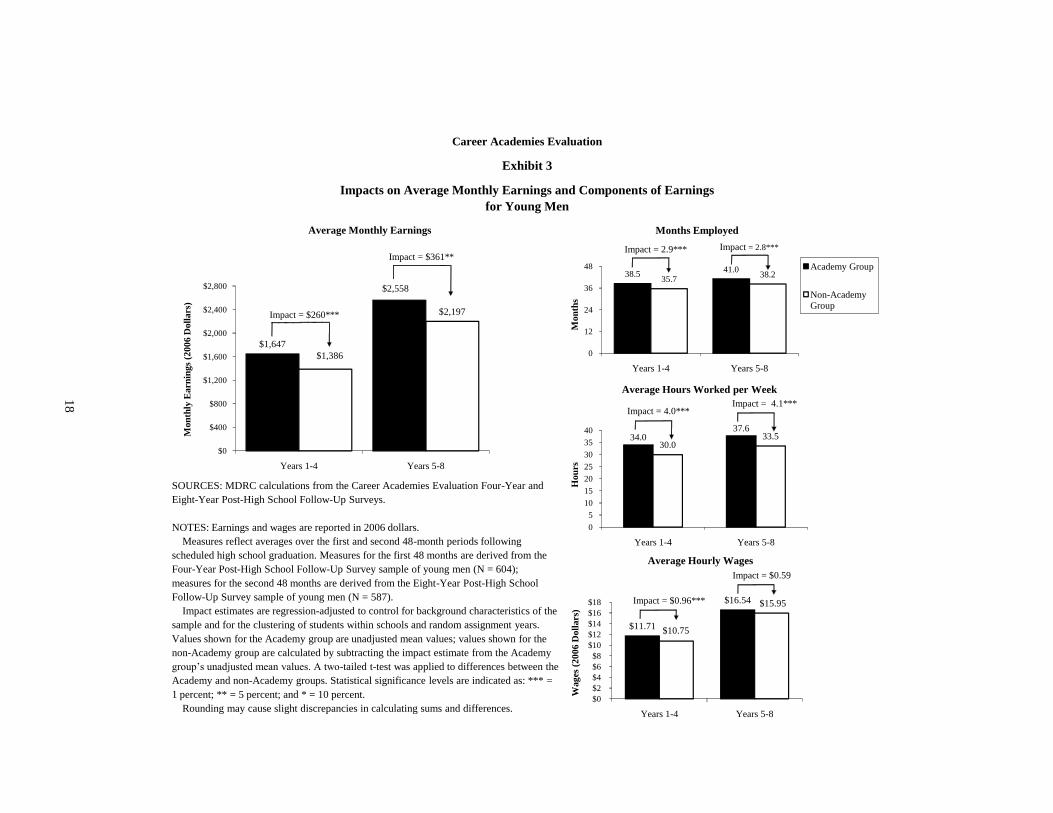
Exhibit 3 displays the Career Academies’ impacts on average monthly earnings
(and the key components of earnings) for young men in the study sample, and Exhibit 4
displays impacts for the young women.24 Exhibit 3 shows that, for both phases of the fol-
low-up period, the Academies produced statistically significant increases in monthly earn-
ings, months employed, and hours worked per week for young men. The programs also
produced increases in hourly wages, but only the estimate for the first four years of the fol-
low-up period is statistically significant. During the first four years, the Career Academies
produced an average increase of $260 in real monthly earnings for young men, which grew
to an impact of $361 in real monthly earnings during the last four years of the follow-up
period. Across the two phases of the follow-up period, therefore, the Career Academies
produced an average increase of $311 in real monthly earnings for young men. This
amounts to a 17 percent increase over and above the average earnings of $1,792 per month
for young men in the non-Academy group — or an increase of $3,722 in annual earnings
and a total of nearly $30,000 in additional real earnings (in 2006 dollars) for males in the
Academy group over the eight-year post-high school follow-up period.25
Exhibit 3 also shows that, for young men, the Academy programs produced sizable
increases in the number of months employed, hours worked per week (including full-time
employment), and hourly wages. Over all eight years, the young men in the Academy group
were employed during nearly 80 months (83 percent of the 96-month follow-up period),
compared with 74 months (77 percent of the follow-up period) for young men in the non-
Academy group. Though not shown in the exhibit, young men in the Academy group were
employed full time during 70 of the 80 months that they were working, compared with only
63 of 74 months for the non-Academy group. Over the eight-year follow-up period, young
men in the Academy group worked an average of about 36 hours per week, compared with
32 hours per week for young men in the non-Academy group.
24
Unit 4 of the Technical Resources for this report (Kemple and Willner, 2008) includes supplemen-
tary tables that provide detailed impact findings for young men and young women in the study sample
over the eight-year follow-up period. 25
These estimates are averaged across the four-year and eight-year follow-up samples of young men
(N = 604 and 587, respectively). The pattern of impacts obtained using the common overlapping sample
of young men from the two follow-up surveys (N = 513) is similar to that obtained using the separate
survey samples, although the size of the impacts is somewhat smaller. For the common sample, the Ca-
reer Academies produced an increase in young men’s earnings of $196 per month during the first four
years of follow-up and $302 per month during the last four years. Over the entire eight-year follow-up
period, the Career Academies produced an impact of $249 per month for young men, which amounts to
an increase of $2,989 per year and an accumulated $23,912 over all eight years (in 2006 dollars). The
earnings impacts for all phases of the follow-up period are statistically significant for this sample. Unit 1
of the Technical Resources for this report (Kemple and Willner, 2008) includes additional details about
the robustness of the earnings impacts across samples.
18
Career Academies Evaluation
Impacts on Average Monthly Earnings and Components of Earnings
for Young Men
Exhibit 3
$1,647
$2,558
$1,386
$2,197
$0
$400
$800
$1,200
$1,600
$2,000
$2,400
$2,800
Years 1-4 Years 5-8
Mon
thly
Earn
ing
s (2
00
6 D
oll
ars
)
Average Monthly Earnings
38.541.0
35.738.2
0
12
24
36
48
Years 1-4 Years 5-8
Mon
ths
Months Employed
Academy Group
Non-Academy
Group
34.037.6
30.033.5
0
5
10
15
20
25
30
35
40
Years 1-4 Years 5-8
Hou
rs
Average Hours Worked per Week
Impact = 4.1***
Impact = 2.9*** Impact = 2.8***
Impact = $260***
Impact = 4.0***
$11.71
$16.54
$10.75
$15.95
$0
$2
$4
$6
$8
$10
$12
$14
$16
$18
Years 1-4 Years 5-8
Wag
es (
20
06
Doll
ars
)
Average Hourly Wages
Impact = $0.96***
Impact = $0.59
SOURCES: MDRC calculations from the Career Academies Evaluation Four-Year and
Eight-Year Post-High School Follow-Up Surveys.
NOTES: Earnings and wages are reported in 2006 dollars.
Measures reflect averages over the first and second 48-month periods following
scheduled high school graduation. Measures for the first 48 months are derived from the
Four-Year Post-High School Follow-Up Survey sample of young men (N = 604);
measures for the second 48 months are derived from the Eight-Year Post-High School
Follow-Up Survey sample of young men (N = 587).
Impact estimates are regression-adjusted to control for background characteristics of the
sample and for the clustering of students within schools and random assignment years.
Values shown for the Academy group are unadjusted mean values; values shown for the
non-Academy group are calculated by subtracting the impact estimate from the Academy
group’s unadjusted mean values. A two-tailed t-test was applied to differences between the
Academy and non-Academy groups. Statistical significance levels are indicated as: *** =
1 percent; ** = 5 percent; and * = 10 percent.
Rounding may cause slight discrepancies in calculating sums and differences.
Impact = $361**
18
19
Career Academies Evaluation
Exhibit 4
Impacts on Average Monthly Earnings and Components of Earnings
for Young Women
$10.20
$13.89
$9.87
$13.24
$0
$2
$4
$6
$8
$10
$12
$14
$16
$18
Years 1-4 Years 5-8
Wag
es (
20
06
Doll
ars
)Average Hourly Wages
Impact = $0.33
Impact = $0.65
35.0 36.734.7 37.0
0
12
24
36
48
Years 1-4 Years 5-8
Mon
ths
Months Employed
Academy Group
Non-Academy
Group
27.130.3
26.6
30.0
0
5
10
15
20
25
30
35
40
Years 1-4 Years 5-8
Hou
rs
Average Hours Worked per Week
Impact = 0.2
Impact = 0.3 Impact = -0.3
Impact = 0.5
SOURCES: MDRC calculations from the Career Academies Evaluation Four-Year and
Eight-Year Post-High School Follow-Up Surveys.
NOTES: Earnings and wages are reported in 2006 dollars.
Measures reflect averages over the first and second 48-month periods following
scheduled high school graduation. Measures for the first 48 months are derived from the
Four-Year Post-High School Follow-Up Survey sample of young women (N = 854);
measures for the second 48 months are derived from the Eight-Year Post-High School
Follow-Up Survey sample of young women (N = 841).
Impact estimates are regression-adjusted to control for background characteristics of the
sample and for the clustering of students within schools and random assignment years.
Values shown for the Academy group are unadjusted mean values; values shown for the
non-Academy group are calculated by subtracting the impact estimate from the Academy
group’s unadjusted mean values. A two-tailed t-test was applied to differences between
the Academy and non-Academy groups. Statistical significance levels are indicated as:
*** = 1 percent; ** = 5 percent; and * = 10 percent.
Rounding may cause slight discrepancies in calculating sums and differences.
$1,153
$1,795
$1,100
$1,677
$0
$400
$800
$1,200
$1,600
$2,000
$2,400
$2,800
Years 1-4 Years 5-8
Mon
thly
Ea
rnin
gs
(20
06
Doll
ars
)
Average Monthly Earnings
Impact = $53
Impact = $118
19
20
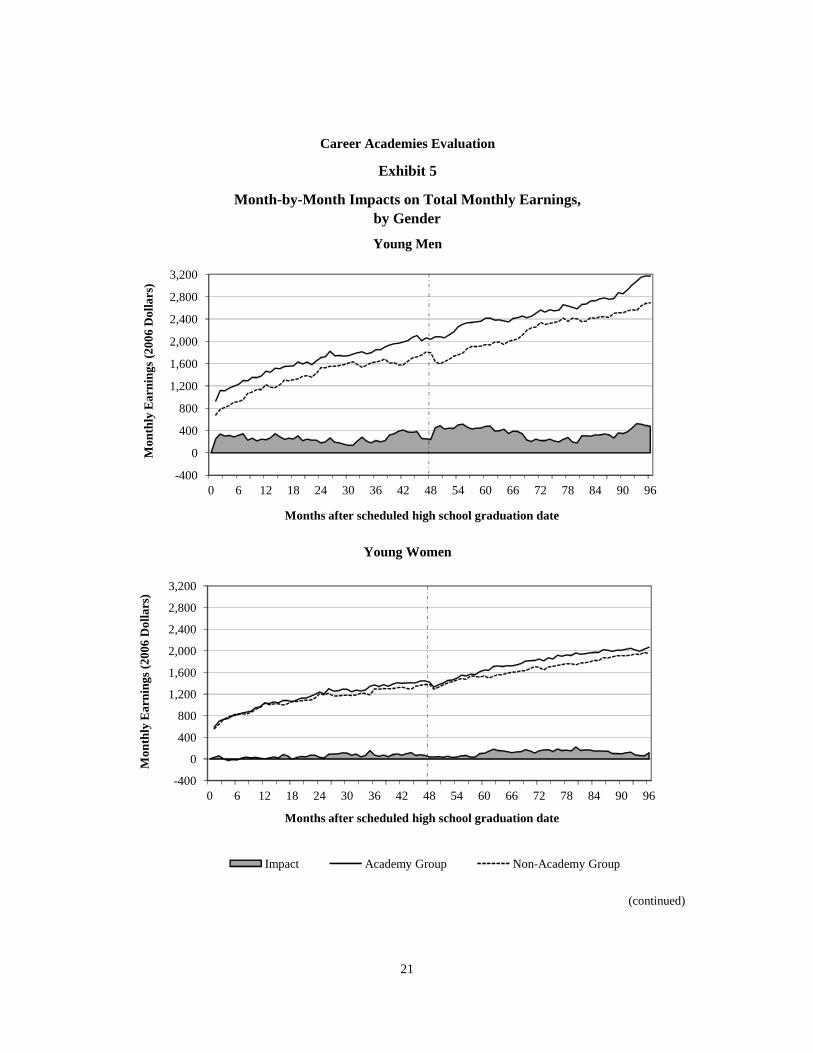
Finally, the top graph in Exhibit 5 shows that the Career Academies’ impact on
monthly earnings for young men persisted throughout the eight-year post-high school fol-
low-up period. It shows that while real monthly earnings more than tripled for both groups,
young men in the Academy group consistently earned more throughout the period. In fact,
during the last year of the follow-up period, the young men in the evaluation sample earned
substantially more than a nationally representative group of young men at a similar point in
their lives, with similar characteristics, who also attended urban, public high schools.26
Furthermore, the magnitude of the impact of Career Academies on annual earnings
during the eighth year after high school for young men — a 16 percent increase over the
non-Academy group’s earnings — is larger than the earnings premium that other research-
ers have calculated for two full-time-equivalent years of enrollment in a community col-
lege. These researchers estimate that completing two years of community college, relative
to having a high school diploma but no postsecondary education, was associated with an 11
to 12 percent increase in annual earnings for young men in 1999.27 Similarly, an unadjusted
analysis of 2006 census data reveals that young men ages 25 to 28 who had completed some
college were earning about 16 percent more than their counterparts with only a high school
diploma or GED.28 While this does not mean that Career Academies can or should serve as a
substitute for postsecondary education for young men, the comparison helps frame the magni-
tude of the labor market impacts for young men.
The Career Academies’ impacts on labor market outcomes for young
women varied somewhat over time but, on average, are not statistically
significant.
26
Young men in the study’s Academy group earned an average of $35,304 (2006 dollar values) dur-
ing the eighth year following scheduled graduation from high school. This compares with $31,576 (2006
dollar values) during 1999 for young men with similar background characteristics from the National Edu-
cation Longitudinal Study of 1988 (NELS:88/2000) who also attended urban, public high schools. This is
based on MDRC calculations from the NELS:88 database. See Unit 2 of the Technical Resources for this
report (Kemple and Willner, 2008) for a description of the analyses that form the basis of these findings. 27
Marcotte, Bailey, Borkoski, and Kienzl (2005) analyzed data from the NELS:88/2000 database to
estimate the contribution of various levels of postsecondary education (controlling for work experience,
urbanicity, ethnicity, high school dropout/GED status, and other demographics) on earnings in 1999,
eight years after the sample was scheduled to graduate from high school. Due to data limitations, the
analysis excluded sample members whose first enrollment in a postsecondary institution occurred more
than two years after their scheduled graduation from high school. 28
These numbers are based on 2006 American Community Survey (ACS) public use files from the
U.S. Census Bureau and include men who were not employed in 2006. (Calculations were performed by
Andrew Sum, Northeastern University, Center for Labor Market Studies.)
21
(continued)
Young Women
Young Men
Career Academies Evaluation
Exhibit 5
Month-by-Month Impacts on Total Monthly Earnings,
by Gender
H:\K12\CA\Report 7\Publications\Round1_Edits\Ex.5-GENDER monthly linegraphs.xls, 6/16/08, CW
-400
0
400
800
1,200
1,600
2,000
2,400
2,800
3,200
0 6 12 18 24 30 36 42 48 54 60 66 72 78 84 90 96
Mo
nth
ly E
arn
ing
s (2
00
6 D
oll
ars
)
Months after scheduled high school graduation date
-400
0
400
800
1,200
1,600
2,000
2,400
2,800
3,200
0 6 12 18 24 30 36 42 48 54 60 66 72 78 84 90 96
Mo
nth
ly E
arn
ing
s (2
00
6 D
oll
ars
)
Months after scheduled high school graduation date
Impact Academy Group Non-Academy Group
SOURCES: MDRC calculations from the Career Academies Evaluation Four-Year and Eight-Year Post-High
School Follow-Up Surveys.
NOTES: Earnings are reported in 2006 dollars.
Measures reflect the 96-month period following scheduled high school graduation for each sample member
(Month 0 is June of the scheduled graduation year). Measures for Months 1 to 48 are derived from the Four-
22
Exhibit 4 and the bottom graph in Exhibit 5 depict substantially different patterns of
labor market outcomes and impacts for young women in the study sample, compared with
those for the young men. First, Exhibit 4 shows that monthly earnings and each of the com-
ponents of monthly earnings were lower for young women in the sample than for young
men (see Exhibit 3). This was true in both the Academy and the non-Academy group. For
example, over the eight-year follow-up period, young men in the non-Academy group
earned an average of $403 more per month than young women in the non-Academy group.
This accumulated to nearly $39,000 (29 percent) more in earnings for young men than
young women in the non-Academy group. The gender difference in the Academy group
was even larger: During the 96-month follow-up period, young men in the Academy group
earned about $60,000 (43 percent) more than young women in the Academy group.
The difference in average monthly earnings between young men and young women
was due, in large part, to differences in employment patterns. Comparing Exhibits 3 and 4
shows that the young women in both groups worked during fewer months and that they
worked fewer hours per week than did the young men; there are also gender differences in
hourly wages. Finally, as shown in Exhibit 5, real monthly earnings for young men in-
creased much more steeply than they did for young women over the follow-up period.
Exhibit 4 shows, on average, that the Academies produced consistently positive but
not statistically significant impacts on labor market outcomes for young women. Average
monthly earnings and hourly wages were only slightly higher for young women in the Acad-
emy group than for young women in the non-Academy group, and there was no difference in
Exhibit 5 (continued)
SOURCES: MDRC calculations from the Career Academies Evaluation Four-Year and Eight-Year Post-High
School Follow-Up Surveys.
NOTES: Earnings are reported in 2006 dollars.
Measures reflect the 96-month period following scheduled high school graduation for each sample member
(Month 0 is June of the scheduled graduation year). Measures for Months 1 to 48 are derived from the Four-
Year Post-High School Follow-Up Survey sample (young men: N = 604; young women: N = 854). Measures
for Months 49 to 96 are derived from the Eight-Year Post-High School Follow-Up Survey sample (young men:
N = 587; young women: N = 841). The dotted line at Month 48 illustrates the cutpoint between the Four-Year
and Eight-Year Post-High School Follow-Up Survey samples.
Impact estimates are regression-adjusted to control for background characteristics of the sample and for the
clustering of students within schools and random assignment years. Values shown for the Academy group are
unadjusted mean values; values shown for the non-Academy group are calculated by subtracting the impact
estimate from the Academy group’s unadjusted mean values. A two-tailed t-test was applied to differences
between the Academy and non-Academy groups. Differences in monthly earnings are significant at a level of
10 percent or less in 73 of the 96 months for young men and in 6 of the 96 months for young women.
23
months employed or hours worked per week.29 It should be noted that differences in impacts
between young men and young women are statistically significant during the first four years
of the follow-up period but are not statistically significant during the last four years of the fol-
low-up up period. In other words, although impacts on monthly earnings were larger in mag-
nitude for the young men, the margin of error around the difference in impacts was even larg-
er, at least in the last four years of the follow-up period. This indicates that the differences in
impacts could be due to chance. Nonetheless, a consistent pattern of positive and statistically
significant impacts for young men but not for young women indicates that the program’s im-
pact on labor market outcomes is concentrated among young men.
It is not clear why the Career Academies had only a marginal impact on labor mar-
ket outcomes for young women. The evaluation did not find evidence that the Career Acad-
emy experience was systematically different for young women than for young men. Nor
does it appear that the Career Academies had systematically different impacts on the high
school experiences of young women and young men. One hypothesis, however, is that the
lack of post-high school labor market impacts for young women may be an artifact of their
somewhat shorter and more intermittent employment spells associated with having children
or attending postsecondary education programs. This will be explored in nonexperimental
analyses to be presented in a future paper.
Differences in impacts on labor market outcomes among three sub-
groups defined by students’ risk of dropping out narrowed over time.
The most consistently positive impacts accrued to the high-risk sub-
group.
Because prior reports from this evaluation focused on the impacts that Career Acad-
emies had on educational outcomes, they examined three subgroups defined by background
29
These estimates are averaged across the four-year and eight-year follow-up samples of young
women (N = 854 and 841, respectively). The pattern of impacts obtained using the common overlapping
sample of young women from the two follow-up surveys (N = 762) is similar to that obtained using the
separate survey samples, although the size of the earnings impact for the last four years is slightly larger
and statistically significant at the 10 percent level. For the common sample, the Career Academies pro-
duced an increase in young women’s earnings of $37 per month during the first four years of follow-up
and $149 per month during the last four years. Over the entire eight-year follow-up period, the Career
Academies produced an impact of $93 per month for young women, which amounts to an increase of
$1,117 per year and an accumulated $8,935 over all eight years (in 2006 dollars). The earnings impacts
for the last four years and averaged across all eight years are statistically significant at the 10 percent lev-
el for this sample. Unit 1 of the Technical Resources for this report (Kemple and Willner, 2008) includes
additional details about the robustness of the earnings impacts across samples.
24
characteristics that are associated with dropping out of high school.30 The student popula-
tions in Career Academies tend to reflect the ethnic, gender, and socioeconomic characteris-
tics of their host high schools, which were diverse. However, little is known about the rela-
tive effectiveness of Academies for key subgroups. For example, some students who ap-
plied for Academies at the end of the eighth or ninth grade were already highly engaged in
school. The Academies aspired to prepare these students for college and to provide them
with career-related learning experiences and credentials that would make them more com-
petitive in the labor market. At the other extreme, some Academy applicants were already
on a path toward dropping out or having their education end with high school. Academies
hoped to ―reengage‖ such students, providing them with more applied learning experiences
and encouraging them to develop higher aspirations for both education and employment.
In order to learn more about the suitability of the Academy approach for meeting
the needs of students in different subgroups, the study examined three risk subgroups,
which are defined below. Each of the characteristics used to define these subgroups was
measured at the time that students applied for a Career Academy — that is, before they
were randomly selected to be in the Academy or the non-Academy group.31
High-risk subgroup: Students in the study sample (approximately 25 per-
cent of both the Academy and the non-Academy group) who had the combi-
nation of characteristics, measured prior to random assignment, that are asso-
ciated with the highest likelihood of dropping out
Medium-risk subgroup: Students in the study sample (approximately 50
percent of both the Academy and the non-Academy group) who had charac-
teristics, measured prior to random assignment, indicating that they were not
particularly likely to drop out but were not highly engaged in school
Low-risk subgroup: Students in the study sample (approximately 25 per-
cent of both the Academy and the non-Academy group) who had the combi-
nation of characteristics, measured prior to random assignment, that are asso-
ciated with the lowest likelihood of dropping out
30
Unit 5 of the Technical Resources for this report (Kemple and Willner, 2008) provides detailed im-
pact findings for the risk subgroups in the study sample. 31
The definition of these subgroups is based on analyses using background characteristics to predict
dropping out among students in the non-Academy group. These analyses yielded an index that expresses
dropout risk as the weighted average of selected background characteristics, including eighth-grade atten-
dance rates and grades, falling behind on progress toward graduation, being retained in a prior grade, hav-
ing transferred schools two or more times, and having a sibling who dropped out of high school. For a
detailed discussion of the method used to define the risk subgroups, see Kemple and Snipes (2000).
25
Exhibit 6 shows the impacts that Career Academies had on average monthly earn-
ings over the eight-year follow-up period for each of the risk subgroups. It indicates that the
Career Academies produced impacts on monthly earnings for all three subgroups at various
points in the follow-up period. Impacts on average monthly earnings (and on many of the
components of earnings) are statistically significant for the high- and medium-risk sub-
groups during the first four years of the follow-up period. During the last four years, im-
pacts on average monthly earnings are statistically significant for the high- and low-risk
subgroups. For the high-risk subgroup, the Academies increased real earnings by an average
of $237 per month over the course of the eight-year follow-up period, or 17 percent, com-
pared with the non-Academy group’s average monthly earnings of $1,436. Impacts on
monthly earnings for the medium- and low-risk subgroups averaged about 10 percent.
Overall, however, differences in impacts on monthly earnings across the three risk sub-
groups are not statistically significant. Thus, differences in impacts across the subgroups
may be due to chance.
Impacts on Educational Attainment
This section of the report focuses on sample members’ educational attainment
through the end of the eight-year follow-up period. The key outcomes include high school
completion status and postsecondary education enrollment and completion. High school
completion statuses include receipt of a high school diploma and receipt of a General Edu-
cational Development certificate (GED). Postsecondary programs include bachelor’s degree
programs, associate’s degree programs, and training certificate or licensing programs. To
help place the educational attainment levels of the young people who are in the study sam-
ple in context, this section of the report offers a comparison with the educational attainment
levels eight years after scheduled high school graduation for a representative sample of sim-
ilar students from urban school districts across the country. The section then proceeds to a
discussion of educational impacts for the subgroups of young men and young women. It
concludes with a brief review of the impacts on educational attainment for subgroups de-
fined by the background characteristics associated with the risk of dropping out of high
school.
Overall, the Career Academies had no impact (positive or negative) on
high school completion rates, although the rates were higher than na-
tional averages.
The left side of Exhibit 7 shows the high school completion status of students in the
Academy and non-Academy groups. Approximately 84 percent of the students in both
26
(continued)
High Risk
Medium Risk
Low Risk
Career Academies Evaluation
Exhibit 6
Month-by-Month Impacts on Total Monthly Earnings,
by Risk Subgroup
H:\K12\CA\Report 7\Publications\Round2_Edits\Ex.6-RISK monthly earnings.xls, 6/18/08, CW
-400
0
400
800
1,200
1,600
2,000
2,400
2,800
3,200
0 6 12 18 24 30 36 42 48 54 60 66 72 78 84 90 96
Mo
nth
ly E
arn
ing
s
(20
06
Do
lla
rs)
Months after scheduled high school graduation date
Impact Academy Group Non-Academy Group
-400
0
400
800
1,200
1,600
2,000
2,400
2,800
3,200
0 6 12 18 24 30 36 42 48 54 60 66 72 78 84 90 96
Mo
nth
ly E
arn
ing
s
(20
06
Do
lla
rs)
Months after scheduled high school graduation date
-400
0
400
800
1,200
1,600
2,000
2,400
2,800
3,200
0 6 12 18 24 30 36 42 48 54 60 66 72 78 84 90 96
Mo
nth
ly E
arn
ing
s
(20
06
Do
lla
rs)
Months after scheduled high school graduation date
SOURCES: MDRC calculations from the Career Academies Evaluation Four-Year and Eight-Year Post-High
School Follow-Up Surveys.
27
groups had earned a high school diploma, and an additional 10 to 12 percent had received a
GED.32
To help place these outcome levels in a broader context, the right side of Exhibit 7
shows the high school completion status of a nationally representative group of students
who had similar background characteristics and who came from school districts that are
similar to those represented in the study sample.33 The figure illustrates several important
points about the performance of students in the study sample and about the conclusions one
32
Unit 3 of the Technical Resources for this report (Kemple and Willner, 2008) provides detailed
findings on the Career Academies’ impacts on educational outcomes for the full study sample. Differenc-
es between estimates presented in this report and those presented in previous reports may be due to dif-
ferences in sample composition and to attempts to reconcile conflicting reports about the specific timing
of the credentials that sample members earned. 33
The percentages on the right side of Exhibit 7 are based on a sample of students from the National
Education Longitudinal Study (NELS) of 1988 through 2000 (Curtin et al., 2002). NELS administered
surveys in 1988, 1990, 1992, 1994, and 2000 to a nationally representative group of students who were
eighth-graders in the spring of 1988 and who were scheduled to graduate from high school in 1992. Be-
cause virtually all the students in the non-Academy group completed the ninth grade, the analyses pre-
sented here include only students from the NELS sample who were tenth-graders in 1990 (that is, who
did not drop out before the tenth grade). Also, to maintain comparability with the schools in the Career
Academies Evaluation, only NELS students from nonselective public comprehensive high schools in ur-
ban school districts were included in the comparisons presented here. The values are regression-adjusted
and mean-centered to reflect outcomes for students who had the same distribution of background charac-
teristics as students in the Career Academies Evaluation sample. For a more detailed description of the
analyses that form the basis of these findings, see Unit 2 of the Technical Resources for this report (Kem-
ple and Willner, 2008).
Exhibit 6 (continued)
SOURCES: MDRC calculations from the Career Academies Evaluation Four-Year and Eight-Year Post-High
School Follow-Up Surveys.
NOTES: Earnings are reported in 2006 dollars.
Measures reflect the 96-month period following scheduled high school graduation for each sample member
(Month 0 is June of the scheduled graduation year). Measures for Months 1 to 48 are derived from the Four-
Year Post-High School Follow-Up Survey sample (high risk: N = 360; medium risk: N = 722; low risk: N =
376). Measures for Months 49 to 96 are derived from the Eight-Year Post-High School Follow-Up Survey
sample (high risk: N = 343; medium risk: N = 721; low risk: N = 364). The dotted line at Month 48 illustrates
the cutpoint between the Four-Year and Eight-Year Post-High School Follow-Up Survey samples.
Impact estimates are regression-adjusted to control for background characteristics of the sample and for the
clustering of students within schools and random assignment years. Values shown for the Academy group are
unadjusted mean values; values shown for the non-Academy group are calculated by subtracting the impact
estimate from the Academy group’s unadjusted mean values. A two-tailed t-test was applied to differences
between the Academy and non-Academy groups. Differences in monthly earnings are significant at a level of
10 percent or less in 37 of the 96 months for the high-risk subgroup, in 39 of the 96 months for the medium-risk
subgroup, and in 22 of the 96 months for the low-risk subgroup.
28
for the Evaluation Sample and the NELS Sample
Career Academies Evaluation
Exhibit 7
High School Completion Rates Eight Years After Scheduled Graduation
Per
cen
tag
e o
f S
am
ple
Mem
ber
s
NELS Sample of
Urban Public SchoolsEvaluation Sample
SOURCES: MDRC calculations from the Career Academies Evaluation One-Year, Four-Year, and Eight-Year
Post-High School Follow-Up Surveys and the National Education Longitudinal Study (NELS), 1988-2000, public-
use data files.
NOTES: All measures reflect completion status eight years after scheduled high school graduation. Students were
considered on-time high school graduates if they received their diploma by the end of June in the year they were
scheduled to graduate.
Measures for the evaluation sample are derived from the full Eight-Year Post-High School Follow-Up Survey
sample (N = 1,428). Measures for the NELS sample are derived from the sample of youth who attended urban,
public, nonselective high schools and who responded to all four waves of NELS postbaseline follow-up surveys (N
= 2,042).
The NELS estimates incorporate weights that account for nonresponse and project to the population of students
who were enrolled in tenth grade in 1990. In addition, the NELS estimates are adjusted to reflect a sample of
students with the same distribution of background characteristics as the non-Academy eight-year follow-up
evaluation sample. No tests of statistical significance were performed on differences between the evaluation
sample and the NELS sample.
Impact estimates for the evaluation sample are regression-adjusted to control for background characteristics of
the sample and for the clustering of students within schools and random assignment years. Values shown for the
Academy group are unadjusted mean values; values shown for the non-Academy group are calculated by
subtracting the impact estimate from the Academy group’s unadjusted mean values. A two-tailed t-test was applied
to differences between the Academy and non-Academy groups within each category. There are no statistically
significant differences in rates of high school graduation (overall, on-time, or late) or GED receipt.
Rounding may cause slight discrepancies in calculating sums and differences.
74.7 73.365.0
9.0 10.3
10.6
12.1 10.0
9.1
0
10
20
30
40
50
60
70
80
90
100
Academy Group Non-Academy Group All Urban, Public,
Nonselective High
Schools
Graduated on time Graduated late Earned a GED
95.893.6
84.7
29
should or should not draw from these outcome levels. For example, students in both the
Academy and the non-Academy group were substantially more likely to graduate from high
school on time than similar students from similar districts across the country. Most notably,
approximately 75 percent of the Academy group graduated from high school on time, com-
pared with only 65 percent of similar students from similar school districts nationally.
Though not shown in the exhibit, this difference is even more dramatic when comparing
students in the evaluation sample with students in the national sample who reported being
enrolled in the general curriculum track of their high school — the option typically taken by
students in the study’s non-Academy group.34
If the evaluation were only able to compare the performance of students in the
Academy group with the performance of similar students from similar high schools across
the country, one might be led to the conclusion that the Career Academies produced mea-
ningful increases in high school graduation rates. In fact, however, the differences in high
school completion rates are due to differences in other characteristics that are associated
with the students’ initial motivation to apply for a Career Academy program.
In short, Exhibit 7 illustrates that the Career Academies did not have an impact
(positive or negative) on high school completion rates. At the same time, the completion
rates (particularly on-time graduation rates) for students in both the Academy and the non-
Academy group would be considered high relative to national averages for similar students
in similar schools. This suggests that Career Academies may have been attracting somewhat
better prepared or more highly motivated students, as seen by superior performance by both
the Academy and the non-Academy group, in relation to similar students in a nationally
representative sample of similar urban public schools. Thus, the Career Academies served
as a viable strategy to keep students on course toward high school completion, although
they were not better at this than the alternatives available in the high schools and communi-
ties where they were located.
Overall, the Career Academies had no impact (positive or negative) on
postsecondary education enrollment and attainment rates.
Exhibit 8 shows the percentage of Academy and non-Academy group members who
had completed a postsecondary education credential by the end of the eight-year post-high
school follow-up period. By the end of the follow-up period, about 50 percent of the Acad-
emy group had earned a postsecondary credential. In all, 16 percent had completed a bache-
lor’s degree or higher; 12 percent had completed a two-year associate’s degree; and 22 per-
34
See Unit 2 of the Technical Resources for this report (Kemple and Willner, 2008).
30
(continued)
Career Academies Evaluation
Exhibit 8
Highest Postsecondary Credential Completed
for the Evaluation Sample and the NELS Sample
Eight Years After Scheduled High School Graduation
H:\K12\CA\Report 7\Publications\Round2_Edits\Ex.8-FULL post-sec.xlsx, 6/18/08, CW
SOURCES: MDRC calculations from the Career Academies Evaluation Eight-Year Post-High School Follow-Up
Survey and the National Education Longitudinal Study (NELS), 1988-2000, public-use data files.
NOTES: All measures reflect completion status at the time of the interview. Interviews for the evaluation sample
began in June of the eighth calendar year following scheduled high school graduation (Month 96, assuming a June
graduation) and extended through December of that year. Interviews for the NELS sample began in January of the
eighth calendar year following scheduled high school graduation (Month 91, assuming a June graduation) and
extended through September of that year. Thus, the NELS sample estimates may exclude some programs that
were completed between January and June of the eighth year following scheduled high school graduation,
whereas the evaluation sample estimates include all programs completed by June of the eighth year.
Some sample members who have completed a certificate or license have not earned a high school diploma or
GED.
Measures for the evaluation sample are derived from the full Eight-Year Post-High School Follow-Up Survey
sample (N = 1,428). Measures for the NELS sample are derived from the sample of youth who attended urban,
public, nonselective high schools and who responded to all four waves of NELS postbaseline follow-up surveys
(N = 2,042).
The NELS estimates incorporate weights that account for nonresponse and project to the population of students
who were enrolled in tenth grade in 1990. In addition, the NELS estimates are adjusted to reflect a sample of
students with the same distribution of background characteristics as the non-Academy eight-year follow-up
evaluation sample. No tests of statistical significance were performed on differences between the evaluation
sample and the NELS sample.
21.5 20.610.5
12.3 11.6
5.7
15.9 17.8
11.6
0
10
20
30
40
50
60
70
80
90
100
Academy Group Non-Academy
Group
All Urban, Public,
Nonselective High
Schools
Per
cen
tag
e o
f S
am
ple
Certificate/license Associate’s degree Bachelor’s degree or higher
49.7 50.0
27.8
NELS Sample of
Urban Public SchoolsEvaluation Sample
Impact estimates for the evaluation sample are regression-adjusted to control for background characteristics
of the sample and for the clustering of students within schools and random assignment years. Values shown for
the Academy group are unadjusted mean values; values shown for the non-Academy group are calculated by
subtracting the impact estimate from the Academy group’s unadjusted mean values. A two-tailed t-test was
31
cent had earned a skills training certificate or license. The non-Academy group had similar
educational outcomes, and none of the minor differences between the Academy group and
the non-Academy group is statistically significant. Though not shown in the exhibit, rough-
ly 20 percent of sample members in both groups were still enrolled in a postsecondary pro-
gram at the end of the follow-up period.
The postsecondary completion rates for the study sample are quite high compared
with national averages for similar students from similar urban school districts. Exhibit 8
indicates that 50 percent of the students in the Academy and non-Academy groups had
earned a postsecondary credential within eight years of scheduled high school graduation,
compared with 28 percent of similar students nationally. Both the Academy group and the
non-Academy group outpaced similar students nationally in each of the three categories of
postsecondary credentials. Note that this does not imply that the participating high school
and their Career Academies are better at preparing students for postsecondary education
than the average urban high school. Rather, the difference in attainment levels is due, in
large part, to the Academies’ attracting students who are likely to do well regardless of
whether they end up in an Academy program.
Educational attainment levels and impacts were generally similar for
young men and young women in the study sample. The Career Acade-
mies did not have systematic impacts on educational attainment for ei-
ther young men or young women, although over 80 percent of both
groups earned a high school diploma, and roughly 50 percent earned a
postsecondary credential.
Exhibit 9 shows the Career Academy impacts on high school completion status and
on postsecondary education credentials earned as of the end of the eight-year post-high
Exhibit 8 (continued)
Impact estimates for the evaluation sample are regression-adjusted to control for background characteristics
of the sample and for the clustering of students within schools and random assignment years. Values shown for
the Academy group are unadjusted mean values; values shown for the non-Academy group are calculated by
subtracting the impact estimate from the Academy group’s unadjusted mean values. A two-tailed t-test was
applied to differences between the Academy and non-Academy groups within each category. There are no
statistically significant differences in the highest postsecondary credential completed.
Rounding may cause slight discrepancies in calculating sums and differences.
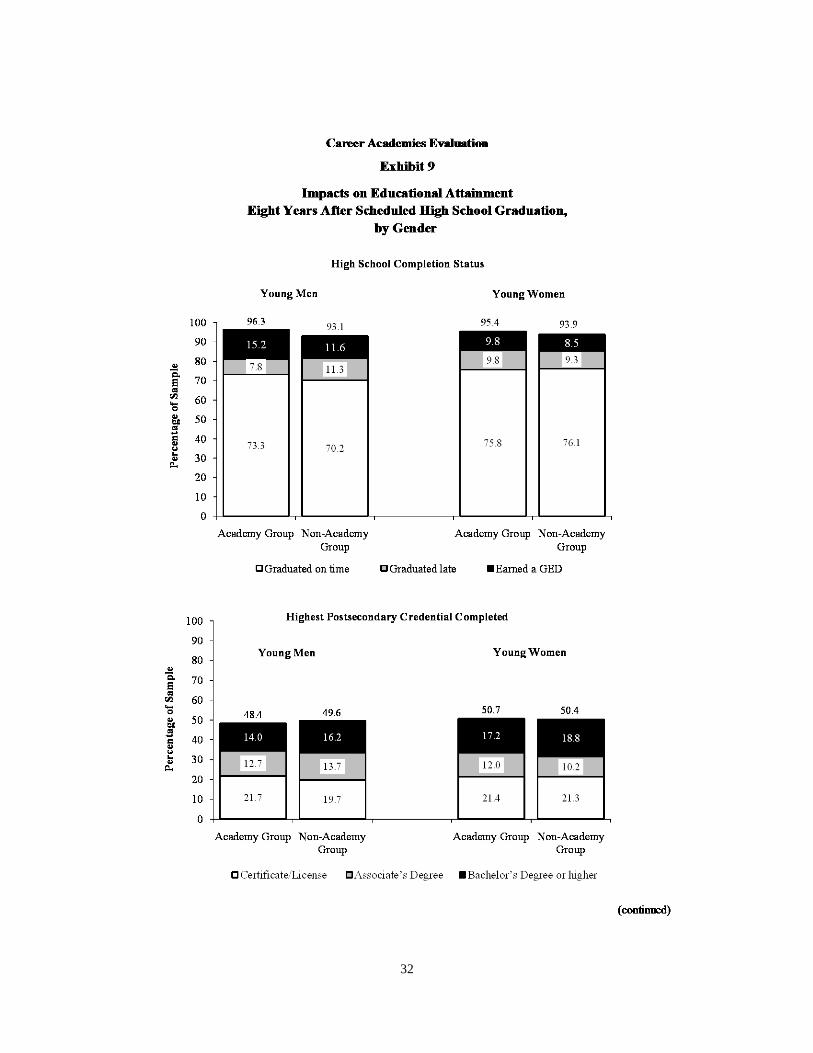
32
33
school follow-up period for the young men and young women in the study sample.35 The
top half of the exhibit indicates that there were only small differences in the high school
completion rates of both the young men and the young women in the Academy and the non-
Academy groups.36 For both genders, the Academy group was equally as likely to earn a high
school diploma as the non-Academy group and was slightly more likely to earn a GED.
Young men were slightly less likely to earn a high school diploma than young women, and
they were somewhat more likely to earn a GED instead. None of the differences between
the two groups is statistically significant.
The bottom half of Exhibit 9 indicates that roughly 50 percent of young men and
young women in the Academy group earned a postsecondary credential. Although the
young men in the non-Academy group were somewhat more likely to have earned a creden-
tial than their Academy group counterparts, the difference is not statistically significant.
The distribution of postsecondary credentials was also similar for young men and young
women and across the Academy and non-Academy groups. For young men in the Academy
group, for example, 14 percent completed a bachelor’s degree or higher; 13 percent earned
an associate’s degree; and 22 percent earned a skills training certificate or license. For
35
Unit 4 of the Technical Resources for this report (Kemple and Willner, 2008) includes supplemen-
tary tables that provide detailed findings on the Career Academies’ impacts on educational outcomes for
young men and young women. 36
None of the differences that are displayed in Exhibit 9 are statistically significant.
Exhibit 9 (continued)
SOURCES: MDRC calculations from the Career Academies Evaluation One-Year, Four-Year, and Eight-Year
Post-High School Follow-Up Surveys.
NOTES: All measures reflect completion status eight years after scheduled high school graduation. Students were
considered on-time high school graduates if they received their diploma by the end of June in the year they were
scheduled to graduate. Some sample members who have completed a certificate or license have not earned a high
school diploma or GED.
Measures are derived from the Eight-Year Post-High School Follow-Up Survey sample (young men: N = 587;
young women: N = 841).
Impact estimates are regression-adjusted to control for background characteristics of the sample and for the
clustering of students within schools and random assignment years. Values shown for the Academy group are
unadjusted mean values; values shown for the non-Academy group are calculated by subtracting the impact
estimate from the Academy group’s unadjusted mean values.
A two-tailed t-test was applied to differences between the Academy and non-Academy groups. There are no
statistically significant differences in rates of high school graduation (overall, on-time, or late) or GED receipt or
in highest postsecondary credential completed.
Rounding may cause slight discrepancies in calculating sums and differences.
34
young women in the Academy group, 17 percent completed a bachelor’s degree or higher;
12 percent earned an associate’s degree; and 21 percent earned a skills training certificate or
license. None of the differences between the Academy and non-Academy groups is statisti-
cally significant.
One implication of the pattern of findings on educational attainment for the young
men is that the substantial impacts on labor market outcomes did not come at the expense of
reducing their access to and completion of postsecondary education credentials.
The Academies had no systematic impact (positive or negative) on edu-
cational attainment for the high-, medium-, or low-risk subgroups.
Although there were striking differences in educational attainment among the three
risk subgroups that have been a focus of the Career Academies Evaluation, the attainment
levels of students in the Academy groups were very similar to those of the non-Academy
groups.37 For example, while 70 percent of the high-risk Academy group earned a high
school diploma, 84 percent of the medium-risk subgroup and 97 percent of the low-risk
subgroup did so. Despite these differences in outcome levels across subgroups, the Career
Academies did not increase or decrease the likelihood of receiving a high school diploma
for any of the subgroups. Specifically, 68 percent of the high-risk non-Academy group
earned a high school diploma, as did 85 percent of the medium-risk and 99 percent of the
low-risk group. None of the differences between the Academy and non-Academy groups is
statistically significant.
Similarly, among those in the Academy group, 38 percent of the high-risk group
had earned a postsecondary credential, while 50 percent of the medium-risk subgroup and
61 percent of the low-risk subgroup did so. By comparison, among those in the non-
Academy group, 39 percent of the high-risk subgroup earned a postsecondary credential, as
did 51 percent of the medium-risk subgroup and 57 percent of the low-risk subgroup.
Again, none of the differences between the Academy and non-Academy groups is statisti-
cally significant.
There was also variation across the three risk subgroups in the percentage of sample
members who were still enrolled in a postsecondary education program at the end of the
eight-year follow-up period. This was the case for about 14 percent of the high-risk Acade-
my group and for approximately 18 percent of the medium-risk subgroup and 27 percent of
the low-risk subgroup. The percentages for the respective non-Academy groups were simi-
37
Unit 5 of the Technical Resources for this report (Kemple and Willner, 2008) includes supplemen-
tary tables that provide detailed findings on the Career Academies’ impacts on educational outcomes for
the risk subgroups.
35
lar, and differences between Academy and non-Academy groups are not statistically signif-
icant.
Finally, there were slight differences in specific patterns of postsecondary educa-
tional attainment across the risk subgroups, although the individual impacts are not general-
ly statistically significant. For example, for the high-risk subgroup, Career Academies pro-
duced a slight decrease in the likelihood of earning a bachelor’s degree and a slight (though
not statistically significant) increase in earning a skills training certificate or license.38 For
the low-risk subgroup, the Academies produced a slight increase in earning an associate’s
degree.
Impacts on Family Formation and Other Social Adjustment Outcomes
The final set of findings addressed in this report focuses on several indicators of so-
cial adjustment, including marital status, parenting status, living arrangements, public assis-
tance receipt, access to health insurance, voter registration, and involvement with the crimi-
nal justice system. Career Academies may be able to improve these types of outcomes be-
cause of their focus on forging strong interpersonal supports for students during high school
and their investment in facilitating healthy transitions to productive opportunities after high
school.
The Career Academies produced an increase in the percentage of young
people living independently with children and a spouse or partner.
While these impacts were similar for both young men and young women
in the study sample, young men also experienced positive impacts on
marriage and being custodial parents.
Exhibit 10 lists several indicators of social adjustment reported by sample members
on the follow-up survey.39 Career Academies had their most striking impact on indicators of
family formation. In all, one-third of the Academy group were living independently with
their children and a spouse or partner, compared with 27 percent of the non-Academy
group. This impact of 6 percentage points from the Career Academies represents a 23 per-
cent increase in two-parent households over and above the rates for the non-Academy
38
For the high-risk subgroup, the impact on earning a bachelor’s degree is statistically significant.
Readers should be cautious when interpreting this isolated statistically significant result because of the
overall pattern of small and not statistically significant impacts. 39
Supplementary tables that provide detailed findings on the Career Academies’ impacts on social ad-
justment indicators for the gender subgroups and the risk subgroups can be found in Units 4 and 5, re-
spectively, of the Technical Resources for this report (Kemple and Willner, 2008).
36
Academy Non-Academy Percentage
Outcome (%) Group Group Impact P-Value Change
Marital status
Married and living together 38.0 33.7 4.3 * 0.081 12.8
Single 55.6 60.0 -4.5 * 0.076 -7.4
Divorced, separated, or widowed 6.4 6.3 0.1 0.0 0.914 2.3
Parental status
Custodial parent 50.8 43.9 6.9 *** 0.006 15.7
Noncustodial parent 5.1 7.8 -2.7 ** 0.026 -34.5
Not a parent 43.9 48.0 -4.1 0.0 0.112 -8.5
Living situation
Lives independently with
child/children and partner 33.1 26.9 6.2 ** 0.010 23.1
Lives independently with no children 30.0 32.4 -2.4 0.0 0.319 -7.5
Lives independently with
child/children but not partner 10.1 9.4 0.7 0.0 0.647 7.2
Lives with parent(s) or guardian(s),
with or without children 26.8 31.3 -4.5 * 0.062 -14.3
Ever gone without health insurance in past year 29.1 31.7 -2.6 0.0 0.296 -8.1
Received TANF or cash assistance in past year 6.8 6.6 0.2 0.0 0.851 3.7
Received food stamps in past year 12.2 12.2 0.0 0.0 0.987 0.2
Registered to vote 73.7 72.4 1.3 0.0 0.565 1.8
Any recent illegal or drug-related activitya
10.3 9.7 0.5 0.0 0.733 5.5
Any recent illegal activity, excluding drug use 5.6 5.4 0.3 0.0 0.809 5.5
Sample size (N = 1,424) 781 643
Impacts on Family Formation and Other Social Adjustment Outcomes
for the Full Sample
Career Academies EvaluationH:\K12\CA\Report 7\Publications\Round2_Edits\Exhibits\Ex.10-FULL family formation.xlsx, 6/18/08, CW
Exhibit 10
Eight Years After Scheduled High School Graduation
SOURCE: MDRC calculations from the Career Academies Evaluation Eight-Year Post-High School Follow-Up
Survey.
NOTES: Impact estimates are regression-adjusted to control for background characteristics of the sample and for
the clustering of students within schools and random assignment years. Values shown for the Academy group are
unadjusted mean values; values shown for the non-Academy group are calculated by subtracting the impact
estimate from the Academy group’s unadjusted mean values. A two-tailed t-test was applied to differences between
the Academy and non-Academy groups. Statistical significance levels are indicated as: *** = 1 percent; ** = 5
percent; and * = 10 percent.
Rounding may cause slight discrepancies in calculating sums and differences.aThis measure includes illegal drug use, breaking the law (other than traffic violations), and any arrests or
convictions in the past year.
37
group. The exhibit also shows that 38 percent of the Academy group were married and liv-
ing with their spouse and that 51 percent were custodial parents eight years after scheduled
graduation from high school. This represents an increase in marriage rates of 4 percentage
points and an increase in being a custodial parent of 7 percentage points, relative to the non-
Academy group. Both of these impacts are statistically significant.
Exhibit 11 indicates that the Career Academy impacts on marriage and being a cus-
todial parent were somewhat larger for young men than they were for young women. Spe-
cifically, the Academies increased marriage rates for young men by 9 percentage points
(from 27 percent for the non-Academy group to 36 percent for the Academy group) and
increased custodial parenthood by nearly 12 percentage points (from 25 percent for the non-
Academy group to nearly 37 percent for the Academy group). By contrast, marriage rates
for young women increased by about 1 percentage point (from 38 percent to 39 percent),
and custodial parenthood rates increased by about 4 percentage points (from 57 percent to
61 percent); neither of these increases is statistically significant. The Career Academies did
significantly decrease the percentage of young women who were still living with a parent or
guardian by 9 percentage points; only 24 percent of these young women were living with
their parents, compared with 33 percent of the young women in the non-Academy group.
The Career Academies did not have a systematic impact (positive or negative) on
the other social adjustment indicators listed in Exhibit 10. Members of both groups were
very unlikely to have received public assistance or to be involved with the criminal justice
system. These findings are consistent with the very high rates of engagement in either edu-
cation or employment throughout the follow-up period. In fact, although not shown in the
exhibit, those in the Academy group were either attending school or working during 83 of
the 96 months in the eight-year follow-up period. The high rates of engagement in produc-
tive activities and the low rates of risk-taking behaviors suggest that the sample members,
on average, were making quite successful transitions to adulthood.
Discussion of the Findings
The findings discussed above suggest several potentially important implications for
education policy and practice.
The findings provide convincing evidence that increased investments in
career-related experiences during high school can improve students’
postsecondary labor market prospects.
A growing body of descriptive analysis suggests that increases in vocational course-
taking and engagement in higher-quality work-based learning programs during high school
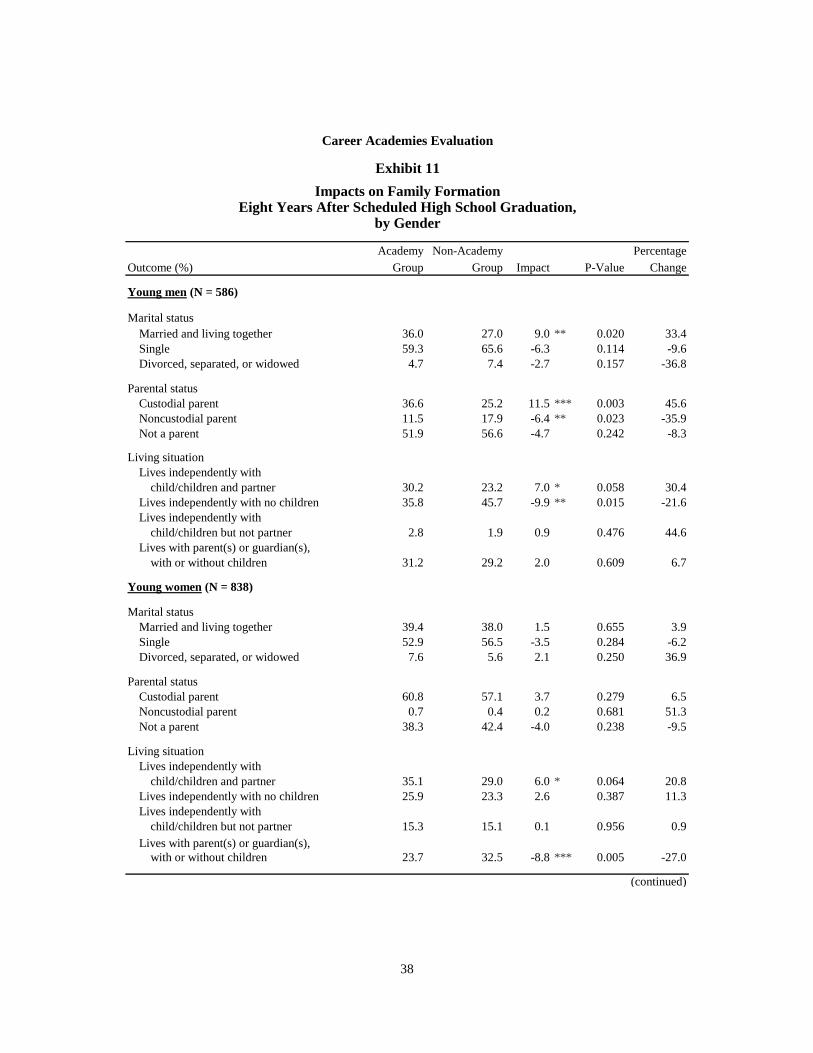
38
Academy Non-Academy Percentage
Outcome (%) Group Group Impact P-Value Change
Young men (N = 586)
Marital status
Married and living together 36.0 27.0 9.0 ** 0.020 33.4
Single 59.3 65.6 -6.3 0.0 0.114 -9.6
Divorced, separated, or widowed 4.7 7.4 -2.7 0.0 0.157 -36.8
Parental status
Custodial parent 36.6 25.2 11.5 *** 0.003 45.6
Noncustodial parent 11.5 17.9 -6.4 ** 0.023 -35.9
Not a parent 51.9 56.6 -4.7 0.0 0.242 -8.3
Living situation
Lives independently with
child/children and partner 30.2 23.2 7.0 * 0.058 30.4
Lives independently with no children 35.8 45.7 -9.9 ** 0.015 -21.6
Lives independently with
child/children but not partner 2.8 1.9 0.9 0.0 0.476 44.6
Lives with parent(s) or guardian(s),
with or without children 31.2 29.2 2.0 0.0 0.609 6.7
Young women (N = 838)
Marital status
Married and living together 39.4 38.0 1.5 0.0 0.655 3.9
Single 52.9 56.5 -3.5 0.0 0.284 -6.2
Divorced, separated, or widowed 7.6 5.6 2.1 0.0 0.250 36.9
Parental status
Custodial parent 60.8 57.1 3.7 0.0 0.279 6.5
Noncustodial parent 0.7 0.4 0.2 0.0 0.681 51.3
Not a parent 38.3 42.4 -4.0 0.0 0.238 -9.5
Living situation
Lives independently with
child/children and partner 35.1 29.0 6.0 * 0.064 20.8
Lives independently with no children 25.9 23.3 2.6 0.0 0.387 11.3
Lives independently with
child/children but not partner 15.3 15.1 0.1 0.0 0.956 0.9
Lives with parent(s) or guardian(s),
with or without children 23.7 32.5 -8.8 *** 0.005 -27.0
(continued)
Impacts on Family Formation
by Gender
Career Academies EvaluationH:\K12\CA\Report 7\Publications\Round2_Edits\Exhibits\Ex.11-GENDER family formation.xlsx, 6/18/08, CW
Exhibit 11
Eight Years After Scheduled High School Graduation,
SOURCE: MDRC calculations from the Career Academies Evaluation Eight-Year Post-High School Follow-Up
Survey.
NOTES: Impact estimates are regression-adjusted to control for background characteristics of the sample and for
the clustering of students within schools and random assignment years. Values shown for the Academy group are
unadjusted mean values; values shown for the non-Academy group are calculated by subtracting the impact
39
are associated with better labor market outcomes after high school.40 Much of this research
focuses only on the correlation between high school course-taking patterns or work expe-
riences and later labor market experiences, making it difficult to make valid causal infe-
rences about the relationships.
The findings discussed in this report provide some of the most convincing evidence
yet that a high school-based intervention can produce substantial and sustained improve-
ments in postsecondary labor market prospects. In fact, the magnitude of the impacts on
monthly earnings for young men exceed differences in earnings that have been found in
other research comparing young workers who have two years of community college with
those who have only a high school diploma.41 While one should not conclude from this that
Career Academies can substitute for postsecondary education below the level of an asso-
ciate’s degree, the findings seem to suggest that Academies do produce benefits in the labor
market that are commensurate with those associated with continuing investment in postse-
condary programs.
While this report provides strong evidence that the Career Academies produced real
improvements in labor market prospects (particularly for young men), preliminary analyses
are now being conducted to examine how the programs produced these effects and which
features were likely to have contributed most to the impacts.42 Preliminary findings shed
40
See Stern et al. (1992); Urquiola et al. (1997); Stern et al. (1994); Stern, McMillion, Hopkins, and
Stone (1990). 41
See Marcotte, Bailey, Borkoski, and Kienzl (2005). 42
To explore these and other issues, MDRC will conduct further analyses using the data that have
been collected for the Career Academies Evaluation. These analyses, involving both experimental and
quasi-experimental methods, will include a synthesis of findings across the full eight years of follow-up
for the study and a deeper examination of the sources of the impacts that the programs produced (or ex-
plorations for why the programs did not produce impacts — for example, on labor market outcomes for
young women).
Exhibit 11 (continued)
SOURCE: MDRC calculations from the Career Academies Evaluation Eight-Year Post-High School Follow-Up
Survey.
NOTES: Impact estimates are regression-adjusted to control for background characteristics of the sample and for
the clustering of students within schools and random assignment years. Values shown for the Academy group are
unadjusted mean values; values shown for the non-Academy group are calculated by subtracting the impact
estimate from the Academy group’s unadjusted mean values.
A two-tailed t-test was applied to differences between the Academy and non-Academy groups. Statistical
significance levels are indicated as: *** = 1 percent; ** = 5 percent; and * = 10 percent.
Rounding may cause slight discrepancies in calculating sums and differences.
40
some light on these issues. The analyses focus on the relationship between Career Academy
impacts on high school experiences and subsequent impacts on postsecondary earnings.
This comparison provides suggestive evidence that substantial increases in students’ expo-
sure to career awareness and development activities were associated with more substantial
labor market impacts. Such career awareness and development activities included job-
shadowing, work-based learning activities, career fairs, guest speakers, and career-related
guidance. In other words, cohorts of students in the study sample who experienced substan-
tial increases in exposure to these types of activities were also more likely to have expe-
rienced strong, positive labor market impacts.
It is important to note, however, that these findings are only suggestive and do not
account for other high school experiences that may be affected by the Career Academies,
which may, in turn, have an impact on postsecondary earnings. For example, longer-term
earnings were also associated with measures of personalized support that students reported
during high school and with their completion of a curriculum consisting of both academic
core courses and a sequence of career-related courses. However, it is not clear whether the
personal relationships are further proxies for the Academies’ overall effect on high school
experiences or whether the relationship between career awareness and development activi-
ties and postsecondary earnings may be muted or enhanced depending on the level of per-
sonalization or whether the Academies enabled students to complete a basic academic core
curriculum. For example, some Academies may have produced substantial increases in vo-
cational and career-related course-taking that were accompanied by a reduction in academic
course-taking. These programs may exhibit small or negligible impacts on labor market
outcomes.
In addition to further analysis of the data collected for this study, it is important that
policymakers and practitioners continue to invest in building evidence about how best to
implement the core components and underlying principles of the Career Academy model.
For example, it seems especially important to learn more about whether and how the Acad-
emies’ employer partnerships and accompanying career awareness and development activi-
ties provide students with added leverage in the postsecondary labor market, over and above
the benefits students may gain from postsecondary education. Toward this end, it may be
useful to conduct systematic tests of initiatives aimed at strengthening employer partner-
ships and expanding student access to work-based learning opportunities and work-related
experiences.
The Career Academies in this study demonstrate the feasibility of ac-
complishing the goals of school-to-career and career-technical education
without compromising academic goals.
41
Like most approaches to education reform, the Career Academy model has many
and varied goals. Career Academies aspire to prevent students from dropping out of high
school and to prepare them for college and other postsecondary education opportunities. At
the same time, Career Academies provide students with an explicit introduction to the world
of work and try to furnish them with skills and connections to help them navigate the transi-
tion from high school to successful employment. Many critics of school-to-work transition
initiatives and career-technical programs contend that programs like Career Academies
track students into classes and work experiences that orient them toward immediate entry
into the labor market. Such criticism sometimes suggests that this orientation comes at the
expense of preparation for and opportunities to attend college.
In this study, however, the high rates of completing postsecondary education cre-
dentials and the sustained impacts on employment and earnings suggest that such tradeoffs
need not occur. At the same time, the findings indicate that although the Academies pro-
vided a viable pathway to postsecondary education, they did not create better opportunities
than those offered in the regular high school environment. This is consistent with previous
findings from the evaluation, which indicate that Career Academies offered essentially the
same set of academic courses and course requirements as those offered in the rest of the
high school. In addition, Career Academy students were typically assigned to the regular
high school guidance counselors and college placement services if they were interested in
going on to postsecondary education. With the continued emphasis on academic perfor-
mance and college preparation, Career Academies face a special challenge to increase aca-
demic rigor while maintaining their distinctive contribution to students’ preparation for the
labor market. Rigorous evidence is beginning to emerge that suggests that integrating aca-
demic content with applied learning activities can improve student achievement. Career
Academies can provide a unique platform for such integration, but high-quality integration
is likely to require intensive professional development for teachers and careful coordination
of shared planning time and student scheduling. In addition, the Academies’ partnerships
with local employers can also offer students unique guidance about the education and skill
requirements of various occupations in their career field. These experiences may serve to
increase students’ aspirations and motivate them to pursue postsecondary education.
The findings suggest that Career Academies can make special efforts to
serve students who are at risk of dropping out of high school without
compromising their capacity to provide college access opportunities, as
well as labor market impacts, for all students.
Earlier findings from the Career Academies evaluation indicated that high-risk stu-
dents experienced modest reductions in dropout rates and increases in attendance and
course-taking (although these did not translate into impacts on graduation or postsecondary
42
enrollment rates). Earlier findings also showed that the Academies’ labor market impacts
were particularly strong among the high- and medium-risk subgroups. In fact, throughout
the eight-year post-high school follow-up period, the high-risk subgroup experienced the
most consistent and positive impacts on labor market outcomes. All of this occurred without
a systematic decline in access to postsecondary education opportunities for the low-, me-
dium-, or high-risk students.
While the Career Academies in this study did serve a range of high-, medium-, and
low-risk students, comparisons with national samples of similar youth suggest that, on aver-
age, the Academies tended to attract students who were highly likely to graduate from high
school and go on to complete a postsecondary education credential even if they were not
selected to enroll in the programs. At the same time, even though they tended to benefit
most from the Academy experience, higher-risk students were the most likely to leave their
Career Academies before the end of their twelfth-grade year. This may have diminished the
potential for strong effects on academic achievement and educational attainment and an
even larger impact on labor market outcomes. These findings suggest that Career Acade-
mies should sustain their commitment to serving a diverse group of students, but that they
can make greater efforts to reach out more systematically to recruit and retain a larger pro-
portion of high-risk students. At the same time, however, it will be important to avoid the
potential stigma and lowered expectations from teachers, students, and parents if Acade-
mies were to target higher-risk students exclusively.
Several school districts and school reform initiatives around the country are now at-
tempting to convert entire high schools into clusters of Career Academies. Instead of giving
students the option of enrolling in traditional general or vocational programs, these wall-to-
wall Academies offer students a choice among different Academies that combine academic
and career-related curricula. This approach may have the greatest potential for maximizing
high-risk students’ access to the programs (because all students would be required to enroll
in an Academy) while ensuring that the Academies include a broad mix of students. These
high schools and reform initiatives, however, face the related challenges of preventing high-
risk students from being tracked into poorly implemented Academies and of ensuring a high
level of implementation on a larger scale.
The findings from this study are most likely to apply to Career Acade-
mies, like those in the study sample, that are able to reach a threshold
level of fidelity to the core elements of the model. Until further research
is available about the specific components and variations in program
implementation strategies, policymakers and practitioners should be
sure to implement the full model with fidelity if they hope to achieve
comparable effects.
43
As noted at the outset of this report, the Career Academies in this study were se-
lected, in part, because they had reached at least a threshold level of fidelity to the core fea-
tures of the Career Academy model — smaller learning communities, academic curricula
combined with career-themed course sequences, and employer partnerships. Over the past
10 years or so, however, the Career Academy model has been called upon to serve an in-
creasing variety of high school reform goals, and its components have been touted as poten-
tial solutions to many problems facing low-performing high schools. As one of the few high
school initiatives with rigorous evidence of effectiveness (albeit concentrated on postsecon-
dary labor market outcomes), the Career Academy model has attained a particularly promi-
nent stature in the field of high school reform. In fact, organizations that support the devel-
opment of Career Academies have come under increasing pressure to expand the use of the
model’s individual components with the expectation that elements of the program can pro-
duce effects similar to those found in this study. In fact, it is not clear that modified versions
of the Career Academy approach can produce impacts on postsecondary labor market out-
comes, much less improvements in academic achievement or educational attainment.
The continued expansion of Career Academy programs presents the model and its
supporters with both opportunities and risks. For instance, in the past five years or so, ef-
forts to convert large comprehensive high schools into smaller learning communities have
increased dramatically. Because of the positive findings from this evaluation, many schools
and districts have looked to the Career Academy model and its supporters to help them with
this conversion process. With the Career Academy moniker, schools can claim that they
have undertaken an evidence-based reform initiative, even though this research does not
indicate that direct long-term effects come from the smaller learning community component
of the model or from programs that do not attempt to implement the full complement of
Academy features.
On the other hand, the available evidence does suggest that Career Academies that
faithfully implement the three core components of the model are well positioned to have
effects on labor market outcomes and may provide an adequate foundation for enhance-
ments that might have an impact on educational attainment. In the final analysis, although
this evaluation provides solid evidence regarding the potential impact of Career Academies,
further demonstrations and evaluations of Academy variants should be undertaken to de-
termine which elements might be most critical to the model’s effectiveness and which ele-
ments can be improved or enhanced to further improve its effectiveness.
The Career Academies Evaluation demonstrates the feasibility, benefits,
and challenges of conducting a longitudinal random assignment evalua-
tion of a prominent high school reform approach.
44
The Career Academies Evaluation is one of the few longitudinal random assignment
evaluations of a school-based education intervention. Without the random assignment re-
search design and the extended follow-up period, it is likely that an alternative approach to
the study would have yielded very different and potentially misleading findings and conclu-
sions. For example, the statistical comparisons with national data might suggest that the Ca-
reer Academies represent a substantially better educational opportunity than many alterna-
tives available to similar students from similar schools and school districts across the coun-
try. The availability of a valid control group — determined by the random assignment de-
sign of the evaluation — shows that the Career Academies in this study tended to attract
students (by a combination of self-selection and program selection) who were likely to do
well in high school and postsecondary education even if they had not been exposed to the
Career Academies. This is the best counterfactual against which to assess the true added
value of interventions like Career Academies that allow for student or program self-
selection.
This study also benefited from the commitment of funders who sustained their in-
vestment in a unique 15-year knowledge-building endeavor. The long-term follow-up pro-
vided insights into many factors that influence the transition from adolescence to adulthood
and enabled the study to determine the extent to which young people’s experiences in the
Career Academies changed the nature of this transition. This type of follow-up is rare for
any type of study but is even more unusual in the context of a rigorous random assignment
study. Given the changing pattern of findings on educational attainment and the emergence
of impacts on labor market outcomes well into the postsecondary years, a short-term study
would likely have left policymakers and practitioners with a very different — and potential-
ly misleading — set of implications.
45
References
Curtin, Thomas R., Steven J. Ingels, Shiying Wu, Ruth Heuer, and Jeffrey Owings. 2002. National
Education Longitudinal Study of 1988: Base-Year to Fourth Follow-Up Data File User’s
Manual. Washington, DC: U.S. Department of Education, Office of Educational Research
and Improvement.
Edelman, Peter, Harry J. Holzer, and Paul Offner. 2006. Reconnecting Disadvantaged Young Men.
Washington, DC: The Urban Institute Press.
Grubb, W. Norton (ed.). 1995a. Education Through Occupations in American High Schools: The
Challenges of Implementing Curriculum Integration, Vol. 1. New York: Teachers College
Press.
Grubb, W. Norton (ed.). 1995b. Education Through Occupations in American High Schools: The
Challenges of Implementing Curriculum Integration, Vol. 2. New York: Teachers College
Press.
Gruber, Jonathan (ed.). 2001. Risky Behavior Among Youths: An Economic Analysis. Chicago: Uni-
versity of Chicago Press.
Kemple, James J. 1997. Career Academies: Communities of Support for Students and Teachers —
Emerging Findings from a 10-Site Evaluation. New York: MDRC.
Kemple, James J. 2001. Career Academies: Impacts on Students’ Initial Transitions to Post-
Secondary Education and Employment. New York: MDRC.
Kemple, James J., Susan M. Poglinco, and Jason C. Snipes. 1999. Career Academies: Building Ca-
reer Awareness and Work-Based Learning Activities Through Employer Partnerships. New
York: MDRC.
Kemple, James J., and JoAnn Leah Rock. 1996. Career Academies: Early Implementation Lessons
from a 10-Site Evaluation. New York: MDRC.
Kemple, James J., and Jason C. Snipes. 2000. Career Academies: Impacts on Students’ Engagement
and Performance in High School. New York: MDRC.
Kemple, James J., and Cynthia J. Willner. 2008. Career Academies: Long-Term Impacts on Labor
Market Outcomes, Educational Attainment, and Transitions to Adulthood. Technical Re-
sources. Web site: www.mdrc.org/publications/482/techresources.pdf
Marcotte, Dave E., Thomas Bailey, Carey Borkoski, and Greg S. Kienzl. 2005. “The Returns of a
Community College Education: Evidence from the National Education Longitudinal Sur-
vey.” Educational Evaluation and Policy Analysis 27, 2: 157-175.
Stern, David, Charles Dayton, and Marilyn Raby. 2003. “Career Academies and High School
Reform Before, During, and After the School-to-Work Movement.” Pages 239-262 in W. J.
46
Stull and N. M. Sanders (eds.), The School-to-Work Movement: Origins and Destinations.
Westport, CT: Praeger.
Stern, David, Neal Finkelstein, James R. Stone III, John Latting, and Carolyn Dornsife. 1994. Re-
search on School-to-Work Transition Programs in the United States. Berkeley: University
of California, National Center for Research in Vocational Education.
Stern, David, Martin McMillion, Charles Hopkins, and James R. Stone III. 1990. “Work Experience
for Students in High School and College.” Youth and Society 21, 3.
Stern, David, James R. Stone III, John Latting, Neal Finkelstein, and Gina Martinez. 1992. School to
Work Transition and the Relevance of Vocational Education to Subsequent Employment:
Review of Research. Berkeley: University of California, National Center for Research in
Vocational Education. Prepared for the National Assessment of Vocational Education.
Sum, Andrew, Neeta Fogg, and Garth Mangum. 2000. Confronting the Youth Demographic Chal-
lenge: The Labor Market Prospects of At-Risk Youth. Baltimore, MD: Johns Hopkins Uni-
versity, Sar Levitan Center for Social Policy Studies.
Sum, Andrew, Ishwar Khatiwada, Frimpomaa Ampaw, and Paulo Tobar. 2004. Trends in Black
Male Joblessness and Year-Round Idleness: An Employment Crisis Ignored. Chicago: Al-
ternative Schools Network.
Sum, Andrew, Joseph McLaughlin, and Ishwar Khatiwada. 2008. The Continued Collapse of the
Nation’s Teen Job Market and the Dismal Outlook for the 2008 Summer Labor Market for
Teens: Does Anybody Care? Boston: Northeastern University, Center for Labor Market
Studies.
Urquiola, Miguel, David Stern, Ilana Horn, Carolyn Dornsife, Bernadette Chi, Lea Williams, Donna
Merritt, Katherine Hughes, and Thomas Bailey. 1997. School to Work, College, and Ca-
reer: A Review of Policy, Practice, and Results 1993-1997. Berkeley: University of Califor-
nia, National Center for Research in Vocational Education.
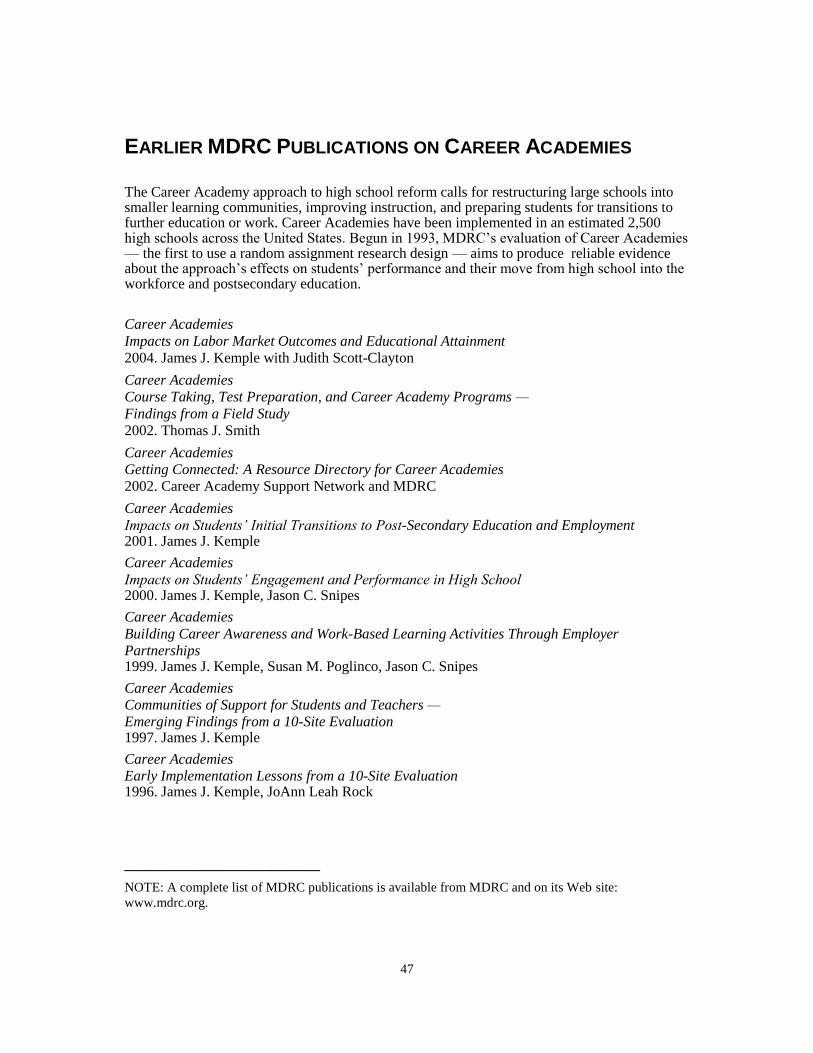
47
EARLIER MDRC PUBLICATIONS ON CAREER ACADEMIES
The Career Academy approach to high school reform calls for restructuring large schools into smaller learning communities, improving instruction, and preparing students for transitions to further education or work. Career Academies have been implemented in an estimated 2,500 high schools across the United States. Begun in 1993, MDRC’s evaluation of Career Academies — the first to use a random assignment research design — aims to produce reliable evidence about the approach’s effects on students’ performance and their move from high school into the workforce and postsecondary education.
Career Academies
Impacts on Labor Market Outcomes and Educational Attainment
2004. James J. Kemple with Judith Scott-Clayton
Career Academies
Course Taking, Test Preparation, and Career Academy Programs —
Findings from a Field Study
2002. Thomas J. Smith
Career Academies
Getting Connected: A Resource Directory for Career Academies
2002. Career Academy Support Network and MDRC
Career Academies
Impacts on Students’ Initial Transitions to Post-Secondary Education and Employment 2001. James J. Kemple
Career Academies
Impacts on Students’ Engagement and Performance in High School 2000. James J. Kemple, Jason C. Snipes
Career Academies
Building Career Awareness and Work-Based Learning Activities Through Employer
Partnerships 1999. James J. Kemple, Susan M. Poglinco, Jason C. Snipes
Career Academies
Communities of Support for Students and Teachers —
Emerging Findings from a 10-Site Evaluation 1997. James J. Kemple
Career Academies
Early Implementation Lessons from a 10-Site Evaluation 1996. James J. Kemple, JoAnn Leah Rock
________________________
NOTE: A complete list of MDRC publications is available from MDRC and on its Web site:
www.mdrc.org.


About MDRC
MDRC is a nonprofit, nonpartisan social and education policy research organization dedicated
to learning what works to improve the well-being of low-income people. Through its research
and the active communication of its findings, MDRC seeks to enhance the effectiveness of so-
cial and education policies and programs.
Founded in 1974 and located in New York City and Oakland, California, MDRC is best known
for mounting rigorous, large-scale, real-world tests of new and existing policies and programs.
Its projects are a mix of demonstrations (field tests of promising new program approaches) and
evaluations of ongoing government and community initiatives. MDRC’s staff bring an unusual
combination of research and organizational experience to their work, providing expertise on the
latest in qualitative and quantitative methods and on program design, development, implementa-
tion, and management. MDRC seeks to learn not just whether a program is effective but also
how and why the program’s effects occur. In addition, it tries to place each project’s findings in
the broader context of related research — in order to build knowledge about what works across
the social and education policy fields. MDRC’s findings, lessons, and best practices are proac-
tively shared with a broad audience in the policy and practitioner community as well as with the
general public and the media.
Over the years, MDRC has brought its unique approach to an ever-growing range of policy
areas and target populations. Once known primarily for evaluations of state welfare-to-work
programs, today MDRC is also studying public school reforms, employment programs for ex-
offenders and people with disabilities, and programs to help low-income students succeed in
college. MDRC’s projects are organized into five areas:
Promoting Family Well-Being and Child Development
Improving Public Education
Raising Academic Achievement and Persistence in College
Supporting Low-Wage Workers and Communities
Overcoming Barriers to Employment
Working in almost every state, all of the nation’s largest cities, and Canada and the United
Kingdom, MDRC conducts its projects in partnership with national, state, and local govern-
ments, public school systems, community organizations, and numerous private philanthropies.