Embed Size (px)
Citation preview
HISTORICALTABLES
BUDGET OF THE UNITED STATES GOVERNMENT
Fiscal Year
1
THE BUDGET DOCUMENTS
Budget of the United States Government, Fiscal Year 2000contains the Budget Message of the President and information onthe President’s 2000 budget proposals. In addition, the Budget in-cludes the Nation’s second comprehensive Government-wide Perform-ance Plan.
Analytical Perspectives, Budget of the United States Govern-ment, Fiscal Year 2000 contains analyses that are designed to high-light specified subject areas or provide other significant presentationsof budget data that place the budget in perspective.
The Analytical Perspectives volume includes economic and account-ing analyses; information on Federal receipts and collections; analysesof Federal spending; detailed information on Federal borrowing anddebt; the Budget Enforcement Act preview report; current servicesestimates; and other technical presentations. It also includes informa-tion on the budget system and concepts and a listing of the Federalprograms by agency and account.
Historical Tables, Budget of the United States Government,Fiscal Year 2000 provides data on budget receipts, outlays, sur-pluses or deficits, Federal debt, and Federal employment coveringan extended time period—in most cases beginning in fiscal year 1940or earlier and ending in fiscal year 2004. These are much longertime periods than those covered by similar tables in other budgetdocuments. As much as possible, the data in this volume and allother historical data in the budget documents have been made con-sistent with the concepts and presentation used in the 2000 Budget,so the data series are comparable over time.
Budget of the United States Government, Fiscal Year 2000—Appendix contains detailed information on the various appropria-tions and funds that constitute the budget and is designed primarilyfor the use of the Appropriations Committee. The Appendix containsmore detailed financial information on individual programs and ap-propriation accounts than any of the other budget documents. Itincludes for each agency: the proposed text of appropriations lan-guage, budget schedules for each account, new legislative proposals,explanations of the work to be performed and the funds needed,and proposed general provisions applicable to the appropriations of
entire agencies or group of agencies. Information is also providedon certain activities whose outlays are not part of the budget totals.
A Citizen’s Guide to the Federal Budget, Budget of theUnited States Government, Fiscal Year 2000 provides generalinformation about the budget and the budget process for the generalpublic.
Budget System and Concepts, Fiscal Year 2000 contains anexplanation of the system and concepts used to formulate the Presi-dent’s budget proposals.
Budget Information for States, Fiscal Year 2000 is an Officeof Management and Budget (OMB) publication that provides proposedState-by-State obligations for the major Federal formula grant pro-grams to State and local governments. The allocations are basedon the proposals in the President’s budget. The report is releasedafter the budget and can be obtained from the Publications Officeof the Executive Office of the President, 725 17th Street NW, Wash-ington, DC 20503; (202) 395–7332.
AUTOMATED SOURCES OF BUDGET INFORMATION
The information contained in these documents is available inelectronic format from the following sources:
CD-ROM. The CD-ROM contains all of the budget documents andsoftware to support reading, printing, and searching the documents.The CD-ROM also has many of the tables in the budget in spread-sheet format.
Internet. All budget documents, including documents that arereleased at a future date, will be available for downloading in severalformats from the Internet. To access documents through the WorldWide Web, use the following address:
http://www.gpo.gov/usbudget
For more information on access to the budget documents, call (202)512–1530 in the D.C. area or toll-free (888) 293–6498.
GENERAL NOTES
1. All years referred to are fiscal years, unless otherwise noted.2. Detail in this document may not add to the totals due to rounding.
U.S. GOVERNMENT PRINTING OFFICEWASHINGTON 1999
For sale by the U.S. Government Printing OfficeSuperintendent of Documents, Mail Stop: SSOP, Washington, D.C. 20402–9328
i
Contents of the Historical Tables
Page
Introduction:Structure, Coverage and Concepts ........................................................................................................................................ 1
Section Notes .......................................................................................................................................................................... 5
Historical Trends .................................................................................................................................................................... 15
Section 1—Overview of Federal Government Finances ............................................................................................................. 19Table 1.1—Summary of Receipts, Outlays, and Surpluses or Deficits (–): 1789–2004 ................................................... 19Table 1.2—Summary of Receipts, Outlays, and Surpluses or Deficits (–) as Percentages of GDP: 1930–2004 ........... 21Table 1.3—Summary of Receipts, Outlays, and Surpluses or Deficits (–) in Current Dollars, Constant (FY 1992)
Dollars, and as Percentages of GDP: 1940–2004 ............................................................................................................. 23Table 1.4—Receipts, Outlays, and Surpluses or Deficits (–) by Fund Group: 1934–2004 .............................................. 25
Section 2—Composition of Federal Government Receipts ......................................................................................................... 27Table 2.1—Receipts by Source: 1934–2004 ......................................................................................................................... 27Table 2.2—Percentage Composition of Receipts by Source: 1934–2004 ........................................................................... 29Table 2.3—Receipts by Source as Percentages of GDP: 1934–2004 ................................................................................. 31Table 2.4—Composition of Social Insurance Taxes and Contributions and of Excise Taxes: 1940–2004 ..................... 33Table 2.5—Composition of ‘‘Other Receipts’’: 1940–2004 .................................................................................................. 40
Section 3—Federal Government Outlays by Function ............................................................................................................... 42Table 3.1—Outlays by Superfunction and Function: 1940–2004 ...................................................................................... 42Table 3.2—Outlays by Function and Subfunction: 1962–2004 ......................................................................................... 50
Section 4—Federal Government Outlays by Agency .................................................................................................................. 65Table 4.1—Outlays by Agency: 1962–2004 ......................................................................................................................... 65Table 4.2—Percentage Distribution of Outlays by Agency: 1962–2004 ........................................................................... 70
Section 5—Budget Authority (On-and Off-Budget) .................................................................................................................... 75Table 5.1—Budget Authority by Function and Subfunction: 1976–2004 ......................................................................... 75Table 5.2—Budget Authority by Agency: 1976–2004 ......................................................................................................... 87Table 5.3—Percentage Distribution of Budget Authority by Agency: 1976–2004 ........................................................... 91Table 5.4—Discretionary Budget Authority by Agency: 1976–2004 ................................................................................. 95Table 5.5—Percentage Distribution of Discretionary Budget Authority by Agency: 1976–2004 ................................... 99
Section 6—Composition of Federal Government Outlays .......................................................................................................... 103Table 6.1—Composition of Outlays: 1940–2004 ................................................................................................................. 103
Section 7—Federal Debt ............................................................................................................................................................... 110Table 7.1—Federal Debt at the End of Year: 1940–2004 .................................................................................................. 110Table 7.2—Debt Subject to Statutory Limit: 1940–2004 ................................................................................................... 112Table 7.3—Statutory Limits on Federal Debt: 1940–Current ........................................................................................... 113
Section 8—Outlays by Budget Enforcement Act Category ........................................................................................................ 117Table 8.1—Outlays by Budget Enforcement Act Category: 1962–2004 ........................................................................... 117Table 8.2—Outlays by Budget Enforcement Act Category in Constant (FY 1992) Dollars: 1962–2004 ....................... 118Table 8.3—Percentage Distribution of Outlays by Budget Enforcement Act Category: 1962–2004 .............................. 119Table 8.4—Outlays by Budget Enforcement Act Category as Percentages of GDP: 1962–2004 .................................... 120Table 8.5—Outlays for Mandatory and Related Programs: 1962–2004 ........................................................................... 121Table 8.6—Outlays for Mandatory and Related Programs in Constant (FY 1992) Dollars: 1962–2004 ....................... 126Table 8.7—Outlays for Discretionary Programs: 1962–2004 ............................................................................................ 131Table 8.8—Outlays for Discretionary Programs in Constant (FY 1992) Dollars: 1962–2004 ........................................ 136Table 8.9—Budget Authority for Discretionary Programs: 1976–2004 ............................................................................ 141
Section 9—Federal Government Outlays for Major Physical Capital, Research and Development, and Education andTraining ...................................................................................................................................................................................... 145
Table 9.1—Total Investment Outlays for Physical Capital, Research and Development, and Education and Train-ing: 1962–2000 .................................................................................................................................................................... 145
Table 9.2—Major Physical Capital Investment Outlays in Current and Constant (FY 1992) Dollars: 1940–2000 ..... 146Table 9.3—Major Public Physical Capital Investment Outlays in Percentage Terms: 1940–2000 ................................ 148Table 9.4—National Defense Outlays for Major Public Direct Physical Capital Investment: 1940–2000 .................... 150Table 9.5—Nondefense Outlays for Major Public Direct Physical Capital Investment: 1940–2000 .............................. 151
ii THE BUDGET FOR FISCAL YEAR 2000, HISTORICAL TABLES
Contents of the Historical Tables—Continued
Page
Section 9 (Continued).Table 9.6—Composition of Outlays for Grants for Major Public Physical Capital Investment: 1941–2000 ................. 153Table 9.7—Summary of Outlays for the Conduct of Research and Development: 1949–2000 (In Current Dollars, as
Percentages of Total Outlays, as Percentages of GDP, and in Constant (FY 1992) Dollars) ....................................... 159Table 9.8—Composition of Outlays for the Conduct of Research and Development: 1949–2000 ................................... 160Table 9.9—Composition of Outlays for the Conduct of Education and Training: 1962–2000 ........................................ 166
Section 10—Gross Domestic Product and Implicit Outlay Deflators ........................................................................................ 169Table 10.1—Gross Domestic Product and Deflators Used in the Historical Tables: 1940–2004 .................................... 169
Section 11—Federal Government Payments for Individuals ..................................................................................................... 171Table 11.1—Summary Comparison of Outlays for Payments for Individuals: 1940–2004 (In Current Dollars, as
Percentages of Total Outlays, as Percentages of GDP, and in Constant (FY 1992) Dollars) ....................................... 171Table 11.2—Functional Composition of Outlays for Payments for Individuals: 1940–2004 .......................................... 173Table 11.3—Outlays for Payments for Individuals by Category and Major Program: 1940–2004 ................................ 181
Section 12—Federal Grants To State and Local Governments ................................................................................................. 203Table 12.1—Summary Comparison of Total Outlays for Grants to State and Local Governments: 1940–2004 (in
Current Dollars, as Percentages of Total Outlays, as Percentages of GDP, and in Constant (FY 1992) Dollars) ..... 203Table 12.2—Total Outlays for Grants to State and Local Governments, by Function and Fund Group: 1940–2004 .. 205Table 12.3—Total Outlays for Grants to State and Local Governments, by Function, Agency, and Program:
1940–2004 ........................................................................................................................................................................... 211
Section 13—Social Security and Medicare .................................................................................................................................. 252Table 13.1—Cash Income, Outgo, and Balances of the Social Security and Medicare Trust Funds: 1936–2004 ......... 252
Section 14—Federal Sector Transactions in the National Income and Product Accounts ...................................................... 263Table 14.1—Federal Transactions in the National Income and Product Accounts for Federal Fiscal Years:
1947–2000 ........................................................................................................................................................................... 263Table 14.2—Federal Transactions in the National Income and Product Accounts as Percentages of GDP for Fed-
eral Fiscal Years: 1947–2000 ............................................................................................................................................. 266
Section 15—Total (Federal and State and Local) Government Finances ................................................................................. 269Table 15.1—Total Government Receipts in Absolute Amounts and as Percentages of GDP: 1947–1998 ..................... 269Table 15.2—Total Government Expenditures: 1947–1998 ................................................................................................ 270Table 15.3—Total Government Expenditures as Percentages of GDP: 1947–1998 ......................................................... 271Table 15.4—Total Government Expenditures by Major Category of Expenditure: 1947–1998 ...................................... 272Table 15.5—Total Government Expenditures by Major Category of Expenditure as Percentages of GDP:
1947–1998 ........................................................................................................................................................................... 273Table 15.6—Total Government Surpluses or Deficits (–) in Absolute Amounts and as Percentages of GDP:
1947–1998 ........................................................................................................................................................................... 274
Section 16—Federal Health Spending ......................................................................................................................................... 275Table 16.1—Total Outlays for Health Programs: 1962–2004 ............................................................................................ 275
Section 17—Government Employment ........................................................................................................................................ 276Table 17.1—Total Executive Branch Civilian Employees, 1940–1998 ............................................................................. 276Table 17.2—Total Executive Branch Civilian Employees, 1940–1998 (as percentage of total) ..................................... 277Table 17.3—Total Executive Branch Civilian Full-Time Equivalent (FTE) Employees, 1981–2000 ............................. 278Table 17.4—Total Executive Branch Civilian Full-Time Equivalent (FTE) Employees, 1981–2000 (as percentage of
total) ..................................................................................................................................................................................... 279Table 17.5—Government Employment and Population, 1962–1998 ................................................................................. 280
1
INTRODUCTION
STRUCTURE, COVERAGE AND CONCEPTS
Historical Tables provides budget users witha wide range of data on Federal Governmentfinances. Many of the data series beginin 1940 and include estimates of the Presi-dent’s budget for 1999–2004. Additionally,Table 1.1 provides data on receipts, outlays,and surpluses or deficits for 1901–1939 andfor earlier multi-year periods.
Structure
This document is composed of 17 sections,each of which has one or more tables.Each section covers a common theme. Section1, for example, provides an overview ofthe budget and off-budget totals; Section2 provides tables on receipts by source;and Section 3 shows outlays by function.When a section contains several tables, thegeneral rule is to start with tables showingthe broadest overview data and then workdown to more detailed tables. The purposeof these tables is to present a broad rangeof historical budgetary data in one convenientreference source and to provide relevant com-parisons most likely to be of assistance.The most common comparisons are in termsof proportions (e.g., each major receipt categoryas a percentage of total receipts and ofthe gross domestic product).
Section notes explain the nature of theactivities covered by the tables in each section.Additional descriptive information is also in-cluded where appropriate. Explanations aregenerally not repeated, but there are occa-sional cross-references to related materials.
Because of the numerous changes in theway budget data have been presented overtime, there are inevitable difficulties in tryingto produce comparable data to cover manyyears. The general rule is to provide datain as meaningful and comparable a fashionas possible. To the extent feasible, the dataare presented on a basis consistent withcurrent budget concepts. When a structural
change is made, insofar as possible the dataare adjusted for all years.
One significant change in recent yearsconcerns the budgetary treatment of Federalcredit programs, which was changed by theFederal Credit Reform Act of 1990. Previouslythe budget recorded the cost of direct andguaranteed loans on a cash basis. Undercredit reform, the budget only records budgetauthority and outlays for the subsidy costof direct and guaranteed loans made in1992 and subsequent years. The subsidyis defined as the net estimated cash flowsto and from the Government over the lifeof the loan, discounted to the present. Thecash transactions are recorded as meansof financing the deficit. Because it was impos-sible to convert the pre–1992 loans to acredit reform basis, the data are on a cashbasis for pre–1992 loans and on a creditreform basis for loans made in 1992 andsubsequent years.
Coverage
The Federal Government has used theunified or consolidated budget concept asthe foundation for its budgetary analysisand presentation since the 1969 budget. Thebasic guidelines for the unified budget werepresented in the Report of the President’sCommission on Budget Concepts (October1967). The Commission recommended thebudget include all Federal fiscal activitiesunless there were exceptionally persuasivereasons for exclusion. Nevertheless, from thevery beginning some programs were perceivedas warranting special treatment. Indeed, theCommission itself recommended a bifurcatedpresentation: a ‘‘unified budget’’ composedof an ‘‘expenditure account’’ and a ‘‘loanaccount.’’ The distinction between the expendi-ture account and the loan account provedto be confusing and caused considerable com-plication in the budget for little benefit.As a result, this distinction was eliminated
2 THE BUDGET FOR FISCAL YEAR 2000, HISTORICAL TABLES
starting with the 1974 budget. However,even prior to the 1974 budget, the Export-Import Bank had been excluded by lawfrom the budget totals, and other exclusionsfollowed. The structure of the budget wasgradually revised to show the off-budget trans-actions in many locations along with theon-budget transactions, and the off-budgetamounts were added to the on-budget amountsin order to show total Federal spending.
The Balanced Budget and Emergency DeficitControl Act of 1985 (Public Law 99–177)repealed the off-budget status of all thenexisting off-budget entities, but it also includeda provision moving the Federal old-age, sur-vivors, and disability insurance funds (collec-tively known as social security) off-budget.To provide a consistent time series, thebudget historical data show social securityoff-budget for all years since its inception,and show all formerly off-budget entitieson-budget for all years. The Omnibus BudgetReconciliation Act of 1989 (OBRA 1989) movedthe Postal Service fund off-budget, startingin fiscal year 1989. Prior to that year,the Postal Service fund is shown on-budget.
Though social security and the Postal Serv-ice are now off-budget, they continue tobe Federal programs. Indeed, social securitycurrently accounts for about one-fourth ofall Federal receipts and one-fifth of all Federalspending. Hence, the budget documents in-clude these funds and focus on the Federaltotals that combine the on-budget and off-budget amounts. Various budget tables andcharts show total Federal receipts, outlays,and surpluses and deficits, and divide thesetotals between the portions that are on-budget and off-budget.
Changes in Historical Budget Authority,Outlays, Receipts and Deficits
The major budget totals for 1997 havechanged from those published in the 1999Budget due to corrections reported to theTreasury. Budget authority and outlays arehigher due to a $3 million reduction inoffsetting receipts for interest on loans forrailroad rehabilitation and improvement. Anincrease of $6 million in offsetting receiptsin Treasury’s budget clearing account (sus-pense) was also made. As a result of these
two changes, total budget authority, outlaysand the deficit for 1997 are reduced by$3 million. Further, but offsetting, changesto 1997 budget authority result from theremoval of discretionary budget authority (andaddition of corresponding amounts of manda-tory budget authority) for various transpor-tation trust funds that were proposed tohave a conceptual change in the 1999 Budgetto show budget authority in lieu of obligationlimitations. The proposed conceptual changeshould have been reflected in the budgetdata only for prospective years. Discretionarybudget authority is reduced (and mandatorybudget authority is increased) by $24,141million.
Conceptual changes were made to budgetauthority for the medicare catastrophic insur-ance trust funds in 1989 and 1990 to makethem consistent with the Budget EnforcementAct definition of budget authority for socialinsurance trust funds. As a result, budgetauthority for medicare is reduced by $1,563million in 1989 and by $414 million in1990. A correction reduces budget authorityfor medicare’s hospital insurance trust fundin 1978 by $54 million.
Other changes were made to the functionalor Budget Enforcement Act category classifica-tions of certain accounts as a result ofjoint consultations among congressional com-mittees, the Congressional Budget Office andthe Office of Management and Budget. Theagency structure shown in this year’s budgetreflects the proposed reorganization of variousinternational agencies. In particular, theUnited States Information Agency and theArms Control and Disarmament Agency arenow shown as part of the State Departmentrather than as Other Independent Agencies.
Note on the Fiscal Year
The Federal fiscal year begins on October1 and ends on the subsequent September30. It is designated by the year in whichit ends; for example, fiscal year 1995 beganon October 1, 1994, and ended on September30, 1995. Prior to fiscal year 1977 theFederal fiscal years began on July 1 andended on June 30. In calendar year 1976the July-September period was a separateaccounting period (known as the transition
3THE BUDGET FOR FISCAL YEAR 2000, HISTORICAL TABLES
quarter or TQ) to bridge the period requiredto shift to the new fiscal year.
Concepts Relevant to the HistoricalTables
Budget (or ‘‘on-budget’’) receipts constitutethe income side of the budget; they arecomposed almost entirely of taxes or othercompulsory payments to the Government. Anyincome from business-type activities (e.g., in-terest income or sale of electric power),and any income by Government accountsarising from payments by other Governmentaccounts is offset against outlays, so thattotal budget outlays are reported net ofoffsetting collections. This method of account-ing permits users to easily identify the sizeand trends in Federal taxes and other compul-sory income, and in Federal spending financedfrom taxes, other compulsory income, or bor-rowing. Budget surplus refers to any excessof budget receipts over budget outlays, whilebudget deficit refers to any excess of budgetoutlays over budget receipts.
The terms off-budget receipts, off-budgetoutlays, off-budget surpluses, and off-budgetdeficits refer to similar categories for off-budget activities. The sum of the on-budgetand off-budget transactions constitute theconsolidated or total Federal Governmenttransactions.
The budget is divided between two fundgroups, Federal funds and trust funds. TheFederal funds grouping includes all receiptsand outlays not specified by law as beingtrust funds. All Federal funds are on-budgetexcept for the Postal Service fund startingwith fiscal year 1989. All trust funds areon-budget, except the two social securityretirement trust funds, which are shownoff-budget for all years.
The term trust fund as used in Federalbudget accounting is frequently misunderstood.In the private sector, ‘‘trust’’ refers to fundsof one party held by a second party (thetrustee) in a fiduciary capacity. In the Federalbudget, the term ‘‘trust fund’’ means onlythat the law requires the funds be accounted
for separately and used only for specifiedpurposes and that the account in whichthe funds are deposited is designated asa ‘‘trust fund.’’ A change in law may changethe future receipts and the terms underwhich the fund’s resources are spent. Thedetermining factor as to whether a particularfund is designated as a ‘‘Federal’’ fund or‘‘trust’’ fund is the law governing the fund.
The largest trust funds are for retirementand social insurance (e.g., civil service andmilitary retirement, social security, medicare,and unemployment benefits). They are fi-nanced largely by social insurance taxes andcontributions and payments from the generalfund (the main component of Federal funds).However, there are also major trust fundsfor transportation (highway and airport andairways) and for other programs financedin whole or in part by user charges.
The budget documents do not separatelyshow user charges. Frequently there is confu-sion between the concept of user chargesand the concept of offsetting collections. Usercharges are charges for services rendered.Such charges may take the form of taxes(budget receipts), such as highway excisetaxes used to finance the highway trustfund. They may also take the form of business-type charges, in which case they are offsettingcollections—offset against budget outlays rath-er than being recorded as budget receipts.Examples of such charges are the proceedsfrom the sale of electric power by the Ten-nessee Valley Authority and medical insurancepremiums paid to medicare’s supplementarymedical insurance trust fund. User chargesmay go to the general fund of the Treasuryor they may be ‘‘earmarked’’. If the fundsare earmarked, it means the collections areseparately identified and used for a specifiedpurpose—they are not commingled (in anaccounting sense) with any other money.This does not mean the money is actuallykept in a separate bank account. All moneyin the Treasury is merged for efficient cashmanagement. However, any earmarked fundsare accounted for in such a way that thebalances are always identifiable and availablefor the stipulated purposes.
5
SECTION NOTES
Notes on Section 1 (Overview of FederalGovernment Finances)
This section provides an overall perspectiveon total receipts, outlays (spending), andsurpluses or deficits, the on-budget and off-budget amounts are also separately shown.Tables 1.1 and 1.2 have similar structures;1.1 shows the data in millions of dollars,while 1.2 shows the same data as percentagesof the gross domestic product (GDP). Forall the historical tables, fiscal year GDPis used to calculate percentages of GDP.The fiscal year GDP data are shown inTable 1.2. Additionally, Table 1.1 shows budg-et totals annually back to 1901 and formulti-year periods back to 1789.
Table 1.3 shows total Federal receipts,outlays, and surpluses or deficits in currentand constant dollars, and as percentagesof GDP. Section 6 provides a disaggregationof the constant dollar outlays.
Table 1.4 shows receipts, outlays and sur-pluses or deficits for the consolidated budgetby fund group. The budget is composedof two principal fund groups—Federal fundsand trust funds. Normally, whenever dataare shown by fund group, any paymentsfrom programs in one fund group to accountsof the other are shown as outlays of thepaying fund and receipts of the collectingfund. When the two fund groups are aggre-gated to arrive at budget totals these interfundtransactions are deducted from both receiptsand outlays in order to arrive at transactionswith the public. Table 1.4 displays receiptsand outlays on a gross basis. That is, incontrast to normal budget practice, collectionsof interfund payments are included in thereceipts totals rather than as offsets to outlays.These interfund collections are grossed-upto more closely approximate cash incomeand outgo of the fund groups.
Notes on Section 2 (Composition ofFederal Government Receipts)
Section 2 provides historical informationon on-budget and off-budget receipts. Table
2.1 shows total receipts divided into fivemajor categories; it also shows the splitbetween on-budget and off-budget receipts.Table 2.2 shows the receipts by major categoryas percentages of total receipts, while Table2.3 shows the same categories of receiptsas percentages of GDP. Table 2.4disaggregates two of the major receipts cat-egories, social insurance taxes and contribu-tions and excise taxes, and Table 2.5disaggregates the ‘‘other receipts’’ category.While the focus of the section is on totalFederal receipts, auxiliary data show theamounts of trust fund receipts in each cat-egory, so it is possible to readily distinguishthe Federal fund and trust fund portions.
Notes on Section 3 (Federal GovernmentOutlays by Function)
Section 3 displays Federal Government out-lays (on-budget and off-budget) according totheir functional classification. The functionalstructure is divided into 18 broad areas(functions) that provide a coherent and com-prehensive basis for analyzing the budget.Each function, in turn, is divided into basicgroupings of programs entitled subfunctions.The structure has two categories—allowancesand undistributed offsetting receipts—that arenot truly functions but are required in orderto cover the entire budget. At times a moresummary presentation of functional data isneeded; the data by ‘‘superfunction’’ is pro-duced to satisfy this need. Table 3.1 providesoutlays by superfunction and function whileTable 3.2 shows outlays by function andsubfunction.
In arraying data on a functional basis,budget authority and outlays are classifiedaccording to the primary purpose of theactivity. To the extent feasible, this classifica-tion is made without regard to agency ororganizational distinctions. Classifying eachactivity solely in the function defining itsmost important purpose—even though manyactivities serve more than one purpose—permits adding the budget authority andoutlays of each function to obtain the budget
6 THE BUDGET FOR FISCAL YEAR 2000, HISTORICAL TABLES
totals. For example, Federal spending formedicaid constitutes a health care program,but it also constitutes a form of incomesecurity benefits. However, the spending can-not be counted in both functions; since themain purpose of medicaid is to finance thehealth care of the beneficiaries, this programis classified in the ‘‘health’’ function. Section3 provides data on budget outlays by function,while Section 5 provides comparable dataon budget authority.
Notes on Section 4 (Federal GovernmentOutlays by Agency)
Section 4 displays Federal Government out-lays (on- and off-budget) by agency. Table4.1 shows the dollar amounts of such outlays,and Table 4.2 shows the percentage distribu-tion. The outlays by agency are based onthe agency structure currently in effect. Forexample, the Department of Education wasestablished by legislation enacted in 1979.However, these data show spending by theDepartment of Education in previous yearsthat consists of education spending attrib-utable to other agencies in earlier years,but now attributable to the Department ofEducation.
Notes on Section 5 (Budget Authority—On- and Off-Budget)
Section 5 provides data on budget authority(BA). BA is the authority provided by lawfor agencies to obligate the Government tospend. Table 5.1 shows BA by function andsubfunction, starting with 1976. Table 5.2provides the same information by agency,and Table 5.3 provides a percentage distribu-tion of BA by agency. Tables 5.4 and 5.5provide the same displays as Tables 5.2and 5.3, but for discretionary budget authorityrather than total budget authority. (Discre-tionary refers to the Budget EnforcementAct category that includes programs subjectto the annual appropriations process.)
The data in these tables were compiledusing the same methods used for the budgethistorical tables for receipts and outlays (e.g.,to the extent feasible, changes in classificationare reflected retroactively so the data showthe same stream of transactions in the same
location for all years). However, BA is hetero-geneous in nature, varying significantly fromone program to another. As a result, itis not additive—either across programs oragencies for a year or, in many cases, foran agency or program across a series ofyears—in the same sense that budget receiptsand budget outlays are additive. The followingare examples of different kinds of BA andthe manner in which there are largedivergences between the creation and useof BA.
• BA and outlays for each year may be ex-actly the same (e.g., interest on the publicdebt).
• For each year the Congress may appro-priate a large quantity of BA that willbe spent over a subsequent period of years(e.g., many defense procurement contractsand major construction programs).
• Some BA (e.g., the salaries and expensesof an operating agency) is made availableonly for a year and any portion not obli-gated during that year lapses (i.e., itceases to be available to be obligated).
• Revolving funds may operate spendingprograms indefinitely with no new infu-sion of BA, other than the authority tospend offsetting collections.
• BA may be enacted with the expectationit is unlikely ever to be used (e.g., standbyborrowing authority).
• All income to a fund (e.g., certain revolv-ing, special, and trust funds) may be per-manently appropriated as BA; as long asthe fund has adequate resources, there isno further relationship between the BAand outlays.
• As a result of the Budget Enforcement Actof 1990, the measurement of BA changedin most special and trust funds with legis-latively imposed limitations or benefit for-mulas that constrain the use of BA. Wherepreviously budget authority was the totalincome to the fund, BA in these funds for1990 and subsequent years is now an esti-mate of the obligations to be incurred dur-ing the fiscal year for benefit payments,administration and other expenses of thefund. In some, but not all, cases it was
7THE BUDGET FOR FISCAL YEAR 2000, HISTORICAL TABLES
possible to adjust BA figures for thesefunds for years prior to 1990 to conformto the current concepts.
• Although major changes in the way BAis measured for credit programs (begin-ning in 1992) result from the Budget En-forcement Act, these tables could not bereconstructed to show revised BA figuresfor 1991 and prior years on the new basis.
• In its earliest years, the Federal FinancingBank (FFB) was conducted as a revolvingfund, making direct loans to the public orpurchasing loan assets from other fundsor accounts. Each new loan by the FFBrequired new BA. In many cases, if thesame loan were made by the account beingserviced by the FFB, the loan could befinanced from offsetting collections and nonew BA would be recorded. Under termsof the 1985 legislation moving the FFBon-budget, the FFB ceased to make directloans to the public. Instead, it makes loansto the accounts it services, and these ac-counts, in turn, make the loans to the pub-lic. Such loans could be made from newBA or other obligational authority avail-able to the parent account. These tableshave not been reconstructed to shift BApreviously scored in the FFB to the parentaccounts, because there is no technicalway to reconfigure the data.
Despite these qualifications there is a desirefor historical data on BA, and this sectionhas been developed to meet that desire.Budget authority data are also provided byfunction in Table 8.9 for various discretionaryprogram groupings.
Notes on Section 6 (Composition ofFederal Government Outlays)
The ‘‘composition’’ categories in this sectiondivide total outlays (including social security)into national defense and nondefense compo-nents, and then disaggregate the nondefensespending into several parts:
• Payments for individuals: These are Fed-eral Government spending programs de-signed to transfer income (in cash or inkind) to individuals or families. To the ex-tent feasible, this category does not in-clude reimbursements for current services
rendered to the Government (e.g., salariesand interest). The payments may be in theform of cash paid directly to individualsor they may take the form of the provisionof services or the payment of bills for ac-tivities largely financed from personal in-come. They include outlays for the provi-sion of medical care (in veterans hospitals,for example) and for the payment of medi-cal bills (e.g., medicare). They also includesubsidies to reduce the cost of housingbelow market rates, and food and nutritionassistance (such as food stamps). The database, while not precise, provides a reason-able perspective of the size and composi-tion of income support transfers withinany particular year and trends over time.Section 11 disaggregates the componentsof this category. The data in Section 6show a significant amount of payments forindividuals takes the form of grants toState and local governments to financebenefits for the ultimate recipients. Thesegrants include medicaid, some food andnutrition assistance, and a significant por-tion of the housing assistance payments.Sections 11 and 12 provide a more detaileddisaggregation of this spending.
• All other grants to State and local govern-ments: This category consists of the Fed-eral nondefense grants to State and localgovernments other than grants defined aspayments for individuals. Section 12disaggregates this spending.
• Net interest: This category consists of allspending (including offsetting receipts) in-cluded in the functional category ‘‘net in-terest.’’ Most spending for net interest ispaid to the public as interest on the Fed-eral debt. As shown in Table 3.2, net inter-est includes, as an offset, significantamounts of interest income.
• All other: This category consists of all re-maining Federal spending and offsettingreceipts except for those included in thecategory ‘‘undistributed offsetting re-ceipts.’’ It includes most Federal loan ac-tivities and most Federal spending for for-eign assistance, farm price supports, medi-cal and other scientific research, and, ingeneral, Federal direct program oper-ations.
8 THE BUDGET FOR FISCAL YEAR 2000, HISTORICAL TABLES
• Undistributed offsetting receipts: These areoffsetting receipts that are not offsetagainst any specific agency or pro-grammatic function. They are classified asfunction 950 in the functional tables. Addi-tional details on their composition can befound at the end of Table 3.2.
Table 6.1 shows these outlays in currentand constant dollars, the percentage distribu-tion of current dollar outlays, and the currentdollar outlays as percentages of GDP. Theterm ‘‘constant dollars’’ means the amountsof money that would have had to be spentin each year if, on average, the unit costof everything purchased within that categoryeach year (including purchases financed byincome transfers, interest, etc.) were thesame as in the base year (1992). The adjust-ments to constant dollars are made by apply-ing a series of chain-weighted price deflatorsto the current dollar data base. The compositedeflator is used to produce estimates ofconstant dollar receipts published in Table1.3. The separate deflators used for thesecalculations are shown in Table 10.1.
Notes on Section 7 (Federal Debt)
This section provides information aboutFederal debt. Table 7.1 contains data ongross Federal debt and its major componentsin terms of both the amount of debt outstand-ing at the end of each year and that amountas a percentage of fiscal year GDP.
Gross Federal debt is composed both ofFederal debt held (owned) by the publicand Federal debt held by Federal Governmentaccounts, which is mostly held by trustfunds. Federal debt held by the public consistsof all Federal debt held outside the FederalGovernment accounts. For example, it includesdebt held by individuals, private banks andinsurance companies, the Federal ReserveBanks, and foreign central banks. The saleof Federal debt to the public is the principalmeans of financing the Federal deficit.
The Federal Government accounts holdingthe largest amount of Federal debt securitiesare the civil service and military retirement,social security, and medicare trust funds.However, significant amounts are also heldby some other Government accounts, such
as the unemployment and highway trustfunds.
Table 7.1 divides debt held by the publicbetween the amount held by the FederalReserve Banks and the remainder. The Fed-eral Reserve System is the central bankfor the Nation. Their holdings of Federaldebt are shown separately because they donot have the same impact on private creditmarkets as does other debt held by thepublic. They accumulate Federal debt asa result of their role as the country’s centralbank, and the size of these holdings hasa major impact on the Nation’s money supply.Since the Federal budget does not forecastFederal Reserve monetary policy, it doesnot project future changes in the amountsof Federal debt that will be held by theFederal Reserve Banks. Hence, the split ofdebt held by the public into that portionheld by the Federal Reserve Banks andthe remainder is provided only for pastyears. Table 2.5 shows deposits of earningsby the Federal Reserve System. Most interestpaid by Treasury on debt held by the FederalReserve Banks is returned to the Treasuryas deposits of earnings, which are recordedas budget receipts.
As a result of a conceptual revision inthe quantification of Federal debt, the dataon debt held by the public and gross Federaldebt—but only a small part of debt heldby Government accounts—were revised backto 1956 in the 1990 budget. The total revisionwas relatively small—a change of under onepercent of the recorded value of the debt—but the revised basis is more consistentwith the quantification of interest outlays,and provides a more meaningful measureof Federal debt. The change converted mostdebt held by the public from the par valueto the sales price plus amortized discount.
Most debt held by Government accountsis issued at par, and securities issued ata premium or discount have traditionallybeen recorded at par. However, zero-couponbonds are recorded at estimated market price.Starting in 1989, total debt held by Govern-ment accounts is adjusted for any initialdiscount on other securities.
Table 7.2 shows the end-of-year amountsof Federal debt subject to the general statutory
9THE BUDGET FOR FISCAL YEAR 2000, HISTORICAL TABLES
limitation. It is recorded at par value (exceptfor savings bonds) through 1988, but bylaw the basis was changed, in part, toaccrual value for later years. Before WorldWar I, each debt issue by the Governmentrequired specific authorization by the Con-gress. Starting in 1917, the nature of thislimitation was modified in several steps untilit developed into a limit on the total amountof Federal debt outstanding. The Treasuryis free to borrow whatever amounts areneeded up to the debt limit, which is changedfrom time to time to meet new requirements.Table 7.3 shows the ceiling at each pointin time since 1940. It provides the specificlegal citation, a short description of thechange, and the amount of the limit specifiedby each Act. Most of gross Federal debtis subject to the statutory limit. However,there are some differences.
Notes on Section 8 (Outlays by BudgetEnforcement Act Category)
Section 8 is composed of nine tables, eightof which present outlays by the major cat-egories used under the Budget EnforcementAct (BEA) and under previous budget agree-ments between Congress and the currentand previous Administrations. The final tablepresents discretionary budget authority. (Dis-cretionary budget authority is shown on anagency basis in Section 5, Table 5.4 andTable 5.5.) Table 8.1 shows Federal outlayswithin each of the categories and subcat-egories. The principal categories are outlaysfor mandatory and related programs andoutlays for discretionary programs. Mandatoryand related programs include direct spendingand offsetting receipts whose budget authorityis provided by law other than appropriationsacts. These include appropriated entitlementsand the food stamp program, which receivepro forma appropriations. Discretionary pro-grams are those whose budgetary resources(other than entitlement authority) are pro-vided in appropriations acts. The table showsthree categories of discretionary programs:Defense (Function 050), International (Func-tion 150), and Domestic (all other discretionaryprograms). Table 8.2 has the same structure,but shows the data in constant (FY 1992)dollars. Table 8.3 shows the percentage dis-tribution of outlays by BEA category and
Table 8.4 shows outlays by BEA categoryas a percentage of GDP.
Table 8.5 provides additional detail byfunction and/or subfunction for mandatoryand related programs. Table 8.6 shows thesame data in constant dollars.
Table 8.7 provides additional detail byfunction and/or subfunction on outlays fordiscretionary programs. Table 8.8 providesthe same data in constant dollars. Table8.9 provides function and/or subfunction detailon budget authority for discretionary pro-grams.
Notes on Section 9 (Federal GovernmentOutlays for Major Physical Capital,Research and Development, and Edu-cation and Training)
Tables in this section provide a broadperspective on Federal Government outlaysfor public physical capital, the conduct ofresearch and development (R&D), and edu-cation and training. These data measurenew Federal spending for major public physicalassets, but they exclude major commodityinventories. In some cases it was necessaryto use supplementary data sources to estimatemissing data in order to develop a consistenthistorical data series. The data for the conductof research and development continue toexclude outlays for construction and majorequipment because such spending is includedin outlays for physical capital.
Table 9.1 shows total investment outlaysfor major public physical capital, R&D, andeducation and training in current and constant(FY 1992) dollars, and shows the percentagedistribution of outlays and outlays as apercentage of GDP. Table 9.2 focuses ondirect Federal outlays and grants for majorpublic physical capital investment in currentand constant (FY 1992) dollars, disaggregatingdirect Federal outlays into national defenseand nondefense capital investment. Table 9.3retains the same structure as 9.2, but showsdirect Federal outlay totals for physical capitalinvestment as percentages of total outlaysand as percentages of GDP. Table 9.4disaggregates national defense direct outlays,while Table 9.5 disaggregates nondefense out-lays for major public physical capital invest-
10 THE BUDGET FOR FISCAL YEAR 2000, HISTORICAL TABLES
ment. Table 9.6 shows the composition ofgrant outlays for major public physical capitalinvestment.
Table 9.7 provides an overall perspectiveon Federal Government outlays for the conductof R&D. It shows total R&D spending andthe split between national defense and non-defense spending in four forms: in currentdollars, in constant dollars, as percentagesof total outlays, and as percentages of GDP.Table 9.8 shows outlays in current dollarsby major function and program.
Table 9.9 shows outlays for the conductof education and training in current dollarsfor direct Federal programs and for grantsto State and local governments. Total outlaysfor the conduct of education and trainingas a percentage of Federal outlays and inconstant (FY 1992) dollars are also shown.As with the series on physical capital, severalbudget data sources have been used to developa consistent data series extending back to1962. A discontinuity occurs between 1991and 1992 and affects primarily direct Federalhigher education outlays. For 1991 and earlier,these data include net loan outlays. Beginningin 1992, pursuant to changes in the treatmentof loans as specified in the Credit ReformAct of 1990, this series includes outlaysfor loan repayments and defaults for loansoriginated in 1991 and earlier and creditsubsidy outlays for loans originated in 1992and later years.
Table 9.9 also excludes education and train-ing outlays for physical capital (which areincluded in Table 9.7) and education andtraining outlays for the conduct of researchand development (which are in Table 9.8).Also excluded are education and trainingprograms for Federal civilian and militarypersonnel.
Notes on Section 10 (Implicit OutlayDeflators)
Section 10 consists of Table 10.1, GrossDomestic Product and Deflators Used in theHistorical Tables, which shows the variousimplicit deflators used to convert currentdollar outlays to constant dollars. The constantdollar deflators are based on chain-weighted(FY 1992 chained-dollars) deflators derived
from the National Income and Product Ac-counts data.
Notes on Section 11 (FederalGovernment Payments for Individuals)
This section provides detail on outlaysfor Federal Government payments for individ-uals, which are also described in the noteson Section 6. The basic purpose of thepayments for individuals aggregation is toprovide a broad perspective on Federal cashor in-kind payments for which no currentservice is rendered yet which constitutesincome transfers to individuals and families.Table 11.1 provides an overview display ofthese data in four different forms. All fourof these displays show the total paymentsfor individuals, and the split of this totalbetween grants to State and local governmentsfor payments for individuals (such as medicaidand grants for housing assistance) and allother (‘‘direct’’) payments for individuals.
Table 11.2 shows the functional compositionof payments for individuals (see notes onSection 3 for a description of the functionalclassification), and includes the same grantsversus nongrants (‘‘direct’’) split provided inTable 11.1. The off-budget social securityprogram finances a significant portion ofthe Federal payments for individuals. Thesetables do not distinguish between the on-budget and off-budget payments for individ-uals. However, all payments for individualsshown in Table 11.2 in function 650 (socialsecurity) are off-budget outlays, and all otherpayments for individuals are on-budget. Table11.3 displays the payments for individualsby major program category.
Notes on Section 12 (Federal Grants ToState and Local Governments)
For several decades the Federal budgetdocuments have provided data on Federalgrants to State and local governments. Thepurpose of these data is to identify FederalGovernment outlays that constitute incometo State and local governments to help financetheir services and their income transfers(payments for individuals) to the public.Grants generally exclude Federal Governmentpayments for services rendered directly to
11THE BUDGET FOR FISCAL YEAR 2000, HISTORICAL TABLES
the Federal Government; for example, theyexclude most Federal Government paymentsfor research and development, and they ex-clude payments to State social service agenciesfor screening disability insurance beneficiariesfor the Federal disability insurance trustfund.
Table 12.1 provides an overall perspectiveon grants; its structure is similar to thestructure of Table 11.1.
Table 12.2 displays Federal grants by func-tion (see notes on Section 3 for a descriptionof the functional classification). The bulkof Federal grants are included in the Federalfunds group; however, since the creationof the highway trust fund in 1957, significantamounts of grants have been financed fromtrust funds (see notes to Section 1 for adescription of the difference between ‘‘Federalfunds’’ and ‘‘trust funds’’). All Federal grantsare on-budget. Wherever trust fund outlaysare included in those data, Table 12.2 notonly identifies the total grants by functionbut also shows the split between Federalfunds and trust funds.
Table 12.3 provides data on grants atthe account or program level, with an identi-fication of the function, agency, and fundgroup of the payment.
Notes on Section 13 (Social Security andMedicare)
Over the past several decades the socialsecurity programs (the Federal old-age andsurvivors insurance (OASI) and the Federaldisability insurance (DI) trust funds) andthe medicare programs (the Federal hospitalinsurance (HI) and the Federal supplementarymedical insurance (SMI) trust funds) havegrown to be among the largest parts ofthe Federal budget. Because of the size,the rates of growth, and the specializedfinancing of these programs, policy analystsfrequently wish to identify these activitiesseparately from all other Federal taxes andspending. As discussed in the introductorynotes, the two social security funds areoff-budget, while the medicare funds areon-budget. As Table 13.1 shows, the firstof these funds (OASI) began in 1937. Thetable shows the annual transactions of that
fund and of the other funds beginning withtheir points of origin.
The table provides detailed informationabout social security and medicare by fund.It shows total cash income (including offsettingreceipts) by fund, separately identifying socialinsurance taxes and contributions,intragovernmental income, and proprietaryreceipts from the public. Virtually all ofthe proprietary receipts from the public, espe-cially those for the supplementary medicalinsurance trust fund, are medicare insurancepremiums. The table shows the income, outgo,and surplus or deficit of each fund foreach year, and also shows the balancesof the funds available for future requirements.Most of these fund balances are investedin public debt securities and constitute asignificant portion of the debt held by Govern-ment accounts (see Table 7.1).
The SMI fund, which was established in1967, is financed primarily by payments fromFederal funds and secondarily by medicalinsurance premiums (proprietary receipts fromthe public). The other three trust fundsare financed primarily by social insurancetaxes. The law establishing the rate andbase of these taxes allocates the tax receiptsamong the three funds.
The table shows significant transfers byOASI and DI to the railroad retirementsocial security equivalent account. These trans-fers are equal to the additional amountsof money social security would have hadto pay, less additional receipts it wouldhave collected, if the rail labor force hadbeen included directly under social securitysince the inception of the social securityprogram.
In 1983, when the OASI fund ran shortof money, Congress passed legislation that(a) provided for a one-time acceleration ofmilitary service credit payments to thesetrust funds, (b) provided for a Federal fundpayment to OASDI for the estimated valueof checks issued in prior years and chargedto the trust funds but never cashed, (c)required that the Treasury make paymentsto OASDHI on the first day of the monthfor the estimated amounts of their socialinsurance taxes to be collected over thecourse of each month (thereby increasing
12 THE BUDGET FOR FISCAL YEAR 2000, HISTORICAL TABLES
each affected trust fund’s balances at thebeginning of the month), and (d) subjectedsome social security benefits to Federal incomeor other taxes and provided for paymentsby Federal funds to social security of amountsequal to these additional taxes. Additionally,in 1983 the OASI fund borrowed from theDI and HI funds (the tables show the amountsof such borrowing and repayments of borrow-ing). The large intragovernmental collectionsby OASDHI in 1983 are a result of thetransactions described under (a) and (b) above.Also starting in 1983, OASI began payinginterest to DI and HI to reimburse themfor the balances OASI borrowed from them;OASDHI paid interest to Treasury to com-pensate it for the balances transferred tothese funds on the first day of each month.The legal requirement for Treasury to makepayments on the first day of the month,and the associated interest payment, endedin 1985 for HI and in 1991 for OASIand DI.
Notes on Section 14 (Federal SectorTransactions in the National Incomeand Product Accounts)
The principal system used in the UnitedStates for measuring total economic activityis the system of national income and productaccounts (NIPA), which provide calculationsof the GDP and related data series. Thesedata are produced by the Bureau of EconomicAnalysis (BEA) of the Department of Com-merce. As part of this work the BEA staffanalyze the budget data base and estimatetransactions consistent with this measurementsystem. The NIPA data are normally producedfor calendar years and quarters. Section 14provides Federal Sector NIPA data on afiscal year basis.
Notes on Section 15 (Total (Federal andState and Local) Government Finances)
Section 15 provides a perspective on thesize and composition of total Government(Federal, State, and local) receipts and spend-ing. Both the Bureau of the Census andthe Bureau of Economic Analysis in theCommerce Department provide information(in the national income and product accounts(NIPA) data) on income and spending for
all levels of government in the United States.These tables include the NIPA State andlocal transactions with the Federal Govern-ment (deducting the amount of overlap dueto Federal grants to State and local govern-ments) to measure total Government receiptsand spending on a fiscal year basis.
Notes on Section 16 (Federal HealthSpending)
Section 16 consists of Table 16.1, TotalOutlays for Health Programs. This tableshows a broad definition of total Federalhealth spending by type of health program,including defense and veterans health pro-grams, medicare, medicaid, Federal employees’health benefits and other health spending.It also shows Federal health spending aspercentages of total outlays and of GDP.
Notes on Section 17 (FederalEmployment)
Section 17 provides an overview of thesize and scope of the Federal work force.The measures of Federal employment cur-rently in use are end-strength and full-time equivalents (FTEs). End-strength is themeasure of total positions filled at the endof the fiscal year, representing a ‘‘head count’’of all paid employees.
Federal employment in the ExecutiveBranch, however, is controlled on the basisof FTEs. Full-time equivalent (FTE) employ-ment is the measure of the total numberof regular (non-overtime) hours worked byan employee divided by the number of compen-sable hours applicable to each fiscal year.A typical FTE workyear is equal to 2,080hours. Put simply, one full-time employeecounts as one FTE, and two employees whowork half-time count as one FTE. FTE datahave been collected for Executive Branchagencies since 1981.
The tables included in this section illustratethe size of the governmental work forcesutilizing these measures. Table 17.1 showsthe end-strength of the Executive Branchand selected agencies starting in 1940. Table17.2 shows the end-strength of the ExecutiveBranch and selected agencies as a percentageof total Executive Branch employment starting
13THE BUDGET FOR FISCAL YEAR 2000, HISTORICAL TABLES
in 1940. Table 17.3 shows FTEs for theExecutive Branch and selected agencies for1981 and subsequent years; Table 17.4 showsthese FTEs as a percentage of total ExecutiveBranch FTEs. Table 17.5 shows a comparison
of the end-strengths of Federal employmentand State and local government employment,and the total of the two as a percentageof the U.S. population in each year.
15
HISTORICAL TRENDS
Because the Historical Tables publicationprovides a large volume and wide arrayof data on Federal Government finances,it is sometimes difficult to perceive the longerterm patterns in various budget aggregatesand components. To assist the reader inunderstanding some of these longer termpatterns, this section provides a short sum-mary of the trends in Federal deficits andsurpluses, debt, receipts, outlays and employ-ment.
Deficits and Debt.—As shown in Table1.1, except for periods of war (when spendingfor defense increased sharply), depressionsor other economic downturns (when receiptsfell precipitously), the Federal budget wasgenerally in surplus throughout most of theNation’s first 200 years. For our first 60years as a Nation (through 1849), cumulativebudget surpluses and deficits yielded a netsurplus of $70 million. The Civil War, alongwith the Spanish-American War and thedepression of the 1890s, resulted in a cumu-lative deficit totaling just under $1 billionduring the 1850–1900 period. Between 1901and 1916, the budget hovered very closeto balance every year. World War I broughtlarge deficits that totaled $23 billion overthe 1917–1919 period. The budget was thenin surplus throughout the 1920s. However,the combination of the Great Depressionfollowed by World War II resulted in along, unbroken string of deficits that werehistorically unprecedented in magnitude. Asa result, Federal debt held by the publicmushroomed from less than $3 billion in1917 to $16 billion in 1930 and then to$242 billion by 1946. In relation to thesize of the economy, debt held by the publicgrew from 15% of GDP in 1930 to 109%in 1946.
During much of the postwar period, thissame pattern persisted—large deficits wereincurred only in time of war (e.g., Koreaand Vietnam) or as a result of recessions.As shown in Table 1.2, prior to the 1980s,postwar deficits as a percent of GDP reachedtheir highest during the 1975–76 recession
at 4.3% in 1976. Debt held by the publichad grown to $477 billion by 1976, but,because the economy had grown faster, debtas a percent of GDP had declined throughoutthe postwar period to a low of 23.9% in1974, climbing back to 27.6% in 1976. Follow-ing five years of deficits averaging 2.5%of GDP between 1977-1981, debt held bythe public rose to 25.8% of GDP by 1981,only two percentage points higher than itspostwar low.
The traditional pattern of running largedeficits only in times of war or economicdownturns was broken during the rest ofthe 1980s. In 1982, large tax cuts wereenacted as were substantial increases indefense spending. Reductions in nondefensespending were not sufficient to offset theimpact on the deficit. As a result, deficitsaveraging $207 billion were incurred between1983 and 1992. As a result of these unprece-dented peacetime deficits, debt held by thepublic grew from $785 billion in 1981 to$3.0 trillion (48.8% of GDP) in 1992.
Since peaking at $290 billion in 1992,deficits have declined each year, droppingto a level of $22 billion in 1997. For 1998,the Nation recorded its first budget surplus($69.2 billion) since 1969. As a percent ofGDP, the budget bottom line went froma deficit of 4.7% in 1992 to a surplusof 0.8% in 1998. Debt held by the public,which peaked at 50.2% of GDP in 1993,has fallen to ??,?% in 1998.
Receipts.— From the beginning of the Re-public until the start of the Civil War,our Nation relied on customs duties to financethe activities of the Federal Government.During the 19th Century, sales of publiclands supplemented customs duties. Whilelarge amounts were occasionally obtained fromthe sale of lands, customs duties accountedfor over 90% of Federal receipts in mostyears prior to the Civil War. Excise taxesbecame an important and growing sourceof Federal receipts starting in the 1860s.Estate and gift taxes were levied and collectedsporadically from the 1860s through World
16 THE BUDGET FOR FISCAL YEAR 2000, HISTORICAL TABLES
War I, although never amounting to a signifi-cant source of receipts during that time.Prior to 1913, income taxes did not existor were inconsequential, other than for abrief time during the Civil War period, whenspecial tax legislation raised the income taxshare of Federal receipts to as much as13% in 1866. Subsequent to the enactmentof income tax legislation in 1913, thesetaxes grew in importance as a Federal receiptssource during following decade. By 1930,the Federal Government was relying on in-come taxes for 60% of its receipts, whilecustoms duties and excise taxes each ac-counted for 15% of the receipts total.
During the 1930s, total Federal receiptsaveraged about 5% of GDP. World WarII brought a dramatic increase in receipts,with the Federal receipts share of GDPpeaking at 20.9% in 1944. The share declinedsomewhat after the war and has remainedfairly steady since the early 1950s, fluctuatingwithin a range of 16–21% of GDP, andare currently at 20.5% of GDP. Despitestaying within this 5% range during thepostwar period, there have been some signifi-cant shifts over time in the underlying sourcesor composition of receipts.
The increase in taxes needed to supportthe war effort in the 1940s saw the incometax rise to prominence as a source of Federalreceipts, reaching nearly 80% of total receiptsin 1944. After the war, the income taxshare of total receipts fell from a postwarhigh of 74% in 1952 to 64% in the late1960s. The growth in social insurance taxes(such as social security and medicare) morethan offset a postwar secular decline inexcise and other non-income tax shares. Thecombination of substantial reductions in in-come taxes enacted in the early 1980s andthe continued growth in social insurancetaxes has resulted in a continued declinein the income tax share of total receipts.By 1983 income taxes had dropped to 54%of total receipts and have remained between53% and 58% since then.
Corporation income taxes accounted for alarge part of this postwar decline, fallingfrom 30% of total Federal receipts in theearly 1950s to 20% in 1969. During thesame period, pretax corporate profits fell
from about 12% of GDP in the early 1950sto 10% in 1968. By 1980 the corporationincome tax share of total receipts had droppedto 12.5%. During the 1980s, pretax corporateprofits declined as a percent of GDP and,thus, the corporation income tax share droppedto as low as 6.2% in 1983, but eventuallyclimbed back to 11.8% in 1996 and havedropped slightly, to 11.0% in 1998, but arestill below the 1980 share. This sharp dropin corporation income tax share of totalreceipts was more than offset by the growthin social insurance taxes, as both tax ratesand percentage of the workforce covered bythese taxes increased. Social insurance taxesincreased from only 8% of total receiptsduring the mid-1940s to 38% by 1992, anddeclining to 33% by 1998. Excise taxes havealso declined in relative importance duringthe postwar period, falling from a 19% sharein 1950 to slightly under 4% currently.
Outlays and Federal employment.—Through-out most of the Nation’s history prior tothe 1930s, the bulk of Federal spendingwent towards national defense, veterans bene-fits and interest on the public debt. In1929, for example, 71% of Federal outlayswere in these three categories. The 1930sbegan with Federal outlays comprising just3.3% of GDP. As shown in Table 1.2, theefforts to fight the Great Depression withpublic works and other nondefense Federalspending, when combined with the depressedGDP levels, caused outlays and their shareof GDP to increase steadily during mostof that decade, with outlays rising to 10.3%of GDP by 1939 and to 12.0% by 1941on the eve of U.S. involvement in WorldWar II. Defense spending during World WarII resulted in outlays as a percent of GDPrising sharply, to a peak of 43.7% in 1944.The end of the war brought total spendingdown to 14.3% of GDP by 1949. Then theKorean war increased spending to an average19.5% of GDP for a few years in the early1950s, but outlays as a percent of GDPthen stabilized at around 17–19% until U.S.involvement in the Vietnam war escalatedsharply in the middle 1960s and early 1970s.From 1967 through 1972, Federal outlaysaveraged 19.6% of GDP. The decline indefense spending as a percent of GDP thatbegan in 1971, as the Vietnam War began
17THE BUDGET FOR FISCAL YEAR 2000, HISTORICAL TABLES
to wind down, was more than offset byincreased spending on human resources pro-grams during the 1970s—due to the matura-tion of the social security program and otherlongstanding income support programs, aswell as a takeoff in spending on the recentlyenacted Great Society programs, such asmedicare and medicaid—so that total spendingincreased as a percent of GDP, averaging20.9% during the last half of that decade.Also contributing to the increase in Federalspending was a substantial increase through-out the 1970s in grants to State and localgovernments. Since receipts were averaging18% of GDP during the decade, chronicdeficits averaging 2% of GDP were incurred(contributing to this was the recession of1975–76, which saw deficits increase to 4.3%in 1976).
The 1980s began with substantial momen-tum in the growth of Federal nondefensespending in the areas of human resources,grants to State and local governments, and,as a result of the deficits incurred throughoutthe 1970s, interest on the public debt. Inthe early 1980s, a combination of substantiallyincreased defense spending, continued growthin human resource spending, a tax cut anda recession caused the deficits to soar, which,in turn, sharply increased spending for inter-est on the public debt. Federal spendingclimbed to an average of nearly 23% ofGDP during the 1981-1985 period. Partialreversals of the tax cut and rapid defensebuildup, along with a strong economy duringthe second half of the decade, brought Federalspending back down to 21.4% of GDP by1989. In the early 1990s, another recession,in the face of continued rapid growth inFederal health care spending and additionalspending necessitated by the Savings andLoan crisis, caused outlays to average over22.5% of GDP in 1991 and 1992. Duringthe past six years, this outlay growth trendwas reversed. Outlays have begun to fallas a percent of GDP, dropping to 19.7%by 1998. This level was last experiencedin the early 1970s.
Despite the growth in total Federal spendingas a percent of GDP in the postwar period,Federal employment, as shown in Table 17.1,has remained roughly constant, ranging from1.8 to 2.3 million civilian employees (excluding
the Postal Service) throughout this period.The composition of employment has shifteddramatically between defense and civilianagencies over the last 35 years. In 1951,for example, of the 2.0 million employees,1.2 million worked for the Department ofDefense and 0.7 million worked for civilianagencies. By 1974, Federal employment wassplit equally between defense and civilianagencies, with each accounting for 1.07 millionemployees. After a buildup in defense civilianemployment in the 1980s, the shift awayfrom defense to civilian agency employmentresumed in the 1990s, so that by 1997civilian agency employment was 1.16 millionand Department of Defense employment was0.69 million, nearly the reverse of the propor-tions in 1951. During the past several yearstotal Federal employment has begun to de-cline. Since 1992, when there were over2.2 million civilians employed by the FederalGovernment, reductions of nearly 400 thou-sand employees have been achieved, bringingFederal employment down to less than 1.9million in 1998.
Although total spending has increased sub-stantially as a percent of GDP since the1950s, the growth in the various componentsof spending has not been even and, thus,the composition of spending has changedsignificantly during the same period.
Discretionary spending totaled 12.7% ofGDP in 1962, with three-fourths going todefense. Defense spending increased duringthe Vietnam War buildup in the late 1960scausing total discretionary outlays to riseto 13.6% of GDP by 1968, after whicha secular decline began. By the middle 1970s,this category had dropped to 10% of GDP.It fluctuated between 91⁄2–101⁄2% of GDPuntil the late 1980’s, when the defense buildupthat started early in that decade ended.Total discretionary spending has fallen moresharply over the past ten years, from 9.4%in 1988 to 6.6% in 1998. Although totaldiscretionary spending has followed a pathof secular decline over the past 25 years,its major components—defense and non-defense—have experienced contrasting his-tories.
Defense discretionary spending was at 9.3%of GDP in 1962. As shown in Table 8.4,
18 THE BUDGET FOR FISCAL YEAR 2000, HISTORICAL TABLES
spending in this category had declined to7.4% of GDP by 1965, then increased asa result of the Vietnam War. After peakingat 9.5% of GDP in 1968, it returned tothe 1965 level by 1971. The decline continuedthroughout the 1970s, hitting a low pointin this decade of 4.7% of GDP in 1979.The defense buildup starting in the early1980s boosted its percentage of GDP backto 6.3% by 1986, after which it again begana gradual decline throughout the rest ofthat decade. By 1998, defense discretionaryspending stood at 3.2% of GDP, reflectingthe impact of the end of the Cold Waron our Nation’s defense requirements andthe significant economic growth during muchof the 1990s.
Nondefense discretionary spending as apercent of GDP has followed a much differentpath. In 1962, it stood at 3.4% of GDP.During the next few years it quickly increased,reaching 4.2% of GDP by 1967. It droppedslightly after that year, but still averagedabout 4.0% of GDP until 1975, when itsurged to 4.5% of GDP due to the recessionand, in part, to growth in spending onenergy and the environment, housing andother income support programs. Much ofthis growth was in the form of Federalgrants to State and local governments. Addi-tional grant spending arose from the creationof General Revenue Sharing in 1972 andvarious anti-recession grants at the end ofthe decade. Nondefense discretionary outlayspeaked as a percent of GDP during therecession in 1980 at 5.2%. They declinedsharply as a percent of GDP starting in1982, falling to 4.0% by 1985 and to 3.5%during the 1987–1990 period. Spending forthese programs has increased slightly since1990, climbing to 3.8% by 1992 before fallingback to 3.4% in 1998.
Programmatic mandatory spending (whichexcludes net interest and undistributed offset-ting receipts) accounts for a large part ofthe growth in total Federal spending asa percent of GDP since the 1950s. Majorprograms in this category include social secu-rity, medicare, deposit insurance and means-tested entitlements (medicaid, aid to depend-ent children, food stamps and other programssubject to an income test). Prior to thestart of medicare and medicaid in 1966,
this category averaged 5.7% of GDP between1962 and 1965 (less than half the sizeof total discretionary spending), with socialsecurity accounting for nearly half. Withina decade, this category was comparable insize to total discretionary spending, nearlydoubling as a percent of GDP to 10.6%by 1976 (1.1% of which was for unemploymentcompensation that year).
Although part of this growth representedthe impact of the 1975–76 recession on GDPlevels and outlays for unemployment com-pensation, the largest part was due to growthin social security, medicare and medicaid.These three programs totaled 3.4% of GDPin 1968 and grew rapidly to 5.6% of GDPby 1976. While social security stabilized asa percent of GDP during 1985–1997, rangingfrom 4.3% to 4.7%, the growth in otherprogrammatic mandatory spending has contin-ued to outpace the growth in GDP sincethe mid-1970s (apart from the recessionaryperiods) due largely to medicare and medicaid.These two programs, which were 1.4% ofGDP in 1976, have more than doubled asa percent of GDP since then, reaching 3.5%in 1998. Excluding medicaid, spending formeans-tested entitlements in 1998 was at1.2% percent of GDP, less than it wastwenty years ago in 1976. By way of contrast,the remaining programmatic mandatoryspending— i.e, excluding medicare, unemploy-ment compensation, social security, depositinsurance and means-tested entitlements—has been halved as a percent of GDP, fallingfrom 2.8% in 1976 to 1.4% of GDP in1998. (Major programs in this grouping includeFederal employee and railroad retirement,veterans’ benefits other than veterans’ pen-sions, and farm price supports.) Nevertheless,total programmatic mandatory spending in1998 had reached 10.7% of GDP comparedto 6.9% for total discretionary spending.
Additional perspectives on spending trendsavailable in this document include spendingby agency, by function and subfunction andby composition of outlays categories, whichinclude payments for individuals and grantsto State and local governments.
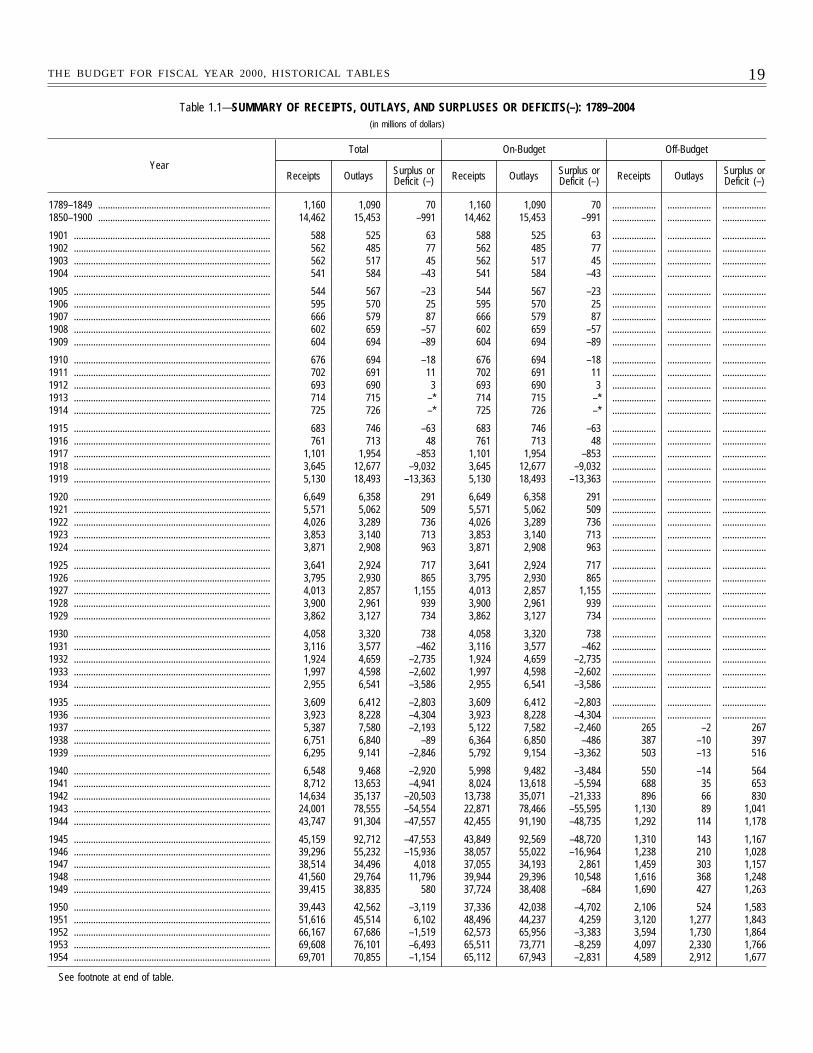
19THE BUDGET FOR FISCAL YEAR 2000, HISTORICAL TABLES
Table 1.1—SUMMARY OF RECEIPTS, OUTLAYS, AND SURPLUSES OR DEFICITS(–): 1789–2004(in millions of dollars)
Year
Total On-Budget Off-Budget
Receipts Outlays Surplus orDeficit (–) Receipts Outlays Surplus or
Deficit (–) Receipts Outlays Surplus orDeficit (–)
1789–1849 ....................................................................... 1,160 1,090 70 1,160 1,090 70 .................. .................. ..................1850–1900 ....................................................................... 14,462 15,453 –991 14,462 15,453 –991 .................. .................. ..................
1901 ................................................................................. 588 525 63 588 525 63 .................. .................. ..................1902 ................................................................................. 562 485 77 562 485 77 .................. .................. ..................1903 ................................................................................. 562 517 45 562 517 45 .................. .................. ..................1904 ................................................................................. 541 584 –43 541 584 –43 .................. .................. ..................
1905 ................................................................................. 544 567 –23 544 567 –23 .................. .................. ..................1906 ................................................................................. 595 570 25 595 570 25 .................. .................. ..................1907 ................................................................................. 666 579 87 666 579 87 .................. .................. ..................1908 ................................................................................. 602 659 –57 602 659 –57 .................. .................. ..................1909 ................................................................................. 604 694 –89 604 694 –89 .................. .................. ..................
1910 ................................................................................. 676 694 –18 676 694 –18 .................. .................. ..................1911 ................................................................................. 702 691 11 702 691 11 .................. .................. ..................1912 ................................................................................. 693 690 3 693 690 3 .................. .................. ..................1913 ................................................................................. 714 715 –* 714 715 –* .................. .................. ..................1914 ................................................................................. 725 726 –* 725 726 –* .................. .................. ..................
1915 ................................................................................. 683 746 –63 683 746 –63 .................. .................. ..................1916 ................................................................................. 761 713 48 761 713 48 .................. .................. ..................1917 ................................................................................. 1,101 1,954 –853 1,101 1,954 –853 .................. .................. ..................1918 ................................................................................. 3,645 12,677 –9,032 3,645 12,677 –9,032 .................. .................. ..................1919 ................................................................................. 5,130 18,493 –13,363 5,130 18,493 –13,363 .................. .................. ..................
1920 ................................................................................. 6,649 6,358 291 6,649 6,358 291 .................. .................. ..................1921 ................................................................................. 5,571 5,062 509 5,571 5,062 509 .................. .................. ..................1922 ................................................................................. 4,026 3,289 736 4,026 3,289 736 .................. .................. ..................1923 ................................................................................. 3,853 3,140 713 3,853 3,140 713 .................. .................. ..................1924 ................................................................................. 3,871 2,908 963 3,871 2,908 963 .................. .................. ..................
1925 ................................................................................. 3,641 2,924 717 3,641 2,924 717 .................. .................. ..................1926 ................................................................................. 3,795 2,930 865 3,795 2,930 865 .................. .................. ..................1927 ................................................................................. 4,013 2,857 1,155 4,013 2,857 1,155 .................. .................. ..................1928 ................................................................................. 3,900 2,961 939 3,900 2,961 939 .................. .................. ..................1929 ................................................................................. 3,862 3,127 734 3,862 3,127 734 .................. .................. ..................
1930 ................................................................................. 4,058 3,320 738 4,058 3,320 738 .................. .................. ..................1931 ................................................................................. 3,116 3,577 –462 3,116 3,577 –462 .................. .................. ..................1932 ................................................................................. 1,924 4,659 –2,735 1,924 4,659 –2,735 .................. .................. ..................1933 ................................................................................. 1,997 4,598 –2,602 1,997 4,598 –2,602 .................. .................. ..................1934 ................................................................................. 2,955 6,541 –3,586 2,955 6,541 –3,586 .................. .................. ..................
1935 ................................................................................. 3,609 6,412 –2,803 3,609 6,412 –2,803 .................. .................. ..................1936 ................................................................................. 3,923 8,228 –4,304 3,923 8,228 –4,304 .................. .................. ..................1937 ................................................................................. 5,387 7,580 –2,193 5,122 7,582 –2,460 265 –2 2671938 ................................................................................. 6,751 6,840 –89 6,364 6,850 –486 387 –10 3971939 ................................................................................. 6,295 9,141 –2,846 5,792 9,154 –3,362 503 –13 516
1940 ................................................................................. 6,548 9,468 –2,920 5,998 9,482 –3,484 550 –14 5641941 ................................................................................. 8,712 13,653 –4,941 8,024 13,618 –5,594 688 35 6531942 ................................................................................. 14,634 35,137 –20,503 13,738 35,071 –21,333 896 66 8301943 ................................................................................. 24,001 78,555 –54,554 22,871 78,466 –55,595 1,130 89 1,0411944 ................................................................................. 43,747 91,304 –47,557 42,455 91,190 –48,735 1,292 114 1,178
1945 ................................................................................. 45,159 92,712 –47,553 43,849 92,569 –48,720 1,310 143 1,1671946 ................................................................................. 39,296 55,232 –15,936 38,057 55,022 –16,964 1,238 210 1,0281947 ................................................................................. 38,514 34,496 4,018 37,055 34,193 2,861 1,459 303 1,1571948 ................................................................................. 41,560 29,764 11,796 39,944 29,396 10,548 1,616 368 1,2481949 ................................................................................. 39,415 38,835 580 37,724 38,408 –684 1,690 427 1,263
1950 ................................................................................. 39,443 42,562 –3,119 37,336 42,038 –4,702 2,106 524 1,5831951 ................................................................................. 51,616 45,514 6,102 48,496 44,237 4,259 3,120 1,277 1,8431952 ................................................................................. 66,167 67,686 –1,519 62,573 65,956 –3,383 3,594 1,730 1,8641953 ................................................................................. 69,608 76,101 –6,493 65,511 73,771 –8,259 4,097 2,330 1,7661954 ................................................................................. 69,701 70,855 –1,154 65,112 67,943 –2,831 4,589 2,912 1,677
See footnote at end of table.
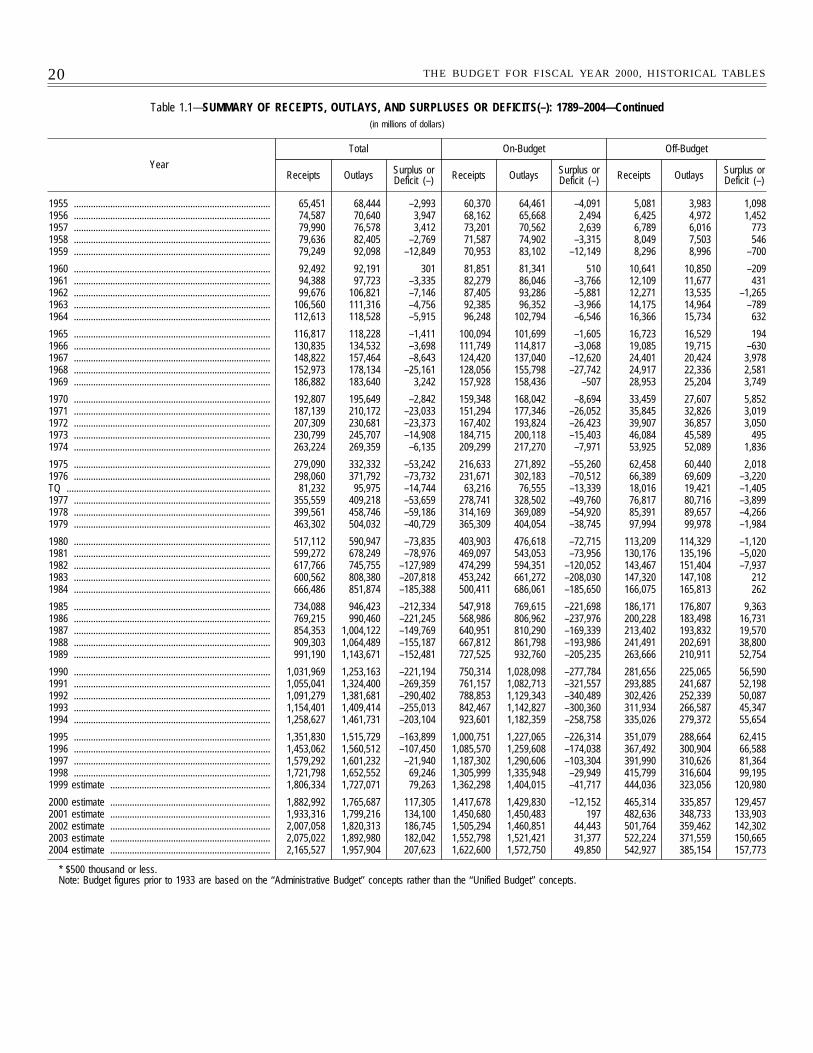
20 THE BUDGET FOR FISCAL YEAR 2000, HISTORICAL TABLES
Table 1.1—SUMMARY OF RECEIPTS, OUTLAYS, AND SURPLUSES OR DEFICITS(–): 1789–2004—Continued(in millions of dollars)
Year
Total On-Budget Off-Budget
Receipts Outlays Surplus orDeficit (–) Receipts Outlays Surplus or
Deficit (–) Receipts Outlays Surplus orDeficit (–)
1955 ................................................................................. 65,451 68,444 –2,993 60,370 64,461 –4,091 5,081 3,983 1,0981956 ................................................................................. 74,587 70,640 3,947 68,162 65,668 2,494 6,425 4,972 1,4521957 ................................................................................. 79,990 76,578 3,412 73,201 70,562 2,639 6,789 6,016 7731958 ................................................................................. 79,636 82,405 –2,769 71,587 74,902 –3,315 8,049 7,503 5461959 ................................................................................. 79,249 92,098 –12,849 70,953 83,102 –12,149 8,296 8,996 –700
1960 ................................................................................. 92,492 92,191 301 81,851 81,341 510 10,641 10,850 –2091961 ................................................................................. 94,388 97,723 –3,335 82,279 86,046 –3,766 12,109 11,677 4311962 ................................................................................. 99,676 106,821 –7,146 87,405 93,286 –5,881 12,271 13,535 –1,2651963 ................................................................................. 106,560 111,316 –4,756 92,385 96,352 –3,966 14,175 14,964 –7891964 ................................................................................. 112,613 118,528 –5,915 96,248 102,794 –6,546 16,366 15,734 632
1965 ................................................................................. 116,817 118,228 –1,411 100,094 101,699 –1,605 16,723 16,529 1941966 ................................................................................. 130,835 134,532 –3,698 111,749 114,817 –3,068 19,085 19,715 –6301967 ................................................................................. 148,822 157,464 –8,643 124,420 137,040 –12,620 24,401 20,424 3,9781968 ................................................................................. 152,973 178,134 –25,161 128,056 155,798 –27,742 24,917 22,336 2,5811969 ................................................................................. 186,882 183,640 3,242 157,928 158,436 –507 28,953 25,204 3,749
1970 ................................................................................. 192,807 195,649 –2,842 159,348 168,042 –8,694 33,459 27,607 5,8521971 ................................................................................. 187,139 210,172 –23,033 151,294 177,346 –26,052 35,845 32,826 3,0191972 ................................................................................. 207,309 230,681 –23,373 167,402 193,824 –26,423 39,907 36,857 3,0501973 ................................................................................. 230,799 245,707 –14,908 184,715 200,118 –15,403 46,084 45,589 4951974 ................................................................................. 263,224 269,359 –6,135 209,299 217,270 –7,971 53,925 52,089 1,836
1975 ................................................................................. 279,090 332,332 –53,242 216,633 271,892 –55,260 62,458 60,440 2,0181976 ................................................................................. 298,060 371,792 –73,732 231,671 302,183 –70,512 66,389 69,609 –3,220TQ .................................................................................... 81,232 95,975 –14,744 63,216 76,555 –13,339 18,016 19,421 –1,4051977 ................................................................................. 355,559 409,218 –53,659 278,741 328,502 –49,760 76,817 80,716 –3,8991978 ................................................................................. 399,561 458,746 –59,186 314,169 369,089 –54,920 85,391 89,657 –4,2661979 ................................................................................. 463,302 504,032 –40,729 365,309 404,054 –38,745 97,994 99,978 –1,984
1980 ................................................................................. 517,112 590,947 –73,835 403,903 476,618 –72,715 113,209 114,329 –1,1201981 ................................................................................. 599,272 678,249 –78,976 469,097 543,053 –73,956 130,176 135,196 –5,0201982 ................................................................................. 617,766 745,755 –127,989 474,299 594,351 –120,052 143,467 151,404 –7,9371983 ................................................................................. 600,562 808,380 –207,818 453,242 661,272 –208,030 147,320 147,108 2121984 ................................................................................. 666,486 851,874 –185,388 500,411 686,061 –185,650 166,075 165,813 262
1985 ................................................................................. 734,088 946,423 –212,334 547,918 769,615 –221,698 186,171 176,807 9,3631986 ................................................................................. 769,215 990,460 –221,245 568,986 806,962 –237,976 200,228 183,498 16,7311987 ................................................................................. 854,353 1,004,122 –149,769 640,951 810,290 –169,339 213,402 193,832 19,5701988 ................................................................................. 909,303 1,064,489 –155,187 667,812 861,798 –193,986 241,491 202,691 38,8001989 ................................................................................. 991,190 1,143,671 –152,481 727,525 932,760 –205,235 263,666 210,911 52,754
1990 ................................................................................. 1,031,969 1,253,163 –221,194 750,314 1,028,098 –277,784 281,656 225,065 56,5901991 ................................................................................. 1,055,041 1,324,400 –269,359 761,157 1,082,713 –321,557 293,885 241,687 52,1981992 ................................................................................. 1,091,279 1,381,681 –290,402 788,853 1,129,343 –340,489 302,426 252,339 50,0871993 ................................................................................. 1,154,401 1,409,414 –255,013 842,467 1,142,827 –300,360 311,934 266,587 45,3471994 ................................................................................. 1,258,627 1,461,731 –203,104 923,601 1,182,359 –258,758 335,026 279,372 55,654
1995 ................................................................................. 1,351,830 1,515,729 –163,899 1,000,751 1,227,065 –226,314 351,079 288,664 62,4151996 ................................................................................. 1,453,062 1,560,512 –107,450 1,085,570 1,259,608 –174,038 367,492 300,904 66,5881997 ................................................................................. 1,579,292 1,601,232 –21,940 1,187,302 1,290,606 –103,304 391,990 310,626 81,3641998 ................................................................................. 1,721,798 1,652,552 69,246 1,305,999 1,335,948 –29,949 415,799 316,604 99,1951999 estimate .................................................................. 1,806,334 1,727,071 79,263 1,362,298 1,404,015 –41,717 444,036 323,056 120,980
2000 estimate .................................................................. 1,882,992 1,765,687 117,305 1,417,678 1,429,830 –12,152 465,314 335,857 129,4572001 estimate .................................................................. 1,933,316 1,799,216 134,100 1,450,680 1,450,483 197 482,636 348,733 133,9032002 estimate .................................................................. 2,007,058 1,820,313 186,745 1,505,294 1,460,851 44,443 501,764 359,462 142,3022003 estimate .................................................................. 2,075,022 1,892,980 182,042 1,552,798 1,521,421 31,377 522,224 371,559 150,6652004 estimate .................................................................. 2,165,527 1,957,904 207,623 1,622,600 1,572,750 49,850 542,927 385,154 157,773
* $500 thousand or less.Note: Budget figures prior to 1933 are based on the ‘‘Administrative Budget’’ concepts rather than the ‘‘Unified Budget’’ concepts.
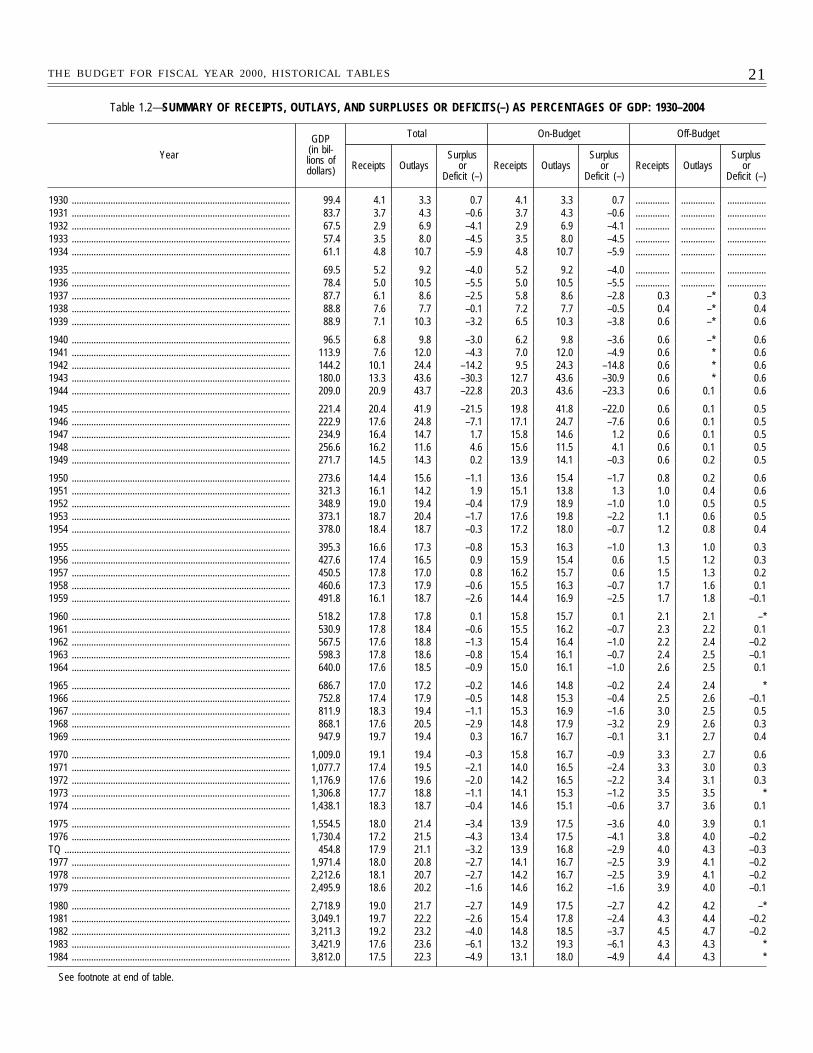
21THE BUDGET FOR FISCAL YEAR 2000, HISTORICAL TABLES
Table 1.2—SUMMARY OF RECEIPTS, OUTLAYS, AND SURPLUSES OR DEFICITS(–) AS PERCENTAGES OF GDP: 1930–2004
Year
GDP(in bil-lions ofdollars)
Total On-Budget Off-Budget
Receipts OutlaysSurplus
orDeficit (–)
Receipts OutlaysSurplus
orDeficit (–)
Receipts OutlaysSurplus
orDeficit (–)
1930 .......................................................................................... 99.4 4.1 3.3 0.7 4.1 3.3 0.7 .............. .............. ................1931 .......................................................................................... 83.7 3.7 4.3 –0.6 3.7 4.3 –0.6 .............. .............. ................1932 .......................................................................................... 67.5 2.9 6.9 –4.1 2.9 6.9 –4.1 .............. .............. ................1933 .......................................................................................... 57.4 3.5 8.0 –4.5 3.5 8.0 –4.5 .............. .............. ................1934 .......................................................................................... 61.1 4.8 10.7 –5.9 4.8 10.7 –5.9 .............. .............. ................
1935 .......................................................................................... 69.5 5.2 9.2 –4.0 5.2 9.2 –4.0 .............. .............. ................1936 .......................................................................................... 78.4 5.0 10.5 –5.5 5.0 10.5 –5.5 .............. .............. ................1937 .......................................................................................... 87.7 6.1 8.6 –2.5 5.8 8.6 –2.8 0.3 –* 0.31938 .......................................................................................... 88.8 7.6 7.7 –0.1 7.2 7.7 –0.5 0.4 –* 0.41939 .......................................................................................... 88.9 7.1 10.3 –3.2 6.5 10.3 –3.8 0.6 –* 0.6
1940 .......................................................................................... 96.5 6.8 9.8 –3.0 6.2 9.8 –3.6 0.6 –* 0.61941 .......................................................................................... 113.9 7.6 12.0 –4.3 7.0 12.0 –4.9 0.6 * 0.61942 .......................................................................................... 144.2 10.1 24.4 –14.2 9.5 24.3 –14.8 0.6 * 0.61943 .......................................................................................... 180.0 13.3 43.6 –30.3 12.7 43.6 –30.9 0.6 * 0.61944 .......................................................................................... 209.0 20.9 43.7 –22.8 20.3 43.6 –23.3 0.6 0.1 0.6
1945 .......................................................................................... 221.4 20.4 41.9 –21.5 19.8 41.8 –22.0 0.6 0.1 0.51946 .......................................................................................... 222.9 17.6 24.8 –7.1 17.1 24.7 –7.6 0.6 0.1 0.51947 .......................................................................................... 234.9 16.4 14.7 1.7 15.8 14.6 1.2 0.6 0.1 0.51948 .......................................................................................... 256.6 16.2 11.6 4.6 15.6 11.5 4.1 0.6 0.1 0.51949 .......................................................................................... 271.7 14.5 14.3 0.2 13.9 14.1 –0.3 0.6 0.2 0.5
1950 .......................................................................................... 273.6 14.4 15.6 –1.1 13.6 15.4 –1.7 0.8 0.2 0.61951 .......................................................................................... 321.3 16.1 14.2 1.9 15.1 13.8 1.3 1.0 0.4 0.61952 .......................................................................................... 348.9 19.0 19.4 –0.4 17.9 18.9 –1.0 1.0 0.5 0.51953 .......................................................................................... 373.1 18.7 20.4 –1.7 17.6 19.8 –2.2 1.1 0.6 0.51954 .......................................................................................... 378.0 18.4 18.7 –0.3 17.2 18.0 –0.7 1.2 0.8 0.4
1955 .......................................................................................... 395.3 16.6 17.3 –0.8 15.3 16.3 –1.0 1.3 1.0 0.31956 .......................................................................................... 427.6 17.4 16.5 0.9 15.9 15.4 0.6 1.5 1.2 0.31957 .......................................................................................... 450.5 17.8 17.0 0.8 16.2 15.7 0.6 1.5 1.3 0.21958 .......................................................................................... 460.6 17.3 17.9 –0.6 15.5 16.3 –0.7 1.7 1.6 0.11959 .......................................................................................... 491.8 16.1 18.7 –2.6 14.4 16.9 –2.5 1.7 1.8 –0.1
1960 .......................................................................................... 518.2 17.8 17.8 0.1 15.8 15.7 0.1 2.1 2.1 –*1961 .......................................................................................... 530.9 17.8 18.4 –0.6 15.5 16.2 –0.7 2.3 2.2 0.11962 .......................................................................................... 567.5 17.6 18.8 –1.3 15.4 16.4 –1.0 2.2 2.4 –0.21963 .......................................................................................... 598.3 17.8 18.6 –0.8 15.4 16.1 –0.7 2.4 2.5 –0.11964 .......................................................................................... 640.0 17.6 18.5 –0.9 15.0 16.1 –1.0 2.6 2.5 0.1
1965 .......................................................................................... 686.7 17.0 17.2 –0.2 14.6 14.8 –0.2 2.4 2.4 *1966 .......................................................................................... 752.8 17.4 17.9 –0.5 14.8 15.3 –0.4 2.5 2.6 –0.11967 .......................................................................................... 811.9 18.3 19.4 –1.1 15.3 16.9 –1.6 3.0 2.5 0.51968 .......................................................................................... 868.1 17.6 20.5 –2.9 14.8 17.9 –3.2 2.9 2.6 0.31969 .......................................................................................... 947.9 19.7 19.4 0.3 16.7 16.7 –0.1 3.1 2.7 0.4
1970 .......................................................................................... 1,009.0 19.1 19.4 –0.3 15.8 16.7 –0.9 3.3 2.7 0.61971 .......................................................................................... 1,077.7 17.4 19.5 –2.1 14.0 16.5 –2.4 3.3 3.0 0.31972 .......................................................................................... 1,176.9 17.6 19.6 –2.0 14.2 16.5 –2.2 3.4 3.1 0.31973 .......................................................................................... 1,306.8 17.7 18.8 –1.1 14.1 15.3 –1.2 3.5 3.5 *1974 .......................................................................................... 1,438.1 18.3 18.7 –0.4 14.6 15.1 –0.6 3.7 3.6 0.1
1975 .......................................................................................... 1,554.5 18.0 21.4 –3.4 13.9 17.5 –3.6 4.0 3.9 0.11976 .......................................................................................... 1,730.4 17.2 21.5 –4.3 13.4 17.5 –4.1 3.8 4.0 –0.2TQ ............................................................................................. 454.8 17.9 21.1 –3.2 13.9 16.8 –2.9 4.0 4.3 –0.31977 .......................................................................................... 1,971.4 18.0 20.8 –2.7 14.1 16.7 –2.5 3.9 4.1 –0.21978 .......................................................................................... 2,212.6 18.1 20.7 –2.7 14.2 16.7 –2.5 3.9 4.1 –0.21979 .......................................................................................... 2,495.9 18.6 20.2 –1.6 14.6 16.2 –1.6 3.9 4.0 –0.1
1980 .......................................................................................... 2,718.9 19.0 21.7 –2.7 14.9 17.5 –2.7 4.2 4.2 –*1981 .......................................................................................... 3,049.1 19.7 22.2 –2.6 15.4 17.8 –2.4 4.3 4.4 –0.21982 .......................................................................................... 3,211.3 19.2 23.2 –4.0 14.8 18.5 –3.7 4.5 4.7 –0.21983 .......................................................................................... 3,421.9 17.6 23.6 –6.1 13.2 19.3 –6.1 4.3 4.3 *1984 .......................................................................................... 3,812.0 17.5 22.3 –4.9 13.1 18.0 –4.9 4.4 4.3 *
See footnote at end of table.
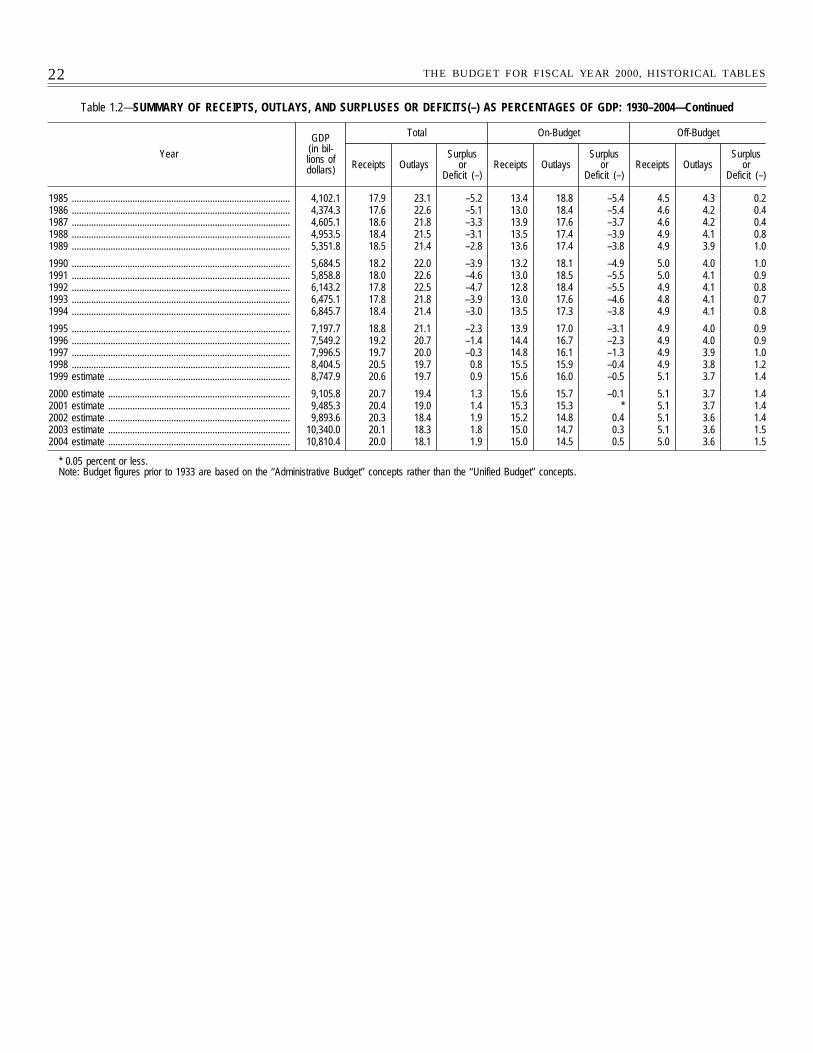
22 THE BUDGET FOR FISCAL YEAR 2000, HISTORICAL TABLES
Table 1.2—SUMMARY OF RECEIPTS, OUTLAYS, AND SURPLUSES OR DEFICITS(–) AS PERCENTAGES OF GDP: 1930–2004—Continued
Year
GDP(in bil-lions ofdollars)
Total On-Budget Off-Budget
Receipts OutlaysSurplus
orDeficit (–)
Receipts OutlaysSurplus
orDeficit (–)
Receipts OutlaysSurplus
orDeficit (–)
1985 .......................................................................................... 4,102.1 17.9 23.1 –5.2 13.4 18.8 –5.4 4.5 4.3 0.21986 .......................................................................................... 4,374.3 17.6 22.6 –5.1 13.0 18.4 –5.4 4.6 4.2 0.41987 .......................................................................................... 4,605.1 18.6 21.8 –3.3 13.9 17.6 –3.7 4.6 4.2 0.41988 .......................................................................................... 4,953.5 18.4 21.5 –3.1 13.5 17.4 –3.9 4.9 4.1 0.81989 .......................................................................................... 5,351.8 18.5 21.4 –2.8 13.6 17.4 –3.8 4.9 3.9 1.0
1990 .......................................................................................... 5,684.5 18.2 22.0 –3.9 13.2 18.1 –4.9 5.0 4.0 1.01991 .......................................................................................... 5,858.8 18.0 22.6 –4.6 13.0 18.5 –5.5 5.0 4.1 0.91992 .......................................................................................... 6,143.2 17.8 22.5 –4.7 12.8 18.4 –5.5 4.9 4.1 0.81993 .......................................................................................... 6,475.1 17.8 21.8 –3.9 13.0 17.6 –4.6 4.8 4.1 0.71994 .......................................................................................... 6,845.7 18.4 21.4 –3.0 13.5 17.3 –3.8 4.9 4.1 0.8
1995 .......................................................................................... 7,197.7 18.8 21.1 –2.3 13.9 17.0 –3.1 4.9 4.0 0.91996 .......................................................................................... 7,549.2 19.2 20.7 –1.4 14.4 16.7 –2.3 4.9 4.0 0.91997 .......................................................................................... 7,996.5 19.7 20.0 –0.3 14.8 16.1 –1.3 4.9 3.9 1.01998 .......................................................................................... 8,404.5 20.5 19.7 0.8 15.5 15.9 –0.4 4.9 3.8 1.21999 estimate ........................................................................... 8,747.9 20.6 19.7 0.9 15.6 16.0 –0.5 5.1 3.7 1.4
2000 estimate ........................................................................... 9,105.8 20.7 19.4 1.3 15.6 15.7 –0.1 5.1 3.7 1.42001 estimate ........................................................................... 9,485.3 20.4 19.0 1.4 15.3 15.3 * 5.1 3.7 1.42002 estimate ........................................................................... 9,893.6 20.3 18.4 1.9 15.2 14.8 0.4 5.1 3.6 1.42003 estimate ........................................................................... 10,340.0 20.1 18.3 1.8 15.0 14.7 0.3 5.1 3.6 1.52004 estimate ........................................................................... 10,810.4 20.0 18.1 1.9 15.0 14.5 0.5 5.0 3.6 1.5
* 0.05 percent or less.Note: Budget figures prior to 1933 are based on the ‘‘Administrative Budget’’ concepts rather than the ‘‘Unified Budget’’ concepts.
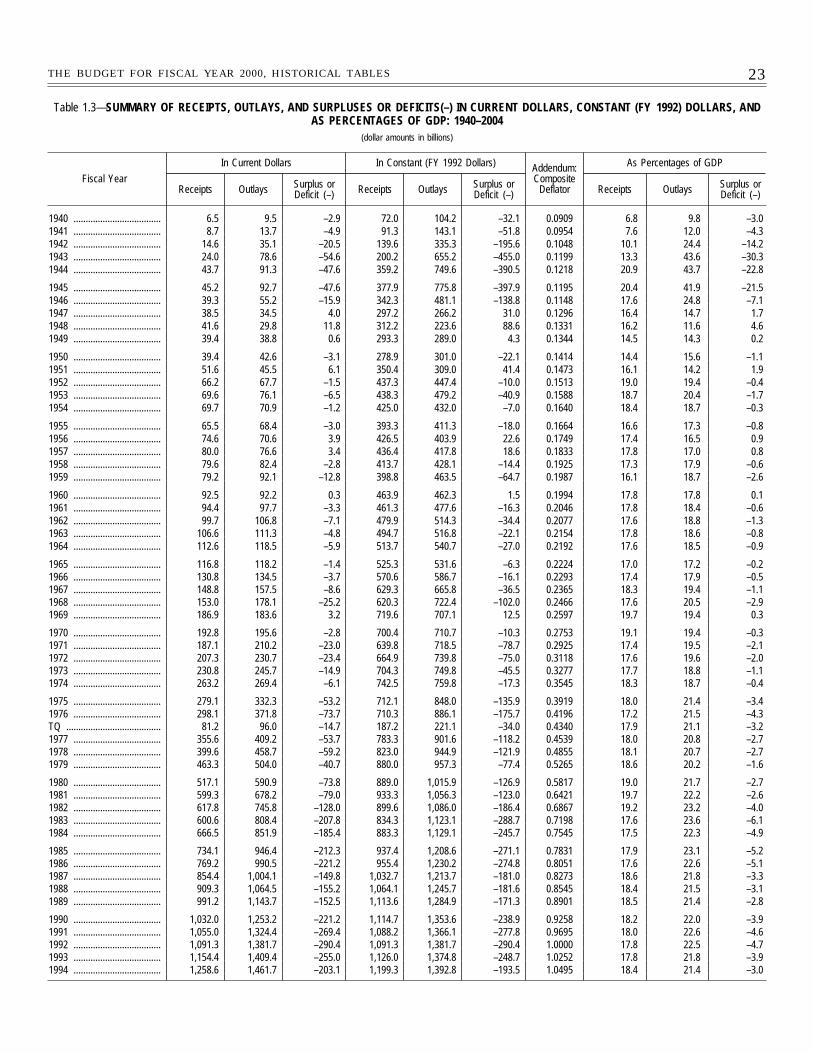
23THE BUDGET FOR FISCAL YEAR 2000, HISTORICAL TABLES
Table 1.3—SUMMARY OF RECEIPTS, OUTLAYS, AND SURPLUSES OR DEFICITS(–) IN CURRENT DOLLARS, CONSTANT (FY 1992) DOLLARS, ANDAS PERCENTAGES OF GDP: 1940–2004
(dollar amounts in billions)
Fiscal Year
In Current Dollars In Constant (FY 1992 Dollars) Addendum:Composite
Deflator
As Percentages of GDP
Receipts Outlays Surplus orDeficit (–) Receipts Outlays Surplus or
Deficit (–) Receipts Outlays Surplus orDeficit (–)
1940 .................................... 6.5 9.5 –2.9 72.0 104.2 –32.1 0.0909 6.8 9.8 –3.01941 .................................... 8.7 13.7 –4.9 91.3 143.1 –51.8 0.0954 7.6 12.0 –4.31942 .................................... 14.6 35.1 –20.5 139.6 335.3 –195.6 0.1048 10.1 24.4 –14.21943 .................................... 24.0 78.6 –54.6 200.2 655.2 –455.0 0.1199 13.3 43.6 –30.31944 .................................... 43.7 91.3 –47.6 359.2 749.6 –390.5 0.1218 20.9 43.7 –22.8
1945 .................................... 45.2 92.7 –47.6 377.9 775.8 –397.9 0.1195 20.4 41.9 –21.51946 .................................... 39.3 55.2 –15.9 342.3 481.1 –138.8 0.1148 17.6 24.8 –7.11947 .................................... 38.5 34.5 4.0 297.2 266.2 31.0 0.1296 16.4 14.7 1.71948 .................................... 41.6 29.8 11.8 312.2 223.6 88.6 0.1331 16.2 11.6 4.61949 .................................... 39.4 38.8 0.6 293.3 289.0 4.3 0.1344 14.5 14.3 0.2
1950 .................................... 39.4 42.6 –3.1 278.9 301.0 –22.1 0.1414 14.4 15.6 –1.11951 .................................... 51.6 45.5 6.1 350.4 309.0 41.4 0.1473 16.1 14.2 1.91952 .................................... 66.2 67.7 –1.5 437.3 447.4 –10.0 0.1513 19.0 19.4 –0.41953 .................................... 69.6 76.1 –6.5 438.3 479.2 –40.9 0.1588 18.7 20.4 –1.71954 .................................... 69.7 70.9 –1.2 425.0 432.0 –7.0 0.1640 18.4 18.7 –0.3
1955 .................................... 65.5 68.4 –3.0 393.3 411.3 –18.0 0.1664 16.6 17.3 –0.81956 .................................... 74.6 70.6 3.9 426.5 403.9 22.6 0.1749 17.4 16.5 0.91957 .................................... 80.0 76.6 3.4 436.4 417.8 18.6 0.1833 17.8 17.0 0.81958 .................................... 79.6 82.4 –2.8 413.7 428.1 –14.4 0.1925 17.3 17.9 –0.61959 .................................... 79.2 92.1 –12.8 398.8 463.5 –64.7 0.1987 16.1 18.7 –2.6
1960 .................................... 92.5 92.2 0.3 463.9 462.3 1.5 0.1994 17.8 17.8 0.11961 .................................... 94.4 97.7 –3.3 461.3 477.6 –16.3 0.2046 17.8 18.4 –0.61962 .................................... 99.7 106.8 –7.1 479.9 514.3 –34.4 0.2077 17.6 18.8 –1.31963 .................................... 106.6 111.3 –4.8 494.7 516.8 –22.1 0.2154 17.8 18.6 –0.81964 .................................... 112.6 118.5 –5.9 513.7 540.7 –27.0 0.2192 17.6 18.5 –0.9
1965 .................................... 116.8 118.2 –1.4 525.3 531.6 –6.3 0.2224 17.0 17.2 –0.21966 .................................... 130.8 134.5 –3.7 570.6 586.7 –16.1 0.2293 17.4 17.9 –0.51967 .................................... 148.8 157.5 –8.6 629.3 665.8 –36.5 0.2365 18.3 19.4 –1.11968 .................................... 153.0 178.1 –25.2 620.3 722.4 –102.0 0.2466 17.6 20.5 –2.91969 .................................... 186.9 183.6 3.2 719.6 707.1 12.5 0.2597 19.7 19.4 0.3
1970 .................................... 192.8 195.6 –2.8 700.4 710.7 –10.3 0.2753 19.1 19.4 –0.31971 .................................... 187.1 210.2 –23.0 639.8 718.5 –78.7 0.2925 17.4 19.5 –2.11972 .................................... 207.3 230.7 –23.4 664.9 739.8 –75.0 0.3118 17.6 19.6 –2.01973 .................................... 230.8 245.7 –14.9 704.3 749.8 –45.5 0.3277 17.7 18.8 –1.11974 .................................... 263.2 269.4 –6.1 742.5 759.8 –17.3 0.3545 18.3 18.7 –0.4
1975 .................................... 279.1 332.3 –53.2 712.1 848.0 –135.9 0.3919 18.0 21.4 –3.41976 .................................... 298.1 371.8 –73.7 710.3 886.1 –175.7 0.4196 17.2 21.5 –4.3TQ ....................................... 81.2 96.0 –14.7 187.2 221.1 –34.0 0.4340 17.9 21.1 –3.21977 .................................... 355.6 409.2 –53.7 783.3 901.6 –118.2 0.4539 18.0 20.8 –2.71978 .................................... 399.6 458.7 –59.2 823.0 944.9 –121.9 0.4855 18.1 20.7 –2.71979 .................................... 463.3 504.0 –40.7 880.0 957.3 –77.4 0.5265 18.6 20.2 –1.6
1980 .................................... 517.1 590.9 –73.8 889.0 1,015.9 –126.9 0.5817 19.0 21.7 –2.71981 .................................... 599.3 678.2 –79.0 933.3 1,056.3 –123.0 0.6421 19.7 22.2 –2.61982 .................................... 617.8 745.8 –128.0 899.6 1,086.0 –186.4 0.6867 19.2 23.2 –4.01983 .................................... 600.6 808.4 –207.8 834.3 1,123.1 –288.7 0.7198 17.6 23.6 –6.11984 .................................... 666.5 851.9 –185.4 883.3 1,129.1 –245.7 0.7545 17.5 22.3 –4.9
1985 .................................... 734.1 946.4 –212.3 937.4 1,208.6 –271.1 0.7831 17.9 23.1 –5.21986 .................................... 769.2 990.5 –221.2 955.4 1,230.2 –274.8 0.8051 17.6 22.6 –5.11987 .................................... 854.4 1,004.1 –149.8 1,032.7 1,213.7 –181.0 0.8273 18.6 21.8 –3.31988 .................................... 909.3 1,064.5 –155.2 1,064.1 1,245.7 –181.6 0.8545 18.4 21.5 –3.11989 .................................... 991.2 1,143.7 –152.5 1,113.6 1,284.9 –171.3 0.8901 18.5 21.4 –2.8
1990 .................................... 1,032.0 1,253.2 –221.2 1,114.7 1,353.6 –238.9 0.9258 18.2 22.0 –3.91991 .................................... 1,055.0 1,324.4 –269.4 1,088.2 1,366.1 –277.8 0.9695 18.0 22.6 –4.61992 .................................... 1,091.3 1,381.7 –290.4 1,091.3 1,381.7 –290.4 1.0000 17.8 22.5 –4.71993 .................................... 1,154.4 1,409.4 –255.0 1,126.0 1,374.8 –248.7 1.0252 17.8 21.8 –3.91994 .................................... 1,258.6 1,461.7 –203.1 1,199.3 1,392.8 –193.5 1.0495 18.4 21.4 –3.0
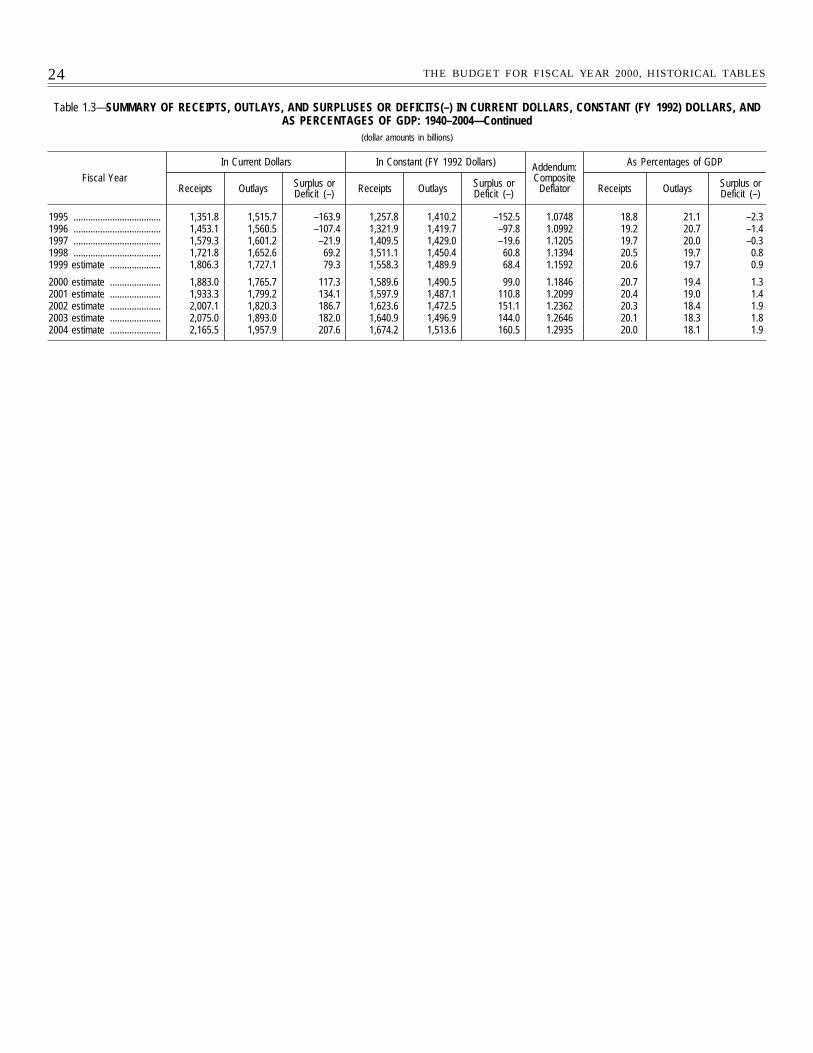
24 THE BUDGET FOR FISCAL YEAR 2000, HISTORICAL TABLES
Table 1.3—SUMMARY OF RECEIPTS, OUTLAYS, AND SURPLUSES OR DEFICITS(–) IN CURRENT DOLLARS, CONSTANT (FY 1992) DOLLARS, ANDAS PERCENTAGES OF GDP: 1940–2004—Continued
(dollar amounts in billions)
Fiscal Year
In Current Dollars In Constant (FY 1992 Dollars) Addendum:Composite
Deflator
As Percentages of GDP
Receipts Outlays Surplus orDeficit (–) Receipts Outlays Surplus or
Deficit (–) Receipts Outlays Surplus orDeficit (–)
1995 .................................... 1,351.8 1,515.7 –163.9 1,257.8 1,410.2 –152.5 1.0748 18.8 21.1 –2.31996 .................................... 1,453.1 1,560.5 –107.4 1,321.9 1,419.7 –97.8 1.0992 19.2 20.7 –1.41997 .................................... 1,579.3 1,601.2 –21.9 1,409.5 1,429.0 –19.6 1.1205 19.7 20.0 –0.31998 .................................... 1,721.8 1,652.6 69.2 1,511.1 1,450.4 60.8 1.1394 20.5 19.7 0.81999 estimate ..................... 1,806.3 1,727.1 79.3 1,558.3 1,489.9 68.4 1.1592 20.6 19.7 0.9
2000 estimate ..................... 1,883.0 1,765.7 117.3 1,589.6 1,490.5 99.0 1.1846 20.7 19.4 1.32001 estimate ..................... 1,933.3 1,799.2 134.1 1,597.9 1,487.1 110.8 1.2099 20.4 19.0 1.42002 estimate ..................... 2,007.1 1,820.3 186.7 1,623.6 1,472.5 151.1 1.2362 20.3 18.4 1.92003 estimate ..................... 2,075.0 1,893.0 182.0 1,640.9 1,496.9 144.0 1.2646 20.1 18.3 1.82004 estimate ..................... 2,165.5 1,957.9 207.6 1,674.2 1,513.6 160.5 1.2935 20.0 18.1 1.9
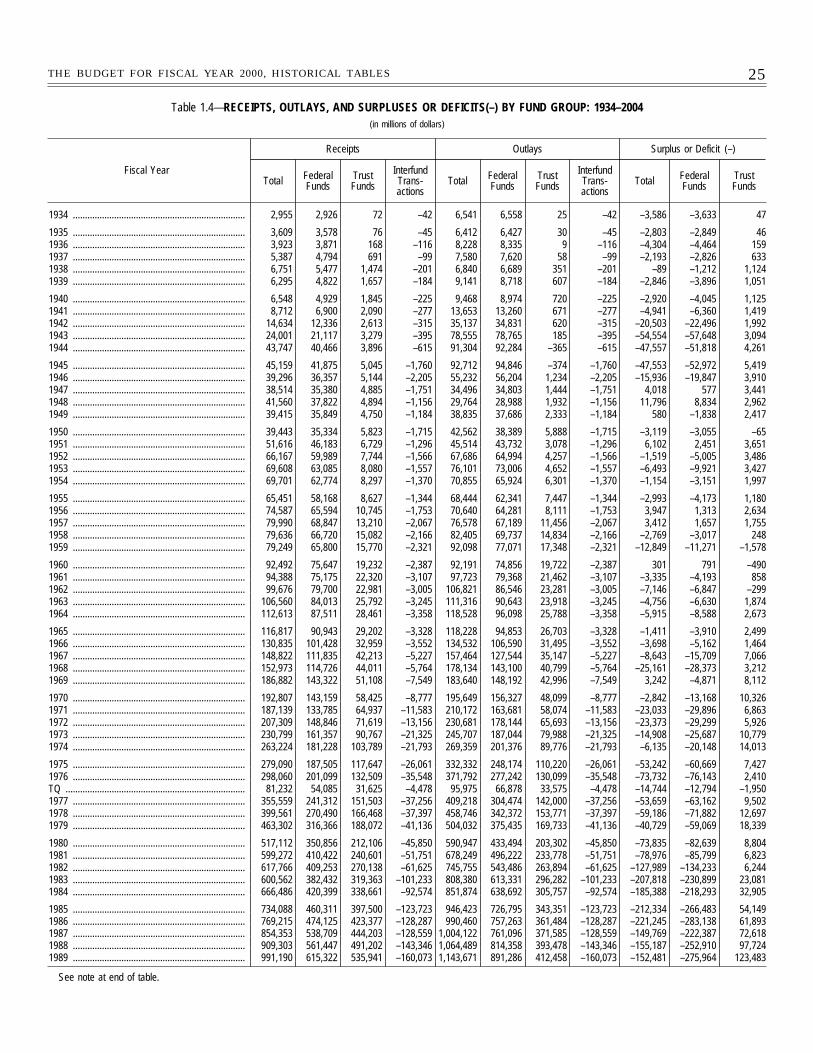
25THE BUDGET FOR FISCAL YEAR 2000, HISTORICAL TABLES
Table 1.4—RECEIPTS, OUTLAYS, AND SURPLUSES OR DEFICITS(–) BY FUND GROUP: 1934–2004(in millions of dollars)
Fiscal Year
Receipts Outlays Surplus or Deficit (–)
Total FederalFunds
TrustFunds
InterfundTrans-actions
Total FederalFunds
TrustFunds
InterfundTrans-actions
Total FederalFunds
TrustFunds
1934 ....................................................................... 2,955 2,926 72 –42 6,541 6,558 25 –42 –3,586 –3,633 47
1935 ....................................................................... 3,609 3,578 76 –45 6,412 6,427 30 –45 –2,803 –2,849 461936 ....................................................................... 3,923 3,871 168 –116 8,228 8,335 9 –116 –4,304 –4,464 1591937 ....................................................................... 5,387 4,794 691 –99 7,580 7,620 58 –99 –2,193 –2,826 6331938 ....................................................................... 6,751 5,477 1,474 –201 6,840 6,689 351 –201 –89 –1,212 1,1241939 ....................................................................... 6,295 4,822 1,657 –184 9,141 8,718 607 –184 –2,846 –3,896 1,051
1940 ....................................................................... 6,548 4,929 1,845 –225 9,468 8,974 720 –225 –2,920 –4,045 1,1251941 ....................................................................... 8,712 6,900 2,090 –277 13,653 13,260 671 –277 –4,941 –6,360 1,4191942 ....................................................................... 14,634 12,336 2,613 –315 35,137 34,831 620 –315 –20,503 –22,496 1,9921943 ....................................................................... 24,001 21,117 3,279 –395 78,555 78,765 185 –395 –54,554 –57,648 3,0941944 ....................................................................... 43,747 40,466 3,896 –615 91,304 92,284 –365 –615 –47,557 –51,818 4,261
1945 ....................................................................... 45,159 41,875 5,045 –1,760 92,712 94,846 –374 –1,760 –47,553 –52,972 5,4191946 ....................................................................... 39,296 36,357 5,144 –2,205 55,232 56,204 1,234 –2,205 –15,936 –19,847 3,9101947 ....................................................................... 38,514 35,380 4,885 –1,751 34,496 34,803 1,444 –1,751 4,018 577 3,4411948 ....................................................................... 41,560 37,822 4,894 –1,156 29,764 28,988 1,932 –1,156 11,796 8,834 2,9621949 ....................................................................... 39,415 35,849 4,750 –1,184 38,835 37,686 2,333 –1,184 580 –1,838 2,417
1950 ....................................................................... 39,443 35,334 5,823 –1,715 42,562 38,389 5,888 –1,715 –3,119 –3,055 –651951 ....................................................................... 51,616 46,183 6,729 –1,296 45,514 43,732 3,078 –1,296 6,102 2,451 3,6511952 ....................................................................... 66,167 59,989 7,744 –1,566 67,686 64,994 4,257 –1,566 –1,519 –5,005 3,4861953 ....................................................................... 69,608 63,085 8,080 –1,557 76,101 73,006 4,652 –1,557 –6,493 –9,921 3,4271954 ....................................................................... 69,701 62,774 8,297 –1,370 70,855 65,924 6,301 –1,370 –1,154 –3,151 1,997
1955 ....................................................................... 65,451 58,168 8,627 –1,344 68,444 62,341 7,447 –1,344 –2,993 –4,173 1,1801956 ....................................................................... 74,587 65,594 10,745 –1,753 70,640 64,281 8,111 –1,753 3,947 1,313 2,6341957 ....................................................................... 79,990 68,847 13,210 –2,067 76,578 67,189 11,456 –2,067 3,412 1,657 1,7551958 ....................................................................... 79,636 66,720 15,082 –2,166 82,405 69,737 14,834 –2,166 –2,769 –3,017 2481959 ....................................................................... 79,249 65,800 15,770 –2,321 92,098 77,071 17,348 –2,321 –12,849 –11,271 –1,578
1960 ....................................................................... 92,492 75,647 19,232 –2,387 92,191 74,856 19,722 –2,387 301 791 –4901961 ....................................................................... 94,388 75,175 22,320 –3,107 97,723 79,368 21,462 –3,107 –3,335 –4,193 8581962 ....................................................................... 99,676 79,700 22,981 –3,005 106,821 86,546 23,281 –3,005 –7,146 –6,847 –2991963 ....................................................................... 106,560 84,013 25,792 –3,245 111,316 90,643 23,918 –3,245 –4,756 –6,630 1,8741964 ....................................................................... 112,613 87,511 28,461 –3,358 118,528 96,098 25,788 –3,358 –5,915 –8,588 2,673
1965 ....................................................................... 116,817 90,943 29,202 –3,328 118,228 94,853 26,703 –3,328 –1,411 –3,910 2,4991966 ....................................................................... 130,835 101,428 32,959 –3,552 134,532 106,590 31,495 –3,552 –3,698 –5,162 1,4641967 ....................................................................... 148,822 111,835 42,213 –5,227 157,464 127,544 35,147 –5,227 –8,643 –15,709 7,0661968 ....................................................................... 152,973 114,726 44,011 –5,764 178,134 143,100 40,799 –5,764 –25,161 –28,373 3,2121969 ....................................................................... 186,882 143,322 51,108 –7,549 183,640 148,192 42,996 –7,549 3,242 –4,871 8,112
1970 ....................................................................... 192,807 143,159 58,425 –8,777 195,649 156,327 48,099 –8,777 –2,842 –13,168 10,3261971 ....................................................................... 187,139 133,785 64,937 –11,583 210,172 163,681 58,074 –11,583 –23,033 –29,896 6,8631972 ....................................................................... 207,309 148,846 71,619 –13,156 230,681 178,144 65,693 –13,156 –23,373 –29,299 5,9261973 ....................................................................... 230,799 161,357 90,767 –21,325 245,707 187,044 79,988 –21,325 –14,908 –25,687 10,7791974 ....................................................................... 263,224 181,228 103,789 –21,793 269,359 201,376 89,776 –21,793 –6,135 –20,148 14,013
1975 ....................................................................... 279,090 187,505 117,647 –26,061 332,332 248,174 110,220 –26,061 –53,242 –60,669 7,4271976 ....................................................................... 298,060 201,099 132,509 –35,548 371,792 277,242 130,099 –35,548 –73,732 –76,143 2,410TQ .......................................................................... 81,232 54,085 31,625 –4,478 95,975 66,878 33,575 –4,478 –14,744 –12,794 –1,9501977 ....................................................................... 355,559 241,312 151,503 –37,256 409,218 304,474 142,000 –37,256 –53,659 –63,162 9,5021978 ....................................................................... 399,561 270,490 166,468 –37,397 458,746 342,372 153,771 –37,397 –59,186 –71,882 12,6971979 ....................................................................... 463,302 316,366 188,072 –41,136 504,032 375,435 169,733 –41,136 –40,729 –59,069 18,339
1980 ....................................................................... 517,112 350,856 212,106 –45,850 590,947 433,494 203,302 –45,850 –73,835 –82,639 8,8041981 ....................................................................... 599,272 410,422 240,601 –51,751 678,249 496,222 233,778 –51,751 –78,976 –85,799 6,8231982 ....................................................................... 617,766 409,253 270,138 –61,625 745,755 543,486 263,894 –61,625 –127,989 –134,233 6,2441983 ....................................................................... 600,562 382,432 319,363 –101,233 808,380 613,331 296,282 –101,233 –207,818 –230,899 23,0811984 ....................................................................... 666,486 420,399 338,661 –92,574 851,874 638,692 305,757 –92,574 –185,388 –218,293 32,905
1985 ....................................................................... 734,088 460,311 397,500 –123,723 946,423 726,795 343,351 –123,723 –212,334 –266,483 54,1491986 ....................................................................... 769,215 474,125 423,377 –128,287 990,460 757,263 361,484 –128,287 –221,245 –283,138 61,8931987 ....................................................................... 854,353 538,709 444,203 –128,559 1,004,122 761,096 371,585 –128,559 –149,769 –222,387 72,6181988 ....................................................................... 909,303 561,447 491,202 –143,346 1,064,489 814,358 393,478 –143,346 –155,187 –252,910 97,7241989 ....................................................................... 991,190 615,322 535,941 –160,073 1,143,671 891,286 412,458 –160,073 –152,481 –275,964 123,483
See note at end of table.
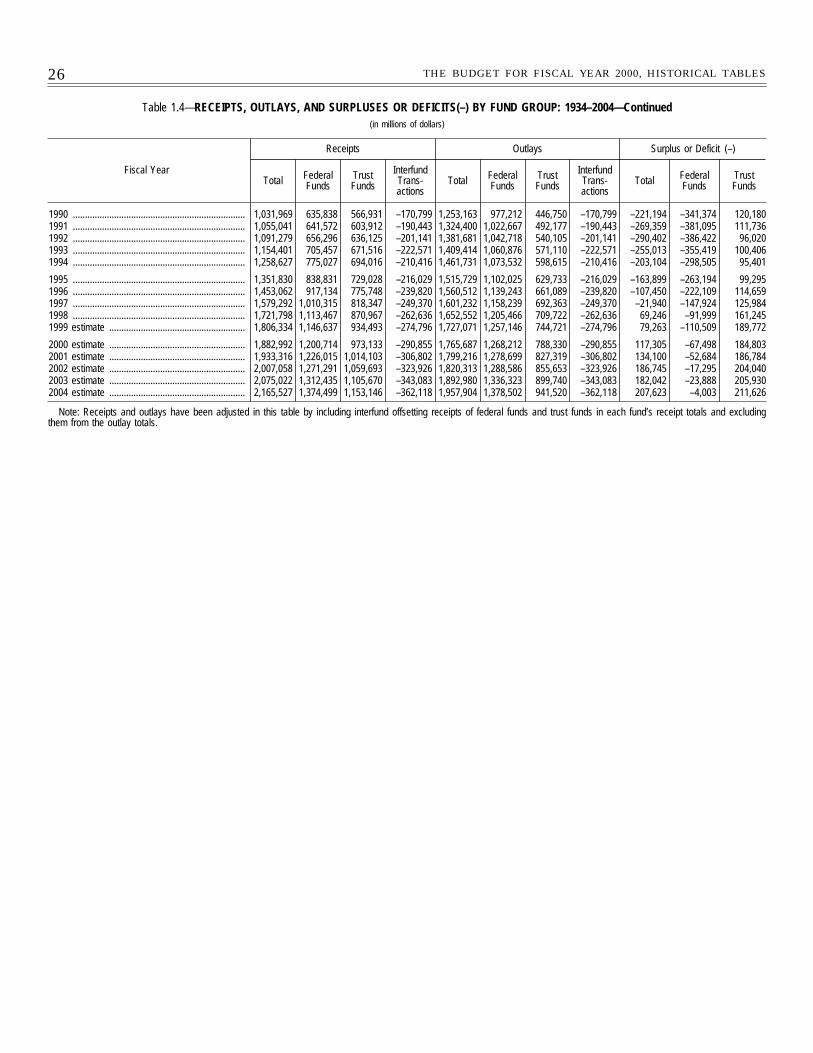
26 THE BUDGET FOR FISCAL YEAR 2000, HISTORICAL TABLES
Table 1.4—RECEIPTS, OUTLAYS, AND SURPLUSES OR DEFICITS(–) BY FUND GROUP: 1934–2004—Continued(in millions of dollars)
Fiscal Year
Receipts Outlays Surplus or Deficit (–)
Total FederalFunds
TrustFunds
InterfundTrans-actions
Total FederalFunds
TrustFunds
InterfundTrans-actions
Total FederalFunds
TrustFunds
1990 ....................................................................... 1,031,969 635,838 566,931 –170,799 1,253,163 977,212 446,750 –170,799 –221,194 –341,374 120,1801991 ....................................................................... 1,055,041 641,572 603,912 –190,443 1,324,400 1,022,667 492,177 –190,443 –269,359 –381,095 111,7361992 ....................................................................... 1,091,279 656,296 636,125 –201,141 1,381,681 1,042,718 540,105 –201,141 –290,402 –386,422 96,0201993 ....................................................................... 1,154,401 705,457 671,516 –222,571 1,409,414 1,060,876 571,110 –222,571 –255,013 –355,419 100,4061994 ....................................................................... 1,258,627 775,027 694,016 –210,416 1,461,731 1,073,532 598,615 –210,416 –203,104 –298,505 95,401
1995 ....................................................................... 1,351,830 838,831 729,028 –216,029 1,515,729 1,102,025 629,733 –216,029 –163,899 –263,194 99,2951996 ....................................................................... 1,453,062 917,134 775,748 –239,820 1,560,512 1,139,243 661,089 –239,820 –107,450 –222,109 114,6591997 ....................................................................... 1,579,292 1,010,315 818,347 –249,370 1,601,232 1,158,239 692,363 –249,370 –21,940 –147,924 125,9841998 ....................................................................... 1,721,798 1,113,467 870,967 –262,636 1,652,552 1,205,466 709,722 –262,636 69,246 –91,999 161,2451999 estimate ........................................................ 1,806,334 1,146,637 934,493 –274,796 1,727,071 1,257,146 744,721 –274,796 79,263 –110,509 189,772
2000 estimate ........................................................ 1,882,992 1,200,714 973,133 –290,855 1,765,687 1,268,212 788,330 –290,855 117,305 –67,498 184,8032001 estimate ........................................................ 1,933,316 1,226,015 1,014,103 –306,802 1,799,216 1,278,699 827,319 –306,802 134,100 –52,684 186,7842002 estimate ........................................................ 2,007,058 1,271,291 1,059,693 –323,926 1,820,313 1,288,586 855,653 –323,926 186,745 –17,295 204,0402003 estimate ........................................................ 2,075,022 1,312,435 1,105,670 –343,083 1,892,980 1,336,323 899,740 –343,083 182,042 –23,888 205,9302004 estimate ........................................................ 2,165,527 1,374,499 1,153,146 –362,118 1,957,904 1,378,502 941,520 –362,118 207,623 –4,003 211,626
Note: Receipts and outlays have been adjusted in this table by including interfund offsetting receipts of federal funds and trust funds in each fund’s receipt totals and excludingthem from the outlay totals.
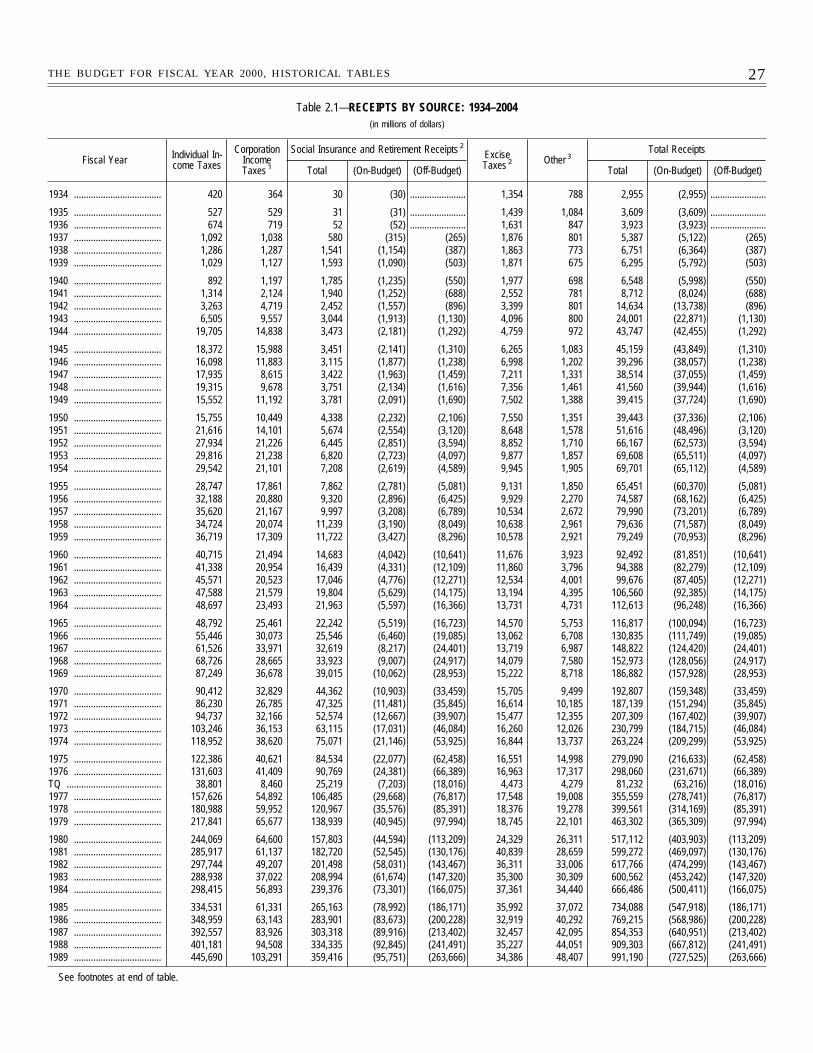
27THE BUDGET FOR FISCAL YEAR 2000, HISTORICAL TABLES
Table 2.1—RECEIPTS BY SOURCE: 1934–2004(in millions of dollars)
Fiscal Year Individual In-come Taxes
CorporationIncomeTaxes 1
Social Insurance and Retirement Receipts 2
ExciseTaxes 2 Other 3
Total Receipts
Total (On-Budget) (Off-Budget) Total (On-Budget) (Off-Budget)
1934 .................................... 420 364 30 (30) ....................... 1,354 788 2,955 (2,955) .......................
1935 .................................... 527 529 31 (31) ....................... 1,439 1,084 3,609 (3,609) .......................1936 .................................... 674 719 52 (52) ....................... 1,631 847 3,923 (3,923) .......................1937 .................................... 1,092 1,038 580 (315) (265) 1,876 801 5,387 (5,122) (265)1938 .................................... 1,286 1,287 1,541 (1,154) (387) 1,863 773 6,751 (6,364) (387)1939 .................................... 1,029 1,127 1,593 (1,090) (503) 1,871 675 6,295 (5,792) (503)
1940 .................................... 892 1,197 1,785 (1,235) (550) 1,977 698 6,548 (5,998) (550)1941 .................................... 1,314 2,124 1,940 (1,252) (688) 2,552 781 8,712 (8,024) (688)1942 .................................... 3,263 4,719 2,452 (1,557) (896) 3,399 801 14,634 (13,738) (896)1943 .................................... 6,505 9,557 3,044 (1,913) (1,130) 4,096 800 24,001 (22,871) (1,130)1944 .................................... 19,705 14,838 3,473 (2,181) (1,292) 4,759 972 43,747 (42,455) (1,292)
1945 .................................... 18,372 15,988 3,451 (2,141) (1,310) 6,265 1,083 45,159 (43,849) (1,310)1946 .................................... 16,098 11,883 3,115 (1,877) (1,238) 6,998 1,202 39,296 (38,057) (1,238)1947 .................................... 17,935 8,615 3,422 (1,963) (1,459) 7,211 1,331 38,514 (37,055) (1,459)1948 .................................... 19,315 9,678 3,751 (2,134) (1,616) 7,356 1,461 41,560 (39,944) (1,616)1949 .................................... 15,552 11,192 3,781 (2,091) (1,690) 7,502 1,388 39,415 (37,724) (1,690)
1950 .................................... 15,755 10,449 4,338 (2,232) (2,106) 7,550 1,351 39,443 (37,336) (2,106)1951 .................................... 21,616 14,101 5,674 (2,554) (3,120) 8,648 1,578 51,616 (48,496) (3,120)1952 .................................... 27,934 21,226 6,445 (2,851) (3,594) 8,852 1,710 66,167 (62,573) (3,594)1953 .................................... 29,816 21,238 6,820 (2,723) (4,097) 9,877 1,857 69,608 (65,511) (4,097)1954 .................................... 29,542 21,101 7,208 (2,619) (4,589) 9,945 1,905 69,701 (65,112) (4,589)
1955 .................................... 28,747 17,861 7,862 (2,781) (5,081) 9,131 1,850 65,451 (60,370) (5,081)1956 .................................... 32,188 20,880 9,320 (2,896) (6,425) 9,929 2,270 74,587 (68,162) (6,425)1957 .................................... 35,620 21,167 9,997 (3,208) (6,789) 10,534 2,672 79,990 (73,201) (6,789)1958 .................................... 34,724 20,074 11,239 (3,190) (8,049) 10,638 2,961 79,636 (71,587) (8,049)1959 .................................... 36,719 17,309 11,722 (3,427) (8,296) 10,578 2,921 79,249 (70,953) (8,296)
1960 .................................... 40,715 21,494 14,683 (4,042) (10,641) 11,676 3,923 92,492 (81,851) (10,641)1961 .................................... 41,338 20,954 16,439 (4,331) (12,109) 11,860 3,796 94,388 (82,279) (12,109)1962 .................................... 45,571 20,523 17,046 (4,776) (12,271) 12,534 4,001 99,676 (87,405) (12,271)1963 .................................... 47,588 21,579 19,804 (5,629) (14,175) 13,194 4,395 106,560 (92,385) (14,175)1964 .................................... 48,697 23,493 21,963 (5,597) (16,366) 13,731 4,731 112,613 (96,248) (16,366)
1965 .................................... 48,792 25,461 22,242 (5,519) (16,723) 14,570 5,753 116,817 (100,094) (16,723)1966 .................................... 55,446 30,073 25,546 (6,460) (19,085) 13,062 6,708 130,835 (111,749) (19,085)1967 .................................... 61,526 33,971 32,619 (8,217) (24,401) 13,719 6,987 148,822 (124,420) (24,401)1968 .................................... 68,726 28,665 33,923 (9,007) (24,917) 14,079 7,580 152,973 (128,056) (24,917)1969 .................................... 87,249 36,678 39,015 (10,062) (28,953) 15,222 8,718 186,882 (157,928) (28,953)
1970 .................................... 90,412 32,829 44,362 (10,903) (33,459) 15,705 9,499 192,807 (159,348) (33,459)1971 .................................... 86,230 26,785 47,325 (11,481) (35,845) 16,614 10,185 187,139 (151,294) (35,845)1972 .................................... 94,737 32,166 52,574 (12,667) (39,907) 15,477 12,355 207,309 (167,402) (39,907)1973 .................................... 103,246 36,153 63,115 (17,031) (46,084) 16,260 12,026 230,799 (184,715) (46,084)1974 .................................... 118,952 38,620 75,071 (21,146) (53,925) 16,844 13,737 263,224 (209,299) (53,925)
1975 .................................... 122,386 40,621 84,534 (22,077) (62,458) 16,551 14,998 279,090 (216,633) (62,458)1976 .................................... 131,603 41,409 90,769 (24,381) (66,389) 16,963 17,317 298,060 (231,671) (66,389)TQ ....................................... 38,801 8,460 25,219 (7,203) (18,016) 4,473 4,279 81,232 (63,216) (18,016)1977 .................................... 157,626 54,892 106,485 (29,668) (76,817) 17,548 19,008 355,559 (278,741) (76,817)1978 .................................... 180,988 59,952 120,967 (35,576) (85,391) 18,376 19,278 399,561 (314,169) (85,391)1979 .................................... 217,841 65,677 138,939 (40,945) (97,994) 18,745 22,101 463,302 (365,309) (97,994)
1980 .................................... 244,069 64,600 157,803 (44,594) (113,209) 24,329 26,311 517,112 (403,903) (113,209)1981 .................................... 285,917 61,137 182,720 (52,545) (130,176) 40,839 28,659 599,272 (469,097) (130,176)1982 .................................... 297,744 49,207 201,498 (58,031) (143,467) 36,311 33,006 617,766 (474,299) (143,467)1983 .................................... 288,938 37,022 208,994 (61,674) (147,320) 35,300 30,309 600,562 (453,242) (147,320)1984 .................................... 298,415 56,893 239,376 (73,301) (166,075) 37,361 34,440 666,486 (500,411) (166,075)
1985 .................................... 334,531 61,331 265,163 (78,992) (186,171) 35,992 37,072 734,088 (547,918) (186,171)1986 .................................... 348,959 63,143 283,901 (83,673) (200,228) 32,919 40,292 769,215 (568,986) (200,228)1987 .................................... 392,557 83,926 303,318 (89,916) (213,402) 32,457 42,095 854,353 (640,951) (213,402)1988 .................................... 401,181 94,508 334,335 (92,845) (241,491) 35,227 44,051 909,303 (667,812) (241,491)1989 .................................... 445,690 103,291 359,416 (95,751) (263,666) 34,386 48,407 991,190 (727,525) (263,666)
See footnotes at end of table.
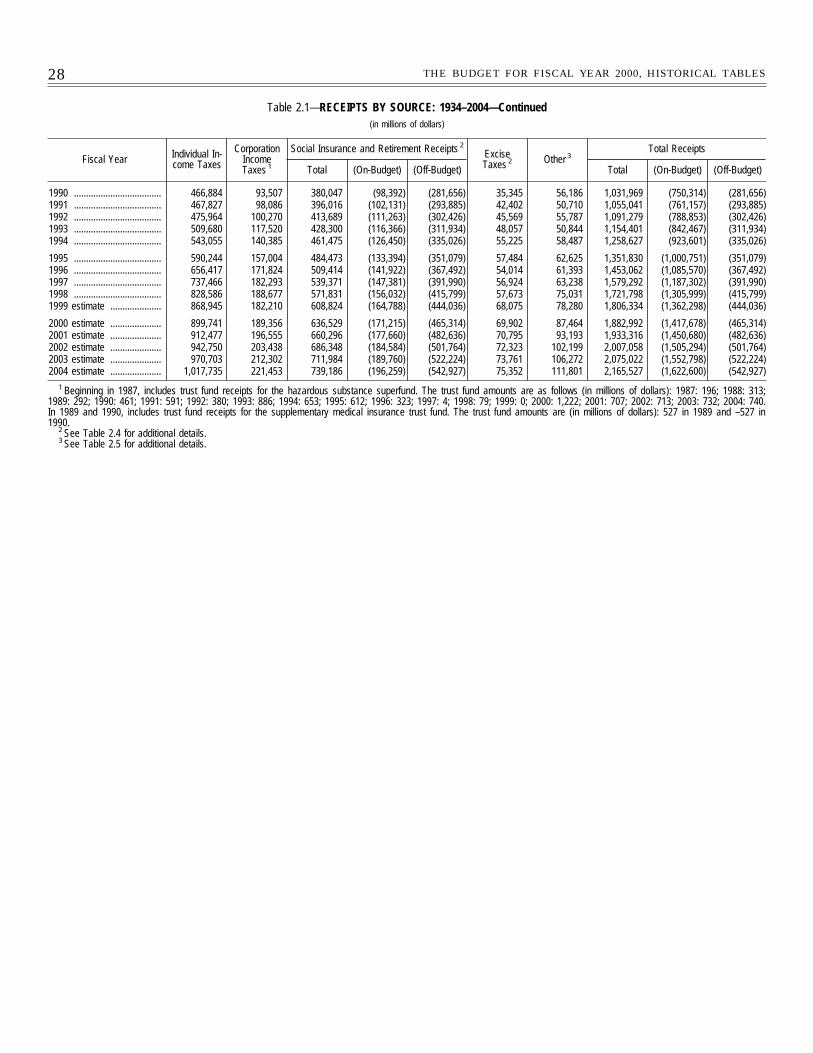
28 THE BUDGET FOR FISCAL YEAR 2000, HISTORICAL TABLES
Table 2.1—RECEIPTS BY SOURCE: 1934–2004—Continued(in millions of dollars)
Fiscal Year Individual In-come Taxes
CorporationIncomeTaxes 1
Social Insurance and Retirement Receipts 2
ExciseTaxes 2 Other 3
Total Receipts
Total (On-Budget) (Off-Budget) Total (On-Budget) (Off-Budget)
1990 .................................... 466,884 93,507 380,047 (98,392) (281,656) 35,345 56,186 1,031,969 (750,314) (281,656)1991 .................................... 467,827 98,086 396,016 (102,131) (293,885) 42,402 50,710 1,055,041 (761,157) (293,885)1992 .................................... 475,964 100,270 413,689 (111,263) (302,426) 45,569 55,787 1,091,279 (788,853) (302,426)1993 .................................... 509,680 117,520 428,300 (116,366) (311,934) 48,057 50,844 1,154,401 (842,467) (311,934)1994 .................................... 543,055 140,385 461,475 (126,450) (335,026) 55,225 58,487 1,258,627 (923,601) (335,026)
1995 .................................... 590,244 157,004 484,473 (133,394) (351,079) 57,484 62,625 1,351,830 (1,000,751) (351,079)1996 .................................... 656,417 171,824 509,414 (141,922) (367,492) 54,014 61,393 1,453,062 (1,085,570) (367,492)1997 .................................... 737,466 182,293 539,371 (147,381) (391,990) 56,924 63,238 1,579,292 (1,187,302) (391,990)1998 .................................... 828,586 188,677 571,831 (156,032) (415,799) 57,673 75,031 1,721,798 (1,305,999) (415,799)1999 estimate ..................... 868,945 182,210 608,824 (164,788) (444,036) 68,075 78,280 1,806,334 (1,362,298) (444,036)
2000 estimate ..................... 899,741 189,356 636,529 (171,215) (465,314) 69,902 87,464 1,882,992 (1,417,678) (465,314)2001 estimate ..................... 912,477 196,555 660,296 (177,660) (482,636) 70,795 93,193 1,933,316 (1,450,680) (482,636)2002 estimate ..................... 942,750 203,438 686,348 (184,584) (501,764) 72,323 102,199 2,007,058 (1,505,294) (501,764)2003 estimate ..................... 970,703 212,302 711,984 (189,760) (522,224) 73,761 106,272 2,075,022 (1,552,798) (522,224)2004 estimate ..................... 1,017,735 221,453 739,186 (196,259) (542,927) 75,352 111,801 2,165,527 (1,622,600) (542,927)
1 Beginning in 1987, includes trust fund receipts for the hazardous substance superfund. The trust fund amounts are as follows (in millions of dollars): 1987: 196; 1988: 313;1989: 292; 1990: 461; 1991: 591; 1992: 380; 1993: 886; 1994: 653; 1995: 612; 1996: 323; 1997: 4; 1998: 79; 1999: 0; 2000: 1,222; 2001: 707; 2002: 713; 2003: 732; 2004: 740.In 1989 and 1990, includes trust fund receipts for the supplementary medical insurance trust fund. The trust fund amounts are (in millions of dollars): 527 in 1989 and –527 in1990.
2 See Table 2.4 for additional details.3 See Table 2.5 for additional details.
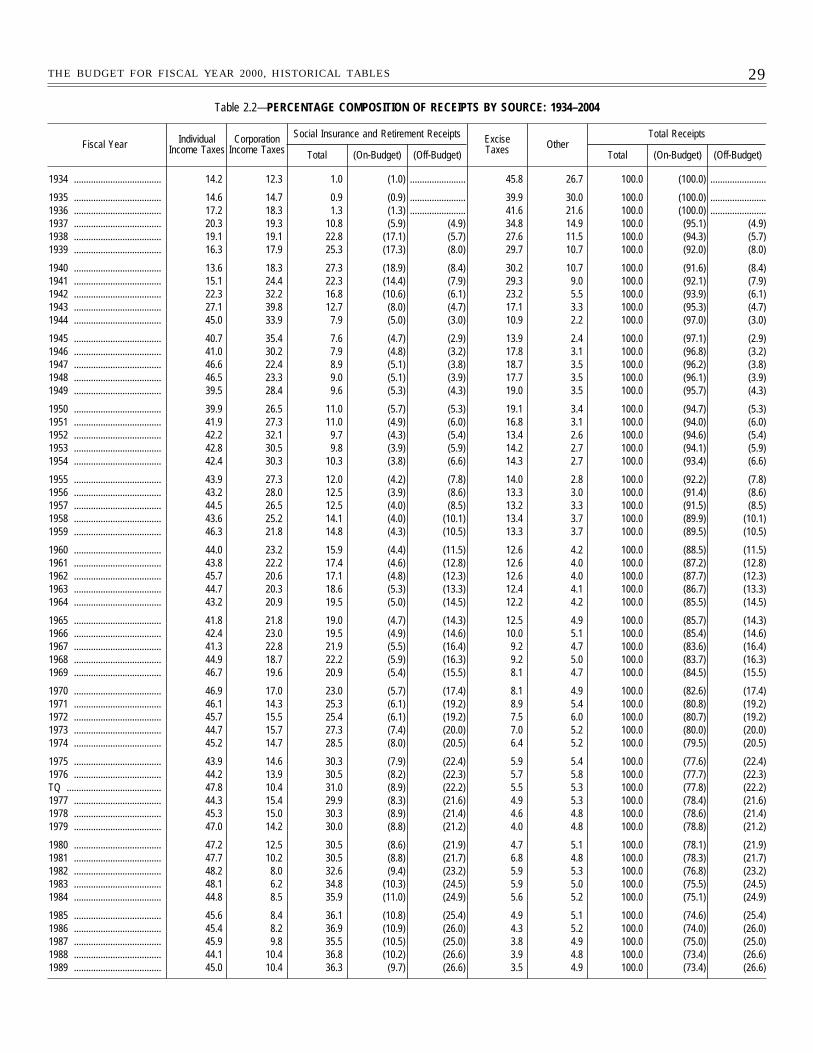
29THE BUDGET FOR FISCAL YEAR 2000, HISTORICAL TABLES
Table 2.2—PERCENTAGE COMPOSITION OF RECEIPTS BY SOURCE: 1934–2004
Fiscal Year IndividualIncome Taxes
CorporationIncome Taxes
Social Insurance and Retirement Receipts ExciseTaxes Other
Total Receipts
Total (On-Budget) (Off-Budget) Total (On-Budget) (Off-Budget)
1934 .................................... 14.2 12.3 1.0 (1.0) ....................... 45.8 26.7 100.0 (100.0) .......................
1935 .................................... 14.6 14.7 0.9 (0.9) ....................... 39.9 30.0 100.0 (100.0) .......................1936 .................................... 17.2 18.3 1.3 (1.3) ....................... 41.6 21.6 100.0 (100.0) .......................1937 .................................... 20.3 19.3 10.8 (5.9) (4.9) 34.8 14.9 100.0 (95.1) (4.9)1938 .................................... 19.1 19.1 22.8 (17.1) (5.7) 27.6 11.5 100.0 (94.3) (5.7)1939 .................................... 16.3 17.9 25.3 (17.3) (8.0) 29.7 10.7 100.0 (92.0) (8.0)
1940 .................................... 13.6 18.3 27.3 (18.9) (8.4) 30.2 10.7 100.0 (91.6) (8.4)1941 .................................... 15.1 24.4 22.3 (14.4) (7.9) 29.3 9.0 100.0 (92.1) (7.9)1942 .................................... 22.3 32.2 16.8 (10.6) (6.1) 23.2 5.5 100.0 (93.9) (6.1)1943 .................................... 27.1 39.8 12.7 (8.0) (4.7) 17.1 3.3 100.0 (95.3) (4.7)1944 .................................... 45.0 33.9 7.9 (5.0) (3.0) 10.9 2.2 100.0 (97.0) (3.0)
1945 .................................... 40.7 35.4 7.6 (4.7) (2.9) 13.9 2.4 100.0 (97.1) (2.9)1946 .................................... 41.0 30.2 7.9 (4.8) (3.2) 17.8 3.1 100.0 (96.8) (3.2)1947 .................................... 46.6 22.4 8.9 (5.1) (3.8) 18.7 3.5 100.0 (96.2) (3.8)1948 .................................... 46.5 23.3 9.0 (5.1) (3.9) 17.7 3.5 100.0 (96.1) (3.9)1949 .................................... 39.5 28.4 9.6 (5.3) (4.3) 19.0 3.5 100.0 (95.7) (4.3)
1950 .................................... 39.9 26.5 11.0 (5.7) (5.3) 19.1 3.4 100.0 (94.7) (5.3)1951 .................................... 41.9 27.3 11.0 (4.9) (6.0) 16.8 3.1 100.0 (94.0) (6.0)1952 .................................... 42.2 32.1 9.7 (4.3) (5.4) 13.4 2.6 100.0 (94.6) (5.4)1953 .................................... 42.8 30.5 9.8 (3.9) (5.9) 14.2 2.7 100.0 (94.1) (5.9)1954 .................................... 42.4 30.3 10.3 (3.8) (6.6) 14.3 2.7 100.0 (93.4) (6.6)
1955 .................................... 43.9 27.3 12.0 (4.2) (7.8) 14.0 2.8 100.0 (92.2) (7.8)1956 .................................... 43.2 28.0 12.5 (3.9) (8.6) 13.3 3.0 100.0 (91.4) (8.6)1957 .................................... 44.5 26.5 12.5 (4.0) (8.5) 13.2 3.3 100.0 (91.5) (8.5)1958 .................................... 43.6 25.2 14.1 (4.0) (10.1) 13.4 3.7 100.0 (89.9) (10.1)1959 .................................... 46.3 21.8 14.8 (4.3) (10.5) 13.3 3.7 100.0 (89.5) (10.5)
1960 .................................... 44.0 23.2 15.9 (4.4) (11.5) 12.6 4.2 100.0 (88.5) (11.5)1961 .................................... 43.8 22.2 17.4 (4.6) (12.8) 12.6 4.0 100.0 (87.2) (12.8)1962 .................................... 45.7 20.6 17.1 (4.8) (12.3) 12.6 4.0 100.0 (87.7) (12.3)1963 .................................... 44.7 20.3 18.6 (5.3) (13.3) 12.4 4.1 100.0 (86.7) (13.3)1964 .................................... 43.2 20.9 19.5 (5.0) (14.5) 12.2 4.2 100.0 (85.5) (14.5)
1965 .................................... 41.8 21.8 19.0 (4.7) (14.3) 12.5 4.9 100.0 (85.7) (14.3)1966 .................................... 42.4 23.0 19.5 (4.9) (14.6) 10.0 5.1 100.0 (85.4) (14.6)1967 .................................... 41.3 22.8 21.9 (5.5) (16.4) 9.2 4.7 100.0 (83.6) (16.4)1968 .................................... 44.9 18.7 22.2 (5.9) (16.3) 9.2 5.0 100.0 (83.7) (16.3)1969 .................................... 46.7 19.6 20.9 (5.4) (15.5) 8.1 4.7 100.0 (84.5) (15.5)
1970 .................................... 46.9 17.0 23.0 (5.7) (17.4) 8.1 4.9 100.0 (82.6) (17.4)1971 .................................... 46.1 14.3 25.3 (6.1) (19.2) 8.9 5.4 100.0 (80.8) (19.2)1972 .................................... 45.7 15.5 25.4 (6.1) (19.2) 7.5 6.0 100.0 (80.7) (19.2)1973 .................................... 44.7 15.7 27.3 (7.4) (20.0) 7.0 5.2 100.0 (80.0) (20.0)1974 .................................... 45.2 14.7 28.5 (8.0) (20.5) 6.4 5.2 100.0 (79.5) (20.5)
1975 .................................... 43.9 14.6 30.3 (7.9) (22.4) 5.9 5.4 100.0 (77.6) (22.4)1976 .................................... 44.2 13.9 30.5 (8.2) (22.3) 5.7 5.8 100.0 (77.7) (22.3)TQ ....................................... 47.8 10.4 31.0 (8.9) (22.2) 5.5 5.3 100.0 (77.8) (22.2)1977 .................................... 44.3 15.4 29.9 (8.3) (21.6) 4.9 5.3 100.0 (78.4) (21.6)1978 .................................... 45.3 15.0 30.3 (8.9) (21.4) 4.6 4.8 100.0 (78.6) (21.4)1979 .................................... 47.0 14.2 30.0 (8.8) (21.2) 4.0 4.8 100.0 (78.8) (21.2)
1980 .................................... 47.2 12.5 30.5 (8.6) (21.9) 4.7 5.1 100.0 (78.1) (21.9)1981 .................................... 47.7 10.2 30.5 (8.8) (21.7) 6.8 4.8 100.0 (78.3) (21.7)1982 .................................... 48.2 8.0 32.6 (9.4) (23.2) 5.9 5.3 100.0 (76.8) (23.2)1983 .................................... 48.1 6.2 34.8 (10.3) (24.5) 5.9 5.0 100.0 (75.5) (24.5)1984 .................................... 44.8 8.5 35.9 (11.0) (24.9) 5.6 5.2 100.0 (75.1) (24.9)
1985 .................................... 45.6 8.4 36.1 (10.8) (25.4) 4.9 5.1 100.0 (74.6) (25.4)1986 .................................... 45.4 8.2 36.9 (10.9) (26.0) 4.3 5.2 100.0 (74.0) (26.0)1987 .................................... 45.9 9.8 35.5 (10.5) (25.0) 3.8 4.9 100.0 (75.0) (25.0)1988 .................................... 44.1 10.4 36.8 (10.2) (26.6) 3.9 4.8 100.0 (73.4) (26.6)1989 .................................... 45.0 10.4 36.3 (9.7) (26.6) 3.5 4.9 100.0 (73.4) (26.6)
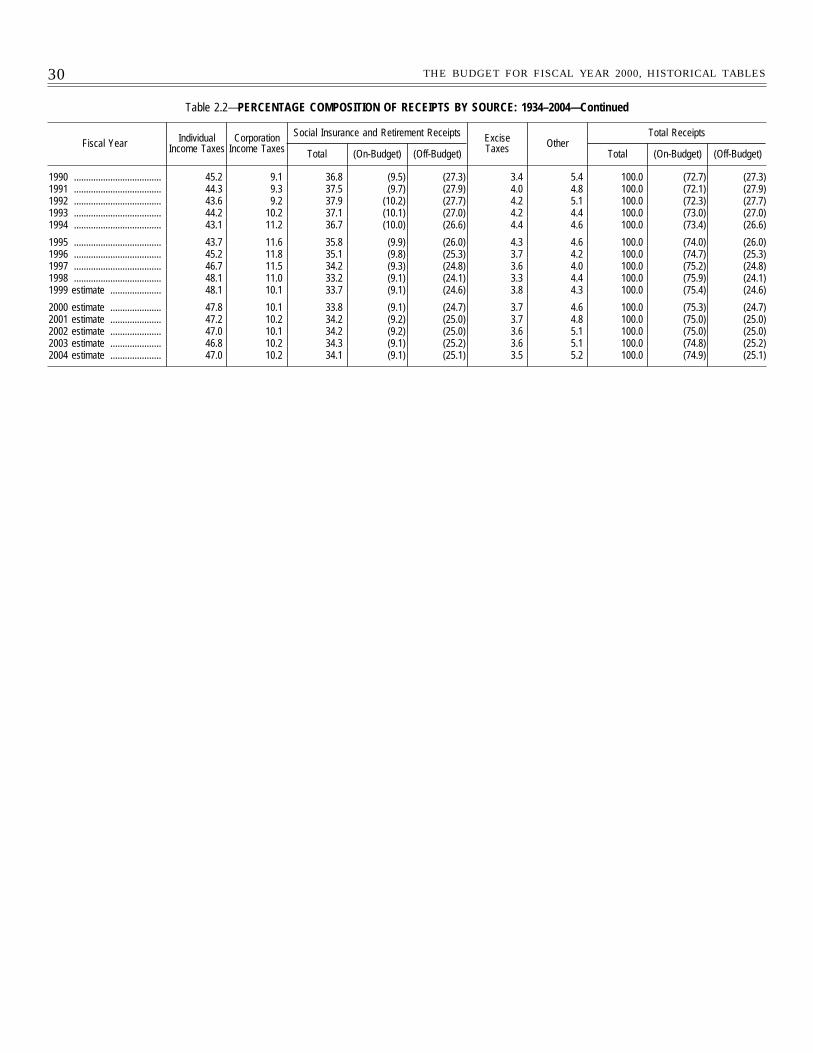
30 THE BUDGET FOR FISCAL YEAR 2000, HISTORICAL TABLES
Table 2.2—PERCENTAGE COMPOSITION OF RECEIPTS BY SOURCE: 1934–2004—Continued
Fiscal Year IndividualIncome Taxes
CorporationIncome Taxes
Social Insurance and Retirement Receipts ExciseTaxes Other
Total Receipts
Total (On-Budget) (Off-Budget) Total (On-Budget) (Off-Budget)
1990 .................................... 45.2 9.1 36.8 (9.5) (27.3) 3.4 5.4 100.0 (72.7) (27.3)1991 .................................... 44.3 9.3 37.5 (9.7) (27.9) 4.0 4.8 100.0 (72.1) (27.9)1992 .................................... 43.6 9.2 37.9 (10.2) (27.7) 4.2 5.1 100.0 (72.3) (27.7)1993 .................................... 44.2 10.2 37.1 (10.1) (27.0) 4.2 4.4 100.0 (73.0) (27.0)1994 .................................... 43.1 11.2 36.7 (10.0) (26.6) 4.4 4.6 100.0 (73.4) (26.6)
1995 .................................... 43.7 11.6 35.8 (9.9) (26.0) 4.3 4.6 100.0 (74.0) (26.0)1996 .................................... 45.2 11.8 35.1 (9.8) (25.3) 3.7 4.2 100.0 (74.7) (25.3)1997 .................................... 46.7 11.5 34.2 (9.3) (24.8) 3.6 4.0 100.0 (75.2) (24.8)1998 .................................... 48.1 11.0 33.2 (9.1) (24.1) 3.3 4.4 100.0 (75.9) (24.1)1999 estimate ..................... 48.1 10.1 33.7 (9.1) (24.6) 3.8 4.3 100.0 (75.4) (24.6)
2000 estimate ..................... 47.8 10.1 33.8 (9.1) (24.7) 3.7 4.6 100.0 (75.3) (24.7)2001 estimate ..................... 47.2 10.2 34.2 (9.2) (25.0) 3.7 4.8 100.0 (75.0) (25.0)2002 estimate ..................... 47.0 10.1 34.2 (9.2) (25.0) 3.6 5.1 100.0 (75.0) (25.0)2003 estimate ..................... 46.8 10.2 34.3 (9.1) (25.2) 3.6 5.1 100.0 (74.8) (25.2)2004 estimate ..................... 47.0 10.2 34.1 (9.1) (25.1) 3.5 5.2 100.0 (74.9) (25.1)
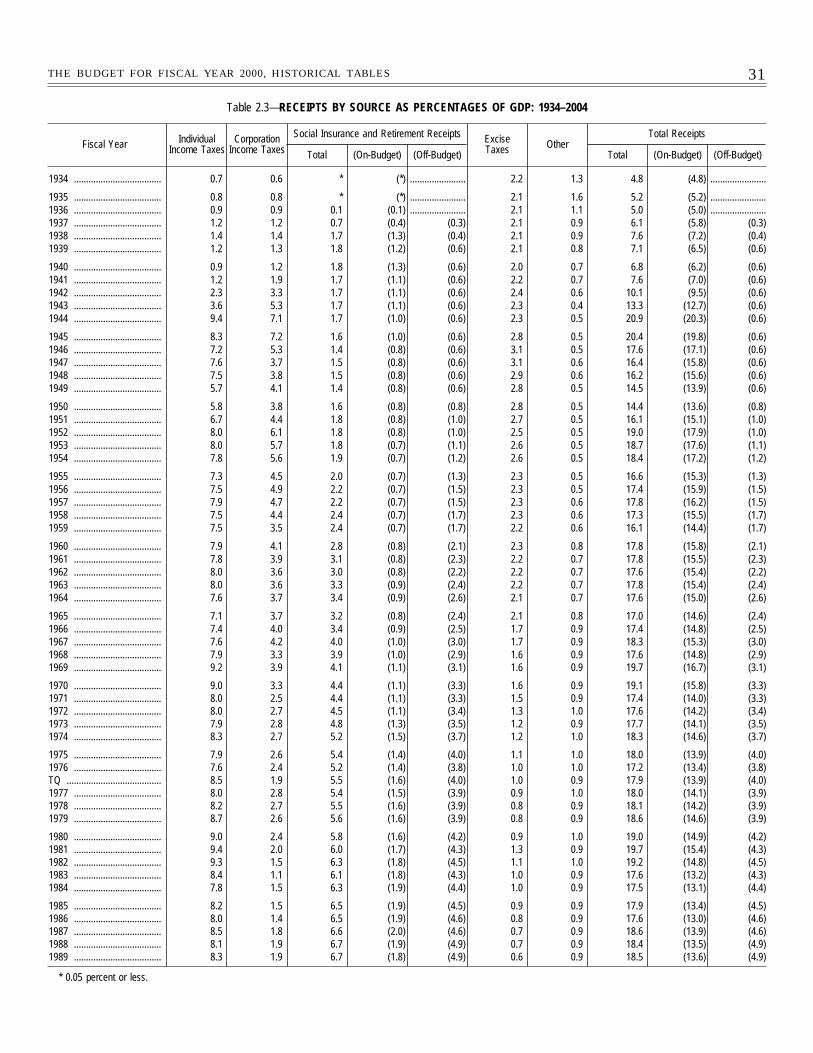
31THE BUDGET FOR FISCAL YEAR 2000, HISTORICAL TABLES
Table 2.3—RECEIPTS BY SOURCE AS PERCENTAGES OF GDP: 1934–2004
Fiscal Year IndividualIncome Taxes
CorporationIncome Taxes
Social Insurance and Retirement Receipts ExciseTaxes Other
Total Receipts
Total (On-Budget) (Off-Budget) Total (On-Budget) (Off-Budget)
1934 .................................... 0.7 0.6 * (*) ....................... 2.2 1.3 4.8 (4.8) .......................
1935 .................................... 0.8 0.8 * (*) ....................... 2.1 1.6 5.2 (5.2) .......................1936 .................................... 0.9 0.9 0.1 (0.1) ....................... 2.1 1.1 5.0 (5.0) .......................1937 .................................... 1.2 1.2 0.7 (0.4) (0.3) 2.1 0.9 6.1 (5.8) (0.3)1938 .................................... 1.4 1.4 1.7 (1.3) (0.4) 2.1 0.9 7.6 (7.2) (0.4)1939 .................................... 1.2 1.3 1.8 (1.2) (0.6) 2.1 0.8 7.1 (6.5) (0.6)
1940 .................................... 0.9 1.2 1.8 (1.3) (0.6) 2.0 0.7 6.8 (6.2) (0.6)1941 .................................... 1.2 1.9 1.7 (1.1) (0.6) 2.2 0.7 7.6 (7.0) (0.6)1942 .................................... 2.3 3.3 1.7 (1.1) (0.6) 2.4 0.6 10.1 (9.5) (0.6)1943 .................................... 3.6 5.3 1.7 (1.1) (0.6) 2.3 0.4 13.3 (12.7) (0.6)1944 .................................... 9.4 7.1 1.7 (1.0) (0.6) 2.3 0.5 20.9 (20.3) (0.6)
1945 .................................... 8.3 7.2 1.6 (1.0) (0.6) 2.8 0.5 20.4 (19.8) (0.6)1946 .................................... 7.2 5.3 1.4 (0.8) (0.6) 3.1 0.5 17.6 (17.1) (0.6)1947 .................................... 7.6 3.7 1.5 (0.8) (0.6) 3.1 0.6 16.4 (15.8) (0.6)1948 .................................... 7.5 3.8 1.5 (0.8) (0.6) 2.9 0.6 16.2 (15.6) (0.6)1949 .................................... 5.7 4.1 1.4 (0.8) (0.6) 2.8 0.5 14.5 (13.9) (0.6)
1950 .................................... 5.8 3.8 1.6 (0.8) (0.8) 2.8 0.5 14.4 (13.6) (0.8)1951 .................................... 6.7 4.4 1.8 (0.8) (1.0) 2.7 0.5 16.1 (15.1) (1.0)1952 .................................... 8.0 6.1 1.8 (0.8) (1.0) 2.5 0.5 19.0 (17.9) (1.0)1953 .................................... 8.0 5.7 1.8 (0.7) (1.1) 2.6 0.5 18.7 (17.6) (1.1)1954 .................................... 7.8 5.6 1.9 (0.7) (1.2) 2.6 0.5 18.4 (17.2) (1.2)
1955 .................................... 7.3 4.5 2.0 (0.7) (1.3) 2.3 0.5 16.6 (15.3) (1.3)1956 .................................... 7.5 4.9 2.2 (0.7) (1.5) 2.3 0.5 17.4 (15.9) (1.5)1957 .................................... 7.9 4.7 2.2 (0.7) (1.5) 2.3 0.6 17.8 (16.2) (1.5)1958 .................................... 7.5 4.4 2.4 (0.7) (1.7) 2.3 0.6 17.3 (15.5) (1.7)1959 .................................... 7.5 3.5 2.4 (0.7) (1.7) 2.2 0.6 16.1 (14.4) (1.7)
1960 .................................... 7.9 4.1 2.8 (0.8) (2.1) 2.3 0.8 17.8 (15.8) (2.1)1961 .................................... 7.8 3.9 3.1 (0.8) (2.3) 2.2 0.7 17.8 (15.5) (2.3)1962 .................................... 8.0 3.6 3.0 (0.8) (2.2) 2.2 0.7 17.6 (15.4) (2.2)1963 .................................... 8.0 3.6 3.3 (0.9) (2.4) 2.2 0.7 17.8 (15.4) (2.4)1964 .................................... 7.6 3.7 3.4 (0.9) (2.6) 2.1 0.7 17.6 (15.0) (2.6)
1965 .................................... 7.1 3.7 3.2 (0.8) (2.4) 2.1 0.8 17.0 (14.6) (2.4)1966 .................................... 7.4 4.0 3.4 (0.9) (2.5) 1.7 0.9 17.4 (14.8) (2.5)1967 .................................... 7.6 4.2 4.0 (1.0) (3.0) 1.7 0.9 18.3 (15.3) (3.0)1968 .................................... 7.9 3.3 3.9 (1.0) (2.9) 1.6 0.9 17.6 (14.8) (2.9)1969 .................................... 9.2 3.9 4.1 (1.1) (3.1) 1.6 0.9 19.7 (16.7) (3.1)
1970 .................................... 9.0 3.3 4.4 (1.1) (3.3) 1.6 0.9 19.1 (15.8) (3.3)1971 .................................... 8.0 2.5 4.4 (1.1) (3.3) 1.5 0.9 17.4 (14.0) (3.3)1972 .................................... 8.0 2.7 4.5 (1.1) (3.4) 1.3 1.0 17.6 (14.2) (3.4)1973 .................................... 7.9 2.8 4.8 (1.3) (3.5) 1.2 0.9 17.7 (14.1) (3.5)1974 .................................... 8.3 2.7 5.2 (1.5) (3.7) 1.2 1.0 18.3 (14.6) (3.7)
1975 .................................... 7.9 2.6 5.4 (1.4) (4.0) 1.1 1.0 18.0 (13.9) (4.0)1976 .................................... 7.6 2.4 5.2 (1.4) (3.8) 1.0 1.0 17.2 (13.4) (3.8)TQ ....................................... 8.5 1.9 5.5 (1.6) (4.0) 1.0 0.9 17.9 (13.9) (4.0)1977 .................................... 8.0 2.8 5.4 (1.5) (3.9) 0.9 1.0 18.0 (14.1) (3.9)1978 .................................... 8.2 2.7 5.5 (1.6) (3.9) 0.8 0.9 18.1 (14.2) (3.9)1979 .................................... 8.7 2.6 5.6 (1.6) (3.9) 0.8 0.9 18.6 (14.6) (3.9)
1980 .................................... 9.0 2.4 5.8 (1.6) (4.2) 0.9 1.0 19.0 (14.9) (4.2)1981 .................................... 9.4 2.0 6.0 (1.7) (4.3) 1.3 0.9 19.7 (15.4) (4.3)1982 .................................... 9.3 1.5 6.3 (1.8) (4.5) 1.1 1.0 19.2 (14.8) (4.5)1983 .................................... 8.4 1.1 6.1 (1.8) (4.3) 1.0 0.9 17.6 (13.2) (4.3)1984 .................................... 7.8 1.5 6.3 (1.9) (4.4) 1.0 0.9 17.5 (13.1) (4.4)
1985 .................................... 8.2 1.5 6.5 (1.9) (4.5) 0.9 0.9 17.9 (13.4) (4.5)1986 .................................... 8.0 1.4 6.5 (1.9) (4.6) 0.8 0.9 17.6 (13.0) (4.6)1987 .................................... 8.5 1.8 6.6 (2.0) (4.6) 0.7 0.9 18.6 (13.9) (4.6)1988 .................................... 8.1 1.9 6.7 (1.9) (4.9) 0.7 0.9 18.4 (13.5) (4.9)1989 .................................... 8.3 1.9 6.7 (1.8) (4.9) 0.6 0.9 18.5 (13.6) (4.9)
* 0.05 percent or less.
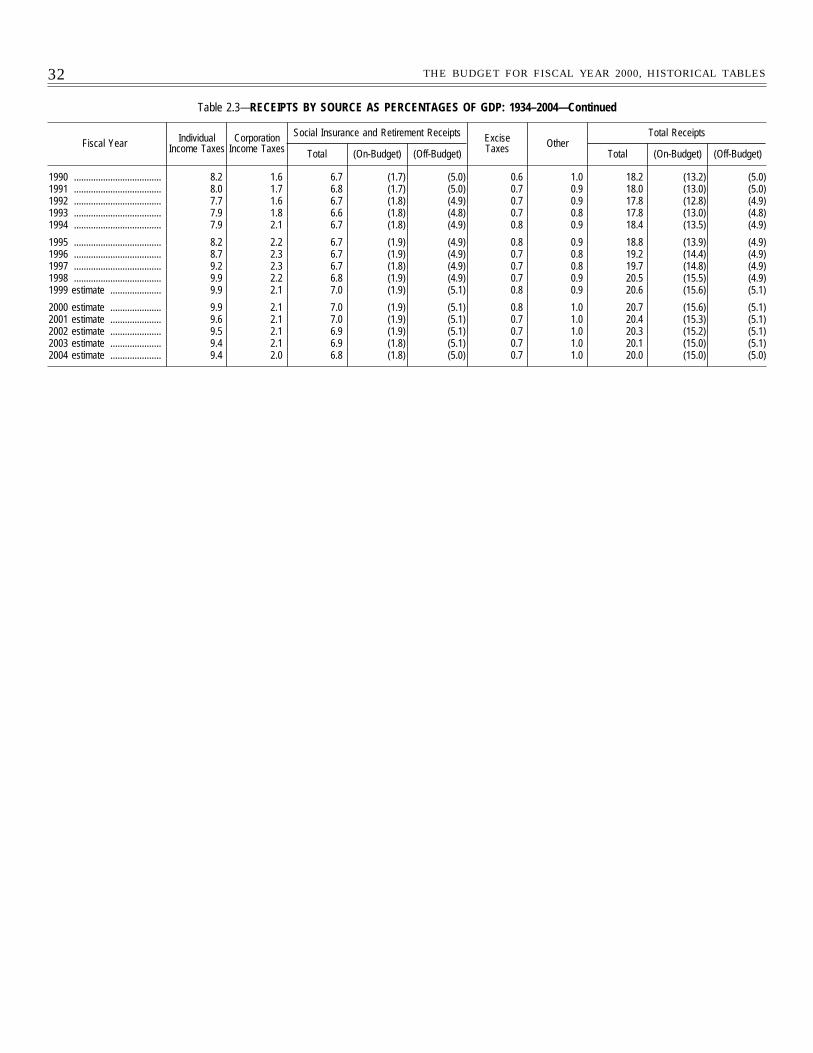
32 THE BUDGET FOR FISCAL YEAR 2000, HISTORICAL TABLES
Table 2.3—RECEIPTS BY SOURCE AS PERCENTAGES OF GDP: 1934–2004—Continued
Fiscal Year IndividualIncome Taxes
CorporationIncome Taxes
Social Insurance and Retirement Receipts ExciseTaxes Other
Total Receipts
Total (On-Budget) (Off-Budget) Total (On-Budget) (Off-Budget)
1990 .................................... 8.2 1.6 6.7 (1.7) (5.0) 0.6 1.0 18.2 (13.2) (5.0)1991 .................................... 8.0 1.7 6.8 (1.7) (5.0) 0.7 0.9 18.0 (13.0) (5.0)1992 .................................... 7.7 1.6 6.7 (1.8) (4.9) 0.7 0.9 17.8 (12.8) (4.9)1993 .................................... 7.9 1.8 6.6 (1.8) (4.8) 0.7 0.8 17.8 (13.0) (4.8)1994 .................................... 7.9 2.1 6.7 (1.8) (4.9) 0.8 0.9 18.4 (13.5) (4.9)
1995 .................................... 8.2 2.2 6.7 (1.9) (4.9) 0.8 0.9 18.8 (13.9) (4.9)1996 .................................... 8.7 2.3 6.7 (1.9) (4.9) 0.7 0.8 19.2 (14.4) (4.9)1997 .................................... 9.2 2.3 6.7 (1.8) (4.9) 0.7 0.8 19.7 (14.8) (4.9)1998 .................................... 9.9 2.2 6.8 (1.9) (4.9) 0.7 0.9 20.5 (15.5) (4.9)1999 estimate ..................... 9.9 2.1 7.0 (1.9) (5.1) 0.8 0.9 20.6 (15.6) (5.1)
2000 estimate ..................... 9.9 2.1 7.0 (1.9) (5.1) 0.8 1.0 20.7 (15.6) (5.1)2001 estimate ..................... 9.6 2.1 7.0 (1.9) (5.1) 0.7 1.0 20.4 (15.3) (5.1)2002 estimate ..................... 9.5 2.1 6.9 (1.9) (5.1) 0.7 1.0 20.3 (15.2) (5.1)2003 estimate ..................... 9.4 2.1 6.9 (1.8) (5.1) 0.7 1.0 20.1 (15.0) (5.1)2004 estimate ..................... 9.4 2.0 6.8 (1.8) (5.0) 0.7 1.0 20.0 (15.0) (5.0)
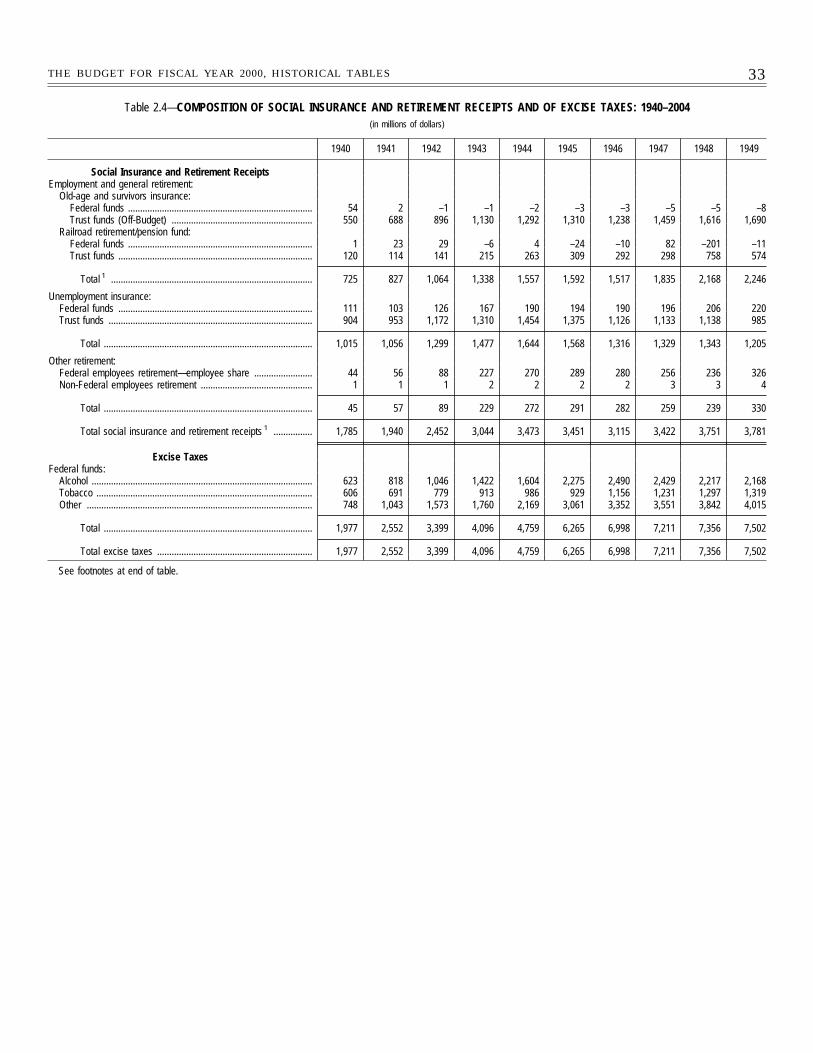
33THE BUDGET FOR FISCAL YEAR 2000, HISTORICAL TABLES
Table 2.4—COMPOSITION OF SOCIAL INSURANCE AND RETIREMENT RECEIPTS AND OF EXCISE TAXES: 1940–2004(in millions of dollars)
1940 1941 1942 1943 1944 1945 1946 1947 1948 1949
Social Insurance and Retirement ReceiptsEmployment and general retirement:
Old-age and survivors insurance:Federal funds ............................................................................ 54 2 –1 –1 –2 –3 –3 –5 –5 –8Trust funds (Off-Budget) .......................................................... 550 688 896 1,130 1,292 1,310 1,238 1,459 1,616 1,690
Railroad retirement/pension fund:Federal funds ............................................................................ 1 23 29 –6 4 –24 –10 82 –201 –11Trust funds ................................................................................ 120 114 141 215 263 309 292 298 758 574
Total 1 ................................................................................... 725 827 1,064 1,338 1,557 1,592 1,517 1,835 2,168 2,246
Unemployment insurance:Federal funds ................................................................................ 111 103 126 167 190 194 190 196 206 220Trust funds .................................................................................... 904 953 1,172 1,310 1,454 1,375 1,126 1,133 1,138 985
Total ...................................................................................... 1,015 1,056 1,299 1,477 1,644 1,568 1,316 1,329 1,343 1,205
Other retirement:Federal employees retirement—employee share ........................ 44 56 88 227 270 289 280 256 236 326Non-Federal employees retirement .............................................. 1 1 1 2 2 2 2 3 3 4
Total ...................................................................................... 45 57 89 229 272 291 282 259 239 330
Total social insurance and retirement receipts 1 ................ 1,785 1,940 2,452 3,044 3,473 3,451 3,115 3,422 3,751 3,781
Excise TaxesFederal funds:
Alcohol ........................................................................................... 623 818 1,046 1,422 1,604 2,275 2,490 2,429 2,217 2,168Tobacco ......................................................................................... 606 691 779 913 986 929 1,156 1,231 1,297 1,319Other ............................................................................................. 748 1,043 1,573 1,760 2,169 3,061 3,352 3,551 3,842 4,015
Total ...................................................................................... 1,977 2,552 3,399 4,096 4,759 6,265 6,998 7,211 7,356 7,502
Total excise taxes ................................................................ 1,977 2,552 3,399 4,096 4,759 6,265 6,998 7,211 7,356 7,502
See footnotes at end of table.
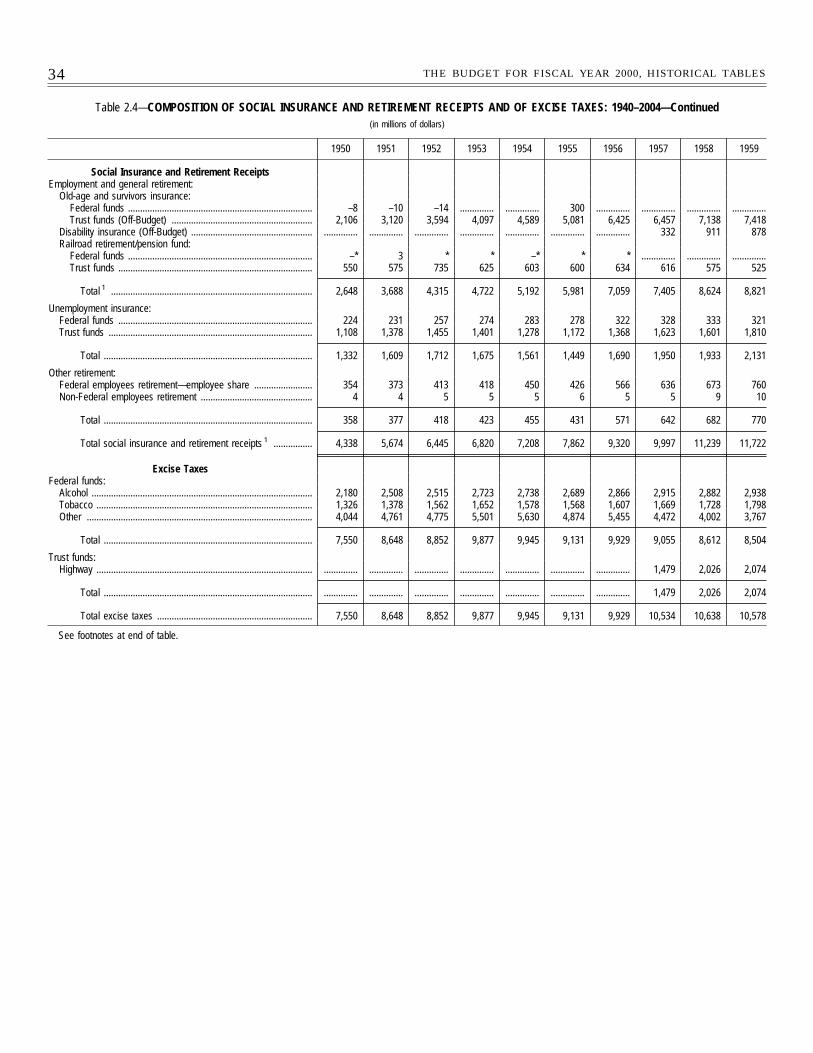
34 THE BUDGET FOR FISCAL YEAR 2000, HISTORICAL TABLES
Table 2.4—COMPOSITION OF SOCIAL INSURANCE AND RETIREMENT RECEIPTS AND OF EXCISE TAXES: 1940–2004—Continued(in millions of dollars)
1950 1951 1952 1953 1954 1955 1956 1957 1958 1959
Social Insurance and Retirement ReceiptsEmployment and general retirement:
Old-age and survivors insurance:Federal funds ............................................................................ –8 –10 –14 .............. .............. 300 .............. .............. .............. ..............Trust funds (Off-Budget) .......................................................... 2,106 3,120 3,594 4,097 4,589 5,081 6,425 6,457 7,138 7,418
Disability insurance (Off-Budget) .................................................. .............. .............. .............. .............. .............. .............. .............. 332 911 878Railroad retirement/pension fund:
Federal funds ............................................................................ –* 3 * * –* * * .............. .............. ..............Trust funds ................................................................................ 550 575 735 625 603 600 634 616 575 525
Total 1 ................................................................................... 2,648 3,688 4,315 4,722 5,192 5,981 7,059 7,405 8,624 8,821
Unemployment insurance:Federal funds ................................................................................ 224 231 257 274 283 278 322 328 333 321Trust funds .................................................................................... 1,108 1,378 1,455 1,401 1,278 1,172 1,368 1,623 1,601 1,810
Total ...................................................................................... 1,332 1,609 1,712 1,675 1,561 1,449 1,690 1,950 1,933 2,131
Other retirement:Federal employees retirement—employee share ........................ 354 373 413 418 450 426 566 636 673 760Non-Federal employees retirement .............................................. 4 4 5 5 5 6 5 5 9 10
Total ...................................................................................... 358 377 418 423 455 431 571 642 682 770
Total social insurance and retirement receipts 1 ................ 4,338 5,674 6,445 6,820 7,208 7,862 9,320 9,997 11,239 11,722
Excise TaxesFederal funds:
Alcohol ........................................................................................... 2,180 2,508 2,515 2,723 2,738 2,689 2,866 2,915 2,882 2,938Tobacco ......................................................................................... 1,326 1,378 1,562 1,652 1,578 1,568 1,607 1,669 1,728 1,798Other ............................................................................................. 4,044 4,761 4,775 5,501 5,630 4,874 5,455 4,472 4,002 3,767
Total ...................................................................................... 7,550 8,648 8,852 9,877 9,945 9,131 9,929 9,055 8,612 8,504
Trust funds:Highway ......................................................................................... .............. .............. .............. .............. .............. .............. .............. 1,479 2,026 2,074
Total ...................................................................................... .............. .............. .............. .............. .............. .............. .............. 1,479 2,026 2,074
Total excise taxes ................................................................ 7,550 8,648 8,852 9,877 9,945 9,131 9,929 10,534 10,638 10,578
See footnotes at end of table.
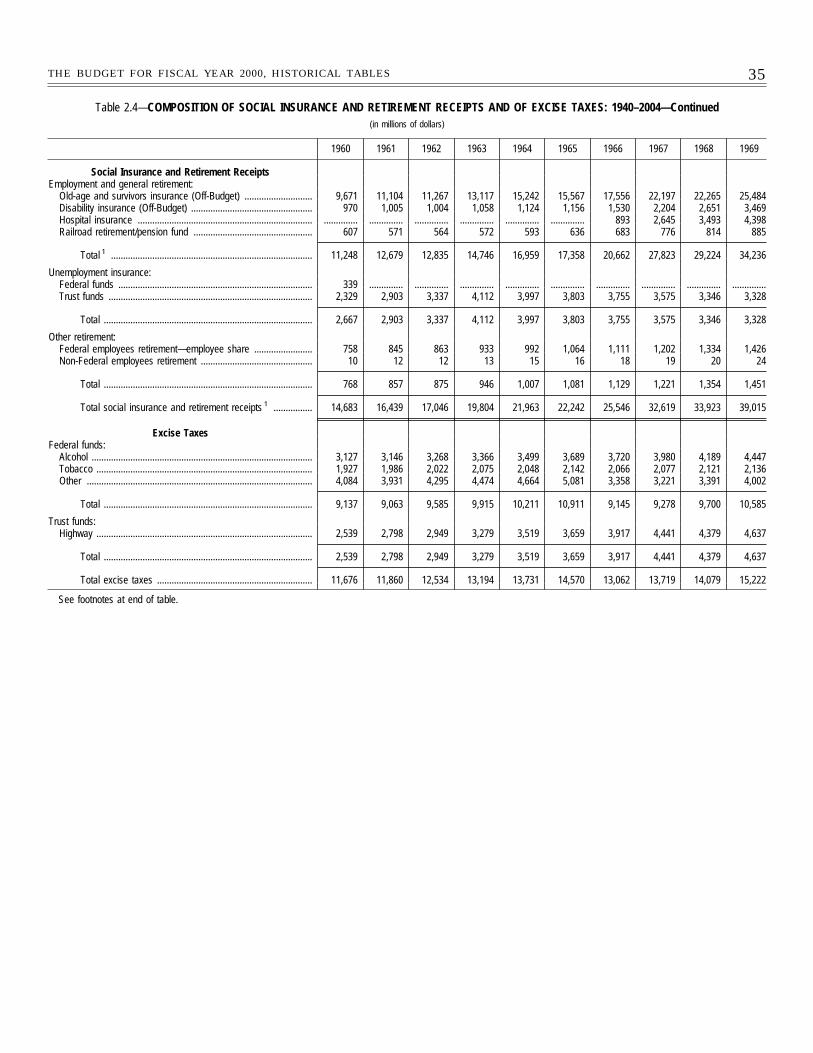
35THE BUDGET FOR FISCAL YEAR 2000, HISTORICAL TABLES
Table 2.4—COMPOSITION OF SOCIAL INSURANCE AND RETIREMENT RECEIPTS AND OF EXCISE TAXES: 1940–2004—Continued(in millions of dollars)
1960 1961 1962 1963 1964 1965 1966 1967 1968 1969
Social Insurance and Retirement ReceiptsEmployment and general retirement:
Old-age and survivors insurance (Off-Budget) ............................ 9,671 11,104 11,267 13,117 15,242 15,567 17,556 22,197 22,265 25,484Disability insurance (Off-Budget) .................................................. 970 1,005 1,004 1,058 1,124 1,156 1,530 2,204 2,651 3,469Hospital insurance ........................................................................ .............. .............. .............. .............. .............. .............. 893 2,645 3,493 4,398Railroad retirement/pension fund ................................................. 607 571 564 572 593 636 683 776 814 885
Total 1 ................................................................................... 11,248 12,679 12,835 14,746 16,959 17,358 20,662 27,823 29,224 34,236
Unemployment insurance:Federal funds ................................................................................ 339 .............. .............. .............. .............. .............. .............. .............. .............. ..............Trust funds .................................................................................... 2,329 2,903 3,337 4,112 3,997 3,803 3,755 3,575 3,346 3,328
Total ...................................................................................... 2,667 2,903 3,337 4,112 3,997 3,803 3,755 3,575 3,346 3,328
Other retirement:Federal employees retirement—employee share ........................ 758 845 863 933 992 1,064 1,111 1,202 1,334 1,426Non-Federal employees retirement .............................................. 10 12 12 13 15 16 18 19 20 24
Total ...................................................................................... 768 857 875 946 1,007 1,081 1,129 1,221 1,354 1,451
Total social insurance and retirement receipts 1 ................ 14,683 16,439 17,046 19,804 21,963 22,242 25,546 32,619 33,923 39,015
Excise TaxesFederal funds:
Alcohol ........................................................................................... 3,127 3,146 3,268 3,366 3,499 3,689 3,720 3,980 4,189 4,447Tobacco ......................................................................................... 1,927 1,986 2,022 2,075 2,048 2,142 2,066 2,077 2,121 2,136Other ............................................................................................. 4,084 3,931 4,295 4,474 4,664 5,081 3,358 3,221 3,391 4,002
Total ...................................................................................... 9,137 9,063 9,585 9,915 10,211 10,911 9,145 9,278 9,700 10,585
Trust funds:Highway ......................................................................................... 2,539 2,798 2,949 3,279 3,519 3,659 3,917 4,441 4,379 4,637
Total ...................................................................................... 2,539 2,798 2,949 3,279 3,519 3,659 3,917 4,441 4,379 4,637
Total excise taxes ................................................................ 11,676 11,860 12,534 13,194 13,731 14,570 13,062 13,719 14,079 15,222
See footnotes at end of table.
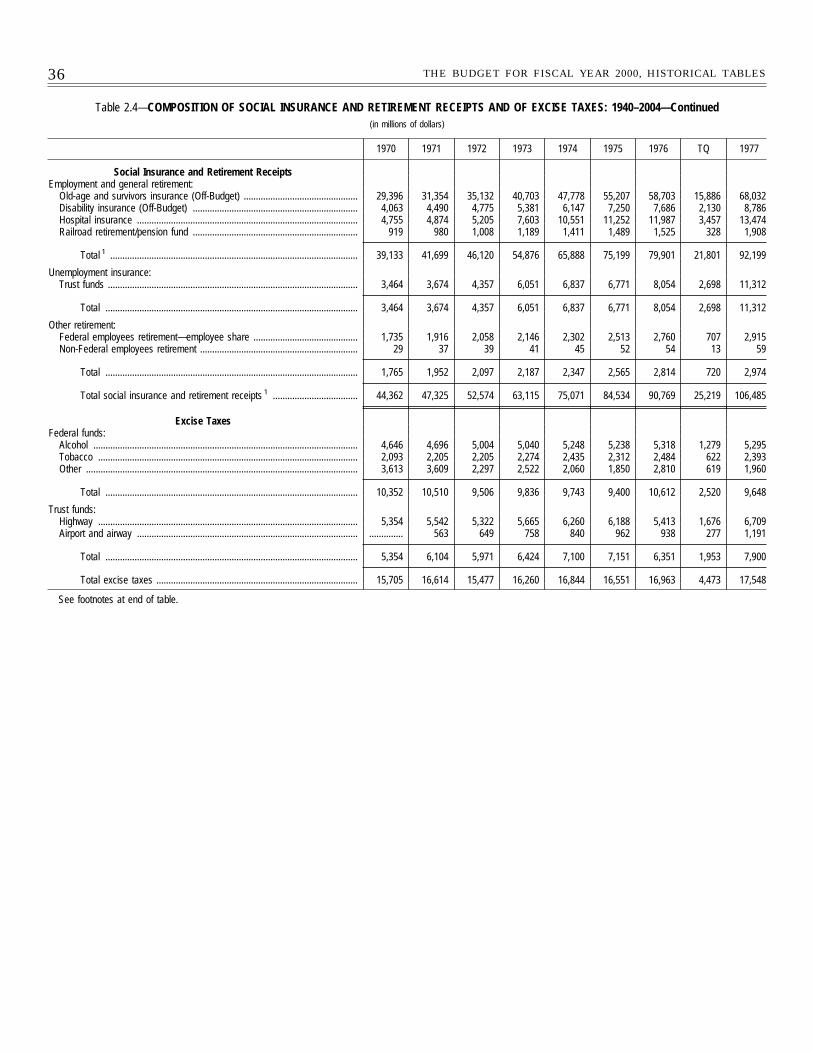
36 THE BUDGET FOR FISCAL YEAR 2000, HISTORICAL TABLES
Table 2.4—COMPOSITION OF SOCIAL INSURANCE AND RETIREMENT RECEIPTS AND OF EXCISE TAXES: 1940–2004—Continued(in millions of dollars)
1970 1971 1972 1973 1974 1975 1976 TQ 1977
Social Insurance and Retirement ReceiptsEmployment and general retirement:
Old-age and survivors insurance (Off-Budget) ............................................... 29,396 31,354 35,132 40,703 47,778 55,207 58,703 15,886 68,032Disability insurance (Off-Budget) .................................................................... 4,063 4,490 4,775 5,381 6,147 7,250 7,686 2,130 8,786Hospital insurance ........................................................................................... 4,755 4,874 5,205 7,603 10,551 11,252 11,987 3,457 13,474Railroad retirement/pension fund .................................................................... 919 980 1,008 1,189 1,411 1,489 1,525 328 1,908
Total 1 ...................................................................................................... 39,133 41,699 46,120 54,876 65,888 75,199 79,901 21,801 92,199
Unemployment insurance:Trust funds ....................................................................................................... 3,464 3,674 4,357 6,051 6,837 6,771 8,054 2,698 11,312
Total ........................................................................................................ 3,464 3,674 4,357 6,051 6,837 6,771 8,054 2,698 11,312
Other retirement:Federal employees retirement—employee share ........................................... 1,735 1,916 2,058 2,146 2,302 2,513 2,760 707 2,915Non-Federal employees retirement ................................................................. 29 37 39 41 45 52 54 13 59
Total ........................................................................................................ 1,765 1,952 2,097 2,187 2,347 2,565 2,814 720 2,974
Total social insurance and retirement receipts 1 ................................... 44,362 47,325 52,574 63,115 75,071 84,534 90,769 25,219 106,485
Excise TaxesFederal funds:
Alcohol ............................................................................................................. 4,646 4,696 5,004 5,040 5,248 5,238 5,318 1,279 5,295Tobacco ........................................................................................................... 2,093 2,205 2,205 2,274 2,435 2,312 2,484 622 2,393Other ................................................................................................................ 3,613 3,609 2,297 2,522 2,060 1,850 2,810 619 1,960
Total ........................................................................................................ 10,352 10,510 9,506 9,836 9,743 9,400 10,612 2,520 9,648
Trust funds:Highway ........................................................................................................... 5,354 5,542 5,322 5,665 6,260 6,188 5,413 1,676 6,709Airport and airway ........................................................................................... .............. 563 649 758 840 962 938 277 1,191
Total ........................................................................................................ 5,354 6,104 5,971 6,424 7,100 7,151 6,351 1,953 7,900
Total excise taxes ................................................................................... 15,705 16,614 15,477 16,260 16,844 16,551 16,963 4,473 17,548
See footnotes at end of table.
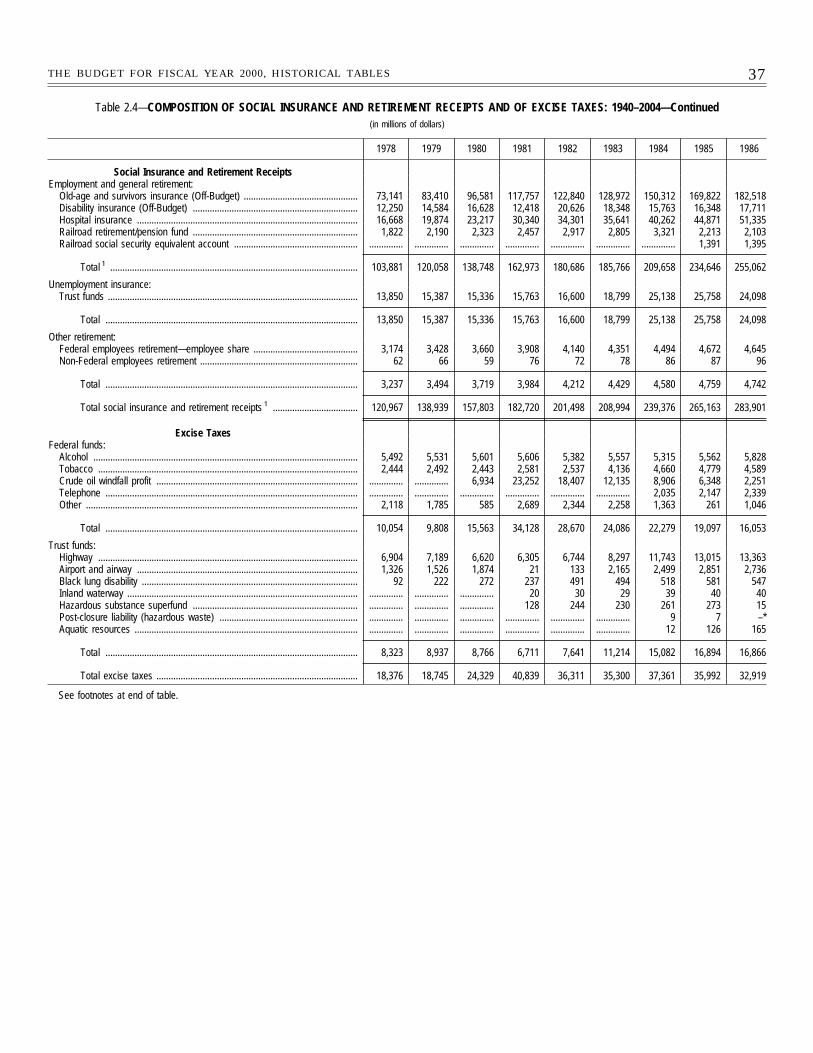
37THE BUDGET FOR FISCAL YEAR 2000, HISTORICAL TABLES
Table 2.4—COMPOSITION OF SOCIAL INSURANCE AND RETIREMENT RECEIPTS AND OF EXCISE TAXES: 1940–2004—Continued(in millions of dollars)
1978 1979 1980 1981 1982 1983 1984 1985 1986
Social Insurance and Retirement ReceiptsEmployment and general retirement:
Old-age and survivors insurance (Off-Budget) ............................................... 73,141 83,410 96,581 117,757 122,840 128,972 150,312 169,822 182,518Disability insurance (Off-Budget) .................................................................... 12,250 14,584 16,628 12,418 20,626 18,348 15,763 16,348 17,711Hospital insurance ........................................................................................... 16,668 19,874 23,217 30,340 34,301 35,641 40,262 44,871 51,335Railroad retirement/pension fund .................................................................... 1,822 2,190 2,323 2,457 2,917 2,805 3,321 2,213 2,103Railroad social security equivalent account ................................................... .............. .............. .............. .............. .............. .............. .............. 1,391 1,395
Total 1 ...................................................................................................... 103,881 120,058 138,748 162,973 180,686 185,766 209,658 234,646 255,062
Unemployment insurance:Trust funds ....................................................................................................... 13,850 15,387 15,336 15,763 16,600 18,799 25,138 25,758 24,098
Total ........................................................................................................ 13,850 15,387 15,336 15,763 16,600 18,799 25,138 25,758 24,098
Other retirement:Federal employees retirement—employee share ........................................... 3,174 3,428 3,660 3,908 4,140 4,351 4,494 4,672 4,645Non-Federal employees retirement ................................................................. 62 66 59 76 72 78 86 87 96
Total ........................................................................................................ 3,237 3,494 3,719 3,984 4,212 4,429 4,580 4,759 4,742
Total social insurance and retirement receipts 1 ................................... 120,967 138,939 157,803 182,720 201,498 208,994 239,376 265,163 283,901
Excise TaxesFederal funds:
Alcohol ............................................................................................................. 5,492 5,531 5,601 5,606 5,382 5,557 5,315 5,562 5,828Tobacco ........................................................................................................... 2,444 2,492 2,443 2,581 2,537 4,136 4,660 4,779 4,589Crude oil windfall profit ................................................................................... .............. .............. 6,934 23,252 18,407 12,135 8,906 6,348 2,251Telephone ........................................................................................................ .............. .............. .............. .............. .............. .............. 2,035 2,147 2,339Other ................................................................................................................ 2,118 1,785 585 2,689 2,344 2,258 1,363 261 1,046
Total ........................................................................................................ 10,054 9,808 15,563 34,128 28,670 24,086 22,279 19,097 16,053
Trust funds:Highway ........................................................................................................... 6,904 7,189 6,620 6,305 6,744 8,297 11,743 13,015 13,363Airport and airway ........................................................................................... 1,326 1,526 1,874 21 133 2,165 2,499 2,851 2,736Black lung disability ......................................................................................... 92 222 272 237 491 494 518 581 547Inland waterway ............................................................................................... .............. .............. .............. 20 30 29 39 40 40Hazardous substance superfund .................................................................... .............. .............. .............. 128 244 230 261 273 15Post-closure liability (hazardous waste) ......................................................... .............. .............. .............. .............. .............. .............. 9 7 –*Aquatic resources ............................................................................................ .............. .............. .............. .............. .............. .............. 12 126 165
Total ........................................................................................................ 8,323 8,937 8,766 6,711 7,641 11,214 15,082 16,894 16,866
Total excise taxes ................................................................................... 18,376 18,745 24,329 40,839 36,311 35,300 37,361 35,992 32,919
See footnotes at end of table.
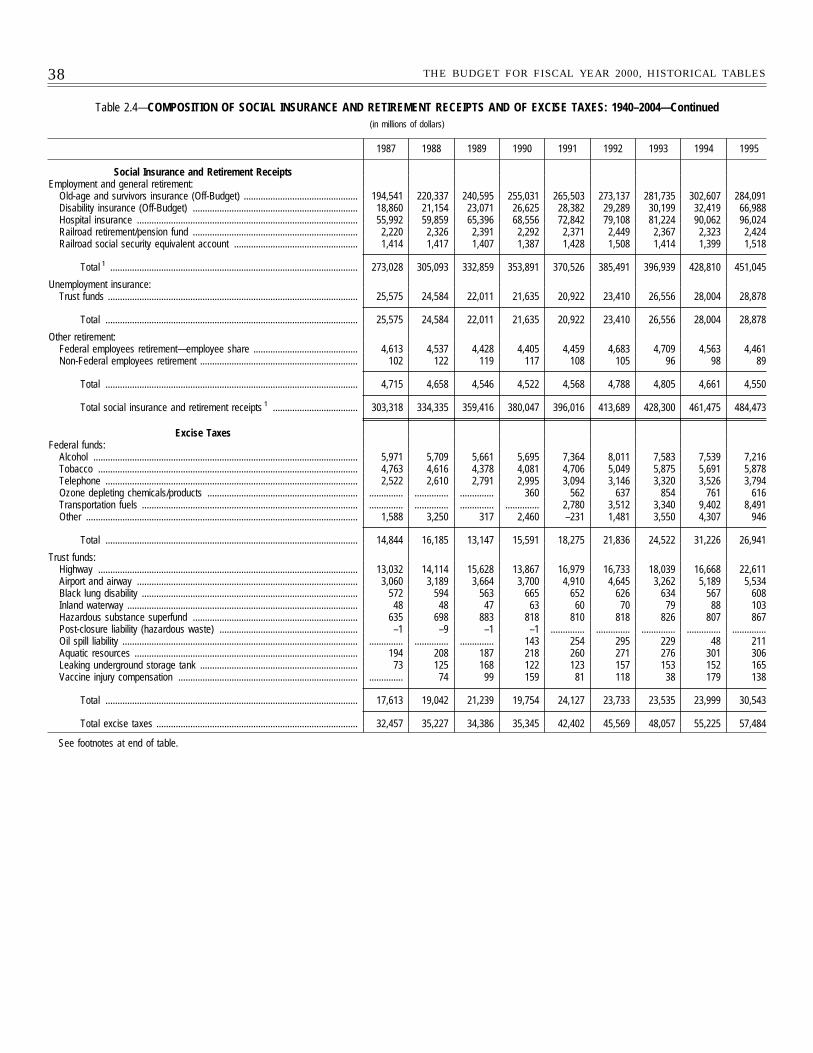
38 THE BUDGET FOR FISCAL YEAR 2000, HISTORICAL TABLES
Table 2.4—COMPOSITION OF SOCIAL INSURANCE AND RETIREMENT RECEIPTS AND OF EXCISE TAXES: 1940–2004—Continued(in millions of dollars)
1987 1988 1989 1990 1991 1992 1993 1994 1995
Social Insurance and Retirement ReceiptsEmployment and general retirement:
Old-age and survivors insurance (Off-Budget) ............................................... 194,541 220,337 240,595 255,031 265,503 273,137 281,735 302,607 284,091Disability insurance (Off-Budget) .................................................................... 18,860 21,154 23,071 26,625 28,382 29,289 30,199 32,419 66,988Hospital insurance ........................................................................................... 55,992 59,859 65,396 68,556 72,842 79,108 81,224 90,062 96,024Railroad retirement/pension fund .................................................................... 2,220 2,326 2,391 2,292 2,371 2,449 2,367 2,323 2,424Railroad social security equivalent account ................................................... 1,414 1,417 1,407 1,387 1,428 1,508 1,414 1,399 1,518
Total 1 ...................................................................................................... 273,028 305,093 332,859 353,891 370,526 385,491 396,939 428,810 451,045
Unemployment insurance:Trust funds ....................................................................................................... 25,575 24,584 22,011 21,635 20,922 23,410 26,556 28,004 28,878
Total ........................................................................................................ 25,575 24,584 22,011 21,635 20,922 23,410 26,556 28,004 28,878
Other retirement:Federal employees retirement—employee share ........................................... 4,613 4,537 4,428 4,405 4,459 4,683 4,709 4,563 4,461Non-Federal employees retirement ................................................................. 102 122 119 117 108 105 96 98 89
Total ........................................................................................................ 4,715 4,658 4,546 4,522 4,568 4,788 4,805 4,661 4,550
Total social insurance and retirement receipts 1 ................................... 303,318 334,335 359,416 380,047 396,016 413,689 428,300 461,475 484,473
Excise TaxesFederal funds:
Alcohol ............................................................................................................. 5,971 5,709 5,661 5,695 7,364 8,011 7,583 7,539 7,216Tobacco ........................................................................................................... 4,763 4,616 4,378 4,081 4,706 5,049 5,875 5,691 5,878Telephone ........................................................................................................ 2,522 2,610 2,791 2,995 3,094 3,146 3,320 3,526 3,794Ozone depleting chemicals/products .............................................................. .............. .............. .............. 360 562 637 854 761 616Transportation fuels ......................................................................................... .............. .............. .............. .............. 2,780 3,512 3,340 9,402 8,491Other ................................................................................................................ 1,588 3,250 317 2,460 –231 1,481 3,550 4,307 946
Total ........................................................................................................ 14,844 16,185 13,147 15,591 18,275 21,836 24,522 31,226 26,941
Trust funds:Highway ........................................................................................................... 13,032 14,114 15,628 13,867 16,979 16,733 18,039 16,668 22,611Airport and airway ........................................................................................... 3,060 3,189 3,664 3,700 4,910 4,645 3,262 5,189 5,534Black lung disability ......................................................................................... 572 594 563 665 652 626 634 567 608Inland waterway ............................................................................................... 48 48 47 63 60 70 79 88 103Hazardous substance superfund .................................................................... 635 698 883 818 810 818 826 807 867Post-closure liability (hazardous waste) ......................................................... –1 –9 –1 –1 .............. .............. .............. .............. ..............Oil spill liability ................................................................................................. .............. .............. .............. 143 254 295 229 48 211Aquatic resources ............................................................................................ 194 208 187 218 260 271 276 301 306Leaking underground storage tank ................................................................. 73 125 168 122 123 157 153 152 165Vaccine injury compensation .......................................................................... .............. 74 99 159 81 118 38 179 138
Total ........................................................................................................ 17,613 19,042 21,239 19,754 24,127 23,733 23,535 23,999 30,543
Total excise taxes ................................................................................... 32,457 35,227 34,386 35,345 42,402 45,569 48,057 55,225 57,484
See footnotes at end of table.
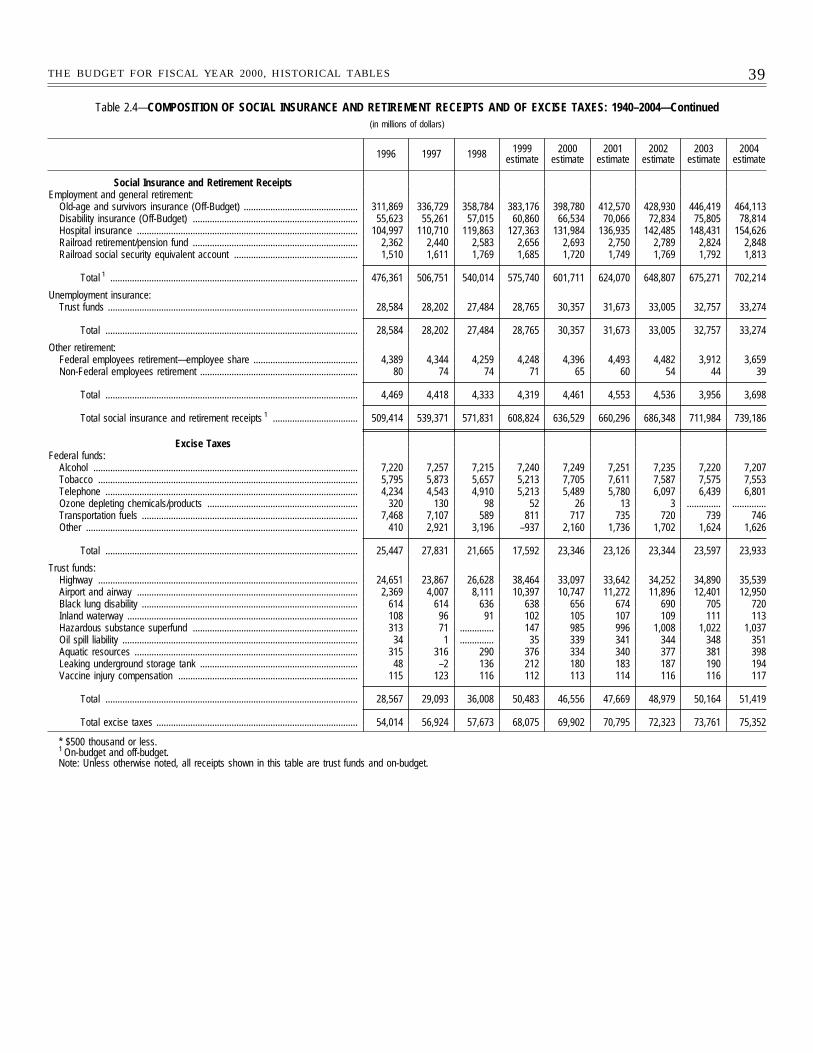
39THE BUDGET FOR FISCAL YEAR 2000, HISTORICAL TABLES
Table 2.4—COMPOSITION OF SOCIAL INSURANCE AND RETIREMENT RECEIPTS AND OF EXCISE TAXES: 1940–2004—Continued(in millions of dollars)
1996 1997 1998 1999estimate
2000estimate
2001estimate
2002estimate
2003estimate
2004estimate
Social Insurance and Retirement ReceiptsEmployment and general retirement:
Old-age and survivors insurance (Off-Budget) ............................................... 311,869 336,729 358,784 383,176 398,780 412,570 428,930 446,419 464,113Disability insurance (Off-Budget) .................................................................... 55,623 55,261 57,015 60,860 66,534 70,066 72,834 75,805 78,814Hospital insurance ........................................................................................... 104,997 110,710 119,863 127,363 131,984 136,935 142,485 148,431 154,626Railroad retirement/pension fund .................................................................... 2,362 2,440 2,583 2,656 2,693 2,750 2,789 2,824 2,848Railroad social security equivalent account ................................................... 1,510 1,611 1,769 1,685 1,720 1,749 1,769 1,792 1,813
Total 1 ...................................................................................................... 476,361 506,751 540,014 575,740 601,711 624,070 648,807 675,271 702,214
Unemployment insurance:Trust funds ....................................................................................................... 28,584 28,202 27,484 28,765 30,357 31,673 33,005 32,757 33,274
Total ........................................................................................................ 28,584 28,202 27,484 28,765 30,357 31,673 33,005 32,757 33,274
Other retirement:Federal employees retirement—employee share ........................................... 4,389 4,344 4,259 4,248 4,396 4,493 4,482 3,912 3,659Non-Federal employees retirement ................................................................. 80 74 74 71 65 60 54 44 39
Total ........................................................................................................ 4,469 4,418 4,333 4,319 4,461 4,553 4,536 3,956 3,698
Total social insurance and retirement receipts 1 ................................... 509,414 539,371 571,831 608,824 636,529 660,296 686,348 711,984 739,186
Excise TaxesFederal funds:
Alcohol ............................................................................................................. 7,220 7,257 7,215 7,240 7,249 7,251 7,235 7,220 7,207Tobacco ........................................................................................................... 5,795 5,873 5,657 5,213 7,705 7,611 7,587 7,575 7,553Telephone ........................................................................................................ 4,234 4,543 4,910 5,213 5,489 5,780 6,097 6,439 6,801Ozone depleting chemicals/products .............................................................. 320 130 98 52 26 13 3 .............. ..............Transportation fuels ......................................................................................... 7,468 7,107 589 811 717 735 720 739 746Other ................................................................................................................ 410 2,921 3,196 –937 2,160 1,736 1,702 1,624 1,626
Total ........................................................................................................ 25,447 27,831 21,665 17,592 23,346 23,126 23,344 23,597 23,933
Trust funds:Highway ........................................................................................................... 24,651 23,867 26,628 38,464 33,097 33,642 34,252 34,890 35,539Airport and airway ........................................................................................... 2,369 4,007 8,111 10,397 10,747 11,272 11,896 12,401 12,950Black lung disability ......................................................................................... 614 614 636 638 656 674 690 705 720Inland waterway ............................................................................................... 108 96 91 102 105 107 109 111 113Hazardous substance superfund .................................................................... 313 71 .............. 147 985 996 1,008 1,022 1,037Oil spill liability ................................................................................................. 34 1 .............. 35 339 341 344 348 351Aquatic resources ............................................................................................ 315 316 290 376 334 340 377 381 398Leaking underground storage tank ................................................................. 48 –2 136 212 180 183 187 190 194Vaccine injury compensation .......................................................................... 115 123 116 112 113 114 116 116 117
Total ........................................................................................................ 28,567 29,093 36,008 50,483 46,556 47,669 48,979 50,164 51,419
Total excise taxes ................................................................................... 54,014 56,924 57,673 68,075 69,902 70,795 72,323 73,761 75,352
* $500 thousand or less.1 On-budget and off-budget.Note: Unless otherwise noted, all receipts shown in this table are trust funds and on-budget.
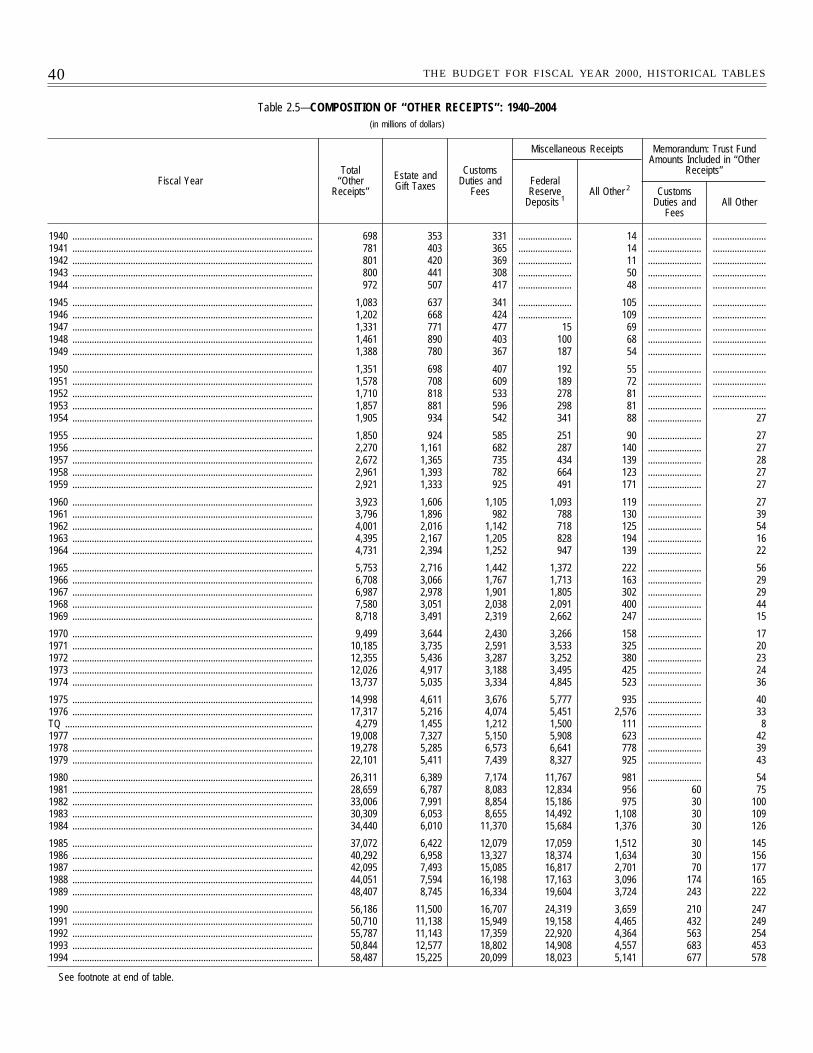
40 THE BUDGET FOR FISCAL YEAR 2000, HISTORICAL TABLES
Table 2.5—COMPOSITION OF ‘‘OTHER RECEIPTS’’: 1940–2004(in millions of dollars)
Fiscal YearTotal
‘‘OtherReceipts’’
Estate andGift Taxes
CustomsDuties and
Fees
Miscellaneous Receipts Memorandum: Trust FundAmounts Included in ‘‘Other
Receipts’’FederalReserve
Deposits 1All Other 2 Customs
Duties andFees
All Other
1940 ................................................................................................... 698 353 331 ...................... 14 ...................... ......................1941 ................................................................................................... 781 403 365 ...................... 14 ...................... ......................1942 ................................................................................................... 801 420 369 ...................... 11 ...................... ......................1943 ................................................................................................... 800 441 308 ...................... 50 ...................... ......................1944 ................................................................................................... 972 507 417 ...................... 48 ...................... ......................
1945 ................................................................................................... 1,083 637 341 ...................... 105 ...................... ......................1946 ................................................................................................... 1,202 668 424 ...................... 109 ...................... ......................1947 ................................................................................................... 1,331 771 477 15 69 ...................... ......................1948 ................................................................................................... 1,461 890 403 100 68 ...................... ......................1949 ................................................................................................... 1,388 780 367 187 54 ...................... ......................
1950 ................................................................................................... 1,351 698 407 192 55 ...................... ......................1951 ................................................................................................... 1,578 708 609 189 72 ...................... ......................1952 ................................................................................................... 1,710 818 533 278 81 ...................... ......................1953 ................................................................................................... 1,857 881 596 298 81 ...................... ......................1954 ................................................................................................... 1,905 934 542 341 88 ...................... 27
1955 ................................................................................................... 1,850 924 585 251 90 ...................... 271956 ................................................................................................... 2,270 1,161 682 287 140 ...................... 271957 ................................................................................................... 2,672 1,365 735 434 139 ...................... 281958 ................................................................................................... 2,961 1,393 782 664 123 ...................... 271959 ................................................................................................... 2,921 1,333 925 491 171 ...................... 27
1960 ................................................................................................... 3,923 1,606 1,105 1,093 119 ...................... 271961 ................................................................................................... 3,796 1,896 982 788 130 ...................... 391962 ................................................................................................... 4,001 2,016 1,142 718 125 ...................... 541963 ................................................................................................... 4,395 2,167 1,205 828 194 ...................... 161964 ................................................................................................... 4,731 2,394 1,252 947 139 ...................... 22
1965 ................................................................................................... 5,753 2,716 1,442 1,372 222 ...................... 561966 ................................................................................................... 6,708 3,066 1,767 1,713 163 ...................... 291967 ................................................................................................... 6,987 2,978 1,901 1,805 302 ...................... 291968 ................................................................................................... 7,580 3,051 2,038 2,091 400 ...................... 441969 ................................................................................................... 8,718 3,491 2,319 2,662 247 ...................... 15
1970 ................................................................................................... 9,499 3,644 2,430 3,266 158 ...................... 171971 ................................................................................................... 10,185 3,735 2,591 3,533 325 ...................... 201972 ................................................................................................... 12,355 5,436 3,287 3,252 380 ...................... 231973 ................................................................................................... 12,026 4,917 3,188 3,495 425 ...................... 241974 ................................................................................................... 13,737 5,035 3,334 4,845 523 ...................... 36
1975 ................................................................................................... 14,998 4,611 3,676 5,777 935 ...................... 401976 ................................................................................................... 17,317 5,216 4,074 5,451 2,576 ...................... 33TQ ...................................................................................................... 4,279 1,455 1,212 1,500 111 ...................... 81977 ................................................................................................... 19,008 7,327 5,150 5,908 623 ...................... 421978 ................................................................................................... 19,278 5,285 6,573 6,641 778 ...................... 391979 ................................................................................................... 22,101 5,411 7,439 8,327 925 ...................... 43
1980 ................................................................................................... 26,311 6,389 7,174 11,767 981 ...................... 541981 ................................................................................................... 28,659 6,787 8,083 12,834 956 60 751982 ................................................................................................... 33,006 7,991 8,854 15,186 975 30 1001983 ................................................................................................... 30,309 6,053 8,655 14,492 1,108 30 1091984 ................................................................................................... 34,440 6,010 11,370 15,684 1,376 30 126
1985 ................................................................................................... 37,072 6,422 12,079 17,059 1,512 30 1451986 ................................................................................................... 40,292 6,958 13,327 18,374 1,634 30 1561987 ................................................................................................... 42,095 7,493 15,085 16,817 2,701 70 1771988 ................................................................................................... 44,051 7,594 16,198 17,163 3,096 174 1651989 ................................................................................................... 48,407 8,745 16,334 19,604 3,724 243 222
1990 ................................................................................................... 56,186 11,500 16,707 24,319 3,659 210 2471991 ................................................................................................... 50,710 11,138 15,949 19,158 4,465 432 2491992 ................................................................................................... 55,787 11,143 17,359 22,920 4,364 563 2541993 ................................................................................................... 50,844 12,577 18,802 14,908 4,557 683 4531994 ................................................................................................... 58,487 15,225 20,099 18,023 5,141 677 578
See footnote at end of table.
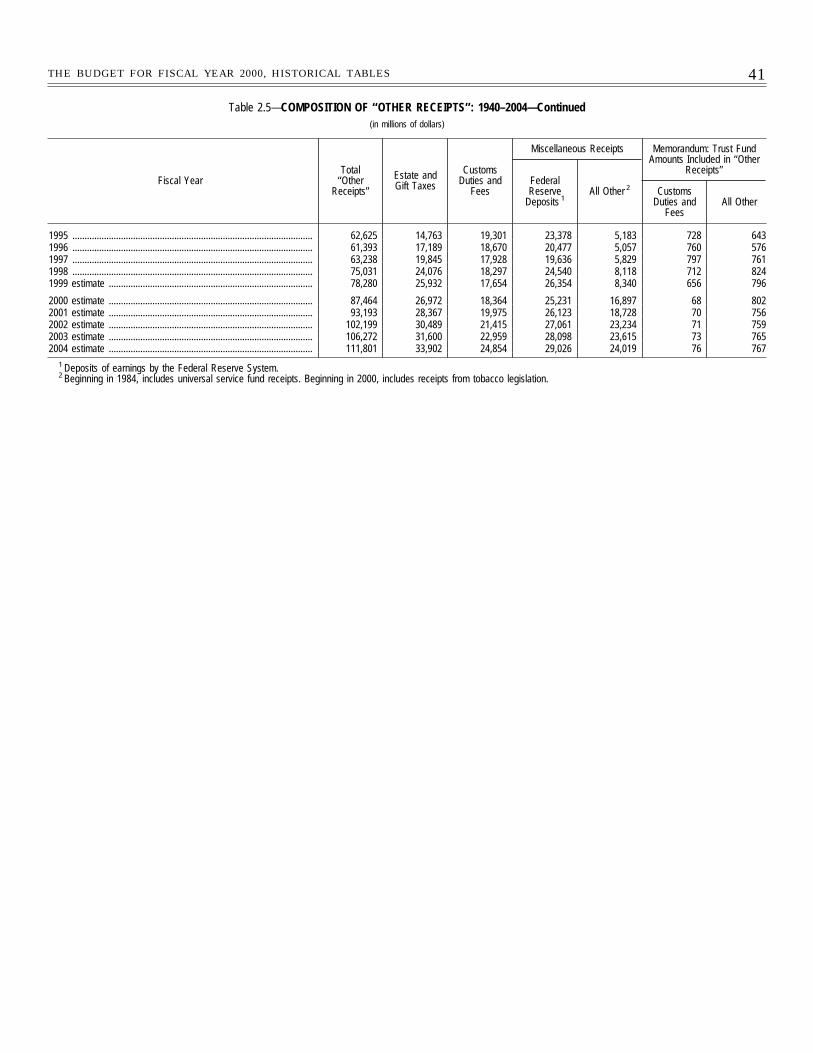
41THE BUDGET FOR FISCAL YEAR 2000, HISTORICAL TABLES
Table 2.5—COMPOSITION OF ‘‘OTHER RECEIPTS’’: 1940–2004—Continued(in millions of dollars)
Fiscal YearTotal
‘‘OtherReceipts’’
Estate andGift Taxes
CustomsDuties and
Fees
Miscellaneous Receipts Memorandum: Trust FundAmounts Included in ‘‘Other
Receipts’’FederalReserve
Deposits 1All Other 2 Customs
Duties andFees
All Other
1995 ................................................................................................... 62,625 14,763 19,301 23,378 5,183 728 6431996 ................................................................................................... 61,393 17,189 18,670 20,477 5,057 760 5761997 ................................................................................................... 63,238 19,845 17,928 19,636 5,829 797 7611998 ................................................................................................... 75,031 24,076 18,297 24,540 8,118 712 8241999 estimate .................................................................................... 78,280 25,932 17,654 26,354 8,340 656 796
2000 estimate .................................................................................... 87,464 26,972 18,364 25,231 16,897 68 8022001 estimate .................................................................................... 93,193 28,367 19,975 26,123 18,728 70 7562002 estimate .................................................................................... 102,199 30,489 21,415 27,061 23,234 71 7592003 estimate .................................................................................... 106,272 31,600 22,959 28,098 23,615 73 7652004 estimate .................................................................................... 111,801 33,902 24,854 29,026 24,019 76 767
1 Deposits of earnings by the Federal Reserve System.2 Beginning in 1984, includes universal service fund receipts. Beginning in 2000, includes receipts from tobacco legislation.
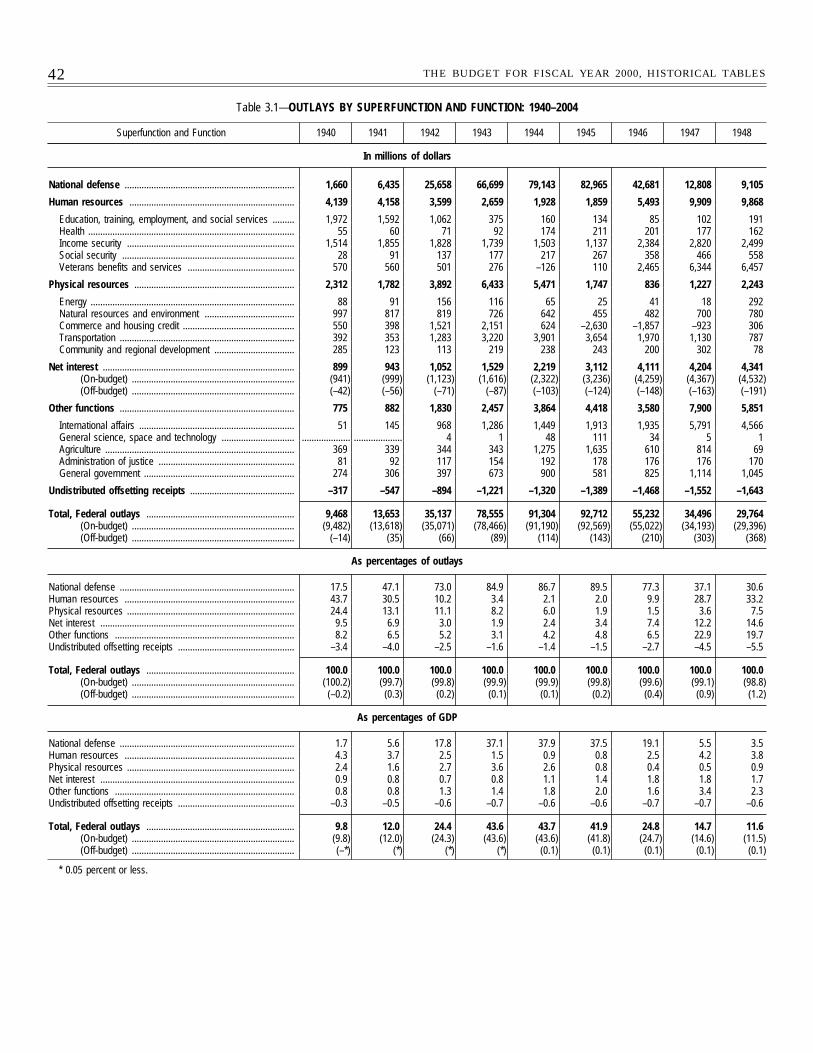
42 THE BUDGET FOR FISCAL YEAR 2000, HISTORICAL TABLES
Table 3.1—OUTLAYS BY SUPERFUNCTION AND FUNCTION: 1940–2004
Superfunction and Function 1940 1941 1942 1943 1944 1945 1946 1947 1948
In millions of dollars
National defense ...................................................................... 1,660 6,435 25,658 66,699 79,143 82,965 42,681 12,808 9,105
Human resources .................................................................... 4,139 4,158 3,599 2,659 1,928 1,859 5,493 9,909 9,868
Education, training, employment, and social services ......... 1,972 1,592 1,062 375 160 134 85 102 191Health ..................................................................................... 55 60 71 92 174 211 201 177 162Income security ..................................................................... 1,514 1,855 1,828 1,739 1,503 1,137 2,384 2,820 2,499Social security ....................................................................... 28 91 137 177 217 267 358 466 558Veterans benefits and services ............................................ 570 560 501 276 –126 110 2,465 6,344 6,457
Physical resources .................................................................. 2,312 1,782 3,892 6,433 5,471 1,747 836 1,227 2,243
Energy .................................................................................... 88 91 156 116 65 25 41 18 292Natural resources and environment ..................................... 997 817 819 726 642 455 482 700 780Commerce and housing credit .............................................. 550 398 1,521 2,151 624 –2,630 –1,857 –923 306Transportation ........................................................................ 392 353 1,283 3,220 3,901 3,654 1,970 1,130 787Community and regional development ................................. 285 123 113 219 238 243 200 302 78
Net interest ............................................................................... 899 943 1,052 1,529 2,219 3,112 4,111 4,204 4,341(On-budget) ................................................................... (941) (999) (1,123) (1,616) (2,322) (3,236) (4,259) (4,367) (4,532)(Off-budget) ................................................................... (–42) (–56) (–71) (–87) (–103) (–124) (–148) (–163) (–191)
Other functions ........................................................................ 775 882 1,830 2,457 3,864 4,418 3,580 7,900 5,851
International affairs ................................................................ 51 145 968 1,286 1,449 1,913 1,935 5,791 4,566General science, space and technology .............................. .................... .................... 4 1 48 111 34 5 1Agriculture .............................................................................. 369 339 344 343 1,275 1,635 610 814 69Administration of justice ........................................................ 81 92 117 154 192 178 176 176 170General government .............................................................. 274 306 397 673 900 581 825 1,114 1,045
Undistributed offsetting receipts ........................................... –317 –547 –894 –1,221 –1,320 –1,389 –1,468 –1,552 –1,643
Total, Federal outlays ............................................................. 9,468 13,653 35,137 78,555 91,304 92,712 55,232 34,496 29,764(On-budget) ................................................................... (9,482) (13,618) (35,071) (78,466) (91,190) (92,569) (55,022) (34,193) (29,396)(Off-budget) ................................................................... (–14) (35) (66) (89) (114) (143) (210) (303) (368)
As percentages of outlays
National defense ........................................................................ 17.5 47.1 73.0 84.9 86.7 89.5 77.3 37.1 30.6Human resources ...................................................................... 43.7 30.5 10.2 3.4 2.1 2.0 9.9 28.7 33.2Physical resources ..................................................................... 24.4 13.1 11.1 8.2 6.0 1.9 1.5 3.6 7.5Net interest ................................................................................ 9.5 6.9 3.0 1.9 2.4 3.4 7.4 12.2 14.6Other functions .......................................................................... 8.2 6.5 5.2 3.1 4.2 4.8 6.5 22.9 19.7Undistributed offsetting receipts ................................................ –3.4 –4.0 –2.5 –1.6 –1.4 –1.5 –2.7 –4.5 –5.5
Total, Federal outlays ............................................................. 100.0 100.0 100.0 100.0 100.0 100.0 100.0 100.0 100.0(On-budget) ................................................................... (100.2) (99.7) (99.8) (99.9) (99.9) (99.8) (99.6) (99.1) (98.8)(Off-budget) ................................................................... (–0.2) (0.3) (0.2) (0.1) (0.1) (0.2) (0.4) (0.9) (1.2)
As percentages of GDP
National defense ........................................................................ 1.7 5.6 17.8 37.1 37.9 37.5 19.1 5.5 3.5Human resources ...................................................................... 4.3 3.7 2.5 1.5 0.9 0.8 2.5 4.2 3.8Physical resources ..................................................................... 2.4 1.6 2.7 3.6 2.6 0.8 0.4 0.5 0.9Net interest ................................................................................ 0.9 0.8 0.7 0.8 1.1 1.4 1.8 1.8 1.7Other functions .......................................................................... 0.8 0.8 1.3 1.4 1.8 2.0 1.6 3.4 2.3Undistributed offsetting receipts ................................................ –0.3 –0.5 –0.6 –0.7 –0.6 –0.6 –0.7 –0.7 –0.6
Total, Federal outlays ............................................................. 9.8 12.0 24.4 43.6 43.7 41.9 24.8 14.7 11.6(On-budget) ................................................................... (9.8) (12.0) (24.3) (43.6) (43.6) (41.8) (24.7) (14.6) (11.5)(Off-budget) ................................................................... (–*) (*) (*) (*) (0.1) (0.1) (0.1) (0.1) (0.1)
* 0.05 percent or less.
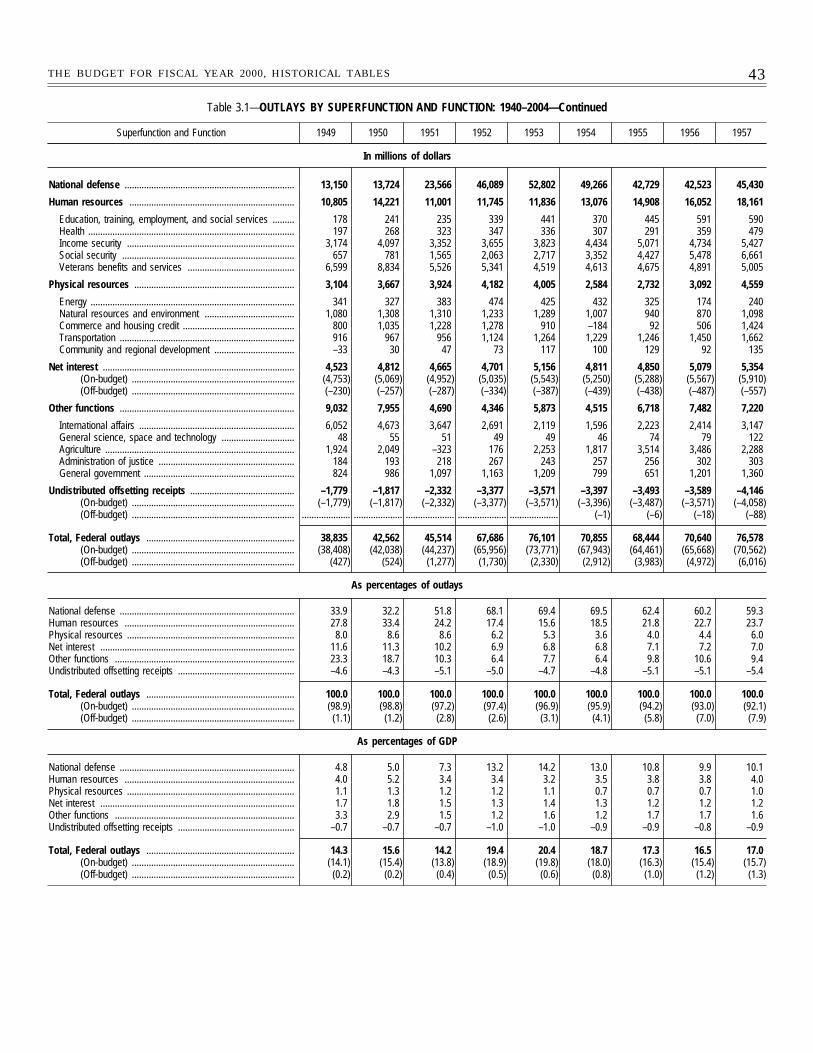
43THE BUDGET FOR FISCAL YEAR 2000, HISTORICAL TABLES
Table 3.1—OUTLAYS BY SUPERFUNCTION AND FUNCTION: 1940–2004—Continued
Superfunction and Function 1949 1950 1951 1952 1953 1954 1955 1956 1957
In millions of dollars
National defense ...................................................................... 13,150 13,724 23,566 46,089 52,802 49,266 42,729 42,523 45,430
Human resources .................................................................... 10,805 14,221 11,001 11,745 11,836 13,076 14,908 16,052 18,161
Education, training, employment, and social services ......... 178 241 235 339 441 370 445 591 590Health ..................................................................................... 197 268 323 347 336 307 291 359 479Income security ..................................................................... 3,174 4,097 3,352 3,655 3,823 4,434 5,071 4,734 5,427Social security ....................................................................... 657 781 1,565 2,063 2,717 3,352 4,427 5,478 6,661Veterans benefits and services ............................................ 6,599 8,834 5,526 5,341 4,519 4,613 4,675 4,891 5,005
Physical resources .................................................................. 3,104 3,667 3,924 4,182 4,005 2,584 2,732 3,092 4,559
Energy .................................................................................... 341 327 383 474 425 432 325 174 240Natural resources and environment ..................................... 1,080 1,308 1,310 1,233 1,289 1,007 940 870 1,098Commerce and housing credit .............................................. 800 1,035 1,228 1,278 910 –184 92 506 1,424Transportation ........................................................................ 916 967 956 1,124 1,264 1,229 1,246 1,450 1,662Community and regional development ................................. –33 30 47 73 117 100 129 92 135
Net interest ............................................................................... 4,523 4,812 4,665 4,701 5,156 4,811 4,850 5,079 5,354(On-budget) ................................................................... (4,753) (5,069) (4,952) (5,035) (5,543) (5,250) (5,288) (5,567) (5,910)(Off-budget) ................................................................... (–230) (–257) (–287) (–334) (–387) (–439) (–438) (–487) (–557)
Other functions ........................................................................ 9,032 7,955 4,690 4,346 5,873 4,515 6,718 7,482 7,220
International affairs ................................................................ 6,052 4,673 3,647 2,691 2,119 1,596 2,223 2,414 3,147General science, space and technology .............................. 48 55 51 49 49 46 74 79 122Agriculture .............................................................................. 1,924 2,049 –323 176 2,253 1,817 3,514 3,486 2,288Administration of justice ........................................................ 184 193 218 267 243 257 256 302 303General government .............................................................. 824 986 1,097 1,163 1,209 799 651 1,201 1,360
Undistributed offsetting receipts ........................................... –1,779 –1,817 –2,332 –3,377 –3,571 –3,397 –3,493 –3,589 –4,146(On-budget) ................................................................... (–1,779) (–1,817) (–2,332) (–3,377) (–3,571) (–3,396) (–3,487) (–3,571) (–4,058)(Off-budget) ................................................................... .................... .................... .................... .................... .................... (–1) (–6) (–18) (–88)
Total, Federal outlays ............................................................. 38,835 42,562 45,514 67,686 76,101 70,855 68,444 70,640 76,578(On-budget) ................................................................... (38,408) (42,038) (44,237) (65,956) (73,771) (67,943) (64,461) (65,668) (70,562)(Off-budget) ................................................................... (427) (524) (1,277) (1,730) (2,330) (2,912) (3,983) (4,972) (6,016)
As percentages of outlays
National defense ........................................................................ 33.9 32.2 51.8 68.1 69.4 69.5 62.4 60.2 59.3Human resources ...................................................................... 27.8 33.4 24.2 17.4 15.6 18.5 21.8 22.7 23.7Physical resources ..................................................................... 8.0 8.6 8.6 6.2 5.3 3.6 4.0 4.4 6.0Net interest ................................................................................ 11.6 11.3 10.2 6.9 6.8 6.8 7.1 7.2 7.0Other functions .......................................................................... 23.3 18.7 10.3 6.4 7.7 6.4 9.8 10.6 9.4Undistributed offsetting receipts ................................................ –4.6 –4.3 –5.1 –5.0 –4.7 –4.8 –5.1 –5.1 –5.4
Total, Federal outlays ............................................................. 100.0 100.0 100.0 100.0 100.0 100.0 100.0 100.0 100.0(On-budget) ................................................................... (98.9) (98.8) (97.2) (97.4) (96.9) (95.9) (94.2) (93.0) (92.1)(Off-budget) ................................................................... (1.1) (1.2) (2.8) (2.6) (3.1) (4.1) (5.8) (7.0) (7.9)
As percentages of GDP
National defense ........................................................................ 4.8 5.0 7.3 13.2 14.2 13.0 10.8 9.9 10.1Human resources ...................................................................... 4.0 5.2 3.4 3.4 3.2 3.5 3.8 3.8 4.0Physical resources ..................................................................... 1.1 1.3 1.2 1.2 1.1 0.7 0.7 0.7 1.0Net interest ................................................................................ 1.7 1.8 1.5 1.3 1.4 1.3 1.2 1.2 1.2Other functions .......................................................................... 3.3 2.9 1.5 1.2 1.6 1.2 1.7 1.7 1.6Undistributed offsetting receipts ................................................ –0.7 –0.7 –0.7 –1.0 –1.0 –0.9 –0.9 –0.8 –0.9
Total, Federal outlays ............................................................. 14.3 15.6 14.2 19.4 20.4 18.7 17.3 16.5 17.0(On-budget) ................................................................... (14.1) (15.4) (13.8) (18.9) (19.8) (18.0) (16.3) (15.4) (15.7)(Off-budget) ................................................................... (0.2) (0.2) (0.4) (0.5) (0.6) (0.8) (1.0) (1.2) (1.3)
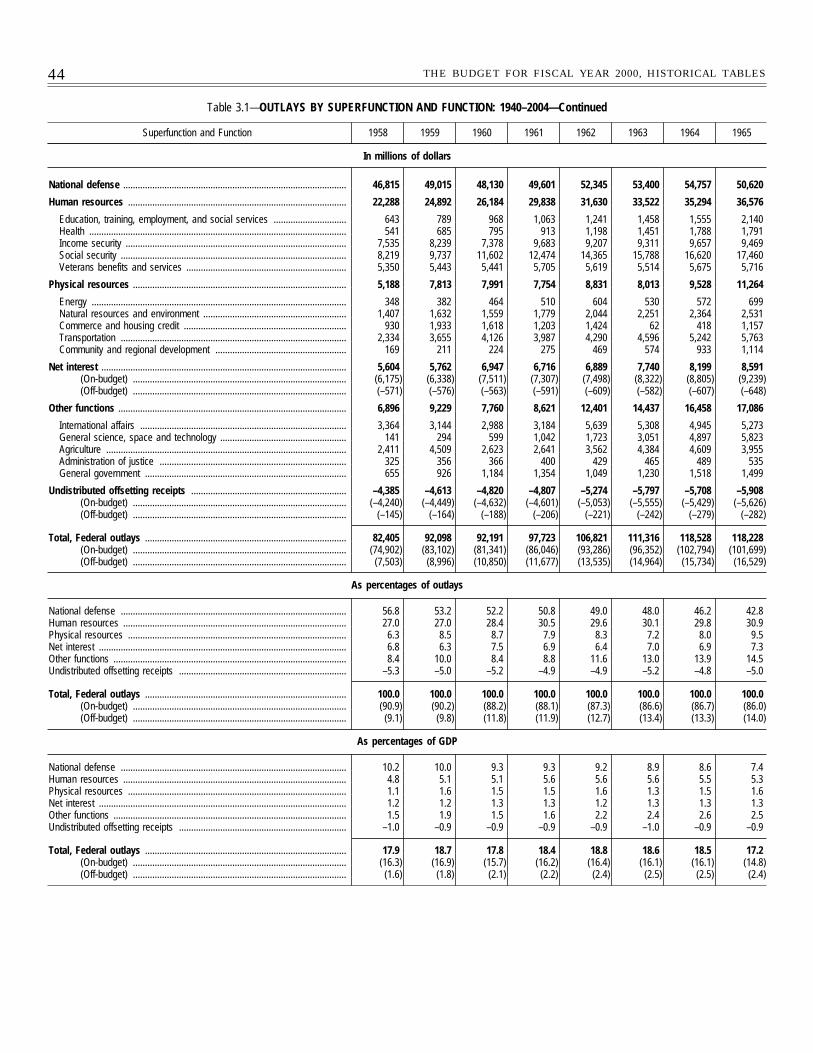
44 THE BUDGET FOR FISCAL YEAR 2000, HISTORICAL TABLES
Table 3.1—OUTLAYS BY SUPERFUNCTION AND FUNCTION: 1940–2004—Continued
Superfunction and Function 1958 1959 1960 1961 1962 1963 1964 1965
In millions of dollars
National defense ............................................................................................ 46,815 49,015 48,130 49,601 52,345 53,400 54,757 50,620
Human resources .......................................................................................... 22,288 24,892 26,184 29,838 31,630 33,522 35,294 36,576
Education, training, employment, and social services .............................. 643 789 968 1,063 1,241 1,458 1,555 2,140Health .......................................................................................................... 541 685 795 913 1,198 1,451 1,788 1,791Income security ........................................................................................... 7,535 8,239 7,378 9,683 9,207 9,311 9,657 9,469Social security ............................................................................................. 8,219 9,737 11,602 12,474 14,365 15,788 16,620 17,460Veterans benefits and services .................................................................. 5,350 5,443 5,441 5,705 5,619 5,514 5,675 5,716
Physical resources ........................................................................................ 5,188 7,813 7,991 7,754 8,831 8,013 9,528 11,264
Energy ......................................................................................................... 348 382 464 510 604 530 572 699Natural resources and environment ........................................................... 1,407 1,632 1,559 1,779 2,044 2,251 2,364 2,531Commerce and housing credit ................................................................... 930 1,933 1,618 1,203 1,424 62 418 1,157Transportation ............................................................................................. 2,334 3,655 4,126 3,987 4,290 4,596 5,242 5,763Community and regional development ...................................................... 169 211 224 275 469 574 933 1,114
Net interest ..................................................................................................... 5,604 5,762 6,947 6,716 6,889 7,740 8,199 8,591(On-budget) ........................................................................................ (6,175) (6,338) (7,511) (7,307) (7,498) (8,322) (8,805) (9,239)(Off-budget) ........................................................................................ (–571) (–576) (–563) (–591) (–609) (–582) (–607) (–648)
Other functions .............................................................................................. 6,896 9,229 7,760 8,621 12,401 14,437 16,458 17,086
International affairs ..................................................................................... 3,364 3,144 2,988 3,184 5,639 5,308 4,945 5,273General science, space and technology .................................................... 141 294 599 1,042 1,723 3,051 4,897 5,823Agriculture ................................................................................................... 2,411 4,509 2,623 2,641 3,562 4,384 4,609 3,955Administration of justice ............................................................................. 325 356 366 400 429 465 489 535General government ................................................................................... 655 926 1,184 1,354 1,049 1,230 1,518 1,499
Undistributed offsetting receipts ................................................................ –4,385 –4,613 –4,820 –4,807 –5,274 –5,797 –5,708 –5,908(On-budget) ........................................................................................ (–4,240) (–4,449) (–4,632) (–4,601) (–5,053) (–5,555) (–5,429) (–5,626)(Off-budget) ........................................................................................ (–145) (–164) (–188) (–206) (–221) (–242) (–279) (–282)
Total, Federal outlays ................................................................................... 82,405 92,098 92,191 97,723 106,821 111,316 118,528 118,228(On-budget) ........................................................................................ (74,902) (83,102) (81,341) (86,046) (93,286) (96,352) (102,794) (101,699)(Off-budget) ........................................................................................ (7,503) (8,996) (10,850) (11,677) (13,535) (14,964) (15,734) (16,529)
As percentages of outlays
National defense ............................................................................................. 56.8 53.2 52.2 50.8 49.0 48.0 46.2 42.8Human resources ............................................................................................ 27.0 27.0 28.4 30.5 29.6 30.1 29.8 30.9Physical resources .......................................................................................... 6.3 8.5 8.7 7.9 8.3 7.2 8.0 9.5Net interest ...................................................................................................... 6.8 6.3 7.5 6.9 6.4 7.0 6.9 7.3Other functions ................................................................................................ 8.4 10.0 8.4 8.8 11.6 13.0 13.9 14.5Undistributed offsetting receipts ..................................................................... –5.3 –5.0 –5.2 –4.9 –4.9 –5.2 –4.8 –5.0
Total, Federal outlays ................................................................................... 100.0 100.0 100.0 100.0 100.0 100.0 100.0 100.0(On-budget) ........................................................................................ (90.9) (90.2) (88.2) (88.1) (87.3) (86.6) (86.7) (86.0)(Off-budget) ........................................................................................ (9.1) (9.8) (11.8) (11.9) (12.7) (13.4) (13.3) (14.0)
As percentages of GDP
National defense ............................................................................................. 10.2 10.0 9.3 9.3 9.2 8.9 8.6 7.4Human resources ............................................................................................ 4.8 5.1 5.1 5.6 5.6 5.6 5.5 5.3Physical resources .......................................................................................... 1.1 1.6 1.5 1.5 1.6 1.3 1.5 1.6Net interest ...................................................................................................... 1.2 1.2 1.3 1.3 1.2 1.3 1.3 1.3Other functions ................................................................................................ 1.5 1.9 1.5 1.6 2.2 2.4 2.6 2.5Undistributed offsetting receipts ..................................................................... –1.0 –0.9 –0.9 –0.9 –0.9 –1.0 –0.9 –0.9
Total, Federal outlays ................................................................................... 17.9 18.7 17.8 18.4 18.8 18.6 18.5 17.2(On-budget) ........................................................................................ (16.3) (16.9) (15.7) (16.2) (16.4) (16.1) (16.1) (14.8)(Off-budget) ........................................................................................ (1.6) (1.8) (2.1) (2.2) (2.4) (2.5) (2.5) (2.4)
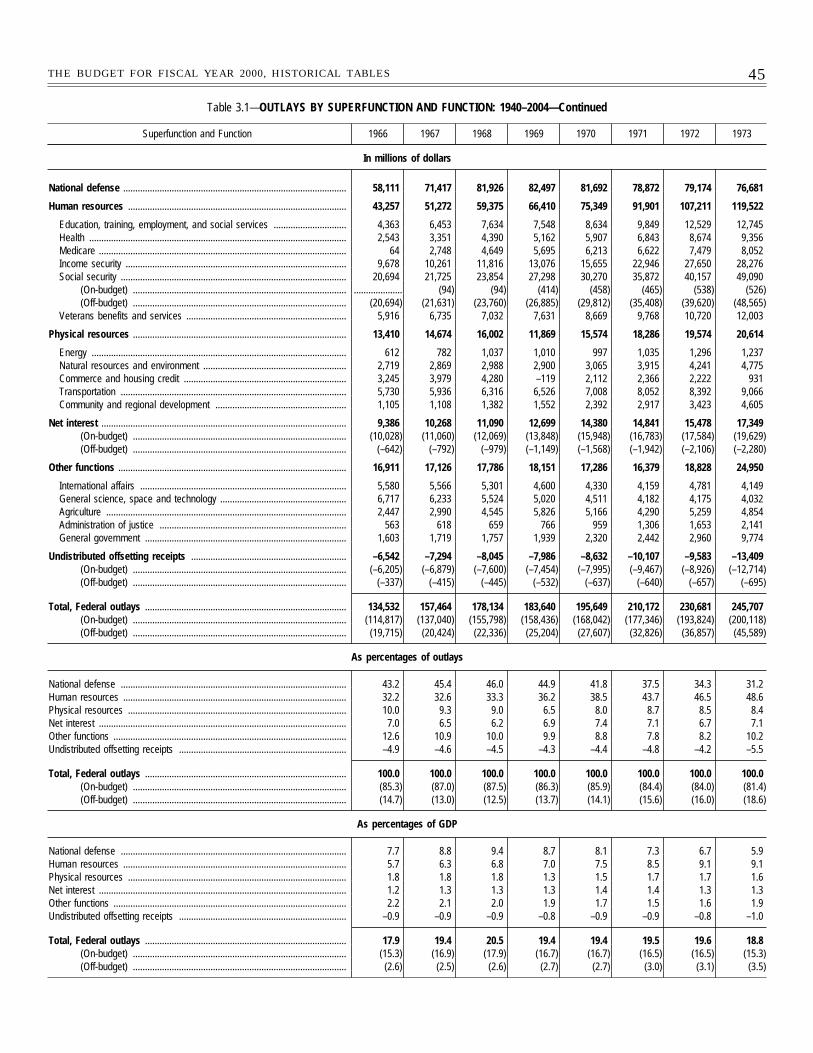
45THE BUDGET FOR FISCAL YEAR 2000, HISTORICAL TABLES
Table 3.1—OUTLAYS BY SUPERFUNCTION AND FUNCTION: 1940–2004—Continued
Superfunction and Function 1966 1967 1968 1969 1970 1971 1972 1973
In millions of dollars
National defense ............................................................................................ 58,111 71,417 81,926 82,497 81,692 78,872 79,174 76,681
Human resources .......................................................................................... 43,257 51,272 59,375 66,410 75,349 91,901 107,211 119,522
Education, training, employment, and social services .............................. 4,363 6,453 7,634 7,548 8,634 9,849 12,529 12,745Health .......................................................................................................... 2,543 3,351 4,390 5,162 5,907 6,843 8,674 9,356Medicare ...................................................................................................... 64 2,748 4,649 5,695 6,213 6,622 7,479 8,052Income security ........................................................................................... 9,678 10,261 11,816 13,076 15,655 22,946 27,650 28,276Social security ............................................................................................. 20,694 21,725 23,854 27,298 30,270 35,872 40,157 49,090
(On-budget) ........................................................................................ .................... (94) (94) (414) (458) (465) (538) (526)(Off-budget) ........................................................................................ (20,694) (21,631) (23,760) (26,885) (29,812) (35,408) (39,620) (48,565)
Veterans benefits and services .................................................................. 5,916 6,735 7,032 7,631 8,669 9,768 10,720 12,003
Physical resources ........................................................................................ 13,410 14,674 16,002 11,869 15,574 18,286 19,574 20,614
Energy ......................................................................................................... 612 782 1,037 1,010 997 1,035 1,296 1,237Natural resources and environment ........................................................... 2,719 2,869 2,988 2,900 3,065 3,915 4,241 4,775Commerce and housing credit ................................................................... 3,245 3,979 4,280 –119 2,112 2,366 2,222 931Transportation ............................................................................................. 5,730 5,936 6,316 6,526 7,008 8,052 8,392 9,066Community and regional development ...................................................... 1,105 1,108 1,382 1,552 2,392 2,917 3,423 4,605
Net interest ..................................................................................................... 9,386 10,268 11,090 12,699 14,380 14,841 15,478 17,349(On-budget) ........................................................................................ (10,028) (11,060) (12,069) (13,848) (15,948) (16,783) (17,584) (19,629)(Off-budget) ........................................................................................ (–642) (–792) (–979) (–1,149) (–1,568) (–1,942) (–2,106) (–2,280)
Other functions .............................................................................................. 16,911 17,126 17,786 18,151 17,286 16,379 18,828 24,950
International affairs ..................................................................................... 5,580 5,566 5,301 4,600 4,330 4,159 4,781 4,149General science, space and technology .................................................... 6,717 6,233 5,524 5,020 4,511 4,182 4,175 4,032Agriculture ................................................................................................... 2,447 2,990 4,545 5,826 5,166 4,290 5,259 4,854Administration of justice ............................................................................. 563 618 659 766 959 1,306 1,653 2,141General government ................................................................................... 1,603 1,719 1,757 1,939 2,320 2,442 2,960 9,774
Undistributed offsetting receipts ................................................................ –6,542 –7,294 –8,045 –7,986 –8,632 –10,107 –9,583 –13,409(On-budget) ........................................................................................ (–6,205) (–6,879) (–7,600) (–7,454) (–7,995) (–9,467) (–8,926) (–12,714)(Off-budget) ........................................................................................ (–337) (–415) (–445) (–532) (–637) (–640) (–657) (–695)
Total, Federal outlays ................................................................................... 134,532 157,464 178,134 183,640 195,649 210,172 230,681 245,707(On-budget) ........................................................................................ (114,817) (137,040) (155,798) (158,436) (168,042) (177,346) (193,824) (200,118)(Off-budget) ........................................................................................ (19,715) (20,424) (22,336) (25,204) (27,607) (32,826) (36,857) (45,589)
As percentages of outlays
National defense ............................................................................................. 43.2 45.4 46.0 44.9 41.8 37.5 34.3 31.2Human resources ............................................................................................ 32.2 32.6 33.3 36.2 38.5 43.7 46.5 48.6Physical resources .......................................................................................... 10.0 9.3 9.0 6.5 8.0 8.7 8.5 8.4Net interest ...................................................................................................... 7.0 6.5 6.2 6.9 7.4 7.1 6.7 7.1Other functions ................................................................................................ 12.6 10.9 10.0 9.9 8.8 7.8 8.2 10.2Undistributed offsetting receipts ..................................................................... –4.9 –4.6 –4.5 –4.3 –4.4 –4.8 –4.2 –5.5
Total, Federal outlays ................................................................................... 100.0 100.0 100.0 100.0 100.0 100.0 100.0 100.0(On-budget) ........................................................................................ (85.3) (87.0) (87.5) (86.3) (85.9) (84.4) (84.0) (81.4)(Off-budget) ........................................................................................ (14.7) (13.0) (12.5) (13.7) (14.1) (15.6) (16.0) (18.6)
As percentages of GDP
National defense ............................................................................................. 7.7 8.8 9.4 8.7 8.1 7.3 6.7 5.9Human resources ............................................................................................ 5.7 6.3 6.8 7.0 7.5 8.5 9.1 9.1Physical resources .......................................................................................... 1.8 1.8 1.8 1.3 1.5 1.7 1.7 1.6Net interest ...................................................................................................... 1.2 1.3 1.3 1.3 1.4 1.4 1.3 1.3Other functions ................................................................................................ 2.2 2.1 2.0 1.9 1.7 1.5 1.6 1.9Undistributed offsetting receipts ..................................................................... –0.9 –0.9 –0.9 –0.8 –0.9 –0.9 –0.8 –1.0
Total, Federal outlays ................................................................................... 17.9 19.4 20.5 19.4 19.4 19.5 19.6 18.8(On-budget) ........................................................................................ (15.3) (16.9) (17.9) (16.7) (16.7) (16.5) (16.5) (15.3)(Off-budget) ........................................................................................ (2.6) (2.5) (2.6) (2.7) (2.7) (3.0) (3.1) (3.5)

46 THE BUDGET FOR FISCAL YEAR 2000, HISTORICAL TABLES
Table 3.1—OUTLAYS BY SUPERFUNCTION AND FUNCTION: 1940–2004—Continued
Superfunction and Function 1974 1975 1976 TQ 1977 1978 1979 1980
In millions of dollars
National defense ............................................................................................ 79,347 86,509 89,619 22,269 97,241 104,495 116,342 133,995
Human resources .......................................................................................... 135,783 173,245 203,594 52,065 221,895 242,329 267,574 313,374
Education, training, employment, and social services .............................. 12,457 16,022 18,910 5,169 21,104 26,710 30,223 31,843Health .......................................................................................................... 10,733 12,930 15,734 3,924 17,302 18,524 20,494 23,169Medicare ...................................................................................................... 9,639 12,875 15,834 4,264 19,345 22,768 26,495 32,090Income security ........................................................................................... 33,713 50,176 60,799 14,985 61,060 61,505 66,376 86,557Social security ............................................................................................. 55,867 64,658 73,899 19,763 85,061 93,861 104,073 118,547
(On-budget) ........................................................................................ (494) (499) (515) .................... (717) (741) (757) (675)(Off-budget) ........................................................................................ (55,373) (64,159) (73,384) (19,763) (84,344) (93,120) (103,316) (117,872)
Veterans benefits and services .................................................................. 13,374 16,584 18,419 3,960 18,022 18,961 19,914 21,169
Physical resources ........................................................................................ 25,106 35,449 39,188 9,512 40,746 52,591 54,559 65,985
Energy ......................................................................................................... 1,303 2,916 4,204 1,129 5,770 7,992 9,180 10,156Natural resources and environment ........................................................... 5,697 7,346 8,184 2,524 10,032 10,983 12,135 13,858Commerce and housing credit ................................................................... 4,705 9,947 7,619 931 3,093 6,254 4,686 9,390Transportation ............................................................................................. 9,172 10,918 13,739 3,358 14,829 15,521 18,079 21,329Community and regional development ...................................................... 4,229 4,322 5,442 1,569 7,021 11,841 10,480 11,252
Net interest ..................................................................................................... 21,449 23,244 26,727 6,949 29,901 35,458 42,636 52,538(On-budget) ........................................................................................ (23,969) (26,047) (29,539) (7,042) (32,551) (37,861) (44,860) (54,877)(Off-budget) ........................................................................................ (–2,520) (–2,803) (–2,812) (–93) (–2,650) (–2,403) (–2,224) (–2,339)
Other functions .............................................................................................. 24,423 27,487 27,050 9,388 34,315 39,594 40,396 44,996
International affairs ..................................................................................... 5,710 7,097 6,433 2,458 6,353 7,482 7,459 12,714General science, space and technology .................................................... 3,980 3,991 4,373 1,162 4,736 4,926 5,235 5,832Agriculture ................................................................................................... 2,230 3,036 3,170 983 6,787 11,357 11,236 8,839Administration of justice ............................................................................. 2,470 2,955 3,328 891 3,605 3,813 4,173 4,584General government ................................................................................... 10,032 10,408 9,747 3,895 12,833 12,015 12,293 13,028
Undistributed offsetting receipts ................................................................ –16,749 –13,602 –14,386 –4,206 –14,879 –15,720 –17,476 –19,942(On-budget) ........................................................................................ (–15,985) (–12,686) (–13,423) (–3,957) (–13,902) (–14,660) (–16,362) (–18,738)(Off-budget) ........................................................................................ (–764) (–916) (–963) (–249) (–977) (–1,060) (–1,114) (–1,204)
Total, Federal outlays ................................................................................... 269,359 332,332 371,792 95,975 409,218 458,746 504,032 590,947(On-budget) ........................................................................................ (217,270) (271,892) (302,183) (76,555) (328,502) (369,089) (404,054) (476,618)(Off-budget) ........................................................................................ (52,089) (60,440) (69,609) (19,421) (80,716) (89,657) (99,978) (114,329)
As percentages of outlays
National defense ............................................................................................. 29.5 26.0 24.1 23.2 23.8 22.8 23.1 22.7Human resources ............................................................................................ 50.4 52.1 54.8 54.2 54.2 52.8 53.1 53.0Physical resources .......................................................................................... 9.3 10.7 10.5 9.9 10.0 11.5 10.8 11.2Net interest ...................................................................................................... 8.0 7.0 7.2 7.2 7.3 7.7 8.5 8.9Other functions ................................................................................................ 9.1 8.3 7.3 9.8 8.4 8.6 8.0 7.6Undistributed offsetting receipts ..................................................................... –6.2 –4.1 –3.9 –4.4 –3.6 –3.4 –3.5 –3.4
Total, Federal outlays ................................................................................... 100.0 100.0 100.0 100.0 100.0 100.0 100.0 100.0(On-budget) ........................................................................................ (80.7) (81.8) (81.3) (79.8) (80.3) (80.5) (80.2) (80.7)(Off-budget) ........................................................................................ (19.3) (18.2) (18.7) (20.2) (19.7) (19.5) (19.8) (19.3)
As percentages of GDP
National defense ............................................................................................. 5.5 5.6 5.2 4.9 4.9 4.7 4.7 4.9Human resources ............................................................................................ 9.4 11.1 11.8 11.4 11.3 11.0 10.7 11.5Physical resources .......................................................................................... 1.7 2.3 2.3 2.1 2.1 2.4 2.2 2.4Net interest ...................................................................................................... 1.5 1.5 1.5 1.5 1.5 1.6 1.7 1.9Other functions ................................................................................................ 1.7 1.8 1.6 2.1 1.7 1.8 1.6 1.7Undistributed offsetting receipts ..................................................................... –1.2 –0.9 –0.8 –0.9 –0.8 –0.7 –0.7 –0.7
Total, Federal outlays ................................................................................... 18.7 21.4 21.5 21.1 20.8 20.7 20.2 21.7(On-budget) ........................................................................................ (15.1) (17.5) (17.5) (16.8) (16.7) (16.7) (16.2) (17.5)(Off-budget) ........................................................................................ (3.6) (3.9) (4.0) (4.3) (4.1) (4.1) (4.0) (4.2)
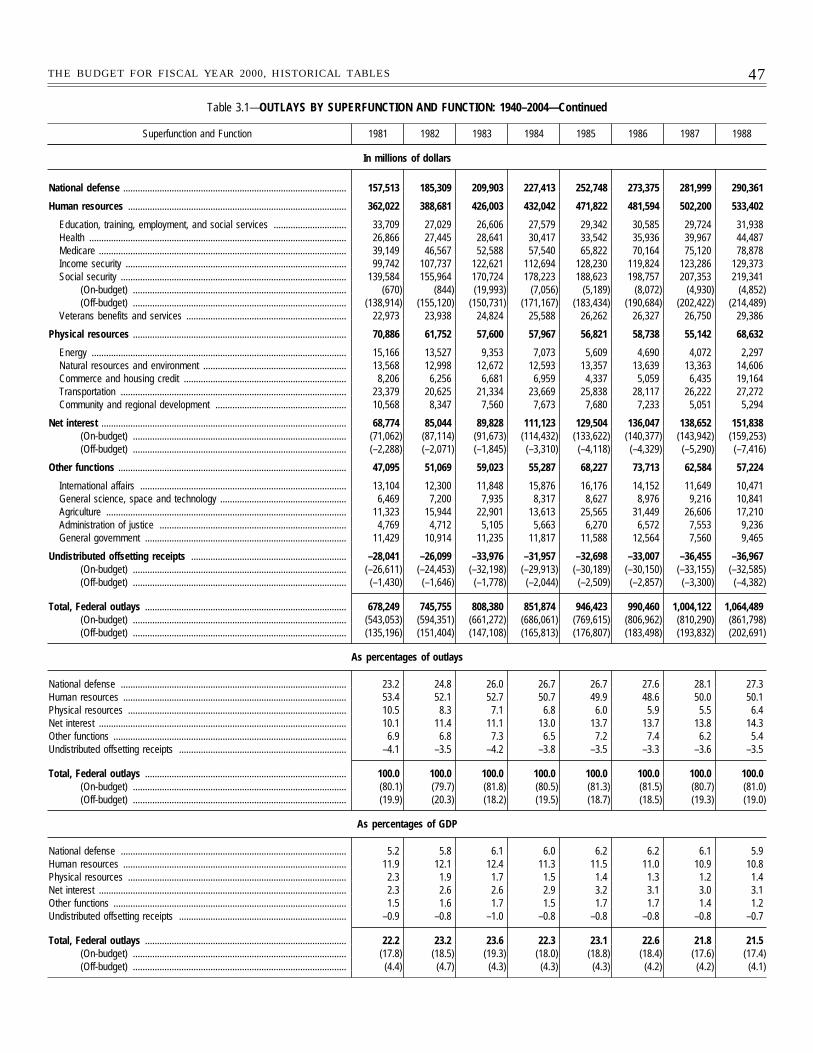
47THE BUDGET FOR FISCAL YEAR 2000, HISTORICAL TABLES
Table 3.1—OUTLAYS BY SUPERFUNCTION AND FUNCTION: 1940–2004—Continued
Superfunction and Function 1981 1982 1983 1984 1985 1986 1987 1988
In millions of dollars
National defense ............................................................................................ 157,513 185,309 209,903 227,413 252,748 273,375 281,999 290,361
Human resources .......................................................................................... 362,022 388,681 426,003 432,042 471,822 481,594 502,200 533,402
Education, training, employment, and social services .............................. 33,709 27,029 26,606 27,579 29,342 30,585 29,724 31,938Health .......................................................................................................... 26,866 27,445 28,641 30,417 33,542 35,936 39,967 44,487Medicare ...................................................................................................... 39,149 46,567 52,588 57,540 65,822 70,164 75,120 78,878Income security ........................................................................................... 99,742 107,737 122,621 112,694 128,230 119,824 123,286 129,373Social security ............................................................................................. 139,584 155,964 170,724 178,223 188,623 198,757 207,353 219,341
(On-budget) ........................................................................................ (670) (844) (19,993) (7,056) (5,189) (8,072) (4,930) (4,852)(Off-budget) ........................................................................................ (138,914) (155,120) (150,731) (171,167) (183,434) (190,684) (202,422) (214,489)
Veterans benefits and services .................................................................. 22,973 23,938 24,824 25,588 26,262 26,327 26,750 29,386
Physical resources ........................................................................................ 70,886 61,752 57,600 57,967 56,821 58,738 55,142 68,632
Energy ......................................................................................................... 15,166 13,527 9,353 7,073 5,609 4,690 4,072 2,297Natural resources and environment ........................................................... 13,568 12,998 12,672 12,593 13,357 13,639 13,363 14,606Commerce and housing credit ................................................................... 8,206 6,256 6,681 6,959 4,337 5,059 6,435 19,164Transportation ............................................................................................. 23,379 20,625 21,334 23,669 25,838 28,117 26,222 27,272Community and regional development ...................................................... 10,568 8,347 7,560 7,673 7,680 7,233 5,051 5,294
Net interest ..................................................................................................... 68,774 85,044 89,828 111,123 129,504 136,047 138,652 151,838(On-budget) ........................................................................................ (71,062) (87,114) (91,673) (114,432) (133,622) (140,377) (143,942) (159,253)(Off-budget) ........................................................................................ (–2,288) (–2,071) (–1,845) (–3,310) (–4,118) (–4,329) (–5,290) (–7,416)
Other functions .............................................................................................. 47,095 51,069 59,023 55,287 68,227 73,713 62,584 57,224
International affairs ..................................................................................... 13,104 12,300 11,848 15,876 16,176 14,152 11,649 10,471General science, space and technology .................................................... 6,469 7,200 7,935 8,317 8,627 8,976 9,216 10,841Agriculture ................................................................................................... 11,323 15,944 22,901 13,613 25,565 31,449 26,606 17,210Administration of justice ............................................................................. 4,769 4,712 5,105 5,663 6,270 6,572 7,553 9,236General government ................................................................................... 11,429 10,914 11,235 11,817 11,588 12,564 7,560 9,465
Undistributed offsetting receipts ................................................................ –28,041 –26,099 –33,976 –31,957 –32,698 –33,007 –36,455 –36,967(On-budget) ........................................................................................ (–26,611) (–24,453) (–32,198) (–29,913) (–30,189) (–30,150) (–33,155) (–32,585)(Off-budget) ........................................................................................ (–1,430) (–1,646) (–1,778) (–2,044) (–2,509) (–2,857) (–3,300) (–4,382)
Total, Federal outlays ................................................................................... 678,249 745,755 808,380 851,874 946,423 990,460 1,004,122 1,064,489(On-budget) ........................................................................................ (543,053) (594,351) (661,272) (686,061) (769,615) (806,962) (810,290) (861,798)(Off-budget) ........................................................................................ (135,196) (151,404) (147,108) (165,813) (176,807) (183,498) (193,832) (202,691)
As percentages of outlays
National defense ............................................................................................. 23.2 24.8 26.0 26.7 26.7 27.6 28.1 27.3Human resources ............................................................................................ 53.4 52.1 52.7 50.7 49.9 48.6 50.0 50.1Physical resources .......................................................................................... 10.5 8.3 7.1 6.8 6.0 5.9 5.5 6.4Net interest ...................................................................................................... 10.1 11.4 11.1 13.0 13.7 13.7 13.8 14.3Other functions ................................................................................................ 6.9 6.8 7.3 6.5 7.2 7.4 6.2 5.4Undistributed offsetting receipts ..................................................................... –4.1 –3.5 –4.2 –3.8 –3.5 –3.3 –3.6 –3.5
Total, Federal outlays ................................................................................... 100.0 100.0 100.0 100.0 100.0 100.0 100.0 100.0(On-budget) ........................................................................................ (80.1) (79.7) (81.8) (80.5) (81.3) (81.5) (80.7) (81.0)(Off-budget) ........................................................................................ (19.9) (20.3) (18.2) (19.5) (18.7) (18.5) (19.3) (19.0)
As percentages of GDP
National defense ............................................................................................. 5.2 5.8 6.1 6.0 6.2 6.2 6.1 5.9Human resources ............................................................................................ 11.9 12.1 12.4 11.3 11.5 11.0 10.9 10.8Physical resources .......................................................................................... 2.3 1.9 1.7 1.5 1.4 1.3 1.2 1.4Net interest ...................................................................................................... 2.3 2.6 2.6 2.9 3.2 3.1 3.0 3.1Other functions ................................................................................................ 1.5 1.6 1.7 1.5 1.7 1.7 1.4 1.2Undistributed offsetting receipts ..................................................................... –0.9 –0.8 –1.0 –0.8 –0.8 –0.8 –0.8 –0.7
Total, Federal outlays ................................................................................... 22.2 23.2 23.6 22.3 23.1 22.6 21.8 21.5(On-budget) ........................................................................................ (17.8) (18.5) (19.3) (18.0) (18.8) (18.4) (17.6) (17.4)(Off-budget) ........................................................................................ (4.4) (4.7) (4.3) (4.3) (4.3) (4.2) (4.2) (4.1)
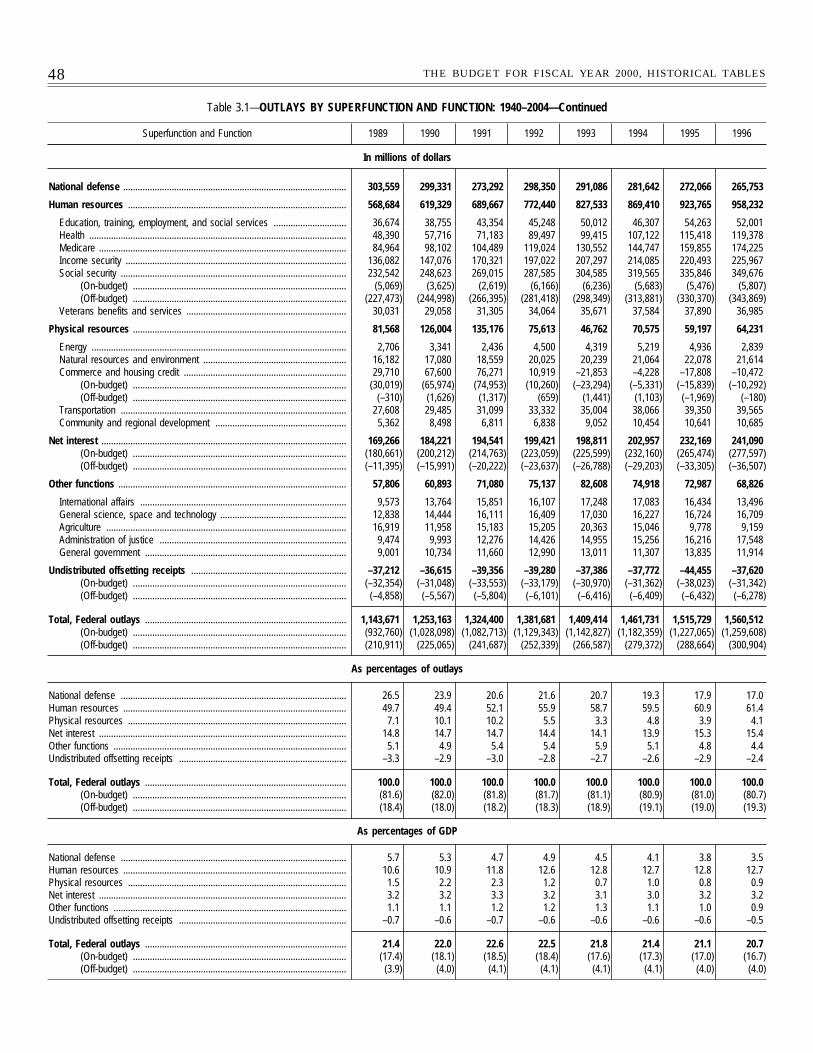
48 THE BUDGET FOR FISCAL YEAR 2000, HISTORICAL TABLES
Table 3.1—OUTLAYS BY SUPERFUNCTION AND FUNCTION: 1940–2004—Continued
Superfunction and Function 1989 1990 1991 1992 1993 1994 1995 1996
In millions of dollars
National defense ............................................................................................ 303,559 299,331 273,292 298,350 291,086 281,642 272,066 265,753
Human resources .......................................................................................... 568,684 619,329 689,667 772,440 827,533 869,410 923,765 958,232
Education, training, employment, and social services .............................. 36,674 38,755 43,354 45,248 50,012 46,307 54,263 52,001Health .......................................................................................................... 48,390 57,716 71,183 89,497 99,415 107,122 115,418 119,378Medicare ...................................................................................................... 84,964 98,102 104,489 119,024 130,552 144,747 159,855 174,225Income security ........................................................................................... 136,082 147,076 170,321 197,022 207,297 214,085 220,493 225,967Social security ............................................................................................. 232,542 248,623 269,015 287,585 304,585 319,565 335,846 349,676
(On-budget) ........................................................................................ (5,069) (3,625) (2,619) (6,166) (6,236) (5,683) (5,476) (5,807)(Off-budget) ........................................................................................ (227,473) (244,998) (266,395) (281,418) (298,349) (313,881) (330,370) (343,869)
Veterans benefits and services .................................................................. 30,031 29,058 31,305 34,064 35,671 37,584 37,890 36,985
Physical resources ........................................................................................ 81,568 126,004 135,176 75,613 46,762 70,575 59,197 64,231
Energy ......................................................................................................... 2,706 3,341 2,436 4,500 4,319 5,219 4,936 2,839Natural resources and environment ........................................................... 16,182 17,080 18,559 20,025 20,239 21,064 22,078 21,614Commerce and housing credit ................................................................... 29,710 67,600 76,271 10,919 –21,853 –4,228 –17,808 –10,472
(On-budget) ........................................................................................ (30,019) (65,974) (74,953) (10,260) (–23,294) (–5,331) (–15,839) (–10,292)(Off-budget) ........................................................................................ (–310) (1,626) (1,317) (659) (1,441) (1,103) (–1,969) (–180)
Transportation ............................................................................................. 27,608 29,485 31,099 33,332 35,004 38,066 39,350 39,565Community and regional development ...................................................... 5,362 8,498 6,811 6,838 9,052 10,454 10,641 10,685
Net interest ..................................................................................................... 169,266 184,221 194,541 199,421 198,811 202,957 232,169 241,090(On-budget) ........................................................................................ (180,661) (200,212) (214,763) (223,059) (225,599) (232,160) (265,474) (277,597)(Off-budget) ........................................................................................ (–11,395) (–15,991) (–20,222) (–23,637) (–26,788) (–29,203) (–33,305) (–36,507)
Other functions .............................................................................................. 57,806 60,893 71,080 75,137 82,608 74,918 72,987 68,826
International affairs ..................................................................................... 9,573 13,764 15,851 16,107 17,248 17,083 16,434 13,496General science, space and technology .................................................... 12,838 14,444 16,111 16,409 17,030 16,227 16,724 16,709Agriculture ................................................................................................... 16,919 11,958 15,183 15,205 20,363 15,046 9,778 9,159Administration of justice ............................................................................. 9,474 9,993 12,276 14,426 14,955 15,256 16,216 17,548General government ................................................................................... 9,001 10,734 11,660 12,990 13,011 11,307 13,835 11,914
Undistributed offsetting receipts ................................................................ –37,212 –36,615 –39,356 –39,280 –37,386 –37,772 –44,455 –37,620(On-budget) ........................................................................................ (–32,354) (–31,048) (–33,553) (–33,179) (–30,970) (–31,362) (–38,023) (–31,342)(Off-budget) ........................................................................................ (–4,858) (–5,567) (–5,804) (–6,101) (–6,416) (–6,409) (–6,432) (–6,278)
Total, Federal outlays ................................................................................... 1,143,671 1,253,163 1,324,400 1,381,681 1,409,414 1,461,731 1,515,729 1,560,512(On-budget) ........................................................................................ (932,760) (1,028,098) (1,082,713) (1,129,343) (1,142,827) (1,182,359) (1,227,065) (1,259,608)(Off-budget) ........................................................................................ (210,911) (225,065) (241,687) (252,339) (266,587) (279,372) (288,664) (300,904)
As percentages of outlays
National defense ............................................................................................. 26.5 23.9 20.6 21.6 20.7 19.3 17.9 17.0Human resources ............................................................................................ 49.7 49.4 52.1 55.9 58.7 59.5 60.9 61.4Physical resources .......................................................................................... 7.1 10.1 10.2 5.5 3.3 4.8 3.9 4.1Net interest ...................................................................................................... 14.8 14.7 14.7 14.4 14.1 13.9 15.3 15.4Other functions ................................................................................................ 5.1 4.9 5.4 5.4 5.9 5.1 4.8 4.4Undistributed offsetting receipts ..................................................................... –3.3 –2.9 –3.0 –2.8 –2.7 –2.6 –2.9 –2.4
Total, Federal outlays ................................................................................... 100.0 100.0 100.0 100.0 100.0 100.0 100.0 100.0(On-budget) ........................................................................................ (81.6) (82.0) (81.8) (81.7) (81.1) (80.9) (81.0) (80.7)(Off-budget) ........................................................................................ (18.4) (18.0) (18.2) (18.3) (18.9) (19.1) (19.0) (19.3)
As percentages of GDP
National defense ............................................................................................. 5.7 5.3 4.7 4.9 4.5 4.1 3.8 3.5Human resources ............................................................................................ 10.6 10.9 11.8 12.6 12.8 12.7 12.8 12.7Physical resources .......................................................................................... 1.5 2.2 2.3 1.2 0.7 1.0 0.8 0.9Net interest ...................................................................................................... 3.2 3.2 3.3 3.2 3.1 3.0 3.2 3.2Other functions ................................................................................................ 1.1 1.1 1.2 1.2 1.3 1.1 1.0 0.9Undistributed offsetting receipts ..................................................................... –0.7 –0.6 –0.7 –0.6 –0.6 –0.6 –0.6 –0.5
Total, Federal outlays ................................................................................... 21.4 22.0 22.6 22.5 21.8 21.4 21.1 20.7(On-budget) ........................................................................................ (17.4) (18.1) (18.5) (18.4) (17.6) (17.3) (17.0) (16.7)(Off-budget) ........................................................................................ (3.9) (4.0) (4.1) (4.1) (4.1) (4.1) (4.0) (4.0)
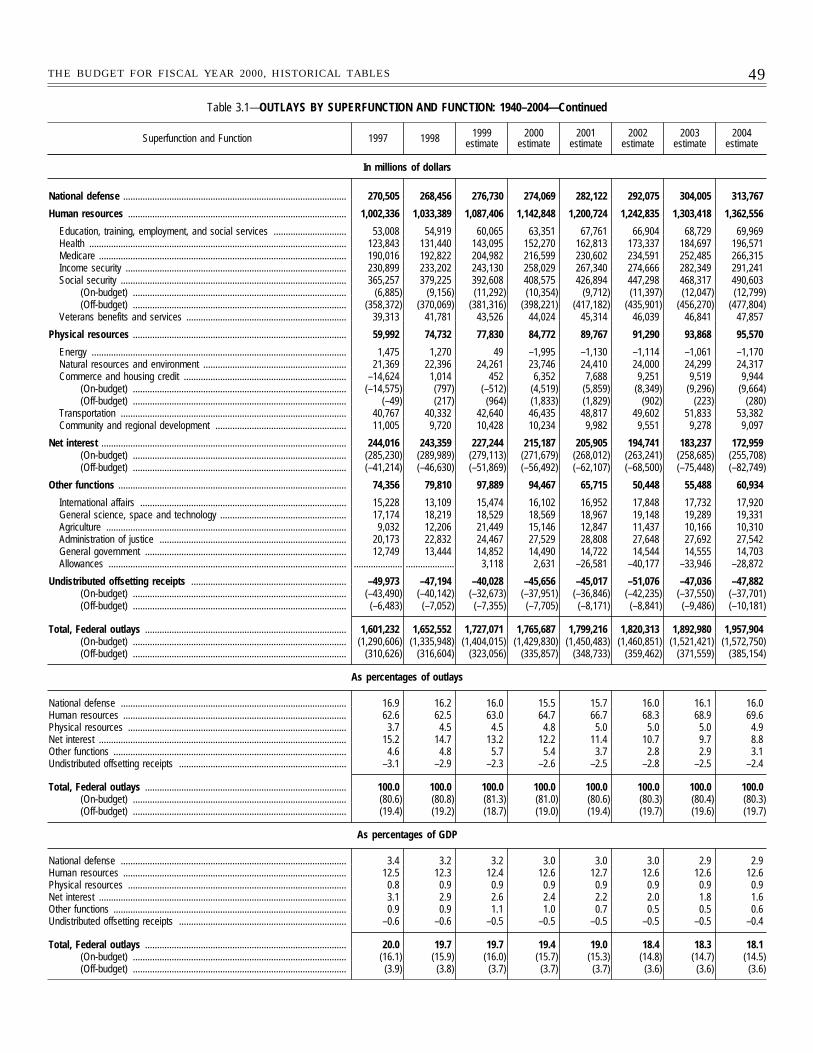
49THE BUDGET FOR FISCAL YEAR 2000, HISTORICAL TABLES
Table 3.1—OUTLAYS BY SUPERFUNCTION AND FUNCTION: 1940–2004—Continued
Superfunction and Function 1997 1998 1999estimate
2000estimate
2001estimate
2002estimate
2003estimate
2004estimate
In millions of dollars
National defense ............................................................................................ 270,505 268,456 276,730 274,069 282,122 292,075 304,005 313,767
Human resources .......................................................................................... 1,002,336 1,033,389 1,087,406 1,142,848 1,200,724 1,242,835 1,303,418 1,362,556
Education, training, employment, and social services .............................. 53,008 54,919 60,065 63,351 67,761 66,904 68,729 69,969Health .......................................................................................................... 123,843 131,440 143,095 152,270 162,813 173,337 184,697 196,571Medicare ...................................................................................................... 190,016 192,822 204,982 216,599 230,602 234,591 252,485 266,315Income security ........................................................................................... 230,899 233,202 243,130 258,029 267,340 274,666 282,349 291,241Social security ............................................................................................. 365,257 379,225 392,608 408,575 426,894 447,298 468,317 490,603
(On-budget) ........................................................................................ (6,885) (9,156) (11,292) (10,354) (9,712) (11,397) (12,047) (12,799)(Off-budget) ........................................................................................ (358,372) (370,069) (381,316) (398,221) (417,182) (435,901) (456,270) (477,804)
Veterans benefits and services .................................................................. 39,313 41,781 43,526 44,024 45,314 46,039 46,841 47,857
Physical resources ........................................................................................ 59,992 74,732 77,830 84,772 89,767 91,290 93,868 95,570
Energy ......................................................................................................... 1,475 1,270 49 –1,995 –1,130 –1,114 –1,061 –1,170Natural resources and environment ........................................................... 21,369 22,396 24,261 23,746 24,410 24,000 24,299 24,317Commerce and housing credit ................................................................... –14,624 1,014 452 6,352 7,688 9,251 9,519 9,944
(On-budget) ........................................................................................ (–14,575) (797) (–512) (4,519) (5,859) (8,349) (9,296) (9,664)(Off-budget) ........................................................................................ (–49) (217) (964) (1,833) (1,829) (902) (223) (280)
Transportation ............................................................................................. 40,767 40,332 42,640 46,435 48,817 49,602 51,833 53,382Community and regional development ...................................................... 11,005 9,720 10,428 10,234 9,982 9,551 9,278 9,097
Net interest ..................................................................................................... 244,016 243,359 227,244 215,187 205,905 194,741 183,237 172,959(On-budget) ........................................................................................ (285,230) (289,989) (279,113) (271,679) (268,012) (263,241) (258,685) (255,708)(Off-budget) ........................................................................................ (–41,214) (–46,630) (–51,869) (–56,492) (–62,107) (–68,500) (–75,448) (–82,749)
Other functions .............................................................................................. 74,356 79,810 97,889 94,467 65,715 50,448 55,488 60,934
International affairs ..................................................................................... 15,228 13,109 15,474 16,102 16,952 17,848 17,732 17,920General science, space and technology .................................................... 17,174 18,219 18,529 18,569 18,967 19,148 19,289 19,331Agriculture ................................................................................................... 9,032 12,206 21,449 15,146 12,847 11,437 10,166 10,310Administration of justice ............................................................................. 20,173 22,832 24,467 27,529 28,808 27,648 27,692 27,542General government ................................................................................... 12,749 13,444 14,852 14,490 14,722 14,544 14,555 14,703Allowances .................................................................................................. .................... .................... 3,118 2,631 –26,581 –40,177 –33,946 –28,872
Undistributed offsetting receipts ................................................................ –49,973 –47,194 –40,028 –45,656 –45,017 –51,076 –47,036 –47,882(On-budget) ........................................................................................ (–43,490) (–40,142) (–32,673) (–37,951) (–36,846) (–42,235) (–37,550) (–37,701)(Off-budget) ........................................................................................ (–6,483) (–7,052) (–7,355) (–7,705) (–8,171) (–8,841) (–9,486) (–10,181)
Total, Federal outlays ................................................................................... 1,601,232 1,652,552 1,727,071 1,765,687 1,799,216 1,820,313 1,892,980 1,957,904(On-budget) ........................................................................................ (1,290,606) (1,335,948) (1,404,015) (1,429,830) (1,450,483) (1,460,851) (1,521,421) (1,572,750)(Off-budget) ........................................................................................ (310,626) (316,604) (323,056) (335,857) (348,733) (359,462) (371,559) (385,154)
As percentages of outlays
National defense ............................................................................................. 16.9 16.2 16.0 15.5 15.7 16.0 16.1 16.0Human resources ............................................................................................ 62.6 62.5 63.0 64.7 66.7 68.3 68.9 69.6Physical resources .......................................................................................... 3.7 4.5 4.5 4.8 5.0 5.0 5.0 4.9Net interest ...................................................................................................... 15.2 14.7 13.2 12.2 11.4 10.7 9.7 8.8Other functions ................................................................................................ 4.6 4.8 5.7 5.4 3.7 2.8 2.9 3.1Undistributed offsetting receipts ..................................................................... –3.1 –2.9 –2.3 –2.6 –2.5 –2.8 –2.5 –2.4
Total, Federal outlays ................................................................................... 100.0 100.0 100.0 100.0 100.0 100.0 100.0 100.0(On-budget) ........................................................................................ (80.6) (80.8) (81.3) (81.0) (80.6) (80.3) (80.4) (80.3)(Off-budget) ........................................................................................ (19.4) (19.2) (18.7) (19.0) (19.4) (19.7) (19.6) (19.7)
As percentages of GDP
National defense ............................................................................................. 3.4 3.2 3.2 3.0 3.0 3.0 2.9 2.9Human resources ............................................................................................ 12.5 12.3 12.4 12.6 12.7 12.6 12.6 12.6Physical resources .......................................................................................... 0.8 0.9 0.9 0.9 0.9 0.9 0.9 0.9Net interest ...................................................................................................... 3.1 2.9 2.6 2.4 2.2 2.0 1.8 1.6Other functions ................................................................................................ 0.9 0.9 1.1 1.0 0.7 0.5 0.5 0.6Undistributed offsetting receipts ..................................................................... –0.6 –0.6 –0.5 –0.5 –0.5 –0.5 –0.5 –0.4
Total, Federal outlays ................................................................................... 20.0 19.7 19.7 19.4 19.0 18.4 18.3 18.1(On-budget) ........................................................................................ (16.1) (15.9) (16.0) (15.7) (15.3) (14.8) (14.7) (14.5)(Off-budget) ........................................................................................ (3.9) (3.8) (3.7) (3.7) (3.7) (3.6) (3.6) (3.6)
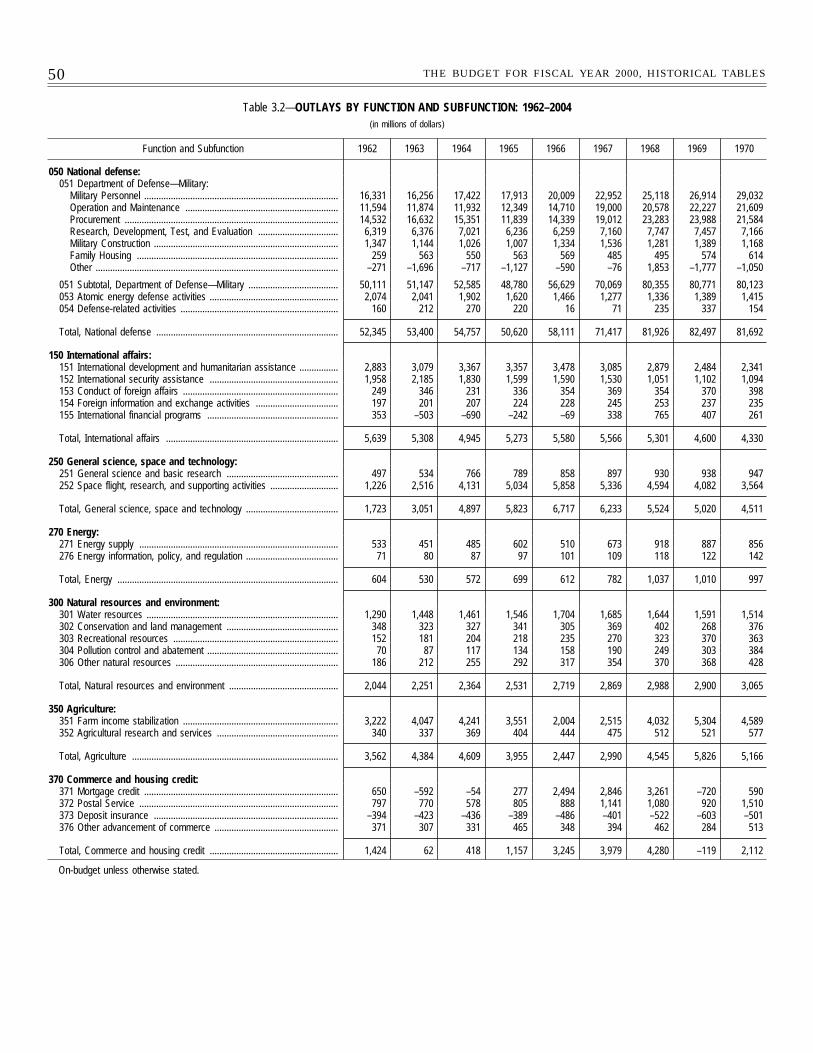
50 THE BUDGET FOR FISCAL YEAR 2000, HISTORICAL TABLES
Table 3.2—OUTLAYS BY FUNCTION AND SUBFUNCTION: 1962–2004(in millions of dollars)
Function and Subfunction 1962 1963 1964 1965 1966 1967 1968 1969 1970
050 National defense:051 Department of Defense—Military:
Military Personnel ................................................................................ 16,331 16,256 17,422 17,913 20,009 22,952 25,118 26,914 29,032Operation and Maintenance ............................................................... 11,594 11,874 11,932 12,349 14,710 19,000 20,578 22,227 21,609Procurement ........................................................................................ 14,532 16,632 15,351 11,839 14,339 19,012 23,283 23,988 21,584Research, Development, Test, and Evaluation ................................. 6,319 6,376 7,021 6,236 6,259 7,160 7,747 7,457 7,166Military Construction ............................................................................ 1,347 1,144 1,026 1,007 1,334 1,536 1,281 1,389 1,168Family Housing ................................................................................... 259 563 550 563 569 485 495 574 614Other .................................................................................................... –271 –1,696 –717 –1,127 –590 –76 1,853 –1,777 –1,050
051 Subtotal, Department of Defense—Military ..................................... 50,111 51,147 52,585 48,780 56,629 70,069 80,355 80,771 80,123053 Atomic energy defense activities ..................................................... 2,074 2,041 1,902 1,620 1,466 1,277 1,336 1,389 1,415054 Defense-related activities ................................................................. 160 212 270 220 16 71 235 337 154
Total, National defense ........................................................................... 52,345 53,400 54,757 50,620 58,111 71,417 81,926 82,497 81,692
150 International affairs:151 International development and humanitarian assistance ................ 2,883 3,079 3,367 3,357 3,478 3,085 2,879 2,484 2,341152 International security assistance ..................................................... 1,958 2,185 1,830 1,599 1,590 1,530 1,051 1,102 1,094153 Conduct of foreign affairs ................................................................ 249 346 231 336 354 369 354 370 398154 Foreign information and exchange activities .................................. 197 201 207 224 228 245 253 237 235155 International financial programs ...................................................... 353 –503 –690 –242 –69 338 765 407 261
Total, International affairs ....................................................................... 5,639 5,308 4,945 5,273 5,580 5,566 5,301 4,600 4,330
250 General science, space and technology:251 General science and basic research .............................................. 497 534 766 789 858 897 930 938 947252 Space flight, research, and supporting activities ............................ 1,226 2,516 4,131 5,034 5,858 5,336 4,594 4,082 3,564
Total, General science, space and technology ...................................... 1,723 3,051 4,897 5,823 6,717 6,233 5,524 5,020 4,511
270 Energy:271 Energy supply .................................................................................. 533 451 485 602 510 673 918 887 856276 Energy information, policy, and regulation ...................................... 71 80 87 97 101 109 118 122 142
Total, Energy ........................................................................................... 604 530 572 699 612 782 1,037 1,010 997
300 Natural resources and environment:301 Water resources ............................................................................... 1,290 1,448 1,461 1,546 1,704 1,685 1,644 1,591 1,514302 Conservation and land management .............................................. 348 323 327 341 305 369 402 268 376303 Recreational resources .................................................................... 152 181 204 218 235 270 323 370 363304 Pollution control and abatement ...................................................... 70 87 117 134 158 190 249 303 384306 Other natural resources ................................................................... 186 212 255 292 317 354 370 368 428
Total, Natural resources and environment ............................................. 2,044 2,251 2,364 2,531 2,719 2,869 2,988 2,900 3,065
350 Agriculture:351 Farm income stabilization ................................................................ 3,222 4,047 4,241 3,551 2,004 2,515 4,032 5,304 4,589352 Agricultural research and services .................................................. 340 337 369 404 444 475 512 521 577
Total, Agriculture ..................................................................................... 3,562 4,384 4,609 3,955 2,447 2,990 4,545 5,826 5,166
370 Commerce and housing credit:371 Mortgage credit ................................................................................ 650 –592 –54 277 2,494 2,846 3,261 –720 590372 Postal Service .................................................................................. 797 770 578 805 888 1,141 1,080 920 1,510373 Deposit insurance ............................................................................ –394 –423 –436 –389 –486 –401 –522 –603 –501376 Other advancement of commerce ................................................... 371 307 331 465 348 394 462 284 513
Total, Commerce and housing credit ..................................................... 1,424 62 418 1,157 3,245 3,979 4,280 –119 2,112
On-budget unless otherwise stated.
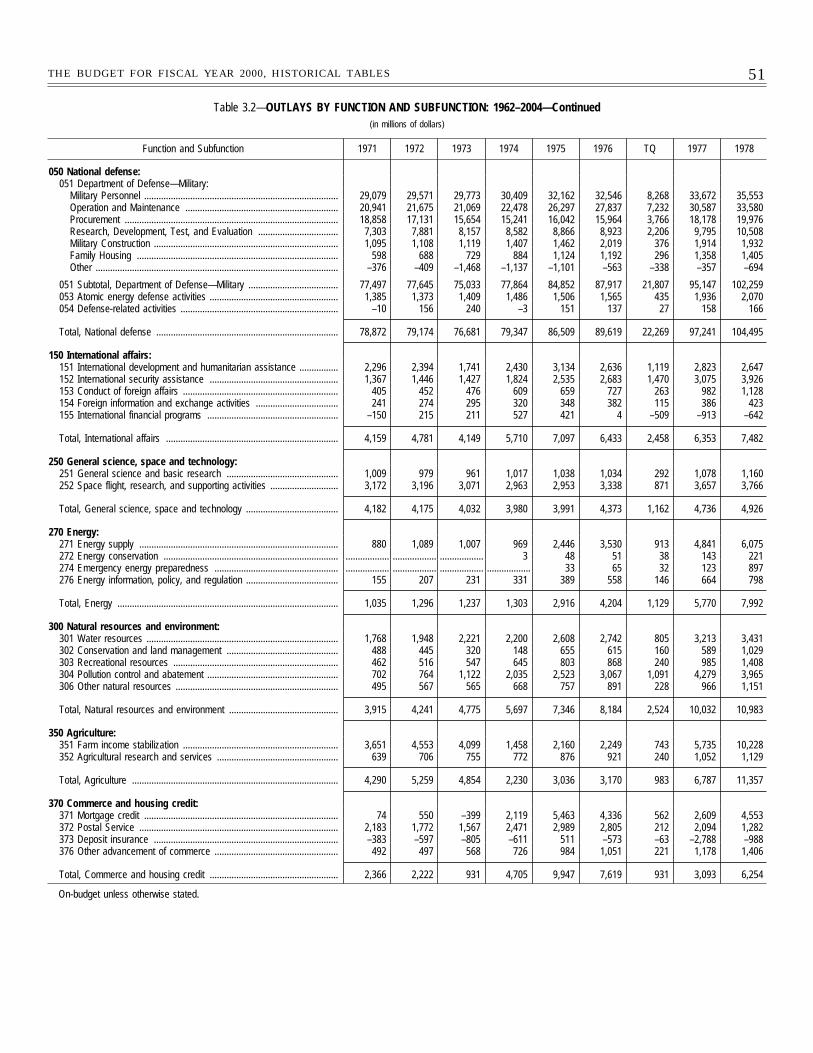
51THE BUDGET FOR FISCAL YEAR 2000, HISTORICAL TABLES
Table 3.2—OUTLAYS BY FUNCTION AND SUBFUNCTION: 1962–2004—Continued(in millions of dollars)
Function and Subfunction 1971 1972 1973 1974 1975 1976 TQ 1977 1978
050 National defense:051 Department of Defense—Military:
Military Personnel ................................................................................ 29,079 29,571 29,773 30,409 32,162 32,546 8,268 33,672 35,553Operation and Maintenance ............................................................... 20,941 21,675 21,069 22,478 26,297 27,837 7,232 30,587 33,580Procurement ........................................................................................ 18,858 17,131 15,654 15,241 16,042 15,964 3,766 18,178 19,976Research, Development, Test, and Evaluation ................................. 7,303 7,881 8,157 8,582 8,866 8,923 2,206 9,795 10,508Military Construction ............................................................................ 1,095 1,108 1,119 1,407 1,462 2,019 376 1,914 1,932Family Housing ................................................................................... 598 688 729 884 1,124 1,192 296 1,358 1,405Other .................................................................................................... –376 –409 –1,468 –1,137 –1,101 –563 –338 –357 –694
051 Subtotal, Department of Defense—Military ..................................... 77,497 77,645 75,033 77,864 84,852 87,917 21,807 95,147 102,259053 Atomic energy defense activities ..................................................... 1,385 1,373 1,409 1,486 1,506 1,565 435 1,936 2,070054 Defense-related activities ................................................................. –10 156 240 –3 151 137 27 158 166
Total, National defense ........................................................................... 78,872 79,174 76,681 79,347 86,509 89,619 22,269 97,241 104,495
150 International affairs:151 International development and humanitarian assistance ................ 2,296 2,394 1,741 2,430 3,134 2,636 1,119 2,823 2,647152 International security assistance ..................................................... 1,367 1,446 1,427 1,824 2,535 2,683 1,470 3,075 3,926153 Conduct of foreign affairs ................................................................ 405 452 476 609 659 727 263 982 1,128154 Foreign information and exchange activities .................................. 241 274 295 320 348 382 115 386 423155 International financial programs ...................................................... –150 215 211 527 421 4 –509 –913 –642
Total, International affairs ....................................................................... 4,159 4,781 4,149 5,710 7,097 6,433 2,458 6,353 7,482
250 General science, space and technology:251 General science and basic research .............................................. 1,009 979 961 1,017 1,038 1,034 292 1,078 1,160252 Space flight, research, and supporting activities ............................ 3,172 3,196 3,071 2,963 2,953 3,338 871 3,657 3,766
Total, General science, space and technology ...................................... 4,182 4,175 4,032 3,980 3,991 4,373 1,162 4,736 4,926
270 Energy:271 Energy supply .................................................................................. 880 1,089 1,007 969 2,446 3,530 913 4,841 6,075272 Energy conservation ........................................................................ .................. .................. .................. 3 48 51 38 143 221274 Emergency energy preparedness ................................................... .................. .................. .................. .................. 33 65 32 123 897276 Energy information, policy, and regulation ...................................... 155 207 231 331 389 558 146 664 798
Total, Energy ........................................................................................... 1,035 1,296 1,237 1,303 2,916 4,204 1,129 5,770 7,992
300 Natural resources and environment:301 Water resources ............................................................................... 1,768 1,948 2,221 2,200 2,608 2,742 805 3,213 3,431302 Conservation and land management .............................................. 488 445 320 148 655 615 160 589 1,029303 Recreational resources .................................................................... 462 516 547 645 803 868 240 985 1,408304 Pollution control and abatement ...................................................... 702 764 1,122 2,035 2,523 3,067 1,091 4,279 3,965306 Other natural resources ................................................................... 495 567 565 668 757 891 228 966 1,151
Total, Natural resources and environment ............................................. 3,915 4,241 4,775 5,697 7,346 8,184 2,524 10,032 10,983
350 Agriculture:351 Farm income stabilization ................................................................ 3,651 4,553 4,099 1,458 2,160 2,249 743 5,735 10,228352 Agricultural research and services .................................................. 639 706 755 772 876 921 240 1,052 1,129
Total, Agriculture ..................................................................................... 4,290 5,259 4,854 2,230 3,036 3,170 983 6,787 11,357
370 Commerce and housing credit:371 Mortgage credit ................................................................................ 74 550 –399 2,119 5,463 4,336 562 2,609 4,553372 Postal Service .................................................................................. 2,183 1,772 1,567 2,471 2,989 2,805 212 2,094 1,282373 Deposit insurance ............................................................................ –383 –597 –805 –611 511 –573 –63 –2,788 –988376 Other advancement of commerce ................................................... 492 497 568 726 984 1,051 221 1,178 1,406
Total, Commerce and housing credit ..................................................... 2,366 2,222 931 4,705 9,947 7,619 931 3,093 6,254
On-budget unless otherwise stated.
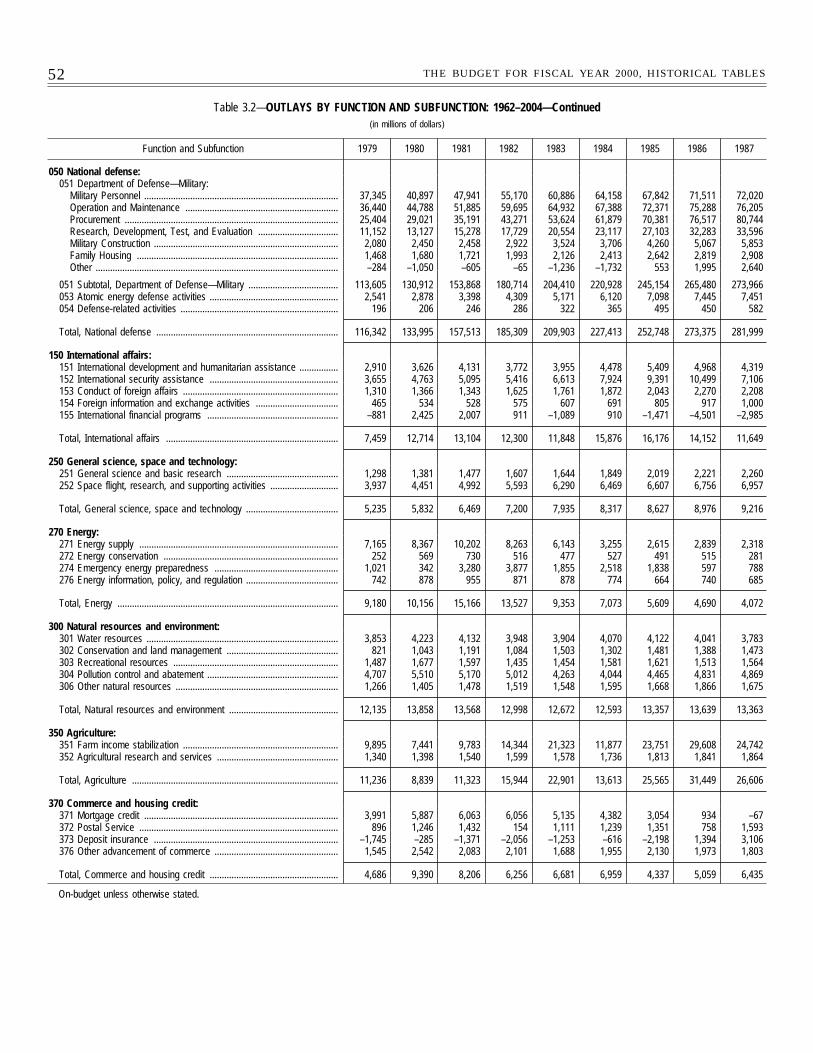
52 THE BUDGET FOR FISCAL YEAR 2000, HISTORICAL TABLES
Table 3.2—OUTLAYS BY FUNCTION AND SUBFUNCTION: 1962–2004—Continued(in millions of dollars)
Function and Subfunction 1979 1980 1981 1982 1983 1984 1985 1986 1987
050 National defense:051 Department of Defense—Military:
Military Personnel ................................................................................ 37,345 40,897 47,941 55,170 60,886 64,158 67,842 71,511 72,020Operation and Maintenance ............................................................... 36,440 44,788 51,885 59,695 64,932 67,388 72,371 75,288 76,205Procurement ........................................................................................ 25,404 29,021 35,191 43,271 53,624 61,879 70,381 76,517 80,744Research, Development, Test, and Evaluation ................................. 11,152 13,127 15,278 17,729 20,554 23,117 27,103 32,283 33,596Military Construction ............................................................................ 2,080 2,450 2,458 2,922 3,524 3,706 4,260 5,067 5,853Family Housing ................................................................................... 1,468 1,680 1,721 1,993 2,126 2,413 2,642 2,819 2,908Other .................................................................................................... –284 –1,050 –605 –65 –1,236 –1,732 553 1,995 2,640
051 Subtotal, Department of Defense—Military ..................................... 113,605 130,912 153,868 180,714 204,410 220,928 245,154 265,480 273,966053 Atomic energy defense activities ..................................................... 2,541 2,878 3,398 4,309 5,171 6,120 7,098 7,445 7,451054 Defense-related activities ................................................................. 196 206 246 286 322 365 495 450 582
Total, National defense ........................................................................... 116,342 133,995 157,513 185,309 209,903 227,413 252,748 273,375 281,999
150 International affairs:151 International development and humanitarian assistance ................ 2,910 3,626 4,131 3,772 3,955 4,478 5,409 4,968 4,319152 International security assistance ..................................................... 3,655 4,763 5,095 5,416 6,613 7,924 9,391 10,499 7,106153 Conduct of foreign affairs ................................................................ 1,310 1,366 1,343 1,625 1,761 1,872 2,043 2,270 2,208154 Foreign information and exchange activities .................................. 465 534 528 575 607 691 805 917 1,000155 International financial programs ...................................................... –881 2,425 2,007 911 –1,089 910 –1,471 –4,501 –2,985
Total, International affairs ....................................................................... 7,459 12,714 13,104 12,300 11,848 15,876 16,176 14,152 11,649
250 General science, space and technology:251 General science and basic research .............................................. 1,298 1,381 1,477 1,607 1,644 1,849 2,019 2,221 2,260252 Space flight, research, and supporting activities ............................ 3,937 4,451 4,992 5,593 6,290 6,469 6,607 6,756 6,957
Total, General science, space and technology ...................................... 5,235 5,832 6,469 7,200 7,935 8,317 8,627 8,976 9,216
270 Energy:271 Energy supply .................................................................................. 7,165 8,367 10,202 8,263 6,143 3,255 2,615 2,839 2,318272 Energy conservation ........................................................................ 252 569 730 516 477 527 491 515 281274 Emergency energy preparedness ................................................... 1,021 342 3,280 3,877 1,855 2,518 1,838 597 788276 Energy information, policy, and regulation ...................................... 742 878 955 871 878 774 664 740 685
Total, Energy ........................................................................................... 9,180 10,156 15,166 13,527 9,353 7,073 5,609 4,690 4,072
300 Natural resources and environment:301 Water resources ............................................................................... 3,853 4,223 4,132 3,948 3,904 4,070 4,122 4,041 3,783302 Conservation and land management .............................................. 821 1,043 1,191 1,084 1,503 1,302 1,481 1,388 1,473303 Recreational resources .................................................................... 1,487 1,677 1,597 1,435 1,454 1,581 1,621 1,513 1,564304 Pollution control and abatement ...................................................... 4,707 5,510 5,170 5,012 4,263 4,044 4,465 4,831 4,869306 Other natural resources ................................................................... 1,266 1,405 1,478 1,519 1,548 1,595 1,668 1,866 1,675
Total, Natural resources and environment ............................................. 12,135 13,858 13,568 12,998 12,672 12,593 13,357 13,639 13,363
350 Agriculture:351 Farm income stabilization ................................................................ 9,895 7,441 9,783 14,344 21,323 11,877 23,751 29,608 24,742352 Agricultural research and services .................................................. 1,340 1,398 1,540 1,599 1,578 1,736 1,813 1,841 1,864
Total, Agriculture ..................................................................................... 11,236 8,839 11,323 15,944 22,901 13,613 25,565 31,449 26,606
370 Commerce and housing credit:371 Mortgage credit ................................................................................ 3,991 5,887 6,063 6,056 5,135 4,382 3,054 934 –67372 Postal Service .................................................................................. 896 1,246 1,432 154 1,111 1,239 1,351 758 1,593373 Deposit insurance ............................................................................ –1,745 –285 –1,371 –2,056 –1,253 –616 –2,198 1,394 3,106376 Other advancement of commerce ................................................... 1,545 2,542 2,083 2,101 1,688 1,955 2,130 1,973 1,803
Total, Commerce and housing credit ..................................................... 4,686 9,390 8,206 6,256 6,681 6,959 4,337 5,059 6,435
On-budget unless otherwise stated.
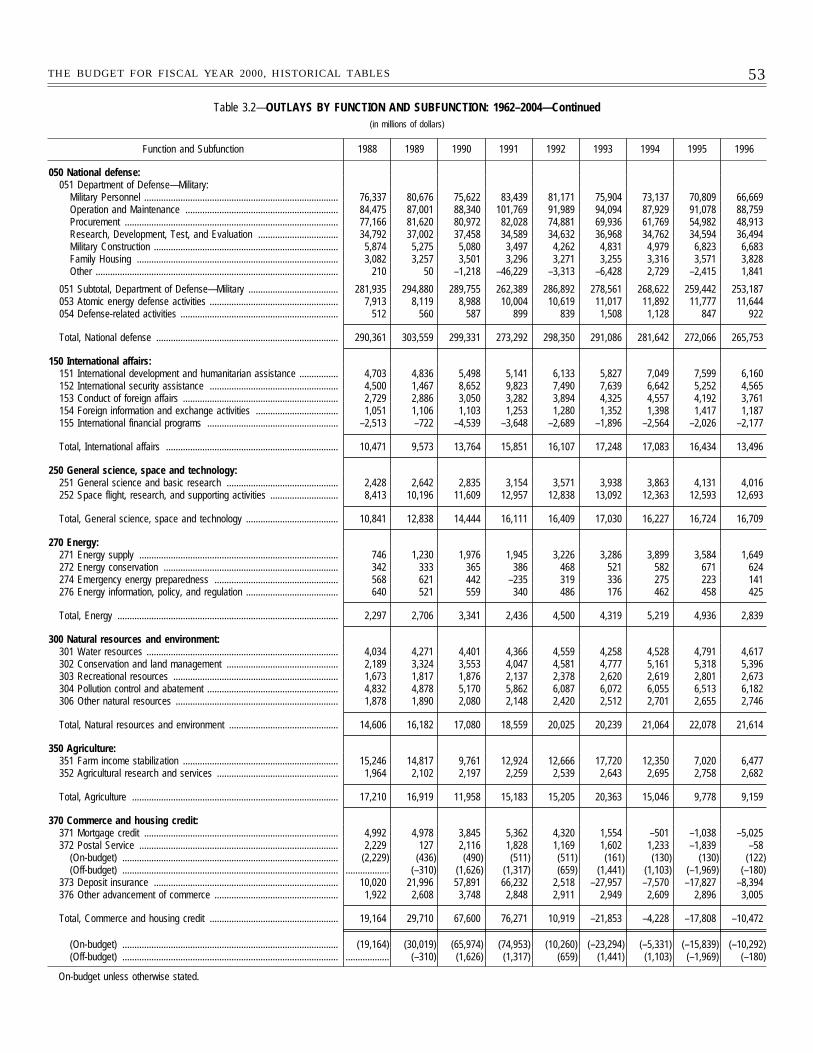
53THE BUDGET FOR FISCAL YEAR 2000, HISTORICAL TABLES
Table 3.2—OUTLAYS BY FUNCTION AND SUBFUNCTION: 1962–2004—Continued(in millions of dollars)
Function and Subfunction 1988 1989 1990 1991 1992 1993 1994 1995 1996
050 National defense:051 Department of Defense—Military:
Military Personnel ................................................................................ 76,337 80,676 75,622 83,439 81,171 75,904 73,137 70,809 66,669Operation and Maintenance ............................................................... 84,475 87,001 88,340 101,769 91,989 94,094 87,929 91,078 88,759Procurement ........................................................................................ 77,166 81,620 80,972 82,028 74,881 69,936 61,769 54,982 48,913Research, Development, Test, and Evaluation ................................. 34,792 37,002 37,458 34,589 34,632 36,968 34,762 34,594 36,494Military Construction ............................................................................ 5,874 5,275 5,080 3,497 4,262 4,831 4,979 6,823 6,683Family Housing ................................................................................... 3,082 3,257 3,501 3,296 3,271 3,255 3,316 3,571 3,828Other .................................................................................................... 210 50 –1,218 –46,229 –3,313 –6,428 2,729 –2,415 1,841
051 Subtotal, Department of Defense—Military ..................................... 281,935 294,880 289,755 262,389 286,892 278,561 268,622 259,442 253,187053 Atomic energy defense activities ..................................................... 7,913 8,119 8,988 10,004 10,619 11,017 11,892 11,777 11,644054 Defense-related activities ................................................................. 512 560 587 899 839 1,508 1,128 847 922
Total, National defense ........................................................................... 290,361 303,559 299,331 273,292 298,350 291,086 281,642 272,066 265,753
150 International affairs:151 International development and humanitarian assistance ................ 4,703 4,836 5,498 5,141 6,133 5,827 7,049 7,599 6,160152 International security assistance ..................................................... 4,500 1,467 8,652 9,823 7,490 7,639 6,642 5,252 4,565153 Conduct of foreign affairs ................................................................ 2,729 2,886 3,050 3,282 3,894 4,325 4,557 4,192 3,761154 Foreign information and exchange activities .................................. 1,051 1,106 1,103 1,253 1,280 1,352 1,398 1,417 1,187155 International financial programs ...................................................... –2,513 –722 –4,539 –3,648 –2,689 –1,896 –2,564 –2,026 –2,177
Total, International affairs ....................................................................... 10,471 9,573 13,764 15,851 16,107 17,248 17,083 16,434 13,496
250 General science, space and technology:251 General science and basic research .............................................. 2,428 2,642 2,835 3,154 3,571 3,938 3,863 4,131 4,016252 Space flight, research, and supporting activities ............................ 8,413 10,196 11,609 12,957 12,838 13,092 12,363 12,593 12,693
Total, General science, space and technology ...................................... 10,841 12,838 14,444 16,111 16,409 17,030 16,227 16,724 16,709
270 Energy:271 Energy supply .................................................................................. 746 1,230 1,976 1,945 3,226 3,286 3,899 3,584 1,649272 Energy conservation ........................................................................ 342 333 365 386 468 521 582 671 624274 Emergency energy preparedness ................................................... 568 621 442 –235 319 336 275 223 141276 Energy information, policy, and regulation ...................................... 640 521 559 340 486 176 462 458 425
Total, Energy ........................................................................................... 2,297 2,706 3,341 2,436 4,500 4,319 5,219 4,936 2,839
300 Natural resources and environment:301 Water resources ............................................................................... 4,034 4,271 4,401 4,366 4,559 4,258 4,528 4,791 4,617302 Conservation and land management .............................................. 2,189 3,324 3,553 4,047 4,581 4,777 5,161 5,318 5,396303 Recreational resources .................................................................... 1,673 1,817 1,876 2,137 2,378 2,620 2,619 2,801 2,673304 Pollution control and abatement ...................................................... 4,832 4,878 5,170 5,862 6,087 6,072 6,055 6,513 6,182306 Other natural resources ................................................................... 1,878 1,890 2,080 2,148 2,420 2,512 2,701 2,655 2,746
Total, Natural resources and environment ............................................. 14,606 16,182 17,080 18,559 20,025 20,239 21,064 22,078 21,614
350 Agriculture:351 Farm income stabilization ................................................................ 15,246 14,817 9,761 12,924 12,666 17,720 12,350 7,020 6,477352 Agricultural research and services .................................................. 1,964 2,102 2,197 2,259 2,539 2,643 2,695 2,758 2,682
Total, Agriculture ..................................................................................... 17,210 16,919 11,958 15,183 15,205 20,363 15,046 9,778 9,159
370 Commerce and housing credit:371 Mortgage credit ................................................................................ 4,992 4,978 3,845 5,362 4,320 1,554 –501 –1,038 –5,025372 Postal Service .................................................................................. 2,229 127 2,116 1,828 1,169 1,602 1,233 –1,839 –58
(On-budget) ......................................................................................... (2,229) (436) (490) (511) (511) (161) (130) (130) (122)(Off-budget) ......................................................................................... .................. (–310) (1,626) (1,317) (659) (1,441) (1,103) (–1,969) (–180)
373 Deposit insurance ............................................................................ 10,020 21,996 57,891 66,232 2,518 –27,957 –7,570 –17,827 –8,394376 Other advancement of commerce ................................................... 1,922 2,608 3,748 2,848 2,911 2,949 2,609 2,896 3,005
Total, Commerce and housing credit ..................................................... 19,164 29,710 67,600 76,271 10,919 –21,853 –4,228 –17,808 –10,472
(On-budget) ......................................................................................... (19,164) (30,019) (65,974) (74,953) (10,260) (–23,294) (–5,331) (–15,839) (–10,292)(Off-budget) ......................................................................................... .................. (–310) (1,626) (1,317) (659) (1,441) (1,103) (–1,969) (–180)
On-budget unless otherwise stated.
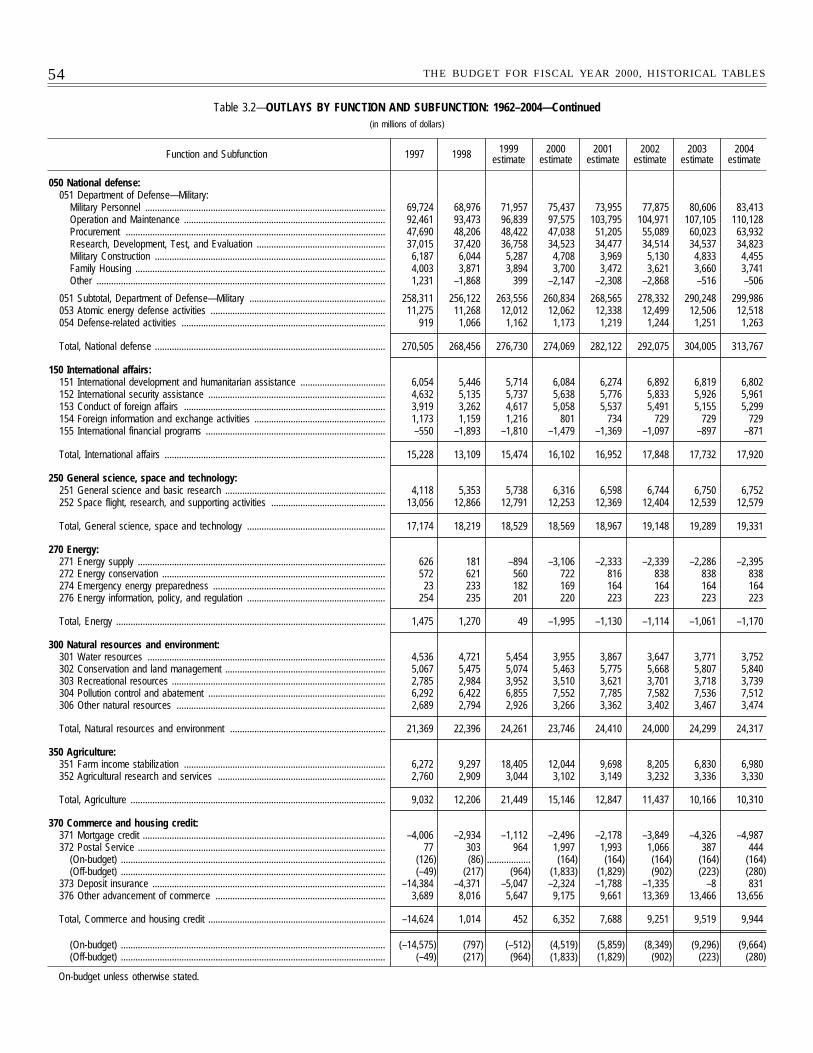
54 THE BUDGET FOR FISCAL YEAR 2000, HISTORICAL TABLES
Table 3.2—OUTLAYS BY FUNCTION AND SUBFUNCTION: 1962–2004—Continued(in millions of dollars)
Function and Subfunction 1997 1998 1999estimate
2000estimate
2001estimate
2002estimate
2003estimate
2004estimate
050 National defense:051 Department of Defense—Military:
Military Personnel ................................................................................................... 69,724 68,976 71,957 75,437 73,955 77,875 80,606 83,413Operation and Maintenance ................................................................................... 92,461 93,473 96,839 97,575 103,795 104,971 107,105 110,128Procurement ........................................................................................................... 47,690 48,206 48,422 47,038 51,205 55,089 60,023 63,932Research, Development, Test, and Evaluation ..................................................... 37,015 37,420 36,758 34,523 34,477 34,514 34,537 34,823Military Construction ............................................................................................... 6,187 6,044 5,287 4,708 3,969 5,130 4,833 4,455Family Housing ....................................................................................................... 4,003 3,871 3,894 3,700 3,472 3,621 3,660 3,741Other ....................................................................................................................... 1,231 –1,868 399 –2,147 –2,308 –2,868 –516 –506
051 Subtotal, Department of Defense—Military ........................................................ 258,311 256,122 263,556 260,834 268,565 278,332 290,248 299,986053 Atomic energy defense activities ........................................................................ 11,275 11,268 12,012 12,062 12,338 12,499 12,506 12,518054 Defense-related activities .................................................................................... 919 1,066 1,162 1,173 1,219 1,244 1,251 1,263
Total, National defense ............................................................................................... 270,505 268,456 276,730 274,069 282,122 292,075 304,005 313,767
150 International affairs:151 International development and humanitarian assistance ................................... 6,054 5,446 5,714 6,084 6,274 6,892 6,819 6,802152 International security assistance ......................................................................... 4,632 5,135 5,737 5,638 5,776 5,833 5,926 5,961153 Conduct of foreign affairs ................................................................................... 3,919 3,262 4,617 5,058 5,537 5,491 5,155 5,299154 Foreign information and exchange activities ...................................................... 1,173 1,159 1,216 801 734 729 729 729155 International financial programs .......................................................................... –550 –1,893 –1,810 –1,479 –1,369 –1,097 –897 –871
Total, International affairs ........................................................................................... 15,228 13,109 15,474 16,102 16,952 17,848 17,732 17,920
250 General science, space and technology:251 General science and basic research .................................................................. 4,118 5,353 5,738 6,316 6,598 6,744 6,750 6,752252 Space flight, research, and supporting activities ............................................... 13,056 12,866 12,791 12,253 12,369 12,404 12,539 12,579
Total, General science, space and technology ......................................................... 17,174 18,219 18,529 18,569 18,967 19,148 19,289 19,331
270 Energy:271 Energy supply ...................................................................................................... 626 181 –894 –3,106 –2,333 –2,339 –2,286 –2,395272 Energy conservation ............................................................................................ 572 621 560 722 816 838 838 838274 Emergency energy preparedness ....................................................................... 23 233 182 169 164 164 164 164276 Energy information, policy, and regulation ......................................................... 254 235 201 220 223 223 223 223
Total, Energy ............................................................................................................... 1,475 1,270 49 –1,995 –1,130 –1,114 –1,061 –1,170
300 Natural resources and environment:301 Water resources .................................................................................................. 4,536 4,721 5,454 3,955 3,867 3,647 3,771 3,752302 Conservation and land management .................................................................. 5,067 5,475 5,074 5,463 5,775 5,668 5,807 5,840303 Recreational resources ........................................................................................ 2,785 2,984 3,952 3,510 3,621 3,701 3,718 3,739304 Pollution control and abatement ......................................................................... 6,292 6,422 6,855 7,552 7,785 7,582 7,536 7,512306 Other natural resources ...................................................................................... 2,689 2,794 2,926 3,266 3,362 3,402 3,467 3,474
Total, Natural resources and environment ................................................................ 21,369 22,396 24,261 23,746 24,410 24,000 24,299 24,317
350 Agriculture:351 Farm income stabilization ................................................................................... 6,272 9,297 18,405 12,044 9,698 8,205 6,830 6,980352 Agricultural research and services ..................................................................... 2,760 2,909 3,044 3,102 3,149 3,232 3,336 3,330
Total, Agriculture ......................................................................................................... 9,032 12,206 21,449 15,146 12,847 11,437 10,166 10,310
370 Commerce and housing credit:371 Mortgage credit .................................................................................................... –4,006 –2,934 –1,112 –2,496 –2,178 –3,849 –4,326 –4,987372 Postal Service ...................................................................................................... 77 303 964 1,997 1,993 1,066 387 444
(On-budget) ............................................................................................................. (126) (86) .................. (164) (164) (164) (164) (164)(Off-budget) ............................................................................................................. (–49) (217) (964) (1,833) (1,829) (902) (223) (280)
373 Deposit insurance ................................................................................................ –14,384 –4,371 –5,047 –2,324 –1,788 –1,335 –8 831376 Other advancement of commerce ...................................................................... 3,689 8,016 5,647 9,175 9,661 13,369 13,466 13,656
Total, Commerce and housing credit ......................................................................... –14,624 1,014 452 6,352 7,688 9,251 9,519 9,944
(On-budget) ............................................................................................................. (–14,575) (797) (–512) (4,519) (5,859) (8,349) (9,296) (9,664)(Off-budget) ............................................................................................................. (–49) (217) (964) (1,833) (1,829) (902) (223) (280)
On-budget unless otherwise stated.
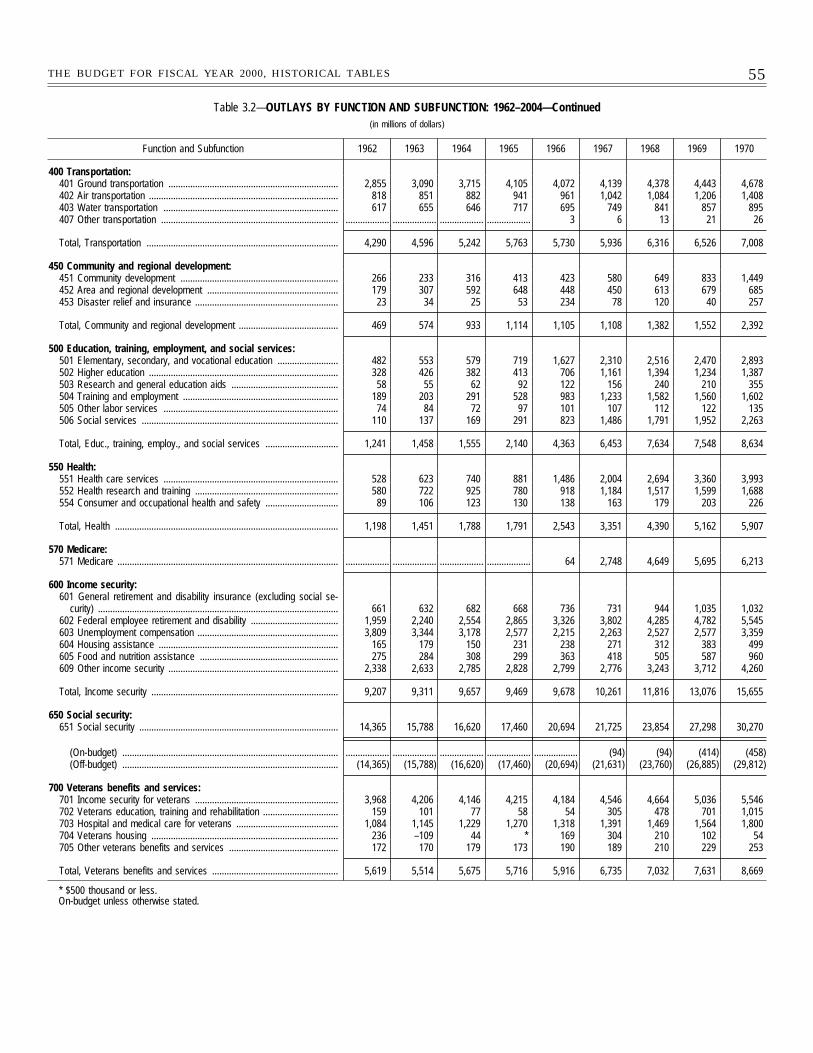
55THE BUDGET FOR FISCAL YEAR 2000, HISTORICAL TABLES
Table 3.2—OUTLAYS BY FUNCTION AND SUBFUNCTION: 1962–2004—Continued(in millions of dollars)
Function and Subfunction 1962 1963 1964 1965 1966 1967 1968 1969 1970
400 Transportation:401 Ground transportation ...................................................................... 2,855 3,090 3,715 4,105 4,072 4,139 4,378 4,443 4,678402 Air transportation .............................................................................. 818 851 882 941 961 1,042 1,084 1,206 1,408403 Water transportation ........................................................................ 617 655 646 717 695 749 841 857 895407 Other transportation ......................................................................... .................. .................. .................. .................. 3 6 13 21 26
Total, Transportation ............................................................................... 4,290 4,596 5,242 5,763 5,730 5,936 6,316 6,526 7,008
450 Community and regional development:451 Community development ................................................................. 266 233 316 413 423 580 649 833 1,449452 Area and regional development ...................................................... 179 307 592 648 448 450 613 679 685453 Disaster relief and insurance ........................................................... 23 34 25 53 234 78 120 40 257
Total, Community and regional development ......................................... 469 574 933 1,114 1,105 1,108 1,382 1,552 2,392
500 Education, training, employment, and social services:501 Elementary, secondary, and vocational education ......................... 482 553 579 719 1,627 2,310 2,516 2,470 2,893502 Higher education .............................................................................. 328 426 382 413 706 1,161 1,394 1,234 1,387503 Research and general education aids ............................................ 58 55 62 92 122 156 240 210 355504 Training and employment ................................................................ 189 203 291 528 983 1,233 1,582 1,560 1,602505 Other labor services ........................................................................ 74 84 72 97 101 107 112 122 135506 Social services ................................................................................. 110 137 169 291 823 1,486 1,791 1,952 2,263
Total, Educ., training, employ., and social services .............................. 1,241 1,458 1,555 2,140 4,363 6,453 7,634 7,548 8,634
550 Health:551 Health care services ........................................................................ 528 623 740 881 1,486 2,004 2,694 3,360 3,993552 Health research and training ........................................................... 580 722 925 780 918 1,184 1,517 1,599 1,688554 Consumer and occupational health and safety .............................. 89 106 123 130 138 163 179 203 226
Total, Health ............................................................................................ 1,198 1,451 1,788 1,791 2,543 3,351 4,390 5,162 5,907
570 Medicare:571 Medicare ........................................................................................... .................. .................. .................. .................. 64 2,748 4,649 5,695 6,213
600 Income security:601 General retirement and disability insurance (excluding social se-
curity) ................................................................................................... 661 632 682 668 736 731 944 1,035 1,032602 Federal employee retirement and disability .................................... 1,959 2,240 2,554 2,865 3,326 3,802 4,285 4,782 5,545603 Unemployment compensation .......................................................... 3,809 3,344 3,178 2,577 2,215 2,263 2,527 2,577 3,359604 Housing assistance .......................................................................... 165 179 150 231 238 271 312 383 499605 Food and nutrition assistance ......................................................... 275 284 308 299 363 418 505 587 960609 Other income security ...................................................................... 2,338 2,633 2,785 2,828 2,799 2,776 3,243 3,712 4,260
Total, Income security ............................................................................. 9,207 9,311 9,657 9,469 9,678 10,261 11,816 13,076 15,655
650 Social security:651 Social security .................................................................................. 14,365 15,788 16,620 17,460 20,694 21,725 23,854 27,298 30,270
(On-budget) ......................................................................................... .................. .................. .................. .................. .................. (94) (94) (414) (458)(Off-budget) ......................................................................................... (14,365) (15,788) (16,620) (17,460) (20,694) (21,631) (23,760) (26,885) (29,812)
700 Veterans benefits and services:701 Income security for veterans ........................................................... 3,968 4,206 4,146 4,215 4,184 4,546 4,664 5,036 5,546702 Veterans education, training and rehabilitation ............................... 159 101 77 58 54 305 478 701 1,015703 Hospital and medical care for veterans .......................................... 1,084 1,145 1,229 1,270 1,318 1,391 1,469 1,564 1,800704 Veterans housing ............................................................................. 236 –109 44 * 169 304 210 102 54705 Other veterans benefits and services ............................................. 172 170 179 173 190 189 210 229 253
Total, Veterans benefits and services .................................................... 5,619 5,514 5,675 5,716 5,916 6,735 7,032 7,631 8,669
* $500 thousand or less.On-budget unless otherwise stated.
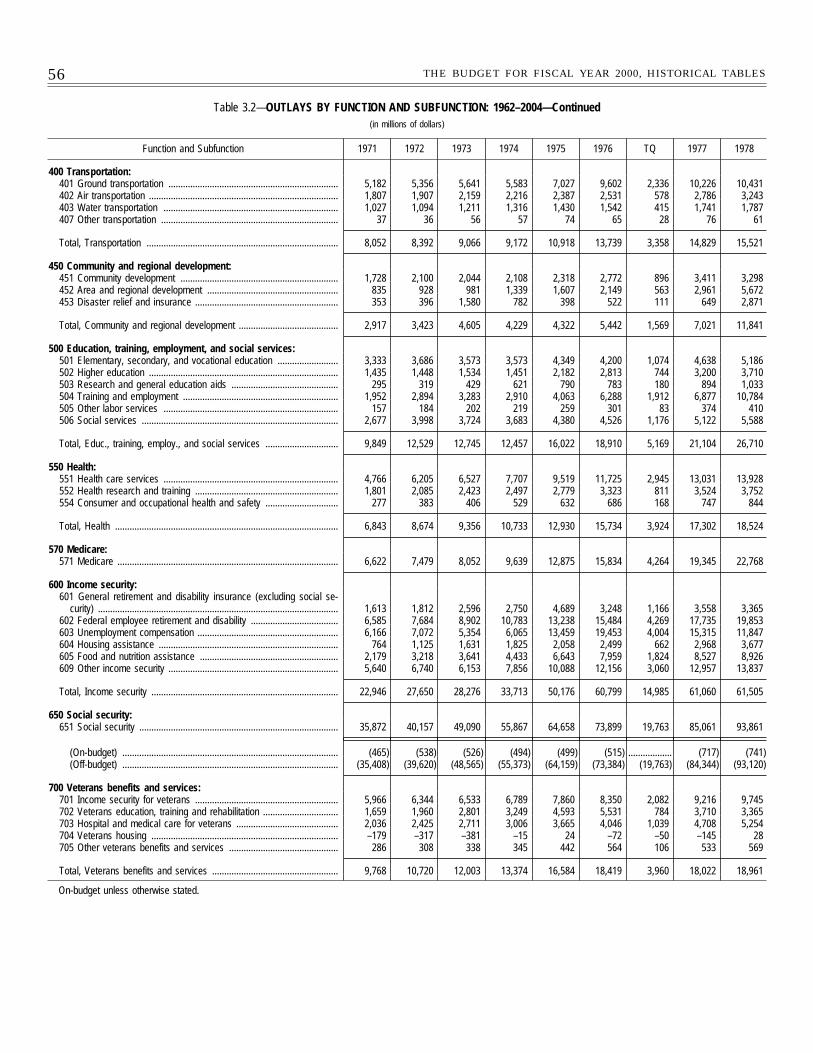
56 THE BUDGET FOR FISCAL YEAR 2000, HISTORICAL TABLES
Table 3.2—OUTLAYS BY FUNCTION AND SUBFUNCTION: 1962–2004—Continued(in millions of dollars)
Function and Subfunction 1971 1972 1973 1974 1975 1976 TQ 1977 1978
400 Transportation:401 Ground transportation ...................................................................... 5,182 5,356 5,641 5,583 7,027 9,602 2,336 10,226 10,431402 Air transportation .............................................................................. 1,807 1,907 2,159 2,216 2,387 2,531 578 2,786 3,243403 Water transportation ........................................................................ 1,027 1,094 1,211 1,316 1,430 1,542 415 1,741 1,787407 Other transportation ......................................................................... 37 36 56 57 74 65 28 76 61
Total, Transportation ............................................................................... 8,052 8,392 9,066 9,172 10,918 13,739 3,358 14,829 15,521
450 Community and regional development:451 Community development ................................................................. 1,728 2,100 2,044 2,108 2,318 2,772 896 3,411 3,298452 Area and regional development ...................................................... 835 928 981 1,339 1,607 2,149 563 2,961 5,672453 Disaster relief and insurance ........................................................... 353 396 1,580 782 398 522 111 649 2,871
Total, Community and regional development ......................................... 2,917 3,423 4,605 4,229 4,322 5,442 1,569 7,021 11,841
500 Education, training, employment, and social services:501 Elementary, secondary, and vocational education ......................... 3,333 3,686 3,573 3,573 4,349 4,200 1,074 4,638 5,186502 Higher education .............................................................................. 1,435 1,448 1,534 1,451 2,182 2,813 744 3,200 3,710503 Research and general education aids ............................................ 295 319 429 621 790 783 180 894 1,033504 Training and employment ................................................................ 1,952 2,894 3,283 2,910 4,063 6,288 1,912 6,877 10,784505 Other labor services ........................................................................ 157 184 202 219 259 301 83 374 410506 Social services ................................................................................. 2,677 3,998 3,724 3,683 4,380 4,526 1,176 5,122 5,588
Total, Educ., training, employ., and social services .............................. 9,849 12,529 12,745 12,457 16,022 18,910 5,169 21,104 26,710
550 Health:551 Health care services ........................................................................ 4,766 6,205 6,527 7,707 9,519 11,725 2,945 13,031 13,928552 Health research and training ........................................................... 1,801 2,085 2,423 2,497 2,779 3,323 811 3,524 3,752554 Consumer and occupational health and safety .............................. 277 383 406 529 632 686 168 747 844
Total, Health ............................................................................................ 6,843 8,674 9,356 10,733 12,930 15,734 3,924 17,302 18,524
570 Medicare:571 Medicare ........................................................................................... 6,622 7,479 8,052 9,639 12,875 15,834 4,264 19,345 22,768
600 Income security:601 General retirement and disability insurance (excluding social se-
curity) ................................................................................................... 1,613 1,812 2,596 2,750 4,689 3,248 1,166 3,558 3,365602 Federal employee retirement and disability .................................... 6,585 7,684 8,902 10,783 13,238 15,484 4,269 17,735 19,853603 Unemployment compensation .......................................................... 6,166 7,072 5,354 6,065 13,459 19,453 4,004 15,315 11,847604 Housing assistance .......................................................................... 764 1,125 1,631 1,825 2,058 2,499 662 2,968 3,677605 Food and nutrition assistance ......................................................... 2,179 3,218 3,641 4,433 6,643 7,959 1,824 8,527 8,926609 Other income security ...................................................................... 5,640 6,740 6,153 7,856 10,088 12,156 3,060 12,957 13,837
Total, Income security ............................................................................. 22,946 27,650 28,276 33,713 50,176 60,799 14,985 61,060 61,505
650 Social security:651 Social security .................................................................................. 35,872 40,157 49,090 55,867 64,658 73,899 19,763 85,061 93,861
(On-budget) ......................................................................................... (465) (538) (526) (494) (499) (515) .................. (717) (741)(Off-budget) ......................................................................................... (35,408) (39,620) (48,565) (55,373) (64,159) (73,384) (19,763) (84,344) (93,120)
700 Veterans benefits and services:701 Income security for veterans ........................................................... 5,966 6,344 6,533 6,789 7,860 8,350 2,082 9,216 9,745702 Veterans education, training and rehabilitation ............................... 1,659 1,960 2,801 3,249 4,593 5,531 784 3,710 3,365703 Hospital and medical care for veterans .......................................... 2,036 2,425 2,711 3,006 3,665 4,046 1,039 4,708 5,254704 Veterans housing ............................................................................. –179 –317 –381 –15 24 –72 –50 –145 28705 Other veterans benefits and services ............................................. 286 308 338 345 442 564 106 533 569
Total, Veterans benefits and services .................................................... 9,768 10,720 12,003 13,374 16,584 18,419 3,960 18,022 18,961
On-budget unless otherwise stated.
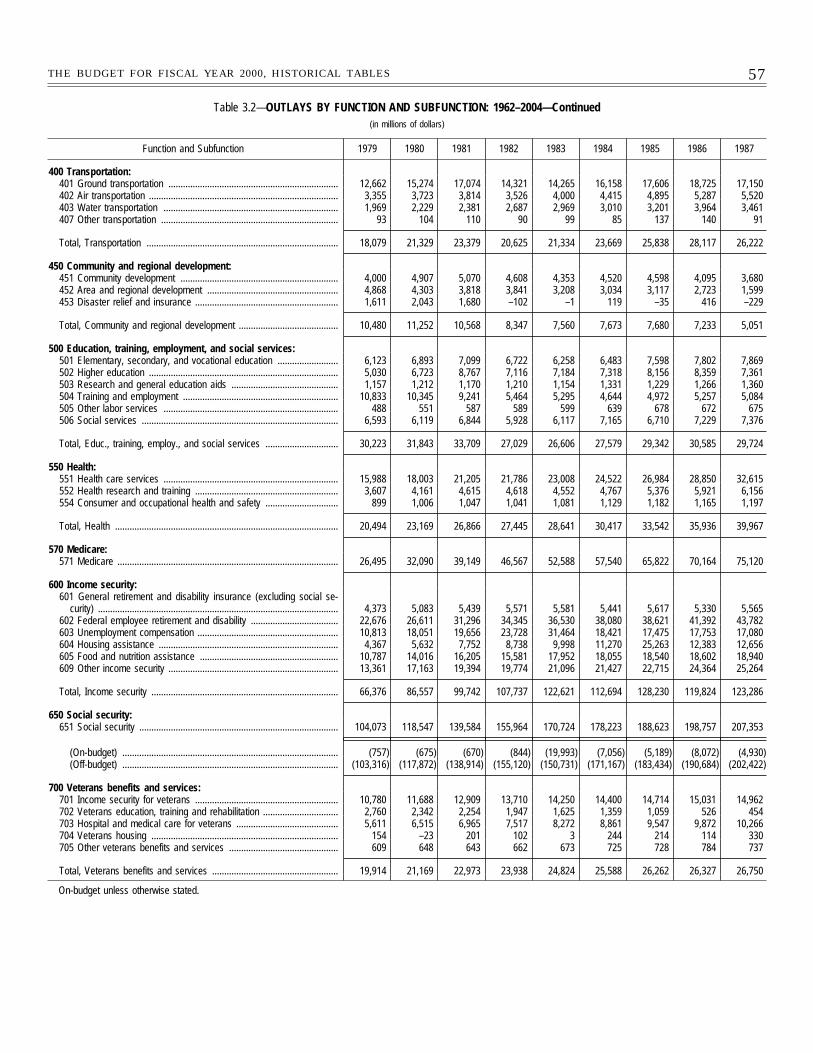
57THE BUDGET FOR FISCAL YEAR 2000, HISTORICAL TABLES
Table 3.2—OUTLAYS BY FUNCTION AND SUBFUNCTION: 1962–2004—Continued(in millions of dollars)
Function and Subfunction 1979 1980 1981 1982 1983 1984 1985 1986 1987
400 Transportation:401 Ground transportation ...................................................................... 12,662 15,274 17,074 14,321 14,265 16,158 17,606 18,725 17,150402 Air transportation .............................................................................. 3,355 3,723 3,814 3,526 4,000 4,415 4,895 5,287 5,520403 Water transportation ........................................................................ 1,969 2,229 2,381 2,687 2,969 3,010 3,201 3,964 3,461407 Other transportation ......................................................................... 93 104 110 90 99 85 137 140 91
Total, Transportation ............................................................................... 18,079 21,329 23,379 20,625 21,334 23,669 25,838 28,117 26,222
450 Community and regional development:451 Community development ................................................................. 4,000 4,907 5,070 4,608 4,353 4,520 4,598 4,095 3,680452 Area and regional development ...................................................... 4,868 4,303 3,818 3,841 3,208 3,034 3,117 2,723 1,599453 Disaster relief and insurance ........................................................... 1,611 2,043 1,680 –102 –1 119 –35 416 –229
Total, Community and regional development ......................................... 10,480 11,252 10,568 8,347 7,560 7,673 7,680 7,233 5,051
500 Education, training, employment, and social services:501 Elementary, secondary, and vocational education ......................... 6,123 6,893 7,099 6,722 6,258 6,483 7,598 7,802 7,869502 Higher education .............................................................................. 5,030 6,723 8,767 7,116 7,184 7,318 8,156 8,359 7,361503 Research and general education aids ............................................ 1,157 1,212 1,170 1,210 1,154 1,331 1,229 1,266 1,360504 Training and employment ................................................................ 10,833 10,345 9,241 5,464 5,295 4,644 4,972 5,257 5,084505 Other labor services ........................................................................ 488 551 587 589 599 639 678 672 675506 Social services ................................................................................. 6,593 6,119 6,844 5,928 6,117 7,165 6,710 7,229 7,376
Total, Educ., training, employ., and social services .............................. 30,223 31,843 33,709 27,029 26,606 27,579 29,342 30,585 29,724
550 Health:551 Health care services ........................................................................ 15,988 18,003 21,205 21,786 23,008 24,522 26,984 28,850 32,615552 Health research and training ........................................................... 3,607 4,161 4,615 4,618 4,552 4,767 5,376 5,921 6,156554 Consumer and occupational health and safety .............................. 899 1,006 1,047 1,041 1,081 1,129 1,182 1,165 1,197
Total, Health ............................................................................................ 20,494 23,169 26,866 27,445 28,641 30,417 33,542 35,936 39,967
570 Medicare:571 Medicare ........................................................................................... 26,495 32,090 39,149 46,567 52,588 57,540 65,822 70,164 75,120
600 Income security:601 General retirement and disability insurance (excluding social se-
curity) ................................................................................................... 4,373 5,083 5,439 5,571 5,581 5,441 5,617 5,330 5,565602 Federal employee retirement and disability .................................... 22,676 26,611 31,296 34,345 36,530 38,080 38,621 41,392 43,782603 Unemployment compensation .......................................................... 10,813 18,051 19,656 23,728 31,464 18,421 17,475 17,753 17,080604 Housing assistance .......................................................................... 4,367 5,632 7,752 8,738 9,998 11,270 25,263 12,383 12,656605 Food and nutrition assistance ......................................................... 10,787 14,016 16,205 15,581 17,952 18,055 18,540 18,602 18,940609 Other income security ...................................................................... 13,361 17,163 19,394 19,774 21,096 21,427 22,715 24,364 25,264
Total, Income security ............................................................................. 66,376 86,557 99,742 107,737 122,621 112,694 128,230 119,824 123,286
650 Social security:651 Social security .................................................................................. 104,073 118,547 139,584 155,964 170,724 178,223 188,623 198,757 207,353
(On-budget) ......................................................................................... (757) (675) (670) (844) (19,993) (7,056) (5,189) (8,072) (4,930)(Off-budget) ......................................................................................... (103,316) (117,872) (138,914) (155,120) (150,731) (171,167) (183,434) (190,684) (202,422)
700 Veterans benefits and services:701 Income security for veterans ........................................................... 10,780 11,688 12,909 13,710 14,250 14,400 14,714 15,031 14,962702 Veterans education, training and rehabilitation ............................... 2,760 2,342 2,254 1,947 1,625 1,359 1,059 526 454703 Hospital and medical care for veterans .......................................... 5,611 6,515 6,965 7,517 8,272 8,861 9,547 9,872 10,266704 Veterans housing ............................................................................. 154 –23 201 102 3 244 214 114 330705 Other veterans benefits and services ............................................. 609 648 643 662 673 725 728 784 737
Total, Veterans benefits and services .................................................... 19,914 21,169 22,973 23,938 24,824 25,588 26,262 26,327 26,750
On-budget unless otherwise stated.
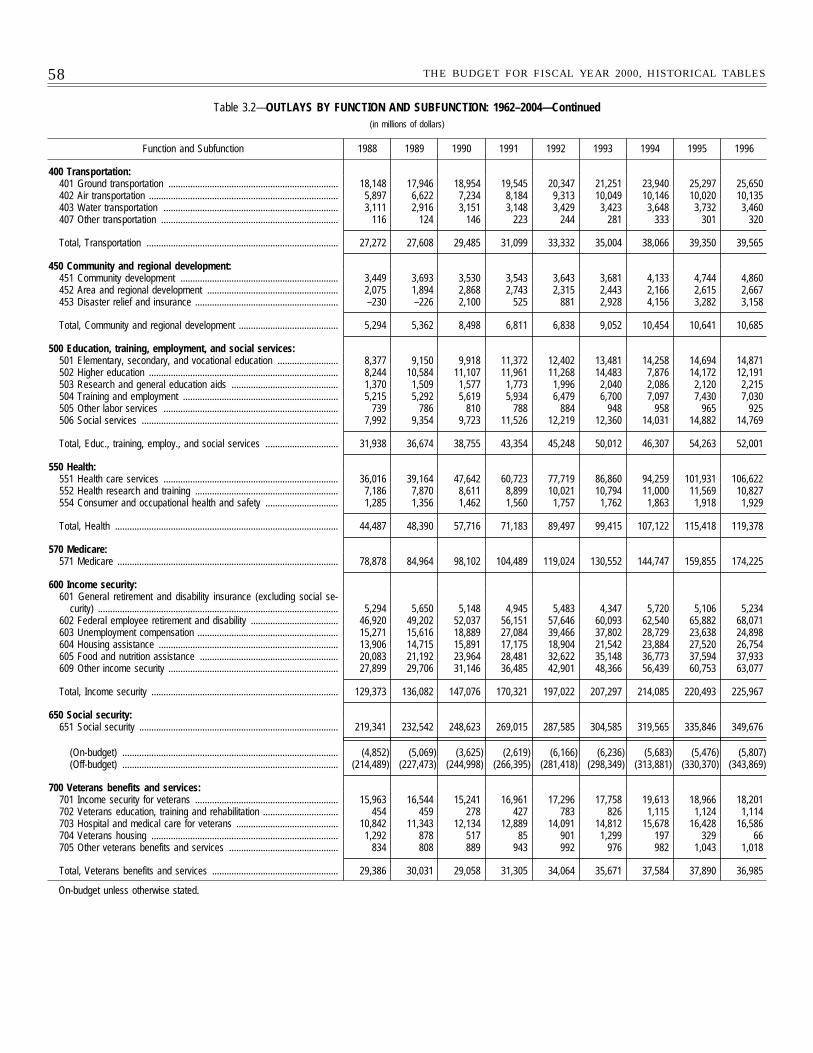
58 THE BUDGET FOR FISCAL YEAR 2000, HISTORICAL TABLES
Table 3.2—OUTLAYS BY FUNCTION AND SUBFUNCTION: 1962–2004—Continued(in millions of dollars)
Function and Subfunction 1988 1989 1990 1991 1992 1993 1994 1995 1996
400 Transportation:401 Ground transportation ...................................................................... 18,148 17,946 18,954 19,545 20,347 21,251 23,940 25,297 25,650402 Air transportation .............................................................................. 5,897 6,622 7,234 8,184 9,313 10,049 10,146 10,020 10,135403 Water transportation ........................................................................ 3,111 2,916 3,151 3,148 3,429 3,423 3,648 3,732 3,460407 Other transportation ......................................................................... 116 124 146 223 244 281 333 301 320
Total, Transportation ............................................................................... 27,272 27,608 29,485 31,099 33,332 35,004 38,066 39,350 39,565
450 Community and regional development:451 Community development ................................................................. 3,449 3,693 3,530 3,543 3,643 3,681 4,133 4,744 4,860452 Area and regional development ...................................................... 2,075 1,894 2,868 2,743 2,315 2,443 2,166 2,615 2,667453 Disaster relief and insurance ........................................................... –230 –226 2,100 525 881 2,928 4,156 3,282 3,158
Total, Community and regional development ......................................... 5,294 5,362 8,498 6,811 6,838 9,052 10,454 10,641 10,685
500 Education, training, employment, and social services:501 Elementary, secondary, and vocational education ......................... 8,377 9,150 9,918 11,372 12,402 13,481 14,258 14,694 14,871502 Higher education .............................................................................. 8,244 10,584 11,107 11,961 11,268 14,483 7,876 14,172 12,191503 Research and general education aids ............................................ 1,370 1,509 1,577 1,773 1,996 2,040 2,086 2,120 2,215504 Training and employment ................................................................ 5,215 5,292 5,619 5,934 6,479 6,700 7,097 7,430 7,030505 Other labor services ........................................................................ 739 786 810 788 884 948 958 965 925506 Social services ................................................................................. 7,992 9,354 9,723 11,526 12,219 12,360 14,031 14,882 14,769
Total, Educ., training, employ., and social services .............................. 31,938 36,674 38,755 43,354 45,248 50,012 46,307 54,263 52,001
550 Health:551 Health care services ........................................................................ 36,016 39,164 47,642 60,723 77,719 86,860 94,259 101,931 106,622552 Health research and training ........................................................... 7,186 7,870 8,611 8,899 10,021 10,794 11,000 11,569 10,827554 Consumer and occupational health and safety .............................. 1,285 1,356 1,462 1,560 1,757 1,762 1,863 1,918 1,929
Total, Health ............................................................................................ 44,487 48,390 57,716 71,183 89,497 99,415 107,122 115,418 119,378
570 Medicare:571 Medicare ........................................................................................... 78,878 84,964 98,102 104,489 119,024 130,552 144,747 159,855 174,225
600 Income security:601 General retirement and disability insurance (excluding social se-
curity) ................................................................................................... 5,294 5,650 5,148 4,945 5,483 4,347 5,720 5,106 5,234602 Federal employee retirement and disability .................................... 46,920 49,202 52,037 56,151 57,646 60,093 62,540 65,882 68,071603 Unemployment compensation .......................................................... 15,271 15,616 18,889 27,084 39,466 37,802 28,729 23,638 24,898604 Housing assistance .......................................................................... 13,906 14,715 15,891 17,175 18,904 21,542 23,884 27,520 26,754605 Food and nutrition assistance ......................................................... 20,083 21,192 23,964 28,481 32,622 35,148 36,773 37,594 37,933609 Other income security ...................................................................... 27,899 29,706 31,146 36,485 42,901 48,366 56,439 60,753 63,077
Total, Income security ............................................................................. 129,373 136,082 147,076 170,321 197,022 207,297 214,085 220,493 225,967
650 Social security:651 Social security .................................................................................. 219,341 232,542 248,623 269,015 287,585 304,585 319,565 335,846 349,676
(On-budget) ......................................................................................... (4,852) (5,069) (3,625) (2,619) (6,166) (6,236) (5,683) (5,476) (5,807)(Off-budget) ......................................................................................... (214,489) (227,473) (244,998) (266,395) (281,418) (298,349) (313,881) (330,370) (343,869)
700 Veterans benefits and services:701 Income security for veterans ........................................................... 15,963 16,544 15,241 16,961 17,296 17,758 19,613 18,966 18,201702 Veterans education, training and rehabilitation ............................... 454 459 278 427 783 826 1,115 1,124 1,114703 Hospital and medical care for veterans .......................................... 10,842 11,343 12,134 12,889 14,091 14,812 15,678 16,428 16,586704 Veterans housing ............................................................................. 1,292 878 517 85 901 1,299 197 329 66705 Other veterans benefits and services ............................................. 834 808 889 943 992 976 982 1,043 1,018
Total, Veterans benefits and services .................................................... 29,386 30,031 29,058 31,305 34,064 35,671 37,584 37,890 36,985
On-budget unless otherwise stated.
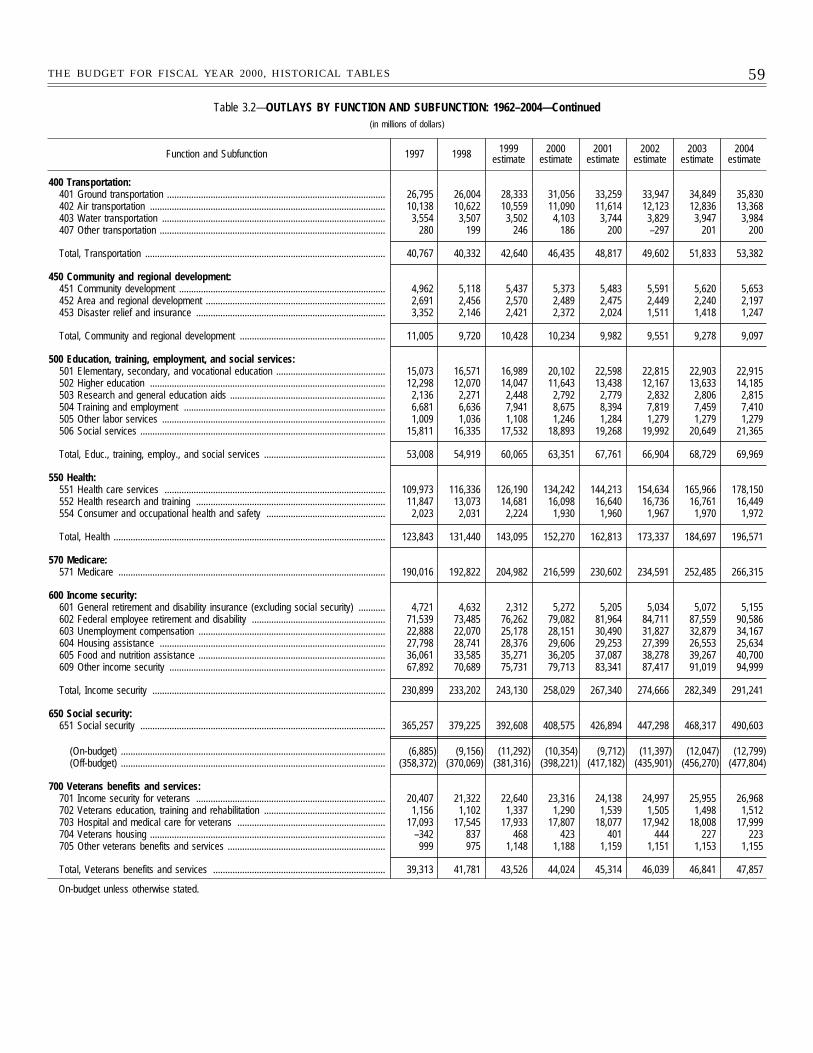
59THE BUDGET FOR FISCAL YEAR 2000, HISTORICAL TABLES
Table 3.2—OUTLAYS BY FUNCTION AND SUBFUNCTION: 1962–2004—Continued(in millions of dollars)
Function and Subfunction 1997 1998 1999estimate
2000estimate
2001estimate
2002estimate
2003estimate
2004estimate
400 Transportation:401 Ground transportation .......................................................................................... 26,795 26,004 28,333 31,056 33,259 33,947 34,849 35,830402 Air transportation ................................................................................................. 10,138 10,622 10,559 11,090 11,614 12,123 12,836 13,368403 Water transportation ............................................................................................ 3,554 3,507 3,502 4,103 3,744 3,829 3,947 3,984407 Other transportation ............................................................................................. 280 199 246 186 200 –297 201 200
Total, Transportation ................................................................................................... 40,767 40,332 42,640 46,435 48,817 49,602 51,833 53,382
450 Community and regional development:451 Community development ..................................................................................... 4,962 5,118 5,437 5,373 5,483 5,591 5,620 5,653452 Area and regional development .......................................................................... 2,691 2,456 2,570 2,489 2,475 2,449 2,240 2,197453 Disaster relief and insurance .............................................................................. 3,352 2,146 2,421 2,372 2,024 1,511 1,418 1,247
Total, Community and regional development ............................................................ 11,005 9,720 10,428 10,234 9,982 9,551 9,278 9,097
500 Education, training, employment, and social services:501 Elementary, secondary, and vocational education ............................................. 15,073 16,571 16,989 20,102 22,598 22,815 22,903 22,915502 Higher education ................................................................................................. 12,298 12,070 14,047 11,643 13,438 12,167 13,633 14,185503 Research and general education aids ................................................................ 2,136 2,271 2,448 2,792 2,779 2,832 2,806 2,815504 Training and employment ................................................................................... 6,681 6,636 7,941 8,675 8,394 7,819 7,459 7,410505 Other labor services ............................................................................................ 1,009 1,036 1,108 1,246 1,284 1,279 1,279 1,279506 Social services ..................................................................................................... 15,811 16,335 17,532 18,893 19,268 19,992 20,649 21,365
Total, Educ., training, employ., and social services .................................................. 53,008 54,919 60,065 63,351 67,761 66,904 68,729 69,969
550 Health:551 Health care services ........................................................................................... 109,973 116,336 126,190 134,242 144,213 154,634 165,966 178,150552 Health research and training .............................................................................. 11,847 13,073 14,681 16,098 16,640 16,736 16,761 16,449554 Consumer and occupational health and safety ................................................. 2,023 2,031 2,224 1,930 1,960 1,967 1,970 1,972
Total, Health ................................................................................................................ 123,843 131,440 143,095 152,270 162,813 173,337 184,697 196,571
570 Medicare:571 Medicare .............................................................................................................. 190,016 192,822 204,982 216,599 230,602 234,591 252,485 266,315
600 Income security:601 General retirement and disability insurance (excluding social security) ........... 4,721 4,632 2,312 5,272 5,205 5,034 5,072 5,155602 Federal employee retirement and disability ....................................................... 71,539 73,485 76,262 79,082 81,964 84,711 87,559 90,586603 Unemployment compensation ............................................................................. 22,888 22,070 25,178 28,151 30,490 31,827 32,879 34,167604 Housing assistance ............................................................................................. 27,798 28,741 28,376 29,606 29,253 27,399 26,553 25,634605 Food and nutrition assistance ............................................................................. 36,061 33,585 35,271 36,205 37,087 38,278 39,267 40,700609 Other income security ......................................................................................... 67,892 70,689 75,731 79,713 83,341 87,417 91,019 94,999
Total, Income security ................................................................................................ 230,899 233,202 243,130 258,029 267,340 274,666 282,349 291,241
650 Social security:651 Social security ..................................................................................................... 365,257 379,225 392,608 408,575 426,894 447,298 468,317 490,603
(On-budget) ............................................................................................................. (6,885) (9,156) (11,292) (10,354) (9,712) (11,397) (12,047) (12,799)(Off-budget) ............................................................................................................. (358,372) (370,069) (381,316) (398,221) (417,182) (435,901) (456,270) (477,804)
700 Veterans benefits and services:701 Income security for veterans .............................................................................. 20,407 21,322 22,640 23,316 24,138 24,997 25,955 26,968702 Veterans education, training and rehabilitation .................................................. 1,156 1,102 1,337 1,290 1,539 1,505 1,498 1,512703 Hospital and medical care for veterans ............................................................. 17,093 17,545 17,933 17,807 18,077 17,942 18,008 17,999704 Veterans housing ................................................................................................. –342 837 468 423 401 444 227 223705 Other veterans benefits and services ................................................................. 999 975 1,148 1,188 1,159 1,151 1,153 1,155
Total, Veterans benefits and services ....................................................................... 39,313 41,781 43,526 44,024 45,314 46,039 46,841 47,857
On-budget unless otherwise stated.
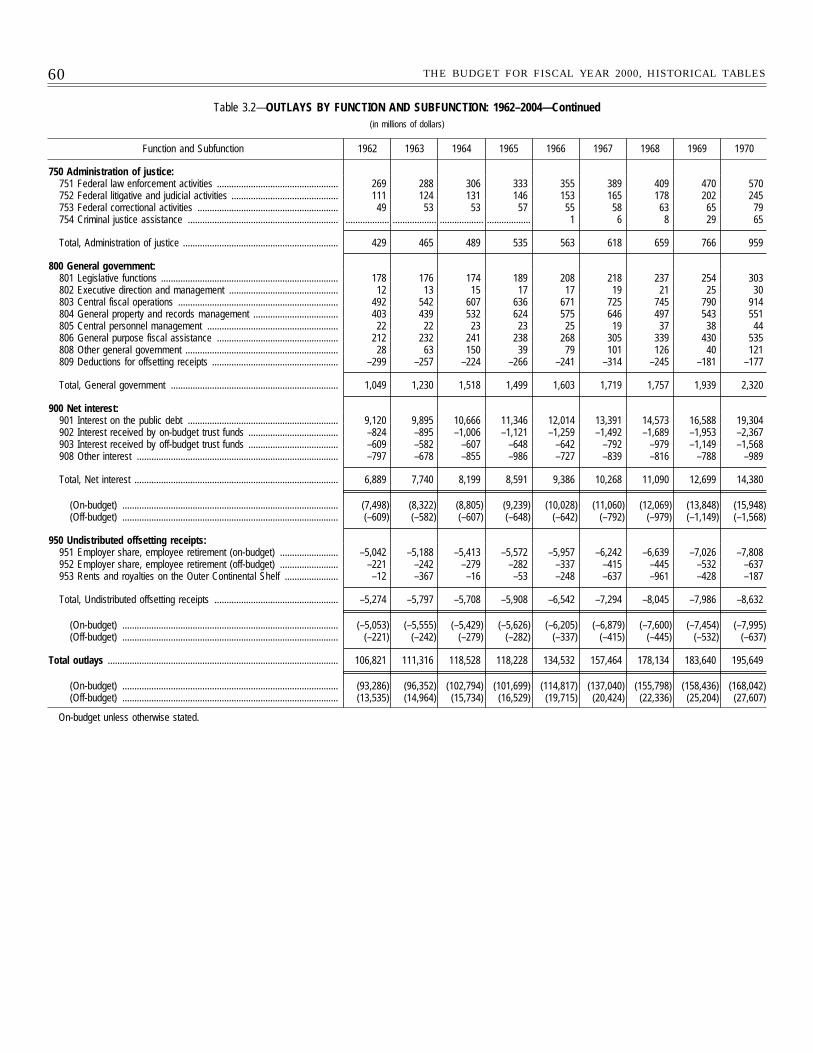
60 THE BUDGET FOR FISCAL YEAR 2000, HISTORICAL TABLES
Table 3.2—OUTLAYS BY FUNCTION AND SUBFUNCTION: 1962–2004—Continued(in millions of dollars)
Function and Subfunction 1962 1963 1964 1965 1966 1967 1968 1969 1970
750 Administration of justice:751 Federal law enforcement activities .................................................. 269 288 306 333 355 389 409 470 570752 Federal litigative and judicial activities ............................................ 111 124 131 146 153 165 178 202 245753 Federal correctional activities .......................................................... 49 53 53 57 55 58 63 65 79754 Criminal justice assistance .............................................................. .................. .................. .................. .................. 1 6 8 29 65
Total, Administration of justice ................................................................ 429 465 489 535 563 618 659 766 959
800 General government:801 Legislative functions ......................................................................... 178 176 174 189 208 218 237 254 303802 Executive direction and management ............................................. 12 13 15 17 17 19 21 25 30803 Central fiscal operations .................................................................. 492 542 607 636 671 725 745 790 914804 General property and records management ................................... 403 439 532 624 575 646 497 543 551805 Central personnel management ...................................................... 22 22 23 23 25 19 37 38 44806 General purpose fiscal assistance .................................................. 212 232 241 238 268 305 339 430 535808 Other general government ............................................................... 28 63 150 39 79 101 126 40 121809 Deductions for offsetting receipts .................................................... –299 –257 –224 –266 –241 –314 –245 –181 –177
Total, General government ..................................................................... 1,049 1,230 1,518 1,499 1,603 1,719 1,757 1,939 2,320
900 Net interest:901 Interest on the public debt .............................................................. 9,120 9,895 10,666 11,346 12,014 13,391 14,573 16,588 19,304902 Interest received by on-budget trust funds ..................................... –824 –895 –1,006 –1,121 –1,259 –1,492 –1,689 –1,953 –2,367903 Interest received by off-budget trust funds ..................................... –609 –582 –607 –648 –642 –792 –979 –1,149 –1,568908 Other interest ................................................................................... –797 –678 –855 –986 –727 –839 –816 –788 –989
Total, Net interest .................................................................................... 6,889 7,740 8,199 8,591 9,386 10,268 11,090 12,699 14,380
(On-budget) ......................................................................................... (7,498) (8,322) (8,805) (9,239) (10,028) (11,060) (12,069) (13,848) (15,948)(Off-budget) ......................................................................................... (–609) (–582) (–607) (–648) (–642) (–792) (–979) (–1,149) (–1,568)
950 Undistributed offsetting receipts:951 Employer share, employee retirement (on-budget) ........................ –5,042 –5,188 –5,413 –5,572 –5,957 –6,242 –6,639 –7,026 –7,808952 Employer share, employee retirement (off-budget) ........................ –221 –242 –279 –282 –337 –415 –445 –532 –637953 Rents and royalties on the Outer Continental Shelf ...................... –12 –367 –16 –53 –248 –637 –961 –428 –187
Total, Undistributed offsetting receipts ................................................... –5,274 –5,797 –5,708 –5,908 –6,542 –7,294 –8,045 –7,986 –8,632
(On-budget) ......................................................................................... (–5,053) (–5,555) (–5,429) (–5,626) (–6,205) (–6,879) (–7,600) (–7,454) (–7,995)(Off-budget) ......................................................................................... (–221) (–242) (–279) (–282) (–337) (–415) (–445) (–532) (–637)
Total outlays ............................................................................................... 106,821 111,316 118,528 118,228 134,532 157,464 178,134 183,640 195,649
(On-budget) ......................................................................................... (93,286) (96,352) (102,794) (101,699) (114,817) (137,040) (155,798) (158,436) (168,042)(Off-budget) ......................................................................................... (13,535) (14,964) (15,734) (16,529) (19,715) (20,424) (22,336) (25,204) (27,607)
On-budget unless otherwise stated.
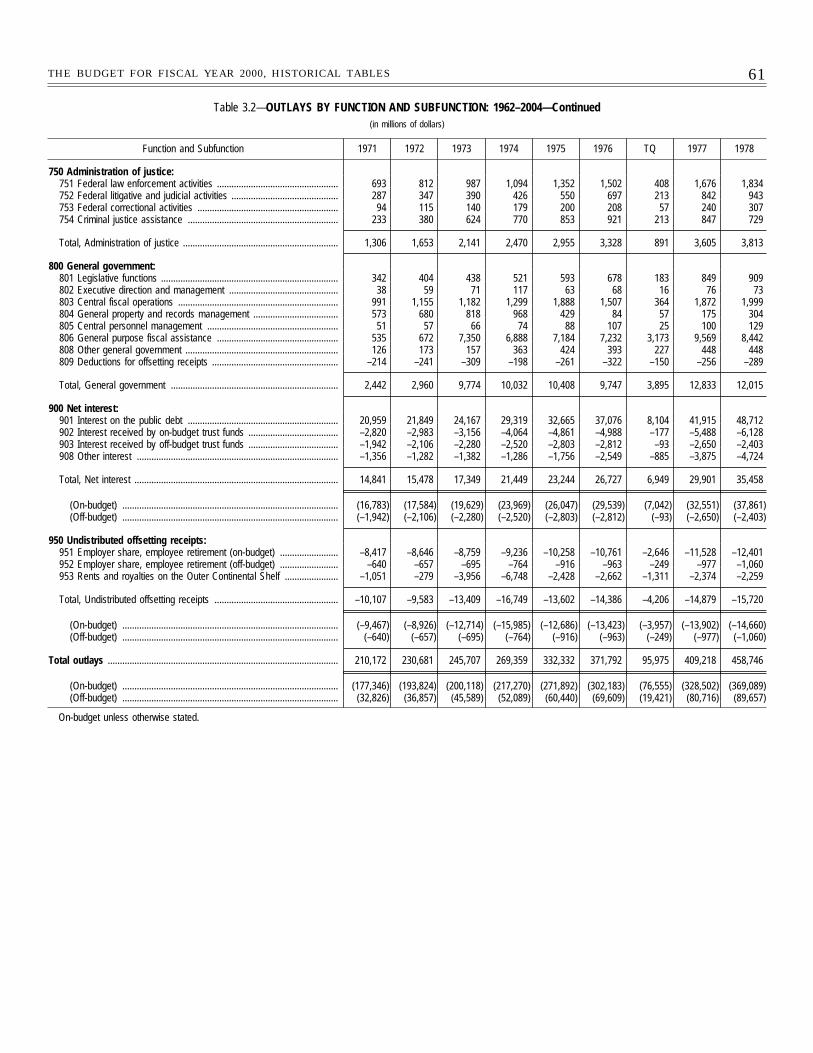
61THE BUDGET FOR FISCAL YEAR 2000, HISTORICAL TABLES
Table 3.2—OUTLAYS BY FUNCTION AND SUBFUNCTION: 1962–2004—Continued(in millions of dollars)
Function and Subfunction 1971 1972 1973 1974 1975 1976 TQ 1977 1978
750 Administration of justice:751 Federal law enforcement activities .................................................. 693 812 987 1,094 1,352 1,502 408 1,676 1,834752 Federal litigative and judicial activities ............................................ 287 347 390 426 550 697 213 842 943753 Federal correctional activities .......................................................... 94 115 140 179 200 208 57 240 307754 Criminal justice assistance .............................................................. 233 380 624 770 853 921 213 847 729
Total, Administration of justice ................................................................ 1,306 1,653 2,141 2,470 2,955 3,328 891 3,605 3,813
800 General government:801 Legislative functions ......................................................................... 342 404 438 521 593 678 183 849 909802 Executive direction and management ............................................. 38 59 71 117 63 68 16 76 73803 Central fiscal operations .................................................................. 991 1,155 1,182 1,299 1,888 1,507 364 1,872 1,999804 General property and records management ................................... 573 680 818 968 429 84 57 175 304805 Central personnel management ...................................................... 51 57 66 74 88 107 25 100 129806 General purpose fiscal assistance .................................................. 535 672 7,350 6,888 7,184 7,232 3,173 9,569 8,442808 Other general government ............................................................... 126 173 157 363 424 393 227 448 448809 Deductions for offsetting receipts .................................................... –214 –241 –309 –198 –261 –322 –150 –256 –289
Total, General government ..................................................................... 2,442 2,960 9,774 10,032 10,408 9,747 3,895 12,833 12,015
900 Net interest:901 Interest on the public debt .............................................................. 20,959 21,849 24,167 29,319 32,665 37,076 8,104 41,915 48,712902 Interest received by on-budget trust funds ..................................... –2,820 –2,983 –3,156 –4,064 –4,861 –4,988 –177 –5,488 –6,128903 Interest received by off-budget trust funds ..................................... –1,942 –2,106 –2,280 –2,520 –2,803 –2,812 –93 –2,650 –2,403908 Other interest ................................................................................... –1,356 –1,282 –1,382 –1,286 –1,756 –2,549 –885 –3,875 –4,724
Total, Net interest .................................................................................... 14,841 15,478 17,349 21,449 23,244 26,727 6,949 29,901 35,458
(On-budget) ......................................................................................... (16,783) (17,584) (19,629) (23,969) (26,047) (29,539) (7,042) (32,551) (37,861)(Off-budget) ......................................................................................... (–1,942) (–2,106) (–2,280) (–2,520) (–2,803) (–2,812) (–93) (–2,650) (–2,403)
950 Undistributed offsetting receipts:951 Employer share, employee retirement (on-budget) ........................ –8,417 –8,646 –8,759 –9,236 –10,258 –10,761 –2,646 –11,528 –12,401952 Employer share, employee retirement (off-budget) ........................ –640 –657 –695 –764 –916 –963 –249 –977 –1,060953 Rents and royalties on the Outer Continental Shelf ...................... –1,051 –279 –3,956 –6,748 –2,428 –2,662 –1,311 –2,374 –2,259
Total, Undistributed offsetting receipts ................................................... –10,107 –9,583 –13,409 –16,749 –13,602 –14,386 –4,206 –14,879 –15,720
(On-budget) ......................................................................................... (–9,467) (–8,926) (–12,714) (–15,985) (–12,686) (–13,423) (–3,957) (–13,902) (–14,660)(Off-budget) ......................................................................................... (–640) (–657) (–695) (–764) (–916) (–963) (–249) (–977) (–1,060)
Total outlays ............................................................................................... 210,172 230,681 245,707 269,359 332,332 371,792 95,975 409,218 458,746
(On-budget) ......................................................................................... (177,346) (193,824) (200,118) (217,270) (271,892) (302,183) (76,555) (328,502) (369,089)(Off-budget) ......................................................................................... (32,826) (36,857) (45,589) (52,089) (60,440) (69,609) (19,421) (80,716) (89,657)
On-budget unless otherwise stated.
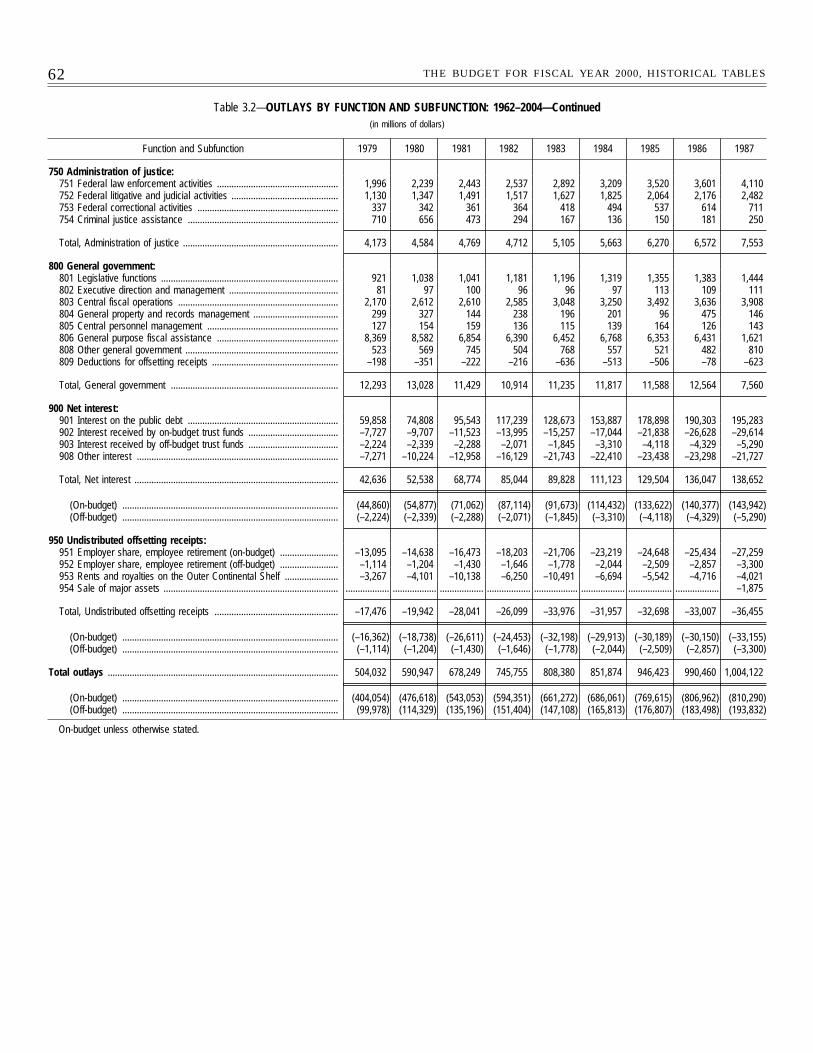
62 THE BUDGET FOR FISCAL YEAR 2000, HISTORICAL TABLES
Table 3.2—OUTLAYS BY FUNCTION AND SUBFUNCTION: 1962–2004—Continued(in millions of dollars)
Function and Subfunction 1979 1980 1981 1982 1983 1984 1985 1986 1987
750 Administration of justice:751 Federal law enforcement activities .................................................. 1,996 2,239 2,443 2,537 2,892 3,209 3,520 3,601 4,110752 Federal litigative and judicial activities ............................................ 1,130 1,347 1,491 1,517 1,627 1,825 2,064 2,176 2,482753 Federal correctional activities .......................................................... 337 342 361 364 418 494 537 614 711754 Criminal justice assistance .............................................................. 710 656 473 294 167 136 150 181 250
Total, Administration of justice ................................................................ 4,173 4,584 4,769 4,712 5,105 5,663 6,270 6,572 7,553
800 General government:801 Legislative functions ......................................................................... 921 1,038 1,041 1,181 1,196 1,319 1,355 1,383 1,444802 Executive direction and management ............................................. 81 97 100 96 96 97 113 109 111803 Central fiscal operations .................................................................. 2,170 2,612 2,610 2,585 3,048 3,250 3,492 3,636 3,908804 General property and records management ................................... 299 327 144 238 196 201 96 475 146805 Central personnel management ...................................................... 127 154 159 136 115 139 164 126 143806 General purpose fiscal assistance .................................................. 8,369 8,582 6,854 6,390 6,452 6,768 6,353 6,431 1,621808 Other general government ............................................................... 523 569 745 504 768 557 521 482 810809 Deductions for offsetting receipts .................................................... –198 –351 –222 –216 –636 –513 –506 –78 –623
Total, General government ..................................................................... 12,293 13,028 11,429 10,914 11,235 11,817 11,588 12,564 7,560
900 Net interest:901 Interest on the public debt .............................................................. 59,858 74,808 95,543 117,239 128,673 153,887 178,898 190,303 195,283902 Interest received by on-budget trust funds ..................................... –7,727 –9,707 –11,523 –13,995 –15,257 –17,044 –21,838 –26,628 –29,614903 Interest received by off-budget trust funds ..................................... –2,224 –2,339 –2,288 –2,071 –1,845 –3,310 –4,118 –4,329 –5,290908 Other interest ................................................................................... –7,271 –10,224 –12,958 –16,129 –21,743 –22,410 –23,438 –23,298 –21,727
Total, Net interest .................................................................................... 42,636 52,538 68,774 85,044 89,828 111,123 129,504 136,047 138,652
(On-budget) ......................................................................................... (44,860) (54,877) (71,062) (87,114) (91,673) (114,432) (133,622) (140,377) (143,942)(Off-budget) ......................................................................................... (–2,224) (–2,339) (–2,288) (–2,071) (–1,845) (–3,310) (–4,118) (–4,329) (–5,290)
950 Undistributed offsetting receipts:951 Employer share, employee retirement (on-budget) ........................ –13,095 –14,638 –16,473 –18,203 –21,706 –23,219 –24,648 –25,434 –27,259952 Employer share, employee retirement (off-budget) ........................ –1,114 –1,204 –1,430 –1,646 –1,778 –2,044 –2,509 –2,857 –3,300953 Rents and royalties on the Outer Continental Shelf ...................... –3,267 –4,101 –10,138 –6,250 –10,491 –6,694 –5,542 –4,716 –4,021954 Sale of major assets ........................................................................ .................. .................. .................. .................. .................. .................. .................. .................. –1,875
Total, Undistributed offsetting receipts ................................................... –17,476 –19,942 –28,041 –26,099 –33,976 –31,957 –32,698 –33,007 –36,455
(On-budget) ......................................................................................... (–16,362) (–18,738) (–26,611) (–24,453) (–32,198) (–29,913) (–30,189) (–30,150) (–33,155)(Off-budget) ......................................................................................... (–1,114) (–1,204) (–1,430) (–1,646) (–1,778) (–2,044) (–2,509) (–2,857) (–3,300)
Total outlays ............................................................................................... 504,032 590,947 678,249 745,755 808,380 851,874 946,423 990,460 1,004,122
(On-budget) ......................................................................................... (404,054) (476,618) (543,053) (594,351) (661,272) (686,061) (769,615) (806,962) (810,290)(Off-budget) ......................................................................................... (99,978) (114,329) (135,196) (151,404) (147,108) (165,813) (176,807) (183,498) (193,832)
On-budget unless otherwise stated.
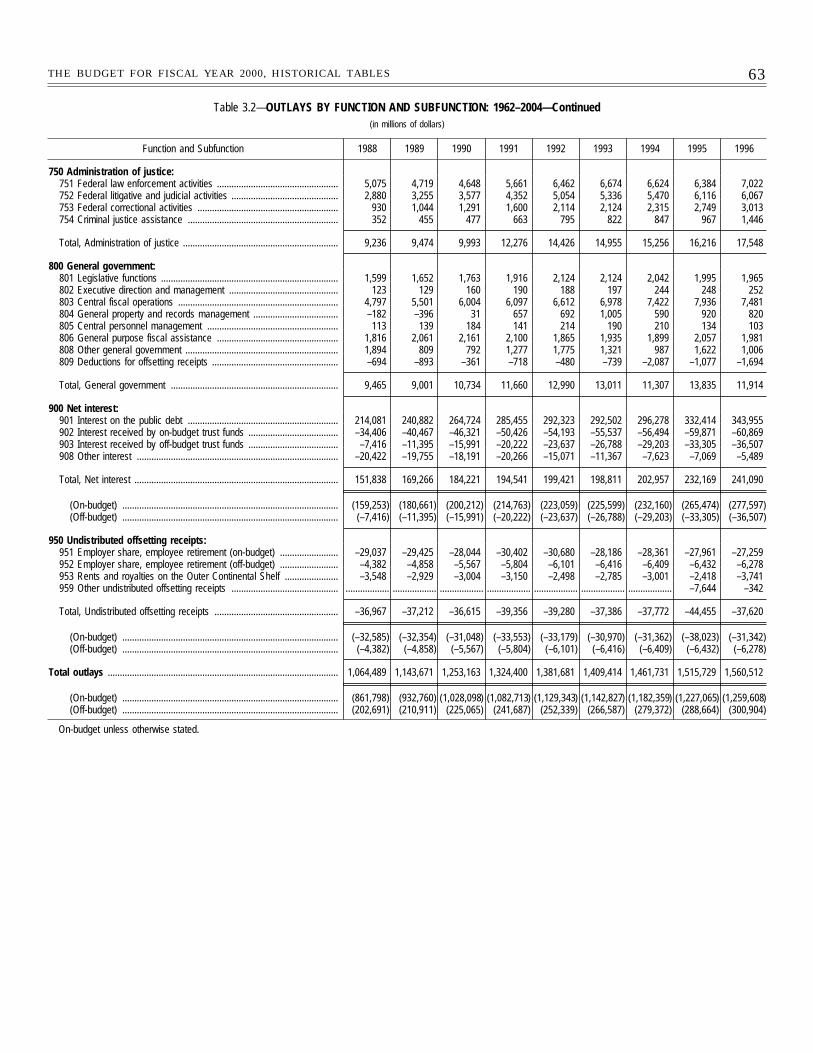
63THE BUDGET FOR FISCAL YEAR 2000, HISTORICAL TABLES
Table 3.2—OUTLAYS BY FUNCTION AND SUBFUNCTION: 1962–2004—Continued(in millions of dollars)
Function and Subfunction 1988 1989 1990 1991 1992 1993 1994 1995 1996
750 Administration of justice:751 Federal law enforcement activities .................................................. 5,075 4,719 4,648 5,661 6,462 6,674 6,624 6,384 7,022752 Federal litigative and judicial activities ............................................ 2,880 3,255 3,577 4,352 5,054 5,336 5,470 6,116 6,067753 Federal correctional activities .......................................................... 930 1,044 1,291 1,600 2,114 2,124 2,315 2,749 3,013754 Criminal justice assistance .............................................................. 352 455 477 663 795 822 847 967 1,446
Total, Administration of justice ................................................................ 9,236 9,474 9,993 12,276 14,426 14,955 15,256 16,216 17,548
800 General government:801 Legislative functions ......................................................................... 1,599 1,652 1,763 1,916 2,124 2,124 2,042 1,995 1,965802 Executive direction and management ............................................. 123 129 160 190 188 197 244 248 252803 Central fiscal operations .................................................................. 4,797 5,501 6,004 6,097 6,612 6,978 7,422 7,936 7,481804 General property and records management ................................... –182 –396 31 657 692 1,005 590 920 820805 Central personnel management ...................................................... 113 139 184 141 214 190 210 134 103806 General purpose fiscal assistance .................................................. 1,816 2,061 2,161 2,100 1,865 1,935 1,899 2,057 1,981808 Other general government ............................................................... 1,894 809 792 1,277 1,775 1,321 987 1,622 1,006809 Deductions for offsetting receipts .................................................... –694 –893 –361 –718 –480 –739 –2,087 –1,077 –1,694
Total, General government ..................................................................... 9,465 9,001 10,734 11,660 12,990 13,011 11,307 13,835 11,914
900 Net interest:901 Interest on the public debt .............................................................. 214,081 240,882 264,724 285,455 292,323 292,502 296,278 332,414 343,955902 Interest received by on-budget trust funds ..................................... –34,406 –40,467 –46,321 –50,426 –54,193 –55,537 –56,494 –59,871 –60,869903 Interest received by off-budget trust funds ..................................... –7,416 –11,395 –15,991 –20,222 –23,637 –26,788 –29,203 –33,305 –36,507908 Other interest ................................................................................... –20,422 –19,755 –18,191 –20,266 –15,071 –11,367 –7,623 –7,069 –5,489
Total, Net interest .................................................................................... 151,838 169,266 184,221 194,541 199,421 198,811 202,957 232,169 241,090
(On-budget) ......................................................................................... (159,253) (180,661) (200,212) (214,763) (223,059) (225,599) (232,160) (265,474) (277,597)(Off-budget) ......................................................................................... (–7,416) (–11,395) (–15,991) (–20,222) (–23,637) (–26,788) (–29,203) (–33,305) (–36,507)
950 Undistributed offsetting receipts:951 Employer share, employee retirement (on-budget) ........................ –29,037 –29,425 –28,044 –30,402 –30,680 –28,186 –28,361 –27,961 –27,259952 Employer share, employee retirement (off-budget) ........................ –4,382 –4,858 –5,567 –5,804 –6,101 –6,416 –6,409 –6,432 –6,278953 Rents and royalties on the Outer Continental Shelf ...................... –3,548 –2,929 –3,004 –3,150 –2,498 –2,785 –3,001 –2,418 –3,741959 Other undistributed offsetting receipts ............................................ .................. .................. .................. .................. .................. .................. .................. –7,644 –342
Total, Undistributed offsetting receipts ................................................... –36,967 –37,212 –36,615 –39,356 –39,280 –37,386 –37,772 –44,455 –37,620
(On-budget) ......................................................................................... (–32,585) (–32,354) (–31,048) (–33,553) (–33,179) (–30,970) (–31,362) (–38,023) (–31,342)(Off-budget) ......................................................................................... (–4,382) (–4,858) (–5,567) (–5,804) (–6,101) (–6,416) (–6,409) (–6,432) (–6,278)
Total outlays ............................................................................................... 1,064,489 1,143,671 1,253,163 1,324,400 1,381,681 1,409,414 1,461,731 1,515,729 1,560,512
(On-budget) ......................................................................................... (861,798) (932,760) (1,028,098) (1,082,713) (1,129,343) (1,142,827) (1,182,359) (1,227,065) (1,259,608)(Off-budget) ......................................................................................... (202,691) (210,911) (225,065) (241,687) (252,339) (266,587) (279,372) (288,664) (300,904)
On-budget unless otherwise stated.
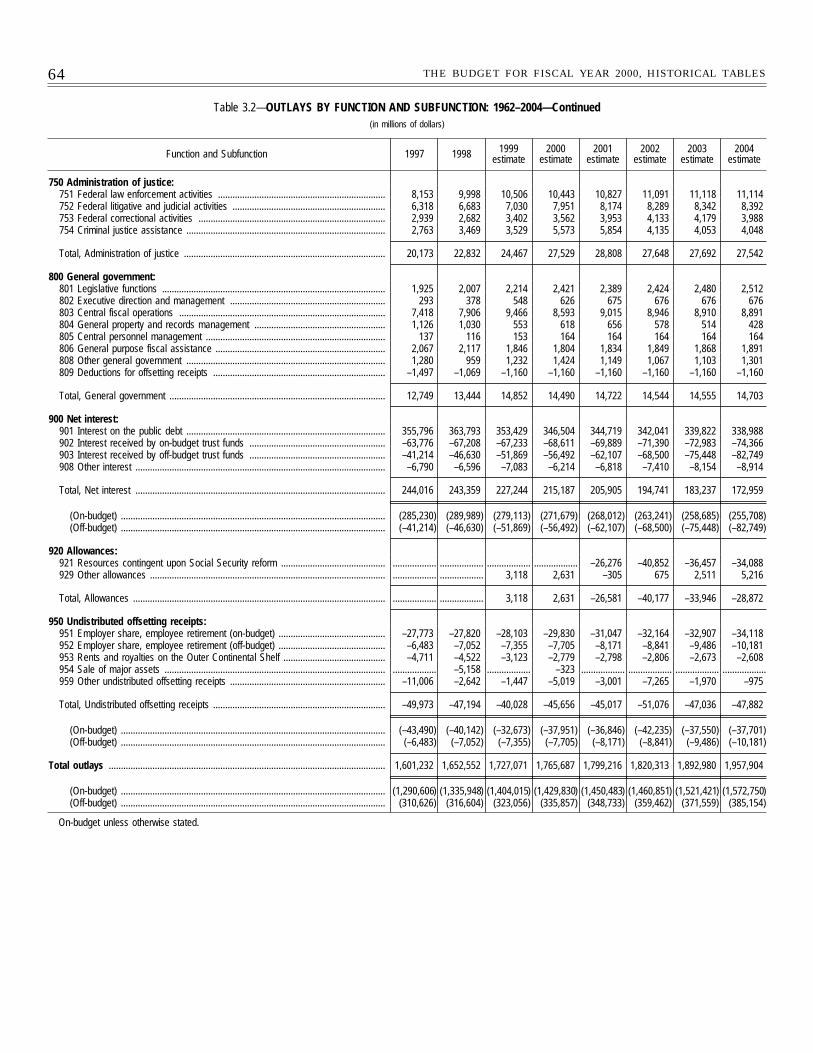
64 THE BUDGET FOR FISCAL YEAR 2000, HISTORICAL TABLES
Table 3.2—OUTLAYS BY FUNCTION AND SUBFUNCTION: 1962–2004—Continued(in millions of dollars)
Function and Subfunction 1997 1998 1999estimate
2000estimate
2001estimate
2002estimate
2003estimate
2004estimate
750 Administration of justice:751 Federal law enforcement activities ..................................................................... 8,153 9,998 10,506 10,443 10,827 11,091 11,118 11,114752 Federal litigative and judicial activities ............................................................... 6,318 6,683 7,030 7,951 8,174 8,289 8,342 8,392753 Federal correctional activities ............................................................................. 2,939 2,682 3,402 3,562 3,953 4,133 4,179 3,988754 Criminal justice assistance .................................................................................. 2,763 3,469 3,529 5,573 5,854 4,135 4,053 4,048
Total, Administration of justice ................................................................................... 20,173 22,832 24,467 27,529 28,808 27,648 27,692 27,542
800 General government:801 Legislative functions ............................................................................................ 1,925 2,007 2,214 2,421 2,389 2,424 2,480 2,512802 Executive direction and management ................................................................ 293 378 548 626 675 676 676 676803 Central fiscal operations ..................................................................................... 7,418 7,906 9,466 8,593 9,015 8,946 8,910 8,891804 General property and records management ...................................................... 1,126 1,030 553 618 656 578 514 428805 Central personnel management .......................................................................... 137 116 153 164 164 164 164 164806 General purpose fiscal assistance ...................................................................... 2,067 2,117 1,846 1,804 1,834 1,849 1,868 1,891808 Other general government .................................................................................. 1,280 959 1,232 1,424 1,149 1,067 1,103 1,301809 Deductions for offsetting receipts ....................................................................... –1,497 –1,069 –1,160 –1,160 –1,160 –1,160 –1,160 –1,160
Total, General government ......................................................................................... 12,749 13,444 14,852 14,490 14,722 14,544 14,555 14,703
900 Net interest:901 Interest on the public debt .................................................................................. 355,796 363,793 353,429 346,504 344,719 342,041 339,822 338,988902 Interest received by on-budget trust funds ........................................................ –63,776 –67,208 –67,233 –68,611 –69,889 –71,390 –72,983 –74,366903 Interest received by off-budget trust funds ........................................................ –41,214 –46,630 –51,869 –56,492 –62,107 –68,500 –75,448 –82,749908 Other interest ....................................................................................................... –6,790 –6,596 –7,083 –6,214 –6,818 –7,410 –8,154 –8,914
Total, Net interest ....................................................................................................... 244,016 243,359 227,244 215,187 205,905 194,741 183,237 172,959
(On-budget) ............................................................................................................. (285,230) (289,989) (279,113) (271,679) (268,012) (263,241) (258,685) (255,708)(Off-budget) ............................................................................................................. (–41,214) (–46,630) (–51,869) (–56,492) (–62,107) (–68,500) (–75,448) (–82,749)
920 Allowances:921 Resources contingent upon Social Security reform ........................................... .................. .................. .................. .................. –26,276 –40,852 –36,457 –34,088929 Other allowances ................................................................................................. .................. .................. 3,118 2,631 –305 675 2,511 5,216
Total, Allowances ........................................................................................................ .................. .................. 3,118 2,631 –26,581 –40,177 –33,946 –28,872
950 Undistributed offsetting receipts:951 Employer share, employee retirement (on-budget) ............................................ –27,773 –27,820 –28,103 –29,830 –31,047 –32,164 –32,907 –34,118952 Employer share, employee retirement (off-budget) ............................................ –6,483 –7,052 –7,355 –7,705 –8,171 –8,841 –9,486 –10,181953 Rents and royalties on the Outer Continental Shelf .......................................... –4,711 –4,522 –3,123 –2,779 –2,798 –2,806 –2,673 –2,608954 Sale of major assets ........................................................................................... .................. –5,158 .................. –323 .................. .................. .................. ..................959 Other undistributed offsetting receipts ................................................................ –11,006 –2,642 –1,447 –5,019 –3,001 –7,265 –1,970 –975
Total, Undistributed offsetting receipts ....................................................................... –49,973 –47,194 –40,028 –45,656 –45,017 –51,076 –47,036 –47,882
(On-budget) ............................................................................................................. (–43,490) (–40,142) (–32,673) (–37,951) (–36,846) (–42,235) (–37,550) (–37,701)(Off-budget) ............................................................................................................. (–6,483) (–7,052) (–7,355) (–7,705) (–8,171) (–8,841) (–9,486) (–10,181)
Total outlays .................................................................................................................. 1,601,232 1,652,552 1,727,071 1,765,687 1,799,216 1,820,313 1,892,980 1,957,904
(On-budget) ............................................................................................................. (1,290,606) (1,335,948) (1,404,015) (1,429,830) (1,450,483) (1,460,851) (1,521,421) (1,572,750)(Off-budget) ............................................................................................................. (310,626) (316,604) (323,056) (335,857) (348,733) (359,462) (371,559) (385,154)
On-budget unless otherwise stated.
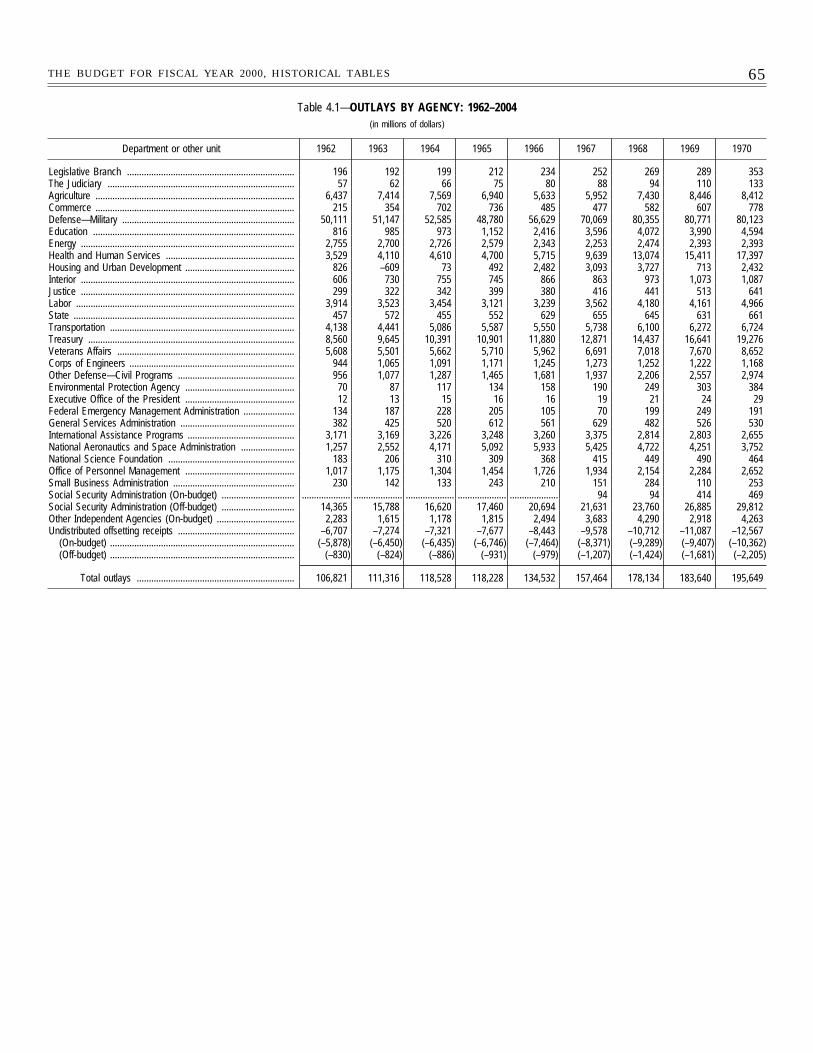
65THE BUDGET FOR FISCAL YEAR 2000, HISTORICAL TABLES
Table 4.1—OUTLAYS BY AGENCY: 1962–2004(in millions of dollars)
Department or other unit 1962 1963 1964 1965 1966 1967 1968 1969 1970
Legislative Branch ..................................................................... 196 192 199 212 234 252 269 289 353The Judiciary ............................................................................. 57 62 66 75 80 88 94 110 133Agriculture .................................................................................. 6,437 7,414 7,569 6,940 5,633 5,952 7,430 8,446 8,412Commerce .................................................................................. 215 354 702 736 485 477 582 607 778Defense—Military ....................................................................... 50,111 51,147 52,585 48,780 56,629 70,069 80,355 80,771 80,123Education ................................................................................... 816 985 973 1,152 2,416 3,596 4,072 3,990 4,594Energy ........................................................................................ 2,755 2,700 2,726 2,579 2,343 2,253 2,474 2,393 2,393Health and Human Services ..................................................... 3,529 4,110 4,610 4,700 5,715 9,639 13,074 15,411 17,397Housing and Urban Development ............................................. 826 –609 73 492 2,482 3,093 3,727 713 2,432Interior ........................................................................................ 606 730 755 745 866 863 973 1,073 1,087Justice ........................................................................................ 299 322 342 399 380 416 441 513 641Labor .......................................................................................... 3,914 3,523 3,454 3,121 3,239 3,562 4,180 4,161 4,966State ........................................................................................... 457 572 455 552 629 655 645 631 661Transportation ............................................................................ 4,138 4,441 5,086 5,587 5,550 5,738 6,100 6,272 6,724Treasury ..................................................................................... 8,560 9,645 10,391 10,901 11,880 12,871 14,437 16,641 19,276Veterans Affairs ......................................................................... 5,608 5,501 5,662 5,710 5,962 6,691 7,018 7,670 8,652Corps of Engineers .................................................................... 944 1,065 1,091 1,171 1,245 1,273 1,252 1,222 1,168Other Defense—Civil Programs ................................................ 956 1,077 1,287 1,465 1,681 1,937 2,206 2,557 2,974Environmental Protection Agency ............................................. 70 87 117 134 158 190 249 303 384Executive Office of the President ............................................. 12 13 15 16 16 19 21 24 29Federal Emergency Management Administration ..................... 134 187 228 205 105 70 199 249 191General Services Administration ............................................... 382 425 520 612 561 629 482 526 530International Assistance Programs ............................................ 3,171 3,169 3,226 3,248 3,260 3,375 2,814 2,803 2,655National Aeronautics and Space Administration ...................... 1,257 2,552 4,171 5,092 5,933 5,425 4,722 4,251 3,752National Science Foundation .................................................... 183 206 310 309 368 415 449 490 464Office of Personnel Management ............................................. 1,017 1,175 1,304 1,454 1,726 1,934 2,154 2,284 2,652Small Business Administration .................................................. 230 142 133 243 210 151 284 110 253Social Security Administration (On-budget) .............................. .................... .................... .................... .................... .................... 94 94 414 469Social Security Administration (Off-budget) .............................. 14,365 15,788 16,620 17,460 20,694 21,631 23,760 26,885 29,812Other Independent Agencies (On-budget) ................................ 2,283 1,615 1,178 1,815 2,494 3,683 4,290 2,918 4,263Undistributed offsetting receipts ................................................ –6,707 –7,274 –7,321 –7,677 –8,443 –9,578 –10,712 –11,087 –12,567
(On-budget) ............................................................................ (–5,878) (–6,450) (–6,435) (–6,746) (–7,464) (–8,371) (–9,289) (–9,407) (–10,362)(Off-budget) ............................................................................ (–830) (–824) (–886) (–931) (–979) (–1,207) (–1,424) (–1,681) (–2,205)
Total outlays ................................................................. 106,821 111,316 118,528 118,228 134,532 157,464 178,134 183,640 195,649
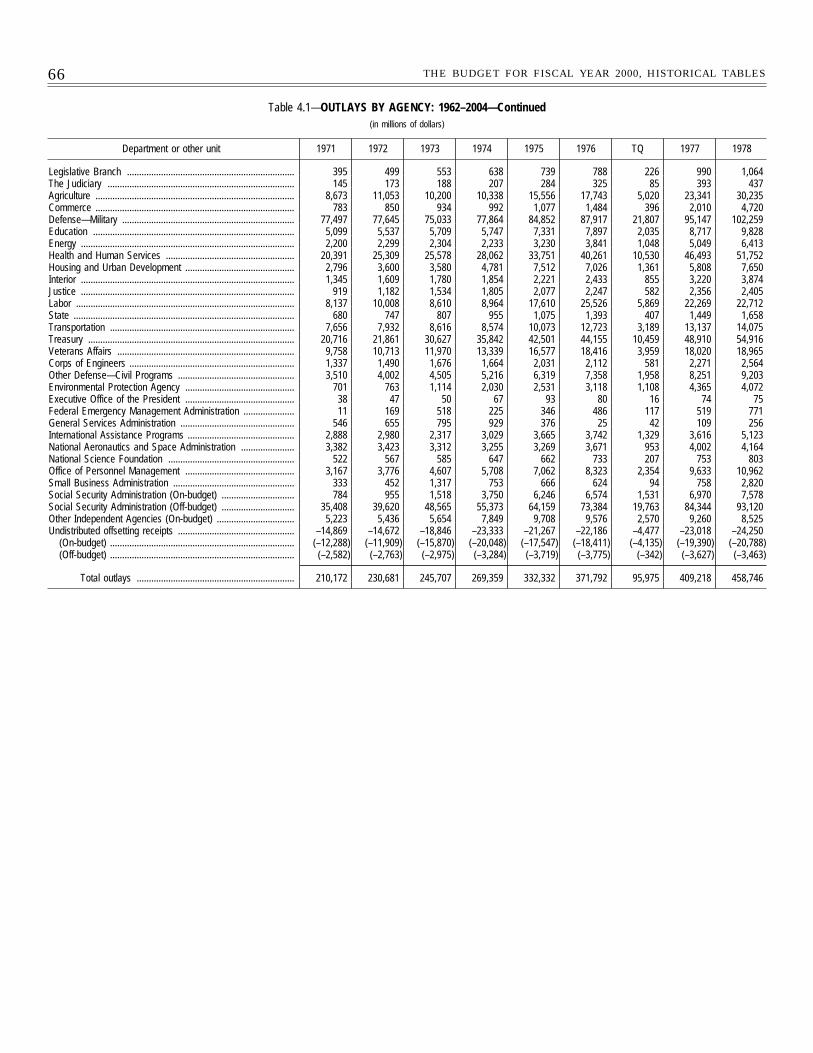
66 THE BUDGET FOR FISCAL YEAR 2000, HISTORICAL TABLES
Table 4.1—OUTLAYS BY AGENCY: 1962–2004—Continued(in millions of dollars)
Department or other unit 1971 1972 1973 1974 1975 1976 TQ 1977 1978
Legislative Branch ..................................................................... 395 499 553 638 739 788 226 990 1,064The Judiciary ............................................................................. 145 173 188 207 284 325 85 393 437Agriculture .................................................................................. 8,673 11,053 10,200 10,338 15,556 17,743 5,020 23,341 30,235Commerce .................................................................................. 783 850 934 992 1,077 1,484 396 2,010 4,720Defense—Military ....................................................................... 77,497 77,645 75,033 77,864 84,852 87,917 21,807 95,147 102,259Education ................................................................................... 5,099 5,537 5,709 5,747 7,331 7,897 2,035 8,717 9,828Energy ........................................................................................ 2,200 2,299 2,304 2,233 3,230 3,841 1,048 5,049 6,413Health and Human Services ..................................................... 20,391 25,309 25,578 28,062 33,751 40,261 10,530 46,493 51,752Housing and Urban Development ............................................. 2,796 3,600 3,580 4,781 7,512 7,026 1,361 5,808 7,650Interior ........................................................................................ 1,345 1,609 1,780 1,854 2,221 2,433 855 3,220 3,874Justice ........................................................................................ 919 1,182 1,534 1,805 2,077 2,247 582 2,356 2,405Labor .......................................................................................... 8,137 10,008 8,610 8,964 17,610 25,526 5,869 22,269 22,712State ........................................................................................... 680 747 807 955 1,075 1,393 407 1,449 1,658Transportation ............................................................................ 7,656 7,932 8,616 8,574 10,073 12,723 3,189 13,137 14,075Treasury ..................................................................................... 20,716 21,861 30,627 35,842 42,501 44,155 10,459 48,910 54,916Veterans Affairs ......................................................................... 9,758 10,713 11,970 13,339 16,577 18,416 3,959 18,020 18,965Corps of Engineers .................................................................... 1,337 1,490 1,676 1,664 2,031 2,112 581 2,271 2,564Other Defense—Civil Programs ................................................ 3,510 4,002 4,505 5,216 6,319 7,358 1,958 8,251 9,203Environmental Protection Agency ............................................. 701 763 1,114 2,030 2,531 3,118 1,108 4,365 4,072Executive Office of the President ............................................. 38 47 50 67 93 80 16 74 75Federal Emergency Management Administration ..................... 11 169 518 225 346 486 117 519 771General Services Administration ............................................... 546 655 795 929 376 25 42 109 256International Assistance Programs ............................................ 2,888 2,980 2,317 3,029 3,665 3,742 1,329 3,616 5,123National Aeronautics and Space Administration ...................... 3,382 3,423 3,312 3,255 3,269 3,671 953 4,002 4,164National Science Foundation .................................................... 522 567 585 647 662 733 207 753 803Office of Personnel Management ............................................. 3,167 3,776 4,607 5,708 7,062 8,323 2,354 9,633 10,962Small Business Administration .................................................. 333 452 1,317 753 666 624 94 758 2,820Social Security Administration (On-budget) .............................. 784 955 1,518 3,750 6,246 6,574 1,531 6,970 7,578Social Security Administration (Off-budget) .............................. 35,408 39,620 48,565 55,373 64,159 73,384 19,763 84,344 93,120Other Independent Agencies (On-budget) ................................ 5,223 5,436 5,654 7,849 9,708 9,576 2,570 9,260 8,525Undistributed offsetting receipts ................................................ –14,869 –14,672 –18,846 –23,333 –21,267 –22,186 –4,477 –23,018 –24,250
(On-budget) ............................................................................ (–12,288) (–11,909) (–15,870) (–20,048) (–17,547) (–18,411) (–4,135) (–19,390) (–20,788)(Off-budget) ............................................................................ (–2,582) (–2,763) (–2,975) (–3,284) (–3,719) (–3,775) (–342) (–3,627) (–3,463)
Total outlays ................................................................. 210,172 230,681 245,707 269,359 332,332 371,792 95,975 409,218 458,746
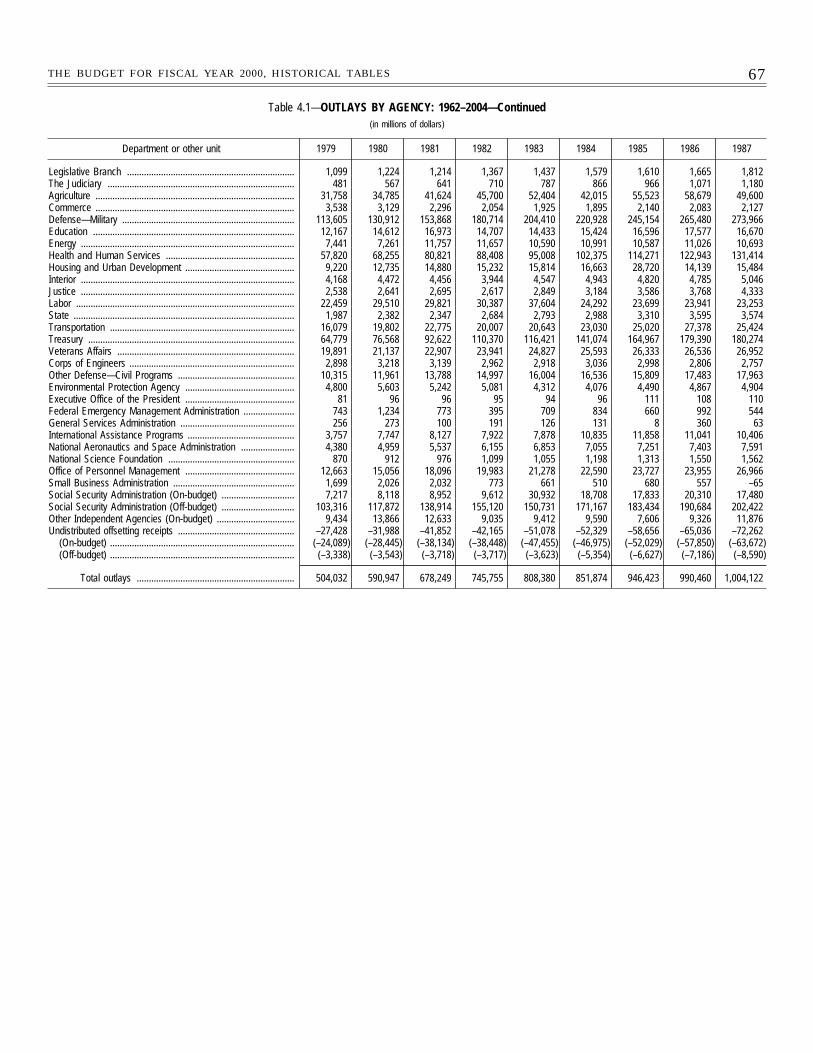
67THE BUDGET FOR FISCAL YEAR 2000, HISTORICAL TABLES
Table 4.1—OUTLAYS BY AGENCY: 1962–2004—Continued(in millions of dollars)
Department or other unit 1979 1980 1981 1982 1983 1984 1985 1986 1987
Legislative Branch ..................................................................... 1,099 1,224 1,214 1,367 1,437 1,579 1,610 1,665 1,812The Judiciary ............................................................................. 481 567 641 710 787 866 966 1,071 1,180Agriculture .................................................................................. 31,758 34,785 41,624 45,700 52,404 42,015 55,523 58,679 49,600Commerce .................................................................................. 3,538 3,129 2,296 2,054 1,925 1,895 2,140 2,083 2,127Defense—Military ....................................................................... 113,605 130,912 153,868 180,714 204,410 220,928 245,154 265,480 273,966Education ................................................................................... 12,167 14,612 16,973 14,707 14,433 15,424 16,596 17,577 16,670Energy ........................................................................................ 7,441 7,261 11,757 11,657 10,590 10,991 10,587 11,026 10,693Health and Human Services ..................................................... 57,820 68,255 80,821 88,408 95,008 102,375 114,271 122,943 131,414Housing and Urban Development ............................................. 9,220 12,735 14,880 15,232 15,814 16,663 28,720 14,139 15,484Interior ........................................................................................ 4,168 4,472 4,456 3,944 4,547 4,943 4,820 4,785 5,046Justice ........................................................................................ 2,538 2,641 2,695 2,617 2,849 3,184 3,586 3,768 4,333Labor .......................................................................................... 22,459 29,510 29,821 30,387 37,604 24,292 23,699 23,941 23,253State ........................................................................................... 1,987 2,382 2,347 2,684 2,793 2,988 3,310 3,595 3,574Transportation ............................................................................ 16,079 19,802 22,775 20,007 20,643 23,030 25,020 27,378 25,424Treasury ..................................................................................... 64,779 76,568 92,622 110,370 116,421 141,074 164,967 179,390 180,274Veterans Affairs ......................................................................... 19,891 21,137 22,907 23,941 24,827 25,593 26,333 26,536 26,952Corps of Engineers .................................................................... 2,898 3,218 3,139 2,962 2,918 3,036 2,998 2,806 2,757Other Defense—Civil Programs ................................................ 10,315 11,961 13,788 14,997 16,004 16,536 15,809 17,483 17,963Environmental Protection Agency ............................................. 4,800 5,603 5,242 5,081 4,312 4,076 4,490 4,867 4,904Executive Office of the President ............................................. 81 96 96 95 94 96 111 108 110Federal Emergency Management Administration ..................... 743 1,234 773 395 709 834 660 992 544General Services Administration ............................................... 256 273 100 191 126 131 8 360 63International Assistance Programs ............................................ 3,757 7,747 8,127 7,922 7,878 10,835 11,858 11,041 10,406National Aeronautics and Space Administration ...................... 4,380 4,959 5,537 6,155 6,853 7,055 7,251 7,403 7,591National Science Foundation .................................................... 870 912 976 1,099 1,055 1,198 1,313 1,550 1,562Office of Personnel Management ............................................. 12,663 15,056 18,096 19,983 21,278 22,590 23,727 23,955 26,966Small Business Administration .................................................. 1,699 2,026 2,032 773 661 510 680 557 –65Social Security Administration (On-budget) .............................. 7,217 8,118 8,952 9,612 30,932 18,708 17,833 20,310 17,480Social Security Administration (Off-budget) .............................. 103,316 117,872 138,914 155,120 150,731 171,167 183,434 190,684 202,422Other Independent Agencies (On-budget) ................................ 9,434 13,866 12,633 9,035 9,412 9,590 7,606 9,326 11,876Undistributed offsetting receipts ................................................ –27,428 –31,988 –41,852 –42,165 –51,078 –52,329 –58,656 –65,036 –72,262
(On-budget) ............................................................................ (–24,089) (–28,445) (–38,134) (–38,448) (–47,455) (–46,975) (–52,029) (–57,850) (–63,672)(Off-budget) ............................................................................ (–3,338) (–3,543) (–3,718) (–3,717) (–3,623) (–5,354) (–6,627) (–7,186) (–8,590)
Total outlays ................................................................. 504,032 590,947 678,249 745,755 808,380 851,874 946,423 990,460 1,004,122
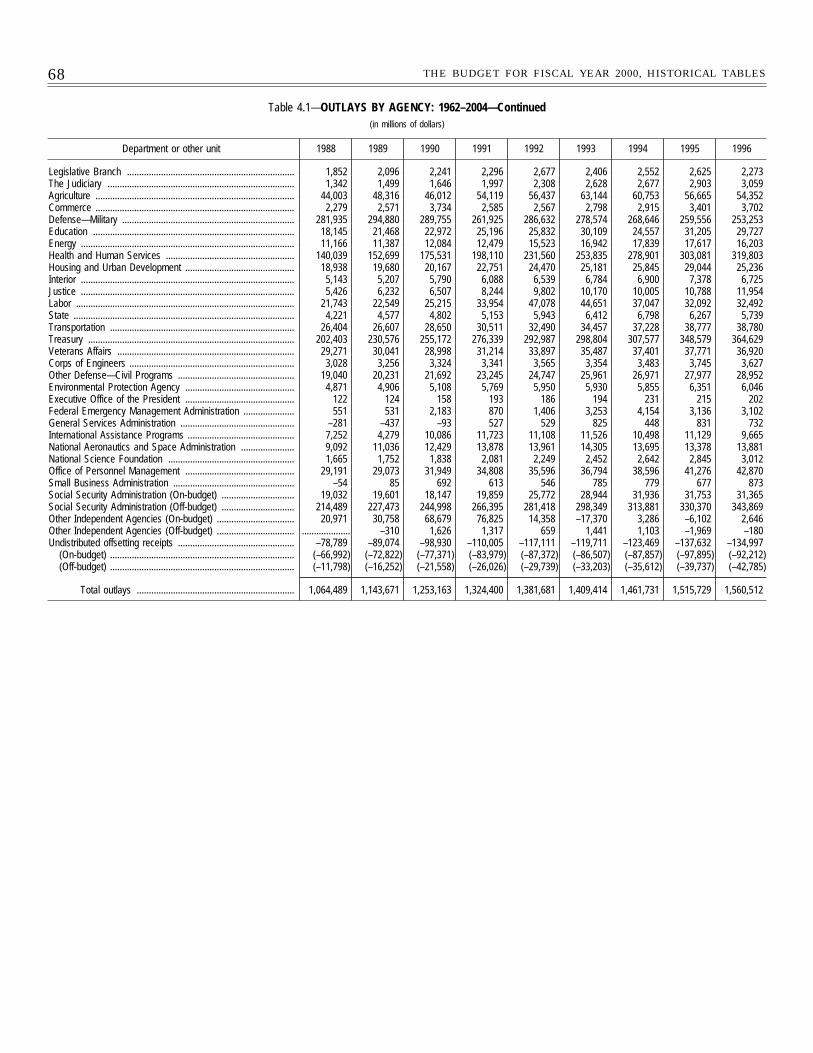
68 THE BUDGET FOR FISCAL YEAR 2000, HISTORICAL TABLES
Table 4.1—OUTLAYS BY AGENCY: 1962–2004—Continued(in millions of dollars)
Department or other unit 1988 1989 1990 1991 1992 1993 1994 1995 1996
Legislative Branch ..................................................................... 1,852 2,096 2,241 2,296 2,677 2,406 2,552 2,625 2,273The Judiciary ............................................................................. 1,342 1,499 1,646 1,997 2,308 2,628 2,677 2,903 3,059Agriculture .................................................................................. 44,003 48,316 46,012 54,119 56,437 63,144 60,753 56,665 54,352Commerce .................................................................................. 2,279 2,571 3,734 2,585 2,567 2,798 2,915 3,401 3,702Defense—Military ....................................................................... 281,935 294,880 289,755 261,925 286,632 278,574 268,646 259,556 253,253Education ................................................................................... 18,145 21,468 22,972 25,196 25,832 30,109 24,557 31,205 29,727Energy ........................................................................................ 11,166 11,387 12,084 12,479 15,523 16,942 17,839 17,617 16,203Health and Human Services ..................................................... 140,039 152,699 175,531 198,110 231,560 253,835 278,901 303,081 319,803Housing and Urban Development ............................................. 18,938 19,680 20,167 22,751 24,470 25,181 25,845 29,044 25,236Interior ........................................................................................ 5,143 5,207 5,790 6,088 6,539 6,784 6,900 7,378 6,725Justice ........................................................................................ 5,426 6,232 6,507 8,244 9,802 10,170 10,005 10,788 11,954Labor .......................................................................................... 21,743 22,549 25,215 33,954 47,078 44,651 37,047 32,092 32,492State ........................................................................................... 4,221 4,577 4,802 5,153 5,943 6,412 6,798 6,267 5,739Transportation ............................................................................ 26,404 26,607 28,650 30,511 32,490 34,457 37,228 38,777 38,780Treasury ..................................................................................... 202,403 230,576 255,172 276,339 292,987 298,804 307,577 348,579 364,629Veterans Affairs ......................................................................... 29,271 30,041 28,998 31,214 33,897 35,487 37,401 37,771 36,920Corps of Engineers .................................................................... 3,028 3,256 3,324 3,341 3,565 3,354 3,483 3,745 3,627Other Defense—Civil Programs ................................................ 19,040 20,231 21,692 23,245 24,747 25,961 26,971 27,977 28,952Environmental Protection Agency ............................................. 4,871 4,906 5,108 5,769 5,950 5,930 5,855 6,351 6,046Executive Office of the President ............................................. 122 124 158 193 186 194 231 215 202Federal Emergency Management Administration ..................... 551 531 2,183 870 1,406 3,253 4,154 3,136 3,102General Services Administration ............................................... –281 –437 –93 527 529 825 448 831 732International Assistance Programs ............................................ 7,252 4,279 10,086 11,723 11,108 11,526 10,498 11,129 9,665National Aeronautics and Space Administration ...................... 9,092 11,036 12,429 13,878 13,961 14,305 13,695 13,378 13,881National Science Foundation .................................................... 1,665 1,752 1,838 2,081 2,249 2,452 2,642 2,845 3,012Office of Personnel Management ............................................. 29,191 29,073 31,949 34,808 35,596 36,794 38,596 41,276 42,870Small Business Administration .................................................. –54 85 692 613 546 785 779 677 873Social Security Administration (On-budget) .............................. 19,032 19,601 18,147 19,859 25,772 28,944 31,936 31,753 31,365Social Security Administration (Off-budget) .............................. 214,489 227,473 244,998 266,395 281,418 298,349 313,881 330,370 343,869Other Independent Agencies (On-budget) ................................ 20,971 30,758 68,679 76,825 14,358 –17,370 3,286 –6,102 2,646Other Independent Agencies (Off-budget) ................................ .................... –310 1,626 1,317 659 1,441 1,103 –1,969 –180Undistributed offsetting receipts ................................................ –78,789 –89,074 –98,930 –110,005 –117,111 –119,711 –123,469 –137,632 –134,997
(On-budget) ............................................................................ (–66,992) (–72,822) (–77,371) (–83,979) (–87,372) (–86,507) (–87,857) (–97,895) (–92,212)(Off-budget) ............................................................................ (–11,798) (–16,252) (–21,558) (–26,026) (–29,739) (–33,203) (–35,612) (–39,737) (–42,785)
Total outlays ................................................................. 1,064,489 1,143,671 1,253,163 1,324,400 1,381,681 1,409,414 1,461,731 1,515,729 1,560,512
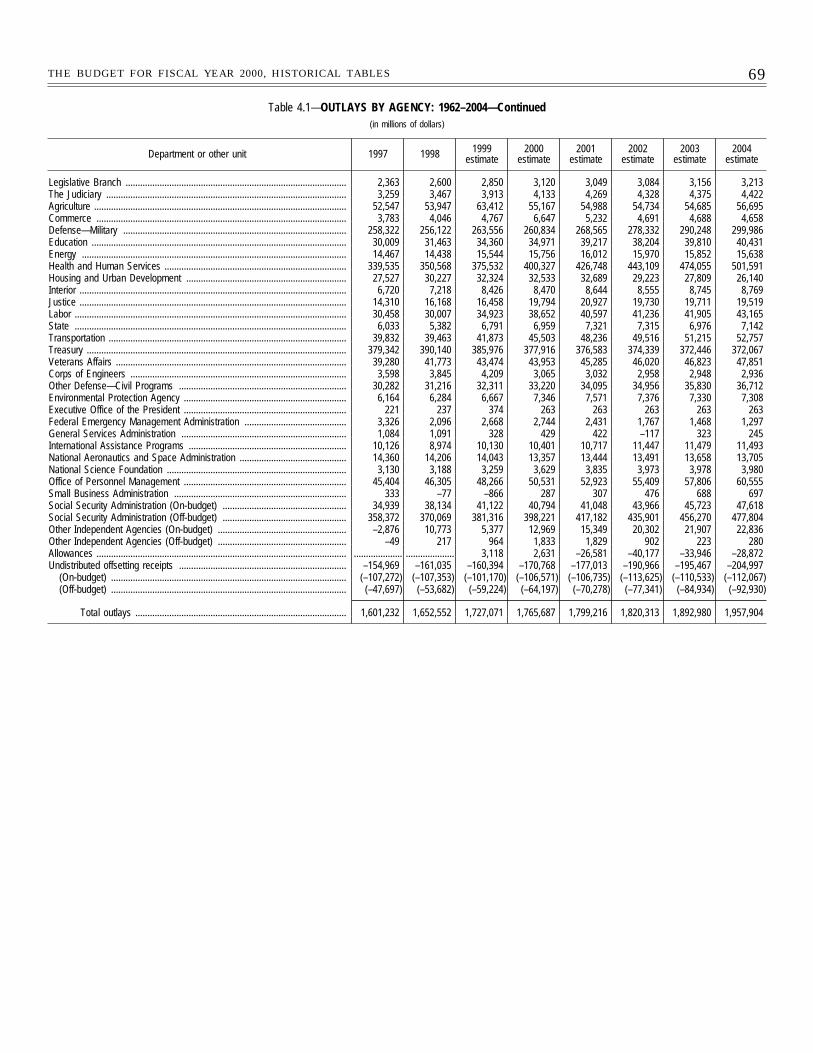
69THE BUDGET FOR FISCAL YEAR 2000, HISTORICAL TABLES
Table 4.1—OUTLAYS BY AGENCY: 1962–2004—Continued(in millions of dollars)
Department or other unit 1997 1998 1999estimate
2000estimate
2001estimate
2002estimate
2003estimate
2004estimate
Legislative Branch ........................................................................................... 2,363 2,600 2,850 3,120 3,049 3,084 3,156 3,213The Judiciary ................................................................................................... 3,259 3,467 3,913 4,133 4,269 4,328 4,375 4,422Agriculture ........................................................................................................ 52,547 53,947 63,412 55,167 54,988 54,734 54,685 56,695Commerce ....................................................................................................... 3,783 4,046 4,767 6,647 5,232 4,691 4,688 4,658Defense—Military ............................................................................................ 258,322 256,122 263,556 260,834 268,565 278,332 290,248 299,986Education ......................................................................................................... 30,009 31,463 34,360 34,971 39,217 38,204 39,810 40,431Energy ............................................................................................................. 14,467 14,438 15,544 15,756 16,012 15,970 15,852 15,638Health and Human Services ........................................................................... 339,535 350,568 375,532 400,327 426,748 443,109 474,055 501,591Housing and Urban Development .................................................................. 27,527 30,227 32,324 32,533 32,689 29,223 27,809 26,140Interior .............................................................................................................. 6,720 7,218 8,426 8,470 8,644 8,555 8,745 8,769Justice .............................................................................................................. 14,310 16,168 16,458 19,794 20,927 19,730 19,711 19,519Labor ................................................................................................................ 30,458 30,007 34,923 38,652 40,597 41,236 41,905 43,165State ................................................................................................................ 6,033 5,382 6,791 6,959 7,321 7,315 6,976 7,142Transportation .................................................................................................. 39,832 39,463 41,873 45,503 48,236 49,516 51,215 52,757Treasury ........................................................................................................... 379,342 390,140 385,976 377,916 376,583 374,339 372,446 372,067Veterans Affairs ............................................................................................... 39,280 41,773 43,474 43,953 45,285 46,020 46,823 47,851Corps of Engineers ......................................................................................... 3,598 3,845 4,209 3,065 3,032 2,958 2,948 2,936Other Defense—Civil Programs ..................................................................... 30,282 31,216 32,311 33,220 34,095 34,956 35,830 36,712Environmental Protection Agency ................................................................... 6,164 6,284 6,667 7,346 7,571 7,376 7,330 7,308Executive Office of the President ................................................................... 221 237 374 263 263 263 263 263Federal Emergency Management Administration .......................................... 3,326 2,096 2,668 2,744 2,431 1,767 1,468 1,297General Services Administration .................................................................... 1,084 1,091 328 429 422 –117 323 245International Assistance Programs ................................................................. 10,126 8,974 10,130 10,401 10,717 11,447 11,479 11,493National Aeronautics and Space Administration ............................................ 14,360 14,206 14,043 13,357 13,444 13,491 13,658 13,705National Science Foundation .......................................................................... 3,130 3,188 3,259 3,629 3,835 3,973 3,978 3,980Office of Personnel Management ................................................................... 45,404 46,305 48,266 50,531 52,923 55,409 57,806 60,555Small Business Administration ....................................................................... 333 –77 –866 287 307 476 688 697Social Security Administration (On-budget) ................................................... 34,939 38,134 41,122 40,794 41,048 43,966 45,723 47,618Social Security Administration (Off-budget) ................................................... 358,372 370,069 381,316 398,221 417,182 435,901 456,270 477,804Other Independent Agencies (On-budget) ..................................................... –2,876 10,773 5,377 12,969 15,349 20,302 21,907 22,836Other Independent Agencies (Off-budget) ..................................................... –49 217 964 1,833 1,829 902 223 280Allowances ....................................................................................................... .................... .................... 3,118 2,631 –26,581 –40,177 –33,946 –28,872Undistributed offsetting receipts ..................................................................... –154,969 –161,035 –160,394 –170,768 –177,013 –190,966 –195,467 –204,997
(On-budget) ................................................................................................. (–107,272) (–107,353) (–101,170) (–106,571) (–106,735) (–113,625) (–110,533) (–112,067)(Off-budget) ................................................................................................. (–47,697) (–53,682) (–59,224) (–64,197) (–70,278) (–77,341) (–84,934) (–92,930)
Total outlays ....................................................................................... 1,601,232 1,652,552 1,727,071 1,765,687 1,799,216 1,820,313 1,892,980 1,957,904
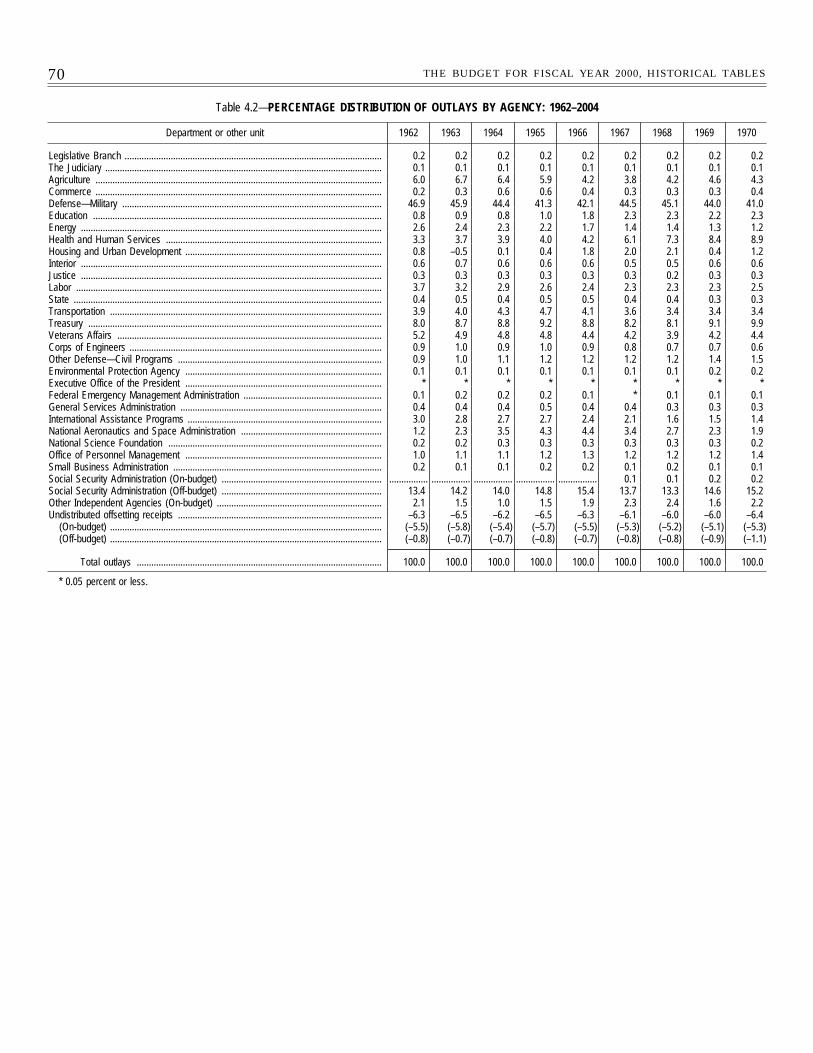
70 THE BUDGET FOR FISCAL YEAR 2000, HISTORICAL TABLES
Table 4.2—PERCENTAGE DISTRIBUTION OF OUTLAYS BY AGENCY: 1962–2004
Department or other unit 1962 1963 1964 1965 1966 1967 1968 1969 1970
Legislative Branch .......................................................................................................... 0.2 0.2 0.2 0.2 0.2 0.2 0.2 0.2 0.2The Judiciary .................................................................................................................. 0.1 0.1 0.1 0.1 0.1 0.1 0.1 0.1 0.1Agriculture ...................................................................................................................... 6.0 6.7 6.4 5.9 4.2 3.8 4.2 4.6 4.3Commerce ...................................................................................................................... 0.2 0.3 0.6 0.6 0.4 0.3 0.3 0.3 0.4Defense—Military ........................................................................................................... 46.9 45.9 44.4 41.3 42.1 44.5 45.1 44.0 41.0Education ....................................................................................................................... 0.8 0.9 0.8 1.0 1.8 2.3 2.3 2.2 2.3Energy ............................................................................................................................ 2.6 2.4 2.3 2.2 1.7 1.4 1.4 1.3 1.2Health and Human Services ......................................................................................... 3.3 3.7 3.9 4.0 4.2 6.1 7.3 8.4 8.9Housing and Urban Development ................................................................................. 0.8 –0.5 0.1 0.4 1.8 2.0 2.1 0.4 1.2Interior ............................................................................................................................ 0.6 0.7 0.6 0.6 0.6 0.5 0.5 0.6 0.6Justice ............................................................................................................................ 0.3 0.3 0.3 0.3 0.3 0.3 0.2 0.3 0.3Labor .............................................................................................................................. 3.7 3.2 2.9 2.6 2.4 2.3 2.3 2.3 2.5State ............................................................................................................................... 0.4 0.5 0.4 0.5 0.5 0.4 0.4 0.3 0.3Transportation ................................................................................................................ 3.9 4.0 4.3 4.7 4.1 3.6 3.4 3.4 3.4Treasury ......................................................................................................................... 8.0 8.7 8.8 9.2 8.8 8.2 8.1 9.1 9.9Veterans Affairs ............................................................................................................. 5.2 4.9 4.8 4.8 4.4 4.2 3.9 4.2 4.4Corps of Engineers ........................................................................................................ 0.9 1.0 0.9 1.0 0.9 0.8 0.7 0.7 0.6Other Defense—Civil Programs .................................................................................... 0.9 1.0 1.1 1.2 1.2 1.2 1.2 1.4 1.5Environmental Protection Agency ................................................................................. 0.1 0.1 0.1 0.1 0.1 0.1 0.1 0.2 0.2Executive Office of the President ................................................................................. * * * * * * * * *Federal Emergency Management Administration ......................................................... 0.1 0.2 0.2 0.2 0.1 * 0.1 0.1 0.1General Services Administration ................................................................................... 0.4 0.4 0.4 0.5 0.4 0.4 0.3 0.3 0.3International Assistance Programs ................................................................................ 3.0 2.8 2.7 2.7 2.4 2.1 1.6 1.5 1.4National Aeronautics and Space Administration .......................................................... 1.2 2.3 3.5 4.3 4.4 3.4 2.7 2.3 1.9National Science Foundation ........................................................................................ 0.2 0.2 0.3 0.3 0.3 0.3 0.3 0.3 0.2Office of Personnel Management ................................................................................. 1.0 1.1 1.1 1.2 1.3 1.2 1.2 1.2 1.4Small Business Administration ...................................................................................... 0.2 0.1 0.1 0.2 0.2 0.1 0.2 0.1 0.1Social Security Administration (On-budget) .................................................................. ................ ................ ................ ................ ................ 0.1 0.1 0.2 0.2Social Security Administration (Off-budget) .................................................................. 13.4 14.2 14.0 14.8 15.4 13.7 13.3 14.6 15.2Other Independent Agencies (On-budget) .................................................................... 2.1 1.5 1.0 1.5 1.9 2.3 2.4 1.6 2.2Undistributed offsetting receipts .................................................................................... –6.3 –6.5 –6.2 –6.5 –6.3 –6.1 –6.0 –6.0 –6.4
(On-budget) ................................................................................................................ (–5.5) (–5.8) (–5.4) (–5.7) (–5.5) (–5.3) (–5.2) (–5.1) (–5.3)(Off-budget) ................................................................................................................ (–0.8) (–0.7) (–0.7) (–0.8) (–0.7) (–0.8) (–0.8) (–0.9) (–1.1)
Total outlays ..................................................................................................... 100.0 100.0 100.0 100.0 100.0 100.0 100.0 100.0 100.0
* 0.05 percent or less.

71THE BUDGET FOR FISCAL YEAR 2000, HISTORICAL TABLES
Table 4.2—PERCENTAGE DISTRIBUTION OF OUTLAYS BY AGENCY: 1962–2004—Continued
Department or other unit 1971 1972 1973 1974 1975 1976 TQ 1977 1978
Legislative Branch .......................................................................................................... 0.2 0.2 0.2 0.2 0.2 0.2 0.2 0.2 0.2The Judiciary .................................................................................................................. 0.1 0.1 0.1 0.1 0.1 0.1 0.1 0.1 0.1Agriculture ...................................................................................................................... 4.1 4.8 4.2 3.8 4.7 4.8 5.2 5.7 6.6Commerce ...................................................................................................................... 0.4 0.4 0.4 0.4 0.3 0.4 0.4 0.5 1.0Defense—Military ........................................................................................................... 36.9 33.7 30.5 28.9 25.5 23.6 22.7 23.3 22.3Education ....................................................................................................................... 2.4 2.4 2.3 2.1 2.2 2.1 2.1 2.1 2.1Energy ............................................................................................................................ 1.0 1.0 0.9 0.8 1.0 1.0 1.1 1.2 1.4Health and Human Services ......................................................................................... 9.7 11.0 10.4 10.4 10.2 10.8 11.0 11.4 11.3Housing and Urban Development ................................................................................. 1.3 1.6 1.5 1.8 2.3 1.9 1.4 1.4 1.7Interior ............................................................................................................................ 0.6 0.7 0.7 0.7 0.7 0.7 0.9 0.8 0.8Justice ............................................................................................................................ 0.4 0.5 0.6 0.7 0.6 0.6 0.6 0.6 0.5Labor .............................................................................................................................. 3.9 4.3 3.5 3.3 5.3 6.9 6.1 5.4 5.0State ............................................................................................................................... 0.3 0.3 0.3 0.4 0.3 0.4 0.4 0.4 0.4Transportation ................................................................................................................ 3.6 3.4 3.5 3.2 3.0 3.4 3.3 3.2 3.1Treasury ......................................................................................................................... 9.9 9.5 12.5 13.3 12.8 11.9 10.9 12.0 12.0Veterans Affairs ............................................................................................................. 4.6 4.6 4.9 5.0 5.0 5.0 4.1 4.4 4.1Corps of Engineers ........................................................................................................ 0.6 0.6 0.7 0.6 0.6 0.6 0.6 0.6 0.6Other Defense—Civil Programs .................................................................................... 1.7 1.7 1.8 1.9 1.9 2.0 2.0 2.0 2.0Environmental Protection Agency ................................................................................. 0.3 0.3 0.5 0.8 0.8 0.8 1.2 1.1 0.9Executive Office of the President ................................................................................. * * * * * * * * *Federal Emergency Management Administration ......................................................... * 0.1 0.2 0.1 0.1 0.1 0.1 0.1 0.2General Services Administration ................................................................................... 0.3 0.3 0.3 0.3 0.1 * * * 0.1International Assistance Programs ................................................................................ 1.4 1.3 0.9 1.1 1.1 1.0 1.4 0.9 1.1National Aeronautics and Space Administration .......................................................... 1.6 1.5 1.3 1.2 1.0 1.0 1.0 1.0 0.9National Science Foundation ........................................................................................ 0.2 0.2 0.2 0.2 0.2 0.2 0.2 0.2 0.2Office of Personnel Management ................................................................................. 1.5 1.6 1.9 2.1 2.1 2.2 2.5 2.4 2.4Small Business Administration ...................................................................................... 0.2 0.2 0.5 0.3 0.2 0.2 0.1 0.2 0.6Social Security Administration (On-budget) .................................................................. 0.4 0.4 0.6 1.4 1.9 1.8 1.6 1.7 1.7Social Security Administration (Off-budget) .................................................................. 16.8 17.2 19.8 20.6 19.3 19.7 20.6 20.6 20.3Other Independent Agencies (On-budget) .................................................................... 2.5 2.4 2.3 2.9 2.9 2.6 2.7 2.3 1.9Undistributed offsetting receipts .................................................................................... –7.1 –6.4 –7.7 –8.7 –6.4 –6.0 –4.7 –5.6 –5.3
(On-budget) ................................................................................................................ (–5.8) (–5.2) (–6.5) (–7.4) (–5.3) (–5.0) (–4.3) (–4.7) (–4.5)(Off-budget) ................................................................................................................ (–1.2) (–1.2) (–1.2) (–1.2) (–1.1) (–1.0) (–0.4) (–0.9) (–0.8)
Total outlays ..................................................................................................... 100.0 100.0 100.0 100.0 100.0 100.0 100.0 100.0 100.0
* 0.05 percent or less.
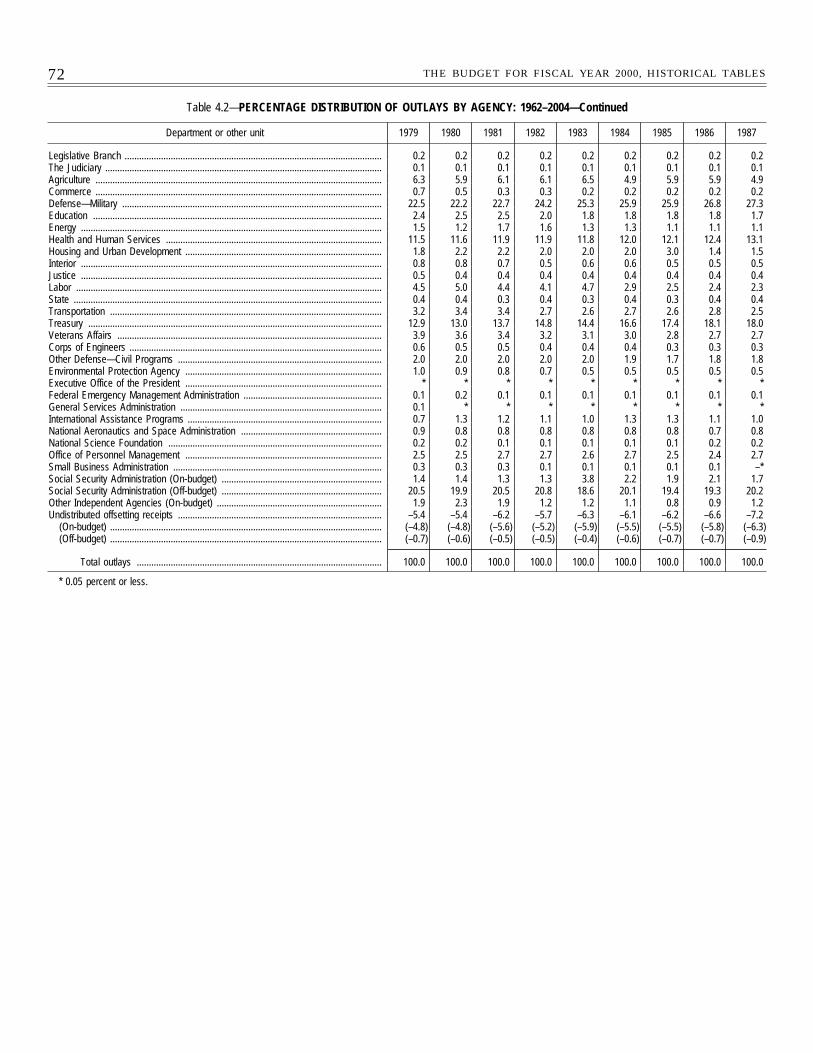
72 THE BUDGET FOR FISCAL YEAR 2000, HISTORICAL TABLES
Table 4.2—PERCENTAGE DISTRIBUTION OF OUTLAYS BY AGENCY: 1962–2004—Continued
Department or other unit 1979 1980 1981 1982 1983 1984 1985 1986 1987
Legislative Branch .......................................................................................................... 0.2 0.2 0.2 0.2 0.2 0.2 0.2 0.2 0.2The Judiciary .................................................................................................................. 0.1 0.1 0.1 0.1 0.1 0.1 0.1 0.1 0.1Agriculture ...................................................................................................................... 6.3 5.9 6.1 6.1 6.5 4.9 5.9 5.9 4.9Commerce ...................................................................................................................... 0.7 0.5 0.3 0.3 0.2 0.2 0.2 0.2 0.2Defense—Military ........................................................................................................... 22.5 22.2 22.7 24.2 25.3 25.9 25.9 26.8 27.3Education ....................................................................................................................... 2.4 2.5 2.5 2.0 1.8 1.8 1.8 1.8 1.7Energy ............................................................................................................................ 1.5 1.2 1.7 1.6 1.3 1.3 1.1 1.1 1.1Health and Human Services ......................................................................................... 11.5 11.6 11.9 11.9 11.8 12.0 12.1 12.4 13.1Housing and Urban Development ................................................................................. 1.8 2.2 2.2 2.0 2.0 2.0 3.0 1.4 1.5Interior ............................................................................................................................ 0.8 0.8 0.7 0.5 0.6 0.6 0.5 0.5 0.5Justice ............................................................................................................................ 0.5 0.4 0.4 0.4 0.4 0.4 0.4 0.4 0.4Labor .............................................................................................................................. 4.5 5.0 4.4 4.1 4.7 2.9 2.5 2.4 2.3State ............................................................................................................................... 0.4 0.4 0.3 0.4 0.3 0.4 0.3 0.4 0.4Transportation ................................................................................................................ 3.2 3.4 3.4 2.7 2.6 2.7 2.6 2.8 2.5Treasury ......................................................................................................................... 12.9 13.0 13.7 14.8 14.4 16.6 17.4 18.1 18.0Veterans Affairs ............................................................................................................. 3.9 3.6 3.4 3.2 3.1 3.0 2.8 2.7 2.7Corps of Engineers ........................................................................................................ 0.6 0.5 0.5 0.4 0.4 0.4 0.3 0.3 0.3Other Defense—Civil Programs .................................................................................... 2.0 2.0 2.0 2.0 2.0 1.9 1.7 1.8 1.8Environmental Protection Agency ................................................................................. 1.0 0.9 0.8 0.7 0.5 0.5 0.5 0.5 0.5Executive Office of the President ................................................................................. * * * * * * * * *Federal Emergency Management Administration ......................................................... 0.1 0.2 0.1 0.1 0.1 0.1 0.1 0.1 0.1General Services Administration ................................................................................... 0.1 * * * * * * * *International Assistance Programs ................................................................................ 0.7 1.3 1.2 1.1 1.0 1.3 1.3 1.1 1.0National Aeronautics and Space Administration .......................................................... 0.9 0.8 0.8 0.8 0.8 0.8 0.8 0.7 0.8National Science Foundation ........................................................................................ 0.2 0.2 0.1 0.1 0.1 0.1 0.1 0.2 0.2Office of Personnel Management ................................................................................. 2.5 2.5 2.7 2.7 2.6 2.7 2.5 2.4 2.7Small Business Administration ...................................................................................... 0.3 0.3 0.3 0.1 0.1 0.1 0.1 0.1 –*Social Security Administration (On-budget) .................................................................. 1.4 1.4 1.3 1.3 3.8 2.2 1.9 2.1 1.7Social Security Administration (Off-budget) .................................................................. 20.5 19.9 20.5 20.8 18.6 20.1 19.4 19.3 20.2Other Independent Agencies (On-budget) .................................................................... 1.9 2.3 1.9 1.2 1.2 1.1 0.8 0.9 1.2Undistributed offsetting receipts .................................................................................... –5.4 –5.4 –6.2 –5.7 –6.3 –6.1 –6.2 –6.6 –7.2
(On-budget) ................................................................................................................ (–4.8) (–4.8) (–5.6) (–5.2) (–5.9) (–5.5) (–5.5) (–5.8) (–6.3)(Off-budget) ................................................................................................................ (–0.7) (–0.6) (–0.5) (–0.5) (–0.4) (–0.6) (–0.7) (–0.7) (–0.9)
Total outlays ..................................................................................................... 100.0 100.0 100.0 100.0 100.0 100.0 100.0 100.0 100.0
* 0.05 percent or less.
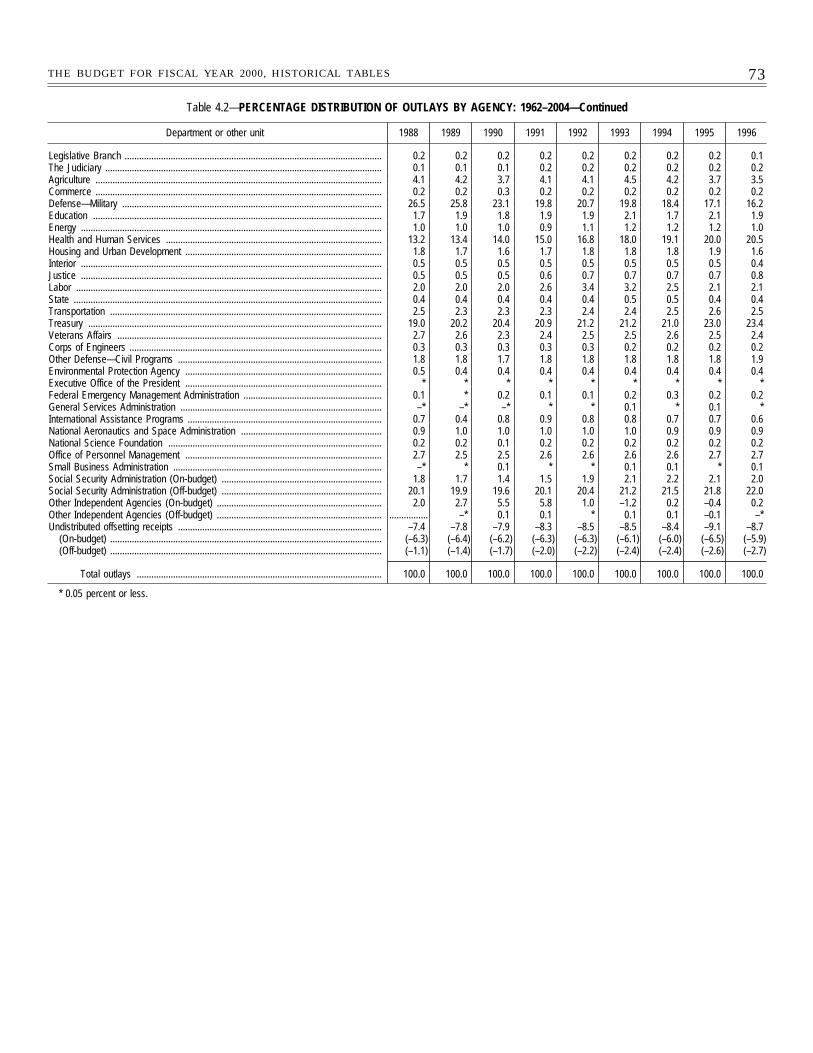
73THE BUDGET FOR FISCAL YEAR 2000, HISTORICAL TABLES
Table 4.2—PERCENTAGE DISTRIBUTION OF OUTLAYS BY AGENCY: 1962–2004—Continued
Department or other unit 1988 1989 1990 1991 1992 1993 1994 1995 1996
Legislative Branch .......................................................................................................... 0.2 0.2 0.2 0.2 0.2 0.2 0.2 0.2 0.1The Judiciary .................................................................................................................. 0.1 0.1 0.1 0.2 0.2 0.2 0.2 0.2 0.2Agriculture ...................................................................................................................... 4.1 4.2 3.7 4.1 4.1 4.5 4.2 3.7 3.5Commerce ...................................................................................................................... 0.2 0.2 0.3 0.2 0.2 0.2 0.2 0.2 0.2Defense—Military ........................................................................................................... 26.5 25.8 23.1 19.8 20.7 19.8 18.4 17.1 16.2Education ....................................................................................................................... 1.7 1.9 1.8 1.9 1.9 2.1 1.7 2.1 1.9Energy ............................................................................................................................ 1.0 1.0 1.0 0.9 1.1 1.2 1.2 1.2 1.0Health and Human Services ......................................................................................... 13.2 13.4 14.0 15.0 16.8 18.0 19.1 20.0 20.5Housing and Urban Development ................................................................................. 1.8 1.7 1.6 1.7 1.8 1.8 1.8 1.9 1.6Interior ............................................................................................................................ 0.5 0.5 0.5 0.5 0.5 0.5 0.5 0.5 0.4Justice ............................................................................................................................ 0.5 0.5 0.5 0.6 0.7 0.7 0.7 0.7 0.8Labor .............................................................................................................................. 2.0 2.0 2.0 2.6 3.4 3.2 2.5 2.1 2.1State ............................................................................................................................... 0.4 0.4 0.4 0.4 0.4 0.5 0.5 0.4 0.4Transportation ................................................................................................................ 2.5 2.3 2.3 2.3 2.4 2.4 2.5 2.6 2.5Treasury ......................................................................................................................... 19.0 20.2 20.4 20.9 21.2 21.2 21.0 23.0 23.4Veterans Affairs ............................................................................................................. 2.7 2.6 2.3 2.4 2.5 2.5 2.6 2.5 2.4Corps of Engineers ........................................................................................................ 0.3 0.3 0.3 0.3 0.3 0.2 0.2 0.2 0.2Other Defense—Civil Programs .................................................................................... 1.8 1.8 1.7 1.8 1.8 1.8 1.8 1.8 1.9Environmental Protection Agency ................................................................................. 0.5 0.4 0.4 0.4 0.4 0.4 0.4 0.4 0.4Executive Office of the President ................................................................................. * * * * * * * * *Federal Emergency Management Administration ......................................................... 0.1 * 0.2 0.1 0.1 0.2 0.3 0.2 0.2General Services Administration ................................................................................... –* –* –* * * 0.1 * 0.1 *International Assistance Programs ................................................................................ 0.7 0.4 0.8 0.9 0.8 0.8 0.7 0.7 0.6National Aeronautics and Space Administration .......................................................... 0.9 1.0 1.0 1.0 1.0 1.0 0.9 0.9 0.9National Science Foundation ........................................................................................ 0.2 0.2 0.1 0.2 0.2 0.2 0.2 0.2 0.2Office of Personnel Management ................................................................................. 2.7 2.5 2.5 2.6 2.6 2.6 2.6 2.7 2.7Small Business Administration ...................................................................................... –* * 0.1 * * 0.1 0.1 * 0.1Social Security Administration (On-budget) .................................................................. 1.8 1.7 1.4 1.5 1.9 2.1 2.2 2.1 2.0Social Security Administration (Off-budget) .................................................................. 20.1 19.9 19.6 20.1 20.4 21.2 21.5 21.8 22.0Other Independent Agencies (On-budget) .................................................................... 2.0 2.7 5.5 5.8 1.0 –1.2 0.2 –0.4 0.2Other Independent Agencies (Off-budget) .................................................................... ................ –* 0.1 0.1 * 0.1 0.1 –0.1 –*Undistributed offsetting receipts .................................................................................... –7.4 –7.8 –7.9 –8.3 –8.5 –8.5 –8.4 –9.1 –8.7
(On-budget) ................................................................................................................ (–6.3) (–6.4) (–6.2) (–6.3) (–6.3) (–6.1) (–6.0) (–6.5) (–5.9)(Off-budget) ................................................................................................................ (–1.1) (–1.4) (–1.7) (–2.0) (–2.2) (–2.4) (–2.4) (–2.6) (–2.7)
Total outlays ..................................................................................................... 100.0 100.0 100.0 100.0 100.0 100.0 100.0 100.0 100.0
* 0.05 percent or less.

74 THE BUDGET FOR FISCAL YEAR 2000, HISTORICAL TABLES
Table 4.2—PERCENTAGE DISTRIBUTION OF OUTLAYS BY AGENCY: 1962–2004—Continued
Department or other unit 1997 1998 1999estimate
2000estimate
2001estimate
2002estimate
2003estimate
2004estimate
Legislative Branch ........................................................................................................................... 0.1 0.2 0.2 0.2 0.2 0.2 0.2 0.2The Judiciary ................................................................................................................................... 0.2 0.2 0.2 0.2 0.2 0.2 0.2 0.2Agriculture ........................................................................................................................................ 3.3 3.3 3.7 3.1 3.1 3.0 2.9 2.9Commerce ....................................................................................................................................... 0.2 0.2 0.3 0.4 0.3 0.3 0.2 0.2Defense—Military ............................................................................................................................ 16.1 15.5 15.3 14.8 14.9 15.3 15.3 15.3Education ......................................................................................................................................... 1.9 1.9 2.0 2.0 2.2 2.1 2.1 2.1Energy ............................................................................................................................................. 0.9 0.9 0.9 0.9 0.9 0.9 0.8 0.8Health and Human Services ........................................................................................................... 21.2 21.2 21.7 22.7 23.7 24.3 25.0 25.6Housing and Urban Development .................................................................................................. 1.7 1.8 1.9 1.8 1.8 1.6 1.5 1.3Interior .............................................................................................................................................. 0.4 0.4 0.5 0.5 0.5 0.5 0.5 0.4Justice .............................................................................................................................................. 0.9 1.0 1.0 1.1 1.2 1.1 1.0 1.0Labor ................................................................................................................................................ 1.9 1.8 2.0 2.2 2.3 2.3 2.2 2.2State ................................................................................................................................................ 0.4 0.3 0.4 0.4 0.4 0.4 0.4 0.4Transportation .................................................................................................................................. 2.5 2.4 2.4 2.6 2.7 2.7 2.7 2.7Treasury ........................................................................................................................................... 23.7 23.6 22.3 21.4 20.9 20.6 19.7 19.0Veterans Affairs ............................................................................................................................... 2.5 2.5 2.5 2.5 2.5 2.5 2.5 2.4Corps of Engineers ......................................................................................................................... 0.2 0.2 0.2 0.2 0.2 0.2 0.2 0.1Other Defense—Civil Programs ..................................................................................................... 1.9 1.9 1.9 1.9 1.9 1.9 1.9 1.9Environmental Protection Agency ................................................................................................... 0.4 0.4 0.4 0.4 0.4 0.4 0.4 0.4Executive Office of the President ................................................................................................... * * * * * * * *Federal Emergency Management Administration .......................................................................... 0.2 0.1 0.2 0.2 0.1 0.1 0.1 0.1General Services Administration .................................................................................................... 0.1 0.1 * * * –* * *International Assistance Programs ................................................................................................. 0.6 0.5 0.6 0.6 0.6 0.6 0.6 0.6National Aeronautics and Space Administration ............................................................................ 0.9 0.9 0.8 0.8 0.7 0.7 0.7 0.7National Science Foundation .......................................................................................................... 0.2 0.2 0.2 0.2 0.2 0.2 0.2 0.2Office of Personnel Management ................................................................................................... 2.8 2.8 2.8 2.9 2.9 3.0 3.1 3.1Small Business Administration ....................................................................................................... * –* –0.1 * * * * *Social Security Administration (On-budget) ................................................................................... 2.2 2.3 2.4 2.3 2.3 2.4 2.4 2.4Social Security Administration (Off-budget) ................................................................................... 22.4 22.4 22.1 22.6 23.2 23.9 24.1 24.4Other Independent Agencies (On-budget) ..................................................................................... –0.2 0.7 0.3 0.7 0.9 1.1 1.2 1.2Other Independent Agencies (Off-budget) ..................................................................................... –* * 0.1 0.1 0.1 * * *Allowances ....................................................................................................................................... ................ ................ 0.2 0.1 –1.5 –2.2 –1.8 –1.5Undistributed offsetting receipts ..................................................................................................... –9.7 –9.7 –9.3 –9.7 –9.8 –10.5 –10.3 –10.5
(On-budget) ................................................................................................................................. (–6.7) (–6.5) (–5.9) (–6.0) (–5.9) (–6.2) (–5.8) (–5.7)(Off-budget) ................................................................................................................................. (–3.0) (–3.2) (–3.4) (–3.6) (–3.9) (–4.2) (–4.5) (–4.7)
Total outlays ....................................................................................................................... 100.0 100.0 100.0 100.0 100.0 100.0 100.0 100.0
* 0.05 percent or less.
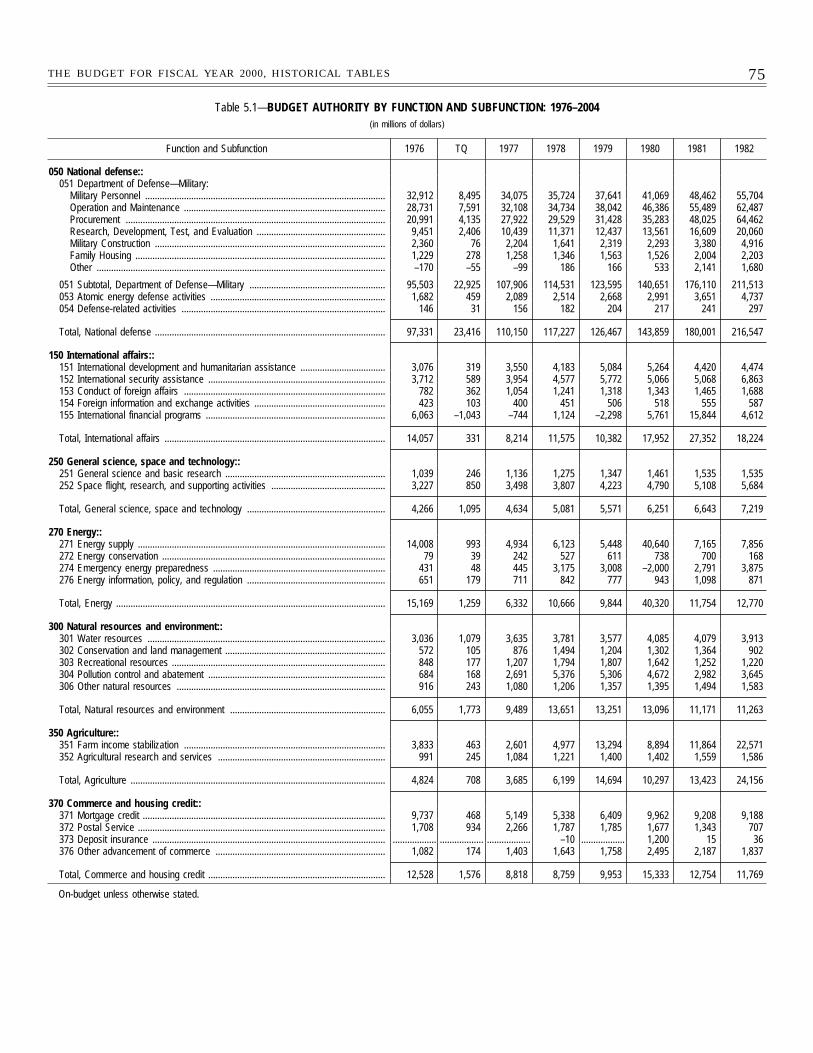
75THE BUDGET FOR FISCAL YEAR 2000, HISTORICAL TABLES
Table 5.1—BUDGET AUTHORITY BY FUNCTION AND SUBFUNCTION: 1976–2004(in millions of dollars)
Function and Subfunction 1976 TQ 1977 1978 1979 1980 1981 1982
050 National defense::051 Department of Defense—Military:
Military Personnel ................................................................................................... 32,912 8,495 34,075 35,724 37,641 41,069 48,462 55,704Operation and Maintenance ................................................................................... 28,731 7,591 32,108 34,734 38,042 46,386 55,489 62,487Procurement ........................................................................................................... 20,991 4,135 27,922 29,529 31,428 35,283 48,025 64,462Research, Development, Test, and Evaluation ..................................................... 9,451 2,406 10,439 11,371 12,437 13,561 16,609 20,060Military Construction ............................................................................................... 2,360 76 2,204 1,641 2,319 2,293 3,380 4,916Family Housing ....................................................................................................... 1,229 278 1,258 1,346 1,563 1,526 2,004 2,203Other ....................................................................................................................... –170 –55 –99 186 166 533 2,141 1,680
051 Subtotal, Department of Defense—Military ........................................................ 95,503 22,925 107,906 114,531 123,595 140,651 176,110 211,513053 Atomic energy defense activities ........................................................................ 1,682 459 2,089 2,514 2,668 2,991 3,651 4,737054 Defense-related activities .................................................................................... 146 31 156 182 204 217 241 297
Total, National defense ............................................................................................... 97,331 23,416 110,150 117,227 126,467 143,859 180,001 216,547
150 International affairs::151 International development and humanitarian assistance ................................... 3,076 319 3,550 4,183 5,084 5,264 4,420 4,474152 International security assistance ......................................................................... 3,712 589 3,954 4,577 5,772 5,066 5,068 6,863153 Conduct of foreign affairs ................................................................................... 782 362 1,054 1,241 1,318 1,343 1,465 1,688154 Foreign information and exchange activities ...................................................... 423 103 400 451 506 518 555 587155 International financial programs .......................................................................... 6,063 –1,043 –744 1,124 –2,298 5,761 15,844 4,612
Total, International affairs ........................................................................................... 14,057 331 8,214 11,575 10,382 17,952 27,352 18,224
250 General science, space and technology::251 General science and basic research .................................................................. 1,039 246 1,136 1,275 1,347 1,461 1,535 1,535252 Space flight, research, and supporting activities ............................................... 3,227 850 3,498 3,807 4,223 4,790 5,108 5,684
Total, General science, space and technology ......................................................... 4,266 1,095 4,634 5,081 5,571 6,251 6,643 7,219
270 Energy::271 Energy supply ...................................................................................................... 14,008 993 4,934 6,123 5,448 40,640 7,165 7,856272 Energy conservation ............................................................................................ 79 39 242 527 611 738 700 168274 Emergency energy preparedness ....................................................................... 431 48 445 3,175 3,008 –2,000 2,791 3,875276 Energy information, policy, and regulation ......................................................... 651 179 711 842 777 943 1,098 871
Total, Energy ............................................................................................................... 15,169 1,259 6,332 10,666 9,844 40,320 11,754 12,770
300 Natural resources and environment::301 Water resources .................................................................................................. 3,036 1,079 3,635 3,781 3,577 4,085 4,079 3,913302 Conservation and land management .................................................................. 572 105 876 1,494 1,204 1,302 1,364 902303 Recreational resources ........................................................................................ 848 177 1,207 1,794 1,807 1,642 1,252 1,220304 Pollution control and abatement ......................................................................... 684 168 2,691 5,376 5,306 4,672 2,982 3,645306 Other natural resources ...................................................................................... 916 243 1,080 1,206 1,357 1,395 1,494 1,583
Total, Natural resources and environment ................................................................ 6,055 1,773 9,489 13,651 13,251 13,096 11,171 11,263
350 Agriculture::351 Farm income stabilization ................................................................................... 3,833 463 2,601 4,977 13,294 8,894 11,864 22,571352 Agricultural research and services ..................................................................... 991 245 1,084 1,221 1,400 1,402 1,559 1,586
Total, Agriculture ......................................................................................................... 4,824 708 3,685 6,199 14,694 10,297 13,423 24,156
370 Commerce and housing credit::371 Mortgage credit .................................................................................................... 9,737 468 5,149 5,338 6,409 9,962 9,208 9,188372 Postal Service ...................................................................................................... 1,708 934 2,266 1,787 1,785 1,677 1,343 707373 Deposit insurance ................................................................................................ .................. .................. .................. –10 .................. 1,200 15 36376 Other advancement of commerce ...................................................................... 1,082 174 1,403 1,643 1,758 2,495 2,187 1,837
Total, Commerce and housing credit ......................................................................... 12,528 1,576 8,818 8,759 9,953 15,333 12,754 11,769
On-budget unless otherwise stated.
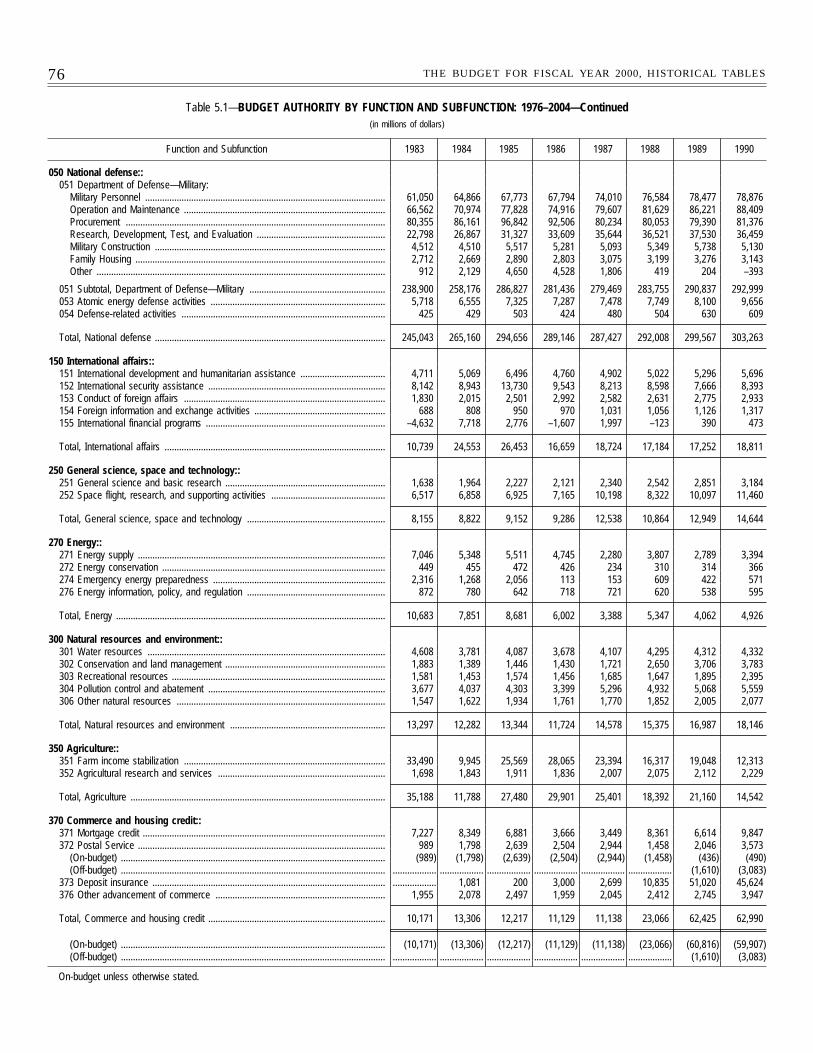
76 THE BUDGET FOR FISCAL YEAR 2000, HISTORICAL TABLES
Table 5.1—BUDGET AUTHORITY BY FUNCTION AND SUBFUNCTION: 1976–2004—Continued(in millions of dollars)
Function and Subfunction 1983 1984 1985 1986 1987 1988 1989 1990
050 National defense::051 Department of Defense—Military:
Military Personnel ................................................................................................... 61,050 64,866 67,773 67,794 74,010 76,584 78,477 78,876Operation and Maintenance ................................................................................... 66,562 70,974 77,828 74,916 79,607 81,629 86,221 88,409Procurement ........................................................................................................... 80,355 86,161 96,842 92,506 80,234 80,053 79,390 81,376Research, Development, Test, and Evaluation ..................................................... 22,798 26,867 31,327 33,609 35,644 36,521 37,530 36,459Military Construction ............................................................................................... 4,512 4,510 5,517 5,281 5,093 5,349 5,738 5,130Family Housing ....................................................................................................... 2,712 2,669 2,890 2,803 3,075 3,199 3,276 3,143Other ....................................................................................................................... 912 2,129 4,650 4,528 1,806 419 204 –393
051 Subtotal, Department of Defense—Military ........................................................ 238,900 258,176 286,827 281,436 279,469 283,755 290,837 292,999053 Atomic energy defense activities ........................................................................ 5,718 6,555 7,325 7,287 7,478 7,749 8,100 9,656054 Defense-related activities .................................................................................... 425 429 503 424 480 504 630 609
Total, National defense ............................................................................................... 245,043 265,160 294,656 289,146 287,427 292,008 299,567 303,263
150 International affairs::151 International development and humanitarian assistance ................................... 4,711 5,069 6,496 4,760 4,902 5,022 5,296 5,696152 International security assistance ......................................................................... 8,142 8,943 13,730 9,543 8,213 8,598 7,666 8,393153 Conduct of foreign affairs ................................................................................... 1,830 2,015 2,501 2,992 2,582 2,631 2,775 2,933154 Foreign information and exchange activities ...................................................... 688 808 950 970 1,031 1,056 1,126 1,317155 International financial programs .......................................................................... –4,632 7,718 2,776 –1,607 1,997 –123 390 473
Total, International affairs ........................................................................................... 10,739 24,553 26,453 16,659 18,724 17,184 17,252 18,811
250 General science, space and technology::251 General science and basic research .................................................................. 1,638 1,964 2,227 2,121 2,340 2,542 2,851 3,184252 Space flight, research, and supporting activities ............................................... 6,517 6,858 6,925 7,165 10,198 8,322 10,097 11,460
Total, General science, space and technology ......................................................... 8,155 8,822 9,152 9,286 12,538 10,864 12,949 14,644
270 Energy::271 Energy supply ...................................................................................................... 7,046 5,348 5,511 4,745 2,280 3,807 2,789 3,394272 Energy conservation ............................................................................................ 449 455 472 426 234 310 314 366274 Emergency energy preparedness ....................................................................... 2,316 1,268 2,056 113 153 609 422 571276 Energy information, policy, and regulation ......................................................... 872 780 642 718 721 620 538 595
Total, Energy ............................................................................................................... 10,683 7,851 8,681 6,002 3,388 5,347 4,062 4,926
300 Natural resources and environment::301 Water resources .................................................................................................. 4,608 3,781 4,087 3,678 4,107 4,295 4,312 4,332302 Conservation and land management .................................................................. 1,883 1,389 1,446 1,430 1,721 2,650 3,706 3,783303 Recreational resources ........................................................................................ 1,581 1,453 1,574 1,456 1,685 1,647 1,895 2,395304 Pollution control and abatement ......................................................................... 3,677 4,037 4,303 3,399 5,296 4,932 5,068 5,559306 Other natural resources ...................................................................................... 1,547 1,622 1,934 1,761 1,770 1,852 2,005 2,077
Total, Natural resources and environment ................................................................ 13,297 12,282 13,344 11,724 14,578 15,375 16,987 18,146
350 Agriculture::351 Farm income stabilization ................................................................................... 33,490 9,945 25,569 28,065 23,394 16,317 19,048 12,313352 Agricultural research and services ..................................................................... 1,698 1,843 1,911 1,836 2,007 2,075 2,112 2,229
Total, Agriculture ......................................................................................................... 35,188 11,788 27,480 29,901 25,401 18,392 21,160 14,542
370 Commerce and housing credit::371 Mortgage credit .................................................................................................... 7,227 8,349 6,881 3,666 3,449 8,361 6,614 9,847372 Postal Service ...................................................................................................... 989 1,798 2,639 2,504 2,944 1,458 2,046 3,573
(On-budget) ............................................................................................................. (989) (1,798) (2,639) (2,504) (2,944) (1,458) (436) (490)(Off-budget) ............................................................................................................. .................. .................. .................. .................. .................. .................. (1,610) (3,083)
373 Deposit insurance ................................................................................................ .................. 1,081 200 3,000 2,699 10,835 51,020 45,624376 Other advancement of commerce ...................................................................... 1,955 2,078 2,497 1,959 2,045 2,412 2,745 3,947
Total, Commerce and housing credit ......................................................................... 10,171 13,306 12,217 11,129 11,138 23,066 62,425 62,990
(On-budget) ............................................................................................................. (10,171) (13,306) (12,217) (11,129) (11,138) (23,066) (60,816) (59,907)(Off-budget) ............................................................................................................. .................. .................. .................. .................. .................. .................. (1,610) (3,083)
On-budget unless otherwise stated.
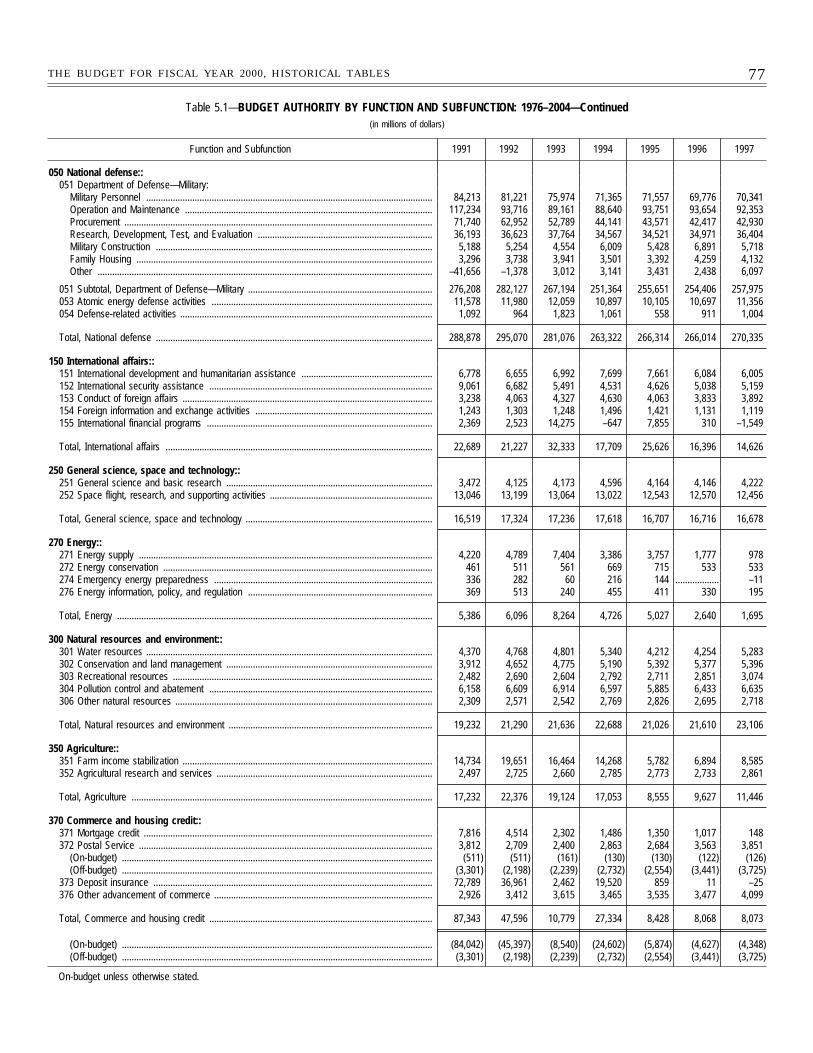
77THE BUDGET FOR FISCAL YEAR 2000, HISTORICAL TABLES
Table 5.1—BUDGET AUTHORITY BY FUNCTION AND SUBFUNCTION: 1976–2004—Continued(in millions of dollars)
Function and Subfunction 1991 1992 1993 1994 1995 1996 1997
050 National defense::051 Department of Defense—Military:
Military Personnel ...................................................................................................................... 84,213 81,221 75,974 71,365 71,557 69,776 70,341Operation and Maintenance ...................................................................................................... 117,234 93,716 89,161 88,640 93,751 93,654 92,353Procurement ............................................................................................................................... 71,740 62,952 52,789 44,141 43,571 42,417 42,930Research, Development, Test, and Evaluation ........................................................................ 36,193 36,623 37,764 34,567 34,521 34,971 36,404Military Construction .................................................................................................................. 5,188 5,254 4,554 6,009 5,428 6,891 5,718Family Housing .......................................................................................................................... 3,296 3,738 3,941 3,501 3,392 4,259 4,132Other .......................................................................................................................................... –41,656 –1,378 3,012 3,141 3,431 2,438 6,097
051 Subtotal, Department of Defense—Military ............................................................................ 276,208 282,127 267,194 251,364 255,651 254,406 257,975053 Atomic energy defense activities ........................................................................................... 11,578 11,980 12,059 10,897 10,105 10,697 11,356054 Defense-related activities ........................................................................................................ 1,092 964 1,823 1,061 558 911 1,004
Total, National defense .................................................................................................................. 288,878 295,070 281,076 263,322 266,314 266,014 270,335
150 International affairs::151 International development and humanitarian assistance ...................................................... 6,778 6,655 6,992 7,699 7,661 6,084 6,005152 International security assistance ............................................................................................ 9,061 6,682 5,491 4,531 4,626 5,038 5,159153 Conduct of foreign affairs ....................................................................................................... 3,238 4,063 4,327 4,630 4,063 3,833 3,892154 Foreign information and exchange activities ......................................................................... 1,243 1,303 1,248 1,496 1,421 1,131 1,119155 International financial programs ............................................................................................. 2,369 2,523 14,275 –647 7,855 310 –1,549
Total, International affairs .............................................................................................................. 22,689 21,227 32,333 17,709 25,626 16,396 14,626
250 General science, space and technology::251 General science and basic research ..................................................................................... 3,472 4,125 4,173 4,596 4,164 4,146 4,222252 Space flight, research, and supporting activities ................................................................... 13,046 13,199 13,064 13,022 12,543 12,570 12,456
Total, General science, space and technology ............................................................................. 16,519 17,324 17,236 17,618 16,707 16,716 16,678
270 Energy::271 Energy supply ......................................................................................................................... 4,220 4,789 7,404 3,386 3,757 1,777 978272 Energy conservation ............................................................................................................... 461 511 561 669 715 533 533274 Emergency energy preparedness .......................................................................................... 336 282 60 216 144 .................. –11276 Energy information, policy, and regulation ............................................................................ 369 513 240 455 411 330 195
Total, Energy .................................................................................................................................. 5,386 6,096 8,264 4,726 5,027 2,640 1,695
300 Natural resources and environment::301 Water resources ...................................................................................................................... 4,370 4,768 4,801 5,340 4,212 4,254 5,283302 Conservation and land management ..................................................................................... 3,912 4,652 4,775 5,190 5,392 5,377 5,396303 Recreational resources ........................................................................................................... 2,482 2,690 2,604 2,792 2,711 2,851 3,074304 Pollution control and abatement ............................................................................................ 6,158 6,609 6,914 6,597 5,885 6,433 6,635306 Other natural resources .......................................................................................................... 2,309 2,571 2,542 2,769 2,826 2,695 2,718
Total, Natural resources and environment .................................................................................... 19,232 21,290 21,636 22,688 21,026 21,610 23,106
350 Agriculture::351 Farm income stabilization ....................................................................................................... 14,734 19,651 16,464 14,268 5,782 6,894 8,585352 Agricultural research and services ......................................................................................... 2,497 2,725 2,660 2,785 2,773 2,733 2,861
Total, Agriculture ............................................................................................................................ 17,232 22,376 19,124 17,053 8,555 9,627 11,446
370 Commerce and housing credit::371 Mortgage credit ....................................................................................................................... 7,816 4,514 2,302 1,486 1,350 1,017 148372 Postal Service ......................................................................................................................... 3,812 2,709 2,400 2,863 2,684 3,563 3,851
(On-budget) ................................................................................................................................ (511) (511) (161) (130) (130) (122) (126)(Off-budget) ................................................................................................................................ (3,301) (2,198) (2,239) (2,732) (2,554) (3,441) (3,725)
373 Deposit insurance ................................................................................................................... 72,789 36,961 2,462 19,520 859 11 –25376 Other advancement of commerce .......................................................................................... 2,926 3,412 3,615 3,465 3,535 3,477 4,099
Total, Commerce and housing credit ............................................................................................ 87,343 47,596 10,779 27,334 8,428 8,068 8,073
(On-budget) ................................................................................................................................ (84,042) (45,397) (8,540) (24,602) (5,874) (4,627) (4,348)(Off-budget) ................................................................................................................................ (3,301) (2,198) (2,239) (2,732) (2,554) (3,441) (3,725)
On-budget unless otherwise stated.
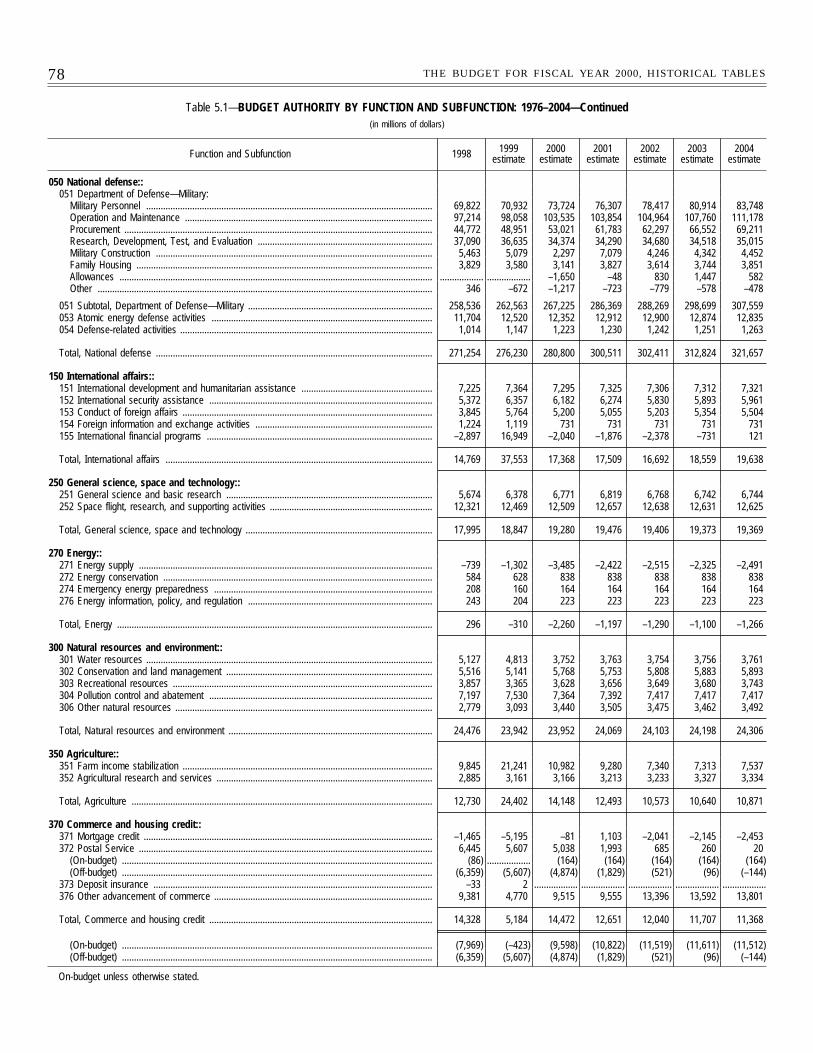
78 THE BUDGET FOR FISCAL YEAR 2000, HISTORICAL TABLES
Table 5.1—BUDGET AUTHORITY BY FUNCTION AND SUBFUNCTION: 1976–2004—Continued(in millions of dollars)
Function and Subfunction 1998 1999estimate
2000estimate
2001estimate
2002estimate
2003estimate
2004estimate
050 National defense::051 Department of Defense—Military:
Military Personnel ...................................................................................................................... 69,822 70,932 73,724 76,307 78,417 80,914 83,748Operation and Maintenance ...................................................................................................... 97,214 98,058 103,535 103,854 104,964 107,760 111,178Procurement ............................................................................................................................... 44,772 48,951 53,021 61,783 62,297 66,552 69,211Research, Development, Test, and Evaluation ........................................................................ 37,090 36,635 34,374 34,290 34,680 34,518 35,015Military Construction .................................................................................................................. 5,463 5,079 2,297 7,079 4,246 4,342 4,452Family Housing .......................................................................................................................... 3,829 3,580 3,141 3,827 3,614 3,744 3,851Allowances ................................................................................................................................. .................. .................. –1,650 –48 830 1,447 582Other .......................................................................................................................................... 346 –672 –1,217 –723 –779 –578 –478
051 Subtotal, Department of Defense—Military ............................................................................ 258,536 262,563 267,225 286,369 288,269 298,699 307,559053 Atomic energy defense activities ........................................................................................... 11,704 12,520 12,352 12,912 12,900 12,874 12,835054 Defense-related activities ........................................................................................................ 1,014 1,147 1,223 1,230 1,242 1,251 1,263
Total, National defense .................................................................................................................. 271,254 276,230 280,800 300,511 302,411 312,824 321,657
150 International affairs::151 International development and humanitarian assistance ...................................................... 7,225 7,364 7,295 7,325 7,306 7,312 7,321152 International security assistance ............................................................................................ 5,372 6,357 6,182 6,274 5,830 5,893 5,961153 Conduct of foreign affairs ....................................................................................................... 3,845 5,764 5,200 5,055 5,203 5,354 5,504154 Foreign information and exchange activities ......................................................................... 1,224 1,119 731 731 731 731 731155 International financial programs ............................................................................................. –2,897 16,949 –2,040 –1,876 –2,378 –731 121
Total, International affairs .............................................................................................................. 14,769 37,553 17,368 17,509 16,692 18,559 19,638
250 General science, space and technology::251 General science and basic research ..................................................................................... 5,674 6,378 6,771 6,819 6,768 6,742 6,744252 Space flight, research, and supporting activities ................................................................... 12,321 12,469 12,509 12,657 12,638 12,631 12,625
Total, General science, space and technology ............................................................................. 17,995 18,847 19,280 19,476 19,406 19,373 19,369
270 Energy::271 Energy supply ......................................................................................................................... –739 –1,302 –3,485 –2,422 –2,515 –2,325 –2,491272 Energy conservation ............................................................................................................... 584 628 838 838 838 838 838274 Emergency energy preparedness .......................................................................................... 208 160 164 164 164 164 164276 Energy information, policy, and regulation ............................................................................ 243 204 223 223 223 223 223
Total, Energy .................................................................................................................................. 296 –310 –2,260 –1,197 –1,290 –1,100 –1,266
300 Natural resources and environment::301 Water resources ...................................................................................................................... 5,127 4,813 3,752 3,763 3,754 3,756 3,761302 Conservation and land management ..................................................................................... 5,516 5,141 5,768 5,753 5,808 5,883 5,893303 Recreational resources ........................................................................................................... 3,857 3,365 3,628 3,656 3,649 3,680 3,743304 Pollution control and abatement ............................................................................................ 7,197 7,530 7,364 7,392 7,417 7,417 7,417306 Other natural resources .......................................................................................................... 2,779 3,093 3,440 3,505 3,475 3,462 3,492
Total, Natural resources and environment .................................................................................... 24,476 23,942 23,952 24,069 24,103 24,198 24,306
350 Agriculture::351 Farm income stabilization ....................................................................................................... 9,845 21,241 10,982 9,280 7,340 7,313 7,537352 Agricultural research and services ......................................................................................... 2,885 3,161 3,166 3,213 3,233 3,327 3,334
Total, Agriculture ............................................................................................................................ 12,730 24,402 14,148 12,493 10,573 10,640 10,871
370 Commerce and housing credit::371 Mortgage credit ....................................................................................................................... –1,465 –5,195 –81 1,103 –2,041 –2,145 –2,453372 Postal Service ......................................................................................................................... 6,445 5,607 5,038 1,993 685 260 20
(On-budget) ................................................................................................................................ (86) .................. (164) (164) (164) (164) (164)(Off-budget) ................................................................................................................................ (6,359) (5,607) (4,874) (1,829) (521) (96) (–144)
373 Deposit insurance ................................................................................................................... –33 2 .................. .................. .................. .................. ..................376 Other advancement of commerce .......................................................................................... 9,381 4,770 9,515 9,555 13,396 13,592 13,801
Total, Commerce and housing credit ............................................................................................ 14,328 5,184 14,472 12,651 12,040 11,707 11,368
(On-budget) ................................................................................................................................ (7,969) (–423) (9,598) (10,822) (11,519) (11,611) (11,512)(Off-budget) ................................................................................................................................ (6,359) (5,607) (4,874) (1,829) (521) (96) (–144)
On-budget unless otherwise stated.
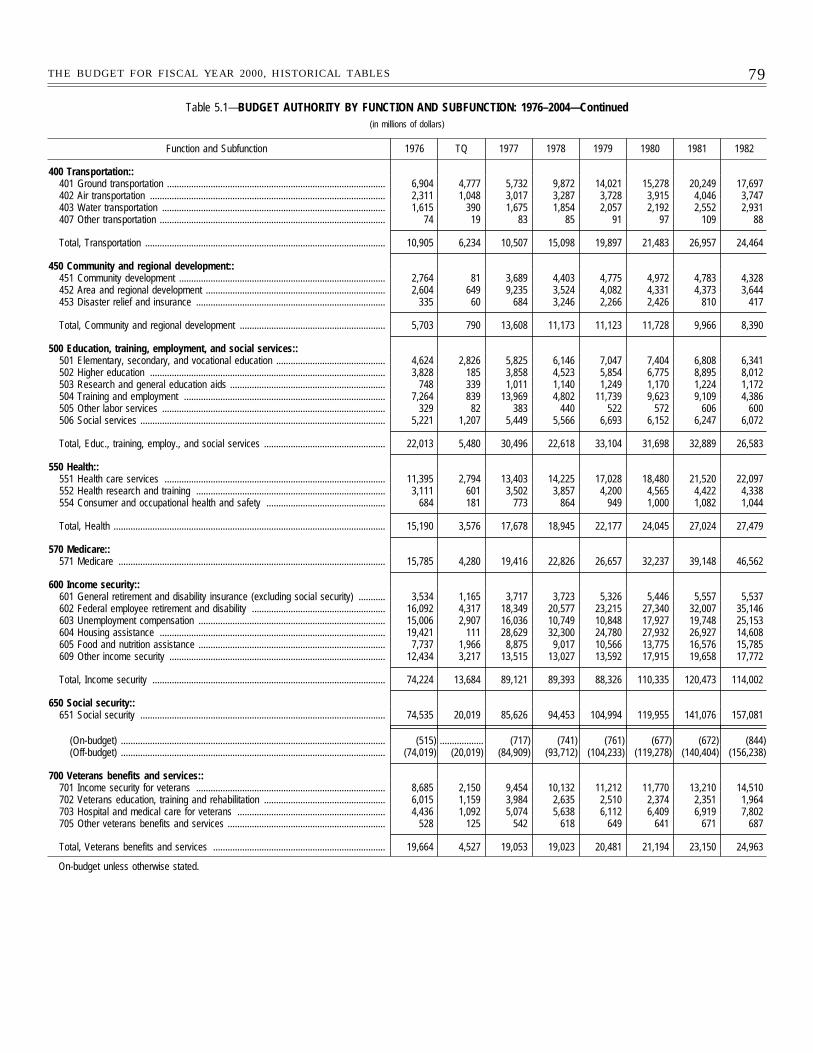
79THE BUDGET FOR FISCAL YEAR 2000, HISTORICAL TABLES
Table 5.1—BUDGET AUTHORITY BY FUNCTION AND SUBFUNCTION: 1976–2004—Continued(in millions of dollars)
Function and Subfunction 1976 TQ 1977 1978 1979 1980 1981 1982
400 Transportation::401 Ground transportation .......................................................................................... 6,904 4,777 5,732 9,872 14,021 15,278 20,249 17,697402 Air transportation ................................................................................................. 2,311 1,048 3,017 3,287 3,728 3,915 4,046 3,747403 Water transportation ............................................................................................ 1,615 390 1,675 1,854 2,057 2,192 2,552 2,931407 Other transportation ............................................................................................. 74 19 83 85 91 97 109 88
Total, Transportation ................................................................................................... 10,905 6,234 10,507 15,098 19,897 21,483 26,957 24,464
450 Community and regional development::451 Community development ..................................................................................... 2,764 81 3,689 4,403 4,775 4,972 4,783 4,328452 Area and regional development .......................................................................... 2,604 649 9,235 3,524 4,082 4,331 4,373 3,644453 Disaster relief and insurance .............................................................................. 335 60 684 3,246 2,266 2,426 810 417
Total, Community and regional development ............................................................ 5,703 790 13,608 11,173 11,123 11,728 9,966 8,390
500 Education, training, employment, and social services::501 Elementary, secondary, and vocational education ............................................. 4,624 2,826 5,825 6,146 7,047 7,404 6,808 6,341502 Higher education ................................................................................................. 3,828 185 3,858 4,523 5,854 6,775 8,895 8,012503 Research and general education aids ................................................................ 748 339 1,011 1,140 1,249 1,170 1,224 1,172504 Training and employment ................................................................................... 7,264 839 13,969 4,802 11,739 9,623 9,109 4,386505 Other labor services ............................................................................................ 329 82 383 440 522 572 606 600506 Social services ..................................................................................................... 5,221 1,207 5,449 5,566 6,693 6,152 6,247 6,072
Total, Educ., training, employ., and social services .................................................. 22,013 5,480 30,496 22,618 33,104 31,698 32,889 26,583
550 Health::551 Health care services ........................................................................................... 11,395 2,794 13,403 14,225 17,028 18,480 21,520 22,097552 Health research and training .............................................................................. 3,111 601 3,502 3,857 4,200 4,565 4,422 4,338554 Consumer and occupational health and safety ................................................. 684 181 773 864 949 1,000 1,082 1,044
Total, Health ................................................................................................................ 15,190 3,576 17,678 18,945 22,177 24,045 27,024 27,479
570 Medicare::571 Medicare .............................................................................................................. 15,785 4,280 19,416 22,826 26,657 32,237 39,148 46,562
600 Income security::601 General retirement and disability insurance (excluding social security) ........... 3,534 1,165 3,717 3,723 5,326 5,446 5,557 5,537602 Federal employee retirement and disability ....................................................... 16,092 4,317 18,349 20,577 23,215 27,340 32,007 35,146603 Unemployment compensation ............................................................................. 15,006 2,907 16,036 10,749 10,848 17,927 19,748 25,153604 Housing assistance ............................................................................................. 19,421 111 28,629 32,300 24,780 27,932 26,927 14,608605 Food and nutrition assistance ............................................................................. 7,737 1,966 8,875 9,017 10,566 13,775 16,576 15,785609 Other income security ......................................................................................... 12,434 3,217 13,515 13,027 13,592 17,915 19,658 17,772
Total, Income security ................................................................................................ 74,224 13,684 89,121 89,393 88,326 110,335 120,473 114,002
650 Social security::651 Social security ..................................................................................................... 74,535 20,019 85,626 94,453 104,994 119,955 141,076 157,081
(On-budget) ............................................................................................................. (515) .................. (717) (741) (761) (677) (672) (844)(Off-budget) ............................................................................................................. (74,019) (20,019) (84,909) (93,712) (104,233) (119,278) (140,404) (156,238)
700 Veterans benefits and services::701 Income security for veterans .............................................................................. 8,685 2,150 9,454 10,132 11,212 11,770 13,210 14,510702 Veterans education, training and rehabilitation .................................................. 6,015 1,159 3,984 2,635 2,510 2,374 2,351 1,964703 Hospital and medical care for veterans ............................................................. 4,436 1,092 5,074 5,638 6,112 6,409 6,919 7,802705 Other veterans benefits and services ................................................................. 528 125 542 618 649 641 671 687
Total, Veterans benefits and services ....................................................................... 19,664 4,527 19,053 19,023 20,481 21,194 23,150 24,963
On-budget unless otherwise stated.
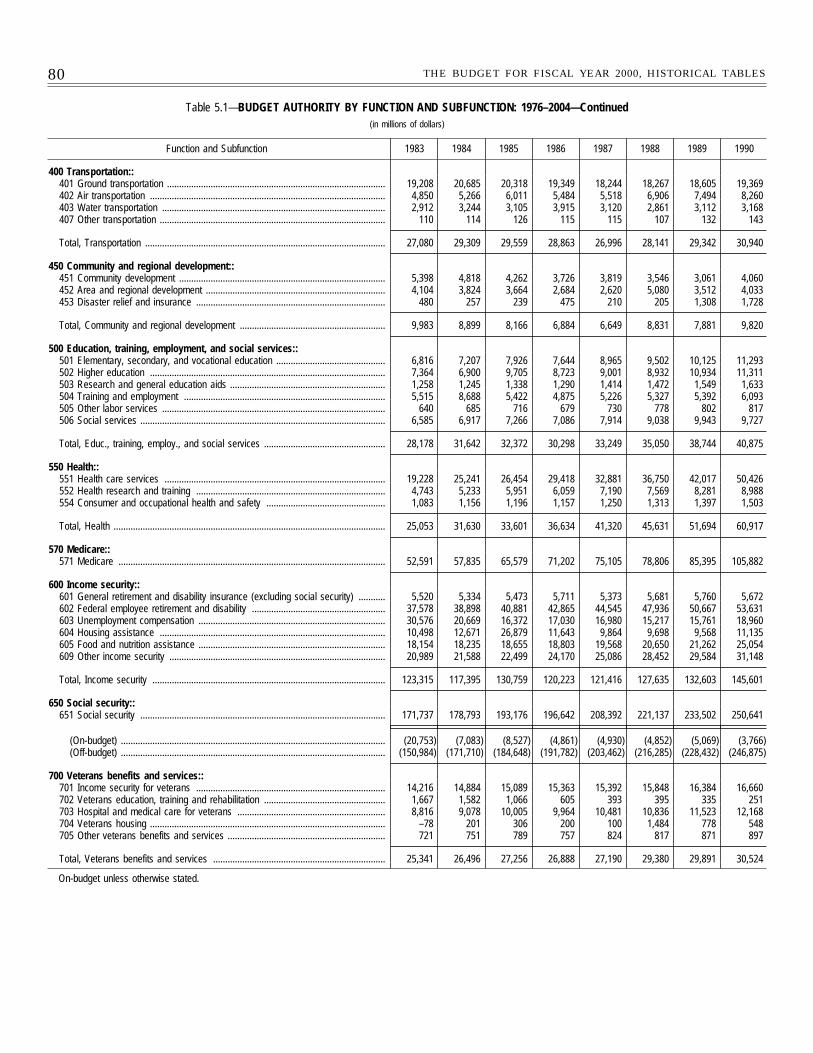
80 THE BUDGET FOR FISCAL YEAR 2000, HISTORICAL TABLES
Table 5.1—BUDGET AUTHORITY BY FUNCTION AND SUBFUNCTION: 1976–2004—Continued(in millions of dollars)
Function and Subfunction 1983 1984 1985 1986 1987 1988 1989 1990
400 Transportation::401 Ground transportation .......................................................................................... 19,208 20,685 20,318 19,349 18,244 18,267 18,605 19,369402 Air transportation ................................................................................................. 4,850 5,266 6,011 5,484 5,518 6,906 7,494 8,260403 Water transportation ............................................................................................ 2,912 3,244 3,105 3,915 3,120 2,861 3,112 3,168407 Other transportation ............................................................................................. 110 114 126 115 115 107 132 143
Total, Transportation ................................................................................................... 27,080 29,309 29,559 28,863 26,996 28,141 29,342 30,940
450 Community and regional development::451 Community development ..................................................................................... 5,398 4,818 4,262 3,726 3,819 3,546 3,061 4,060452 Area and regional development .......................................................................... 4,104 3,824 3,664 2,684 2,620 5,080 3,512 4,033453 Disaster relief and insurance .............................................................................. 480 257 239 475 210 205 1,308 1,728
Total, Community and regional development ............................................................ 9,983 8,899 8,166 6,884 6,649 8,831 7,881 9,820
500 Education, training, employment, and social services::501 Elementary, secondary, and vocational education ............................................. 6,816 7,207 7,926 7,644 8,965 9,502 10,125 11,293502 Higher education ................................................................................................. 7,364 6,900 9,705 8,723 9,001 8,932 10,934 11,311503 Research and general education aids ................................................................ 1,258 1,245 1,338 1,290 1,414 1,472 1,549 1,633504 Training and employment ................................................................................... 5,515 8,688 5,422 4,875 5,226 5,327 5,392 6,093505 Other labor services ............................................................................................ 640 685 716 679 730 778 802 817506 Social services ..................................................................................................... 6,585 6,917 7,266 7,086 7,914 9,038 9,943 9,727
Total, Educ., training, employ., and social services .................................................. 28,178 31,642 32,372 30,298 33,249 35,050 38,744 40,875
550 Health::551 Health care services ........................................................................................... 19,228 25,241 26,454 29,418 32,881 36,750 42,017 50,426552 Health research and training .............................................................................. 4,743 5,233 5,951 6,059 7,190 7,569 8,281 8,988554 Consumer and occupational health and safety ................................................. 1,083 1,156 1,196 1,157 1,250 1,313 1,397 1,503
Total, Health ................................................................................................................ 25,053 31,630 33,601 36,634 41,320 45,631 51,694 60,917
570 Medicare::571 Medicare .............................................................................................................. 52,591 57,835 65,579 71,202 75,105 78,806 85,395 105,882
600 Income security::601 General retirement and disability insurance (excluding social security) ........... 5,520 5,334 5,473 5,711 5,373 5,681 5,760 5,672602 Federal employee retirement and disability ....................................................... 37,578 38,898 40,881 42,865 44,545 47,936 50,667 53,631603 Unemployment compensation ............................................................................. 30,576 20,669 16,372 17,030 16,980 15,217 15,761 18,960604 Housing assistance ............................................................................................. 10,498 12,671 26,879 11,643 9,864 9,698 9,568 11,135605 Food and nutrition assistance ............................................................................. 18,154 18,235 18,655 18,803 19,568 20,650 21,262 25,054609 Other income security ......................................................................................... 20,989 21,588 22,499 24,170 25,086 28,452 29,584 31,148
Total, Income security ................................................................................................ 123,315 117,395 130,759 120,223 121,416 127,635 132,603 145,601
650 Social security::651 Social security ..................................................................................................... 171,737 178,793 193,176 196,642 208,392 221,137 233,502 250,641
(On-budget) ............................................................................................................. (20,753) (7,083) (8,527) (4,861) (4,930) (4,852) (5,069) (3,766)(Off-budget) ............................................................................................................. (150,984) (171,710) (184,648) (191,782) (203,462) (216,285) (228,432) (246,875)
700 Veterans benefits and services::701 Income security for veterans .............................................................................. 14,216 14,884 15,089 15,363 15,392 15,848 16,384 16,660702 Veterans education, training and rehabilitation .................................................. 1,667 1,582 1,066 605 393 395 335 251703 Hospital and medical care for veterans ............................................................. 8,816 9,078 10,005 9,964 10,481 10,836 11,523 12,168704 Veterans housing ................................................................................................. –78 201 306 200 100 1,484 778 548705 Other veterans benefits and services ................................................................. 721 751 789 757 824 817 871 897
Total, Veterans benefits and services ....................................................................... 25,341 26,496 27,256 26,888 27,190 29,380 29,891 30,524
On-budget unless otherwise stated.
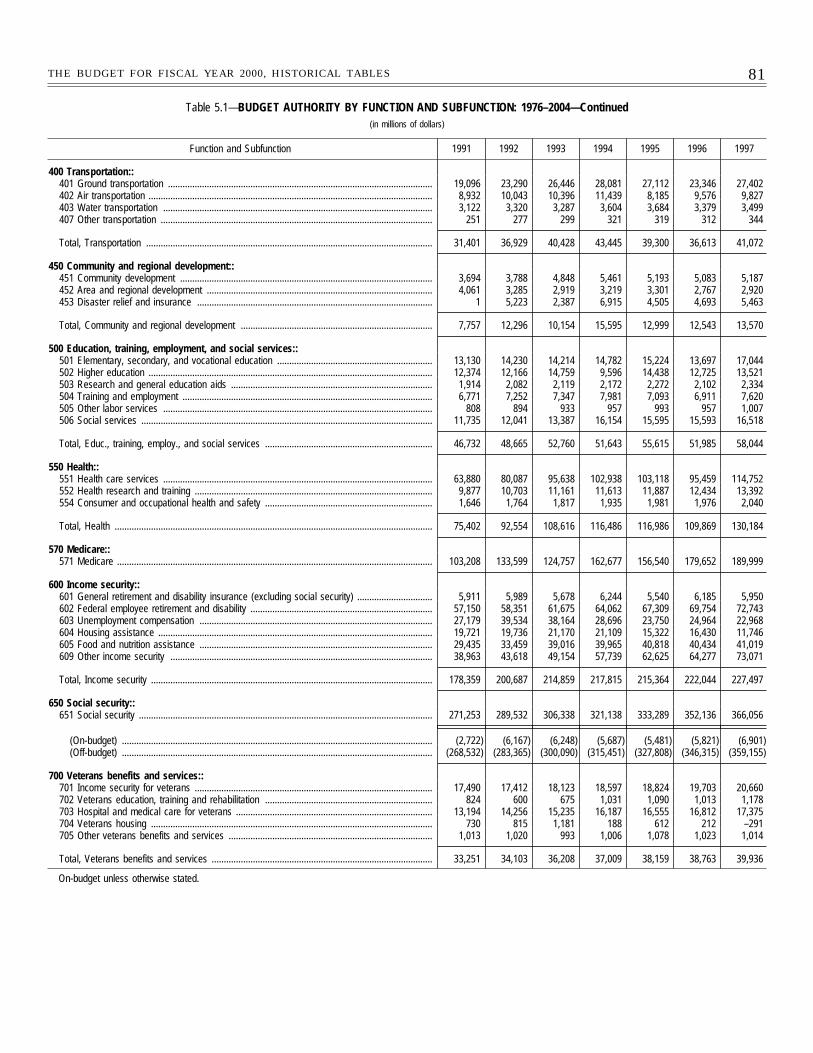
81THE BUDGET FOR FISCAL YEAR 2000, HISTORICAL TABLES
Table 5.1—BUDGET AUTHORITY BY FUNCTION AND SUBFUNCTION: 1976–2004—Continued(in millions of dollars)
Function and Subfunction 1991 1992 1993 1994 1995 1996 1997
400 Transportation::401 Ground transportation ............................................................................................................. 19,096 23,290 26,446 28,081 27,112 23,346 27,402402 Air transportation ..................................................................................................................... 8,932 10,043 10,396 11,439 8,185 9,576 9,827403 Water transportation ............................................................................................................... 3,122 3,320 3,287 3,604 3,684 3,379 3,499407 Other transportation ................................................................................................................ 251 277 299 321 319 312 344
Total, Transportation ...................................................................................................................... 31,401 36,929 40,428 43,445 39,300 36,613 41,072
450 Community and regional development::451 Community development ........................................................................................................ 3,694 3,788 4,848 5,461 5,193 5,083 5,187452 Area and regional development ............................................................................................. 4,061 3,285 2,919 3,219 3,301 2,767 2,920453 Disaster relief and insurance ................................................................................................. 1 5,223 2,387 6,915 4,505 4,693 5,463
Total, Community and regional development ............................................................................... 7,757 12,296 10,154 15,595 12,999 12,543 13,570
500 Education, training, employment, and social services::501 Elementary, secondary, and vocational education ................................................................ 13,130 14,230 14,214 14,782 15,224 13,697 17,044502 Higher education ..................................................................................................................... 12,374 12,166 14,759 9,596 14,438 12,725 13,521503 Research and general education aids ................................................................................... 1,914 2,082 2,119 2,172 2,272 2,102 2,334504 Training and employment ....................................................................................................... 6,771 7,252 7,347 7,981 7,093 6,911 7,620505 Other labor services ............................................................................................................... 808 894 933 957 993 957 1,007506 Social services ........................................................................................................................ 11,735 12,041 13,387 16,154 15,595 15,593 16,518
Total, Educ., training, employ., and social services ..................................................................... 46,732 48,665 52,760 51,643 55,615 51,985 58,044
550 Health::551 Health care services ............................................................................................................... 63,880 80,087 95,638 102,938 103,118 95,459 114,752552 Health research and training .................................................................................................. 9,877 10,703 11,161 11,613 11,887 12,434 13,392554 Consumer and occupational health and safety ..................................................................... 1,646 1,764 1,817 1,935 1,981 1,976 2,040
Total, Health ................................................................................................................................... 75,402 92,554 108,616 116,486 116,986 109,869 130,184
570 Medicare::571 Medicare .................................................................................................................................. 103,208 133,599 124,757 162,677 156,540 179,652 189,999
600 Income security::601 General retirement and disability insurance (excluding social security) ............................... 5,911 5,989 5,678 6,244 5,540 6,185 5,950602 Federal employee retirement and disability ........................................................................... 57,150 58,351 61,675 64,062 67,309 69,754 72,743603 Unemployment compensation ................................................................................................ 27,179 39,534 38,164 28,696 23,750 24,964 22,968604 Housing assistance ................................................................................................................. 19,721 19,736 21,170 21,109 15,322 16,430 11,746605 Food and nutrition assistance ................................................................................................ 29,435 33,459 39,016 39,965 40,818 40,434 41,019609 Other income security ............................................................................................................ 38,963 43,618 49,154 57,739 62,625 64,277 73,071
Total, Income security .................................................................................................................... 178,359 200,687 214,859 217,815 215,364 222,044 227,497
650 Social security::651 Social security ......................................................................................................................... 271,253 289,532 306,338 321,138 333,289 352,136 366,056
(On-budget) ................................................................................................................................ (2,722) (6,167) (6,248) (5,687) (5,481) (5,821) (6,901)(Off-budget) ................................................................................................................................ (268,532) (283,365) (300,090) (315,451) (327,808) (346,315) (359,155)
700 Veterans benefits and services::701 Income security for veterans .................................................................................................. 17,490 17,412 18,123 18,597 18,824 19,703 20,660702 Veterans education, training and rehabilitation ..................................................................... 824 600 675 1,031 1,090 1,013 1,178703 Hospital and medical care for veterans ................................................................................. 13,194 14,256 15,235 16,187 16,555 16,812 17,375704 Veterans housing .................................................................................................................... 730 815 1,181 188 612 212 –291705 Other veterans benefits and services .................................................................................... 1,013 1,020 993 1,006 1,078 1,023 1,014
Total, Veterans benefits and services ........................................................................................... 33,251 34,103 36,208 37,009 38,159 38,763 39,936
On-budget unless otherwise stated.
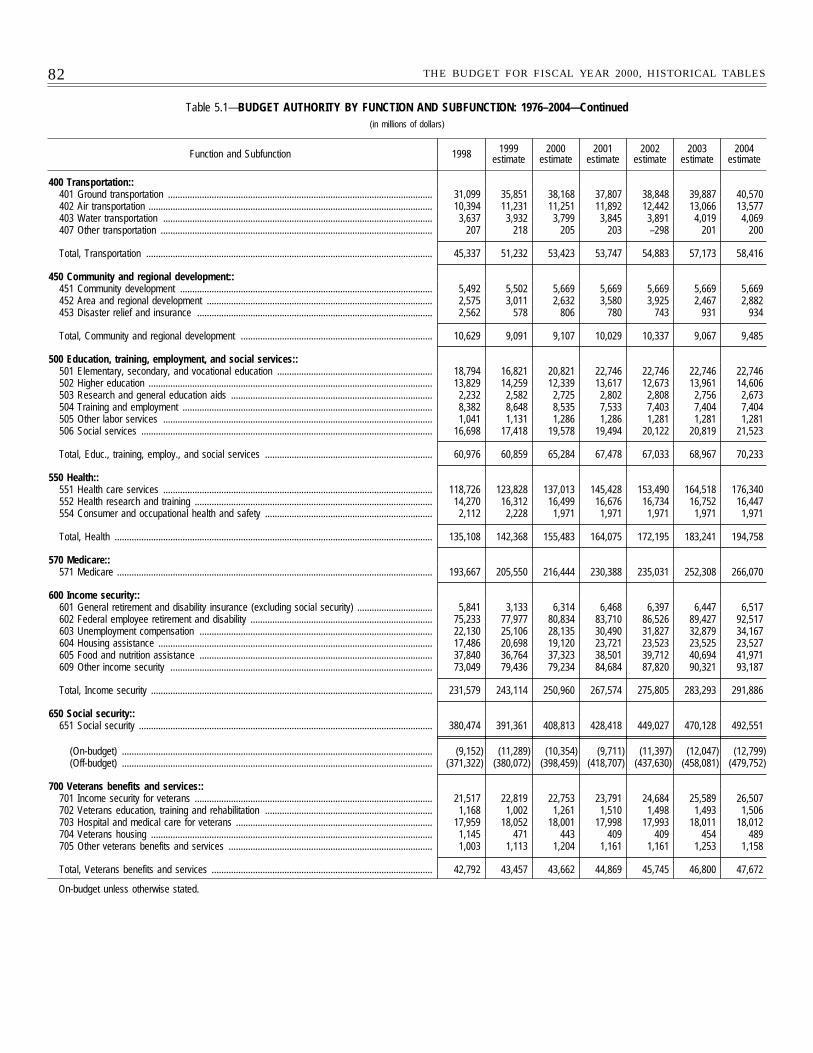
82 THE BUDGET FOR FISCAL YEAR 2000, HISTORICAL TABLES
Table 5.1—BUDGET AUTHORITY BY FUNCTION AND SUBFUNCTION: 1976–2004—Continued(in millions of dollars)
Function and Subfunction 1998 1999estimate
2000estimate
2001estimate
2002estimate
2003estimate
2004estimate
400 Transportation::401 Ground transportation ............................................................................................................. 31,099 35,851 38,168 37,807 38,848 39,887 40,570402 Air transportation ..................................................................................................................... 10,394 11,231 11,251 11,892 12,442 13,066 13,577403 Water transportation ............................................................................................................... 3,637 3,932 3,799 3,845 3,891 4,019 4,069407 Other transportation ................................................................................................................ 207 218 205 203 –298 201 200
Total, Transportation ...................................................................................................................... 45,337 51,232 53,423 53,747 54,883 57,173 58,416
450 Community and regional development::451 Community development ........................................................................................................ 5,492 5,502 5,669 5,669 5,669 5,669 5,669452 Area and regional development ............................................................................................. 2,575 3,011 2,632 3,580 3,925 2,467 2,882453 Disaster relief and insurance ................................................................................................. 2,562 578 806 780 743 931 934
Total, Community and regional development ............................................................................... 10,629 9,091 9,107 10,029 10,337 9,067 9,485
500 Education, training, employment, and social services::501 Elementary, secondary, and vocational education ................................................................ 18,794 16,821 20,821 22,746 22,746 22,746 22,746502 Higher education ..................................................................................................................... 13,829 14,259 12,339 13,617 12,673 13,961 14,606503 Research and general education aids ................................................................................... 2,232 2,582 2,725 2,802 2,808 2,756 2,673504 Training and employment ....................................................................................................... 8,382 8,648 8,535 7,533 7,403 7,404 7,404505 Other labor services ............................................................................................................... 1,041 1,131 1,286 1,286 1,281 1,281 1,281506 Social services ........................................................................................................................ 16,698 17,418 19,578 19,494 20,122 20,819 21,523
Total, Educ., training, employ., and social services ..................................................................... 60,976 60,859 65,284 67,478 67,033 68,967 70,233
550 Health::551 Health care services ............................................................................................................... 118,726 123,828 137,013 145,428 153,490 164,518 176,340552 Health research and training .................................................................................................. 14,270 16,312 16,499 16,676 16,734 16,752 16,447554 Consumer and occupational health and safety ..................................................................... 2,112 2,228 1,971 1,971 1,971 1,971 1,971
Total, Health ................................................................................................................................... 135,108 142,368 155,483 164,075 172,195 183,241 194,758
570 Medicare::571 Medicare .................................................................................................................................. 193,667 205,550 216,444 230,388 235,031 252,308 266,070
600 Income security::601 General retirement and disability insurance (excluding social security) ............................... 5,841 3,133 6,314 6,468 6,397 6,447 6,517602 Federal employee retirement and disability ........................................................................... 75,233 77,977 80,834 83,710 86,526 89,427 92,517603 Unemployment compensation ................................................................................................ 22,130 25,106 28,135 30,490 31,827 32,879 34,167604 Housing assistance ................................................................................................................. 17,486 20,698 19,120 23,721 23,523 23,525 23,527605 Food and nutrition assistance ................................................................................................ 37,840 36,764 37,323 38,501 39,712 40,694 41,971609 Other income security ............................................................................................................ 73,049 79,436 79,234 84,684 87,820 90,321 93,187
Total, Income security .................................................................................................................... 231,579 243,114 250,960 267,574 275,805 283,293 291,886
650 Social security::651 Social security ......................................................................................................................... 380,474 391,361 408,813 428,418 449,027 470,128 492,551
(On-budget) ................................................................................................................................ (9,152) (11,289) (10,354) (9,711) (11,397) (12,047) (12,799)(Off-budget) ................................................................................................................................ (371,322) (380,072) (398,459) (418,707) (437,630) (458,081) (479,752)
700 Veterans benefits and services::701 Income security for veterans .................................................................................................. 21,517 22,819 22,753 23,791 24,684 25,589 26,507702 Veterans education, training and rehabilitation ..................................................................... 1,168 1,002 1,261 1,510 1,498 1,493 1,506703 Hospital and medical care for veterans ................................................................................. 17,959 18,052 18,001 17,998 17,993 18,011 18,012704 Veterans housing .................................................................................................................... 1,145 471 443 409 409 454 489705 Other veterans benefits and services .................................................................................... 1,003 1,113 1,204 1,161 1,161 1,253 1,158
Total, Veterans benefits and services ........................................................................................... 42,792 43,457 43,662 44,869 45,745 46,800 47,672
On-budget unless otherwise stated.
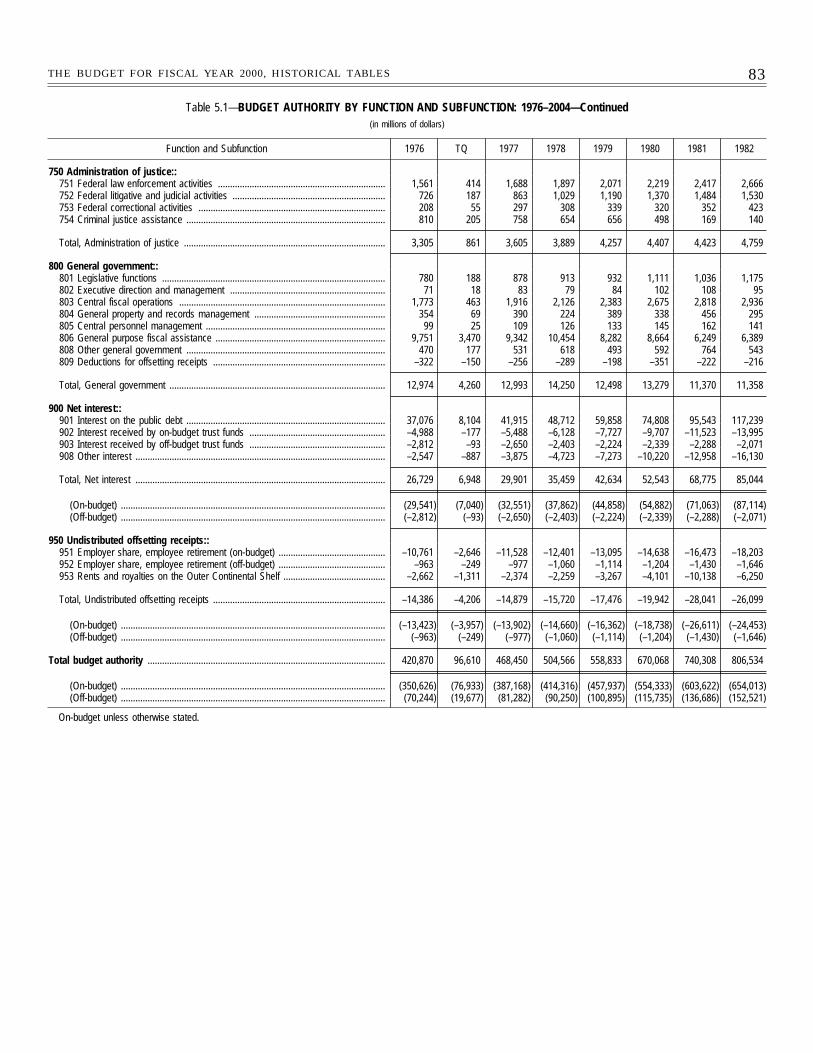
83THE BUDGET FOR FISCAL YEAR 2000, HISTORICAL TABLES
Table 5.1—BUDGET AUTHORITY BY FUNCTION AND SUBFUNCTION: 1976–2004—Continued(in millions of dollars)
Function and Subfunction 1976 TQ 1977 1978 1979 1980 1981 1982
750 Administration of justice::751 Federal law enforcement activities ..................................................................... 1,561 414 1,688 1,897 2,071 2,219 2,417 2,666752 Federal litigative and judicial activities ............................................................... 726 187 863 1,029 1,190 1,370 1,484 1,530753 Federal correctional activities ............................................................................. 208 55 297 308 339 320 352 423754 Criminal justice assistance .................................................................................. 810 205 758 654 656 498 169 140
Total, Administration of justice ................................................................................... 3,305 861 3,605 3,889 4,257 4,407 4,423 4,759
800 General government::801 Legislative functions ............................................................................................ 780 188 878 913 932 1,111 1,036 1,175802 Executive direction and management ................................................................ 71 18 83 79 84 102 108 95803 Central fiscal operations ..................................................................................... 1,773 463 1,916 2,126 2,383 2,675 2,818 2,936804 General property and records management ...................................................... 354 69 390 224 389 338 456 295805 Central personnel management .......................................................................... 99 25 109 126 133 145 162 141806 General purpose fiscal assistance ...................................................................... 9,751 3,470 9,342 10,454 8,282 8,664 6,249 6,389808 Other general government .................................................................................. 470 177 531 618 493 592 764 543809 Deductions for offsetting receipts ....................................................................... –322 –150 –256 –289 –198 –351 –222 –216
Total, General government ......................................................................................... 12,974 4,260 12,993 14,250 12,498 13,279 11,370 11,358
900 Net interest::901 Interest on the public debt .................................................................................. 37,076 8,104 41,915 48,712 59,858 74,808 95,543 117,239902 Interest received by on-budget trust funds ........................................................ –4,988 –177 –5,488 –6,128 –7,727 –9,707 –11,523 –13,995903 Interest received by off-budget trust funds ........................................................ –2,812 –93 –2,650 –2,403 –2,224 –2,339 –2,288 –2,071908 Other interest ....................................................................................................... –2,547 –887 –3,875 –4,723 –7,273 –10,220 –12,958 –16,130
Total, Net interest ....................................................................................................... 26,729 6,948 29,901 35,459 42,634 52,543 68,775 85,044
(On-budget) ............................................................................................................. (29,541) (7,040) (32,551) (37,862) (44,858) (54,882) (71,063) (87,114)(Off-budget) ............................................................................................................. (–2,812) (–93) (–2,650) (–2,403) (–2,224) (–2,339) (–2,288) (–2,071)
950 Undistributed offsetting receipts::951 Employer share, employee retirement (on-budget) ............................................ –10,761 –2,646 –11,528 –12,401 –13,095 –14,638 –16,473 –18,203952 Employer share, employee retirement (off-budget) ............................................ –963 –249 –977 –1,060 –1,114 –1,204 –1,430 –1,646953 Rents and royalties on the Outer Continental Shelf .......................................... –2,662 –1,311 –2,374 –2,259 –3,267 –4,101 –10,138 –6,250
Total, Undistributed offsetting receipts ....................................................................... –14,386 –4,206 –14,879 –15,720 –17,476 –19,942 –28,041 –26,099
(On-budget) ............................................................................................................. (–13,423) (–3,957) (–13,902) (–14,660) (–16,362) (–18,738) (–26,611) (–24,453)(Off-budget) ............................................................................................................. (–963) (–249) (–977) (–1,060) (–1,114) (–1,204) (–1,430) (–1,646)
Total budget authority .................................................................................................. 420,870 96,610 468,450 504,566 558,833 670,068 740,308 806,534
(On-budget) ............................................................................................................. (350,626) (76,933) (387,168) (414,316) (457,937) (554,333) (603,622) (654,013)(Off-budget) ............................................................................................................. (70,244) (19,677) (81,282) (90,250) (100,895) (115,735) (136,686) (152,521)
On-budget unless otherwise stated.
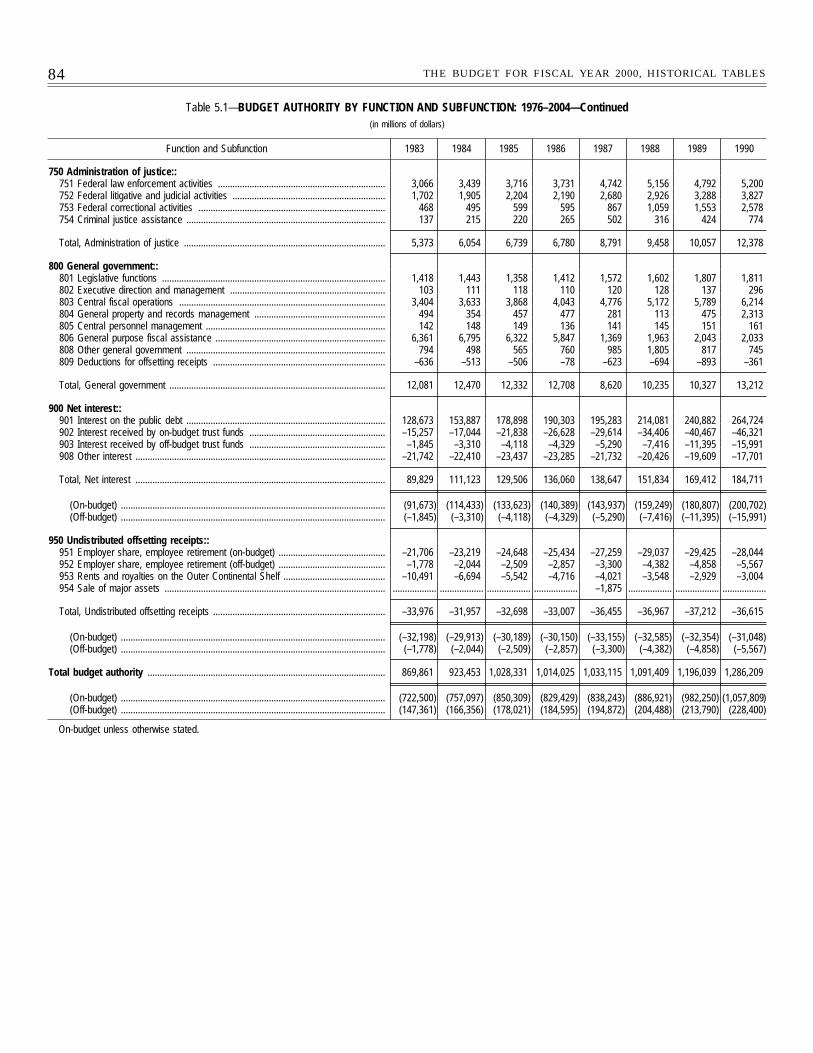
84 THE BUDGET FOR FISCAL YEAR 2000, HISTORICAL TABLES
Table 5.1—BUDGET AUTHORITY BY FUNCTION AND SUBFUNCTION: 1976–2004—Continued(in millions of dollars)
Function and Subfunction 1983 1984 1985 1986 1987 1988 1989 1990
750 Administration of justice::751 Federal law enforcement activities ..................................................................... 3,066 3,439 3,716 3,731 4,742 5,156 4,792 5,200752 Federal litigative and judicial activities ............................................................... 1,702 1,905 2,204 2,190 2,680 2,926 3,288 3,827753 Federal correctional activities ............................................................................. 468 495 599 595 867 1,059 1,553 2,578754 Criminal justice assistance .................................................................................. 137 215 220 265 502 316 424 774
Total, Administration of justice ................................................................................... 5,373 6,054 6,739 6,780 8,791 9,458 10,057 12,378
800 General government::801 Legislative functions ............................................................................................ 1,418 1,443 1,358 1,412 1,572 1,602 1,807 1,811802 Executive direction and management ................................................................ 103 111 118 110 120 128 137 296803 Central fiscal operations ..................................................................................... 3,404 3,633 3,868 4,043 4,776 5,172 5,789 6,214804 General property and records management ...................................................... 494 354 457 477 281 113 475 2,313805 Central personnel management .......................................................................... 142 148 149 136 141 145 151 161806 General purpose fiscal assistance ...................................................................... 6,361 6,795 6,322 5,847 1,369 1,963 2,043 2,033808 Other general government .................................................................................. 794 498 565 760 985 1,805 817 745809 Deductions for offsetting receipts ....................................................................... –636 –513 –506 –78 –623 –694 –893 –361
Total, General government ......................................................................................... 12,081 12,470 12,332 12,708 8,620 10,235 10,327 13,212
900 Net interest::901 Interest on the public debt .................................................................................. 128,673 153,887 178,898 190,303 195,283 214,081 240,882 264,724902 Interest received by on-budget trust funds ........................................................ –15,257 –17,044 –21,838 –26,628 –29,614 –34,406 –40,467 –46,321903 Interest received by off-budget trust funds ........................................................ –1,845 –3,310 –4,118 –4,329 –5,290 –7,416 –11,395 –15,991908 Other interest ....................................................................................................... –21,742 –22,410 –23,437 –23,285 –21,732 –20,426 –19,609 –17,701
Total, Net interest ....................................................................................................... 89,829 111,123 129,506 136,060 138,647 151,834 169,412 184,711
(On-budget) ............................................................................................................. (91,673) (114,433) (133,623) (140,389) (143,937) (159,249) (180,807) (200,702)(Off-budget) ............................................................................................................. (–1,845) (–3,310) (–4,118) (–4,329) (–5,290) (–7,416) (–11,395) (–15,991)
950 Undistributed offsetting receipts::951 Employer share, employee retirement (on-budget) ............................................ –21,706 –23,219 –24,648 –25,434 –27,259 –29,037 –29,425 –28,044952 Employer share, employee retirement (off-budget) ............................................ –1,778 –2,044 –2,509 –2,857 –3,300 –4,382 –4,858 –5,567953 Rents and royalties on the Outer Continental Shelf .......................................... –10,491 –6,694 –5,542 –4,716 –4,021 –3,548 –2,929 –3,004954 Sale of major assets ........................................................................................... .................. .................. .................. .................. –1,875 .................. .................. ..................
Total, Undistributed offsetting receipts ....................................................................... –33,976 –31,957 –32,698 –33,007 –36,455 –36,967 –37,212 –36,615
(On-budget) ............................................................................................................. (–32,198) (–29,913) (–30,189) (–30,150) (–33,155) (–32,585) (–32,354) (–31,048)(Off-budget) ............................................................................................................. (–1,778) (–2,044) (–2,509) (–2,857) (–3,300) (–4,382) (–4,858) (–5,567)
Total budget authority .................................................................................................. 869,861 923,453 1,028,331 1,014,025 1,033,115 1,091,409 1,196,039 1,286,209
(On-budget) ............................................................................................................. (722,500) (757,097) (850,309) (829,429) (838,243) (886,921) (982,250) (1,057,809)(Off-budget) ............................................................................................................. (147,361) (166,356) (178,021) (184,595) (194,872) (204,488) (213,790) (228,400)
On-budget unless otherwise stated.
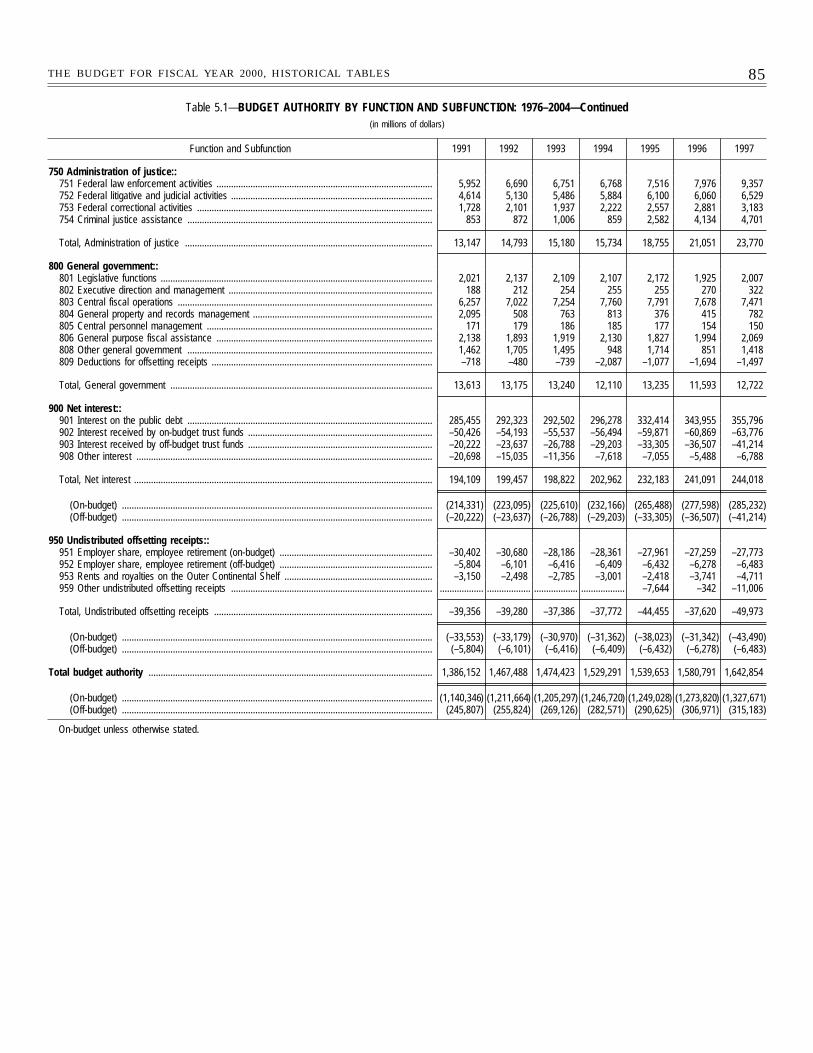
85THE BUDGET FOR FISCAL YEAR 2000, HISTORICAL TABLES
Table 5.1—BUDGET AUTHORITY BY FUNCTION AND SUBFUNCTION: 1976–2004—Continued(in millions of dollars)
Function and Subfunction 1991 1992 1993 1994 1995 1996 1997
750 Administration of justice::751 Federal law enforcement activities ......................................................................................... 5,952 6,690 6,751 6,768 7,516 7,976 9,357752 Federal litigative and judicial activities ................................................................................... 4,614 5,130 5,486 5,884 6,100 6,060 6,529753 Federal correctional activities ................................................................................................. 1,728 2,101 1,937 2,222 2,557 2,881 3,183754 Criminal justice assistance ..................................................................................................... 853 872 1,006 859 2,582 4,134 4,701
Total, Administration of justice ...................................................................................................... 13,147 14,793 15,180 15,734 18,755 21,051 23,770
800 General government::801 Legislative functions ................................................................................................................ 2,021 2,137 2,109 2,107 2,172 1,925 2,007802 Executive direction and management .................................................................................... 188 212 254 255 255 270 322803 Central fiscal operations ......................................................................................................... 6,257 7,022 7,254 7,760 7,791 7,678 7,471804 General property and records management .......................................................................... 2,095 508 763 813 376 415 782805 Central personnel management ............................................................................................. 171 179 186 185 177 154 150806 General purpose fiscal assistance ......................................................................................... 2,138 1,893 1,919 2,130 1,827 1,994 2,069808 Other general government ..................................................................................................... 1,462 1,705 1,495 948 1,714 851 1,418809 Deductions for offsetting receipts ........................................................................................... –718 –480 –739 –2,087 –1,077 –1,694 –1,497
Total, General government ............................................................................................................ 13,613 13,175 13,240 12,110 13,235 11,593 12,722
900 Net interest::901 Interest on the public debt ..................................................................................................... 285,455 292,323 292,502 296,278 332,414 343,955 355,796902 Interest received by on-budget trust funds ............................................................................ –50,426 –54,193 –55,537 –56,494 –59,871 –60,869 –63,776903 Interest received by off-budget trust funds ............................................................................ –20,222 –23,637 –26,788 –29,203 –33,305 –36,507 –41,214908 Other interest .......................................................................................................................... –20,698 –15,035 –11,356 –7,618 –7,055 –5,488 –6,788
Total, Net interest ........................................................................................................................... 194,109 199,457 198,822 202,962 232,183 241,091 244,018
(On-budget) ................................................................................................................................ (214,331) (223,095) (225,610) (232,166) (265,488) (277,598) (285,232)(Off-budget) ................................................................................................................................ (–20,222) (–23,637) (–26,788) (–29,203) (–33,305) (–36,507) (–41,214)
950 Undistributed offsetting receipts::951 Employer share, employee retirement (on-budget) ............................................................... –30,402 –30,680 –28,186 –28,361 –27,961 –27,259 –27,773952 Employer share, employee retirement (off-budget) ............................................................... –5,804 –6,101 –6,416 –6,409 –6,432 –6,278 –6,483953 Rents and royalties on the Outer Continental Shelf ............................................................. –3,150 –2,498 –2,785 –3,001 –2,418 –3,741 –4,711959 Other undistributed offsetting receipts ................................................................................... .................. .................. .................. .................. –7,644 –342 –11,006
Total, Undistributed offsetting receipts .......................................................................................... –39,356 –39,280 –37,386 –37,772 –44,455 –37,620 –49,973
(On-budget) ................................................................................................................................ (–33,553) (–33,179) (–30,970) (–31,362) (–38,023) (–31,342) (–43,490)(Off-budget) ................................................................................................................................ (–5,804) (–6,101) (–6,416) (–6,409) (–6,432) (–6,278) (–6,483)
Total budget authority ..................................................................................................................... 1,386,152 1,467,488 1,474,423 1,529,291 1,539,653 1,580,791 1,642,854
(On-budget) ................................................................................................................................ (1,140,346) (1,211,664) (1,205,297) (1,246,720) (1,249,028) (1,273,820) (1,327,671)(Off-budget) ................................................................................................................................ (245,807) (255,824) (269,126) (282,571) (290,625) (306,971) (315,183)
On-budget unless otherwise stated.
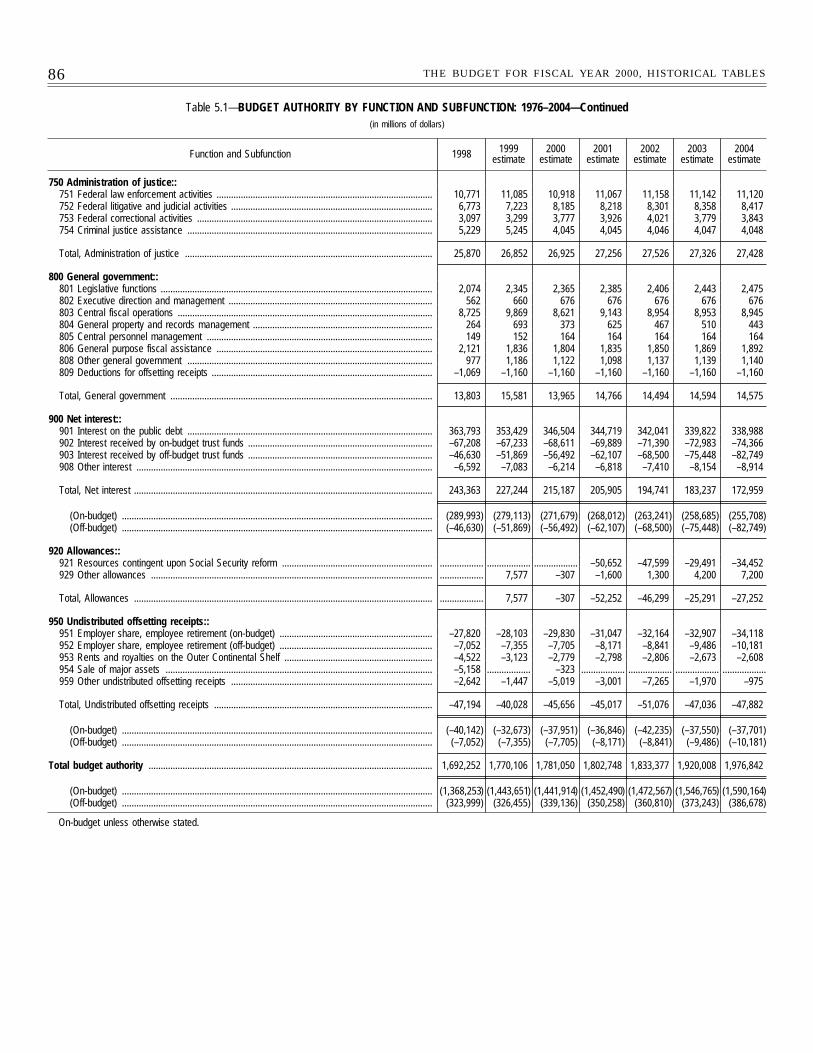
86 THE BUDGET FOR FISCAL YEAR 2000, HISTORICAL TABLES
Table 5.1—BUDGET AUTHORITY BY FUNCTION AND SUBFUNCTION: 1976–2004—Continued(in millions of dollars)
Function and Subfunction 1998 1999estimate
2000estimate
2001estimate
2002estimate
2003estimate
2004estimate
750 Administration of justice::751 Federal law enforcement activities ......................................................................................... 10,771 11,085 10,918 11,067 11,158 11,142 11,120752 Federal litigative and judicial activities ................................................................................... 6,773 7,223 8,185 8,218 8,301 8,358 8,417753 Federal correctional activities ................................................................................................. 3,097 3,299 3,777 3,926 4,021 3,779 3,843754 Criminal justice assistance ..................................................................................................... 5,229 5,245 4,045 4,045 4,046 4,047 4,048
Total, Administration of justice ...................................................................................................... 25,870 26,852 26,925 27,256 27,526 27,326 27,428
800 General government::801 Legislative functions ................................................................................................................ 2,074 2,345 2,365 2,385 2,406 2,443 2,475802 Executive direction and management .................................................................................... 562 660 676 676 676 676 676803 Central fiscal operations ......................................................................................................... 8,725 9,869 8,621 9,143 8,954 8,953 8,945804 General property and records management .......................................................................... 264 693 373 625 467 510 443805 Central personnel management ............................................................................................. 149 152 164 164 164 164 164806 General purpose fiscal assistance ......................................................................................... 2,121 1,836 1,804 1,835 1,850 1,869 1,892808 Other general government ..................................................................................................... 977 1,186 1,122 1,098 1,137 1,139 1,140809 Deductions for offsetting receipts ........................................................................................... –1,069 –1,160 –1,160 –1,160 –1,160 –1,160 –1,160
Total, General government ............................................................................................................ 13,803 15,581 13,965 14,766 14,494 14,594 14,575
900 Net interest::901 Interest on the public debt ..................................................................................................... 363,793 353,429 346,504 344,719 342,041 339,822 338,988902 Interest received by on-budget trust funds ............................................................................ –67,208 –67,233 –68,611 –69,889 –71,390 –72,983 –74,366903 Interest received by off-budget trust funds ............................................................................ –46,630 –51,869 –56,492 –62,107 –68,500 –75,448 –82,749908 Other interest .......................................................................................................................... –6,592 –7,083 –6,214 –6,818 –7,410 –8,154 –8,914
Total, Net interest ........................................................................................................................... 243,363 227,244 215,187 205,905 194,741 183,237 172,959
(On-budget) ................................................................................................................................ (289,993) (279,113) (271,679) (268,012) (263,241) (258,685) (255,708)(Off-budget) ................................................................................................................................ (–46,630) (–51,869) (–56,492) (–62,107) (–68,500) (–75,448) (–82,749)
920 Allowances::921 Resources contingent upon Social Security reform .............................................................. .................. .................. .................. –50,652 –47,599 –29,491 –34,452929 Other allowances .................................................................................................................... .................. 7,577 –307 –1,600 1,300 4,200 7,200
Total, Allowances ........................................................................................................................... .................. 7,577 –307 –52,252 –46,299 –25,291 –27,252
950 Undistributed offsetting receipts::951 Employer share, employee retirement (on-budget) ............................................................... –27,820 –28,103 –29,830 –31,047 –32,164 –32,907 –34,118952 Employer share, employee retirement (off-budget) ............................................................... –7,052 –7,355 –7,705 –8,171 –8,841 –9,486 –10,181953 Rents and royalties on the Outer Continental Shelf ............................................................. –4,522 –3,123 –2,779 –2,798 –2,806 –2,673 –2,608954 Sale of major assets .............................................................................................................. –5,158 .................. –323 .................. .................. .................. ..................959 Other undistributed offsetting receipts ................................................................................... –2,642 –1,447 –5,019 –3,001 –7,265 –1,970 –975
Total, Undistributed offsetting receipts .......................................................................................... –47,194 –40,028 –45,656 –45,017 –51,076 –47,036 –47,882
(On-budget) ................................................................................................................................ (–40,142) (–32,673) (–37,951) (–36,846) (–42,235) (–37,550) (–37,701)(Off-budget) ................................................................................................................................ (–7,052) (–7,355) (–7,705) (–8,171) (–8,841) (–9,486) (–10,181)
Total budget authority ..................................................................................................................... 1,692,252 1,770,106 1,781,050 1,802,748 1,833,377 1,920,008 1,976,842
(On-budget) ................................................................................................................................ (1,368,253) (1,443,651) (1,441,914) (1,452,490) (1,472,567) (1,546,765) (1,590,164)(Off-budget) ................................................................................................................................ (323,999) (326,455) (339,136) (350,258) (360,810) (373,243) (386,678)
On-budget unless otherwise stated.
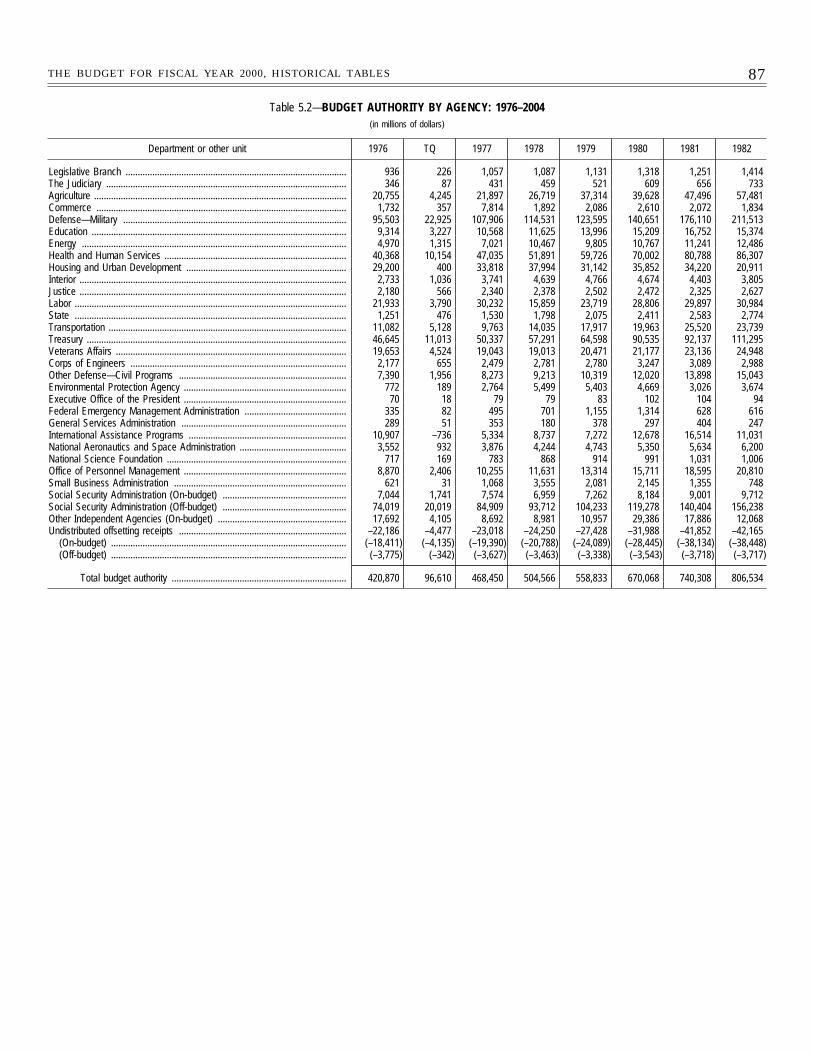
87THE BUDGET FOR FISCAL YEAR 2000, HISTORICAL TABLES
Table 5.2—BUDGET AUTHORITY BY AGENCY: 1976–2004(in millions of dollars)
Department or other unit 1976 TQ 1977 1978 1979 1980 1981 1982
Legislative Branch ........................................................................................... 936 226 1,057 1,087 1,131 1,318 1,251 1,414The Judiciary ................................................................................................... 346 87 431 459 521 609 656 733Agriculture ........................................................................................................ 20,755 4,245 21,897 26,719 37,314 39,628 47,496 57,481Commerce ....................................................................................................... 1,732 357 7,814 1,892 2,086 2,610 2,072 1,834Defense—Military ............................................................................................ 95,503 22,925 107,906 114,531 123,595 140,651 176,110 211,513Education ......................................................................................................... 9,314 3,227 10,568 11,625 13,996 15,209 16,752 15,374Energy ............................................................................................................. 4,970 1,315 7,021 10,467 9,805 10,767 11,241 12,486Health and Human Services ........................................................................... 40,368 10,154 47,035 51,891 59,726 70,002 80,788 86,307Housing and Urban Development .................................................................. 29,200 400 33,818 37,994 31,142 35,852 34,220 20,911Interior .............................................................................................................. 2,733 1,036 3,741 4,639 4,766 4,674 4,403 3,805Justice .............................................................................................................. 2,180 566 2,340 2,378 2,502 2,472 2,325 2,627Labor ................................................................................................................ 21,933 3,790 30,232 15,859 23,719 28,806 29,897 30,984State ................................................................................................................ 1,251 476 1,530 1,798 2,075 2,411 2,583 2,774Transportation .................................................................................................. 11,082 5,128 9,763 14,035 17,917 19,963 25,520 23,739Treasury ........................................................................................................... 46,645 11,013 50,337 57,291 64,598 90,535 92,137 111,295Veterans Affairs ............................................................................................... 19,653 4,524 19,043 19,013 20,471 21,177 23,136 24,948Corps of Engineers ......................................................................................... 2,177 655 2,479 2,781 2,780 3,247 3,089 2,988Other Defense—Civil Programs ..................................................................... 7,390 1,956 8,273 9,213 10,319 12,020 13,898 15,043Environmental Protection Agency ................................................................... 772 189 2,764 5,499 5,403 4,669 3,026 3,674Executive Office of the President ................................................................... 70 18 79 79 83 102 104 94Federal Emergency Management Administration .......................................... 335 82 495 701 1,155 1,314 628 616General Services Administration .................................................................... 289 51 353 180 378 297 404 247International Assistance Programs ................................................................. 10,907 –736 5,334 8,737 7,272 12,678 16,514 11,031National Aeronautics and Space Administration ............................................ 3,552 932 3,876 4,244 4,743 5,350 5,634 6,200National Science Foundation .......................................................................... 717 169 783 868 914 991 1,031 1,006Office of Personnel Management ................................................................... 8,870 2,406 10,255 11,631 13,314 15,711 18,595 20,810Small Business Administration ....................................................................... 621 31 1,068 3,555 2,081 2,145 1,355 748Social Security Administration (On-budget) ................................................... 7,044 1,741 7,574 6,959 7,262 8,184 9,001 9,712Social Security Administration (Off-budget) ................................................... 74,019 20,019 84,909 93,712 104,233 119,278 140,404 156,238Other Independent Agencies (On-budget) ..................................................... 17,692 4,105 8,692 8,981 10,957 29,386 17,886 12,068Undistributed offsetting receipts ..................................................................... –22,186 –4,477 –23,018 –24,250 –27,428 –31,988 –41,852 –42,165
(On-budget) ................................................................................................. (–18,411) (–4,135) (–19,390) (–20,788) (–24,089) (–28,445) (–38,134) (–38,448)(Off-budget) ................................................................................................. (–3,775) (–342) (–3,627) (–3,463) (–3,338) (–3,543) (–3,718) (–3,717)
Total budget authority ........................................................................ 420,870 96,610 468,450 504,566 558,833 670,068 740,308 806,534
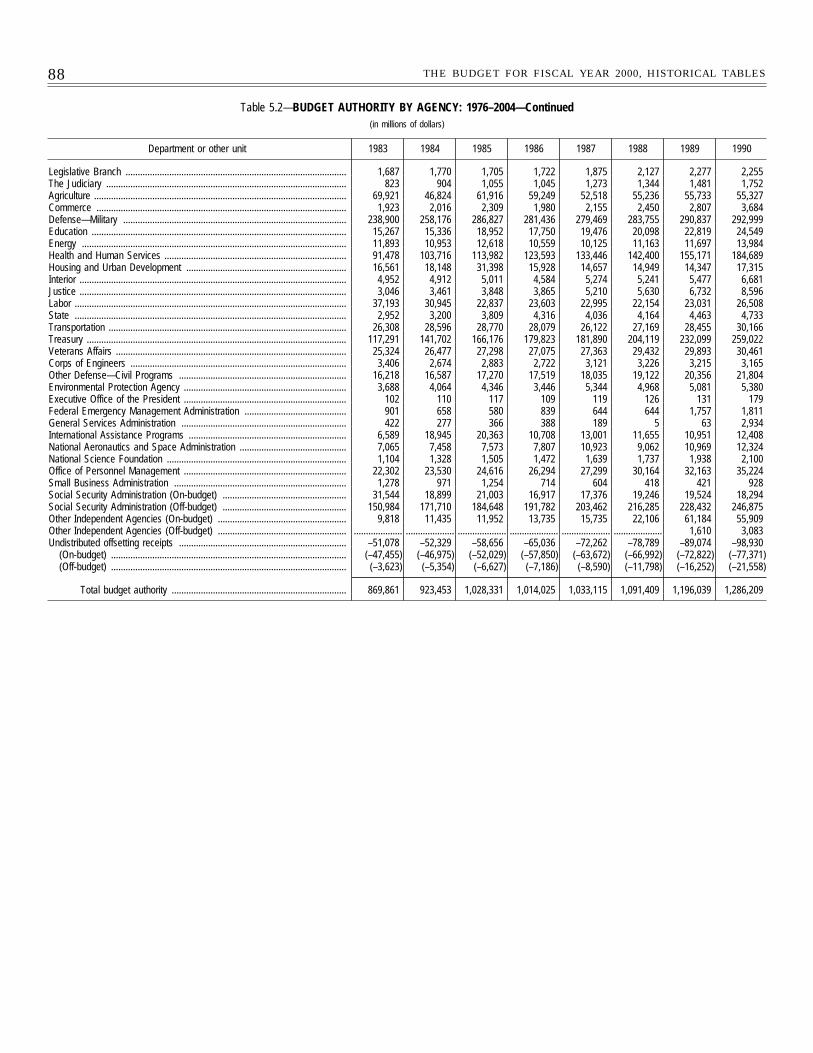
88 THE BUDGET FOR FISCAL YEAR 2000, HISTORICAL TABLES
Table 5.2—BUDGET AUTHORITY BY AGENCY: 1976–2004—Continued(in millions of dollars)
Department or other unit 1983 1984 1985 1986 1987 1988 1989 1990
Legislative Branch ........................................................................................... 1,687 1,770 1,705 1,722 1,875 2,127 2,277 2,255The Judiciary ................................................................................................... 823 904 1,055 1,045 1,273 1,344 1,481 1,752Agriculture ........................................................................................................ 69,921 46,824 61,916 59,249 52,518 55,236 55,733 55,327Commerce ....................................................................................................... 1,923 2,016 2,309 1,980 2,155 2,450 2,807 3,684Defense—Military ............................................................................................ 238,900 258,176 286,827 281,436 279,469 283,755 290,837 292,999Education ......................................................................................................... 15,267 15,336 18,952 17,750 19,476 20,098 22,819 24,549Energy ............................................................................................................. 11,893 10,953 12,618 10,559 10,125 11,163 11,697 13,984Health and Human Services ........................................................................... 91,478 103,716 113,982 123,593 133,446 142,400 155,171 184,689Housing and Urban Development .................................................................. 16,561 18,148 31,398 15,928 14,657 14,949 14,347 17,315Interior .............................................................................................................. 4,952 4,912 5,011 4,584 5,274 5,241 5,477 6,681Justice .............................................................................................................. 3,046 3,461 3,848 3,865 5,210 5,630 6,732 8,596Labor ................................................................................................................ 37,193 30,945 22,837 23,603 22,995 22,154 23,031 26,508State ................................................................................................................ 2,952 3,200 3,809 4,316 4,036 4,164 4,463 4,733Transportation .................................................................................................. 26,308 28,596 28,770 28,079 26,122 27,169 28,455 30,166Treasury ........................................................................................................... 117,291 141,702 166,176 179,823 181,890 204,119 232,099 259,022Veterans Affairs ............................................................................................... 25,324 26,477 27,298 27,075 27,363 29,432 29,893 30,461Corps of Engineers ......................................................................................... 3,406 2,674 2,883 2,722 3,121 3,226 3,215 3,165Other Defense—Civil Programs ..................................................................... 16,218 16,587 17,270 17,519 18,035 19,122 20,356 21,804Environmental Protection Agency ................................................................... 3,688 4,064 4,346 3,446 5,344 4,968 5,081 5,380Executive Office of the President ................................................................... 102 110 117 109 119 126 131 179Federal Emergency Management Administration .......................................... 901 658 580 839 644 644 1,757 1,811General Services Administration .................................................................... 422 277 366 388 189 5 63 2,934International Assistance Programs ................................................................. 6,589 18,945 20,363 10,708 13,001 11,655 10,951 12,408National Aeronautics and Space Administration ............................................ 7,065 7,458 7,573 7,807 10,923 9,062 10,969 12,324National Science Foundation .......................................................................... 1,104 1,328 1,505 1,472 1,639 1,737 1,938 2,100Office of Personnel Management ................................................................... 22,302 23,530 24,616 26,294 27,299 30,164 32,163 35,224Small Business Administration ....................................................................... 1,278 971 1,254 714 604 418 421 928Social Security Administration (On-budget) ................................................... 31,544 18,899 21,003 16,917 17,376 19,246 19,524 18,294Social Security Administration (Off-budget) ................................................... 150,984 171,710 184,648 191,782 203,462 216,285 228,432 246,875Other Independent Agencies (On-budget) ..................................................... 9,818 11,435 11,952 13,735 15,735 22,106 61,184 55,909Other Independent Agencies (Off-budget) ..................................................... .................... .................... .................... .................... .................... .................... 1,610 3,083Undistributed offsetting receipts ..................................................................... –51,078 –52,329 –58,656 –65,036 –72,262 –78,789 –89,074 –98,930
(On-budget) ................................................................................................. (–47,455) (–46,975) (–52,029) (–57,850) (–63,672) (–66,992) (–72,822) (–77,371)(Off-budget) ................................................................................................. (–3,623) (–5,354) (–6,627) (–7,186) (–8,590) (–11,798) (–16,252) (–21,558)
Total budget authority ........................................................................ 869,861 923,453 1,028,331 1,014,025 1,033,115 1,091,409 1,196,039 1,286,209
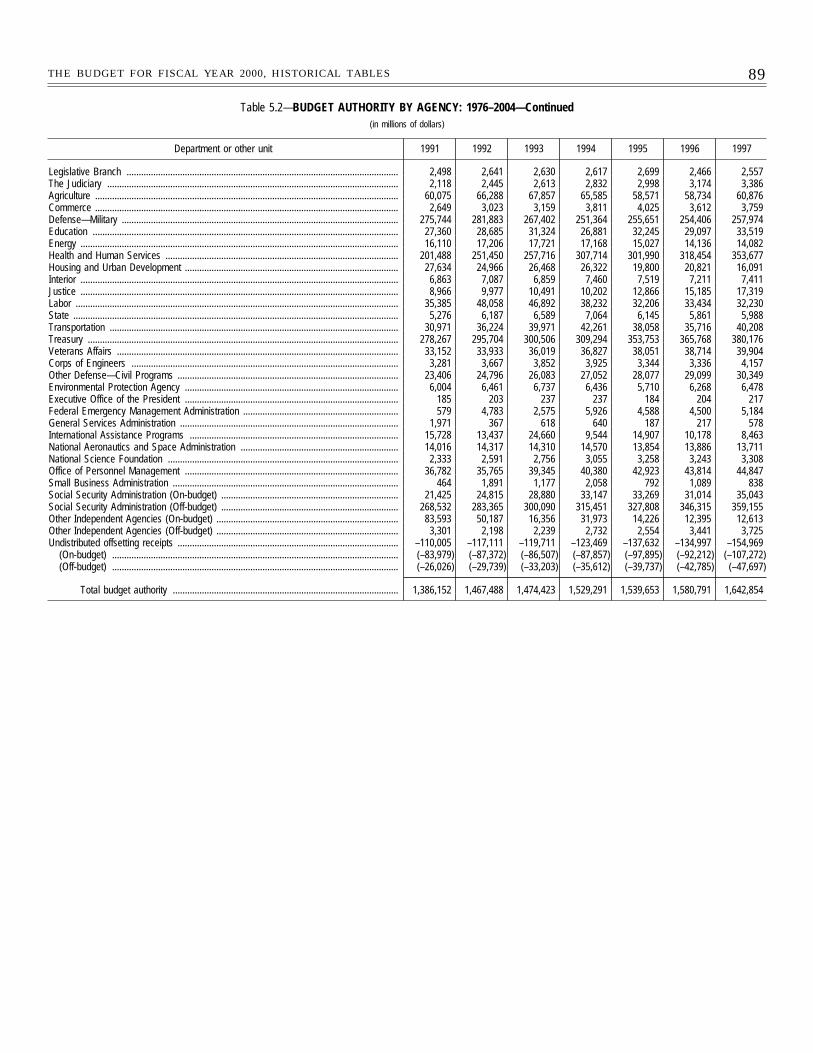
89THE BUDGET FOR FISCAL YEAR 2000, HISTORICAL TABLES
Table 5.2—BUDGET AUTHORITY BY AGENCY: 1976–2004—Continued(in millions of dollars)
Department or other unit 1991 1992 1993 1994 1995 1996 1997
Legislative Branch ................................................................................................................ 2,498 2,641 2,630 2,617 2,699 2,466 2,557The Judiciary ........................................................................................................................ 2,118 2,445 2,613 2,832 2,998 3,174 3,386Agriculture ............................................................................................................................. 60,075 66,288 67,857 65,585 58,571 58,734 60,876Commerce ............................................................................................................................. 2,649 3,023 3,159 3,811 4,025 3,612 3,759Defense—Military .................................................................................................................. 275,744 281,883 267,402 251,364 255,651 254,406 257,974Education .............................................................................................................................. 27,360 28,685 31,324 26,881 32,245 29,097 33,519Energy ................................................................................................................................... 16,110 17,206 17,721 17,168 15,027 14,136 14,082Health and Human Services ................................................................................................ 201,488 251,450 257,716 307,714 301,990 318,454 353,677Housing and Urban Development ........................................................................................ 27,634 24,966 26,468 26,322 19,800 20,821 16,091Interior ................................................................................................................................... 6,863 7,087 6,859 7,460 7,519 7,211 7,411Justice ................................................................................................................................... 8,966 9,977 10,491 10,202 12,866 15,185 17,319Labor ..................................................................................................................................... 35,385 48,058 46,892 38,232 32,206 33,434 32,230State ...................................................................................................................................... 5,276 6,187 6,589 7,064 6,145 5,861 5,988Transportation ....................................................................................................................... 30,971 36,224 39,971 42,261 38,058 35,716 40,208Treasury ................................................................................................................................ 278,267 295,704 300,506 309,294 353,753 365,768 380,176Veterans Affairs .................................................................................................................... 33,152 33,933 36,019 36,827 38,051 38,714 39,904Corps of Engineers .............................................................................................................. 3,281 3,667 3,852 3,925 3,344 3,336 4,157Other Defense—Civil Programs ........................................................................................... 23,406 24,796 26,083 27,052 28,077 29,099 30,349Environmental Protection Agency ........................................................................................ 6,004 6,461 6,737 6,436 5,710 6,268 6,478Executive Office of the President ........................................................................................ 185 203 237 237 184 204 217Federal Emergency Management Administration ................................................................ 579 4,783 2,575 5,926 4,588 4,500 5,184General Services Administration .......................................................................................... 1,971 367 618 640 187 217 578International Assistance Programs ...................................................................................... 15,728 13,437 24,660 9,544 14,907 10,178 8,463National Aeronautics and Space Administration ................................................................. 14,016 14,317 14,310 14,570 13,854 13,886 13,711National Science Foundation ............................................................................................... 2,333 2,591 2,756 3,055 3,258 3,243 3,308Office of Personnel Management ........................................................................................ 36,782 35,765 39,345 40,380 42,923 43,814 44,847Small Business Administration ............................................................................................. 464 1,891 1,177 2,058 792 1,089 838Social Security Administration (On-budget) ......................................................................... 21,425 24,815 28,880 33,147 33,269 31,014 35,043Social Security Administration (Off-budget) ......................................................................... 268,532 283,365 300,090 315,451 327,808 346,315 359,155Other Independent Agencies (On-budget) ........................................................................... 83,593 50,187 16,356 31,973 14,226 12,395 12,613Other Independent Agencies (Off-budget) ........................................................................... 3,301 2,198 2,239 2,732 2,554 3,441 3,725Undistributed offsetting receipts ........................................................................................... –110,005 –117,111 –119,711 –123,469 –137,632 –134,997 –154,969
(On-budget) ...................................................................................................................... (–83,979) (–87,372) (–86,507) (–87,857) (–97,895) (–92,212) (–107,272)(Off-budget) ...................................................................................................................... (–26,026) (–29,739) (–33,203) (–35,612) (–39,737) (–42,785) (–47,697)
Total budget authority ............................................................................................. 1,386,152 1,467,488 1,474,423 1,529,291 1,539,653 1,580,791 1,642,854
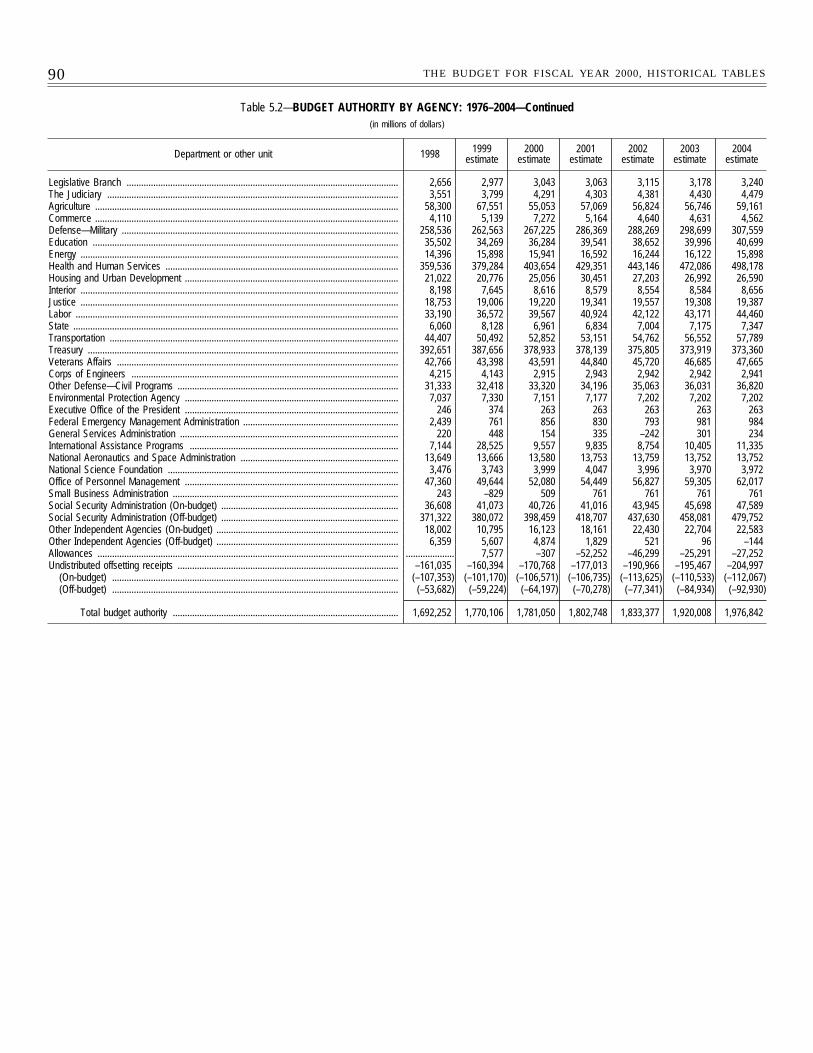
90 THE BUDGET FOR FISCAL YEAR 2000, HISTORICAL TABLES
Table 5.2—BUDGET AUTHORITY BY AGENCY: 1976–2004—Continued(in millions of dollars)
Department or other unit 1998 1999estimate
2000estimate
2001estimate
2002estimate
2003estimate
2004estimate
Legislative Branch ................................................................................................................ 2,656 2,977 3,043 3,063 3,115 3,178 3,240The Judiciary ........................................................................................................................ 3,551 3,799 4,291 4,303 4,381 4,430 4,479Agriculture ............................................................................................................................. 58,300 67,551 55,053 57,069 56,824 56,746 59,161Commerce ............................................................................................................................. 4,110 5,139 7,272 5,164 4,640 4,631 4,562Defense—Military .................................................................................................................. 258,536 262,563 267,225 286,369 288,269 298,699 307,559Education .............................................................................................................................. 35,502 34,269 36,284 39,541 38,652 39,996 40,699Energy ................................................................................................................................... 14,396 15,898 15,941 16,592 16,244 16,122 15,898Health and Human Services ................................................................................................ 359,536 379,284 403,654 429,351 443,146 472,086 498,178Housing and Urban Development ........................................................................................ 21,022 20,776 25,056 30,451 27,203 26,992 26,590Interior ................................................................................................................................... 8,198 7,645 8,616 8,579 8,554 8,584 8,656Justice ................................................................................................................................... 18,753 19,006 19,220 19,341 19,557 19,308 19,387Labor ..................................................................................................................................... 33,190 36,572 39,567 40,924 42,122 43,171 44,460State ...................................................................................................................................... 6,060 8,128 6,961 6,834 7,004 7,175 7,347Transportation ....................................................................................................................... 44,407 50,492 52,852 53,151 54,762 56,552 57,789Treasury ................................................................................................................................ 392,651 387,656 378,933 378,139 375,805 373,919 373,360Veterans Affairs .................................................................................................................... 42,766 43,398 43,591 44,840 45,720 46,685 47,665Corps of Engineers .............................................................................................................. 4,215 4,143 2,915 2,943 2,942 2,942 2,941Other Defense—Civil Programs ........................................................................................... 31,333 32,418 33,320 34,196 35,063 36,031 36,820Environmental Protection Agency ........................................................................................ 7,037 7,330 7,151 7,177 7,202 7,202 7,202Executive Office of the President ........................................................................................ 246 374 263 263 263 263 263Federal Emergency Management Administration ................................................................ 2,439 761 856 830 793 981 984General Services Administration .......................................................................................... 220 448 154 335 –242 301 234International Assistance Programs ...................................................................................... 7,144 28,525 9,557 9,835 8,754 10,405 11,335National Aeronautics and Space Administration ................................................................. 13,649 13,666 13,580 13,753 13,759 13,752 13,752National Science Foundation ............................................................................................... 3,476 3,743 3,999 4,047 3,996 3,970 3,972Office of Personnel Management ........................................................................................ 47,360 49,644 52,080 54,449 56,827 59,305 62,017Small Business Administration ............................................................................................. 243 –829 509 761 761 761 761Social Security Administration (On-budget) ......................................................................... 36,608 41,073 40,726 41,016 43,945 45,698 47,589Social Security Administration (Off-budget) ......................................................................... 371,322 380,072 398,459 418,707 437,630 458,081 479,752Other Independent Agencies (On-budget) ........................................................................... 18,002 10,795 16,123 18,161 22,430 22,704 22,583Other Independent Agencies (Off-budget) ........................................................................... 6,359 5,607 4,874 1,829 521 96 –144Allowances ............................................................................................................................ .................... 7,577 –307 –52,252 –46,299 –25,291 –27,252Undistributed offsetting receipts ........................................................................................... –161,035 –160,394 –170,768 –177,013 –190,966 –195,467 –204,997
(On-budget) ...................................................................................................................... (–107,353) (–101,170) (–106,571) (–106,735) (–113,625) (–110,533) (–112,067)(Off-budget) ...................................................................................................................... (–53,682) (–59,224) (–64,197) (–70,278) (–77,341) (–84,934) (–92,930)
Total budget authority ............................................................................................. 1,692,252 1,770,106 1,781,050 1,802,748 1,833,377 1,920,008 1,976,842

91THE BUDGET FOR FISCAL YEAR 2000, HISTORICAL TABLES
Table 5.3—PERCENTAGE DISTRIBUTION OF BUDGET AUTHORITY BY AGENCY: 1976–2004
Department or other unit 1976 TQ 1977 1978 1979 1980 1981 1982
Legislative Branch ........................................................................................... 0.2 0.2 0.2 0.2 0.2 0.2 0.2 0.2The Judiciary ................................................................................................... 0.1 0.1 0.1 0.1 0.1 0.1 0.1 0.1Agriculture ........................................................................................................ 4.9 4.4 4.7 5.3 6.7 5.9 6.4 7.1Commerce ....................................................................................................... 0.4 0.4 1.7 0.4 0.4 0.4 0.3 0.2Defense—Military ............................................................................................ 22.7 23.7 23.0 22.7 22.1 21.0 23.8 26.2Education ......................................................................................................... 2.2 3.3 2.3 2.3 2.5 2.3 2.3 1.9Energy ............................................................................................................. 1.2 1.4 1.5 2.1 1.8 1.6 1.5 1.5Health and Human Services ........................................................................... 9.6 10.5 10.0 10.3 10.7 10.4 10.9 10.7Housing and Urban Development .................................................................. 6.9 0.4 7.2 7.5 5.6 5.4 4.6 2.6Interior .............................................................................................................. 0.6 1.1 0.8 0.9 0.9 0.7 0.6 0.5Justice .............................................................................................................. 0.5 0.6 0.5 0.5 0.4 0.4 0.3 0.3Labor ................................................................................................................ 5.2 3.9 6.5 3.1 4.2 4.3 4.0 3.8State ................................................................................................................ 0.3 0.5 0.3 0.4 0.4 0.4 0.3 0.3Transportation .................................................................................................. 2.6 5.3 2.1 2.8 3.2 3.0 3.4 2.9Treasury ........................................................................................................... 11.1 11.4 10.7 11.4 11.6 13.5 12.4 13.8Veterans Affairs ............................................................................................... 4.7 4.7 4.1 3.8 3.7 3.2 3.1 3.1Corps of Engineers ......................................................................................... 0.5 0.7 0.5 0.6 0.5 0.5 0.4 0.4Other Defense—Civil Programs ..................................................................... 1.8 2.0 1.8 1.8 1.8 1.8 1.9 1.9Environmental Protection Agency ................................................................... 0.2 0.2 0.6 1.1 1.0 0.7 0.4 0.5Executive Office of the President ................................................................... * * * * * * * *Federal Emergency Management Administration .......................................... 0.1 0.1 0.1 0.1 0.2 0.2 0.1 0.1General Services Administration .................................................................... 0.1 0.1 0.1 * 0.1 * 0.1 *International Assistance Programs ................................................................. 2.6 –0.8 1.1 1.7 1.3 1.9 2.2 1.4National Aeronautics and Space Administration ............................................ 0.8 1.0 0.8 0.8 0.8 0.8 0.8 0.8National Science Foundation .......................................................................... 0.2 0.2 0.2 0.2 0.2 0.1 0.1 0.1Office of Personnel Management ................................................................... 2.1 2.5 2.2 2.3 2.4 2.3 2.5 2.6Small Business Administration ....................................................................... 0.1 * 0.2 0.7 0.4 0.3 0.2 0.1Social Security Administration (On-budget) ................................................... 1.7 1.8 1.6 1.4 1.3 1.2 1.2 1.2Social Security Administration (Off-budget) ................................................... 17.6 20.7 18.1 18.6 18.7 17.8 19.0 19.4Other Independent Agencies (On-budget) ..................................................... 4.2 4.2 1.9 1.8 2.0 4.4 2.4 1.5Undistributed offsetting receipts ..................................................................... –5.3 –4.6 –4.9 –4.8 –4.9 –4.8 –5.7 –5.2
(On-budget) ................................................................................................. (–4.4) (–4.3) (–4.1) (–4.1) (–4.3) (–4.2) (–5.2) (–4.8)(Off-budget) ................................................................................................. (–0.9) (–0.4) (–0.8) (–0.7) (–0.6) (–0.5) (–0.5) (–0.5)
Total budget authority ........................................................................ 100.0 100.0 100.0 100.0 100.0 100.0 100.0 100.0
* 0.05 percent or less.
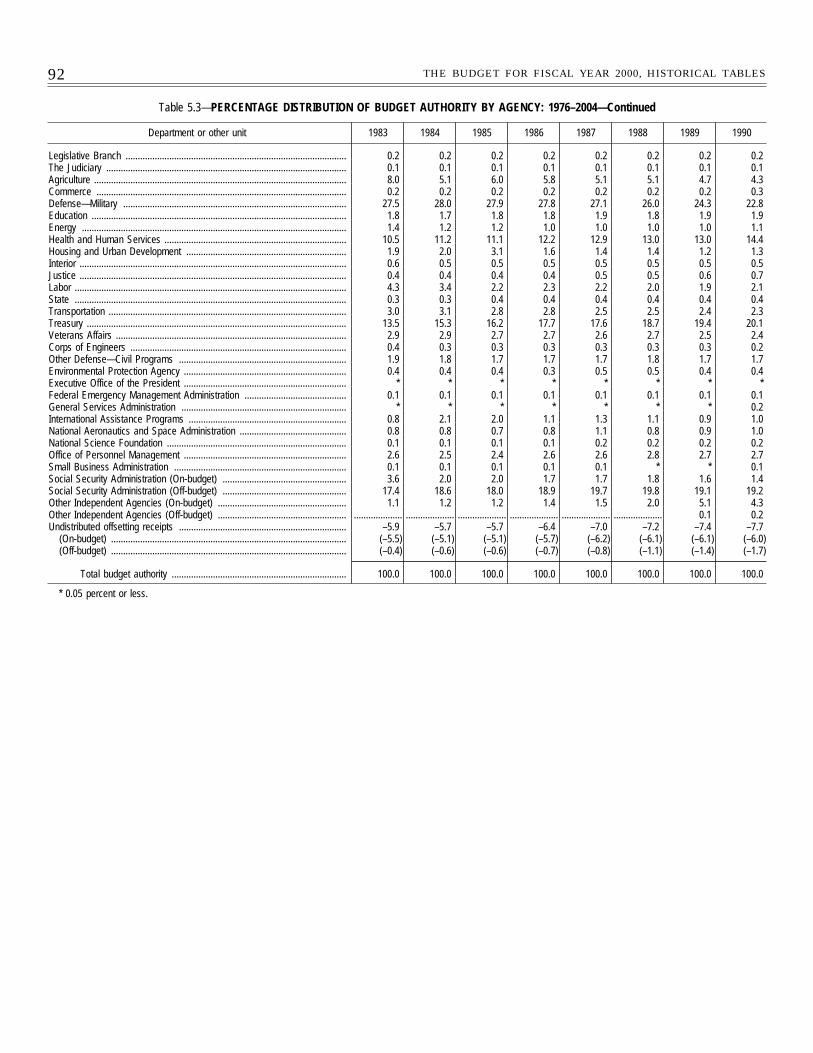
92 THE BUDGET FOR FISCAL YEAR 2000, HISTORICAL TABLES
Table 5.3—PERCENTAGE DISTRIBUTION OF BUDGET AUTHORITY BY AGENCY: 1976–2004—Continued
Department or other unit 1983 1984 1985 1986 1987 1988 1989 1990
Legislative Branch ........................................................................................... 0.2 0.2 0.2 0.2 0.2 0.2 0.2 0.2The Judiciary ................................................................................................... 0.1 0.1 0.1 0.1 0.1 0.1 0.1 0.1Agriculture ........................................................................................................ 8.0 5.1 6.0 5.8 5.1 5.1 4.7 4.3Commerce ....................................................................................................... 0.2 0.2 0.2 0.2 0.2 0.2 0.2 0.3Defense—Military ............................................................................................ 27.5 28.0 27.9 27.8 27.1 26.0 24.3 22.8Education ......................................................................................................... 1.8 1.7 1.8 1.8 1.9 1.8 1.9 1.9Energy ............................................................................................................. 1.4 1.2 1.2 1.0 1.0 1.0 1.0 1.1Health and Human Services ........................................................................... 10.5 11.2 11.1 12.2 12.9 13.0 13.0 14.4Housing and Urban Development .................................................................. 1.9 2.0 3.1 1.6 1.4 1.4 1.2 1.3Interior .............................................................................................................. 0.6 0.5 0.5 0.5 0.5 0.5 0.5 0.5Justice .............................................................................................................. 0.4 0.4 0.4 0.4 0.5 0.5 0.6 0.7Labor ................................................................................................................ 4.3 3.4 2.2 2.3 2.2 2.0 1.9 2.1State ................................................................................................................ 0.3 0.3 0.4 0.4 0.4 0.4 0.4 0.4Transportation .................................................................................................. 3.0 3.1 2.8 2.8 2.5 2.5 2.4 2.3Treasury ........................................................................................................... 13.5 15.3 16.2 17.7 17.6 18.7 19.4 20.1Veterans Affairs ............................................................................................... 2.9 2.9 2.7 2.7 2.6 2.7 2.5 2.4Corps of Engineers ......................................................................................... 0.4 0.3 0.3 0.3 0.3 0.3 0.3 0.2Other Defense—Civil Programs ..................................................................... 1.9 1.8 1.7 1.7 1.7 1.8 1.7 1.7Environmental Protection Agency ................................................................... 0.4 0.4 0.4 0.3 0.5 0.5 0.4 0.4Executive Office of the President ................................................................... * * * * * * * *Federal Emergency Management Administration .......................................... 0.1 0.1 0.1 0.1 0.1 0.1 0.1 0.1General Services Administration .................................................................... * * * * * * * 0.2International Assistance Programs ................................................................. 0.8 2.1 2.0 1.1 1.3 1.1 0.9 1.0National Aeronautics and Space Administration ............................................ 0.8 0.8 0.7 0.8 1.1 0.8 0.9 1.0National Science Foundation .......................................................................... 0.1 0.1 0.1 0.1 0.2 0.2 0.2 0.2Office of Personnel Management ................................................................... 2.6 2.5 2.4 2.6 2.6 2.8 2.7 2.7Small Business Administration ....................................................................... 0.1 0.1 0.1 0.1 0.1 * * 0.1Social Security Administration (On-budget) ................................................... 3.6 2.0 2.0 1.7 1.7 1.8 1.6 1.4Social Security Administration (Off-budget) ................................................... 17.4 18.6 18.0 18.9 19.7 19.8 19.1 19.2Other Independent Agencies (On-budget) ..................................................... 1.1 1.2 1.2 1.4 1.5 2.0 5.1 4.3Other Independent Agencies (Off-budget) ..................................................... .................... .................... .................... .................... .................... .................... 0.1 0.2Undistributed offsetting receipts ..................................................................... –5.9 –5.7 –5.7 –6.4 –7.0 –7.2 –7.4 –7.7
(On-budget) ................................................................................................. (–5.5) (–5.1) (–5.1) (–5.7) (–6.2) (–6.1) (–6.1) (–6.0)(Off-budget) ................................................................................................. (–0.4) (–0.6) (–0.6) (–0.7) (–0.8) (–1.1) (–1.4) (–1.7)
Total budget authority ........................................................................ 100.0 100.0 100.0 100.0 100.0 100.0 100.0 100.0
* 0.05 percent or less.

93THE BUDGET FOR FISCAL YEAR 2000, HISTORICAL TABLES
Table 5.3—PERCENTAGE DISTRIBUTION OF BUDGET AUTHORITY BY AGENCY: 1976–2004—Continued
Department or other unit 1991 1992 1993 1994 1995 1996 1997
Legislative Branch ................................................................................................................ 0.2 0.2 0.2 0.2 0.2 0.2 0.2The Judiciary ........................................................................................................................ 0.2 0.2 0.2 0.2 0.2 0.2 0.2Agriculture ............................................................................................................................. 4.3 4.5 4.6 4.3 3.8 3.7 3.7Commerce ............................................................................................................................. 0.2 0.2 0.2 0.2 0.3 0.2 0.2Defense—Military .................................................................................................................. 19.9 19.2 18.1 16.4 16.6 16.1 15.7Education .............................................................................................................................. 2.0 2.0 2.1 1.8 2.1 1.8 2.0Energy ................................................................................................................................... 1.2 1.2 1.2 1.1 1.0 0.9 0.9Health and Human Services ................................................................................................ 14.5 17.1 17.5 20.1 19.6 20.1 21.5Housing and Urban Development ........................................................................................ 2.0 1.7 1.8 1.7 1.3 1.3 1.0Interior ................................................................................................................................... 0.5 0.5 0.5 0.5 0.5 0.5 0.5Justice ................................................................................................................................... 0.6 0.7 0.7 0.7 0.8 1.0 1.1Labor ..................................................................................................................................... 2.6 3.3 3.2 2.5 2.1 2.1 2.0State ...................................................................................................................................... 0.4 0.4 0.4 0.5 0.4 0.4 0.4Transportation ....................................................................................................................... 2.2 2.5 2.7 2.8 2.5 2.3 2.4Treasury ................................................................................................................................ 20.1 20.2 20.4 20.2 23.0 23.1 23.1Veterans Affairs .................................................................................................................... 2.4 2.3 2.4 2.4 2.5 2.4 2.4Corps of Engineers .............................................................................................................. 0.2 0.2 0.3 0.3 0.2 0.2 0.3Other Defense—Civil Programs ........................................................................................... 1.7 1.7 1.8 1.8 1.8 1.8 1.8Environmental Protection Agency ........................................................................................ 0.4 0.4 0.5 0.4 0.4 0.4 0.4Executive Office of the President ........................................................................................ * * * * * * *Federal Emergency Management Administration ................................................................ * 0.3 0.2 0.4 0.3 0.3 0.3General Services Administration .......................................................................................... 0.1 * * * * * *International Assistance Programs ...................................................................................... 1.1 0.9 1.7 0.6 1.0 0.6 0.5National Aeronautics and Space Administration ................................................................. 1.0 1.0 1.0 1.0 0.9 0.9 0.8National Science Foundation ............................................................................................... 0.2 0.2 0.2 0.2 0.2 0.2 0.2Office of Personnel Management ........................................................................................ 2.7 2.4 2.7 2.6 2.8 2.8 2.7Small Business Administration ............................................................................................. * 0.1 0.1 0.1 0.1 0.1 0.1Social Security Administration (On-budget) ......................................................................... 1.5 1.7 2.0 2.2 2.2 2.0 2.1Social Security Administration (Off-budget) ......................................................................... 19.4 19.3 20.4 20.6 21.3 21.9 21.9Other Independent Agencies (On-budget) ........................................................................... 6.0 3.4 1.1 2.1 0.9 0.8 0.8Other Independent Agencies (Off-budget) ........................................................................... 0.2 0.1 0.2 0.2 0.2 0.2 0.2Undistributed offsetting receipts ........................................................................................... –7.9 –8.0 –8.1 –8.1 –8.9 –8.5 –9.4
(On-budget) ...................................................................................................................... (–6.1) (–6.0) (–5.9) (–5.7) (–6.4) (–5.8) (–6.5)(Off-budget) ...................................................................................................................... (–1.9) (–2.0) (–2.3) (–2.3) (–2.6) (–2.7) (–2.9)
Total budget authority ............................................................................................. 100.0 100.0 100.0 100.0 100.0 100.0 100.0
* 0.05 percent or less.
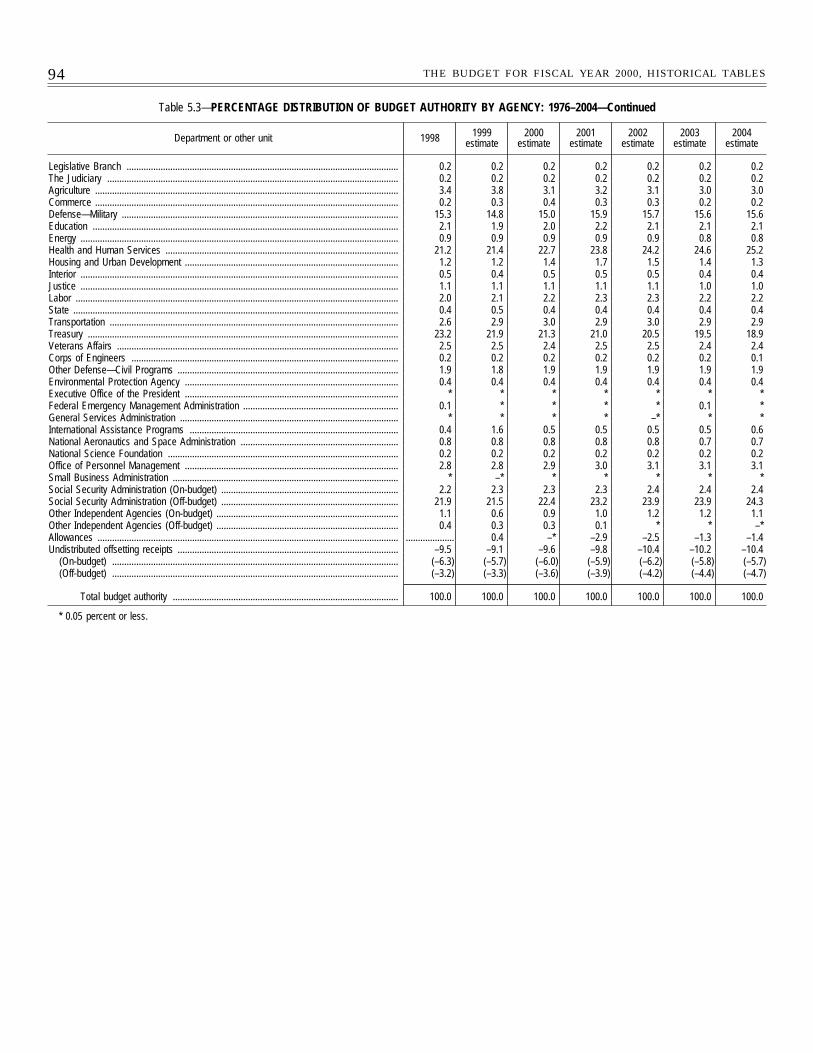
94 THE BUDGET FOR FISCAL YEAR 2000, HISTORICAL TABLES
Table 5.3—PERCENTAGE DISTRIBUTION OF BUDGET AUTHORITY BY AGENCY: 1976–2004—Continued
Department or other unit 1998 1999estimate
2000estimate
2001estimate
2002estimate
2003estimate
2004estimate
Legislative Branch ................................................................................................................ 0.2 0.2 0.2 0.2 0.2 0.2 0.2The Judiciary ........................................................................................................................ 0.2 0.2 0.2 0.2 0.2 0.2 0.2Agriculture ............................................................................................................................. 3.4 3.8 3.1 3.2 3.1 3.0 3.0Commerce ............................................................................................................................. 0.2 0.3 0.4 0.3 0.3 0.2 0.2Defense—Military .................................................................................................................. 15.3 14.8 15.0 15.9 15.7 15.6 15.6Education .............................................................................................................................. 2.1 1.9 2.0 2.2 2.1 2.1 2.1Energy ................................................................................................................................... 0.9 0.9 0.9 0.9 0.9 0.8 0.8Health and Human Services ................................................................................................ 21.2 21.4 22.7 23.8 24.2 24.6 25.2Housing and Urban Development ........................................................................................ 1.2 1.2 1.4 1.7 1.5 1.4 1.3Interior ................................................................................................................................... 0.5 0.4 0.5 0.5 0.5 0.4 0.4Justice ................................................................................................................................... 1.1 1.1 1.1 1.1 1.1 1.0 1.0Labor ..................................................................................................................................... 2.0 2.1 2.2 2.3 2.3 2.2 2.2State ...................................................................................................................................... 0.4 0.5 0.4 0.4 0.4 0.4 0.4Transportation ....................................................................................................................... 2.6 2.9 3.0 2.9 3.0 2.9 2.9Treasury ................................................................................................................................ 23.2 21.9 21.3 21.0 20.5 19.5 18.9Veterans Affairs .................................................................................................................... 2.5 2.5 2.4 2.5 2.5 2.4 2.4Corps of Engineers .............................................................................................................. 0.2 0.2 0.2 0.2 0.2 0.2 0.1Other Defense—Civil Programs ........................................................................................... 1.9 1.8 1.9 1.9 1.9 1.9 1.9Environmental Protection Agency ........................................................................................ 0.4 0.4 0.4 0.4 0.4 0.4 0.4Executive Office of the President ........................................................................................ * * * * * * *Federal Emergency Management Administration ................................................................ 0.1 * * * * 0.1 *General Services Administration .......................................................................................... * * * * –* * *International Assistance Programs ...................................................................................... 0.4 1.6 0.5 0.5 0.5 0.5 0.6National Aeronautics and Space Administration ................................................................. 0.8 0.8 0.8 0.8 0.8 0.7 0.7National Science Foundation ............................................................................................... 0.2 0.2 0.2 0.2 0.2 0.2 0.2Office of Personnel Management ........................................................................................ 2.8 2.8 2.9 3.0 3.1 3.1 3.1Small Business Administration ............................................................................................. * –* * * * * *Social Security Administration (On-budget) ......................................................................... 2.2 2.3 2.3 2.3 2.4 2.4 2.4Social Security Administration (Off-budget) ......................................................................... 21.9 21.5 22.4 23.2 23.9 23.9 24.3Other Independent Agencies (On-budget) ........................................................................... 1.1 0.6 0.9 1.0 1.2 1.2 1.1Other Independent Agencies (Off-budget) ........................................................................... 0.4 0.3 0.3 0.1 * * –*Allowances ............................................................................................................................ .................... 0.4 –* –2.9 –2.5 –1.3 –1.4Undistributed offsetting receipts ........................................................................................... –9.5 –9.1 –9.6 –9.8 –10.4 –10.2 –10.4
(On-budget) ...................................................................................................................... (–6.3) (–5.7) (–6.0) (–5.9) (–6.2) (–5.8) (–5.7)(Off-budget) ...................................................................................................................... (–3.2) (–3.3) (–3.6) (–3.9) (–4.2) (–4.4) (–4.7)
Total budget authority ............................................................................................. 100.0 100.0 100.0 100.0 100.0 100.0 100.0
* 0.05 percent or less.
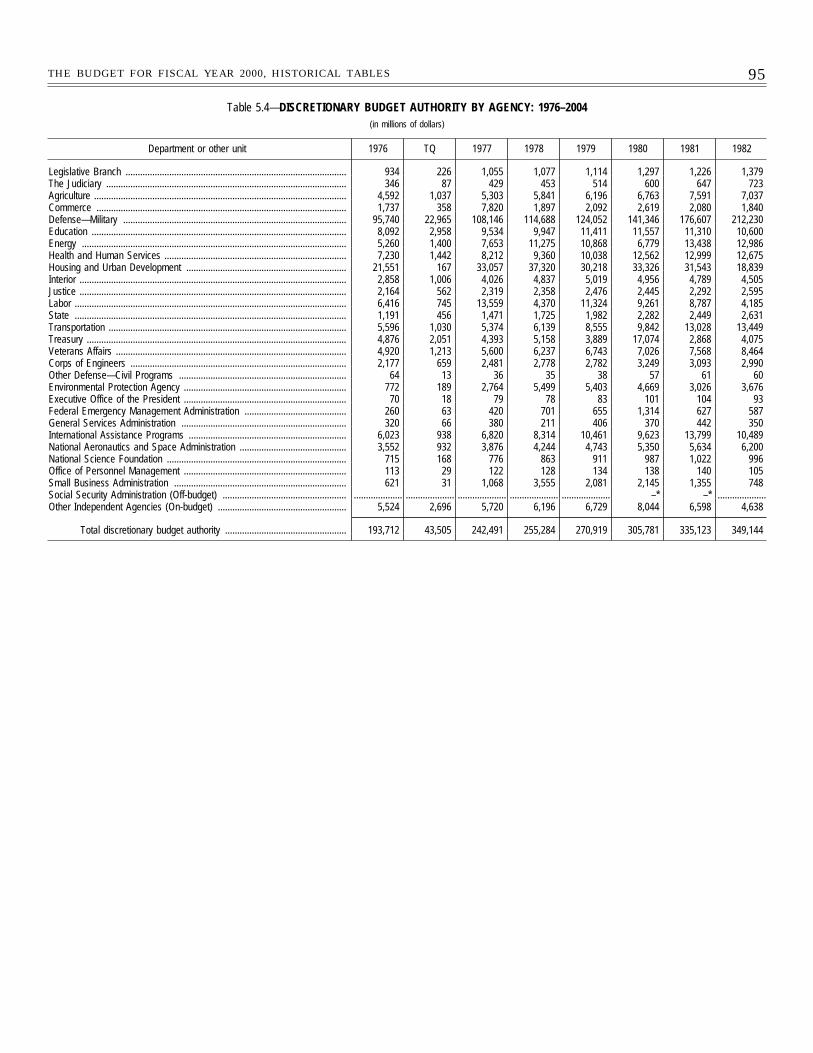
95THE BUDGET FOR FISCAL YEAR 2000, HISTORICAL TABLES
Table 5.4—DISCRETIONARY BUDGET AUTHORITY BY AGENCY: 1976–2004(in millions of dollars)
Department or other unit 1976 TQ 1977 1978 1979 1980 1981 1982
Legislative Branch ........................................................................................... 934 226 1,055 1,077 1,114 1,297 1,226 1,379The Judiciary ................................................................................................... 346 87 429 453 514 600 647 723Agriculture ........................................................................................................ 4,592 1,037 5,303 5,841 6,196 6,763 7,591 7,037Commerce ....................................................................................................... 1,737 358 7,820 1,897 2,092 2,619 2,080 1,840Defense—Military ............................................................................................ 95,740 22,965 108,146 114,688 124,052 141,346 176,607 212,230Education ......................................................................................................... 8,092 2,958 9,534 9,947 11,411 11,557 11,310 10,600Energy ............................................................................................................. 5,260 1,400 7,653 11,275 10,868 6,779 13,438 12,986Health and Human Services ........................................................................... 7,230 1,442 8,212 9,360 10,038 12,562 12,999 12,675Housing and Urban Development .................................................................. 21,551 167 33,057 37,320 30,218 33,326 31,543 18,839Interior .............................................................................................................. 2,858 1,006 4,026 4,837 5,019 4,956 4,789 4,505Justice .............................................................................................................. 2,164 562 2,319 2,358 2,476 2,445 2,292 2,595Labor ................................................................................................................ 6,416 745 13,559 4,370 11,324 9,261 8,787 4,185State ................................................................................................................ 1,191 456 1,471 1,725 1,982 2,282 2,449 2,631Transportation .................................................................................................. 5,596 1,030 5,374 6,139 8,555 9,842 13,028 13,449Treasury ........................................................................................................... 4,876 2,051 4,393 5,158 3,889 17,074 2,868 4,075Veterans Affairs ............................................................................................... 4,920 1,213 5,600 6,237 6,743 7,026 7,568 8,464Corps of Engineers ......................................................................................... 2,177 659 2,481 2,778 2,782 3,249 3,093 2,990Other Defense—Civil Programs ..................................................................... 64 13 36 35 38 57 61 60Environmental Protection Agency ................................................................... 772 189 2,764 5,499 5,403 4,669 3,026 3,676Executive Office of the President ................................................................... 70 18 79 78 83 101 104 93Federal Emergency Management Administration .......................................... 260 63 420 701 655 1,314 627 587General Services Administration .................................................................... 320 66 380 211 406 370 442 350International Assistance Programs ................................................................. 6,023 938 6,820 8,314 10,461 9,623 13,799 10,489National Aeronautics and Space Administration ............................................ 3,552 932 3,876 4,244 4,743 5,350 5,634 6,200National Science Foundation .......................................................................... 715 168 776 863 911 987 1,022 996Office of Personnel Management ................................................................... 113 29 122 128 134 138 140 105Small Business Administration ....................................................................... 621 31 1,068 3,555 2,081 2,145 1,355 748Social Security Administration (Off-budget) ................................................... .................... .................... .................... .................... .................... –* –* ....................Other Independent Agencies (On-budget) ..................................................... 5,524 2,696 5,720 6,196 6,729 8,044 6,598 4,638
Total discretionary budget authority .................................................. 193,712 43,505 242,491 255,284 270,919 305,781 335,123 349,144
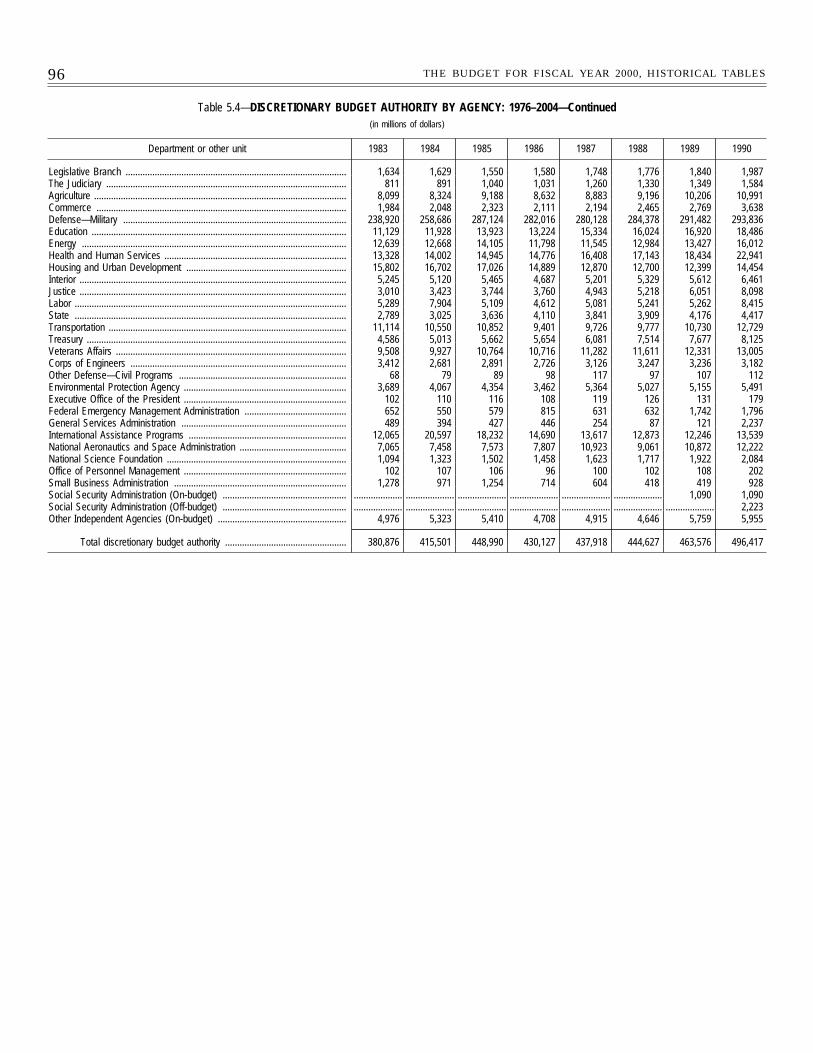
96 THE BUDGET FOR FISCAL YEAR 2000, HISTORICAL TABLES
Table 5.4—DISCRETIONARY BUDGET AUTHORITY BY AGENCY: 1976–2004—Continued(in millions of dollars)
Department or other unit 1983 1984 1985 1986 1987 1988 1989 1990
Legislative Branch ........................................................................................... 1,634 1,629 1,550 1,580 1,748 1,776 1,840 1,987The Judiciary ................................................................................................... 811 891 1,040 1,031 1,260 1,330 1,349 1,584Agriculture ........................................................................................................ 8,099 8,324 9,188 8,632 8,883 9,196 10,206 10,991Commerce ....................................................................................................... 1,984 2,048 2,323 2,111 2,194 2,465 2,769 3,638Defense—Military ............................................................................................ 238,920 258,686 287,124 282,016 280,128 284,378 291,482 293,836Education ......................................................................................................... 11,129 11,928 13,923 13,224 15,334 16,024 16,920 18,486Energy ............................................................................................................. 12,639 12,668 14,105 11,798 11,545 12,984 13,427 16,012Health and Human Services ........................................................................... 13,328 14,002 14,945 14,776 16,408 17,143 18,434 22,941Housing and Urban Development .................................................................. 15,802 16,702 17,026 14,889 12,870 12,700 12,399 14,454Interior .............................................................................................................. 5,245 5,120 5,465 4,687 5,201 5,329 5,612 6,461Justice .............................................................................................................. 3,010 3,423 3,744 3,760 4,943 5,218 6,051 8,098Labor ................................................................................................................ 5,289 7,904 5,109 4,612 5,081 5,241 5,262 8,415State ................................................................................................................ 2,789 3,025 3,636 4,110 3,841 3,909 4,176 4,417Transportation .................................................................................................. 11,114 10,550 10,852 9,401 9,726 9,777 10,730 12,729Treasury ........................................................................................................... 4,586 5,013 5,662 5,654 6,081 7,514 7,677 8,125Veterans Affairs ............................................................................................... 9,508 9,927 10,764 10,716 11,282 11,611 12,331 13,005Corps of Engineers ......................................................................................... 3,412 2,681 2,891 2,726 3,126 3,247 3,236 3,182Other Defense—Civil Programs ..................................................................... 68 79 89 98 117 97 107 112Environmental Protection Agency ................................................................... 3,689 4,067 4,354 3,462 5,364 5,027 5,155 5,491Executive Office of the President ................................................................... 102 110 116 108 119 126 131 179Federal Emergency Management Administration .......................................... 652 550 579 815 631 632 1,742 1,796General Services Administration .................................................................... 489 394 427 446 254 87 121 2,237International Assistance Programs ................................................................. 12,065 20,597 18,232 14,690 13,617 12,873 12,246 13,539National Aeronautics and Space Administration ............................................ 7,065 7,458 7,573 7,807 10,923 9,061 10,872 12,222National Science Foundation .......................................................................... 1,094 1,323 1,502 1,458 1,623 1,717 1,922 2,084Office of Personnel Management ................................................................... 102 107 106 96 100 102 108 202Small Business Administration ....................................................................... 1,278 971 1,254 714 604 418 419 928Social Security Administration (On-budget) ................................................... .................... .................... .................... .................... .................... .................... 1,090 1,090Social Security Administration (Off-budget) ................................................... .................... .................... .................... .................... .................... .................... .................... 2,223Other Independent Agencies (On-budget) ..................................................... 4,976 5,323 5,410 4,708 4,915 4,646 5,759 5,955
Total discretionary budget authority .................................................. 380,876 415,501 448,990 430,127 437,918 444,627 463,576 496,417
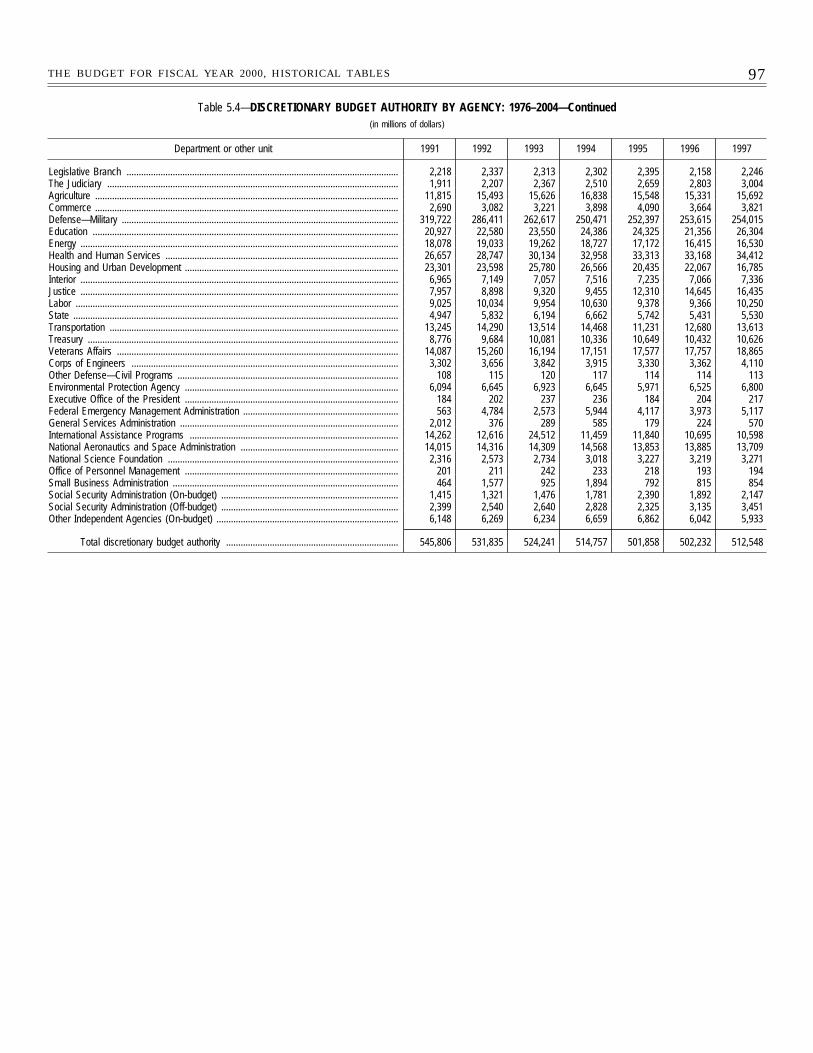
97THE BUDGET FOR FISCAL YEAR 2000, HISTORICAL TABLES
Table 5.4—DISCRETIONARY BUDGET AUTHORITY BY AGENCY: 1976–2004—Continued(in millions of dollars)
Department or other unit 1991 1992 1993 1994 1995 1996 1997
Legislative Branch ................................................................................................................ 2,218 2,337 2,313 2,302 2,395 2,158 2,246The Judiciary ........................................................................................................................ 1,911 2,207 2,367 2,510 2,659 2,803 3,004Agriculture ............................................................................................................................. 11,815 15,493 15,626 16,838 15,548 15,331 15,692Commerce ............................................................................................................................. 2,690 3,082 3,221 3,898 4,090 3,664 3,821Defense—Military .................................................................................................................. 319,722 286,411 262,617 250,471 252,397 253,615 254,015Education .............................................................................................................................. 20,927 22,580 23,550 24,386 24,325 21,356 26,304Energy ................................................................................................................................... 18,078 19,033 19,262 18,727 17,172 16,415 16,530Health and Human Services ................................................................................................ 26,657 28,747 30,134 32,958 33,313 33,168 34,412Housing and Urban Development ........................................................................................ 23,301 23,598 25,780 26,566 20,435 22,067 16,785Interior ................................................................................................................................... 6,965 7,149 7,057 7,516 7,235 7,066 7,336Justice ................................................................................................................................... 7,957 8,898 9,320 9,455 12,310 14,645 16,435Labor ..................................................................................................................................... 9,025 10,034 9,954 10,630 9,378 9,366 10,250State ...................................................................................................................................... 4,947 5,832 6,194 6,662 5,742 5,431 5,530Transportation ....................................................................................................................... 13,245 14,290 13,514 14,468 11,231 12,680 13,613Treasury ................................................................................................................................ 8,776 9,684 10,081 10,336 10,649 10,432 10,626Veterans Affairs .................................................................................................................... 14,087 15,260 16,194 17,151 17,577 17,757 18,865Corps of Engineers .............................................................................................................. 3,302 3,656 3,842 3,915 3,330 3,362 4,110Other Defense—Civil Programs ........................................................................................... 108 115 120 117 114 114 113Environmental Protection Agency ........................................................................................ 6,094 6,645 6,923 6,645 5,971 6,525 6,800Executive Office of the President ........................................................................................ 184 202 237 236 184 204 217Federal Emergency Management Administration ................................................................ 563 4,784 2,573 5,944 4,117 3,973 5,117General Services Administration .......................................................................................... 2,012 376 289 585 179 224 570International Assistance Programs ...................................................................................... 14,262 12,616 24,512 11,459 11,840 10,695 10,598National Aeronautics and Space Administration ................................................................. 14,015 14,316 14,309 14,568 13,853 13,885 13,709National Science Foundation ............................................................................................... 2,316 2,573 2,734 3,018 3,227 3,219 3,271Office of Personnel Management ........................................................................................ 201 211 242 233 218 193 194Small Business Administration ............................................................................................. 464 1,577 925 1,894 792 815 854Social Security Administration (On-budget) ......................................................................... 1,415 1,321 1,476 1,781 2,390 1,892 2,147Social Security Administration (Off-budget) ......................................................................... 2,399 2,540 2,640 2,828 2,325 3,135 3,451Other Independent Agencies (On-budget) ........................................................................... 6,148 6,269 6,234 6,659 6,862 6,042 5,933
Total discretionary budget authority ....................................................................... 545,806 531,835 524,241 514,757 501,858 502,232 512,548
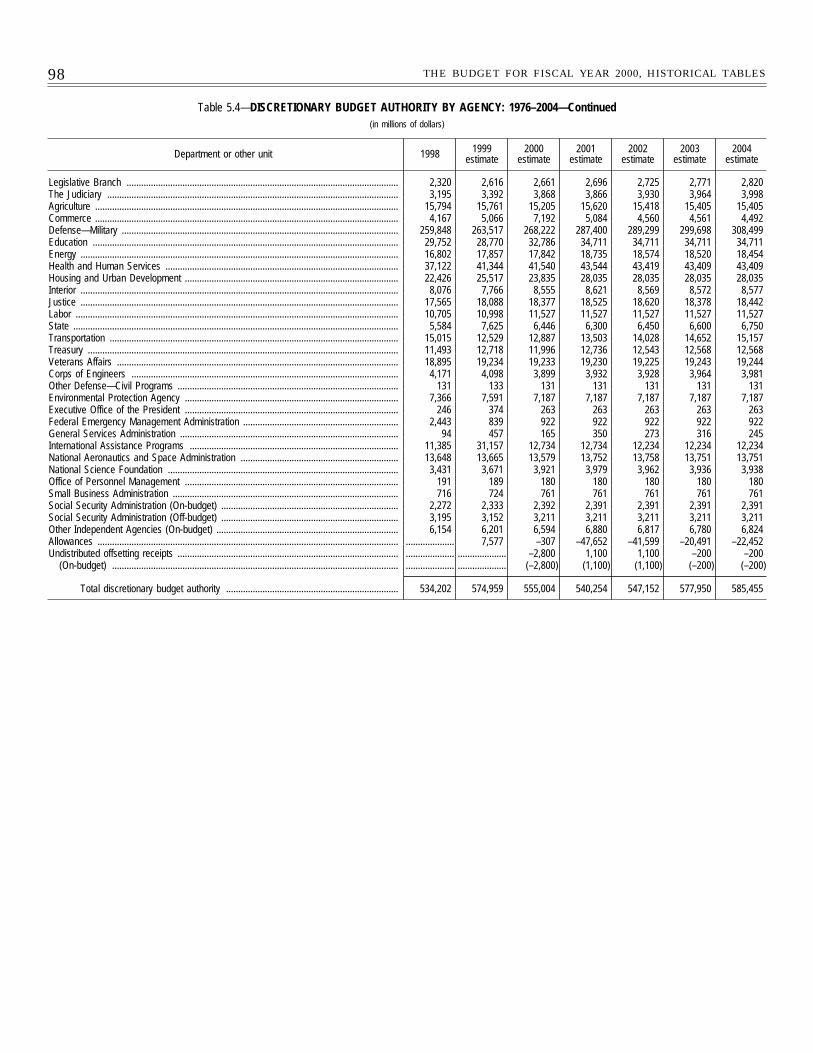
98 THE BUDGET FOR FISCAL YEAR 2000, HISTORICAL TABLES
Table 5.4—DISCRETIONARY BUDGET AUTHORITY BY AGENCY: 1976–2004—Continued(in millions of dollars)
Department or other unit 1998 1999estimate
2000estimate
2001estimate
2002estimate
2003estimate
2004estimate
Legislative Branch ................................................................................................................ 2,320 2,616 2,661 2,696 2,725 2,771 2,820The Judiciary ........................................................................................................................ 3,195 3,392 3,868 3,866 3,930 3,964 3,998Agriculture ............................................................................................................................. 15,794 15,761 15,205 15,620 15,418 15,405 15,405Commerce ............................................................................................................................. 4,167 5,066 7,192 5,084 4,560 4,561 4,492Defense—Military .................................................................................................................. 259,848 263,517 268,222 287,400 289,299 299,698 308,499Education .............................................................................................................................. 29,752 28,770 32,786 34,711 34,711 34,711 34,711Energy ................................................................................................................................... 16,802 17,857 17,842 18,735 18,574 18,520 18,454Health and Human Services ................................................................................................ 37,122 41,344 41,540 43,544 43,419 43,409 43,409Housing and Urban Development ........................................................................................ 22,426 25,517 23,835 28,035 28,035 28,035 28,035Interior ................................................................................................................................... 8,076 7,766 8,555 8,621 8,569 8,572 8,577Justice ................................................................................................................................... 17,565 18,088 18,377 18,525 18,620 18,378 18,442Labor ..................................................................................................................................... 10,705 10,998 11,527 11,527 11,527 11,527 11,527State ...................................................................................................................................... 5,584 7,625 6,446 6,300 6,450 6,600 6,750Transportation ....................................................................................................................... 15,015 12,529 12,887 13,503 14,028 14,652 15,157Treasury ................................................................................................................................ 11,493 12,718 11,996 12,736 12,543 12,568 12,568Veterans Affairs .................................................................................................................... 18,895 19,234 19,233 19,230 19,225 19,243 19,244Corps of Engineers .............................................................................................................. 4,171 4,098 3,899 3,932 3,928 3,964 3,981Other Defense—Civil Programs ........................................................................................... 131 133 131 131 131 131 131Environmental Protection Agency ........................................................................................ 7,366 7,591 7,187 7,187 7,187 7,187 7,187Executive Office of the President ........................................................................................ 246 374 263 263 263 263 263Federal Emergency Management Administration ................................................................ 2,443 839 922 922 922 922 922General Services Administration .......................................................................................... 94 457 165 350 273 316 245International Assistance Programs ...................................................................................... 11,385 31,157 12,734 12,734 12,234 12,234 12,234National Aeronautics and Space Administration ................................................................. 13,648 13,665 13,579 13,752 13,758 13,751 13,751National Science Foundation ............................................................................................... 3,431 3,671 3,921 3,979 3,962 3,936 3,938Office of Personnel Management ........................................................................................ 191 189 180 180 180 180 180Small Business Administration ............................................................................................. 716 724 761 761 761 761 761Social Security Administration (On-budget) ......................................................................... 2,272 2,333 2,392 2,391 2,391 2,391 2,391Social Security Administration (Off-budget) ......................................................................... 3,195 3,152 3,211 3,211 3,211 3,211 3,211Other Independent Agencies (On-budget) ........................................................................... 6,154 6,201 6,594 6,880 6,817 6,780 6,824Allowances ............................................................................................................................ .................... 7,577 –307 –47,652 –41,599 –20,491 –22,452Undistributed offsetting receipts ........................................................................................... .................... .................... –2,800 1,100 1,100 –200 –200
(On-budget) ...................................................................................................................... .................... .................... (–2,800) (1,100) (1,100) (–200) (–200)
Total discretionary budget authority ....................................................................... 534,202 574,959 555,004 540,254 547,152 577,950 585,455
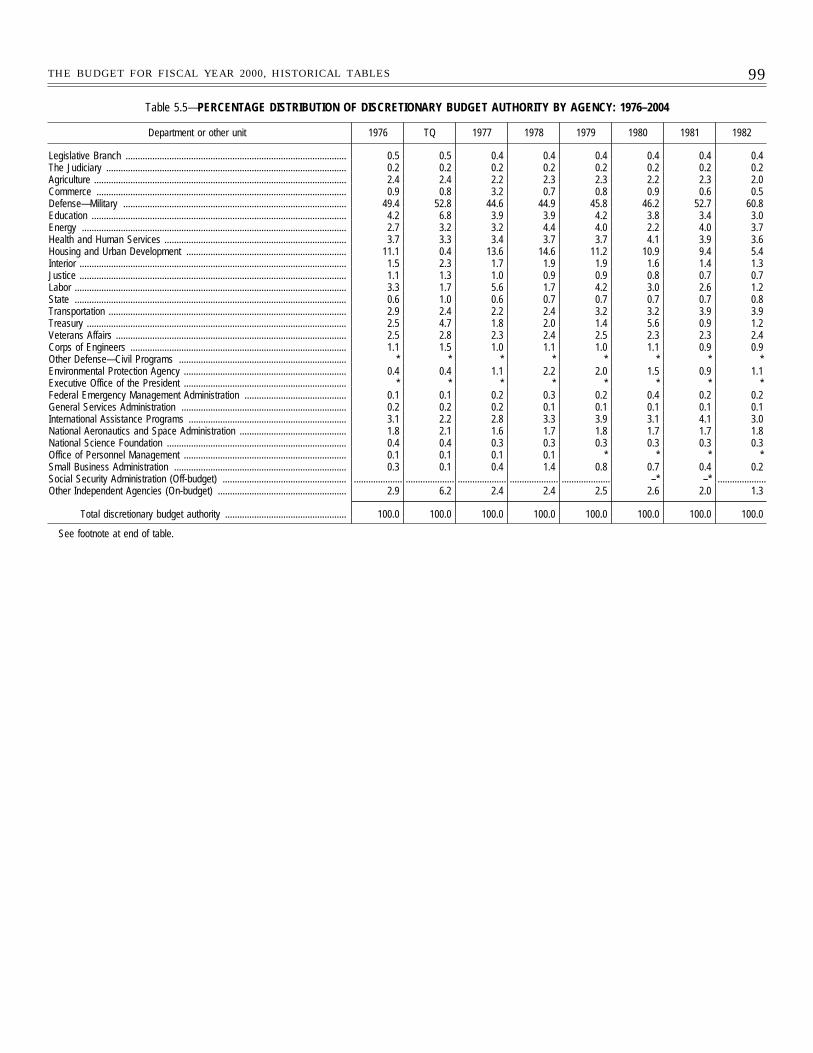
99THE BUDGET FOR FISCAL YEAR 2000, HISTORICAL TABLES
Table 5.5—PERCENTAGE DISTRIBUTION OF DISCRETIONARY BUDGET AUTHORITY BY AGENCY: 1976–2004
Department or other unit 1976 TQ 1977 1978 1979 1980 1981 1982
Legislative Branch ........................................................................................... 0.5 0.5 0.4 0.4 0.4 0.4 0.4 0.4The Judiciary ................................................................................................... 0.2 0.2 0.2 0.2 0.2 0.2 0.2 0.2Agriculture ........................................................................................................ 2.4 2.4 2.2 2.3 2.3 2.2 2.3 2.0Commerce ....................................................................................................... 0.9 0.8 3.2 0.7 0.8 0.9 0.6 0.5Defense—Military ............................................................................................ 49.4 52.8 44.6 44.9 45.8 46.2 52.7 60.8Education ......................................................................................................... 4.2 6.8 3.9 3.9 4.2 3.8 3.4 3.0Energy ............................................................................................................. 2.7 3.2 3.2 4.4 4.0 2.2 4.0 3.7Health and Human Services ........................................................................... 3.7 3.3 3.4 3.7 3.7 4.1 3.9 3.6Housing and Urban Development .................................................................. 11.1 0.4 13.6 14.6 11.2 10.9 9.4 5.4Interior .............................................................................................................. 1.5 2.3 1.7 1.9 1.9 1.6 1.4 1.3Justice .............................................................................................................. 1.1 1.3 1.0 0.9 0.9 0.8 0.7 0.7Labor ................................................................................................................ 3.3 1.7 5.6 1.7 4.2 3.0 2.6 1.2State ................................................................................................................ 0.6 1.0 0.6 0.7 0.7 0.7 0.7 0.8Transportation .................................................................................................. 2.9 2.4 2.2 2.4 3.2 3.2 3.9 3.9Treasury ........................................................................................................... 2.5 4.7 1.8 2.0 1.4 5.6 0.9 1.2Veterans Affairs ............................................................................................... 2.5 2.8 2.3 2.4 2.5 2.3 2.3 2.4Corps of Engineers ......................................................................................... 1.1 1.5 1.0 1.1 1.0 1.1 0.9 0.9Other Defense—Civil Programs ..................................................................... * * * * * * * *Environmental Protection Agency ................................................................... 0.4 0.4 1.1 2.2 2.0 1.5 0.9 1.1Executive Office of the President ................................................................... * * * * * * * *Federal Emergency Management Administration .......................................... 0.1 0.1 0.2 0.3 0.2 0.4 0.2 0.2General Services Administration .................................................................... 0.2 0.2 0.2 0.1 0.1 0.1 0.1 0.1International Assistance Programs ................................................................. 3.1 2.2 2.8 3.3 3.9 3.1 4.1 3.0National Aeronautics and Space Administration ............................................ 1.8 2.1 1.6 1.7 1.8 1.7 1.7 1.8National Science Foundation .......................................................................... 0.4 0.4 0.3 0.3 0.3 0.3 0.3 0.3Office of Personnel Management ................................................................... 0.1 0.1 0.1 0.1 * * * *Small Business Administration ....................................................................... 0.3 0.1 0.4 1.4 0.8 0.7 0.4 0.2Social Security Administration (Off-budget) ................................................... .................... .................... .................... .................... .................... –* –* ....................Other Independent Agencies (On-budget) ..................................................... 2.9 6.2 2.4 2.4 2.5 2.6 2.0 1.3
Total discretionary budget authority .................................................. 100.0 100.0 100.0 100.0 100.0 100.0 100.0 100.0
See footnote at end of table.
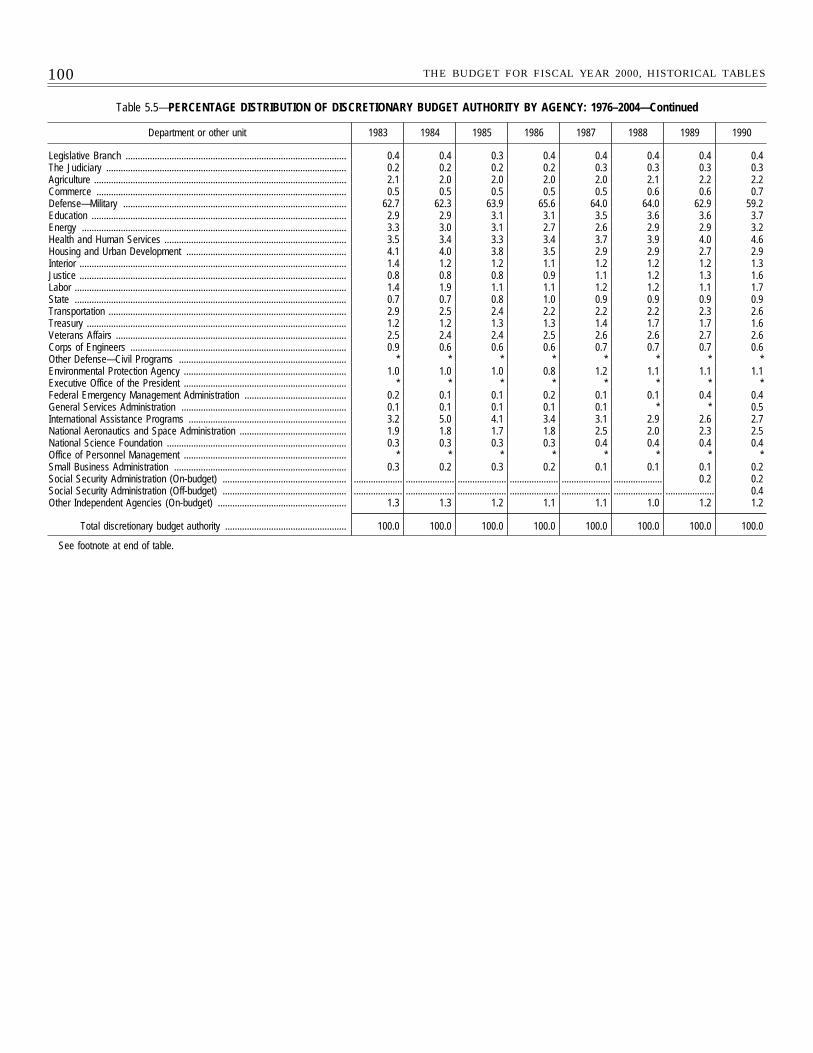
100 THE BUDGET FOR FISCAL YEAR 2000, HISTORICAL TABLES
Table 5.5—PERCENTAGE DISTRIBUTION OF DISCRETIONARY BUDGET AUTHORITY BY AGENCY: 1976–2004—Continued
Department or other unit 1983 1984 1985 1986 1987 1988 1989 1990
Legislative Branch ........................................................................................... 0.4 0.4 0.3 0.4 0.4 0.4 0.4 0.4The Judiciary ................................................................................................... 0.2 0.2 0.2 0.2 0.3 0.3 0.3 0.3Agriculture ........................................................................................................ 2.1 2.0 2.0 2.0 2.0 2.1 2.2 2.2Commerce ....................................................................................................... 0.5 0.5 0.5 0.5 0.5 0.6 0.6 0.7Defense—Military ............................................................................................ 62.7 62.3 63.9 65.6 64.0 64.0 62.9 59.2Education ......................................................................................................... 2.9 2.9 3.1 3.1 3.5 3.6 3.6 3.7Energy ............................................................................................................. 3.3 3.0 3.1 2.7 2.6 2.9 2.9 3.2Health and Human Services ........................................................................... 3.5 3.4 3.3 3.4 3.7 3.9 4.0 4.6Housing and Urban Development .................................................................. 4.1 4.0 3.8 3.5 2.9 2.9 2.7 2.9Interior .............................................................................................................. 1.4 1.2 1.2 1.1 1.2 1.2 1.2 1.3Justice .............................................................................................................. 0.8 0.8 0.8 0.9 1.1 1.2 1.3 1.6Labor ................................................................................................................ 1.4 1.9 1.1 1.1 1.2 1.2 1.1 1.7State ................................................................................................................ 0.7 0.7 0.8 1.0 0.9 0.9 0.9 0.9Transportation .................................................................................................. 2.9 2.5 2.4 2.2 2.2 2.2 2.3 2.6Treasury ........................................................................................................... 1.2 1.2 1.3 1.3 1.4 1.7 1.7 1.6Veterans Affairs ............................................................................................... 2.5 2.4 2.4 2.5 2.6 2.6 2.7 2.6Corps of Engineers ......................................................................................... 0.9 0.6 0.6 0.6 0.7 0.7 0.7 0.6Other Defense—Civil Programs ..................................................................... * * * * * * * *Environmental Protection Agency ................................................................... 1.0 1.0 1.0 0.8 1.2 1.1 1.1 1.1Executive Office of the President ................................................................... * * * * * * * *Federal Emergency Management Administration .......................................... 0.2 0.1 0.1 0.2 0.1 0.1 0.4 0.4General Services Administration .................................................................... 0.1 0.1 0.1 0.1 0.1 * * 0.5International Assistance Programs ................................................................. 3.2 5.0 4.1 3.4 3.1 2.9 2.6 2.7National Aeronautics and Space Administration ............................................ 1.9 1.8 1.7 1.8 2.5 2.0 2.3 2.5National Science Foundation .......................................................................... 0.3 0.3 0.3 0.3 0.4 0.4 0.4 0.4Office of Personnel Management ................................................................... * * * * * * * *Small Business Administration ....................................................................... 0.3 0.2 0.3 0.2 0.1 0.1 0.1 0.2Social Security Administration (On-budget) ................................................... .................... .................... .................... .................... .................... .................... 0.2 0.2Social Security Administration (Off-budget) ................................................... .................... .................... .................... .................... .................... .................... .................... 0.4Other Independent Agencies (On-budget) ..................................................... 1.3 1.3 1.2 1.1 1.1 1.0 1.2 1.2
Total discretionary budget authority .................................................. 100.0 100.0 100.0 100.0 100.0 100.0 100.0 100.0
See footnote at end of table.
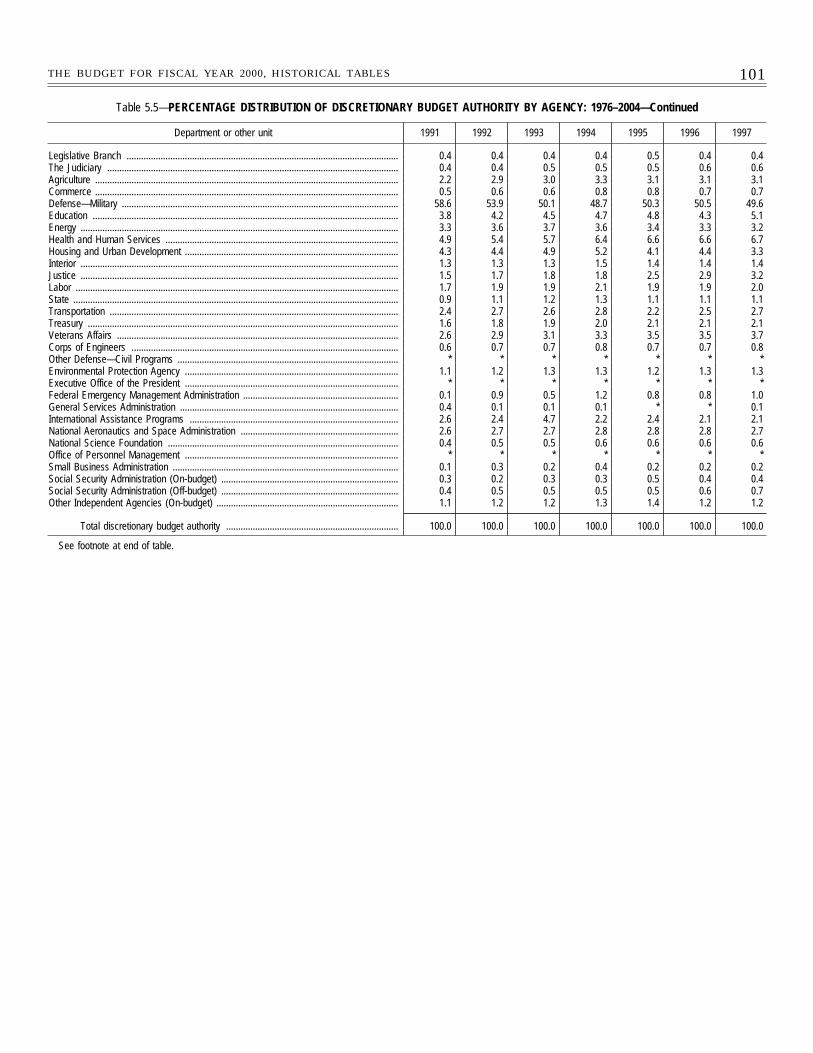
101THE BUDGET FOR FISCAL YEAR 2000, HISTORICAL TABLES
Table 5.5—PERCENTAGE DISTRIBUTION OF DISCRETIONARY BUDGET AUTHORITY BY AGENCY: 1976–2004—Continued
Department or other unit 1991 1992 1993 1994 1995 1996 1997
Legislative Branch ................................................................................................................ 0.4 0.4 0.4 0.4 0.5 0.4 0.4The Judiciary ........................................................................................................................ 0.4 0.4 0.5 0.5 0.5 0.6 0.6Agriculture ............................................................................................................................. 2.2 2.9 3.0 3.3 3.1 3.1 3.1Commerce ............................................................................................................................. 0.5 0.6 0.6 0.8 0.8 0.7 0.7Defense—Military .................................................................................................................. 58.6 53.9 50.1 48.7 50.3 50.5 49.6Education .............................................................................................................................. 3.8 4.2 4.5 4.7 4.8 4.3 5.1Energy ................................................................................................................................... 3.3 3.6 3.7 3.6 3.4 3.3 3.2Health and Human Services ................................................................................................ 4.9 5.4 5.7 6.4 6.6 6.6 6.7Housing and Urban Development ........................................................................................ 4.3 4.4 4.9 5.2 4.1 4.4 3.3Interior ................................................................................................................................... 1.3 1.3 1.3 1.5 1.4 1.4 1.4Justice ................................................................................................................................... 1.5 1.7 1.8 1.8 2.5 2.9 3.2Labor ..................................................................................................................................... 1.7 1.9 1.9 2.1 1.9 1.9 2.0State ...................................................................................................................................... 0.9 1.1 1.2 1.3 1.1 1.1 1.1Transportation ....................................................................................................................... 2.4 2.7 2.6 2.8 2.2 2.5 2.7Treasury ................................................................................................................................ 1.6 1.8 1.9 2.0 2.1 2.1 2.1Veterans Affairs .................................................................................................................... 2.6 2.9 3.1 3.3 3.5 3.5 3.7Corps of Engineers .............................................................................................................. 0.6 0.7 0.7 0.8 0.7 0.7 0.8Other Defense—Civil Programs ........................................................................................... * * * * * * *Environmental Protection Agency ........................................................................................ 1.1 1.2 1.3 1.3 1.2 1.3 1.3Executive Office of the President ........................................................................................ * * * * * * *Federal Emergency Management Administration ................................................................ 0.1 0.9 0.5 1.2 0.8 0.8 1.0General Services Administration .......................................................................................... 0.4 0.1 0.1 0.1 * * 0.1International Assistance Programs ...................................................................................... 2.6 2.4 4.7 2.2 2.4 2.1 2.1National Aeronautics and Space Administration ................................................................. 2.6 2.7 2.7 2.8 2.8 2.8 2.7National Science Foundation ............................................................................................... 0.4 0.5 0.5 0.6 0.6 0.6 0.6Office of Personnel Management ........................................................................................ * * * * * * *Small Business Administration ............................................................................................. 0.1 0.3 0.2 0.4 0.2 0.2 0.2Social Security Administration (On-budget) ......................................................................... 0.3 0.2 0.3 0.3 0.5 0.4 0.4Social Security Administration (Off-budget) ......................................................................... 0.4 0.5 0.5 0.5 0.5 0.6 0.7Other Independent Agencies (On-budget) ........................................................................... 1.1 1.2 1.2 1.3 1.4 1.2 1.2
Total discretionary budget authority ....................................................................... 100.0 100.0 100.0 100.0 100.0 100.0 100.0
See footnote at end of table.

102 THE BUDGET FOR FISCAL YEAR 2000, HISTORICAL TABLES
Table 5.5—PERCENTAGE DISTRIBUTION OF DISCRETIONARY BUDGET AUTHORITY BY AGENCY: 1976–2004—Continued
Department or other unit 1998 1999estimate
2000estimate
2001estimate
2002estimate
2003estimate
2004estimate
Legislative Branch ................................................................................................................ 0.4 0.5 0.5 0.5 0.5 0.5 0.5The Judiciary ........................................................................................................................ 0.6 0.6 0.7 0.7 0.7 0.7 0.7Agriculture ............................................................................................................................. 3.0 2.7 2.7 2.9 2.8 2.7 2.6Commerce ............................................................................................................................. 0.8 0.9 1.3 0.9 0.8 0.8 0.8Defense—Military .................................................................................................................. 48.6 45.8 48.3 53.2 52.9 51.9 52.7Education .............................................................................................................................. 5.6 5.0 5.9 6.4 6.3 6.0 5.9Energy ................................................................................................................................... 3.1 3.1 3.2 3.5 3.4 3.2 3.2Health and Human Services ................................................................................................ 6.9 7.2 7.5 8.1 7.9 7.5 7.4Housing and Urban Development ........................................................................................ 4.2 4.4 4.3 5.2 5.1 4.9 4.8Interior ................................................................................................................................... 1.5 1.4 1.5 1.6 1.6 1.5 1.5Justice ................................................................................................................................... 3.3 3.1 3.3 3.4 3.4 3.2 3.2Labor ..................................................................................................................................... 2.0 1.9 2.1 2.1 2.1 2.0 2.0State ...................................................................................................................................... 1.0 1.3 1.2 1.2 1.2 1.1 1.2Transportation ....................................................................................................................... 2.8 2.2 2.3 2.5 2.6 2.5 2.6Treasury ................................................................................................................................ 2.2 2.2 2.2 2.4 2.3 2.2 2.1Veterans Affairs .................................................................................................................... 3.5 3.3 3.5 3.6 3.5 3.3 3.3Corps of Engineers .............................................................................................................. 0.8 0.7 0.7 0.7 0.7 0.7 0.7Other Defense—Civil Programs ........................................................................................... * * * * * * *Environmental Protection Agency ........................................................................................ 1.4 1.3 1.3 1.3 1.3 1.2 1.2Executive Office of the President ........................................................................................ * 0.1 * * * * *Federal Emergency Management Administration ................................................................ 0.5 0.1 0.2 0.2 0.2 0.2 0.2General Services Administration .......................................................................................... * 0.1 * 0.1 * 0.1 *International Assistance Programs ...................................................................................... 2.1 5.4 2.3 2.4 2.2 2.1 2.1National Aeronautics and Space Administration ................................................................. 2.6 2.4 2.4 2.5 2.5 2.4 2.3National Science Foundation ............................................................................................... 0.6 0.6 0.7 0.7 0.7 0.7 0.7Office of Personnel Management ........................................................................................ * * * * * * *Small Business Administration ............................................................................................. 0.1 0.1 0.1 0.1 0.1 0.1 0.1Social Security Administration (On-budget) ......................................................................... 0.4 0.4 0.4 0.4 0.4 0.4 0.4Social Security Administration (Off-budget) ......................................................................... 0.6 0.5 0.6 0.6 0.6 0.6 0.5Other Independent Agencies (On-budget) ........................................................................... 1.2 1.1 1.2 1.3 1.2 1.2 1.2Allowances ............................................................................................................................ .................... 1.3 –0.1 –8.8 –7.6 –3.5 –3.8Undistributed offsetting receipts ........................................................................................... .................... .................... –0.5 0.2 0.2 –* –*
(On-budget) ...................................................................................................................... .................... .................... (–0.5) (0.2) (0.2) (–*) (–*)
Total discretionary budget authority ....................................................................... 100.0 100.0 100.0 100.0 100.0 100.0 100.0
* 0.05 percent or less.
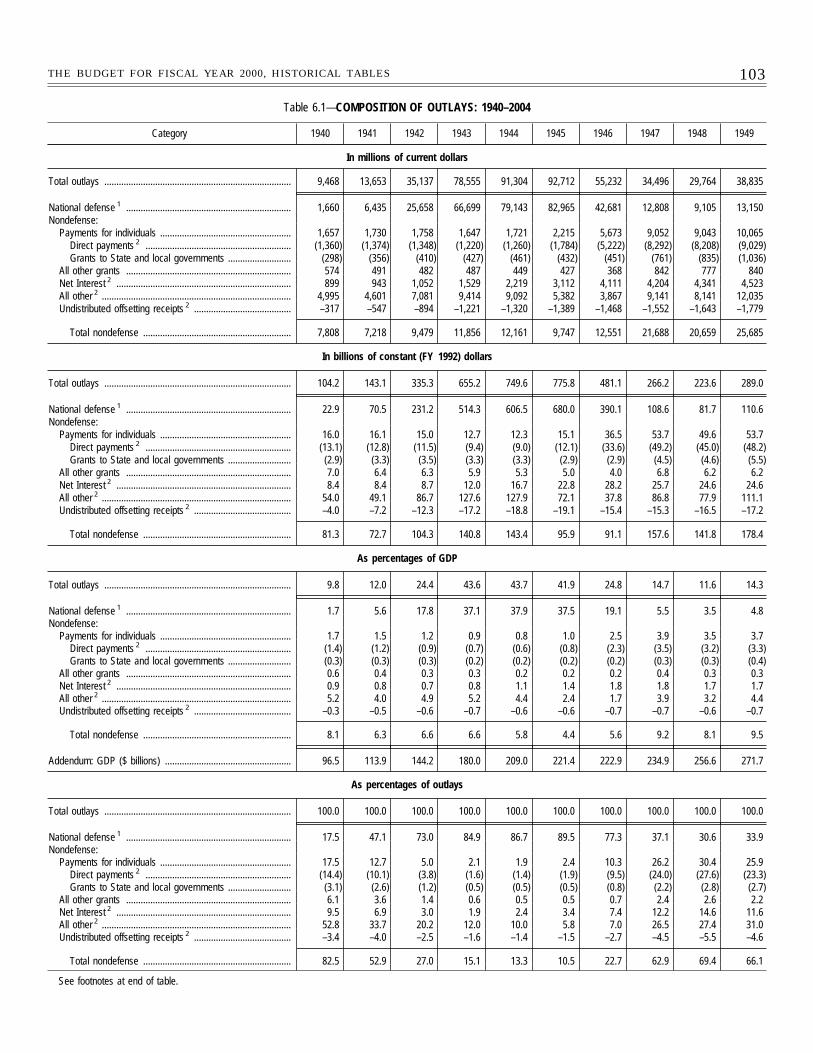
103THE BUDGET FOR FISCAL YEAR 2000, HISTORICAL TABLES
Table 6.1—COMPOSITION OF OUTLAYS: 1940–2004
Category 1940 1941 1942 1943 1944 1945 1946 1947 1948 1949
In millions of current dollars
Total outlays ............................................................................. 9,468 13,653 35,137 78,555 91,304 92,712 55,232 34,496 29,764 38,835
National defense 1 .................................................................... 1,660 6,435 25,658 66,699 79,143 82,965 42,681 12,808 9,105 13,150Nondefense:
Payments for individuals ...................................................... 1,657 1,730 1,758 1,647 1,721 2,215 5,673 9,052 9,043 10,065Direct payments 2 ............................................................ (1,360) (1,374) (1,348) (1,220) (1,260) (1,784) (5,222) (8,292) (8,208) (9,029)Grants to State and local governments .......................... (298) (356) (410) (427) (461) (432) (451) (761) (835) (1,036)
All other grants .................................................................... 574 491 482 487 449 427 368 842 777 840Net Interest 2 ........................................................................ 899 943 1,052 1,529 2,219 3,112 4,111 4,204 4,341 4,523All other 2 .............................................................................. 4,995 4,601 7,081 9,414 9,092 5,382 3,867 9,141 8,141 12,035Undistributed offsetting receipts 2 ........................................ –317 –547 –894 –1,221 –1,320 –1,389 –1,468 –1,552 –1,643 –1,779
Total nondefense ............................................................. 7,808 7,218 9,479 11,856 12,161 9,747 12,551 21,688 20,659 25,685
In billions of constant (FY 1992) dollars
Total outlays ............................................................................. 104.2 143.1 335.3 655.2 749.6 775.8 481.1 266.2 223.6 289.0
National defense 1 .................................................................... 22.9 70.5 231.2 514.3 606.5 680.0 390.1 108.6 81.7 110.6Nondefense:
Payments for individuals ...................................................... 16.0 16.1 15.0 12.7 12.3 15.1 36.5 53.7 49.6 53.7Direct payments 2 ............................................................ (13.1) (12.8) (11.5) (9.4) (9.0) (12.1) (33.6) (49.2) (45.0) (48.2)Grants to State and local governments .......................... (2.9) (3.3) (3.5) (3.3) (3.3) (2.9) (2.9) (4.5) (4.6) (5.5)
All other grants .................................................................... 7.0 6.4 6.3 5.9 5.3 5.0 4.0 6.8 6.2 6.2Net Interest 2 ........................................................................ 8.4 8.4 8.7 12.0 16.7 22.8 28.2 25.7 24.6 24.6All other 2 .............................................................................. 54.0 49.1 86.7 127.6 127.9 72.1 37.8 86.8 77.9 111.1Undistributed offsetting receipts 2 ........................................ –4.0 –7.2 –12.3 –17.2 –18.8 –19.1 –15.4 –15.3 –16.5 –17.2
Total nondefense ............................................................. 81.3 72.7 104.3 140.8 143.4 95.9 91.1 157.6 141.8 178.4
As percentages of GDP
Total outlays ............................................................................. 9.8 12.0 24.4 43.6 43.7 41.9 24.8 14.7 11.6 14.3
National defense 1 .................................................................... 1.7 5.6 17.8 37.1 37.9 37.5 19.1 5.5 3.5 4.8Nondefense:
Payments for individuals ...................................................... 1.7 1.5 1.2 0.9 0.8 1.0 2.5 3.9 3.5 3.7Direct payments 2 ............................................................ (1.4) (1.2) (0.9) (0.7) (0.6) (0.8) (2.3) (3.5) (3.2) (3.3)Grants to State and local governments .......................... (0.3) (0.3) (0.3) (0.2) (0.2) (0.2) (0.2) (0.3) (0.3) (0.4)
All other grants .................................................................... 0.6 0.4 0.3 0.3 0.2 0.2 0.2 0.4 0.3 0.3Net Interest 2 ........................................................................ 0.9 0.8 0.7 0.8 1.1 1.4 1.8 1.8 1.7 1.7All other 2 .............................................................................. 5.2 4.0 4.9 5.2 4.4 2.4 1.7 3.9 3.2 4.4Undistributed offsetting receipts 2 ........................................ –0.3 –0.5 –0.6 –0.7 –0.6 –0.6 –0.7 –0.7 –0.6 –0.7
Total nondefense ............................................................. 8.1 6.3 6.6 6.6 5.8 4.4 5.6 9.2 8.1 9.5
Addendum: GDP ($ billions) .................................................... 96.5 113.9 144.2 180.0 209.0 221.4 222.9 234.9 256.6 271.7
As percentages of outlays
Total outlays ............................................................................. 100.0 100.0 100.0 100.0 100.0 100.0 100.0 100.0 100.0 100.0
National defense 1 .................................................................... 17.5 47.1 73.0 84.9 86.7 89.5 77.3 37.1 30.6 33.9Nondefense:
Payments for individuals ...................................................... 17.5 12.7 5.0 2.1 1.9 2.4 10.3 26.2 30.4 25.9Direct payments 2 ............................................................ (14.4) (10.1) (3.8) (1.6) (1.4) (1.9) (9.5) (24.0) (27.6) (23.3)Grants to State and local governments .......................... (3.1) (2.6) (1.2) (0.5) (0.5) (0.5) (0.8) (2.2) (2.8) (2.7)
All other grants .................................................................... 6.1 3.6 1.4 0.6 0.5 0.5 0.7 2.4 2.6 2.2Net Interest 2 ........................................................................ 9.5 6.9 3.0 1.9 2.4 3.4 7.4 12.2 14.6 11.6All other 2 .............................................................................. 52.8 33.7 20.2 12.0 10.0 5.8 7.0 26.5 27.4 31.0Undistributed offsetting receipts 2 ........................................ –3.4 –4.0 –2.5 –1.6 –1.4 –1.5 –2.7 –4.5 –5.5 –4.6
Total nondefense ............................................................. 82.5 52.9 27.0 15.1 13.3 10.5 22.7 62.9 69.4 66.1
See footnotes at end of table.
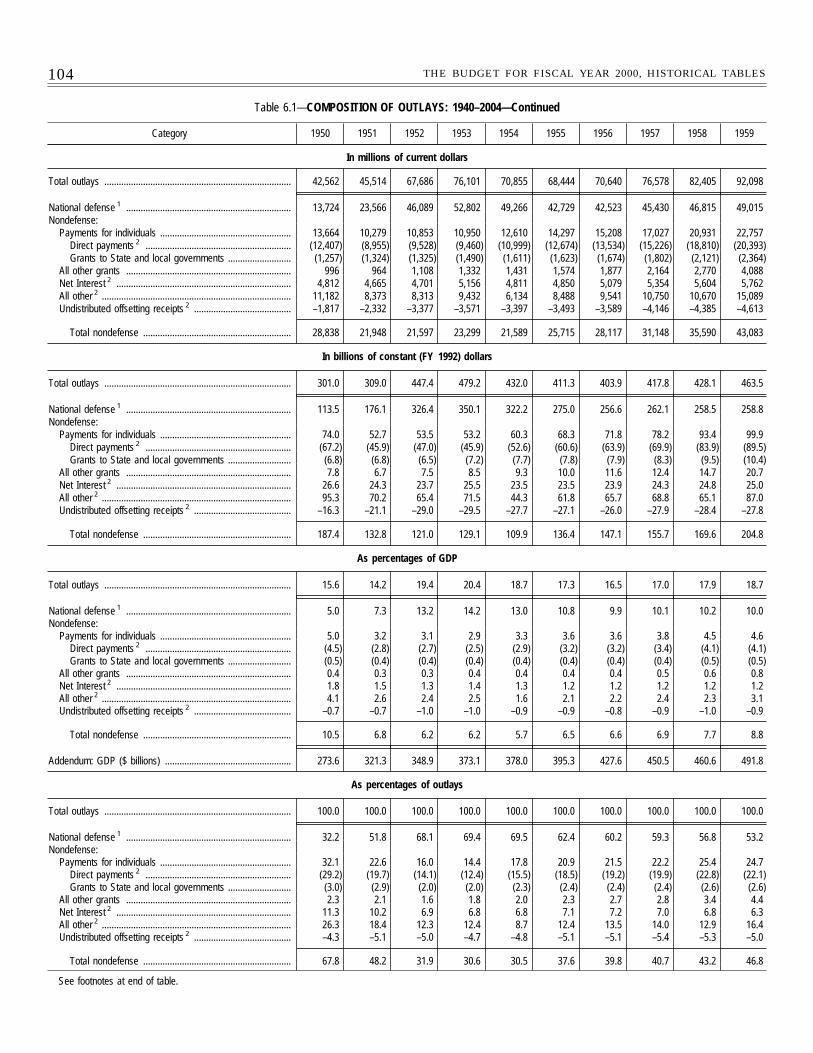
104 THE BUDGET FOR FISCAL YEAR 2000, HISTORICAL TABLES
Table 6.1—COMPOSITION OF OUTLAYS: 1940–2004—Continued
Category 1950 1951 1952 1953 1954 1955 1956 1957 1958 1959
In millions of current dollars
Total outlays ............................................................................. 42,562 45,514 67,686 76,101 70,855 68,444 70,640 76,578 82,405 92,098
National defense 1 .................................................................... 13,724 23,566 46,089 52,802 49,266 42,729 42,523 45,430 46,815 49,015Nondefense:
Payments for individuals ...................................................... 13,664 10,279 10,853 10,950 12,610 14,297 15,208 17,027 20,931 22,757Direct payments 2 ............................................................ (12,407) (8,955) (9,528) (9,460) (10,999) (12,674) (13,534) (15,226) (18,810) (20,393)Grants to State and local governments .......................... (1,257) (1,324) (1,325) (1,490) (1,611) (1,623) (1,674) (1,802) (2,121) (2,364)
All other grants .................................................................... 996 964 1,108 1,332 1,431 1,574 1,877 2,164 2,770 4,088Net Interest 2 ........................................................................ 4,812 4,665 4,701 5,156 4,811 4,850 5,079 5,354 5,604 5,762All other 2 .............................................................................. 11,182 8,373 8,313 9,432 6,134 8,488 9,541 10,750 10,670 15,089Undistributed offsetting receipts 2 ........................................ –1,817 –2,332 –3,377 –3,571 –3,397 –3,493 –3,589 –4,146 –4,385 –4,613
Total nondefense ............................................................. 28,838 21,948 21,597 23,299 21,589 25,715 28,117 31,148 35,590 43,083
In billions of constant (FY 1992) dollars
Total outlays ............................................................................. 301.0 309.0 447.4 479.2 432.0 411.3 403.9 417.8 428.1 463.5
National defense 1 .................................................................... 113.5 176.1 326.4 350.1 322.2 275.0 256.6 262.1 258.5 258.8Nondefense:
Payments for individuals ...................................................... 74.0 52.7 53.5 53.2 60.3 68.3 71.8 78.2 93.4 99.9Direct payments 2 ............................................................ (67.2) (45.9) (47.0) (45.9) (52.6) (60.6) (63.9) (69.9) (83.9) (89.5)Grants to State and local governments .......................... (6.8) (6.8) (6.5) (7.2) (7.7) (7.8) (7.9) (8.3) (9.5) (10.4)
All other grants .................................................................... 7.8 6.7 7.5 8.5 9.3 10.0 11.6 12.4 14.7 20.7Net Interest 2 ........................................................................ 26.6 24.3 23.7 25.5 23.5 23.5 23.9 24.3 24.8 25.0All other 2 .............................................................................. 95.3 70.2 65.4 71.5 44.3 61.8 65.7 68.8 65.1 87.0Undistributed offsetting receipts 2 ........................................ –16.3 –21.1 –29.0 –29.5 –27.7 –27.1 –26.0 –27.9 –28.4 –27.8
Total nondefense ............................................................. 187.4 132.8 121.0 129.1 109.9 136.4 147.1 155.7 169.6 204.8
As percentages of GDP
Total outlays ............................................................................. 15.6 14.2 19.4 20.4 18.7 17.3 16.5 17.0 17.9 18.7
National defense 1 .................................................................... 5.0 7.3 13.2 14.2 13.0 10.8 9.9 10.1 10.2 10.0Nondefense:
Payments for individuals ...................................................... 5.0 3.2 3.1 2.9 3.3 3.6 3.6 3.8 4.5 4.6Direct payments 2 ............................................................ (4.5) (2.8) (2.7) (2.5) (2.9) (3.2) (3.2) (3.4) (4.1) (4.1)Grants to State and local governments .......................... (0.5) (0.4) (0.4) (0.4) (0.4) (0.4) (0.4) (0.4) (0.5) (0.5)
All other grants .................................................................... 0.4 0.3 0.3 0.4 0.4 0.4 0.4 0.5 0.6 0.8Net Interest 2 ........................................................................ 1.8 1.5 1.3 1.4 1.3 1.2 1.2 1.2 1.2 1.2All other 2 .............................................................................. 4.1 2.6 2.4 2.5 1.6 2.1 2.2 2.4 2.3 3.1Undistributed offsetting receipts 2 ........................................ –0.7 –0.7 –1.0 –1.0 –0.9 –0.9 –0.8 –0.9 –1.0 –0.9
Total nondefense ............................................................. 10.5 6.8 6.2 6.2 5.7 6.5 6.6 6.9 7.7 8.8
Addendum: GDP ($ billions) .................................................... 273.6 321.3 348.9 373.1 378.0 395.3 427.6 450.5 460.6 491.8
As percentages of outlays
Total outlays ............................................................................. 100.0 100.0 100.0 100.0 100.0 100.0 100.0 100.0 100.0 100.0
National defense 1 .................................................................... 32.2 51.8 68.1 69.4 69.5 62.4 60.2 59.3 56.8 53.2Nondefense:
Payments for individuals ...................................................... 32.1 22.6 16.0 14.4 17.8 20.9 21.5 22.2 25.4 24.7Direct payments 2 ............................................................ (29.2) (19.7) (14.1) (12.4) (15.5) (18.5) (19.2) (19.9) (22.8) (22.1)Grants to State and local governments .......................... (3.0) (2.9) (2.0) (2.0) (2.3) (2.4) (2.4) (2.4) (2.6) (2.6)
All other grants .................................................................... 2.3 2.1 1.6 1.8 2.0 2.3 2.7 2.8 3.4 4.4Net Interest 2 ........................................................................ 11.3 10.2 6.9 6.8 6.8 7.1 7.2 7.0 6.8 6.3All other 2 .............................................................................. 26.3 18.4 12.3 12.4 8.7 12.4 13.5 14.0 12.9 16.4Undistributed offsetting receipts 2 ........................................ –4.3 –5.1 –5.0 –4.7 –4.8 –5.1 –5.1 –5.4 –5.3 –5.0
Total nondefense ............................................................. 67.8 48.2 31.9 30.6 30.5 37.6 39.8 40.7 43.2 46.8
See footnotes at end of table.
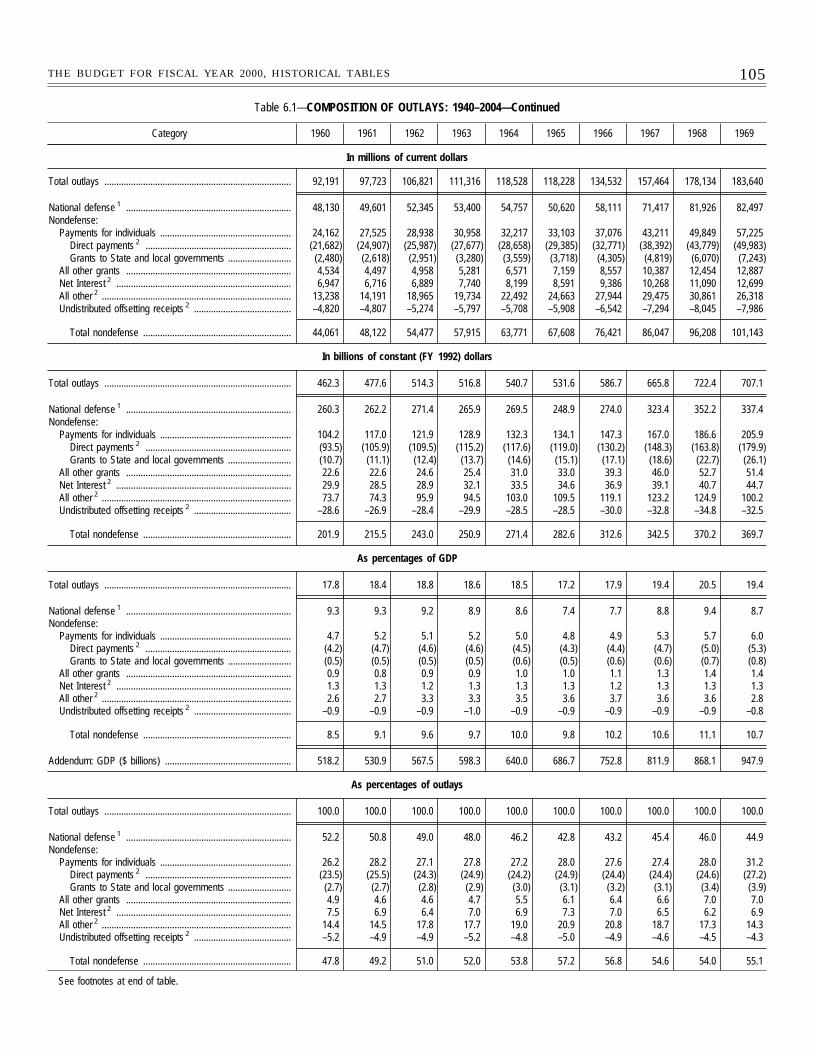
105THE BUDGET FOR FISCAL YEAR 2000, HISTORICAL TABLES
Table 6.1—COMPOSITION OF OUTLAYS: 1940–2004—Continued
Category 1960 1961 1962 1963 1964 1965 1966 1967 1968 1969
In millions of current dollars
Total outlays ............................................................................. 92,191 97,723 106,821 111,316 118,528 118,228 134,532 157,464 178,134 183,640
National defense 1 .................................................................... 48,130 49,601 52,345 53,400 54,757 50,620 58,111 71,417 81,926 82,497Nondefense:
Payments for individuals ...................................................... 24,162 27,525 28,938 30,958 32,217 33,103 37,076 43,211 49,849 57,225Direct payments 2 ............................................................ (21,682) (24,907) (25,987) (27,677) (28,658) (29,385) (32,771) (38,392) (43,779) (49,983)Grants to State and local governments .......................... (2,480) (2,618) (2,951) (3,280) (3,559) (3,718) (4,305) (4,819) (6,070) (7,243)
All other grants .................................................................... 4,534 4,497 4,958 5,281 6,571 7,159 8,557 10,387 12,454 12,887Net Interest 2 ........................................................................ 6,947 6,716 6,889 7,740 8,199 8,591 9,386 10,268 11,090 12,699All other 2 .............................................................................. 13,238 14,191 18,965 19,734 22,492 24,663 27,944 29,475 30,861 26,318Undistributed offsetting receipts 2 ........................................ –4,820 –4,807 –5,274 –5,797 –5,708 –5,908 –6,542 –7,294 –8,045 –7,986
Total nondefense ............................................................. 44,061 48,122 54,477 57,915 63,771 67,608 76,421 86,047 96,208 101,143
In billions of constant (FY 1992) dollars
Total outlays ............................................................................. 462.3 477.6 514.3 516.8 540.7 531.6 586.7 665.8 722.4 707.1
National defense 1 .................................................................... 260.3 262.2 271.4 265.9 269.5 248.9 274.0 323.4 352.2 337.4Nondefense:
Payments for individuals ...................................................... 104.2 117.0 121.9 128.9 132.3 134.1 147.3 167.0 186.6 205.9Direct payments 2 ............................................................ (93.5) (105.9) (109.5) (115.2) (117.6) (119.0) (130.2) (148.3) (163.8) (179.9)Grants to State and local governments .......................... (10.7) (11.1) (12.4) (13.7) (14.6) (15.1) (17.1) (18.6) (22.7) (26.1)
All other grants .................................................................... 22.6 22.6 24.6 25.4 31.0 33.0 39.3 46.0 52.7 51.4Net Interest 2 ........................................................................ 29.9 28.5 28.9 32.1 33.5 34.6 36.9 39.1 40.7 44.7All other 2 .............................................................................. 73.7 74.3 95.9 94.5 103.0 109.5 119.1 123.2 124.9 100.2Undistributed offsetting receipts 2 ........................................ –28.6 –26.9 –28.4 –29.9 –28.5 –28.5 –30.0 –32.8 –34.8 –32.5
Total nondefense ............................................................. 201.9 215.5 243.0 250.9 271.4 282.6 312.6 342.5 370.2 369.7
As percentages of GDP
Total outlays ............................................................................. 17.8 18.4 18.8 18.6 18.5 17.2 17.9 19.4 20.5 19.4
National defense 1 .................................................................... 9.3 9.3 9.2 8.9 8.6 7.4 7.7 8.8 9.4 8.7Nondefense:
Payments for individuals ...................................................... 4.7 5.2 5.1 5.2 5.0 4.8 4.9 5.3 5.7 6.0Direct payments 2 ............................................................ (4.2) (4.7) (4.6) (4.6) (4.5) (4.3) (4.4) (4.7) (5.0) (5.3)Grants to State and local governments .......................... (0.5) (0.5) (0.5) (0.5) (0.6) (0.5) (0.6) (0.6) (0.7) (0.8)
All other grants .................................................................... 0.9 0.8 0.9 0.9 1.0 1.0 1.1 1.3 1.4 1.4Net Interest 2 ........................................................................ 1.3 1.3 1.2 1.3 1.3 1.3 1.2 1.3 1.3 1.3All other 2 .............................................................................. 2.6 2.7 3.3 3.3 3.5 3.6 3.7 3.6 3.6 2.8Undistributed offsetting receipts 2 ........................................ –0.9 –0.9 –0.9 –1.0 –0.9 –0.9 –0.9 –0.9 –0.9 –0.8
Total nondefense ............................................................. 8.5 9.1 9.6 9.7 10.0 9.8 10.2 10.6 11.1 10.7
Addendum: GDP ($ billions) .................................................... 518.2 530.9 567.5 598.3 640.0 686.7 752.8 811.9 868.1 947.9
As percentages of outlays
Total outlays ............................................................................. 100.0 100.0 100.0 100.0 100.0 100.0 100.0 100.0 100.0 100.0
National defense 1 .................................................................... 52.2 50.8 49.0 48.0 46.2 42.8 43.2 45.4 46.0 44.9Nondefense:
Payments for individuals ...................................................... 26.2 28.2 27.1 27.8 27.2 28.0 27.6 27.4 28.0 31.2Direct payments 2 ............................................................ (23.5) (25.5) (24.3) (24.9) (24.2) (24.9) (24.4) (24.4) (24.6) (27.2)Grants to State and local governments .......................... (2.7) (2.7) (2.8) (2.9) (3.0) (3.1) (3.2) (3.1) (3.4) (3.9)
All other grants .................................................................... 4.9 4.6 4.6 4.7 5.5 6.1 6.4 6.6 7.0 7.0Net Interest 2 ........................................................................ 7.5 6.9 6.4 7.0 6.9 7.3 7.0 6.5 6.2 6.9All other 2 .............................................................................. 14.4 14.5 17.8 17.7 19.0 20.9 20.8 18.7 17.3 14.3Undistributed offsetting receipts 2 ........................................ –5.2 –4.9 –4.9 –5.2 –4.8 –5.0 –4.9 –4.6 –4.5 –4.3
Total nondefense ............................................................. 47.8 49.2 51.0 52.0 53.8 57.2 56.8 54.6 54.0 55.1
See footnotes at end of table.
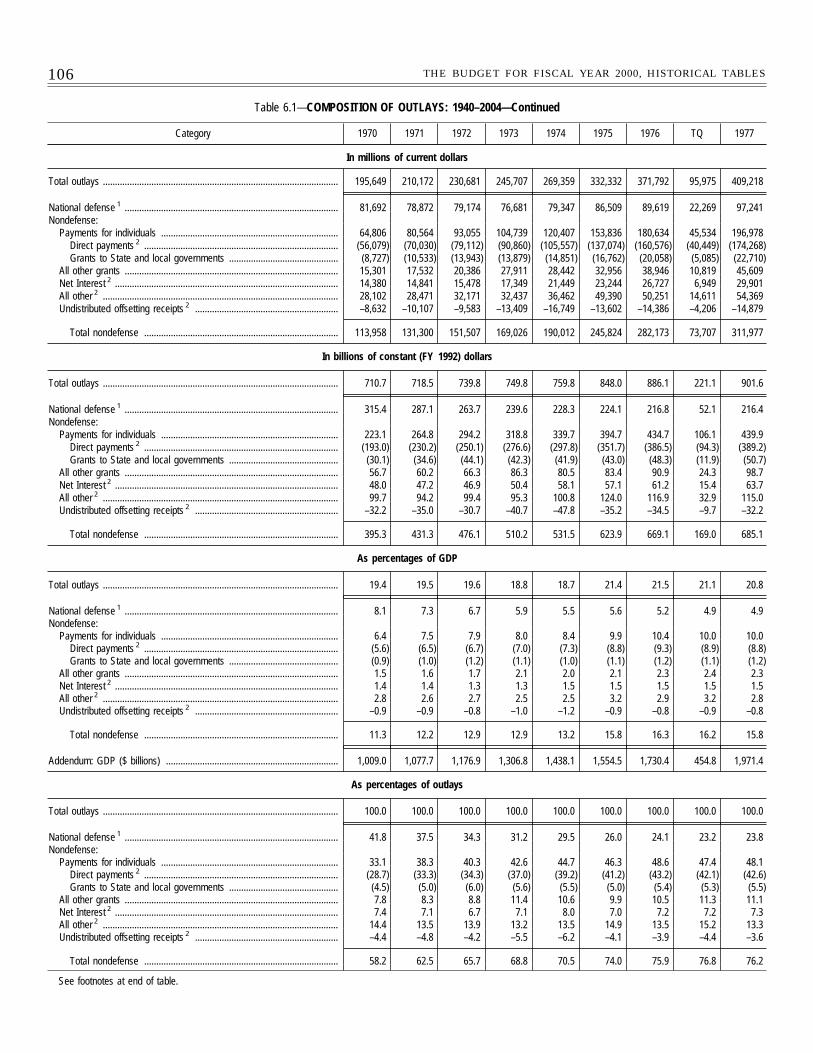
106 THE BUDGET FOR FISCAL YEAR 2000, HISTORICAL TABLES
Table 6.1—COMPOSITION OF OUTLAYS: 1940–2004—Continued
Category 1970 1971 1972 1973 1974 1975 1976 TQ 1977
In millions of current dollars
Total outlays ................................................................................................. 195,649 210,172 230,681 245,707 269,359 332,332 371,792 95,975 409,218
National defense 1 ........................................................................................ 81,692 78,872 79,174 76,681 79,347 86,509 89,619 22,269 97,241Nondefense:
Payments for individuals ......................................................................... 64,806 80,564 93,055 104,739 120,407 153,836 180,634 45,534 196,978Direct payments 2 ................................................................................ (56,079) (70,030) (79,112) (90,860) (105,557) (137,074) (160,576) (40,449) (174,268)Grants to State and local governments ............................................. (8,727) (10,533) (13,943) (13,879) (14,851) (16,762) (20,058) (5,085) (22,710)
All other grants ........................................................................................ 15,301 17,532 20,386 27,911 28,442 32,956 38,946 10,819 45,609Net Interest 2 ............................................................................................ 14,380 14,841 15,478 17,349 21,449 23,244 26,727 6,949 29,901All other 2 ................................................................................................. 28,102 28,471 32,171 32,437 36,462 49,390 50,251 14,611 54,369Undistributed offsetting receipts 2 ........................................................... –8,632 –10,107 –9,583 –13,409 –16,749 –13,602 –14,386 –4,206 –14,879
Total nondefense ................................................................................ 113,958 131,300 151,507 169,026 190,012 245,824 282,173 73,707 311,977
In billions of constant (FY 1992) dollars
Total outlays ................................................................................................. 710.7 718.5 739.8 749.8 759.8 848.0 886.1 221.1 901.6
National defense 1 ........................................................................................ 315.4 287.1 263.7 239.6 228.3 224.1 216.8 52.1 216.4Nondefense:
Payments for individuals ......................................................................... 223.1 264.8 294.2 318.8 339.7 394.7 434.7 106.1 439.9Direct payments 2 ................................................................................ (193.0) (230.2) (250.1) (276.6) (297.8) (351.7) (386.5) (94.3) (389.2)Grants to State and local governments ............................................. (30.1) (34.6) (44.1) (42.3) (41.9) (43.0) (48.3) (11.9) (50.7)
All other grants ........................................................................................ 56.7 60.2 66.3 86.3 80.5 83.4 90.9 24.3 98.7Net Interest 2 ............................................................................................ 48.0 47.2 46.9 50.4 58.1 57.1 61.2 15.4 63.7All other 2 ................................................................................................. 99.7 94.2 99.4 95.3 100.8 124.0 116.9 32.9 115.0Undistributed offsetting receipts 2 ........................................................... –32.2 –35.0 –30.7 –40.7 –47.8 –35.2 –34.5 –9.7 –32.2
Total nondefense ................................................................................ 395.3 431.3 476.1 510.2 531.5 623.9 669.1 169.0 685.1
As percentages of GDP
Total outlays ................................................................................................. 19.4 19.5 19.6 18.8 18.7 21.4 21.5 21.1 20.8
National defense 1 ........................................................................................ 8.1 7.3 6.7 5.9 5.5 5.6 5.2 4.9 4.9Nondefense:
Payments for individuals ......................................................................... 6.4 7.5 7.9 8.0 8.4 9.9 10.4 10.0 10.0Direct payments 2 ................................................................................ (5.6) (6.5) (6.7) (7.0) (7.3) (8.8) (9.3) (8.9) (8.8)Grants to State and local governments ............................................. (0.9) (1.0) (1.2) (1.1) (1.0) (1.1) (1.2) (1.1) (1.2)
All other grants ........................................................................................ 1.5 1.6 1.7 2.1 2.0 2.1 2.3 2.4 2.3Net Interest 2 ............................................................................................ 1.4 1.4 1.3 1.3 1.5 1.5 1.5 1.5 1.5All other 2 ................................................................................................. 2.8 2.6 2.7 2.5 2.5 3.2 2.9 3.2 2.8Undistributed offsetting receipts 2 ........................................................... –0.9 –0.9 –0.8 –1.0 –1.2 –0.9 –0.8 –0.9 –0.8
Total nondefense ................................................................................ 11.3 12.2 12.9 12.9 13.2 15.8 16.3 16.2 15.8
Addendum: GDP ($ billions) ....................................................................... 1,009.0 1,077.7 1,176.9 1,306.8 1,438.1 1,554.5 1,730.4 454.8 1,971.4
As percentages of outlays
Total outlays ................................................................................................. 100.0 100.0 100.0 100.0 100.0 100.0 100.0 100.0 100.0
National defense 1 ........................................................................................ 41.8 37.5 34.3 31.2 29.5 26.0 24.1 23.2 23.8Nondefense:
Payments for individuals ......................................................................... 33.1 38.3 40.3 42.6 44.7 46.3 48.6 47.4 48.1Direct payments 2 ................................................................................ (28.7) (33.3) (34.3) (37.0) (39.2) (41.2) (43.2) (42.1) (42.6)Grants to State and local governments ............................................. (4.5) (5.0) (6.0) (5.6) (5.5) (5.0) (5.4) (5.3) (5.5)
All other grants ........................................................................................ 7.8 8.3 8.8 11.4 10.6 9.9 10.5 11.3 11.1Net Interest 2 ............................................................................................ 7.4 7.1 6.7 7.1 8.0 7.0 7.2 7.2 7.3All other 2 ................................................................................................. 14.4 13.5 13.9 13.2 13.5 14.9 13.5 15.2 13.3Undistributed offsetting receipts 2 ........................................................... –4.4 –4.8 –4.2 –5.5 –6.2 –4.1 –3.9 –4.4 –3.6
Total nondefense ................................................................................ 58.2 62.5 65.7 68.8 70.5 74.0 75.9 76.8 76.2
See footnotes at end of table.
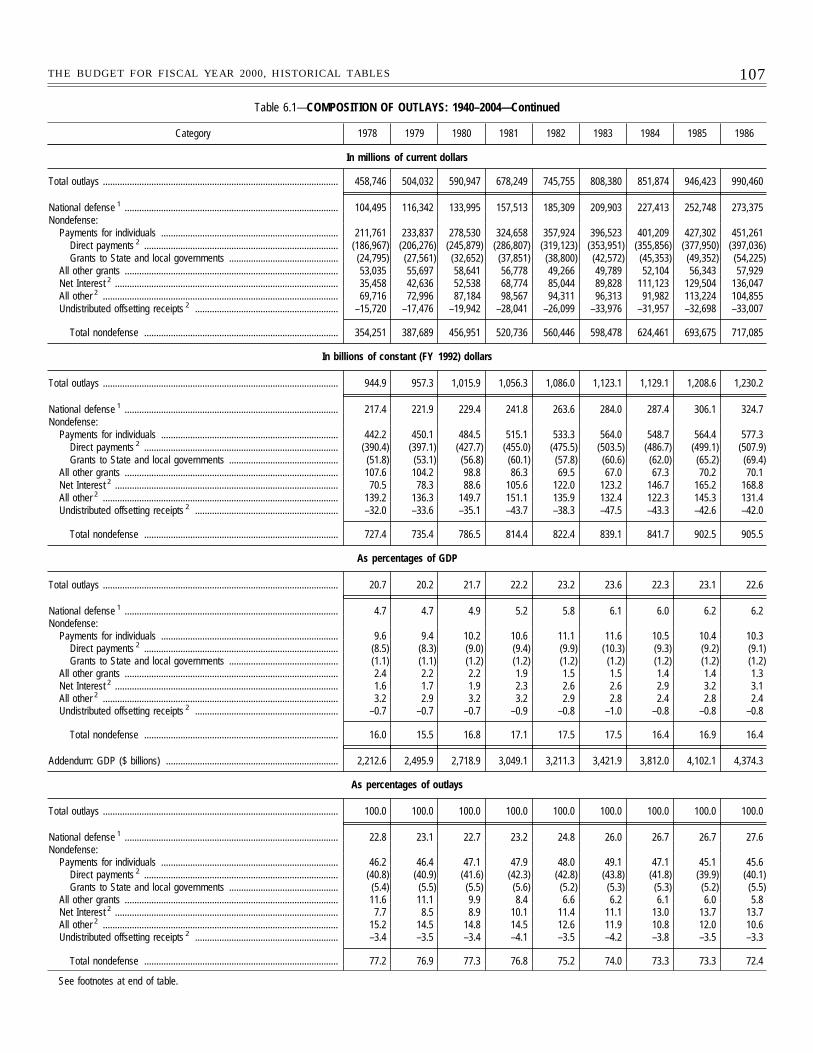
107THE BUDGET FOR FISCAL YEAR 2000, HISTORICAL TABLES
Table 6.1—COMPOSITION OF OUTLAYS: 1940–2004—Continued
Category 1978 1979 1980 1981 1982 1983 1984 1985 1986
In millions of current dollars
Total outlays ................................................................................................. 458,746 504,032 590,947 678,249 745,755 808,380 851,874 946,423 990,460
National defense 1 ........................................................................................ 104,495 116,342 133,995 157,513 185,309 209,903 227,413 252,748 273,375Nondefense:
Payments for individuals ......................................................................... 211,761 233,837 278,530 324,658 357,924 396,523 401,209 427,302 451,261Direct payments 2 ................................................................................ (186,967) (206,276) (245,879) (286,807) (319,123) (353,951) (355,856) (377,950) (397,036)Grants to State and local governments ............................................. (24,795) (27,561) (32,652) (37,851) (38,800) (42,572) (45,353) (49,352) (54,225)
All other grants ........................................................................................ 53,035 55,697 58,641 56,778 49,266 49,789 52,104 56,343 57,929Net Interest 2 ............................................................................................ 35,458 42,636 52,538 68,774 85,044 89,828 111,123 129,504 136,047All other 2 ................................................................................................. 69,716 72,996 87,184 98,567 94,311 96,313 91,982 113,224 104,855Undistributed offsetting receipts 2 ........................................................... –15,720 –17,476 –19,942 –28,041 –26,099 –33,976 –31,957 –32,698 –33,007
Total nondefense ................................................................................ 354,251 387,689 456,951 520,736 560,446 598,478 624,461 693,675 717,085
In billions of constant (FY 1992) dollars
Total outlays ................................................................................................. 944.9 957.3 1,015.9 1,056.3 1,086.0 1,123.1 1,129.1 1,208.6 1,230.2
National defense 1 ........................................................................................ 217.4 221.9 229.4 241.8 263.6 284.0 287.4 306.1 324.7Nondefense:
Payments for individuals ......................................................................... 442.2 450.1 484.5 515.1 533.3 564.0 548.7 564.4 577.3Direct payments 2 ................................................................................ (390.4) (397.1) (427.7) (455.0) (475.5) (503.5) (486.7) (499.1) (507.9)Grants to State and local governments ............................................. (51.8) (53.1) (56.8) (60.1) (57.8) (60.6) (62.0) (65.2) (69.4)
All other grants ........................................................................................ 107.6 104.2 98.8 86.3 69.5 67.0 67.3 70.2 70.1Net Interest 2 ............................................................................................ 70.5 78.3 88.6 105.6 122.0 123.2 146.7 165.2 168.8All other 2 ................................................................................................. 139.2 136.3 149.7 151.1 135.9 132.4 122.3 145.3 131.4Undistributed offsetting receipts 2 ........................................................... –32.0 –33.6 –35.1 –43.7 –38.3 –47.5 –43.3 –42.6 –42.0
Total nondefense ................................................................................ 727.4 735.4 786.5 814.4 822.4 839.1 841.7 902.5 905.5
As percentages of GDP
Total outlays ................................................................................................. 20.7 20.2 21.7 22.2 23.2 23.6 22.3 23.1 22.6
National defense 1 ........................................................................................ 4.7 4.7 4.9 5.2 5.8 6.1 6.0 6.2 6.2Nondefense:
Payments for individuals ......................................................................... 9.6 9.4 10.2 10.6 11.1 11.6 10.5 10.4 10.3Direct payments 2 ................................................................................ (8.5) (8.3) (9.0) (9.4) (9.9) (10.3) (9.3) (9.2) (9.1)Grants to State and local governments ............................................. (1.1) (1.1) (1.2) (1.2) (1.2) (1.2) (1.2) (1.2) (1.2)
All other grants ........................................................................................ 2.4 2.2 2.2 1.9 1.5 1.5 1.4 1.4 1.3Net Interest 2 ............................................................................................ 1.6 1.7 1.9 2.3 2.6 2.6 2.9 3.2 3.1All other 2 ................................................................................................. 3.2 2.9 3.2 3.2 2.9 2.8 2.4 2.8 2.4Undistributed offsetting receipts 2 ........................................................... –0.7 –0.7 –0.7 –0.9 –0.8 –1.0 –0.8 –0.8 –0.8
Total nondefense ................................................................................ 16.0 15.5 16.8 17.1 17.5 17.5 16.4 16.9 16.4
Addendum: GDP ($ billions) ....................................................................... 2,212.6 2,495.9 2,718.9 3,049.1 3,211.3 3,421.9 3,812.0 4,102.1 4,374.3
As percentages of outlays
Total outlays ................................................................................................. 100.0 100.0 100.0 100.0 100.0 100.0 100.0 100.0 100.0
National defense 1 ........................................................................................ 22.8 23.1 22.7 23.2 24.8 26.0 26.7 26.7 27.6Nondefense:
Payments for individuals ......................................................................... 46.2 46.4 47.1 47.9 48.0 49.1 47.1 45.1 45.6Direct payments 2 ................................................................................ (40.8) (40.9) (41.6) (42.3) (42.8) (43.8) (41.8) (39.9) (40.1)Grants to State and local governments ............................................. (5.4) (5.5) (5.5) (5.6) (5.2) (5.3) (5.3) (5.2) (5.5)
All other grants ........................................................................................ 11.6 11.1 9.9 8.4 6.6 6.2 6.1 6.0 5.8Net Interest 2 ............................................................................................ 7.7 8.5 8.9 10.1 11.4 11.1 13.0 13.7 13.7All other 2 ................................................................................................. 15.2 14.5 14.8 14.5 12.6 11.9 10.8 12.0 10.6Undistributed offsetting receipts 2 ........................................................... –3.4 –3.5 –3.4 –4.1 –3.5 –4.2 –3.8 –3.5 –3.3
Total nondefense ................................................................................ 77.2 76.9 77.3 76.8 75.2 74.0 73.3 73.3 72.4
See footnotes at end of table.
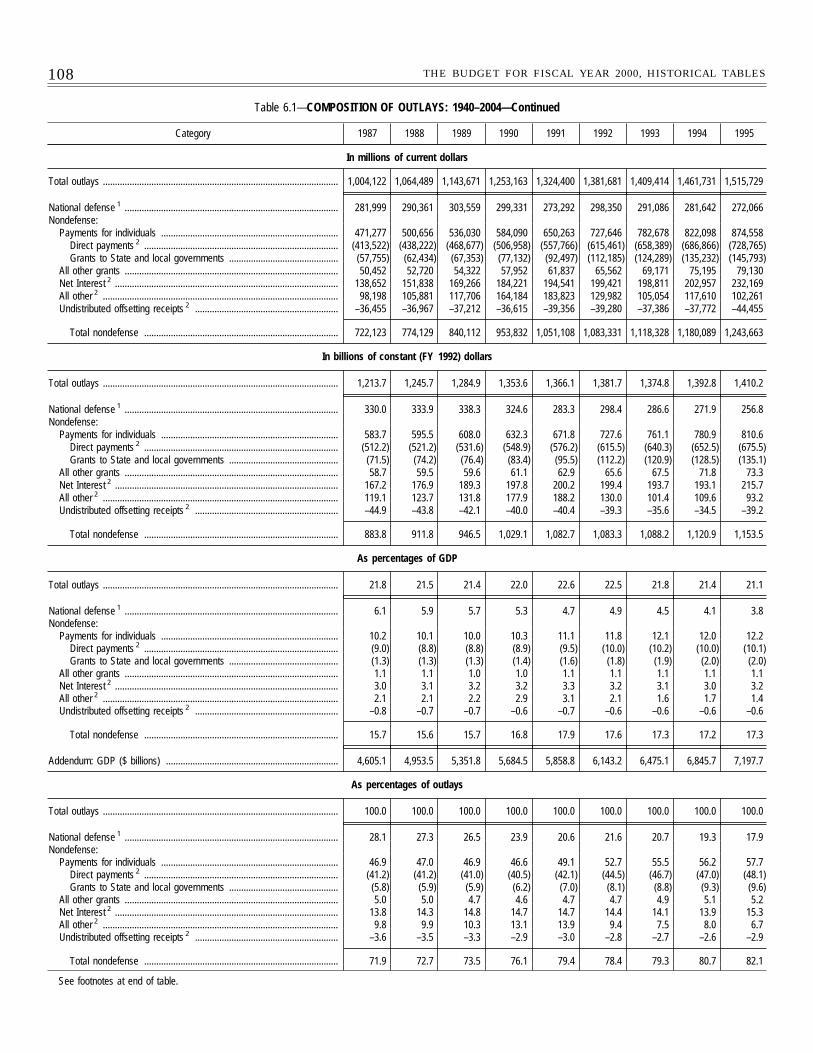
108 THE BUDGET FOR FISCAL YEAR 2000, HISTORICAL TABLES
Table 6.1—COMPOSITION OF OUTLAYS: 1940–2004—Continued
Category 1987 1988 1989 1990 1991 1992 1993 1994 1995
In millions of current dollars
Total outlays ................................................................................................. 1,004,122 1,064,489 1,143,671 1,253,163 1,324,400 1,381,681 1,409,414 1,461,731 1,515,729
National defense 1 ........................................................................................ 281,999 290,361 303,559 299,331 273,292 298,350 291,086 281,642 272,066Nondefense:
Payments for individuals ......................................................................... 471,277 500,656 536,030 584,090 650,263 727,646 782,678 822,098 874,558Direct payments 2 ................................................................................ (413,522) (438,222) (468,677) (506,958) (557,766) (615,461) (658,389) (686,866) (728,765)Grants to State and local governments ............................................. (57,755) (62,434) (67,353) (77,132) (92,497) (112,185) (124,289) (135,232) (145,793)
All other grants ........................................................................................ 50,452 52,720 54,322 57,952 61,837 65,562 69,171 75,195 79,130Net Interest 2 ............................................................................................ 138,652 151,838 169,266 184,221 194,541 199,421 198,811 202,957 232,169All other 2 ................................................................................................. 98,198 105,881 117,706 164,184 183,823 129,982 105,054 117,610 102,261Undistributed offsetting receipts 2 ........................................................... –36,455 –36,967 –37,212 –36,615 –39,356 –39,280 –37,386 –37,772 –44,455
Total nondefense ................................................................................ 722,123 774,129 840,112 953,832 1,051,108 1,083,331 1,118,328 1,180,089 1,243,663
In billions of constant (FY 1992) dollars
Total outlays ................................................................................................. 1,213.7 1,245.7 1,284.9 1,353.6 1,366.1 1,381.7 1,374.8 1,392.8 1,410.2
National defense 1 ........................................................................................ 330.0 333.9 338.3 324.6 283.3 298.4 286.6 271.9 256.8Nondefense:
Payments for individuals ......................................................................... 583.7 595.5 608.0 632.3 671.8 727.6 761.1 780.9 810.6Direct payments 2 ................................................................................ (512.2) (521.2) (531.6) (548.9) (576.2) (615.5) (640.3) (652.5) (675.5)Grants to State and local governments ............................................. (71.5) (74.2) (76.4) (83.4) (95.5) (112.2) (120.9) (128.5) (135.1)
All other grants ........................................................................................ 58.7 59.5 59.6 61.1 62.9 65.6 67.5 71.8 73.3Net Interest 2 ............................................................................................ 167.2 176.9 189.3 197.8 200.2 199.4 193.7 193.1 215.7All other 2 ................................................................................................. 119.1 123.7 131.8 177.9 188.2 130.0 101.4 109.6 93.2Undistributed offsetting receipts 2 ........................................................... –44.9 –43.8 –42.1 –40.0 –40.4 –39.3 –35.6 –34.5 –39.2
Total nondefense ................................................................................ 883.8 911.8 946.5 1,029.1 1,082.7 1,083.3 1,088.2 1,120.9 1,153.5
As percentages of GDP
Total outlays ................................................................................................. 21.8 21.5 21.4 22.0 22.6 22.5 21.8 21.4 21.1
National defense 1 ........................................................................................ 6.1 5.9 5.7 5.3 4.7 4.9 4.5 4.1 3.8Nondefense:
Payments for individuals ......................................................................... 10.2 10.1 10.0 10.3 11.1 11.8 12.1 12.0 12.2Direct payments 2 ................................................................................ (9.0) (8.8) (8.8) (8.9) (9.5) (10.0) (10.2) (10.0) (10.1)Grants to State and local governments ............................................. (1.3) (1.3) (1.3) (1.4) (1.6) (1.8) (1.9) (2.0) (2.0)
All other grants ........................................................................................ 1.1 1.1 1.0 1.0 1.1 1.1 1.1 1.1 1.1Net Interest 2 ............................................................................................ 3.0 3.1 3.2 3.2 3.3 3.2 3.1 3.0 3.2All other 2 ................................................................................................. 2.1 2.1 2.2 2.9 3.1 2.1 1.6 1.7 1.4Undistributed offsetting receipts 2 ........................................................... –0.8 –0.7 –0.7 –0.6 –0.7 –0.6 –0.6 –0.6 –0.6
Total nondefense ................................................................................ 15.7 15.6 15.7 16.8 17.9 17.6 17.3 17.2 17.3
Addendum: GDP ($ billions) ....................................................................... 4,605.1 4,953.5 5,351.8 5,684.5 5,858.8 6,143.2 6,475.1 6,845.7 7,197.7
As percentages of outlays
Total outlays ................................................................................................. 100.0 100.0 100.0 100.0 100.0 100.0 100.0 100.0 100.0
National defense 1 ........................................................................................ 28.1 27.3 26.5 23.9 20.6 21.6 20.7 19.3 17.9Nondefense:
Payments for individuals ......................................................................... 46.9 47.0 46.9 46.6 49.1 52.7 55.5 56.2 57.7Direct payments 2 ................................................................................ (41.2) (41.2) (41.0) (40.5) (42.1) (44.5) (46.7) (47.0) (48.1)Grants to State and local governments ............................................. (5.8) (5.9) (5.9) (6.2) (7.0) (8.1) (8.8) (9.3) (9.6)
All other grants ........................................................................................ 5.0 5.0 4.7 4.6 4.7 4.7 4.9 5.1 5.2Net Interest 2 ............................................................................................ 13.8 14.3 14.8 14.7 14.7 14.4 14.1 13.9 15.3All other 2 ................................................................................................. 9.8 9.9 10.3 13.1 13.9 9.4 7.5 8.0 6.7Undistributed offsetting receipts 2 ........................................................... –3.6 –3.5 –3.3 –2.9 –3.0 –2.8 –2.7 –2.6 –2.9
Total nondefense ................................................................................ 71.9 72.7 73.5 76.1 79.4 78.4 79.3 80.7 82.1
See footnotes at end of table.
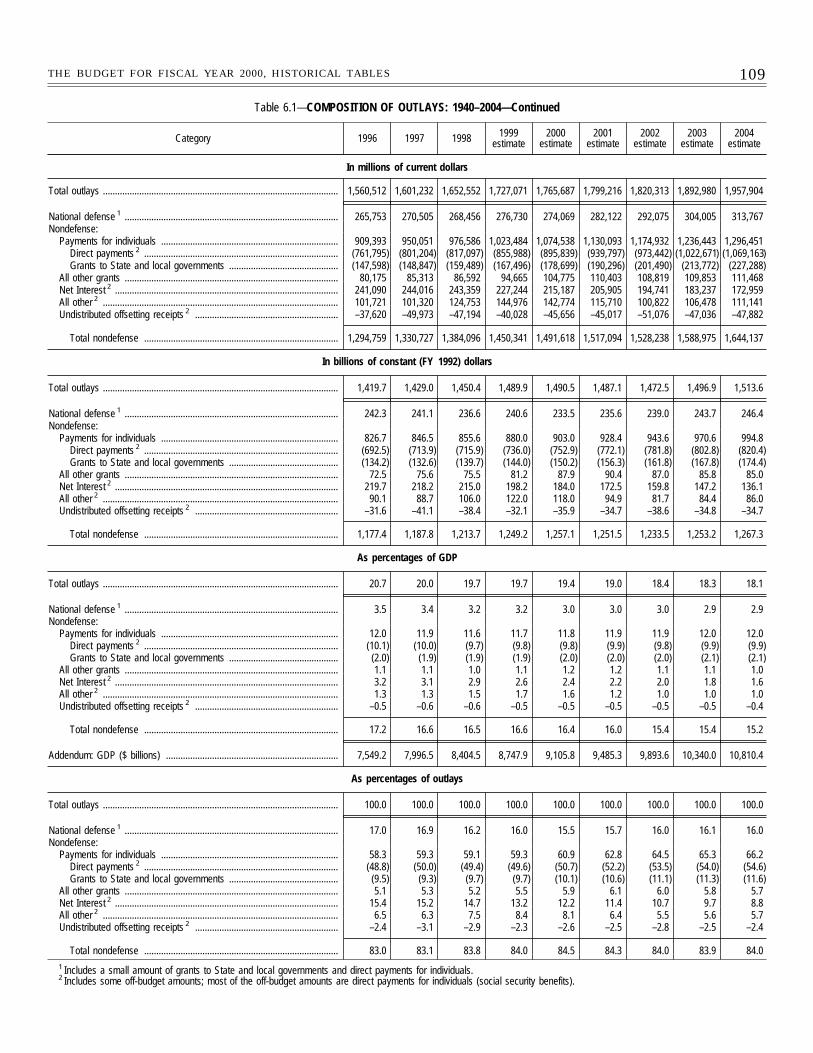
109THE BUDGET FOR FISCAL YEAR 2000, HISTORICAL TABLES
Table 6.1—COMPOSITION OF OUTLAYS: 1940–2004—Continued
Category 1996 1997 1998 1999estimate
2000estimate
2001estimate
2002estimate
2003estimate
2004estimate
In millions of current dollars
Total outlays ................................................................................................. 1,560,512 1,601,232 1,652,552 1,727,071 1,765,687 1,799,216 1,820,313 1,892,980 1,957,904
National defense 1 ........................................................................................ 265,753 270,505 268,456 276,730 274,069 282,122 292,075 304,005 313,767Nondefense:
Payments for individuals ......................................................................... 909,393 950,051 976,586 1,023,484 1,074,538 1,130,093 1,174,932 1,236,443 1,296,451Direct payments 2 ................................................................................ (761,795) (801,204) (817,097) (855,988) (895,839) (939,797) (973,442) (1,022,671) (1,069,163)Grants to State and local governments ............................................. (147,598) (148,847) (159,489) (167,496) (178,699) (190,296) (201,490) (213,772) (227,288)
All other grants ........................................................................................ 80,175 85,313 86,592 94,665 104,775 110,403 108,819 109,853 111,468Net Interest 2 ............................................................................................ 241,090 244,016 243,359 227,244 215,187 205,905 194,741 183,237 172,959All other 2 ................................................................................................. 101,721 101,320 124,753 144,976 142,774 115,710 100,822 106,478 111,141Undistributed offsetting receipts 2 ........................................................... –37,620 –49,973 –47,194 –40,028 –45,656 –45,017 –51,076 –47,036 –47,882
Total nondefense ................................................................................ 1,294,759 1,330,727 1,384,096 1,450,341 1,491,618 1,517,094 1,528,238 1,588,975 1,644,137
In billions of constant (FY 1992) dollars
Total outlays ................................................................................................. 1,419.7 1,429.0 1,450.4 1,489.9 1,490.5 1,487.1 1,472.5 1,496.9 1,513.6
National defense 1 ........................................................................................ 242.3 241.1 236.6 240.6 233.5 235.6 239.0 243.7 246.4Nondefense:
Payments for individuals ......................................................................... 826.7 846.5 855.6 880.0 903.0 928.4 943.6 970.6 994.8Direct payments 2 ................................................................................ (692.5) (713.9) (715.9) (736.0) (752.9) (772.1) (781.8) (802.8) (820.4)Grants to State and local governments ............................................. (134.2) (132.6) (139.7) (144.0) (150.2) (156.3) (161.8) (167.8) (174.4)
All other grants ........................................................................................ 72.5 75.6 75.5 81.2 87.9 90.4 87.0 85.8 85.0Net Interest 2 ............................................................................................ 219.7 218.2 215.0 198.2 184.0 172.5 159.8 147.2 136.1All other 2 ................................................................................................. 90.1 88.7 106.0 122.0 118.0 94.9 81.7 84.4 86.0Undistributed offsetting receipts 2 ........................................................... –31.6 –41.1 –38.4 –32.1 –35.9 –34.7 –38.6 –34.8 –34.7
Total nondefense ................................................................................ 1,177.4 1,187.8 1,213.7 1,249.2 1,257.1 1,251.5 1,233.5 1,253.2 1,267.3
As percentages of GDP
Total outlays ................................................................................................. 20.7 20.0 19.7 19.7 19.4 19.0 18.4 18.3 18.1
National defense 1 ........................................................................................ 3.5 3.4 3.2 3.2 3.0 3.0 3.0 2.9 2.9Nondefense:
Payments for individuals ......................................................................... 12.0 11.9 11.6 11.7 11.8 11.9 11.9 12.0 12.0Direct payments 2 ................................................................................ (10.1) (10.0) (9.7) (9.8) (9.8) (9.9) (9.8) (9.9) (9.9)Grants to State and local governments ............................................. (2.0) (1.9) (1.9) (1.9) (2.0) (2.0) (2.0) (2.1) (2.1)
All other grants ........................................................................................ 1.1 1.1 1.0 1.1 1.2 1.2 1.1 1.1 1.0Net Interest 2 ............................................................................................ 3.2 3.1 2.9 2.6 2.4 2.2 2.0 1.8 1.6All other 2 ................................................................................................. 1.3 1.3 1.5 1.7 1.6 1.2 1.0 1.0 1.0Undistributed offsetting receipts 2 ........................................................... –0.5 –0.6 –0.6 –0.5 –0.5 –0.5 –0.5 –0.5 –0.4
Total nondefense ................................................................................ 17.2 16.6 16.5 16.6 16.4 16.0 15.4 15.4 15.2
Addendum: GDP ($ billions) ....................................................................... 7,549.2 7,996.5 8,404.5 8,747.9 9,105.8 9,485.3 9,893.6 10,340.0 10,810.4
As percentages of outlays
Total outlays ................................................................................................. 100.0 100.0 100.0 100.0 100.0 100.0 100.0 100.0 100.0
National defense 1 ........................................................................................ 17.0 16.9 16.2 16.0 15.5 15.7 16.0 16.1 16.0Nondefense:
Payments for individuals ......................................................................... 58.3 59.3 59.1 59.3 60.9 62.8 64.5 65.3 66.2Direct payments 2 ................................................................................ (48.8) (50.0) (49.4) (49.6) (50.7) (52.2) (53.5) (54.0) (54.6)Grants to State and local governments ............................................. (9.5) (9.3) (9.7) (9.7) (10.1) (10.6) (11.1) (11.3) (11.6)
All other grants ........................................................................................ 5.1 5.3 5.2 5.5 5.9 6.1 6.0 5.8 5.7Net Interest 2 ............................................................................................ 15.4 15.2 14.7 13.2 12.2 11.4 10.7 9.7 8.8All other 2 ................................................................................................. 6.5 6.3 7.5 8.4 8.1 6.4 5.5 5.6 5.7Undistributed offsetting receipts 2 ........................................................... –2.4 –3.1 –2.9 –2.3 –2.6 –2.5 –2.8 –2.5 –2.4
Total nondefense ................................................................................ 83.0 83.1 83.8 84.0 84.5 84.3 84.0 83.9 84.01 Includes a small amount of grants to State and local governments and direct payments for individuals.2 Includes some off-budget amounts; most of the off-budget amounts are direct payments for individuals (social security benefits).
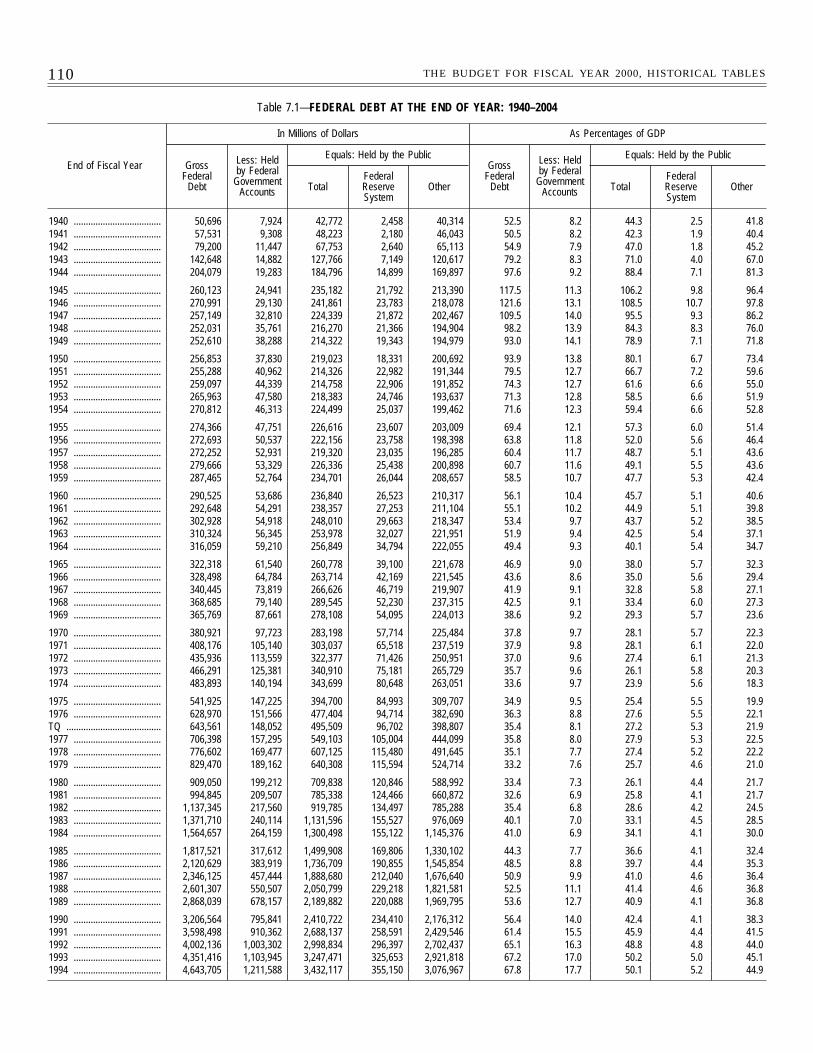
110 THE BUDGET FOR FISCAL YEAR 2000, HISTORICAL TABLES
Table 7.1—FEDERAL DEBT AT THE END OF YEAR: 1940–2004
End of Fiscal Year
In Millions of Dollars As Percentages of GDP
GrossFederal
Debt
Less: Heldby Federal
GovernmentAccounts
Equals: Held by the PublicGross
FederalDebt
Less: Heldby Federal
GovernmentAccounts
Equals: Held by the Public
TotalFederalReserveSystem
Other TotalFederalReserveSystem
Other
1940 .................................... 50,696 7,924 42,772 2,458 40,314 52.5 8.2 44.3 2.5 41.81941 .................................... 57,531 9,308 48,223 2,180 46,043 50.5 8.2 42.3 1.9 40.41942 .................................... 79,200 11,447 67,753 2,640 65,113 54.9 7.9 47.0 1.8 45.21943 .................................... 142,648 14,882 127,766 7,149 120,617 79.2 8.3 71.0 4.0 67.01944 .................................... 204,079 19,283 184,796 14,899 169,897 97.6 9.2 88.4 7.1 81.3
1945 .................................... 260,123 24,941 235,182 21,792 213,390 117.5 11.3 106.2 9.8 96.41946 .................................... 270,991 29,130 241,861 23,783 218,078 121.6 13.1 108.5 10.7 97.81947 .................................... 257,149 32,810 224,339 21,872 202,467 109.5 14.0 95.5 9.3 86.21948 .................................... 252,031 35,761 216,270 21,366 194,904 98.2 13.9 84.3 8.3 76.01949 .................................... 252,610 38,288 214,322 19,343 194,979 93.0 14.1 78.9 7.1 71.8
1950 .................................... 256,853 37,830 219,023 18,331 200,692 93.9 13.8 80.1 6.7 73.41951 .................................... 255,288 40,962 214,326 22,982 191,344 79.5 12.7 66.7 7.2 59.61952 .................................... 259,097 44,339 214,758 22,906 191,852 74.3 12.7 61.6 6.6 55.01953 .................................... 265,963 47,580 218,383 24,746 193,637 71.3 12.8 58.5 6.6 51.91954 .................................... 270,812 46,313 224,499 25,037 199,462 71.6 12.3 59.4 6.6 52.8
1955 .................................... 274,366 47,751 226,616 23,607 203,009 69.4 12.1 57.3 6.0 51.41956 .................................... 272,693 50,537 222,156 23,758 198,398 63.8 11.8 52.0 5.6 46.41957 .................................... 272,252 52,931 219,320 23,035 196,285 60.4 11.7 48.7 5.1 43.61958 .................................... 279,666 53,329 226,336 25,438 200,898 60.7 11.6 49.1 5.5 43.61959 .................................... 287,465 52,764 234,701 26,044 208,657 58.5 10.7 47.7 5.3 42.4
1960 .................................... 290,525 53,686 236,840 26,523 210,317 56.1 10.4 45.7 5.1 40.61961 .................................... 292,648 54,291 238,357 27,253 211,104 55.1 10.2 44.9 5.1 39.81962 .................................... 302,928 54,918 248,010 29,663 218,347 53.4 9.7 43.7 5.2 38.51963 .................................... 310,324 56,345 253,978 32,027 221,951 51.9 9.4 42.5 5.4 37.11964 .................................... 316,059 59,210 256,849 34,794 222,055 49.4 9.3 40.1 5.4 34.7
1965 .................................... 322,318 61,540 260,778 39,100 221,678 46.9 9.0 38.0 5.7 32.31966 .................................... 328,498 64,784 263,714 42,169 221,545 43.6 8.6 35.0 5.6 29.41967 .................................... 340,445 73,819 266,626 46,719 219,907 41.9 9.1 32.8 5.8 27.11968 .................................... 368,685 79,140 289,545 52,230 237,315 42.5 9.1 33.4 6.0 27.31969 .................................... 365,769 87,661 278,108 54,095 224,013 38.6 9.2 29.3 5.7 23.6
1970 .................................... 380,921 97,723 283,198 57,714 225,484 37.8 9.7 28.1 5.7 22.31971 .................................... 408,176 105,140 303,037 65,518 237,519 37.9 9.8 28.1 6.1 22.01972 .................................... 435,936 113,559 322,377 71,426 250,951 37.0 9.6 27.4 6.1 21.31973 .................................... 466,291 125,381 340,910 75,181 265,729 35.7 9.6 26.1 5.8 20.31974 .................................... 483,893 140,194 343,699 80,648 263,051 33.6 9.7 23.9 5.6 18.3
1975 .................................... 541,925 147,225 394,700 84,993 309,707 34.9 9.5 25.4 5.5 19.91976 .................................... 628,970 151,566 477,404 94,714 382,690 36.3 8.8 27.6 5.5 22.1TQ ....................................... 643,561 148,052 495,509 96,702 398,807 35.4 8.1 27.2 5.3 21.91977 .................................... 706,398 157,295 549,103 105,004 444,099 35.8 8.0 27.9 5.3 22.51978 .................................... 776,602 169,477 607,125 115,480 491,645 35.1 7.7 27.4 5.2 22.21979 .................................... 829,470 189,162 640,308 115,594 524,714 33.2 7.6 25.7 4.6 21.0
1980 .................................... 909,050 199,212 709,838 120,846 588,992 33.4 7.3 26.1 4.4 21.71981 .................................... 994,845 209,507 785,338 124,466 660,872 32.6 6.9 25.8 4.1 21.71982 .................................... 1,137,345 217,560 919,785 134,497 785,288 35.4 6.8 28.6 4.2 24.51983 .................................... 1,371,710 240,114 1,131,596 155,527 976,069 40.1 7.0 33.1 4.5 28.51984 .................................... 1,564,657 264,159 1,300,498 155,122 1,145,376 41.0 6.9 34.1 4.1 30.0
1985 .................................... 1,817,521 317,612 1,499,908 169,806 1,330,102 44.3 7.7 36.6 4.1 32.41986 .................................... 2,120,629 383,919 1,736,709 190,855 1,545,854 48.5 8.8 39.7 4.4 35.31987 .................................... 2,346,125 457,444 1,888,680 212,040 1,676,640 50.9 9.9 41.0 4.6 36.41988 .................................... 2,601,307 550,507 2,050,799 229,218 1,821,581 52.5 11.1 41.4 4.6 36.81989 .................................... 2,868,039 678,157 2,189,882 220,088 1,969,795 53.6 12.7 40.9 4.1 36.8
1990 .................................... 3,206,564 795,841 2,410,722 234,410 2,176,312 56.4 14.0 42.4 4.1 38.31991 .................................... 3,598,498 910,362 2,688,137 258,591 2,429,546 61.4 15.5 45.9 4.4 41.51992 .................................... 4,002,136 1,003,302 2,998,834 296,397 2,702,437 65.1 16.3 48.8 4.8 44.01993 .................................... 4,351,416 1,103,945 3,247,471 325,653 2,921,818 67.2 17.0 50.2 5.0 45.11994 .................................... 4,643,705 1,211,588 3,432,117 355,150 3,076,967 67.8 17.7 50.1 5.2 44.9
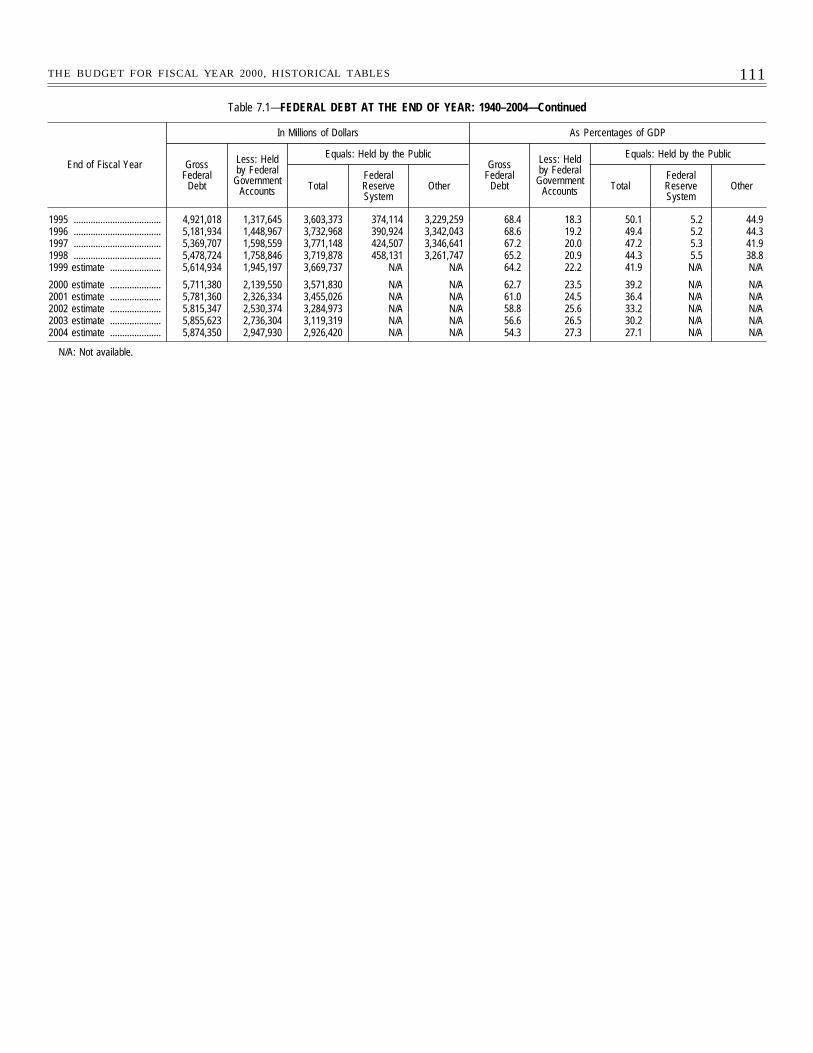
111THE BUDGET FOR FISCAL YEAR 2000, HISTORICAL TABLES
Table 7.1—FEDERAL DEBT AT THE END OF YEAR: 1940–2004—Continued
End of Fiscal Year
In Millions of Dollars As Percentages of GDP
GrossFederal
Debt
Less: Heldby Federal
GovernmentAccounts
Equals: Held by the PublicGross
FederalDebt
Less: Heldby Federal
GovernmentAccounts
Equals: Held by the Public
TotalFederalReserveSystem
Other TotalFederalReserveSystem
Other
1995 .................................... 4,921,018 1,317,645 3,603,373 374,114 3,229,259 68.4 18.3 50.1 5.2 44.91996 .................................... 5,181,934 1,448,967 3,732,968 390,924 3,342,043 68.6 19.2 49.4 5.2 44.31997 .................................... 5,369,707 1,598,559 3,771,148 424,507 3,346,641 67.2 20.0 47.2 5.3 41.91998 .................................... 5,478,724 1,758,846 3,719,878 458,131 3,261,747 65.2 20.9 44.3 5.5 38.81999 estimate ..................... 5,614,934 1,945,197 3,669,737 N/A N/A 64.2 22.2 41.9 N/A N/A
2000 estimate ..................... 5,711,380 2,139,550 3,571,830 N/A N/A 62.7 23.5 39.2 N/A N/A2001 estimate ..................... 5,781,360 2,326,334 3,455,026 N/A N/A 61.0 24.5 36.4 N/A N/A2002 estimate ..................... 5,815,347 2,530,374 3,284,973 N/A N/A 58.8 25.6 33.2 N/A N/A2003 estimate ..................... 5,855,623 2,736,304 3,119,319 N/A N/A 56.6 26.5 30.2 N/A N/A2004 estimate ..................... 5,874,350 2,947,930 2,926,420 N/A N/A 54.3 27.3 27.1 N/A N/A
N/A: Not available.
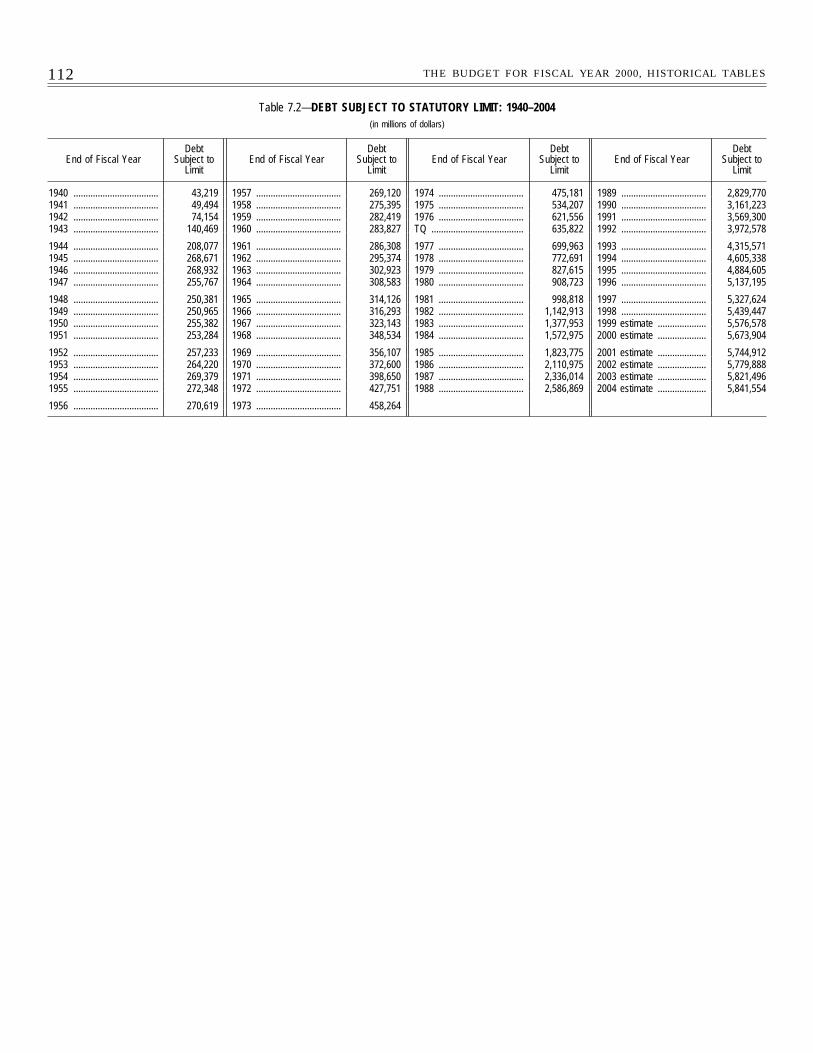
112 THE BUDGET FOR FISCAL YEAR 2000, HISTORICAL TABLES
Table 7.2—DEBT SUBJECT TO STATUTORY LIMIT: 1940–2004(in millions of dollars)
End of Fiscal YearDebt
Subject toLimit
End of Fiscal YearDebt
Subject toLimit
End of Fiscal YearDebt
Subject toLimit
End of Fiscal YearDebt
Subject toLimit
1940 ................................... 43,219 1957 ................................... 269,120 1974 ................................... 475,181 1989 ................................... 2,829,7701941 ................................... 49,494 1958 ................................... 275,395 1975 ................................... 534,207 1990 ................................... 3,161,2231942 ................................... 74,154 1959 ................................... 282,419 1976 ................................... 621,556 1991 ................................... 3,569,3001943 ................................... 140,469 1960 ................................... 283,827 TQ ...................................... 635,822 1992 ................................... 3,972,578
1944 ................................... 208,077 1961 ................................... 286,308 1977 ................................... 699,963 1993 ................................... 4,315,5711945 ................................... 268,671 1962 ................................... 295,374 1978 ................................... 772,691 1994 ................................... 4,605,3381946 ................................... 268,932 1963 ................................... 302,923 1979 ................................... 827,615 1995 ................................... 4,884,6051947 ................................... 255,767 1964 ................................... 308,583 1980 ................................... 908,723 1996 ................................... 5,137,195
1948 ................................... 250,381 1965 ................................... 314,126 1981 ................................... 998,818 1997 ................................... 5,327,6241949 ................................... 250,965 1966 ................................... 316,293 1982 ................................... 1,142,913 1998 ................................... 5,439,4471950 ................................... 255,382 1967 ................................... 323,143 1983 ................................... 1,377,953 1999 estimate .................... 5,576,5781951 ................................... 253,284 1968 ................................... 348,534 1984 ................................... 1,572,975 2000 estimate .................... 5,673,904
1952 ................................... 257,233 1969 ................................... 356,107 1985 ................................... 1,823,775 2001 estimate .................... 5,744,9121953 ................................... 264,220 1970 ................................... 372,600 1986 ................................... 2,110,975 2002 estimate .................... 5,779,8881954 ................................... 269,379 1971 ................................... 398,650 1987 ................................... 2,336,014 2003 estimate .................... 5,821,4961955 ................................... 272,348 1972 ................................... 427,751 1988 ................................... 2,586,869 2004 estimate .................... 5,841,554
1956 ................................... 270,619 1973 ................................... 458,264
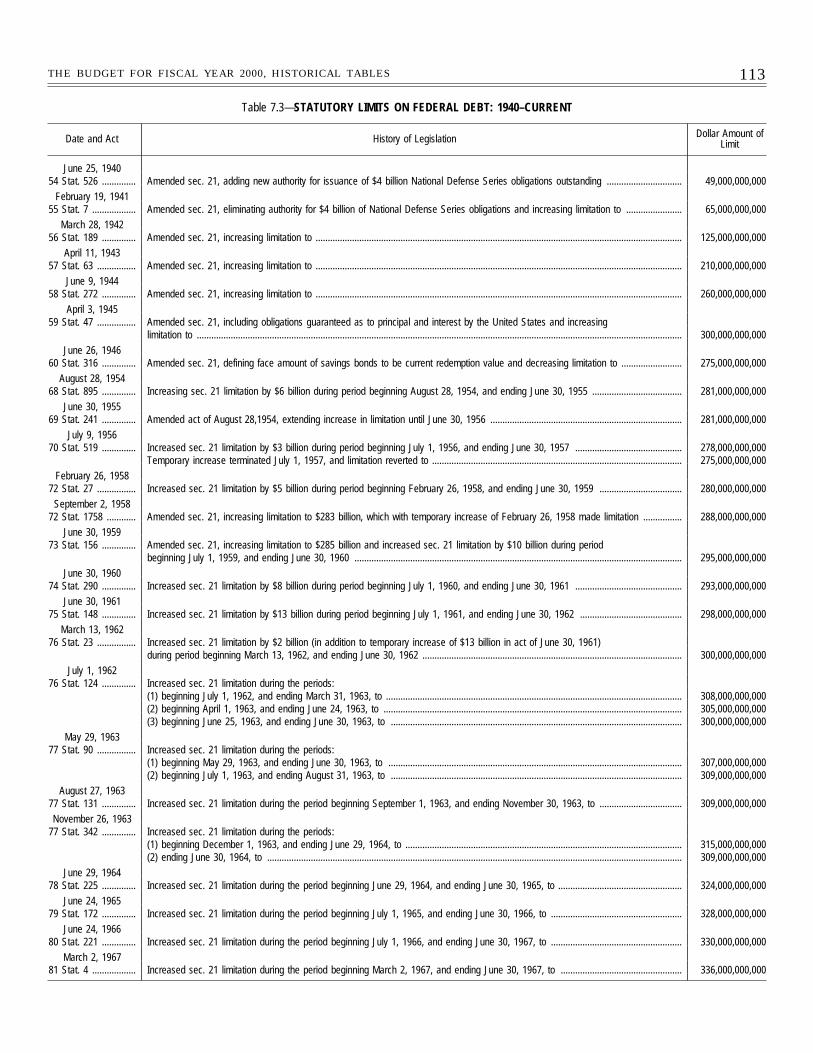
113THE BUDGET FOR FISCAL YEAR 2000, HISTORICAL TABLES
Table 7.3—STATUTORY LIMITS ON FEDERAL DEBT: 1940–CURRENT
Date and Act History of Legislation Dollar Amount ofLimit
June 25, 194054 Stat. 526 .............. Amended sec. 21, adding new authority for issuance of $4 billion National Defense Series obligations outstanding ............................... 49,000,000,000
February 19, 194155 Stat. 7 .................. Amended sec. 21, eliminating authority for $4 billion of National Defense Series obligations and increasing limitation to ....................... 65,000,000,000
March 28, 194256 Stat. 189 .............. Amended sec. 21, increasing limitation to ....................................................................................................................................................... 125,000,000,000
April 11, 194357 Stat. 63 ................ Amended sec. 21, increasing limitation to ....................................................................................................................................................... 210,000,000,000
June 9, 194458 Stat. 272 .............. Amended sec. 21, increasing limitation to ....................................................................................................................................................... 260,000,000,000
April 3, 194559 Stat. 47 ................ Amended sec. 21, including obligations guaranteed as to principal and interest by the United States and increasing
limitation to ........................................................................................................................................................................................................ 300,000,000,000
June 26, 194660 Stat. 316 .............. Amended sec. 21, defining face amount of savings bonds to be current redemption value and decreasing limitation to ......................... 275,000,000,000
August 28, 195468 Stat. 895 .............. Increasing sec. 21 limitation by $6 billion during period beginning August 28, 1954, and ending June 30, 1955 ..................................... 281,000,000,000
June 30, 195569 Stat. 241 .............. Amended act of August 28,1954, extending increase in limitation until June 30, 1956 ............................................................................... 281,000,000,000
July 9, 195670 Stat. 519 .............. Increased sec. 21 limitation by $3 billion during period beginning July 1, 1956, and ending June 30, 1957 ............................................ 278,000,000,000
Temporary increase terminated July 1, 1957, and limitation reverted to ....................................................................................................... 275,000,000,000
February 26, 195872 Stat. 27 ................ Increased sec. 21 limitation by $5 billion during period beginning February 26, 1958, and ending June 30, 1959 .................................. 280,000,000,000
September 2, 195872 Stat. 1758 ............ Amended sec. 21, increasing limitation to $283 billion, which with temporary increase of February 26, 1958 made limitation ................ 288,000,000,000
June 30, 195973 Stat. 156 .............. Amended sec. 21, increasing limitation to $285 billion and increased sec. 21 limitation by $10 billion during period
beginning July 1, 1959, and ending June 30, 1960 ....................................................................................................................................... 295,000,000,000
June 30, 196074 Stat. 290 .............. Increased sec. 21 limitation by $8 billion during period beginning July 1, 1960, and ending June 30, 1961 ............................................ 293,000,000,000
June 30, 196175 Stat. 148 .............. Increased sec. 21 limitation by $13 billion during period beginning July 1, 1961, and ending June 30, 1962 .......................................... 298,000,000,000
March 13, 196276 Stat. 23 ................ Increased sec. 21 limitation by $2 billion (in addition to temporary increase of $13 billion in act of June 30, 1961)
during period beginning March 13, 1962, and ending June 30, 1962 ........................................................................................................... 300,000,000,000
July 1, 196276 Stat. 124 .............. Increased sec. 21 limitation during the periods:
(1) beginning July 1, 1962, and ending March 31, 1963, to .......................................................................................................................... 308,000,000,000(2) beginning April 1, 1963, and ending June 24, 1963, to ........................................................................................................................... 305,000,000,000(3) beginning June 25, 1963, and ending June 30, 1963, to ........................................................................................................................ 300,000,000,000
May 29, 196377 Stat. 90 ................ Increased sec. 21 limitation during the periods:
(1) beginning May 29, 1963, and ending June 30, 1963, to ......................................................................................................................... 307,000,000,000(2) beginning July 1, 1963, and ending August 31, 1963, to ........................................................................................................................ 309,000,000,000
August 27, 196377 Stat. 131 .............. Increased sec. 21 limitation during the period beginning September 1, 1963, and ending November 30, 1963, to .................................. 309,000,000,000
November 26, 196377 Stat. 342 .............. Increased sec. 21 limitation during the periods:
(1) beginning December 1, 1963, and ending June 29, 1964, to .................................................................................................................. 315,000,000,000(2) ending June 30, 1964, to ........................................................................................................................................................................... 309,000,000,000
June 29, 196478 Stat. 225 .............. Increased sec. 21 limitation during the period beginning June 29, 1964, and ending June 30, 1965, to ................................................... 324,000,000,000
June 24, 196579 Stat. 172 .............. Increased sec. 21 limitation during the period beginning July 1, 1965, and ending June 30, 1966, to ...................................................... 328,000,000,000
June 24, 196680 Stat. 221 .............. Increased sec. 21 limitation during the period beginning July 1, 1966, and ending June 30, 1967, to ...................................................... 330,000,000,000
March 2, 196781 Stat. 4 .................. Increased sec. 21 limitation during the period beginning March 2, 1967, and ending June 30, 1967, to .................................................. 336,000,000,000
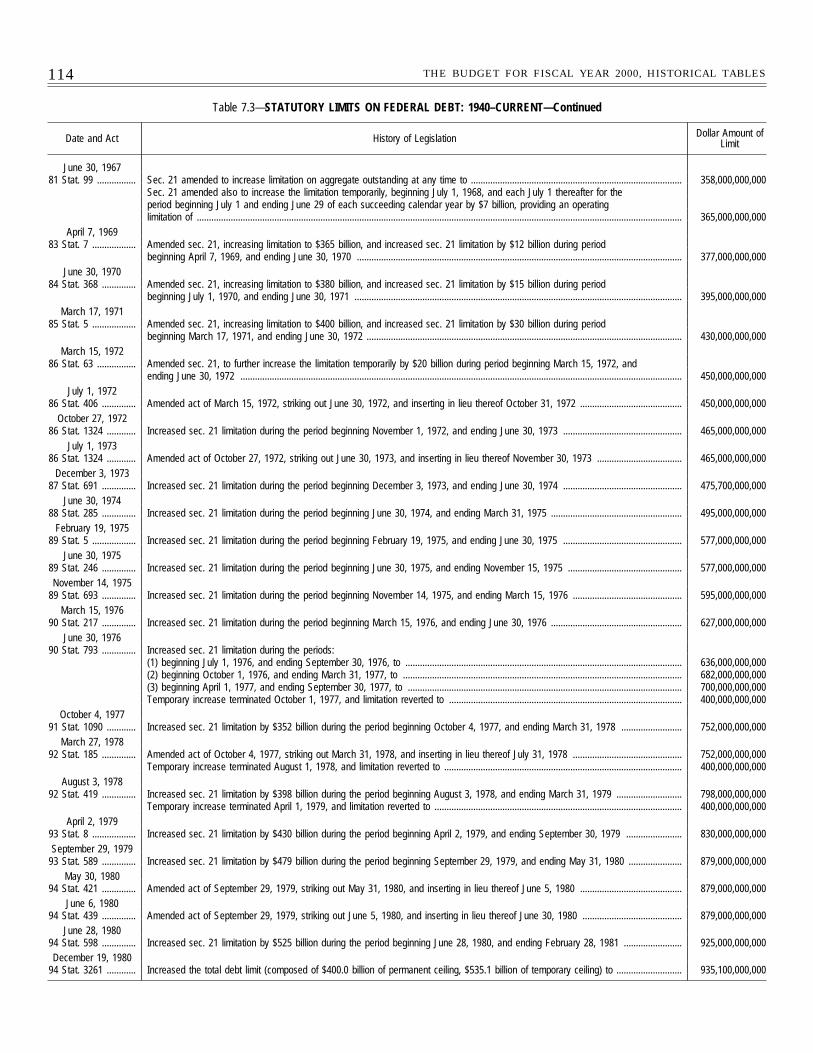
114 THE BUDGET FOR FISCAL YEAR 2000, HISTORICAL TABLES
Table 7.3—STATUTORY LIMITS ON FEDERAL DEBT: 1940–CURRENT—Continued
Date and Act History of Legislation Dollar Amount ofLimit
June 30, 196781 Stat. 99 ................ Sec. 21 amended to increase limitation on aggregate outstanding at any time to ....................................................................................... 358,000,000,000
Sec. 21 amended also to increase the limitation temporarily, beginning July 1, 1968, and each July 1 thereafter for theperiod beginning July 1 and ending June 29 of each succeeding calendar year by $7 billion, providing an operatinglimitation of ........................................................................................................................................................................................................ 365,000,000,000
April 7, 196983 Stat. 7 .................. Amended sec. 21, increasing limitation to $365 billion, and increased sec. 21 limitation by $12 billion during period
beginning April 7, 1969, and ending June 30, 1970 ...................................................................................................................................... 377,000,000,000June 30, 1970
84 Stat. 368 .............. Amended sec. 21, increasing limitation to $380 billion, and increased sec. 21 limitation by $15 billion during periodbeginning July 1, 1970, and ending June 30, 1971 ....................................................................................................................................... 395,000,000,000
March 17, 197185 Stat. 5 .................. Amended sec. 21, increasing limitation to $400 billion, and increased sec. 21 limitation by $30 billion during period
beginning March 17, 1971, and ending June 30, 1972 .................................................................................................................................. 430,000,000,000March 15, 1972
86 Stat. 63 ................ Amended sec. 21, to further increase the limitation temporarily by $20 billion during period beginning March 15, 1972, andending June 30, 1972 ...................................................................................................................................................................................... 450,000,000,000
July 1, 197286 Stat. 406 .............. Amended act of March 15, 1972, striking out June 30, 1972, and inserting in lieu thereof October 31, 1972 .......................................... 450,000,000,000
October 27, 197286 Stat. 1324 ............ Increased sec. 21 limitation during the period beginning November 1, 1972, and ending June 30, 1973 ................................................. 465,000,000,000
July 1, 197386 Stat. 1324 ............ Amended act of October 27, 1972, striking out June 30, 1973, and inserting in lieu thereof November 30, 1973 ................................... 465,000,000,000
December 3, 197387 Stat. 691 .............. Increased sec. 21 limitation during the period beginning December 3, 1973, and ending June 30, 1974 ................................................. 475,700,000,000
June 30, 197488 Stat. 285 .............. Increased sec. 21 limitation during the period beginning June 30, 1974, and ending March 31, 1975 ...................................................... 495,000,000,000
February 19, 197589 Stat. 5 .................. Increased sec. 21 limitation during the period beginning February 19, 1975, and ending June 30, 1975 ................................................. 577,000,000,000
June 30, 197589 Stat. 246 .............. Increased sec. 21 limitation during the period beginning June 30, 1975, and ending November 15, 1975 ............................................... 577,000,000,000November 14, 1975
89 Stat. 693 .............. Increased sec. 21 limitation during the period beginning November 14, 1975, and ending March 15, 1976 ............................................. 595,000,000,000March 15, 1976
90 Stat. 217 .............. Increased sec. 21 limitation during the period beginning March 15, 1976, and ending June 30, 1976 ...................................................... 627,000,000,000June 30, 1976
90 Stat. 793 .............. Increased sec. 21 limitation during the periods:(1) beginning July 1, 1976, and ending September 30, 1976, to .................................................................................................................. 636,000,000,000(2) beginning October 1, 1976, and ending March 31, 1977, to ................................................................................................................... 682,000,000,000(3) beginning April 1, 1977, and ending September 30, 1977, to ................................................................................................................. 700,000,000,000Temporary increase terminated October 1, 1977, and limitation reverted to ................................................................................................ 400,000,000,000
October 4, 197791 Stat. 1090 ............ Increased sec. 21 limitation by $352 billion during the period beginning October 4, 1977, and ending March 31, 1978 ......................... 752,000,000,000
March 27, 197892 Stat. 185 .............. Amended act of October 4, 1977, striking out March 31, 1978, and inserting in lieu thereof July 31, 1978 ............................................. 752,000,000,000
Temporary increase terminated August 1, 1978, and limitation reverted to .................................................................................................. 400,000,000,000August 3, 1978
92 Stat. 419 .............. Increased sec. 21 limitation by $398 billion during the period beginning August 3, 1978, and ending March 31, 1979 ........................... 798,000,000,000Temporary increase terminated April 1, 1979, and limitation reverted to ...................................................................................................... 400,000,000,000
April 2, 197993 Stat. 8 .................. Increased sec. 21 limitation by $430 billion during the period beginning April 2, 1979, and ending September 30, 1979 ....................... 830,000,000,000September 29, 1979
93 Stat. 589 .............. Increased sec. 21 limitation by $479 billion during the period beginning September 29, 1979, and ending May 31, 1980 ...................... 879,000,000,000May 30, 1980
94 Stat. 421 .............. Amended act of September 29, 1979, striking out May 31, 1980, and inserting in lieu thereof June 5, 1980 .......................................... 879,000,000,000June 6, 1980
94 Stat. 439 .............. Amended act of September 29, 1979, striking out June 5, 1980, and inserting in lieu thereof June 30, 1980 ......................................... 879,000,000,000June 28, 1980
94 Stat. 598 .............. Increased sec. 21 limitation by $525 billion during the period beginning June 28, 1980, and ending February 28, 1981 ........................ 925,000,000,000December 19, 1980
94 Stat. 3261 ............ Increased the total debt limit (composed of $400.0 billion of permanent ceiling, $535.1 billion of temporary ceiling) to ........................... 935,100,000,000
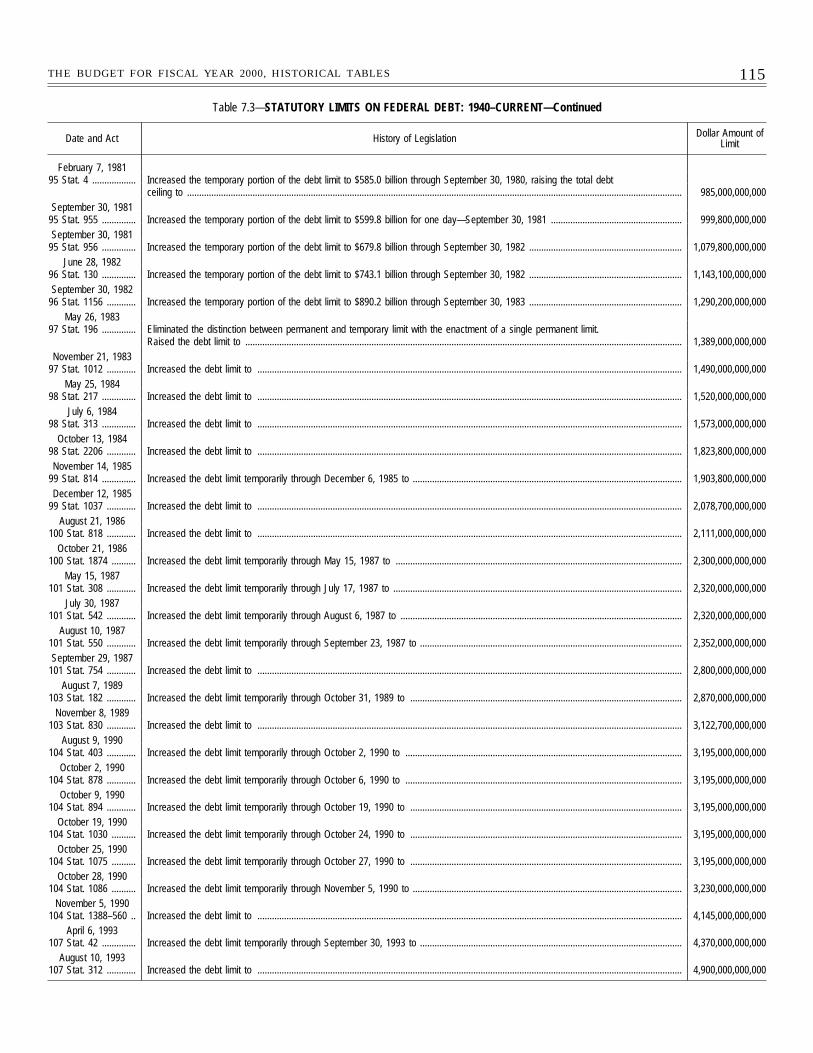
115THE BUDGET FOR FISCAL YEAR 2000, HISTORICAL TABLES
Table 7.3—STATUTORY LIMITS ON FEDERAL DEBT: 1940–CURRENT—Continued
Date and Act History of Legislation Dollar Amount ofLimit
February 7, 198195 Stat. 4 .................. Increased the temporary portion of the debt limit to $585.0 billion through September 30, 1980, raising the total debt
ceiling to ............................................................................................................................................................................................................ 985,000,000,000September 30, 1981
95 Stat. 955 .............. Increased the temporary portion of the debt limit to $599.8 billion for one day—September 30, 1981 ...................................................... 999,800,000,000September 30, 1981
95 Stat. 956 .............. Increased the temporary portion of the debt limit to $679.8 billion through September 30, 1982 ............................................................... 1,079,800,000,000June 28, 1982
96 Stat. 130 .............. Increased the temporary portion of the debt limit to $743.1 billion through September 30, 1982 ............................................................... 1,143,100,000,000September 30, 1982
96 Stat. 1156 ............ Increased the temporary portion of the debt limit to $890.2 billion through September 30, 1983 ............................................................... 1,290,200,000,000May 26, 1983
97 Stat. 196 .............. Eliminated the distinction between permanent and temporary limit with the enactment of a single permanent limit.Raised the debt limit to .................................................................................................................................................................................... 1,389,000,000,000
November 21, 198397 Stat. 1012 ............ Increased the debt limit to ............................................................................................................................................................................... 1,490,000,000,000
May 25, 198498 Stat. 217 .............. Increased the debt limit to ............................................................................................................................................................................... 1,520,000,000,000
July 6, 198498 Stat. 313 .............. Increased the debt limit to ............................................................................................................................................................................... 1,573,000,000,000
October 13, 198498 Stat. 2206 ............ Increased the debt limit to ............................................................................................................................................................................... 1,823,800,000,000November 14, 1985
99 Stat. 814 .............. Increased the debt limit temporarily through December 6, 1985 to ............................................................................................................... 1,903,800,000,000December 12, 1985
99 Stat. 1037 ............ Increased the debt limit to ............................................................................................................................................................................... 2,078,700,000,000August 21, 1986
100 Stat. 818 ............ Increased the debt limit to ............................................................................................................................................................................... 2,111,000,000,000October 21, 1986
100 Stat. 1874 .......... Increased the debt limit temporarily through May 15, 1987 to ...................................................................................................................... 2,300,000,000,000May 15, 1987
101 Stat. 308 ............ Increased the debt limit temporarily through July 17, 1987 to ....................................................................................................................... 2,320,000,000,000July 30, 1987
101 Stat. 542 ............ Increased the debt limit temporarily through August 6, 1987 to .................................................................................................................... 2,320,000,000,000August 10, 1987
101 Stat. 550 ............ Increased the debt limit temporarily through September 23, 1987 to ............................................................................................................ 2,352,000,000,000September 29, 1987
101 Stat. 754 ............ Increased the debt limit to ............................................................................................................................................................................... 2,800,000,000,000August 7, 1989
103 Stat. 182 ............ Increased the debt limit temporarily through October 31, 1989 to ................................................................................................................ 2,870,000,000,000November 8, 1989
103 Stat. 830 ............ Increased the debt limit to ............................................................................................................................................................................... 3,122,700,000,000August 9, 1990
104 Stat. 403 ............ Increased the debt limit temporarily through October 2, 1990 to .................................................................................................................. 3,195,000,000,000October 2, 1990
104 Stat. 878 ............ Increased the debt limit temporarily through October 6, 1990 to .................................................................................................................. 3,195,000,000,000October 9, 1990
104 Stat. 894 ............ Increased the debt limit temporarily through October 19, 1990 to ................................................................................................................ 3,195,000,000,000October 19, 1990
104 Stat. 1030 .......... Increased the debt limit temporarily through October 24, 1990 to ................................................................................................................ 3,195,000,000,000October 25, 1990
104 Stat. 1075 .......... Increased the debt limit temporarily through October 27, 1990 to ................................................................................................................ 3,195,000,000,000October 28, 1990
104 Stat. 1086 .......... Increased the debt limit temporarily through November 5, 1990 to ............................................................................................................... 3,230,000,000,000November 5, 1990
104 Stat. 1388–560 .. Increased the debt limit to ............................................................................................................................................................................... 4,145,000,000,000April 6, 1993
107 Stat. 42 .............. Increased the debt limit temporarily through September 30, 1993 to ............................................................................................................ 4,370,000,000,000August 10, 1993
107 Stat. 312 ............ Increased the debt limit to ............................................................................................................................................................................... 4,900,000,000,000
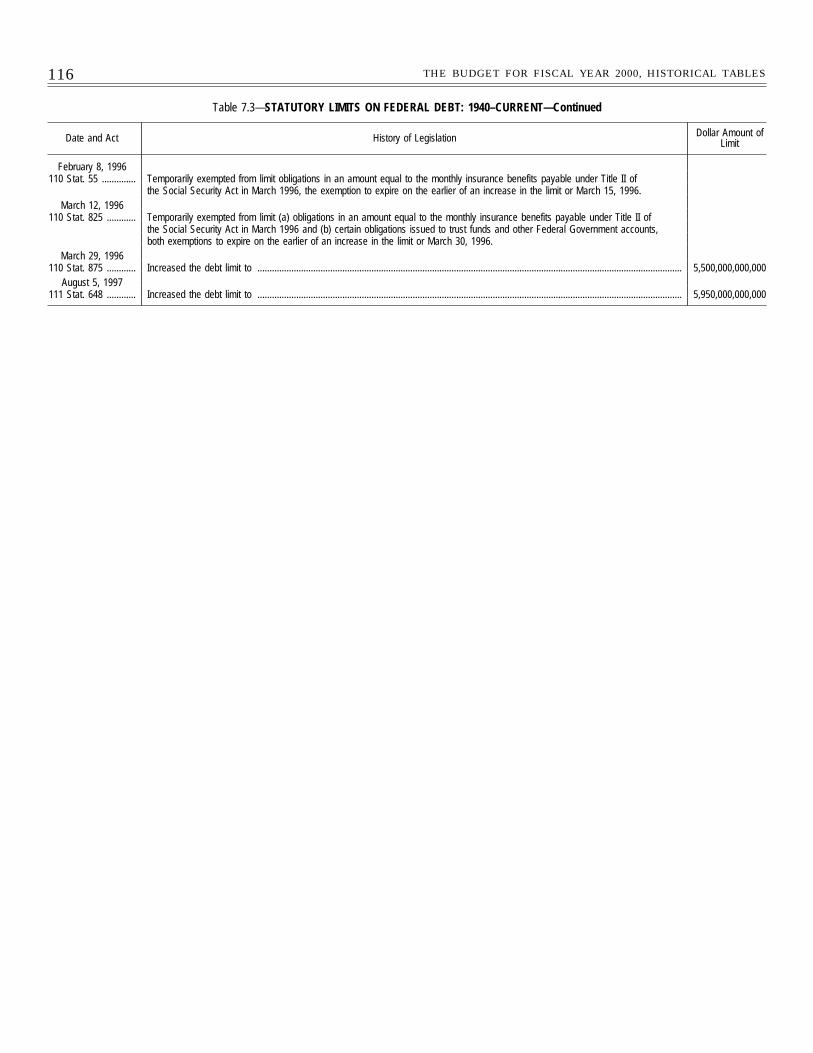
116 THE BUDGET FOR FISCAL YEAR 2000, HISTORICAL TABLES
Table 7.3—STATUTORY LIMITS ON FEDERAL DEBT: 1940–CURRENT—Continued
Date and Act History of Legislation Dollar Amount ofLimit
February 8, 1996110 Stat. 55 .............. Temporarily exempted from limit obligations in an amount equal to the monthly insurance benefits payable under Title II of
the Social Security Act in March 1996, the exemption to expire on the earlier of an increase in the limit or March 15, 1996.March 12, 1996
110 Stat. 825 ............ Temporarily exempted from limit (a) obligations in an amount equal to the monthly insurance benefits payable under Title II ofthe Social Security Act in March 1996 and (b) certain obligations issued to trust funds and other Federal Government accounts,both exemptions to expire on the earlier of an increase in the limit or March 30, 1996.
March 29, 1996110 Stat. 875 ............ Increased the debt limit to ............................................................................................................................................................................... 5,500,000,000,000
August 5, 1997111 Stat. 648 ............ Increased the debt limit to ............................................................................................................................................................................... 5,950,000,000,000
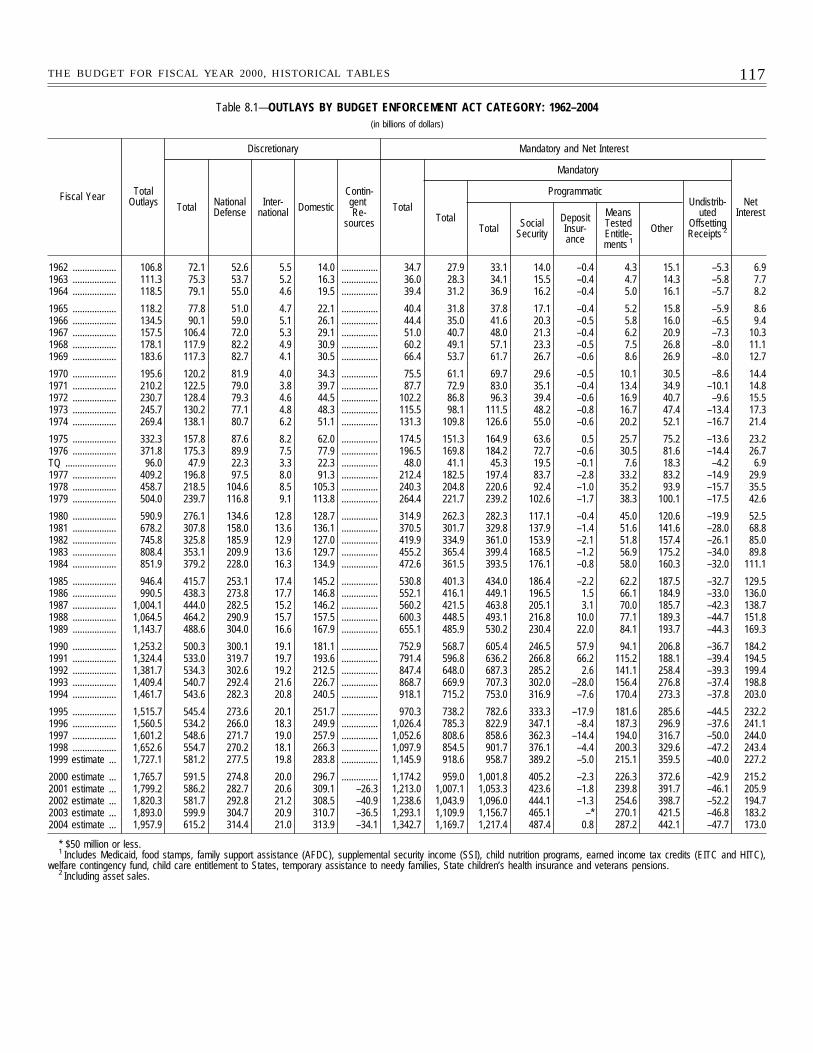
117THE BUDGET FOR FISCAL YEAR 2000, HISTORICAL TABLES
Table 8.1—OUTLAYS BY BUDGET ENFORCEMENT ACT CATEGORY: 1962–2004(in billions of dollars)
Fiscal Year TotalOutlays
Discretionary Mandatory and Net Interest
Total NationalDefense
Inter-national Domestic
Contin-gent Re-
sources
Total
Mandatory
NetInterestTotal
ProgrammaticUndistrib-
utedOffsettingReceipts 2Total Social
Security
DepositInsur-ance
MeansTestedEntitle-ments 1
Other
1962 .................. 106.8 72.1 52.6 5.5 14.0 ............... 34.7 27.9 33.1 14.0 –0.4 4.3 15.1 –5.3 6.91963 .................. 111.3 75.3 53.7 5.2 16.3 ............... 36.0 28.3 34.1 15.5 –0.4 4.7 14.3 –5.8 7.71964 .................. 118.5 79.1 55.0 4.6 19.5 ............... 39.4 31.2 36.9 16.2 –0.4 5.0 16.1 –5.7 8.2
1965 .................. 118.2 77.8 51.0 4.7 22.1 ............... 40.4 31.8 37.8 17.1 –0.4 5.2 15.8 –5.9 8.61966 .................. 134.5 90.1 59.0 5.1 26.1 ............... 44.4 35.0 41.6 20.3 –0.5 5.8 16.0 –6.5 9.41967 .................. 157.5 106.4 72.0 5.3 29.1 ............... 51.0 40.7 48.0 21.3 –0.4 6.2 20.9 –7.3 10.31968 .................. 178.1 117.9 82.2 4.9 30.9 ............... 60.2 49.1 57.1 23.3 –0.5 7.5 26.8 –8.0 11.11969 .................. 183.6 117.3 82.7 4.1 30.5 ............... 66.4 53.7 61.7 26.7 –0.6 8.6 26.9 –8.0 12.7
1970 .................. 195.6 120.2 81.9 4.0 34.3 ............... 75.5 61.1 69.7 29.6 –0.5 10.1 30.5 –8.6 14.41971 .................. 210.2 122.5 79.0 3.8 39.7 ............... 87.7 72.9 83.0 35.1 –0.4 13.4 34.9 –10.1 14.81972 .................. 230.7 128.4 79.3 4.6 44.5 ............... 102.2 86.8 96.3 39.4 –0.6 16.9 40.7 –9.6 15.51973 .................. 245.7 130.2 77.1 4.8 48.3 ............... 115.5 98.1 111.5 48.2 –0.8 16.7 47.4 –13.4 17.31974 .................. 269.4 138.1 80.7 6.2 51.1 ............... 131.3 109.8 126.6 55.0 –0.6 20.2 52.1 –16.7 21.4
1975 .................. 332.3 157.8 87.6 8.2 62.0 ............... 174.5 151.3 164.9 63.6 0.5 25.7 75.2 –13.6 23.21976 .................. 371.8 175.3 89.9 7.5 77.9 ............... 196.5 169.8 184.2 72.7 –0.6 30.5 81.6 –14.4 26.7TQ ..................... 96.0 47.9 22.3 3.3 22.3 ............... 48.0 41.1 45.3 19.5 –0.1 7.6 18.3 –4.2 6.91977 .................. 409.2 196.8 97.5 8.0 91.3 ............... 212.4 182.5 197.4 83.7 –2.8 33.2 83.2 –14.9 29.91978 .................. 458.7 218.5 104.6 8.5 105.3 ............... 240.3 204.8 220.6 92.4 –1.0 35.2 93.9 –15.7 35.51979 .................. 504.0 239.7 116.8 9.1 113.8 ............... 264.4 221.7 239.2 102.6 –1.7 38.3 100.1 –17.5 42.6
1980 .................. 590.9 276.1 134.6 12.8 128.7 ............... 314.9 262.3 282.3 117.1 –0.4 45.0 120.6 –19.9 52.51981 .................. 678.2 307.8 158.0 13.6 136.1 ............... 370.5 301.7 329.8 137.9 –1.4 51.6 141.6 –28.0 68.81982 .................. 745.8 325.8 185.9 12.9 127.0 ............... 419.9 334.9 361.0 153.9 –2.1 51.8 157.4 –26.1 85.01983 .................. 808.4 353.1 209.9 13.6 129.7 ............... 455.2 365.4 399.4 168.5 –1.2 56.9 175.2 –34.0 89.81984 .................. 851.9 379.2 228.0 16.3 134.9 ............... 472.6 361.5 393.5 176.1 –0.8 58.0 160.3 –32.0 111.1
1985 .................. 946.4 415.7 253.1 17.4 145.2 ............... 530.8 401.3 434.0 186.4 –2.2 62.2 187.5 –32.7 129.51986 .................. 990.5 438.3 273.8 17.7 146.8 ............... 552.1 416.1 449.1 196.5 1.5 66.1 184.9 –33.0 136.01987 .................. 1,004.1 444.0 282.5 15.2 146.2 ............... 560.2 421.5 463.8 205.1 3.1 70.0 185.7 –42.3 138.71988 .................. 1,064.5 464.2 290.9 15.7 157.5 ............... 600.3 448.5 493.1 216.8 10.0 77.1 189.3 –44.7 151.81989 .................. 1,143.7 488.6 304.0 16.6 167.9 ............... 655.1 485.9 530.2 230.4 22.0 84.1 193.7 –44.3 169.3
1990 .................. 1,253.2 500.3 300.1 19.1 181.1 ............... 752.9 568.7 605.4 246.5 57.9 94.1 206.8 –36.7 184.21991 .................. 1,324.4 533.0 319.7 19.7 193.6 ............... 791.4 596.8 636.2 266.8 66.2 115.2 188.1 –39.4 194.51992 .................. 1,381.7 534.3 302.6 19.2 212.5 ............... 847.4 648.0 687.3 285.2 2.6 141.1 258.4 –39.3 199.41993 .................. 1,409.4 540.7 292.4 21.6 226.7 ............... 868.7 669.9 707.3 302.0 –28.0 156.4 276.8 –37.4 198.81994 .................. 1,461.7 543.6 282.3 20.8 240.5 ............... 918.1 715.2 753.0 316.9 –7.6 170.4 273.3 –37.8 203.0
1995 .................. 1,515.7 545.4 273.6 20.1 251.7 ............... 970.3 738.2 782.6 333.3 –17.9 181.6 285.6 –44.5 232.21996 .................. 1,560.5 534.2 266.0 18.3 249.9 ............... 1,026.4 785.3 822.9 347.1 –8.4 187.3 296.9 –37.6 241.11997 .................. 1,601.2 548.6 271.7 19.0 257.9 ............... 1,052.6 808.6 858.6 362.3 –14.4 194.0 316.7 –50.0 244.01998 .................. 1,652.6 554.7 270.2 18.1 266.3 ............... 1,097.9 854.5 901.7 376.1 –4.4 200.3 329.6 –47.2 243.41999 estimate ... 1,727.1 581.2 277.5 19.8 283.8 ............... 1,145.9 918.6 958.7 389.2 –5.0 215.1 359.5 –40.0 227.2
2000 estimate ... 1,765.7 591.5 274.8 20.0 296.7 ............... 1,174.2 959.0 1,001.8 405.2 –2.3 226.3 372.6 –42.9 215.22001 estimate ... 1,799.2 586.2 282.7 20.6 309.1 –26.3 1,213.0 1,007.1 1,053.3 423.6 –1.8 239.8 391.7 –46.1 205.92002 estimate ... 1,820.3 581.7 292.8 21.2 308.5 –40.9 1,238.6 1,043.9 1,096.0 444.1 –1.3 254.6 398.7 –52.2 194.72003 estimate ... 1,893.0 599.9 304.7 20.9 310.7 –36.5 1,293.1 1,109.9 1,156.7 465.1 –* 270.1 421.5 –46.8 183.22004 estimate ... 1,957.9 615.2 314.4 21.0 313.9 –34.1 1,342.7 1,169.7 1,217.4 487.4 0.8 287.2 442.1 –47.7 173.0
* $50 million or less.1 Includes Medicaid, food stamps, family support assistance (AFDC), supplemental security income (SSI), child nutrition programs, earned income tax credits (EITC and HITC),
welfare contingency fund, child care entitlement to States, temporary assistance to needy families, State children’s health insurance and veterans pensions.2 Including asset sales.
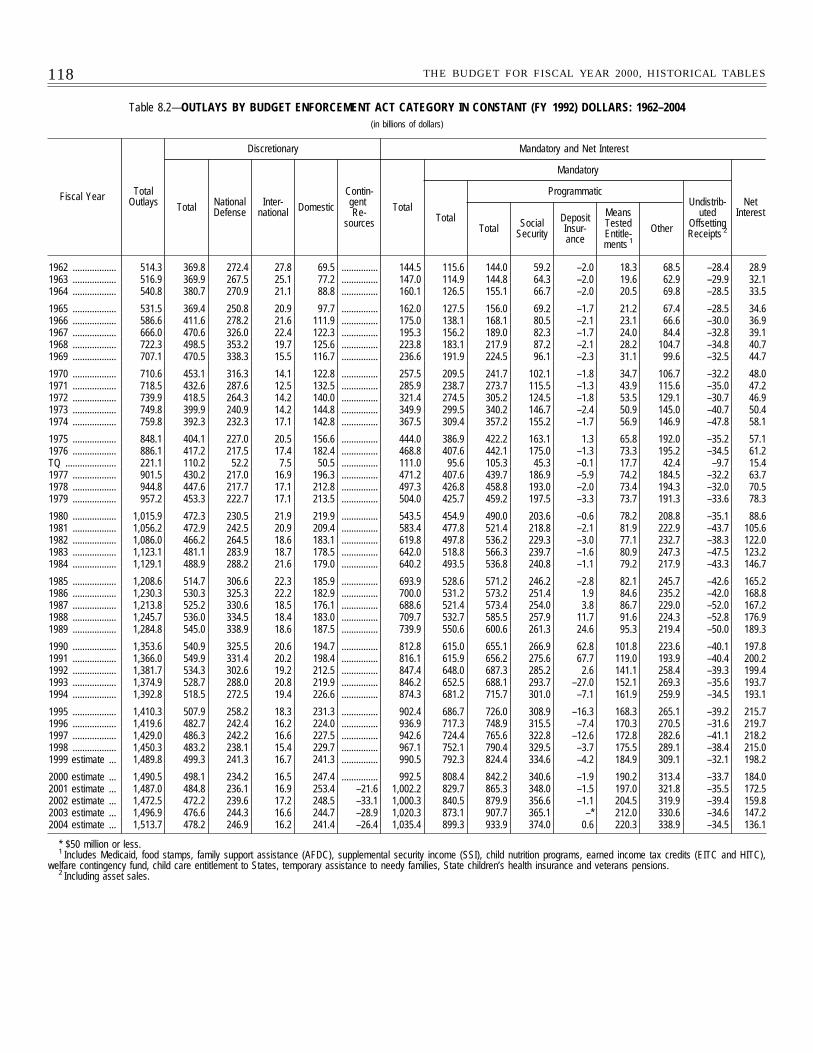
118 THE BUDGET FOR FISCAL YEAR 2000, HISTORICAL TABLES
Table 8.2—OUTLAYS BY BUDGET ENFORCEMENT ACT CATEGORY IN CONSTANT (FY 1992) DOLLARS: 1962–2004(in billions of dollars)
Fiscal Year TotalOutlays
Discretionary Mandatory and Net Interest
Total NationalDefense
Inter-national Domestic
Contin-gent Re-
sources
Total
Mandatory
NetInterestTotal
ProgrammaticUndistrib-
utedOffsettingReceipts 2Total Social
Security
DepositInsur-ance
MeansTestedEntitle-ments 1
Other
1962 .................. 514.3 369.8 272.4 27.8 69.5 ............... 144.5 115.6 144.0 59.2 –2.0 18.3 68.5 –28.4 28.91963 .................. 516.9 369.9 267.5 25.1 77.2 ............... 147.0 114.9 144.8 64.3 –2.0 19.6 62.9 –29.9 32.11964 .................. 540.8 380.7 270.9 21.1 88.8 ............... 160.1 126.5 155.1 66.7 –2.0 20.5 69.8 –28.5 33.5
1965 .................. 531.5 369.4 250.8 20.9 97.7 ............... 162.0 127.5 156.0 69.2 –1.7 21.2 67.4 –28.5 34.61966 .................. 586.6 411.6 278.2 21.6 111.9 ............... 175.0 138.1 168.1 80.5 –2.1 23.1 66.6 –30.0 36.91967 .................. 666.0 470.6 326.0 22.4 122.3 ............... 195.3 156.2 189.0 82.3 –1.7 24.0 84.4 –32.8 39.11968 .................. 722.3 498.5 353.2 19.7 125.6 ............... 223.8 183.1 217.9 87.2 –2.1 28.2 104.7 –34.8 40.71969 .................. 707.1 470.5 338.3 15.5 116.7 ............... 236.6 191.9 224.5 96.1 –2.3 31.1 99.6 –32.5 44.7
1970 .................. 710.6 453.1 316.3 14.1 122.8 ............... 257.5 209.5 241.7 102.1 –1.8 34.7 106.7 –32.2 48.01971 .................. 718.5 432.6 287.6 12.5 132.5 ............... 285.9 238.7 273.7 115.5 –1.3 43.9 115.6 –35.0 47.21972 .................. 739.9 418.5 264.3 14.2 140.0 ............... 321.4 274.5 305.2 124.5 –1.8 53.5 129.1 –30.7 46.91973 .................. 749.8 399.9 240.9 14.2 144.8 ............... 349.9 299.5 340.2 146.7 –2.4 50.9 145.0 –40.7 50.41974 .................. 759.8 392.3 232.3 17.1 142.8 ............... 367.5 309.4 357.2 155.2 –1.7 56.9 146.9 –47.8 58.1
1975 .................. 848.1 404.1 227.0 20.5 156.6 ............... 444.0 386.9 422.2 163.1 1.3 65.8 192.0 –35.2 57.11976 .................. 886.1 417.2 217.5 17.4 182.4 ............... 468.8 407.6 442.1 175.0 –1.3 73.3 195.2 –34.5 61.2TQ ..................... 221.1 110.2 52.2 7.5 50.5 ............... 111.0 95.6 105.3 45.3 –0.1 17.7 42.4 –9.7 15.41977 .................. 901.5 430.2 217.0 16.9 196.3 ............... 471.2 407.6 439.7 186.9 –5.9 74.2 184.5 –32.2 63.71978 .................. 944.8 447.6 217.7 17.1 212.8 ............... 497.3 426.8 458.8 193.0 –2.0 73.4 194.3 –32.0 70.51979 .................. 957.2 453.3 222.7 17.1 213.5 ............... 504.0 425.7 459.2 197.5 –3.3 73.7 191.3 –33.6 78.3
1980 .................. 1,015.9 472.3 230.5 21.9 219.9 ............... 543.5 454.9 490.0 203.6 –0.6 78.2 208.8 –35.1 88.61981 .................. 1,056.2 472.9 242.5 20.9 209.4 ............... 583.4 477.8 521.4 218.8 –2.1 81.9 222.9 –43.7 105.61982 .................. 1,086.0 466.2 264.5 18.6 183.1 ............... 619.8 497.8 536.2 229.3 –3.0 77.1 232.7 –38.3 122.01983 .................. 1,123.1 481.1 283.9 18.7 178.5 ............... 642.0 518.8 566.3 239.7 –1.6 80.9 247.3 –47.5 123.21984 .................. 1,129.1 488.9 288.2 21.6 179.0 ............... 640.2 493.5 536.8 240.8 –1.1 79.2 217.9 –43.3 146.7
1985 .................. 1,208.6 514.7 306.6 22.3 185.9 ............... 693.9 528.6 571.2 246.2 –2.8 82.1 245.7 –42.6 165.21986 .................. 1,230.3 530.3 325.3 22.2 182.9 ............... 700.0 531.2 573.2 251.4 1.9 84.6 235.2 –42.0 168.81987 .................. 1,213.8 525.2 330.6 18.5 176.1 ............... 688.6 521.4 573.4 254.0 3.8 86.7 229.0 –52.0 167.21988 .................. 1,245.7 536.0 334.5 18.4 183.0 ............... 709.7 532.7 585.5 257.9 11.7 91.6 224.3 –52.8 176.91989 .................. 1,284.8 545.0 338.9 18.6 187.5 ............... 739.9 550.6 600.6 261.3 24.6 95.3 219.4 –50.0 189.3
1990 .................. 1,353.6 540.9 325.5 20.6 194.7 ............... 812.8 615.0 655.1 266.9 62.8 101.8 223.6 –40.1 197.81991 .................. 1,366.0 549.9 331.4 20.2 198.4 ............... 816.1 615.9 656.2 275.6 67.7 119.0 193.9 –40.4 200.21992 .................. 1,381.7 534.3 302.6 19.2 212.5 ............... 847.4 648.0 687.3 285.2 2.6 141.1 258.4 –39.3 199.41993 .................. 1,374.9 528.7 288.0 20.8 219.9 ............... 846.2 652.5 688.1 293.7 –27.0 152.1 269.3 –35.6 193.71994 .................. 1,392.8 518.5 272.5 19.4 226.6 ............... 874.3 681.2 715.7 301.0 –7.1 161.9 259.9 –34.5 193.1
1995 .................. 1,410.3 507.9 258.2 18.3 231.3 ............... 902.4 686.7 726.0 308.9 –16.3 168.3 265.1 –39.2 215.71996 .................. 1,419.6 482.7 242.4 16.2 224.0 ............... 936.9 717.3 748.9 315.5 –7.4 170.3 270.5 –31.6 219.71997 .................. 1,429.0 486.3 242.2 16.6 227.5 ............... 942.6 724.4 765.6 322.8 –12.6 172.8 282.6 –41.1 218.21998 .................. 1,450.3 483.2 238.1 15.4 229.7 ............... 967.1 752.1 790.4 329.5 –3.7 175.5 289.1 –38.4 215.01999 estimate ... 1,489.8 499.3 241.3 16.7 241.3 ............... 990.5 792.3 824.4 334.6 –4.2 184.9 309.1 –32.1 198.2
2000 estimate ... 1,490.5 498.1 234.2 16.5 247.4 ............... 992.5 808.4 842.2 340.6 –1.9 190.2 313.4 –33.7 184.02001 estimate ... 1,487.0 484.8 236.1 16.9 253.4 –21.6 1,002.2 829.7 865.3 348.0 –1.5 197.0 321.8 –35.5 172.52002 estimate ... 1,472.5 472.2 239.6 17.2 248.5 –33.1 1,000.3 840.5 879.9 356.6 –1.1 204.5 319.9 –39.4 159.82003 estimate ... 1,496.9 476.6 244.3 16.6 244.7 –28.9 1,020.3 873.1 907.7 365.1 –* 212.0 330.6 –34.6 147.22004 estimate ... 1,513.7 478.2 246.9 16.2 241.4 –26.4 1,035.4 899.3 933.9 374.0 0.6 220.3 338.9 –34.5 136.1
* $50 million or less.1 Includes Medicaid, food stamps, family support assistance (AFDC), supplemental security income (SSI), child nutrition programs, earned income tax credits (EITC and HITC),
welfare contingency fund, child care entitlement to States, temporary assistance to needy families, State children’s health insurance and veterans pensions.2 Including asset sales.
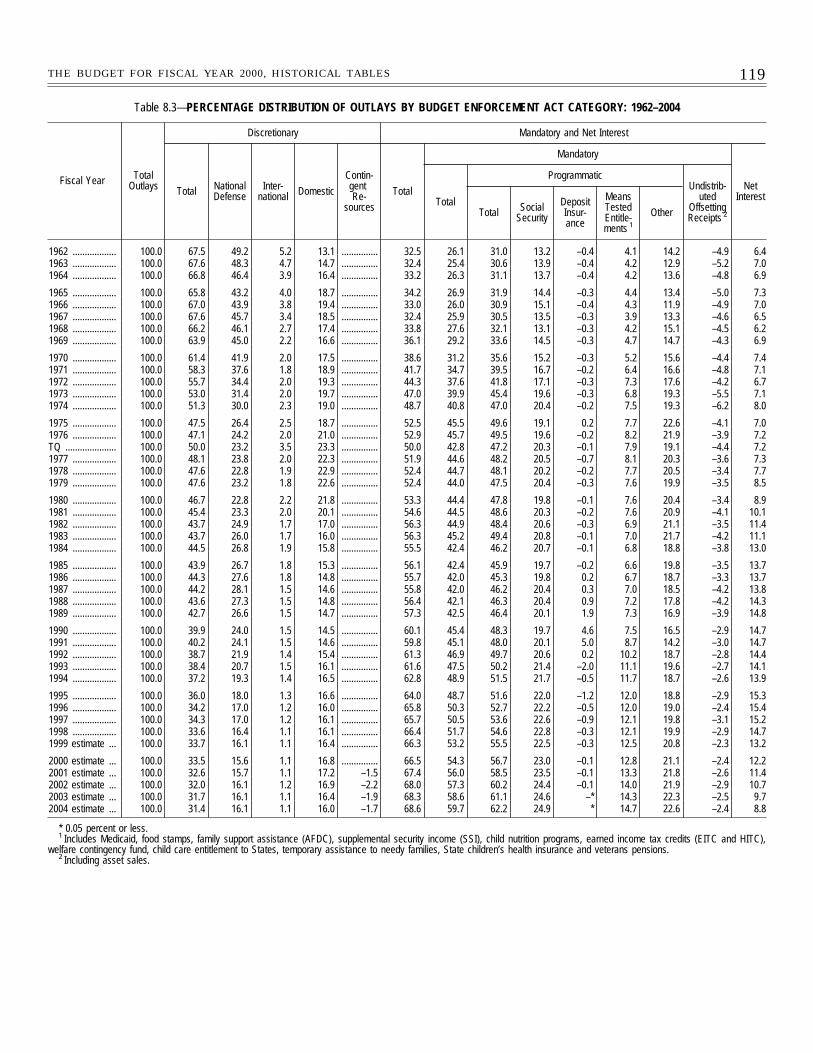
119THE BUDGET FOR FISCAL YEAR 2000, HISTORICAL TABLES
Table 8.3—PERCENTAGE DISTRIBUTION OF OUTLAYS BY BUDGET ENFORCEMENT ACT CATEGORY: 1962–2004
Fiscal Year TotalOutlays
Discretionary Mandatory and Net Interest
Total NationalDefense
Inter-national Domestic
Contin-gent Re-
sources
Total
Mandatory
NetInterestTotal
ProgrammaticUndistrib-
utedOffsettingReceipts 2Total Social
Security
DepositInsur-ance
MeansTestedEntitle-ments 1
Other
1962 .................. 100.0 67.5 49.2 5.2 13.1 ............... 32.5 26.1 31.0 13.2 –0.4 4.1 14.2 –4.9 6.41963 .................. 100.0 67.6 48.3 4.7 14.7 ............... 32.4 25.4 30.6 13.9 –0.4 4.2 12.9 –5.2 7.01964 .................. 100.0 66.8 46.4 3.9 16.4 ............... 33.2 26.3 31.1 13.7 –0.4 4.2 13.6 –4.8 6.9
1965 .................. 100.0 65.8 43.2 4.0 18.7 ............... 34.2 26.9 31.9 14.4 –0.3 4.4 13.4 –5.0 7.31966 .................. 100.0 67.0 43.9 3.8 19.4 ............... 33.0 26.0 30.9 15.1 –0.4 4.3 11.9 –4.9 7.01967 .................. 100.0 67.6 45.7 3.4 18.5 ............... 32.4 25.9 30.5 13.5 –0.3 3.9 13.3 –4.6 6.51968 .................. 100.0 66.2 46.1 2.7 17.4 ............... 33.8 27.6 32.1 13.1 –0.3 4.2 15.1 –4.5 6.21969 .................. 100.0 63.9 45.0 2.2 16.6 ............... 36.1 29.2 33.6 14.5 –0.3 4.7 14.7 –4.3 6.9
1970 .................. 100.0 61.4 41.9 2.0 17.5 ............... 38.6 31.2 35.6 15.2 –0.3 5.2 15.6 –4.4 7.41971 .................. 100.0 58.3 37.6 1.8 18.9 ............... 41.7 34.7 39.5 16.7 –0.2 6.4 16.6 –4.8 7.11972 .................. 100.0 55.7 34.4 2.0 19.3 ............... 44.3 37.6 41.8 17.1 –0.3 7.3 17.6 –4.2 6.71973 .................. 100.0 53.0 31.4 2.0 19.7 ............... 47.0 39.9 45.4 19.6 –0.3 6.8 19.3 –5.5 7.11974 .................. 100.0 51.3 30.0 2.3 19.0 ............... 48.7 40.8 47.0 20.4 –0.2 7.5 19.3 –6.2 8.0
1975 .................. 100.0 47.5 26.4 2.5 18.7 ............... 52.5 45.5 49.6 19.1 0.2 7.7 22.6 –4.1 7.01976 .................. 100.0 47.1 24.2 2.0 21.0 ............... 52.9 45.7 49.5 19.6 –0.2 8.2 21.9 –3.9 7.2TQ ..................... 100.0 50.0 23.2 3.5 23.3 ............... 50.0 42.8 47.2 20.3 –0.1 7.9 19.1 –4.4 7.21977 .................. 100.0 48.1 23.8 2.0 22.3 ............... 51.9 44.6 48.2 20.5 –0.7 8.1 20.3 –3.6 7.31978 .................. 100.0 47.6 22.8 1.9 22.9 ............... 52.4 44.7 48.1 20.2 –0.2 7.7 20.5 –3.4 7.71979 .................. 100.0 47.6 23.2 1.8 22.6 ............... 52.4 44.0 47.5 20.4 –0.3 7.6 19.9 –3.5 8.5
1980 .................. 100.0 46.7 22.8 2.2 21.8 ............... 53.3 44.4 47.8 19.8 –0.1 7.6 20.4 –3.4 8.91981 .................. 100.0 45.4 23.3 2.0 20.1 ............... 54.6 44.5 48.6 20.3 –0.2 7.6 20.9 –4.1 10.11982 .................. 100.0 43.7 24.9 1.7 17.0 ............... 56.3 44.9 48.4 20.6 –0.3 6.9 21.1 –3.5 11.41983 .................. 100.0 43.7 26.0 1.7 16.0 ............... 56.3 45.2 49.4 20.8 –0.1 7.0 21.7 –4.2 11.11984 .................. 100.0 44.5 26.8 1.9 15.8 ............... 55.5 42.4 46.2 20.7 –0.1 6.8 18.8 –3.8 13.0
1985 .................. 100.0 43.9 26.7 1.8 15.3 ............... 56.1 42.4 45.9 19.7 –0.2 6.6 19.8 –3.5 13.71986 .................. 100.0 44.3 27.6 1.8 14.8 ............... 55.7 42.0 45.3 19.8 0.2 6.7 18.7 –3.3 13.71987 .................. 100.0 44.2 28.1 1.5 14.6 ............... 55.8 42.0 46.2 20.4 0.3 7.0 18.5 –4.2 13.81988 .................. 100.0 43.6 27.3 1.5 14.8 ............... 56.4 42.1 46.3 20.4 0.9 7.2 17.8 –4.2 14.31989 .................. 100.0 42.7 26.6 1.5 14.7 ............... 57.3 42.5 46.4 20.1 1.9 7.3 16.9 –3.9 14.8
1990 .................. 100.0 39.9 24.0 1.5 14.5 ............... 60.1 45.4 48.3 19.7 4.6 7.5 16.5 –2.9 14.71991 .................. 100.0 40.2 24.1 1.5 14.6 ............... 59.8 45.1 48.0 20.1 5.0 8.7 14.2 –3.0 14.71992 .................. 100.0 38.7 21.9 1.4 15.4 ............... 61.3 46.9 49.7 20.6 0.2 10.2 18.7 –2.8 14.41993 .................. 100.0 38.4 20.7 1.5 16.1 ............... 61.6 47.5 50.2 21.4 –2.0 11.1 19.6 –2.7 14.11994 .................. 100.0 37.2 19.3 1.4 16.5 ............... 62.8 48.9 51.5 21.7 –0.5 11.7 18.7 –2.6 13.9
1995 .................. 100.0 36.0 18.0 1.3 16.6 ............... 64.0 48.7 51.6 22.0 –1.2 12.0 18.8 –2.9 15.31996 .................. 100.0 34.2 17.0 1.2 16.0 ............... 65.8 50.3 52.7 22.2 –0.5 12.0 19.0 –2.4 15.41997 .................. 100.0 34.3 17.0 1.2 16.1 ............... 65.7 50.5 53.6 22.6 –0.9 12.1 19.8 –3.1 15.21998 .................. 100.0 33.6 16.4 1.1 16.1 ............... 66.4 51.7 54.6 22.8 –0.3 12.1 19.9 –2.9 14.71999 estimate ... 100.0 33.7 16.1 1.1 16.4 ............... 66.3 53.2 55.5 22.5 –0.3 12.5 20.8 –2.3 13.2
2000 estimate ... 100.0 33.5 15.6 1.1 16.8 ............... 66.5 54.3 56.7 23.0 –0.1 12.8 21.1 –2.4 12.22001 estimate ... 100.0 32.6 15.7 1.1 17.2 –1.5 67.4 56.0 58.5 23.5 –0.1 13.3 21.8 –2.6 11.42002 estimate ... 100.0 32.0 16.1 1.2 16.9 –2.2 68.0 57.3 60.2 24.4 –0.1 14.0 21.9 –2.9 10.72003 estimate ... 100.0 31.7 16.1 1.1 16.4 –1.9 68.3 58.6 61.1 24.6 –* 14.3 22.3 –2.5 9.72004 estimate ... 100.0 31.4 16.1 1.1 16.0 –1.7 68.6 59.7 62.2 24.9 * 14.7 22.6 –2.4 8.8
* 0.05 percent or less.1 Includes Medicaid, food stamps, family support assistance (AFDC), supplemental security income (SSI), child nutrition programs, earned income tax credits (EITC and HITC),
welfare contingency fund, child care entitlement to States, temporary assistance to needy families, State children’s health insurance and veterans pensions.2 Including asset sales.
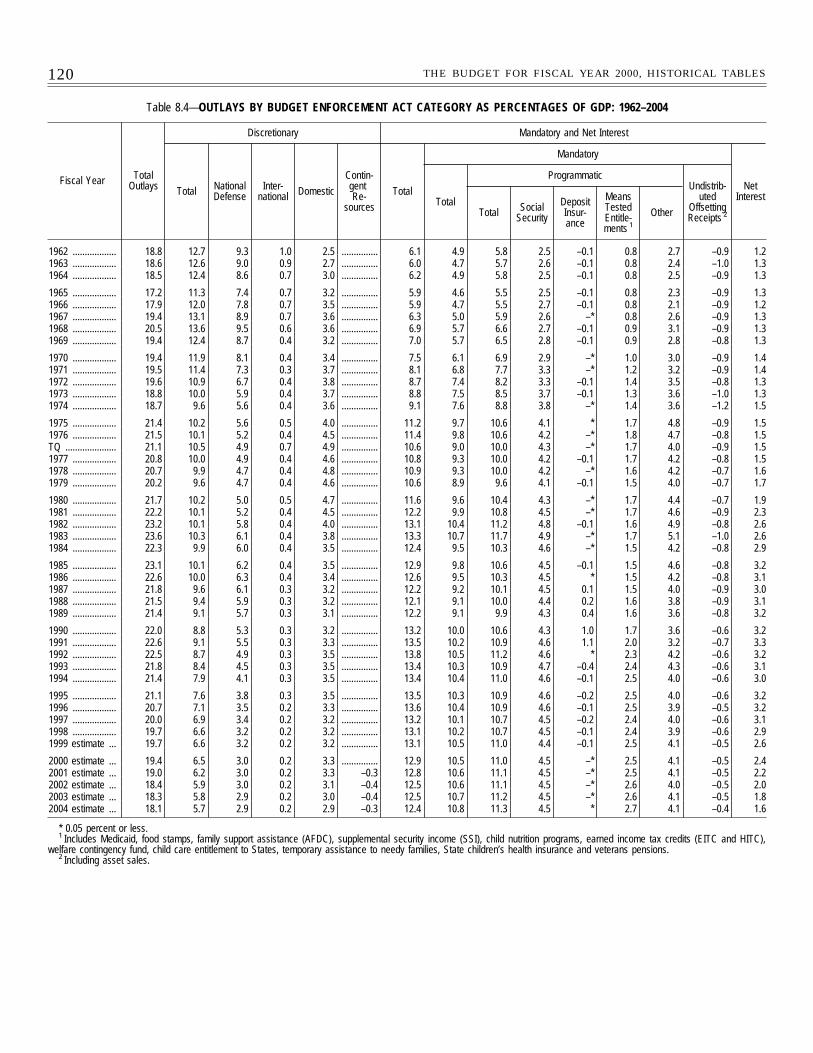
120 THE BUDGET FOR FISCAL YEAR 2000, HISTORICAL TABLES
Table 8.4—OUTLAYS BY BUDGET ENFORCEMENT ACT CATEGORY AS PERCENTAGES OF GDP: 1962–2004
Fiscal Year TotalOutlays
Discretionary Mandatory and Net Interest
Total NationalDefense
Inter-national Domestic
Contin-gent Re-
sources
Total
Mandatory
NetInterestTotal
ProgrammaticUndistrib-
utedOffsettingReceipts 2Total Social
Security
DepositInsur-ance
MeansTestedEntitle-ments 1
Other
1962 .................. 18.8 12.7 9.3 1.0 2.5 ............... 6.1 4.9 5.8 2.5 –0.1 0.8 2.7 –0.9 1.21963 .................. 18.6 12.6 9.0 0.9 2.7 ............... 6.0 4.7 5.7 2.6 –0.1 0.8 2.4 –1.0 1.31964 .................. 18.5 12.4 8.6 0.7 3.0 ............... 6.2 4.9 5.8 2.5 –0.1 0.8 2.5 –0.9 1.3
1965 .................. 17.2 11.3 7.4 0.7 3.2 ............... 5.9 4.6 5.5 2.5 –0.1 0.8 2.3 –0.9 1.31966 .................. 17.9 12.0 7.8 0.7 3.5 ............... 5.9 4.7 5.5 2.7 –0.1 0.8 2.1 –0.9 1.21967 .................. 19.4 13.1 8.9 0.7 3.6 ............... 6.3 5.0 5.9 2.6 –* 0.8 2.6 –0.9 1.31968 .................. 20.5 13.6 9.5 0.6 3.6 ............... 6.9 5.7 6.6 2.7 –0.1 0.9 3.1 –0.9 1.31969 .................. 19.4 12.4 8.7 0.4 3.2 ............... 7.0 5.7 6.5 2.8 –0.1 0.9 2.8 –0.8 1.3
1970 .................. 19.4 11.9 8.1 0.4 3.4 ............... 7.5 6.1 6.9 2.9 –* 1.0 3.0 –0.9 1.41971 .................. 19.5 11.4 7.3 0.3 3.7 ............... 8.1 6.8 7.7 3.3 –* 1.2 3.2 –0.9 1.41972 .................. 19.6 10.9 6.7 0.4 3.8 ............... 8.7 7.4 8.2 3.3 –0.1 1.4 3.5 –0.8 1.31973 .................. 18.8 10.0 5.9 0.4 3.7 ............... 8.8 7.5 8.5 3.7 –0.1 1.3 3.6 –1.0 1.31974 .................. 18.7 9.6 5.6 0.4 3.6 ............... 9.1 7.6 8.8 3.8 –* 1.4 3.6 –1.2 1.5
1975 .................. 21.4 10.2 5.6 0.5 4.0 ............... 11.2 9.7 10.6 4.1 * 1.7 4.8 –0.9 1.51976 .................. 21.5 10.1 5.2 0.4 4.5 ............... 11.4 9.8 10.6 4.2 –* 1.8 4.7 –0.8 1.5TQ ..................... 21.1 10.5 4.9 0.7 4.9 ............... 10.6 9.0 10.0 4.3 –* 1.7 4.0 –0.9 1.51977 .................. 20.8 10.0 4.9 0.4 4.6 ............... 10.8 9.3 10.0 4.2 –0.1 1.7 4.2 –0.8 1.51978 .................. 20.7 9.9 4.7 0.4 4.8 ............... 10.9 9.3 10.0 4.2 –* 1.6 4.2 –0.7 1.61979 .................. 20.2 9.6 4.7 0.4 4.6 ............... 10.6 8.9 9.6 4.1 –0.1 1.5 4.0 –0.7 1.7
1980 .................. 21.7 10.2 5.0 0.5 4.7 ............... 11.6 9.6 10.4 4.3 –* 1.7 4.4 –0.7 1.91981 .................. 22.2 10.1 5.2 0.4 4.5 ............... 12.2 9.9 10.8 4.5 –* 1.7 4.6 –0.9 2.31982 .................. 23.2 10.1 5.8 0.4 4.0 ............... 13.1 10.4 11.2 4.8 –0.1 1.6 4.9 –0.8 2.61983 .................. 23.6 10.3 6.1 0.4 3.8 ............... 13.3 10.7 11.7 4.9 –* 1.7 5.1 –1.0 2.61984 .................. 22.3 9.9 6.0 0.4 3.5 ............... 12.4 9.5 10.3 4.6 –* 1.5 4.2 –0.8 2.9
1985 .................. 23.1 10.1 6.2 0.4 3.5 ............... 12.9 9.8 10.6 4.5 –0.1 1.5 4.6 –0.8 3.21986 .................. 22.6 10.0 6.3 0.4 3.4 ............... 12.6 9.5 10.3 4.5 * 1.5 4.2 –0.8 3.11987 .................. 21.8 9.6 6.1 0.3 3.2 ............... 12.2 9.2 10.1 4.5 0.1 1.5 4.0 –0.9 3.01988 .................. 21.5 9.4 5.9 0.3 3.2 ............... 12.1 9.1 10.0 4.4 0.2 1.6 3.8 –0.9 3.11989 .................. 21.4 9.1 5.7 0.3 3.1 ............... 12.2 9.1 9.9 4.3 0.4 1.6 3.6 –0.8 3.2
1990 .................. 22.0 8.8 5.3 0.3 3.2 ............... 13.2 10.0 10.6 4.3 1.0 1.7 3.6 –0.6 3.21991 .................. 22.6 9.1 5.5 0.3 3.3 ............... 13.5 10.2 10.9 4.6 1.1 2.0 3.2 –0.7 3.31992 .................. 22.5 8.7 4.9 0.3 3.5 ............... 13.8 10.5 11.2 4.6 * 2.3 4.2 –0.6 3.21993 .................. 21.8 8.4 4.5 0.3 3.5 ............... 13.4 10.3 10.9 4.7 –0.4 2.4 4.3 –0.6 3.11994 .................. 21.4 7.9 4.1 0.3 3.5 ............... 13.4 10.4 11.0 4.6 –0.1 2.5 4.0 –0.6 3.0
1995 .................. 21.1 7.6 3.8 0.3 3.5 ............... 13.5 10.3 10.9 4.6 –0.2 2.5 4.0 –0.6 3.21996 .................. 20.7 7.1 3.5 0.2 3.3 ............... 13.6 10.4 10.9 4.6 –0.1 2.5 3.9 –0.5 3.21997 .................. 20.0 6.9 3.4 0.2 3.2 ............... 13.2 10.1 10.7 4.5 –0.2 2.4 4.0 –0.6 3.11998 .................. 19.7 6.6 3.2 0.2 3.2 ............... 13.1 10.2 10.7 4.5 –0.1 2.4 3.9 –0.6 2.91999 estimate ... 19.7 6.6 3.2 0.2 3.2 ............... 13.1 10.5 11.0 4.4 –0.1 2.5 4.1 –0.5 2.6
2000 estimate ... 19.4 6.5 3.0 0.2 3.3 ............... 12.9 10.5 11.0 4.5 –* 2.5 4.1 –0.5 2.42001 estimate ... 19.0 6.2 3.0 0.2 3.3 –0.3 12.8 10.6 11.1 4.5 –* 2.5 4.1 –0.5 2.22002 estimate ... 18.4 5.9 3.0 0.2 3.1 –0.4 12.5 10.6 11.1 4.5 –* 2.6 4.0 –0.5 2.02003 estimate ... 18.3 5.8 2.9 0.2 3.0 –0.4 12.5 10.7 11.2 4.5 –* 2.6 4.1 –0.5 1.82004 estimate ... 18.1 5.7 2.9 0.2 2.9 –0.3 12.4 10.8 11.3 4.5 * 2.7 4.1 –0.4 1.6
* 0.05 percent or less.1 Includes Medicaid, food stamps, family support assistance (AFDC), supplemental security income (SSI), child nutrition programs, earned income tax credits (EITC and HITC),
welfare contingency fund, child care entitlement to States, temporary assistance to needy families, State children’s health insurance and veterans pensions.2 Including asset sales.
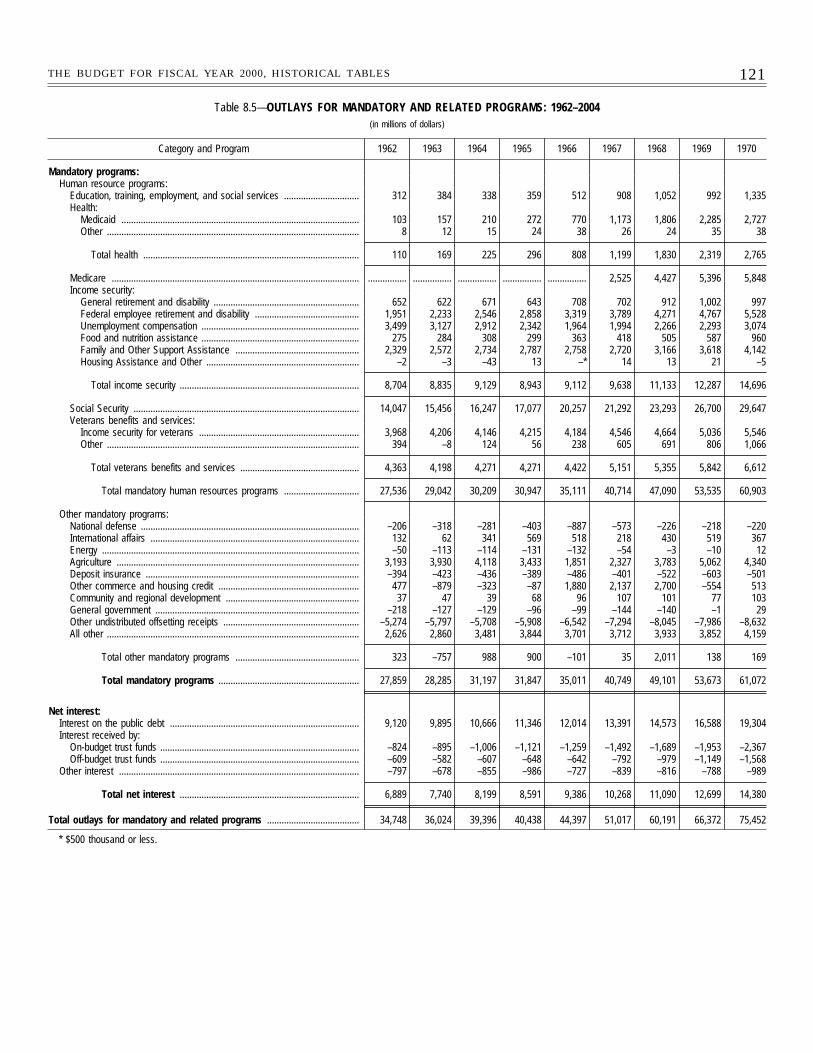
121THE BUDGET FOR FISCAL YEAR 2000, HISTORICAL TABLES
Table 8.5—OUTLAYS FOR MANDATORY AND RELATED PROGRAMS: 1962–2004(in millions of dollars)
Category and Program 1962 1963 1964 1965 1966 1967 1968 1969 1970
Mandatory programs:Human resource programs:
Education, training, employment, and social services ............................... 312 384 338 359 512 908 1,052 992 1,335Health:
Medicaid .................................................................................................. 103 157 210 272 770 1,173 1,806 2,285 2,727Other ........................................................................................................ 8 12 15 24 38 26 24 35 38
Total health ......................................................................................... 110 169 225 296 808 1,199 1,830 2,319 2,765
Medicare ...................................................................................................... ................ ................ ................ ................ ................ 2,525 4,427 5,396 5,848Income security:
General retirement and disability ............................................................ 652 622 671 643 708 702 912 1,002 997Federal employee retirement and disability ........................................... 1,951 2,233 2,546 2,858 3,319 3,789 4,271 4,767 5,528Unemployment compensation ................................................................. 3,499 3,127 2,912 2,342 1,964 1,994 2,266 2,293 3,074Food and nutrition assistance ................................................................. 275 284 308 299 363 418 505 587 960Family and Other Support Assistance ................................................... 2,329 2,572 2,734 2,787 2,758 2,720 3,166 3,618 4,142Housing Assistance and Other ............................................................... –2 –3 –43 13 –* 14 13 21 –5
Total income security .......................................................................... 8,704 8,835 9,129 8,943 9,112 9,638 11,133 12,287 14,696
Social Security ............................................................................................. 14,047 15,456 16,247 17,077 20,257 21,292 23,293 26,700 29,647Veterans benefits and services:
Income security for veterans .................................................................. 3,968 4,206 4,146 4,215 4,184 4,546 4,664 5,036 5,546Other ........................................................................................................ 394 –8 124 56 238 605 691 806 1,066
Total veterans benefits and services ................................................. 4,363 4,198 4,271 4,271 4,422 5,151 5,355 5,842 6,612
Total mandatory human resources programs ............................... 27,536 29,042 30,209 30,947 35,111 40,714 47,090 53,535 60,903
Other mandatory programs:National defense .......................................................................................... –206 –318 –281 –403 –887 –573 –226 –218 –220International affairs ...................................................................................... 132 62 341 569 518 218 430 519 367Energy .......................................................................................................... –50 –113 –114 –131 –132 –54 –3 –10 12Agriculture .................................................................................................... 3,193 3,930 4,118 3,433 1,851 2,327 3,783 5,062 4,340Deposit insurance ........................................................................................ –394 –423 –436 –389 –486 –401 –522 –603 –501Other commerce and housing credit .......................................................... 477 –879 –323 –87 1,880 2,137 2,700 –554 513Community and regional development ....................................................... 37 47 39 68 96 107 101 77 103General government .................................................................................... –218 –127 –129 –96 –99 –144 –140 –1 29Other undistributed offsetting receipts ........................................................ –5,274 –5,797 –5,708 –5,908 –6,542 –7,294 –8,045 –7,986 –8,632All other ........................................................................................................ 2,626 2,860 3,481 3,844 3,701 3,712 3,933 3,852 4,159
Total other mandatory programs ................................................... 323 –757 988 900 –101 35 2,011 138 169
Total mandatory programs .......................................................... 27,859 28,285 31,197 31,847 35,011 40,749 49,101 53,673 61,072
Net interest:Interest on the public debt .............................................................................. 9,120 9,895 10,666 11,346 12,014 13,391 14,573 16,588 19,304Interest received by:
On-budget trust funds .................................................................................. –824 –895 –1,006 –1,121 –1,259 –1,492 –1,689 –1,953 –2,367Off-budget trust funds .................................................................................. –609 –582 –607 –648 –642 –792 –979 –1,149 –1,568
Other interest ................................................................................................... –797 –678 –855 –986 –727 –839 –816 –788 –989
Total net interest .......................................................................... 6,889 7,740 8,199 8,591 9,386 10,268 11,090 12,699 14,380
Total outlays for mandatory and related programs ...................................... 34,748 36,024 39,396 40,438 44,397 51,017 60,191 66,372 75,452
* $500 thousand or less.
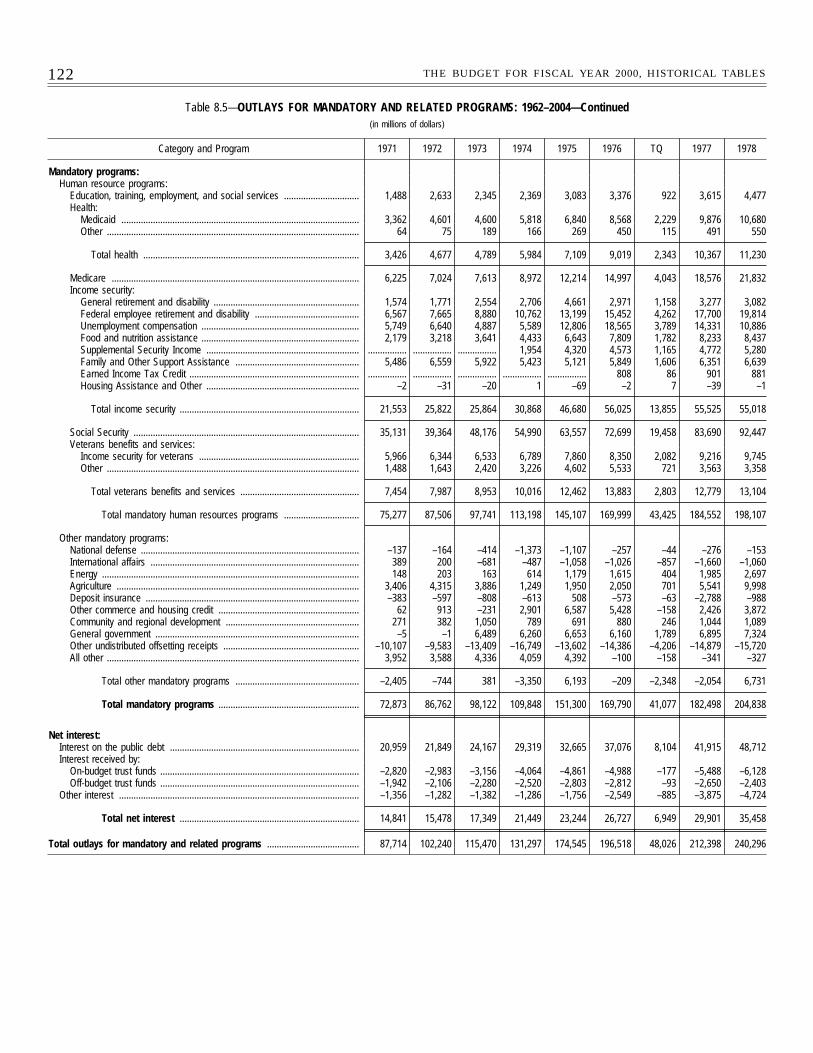
122 THE BUDGET FOR FISCAL YEAR 2000, HISTORICAL TABLES
Table 8.5—OUTLAYS FOR MANDATORY AND RELATED PROGRAMS: 1962–2004—Continued(in millions of dollars)
Category and Program 1971 1972 1973 1974 1975 1976 TQ 1977 1978
Mandatory programs:Human resource programs:
Education, training, employment, and social services ............................... 1,488 2,633 2,345 2,369 3,083 3,376 922 3,615 4,477Health:
Medicaid .................................................................................................. 3,362 4,601 4,600 5,818 6,840 8,568 2,229 9,876 10,680Other ........................................................................................................ 64 75 189 166 269 450 115 491 550
Total health ......................................................................................... 3,426 4,677 4,789 5,984 7,109 9,019 2,343 10,367 11,230
Medicare ...................................................................................................... 6,225 7,024 7,613 8,972 12,214 14,997 4,043 18,576 21,832Income security:
General retirement and disability ............................................................ 1,574 1,771 2,554 2,706 4,661 2,971 1,158 3,277 3,082Federal employee retirement and disability ........................................... 6,567 7,665 8,880 10,762 13,199 15,452 4,262 17,700 19,814Unemployment compensation ................................................................. 5,749 6,640 4,887 5,589 12,806 18,565 3,789 14,331 10,886Food and nutrition assistance ................................................................. 2,179 3,218 3,641 4,433 6,643 7,809 1,782 8,233 8,437Supplemental Security Income ............................................................... ................ ................ ................ 1,954 4,320 4,573 1,165 4,772 5,280Family and Other Support Assistance ................................................... 5,486 6,559 5,922 5,423 5,121 5,849 1,606 6,351 6,639Earned Income Tax Credit ...................................................................... ................ ................ ................ ................ ................ 808 86 901 881Housing Assistance and Other ............................................................... –2 –31 –20 1 –69 –2 7 –39 –1
Total income security .......................................................................... 21,553 25,822 25,864 30,868 46,680 56,025 13,855 55,525 55,018
Social Security ............................................................................................. 35,131 39,364 48,176 54,990 63,557 72,699 19,458 83,690 92,447Veterans benefits and services:
Income security for veterans .................................................................. 5,966 6,344 6,533 6,789 7,860 8,350 2,082 9,216 9,745Other ........................................................................................................ 1,488 1,643 2,420 3,226 4,602 5,533 721 3,563 3,358
Total veterans benefits and services ................................................. 7,454 7,987 8,953 10,016 12,462 13,883 2,803 12,779 13,104
Total mandatory human resources programs ............................... 75,277 87,506 97,741 113,198 145,107 169,999 43,425 184,552 198,107
Other mandatory programs:National defense .......................................................................................... –137 –164 –414 –1,373 –1,107 –257 –44 –276 –153International affairs ...................................................................................... 389 200 –681 –487 –1,058 –1,026 –857 –1,660 –1,060Energy .......................................................................................................... 148 203 163 614 1,179 1,615 404 1,985 2,697Agriculture .................................................................................................... 3,406 4,315 3,886 1,249 1,950 2,050 701 5,541 9,998Deposit insurance ........................................................................................ –383 –597 –808 –613 508 –573 –63 –2,788 –988Other commerce and housing credit .......................................................... 62 913 –231 2,901 6,587 5,428 –158 2,426 3,872Community and regional development ....................................................... 271 382 1,050 789 691 880 246 1,044 1,089General government .................................................................................... –5 –1 6,489 6,260 6,653 6,160 1,789 6,895 7,324Other undistributed offsetting receipts ........................................................ –10,107 –9,583 –13,409 –16,749 –13,602 –14,386 –4,206 –14,879 –15,720All other ........................................................................................................ 3,952 3,588 4,336 4,059 4,392 –100 –158 –341 –327
Total other mandatory programs ................................................... –2,405 –744 381 –3,350 6,193 –209 –2,348 –2,054 6,731
Total mandatory programs .......................................................... 72,873 86,762 98,122 109,848 151,300 169,790 41,077 182,498 204,838
Net interest:Interest on the public debt .............................................................................. 20,959 21,849 24,167 29,319 32,665 37,076 8,104 41,915 48,712Interest received by:
On-budget trust funds .................................................................................. –2,820 –2,983 –3,156 –4,064 –4,861 –4,988 –177 –5,488 –6,128Off-budget trust funds .................................................................................. –1,942 –2,106 –2,280 –2,520 –2,803 –2,812 –93 –2,650 –2,403
Other interest ................................................................................................... –1,356 –1,282 –1,382 –1,286 –1,756 –2,549 –885 –3,875 –4,724
Total net interest .......................................................................... 14,841 15,478 17,349 21,449 23,244 26,727 6,949 29,901 35,458
Total outlays for mandatory and related programs ...................................... 87,714 102,240 115,470 131,297 174,545 196,518 48,026 212,398 240,296
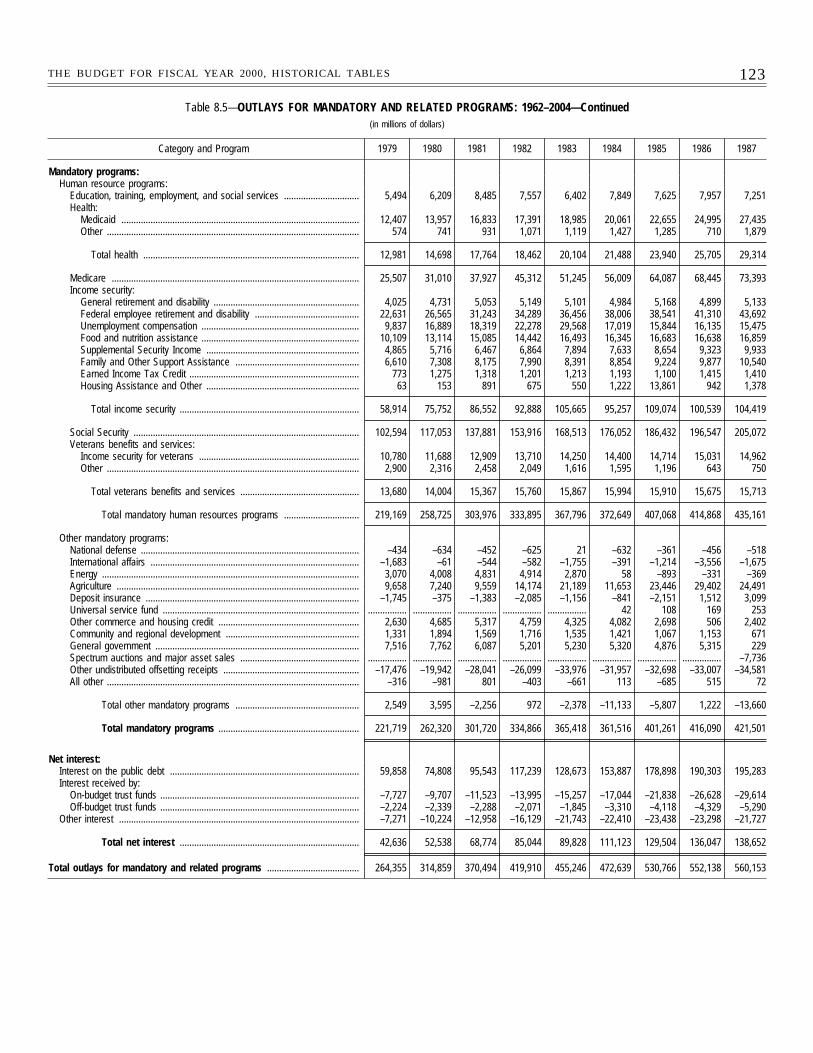
123THE BUDGET FOR FISCAL YEAR 2000, HISTORICAL TABLES
Table 8.5—OUTLAYS FOR MANDATORY AND RELATED PROGRAMS: 1962–2004—Continued(in millions of dollars)
Category and Program 1979 1980 1981 1982 1983 1984 1985 1986 1987
Mandatory programs:Human resource programs:
Education, training, employment, and social services ............................... 5,494 6,209 8,485 7,557 6,402 7,849 7,625 7,957 7,251Health:
Medicaid .................................................................................................. 12,407 13,957 16,833 17,391 18,985 20,061 22,655 24,995 27,435Other ........................................................................................................ 574 741 931 1,071 1,119 1,427 1,285 710 1,879
Total health ......................................................................................... 12,981 14,698 17,764 18,462 20,104 21,488 23,940 25,705 29,314
Medicare ...................................................................................................... 25,507 31,010 37,927 45,312 51,245 56,009 64,087 68,445 73,393Income security:
General retirement and disability ............................................................ 4,025 4,731 5,053 5,149 5,101 4,984 5,168 4,899 5,133Federal employee retirement and disability ........................................... 22,631 26,565 31,243 34,289 36,456 38,006 38,541 41,310 43,692Unemployment compensation ................................................................. 9,837 16,889 18,319 22,278 29,568 17,019 15,844 16,135 15,475Food and nutrition assistance ................................................................. 10,109 13,114 15,085 14,442 16,493 16,345 16,683 16,638 16,859Supplemental Security Income ............................................................... 4,865 5,716 6,467 6,864 7,894 7,633 8,654 9,323 9,933Family and Other Support Assistance ................................................... 6,610 7,308 8,175 7,990 8,391 8,854 9,224 9,877 10,540Earned Income Tax Credit ...................................................................... 773 1,275 1,318 1,201 1,213 1,193 1,100 1,415 1,410Housing Assistance and Other ............................................................... 63 153 891 675 550 1,222 13,861 942 1,378
Total income security .......................................................................... 58,914 75,752 86,552 92,888 105,665 95,257 109,074 100,539 104,419
Social Security ............................................................................................. 102,594 117,053 137,881 153,916 168,513 176,052 186,432 196,547 205,072Veterans benefits and services:
Income security for veterans .................................................................. 10,780 11,688 12,909 13,710 14,250 14,400 14,714 15,031 14,962Other ........................................................................................................ 2,900 2,316 2,458 2,049 1,616 1,595 1,196 643 750
Total veterans benefits and services ................................................. 13,680 14,004 15,367 15,760 15,867 15,994 15,910 15,675 15,713
Total mandatory human resources programs ............................... 219,169 258,725 303,976 333,895 367,796 372,649 407,068 414,868 435,161
Other mandatory programs:National defense .......................................................................................... –434 –634 –452 –625 21 –632 –361 –456 –518International affairs ...................................................................................... –1,683 –61 –544 –582 –1,755 –391 –1,214 –3,556 –1,675Energy .......................................................................................................... 3,070 4,008 4,831 4,914 2,870 58 –893 –331 –369Agriculture .................................................................................................... 9,658 7,240 9,559 14,174 21,189 11,653 23,446 29,402 24,491Deposit insurance ........................................................................................ –1,745 –375 –1,383 –2,085 –1,156 –841 –2,151 1,512 3,099Universal service fund ................................................................................. ................ ................ ................ ................ ................ 42 108 169 253Other commerce and housing credit .......................................................... 2,630 4,685 5,317 4,759 4,325 4,082 2,698 506 2,402Community and regional development ....................................................... 1,331 1,894 1,569 1,716 1,535 1,421 1,067 1,153 671General government .................................................................................... 7,516 7,762 6,087 5,201 5,230 5,320 4,876 5,315 229Spectrum auctions and major asset sales ................................................. ................ ................ ................ ................ ................ ................ ................ ................ –7,736Other undistributed offsetting receipts ........................................................ –17,476 –19,942 –28,041 –26,099 –33,976 –31,957 –32,698 –33,007 –34,581All other ........................................................................................................ –316 –981 801 –403 –661 113 –685 515 72
Total other mandatory programs ................................................... 2,549 3,595 –2,256 972 –2,378 –11,133 –5,807 1,222 –13,660
Total mandatory programs .......................................................... 221,719 262,320 301,720 334,866 365,418 361,516 401,261 416,090 421,501
Net interest:Interest on the public debt .............................................................................. 59,858 74,808 95,543 117,239 128,673 153,887 178,898 190,303 195,283Interest received by:
On-budget trust funds .................................................................................. –7,727 –9,707 –11,523 –13,995 –15,257 –17,044 –21,838 –26,628 –29,614Off-budget trust funds .................................................................................. –2,224 –2,339 –2,288 –2,071 –1,845 –3,310 –4,118 –4,329 –5,290
Other interest ................................................................................................... –7,271 –10,224 –12,958 –16,129 –21,743 –22,410 –23,438 –23,298 –21,727
Total net interest .......................................................................... 42,636 52,538 68,774 85,044 89,828 111,123 129,504 136,047 138,652
Total outlays for mandatory and related programs ...................................... 264,355 314,859 370,494 419,910 455,246 472,639 530,766 552,138 560,153
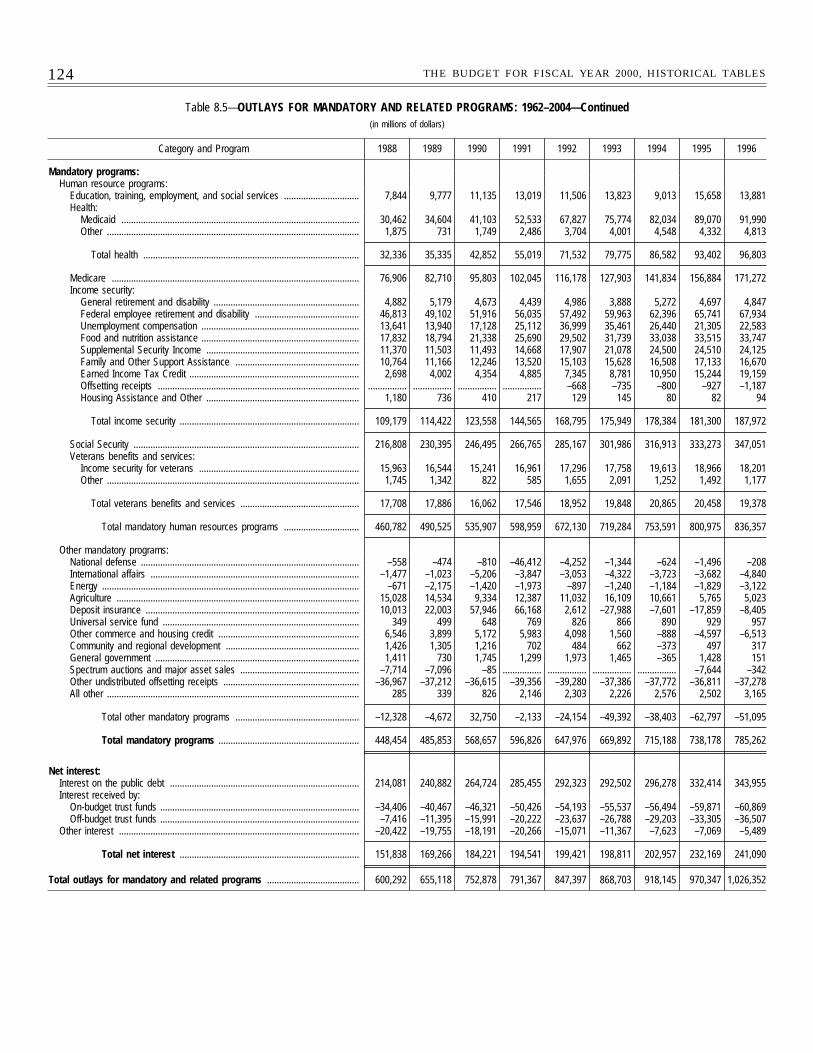
124 THE BUDGET FOR FISCAL YEAR 2000, HISTORICAL TABLES
Table 8.5—OUTLAYS FOR MANDATORY AND RELATED PROGRAMS: 1962–2004—Continued(in millions of dollars)
Category and Program 1988 1989 1990 1991 1992 1993 1994 1995 1996
Mandatory programs:Human resource programs:
Education, training, employment, and social services ............................... 7,844 9,777 11,135 13,019 11,506 13,823 9,013 15,658 13,881Health:
Medicaid .................................................................................................. 30,462 34,604 41,103 52,533 67,827 75,774 82,034 89,070 91,990Other ........................................................................................................ 1,875 731 1,749 2,486 3,704 4,001 4,548 4,332 4,813
Total health ......................................................................................... 32,336 35,335 42,852 55,019 71,532 79,775 86,582 93,402 96,803
Medicare ...................................................................................................... 76,906 82,710 95,803 102,045 116,178 127,903 141,834 156,884 171,272Income security:
General retirement and disability ............................................................ 4,882 5,179 4,673 4,439 4,986 3,888 5,272 4,697 4,847Federal employee retirement and disability ........................................... 46,813 49,102 51,916 56,035 57,492 59,963 62,396 65,741 67,934Unemployment compensation ................................................................. 13,641 13,940 17,128 25,112 36,999 35,461 26,440 21,305 22,583Food and nutrition assistance ................................................................. 17,832 18,794 21,338 25,690 29,502 31,739 33,038 33,515 33,747Supplemental Security Income ............................................................... 11,370 11,503 11,493 14,668 17,907 21,078 24,500 24,510 24,125Family and Other Support Assistance ................................................... 10,764 11,166 12,246 13,520 15,103 15,628 16,508 17,133 16,670Earned Income Tax Credit ...................................................................... 2,698 4,002 4,354 4,885 7,345 8,781 10,950 15,244 19,159Offsetting receipts ................................................................................... ................ ................ ................ ................ –668 –735 –800 –927 –1,187Housing Assistance and Other ............................................................... 1,180 736 410 217 129 145 80 82 94
Total income security .......................................................................... 109,179 114,422 123,558 144,565 168,795 175,949 178,384 181,300 187,972
Social Security ............................................................................................. 216,808 230,395 246,495 266,765 285,167 301,986 316,913 333,273 347,051Veterans benefits and services:
Income security for veterans .................................................................. 15,963 16,544 15,241 16,961 17,296 17,758 19,613 18,966 18,201Other ........................................................................................................ 1,745 1,342 822 585 1,655 2,091 1,252 1,492 1,177
Total veterans benefits and services ................................................. 17,708 17,886 16,062 17,546 18,952 19,848 20,865 20,458 19,378
Total mandatory human resources programs ............................... 460,782 490,525 535,907 598,959 672,130 719,284 753,591 800,975 836,357
Other mandatory programs:National defense .......................................................................................... –558 –474 –810 –46,412 –4,252 –1,344 –624 –1,496 –208International affairs ...................................................................................... –1,477 –1,023 –5,206 –3,847 –3,053 –4,322 –3,723 –3,682 –4,840Energy .......................................................................................................... –671 –2,175 –1,420 –1,973 –897 –1,240 –1,184 –1,829 –3,122Agriculture .................................................................................................... 15,028 14,534 9,334 12,387 11,032 16,109 10,661 5,765 5,023Deposit insurance ........................................................................................ 10,013 22,003 57,946 66,168 2,612 –27,988 –7,601 –17,859 –8,405Universal service fund ................................................................................. 349 499 648 769 826 866 890 929 957Other commerce and housing credit .......................................................... 6,546 3,899 5,172 5,983 4,098 1,560 –888 –4,597 –6,513Community and regional development ....................................................... 1,426 1,305 1,216 702 484 662 –373 497 317General government .................................................................................... 1,411 730 1,745 1,299 1,973 1,465 –365 1,428 151Spectrum auctions and major asset sales ................................................. –7,714 –7,096 –85 ................ ................ ................ ................ –7,644 –342Other undistributed offsetting receipts ........................................................ –36,967 –37,212 –36,615 –39,356 –39,280 –37,386 –37,772 –36,811 –37,278All other ........................................................................................................ 285 339 826 2,146 2,303 2,226 2,576 2,502 3,165
Total other mandatory programs ................................................... –12,328 –4,672 32,750 –2,133 –24,154 –49,392 –38,403 –62,797 –51,095
Total mandatory programs .......................................................... 448,454 485,853 568,657 596,826 647,976 669,892 715,188 738,178 785,262
Net interest:Interest on the public debt .............................................................................. 214,081 240,882 264,724 285,455 292,323 292,502 296,278 332,414 343,955Interest received by:
On-budget trust funds .................................................................................. –34,406 –40,467 –46,321 –50,426 –54,193 –55,537 –56,494 –59,871 –60,869Off-budget trust funds .................................................................................. –7,416 –11,395 –15,991 –20,222 –23,637 –26,788 –29,203 –33,305 –36,507
Other interest ................................................................................................... –20,422 –19,755 –18,191 –20,266 –15,071 –11,367 –7,623 –7,069 –5,489
Total net interest .......................................................................... 151,838 169,266 184,221 194,541 199,421 198,811 202,957 232,169 241,090
Total outlays for mandatory and related programs ...................................... 600,292 655,118 752,878 791,367 847,397 868,703 918,145 970,347 1,026,352
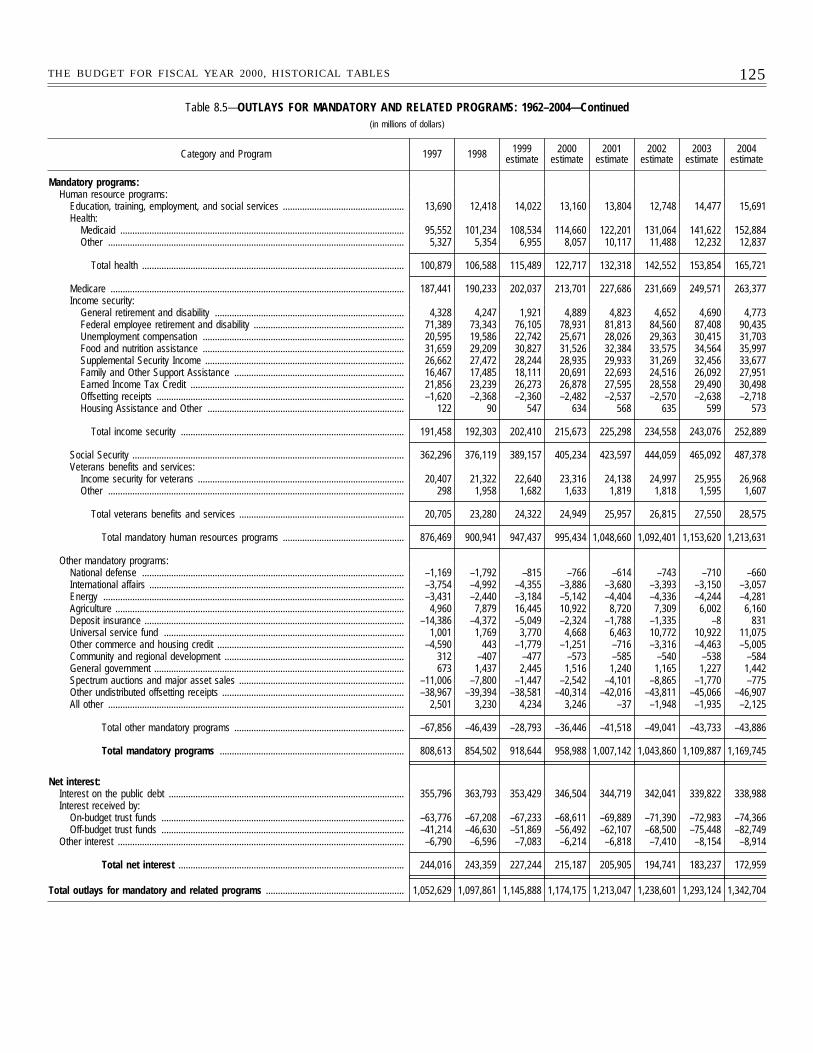
125THE BUDGET FOR FISCAL YEAR 2000, HISTORICAL TABLES
Table 8.5—OUTLAYS FOR MANDATORY AND RELATED PROGRAMS: 1962–2004—Continued(in millions of dollars)
Category and Program 1997 1998 1999estimate
2000estimate
2001estimate
2002estimate
2003estimate
2004estimate
Mandatory programs:Human resource programs:
Education, training, employment, and social services .................................................. 13,690 12,418 14,022 13,160 13,804 12,748 14,477 15,691Health:
Medicaid ..................................................................................................................... 95,552 101,234 108,534 114,660 122,201 131,064 141,622 152,884Other .......................................................................................................................... 5,327 5,354 6,955 8,057 10,117 11,488 12,232 12,837
Total health ............................................................................................................ 100,879 106,588 115,489 122,717 132,318 142,552 153,854 165,721
Medicare ......................................................................................................................... 187,441 190,233 202,037 213,701 227,686 231,669 249,571 263,377Income security:
General retirement and disability .............................................................................. 4,328 4,247 1,921 4,889 4,823 4,652 4,690 4,773Federal employee retirement and disability .............................................................. 71,389 73,343 76,105 78,931 81,813 84,560 87,408 90,435Unemployment compensation ................................................................................... 20,595 19,586 22,742 25,671 28,026 29,363 30,415 31,703Food and nutrition assistance ................................................................................... 31,659 29,209 30,827 31,526 32,384 33,575 34,564 35,997Supplemental Security Income .................................................................................. 26,662 27,472 28,244 28,935 29,933 31,269 32,456 33,677Family and Other Support Assistance ...................................................................... 16,467 17,485 18,111 20,691 22,693 24,516 26,092 27,951Earned Income Tax Credit ........................................................................................ 21,856 23,239 26,273 26,878 27,595 28,558 29,490 30,498Offsetting receipts ...................................................................................................... –1,620 –2,368 –2,360 –2,482 –2,537 –2,570 –2,638 –2,718Housing Assistance and Other ................................................................................. 122 90 547 634 568 635 599 573
Total income security ............................................................................................ 191,458 192,303 202,410 215,673 225,298 234,558 243,076 252,889
Social Security ................................................................................................................ 362,296 376,119 389,157 405,234 423,597 444,059 465,092 487,378Veterans benefits and services:
Income security for veterans ..................................................................................... 20,407 21,322 22,640 23,316 24,138 24,997 25,955 26,968Other .......................................................................................................................... 298 1,958 1,682 1,633 1,819 1,818 1,595 1,607
Total veterans benefits and services .................................................................... 20,705 23,280 24,322 24,949 25,957 26,815 27,550 28,575
Total mandatory human resources programs .................................................. 876,469 900,941 947,437 995,434 1,048,660 1,092,401 1,153,620 1,213,631
Other mandatory programs:National defense ............................................................................................................ –1,169 –1,792 –815 –766 –614 –743 –710 –660International affairs ......................................................................................................... –3,754 –4,992 –4,355 –3,886 –3,680 –3,393 –3,150 –3,057Energy ............................................................................................................................ –3,431 –2,440 –3,184 –5,142 –4,404 –4,336 –4,244 –4,281Agriculture ....................................................................................................................... 4,960 7,879 16,445 10,922 8,720 7,309 6,002 6,160Deposit insurance ........................................................................................................... –14,386 –4,372 –5,049 –2,324 –1,788 –1,335 –8 831Universal service fund ................................................................................................... 1,001 1,769 3,770 4,668 6,463 10,772 10,922 11,075Other commerce and housing credit ............................................................................. –4,590 443 –1,779 –1,251 –716 –3,316 –4,463 –5,005Community and regional development .......................................................................... 312 –407 –477 –573 –585 –540 –538 –584General government ....................................................................................................... 673 1,437 2,445 1,516 1,240 1,165 1,227 1,442Spectrum auctions and major asset sales .................................................................... –11,006 –7,800 –1,447 –2,542 –4,101 –8,865 –1,770 –775Other undistributed offsetting receipts ........................................................................... –38,967 –39,394 –38,581 –40,314 –42,016 –43,811 –45,066 –46,907All other .......................................................................................................................... 2,501 3,230 4,234 3,246 –37 –1,948 –1,935 –2,125
Total other mandatory programs ...................................................................... –67,856 –46,439 –28,793 –36,446 –41,518 –49,041 –43,733 –43,886
Total mandatory programs ............................................................................ 808,613 854,502 918,644 958,988 1,007,142 1,043,860 1,109,887 1,169,745
Net interest:Interest on the public debt ................................................................................................. 355,796 363,793 353,429 346,504 344,719 342,041 339,822 338,988Interest received by:
On-budget trust funds .................................................................................................... –63,776 –67,208 –67,233 –68,611 –69,889 –71,390 –72,983 –74,366Off-budget trust funds .................................................................................................... –41,214 –46,630 –51,869 –56,492 –62,107 –68,500 –75,448 –82,749
Other interest ...................................................................................................................... –6,790 –6,596 –7,083 –6,214 –6,818 –7,410 –8,154 –8,914
Total net interest ............................................................................................. 244,016 243,359 227,244 215,187 205,905 194,741 183,237 172,959
Total outlays for mandatory and related programs ......................................................... 1,052,629 1,097,861 1,145,888 1,174,175 1,213,047 1,238,601 1,293,124 1,342,704
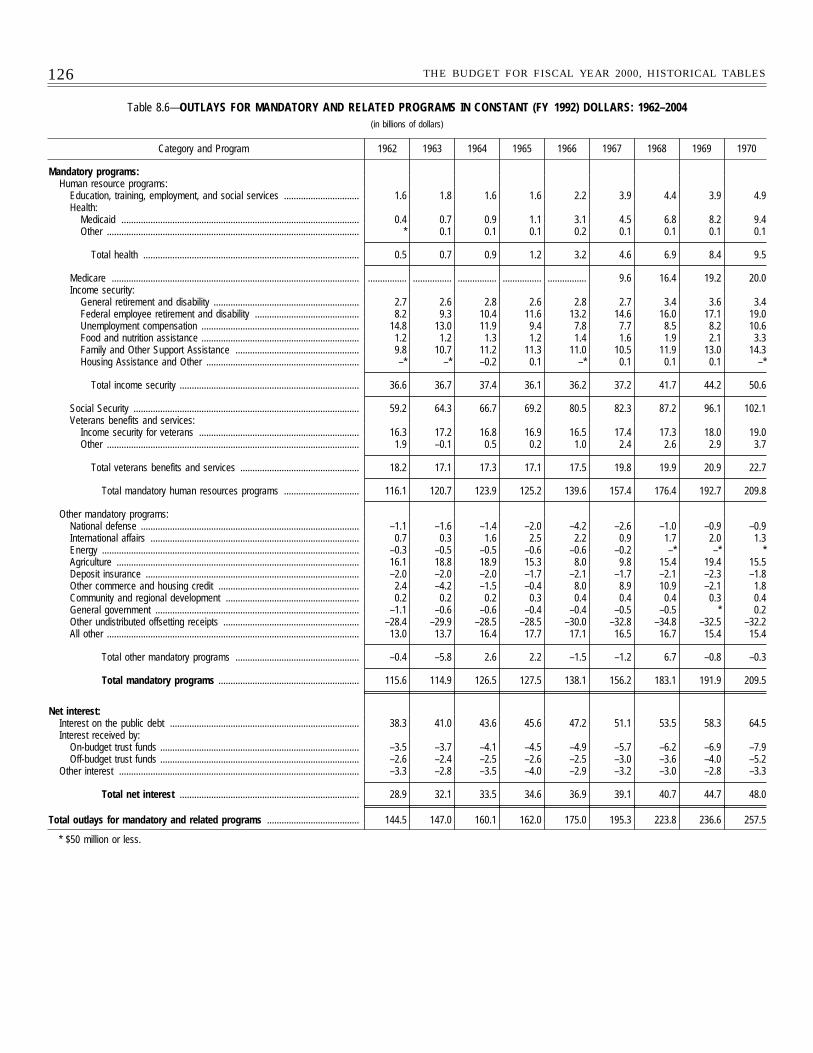
126 THE BUDGET FOR FISCAL YEAR 2000, HISTORICAL TABLES
Table 8.6—OUTLAYS FOR MANDATORY AND RELATED PROGRAMS IN CONSTANT (FY 1992) DOLLARS: 1962–2004(in billions of dollars)
Category and Program 1962 1963 1964 1965 1966 1967 1968 1969 1970
Mandatory programs:Human resource programs:
Education, training, employment, and social services ............................... 1.6 1.8 1.6 1.6 2.2 3.9 4.4 3.9 4.9Health:
Medicaid .................................................................................................. 0.4 0.7 0.9 1.1 3.1 4.5 6.8 8.2 9.4Other ........................................................................................................ * 0.1 0.1 0.1 0.2 0.1 0.1 0.1 0.1
Total health ......................................................................................... 0.5 0.7 0.9 1.2 3.2 4.6 6.9 8.4 9.5
Medicare ...................................................................................................... ................ ................ ................ ................ ................ 9.6 16.4 19.2 20.0Income security:
General retirement and disability ............................................................ 2.7 2.6 2.8 2.6 2.8 2.7 3.4 3.6 3.4Federal employee retirement and disability ........................................... 8.2 9.3 10.4 11.6 13.2 14.6 16.0 17.1 19.0Unemployment compensation ................................................................. 14.8 13.0 11.9 9.4 7.8 7.7 8.5 8.2 10.6Food and nutrition assistance ................................................................. 1.2 1.2 1.3 1.2 1.4 1.6 1.9 2.1 3.3Family and Other Support Assistance ................................................... 9.8 10.7 11.2 11.3 11.0 10.5 11.9 13.0 14.3Housing Assistance and Other ............................................................... –* –* –0.2 0.1 –* 0.1 0.1 0.1 –*
Total income security .......................................................................... 36.6 36.7 37.4 36.1 36.2 37.2 41.7 44.2 50.6
Social Security ............................................................................................. 59.2 64.3 66.7 69.2 80.5 82.3 87.2 96.1 102.1Veterans benefits and services:
Income security for veterans .................................................................. 16.3 17.2 16.8 16.9 16.5 17.4 17.3 18.0 19.0Other ........................................................................................................ 1.9 –0.1 0.5 0.2 1.0 2.4 2.6 2.9 3.7
Total veterans benefits and services ................................................. 18.2 17.1 17.3 17.1 17.5 19.8 19.9 20.9 22.7
Total mandatory human resources programs ............................... 116.1 120.7 123.9 125.2 139.6 157.4 176.4 192.7 209.8
Other mandatory programs:National defense .......................................................................................... –1.1 –1.6 –1.4 –2.0 –4.2 –2.6 –1.0 –0.9 –0.9International affairs ...................................................................................... 0.7 0.3 1.6 2.5 2.2 0.9 1.7 2.0 1.3Energy .......................................................................................................... –0.3 –0.5 –0.5 –0.6 –0.6 –0.2 –* –* *Agriculture .................................................................................................... 16.1 18.8 18.9 15.3 8.0 9.8 15.4 19.4 15.5Deposit insurance ........................................................................................ –2.0 –2.0 –2.0 –1.7 –2.1 –1.7 –2.1 –2.3 –1.8Other commerce and housing credit .......................................................... 2.4 –4.2 –1.5 –0.4 8.0 8.9 10.9 –2.1 1.8Community and regional development ....................................................... 0.2 0.2 0.2 0.3 0.4 0.4 0.4 0.3 0.4General government .................................................................................... –1.1 –0.6 –0.6 –0.4 –0.4 –0.5 –0.5 * 0.2Other undistributed offsetting receipts ........................................................ –28.4 –29.9 –28.5 –28.5 –30.0 –32.8 –34.8 –32.5 –32.2All other ........................................................................................................ 13.0 13.7 16.4 17.7 17.1 16.5 16.7 15.4 15.4
Total other mandatory programs ................................................... –0.4 –5.8 2.6 2.2 –1.5 –1.2 6.7 –0.8 –0.3
Total mandatory programs .......................................................... 115.6 114.9 126.5 127.5 138.1 156.2 183.1 191.9 209.5
Net interest:Interest on the public debt .............................................................................. 38.3 41.0 43.6 45.6 47.2 51.1 53.5 58.3 64.5Interest received by:
On-budget trust funds .................................................................................. –3.5 –3.7 –4.1 –4.5 –4.9 –5.7 –6.2 –6.9 –7.9Off-budget trust funds .................................................................................. –2.6 –2.4 –2.5 –2.6 –2.5 –3.0 –3.6 –4.0 –5.2
Other interest ................................................................................................... –3.3 –2.8 –3.5 –4.0 –2.9 –3.2 –3.0 –2.8 –3.3
Total net interest .......................................................................... 28.9 32.1 33.5 34.6 36.9 39.1 40.7 44.7 48.0
Total outlays for mandatory and related programs ...................................... 144.5 147.0 160.1 162.0 175.0 195.3 223.8 236.6 257.5
* $50 million or less.
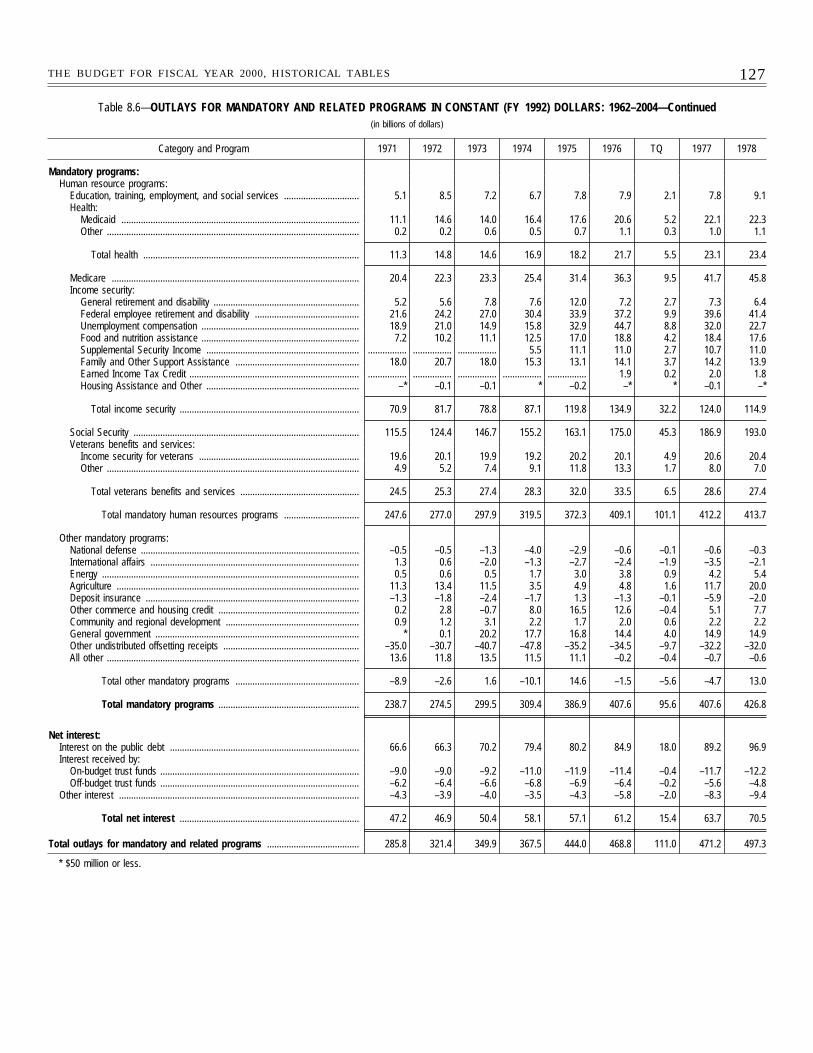
127THE BUDGET FOR FISCAL YEAR 2000, HISTORICAL TABLES
Table 8.6—OUTLAYS FOR MANDATORY AND RELATED PROGRAMS IN CONSTANT (FY 1992) DOLLARS: 1962–2004—Continued(in billions of dollars)
Category and Program 1971 1972 1973 1974 1975 1976 TQ 1977 1978
Mandatory programs:Human resource programs:
Education, training, employment, and social services ............................... 5.1 8.5 7.2 6.7 7.8 7.9 2.1 7.8 9.1Health:
Medicaid .................................................................................................. 11.1 14.6 14.0 16.4 17.6 20.6 5.2 22.1 22.3Other ........................................................................................................ 0.2 0.2 0.6 0.5 0.7 1.1 0.3 1.0 1.1
Total health ......................................................................................... 11.3 14.8 14.6 16.9 18.2 21.7 5.5 23.1 23.4
Medicare ...................................................................................................... 20.4 22.3 23.3 25.4 31.4 36.3 9.5 41.7 45.8Income security:
General retirement and disability ............................................................ 5.2 5.6 7.8 7.6 12.0 7.2 2.7 7.3 6.4Federal employee retirement and disability ........................................... 21.6 24.2 27.0 30.4 33.9 37.2 9.9 39.6 41.4Unemployment compensation ................................................................. 18.9 21.0 14.9 15.8 32.9 44.7 8.8 32.0 22.7Food and nutrition assistance ................................................................. 7.2 10.2 11.1 12.5 17.0 18.8 4.2 18.4 17.6Supplemental Security Income ............................................................... ................ ................ ................ 5.5 11.1 11.0 2.7 10.7 11.0Family and Other Support Assistance ................................................... 18.0 20.7 18.0 15.3 13.1 14.1 3.7 14.2 13.9Earned Income Tax Credit ...................................................................... ................ ................ ................ ................ ................ 1.9 0.2 2.0 1.8Housing Assistance and Other ............................................................... –* –0.1 –0.1 * –0.2 –* * –0.1 –*
Total income security .......................................................................... 70.9 81.7 78.8 87.1 119.8 134.9 32.2 124.0 114.9
Social Security ............................................................................................. 115.5 124.4 146.7 155.2 163.1 175.0 45.3 186.9 193.0Veterans benefits and services:
Income security for veterans .................................................................. 19.6 20.1 19.9 19.2 20.2 20.1 4.9 20.6 20.4Other ........................................................................................................ 4.9 5.2 7.4 9.1 11.8 13.3 1.7 8.0 7.0
Total veterans benefits and services ................................................. 24.5 25.3 27.4 28.3 32.0 33.5 6.5 28.6 27.4
Total mandatory human resources programs ............................... 247.6 277.0 297.9 319.5 372.3 409.1 101.1 412.2 413.7
Other mandatory programs:National defense .......................................................................................... –0.5 –0.5 –1.3 –4.0 –2.9 –0.6 –0.1 –0.6 –0.3International affairs ...................................................................................... 1.3 0.6 –2.0 –1.3 –2.7 –2.4 –1.9 –3.5 –2.1Energy .......................................................................................................... 0.5 0.6 0.5 1.7 3.0 3.8 0.9 4.2 5.4Agriculture .................................................................................................... 11.3 13.4 11.5 3.5 4.9 4.8 1.6 11.7 20.0Deposit insurance ........................................................................................ –1.3 –1.8 –2.4 –1.7 1.3 –1.3 –0.1 –5.9 –2.0Other commerce and housing credit .......................................................... 0.2 2.8 –0.7 8.0 16.5 12.6 –0.4 5.1 7.7Community and regional development ....................................................... 0.9 1.2 3.1 2.2 1.7 2.0 0.6 2.2 2.2General government .................................................................................... * 0.1 20.2 17.7 16.8 14.4 4.0 14.9 14.9Other undistributed offsetting receipts ........................................................ –35.0 –30.7 –40.7 –47.8 –35.2 –34.5 –9.7 –32.2 –32.0All other ........................................................................................................ 13.6 11.8 13.5 11.5 11.1 –0.2 –0.4 –0.7 –0.6
Total other mandatory programs ................................................... –8.9 –2.6 1.6 –10.1 14.6 –1.5 –5.6 –4.7 13.0
Total mandatory programs .......................................................... 238.7 274.5 299.5 309.4 386.9 407.6 95.6 407.6 426.8
Net interest:Interest on the public debt .............................................................................. 66.6 66.3 70.2 79.4 80.2 84.9 18.0 89.2 96.9Interest received by:
On-budget trust funds .................................................................................. –9.0 –9.0 –9.2 –11.0 –11.9 –11.4 –0.4 –11.7 –12.2Off-budget trust funds .................................................................................. –6.2 –6.4 –6.6 –6.8 –6.9 –6.4 –0.2 –5.6 –4.8
Other interest ................................................................................................... –4.3 –3.9 –4.0 –3.5 –4.3 –5.8 –2.0 –8.3 –9.4
Total net interest .......................................................................... 47.2 46.9 50.4 58.1 57.1 61.2 15.4 63.7 70.5
Total outlays for mandatory and related programs ...................................... 285.8 321.4 349.9 367.5 444.0 468.8 111.0 471.2 497.3
* $50 million or less.
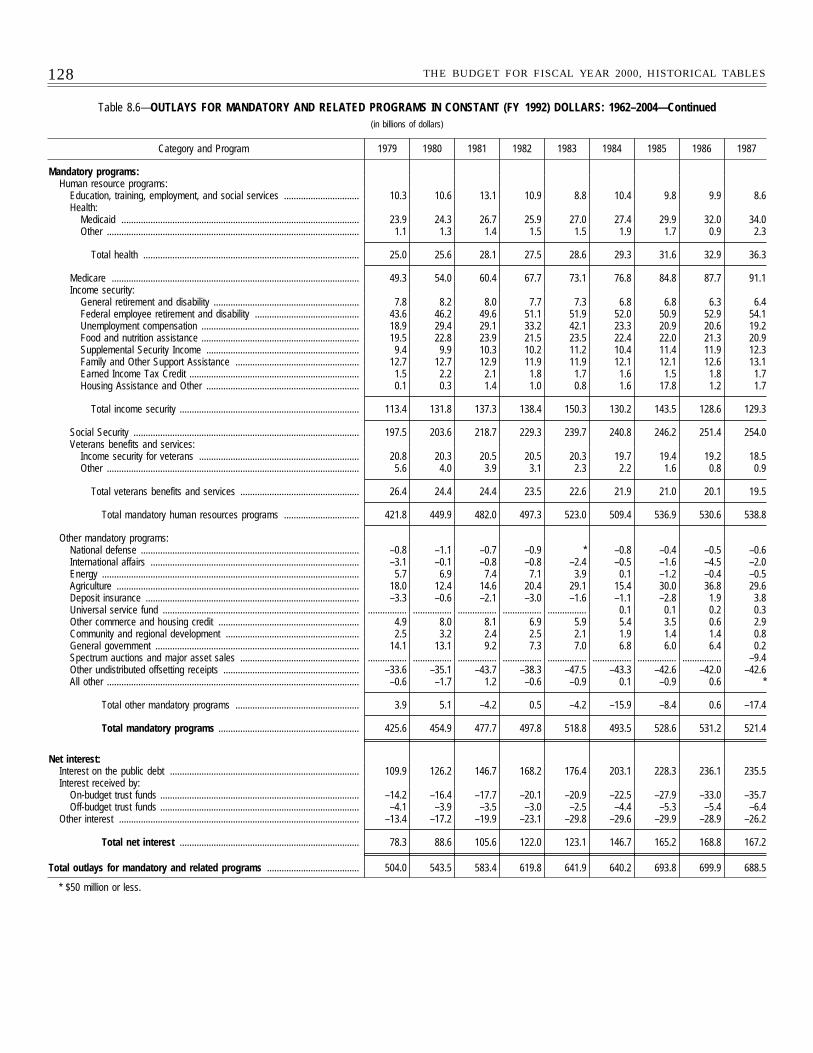
128 THE BUDGET FOR FISCAL YEAR 2000, HISTORICAL TABLES
Table 8.6—OUTLAYS FOR MANDATORY AND RELATED PROGRAMS IN CONSTANT (FY 1992) DOLLARS: 1962–2004—Continued(in billions of dollars)
Category and Program 1979 1980 1981 1982 1983 1984 1985 1986 1987
Mandatory programs:Human resource programs:
Education, training, employment, and social services ............................... 10.3 10.6 13.1 10.9 8.8 10.4 9.8 9.9 8.6Health:
Medicaid .................................................................................................. 23.9 24.3 26.7 25.9 27.0 27.4 29.9 32.0 34.0Other ........................................................................................................ 1.1 1.3 1.4 1.5 1.5 1.9 1.7 0.9 2.3
Total health ......................................................................................... 25.0 25.6 28.1 27.5 28.6 29.3 31.6 32.9 36.3
Medicare ...................................................................................................... 49.3 54.0 60.4 67.7 73.1 76.8 84.8 87.7 91.1Income security:
General retirement and disability ............................................................ 7.8 8.2 8.0 7.7 7.3 6.8 6.8 6.3 6.4Federal employee retirement and disability ........................................... 43.6 46.2 49.6 51.1 51.9 52.0 50.9 52.9 54.1Unemployment compensation ................................................................. 18.9 29.4 29.1 33.2 42.1 23.3 20.9 20.6 19.2Food and nutrition assistance ................................................................. 19.5 22.8 23.9 21.5 23.5 22.4 22.0 21.3 20.9Supplemental Security Income ............................................................... 9.4 9.9 10.3 10.2 11.2 10.4 11.4 11.9 12.3Family and Other Support Assistance ................................................... 12.7 12.7 12.9 11.9 11.9 12.1 12.1 12.6 13.1Earned Income Tax Credit ...................................................................... 1.5 2.2 2.1 1.8 1.7 1.6 1.5 1.8 1.7Housing Assistance and Other ............................................................... 0.1 0.3 1.4 1.0 0.8 1.6 17.8 1.2 1.7
Total income security .......................................................................... 113.4 131.8 137.3 138.4 150.3 130.2 143.5 128.6 129.3
Social Security ............................................................................................. 197.5 203.6 218.7 229.3 239.7 240.8 246.2 251.4 254.0Veterans benefits and services:
Income security for veterans .................................................................. 20.8 20.3 20.5 20.5 20.3 19.7 19.4 19.2 18.5Other ........................................................................................................ 5.6 4.0 3.9 3.1 2.3 2.2 1.6 0.8 0.9
Total veterans benefits and services ................................................. 26.4 24.4 24.4 23.5 22.6 21.9 21.0 20.1 19.5
Total mandatory human resources programs ............................... 421.8 449.9 482.0 497.3 523.0 509.4 536.9 530.6 538.8
Other mandatory programs:National defense .......................................................................................... –0.8 –1.1 –0.7 –0.9 * –0.8 –0.4 –0.5 –0.6International affairs ...................................................................................... –3.1 –0.1 –0.8 –0.8 –2.4 –0.5 –1.6 –4.5 –2.0Energy .......................................................................................................... 5.7 6.9 7.4 7.1 3.9 0.1 –1.2 –0.4 –0.5Agriculture .................................................................................................... 18.0 12.4 14.6 20.4 29.1 15.4 30.0 36.8 29.6Deposit insurance ........................................................................................ –3.3 –0.6 –2.1 –3.0 –1.6 –1.1 –2.8 1.9 3.8Universal service fund ................................................................................. ................ ................ ................ ................ ................ 0.1 0.1 0.2 0.3Other commerce and housing credit .......................................................... 4.9 8.0 8.1 6.9 5.9 5.4 3.5 0.6 2.9Community and regional development ....................................................... 2.5 3.2 2.4 2.5 2.1 1.9 1.4 1.4 0.8General government .................................................................................... 14.1 13.1 9.2 7.3 7.0 6.8 6.0 6.4 0.2Spectrum auctions and major asset sales ................................................. ................ ................ ................ ................ ................ ................ ................ ................ –9.4Other undistributed offsetting receipts ........................................................ –33.6 –35.1 –43.7 –38.3 –47.5 –43.3 –42.6 –42.0 –42.6All other ........................................................................................................ –0.6 –1.7 1.2 –0.6 –0.9 0.1 –0.9 0.6 *
Total other mandatory programs ................................................... 3.9 5.1 –4.2 0.5 –4.2 –15.9 –8.4 0.6 –17.4
Total mandatory programs .......................................................... 425.6 454.9 477.7 497.8 518.8 493.5 528.6 531.2 521.4
Net interest:Interest on the public debt .............................................................................. 109.9 126.2 146.7 168.2 176.4 203.1 228.3 236.1 235.5Interest received by:
On-budget trust funds .................................................................................. –14.2 –16.4 –17.7 –20.1 –20.9 –22.5 –27.9 –33.0 –35.7Off-budget trust funds .................................................................................. –4.1 –3.9 –3.5 –3.0 –2.5 –4.4 –5.3 –5.4 –6.4
Other interest ................................................................................................... –13.4 –17.2 –19.9 –23.1 –29.8 –29.6 –29.9 –28.9 –26.2
Total net interest .......................................................................... 78.3 88.6 105.6 122.0 123.1 146.7 165.2 168.8 167.2
Total outlays for mandatory and related programs ...................................... 504.0 543.5 583.4 619.8 641.9 640.2 693.8 699.9 688.5
* $50 million or less.
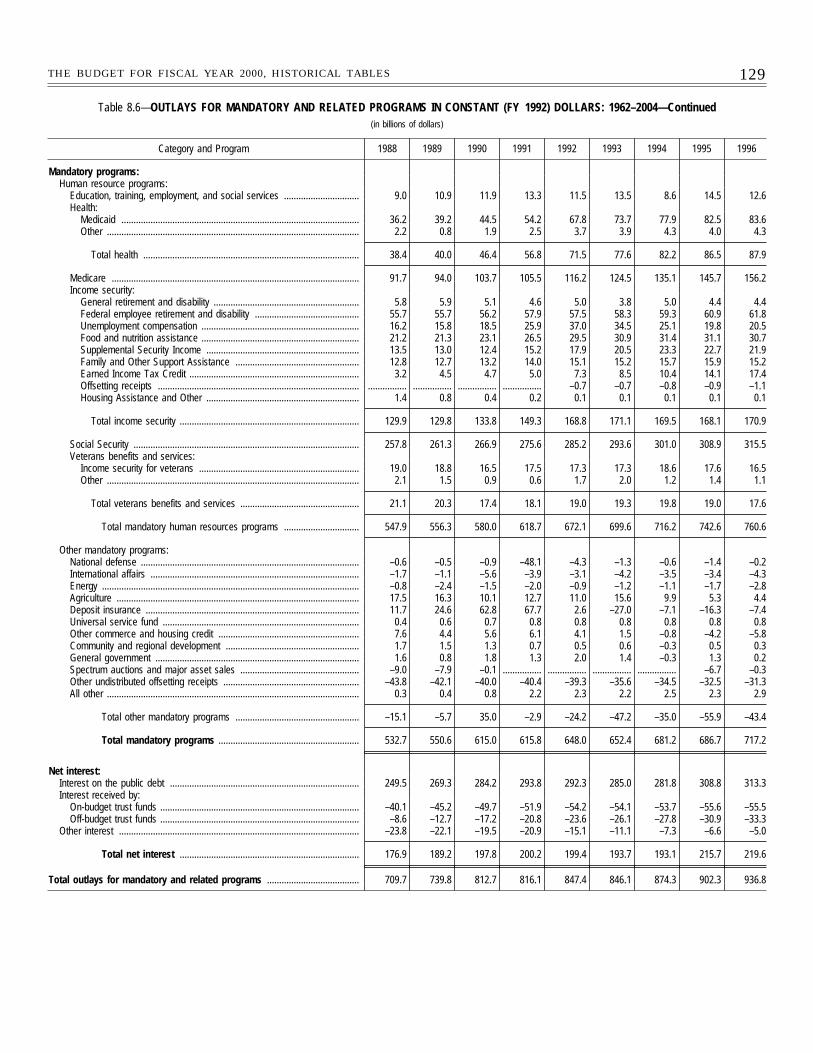
129THE BUDGET FOR FISCAL YEAR 2000, HISTORICAL TABLES
Table 8.6—OUTLAYS FOR MANDATORY AND RELATED PROGRAMS IN CONSTANT (FY 1992) DOLLARS: 1962–2004—Continued(in billions of dollars)
Category and Program 1988 1989 1990 1991 1992 1993 1994 1995 1996
Mandatory programs:Human resource programs:
Education, training, employment, and social services ............................... 9.0 10.9 11.9 13.3 11.5 13.5 8.6 14.5 12.6Health:
Medicaid .................................................................................................. 36.2 39.2 44.5 54.2 67.8 73.7 77.9 82.5 83.6Other ........................................................................................................ 2.2 0.8 1.9 2.5 3.7 3.9 4.3 4.0 4.3
Total health ......................................................................................... 38.4 40.0 46.4 56.8 71.5 77.6 82.2 86.5 87.9
Medicare ...................................................................................................... 91.7 94.0 103.7 105.5 116.2 124.5 135.1 145.7 156.2Income security:
General retirement and disability ............................................................ 5.8 5.9 5.1 4.6 5.0 3.8 5.0 4.4 4.4Federal employee retirement and disability ........................................... 55.7 55.7 56.2 57.9 57.5 58.3 59.3 60.9 61.8Unemployment compensation ................................................................. 16.2 15.8 18.5 25.9 37.0 34.5 25.1 19.8 20.5Food and nutrition assistance ................................................................. 21.2 21.3 23.1 26.5 29.5 30.9 31.4 31.1 30.7Supplemental Security Income ............................................................... 13.5 13.0 12.4 15.2 17.9 20.5 23.3 22.7 21.9Family and Other Support Assistance ................................................... 12.8 12.7 13.2 14.0 15.1 15.2 15.7 15.9 15.2Earned Income Tax Credit ...................................................................... 3.2 4.5 4.7 5.0 7.3 8.5 10.4 14.1 17.4Offsetting receipts ................................................................................... ................ ................ ................ ................ –0.7 –0.7 –0.8 –0.9 –1.1Housing Assistance and Other ............................................................... 1.4 0.8 0.4 0.2 0.1 0.1 0.1 0.1 0.1
Total income security .......................................................................... 129.9 129.8 133.8 149.3 168.8 171.1 169.5 168.1 170.9
Social Security ............................................................................................. 257.8 261.3 266.9 275.6 285.2 293.6 301.0 308.9 315.5Veterans benefits and services:
Income security for veterans .................................................................. 19.0 18.8 16.5 17.5 17.3 17.3 18.6 17.6 16.5Other ........................................................................................................ 2.1 1.5 0.9 0.6 1.7 2.0 1.2 1.4 1.1
Total veterans benefits and services ................................................. 21.1 20.3 17.4 18.1 19.0 19.3 19.8 19.0 17.6
Total mandatory human resources programs ............................... 547.9 556.3 580.0 618.7 672.1 699.6 716.2 742.6 760.6
Other mandatory programs:National defense .......................................................................................... –0.6 –0.5 –0.9 –48.1 –4.3 –1.3 –0.6 –1.4 –0.2International affairs ...................................................................................... –1.7 –1.1 –5.6 –3.9 –3.1 –4.2 –3.5 –3.4 –4.3Energy .......................................................................................................... –0.8 –2.4 –1.5 –2.0 –0.9 –1.2 –1.1 –1.7 –2.8Agriculture .................................................................................................... 17.5 16.3 10.1 12.7 11.0 15.6 9.9 5.3 4.4Deposit insurance ........................................................................................ 11.7 24.6 62.8 67.7 2.6 –27.0 –7.1 –16.3 –7.4Universal service fund ................................................................................. 0.4 0.6 0.7 0.8 0.8 0.8 0.8 0.8 0.8Other commerce and housing credit .......................................................... 7.6 4.4 5.6 6.1 4.1 1.5 –0.8 –4.2 –5.8Community and regional development ....................................................... 1.7 1.5 1.3 0.7 0.5 0.6 –0.3 0.5 0.3General government .................................................................................... 1.6 0.8 1.8 1.3 2.0 1.4 –0.3 1.3 0.2Spectrum auctions and major asset sales ................................................. –9.0 –7.9 –0.1 ................ ................ ................ ................ –6.7 –0.3Other undistributed offsetting receipts ........................................................ –43.8 –42.1 –40.0 –40.4 –39.3 –35.6 –34.5 –32.5 –31.3All other ........................................................................................................ 0.3 0.4 0.8 2.2 2.3 2.2 2.5 2.3 2.9
Total other mandatory programs ................................................... –15.1 –5.7 35.0 –2.9 –24.2 –47.2 –35.0 –55.9 –43.4
Total mandatory programs .......................................................... 532.7 550.6 615.0 615.8 648.0 652.4 681.2 686.7 717.2
Net interest:Interest on the public debt .............................................................................. 249.5 269.3 284.2 293.8 292.3 285.0 281.8 308.8 313.3Interest received by:
On-budget trust funds .................................................................................. –40.1 –45.2 –49.7 –51.9 –54.2 –54.1 –53.7 –55.6 –55.5Off-budget trust funds .................................................................................. –8.6 –12.7 –17.2 –20.8 –23.6 –26.1 –27.8 –30.9 –33.3
Other interest ................................................................................................... –23.8 –22.1 –19.5 –20.9 –15.1 –11.1 –7.3 –6.6 –5.0
Total net interest .......................................................................... 176.9 189.2 197.8 200.2 199.4 193.7 193.1 215.7 219.6
Total outlays for mandatory and related programs ...................................... 709.7 739.8 812.7 816.1 847.4 846.1 874.3 902.3 936.8
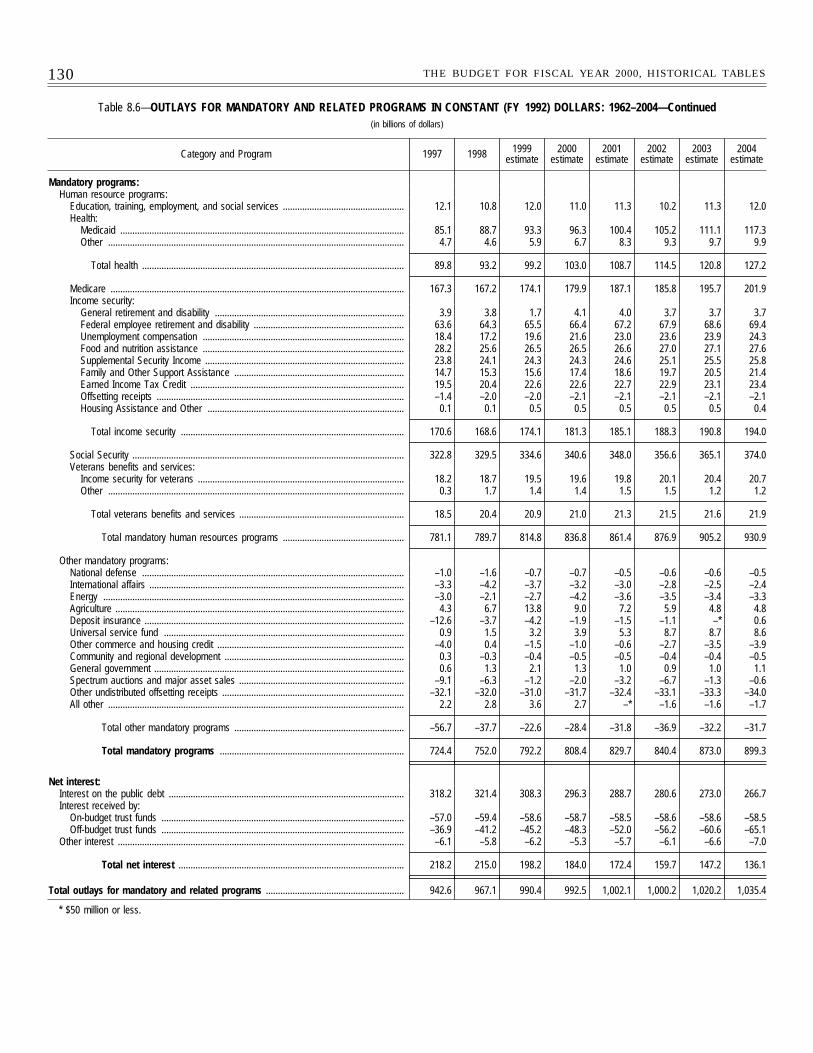
130 THE BUDGET FOR FISCAL YEAR 2000, HISTORICAL TABLES
Table 8.6—OUTLAYS FOR MANDATORY AND RELATED PROGRAMS IN CONSTANT (FY 1992) DOLLARS: 1962–2004—Continued(in billions of dollars)
Category and Program 1997 1998 1999estimate
2000estimate
2001estimate
2002estimate
2003estimate
2004estimate
Mandatory programs:Human resource programs:
Education, training, employment, and social services .................................................. 12.1 10.8 12.0 11.0 11.3 10.2 11.3 12.0Health:
Medicaid ..................................................................................................................... 85.1 88.7 93.3 96.3 100.4 105.2 111.1 117.3Other .......................................................................................................................... 4.7 4.6 5.9 6.7 8.3 9.3 9.7 9.9
Total health ............................................................................................................ 89.8 93.2 99.2 103.0 108.7 114.5 120.8 127.2
Medicare ......................................................................................................................... 167.3 167.2 174.1 179.9 187.1 185.8 195.7 201.9Income security:
General retirement and disability .............................................................................. 3.9 3.8 1.7 4.1 4.0 3.7 3.7 3.7Federal employee retirement and disability .............................................................. 63.6 64.3 65.5 66.4 67.2 67.9 68.6 69.4Unemployment compensation ................................................................................... 18.4 17.2 19.6 21.6 23.0 23.6 23.9 24.3Food and nutrition assistance ................................................................................... 28.2 25.6 26.5 26.5 26.6 27.0 27.1 27.6Supplemental Security Income .................................................................................. 23.8 24.1 24.3 24.3 24.6 25.1 25.5 25.8Family and Other Support Assistance ...................................................................... 14.7 15.3 15.6 17.4 18.6 19.7 20.5 21.4Earned Income Tax Credit ........................................................................................ 19.5 20.4 22.6 22.6 22.7 22.9 23.1 23.4Offsetting receipts ...................................................................................................... –1.4 –2.0 –2.0 –2.1 –2.1 –2.1 –2.1 –2.1Housing Assistance and Other ................................................................................. 0.1 0.1 0.5 0.5 0.5 0.5 0.5 0.4
Total income security ............................................................................................ 170.6 168.6 174.1 181.3 185.1 188.3 190.8 194.0
Social Security ................................................................................................................ 322.8 329.5 334.6 340.6 348.0 356.6 365.1 374.0Veterans benefits and services:
Income security for veterans ..................................................................................... 18.2 18.7 19.5 19.6 19.8 20.1 20.4 20.7Other .......................................................................................................................... 0.3 1.7 1.4 1.4 1.5 1.5 1.2 1.2
Total veterans benefits and services .................................................................... 18.5 20.4 20.9 21.0 21.3 21.5 21.6 21.9
Total mandatory human resources programs .................................................. 781.1 789.7 814.8 836.8 861.4 876.9 905.2 930.9
Other mandatory programs:National defense ............................................................................................................ –1.0 –1.6 –0.7 –0.7 –0.5 –0.6 –0.6 –0.5International affairs ......................................................................................................... –3.3 –4.2 –3.7 –3.2 –3.0 –2.8 –2.5 –2.4Energy ............................................................................................................................ –3.0 –2.1 –2.7 –4.2 –3.6 –3.5 –3.4 –3.3Agriculture ....................................................................................................................... 4.3 6.7 13.8 9.0 7.2 5.9 4.8 4.8Deposit insurance ........................................................................................................... –12.6 –3.7 –4.2 –1.9 –1.5 –1.1 –* 0.6Universal service fund ................................................................................................... 0.9 1.5 3.2 3.9 5.3 8.7 8.7 8.6Other commerce and housing credit ............................................................................. –4.0 0.4 –1.5 –1.0 –0.6 –2.7 –3.5 –3.9Community and regional development .......................................................................... 0.3 –0.3 –0.4 –0.5 –0.5 –0.4 –0.4 –0.5General government ....................................................................................................... 0.6 1.3 2.1 1.3 1.0 0.9 1.0 1.1Spectrum auctions and major asset sales .................................................................... –9.1 –6.3 –1.2 –2.0 –3.2 –6.7 –1.3 –0.6Other undistributed offsetting receipts ........................................................................... –32.1 –32.0 –31.0 –31.7 –32.4 –33.1 –33.3 –34.0All other .......................................................................................................................... 2.2 2.8 3.6 2.7 –* –1.6 –1.6 –1.7
Total other mandatory programs ...................................................................... –56.7 –37.7 –22.6 –28.4 –31.8 –36.9 –32.2 –31.7
Total mandatory programs ............................................................................ 724.4 752.0 792.2 808.4 829.7 840.4 873.0 899.3
Net interest:Interest on the public debt ................................................................................................. 318.2 321.4 308.3 296.3 288.7 280.6 273.0 266.7Interest received by:
On-budget trust funds .................................................................................................... –57.0 –59.4 –58.6 –58.7 –58.5 –58.6 –58.6 –58.5Off-budget trust funds .................................................................................................... –36.9 –41.2 –45.2 –48.3 –52.0 –56.2 –60.6 –65.1
Other interest ...................................................................................................................... –6.1 –5.8 –6.2 –5.3 –5.7 –6.1 –6.6 –7.0
Total net interest ............................................................................................. 218.2 215.0 198.2 184.0 172.4 159.7 147.2 136.1
Total outlays for mandatory and related programs ......................................................... 942.6 967.1 990.4 992.5 1,002.1 1,000.2 1,020.2 1,035.4
* $50 million or less.
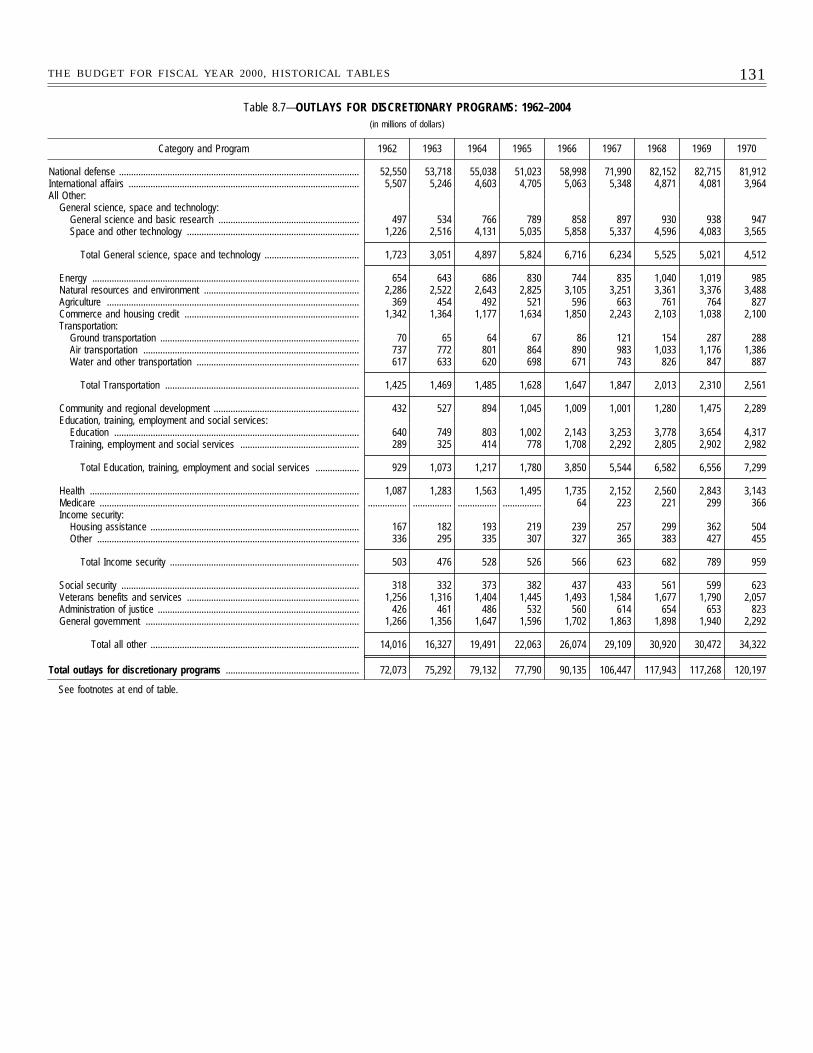
131THE BUDGET FOR FISCAL YEAR 2000, HISTORICAL TABLES
Table 8.7—OUTLAYS FOR DISCRETIONARY PROGRAMS: 1962–2004(in millions of dollars)
Category and Program 1962 1963 1964 1965 1966 1967 1968 1969 1970
National defense ................................................................................................... 52,550 53,718 55,038 51,023 58,998 71,990 82,152 82,715 81,912International affairs ............................................................................................... 5,507 5,246 4,603 4,705 5,063 5,348 4,871 4,081 3,964All Other:
General science, space and technology:General science and basic research .......................................................... 497 534 766 789 858 897 930 938 947Space and other technology ....................................................................... 1,226 2,516 4,131 5,035 5,858 5,337 4,596 4,083 3,565
Total General science, space and technology ....................................... 1,723 3,051 4,897 5,824 6,716 6,234 5,525 5,021 4,512
Energy .............................................................................................................. 654 643 686 830 744 835 1,040 1,019 985Natural resources and environment ................................................................ 2,286 2,522 2,643 2,825 3,105 3,251 3,361 3,376 3,488Agriculture ........................................................................................................ 369 454 492 521 596 663 761 764 827Commerce and housing credit ........................................................................ 1,342 1,364 1,177 1,634 1,850 2,243 2,103 1,038 2,100Transportation:
Ground transportation .................................................................................. 70 65 64 67 86 121 154 287 288Air transportation ......................................................................................... 737 772 801 864 890 983 1,033 1,176 1,386Water and other transportation ................................................................... 617 633 620 698 671 743 826 847 887
Total Transportation ................................................................................ 1,425 1,469 1,485 1,628 1,647 1,847 2,013 2,310 2,561
Community and regional development ............................................................ 432 527 894 1,045 1,009 1,001 1,280 1,475 2,289Education, training, employment and social services:
Education ..................................................................................................... 640 749 803 1,002 2,143 3,253 3,778 3,654 4,317Training, employment and social services ................................................. 289 325 414 778 1,708 2,292 2,805 2,902 2,982
Total Education, training, employment and social services .................. 929 1,073 1,217 1,780 3,850 5,544 6,582 6,556 7,299
Health ............................................................................................................... 1,087 1,283 1,563 1,495 1,735 2,152 2,560 2,843 3,143Medicare ........................................................................................................... ................ ................ ................ ................ 64 223 221 299 366Income security:
Housing assistance ...................................................................................... 167 182 193 219 239 257 299 362 504Other ............................................................................................................ 336 295 335 307 327 365 383 427 455
Total Income security .............................................................................. 503 476 528 526 566 623 682 789 959
Social security .................................................................................................. 318 332 373 382 437 433 561 599 623Veterans benefits and services ....................................................................... 1,256 1,316 1,404 1,445 1,493 1,584 1,677 1,790 2,057Administration of justice ................................................................................... 426 461 486 532 560 614 654 653 823General government ........................................................................................ 1,266 1,356 1,647 1,596 1,702 1,863 1,898 1,940 2,292
Total all other ...................................................................................... 14,016 16,327 19,491 22,063 26,074 29,109 30,920 30,472 34,322
Total outlays for discretionary programs ....................................................... 72,073 75,292 79,132 77,790 90,135 106,447 117,943 117,268 120,197
See footnotes at end of table.
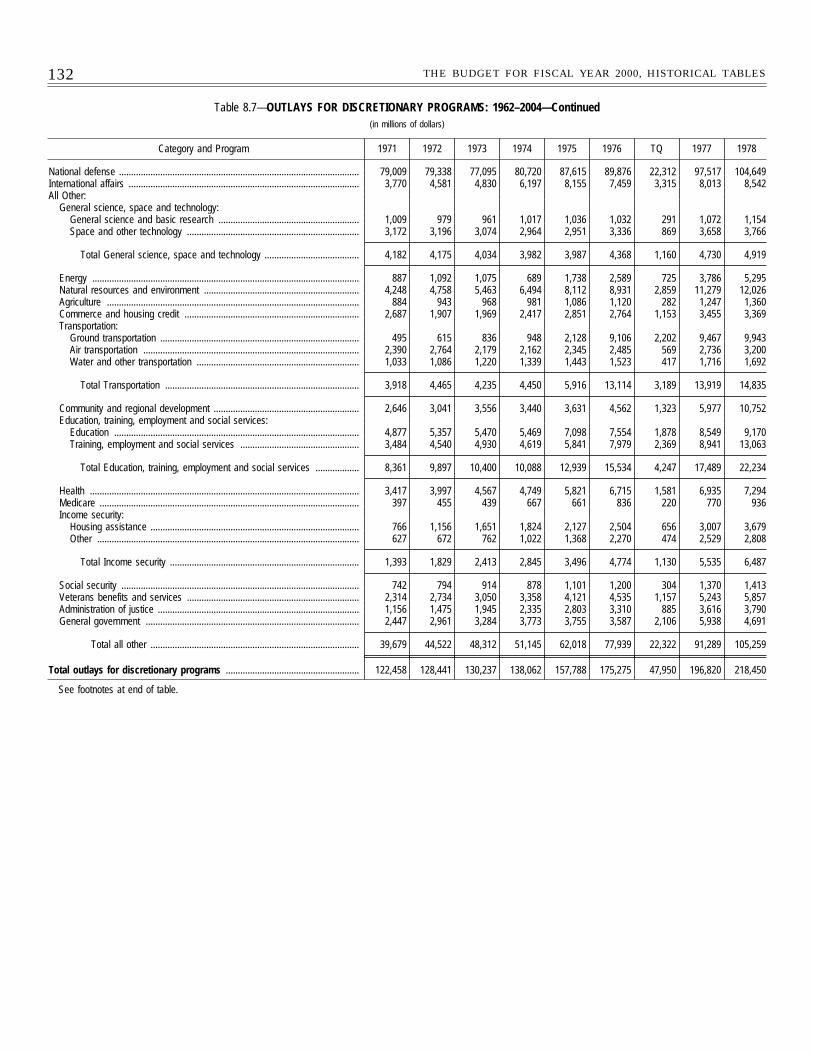
132 THE BUDGET FOR FISCAL YEAR 2000, HISTORICAL TABLES
Table 8.7—OUTLAYS FOR DISCRETIONARY PROGRAMS: 1962–2004—Continued(in millions of dollars)
Category and Program 1971 1972 1973 1974 1975 1976 TQ 1977 1978
National defense ................................................................................................... 79,009 79,338 77,095 80,720 87,615 89,876 22,312 97,517 104,649International affairs ............................................................................................... 3,770 4,581 4,830 6,197 8,155 7,459 3,315 8,013 8,542All Other:
General science, space and technology:General science and basic research .......................................................... 1,009 979 961 1,017 1,036 1,032 291 1,072 1,154Space and other technology ....................................................................... 3,172 3,196 3,074 2,964 2,951 3,336 869 3,658 3,766
Total General science, space and technology ....................................... 4,182 4,175 4,034 3,982 3,987 4,368 1,160 4,730 4,919
Energy .............................................................................................................. 887 1,092 1,075 689 1,738 2,589 725 3,786 5,295Natural resources and environment ................................................................ 4,248 4,758 5,463 6,494 8,112 8,931 2,859 11,279 12,026Agriculture ........................................................................................................ 884 943 968 981 1,086 1,120 282 1,247 1,360Commerce and housing credit ........................................................................ 2,687 1,907 1,969 2,417 2,851 2,764 1,153 3,455 3,369Transportation:
Ground transportation .................................................................................. 495 615 836 948 2,128 9,106 2,202 9,467 9,943Air transportation ......................................................................................... 2,390 2,764 2,179 2,162 2,345 2,485 569 2,736 3,200Water and other transportation ................................................................... 1,033 1,086 1,220 1,339 1,443 1,523 417 1,716 1,692
Total Transportation ................................................................................ 3,918 4,465 4,235 4,450 5,916 13,114 3,189 13,919 14,835
Community and regional development ............................................................ 2,646 3,041 3,556 3,440 3,631 4,562 1,323 5,977 10,752Education, training, employment and social services:
Education ..................................................................................................... 4,877 5,357 5,470 5,469 7,098 7,554 1,878 8,549 9,170Training, employment and social services ................................................. 3,484 4,540 4,930 4,619 5,841 7,979 2,369 8,941 13,063
Total Education, training, employment and social services .................. 8,361 9,897 10,400 10,088 12,939 15,534 4,247 17,489 22,234
Health ............................................................................................................... 3,417 3,997 4,567 4,749 5,821 6,715 1,581 6,935 7,294Medicare ........................................................................................................... 397 455 439 667 661 836 220 770 936Income security:
Housing assistance ...................................................................................... 766 1,156 1,651 1,824 2,127 2,504 656 3,007 3,679Other ............................................................................................................ 627 672 762 1,022 1,368 2,270 474 2,529 2,808
Total Income security .............................................................................. 1,393 1,829 2,413 2,845 3,496 4,774 1,130 5,535 6,487
Social security .................................................................................................. 742 794 914 878 1,101 1,200 304 1,370 1,413Veterans benefits and services ....................................................................... 2,314 2,734 3,050 3,358 4,121 4,535 1,157 5,243 5,857Administration of justice ................................................................................... 1,156 1,475 1,945 2,335 2,803 3,310 885 3,616 3,790General government ........................................................................................ 2,447 2,961 3,284 3,773 3,755 3,587 2,106 5,938 4,691
Total all other ...................................................................................... 39,679 44,522 48,312 51,145 62,018 77,939 22,322 91,289 105,259
Total outlays for discretionary programs ....................................................... 122,458 128,441 130,237 138,062 157,788 175,275 47,950 196,820 218,450
See footnotes at end of table.
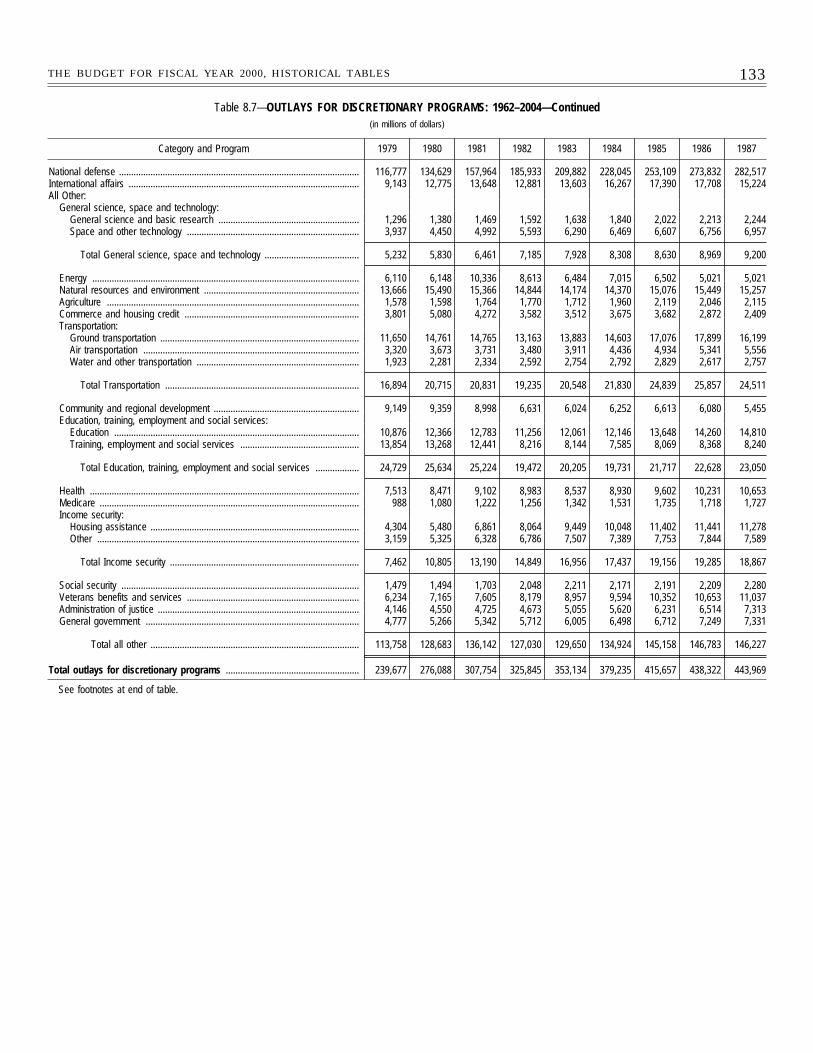
133THE BUDGET FOR FISCAL YEAR 2000, HISTORICAL TABLES
Table 8.7—OUTLAYS FOR DISCRETIONARY PROGRAMS: 1962–2004—Continued(in millions of dollars)
Category and Program 1979 1980 1981 1982 1983 1984 1985 1986 1987
National defense ................................................................................................... 116,777 134,629 157,964 185,933 209,882 228,045 253,109 273,832 282,517International affairs ............................................................................................... 9,143 12,775 13,648 12,881 13,603 16,267 17,390 17,708 15,224All Other:
General science, space and technology:General science and basic research .......................................................... 1,296 1,380 1,469 1,592 1,638 1,840 2,022 2,213 2,244Space and other technology ....................................................................... 3,937 4,450 4,992 5,593 6,290 6,469 6,607 6,756 6,957
Total General science, space and technology ....................................... 5,232 5,830 6,461 7,185 7,928 8,308 8,630 8,969 9,200
Energy .............................................................................................................. 6,110 6,148 10,336 8,613 6,484 7,015 6,502 5,021 5,021Natural resources and environment ................................................................ 13,666 15,490 15,366 14,844 14,174 14,370 15,076 15,449 15,257Agriculture ........................................................................................................ 1,578 1,598 1,764 1,770 1,712 1,960 2,119 2,046 2,115Commerce and housing credit ........................................................................ 3,801 5,080 4,272 3,582 3,512 3,675 3,682 2,872 2,409Transportation:
Ground transportation .................................................................................. 11,650 14,761 14,765 13,163 13,883 14,603 17,076 17,899 16,199Air transportation ......................................................................................... 3,320 3,673 3,731 3,480 3,911 4,436 4,934 5,341 5,556Water and other transportation ................................................................... 1,923 2,281 2,334 2,592 2,754 2,792 2,829 2,617 2,757
Total Transportation ................................................................................ 16,894 20,715 20,831 19,235 20,548 21,830 24,839 25,857 24,511
Community and regional development ............................................................ 9,149 9,359 8,998 6,631 6,024 6,252 6,613 6,080 5,455Education, training, employment and social services:
Education ..................................................................................................... 10,876 12,366 12,783 11,256 12,061 12,146 13,648 14,260 14,810Training, employment and social services ................................................. 13,854 13,268 12,441 8,216 8,144 7,585 8,069 8,368 8,240
Total Education, training, employment and social services .................. 24,729 25,634 25,224 19,472 20,205 19,731 21,717 22,628 23,050
Health ............................................................................................................... 7,513 8,471 9,102 8,983 8,537 8,930 9,602 10,231 10,653Medicare ........................................................................................................... 988 1,080 1,222 1,256 1,342 1,531 1,735 1,718 1,727Income security:
Housing assistance ...................................................................................... 4,304 5,480 6,861 8,064 9,449 10,048 11,402 11,441 11,278Other ............................................................................................................ 3,159 5,325 6,328 6,786 7,507 7,389 7,753 7,844 7,589
Total Income security .............................................................................. 7,462 10,805 13,190 14,849 16,956 17,437 19,156 19,285 18,867
Social security .................................................................................................. 1,479 1,494 1,703 2,048 2,211 2,171 2,191 2,209 2,280Veterans benefits and services ....................................................................... 6,234 7,165 7,605 8,179 8,957 9,594 10,352 10,653 11,037Administration of justice ................................................................................... 4,146 4,550 4,725 4,673 5,055 5,620 6,231 6,514 7,313General government ........................................................................................ 4,777 5,266 5,342 5,712 6,005 6,498 6,712 7,249 7,331
Total all other ...................................................................................... 113,758 128,683 136,142 127,030 129,650 134,924 145,158 146,783 146,227
Total outlays for discretionary programs ....................................................... 239,677 276,088 307,754 325,845 353,134 379,235 415,657 438,322 443,969
See footnotes at end of table.
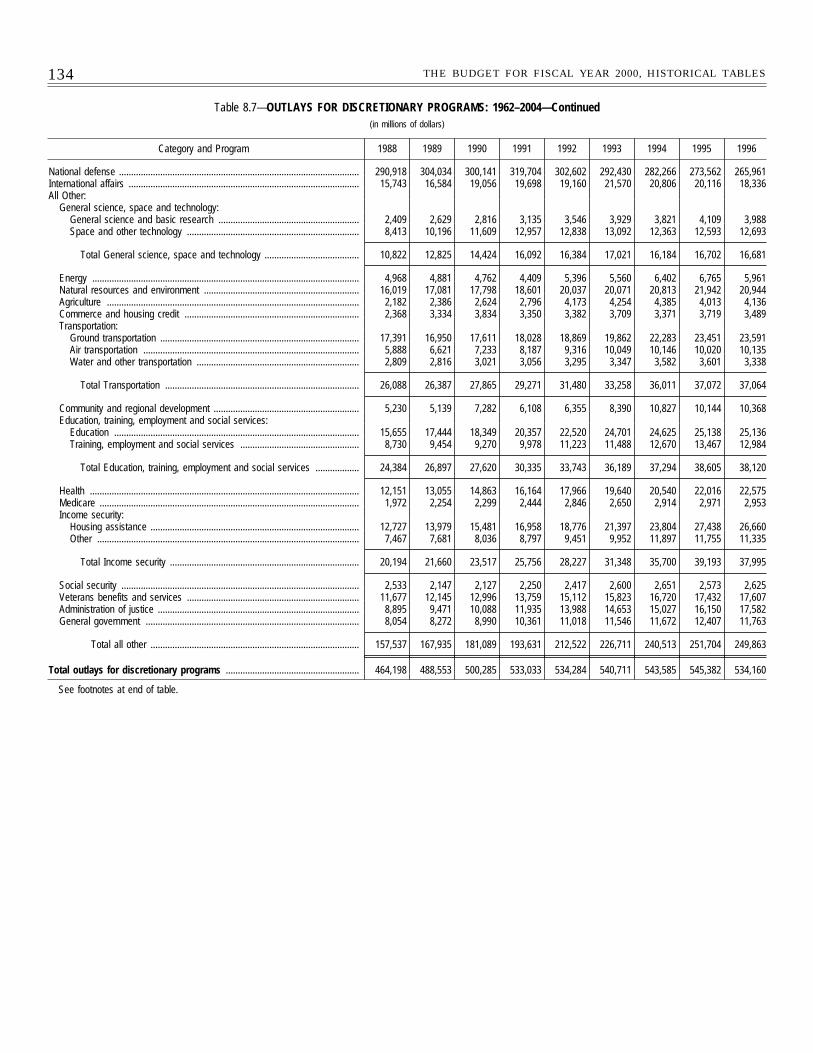
134 THE BUDGET FOR FISCAL YEAR 2000, HISTORICAL TABLES
Table 8.7—OUTLAYS FOR DISCRETIONARY PROGRAMS: 1962–2004—Continued(in millions of dollars)
Category and Program 1988 1989 1990 1991 1992 1993 1994 1995 1996
National defense ................................................................................................... 290,918 304,034 300,141 319,704 302,602 292,430 282,266 273,562 265,961International affairs ............................................................................................... 15,743 16,584 19,056 19,698 19,160 21,570 20,806 20,116 18,336All Other:
General science, space and technology:General science and basic research .......................................................... 2,409 2,629 2,816 3,135 3,546 3,929 3,821 4,109 3,988Space and other technology ....................................................................... 8,413 10,196 11,609 12,957 12,838 13,092 12,363 12,593 12,693
Total General science, space and technology ....................................... 10,822 12,825 14,424 16,092 16,384 17,021 16,184 16,702 16,681
Energy .............................................................................................................. 4,968 4,881 4,762 4,409 5,396 5,560 6,402 6,765 5,961Natural resources and environment ................................................................ 16,019 17,081 17,798 18,601 20,037 20,071 20,813 21,942 20,944Agriculture ........................................................................................................ 2,182 2,386 2,624 2,796 4,173 4,254 4,385 4,013 4,136Commerce and housing credit ........................................................................ 2,368 3,334 3,834 3,350 3,382 3,709 3,371 3,719 3,489Transportation:
Ground transportation .................................................................................. 17,391 16,950 17,611 18,028 18,869 19,862 22,283 23,451 23,591Air transportation ......................................................................................... 5,888 6,621 7,233 8,187 9,316 10,049 10,146 10,020 10,135Water and other transportation ................................................................... 2,809 2,816 3,021 3,056 3,295 3,347 3,582 3,601 3,338
Total Transportation ................................................................................ 26,088 26,387 27,865 29,271 31,480 33,258 36,011 37,072 37,064
Community and regional development ............................................................ 5,230 5,139 7,282 6,108 6,355 8,390 10,827 10,144 10,368Education, training, employment and social services:
Education ..................................................................................................... 15,655 17,444 18,349 20,357 22,520 24,701 24,625 25,138 25,136Training, employment and social services ................................................. 8,730 9,454 9,270 9,978 11,223 11,488 12,670 13,467 12,984
Total Education, training, employment and social services .................. 24,384 26,897 27,620 30,335 33,743 36,189 37,294 38,605 38,120
Health ............................................................................................................... 12,151 13,055 14,863 16,164 17,966 19,640 20,540 22,016 22,575Medicare ........................................................................................................... 1,972 2,254 2,299 2,444 2,846 2,650 2,914 2,971 2,953Income security:
Housing assistance ...................................................................................... 12,727 13,979 15,481 16,958 18,776 21,397 23,804 27,438 26,660Other ............................................................................................................ 7,467 7,681 8,036 8,797 9,451 9,952 11,897 11,755 11,335
Total Income security .............................................................................. 20,194 21,660 23,517 25,756 28,227 31,348 35,700 39,193 37,995
Social security .................................................................................................. 2,533 2,147 2,127 2,250 2,417 2,600 2,651 2,573 2,625Veterans benefits and services ....................................................................... 11,677 12,145 12,996 13,759 15,112 15,823 16,720 17,432 17,607Administration of justice ................................................................................... 8,895 9,471 10,088 11,935 13,988 14,653 15,027 16,150 17,582General government ........................................................................................ 8,054 8,272 8,990 10,361 11,018 11,546 11,672 12,407 11,763
Total all other ...................................................................................... 157,537 167,935 181,089 193,631 212,522 226,711 240,513 251,704 249,863
Total outlays for discretionary programs ....................................................... 464,198 488,553 500,285 533,033 534,284 540,711 543,585 545,382 534,160
See footnotes at end of table.
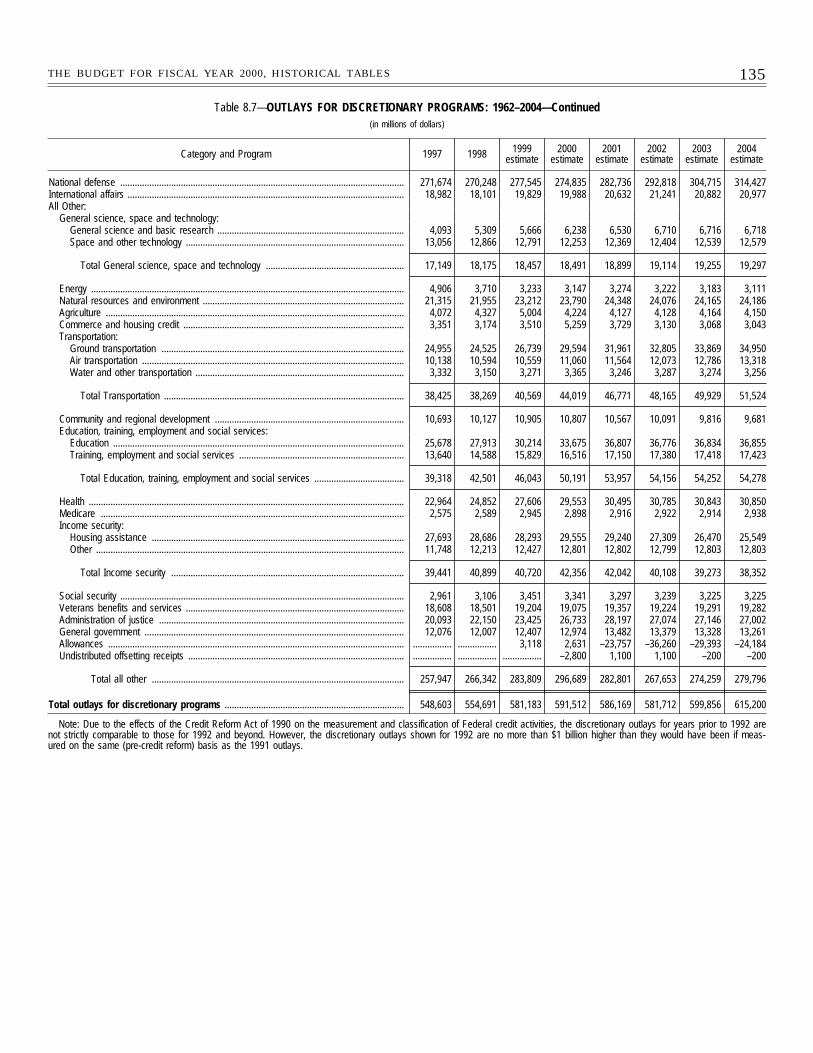
135THE BUDGET FOR FISCAL YEAR 2000, HISTORICAL TABLES
Table 8.7—OUTLAYS FOR DISCRETIONARY PROGRAMS: 1962–2004—Continued(in millions of dollars)
Category and Program 1997 1998 1999estimate
2000estimate
2001estimate
2002estimate
2003estimate
2004estimate
National defense ..................................................................................................................... 271,674 270,248 277,545 274,835 282,736 292,818 304,715 314,427International affairs .................................................................................................................. 18,982 18,101 19,829 19,988 20,632 21,241 20,882 20,977All Other:
General science, space and technology:General science and basic research ............................................................................. 4,093 5,309 5,666 6,238 6,530 6,710 6,716 6,718Space and other technology .......................................................................................... 13,056 12,866 12,791 12,253 12,369 12,404 12,539 12,579
Total General science, space and technology ......................................................... 17,149 18,175 18,457 18,491 18,899 19,114 19,255 19,297
Energy ................................................................................................................................. 4,906 3,710 3,233 3,147 3,274 3,222 3,183 3,111Natural resources and environment ................................................................................... 21,315 21,955 23,212 23,790 24,348 24,076 24,165 24,186Agriculture ........................................................................................................................... 4,072 4,327 5,004 4,224 4,127 4,128 4,164 4,150Commerce and housing credit ........................................................................................... 3,351 3,174 3,510 5,259 3,729 3,130 3,068 3,043Transportation:
Ground transportation .................................................................................................... 24,955 24,525 26,739 29,594 31,961 32,805 33,869 34,950Air transportation ............................................................................................................ 10,138 10,594 10,559 11,060 11,564 12,073 12,786 13,318Water and other transportation ...................................................................................... 3,332 3,150 3,271 3,365 3,246 3,287 3,274 3,256
Total Transportation ................................................................................................... 38,425 38,269 40,569 44,019 46,771 48,165 49,929 51,524
Community and regional development .............................................................................. 10,693 10,127 10,905 10,807 10,567 10,091 9,816 9,681Education, training, employment and social services:
Education ........................................................................................................................ 25,678 27,913 30,214 33,675 36,807 36,776 36,834 36,855Training, employment and social services .................................................................... 13,640 14,588 15,829 16,516 17,150 17,380 17,418 17,423
Total Education, training, employment and social services ..................................... 39,318 42,501 46,043 50,191 53,957 54,156 54,252 54,278
Health .................................................................................................................................. 22,964 24,852 27,606 29,553 30,495 30,785 30,843 30,850Medicare ............................................................................................................................. 2,575 2,589 2,945 2,898 2,916 2,922 2,914 2,938Income security:
Housing assistance ........................................................................................................ 27,693 28,686 28,293 29,555 29,240 27,309 26,470 25,549Other ............................................................................................................................... 11,748 12,213 12,427 12,801 12,802 12,799 12,803 12,803
Total Income security ................................................................................................ 39,441 40,899 40,720 42,356 42,042 40,108 39,273 38,352
Social security ..................................................................................................................... 2,961 3,106 3,451 3,341 3,297 3,239 3,225 3,225Veterans benefits and services .......................................................................................... 18,608 18,501 19,204 19,075 19,357 19,224 19,291 19,282Administration of justice ..................................................................................................... 20,093 22,150 23,425 26,733 28,197 27,074 27,146 27,002General government ........................................................................................................... 12,076 12,007 12,407 12,974 13,482 13,379 13,328 13,261Allowances .......................................................................................................................... ................ ................ 3,118 2,631 –23,757 –36,260 –29,393 –24,184Undistributed offsetting receipts ......................................................................................... ................ ................ ................ –2,800 1,100 1,100 –200 –200
Total all other ........................................................................................................ 257,947 266,342 283,809 296,689 282,801 267,653 274,259 279,796
Total outlays for discretionary programs .......................................................................... 548,603 554,691 581,183 591,512 586,169 581,712 599,856 615,200
Note: Due to the effects of the Credit Reform Act of 1990 on the measurement and classification of Federal credit activities, the discretionary outlays for years prior to 1992 arenot strictly comparable to those for 1992 and beyond. However, the discretionary outlays shown for 1992 are no more than $1 billion higher than they would have been if meas-ured on the same (pre-credit reform) basis as the 1991 outlays.
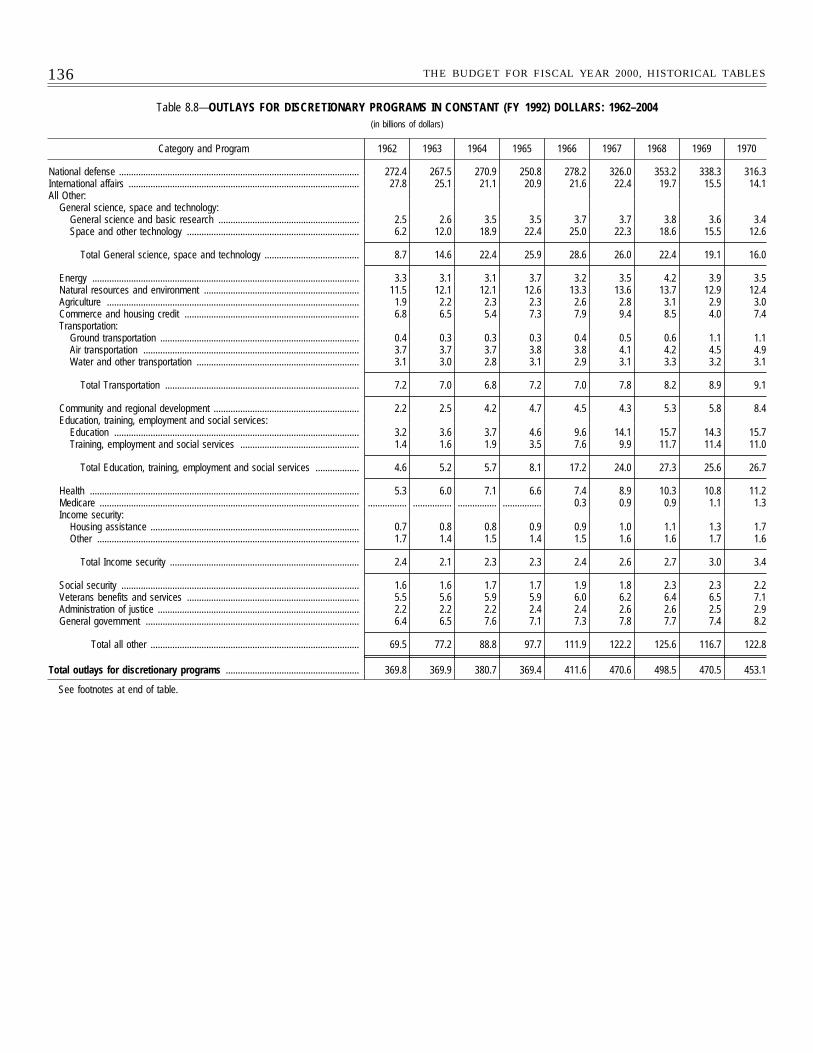
136 THE BUDGET FOR FISCAL YEAR 2000, HISTORICAL TABLES
Table 8.8—OUTLAYS FOR DISCRETIONARY PROGRAMS IN CONSTANT (FY 1992) DOLLARS: 1962–2004(in billions of dollars)
Category and Program 1962 1963 1964 1965 1966 1967 1968 1969 1970
National defense ................................................................................................... 272.4 267.5 270.9 250.8 278.2 326.0 353.2 338.3 316.3International affairs ............................................................................................... 27.8 25.1 21.1 20.9 21.6 22.4 19.7 15.5 14.1All Other:
General science, space and technology:General science and basic research .......................................................... 2.5 2.6 3.5 3.5 3.7 3.7 3.8 3.6 3.4Space and other technology ....................................................................... 6.2 12.0 18.9 22.4 25.0 22.3 18.6 15.5 12.6
Total General science, space and technology ....................................... 8.7 14.6 22.4 25.9 28.6 26.0 22.4 19.1 16.0
Energy .............................................................................................................. 3.3 3.1 3.1 3.7 3.2 3.5 4.2 3.9 3.5Natural resources and environment ................................................................ 11.5 12.1 12.1 12.6 13.3 13.6 13.7 12.9 12.4Agriculture ........................................................................................................ 1.9 2.2 2.3 2.3 2.6 2.8 3.1 2.9 3.0Commerce and housing credit ........................................................................ 6.8 6.5 5.4 7.3 7.9 9.4 8.5 4.0 7.4Transportation:
Ground transportation .................................................................................. 0.4 0.3 0.3 0.3 0.4 0.5 0.6 1.1 1.1Air transportation ......................................................................................... 3.7 3.7 3.7 3.8 3.8 4.1 4.2 4.5 4.9Water and other transportation ................................................................... 3.1 3.0 2.8 3.1 2.9 3.1 3.3 3.2 3.1
Total Transportation ................................................................................ 7.2 7.0 6.8 7.2 7.0 7.8 8.2 8.9 9.1
Community and regional development ............................................................ 2.2 2.5 4.2 4.7 4.5 4.3 5.3 5.8 8.4Education, training, employment and social services:
Education ..................................................................................................... 3.2 3.6 3.7 4.6 9.6 14.1 15.7 14.3 15.7Training, employment and social services ................................................. 1.4 1.6 1.9 3.5 7.6 9.9 11.7 11.4 11.0
Total Education, training, employment and social services .................. 4.6 5.2 5.7 8.1 17.2 24.0 27.3 25.6 26.7
Health ............................................................................................................... 5.3 6.0 7.1 6.6 7.4 8.9 10.3 10.8 11.2Medicare ........................................................................................................... ................ ................ ................ ................ 0.3 0.9 0.9 1.1 1.3Income security:
Housing assistance ...................................................................................... 0.7 0.8 0.8 0.9 0.9 1.0 1.1 1.3 1.7Other ............................................................................................................ 1.7 1.4 1.5 1.4 1.5 1.6 1.6 1.7 1.6
Total Income security .............................................................................. 2.4 2.1 2.3 2.3 2.4 2.6 2.7 3.0 3.4
Social security .................................................................................................. 1.6 1.6 1.7 1.7 1.9 1.8 2.3 2.3 2.2Veterans benefits and services ....................................................................... 5.5 5.6 5.9 5.9 6.0 6.2 6.4 6.5 7.1Administration of justice ................................................................................... 2.2 2.2 2.2 2.4 2.4 2.6 2.6 2.5 2.9General government ........................................................................................ 6.4 6.5 7.6 7.1 7.3 7.8 7.7 7.4 8.2
Total all other ...................................................................................... 69.5 77.2 88.8 97.7 111.9 122.2 125.6 116.7 122.8
Total outlays for discretionary programs ....................................................... 369.8 369.9 380.7 369.4 411.6 470.6 498.5 470.5 453.1
See footnotes at end of table.
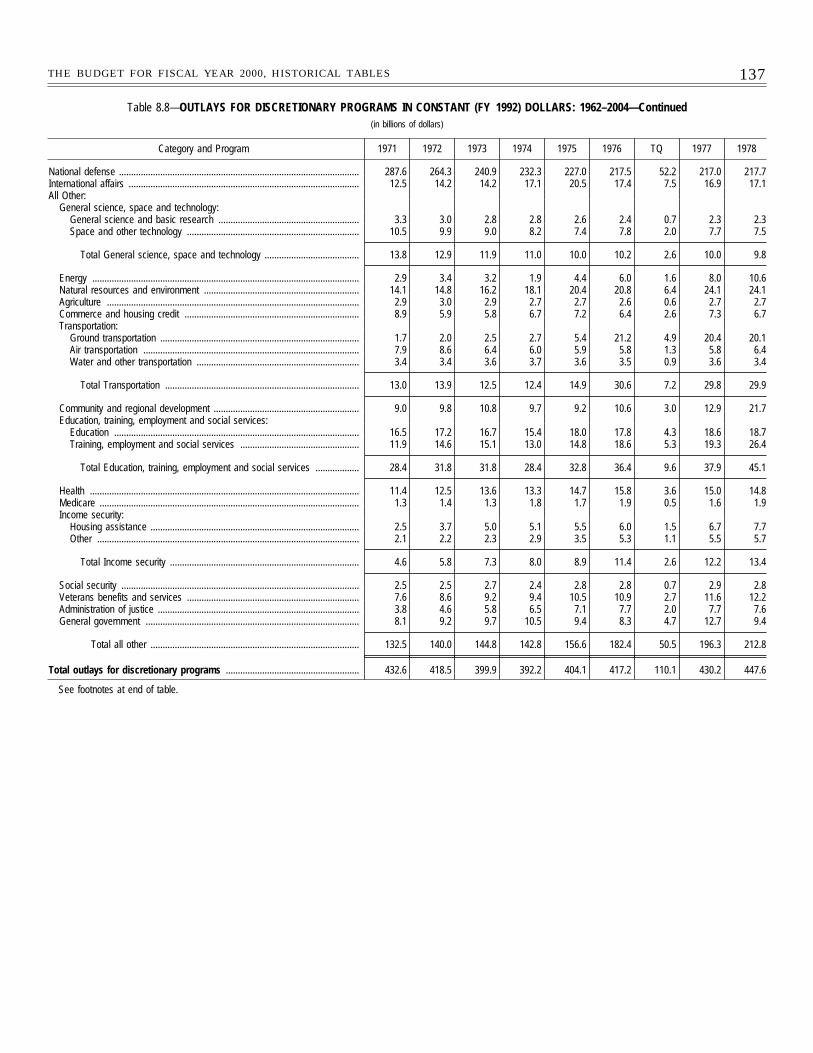
137THE BUDGET FOR FISCAL YEAR 2000, HISTORICAL TABLES
Table 8.8—OUTLAYS FOR DISCRETIONARY PROGRAMS IN CONSTANT (FY 1992) DOLLARS: 1962–2004—Continued(in billions of dollars)
Category and Program 1971 1972 1973 1974 1975 1976 TQ 1977 1978
National defense ................................................................................................... 287.6 264.3 240.9 232.3 227.0 217.5 52.2 217.0 217.7International affairs ............................................................................................... 12.5 14.2 14.2 17.1 20.5 17.4 7.5 16.9 17.1All Other:
General science, space and technology:General science and basic research .......................................................... 3.3 3.0 2.8 2.8 2.6 2.4 0.7 2.3 2.3Space and other technology ....................................................................... 10.5 9.9 9.0 8.2 7.4 7.8 2.0 7.7 7.5
Total General science, space and technology ....................................... 13.8 12.9 11.9 11.0 10.0 10.2 2.6 10.0 9.8
Energy .............................................................................................................. 2.9 3.4 3.2 1.9 4.4 6.0 1.6 8.0 10.6Natural resources and environment ................................................................ 14.1 14.8 16.2 18.1 20.4 20.8 6.4 24.1 24.1Agriculture ........................................................................................................ 2.9 3.0 2.9 2.7 2.7 2.6 0.6 2.7 2.7Commerce and housing credit ........................................................................ 8.9 5.9 5.8 6.7 7.2 6.4 2.6 7.3 6.7Transportation:
Ground transportation .................................................................................. 1.7 2.0 2.5 2.7 5.4 21.2 4.9 20.4 20.1Air transportation ......................................................................................... 7.9 8.6 6.4 6.0 5.9 5.8 1.3 5.8 6.4Water and other transportation ................................................................... 3.4 3.4 3.6 3.7 3.6 3.5 0.9 3.6 3.4
Total Transportation ................................................................................ 13.0 13.9 12.5 12.4 14.9 30.6 7.2 29.8 29.9
Community and regional development ............................................................ 9.0 9.8 10.8 9.7 9.2 10.6 3.0 12.9 21.7Education, training, employment and social services:
Education ..................................................................................................... 16.5 17.2 16.7 15.4 18.0 17.8 4.3 18.6 18.7Training, employment and social services ................................................. 11.9 14.6 15.1 13.0 14.8 18.6 5.3 19.3 26.4
Total Education, training, employment and social services .................. 28.4 31.8 31.8 28.4 32.8 36.4 9.6 37.9 45.1
Health ............................................................................................................... 11.4 12.5 13.6 13.3 14.7 15.8 3.6 15.0 14.8Medicare ........................................................................................................... 1.3 1.4 1.3 1.8 1.7 1.9 0.5 1.6 1.9Income security:
Housing assistance ...................................................................................... 2.5 3.7 5.0 5.1 5.5 6.0 1.5 6.7 7.7Other ............................................................................................................ 2.1 2.2 2.3 2.9 3.5 5.3 1.1 5.5 5.7
Total Income security .............................................................................. 4.6 5.8 7.3 8.0 8.9 11.4 2.6 12.2 13.4
Social security .................................................................................................. 2.5 2.5 2.7 2.4 2.8 2.8 0.7 2.9 2.8Veterans benefits and services ....................................................................... 7.6 8.6 9.2 9.4 10.5 10.9 2.7 11.6 12.2Administration of justice ................................................................................... 3.8 4.6 5.8 6.5 7.1 7.7 2.0 7.7 7.6General government ........................................................................................ 8.1 9.2 9.7 10.5 9.4 8.3 4.7 12.7 9.4
Total all other ...................................................................................... 132.5 140.0 144.8 142.8 156.6 182.4 50.5 196.3 212.8
Total outlays for discretionary programs ....................................................... 432.6 418.5 399.9 392.2 404.1 417.2 110.1 430.2 447.6
See footnotes at end of table.
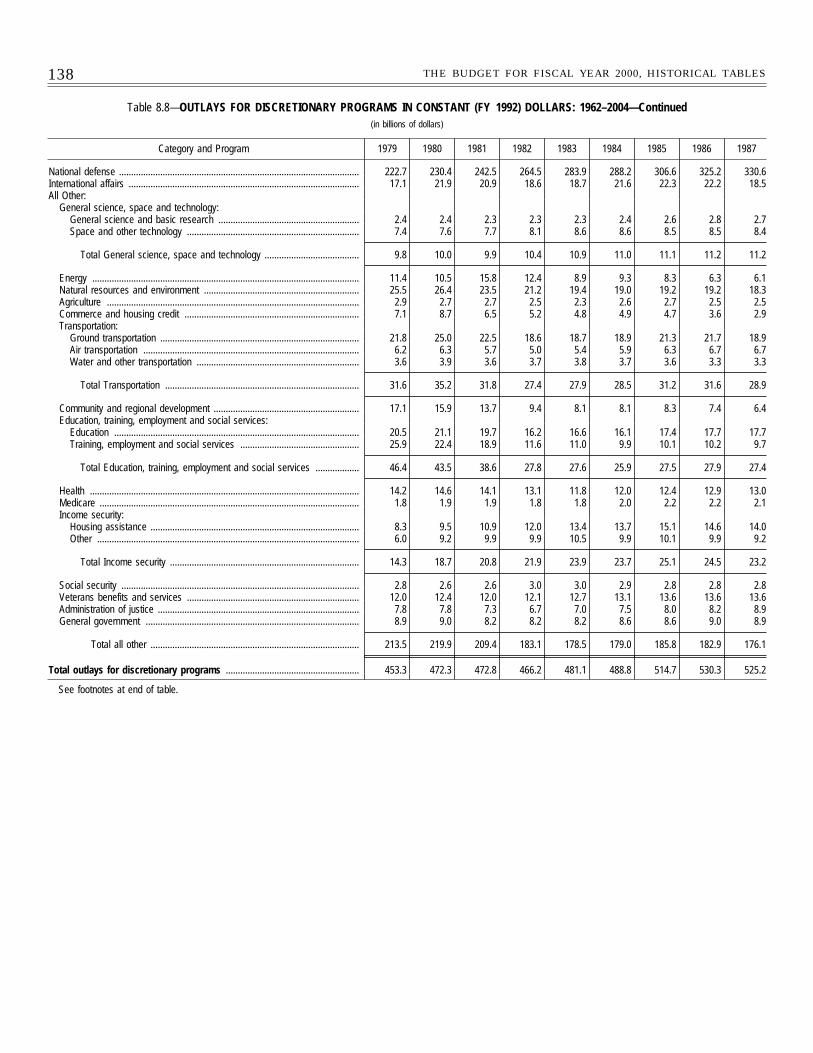
138 THE BUDGET FOR FISCAL YEAR 2000, HISTORICAL TABLES
Table 8.8—OUTLAYS FOR DISCRETIONARY PROGRAMS IN CONSTANT (FY 1992) DOLLARS: 1962–2004—Continued(in billions of dollars)
Category and Program 1979 1980 1981 1982 1983 1984 1985 1986 1987
National defense ................................................................................................... 222.7 230.4 242.5 264.5 283.9 288.2 306.6 325.2 330.6International affairs ............................................................................................... 17.1 21.9 20.9 18.6 18.7 21.6 22.3 22.2 18.5All Other:
General science, space and technology:General science and basic research .......................................................... 2.4 2.4 2.3 2.3 2.3 2.4 2.6 2.8 2.7Space and other technology ....................................................................... 7.4 7.6 7.7 8.1 8.6 8.6 8.5 8.5 8.4
Total General science, space and technology ....................................... 9.8 10.0 9.9 10.4 10.9 11.0 11.1 11.2 11.2
Energy .............................................................................................................. 11.4 10.5 15.8 12.4 8.9 9.3 8.3 6.3 6.1Natural resources and environment ................................................................ 25.5 26.4 23.5 21.2 19.4 19.0 19.2 19.2 18.3Agriculture ........................................................................................................ 2.9 2.7 2.7 2.5 2.3 2.6 2.7 2.5 2.5Commerce and housing credit ........................................................................ 7.1 8.7 6.5 5.2 4.8 4.9 4.7 3.6 2.9Transportation:
Ground transportation .................................................................................. 21.8 25.0 22.5 18.6 18.7 18.9 21.3 21.7 18.9Air transportation ......................................................................................... 6.2 6.3 5.7 5.0 5.4 5.9 6.3 6.7 6.7Water and other transportation ................................................................... 3.6 3.9 3.6 3.7 3.8 3.7 3.6 3.3 3.3
Total Transportation ................................................................................ 31.6 35.2 31.8 27.4 27.9 28.5 31.2 31.6 28.9
Community and regional development ............................................................ 17.1 15.9 13.7 9.4 8.1 8.1 8.3 7.4 6.4Education, training, employment and social services:
Education ..................................................................................................... 20.5 21.1 19.7 16.2 16.6 16.1 17.4 17.7 17.7Training, employment and social services ................................................. 25.9 22.4 18.9 11.6 11.0 9.9 10.1 10.2 9.7
Total Education, training, employment and social services .................. 46.4 43.5 38.6 27.8 27.6 25.9 27.5 27.9 27.4
Health ............................................................................................................... 14.2 14.6 14.1 13.1 11.8 12.0 12.4 12.9 13.0Medicare ........................................................................................................... 1.8 1.9 1.9 1.8 1.8 2.0 2.2 2.2 2.1Income security:
Housing assistance ...................................................................................... 8.3 9.5 10.9 12.0 13.4 13.7 15.1 14.6 14.0Other ............................................................................................................ 6.0 9.2 9.9 9.9 10.5 9.9 10.1 9.9 9.2
Total Income security .............................................................................. 14.3 18.7 20.8 21.9 23.9 23.7 25.1 24.5 23.2
Social security .................................................................................................. 2.8 2.6 2.6 3.0 3.0 2.9 2.8 2.8 2.8Veterans benefits and services ....................................................................... 12.0 12.4 12.0 12.1 12.7 13.1 13.6 13.6 13.6Administration of justice ................................................................................... 7.8 7.8 7.3 6.7 7.0 7.5 8.0 8.2 8.9General government ........................................................................................ 8.9 9.0 8.2 8.2 8.2 8.6 8.6 9.0 8.9
Total all other ...................................................................................... 213.5 219.9 209.4 183.1 178.5 179.0 185.8 182.9 176.1
Total outlays for discretionary programs ....................................................... 453.3 472.3 472.8 466.2 481.1 488.8 514.7 530.3 525.2
See footnotes at end of table.
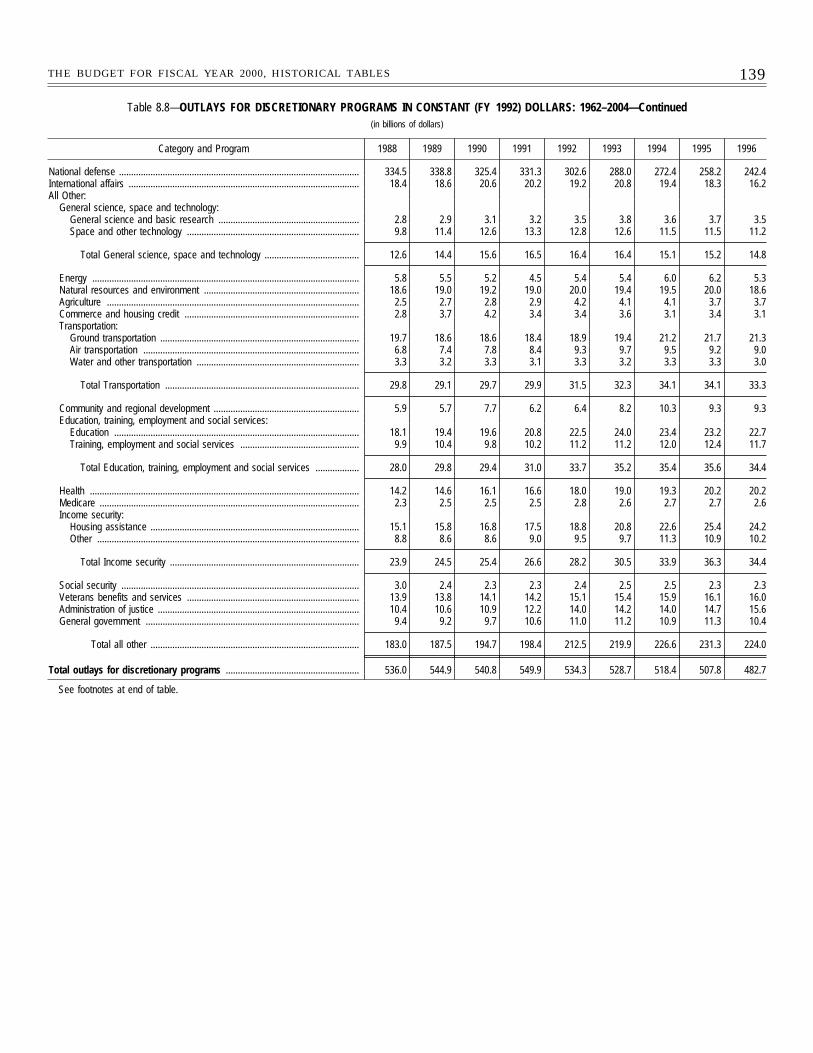
139THE BUDGET FOR FISCAL YEAR 2000, HISTORICAL TABLES
Table 8.8—OUTLAYS FOR DISCRETIONARY PROGRAMS IN CONSTANT (FY 1992) DOLLARS: 1962–2004—Continued(in billions of dollars)
Category and Program 1988 1989 1990 1991 1992 1993 1994 1995 1996
National defense ................................................................................................... 334.5 338.8 325.4 331.3 302.6 288.0 272.4 258.2 242.4International affairs ............................................................................................... 18.4 18.6 20.6 20.2 19.2 20.8 19.4 18.3 16.2All Other:
General science, space and technology:General science and basic research .......................................................... 2.8 2.9 3.1 3.2 3.5 3.8 3.6 3.7 3.5Space and other technology ....................................................................... 9.8 11.4 12.6 13.3 12.8 12.6 11.5 11.5 11.2
Total General science, space and technology ....................................... 12.6 14.4 15.6 16.5 16.4 16.4 15.1 15.2 14.8
Energy .............................................................................................................. 5.8 5.5 5.2 4.5 5.4 5.4 6.0 6.2 5.3Natural resources and environment ................................................................ 18.6 19.0 19.2 19.0 20.0 19.4 19.5 20.0 18.6Agriculture ........................................................................................................ 2.5 2.7 2.8 2.9 4.2 4.1 4.1 3.7 3.7Commerce and housing credit ........................................................................ 2.8 3.7 4.2 3.4 3.4 3.6 3.1 3.4 3.1Transportation:
Ground transportation .................................................................................. 19.7 18.6 18.6 18.4 18.9 19.4 21.2 21.7 21.3Air transportation ......................................................................................... 6.8 7.4 7.8 8.4 9.3 9.7 9.5 9.2 9.0Water and other transportation ................................................................... 3.3 3.2 3.3 3.1 3.3 3.2 3.3 3.3 3.0
Total Transportation ................................................................................ 29.8 29.1 29.7 29.9 31.5 32.3 34.1 34.1 33.3
Community and regional development ............................................................ 5.9 5.7 7.7 6.2 6.4 8.2 10.3 9.3 9.3Education, training, employment and social services:
Education ..................................................................................................... 18.1 19.4 19.6 20.8 22.5 24.0 23.4 23.2 22.7Training, employment and social services ................................................. 9.9 10.4 9.8 10.2 11.2 11.2 12.0 12.4 11.7
Total Education, training, employment and social services .................. 28.0 29.8 29.4 31.0 33.7 35.2 35.4 35.6 34.4
Health ............................................................................................................... 14.2 14.6 16.1 16.6 18.0 19.0 19.3 20.2 20.2Medicare ........................................................................................................... 2.3 2.5 2.5 2.5 2.8 2.6 2.7 2.7 2.6Income security:
Housing assistance ...................................................................................... 15.1 15.8 16.8 17.5 18.8 20.8 22.6 25.4 24.2Other ............................................................................................................ 8.8 8.6 8.6 9.0 9.5 9.7 11.3 10.9 10.2
Total Income security .............................................................................. 23.9 24.5 25.4 26.6 28.2 30.5 33.9 36.3 34.4
Social security .................................................................................................. 3.0 2.4 2.3 2.3 2.4 2.5 2.5 2.3 2.3Veterans benefits and services ....................................................................... 13.9 13.8 14.1 14.2 15.1 15.4 15.9 16.1 16.0Administration of justice ................................................................................... 10.4 10.6 10.9 12.2 14.0 14.2 14.0 14.7 15.6General government ........................................................................................ 9.4 9.2 9.7 10.6 11.0 11.2 10.9 11.3 10.4
Total all other ...................................................................................... 183.0 187.5 194.7 198.4 212.5 219.9 226.6 231.3 224.0
Total outlays for discretionary programs ....................................................... 536.0 544.9 540.8 549.9 534.3 528.7 518.4 507.8 482.7
See footnotes at end of table.
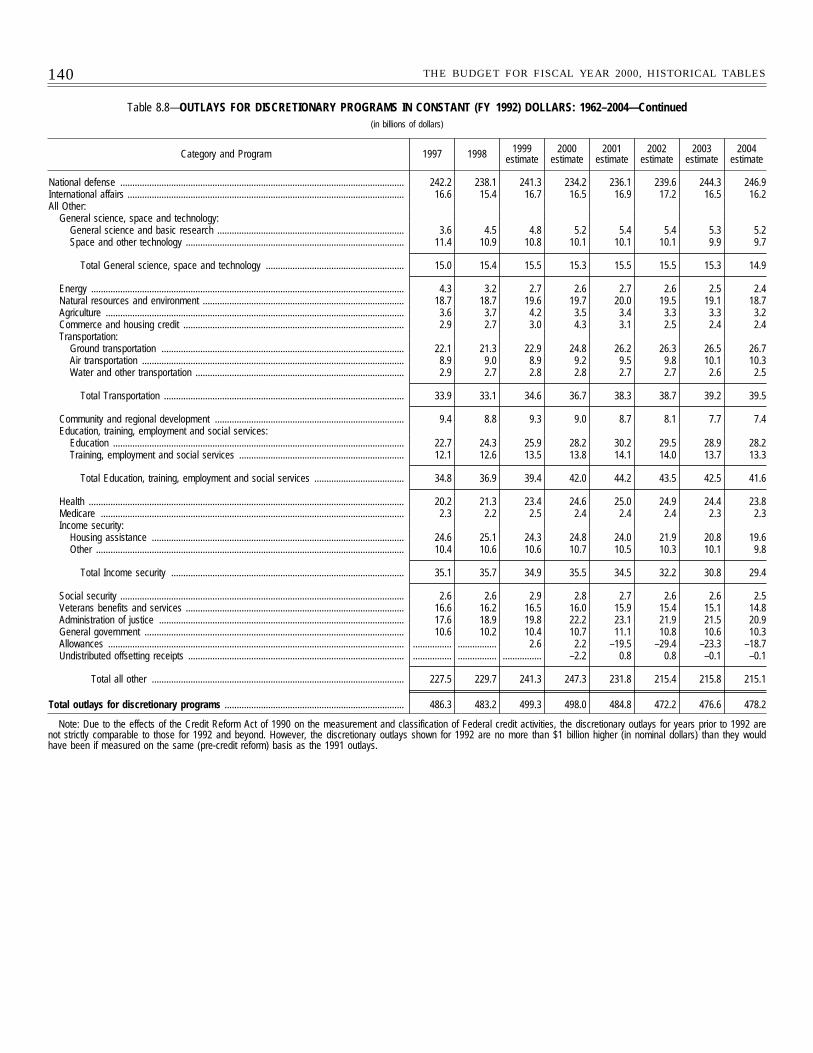
140 THE BUDGET FOR FISCAL YEAR 2000, HISTORICAL TABLES
Table 8.8—OUTLAYS FOR DISCRETIONARY PROGRAMS IN CONSTANT (FY 1992) DOLLARS: 1962–2004—Continued(in billions of dollars)
Category and Program 1997 1998 1999estimate
2000estimate
2001estimate
2002estimate
2003estimate
2004estimate
National defense ..................................................................................................................... 242.2 238.1 241.3 234.2 236.1 239.6 244.3 246.9International affairs .................................................................................................................. 16.6 15.4 16.7 16.5 16.9 17.2 16.5 16.2All Other:
General science, space and technology:General science and basic research ............................................................................. 3.6 4.5 4.8 5.2 5.4 5.4 5.3 5.2Space and other technology .......................................................................................... 11.4 10.9 10.8 10.1 10.1 10.1 9.9 9.7
Total General science, space and technology ......................................................... 15.0 15.4 15.5 15.3 15.5 15.5 15.3 14.9
Energy ................................................................................................................................. 4.3 3.2 2.7 2.6 2.7 2.6 2.5 2.4Natural resources and environment ................................................................................... 18.7 18.7 19.6 19.7 20.0 19.5 19.1 18.7Agriculture ........................................................................................................................... 3.6 3.7 4.2 3.5 3.4 3.3 3.3 3.2Commerce and housing credit ........................................................................................... 2.9 2.7 3.0 4.3 3.1 2.5 2.4 2.4Transportation:
Ground transportation .................................................................................................... 22.1 21.3 22.9 24.8 26.2 26.3 26.5 26.7Air transportation ............................................................................................................ 8.9 9.0 8.9 9.2 9.5 9.8 10.1 10.3Water and other transportation ...................................................................................... 2.9 2.7 2.8 2.8 2.7 2.7 2.6 2.5
Total Transportation ................................................................................................... 33.9 33.1 34.6 36.7 38.3 38.7 39.2 39.5
Community and regional development .............................................................................. 9.4 8.8 9.3 9.0 8.7 8.1 7.7 7.4Education, training, employment and social services:
Education ........................................................................................................................ 22.7 24.3 25.9 28.2 30.2 29.5 28.9 28.2Training, employment and social services .................................................................... 12.1 12.6 13.5 13.8 14.1 14.0 13.7 13.3
Total Education, training, employment and social services ..................................... 34.8 36.9 39.4 42.0 44.2 43.5 42.5 41.6
Health .................................................................................................................................. 20.2 21.3 23.4 24.6 25.0 24.9 24.4 23.8Medicare ............................................................................................................................. 2.3 2.2 2.5 2.4 2.4 2.4 2.3 2.3Income security:
Housing assistance ........................................................................................................ 24.6 25.1 24.3 24.8 24.0 21.9 20.8 19.6Other ............................................................................................................................... 10.4 10.6 10.6 10.7 10.5 10.3 10.1 9.8
Total Income security ................................................................................................ 35.1 35.7 34.9 35.5 34.5 32.2 30.8 29.4
Social security ..................................................................................................................... 2.6 2.6 2.9 2.8 2.7 2.6 2.6 2.5Veterans benefits and services .......................................................................................... 16.6 16.2 16.5 16.0 15.9 15.4 15.1 14.8Administration of justice ..................................................................................................... 17.6 18.9 19.8 22.2 23.1 21.9 21.5 20.9General government ........................................................................................................... 10.6 10.2 10.4 10.7 11.1 10.8 10.6 10.3Allowances .......................................................................................................................... ................ ................ 2.6 2.2 –19.5 –29.4 –23.3 –18.7Undistributed offsetting receipts ......................................................................................... ................ ................ ................ –2.2 0.8 0.8 –0.1 –0.1
Total all other ........................................................................................................ 227.5 229.7 241.3 247.3 231.8 215.4 215.8 215.1
Total outlays for discretionary programs .......................................................................... 486.3 483.2 499.3 498.0 484.8 472.2 476.6 478.2
Note: Due to the effects of the Credit Reform Act of 1990 on the measurement and classification of Federal credit activities, the discretionary outlays for years prior to 1992 arenot strictly comparable to those for 1992 and beyond. However, the discretionary outlays shown for 1992 are no more than $1 billion higher (in nominal dollars) than they wouldhave been if measured on the same (pre-credit reform) basis as the 1991 outlays.
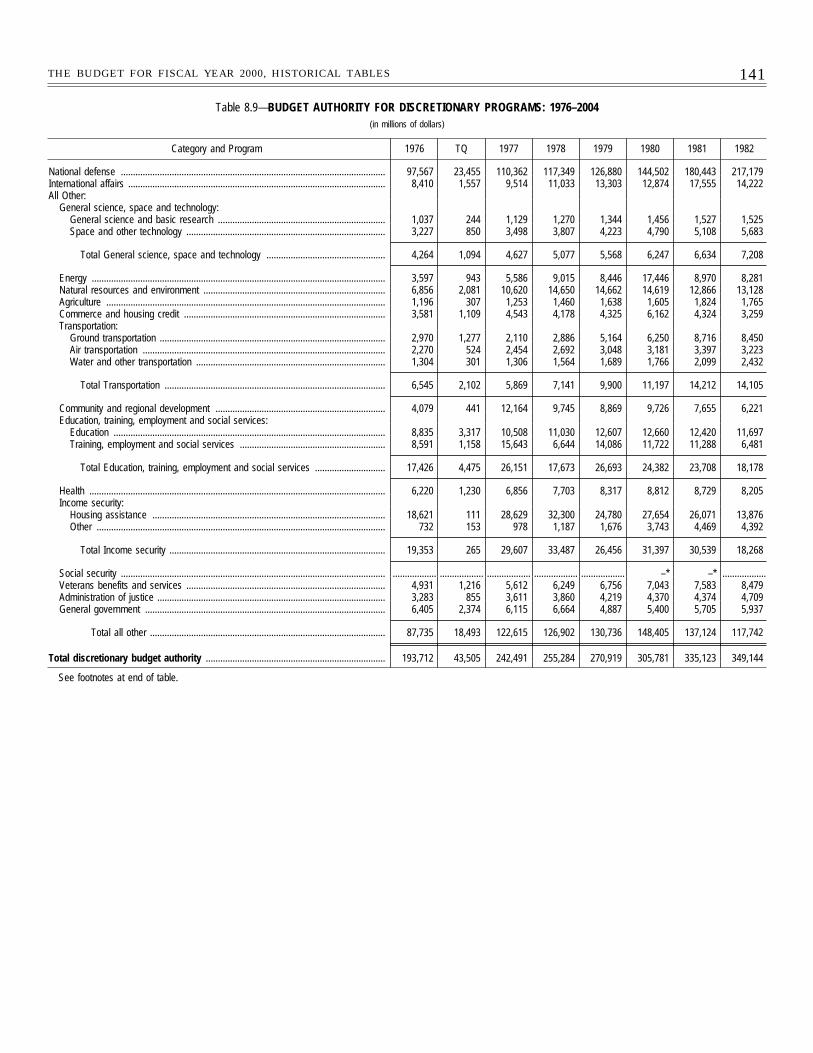
141THE BUDGET FOR FISCAL YEAR 2000, HISTORICAL TABLES
Table 8.9—BUDGET AUTHORITY FOR DISCRETIONARY PROGRAMS: 1976–2004(in millions of dollars)
Category and Program 1976 TQ 1977 1978 1979 1980 1981 1982
National defense ............................................................................................................. 97,567 23,455 110,362 117,349 126,880 144,502 180,443 217,179International affairs .......................................................................................................... 8,410 1,557 9,514 11,033 13,303 12,874 17,555 14,222All Other:
General science, space and technology:General science and basic research ..................................................................... 1,037 244 1,129 1,270 1,344 1,456 1,527 1,525Space and other technology .................................................................................. 3,227 850 3,498 3,807 4,223 4,790 5,108 5,683
Total General science, space and technology ................................................. 4,264 1,094 4,627 5,077 5,568 6,247 6,634 7,208
Energy ......................................................................................................................... 3,597 943 5,586 9,015 8,446 17,446 8,970 8,281Natural resources and environment ........................................................................... 6,856 2,081 10,620 14,650 14,662 14,619 12,866 13,128Agriculture ................................................................................................................... 1,196 307 1,253 1,460 1,638 1,605 1,824 1,765Commerce and housing credit ................................................................................... 3,581 1,109 4,543 4,178 4,325 6,162 4,324 3,259Transportation:
Ground transportation ............................................................................................. 2,970 1,277 2,110 2,886 5,164 6,250 8,716 8,450Air transportation .................................................................................................... 2,270 524 2,454 2,692 3,048 3,181 3,397 3,223Water and other transportation .............................................................................. 1,304 301 1,306 1,564 1,689 1,766 2,099 2,432
Total Transportation ........................................................................................... 6,545 2,102 5,869 7,141 9,900 11,197 14,212 14,105
Community and regional development ...................................................................... 4,079 441 12,164 9,745 8,869 9,726 7,655 6,221Education, training, employment and social services:
Education ................................................................................................................ 8,835 3,317 10,508 11,030 12,607 12,660 12,420 11,697Training, employment and social services ............................................................ 8,591 1,158 15,643 6,644 14,086 11,722 11,288 6,481
Total Education, training, employment and social services ............................. 17,426 4,475 26,151 17,673 26,693 24,382 23,708 18,178
Health .......................................................................................................................... 6,220 1,230 6,856 7,703 8,317 8,812 8,729 8,205Income security:
Housing assistance ................................................................................................ 18,621 111 28,629 32,300 24,780 27,654 26,071 13,876Other ....................................................................................................................... 732 153 978 1,187 1,676 3,743 4,469 4,392
Total Income security ......................................................................................... 19,353 265 29,607 33,487 26,456 31,397 30,539 18,268
Social security ............................................................................................................. .................. .................. .................. .................. .................. –* –* ..................Veterans benefits and services .................................................................................. 4,931 1,216 5,612 6,249 6,756 7,043 7,583 8,479Administration of justice .............................................................................................. 3,283 855 3,611 3,860 4,219 4,370 4,374 4,709General government ................................................................................................... 6,405 2,374 6,115 6,664 4,887 5,400 5,705 5,937
Total all other ................................................................................................. 87,735 18,493 122,615 126,902 130,736 148,405 137,124 117,742
Total discretionary budget authority .......................................................................... 193,712 43,505 242,491 255,284 270,919 305,781 335,123 349,144
See footnotes at end of table.
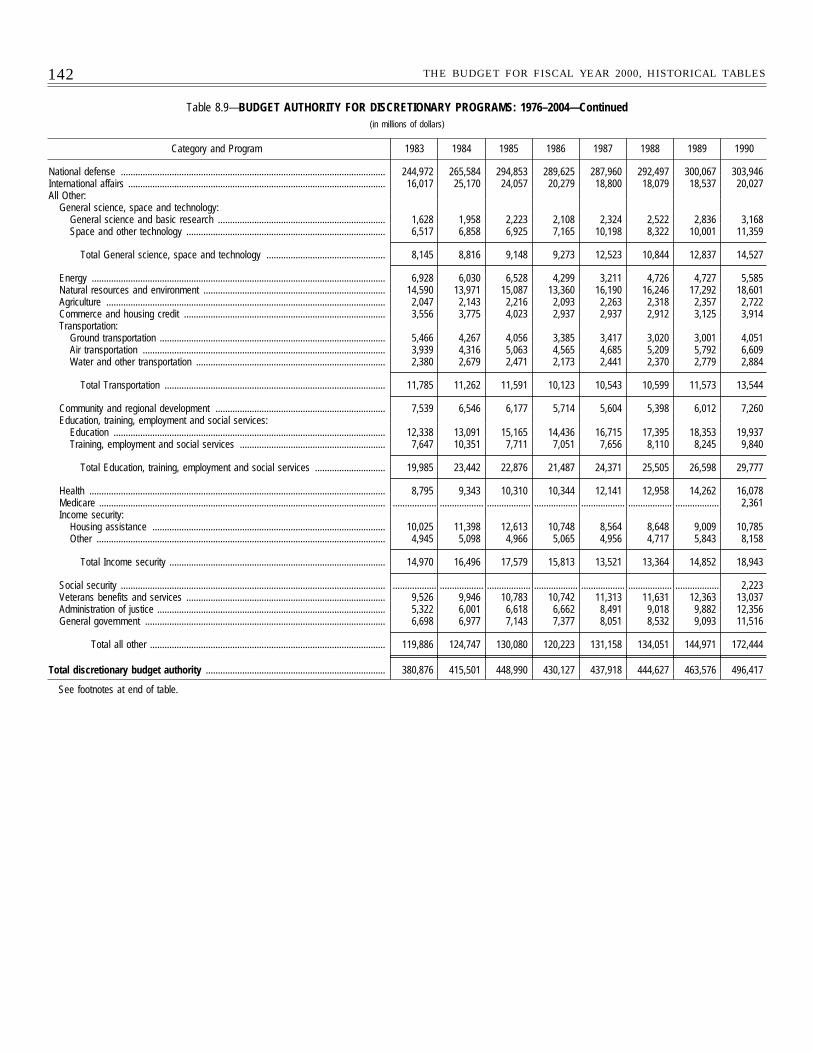
142 THE BUDGET FOR FISCAL YEAR 2000, HISTORICAL TABLES
Table 8.9—BUDGET AUTHORITY FOR DISCRETIONARY PROGRAMS: 1976–2004—Continued(in millions of dollars)
Category and Program 1983 1984 1985 1986 1987 1988 1989 1990
National defense ............................................................................................................. 244,972 265,584 294,853 289,625 287,960 292,497 300,067 303,946International affairs .......................................................................................................... 16,017 25,170 24,057 20,279 18,800 18,079 18,537 20,027All Other:
General science, space and technology:General science and basic research ..................................................................... 1,628 1,958 2,223 2,108 2,324 2,522 2,836 3,168Space and other technology .................................................................................. 6,517 6,858 6,925 7,165 10,198 8,322 10,001 11,359
Total General science, space and technology ................................................. 8,145 8,816 9,148 9,273 12,523 10,844 12,837 14,527
Energy ......................................................................................................................... 6,928 6,030 6,528 4,299 3,211 4,726 4,727 5,585Natural resources and environment ........................................................................... 14,590 13,971 15,087 13,360 16,190 16,246 17,292 18,601Agriculture ................................................................................................................... 2,047 2,143 2,216 2,093 2,263 2,318 2,357 2,722Commerce and housing credit ................................................................................... 3,556 3,775 4,023 2,937 2,937 2,912 3,125 3,914Transportation:
Ground transportation ............................................................................................. 5,466 4,267 4,056 3,385 3,417 3,020 3,001 4,051Air transportation .................................................................................................... 3,939 4,316 5,063 4,565 4,685 5,209 5,792 6,609Water and other transportation .............................................................................. 2,380 2,679 2,471 2,173 2,441 2,370 2,779 2,884
Total Transportation ........................................................................................... 11,785 11,262 11,591 10,123 10,543 10,599 11,573 13,544
Community and regional development ...................................................................... 7,539 6,546 6,177 5,714 5,604 5,398 6,012 7,260Education, training, employment and social services:
Education ................................................................................................................ 12,338 13,091 15,165 14,436 16,715 17,395 18,353 19,937Training, employment and social services ............................................................ 7,647 10,351 7,711 7,051 7,656 8,110 8,245 9,840
Total Education, training, employment and social services ............................. 19,985 23,442 22,876 21,487 24,371 25,505 26,598 29,777
Health .......................................................................................................................... 8,795 9,343 10,310 10,344 12,141 12,958 14,262 16,078Medicare ...................................................................................................................... .................. .................. .................. .................. .................. .................. .................. 2,361Income security:
Housing assistance ................................................................................................ 10,025 11,398 12,613 10,748 8,564 8,648 9,009 10,785Other ....................................................................................................................... 4,945 5,098 4,966 5,065 4,956 4,717 5,843 8,158
Total Income security ......................................................................................... 14,970 16,496 17,579 15,813 13,521 13,364 14,852 18,943
Social security ............................................................................................................. .................. .................. .................. .................. .................. .................. .................. 2,223Veterans benefits and services .................................................................................. 9,526 9,946 10,783 10,742 11,313 11,631 12,363 13,037Administration of justice .............................................................................................. 5,322 6,001 6,618 6,662 8,491 9,018 9,882 12,356General government ................................................................................................... 6,698 6,977 7,143 7,377 8,051 8,532 9,093 11,516
Total all other ................................................................................................. 119,886 124,747 130,080 120,223 131,158 134,051 144,971 172,444
Total discretionary budget authority .......................................................................... 380,876 415,501 448,990 430,127 437,918 444,627 463,576 496,417
See footnotes at end of table.
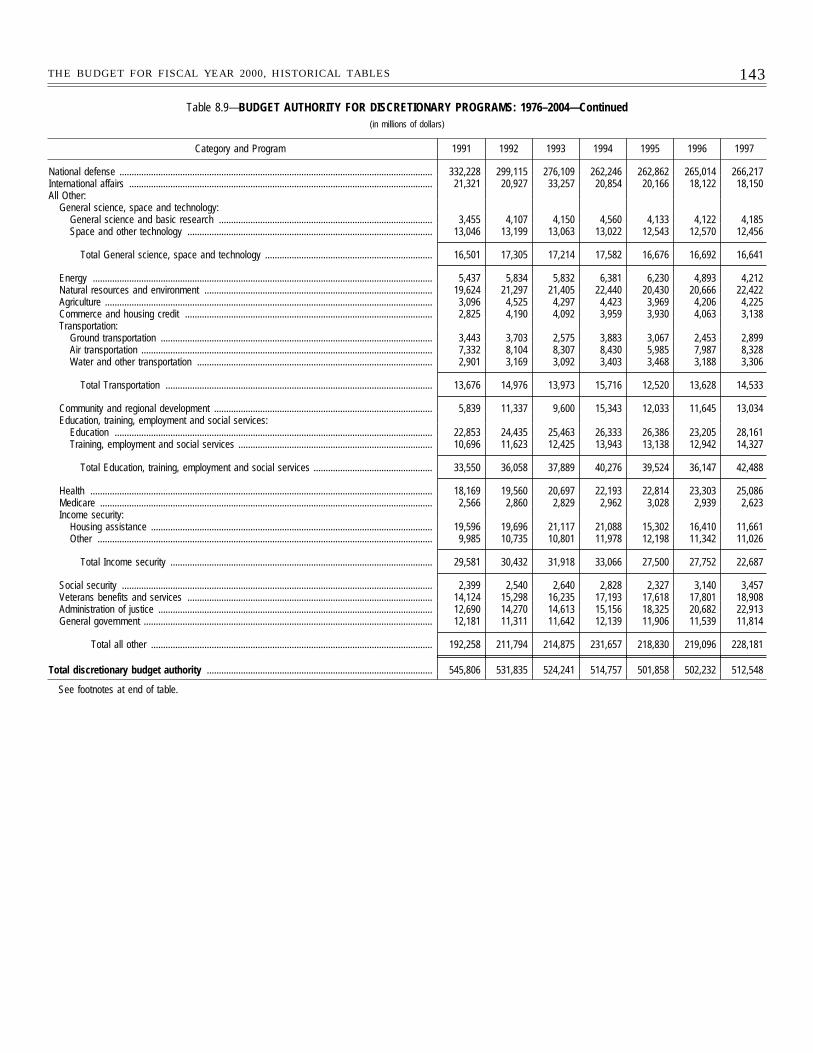
143THE BUDGET FOR FISCAL YEAR 2000, HISTORICAL TABLES
Table 8.9—BUDGET AUTHORITY FOR DISCRETIONARY PROGRAMS: 1976–2004—Continued(in millions of dollars)
Category and Program 1991 1992 1993 1994 1995 1996 1997
National defense ................................................................................................................................. 332,228 299,115 276,109 262,246 262,862 265,014 266,217International affairs ............................................................................................................................. 21,321 20,927 33,257 20,854 20,166 18,122 18,150All Other:
General science, space and technology:General science and basic research ........................................................................................ 3,455 4,107 4,150 4,560 4,133 4,122 4,185Space and other technology ..................................................................................................... 13,046 13,199 13,063 13,022 12,543 12,570 12,456
Total General science, space and technology ..................................................................... 16,501 17,305 17,214 17,582 16,676 16,692 16,641
Energy ............................................................................................................................................ 5,437 5,834 5,832 6,381 6,230 4,893 4,212Natural resources and environment .............................................................................................. 19,624 21,297 21,405 22,440 20,430 20,666 22,422Agriculture ....................................................................................................................................... 3,096 4,525 4,297 4,423 3,969 4,206 4,225Commerce and housing credit ...................................................................................................... 2,825 4,190 4,092 3,959 3,930 4,063 3,138Transportation:
Ground transportation ................................................................................................................ 3,443 3,703 2,575 3,883 3,067 2,453 2,899Air transportation ........................................................................................................................ 7,332 8,104 8,307 8,430 5,985 7,987 8,328Water and other transportation ................................................................................................. 2,901 3,169 3,092 3,403 3,468 3,188 3,306
Total Transportation .............................................................................................................. 13,676 14,976 13,973 15,716 12,520 13,628 14,533
Community and regional development .......................................................................................... 5,839 11,337 9,600 15,343 12,033 11,645 13,034Education, training, employment and social services:
Education ................................................................................................................................... 22,853 24,435 25,463 26,333 26,386 23,205 28,161Training, employment and social services ................................................................................ 10,696 11,623 12,425 13,943 13,138 12,942 14,327
Total Education, training, employment and social services ................................................. 33,550 36,058 37,889 40,276 39,524 36,147 42,488
Health ............................................................................................................................................. 18,169 19,560 20,697 22,193 22,814 23,303 25,086Medicare ......................................................................................................................................... 2,566 2,860 2,829 2,962 3,028 2,939 2,623Income security:
Housing assistance .................................................................................................................... 19,596 19,696 21,117 21,088 15,302 16,410 11,661Other .......................................................................................................................................... 9,985 10,735 10,801 11,978 12,198 11,342 11,026
Total Income security ............................................................................................................ 29,581 30,432 31,918 33,066 27,500 27,752 22,687
Social security ................................................................................................................................ 2,399 2,540 2,640 2,828 2,327 3,140 3,457Veterans benefits and services ..................................................................................................... 14,124 15,298 16,235 17,193 17,618 17,801 18,908Administration of justice ................................................................................................................. 12,690 14,270 14,613 15,156 18,325 20,682 22,913General government ....................................................................................................................... 12,181 11,311 11,642 12,139 11,906 11,539 11,814
Total all other .................................................................................................................... 192,258 211,794 214,875 231,657 218,830 219,096 228,181
Total discretionary budget authority ............................................................................................. 545,806 531,835 524,241 514,757 501,858 502,232 512,548
See footnotes at end of table.
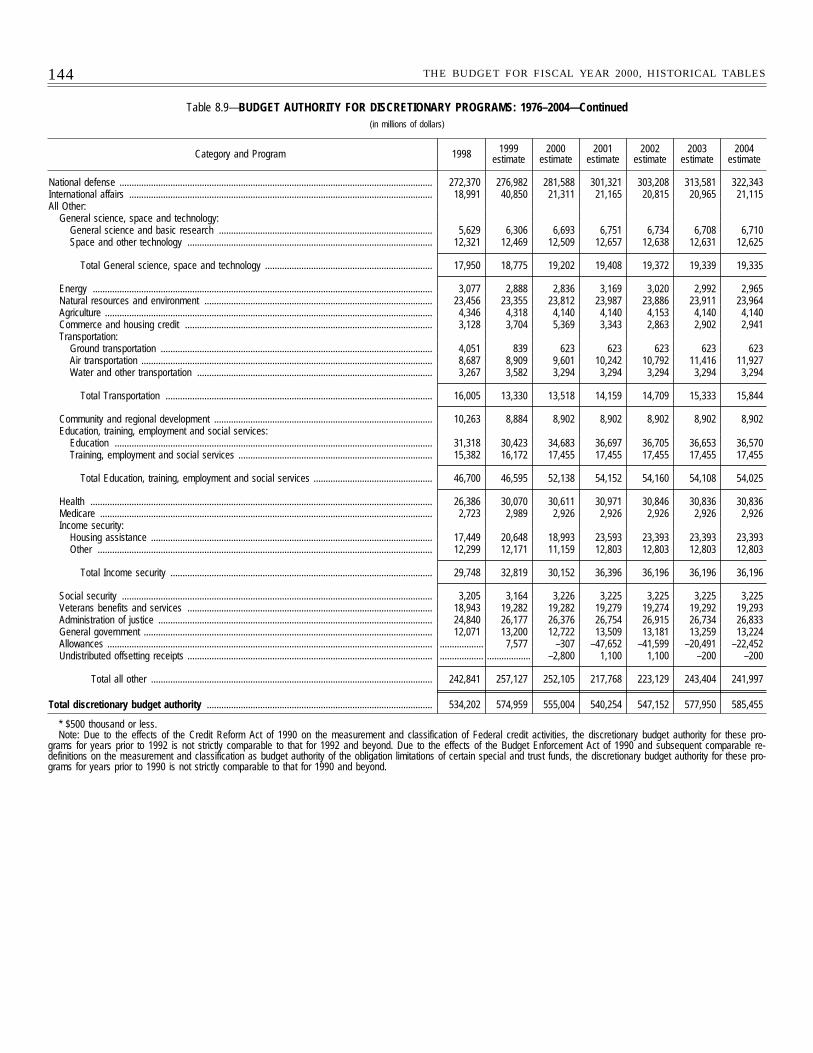
144 THE BUDGET FOR FISCAL YEAR 2000, HISTORICAL TABLES
Table 8.9—BUDGET AUTHORITY FOR DISCRETIONARY PROGRAMS: 1976–2004—Continued(in millions of dollars)
Category and Program 1998 1999estimate
2000estimate
2001estimate
2002estimate
2003estimate
2004estimate
National defense ................................................................................................................................. 272,370 276,982 281,588 301,321 303,208 313,581 322,343International affairs ............................................................................................................................. 18,991 40,850 21,311 21,165 20,815 20,965 21,115All Other:
General science, space and technology:General science and basic research ........................................................................................ 5,629 6,306 6,693 6,751 6,734 6,708 6,710Space and other technology ..................................................................................................... 12,321 12,469 12,509 12,657 12,638 12,631 12,625
Total General science, space and technology ..................................................................... 17,950 18,775 19,202 19,408 19,372 19,339 19,335
Energy ............................................................................................................................................ 3,077 2,888 2,836 3,169 3,020 2,992 2,965Natural resources and environment .............................................................................................. 23,456 23,355 23,812 23,987 23,886 23,911 23,964Agriculture ....................................................................................................................................... 4,346 4,318 4,140 4,140 4,153 4,140 4,140Commerce and housing credit ...................................................................................................... 3,128 3,704 5,369 3,343 2,863 2,902 2,941Transportation:
Ground transportation ................................................................................................................ 4,051 839 623 623 623 623 623Air transportation ........................................................................................................................ 8,687 8,909 9,601 10,242 10,792 11,416 11,927Water and other transportation ................................................................................................. 3,267 3,582 3,294 3,294 3,294 3,294 3,294
Total Transportation .............................................................................................................. 16,005 13,330 13,518 14,159 14,709 15,333 15,844
Community and regional development .......................................................................................... 10,263 8,884 8,902 8,902 8,902 8,902 8,902Education, training, employment and social services:
Education ................................................................................................................................... 31,318 30,423 34,683 36,697 36,705 36,653 36,570Training, employment and social services ................................................................................ 15,382 16,172 17,455 17,455 17,455 17,455 17,455
Total Education, training, employment and social services ................................................. 46,700 46,595 52,138 54,152 54,160 54,108 54,025
Health ............................................................................................................................................. 26,386 30,070 30,611 30,971 30,846 30,836 30,836Medicare ......................................................................................................................................... 2,723 2,989 2,926 2,926 2,926 2,926 2,926Income security:
Housing assistance .................................................................................................................... 17,449 20,648 18,993 23,593 23,393 23,393 23,393Other .......................................................................................................................................... 12,299 12,171 11,159 12,803 12,803 12,803 12,803
Total Income security ............................................................................................................ 29,748 32,819 30,152 36,396 36,196 36,196 36,196
Social security ................................................................................................................................ 3,205 3,164 3,226 3,225 3,225 3,225 3,225Veterans benefits and services ..................................................................................................... 18,943 19,282 19,282 19,279 19,274 19,292 19,293Administration of justice ................................................................................................................. 24,840 26,177 26,376 26,754 26,915 26,734 26,833General government ....................................................................................................................... 12,071 13,200 12,722 13,509 13,181 13,259 13,224Allowances ...................................................................................................................................... .................. 7,577 –307 –47,652 –41,599 –20,491 –22,452Undistributed offsetting receipts ..................................................................................................... .................. .................. –2,800 1,100 1,100 –200 –200
Total all other .................................................................................................................... 242,841 257,127 252,105 217,768 223,129 243,404 241,997
Total discretionary budget authority ............................................................................................. 534,202 574,959 555,004 540,254 547,152 577,950 585,455
* $500 thousand or less.Note: Due to the effects of the Credit Reform Act of 1990 on the measurement and classification of Federal credit activities, the discretionary budget authority for these pro-
grams for years prior to 1992 is not strictly comparable to that for 1992 and beyond. Due to the effects of the Budget Enforcement Act of 1990 and subsequent comparable re-definitions on the measurement and classification as budget authority of the obligation limitations of certain special and trust funds, the discretionary budget authority for these pro-grams for years prior to 1990 is not strictly comparable to that for 1990 and beyond.
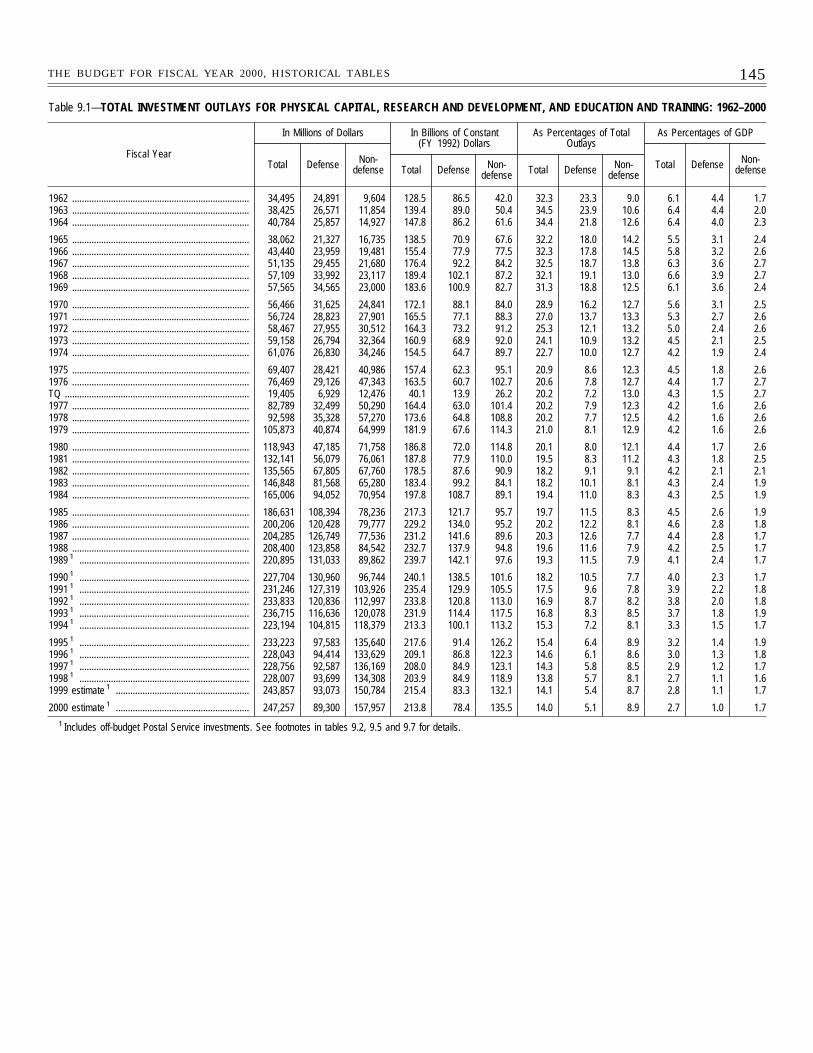
145THE BUDGET FOR FISCAL YEAR 2000, HISTORICAL TABLES
Table 9.1—TOTAL INVESTMENT OUTLAYS FOR PHYSICAL CAPITAL, RESEARCH AND DEVELOPMENT, AND EDUCATION AND TRAINING: 1962–2000
Fiscal Year
In Millions of Dollars In Billions of Constant(FY 1992) Dollars
As Percentages of TotalOutlays
As Percentages of GDP
Total Defense Non-defense Total Defense Non-
defense Total Defense Non-defense
Total Defense Non-defense
1962 ......................................................................... 34,495 24,891 9,604 128.5 86.5 42.0 32.3 23.3 9.0 6.1 4.4 1.71963 ......................................................................... 38,425 26,571 11,854 139.4 89.0 50.4 34.5 23.9 10.6 6.4 4.4 2.01964 ......................................................................... 40,784 25,857 14,927 147.8 86.2 61.6 34.4 21.8 12.6 6.4 4.0 2.3
1965 ......................................................................... 38,062 21,327 16,735 138.5 70.9 67.6 32.2 18.0 14.2 5.5 3.1 2.41966 ......................................................................... 43,440 23,959 19,481 155.4 77.9 77.5 32.3 17.8 14.5 5.8 3.2 2.61967 ......................................................................... 51,135 29,455 21,680 176.4 92.2 84.2 32.5 18.7 13.8 6.3 3.6 2.71968 ......................................................................... 57,109 33,992 23,117 189.4 102.1 87.2 32.1 19.1 13.0 6.6 3.9 2.71969 ......................................................................... 57,565 34,565 23,000 183.6 100.9 82.7 31.3 18.8 12.5 6.1 3.6 2.4
1970 ......................................................................... 56,466 31,625 24,841 172.1 88.1 84.0 28.9 16.2 12.7 5.6 3.1 2.51971 ......................................................................... 56,724 28,823 27,901 165.5 77.1 88.3 27.0 13.7 13.3 5.3 2.7 2.61972 ......................................................................... 58,467 27,955 30,512 164.3 73.2 91.2 25.3 12.1 13.2 5.0 2.4 2.61973 ......................................................................... 59,158 26,794 32,364 160.9 68.9 92.0 24.1 10.9 13.2 4.5 2.1 2.51974 ......................................................................... 61,076 26,830 34,246 154.5 64.7 89.7 22.7 10.0 12.7 4.2 1.9 2.4
1975 ......................................................................... 69,407 28,421 40,986 157.4 62.3 95.1 20.9 8.6 12.3 4.5 1.8 2.61976 ......................................................................... 76,469 29,126 47,343 163.5 60.7 102.7 20.6 7.8 12.7 4.4 1.7 2.7TQ ............................................................................ 19,405 6,929 12,476 40.1 13.9 26.2 20.2 7.2 13.0 4.3 1.5 2.71977 ......................................................................... 82,789 32,499 50,290 164.4 63.0 101.4 20.2 7.9 12.3 4.2 1.6 2.61978 ......................................................................... 92,598 35,328 57,270 173.6 64.8 108.8 20.2 7.7 12.5 4.2 1.6 2.61979 ......................................................................... 105,873 40,874 64,999 181.9 67.6 114.3 21.0 8.1 12.9 4.2 1.6 2.6
1980 ......................................................................... 118,943 47,185 71,758 186.8 72.0 114.8 20.1 8.0 12.1 4.4 1.7 2.61981 ......................................................................... 132,141 56,079 76,061 187.8 77.9 110.0 19.5 8.3 11.2 4.3 1.8 2.51982 ......................................................................... 135,565 67,805 67,760 178.5 87.6 90.9 18.2 9.1 9.1 4.2 2.1 2.11983 ......................................................................... 146,848 81,568 65,280 183.4 99.2 84.1 18.2 10.1 8.1 4.3 2.4 1.91984 ......................................................................... 165,006 94,052 70,954 197.8 108.7 89.1 19.4 11.0 8.3 4.3 2.5 1.9
1985 ......................................................................... 186,631 108,394 78,236 217.3 121.7 95.7 19.7 11.5 8.3 4.5 2.6 1.91986 ......................................................................... 200,206 120,428 79,777 229.2 134.0 95.2 20.2 12.2 8.1 4.6 2.8 1.81987 ......................................................................... 204,285 126,749 77,536 231.2 141.6 89.6 20.3 12.6 7.7 4.4 2.8 1.71988 ......................................................................... 208,400 123,858 84,542 232.7 137.9 94.8 19.6 11.6 7.9 4.2 2.5 1.71989 1 ...................................................................... 220,895 131,033 89,862 239.7 142.1 97.6 19.3 11.5 7.9 4.1 2.4 1.7
1990 1 ...................................................................... 227,704 130,960 96,744 240.1 138.5 101.6 18.2 10.5 7.7 4.0 2.3 1.71991 1 ...................................................................... 231,246 127,319 103,926 235.4 129.9 105.5 17.5 9.6 7.8 3.9 2.2 1.81992 1 ...................................................................... 233,833 120,836 112,997 233.8 120.8 113.0 16.9 8.7 8.2 3.8 2.0 1.81993 1 ...................................................................... 236,715 116,636 120,078 231.9 114.4 117.5 16.8 8.3 8.5 3.7 1.8 1.91994 1 ...................................................................... 223,194 104,815 118,379 213.3 100.1 113.2 15.3 7.2 8.1 3.3 1.5 1.7
1995 1 ...................................................................... 233,223 97,583 135,640 217.6 91.4 126.2 15.4 6.4 8.9 3.2 1.4 1.91996 1 ...................................................................... 228,043 94,414 133,629 209.1 86.8 122.3 14.6 6.1 8.6 3.0 1.3 1.81997 1 ...................................................................... 228,756 92,587 136,169 208.0 84.9 123.1 14.3 5.8 8.5 2.9 1.2 1.71998 1 ...................................................................... 228,007 93,699 134,308 203.9 84.9 118.9 13.8 5.7 8.1 2.7 1.1 1.61999 estimate 1 ....................................................... 243,857 93,073 150,784 215.4 83.3 132.1 14.1 5.4 8.7 2.8 1.1 1.7
2000 estimate 1 ....................................................... 247,257 89,300 157,957 213.8 78.4 135.5 14.0 5.1 8.9 2.7 1.0 1.71 Includes off-budget Postal Service investments. See footnotes in tables 9.2, 9.5 and 9.7 for details.
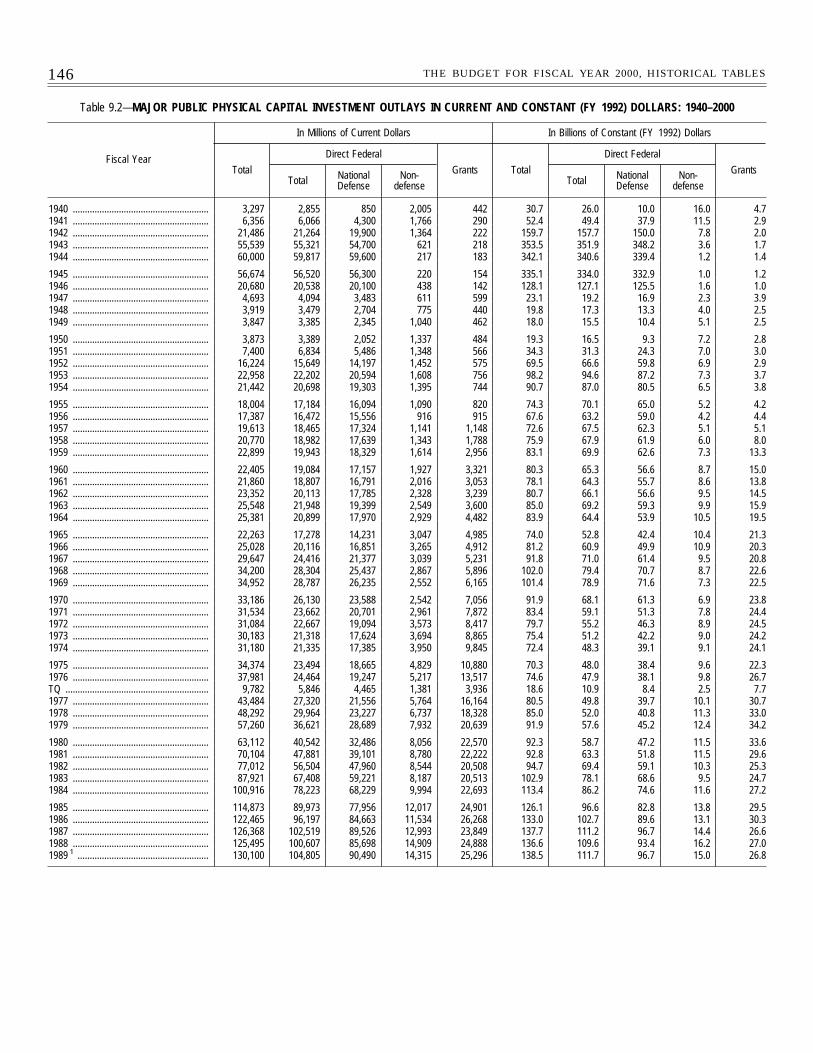
146 THE BUDGET FOR FISCAL YEAR 2000, HISTORICAL TABLES
Table 9.2—MAJOR PUBLIC PHYSICAL CAPITAL INVESTMENT OUTLAYS IN CURRENT AND CONSTANT (FY 1992) DOLLARS: 1940–2000
Fiscal Year
In Millions of Current Dollars In Billions of Constant (FY 1992) Dollars
Total
Direct Federal
Grants Total
Direct Federal
GrantsTotal National
DefenseNon-
defense Total NationalDefense
Non-defense
1940 ........................................................ 3,297 2,855 850 2,005 442 30.7 26.0 10.0 16.0 4.71941 ........................................................ 6,356 6,066 4,300 1,766 290 52.4 49.4 37.9 11.5 2.91942 ........................................................ 21,486 21,264 19,900 1,364 222 159.7 157.7 150.0 7.8 2.01943 ........................................................ 55,539 55,321 54,700 621 218 353.5 351.9 348.2 3.6 1.71944 ........................................................ 60,000 59,817 59,600 217 183 342.1 340.6 339.4 1.2 1.4
1945 ........................................................ 56,674 56,520 56,300 220 154 335.1 334.0 332.9 1.0 1.21946 ........................................................ 20,680 20,538 20,100 438 142 128.1 127.1 125.5 1.6 1.01947 ........................................................ 4,693 4,094 3,483 611 599 23.1 19.2 16.9 2.3 3.91948 ........................................................ 3,919 3,479 2,704 775 440 19.8 17.3 13.3 4.0 2.51949 ........................................................ 3,847 3,385 2,345 1,040 462 18.0 15.5 10.4 5.1 2.5
1950 ........................................................ 3,873 3,389 2,052 1,337 484 19.3 16.5 9.3 7.2 2.81951 ........................................................ 7,400 6,834 5,486 1,348 566 34.3 31.3 24.3 7.0 3.01952 ........................................................ 16,224 15,649 14,197 1,452 575 69.5 66.6 59.8 6.9 2.91953 ........................................................ 22,958 22,202 20,594 1,608 756 98.2 94.6 87.2 7.3 3.71954 ........................................................ 21,442 20,698 19,303 1,395 744 90.7 87.0 80.5 6.5 3.8
1955 ........................................................ 18,004 17,184 16,094 1,090 820 74.3 70.1 65.0 5.2 4.21956 ........................................................ 17,387 16,472 15,556 916 915 67.6 63.2 59.0 4.2 4.41957 ........................................................ 19,613 18,465 17,324 1,141 1,148 72.6 67.5 62.3 5.1 5.11958 ........................................................ 20,770 18,982 17,639 1,343 1,788 75.9 67.9 61.9 6.0 8.01959 ........................................................ 22,899 19,943 18,329 1,614 2,956 83.1 69.9 62.6 7.3 13.3
1960 ........................................................ 22,405 19,084 17,157 1,927 3,321 80.3 65.3 56.6 8.7 15.01961 ........................................................ 21,860 18,807 16,791 2,016 3,053 78.1 64.3 55.7 8.6 13.81962 ........................................................ 23,352 20,113 17,785 2,328 3,239 80.7 66.1 56.6 9.5 14.51963 ........................................................ 25,548 21,948 19,399 2,549 3,600 85.0 69.2 59.3 9.9 15.91964 ........................................................ 25,381 20,899 17,970 2,929 4,482 83.9 64.4 53.9 10.5 19.5
1965 ........................................................ 22,263 17,278 14,231 3,047 4,985 74.0 52.8 42.4 10.4 21.31966 ........................................................ 25,028 20,116 16,851 3,265 4,912 81.2 60.9 49.9 10.9 20.31967 ........................................................ 29,647 24,416 21,377 3,039 5,231 91.8 71.0 61.4 9.5 20.81968 ........................................................ 34,200 28,304 25,437 2,867 5,896 102.0 79.4 70.7 8.7 22.61969 ........................................................ 34,952 28,787 26,235 2,552 6,165 101.4 78.9 71.6 7.3 22.5
1970 ........................................................ 33,186 26,130 23,588 2,542 7,056 91.9 68.1 61.3 6.9 23.81971 ........................................................ 31,534 23,662 20,701 2,961 7,872 83.4 59.1 51.3 7.8 24.41972 ........................................................ 31,084 22,667 19,094 3,573 8,417 79.7 55.2 46.3 8.9 24.51973 ........................................................ 30,183 21,318 17,624 3,694 8,865 75.4 51.2 42.2 9.0 24.21974 ........................................................ 31,180 21,335 17,385 3,950 9,845 72.4 48.3 39.1 9.1 24.1
1975 ........................................................ 34,374 23,494 18,665 4,829 10,880 70.3 48.0 38.4 9.6 22.31976 ........................................................ 37,981 24,464 19,247 5,217 13,517 74.6 47.9 38.1 9.8 26.7TQ ........................................................... 9,782 5,846 4,465 1,381 3,936 18.6 10.9 8.4 2.5 7.71977 ........................................................ 43,484 27,320 21,556 5,764 16,164 80.5 49.8 39.7 10.1 30.71978 ........................................................ 48,292 29,964 23,227 6,737 18,328 85.0 52.0 40.8 11.3 33.01979 ........................................................ 57,260 36,621 28,689 7,932 20,639 91.9 57.6 45.2 12.4 34.2
1980 ........................................................ 63,112 40,542 32,486 8,056 22,570 92.3 58.7 47.2 11.5 33.61981 ........................................................ 70,104 47,881 39,101 8,780 22,222 92.8 63.3 51.8 11.5 29.61982 ........................................................ 77,012 56,504 47,960 8,544 20,508 94.7 69.4 59.1 10.3 25.31983 ........................................................ 87,921 67,408 59,221 8,187 20,513 102.9 78.1 68.6 9.5 24.71984 ........................................................ 100,916 78,223 68,229 9,994 22,693 113.4 86.2 74.6 11.6 27.2
1985 ........................................................ 114,873 89,973 77,956 12,017 24,901 126.1 96.6 82.8 13.8 29.51986 ........................................................ 122,465 96,197 84,663 11,534 26,268 133.0 102.7 89.6 13.1 30.31987 ........................................................ 126,368 102,519 89,526 12,993 23,849 137.7 111.2 96.7 14.4 26.61988 ........................................................ 125,495 100,607 85,698 14,909 24,888 136.6 109.6 93.4 16.2 27.01989 1 ...................................................... 130,100 104,805 90,490 14,315 25,296 138.5 111.7 96.7 15.0 26.8
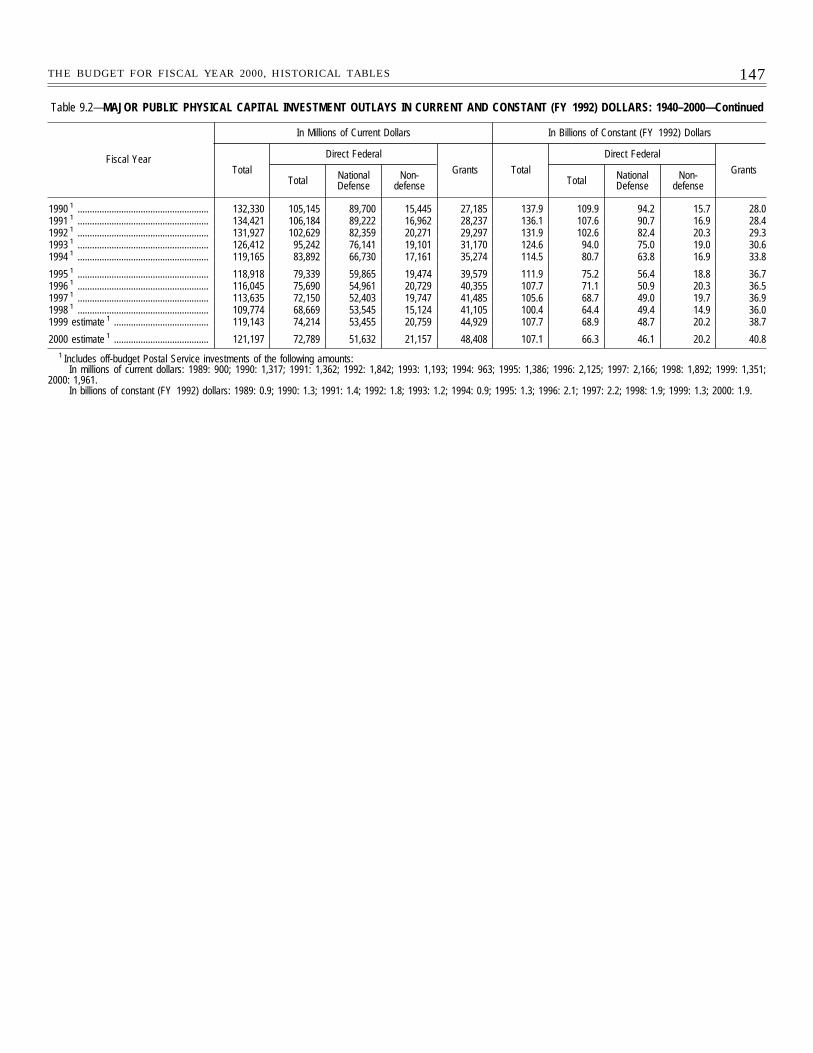
147THE BUDGET FOR FISCAL YEAR 2000, HISTORICAL TABLES
Table 9.2—MAJOR PUBLIC PHYSICAL CAPITAL INVESTMENT OUTLAYS IN CURRENT AND CONSTANT (FY 1992) DOLLARS: 1940–2000—Continued
Fiscal Year
In Millions of Current Dollars In Billions of Constant (FY 1992) Dollars
Total
Direct Federal
Grants Total
Direct Federal
GrantsTotal National
DefenseNon-
defense Total NationalDefense
Non-defense
1990 1 ...................................................... 132,330 105,145 89,700 15,445 27,185 137.9 109.9 94.2 15.7 28.01991 1 ...................................................... 134,421 106,184 89,222 16,962 28,237 136.1 107.6 90.7 16.9 28.41992 1 ...................................................... 131,927 102,629 82,359 20,271 29,297 131.9 102.6 82.4 20.3 29.31993 1 ...................................................... 126,412 95,242 76,141 19,101 31,170 124.6 94.0 75.0 19.0 30.61994 1 ...................................................... 119,165 83,892 66,730 17,161 35,274 114.5 80.7 63.8 16.9 33.8
1995 1 ...................................................... 118,918 79,339 59,865 19,474 39,579 111.9 75.2 56.4 18.8 36.71996 1 ...................................................... 116,045 75,690 54,961 20,729 40,355 107.7 71.1 50.9 20.3 36.51997 1 ...................................................... 113,635 72,150 52,403 19,747 41,485 105.6 68.7 49.0 19.7 36.91998 1 ...................................................... 109,774 68,669 53,545 15,124 41,105 100.4 64.4 49.4 14.9 36.01999 estimate 1 ....................................... 119,143 74,214 53,455 20,759 44,929 107.7 68.9 48.7 20.2 38.7
2000 estimate 1 ....................................... 121,197 72,789 51,632 21,157 48,408 107.1 66.3 46.1 20.2 40.81 Includes off-budget Postal Service investments of the following amounts:
In millions of current dollars: 1989: 900; 1990: 1,317; 1991: 1,362; 1992: 1,842; 1993: 1,193; 1994: 963; 1995: 1,386; 1996: 2,125; 1997: 2,166; 1998: 1,892; 1999: 1,351;2000: 1,961.
In billions of constant (FY 1992) dollars: 1989: 0.9; 1990: 1.3; 1991: 1.4; 1992: 1.8; 1993: 1.2; 1994: 0.9; 1995: 1.3; 1996: 2.1; 1997: 2.2; 1998: 1.9; 1999: 1.3; 2000: 1.9.
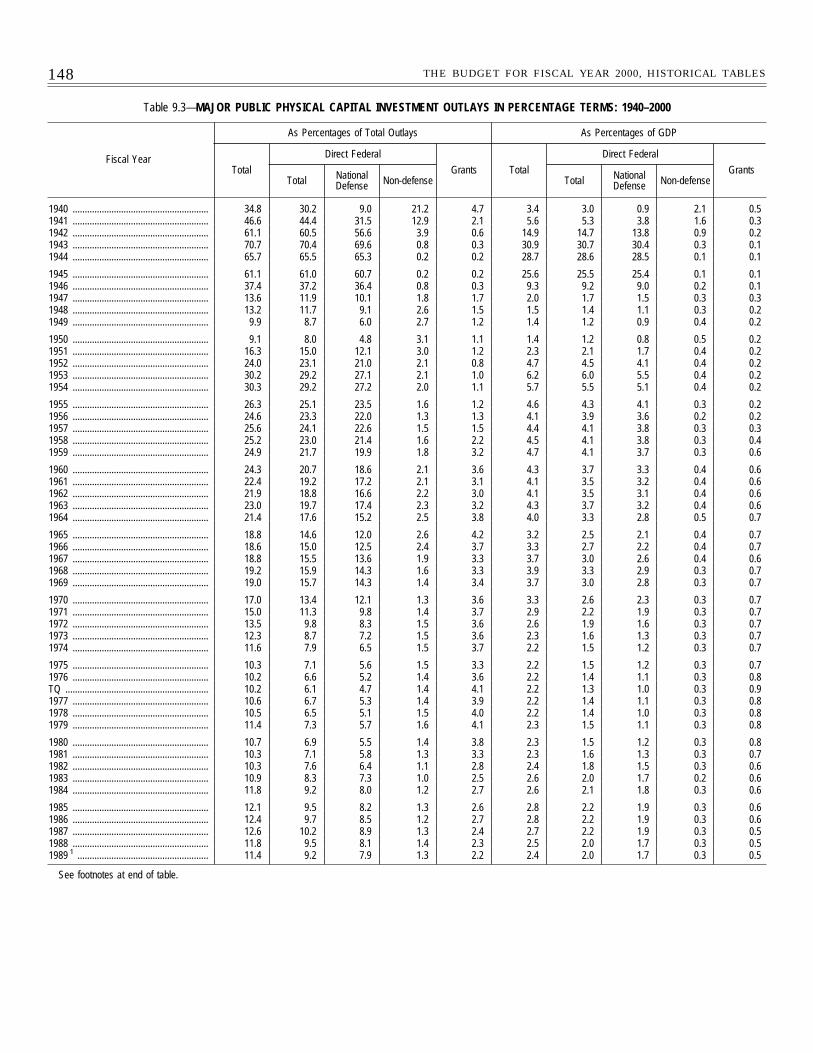
148 THE BUDGET FOR FISCAL YEAR 2000, HISTORICAL TABLES
Table 9.3—MAJOR PUBLIC PHYSICAL CAPITAL INVESTMENT OUTLAYS IN PERCENTAGE TERMS: 1940–2000
Fiscal Year
As Percentages of Total Outlays As Percentages of GDP
Total
Direct Federal
Grants Total
Direct Federal
GrantsTotal National
Defense Non-defense Total NationalDefense Non-defense
1940 ........................................................ 34.8 30.2 9.0 21.2 4.7 3.4 3.0 0.9 2.1 0.51941 ........................................................ 46.6 44.4 31.5 12.9 2.1 5.6 5.3 3.8 1.6 0.31942 ........................................................ 61.1 60.5 56.6 3.9 0.6 14.9 14.7 13.8 0.9 0.21943 ........................................................ 70.7 70.4 69.6 0.8 0.3 30.9 30.7 30.4 0.3 0.11944 ........................................................ 65.7 65.5 65.3 0.2 0.2 28.7 28.6 28.5 0.1 0.1
1945 ........................................................ 61.1 61.0 60.7 0.2 0.2 25.6 25.5 25.4 0.1 0.11946 ........................................................ 37.4 37.2 36.4 0.8 0.3 9.3 9.2 9.0 0.2 0.11947 ........................................................ 13.6 11.9 10.1 1.8 1.7 2.0 1.7 1.5 0.3 0.31948 ........................................................ 13.2 11.7 9.1 2.6 1.5 1.5 1.4 1.1 0.3 0.21949 ........................................................ 9.9 8.7 6.0 2.7 1.2 1.4 1.2 0.9 0.4 0.2
1950 ........................................................ 9.1 8.0 4.8 3.1 1.1 1.4 1.2 0.8 0.5 0.21951 ........................................................ 16.3 15.0 12.1 3.0 1.2 2.3 2.1 1.7 0.4 0.21952 ........................................................ 24.0 23.1 21.0 2.1 0.8 4.7 4.5 4.1 0.4 0.21953 ........................................................ 30.2 29.2 27.1 2.1 1.0 6.2 6.0 5.5 0.4 0.21954 ........................................................ 30.3 29.2 27.2 2.0 1.1 5.7 5.5 5.1 0.4 0.2
1955 ........................................................ 26.3 25.1 23.5 1.6 1.2 4.6 4.3 4.1 0.3 0.21956 ........................................................ 24.6 23.3 22.0 1.3 1.3 4.1 3.9 3.6 0.2 0.21957 ........................................................ 25.6 24.1 22.6 1.5 1.5 4.4 4.1 3.8 0.3 0.31958 ........................................................ 25.2 23.0 21.4 1.6 2.2 4.5 4.1 3.8 0.3 0.41959 ........................................................ 24.9 21.7 19.9 1.8 3.2 4.7 4.1 3.7 0.3 0.6
1960 ........................................................ 24.3 20.7 18.6 2.1 3.6 4.3 3.7 3.3 0.4 0.61961 ........................................................ 22.4 19.2 17.2 2.1 3.1 4.1 3.5 3.2 0.4 0.61962 ........................................................ 21.9 18.8 16.6 2.2 3.0 4.1 3.5 3.1 0.4 0.61963 ........................................................ 23.0 19.7 17.4 2.3 3.2 4.3 3.7 3.2 0.4 0.61964 ........................................................ 21.4 17.6 15.2 2.5 3.8 4.0 3.3 2.8 0.5 0.7
1965 ........................................................ 18.8 14.6 12.0 2.6 4.2 3.2 2.5 2.1 0.4 0.71966 ........................................................ 18.6 15.0 12.5 2.4 3.7 3.3 2.7 2.2 0.4 0.71967 ........................................................ 18.8 15.5 13.6 1.9 3.3 3.7 3.0 2.6 0.4 0.61968 ........................................................ 19.2 15.9 14.3 1.6 3.3 3.9 3.3 2.9 0.3 0.71969 ........................................................ 19.0 15.7 14.3 1.4 3.4 3.7 3.0 2.8 0.3 0.7
1970 ........................................................ 17.0 13.4 12.1 1.3 3.6 3.3 2.6 2.3 0.3 0.71971 ........................................................ 15.0 11.3 9.8 1.4 3.7 2.9 2.2 1.9 0.3 0.71972 ........................................................ 13.5 9.8 8.3 1.5 3.6 2.6 1.9 1.6 0.3 0.71973 ........................................................ 12.3 8.7 7.2 1.5 3.6 2.3 1.6 1.3 0.3 0.71974 ........................................................ 11.6 7.9 6.5 1.5 3.7 2.2 1.5 1.2 0.3 0.7
1975 ........................................................ 10.3 7.1 5.6 1.5 3.3 2.2 1.5 1.2 0.3 0.71976 ........................................................ 10.2 6.6 5.2 1.4 3.6 2.2 1.4 1.1 0.3 0.8TQ ........................................................... 10.2 6.1 4.7 1.4 4.1 2.2 1.3 1.0 0.3 0.91977 ........................................................ 10.6 6.7 5.3 1.4 3.9 2.2 1.4 1.1 0.3 0.81978 ........................................................ 10.5 6.5 5.1 1.5 4.0 2.2 1.4 1.0 0.3 0.81979 ........................................................ 11.4 7.3 5.7 1.6 4.1 2.3 1.5 1.1 0.3 0.8
1980 ........................................................ 10.7 6.9 5.5 1.4 3.8 2.3 1.5 1.2 0.3 0.81981 ........................................................ 10.3 7.1 5.8 1.3 3.3 2.3 1.6 1.3 0.3 0.71982 ........................................................ 10.3 7.6 6.4 1.1 2.8 2.4 1.8 1.5 0.3 0.61983 ........................................................ 10.9 8.3 7.3 1.0 2.5 2.6 2.0 1.7 0.2 0.61984 ........................................................ 11.8 9.2 8.0 1.2 2.7 2.6 2.1 1.8 0.3 0.6
1985 ........................................................ 12.1 9.5 8.2 1.3 2.6 2.8 2.2 1.9 0.3 0.61986 ........................................................ 12.4 9.7 8.5 1.2 2.7 2.8 2.2 1.9 0.3 0.61987 ........................................................ 12.6 10.2 8.9 1.3 2.4 2.7 2.2 1.9 0.3 0.51988 ........................................................ 11.8 9.5 8.1 1.4 2.3 2.5 2.0 1.7 0.3 0.51989 1 ...................................................... 11.4 9.2 7.9 1.3 2.2 2.4 2.0 1.7 0.3 0.5
See footnotes at end of table.
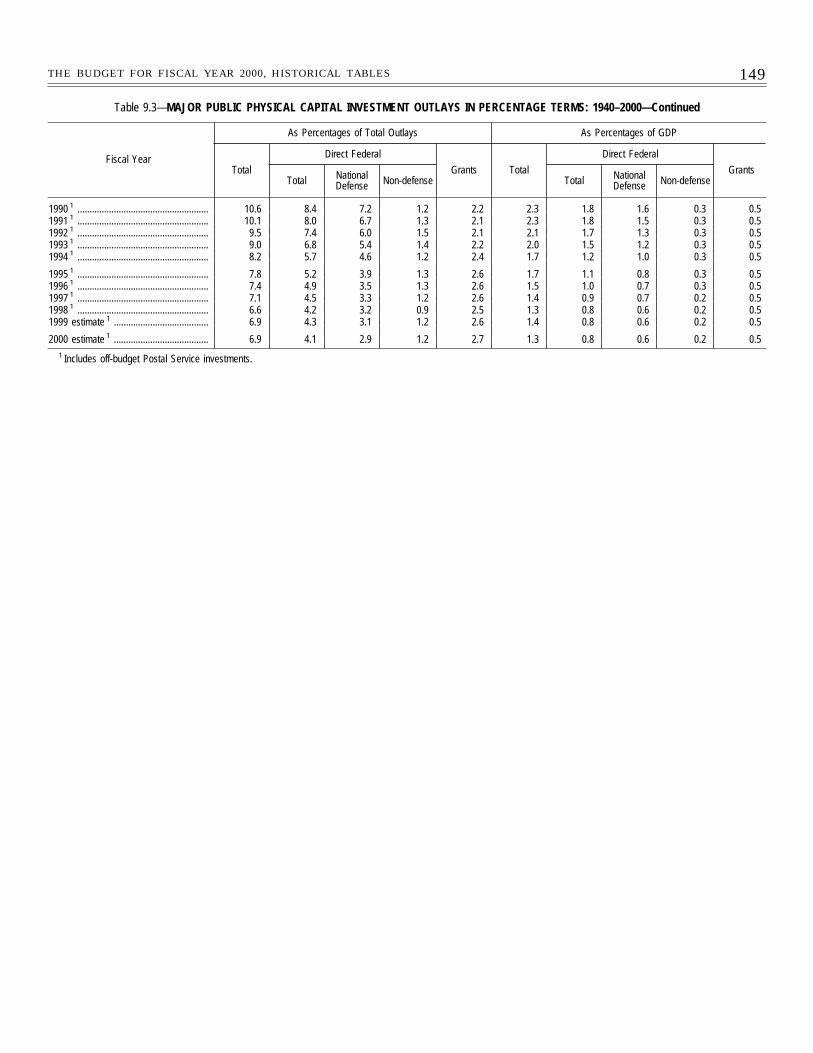
149THE BUDGET FOR FISCAL YEAR 2000, HISTORICAL TABLES
Table 9.3—MAJOR PUBLIC PHYSICAL CAPITAL INVESTMENT OUTLAYS IN PERCENTAGE TERMS: 1940–2000—Continued
Fiscal Year
As Percentages of Total Outlays As Percentages of GDP
Total
Direct Federal
Grants Total
Direct Federal
GrantsTotal National
Defense Non-defense Total NationalDefense Non-defense
1990 1 ...................................................... 10.6 8.4 7.2 1.2 2.2 2.3 1.8 1.6 0.3 0.51991 1 ...................................................... 10.1 8.0 6.7 1.3 2.1 2.3 1.8 1.5 0.3 0.51992 1 ...................................................... 9.5 7.4 6.0 1.5 2.1 2.1 1.7 1.3 0.3 0.51993 1 ...................................................... 9.0 6.8 5.4 1.4 2.2 2.0 1.5 1.2 0.3 0.51994 1 ...................................................... 8.2 5.7 4.6 1.2 2.4 1.7 1.2 1.0 0.3 0.5
1995 1 ...................................................... 7.8 5.2 3.9 1.3 2.6 1.7 1.1 0.8 0.3 0.51996 1 ...................................................... 7.4 4.9 3.5 1.3 2.6 1.5 1.0 0.7 0.3 0.51997 1 ...................................................... 7.1 4.5 3.3 1.2 2.6 1.4 0.9 0.7 0.2 0.51998 1 ...................................................... 6.6 4.2 3.2 0.9 2.5 1.3 0.8 0.6 0.2 0.51999 estimate 1 ....................................... 6.9 4.3 3.1 1.2 2.6 1.4 0.8 0.6 0.2 0.5
2000 estimate 1 ....................................... 6.9 4.1 2.9 1.2 2.7 1.3 0.8 0.6 0.2 0.51 Includes off-budget Postal Service investments.
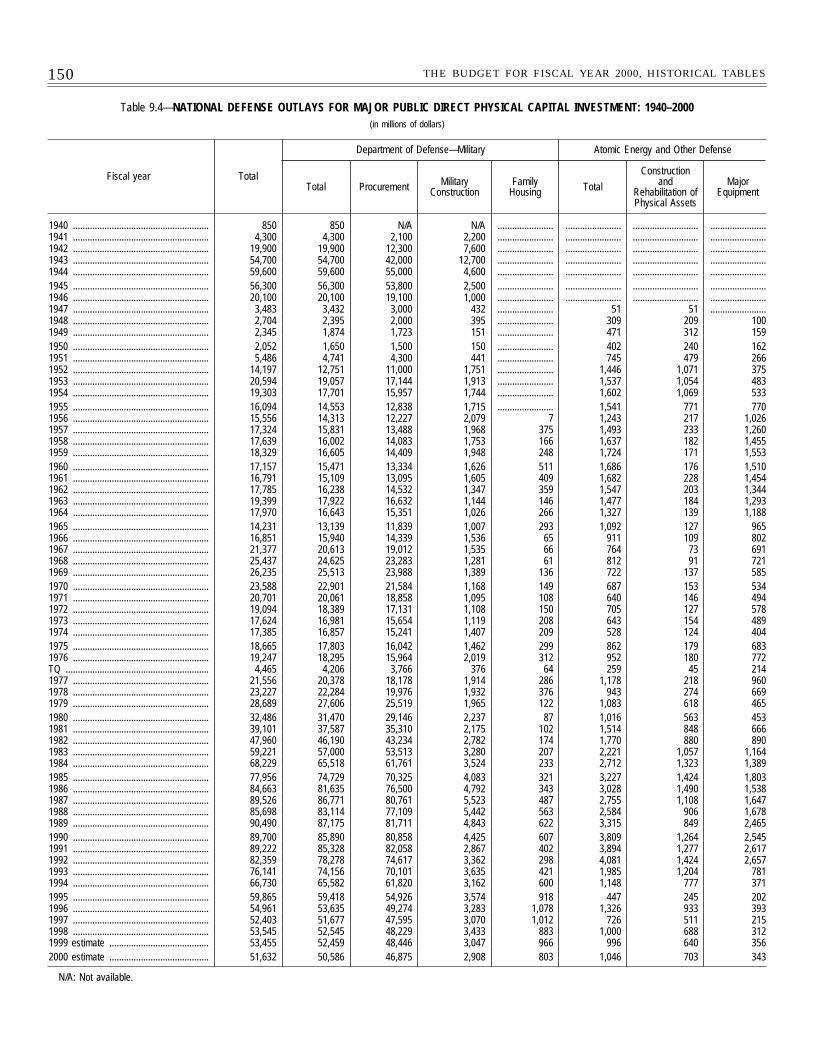
150 THE BUDGET FOR FISCAL YEAR 2000, HISTORICAL TABLES
Table 9.4—NATIONAL DEFENSE OUTLAYS FOR MAJOR PUBLIC DIRECT PHYSICAL CAPITAL INVESTMENT: 1940–2000(in millions of dollars)
Fiscal year Total
Department of Defense—Military Atomic Energy and Other Defense
Total Procurement MilitaryConstruction
FamilyHousing Total
Constructionand
Rehabilitation ofPhysical Assets
MajorEquipment
1940 ........................................................ 850 850 N/A N/A ....................... ....................... ........................... .......................1941 ........................................................ 4,300 4,300 2,100 2,200 ....................... ....................... ........................... .......................1942 ........................................................ 19,900 19,900 12,300 7,600 ....................... ....................... ........................... .......................1943 ........................................................ 54,700 54,700 42,000 12,700 ....................... ....................... ........................... .......................1944 ........................................................ 59,600 59,600 55,000 4,600 ....................... ....................... ........................... .......................1945 ........................................................ 56,300 56,300 53,800 2,500 ....................... ....................... ........................... .......................1946 ........................................................ 20,100 20,100 19,100 1,000 ....................... ....................... ........................... .......................1947 ........................................................ 3,483 3,432 3,000 432 ....................... 51 51 .......................1948 ........................................................ 2,704 2,395 2,000 395 ....................... 309 209 1001949 ........................................................ 2,345 1,874 1,723 151 ....................... 471 312 1591950 ........................................................ 2,052 1,650 1,500 150 ....................... 402 240 1621951 ........................................................ 5,486 4,741 4,300 441 ....................... 745 479 2661952 ........................................................ 14,197 12,751 11,000 1,751 ....................... 1,446 1,071 3751953 ........................................................ 20,594 19,057 17,144 1,913 ....................... 1,537 1,054 4831954 ........................................................ 19,303 17,701 15,957 1,744 ....................... 1,602 1,069 5331955 ........................................................ 16,094 14,553 12,838 1,715 ....................... 1,541 771 7701956 ........................................................ 15,556 14,313 12,227 2,079 7 1,243 217 1,0261957 ........................................................ 17,324 15,831 13,488 1,968 375 1,493 233 1,2601958 ........................................................ 17,639 16,002 14,083 1,753 166 1,637 182 1,4551959 ........................................................ 18,329 16,605 14,409 1,948 248 1,724 171 1,5531960 ........................................................ 17,157 15,471 13,334 1,626 511 1,686 176 1,5101961 ........................................................ 16,791 15,109 13,095 1,605 409 1,682 228 1,4541962 ........................................................ 17,785 16,238 14,532 1,347 359 1,547 203 1,3441963 ........................................................ 19,399 17,922 16,632 1,144 146 1,477 184 1,2931964 ........................................................ 17,970 16,643 15,351 1,026 266 1,327 139 1,1881965 ........................................................ 14,231 13,139 11,839 1,007 293 1,092 127 9651966 ........................................................ 16,851 15,940 14,339 1,536 65 911 109 8021967 ........................................................ 21,377 20,613 19,012 1,535 66 764 73 6911968 ........................................................ 25,437 24,625 23,283 1,281 61 812 91 7211969 ........................................................ 26,235 25,513 23,988 1,389 136 722 137 5851970 ........................................................ 23,588 22,901 21,584 1,168 149 687 153 5341971 ........................................................ 20,701 20,061 18,858 1,095 108 640 146 4941972 ........................................................ 19,094 18,389 17,131 1,108 150 705 127 5781973 ........................................................ 17,624 16,981 15,654 1,119 208 643 154 4891974 ........................................................ 17,385 16,857 15,241 1,407 209 528 124 4041975 ........................................................ 18,665 17,803 16,042 1,462 299 862 179 6831976 ........................................................ 19,247 18,295 15,964 2,019 312 952 180 772TQ ........................................................... 4,465 4,206 3,766 376 64 259 45 2141977 ........................................................ 21,556 20,378 18,178 1,914 286 1,178 218 9601978 ........................................................ 23,227 22,284 19,976 1,932 376 943 274 6691979 ........................................................ 28,689 27,606 25,519 1,965 122 1,083 618 4651980 ........................................................ 32,486 31,470 29,146 2,237 87 1,016 563 4531981 ........................................................ 39,101 37,587 35,310 2,175 102 1,514 848 6661982 ........................................................ 47,960 46,190 43,234 2,782 174 1,770 880 8901983 ........................................................ 59,221 57,000 53,513 3,280 207 2,221 1,057 1,1641984 ........................................................ 68,229 65,518 61,761 3,524 233 2,712 1,323 1,3891985 ........................................................ 77,956 74,729 70,325 4,083 321 3,227 1,424 1,8031986 ........................................................ 84,663 81,635 76,500 4,792 343 3,028 1,490 1,5381987 ........................................................ 89,526 86,771 80,761 5,523 487 2,755 1,108 1,6471988 ........................................................ 85,698 83,114 77,109 5,442 563 2,584 906 1,6781989 ........................................................ 90,490 87,175 81,711 4,843 622 3,315 849 2,4651990 ........................................................ 89,700 85,890 80,858 4,425 607 3,809 1,264 2,5451991 ........................................................ 89,222 85,328 82,058 2,867 402 3,894 1,277 2,6171992 ........................................................ 82,359 78,278 74,617 3,362 298 4,081 1,424 2,6571993 ........................................................ 76,141 74,156 70,101 3,635 421 1,985 1,204 7811994 ........................................................ 66,730 65,582 61,820 3,162 600 1,148 777 3711995 ........................................................ 59,865 59,418 54,926 3,574 918 447 245 2021996 ........................................................ 54,961 53,635 49,274 3,283 1,078 1,326 933 3931997 ........................................................ 52,403 51,677 47,595 3,070 1,012 726 511 2151998 ........................................................ 53,545 52,545 48,229 3,433 883 1,000 688 3121999 estimate ......................................... 53,455 52,459 48,446 3,047 966 996 640 3562000 estimate ......................................... 51,632 50,586 46,875 2,908 803 1,046 703 343
N/A: Not available.
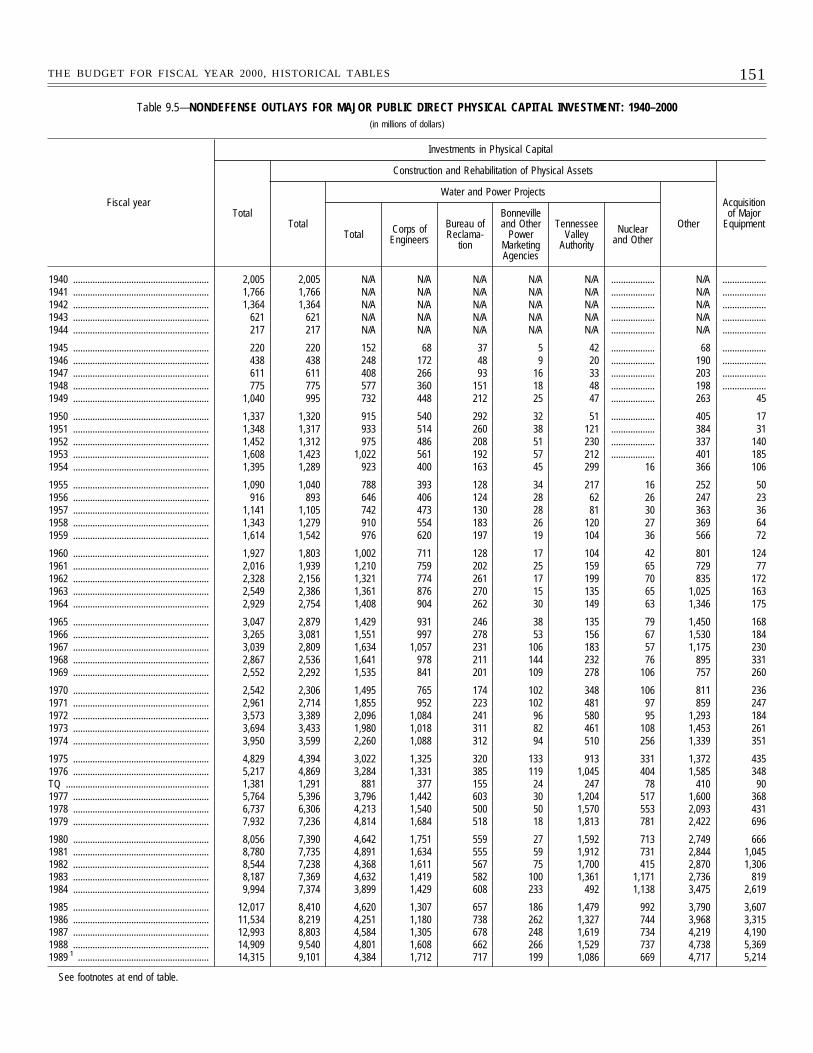
151THE BUDGET FOR FISCAL YEAR 2000, HISTORICAL TABLES
Table 9.5—NONDEFENSE OUTLAYS FOR MAJOR PUBLIC DIRECT PHYSICAL CAPITAL INVESTMENT: 1940–2000(in millions of dollars)
Fiscal year
Investments in Physical Capital
Total
Construction and Rehabilitation of Physical Assets
Acquisitionof Major
EquipmentTotal
Water and Power Projects
OtherTotal Corps of
Engineers
Bureau ofReclama-
tion
Bonnevilleand Other
PowerMarketingAgencies
TennesseeValley
Authority
Nuclearand Other
1940 ........................................................ 2,005 2,005 N/A N/A N/A N/A N/A .................. N/A ..................1941 ........................................................ 1,766 1,766 N/A N/A N/A N/A N/A .................. N/A ..................1942 ........................................................ 1,364 1,364 N/A N/A N/A N/A N/A .................. N/A ..................1943 ........................................................ 621 621 N/A N/A N/A N/A N/A .................. N/A ..................1944 ........................................................ 217 217 N/A N/A N/A N/A N/A .................. N/A ..................
1945 ........................................................ 220 220 152 68 37 5 42 .................. 68 ..................1946 ........................................................ 438 438 248 172 48 9 20 .................. 190 ..................1947 ........................................................ 611 611 408 266 93 16 33 .................. 203 ..................1948 ........................................................ 775 775 577 360 151 18 48 .................. 198 ..................1949 ........................................................ 1,040 995 732 448 212 25 47 .................. 263 45
1950 ........................................................ 1,337 1,320 915 540 292 32 51 .................. 405 171951 ........................................................ 1,348 1,317 933 514 260 38 121 .................. 384 311952 ........................................................ 1,452 1,312 975 486 208 51 230 .................. 337 1401953 ........................................................ 1,608 1,423 1,022 561 192 57 212 .................. 401 1851954 ........................................................ 1,395 1,289 923 400 163 45 299 16 366 106
1955 ........................................................ 1,090 1,040 788 393 128 34 217 16 252 501956 ........................................................ 916 893 646 406 124 28 62 26 247 231957 ........................................................ 1,141 1,105 742 473 130 28 81 30 363 361958 ........................................................ 1,343 1,279 910 554 183 26 120 27 369 641959 ........................................................ 1,614 1,542 976 620 197 19 104 36 566 72
1960 ........................................................ 1,927 1,803 1,002 711 128 17 104 42 801 1241961 ........................................................ 2,016 1,939 1,210 759 202 25 159 65 729 771962 ........................................................ 2,328 2,156 1,321 774 261 17 199 70 835 1721963 ........................................................ 2,549 2,386 1,361 876 270 15 135 65 1,025 1631964 ........................................................ 2,929 2,754 1,408 904 262 30 149 63 1,346 175
1965 ........................................................ 3,047 2,879 1,429 931 246 38 135 79 1,450 1681966 ........................................................ 3,265 3,081 1,551 997 278 53 156 67 1,530 1841967 ........................................................ 3,039 2,809 1,634 1,057 231 106 183 57 1,175 2301968 ........................................................ 2,867 2,536 1,641 978 211 144 232 76 895 3311969 ........................................................ 2,552 2,292 1,535 841 201 109 278 106 757 260
1970 ........................................................ 2,542 2,306 1,495 765 174 102 348 106 811 2361971 ........................................................ 2,961 2,714 1,855 952 223 102 481 97 859 2471972 ........................................................ 3,573 3,389 2,096 1,084 241 96 580 95 1,293 1841973 ........................................................ 3,694 3,433 1,980 1,018 311 82 461 108 1,453 2611974 ........................................................ 3,950 3,599 2,260 1,088 312 94 510 256 1,339 351
1975 ........................................................ 4,829 4,394 3,022 1,325 320 133 913 331 1,372 4351976 ........................................................ 5,217 4,869 3,284 1,331 385 119 1,045 404 1,585 348TQ ........................................................... 1,381 1,291 881 377 155 24 247 78 410 901977 ........................................................ 5,764 5,396 3,796 1,442 603 30 1,204 517 1,600 3681978 ........................................................ 6,737 6,306 4,213 1,540 500 50 1,570 553 2,093 4311979 ........................................................ 7,932 7,236 4,814 1,684 518 18 1,813 781 2,422 696
1980 ........................................................ 8,056 7,390 4,642 1,751 559 27 1,592 713 2,749 6661981 ........................................................ 8,780 7,735 4,891 1,634 555 59 1,912 731 2,844 1,0451982 ........................................................ 8,544 7,238 4,368 1,611 567 75 1,700 415 2,870 1,3061983 ........................................................ 8,187 7,369 4,632 1,419 582 100 1,361 1,171 2,736 8191984 ........................................................ 9,994 7,374 3,899 1,429 608 233 492 1,138 3,475 2,619
1985 ........................................................ 12,017 8,410 4,620 1,307 657 186 1,479 992 3,790 3,6071986 ........................................................ 11,534 8,219 4,251 1,180 738 262 1,327 744 3,968 3,3151987 ........................................................ 12,993 8,803 4,584 1,305 678 248 1,619 734 4,219 4,1901988 ........................................................ 14,909 9,540 4,801 1,608 662 266 1,529 737 4,738 5,3691989 1 ...................................................... 14,315 9,101 4,384 1,712 717 199 1,086 669 4,717 5,214
See footnotes at end of table.
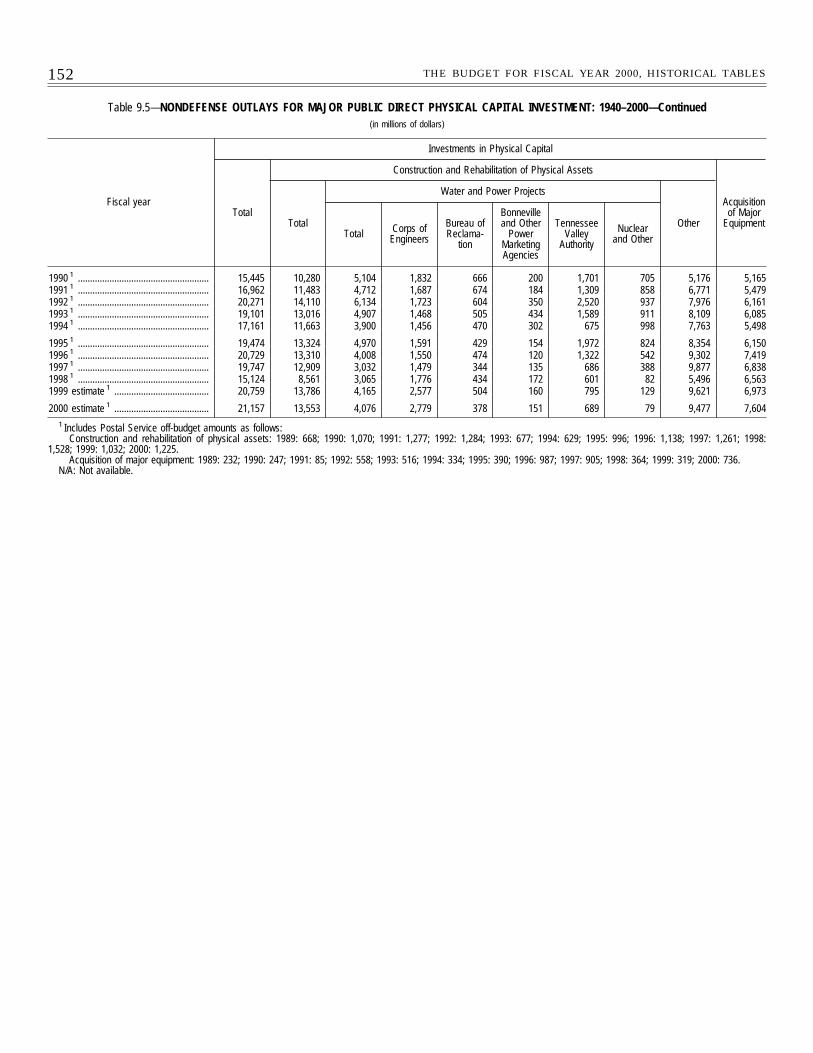
152 THE BUDGET FOR FISCAL YEAR 2000, HISTORICAL TABLES
Table 9.5—NONDEFENSE OUTLAYS FOR MAJOR PUBLIC DIRECT PHYSICAL CAPITAL INVESTMENT: 1940–2000—Continued(in millions of dollars)
Fiscal year
Investments in Physical Capital
Total
Construction and Rehabilitation of Physical Assets
Acquisitionof Major
EquipmentTotal
Water and Power Projects
OtherTotal Corps of
Engineers
Bureau ofReclama-
tion
Bonnevilleand Other
PowerMarketingAgencies
TennesseeValley
Authority
Nuclearand Other
1990 1 ...................................................... 15,445 10,280 5,104 1,832 666 200 1,701 705 5,176 5,1651991 1 ...................................................... 16,962 11,483 4,712 1,687 674 184 1,309 858 6,771 5,4791992 1 ...................................................... 20,271 14,110 6,134 1,723 604 350 2,520 937 7,976 6,1611993 1 ...................................................... 19,101 13,016 4,907 1,468 505 434 1,589 911 8,109 6,0851994 1 ...................................................... 17,161 11,663 3,900 1,456 470 302 675 998 7,763 5,498
1995 1 ...................................................... 19,474 13,324 4,970 1,591 429 154 1,972 824 8,354 6,1501996 1 ...................................................... 20,729 13,310 4,008 1,550 474 120 1,322 542 9,302 7,4191997 1 ...................................................... 19,747 12,909 3,032 1,479 344 135 686 388 9,877 6,8381998 1 ...................................................... 15,124 8,561 3,065 1,776 434 172 601 82 5,496 6,5631999 estimate 1 ....................................... 20,759 13,786 4,165 2,577 504 160 795 129 9,621 6,973
2000 estimate 1 ....................................... 21,157 13,553 4,076 2,779 378 151 689 79 9,477 7,6041 Includes Postal Service off-budget amounts as follows:
Construction and rehabilitation of physical assets: 1989: 668; 1990: 1,070; 1991: 1,277; 1992: 1,284; 1993: 677; 1994: 629; 1995: 996; 1996: 1,138; 1997: 1,261; 1998:1,528; 1999: 1,032; 2000: 1,225.
Acquisition of major equipment: 1989: 232; 1990: 247; 1991: 85; 1992: 558; 1993: 516; 1994: 334; 1995: 390; 1996: 987; 1997: 905; 1998: 364; 1999: 319; 2000: 736.N/A: Not available.
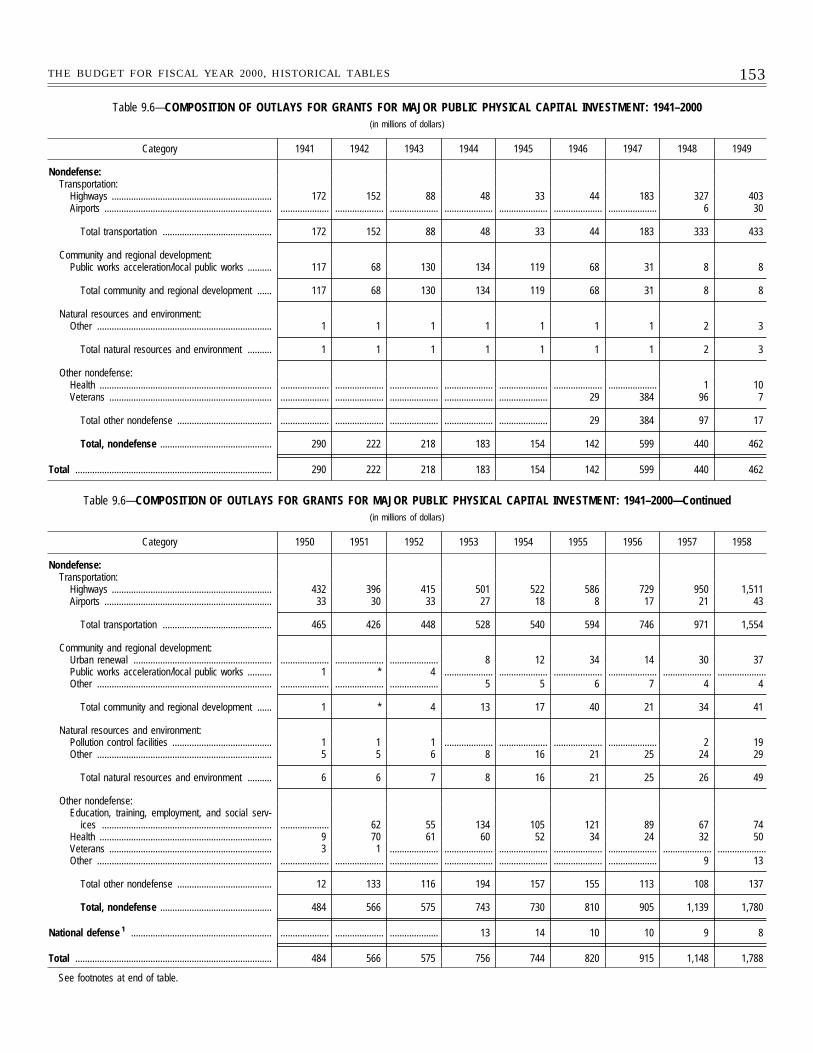
153THE BUDGET FOR FISCAL YEAR 2000, HISTORICAL TABLES
Table 9.6—COMPOSITION OF OUTLAYS FOR GRANTS FOR MAJOR PUBLIC PHYSICAL CAPITAL INVESTMENT: 1941–2000(in millions of dollars)
Category 1941 1942 1943 1944 1945 1946 1947 1948 1949
Nondefense:Transportation:
Highways .................................................................. 172 152 88 48 33 44 183 327 403Airports ..................................................................... .................... .................... .................... .................... .................... .................... .................... 6 30
Total transportation ............................................. 172 152 88 48 33 44 183 333 433
Community and regional development:Public works acceleration/local public works .......... 117 68 130 134 119 68 31 8 8
Total community and regional development ...... 117 68 130 134 119 68 31 8 8
Natural resources and environment:Other ........................................................................ 1 1 1 1 1 1 1 2 3
Total natural resources and environment .......... 1 1 1 1 1 1 1 2 3
Other nondefense:Health ....................................................................... .................... .................... .................... .................... .................... .................... .................... 1 10Veterans ................................................................... .................... .................... .................... .................... .................... 29 384 96 7
Total other nondefense ....................................... .................... .................... .................... .................... .................... 29 384 97 17
Total, nondefense .............................................. 290 222 218 183 154 142 599 440 462
Total ................................................................................. 290 222 218 183 154 142 599 440 462
Table 9.6—COMPOSITION OF OUTLAYS FOR GRANTS FOR MAJOR PUBLIC PHYSICAL CAPITAL INVESTMENT: 1941–2000—Continued(in millions of dollars)
Category 1950 1951 1952 1953 1954 1955 1956 1957 1958
Nondefense:Transportation:
Highways .................................................................. 432 396 415 501 522 586 729 950 1,511Airports ..................................................................... 33 30 33 27 18 8 17 21 43
Total transportation ............................................. 465 426 448 528 540 594 746 971 1,554
Community and regional development:Urban renewal ......................................................... .................... .................... .................... 8 12 34 14 30 37Public works acceleration/local public works .......... 1 * 4 .................... .................... .................... .................... .................... ....................Other ........................................................................ .................... .................... .................... 5 5 6 7 4 4
Total community and regional development ...... 1 * 4 13 17 40 21 34 41
Natural resources and environment:Pollution control facilities ......................................... 1 1 1 .................... .................... .................... .................... 2 19Other ........................................................................ 5 5 6 8 16 21 25 24 29
Total natural resources and environment .......... 6 6 7 8 16 21 25 26 49
Other nondefense:Education, training, employment, and social serv-
ices ...................................................................... .................... 62 55 134 105 121 89 67 74Health ....................................................................... 9 70 61 60 52 34 24 32 50Veterans ................................................................... 3 1 .................... .................... .................... .................... .................... .................... ....................Other ........................................................................ .................... .................... .................... .................... .................... .................... .................... 9 13
Total other nondefense ....................................... 12 133 116 194 157 155 113 108 137
Total, nondefense .............................................. 484 566 575 743 730 810 905 1,139 1,780
National defense 1 .......................................................... .................... .................... .................... 13 14 10 10 9 8
Total ................................................................................. 484 566 575 756 744 820 915 1,148 1,788
See footnotes at end of table.
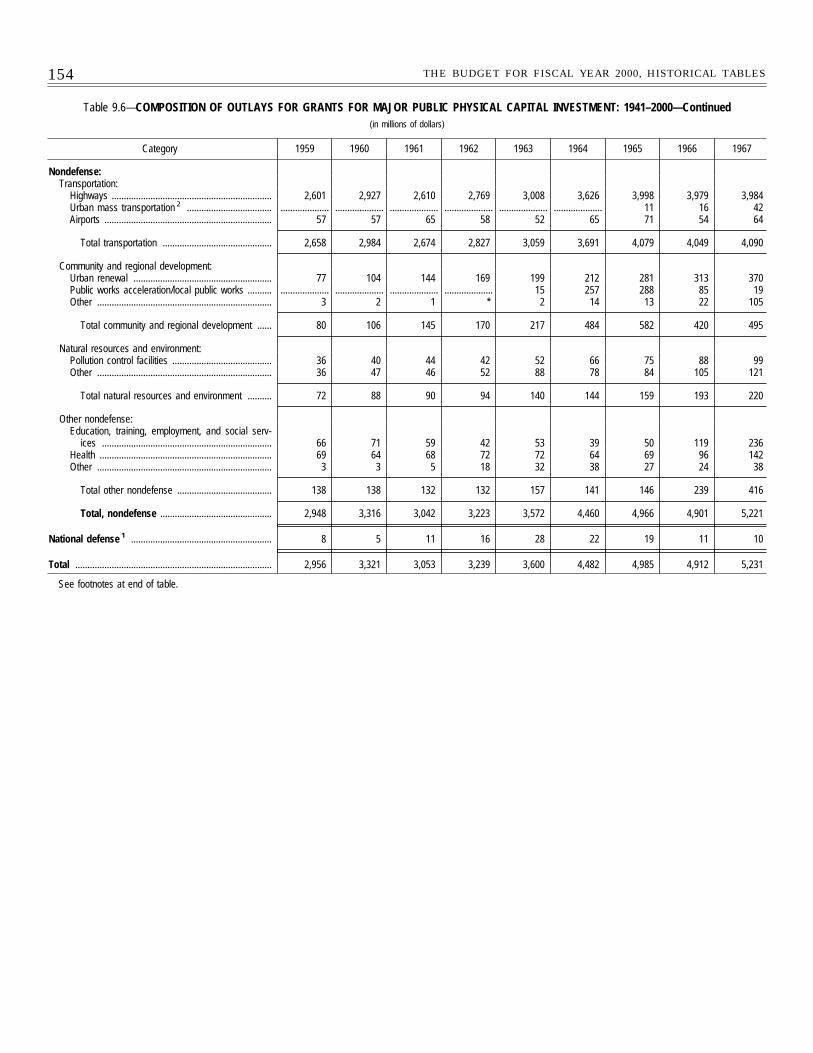
154 THE BUDGET FOR FISCAL YEAR 2000, HISTORICAL TABLES
Table 9.6—COMPOSITION OF OUTLAYS FOR GRANTS FOR MAJOR PUBLIC PHYSICAL CAPITAL INVESTMENT: 1941–2000—Continued(in millions of dollars)
Category 1959 1960 1961 1962 1963 1964 1965 1966 1967
Nondefense:Transportation:
Highways .................................................................. 2,601 2,927 2,610 2,769 3,008 3,626 3,998 3,979 3,984Urban mass transportation 2 ................................... .................... .................... .................... .................... .................... .................... 11 16 42Airports ..................................................................... 57 57 65 58 52 65 71 54 64
Total transportation ............................................. 2,658 2,984 2,674 2,827 3,059 3,691 4,079 4,049 4,090
Community and regional development:Urban renewal ......................................................... 77 104 144 169 199 212 281 313 370Public works acceleration/local public works .......... .................... .................... .................... .................... 15 257 288 85 19Other ........................................................................ 3 2 1 * 2 14 13 22 105
Total community and regional development ...... 80 106 145 170 217 484 582 420 495
Natural resources and environment:Pollution control facilities ......................................... 36 40 44 42 52 66 75 88 99Other ........................................................................ 36 47 46 52 88 78 84 105 121
Total natural resources and environment .......... 72 88 90 94 140 144 159 193 220
Other nondefense:Education, training, employment, and social serv-
ices ...................................................................... 66 71 59 42 53 39 50 119 236Health ....................................................................... 69 64 68 72 72 64 69 96 142Other ........................................................................ 3 3 5 18 32 38 27 24 38
Total other nondefense ....................................... 138 138 132 132 157 141 146 239 416
Total, nondefense .............................................. 2,948 3,316 3,042 3,223 3,572 4,460 4,966 4,901 5,221
National defense 1 .......................................................... 8 5 11 16 28 22 19 11 10
Total ................................................................................. 2,956 3,321 3,053 3,239 3,600 4,482 4,985 4,912 5,231
See footnotes at end of table.
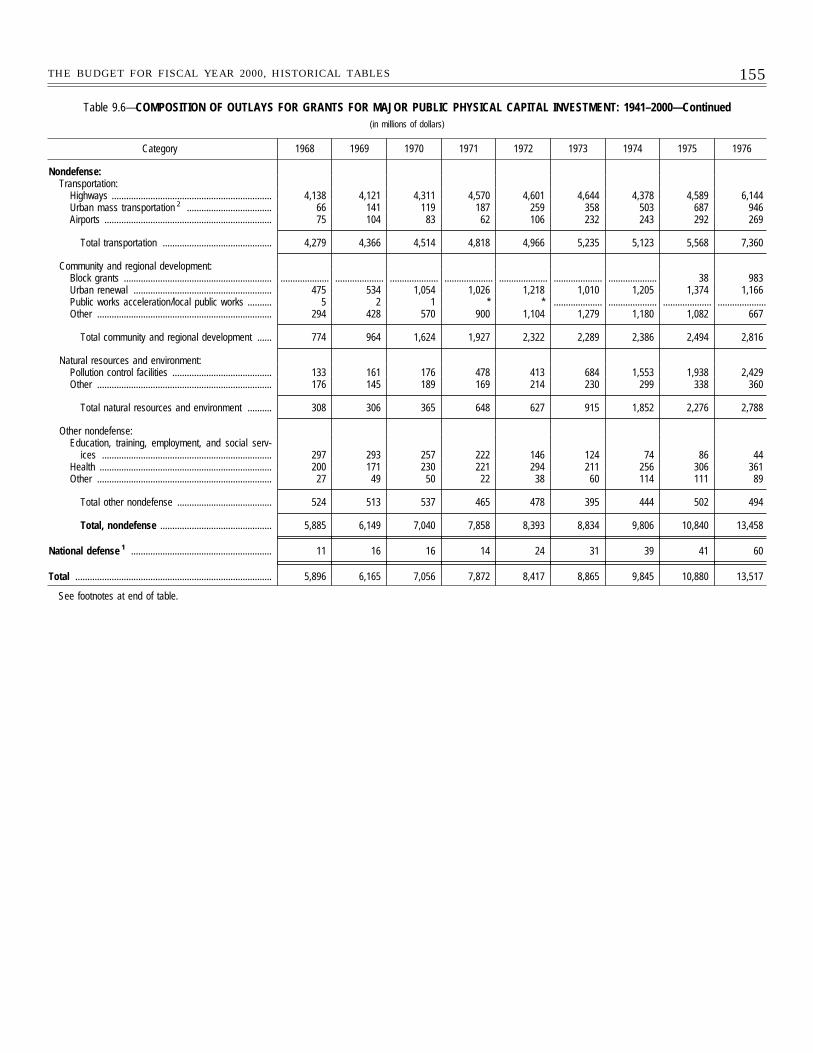
155THE BUDGET FOR FISCAL YEAR 2000, HISTORICAL TABLES
Table 9.6—COMPOSITION OF OUTLAYS FOR GRANTS FOR MAJOR PUBLIC PHYSICAL CAPITAL INVESTMENT: 1941–2000—Continued(in millions of dollars)
Category 1968 1969 1970 1971 1972 1973 1974 1975 1976
Nondefense:Transportation:
Highways .................................................................. 4,138 4,121 4,311 4,570 4,601 4,644 4,378 4,589 6,144Urban mass transportation 2 ................................... 66 141 119 187 259 358 503 687 946Airports ..................................................................... 75 104 83 62 106 232 243 292 269
Total transportation ............................................. 4,279 4,366 4,514 4,818 4,966 5,235 5,123 5,568 7,360
Community and regional development:Block grants ............................................................. .................... .................... .................... .................... .................... .................... .................... 38 983Urban renewal ......................................................... 475 534 1,054 1,026 1,218 1,010 1,205 1,374 1,166Public works acceleration/local public works .......... 5 2 1 * * .................... .................... .................... ....................Other ........................................................................ 294 428 570 900 1,104 1,279 1,180 1,082 667
Total community and regional development ...... 774 964 1,624 1,927 2,322 2,289 2,386 2,494 2,816
Natural resources and environment:Pollution control facilities ......................................... 133 161 176 478 413 684 1,553 1,938 2,429Other ........................................................................ 176 145 189 169 214 230 299 338 360
Total natural resources and environment .......... 308 306 365 648 627 915 1,852 2,276 2,788
Other nondefense:Education, training, employment, and social serv-
ices ...................................................................... 297 293 257 222 146 124 74 86 44Health ....................................................................... 200 171 230 221 294 211 256 306 361Other ........................................................................ 27 49 50 22 38 60 114 111 89
Total other nondefense ....................................... 524 513 537 465 478 395 444 502 494
Total, nondefense .............................................. 5,885 6,149 7,040 7,858 8,393 8,834 9,806 10,840 13,458
National defense 1 .......................................................... 11 16 16 14 24 31 39 41 60
Total ................................................................................. 5,896 6,165 7,056 7,872 8,417 8,865 9,845 10,880 13,517
See footnotes at end of table.
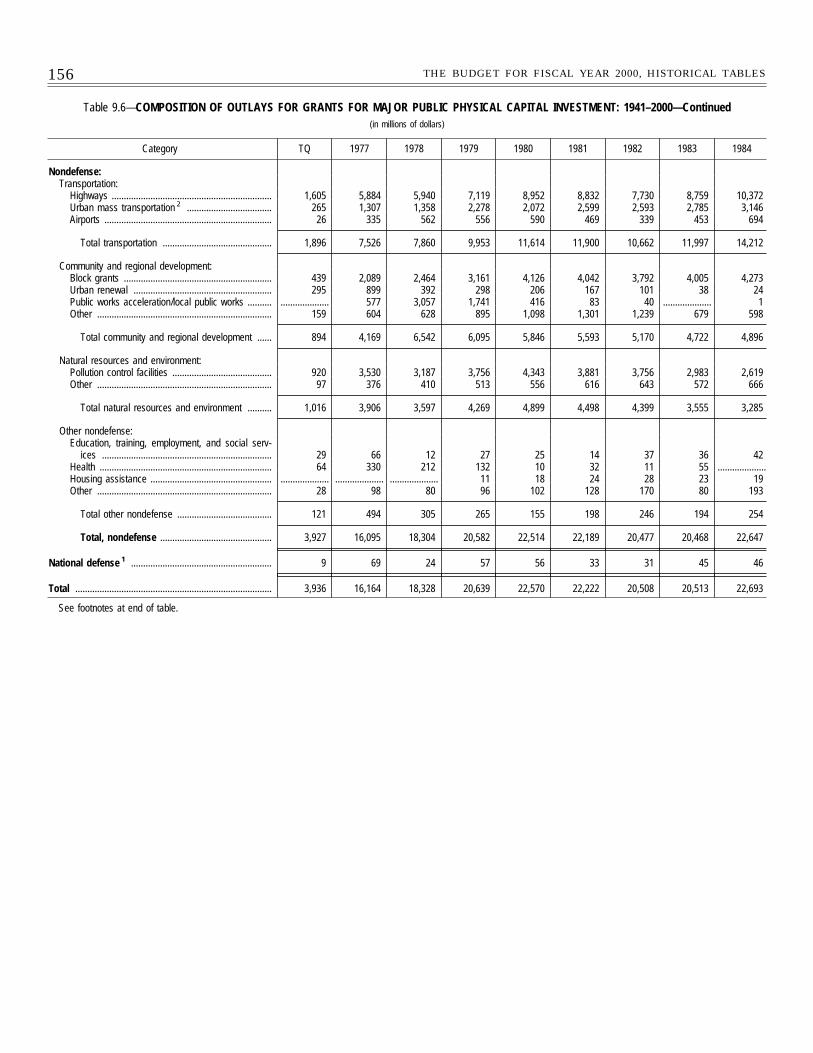
156 THE BUDGET FOR FISCAL YEAR 2000, HISTORICAL TABLES
Table 9.6—COMPOSITION OF OUTLAYS FOR GRANTS FOR MAJOR PUBLIC PHYSICAL CAPITAL INVESTMENT: 1941–2000—Continued(in millions of dollars)
Category TQ 1977 1978 1979 1980 1981 1982 1983 1984
Nondefense:Transportation:
Highways .................................................................. 1,605 5,884 5,940 7,119 8,952 8,832 7,730 8,759 10,372Urban mass transportation 2 ................................... 265 1,307 1,358 2,278 2,072 2,599 2,593 2,785 3,146Airports ..................................................................... 26 335 562 556 590 469 339 453 694
Total transportation ............................................. 1,896 7,526 7,860 9,953 11,614 11,900 10,662 11,997 14,212
Community and regional development:Block grants ............................................................. 439 2,089 2,464 3,161 4,126 4,042 3,792 4,005 4,273Urban renewal ......................................................... 295 899 392 298 206 167 101 38 24Public works acceleration/local public works .......... .................... 577 3,057 1,741 416 83 40 .................... 1Other ........................................................................ 159 604 628 895 1,098 1,301 1,239 679 598
Total community and regional development ...... 894 4,169 6,542 6,095 5,846 5,593 5,170 4,722 4,896
Natural resources and environment:Pollution control facilities ......................................... 920 3,530 3,187 3,756 4,343 3,881 3,756 2,983 2,619Other ........................................................................ 97 376 410 513 556 616 643 572 666
Total natural resources and environment .......... 1,016 3,906 3,597 4,269 4,899 4,498 4,399 3,555 3,285
Other nondefense:Education, training, employment, and social serv-
ices ...................................................................... 29 66 12 27 25 14 37 36 42Health ....................................................................... 64 330 212 132 10 32 11 55 ....................Housing assistance .................................................. .................... .................... .................... 11 18 24 28 23 19Other ........................................................................ 28 98 80 96 102 128 170 80 193
Total other nondefense ....................................... 121 494 305 265 155 198 246 194 254
Total, nondefense .............................................. 3,927 16,095 18,304 20,582 22,514 22,189 20,477 20,468 22,647
National defense 1 .......................................................... 9 69 24 57 56 33 31 45 46
Total ................................................................................. 3,936 16,164 18,328 20,639 22,570 22,222 20,508 20,513 22,693
See footnotes at end of table.
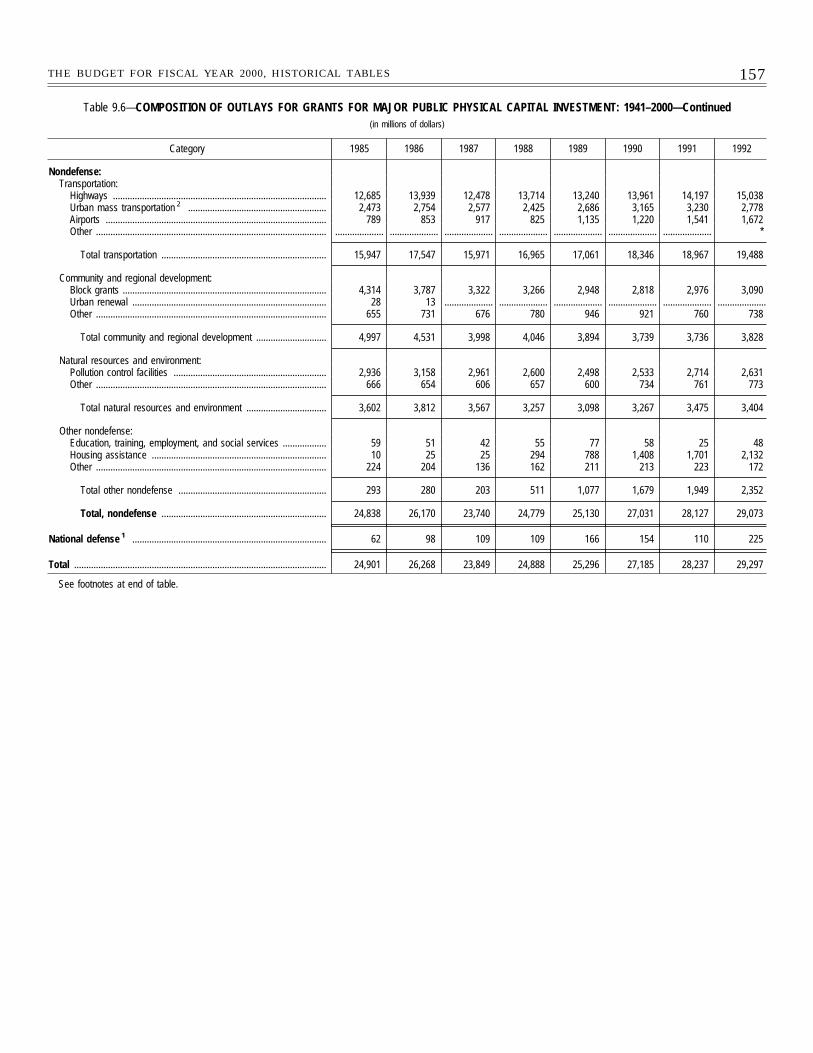
157THE BUDGET FOR FISCAL YEAR 2000, HISTORICAL TABLES
Table 9.6—COMPOSITION OF OUTLAYS FOR GRANTS FOR MAJOR PUBLIC PHYSICAL CAPITAL INVESTMENT: 1941–2000—Continued(in millions of dollars)
Category 1985 1986 1987 1988 1989 1990 1991 1992
Nondefense:Transportation:
Highways ........................................................................................ 12,685 13,939 12,478 13,714 13,240 13,961 14,197 15,038Urban mass transportation 2 ......................................................... 2,473 2,754 2,577 2,425 2,686 3,165 3,230 2,778Airports ........................................................................................... 789 853 917 825 1,135 1,220 1,541 1,672Other ............................................................................................... .................... .................... .................... .................... .................... .................... .................... *
Total transportation .................................................................... 15,947 17,547 15,971 16,965 17,061 18,346 18,967 19,488
Community and regional development:Block grants .................................................................................... 4,314 3,787 3,322 3,266 2,948 2,818 2,976 3,090Urban renewal ................................................................................ 28 13 .................... .................... .................... .................... .................... ....................Other ............................................................................................... 655 731 676 780 946 921 760 738
Total community and regional development ............................. 4,997 4,531 3,998 4,046 3,894 3,739 3,736 3,828
Natural resources and environment:Pollution control facilities ............................................................... 2,936 3,158 2,961 2,600 2,498 2,533 2,714 2,631Other ............................................................................................... 666 654 606 657 600 734 761 773
Total natural resources and environment ................................. 3,602 3,812 3,567 3,257 3,098 3,267 3,475 3,404
Other nondefense:Education, training, employment, and social services .................. 59 51 42 55 77 58 25 48Housing assistance ........................................................................ 10 25 25 294 788 1,408 1,701 2,132Other ............................................................................................... 224 204 136 162 211 213 223 172
Total other nondefense ............................................................. 293 280 203 511 1,077 1,679 1,949 2,352
Total, nondefense .................................................................... 24,838 26,170 23,740 24,779 25,130 27,031 28,127 29,073
National defense 1 ................................................................................ 62 98 109 109 166 154 110 225
Total ........................................................................................................ 24,901 26,268 23,849 24,888 25,296 27,185 28,237 29,297
See footnotes at end of table.
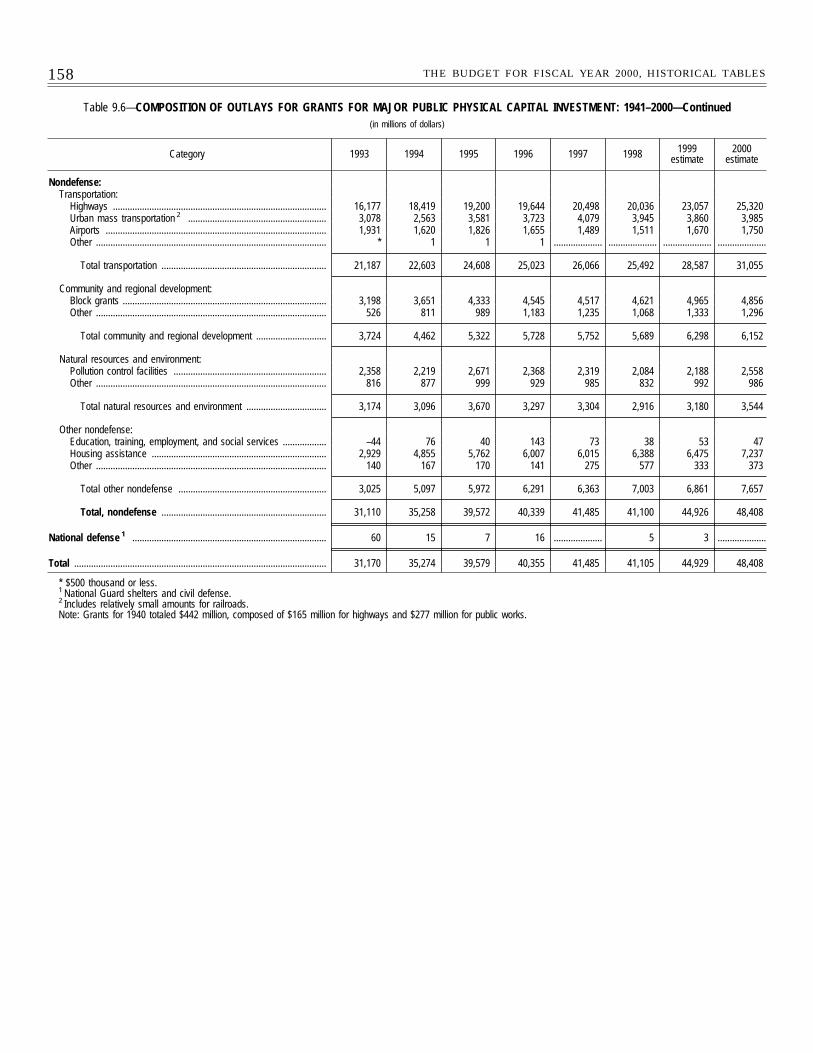
158 THE BUDGET FOR FISCAL YEAR 2000, HISTORICAL TABLES
Table 9.6—COMPOSITION OF OUTLAYS FOR GRANTS FOR MAJOR PUBLIC PHYSICAL CAPITAL INVESTMENT: 1941–2000—Continued(in millions of dollars)
Category 1993 1994 1995 1996 1997 1998 1999estimate
2000estimate
Nondefense:Transportation:
Highways ........................................................................................ 16,177 18,419 19,200 19,644 20,498 20,036 23,057 25,320Urban mass transportation 2 ......................................................... 3,078 2,563 3,581 3,723 4,079 3,945 3,860 3,985Airports ........................................................................................... 1,931 1,620 1,826 1,655 1,489 1,511 1,670 1,750Other ............................................................................................... * 1 1 1 .................... .................... .................... ....................
Total transportation .................................................................... 21,187 22,603 24,608 25,023 26,066 25,492 28,587 31,055
Community and regional development:Block grants .................................................................................... 3,198 3,651 4,333 4,545 4,517 4,621 4,965 4,856Other ............................................................................................... 526 811 989 1,183 1,235 1,068 1,333 1,296
Total community and regional development ............................. 3,724 4,462 5,322 5,728 5,752 5,689 6,298 6,152
Natural resources and environment:Pollution control facilities ............................................................... 2,358 2,219 2,671 2,368 2,319 2,084 2,188 2,558Other ............................................................................................... 816 877 999 929 985 832 992 986
Total natural resources and environment ................................. 3,174 3,096 3,670 3,297 3,304 2,916 3,180 3,544
Other nondefense:Education, training, employment, and social services .................. –44 76 40 143 73 38 53 47Housing assistance ........................................................................ 2,929 4,855 5,762 6,007 6,015 6,388 6,475 7,237Other ............................................................................................... 140 167 170 141 275 577 333 373
Total other nondefense ............................................................. 3,025 5,097 5,972 6,291 6,363 7,003 6,861 7,657
Total, nondefense .................................................................... 31,110 35,258 39,572 40,339 41,485 41,100 44,926 48,408
National defense 1 ................................................................................ 60 15 7 16 .................... 5 3 ....................
Total ........................................................................................................ 31,170 35,274 39,579 40,355 41,485 41,105 44,929 48,408
* $500 thousand or less.1 National Guard shelters and civil defense.2 Includes relatively small amounts for railroads.Note: Grants for 1940 totaled $442 million, composed of $165 million for highways and $277 million for public works.
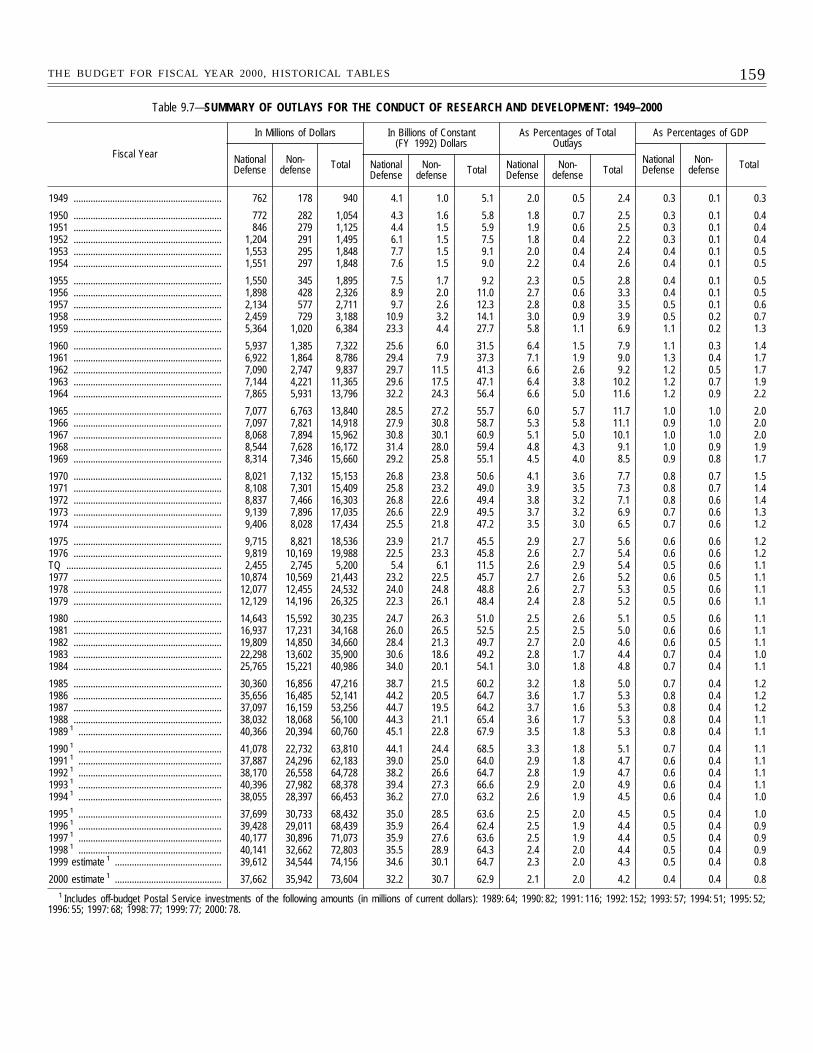
159THE BUDGET FOR FISCAL YEAR 2000, HISTORICAL TABLES
Table 9.7—SUMMARY OF OUTLAYS FOR THE CONDUCT OF RESEARCH AND DEVELOPMENT: 1949–2000
Fiscal Year
In Millions of Dollars In Billions of Constant(FY 1992) Dollars
As Percentages of TotalOutlays
As Percentages of GDP
NationalDefense
Non-defense Total National
DefenseNon-
defense Total NationalDefense
Non-defense Total
NationalDefense
Non-defense Total
1949 ............................................................. 762 178 940 4.1 1.0 5.1 2.0 0.5 2.4 0.3 0.1 0.3
1950 ............................................................. 772 282 1,054 4.3 1.6 5.8 1.8 0.7 2.5 0.3 0.1 0.41951 ............................................................. 846 279 1,125 4.4 1.5 5.9 1.9 0.6 2.5 0.3 0.1 0.41952 ............................................................. 1,204 291 1,495 6.1 1.5 7.5 1.8 0.4 2.2 0.3 0.1 0.41953 ............................................................. 1,553 295 1,848 7.7 1.5 9.1 2.0 0.4 2.4 0.4 0.1 0.51954 ............................................................. 1,551 297 1,848 7.6 1.5 9.0 2.2 0.4 2.6 0.4 0.1 0.5
1955 ............................................................. 1,550 345 1,895 7.5 1.7 9.2 2.3 0.5 2.8 0.4 0.1 0.51956 ............................................................. 1,898 428 2,326 8.9 2.0 11.0 2.7 0.6 3.3 0.4 0.1 0.51957 ............................................................. 2,134 577 2,711 9.7 2.6 12.3 2.8 0.8 3.5 0.5 0.1 0.61958 ............................................................. 2,459 729 3,188 10.9 3.2 14.1 3.0 0.9 3.9 0.5 0.2 0.71959 ............................................................. 5,364 1,020 6,384 23.3 4.4 27.7 5.8 1.1 6.9 1.1 0.2 1.3
1960 ............................................................. 5,937 1,385 7,322 25.6 6.0 31.5 6.4 1.5 7.9 1.1 0.3 1.41961 ............................................................. 6,922 1,864 8,786 29.4 7.9 37.3 7.1 1.9 9.0 1.3 0.4 1.71962 ............................................................. 7,090 2,747 9,837 29.7 11.5 41.3 6.6 2.6 9.2 1.2 0.5 1.71963 ............................................................. 7,144 4,221 11,365 29.6 17.5 47.1 6.4 3.8 10.2 1.2 0.7 1.91964 ............................................................. 7,865 5,931 13,796 32.2 24.3 56.4 6.6 5.0 11.6 1.2 0.9 2.2
1965 ............................................................. 7,077 6,763 13,840 28.5 27.2 55.7 6.0 5.7 11.7 1.0 1.0 2.01966 ............................................................. 7,097 7,821 14,918 27.9 30.8 58.7 5.3 5.8 11.1 0.9 1.0 2.01967 ............................................................. 8,068 7,894 15,962 30.8 30.1 60.9 5.1 5.0 10.1 1.0 1.0 2.01968 ............................................................. 8,544 7,628 16,172 31.4 28.0 59.4 4.8 4.3 9.1 1.0 0.9 1.91969 ............................................................. 8,314 7,346 15,660 29.2 25.8 55.1 4.5 4.0 8.5 0.9 0.8 1.7
1970 ............................................................. 8,021 7,132 15,153 26.8 23.8 50.6 4.1 3.6 7.7 0.8 0.7 1.51971 ............................................................. 8,108 7,301 15,409 25.8 23.2 49.0 3.9 3.5 7.3 0.8 0.7 1.41972 ............................................................. 8,837 7,466 16,303 26.8 22.6 49.4 3.8 3.2 7.1 0.8 0.6 1.41973 ............................................................. 9,139 7,896 17,035 26.6 22.9 49.5 3.7 3.2 6.9 0.7 0.6 1.31974 ............................................................. 9,406 8,028 17,434 25.5 21.8 47.2 3.5 3.0 6.5 0.7 0.6 1.2
1975 ............................................................. 9,715 8,821 18,536 23.9 21.7 45.5 2.9 2.7 5.6 0.6 0.6 1.21976 ............................................................. 9,819 10,169 19,988 22.5 23.3 45.8 2.6 2.7 5.4 0.6 0.6 1.2TQ ................................................................ 2,455 2,745 5,200 5.4 6.1 11.5 2.6 2.9 5.4 0.5 0.6 1.11977 ............................................................. 10,874 10,569 21,443 23.2 22.5 45.7 2.7 2.6 5.2 0.6 0.5 1.11978 ............................................................. 12,077 12,455 24,532 24.0 24.8 48.8 2.6 2.7 5.3 0.5 0.6 1.11979 ............................................................. 12,129 14,196 26,325 22.3 26.1 48.4 2.4 2.8 5.2 0.5 0.6 1.1
1980 ............................................................. 14,643 15,592 30,235 24.7 26.3 51.0 2.5 2.6 5.1 0.5 0.6 1.11981 ............................................................. 16,937 17,231 34,168 26.0 26.5 52.5 2.5 2.5 5.0 0.6 0.6 1.11982 ............................................................. 19,809 14,850 34,660 28.4 21.3 49.7 2.7 2.0 4.6 0.6 0.5 1.11983 ............................................................. 22,298 13,602 35,900 30.6 18.6 49.2 2.8 1.7 4.4 0.7 0.4 1.01984 ............................................................. 25,765 15,221 40,986 34.0 20.1 54.1 3.0 1.8 4.8 0.7 0.4 1.1
1985 ............................................................. 30,360 16,856 47,216 38.7 21.5 60.2 3.2 1.8 5.0 0.7 0.4 1.21986 ............................................................. 35,656 16,485 52,141 44.2 20.5 64.7 3.6 1.7 5.3 0.8 0.4 1.21987 ............................................................. 37,097 16,159 53,256 44.7 19.5 64.2 3.7 1.6 5.3 0.8 0.4 1.21988 ............................................................. 38,032 18,068 56,100 44.3 21.1 65.4 3.6 1.7 5.3 0.8 0.4 1.11989 1 ........................................................... 40,366 20,394 60,760 45.1 22.8 67.9 3.5 1.8 5.3 0.8 0.4 1.1
1990 1 ........................................................... 41,078 22,732 63,810 44.1 24.4 68.5 3.3 1.8 5.1 0.7 0.4 1.11991 1 ........................................................... 37,887 24,296 62,183 39.0 25.0 64.0 2.9 1.8 4.7 0.6 0.4 1.11992 1 ........................................................... 38,170 26,558 64,728 38.2 26.6 64.7 2.8 1.9 4.7 0.6 0.4 1.11993 1 ........................................................... 40,396 27,982 68,378 39.4 27.3 66.6 2.9 2.0 4.9 0.6 0.4 1.11994 1 ........................................................... 38,055 28,397 66,453 36.2 27.0 63.2 2.6 1.9 4.5 0.6 0.4 1.0
1995 1 ........................................................... 37,699 30,733 68,432 35.0 28.5 63.6 2.5 2.0 4.5 0.5 0.4 1.01996 1 ........................................................... 39,428 29,011 68,439 35.9 26.4 62.4 2.5 1.9 4.4 0.5 0.4 0.91997 1 ........................................................... 40,177 30,896 71,073 35.9 27.6 63.6 2.5 1.9 4.4 0.5 0.4 0.91998 1 ........................................................... 40,141 32,662 72,803 35.5 28.9 64.3 2.4 2.0 4.4 0.5 0.4 0.91999 estimate 1 ............................................ 39,612 34,544 74,156 34.6 30.1 64.7 2.3 2.0 4.3 0.5 0.4 0.8
2000 estimate 1 ............................................ 37,662 35,942 73,604 32.2 30.7 62.9 2.1 2.0 4.2 0.4 0.4 0.81 Includes off-budget Postal Service investments of the following amounts (in millions of current dollars): 1989: 64; 1990: 82; 1991: 116; 1992: 152; 1993: 57; 1994: 51; 1995: 52;
1996: 55; 1997: 68; 1998: 77; 1999: 77; 2000: 78.
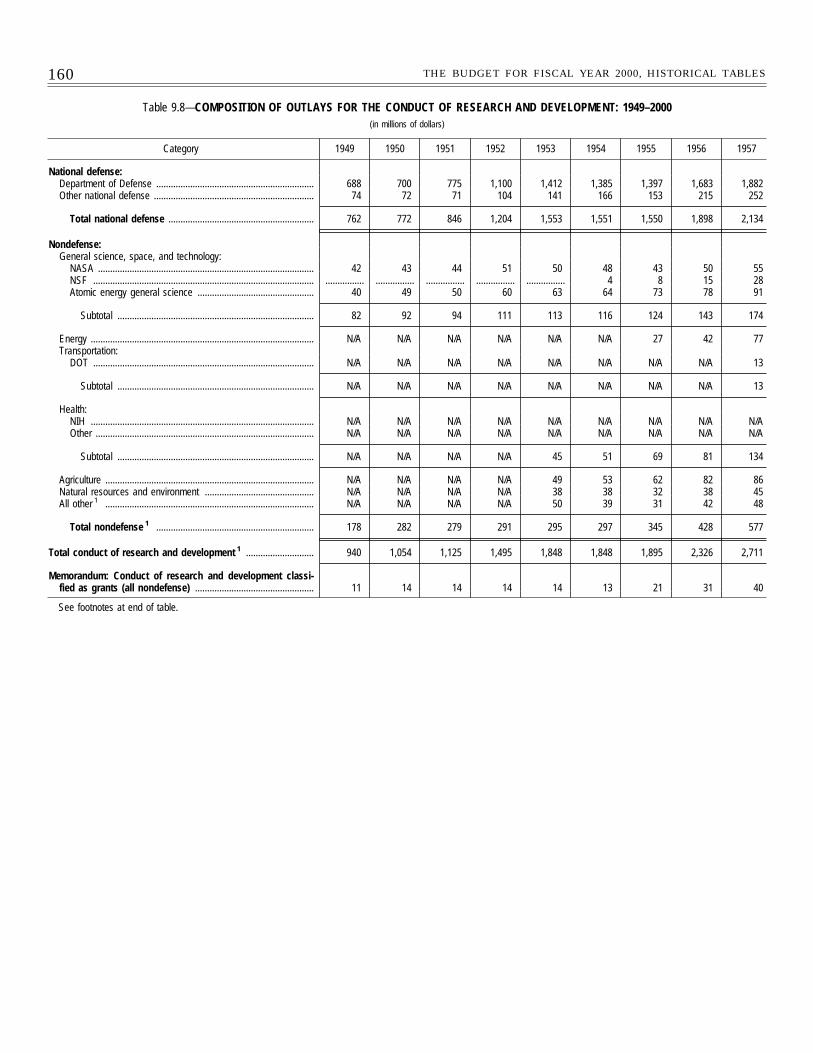
160 THE BUDGET FOR FISCAL YEAR 2000, HISTORICAL TABLES
Table 9.8—COMPOSITION OF OUTLAYS FOR THE CONDUCT OF RESEARCH AND DEVELOPMENT: 1949–2000(in millions of dollars)
Category 1949 1950 1951 1952 1953 1954 1955 1956 1957
National defense:Department of Defense ................................................................. 688 700 775 1,100 1,412 1,385 1,397 1,683 1,882Other national defense .................................................................. 74 72 71 104 141 166 153 215 252
Total national defense ............................................................ 762 772 846 1,204 1,553 1,551 1,550 1,898 2,134
Nondefense:General science, space, and technology:
NASA ......................................................................................... 42 43 44 51 50 48 43 50 55NSF ........................................................................................... ................ ................ ................ ................ ................ 4 8 15 28Atomic energy general science ................................................ 40 49 50 60 63 64 73 78 91
Subtotal ................................................................................. 82 92 94 111 113 116 124 143 174
Energy ............................................................................................ N/A N/A N/A N/A N/A N/A 27 42 77Transportation:
DOT ........................................................................................... N/A N/A N/A N/A N/A N/A N/A N/A 13
Subtotal ................................................................................. N/A N/A N/A N/A N/A N/A N/A N/A 13
Health:NIH ............................................................................................ N/A N/A N/A N/A N/A N/A N/A N/A N/AOther .......................................................................................... N/A N/A N/A N/A N/A N/A N/A N/A N/A
Subtotal ................................................................................. N/A N/A N/A N/A 45 51 69 81 134
Agriculture ...................................................................................... N/A N/A N/A N/A 49 53 62 82 86Natural resources and environment ............................................. N/A N/A N/A N/A 38 38 32 38 45All other 1 ...................................................................................... N/A N/A N/A N/A 50 39 31 42 48
Total nondefense 1 ................................................................. 178 282 279 291 295 297 345 428 577
Total conduct of research and development 1 ............................ 940 1,054 1,125 1,495 1,848 1,848 1,895 2,326 2,711
Memorandum: Conduct of research and development classi-fied as grants (all nondefense) ................................................. 11 14 14 14 14 13 21 31 40
See footnotes at end of table.
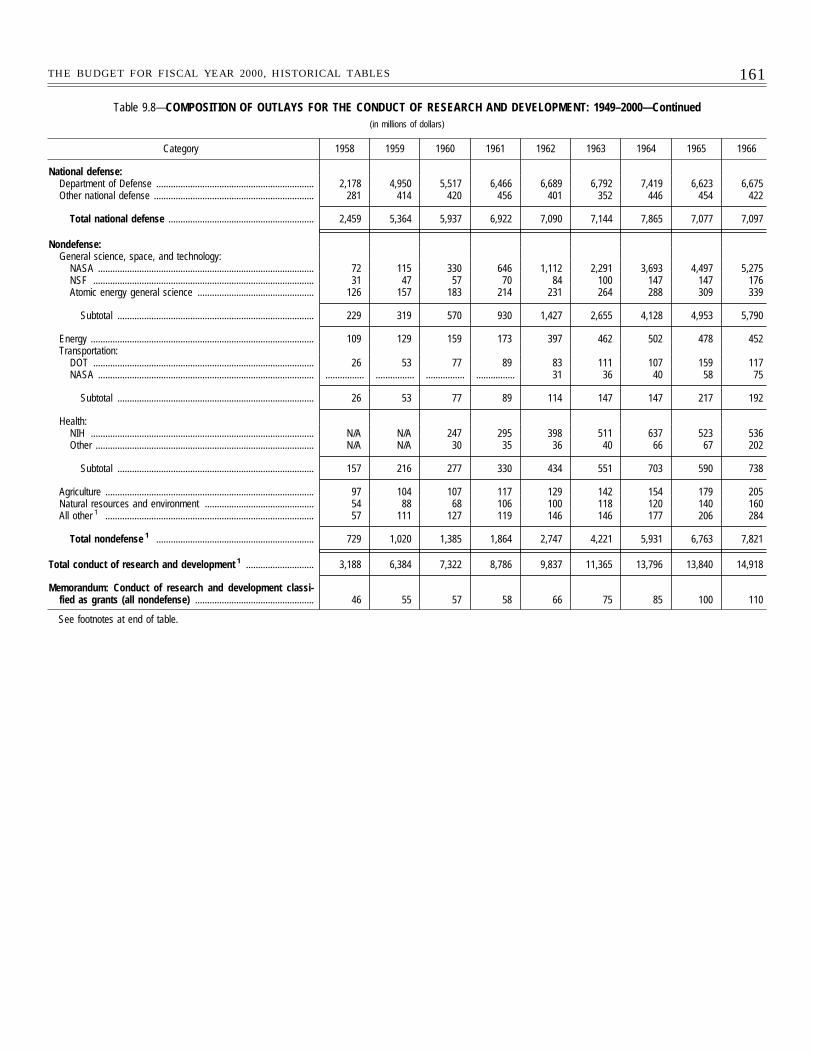
161THE BUDGET FOR FISCAL YEAR 2000, HISTORICAL TABLES
Table 9.8—COMPOSITION OF OUTLAYS FOR THE CONDUCT OF RESEARCH AND DEVELOPMENT: 1949–2000—Continued(in millions of dollars)
Category 1958 1959 1960 1961 1962 1963 1964 1965 1966
National defense:Department of Defense ................................................................. 2,178 4,950 5,517 6,466 6,689 6,792 7,419 6,623 6,675Other national defense .................................................................. 281 414 420 456 401 352 446 454 422
Total national defense ............................................................ 2,459 5,364 5,937 6,922 7,090 7,144 7,865 7,077 7,097
Nondefense:General science, space, and technology:
NASA ......................................................................................... 72 115 330 646 1,112 2,291 3,693 4,497 5,275NSF ........................................................................................... 31 47 57 70 84 100 147 147 176Atomic energy general science ................................................ 126 157 183 214 231 264 288 309 339
Subtotal ................................................................................. 229 319 570 930 1,427 2,655 4,128 4,953 5,790
Energy ............................................................................................ 109 129 159 173 397 462 502 478 452Transportation:
DOT ........................................................................................... 26 53 77 89 83 111 107 159 117NASA ......................................................................................... ................ ................ ................ ................ 31 36 40 58 75
Subtotal ................................................................................. 26 53 77 89 114 147 147 217 192
Health:NIH ............................................................................................ N/A N/A 247 295 398 511 637 523 536Other .......................................................................................... N/A N/A 30 35 36 40 66 67 202
Subtotal ................................................................................. 157 216 277 330 434 551 703 590 738
Agriculture ...................................................................................... 97 104 107 117 129 142 154 179 205Natural resources and environment ............................................. 54 88 68 106 100 118 120 140 160All other 1 ...................................................................................... 57 111 127 119 146 146 177 206 284
Total nondefense 1 ................................................................. 729 1,020 1,385 1,864 2,747 4,221 5,931 6,763 7,821
Total conduct of research and development 1 ............................ 3,188 6,384 7,322 8,786 9,837 11,365 13,796 13,840 14,918
Memorandum: Conduct of research and development classi-fied as grants (all nondefense) ................................................. 46 55 57 58 66 75 85 100 110
See footnotes at end of table.
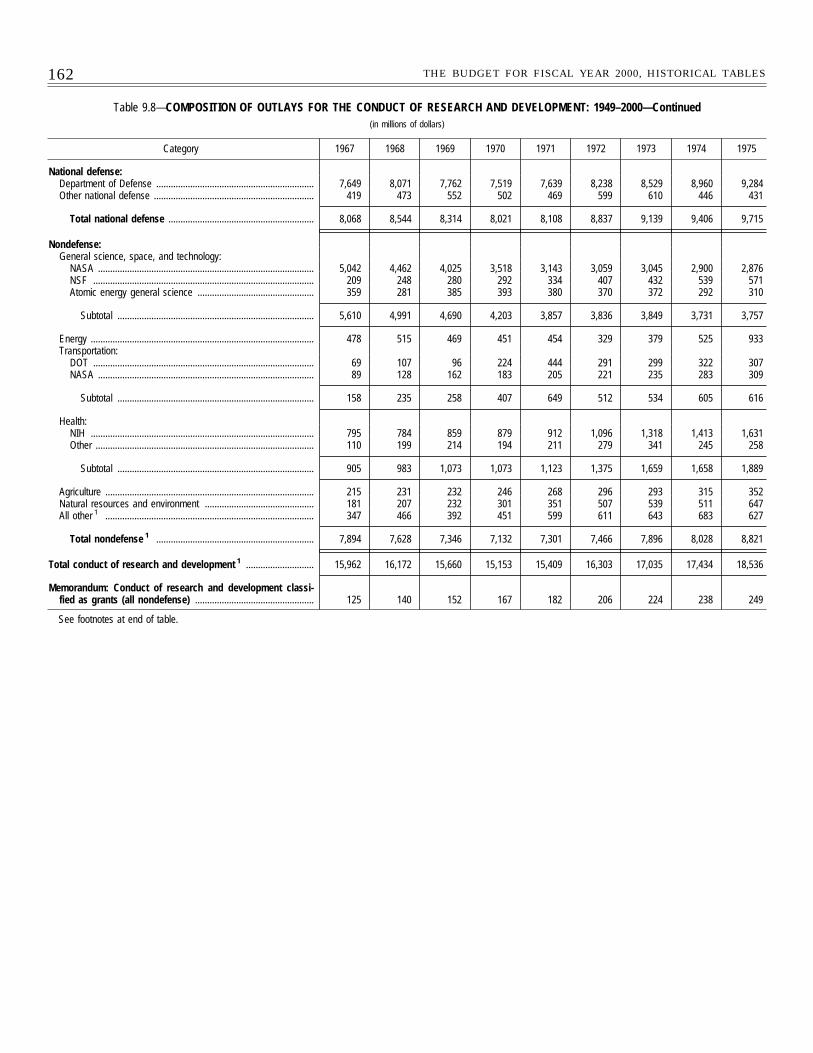
162 THE BUDGET FOR FISCAL YEAR 2000, HISTORICAL TABLES
Table 9.8—COMPOSITION OF OUTLAYS FOR THE CONDUCT OF RESEARCH AND DEVELOPMENT: 1949–2000—Continued(in millions of dollars)
Category 1967 1968 1969 1970 1971 1972 1973 1974 1975
National defense:Department of Defense ................................................................. 7,649 8,071 7,762 7,519 7,639 8,238 8,529 8,960 9,284Other national defense .................................................................. 419 473 552 502 469 599 610 446 431
Total national defense ............................................................ 8,068 8,544 8,314 8,021 8,108 8,837 9,139 9,406 9,715
Nondefense:General science, space, and technology:
NASA ......................................................................................... 5,042 4,462 4,025 3,518 3,143 3,059 3,045 2,900 2,876NSF ........................................................................................... 209 248 280 292 334 407 432 539 571Atomic energy general science ................................................ 359 281 385 393 380 370 372 292 310
Subtotal ................................................................................. 5,610 4,991 4,690 4,203 3,857 3,836 3,849 3,731 3,757
Energy ............................................................................................ 478 515 469 451 454 329 379 525 933Transportation:
DOT ........................................................................................... 69 107 96 224 444 291 299 322 307NASA ......................................................................................... 89 128 162 183 205 221 235 283 309
Subtotal ................................................................................. 158 235 258 407 649 512 534 605 616
Health:NIH ............................................................................................ 795 784 859 879 912 1,096 1,318 1,413 1,631Other .......................................................................................... 110 199 214 194 211 279 341 245 258
Subtotal ................................................................................. 905 983 1,073 1,073 1,123 1,375 1,659 1,658 1,889
Agriculture ...................................................................................... 215 231 232 246 268 296 293 315 352Natural resources and environment ............................................. 181 207 232 301 351 507 539 511 647All other 1 ...................................................................................... 347 466 392 451 599 611 643 683 627
Total nondefense 1 ................................................................. 7,894 7,628 7,346 7,132 7,301 7,466 7,896 8,028 8,821
Total conduct of research and development 1 ............................ 15,962 16,172 15,660 15,153 15,409 16,303 17,035 17,434 18,536
Memorandum: Conduct of research and development classi-fied as grants (all nondefense) ................................................. 125 140 152 167 182 206 224 238 249
See footnotes at end of table.
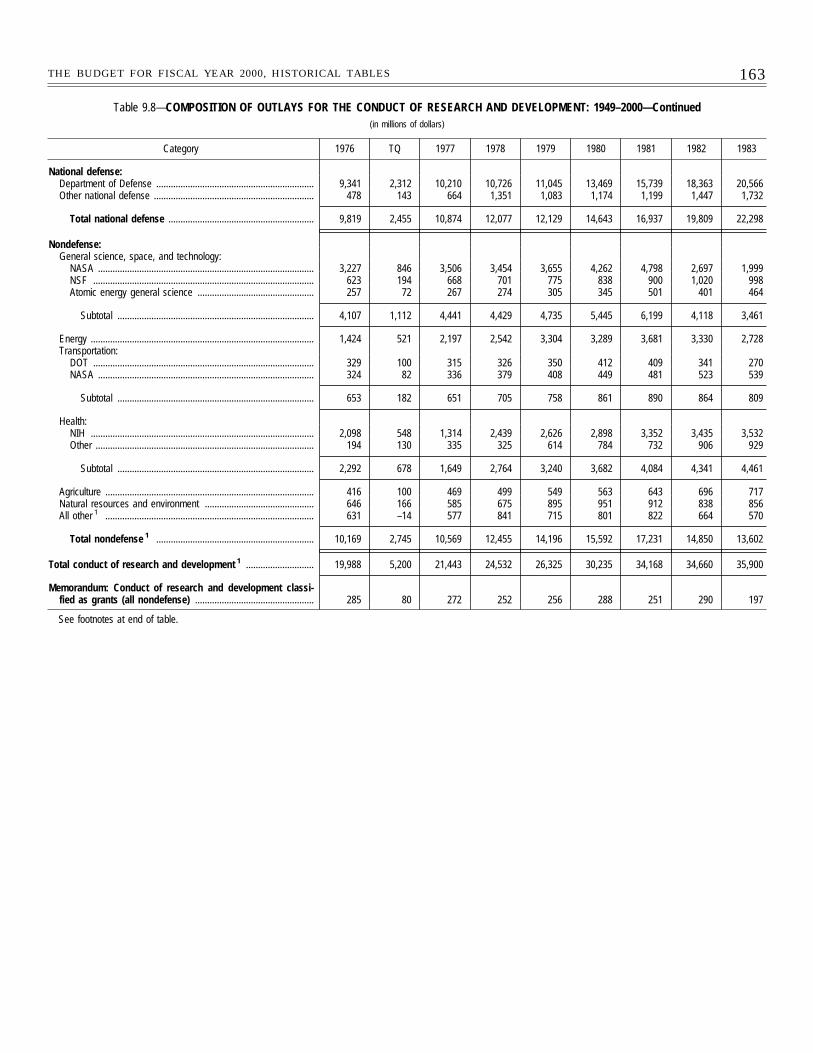
163THE BUDGET FOR FISCAL YEAR 2000, HISTORICAL TABLES
Table 9.8—COMPOSITION OF OUTLAYS FOR THE CONDUCT OF RESEARCH AND DEVELOPMENT: 1949–2000—Continued(in millions of dollars)
Category 1976 TQ 1977 1978 1979 1980 1981 1982 1983
National defense:Department of Defense ................................................................. 9,341 2,312 10,210 10,726 11,045 13,469 15,739 18,363 20,566Other national defense .................................................................. 478 143 664 1,351 1,083 1,174 1,199 1,447 1,732
Total national defense ............................................................ 9,819 2,455 10,874 12,077 12,129 14,643 16,937 19,809 22,298
Nondefense:General science, space, and technology:
NASA ......................................................................................... 3,227 846 3,506 3,454 3,655 4,262 4,798 2,697 1,999NSF ........................................................................................... 623 194 668 701 775 838 900 1,020 998Atomic energy general science ................................................ 257 72 267 274 305 345 501 401 464
Subtotal ................................................................................. 4,107 1,112 4,441 4,429 4,735 5,445 6,199 4,118 3,461
Energy ............................................................................................ 1,424 521 2,197 2,542 3,304 3,289 3,681 3,330 2,728Transportation:
DOT ........................................................................................... 329 100 315 326 350 412 409 341 270NASA ......................................................................................... 324 82 336 379 408 449 481 523 539
Subtotal ................................................................................. 653 182 651 705 758 861 890 864 809
Health:NIH ............................................................................................ 2,098 548 1,314 2,439 2,626 2,898 3,352 3,435 3,532Other .......................................................................................... 194 130 335 325 614 784 732 906 929
Subtotal ................................................................................. 2,292 678 1,649 2,764 3,240 3,682 4,084 4,341 4,461
Agriculture ...................................................................................... 416 100 469 499 549 563 643 696 717Natural resources and environment ............................................. 646 166 585 675 895 951 912 838 856All other 1 ...................................................................................... 631 –14 577 841 715 801 822 664 570
Total nondefense 1 ................................................................. 10,169 2,745 10,569 12,455 14,196 15,592 17,231 14,850 13,602
Total conduct of research and development 1 ............................ 19,988 5,200 21,443 24,532 26,325 30,235 34,168 34,660 35,900
Memorandum: Conduct of research and development classi-fied as grants (all nondefense) ................................................. 285 80 272 252 256 288 251 290 197
See footnotes at end of table.
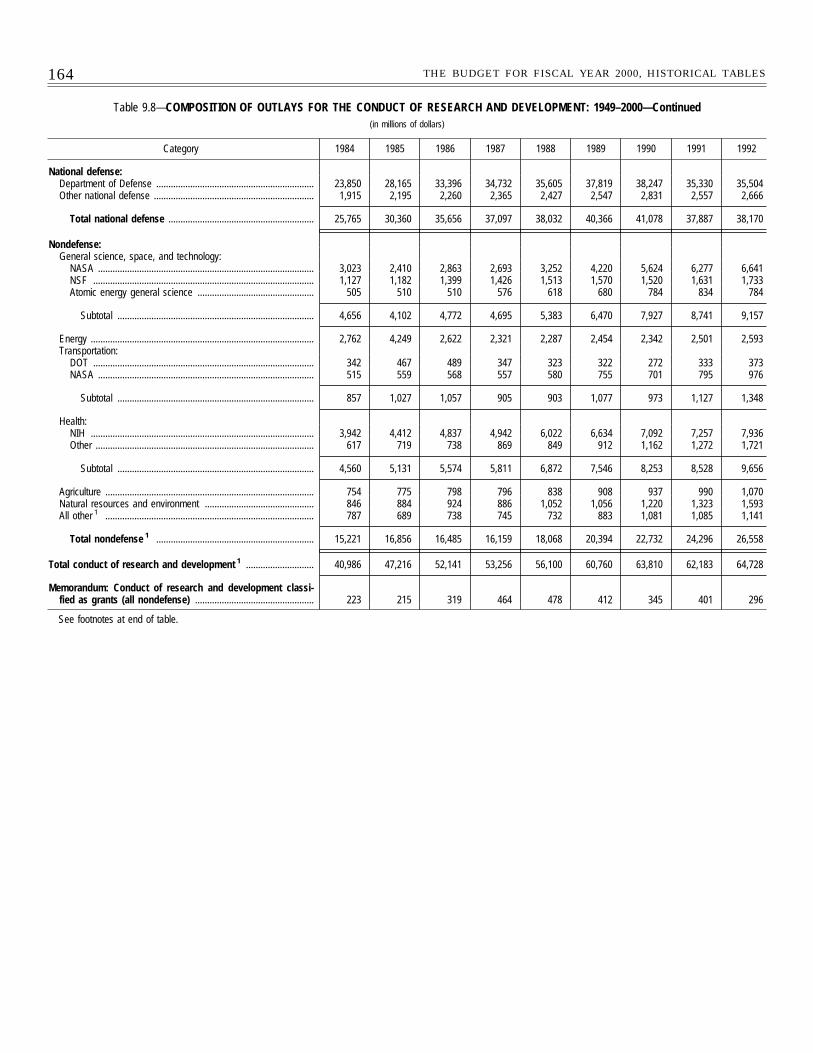
164 THE BUDGET FOR FISCAL YEAR 2000, HISTORICAL TABLES
Table 9.8—COMPOSITION OF OUTLAYS FOR THE CONDUCT OF RESEARCH AND DEVELOPMENT: 1949–2000—Continued(in millions of dollars)
Category 1984 1985 1986 1987 1988 1989 1990 1991 1992
National defense:Department of Defense ................................................................. 23,850 28,165 33,396 34,732 35,605 37,819 38,247 35,330 35,504Other national defense .................................................................. 1,915 2,195 2,260 2,365 2,427 2,547 2,831 2,557 2,666
Total national defense ............................................................ 25,765 30,360 35,656 37,097 38,032 40,366 41,078 37,887 38,170
Nondefense:General science, space, and technology:
NASA ......................................................................................... 3,023 2,410 2,863 2,693 3,252 4,220 5,624 6,277 6,641NSF ........................................................................................... 1,127 1,182 1,399 1,426 1,513 1,570 1,520 1,631 1,733Atomic energy general science ................................................ 505 510 510 576 618 680 784 834 784
Subtotal ................................................................................. 4,656 4,102 4,772 4,695 5,383 6,470 7,927 8,741 9,157
Energy ............................................................................................ 2,762 4,249 2,622 2,321 2,287 2,454 2,342 2,501 2,593Transportation:
DOT ........................................................................................... 342 467 489 347 323 322 272 333 373NASA ......................................................................................... 515 559 568 557 580 755 701 795 976
Subtotal ................................................................................. 857 1,027 1,057 905 903 1,077 973 1,127 1,348
Health:NIH ............................................................................................ 3,942 4,412 4,837 4,942 6,022 6,634 7,092 7,257 7,936Other .......................................................................................... 617 719 738 869 849 912 1,162 1,272 1,721
Subtotal ................................................................................. 4,560 5,131 5,574 5,811 6,872 7,546 8,253 8,528 9,656
Agriculture ...................................................................................... 754 775 798 796 838 908 937 990 1,070Natural resources and environment ............................................. 846 884 924 886 1,052 1,056 1,220 1,323 1,593All other 1 ...................................................................................... 787 689 738 745 732 883 1,081 1,085 1,141
Total nondefense 1 ................................................................. 15,221 16,856 16,485 16,159 18,068 20,394 22,732 24,296 26,558
Total conduct of research and development 1 ............................ 40,986 47,216 52,141 53,256 56,100 60,760 63,810 62,183 64,728
Memorandum: Conduct of research and development classi-fied as grants (all nondefense) ................................................. 223 215 319 464 478 412 345 401 296
See footnotes at end of table.
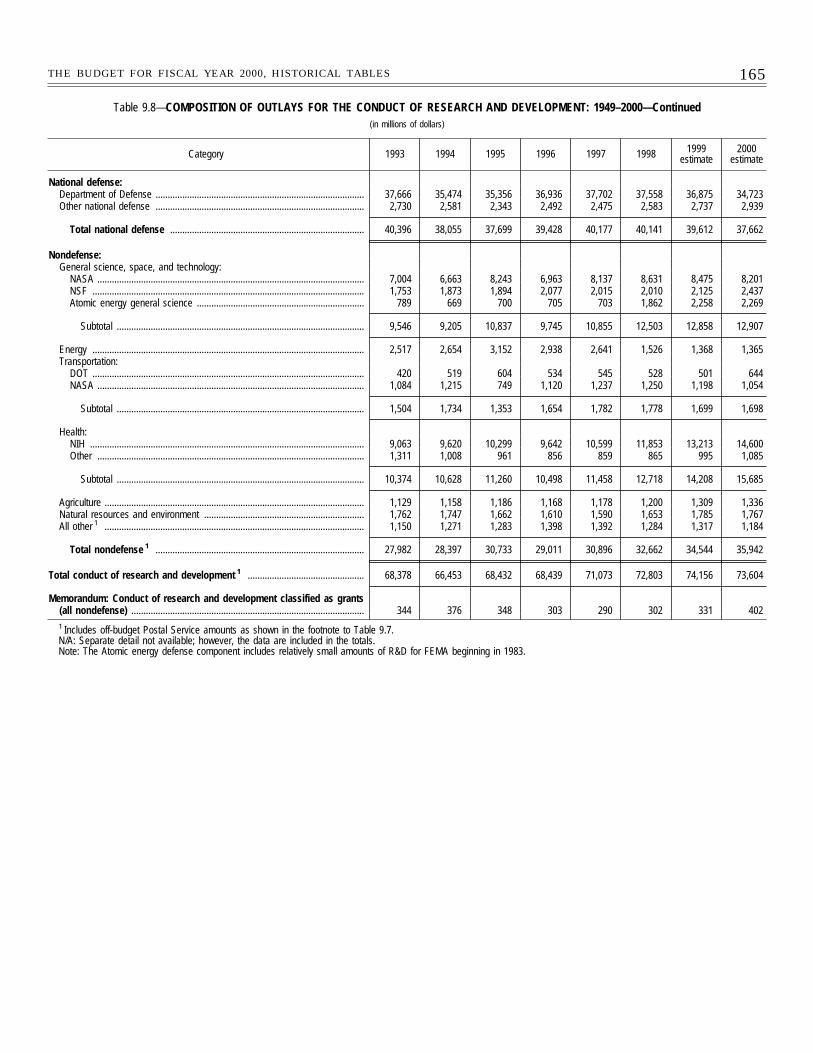
165THE BUDGET FOR FISCAL YEAR 2000, HISTORICAL TABLES
Table 9.8—COMPOSITION OF OUTLAYS FOR THE CONDUCT OF RESEARCH AND DEVELOPMENT: 1949–2000—Continued(in millions of dollars)
Category 1993 1994 1995 1996 1997 1998 1999estimate
2000estimate
National defense:Department of Defense ...................................................................................... 37,666 35,474 35,356 36,936 37,702 37,558 36,875 34,723Other national defense ...................................................................................... 2,730 2,581 2,343 2,492 2,475 2,583 2,737 2,939
Total national defense ................................................................................ 40,396 38,055 37,699 39,428 40,177 40,141 39,612 37,662
Nondefense:General science, space, and technology:
NASA .............................................................................................................. 7,004 6,663 8,243 6,963 8,137 8,631 8,475 8,201NSF ................................................................................................................ 1,753 1,873 1,894 2,077 2,015 2,010 2,125 2,437Atomic energy general science ..................................................................... 789 669 700 705 703 1,862 2,258 2,269
Subtotal ...................................................................................................... 9,546 9,205 10,837 9,745 10,855 12,503 12,858 12,907
Energy ................................................................................................................ 2,517 2,654 3,152 2,938 2,641 1,526 1,368 1,365Transportation:
DOT ................................................................................................................ 420 519 604 534 545 528 501 644NASA .............................................................................................................. 1,084 1,215 749 1,120 1,237 1,250 1,198 1,054
Subtotal ...................................................................................................... 1,504 1,734 1,353 1,654 1,782 1,778 1,699 1,698
Health:NIH ................................................................................................................. 9,063 9,620 10,299 9,642 10,599 11,853 13,213 14,600Other .............................................................................................................. 1,311 1,008 961 856 859 865 995 1,085
Subtotal ...................................................................................................... 10,374 10,628 11,260 10,498 11,458 12,718 14,208 15,685
Agriculture ........................................................................................................... 1,129 1,158 1,186 1,168 1,178 1,200 1,309 1,336Natural resources and environment .................................................................. 1,762 1,747 1,662 1,610 1,590 1,653 1,785 1,767All other 1 ........................................................................................................... 1,150 1,271 1,283 1,398 1,392 1,284 1,317 1,184
Total nondefense 1 ...................................................................................... 27,982 28,397 30,733 29,011 30,896 32,662 34,544 35,942
Total conduct of research and development 1 ................................................ 68,378 66,453 68,432 68,439 71,073 72,803 74,156 73,604
Memorandum: Conduct of research and development classified as grants(all nondefense) ................................................................................................ 344 376 348 303 290 302 331 4021 Includes off-budget Postal Service amounts as shown in the footnote to Table 9.7.N/A: Separate detail not available; however, the data are included in the totals.Note: The Atomic energy defense component includes relatively small amounts of R&D for FEMA beginning in 1983.
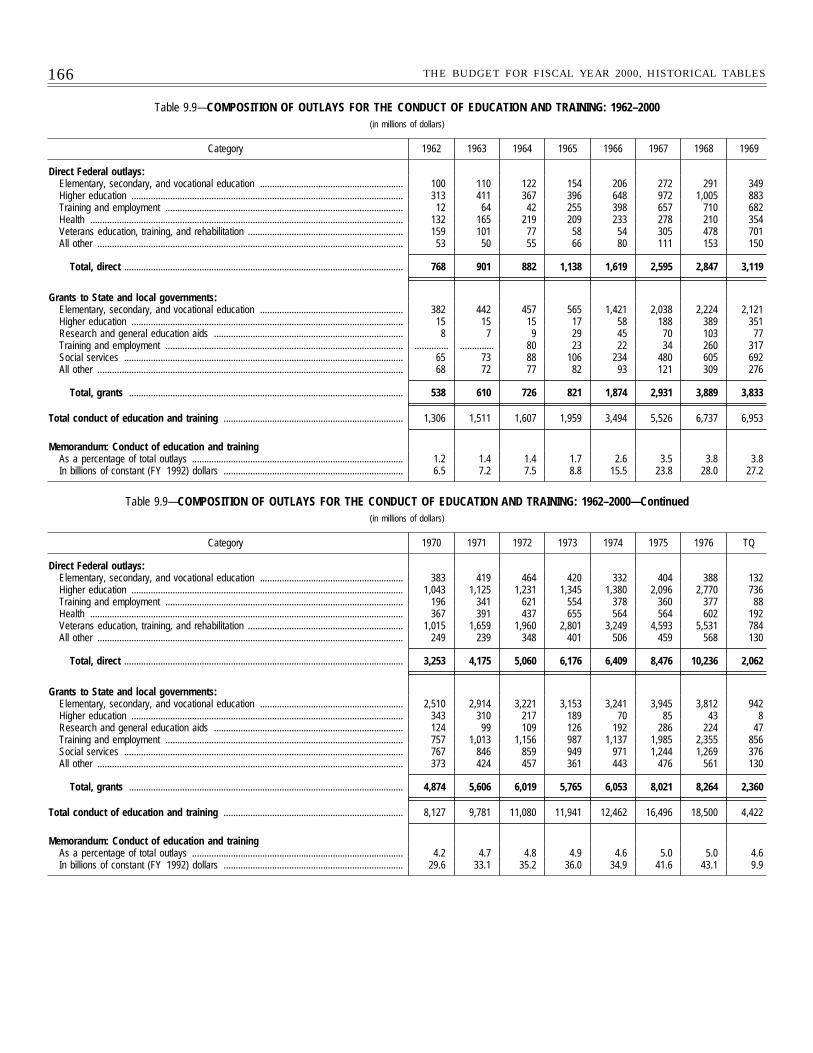
166 THE BUDGET FOR FISCAL YEAR 2000, HISTORICAL TABLES
Table 9.9—COMPOSITION OF OUTLAYS FOR THE CONDUCT OF EDUCATION AND TRAINING: 1962–2000(in millions of dollars)
Category 1962 1963 1964 1965 1966 1967 1968 1969
Direct Federal outlays:Elementary, secondary, and vocational education ........................................................... 100 110 122 154 206 272 291 349Higher education ................................................................................................................ 313 411 367 396 648 972 1,005 883Training and employment .................................................................................................. 12 64 42 255 398 657 710 682Health ................................................................................................................................. 132 165 219 209 233 278 210 354Veterans education, training, and rehabilitation ................................................................ 159 101 77 58 54 305 478 701All other .............................................................................................................................. 53 50 55 66 80 111 153 150
Total, direct ................................................................................................................... 768 901 882 1,138 1,619 2,595 2,847 3,119
Grants to State and local governments:Elementary, secondary, and vocational education ........................................................... 382 442 457 565 1,421 2,038 2,224 2,121Higher education ................................................................................................................ 15 15 15 17 58 188 389 351Research and general education aids .............................................................................. 8 7 9 29 45 70 103 77Training and employment .................................................................................................. .............. .............. 80 23 22 34 260 317Social services ................................................................................................................... 65 73 88 106 234 480 605 692All other .............................................................................................................................. 68 72 77 82 93 121 309 276
Total, grants ................................................................................................................. 538 610 726 821 1,874 2,931 3,889 3,833
Total conduct of education and training .......................................................................... 1,306 1,511 1,607 1,959 3,494 5,526 6,737 6,953
Memorandum: Conduct of education and trainingAs a percentage of total outlays ....................................................................................... 1.2 1.4 1.4 1.7 2.6 3.5 3.8 3.8In billions of constant (FY 1992) dollars .......................................................................... 6.5 7.2 7.5 8.8 15.5 23.8 28.0 27.2
Table 9.9—COMPOSITION OF OUTLAYS FOR THE CONDUCT OF EDUCATION AND TRAINING: 1962–2000—Continued(in millions of dollars)
Category 1970 1971 1972 1973 1974 1975 1976 TQ
Direct Federal outlays:Elementary, secondary, and vocational education ........................................................... 383 419 464 420 332 404 388 132Higher education ................................................................................................................ 1,043 1,125 1,231 1,345 1,380 2,096 2,770 736Training and employment .................................................................................................. 196 341 621 554 378 360 377 88Health ................................................................................................................................. 367 391 437 655 564 564 602 192Veterans education, training, and rehabilitation ................................................................ 1,015 1,659 1,960 2,801 3,249 4,593 5,531 784All other .............................................................................................................................. 249 239 348 401 506 459 568 130
Total, direct ................................................................................................................... 3,253 4,175 5,060 6,176 6,409 8,476 10,236 2,062
Grants to State and local governments:Elementary, secondary, and vocational education ........................................................... 2,510 2,914 3,221 3,153 3,241 3,945 3,812 942Higher education ................................................................................................................ 343 310 217 189 70 85 43 8Research and general education aids .............................................................................. 124 99 109 126 192 286 224 47Training and employment .................................................................................................. 757 1,013 1,156 987 1,137 1,985 2,355 856Social services ................................................................................................................... 767 846 859 949 971 1,244 1,269 376All other .............................................................................................................................. 373 424 457 361 443 476 561 130
Total, grants ................................................................................................................. 4,874 5,606 6,019 5,765 6,053 8,021 8,264 2,360
Total conduct of education and training .......................................................................... 8,127 9,781 11,080 11,941 12,462 16,496 18,500 4,422
Memorandum: Conduct of education and trainingAs a percentage of total outlays ....................................................................................... 4.2 4.7 4.8 4.9 4.6 5.0 5.0 4.6In billions of constant (FY 1992) dollars .......................................................................... 29.6 33.1 35.2 36.0 34.9 41.6 43.1 9.9
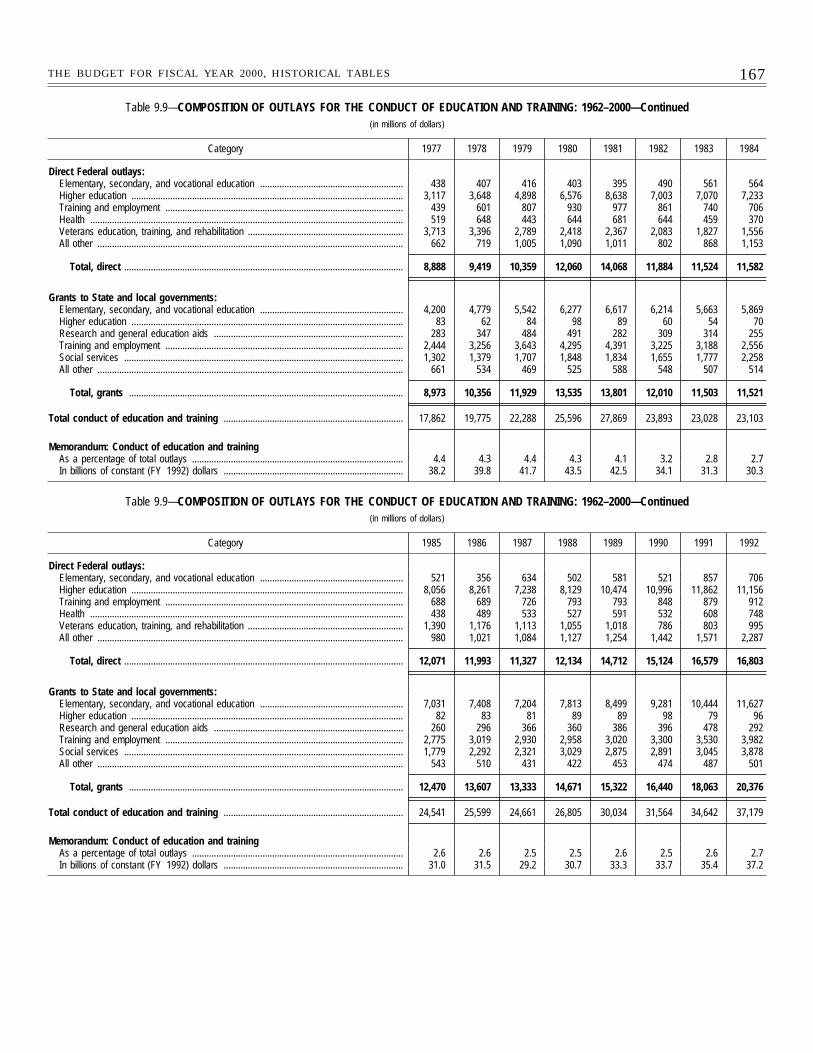
167THE BUDGET FOR FISCAL YEAR 2000, HISTORICAL TABLES
Table 9.9—COMPOSITION OF OUTLAYS FOR THE CONDUCT OF EDUCATION AND TRAINING: 1962–2000—Continued(in millions of dollars)
Category 1977 1978 1979 1980 1981 1982 1983 1984
Direct Federal outlays:Elementary, secondary, and vocational education ........................................................... 438 407 416 403 395 490 561 564Higher education ................................................................................................................ 3,117 3,648 4,898 6,576 8,638 7,003 7,070 7,233Training and employment .................................................................................................. 439 601 807 930 977 861 740 706Health ................................................................................................................................. 519 648 443 644 681 644 459 370Veterans education, training, and rehabilitation ................................................................ 3,713 3,396 2,789 2,418 2,367 2,083 1,827 1,556All other .............................................................................................................................. 662 719 1,005 1,090 1,011 802 868 1,153
Total, direct ................................................................................................................... 8,888 9,419 10,359 12,060 14,068 11,884 11,524 11,582
Grants to State and local governments:Elementary, secondary, and vocational education ........................................................... 4,200 4,779 5,542 6,277 6,617 6,214 5,663 5,869Higher education ................................................................................................................ 83 62 84 98 89 60 54 70Research and general education aids .............................................................................. 283 347 484 491 282 309 314 255Training and employment .................................................................................................. 2,444 3,256 3,643 4,295 4,391 3,225 3,188 2,556Social services ................................................................................................................... 1,302 1,379 1,707 1,848 1,834 1,655 1,777 2,258All other .............................................................................................................................. 661 534 469 525 588 548 507 514
Total, grants ................................................................................................................. 8,973 10,356 11,929 13,535 13,801 12,010 11,503 11,521
Total conduct of education and training .......................................................................... 17,862 19,775 22,288 25,596 27,869 23,893 23,028 23,103
Memorandum: Conduct of education and trainingAs a percentage of total outlays ....................................................................................... 4.4 4.3 4.4 4.3 4.1 3.2 2.8 2.7In billions of constant (FY 1992) dollars .......................................................................... 38.2 39.8 41.7 43.5 42.5 34.1 31.3 30.3
Table 9.9—COMPOSITION OF OUTLAYS FOR THE CONDUCT OF EDUCATION AND TRAINING: 1962–2000—Continued(in millions of dollars)
Category 1985 1986 1987 1988 1989 1990 1991 1992
Direct Federal outlays:Elementary, secondary, and vocational education ........................................................... 521 356 634 502 581 521 857 706Higher education ................................................................................................................ 8,056 8,261 7,238 8,129 10,474 10,996 11,862 11,156Training and employment .................................................................................................. 688 689 726 793 793 848 879 912Health ................................................................................................................................. 438 489 533 527 591 532 608 748Veterans education, training, and rehabilitation ................................................................ 1,390 1,176 1,113 1,055 1,018 786 803 995All other .............................................................................................................................. 980 1,021 1,084 1,127 1,254 1,442 1,571 2,287
Total, direct ................................................................................................................... 12,071 11,993 11,327 12,134 14,712 15,124 16,579 16,803
Grants to State and local governments:Elementary, secondary, and vocational education ........................................................... 7,031 7,408 7,204 7,813 8,499 9,281 10,444 11,627Higher education ................................................................................................................ 82 83 81 89 89 98 79 96Research and general education aids .............................................................................. 260 296 366 360 386 396 478 292Training and employment .................................................................................................. 2,775 3,019 2,930 2,958 3,020 3,300 3,530 3,982Social services ................................................................................................................... 1,779 2,292 2,321 3,029 2,875 2,891 3,045 3,878All other .............................................................................................................................. 543 510 431 422 453 474 487 501
Total, grants ................................................................................................................. 12,470 13,607 13,333 14,671 15,322 16,440 18,063 20,376
Total conduct of education and training .......................................................................... 24,541 25,599 24,661 26,805 30,034 31,564 34,642 37,179
Memorandum: Conduct of education and trainingAs a percentage of total outlays ....................................................................................... 2.6 2.6 2.5 2.5 2.6 2.5 2.6 2.7In billions of constant (FY 1992) dollars .......................................................................... 31.0 31.5 29.2 30.7 33.3 33.7 35.4 37.2
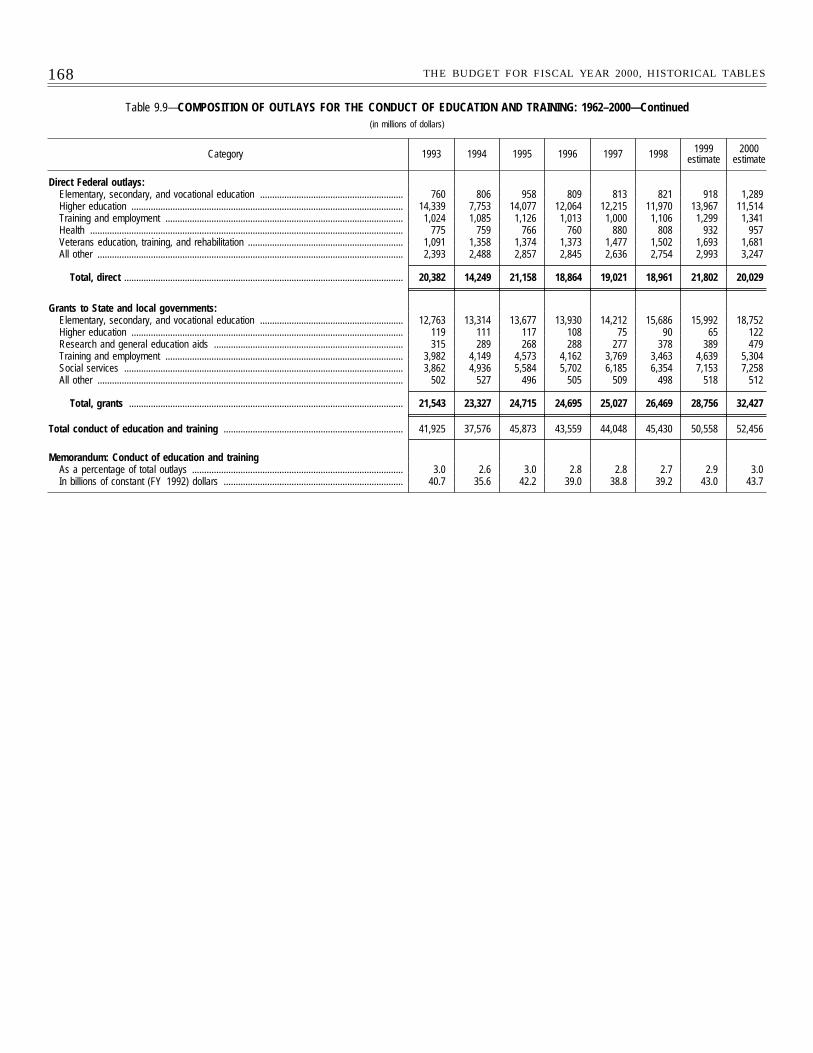
168 THE BUDGET FOR FISCAL YEAR 2000, HISTORICAL TABLES
Table 9.9—COMPOSITION OF OUTLAYS FOR THE CONDUCT OF EDUCATION AND TRAINING: 1962–2000—Continued(in millions of dollars)
Category 1993 1994 1995 1996 1997 1998 1999estimate
2000estimate
Direct Federal outlays:Elementary, secondary, and vocational education ........................................................... 760 806 958 809 813 821 918 1,289Higher education ................................................................................................................ 14,339 7,753 14,077 12,064 12,215 11,970 13,967 11,514Training and employment .................................................................................................. 1,024 1,085 1,126 1,013 1,000 1,106 1,299 1,341Health ................................................................................................................................. 775 759 766 760 880 808 932 957Veterans education, training, and rehabilitation ................................................................ 1,091 1,358 1,374 1,373 1,477 1,502 1,693 1,681All other .............................................................................................................................. 2,393 2,488 2,857 2,845 2,636 2,754 2,993 3,247
Total, direct ................................................................................................................... 20,382 14,249 21,158 18,864 19,021 18,961 21,802 20,029
Grants to State and local governments:Elementary, secondary, and vocational education ........................................................... 12,763 13,314 13,677 13,930 14,212 15,686 15,992 18,752Higher education ................................................................................................................ 119 111 117 108 75 90 65 122Research and general education aids .............................................................................. 315 289 268 288 277 378 389 479Training and employment .................................................................................................. 3,982 4,149 4,573 4,162 3,769 3,463 4,639 5,304Social services ................................................................................................................... 3,862 4,936 5,584 5,702 6,185 6,354 7,153 7,258All other .............................................................................................................................. 502 527 496 505 509 498 518 512
Total, grants ................................................................................................................. 21,543 23,327 24,715 24,695 25,027 26,469 28,756 32,427
Total conduct of education and training .......................................................................... 41,925 37,576 45,873 43,559 44,048 45,430 50,558 52,456
Memorandum: Conduct of education and trainingAs a percentage of total outlays ....................................................................................... 3.0 2.6 3.0 2.8 2.8 2.7 2.9 3.0In billions of constant (FY 1992) dollars .......................................................................... 40.7 35.6 42.2 39.0 38.8 39.2 43.0 43.7
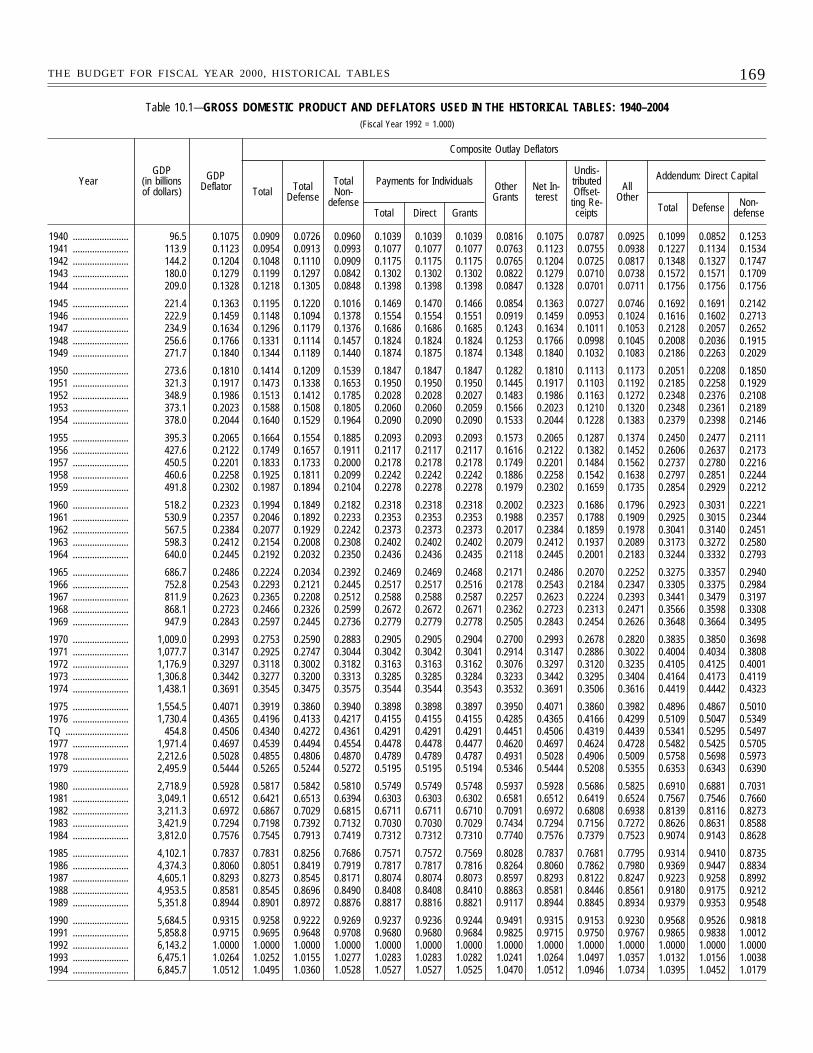
169THE BUDGET FOR FISCAL YEAR 2000, HISTORICAL TABLES
Table 10.1—GROSS DOMESTIC PRODUCT AND DEFLATORS USED IN THE HISTORICAL TABLES: 1940–2004(Fiscal Year 1992 = 1.000)
YearGDP
(in billionsof dollars)
GDPDeflator
Composite Outlay Deflators
Total TotalDefense
TotalNon-
defense
Payments for Individuals OtherGrants
Net In-terest
Undis-tributedOffset-
ting Re-ceipts
AllOther
Addendum: Direct Capital
Total Direct Grants Total Defense Non-defense
1940 ....................... 96.5 0.1075 0.0909 0.0726 0.0960 0.1039 0.1039 0.1039 0.0816 0.1075 0.0787 0.0925 0.1099 0.0852 0.12531941 ....................... 113.9 0.1123 0.0954 0.0913 0.0993 0.1077 0.1077 0.1077 0.0763 0.1123 0.0755 0.0938 0.1227 0.1134 0.15341942 ....................... 144.2 0.1204 0.1048 0.1110 0.0909 0.1175 0.1175 0.1175 0.0765 0.1204 0.0725 0.0817 0.1348 0.1327 0.17471943 ....................... 180.0 0.1279 0.1199 0.1297 0.0842 0.1302 0.1302 0.1302 0.0822 0.1279 0.0710 0.0738 0.1572 0.1571 0.17091944 ....................... 209.0 0.1328 0.1218 0.1305 0.0848 0.1398 0.1398 0.1398 0.0847 0.1328 0.0701 0.0711 0.1756 0.1756 0.1756
1945 ....................... 221.4 0.1363 0.1195 0.1220 0.1016 0.1469 0.1470 0.1466 0.0854 0.1363 0.0727 0.0746 0.1692 0.1691 0.21421946 ....................... 222.9 0.1459 0.1148 0.1094 0.1378 0.1554 0.1554 0.1551 0.0919 0.1459 0.0953 0.1024 0.1616 0.1602 0.27131947 ....................... 234.9 0.1634 0.1296 0.1179 0.1376 0.1686 0.1686 0.1685 0.1243 0.1634 0.1011 0.1053 0.2128 0.2057 0.26521948 ....................... 256.6 0.1766 0.1331 0.1114 0.1457 0.1824 0.1824 0.1824 0.1253 0.1766 0.0998 0.1045 0.2008 0.2036 0.19151949 ....................... 271.7 0.1840 0.1344 0.1189 0.1440 0.1874 0.1875 0.1874 0.1348 0.1840 0.1032 0.1083 0.2186 0.2263 0.2029
1950 ....................... 273.6 0.1810 0.1414 0.1209 0.1539 0.1847 0.1847 0.1847 0.1282 0.1810 0.1113 0.1173 0.2051 0.2208 0.18501951 ....................... 321.3 0.1917 0.1473 0.1338 0.1653 0.1950 0.1950 0.1950 0.1445 0.1917 0.1103 0.1192 0.2185 0.2258 0.19291952 ....................... 348.9 0.1986 0.1513 0.1412 0.1785 0.2028 0.2028 0.2027 0.1483 0.1986 0.1163 0.1272 0.2348 0.2376 0.21081953 ....................... 373.1 0.2023 0.1588 0.1508 0.1805 0.2060 0.2060 0.2059 0.1566 0.2023 0.1210 0.1320 0.2348 0.2361 0.21891954 ....................... 378.0 0.2044 0.1640 0.1529 0.1964 0.2090 0.2090 0.2090 0.1533 0.2044 0.1228 0.1383 0.2379 0.2398 0.2146
1955 ....................... 395.3 0.2065 0.1664 0.1554 0.1885 0.2093 0.2093 0.2093 0.1573 0.2065 0.1287 0.1374 0.2450 0.2477 0.21111956 ....................... 427.6 0.2122 0.1749 0.1657 0.1911 0.2117 0.2117 0.2117 0.1616 0.2122 0.1382 0.1452 0.2606 0.2637 0.21731957 ....................... 450.5 0.2201 0.1833 0.1733 0.2000 0.2178 0.2178 0.2178 0.1749 0.2201 0.1484 0.1562 0.2737 0.2780 0.22161958 ....................... 460.6 0.2258 0.1925 0.1811 0.2099 0.2242 0.2242 0.2242 0.1886 0.2258 0.1542 0.1638 0.2797 0.2851 0.22441959 ....................... 491.8 0.2302 0.1987 0.1894 0.2104 0.2278 0.2278 0.2278 0.1979 0.2302 0.1659 0.1735 0.2854 0.2929 0.2212
1960 ....................... 518.2 0.2323 0.1994 0.1849 0.2182 0.2318 0.2318 0.2318 0.2002 0.2323 0.1686 0.1796 0.2923 0.3031 0.22211961 ....................... 530.9 0.2357 0.2046 0.1892 0.2233 0.2353 0.2353 0.2353 0.1988 0.2357 0.1788 0.1909 0.2925 0.3015 0.23441962 ....................... 567.5 0.2384 0.2077 0.1929 0.2242 0.2373 0.2373 0.2373 0.2017 0.2384 0.1859 0.1978 0.3041 0.3140 0.24511963 ....................... 598.3 0.2412 0.2154 0.2008 0.2308 0.2402 0.2402 0.2402 0.2079 0.2412 0.1937 0.2089 0.3173 0.3272 0.25801964 ....................... 640.0 0.2445 0.2192 0.2032 0.2350 0.2436 0.2436 0.2435 0.2118 0.2445 0.2001 0.2183 0.3244 0.3332 0.2793
1965 ....................... 686.7 0.2486 0.2224 0.2034 0.2392 0.2469 0.2469 0.2468 0.2171 0.2486 0.2070 0.2252 0.3275 0.3357 0.29401966 ....................... 752.8 0.2543 0.2293 0.2121 0.2445 0.2517 0.2517 0.2516 0.2178 0.2543 0.2184 0.2347 0.3305 0.3375 0.29841967 ....................... 811.9 0.2623 0.2365 0.2208 0.2512 0.2588 0.2588 0.2587 0.2257 0.2623 0.2224 0.2393 0.3441 0.3479 0.31971968 ....................... 868.1 0.2723 0.2466 0.2326 0.2599 0.2672 0.2672 0.2671 0.2362 0.2723 0.2313 0.2471 0.3566 0.3598 0.33081969 ....................... 947.9 0.2843 0.2597 0.2445 0.2736 0.2779 0.2779 0.2778 0.2505 0.2843 0.2454 0.2626 0.3648 0.3664 0.3495
1970 ....................... 1,009.0 0.2993 0.2753 0.2590 0.2883 0.2905 0.2905 0.2904 0.2700 0.2993 0.2678 0.2820 0.3835 0.3850 0.36981971 ....................... 1,077.7 0.3147 0.2925 0.2747 0.3044 0.3042 0.3042 0.3041 0.2914 0.3147 0.2886 0.3022 0.4004 0.4034 0.38081972 ....................... 1,176.9 0.3297 0.3118 0.3002 0.3182 0.3163 0.3163 0.3162 0.3076 0.3297 0.3120 0.3235 0.4105 0.4125 0.40011973 ....................... 1,306.8 0.3442 0.3277 0.3200 0.3313 0.3285 0.3285 0.3284 0.3233 0.3442 0.3295 0.3404 0.4164 0.4173 0.41191974 ....................... 1,438.1 0.3691 0.3545 0.3475 0.3575 0.3544 0.3544 0.3543 0.3532 0.3691 0.3506 0.3616 0.4419 0.4442 0.4323
1975 ....................... 1,554.5 0.4071 0.3919 0.3860 0.3940 0.3898 0.3898 0.3897 0.3950 0.4071 0.3860 0.3982 0.4896 0.4867 0.50101976 ....................... 1,730.4 0.4365 0.4196 0.4133 0.4217 0.4155 0.4155 0.4155 0.4285 0.4365 0.4166 0.4299 0.5109 0.5047 0.5349TQ .......................... 454.8 0.4506 0.4340 0.4272 0.4361 0.4291 0.4291 0.4291 0.4451 0.4506 0.4319 0.4439 0.5341 0.5295 0.54971977 ....................... 1,971.4 0.4697 0.4539 0.4494 0.4554 0.4478 0.4478 0.4477 0.4620 0.4697 0.4624 0.4728 0.5482 0.5425 0.57051978 ....................... 2,212.6 0.5028 0.4855 0.4806 0.4870 0.4789 0.4789 0.4787 0.4931 0.5028 0.4906 0.5009 0.5758 0.5698 0.59731979 ....................... 2,495.9 0.5444 0.5265 0.5244 0.5272 0.5195 0.5195 0.5194 0.5346 0.5444 0.5208 0.5355 0.6353 0.6343 0.6390
1980 ....................... 2,718.9 0.5928 0.5817 0.5842 0.5810 0.5749 0.5749 0.5748 0.5937 0.5928 0.5686 0.5825 0.6910 0.6881 0.70311981 ....................... 3,049.1 0.6512 0.6421 0.6513 0.6394 0.6303 0.6303 0.6302 0.6581 0.6512 0.6419 0.6524 0.7567 0.7546 0.76601982 ....................... 3,211.3 0.6972 0.6867 0.7029 0.6815 0.6711 0.6711 0.6710 0.7091 0.6972 0.6808 0.6938 0.8139 0.8116 0.82731983 ....................... 3,421.9 0.7294 0.7198 0.7392 0.7132 0.7030 0.7030 0.7029 0.7434 0.7294 0.7156 0.7272 0.8626 0.8631 0.85881984 ....................... 3,812.0 0.7576 0.7545 0.7913 0.7419 0.7312 0.7312 0.7310 0.7740 0.7576 0.7379 0.7523 0.9074 0.9143 0.8628
1985 ....................... 4,102.1 0.7837 0.7831 0.8256 0.7686 0.7571 0.7572 0.7569 0.8028 0.7837 0.7681 0.7795 0.9314 0.9410 0.87351986 ....................... 4,374.3 0.8060 0.8051 0.8419 0.7919 0.7817 0.7817 0.7816 0.8264 0.8060 0.7862 0.7980 0.9369 0.9447 0.88341987 ....................... 4,605.1 0.8293 0.8273 0.8545 0.8171 0.8074 0.8074 0.8073 0.8597 0.8293 0.8122 0.8247 0.9223 0.9258 0.89921988 ....................... 4,953.5 0.8581 0.8545 0.8696 0.8490 0.8408 0.8408 0.8410 0.8863 0.8581 0.8446 0.8561 0.9180 0.9175 0.92121989 ....................... 5,351.8 0.8944 0.8901 0.8972 0.8876 0.8817 0.8816 0.8821 0.9117 0.8944 0.8845 0.8934 0.9379 0.9353 0.9548
1990 ....................... 5,684.5 0.9315 0.9258 0.9222 0.9269 0.9237 0.9236 0.9244 0.9491 0.9315 0.9153 0.9230 0.9568 0.9526 0.98181991 ....................... 5,858.8 0.9715 0.9695 0.9648 0.9708 0.9680 0.9680 0.9684 0.9825 0.9715 0.9750 0.9767 0.9865 0.9838 1.00121992 ....................... 6,143.2 1.0000 1.0000 1.0000 1.0000 1.0000 1.0000 1.0000 1.0000 1.0000 1.0000 1.0000 1.0000 1.0000 1.00001993 ....................... 6,475.1 1.0264 1.0252 1.0155 1.0277 1.0283 1.0283 1.0282 1.0241 1.0264 1.0497 1.0357 1.0132 1.0156 1.00381994 ....................... 6,845.7 1.0512 1.0495 1.0360 1.0528 1.0527 1.0527 1.0525 1.0470 1.0512 1.0946 1.0734 1.0395 1.0452 1.0179
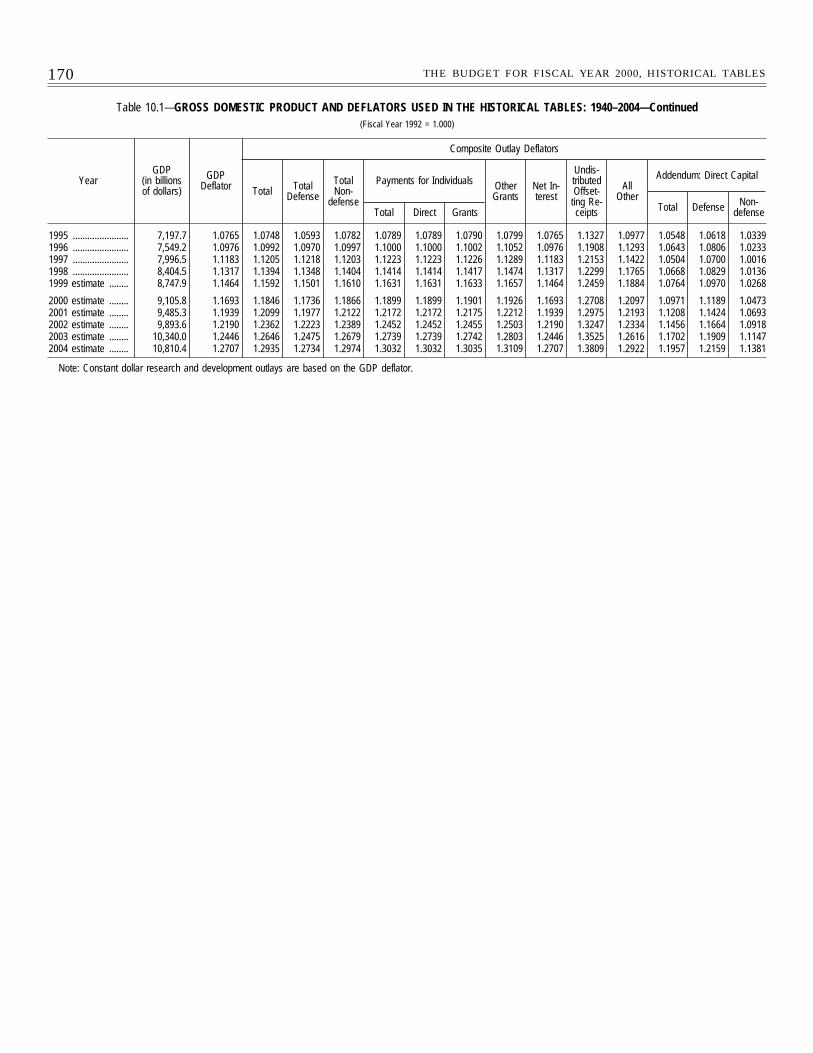
170 THE BUDGET FOR FISCAL YEAR 2000, HISTORICAL TABLES
Table 10.1—GROSS DOMESTIC PRODUCT AND DEFLATORS USED IN THE HISTORICAL TABLES: 1940–2004—Continued(Fiscal Year 1992 = 1.000)
YearGDP
(in billionsof dollars)
GDPDeflator
Composite Outlay Deflators
Total TotalDefense
TotalNon-
defense
Payments for Individuals OtherGrants
Net In-terest
Undis-tributedOffset-
ting Re-ceipts
AllOther
Addendum: Direct Capital
Total Direct Grants Total Defense Non-defense
1995 ....................... 7,197.7 1.0765 1.0748 1.0593 1.0782 1.0789 1.0789 1.0790 1.0799 1.0765 1.1327 1.0977 1.0548 1.0618 1.03391996 ....................... 7,549.2 1.0976 1.0992 1.0970 1.0997 1.1000 1.1000 1.1002 1.1052 1.0976 1.1908 1.1293 1.0643 1.0806 1.02331997 ....................... 7,996.5 1.1183 1.1205 1.1218 1.1203 1.1223 1.1223 1.1226 1.1289 1.1183 1.2153 1.1422 1.0504 1.0700 1.00161998 ....................... 8,404.5 1.1317 1.1394 1.1348 1.1404 1.1414 1.1414 1.1417 1.1474 1.1317 1.2299 1.1765 1.0668 1.0829 1.01361999 estimate ........ 8,747.9 1.1464 1.1592 1.1501 1.1610 1.1631 1.1631 1.1633 1.1657 1.1464 1.2459 1.1884 1.0764 1.0970 1.0268
2000 estimate ........ 9,105.8 1.1693 1.1846 1.1736 1.1866 1.1899 1.1899 1.1901 1.1926 1.1693 1.2708 1.2097 1.0971 1.1189 1.04732001 estimate ........ 9,485.3 1.1939 1.2099 1.1977 1.2122 1.2172 1.2172 1.2175 1.2212 1.1939 1.2975 1.2193 1.1208 1.1424 1.06932002 estimate ........ 9,893.6 1.2190 1.2362 1.2223 1.2389 1.2452 1.2452 1.2455 1.2503 1.2190 1.3247 1.2334 1.1456 1.1664 1.09182003 estimate ........ 10,340.0 1.2446 1.2646 1.2475 1.2679 1.2739 1.2739 1.2742 1.2803 1.2446 1.3525 1.2616 1.1702 1.1909 1.11472004 estimate ........ 10,810.4 1.2707 1.2935 1.2734 1.2974 1.3032 1.3032 1.3035 1.3109 1.2707 1.3809 1.2922 1.1957 1.2159 1.1381
Note: Constant dollar research and development outlays are based on the GDP deflator.
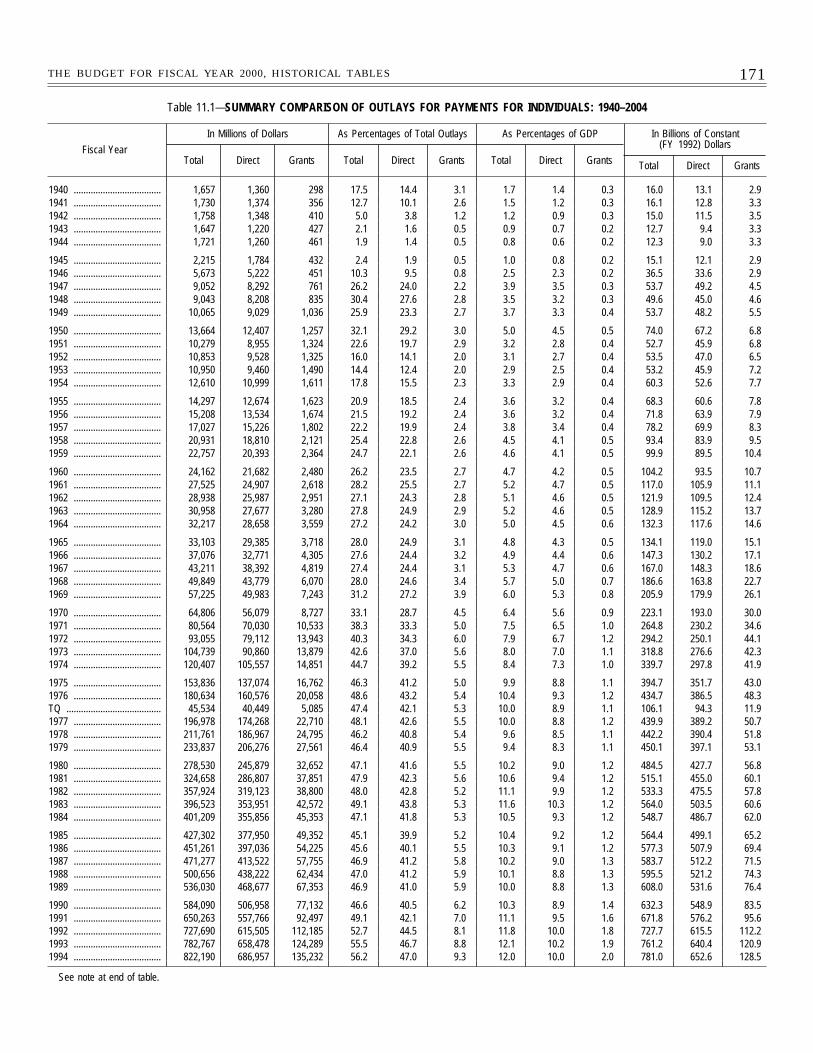
171THE BUDGET FOR FISCAL YEAR 2000, HISTORICAL TABLES
Table 11.1—SUMMARY COMPARISON OF OUTLAYS FOR PAYMENTS FOR INDIVIDUALS: 1940–2004
Fiscal Year
In Millions of Dollars As Percentages of Total Outlays As Percentages of GDP In Billions of Constant(FY 1992) Dollars
Total Direct Grants Total Direct Grants Total Direct Grants Total Direct Grants
1940 .................................... 1,657 1,360 298 17.5 14.4 3.1 1.7 1.4 0.3 16.0 13.1 2.91941 .................................... 1,730 1,374 356 12.7 10.1 2.6 1.5 1.2 0.3 16.1 12.8 3.31942 .................................... 1,758 1,348 410 5.0 3.8 1.2 1.2 0.9 0.3 15.0 11.5 3.51943 .................................... 1,647 1,220 427 2.1 1.6 0.5 0.9 0.7 0.2 12.7 9.4 3.31944 .................................... 1,721 1,260 461 1.9 1.4 0.5 0.8 0.6 0.2 12.3 9.0 3.3
1945 .................................... 2,215 1,784 432 2.4 1.9 0.5 1.0 0.8 0.2 15.1 12.1 2.91946 .................................... 5,673 5,222 451 10.3 9.5 0.8 2.5 2.3 0.2 36.5 33.6 2.91947 .................................... 9,052 8,292 761 26.2 24.0 2.2 3.9 3.5 0.3 53.7 49.2 4.51948 .................................... 9,043 8,208 835 30.4 27.6 2.8 3.5 3.2 0.3 49.6 45.0 4.61949 .................................... 10,065 9,029 1,036 25.9 23.3 2.7 3.7 3.3 0.4 53.7 48.2 5.5
1950 .................................... 13,664 12,407 1,257 32.1 29.2 3.0 5.0 4.5 0.5 74.0 67.2 6.81951 .................................... 10,279 8,955 1,324 22.6 19.7 2.9 3.2 2.8 0.4 52.7 45.9 6.81952 .................................... 10,853 9,528 1,325 16.0 14.1 2.0 3.1 2.7 0.4 53.5 47.0 6.51953 .................................... 10,950 9,460 1,490 14.4 12.4 2.0 2.9 2.5 0.4 53.2 45.9 7.21954 .................................... 12,610 10,999 1,611 17.8 15.5 2.3 3.3 2.9 0.4 60.3 52.6 7.7
1955 .................................... 14,297 12,674 1,623 20.9 18.5 2.4 3.6 3.2 0.4 68.3 60.6 7.81956 .................................... 15,208 13,534 1,674 21.5 19.2 2.4 3.6 3.2 0.4 71.8 63.9 7.91957 .................................... 17,027 15,226 1,802 22.2 19.9 2.4 3.8 3.4 0.4 78.2 69.9 8.31958 .................................... 20,931 18,810 2,121 25.4 22.8 2.6 4.5 4.1 0.5 93.4 83.9 9.51959 .................................... 22,757 20,393 2,364 24.7 22.1 2.6 4.6 4.1 0.5 99.9 89.5 10.4
1960 .................................... 24,162 21,682 2,480 26.2 23.5 2.7 4.7 4.2 0.5 104.2 93.5 10.71961 .................................... 27,525 24,907 2,618 28.2 25.5 2.7 5.2 4.7 0.5 117.0 105.9 11.11962 .................................... 28,938 25,987 2,951 27.1 24.3 2.8 5.1 4.6 0.5 121.9 109.5 12.41963 .................................... 30,958 27,677 3,280 27.8 24.9 2.9 5.2 4.6 0.5 128.9 115.2 13.71964 .................................... 32,217 28,658 3,559 27.2 24.2 3.0 5.0 4.5 0.6 132.3 117.6 14.6
1965 .................................... 33,103 29,385 3,718 28.0 24.9 3.1 4.8 4.3 0.5 134.1 119.0 15.11966 .................................... 37,076 32,771 4,305 27.6 24.4 3.2 4.9 4.4 0.6 147.3 130.2 17.11967 .................................... 43,211 38,392 4,819 27.4 24.4 3.1 5.3 4.7 0.6 167.0 148.3 18.61968 .................................... 49,849 43,779 6,070 28.0 24.6 3.4 5.7 5.0 0.7 186.6 163.8 22.71969 .................................... 57,225 49,983 7,243 31.2 27.2 3.9 6.0 5.3 0.8 205.9 179.9 26.1
1970 .................................... 64,806 56,079 8,727 33.1 28.7 4.5 6.4 5.6 0.9 223.1 193.0 30.01971 .................................... 80,564 70,030 10,533 38.3 33.3 5.0 7.5 6.5 1.0 264.8 230.2 34.61972 .................................... 93,055 79,112 13,943 40.3 34.3 6.0 7.9 6.7 1.2 294.2 250.1 44.11973 .................................... 104,739 90,860 13,879 42.6 37.0 5.6 8.0 7.0 1.1 318.8 276.6 42.31974 .................................... 120,407 105,557 14,851 44.7 39.2 5.5 8.4 7.3 1.0 339.7 297.8 41.9
1975 .................................... 153,836 137,074 16,762 46.3 41.2 5.0 9.9 8.8 1.1 394.7 351.7 43.01976 .................................... 180,634 160,576 20,058 48.6 43.2 5.4 10.4 9.3 1.2 434.7 386.5 48.3TQ ....................................... 45,534 40,449 5,085 47.4 42.1 5.3 10.0 8.9 1.1 106.1 94.3 11.91977 .................................... 196,978 174,268 22,710 48.1 42.6 5.5 10.0 8.8 1.2 439.9 389.2 50.71978 .................................... 211,761 186,967 24,795 46.2 40.8 5.4 9.6 8.5 1.1 442.2 390.4 51.81979 .................................... 233,837 206,276 27,561 46.4 40.9 5.5 9.4 8.3 1.1 450.1 397.1 53.1
1980 .................................... 278,530 245,879 32,652 47.1 41.6 5.5 10.2 9.0 1.2 484.5 427.7 56.81981 .................................... 324,658 286,807 37,851 47.9 42.3 5.6 10.6 9.4 1.2 515.1 455.0 60.11982 .................................... 357,924 319,123 38,800 48.0 42.8 5.2 11.1 9.9 1.2 533.3 475.5 57.81983 .................................... 396,523 353,951 42,572 49.1 43.8 5.3 11.6 10.3 1.2 564.0 503.5 60.61984 .................................... 401,209 355,856 45,353 47.1 41.8 5.3 10.5 9.3 1.2 548.7 486.7 62.0
1985 .................................... 427,302 377,950 49,352 45.1 39.9 5.2 10.4 9.2 1.2 564.4 499.1 65.21986 .................................... 451,261 397,036 54,225 45.6 40.1 5.5 10.3 9.1 1.2 577.3 507.9 69.41987 .................................... 471,277 413,522 57,755 46.9 41.2 5.8 10.2 9.0 1.3 583.7 512.2 71.51988 .................................... 500,656 438,222 62,434 47.0 41.2 5.9 10.1 8.8 1.3 595.5 521.2 74.31989 .................................... 536,030 468,677 67,353 46.9 41.0 5.9 10.0 8.8 1.3 608.0 531.6 76.4
1990 .................................... 584,090 506,958 77,132 46.6 40.5 6.2 10.3 8.9 1.4 632.3 548.9 83.51991 .................................... 650,263 557,766 92,497 49.1 42.1 7.0 11.1 9.5 1.6 671.8 576.2 95.61992 .................................... 727,690 615,505 112,185 52.7 44.5 8.1 11.8 10.0 1.8 727.7 615.5 112.21993 .................................... 782,767 658,478 124,289 55.5 46.7 8.8 12.1 10.2 1.9 761.2 640.4 120.91994 .................................... 822,190 686,957 135,232 56.2 47.0 9.3 12.0 10.0 2.0 781.0 652.6 128.5
See note at end of table.
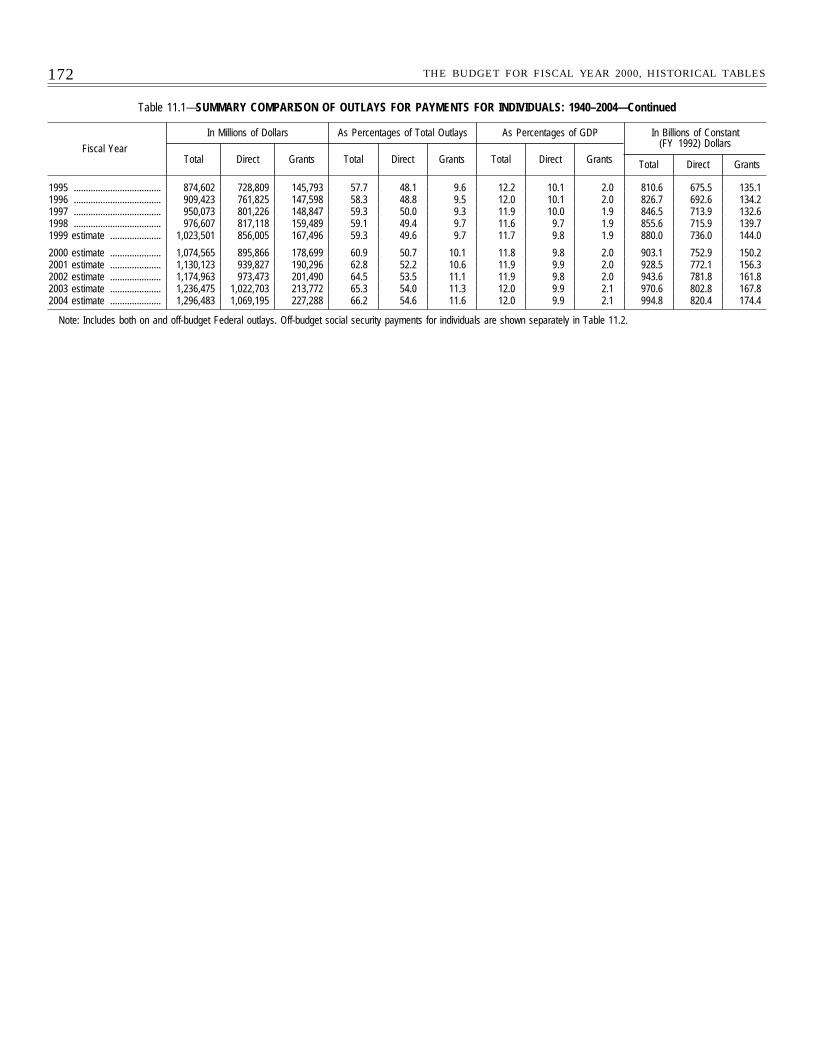
172 THE BUDGET FOR FISCAL YEAR 2000, HISTORICAL TABLES
Table 11.1—SUMMARY COMPARISON OF OUTLAYS FOR PAYMENTS FOR INDIVIDUALS: 1940–2004—Continued
Fiscal Year
In Millions of Dollars As Percentages of Total Outlays As Percentages of GDP In Billions of Constant(FY 1992) Dollars
Total Direct Grants Total Direct Grants Total Direct Grants Total Direct Grants
1995 .................................... 874,602 728,809 145,793 57.7 48.1 9.6 12.2 10.1 2.0 810.6 675.5 135.11996 .................................... 909,423 761,825 147,598 58.3 48.8 9.5 12.0 10.1 2.0 826.7 692.6 134.21997 .................................... 950,073 801,226 148,847 59.3 50.0 9.3 11.9 10.0 1.9 846.5 713.9 132.61998 .................................... 976,607 817,118 159,489 59.1 49.4 9.7 11.6 9.7 1.9 855.6 715.9 139.71999 estimate ..................... 1,023,501 856,005 167,496 59.3 49.6 9.7 11.7 9.8 1.9 880.0 736.0 144.0
2000 estimate ..................... 1,074,565 895,866 178,699 60.9 50.7 10.1 11.8 9.8 2.0 903.1 752.9 150.22001 estimate ..................... 1,130,123 939,827 190,296 62.8 52.2 10.6 11.9 9.9 2.0 928.5 772.1 156.32002 estimate ..................... 1,174,963 973,473 201,490 64.5 53.5 11.1 11.9 9.8 2.0 943.6 781.8 161.82003 estimate ..................... 1,236,475 1,022,703 213,772 65.3 54.0 11.3 12.0 9.9 2.1 970.6 802.8 167.82004 estimate ..................... 1,296,483 1,069,195 227,288 66.2 54.6 11.6 12.0 9.9 2.1 994.8 820.4 174.4
Note: Includes both on and off-budget Federal outlays. Off-budget social security payments for individuals are shown separately in Table 11.2.
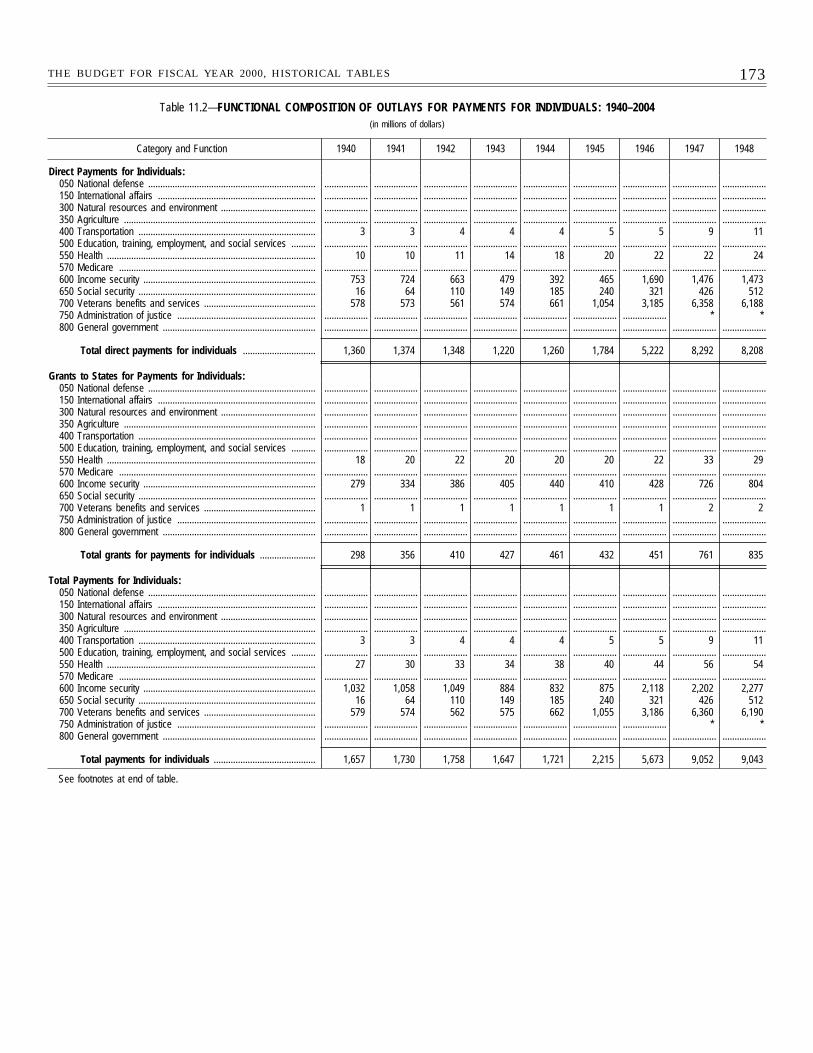
173THE BUDGET FOR FISCAL YEAR 2000, HISTORICAL TABLES
Table 11.2—FUNCTIONAL COMPOSITION OF OUTLAYS FOR PAYMENTS FOR INDIVIDUALS: 1940–2004(in millions of dollars)
Category and Function 1940 1941 1942 1943 1944 1945 1946 1947 1948
Direct Payments for Individuals:050 National defense ..................................................................... .................. .................. .................. .................. .................. .................. .................. .................. ..................150 International affairs ................................................................. .................. .................. .................. .................. .................. .................. .................. .................. ..................300 Natural resources and environment ....................................... .................. .................. .................. .................. .................. .................. .................. .................. ..................350 Agriculture ............................................................................... .................. .................. .................. .................. .................. .................. .................. .................. ..................400 Transportation ......................................................................... 3 3 4 4 4 5 5 9 11500 Education, training, employment, and social services .......... .................. .................. .................. .................. .................. .................. .................. .................. ..................550 Health ...................................................................................... 10 10 11 14 18 20 22 22 24570 Medicare ................................................................................. .................. .................. .................. .................. .................. .................. .................. .................. ..................600 Income security ....................................................................... 753 724 663 479 392 465 1,690 1,476 1,473650 Social security ......................................................................... 16 64 110 149 185 240 321 426 512700 Veterans benefits and services .............................................. 578 573 561 574 661 1,054 3,185 6,358 6,188750 Administration of justice ......................................................... .................. .................. .................. .................. .................. .................. .................. * *800 General government ............................................................... .................. .................. .................. .................. .................. .................. .................. .................. ..................
Total direct payments for individuals .............................. 1,360 1,374 1,348 1,220 1,260 1,784 5,222 8,292 8,208
Grants to States for Payments for Individuals:050 National defense ..................................................................... .................. .................. .................. .................. .................. .................. .................. .................. ..................150 International affairs ................................................................. .................. .................. .................. .................. .................. .................. .................. .................. ..................300 Natural resources and environment ....................................... .................. .................. .................. .................. .................. .................. .................. .................. ..................350 Agriculture ............................................................................... .................. .................. .................. .................. .................. .................. .................. .................. ..................400 Transportation ......................................................................... .................. .................. .................. .................. .................. .................. .................. .................. ..................500 Education, training, employment, and social services .......... .................. .................. .................. .................. .................. .................. .................. .................. ..................550 Health ...................................................................................... 18 20 22 20 20 20 22 33 29570 Medicare ................................................................................. .................. .................. .................. .................. .................. .................. .................. .................. ..................600 Income security ....................................................................... 279 334 386 405 440 410 428 726 804650 Social security ......................................................................... .................. .................. .................. .................. .................. .................. .................. .................. ..................700 Veterans benefits and services .............................................. 1 1 1 1 1 1 1 2 2750 Administration of justice ......................................................... .................. .................. .................. .................. .................. .................. .................. .................. ..................800 General government ............................................................... .................. .................. .................. .................. .................. .................. .................. .................. ..................
Total grants for payments for individuals ....................... 298 356 410 427 461 432 451 761 835
Total Payments for Individuals:050 National defense ..................................................................... .................. .................. .................. .................. .................. .................. .................. .................. ..................150 International affairs ................................................................. .................. .................. .................. .................. .................. .................. .................. .................. ..................300 Natural resources and environment ....................................... .................. .................. .................. .................. .................. .................. .................. .................. ..................350 Agriculture ............................................................................... .................. .................. .................. .................. .................. .................. .................. .................. ..................400 Transportation ......................................................................... 3 3 4 4 4 5 5 9 11500 Education, training, employment, and social services .......... .................. .................. .................. .................. .................. .................. .................. .................. ..................550 Health ...................................................................................... 27 30 33 34 38 40 44 56 54570 Medicare ................................................................................. .................. .................. .................. .................. .................. .................. .................. .................. ..................600 Income security ....................................................................... 1,032 1,058 1,049 884 832 875 2,118 2,202 2,277650 Social security ......................................................................... 16 64 110 149 185 240 321 426 512700 Veterans benefits and services .............................................. 579 574 562 575 662 1,055 3,186 6,360 6,190750 Administration of justice ......................................................... .................. .................. .................. .................. .................. .................. .................. * *800 General government ............................................................... .................. .................. .................. .................. .................. .................. .................. .................. ..................
Total payments for individuals .......................................... 1,657 1,730 1,758 1,647 1,721 2,215 5,673 9,052 9,043
See footnotes at end of table.
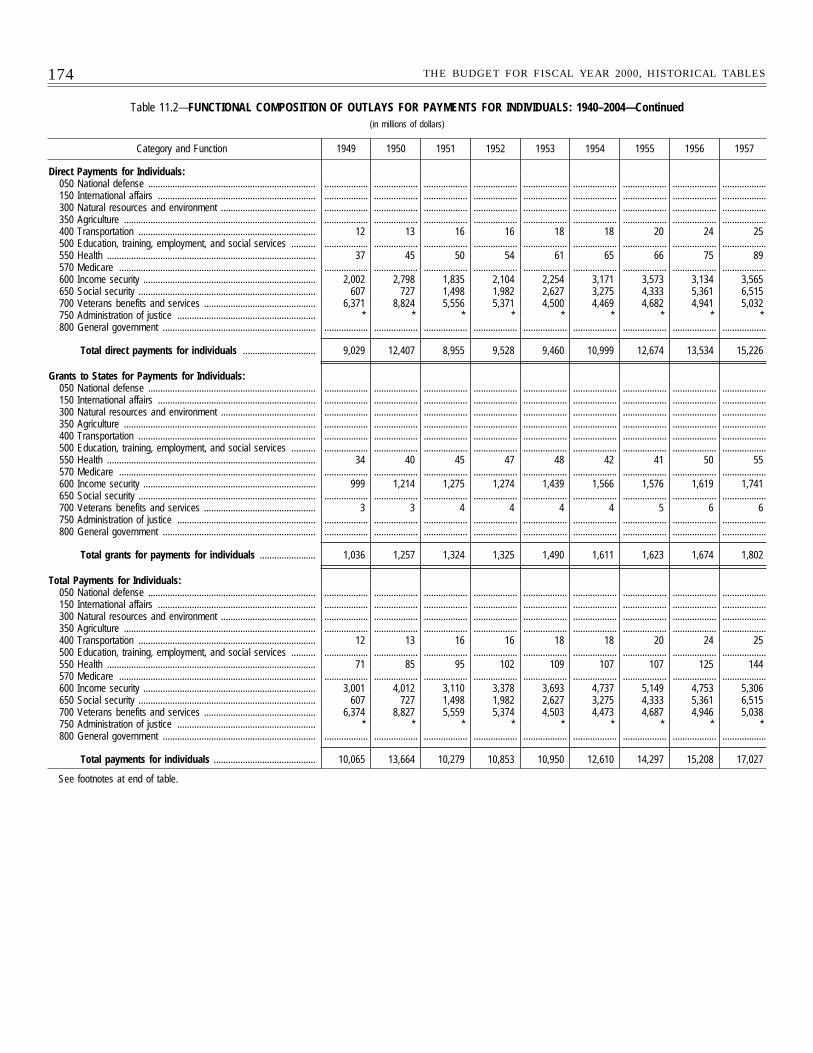
174 THE BUDGET FOR FISCAL YEAR 2000, HISTORICAL TABLES
Table 11.2—FUNCTIONAL COMPOSITION OF OUTLAYS FOR PAYMENTS FOR INDIVIDUALS: 1940–2004—Continued(in millions of dollars)
Category and Function 1949 1950 1951 1952 1953 1954 1955 1956 1957
Direct Payments for Individuals:050 National defense ..................................................................... .................. .................. .................. .................. .................. .................. .................. .................. ..................150 International affairs ................................................................. .................. .................. .................. .................. .................. .................. .................. .................. ..................300 Natural resources and environment ....................................... .................. .................. .................. .................. .................. .................. .................. .................. ..................350 Agriculture ............................................................................... .................. .................. .................. .................. .................. .................. .................. .................. ..................400 Transportation ......................................................................... 12 13 16 16 18 18 20 24 25500 Education, training, employment, and social services .......... .................. .................. .................. .................. .................. .................. .................. .................. ..................550 Health ...................................................................................... 37 45 50 54 61 65 66 75 89570 Medicare ................................................................................. .................. .................. .................. .................. .................. .................. .................. .................. ..................600 Income security ....................................................................... 2,002 2,798 1,835 2,104 2,254 3,171 3,573 3,134 3,565650 Social security ......................................................................... 607 727 1,498 1,982 2,627 3,275 4,333 5,361 6,515700 Veterans benefits and services .............................................. 6,371 8,824 5,556 5,371 4,500 4,469 4,682 4,941 5,032750 Administration of justice ......................................................... * * * * * * * * *800 General government ............................................................... .................. .................. .................. .................. .................. .................. .................. .................. ..................
Total direct payments for individuals .............................. 9,029 12,407 8,955 9,528 9,460 10,999 12,674 13,534 15,226
Grants to States for Payments for Individuals:050 National defense ..................................................................... .................. .................. .................. .................. .................. .................. .................. .................. ..................150 International affairs ................................................................. .................. .................. .................. .................. .................. .................. .................. .................. ..................300 Natural resources and environment ....................................... .................. .................. .................. .................. .................. .................. .................. .................. ..................350 Agriculture ............................................................................... .................. .................. .................. .................. .................. .................. .................. .................. ..................400 Transportation ......................................................................... .................. .................. .................. .................. .................. .................. .................. .................. ..................500 Education, training, employment, and social services .......... .................. .................. .................. .................. .................. .................. .................. .................. ..................550 Health ...................................................................................... 34 40 45 47 48 42 41 50 55570 Medicare ................................................................................. .................. .................. .................. .................. .................. .................. .................. .................. ..................600 Income security ....................................................................... 999 1,214 1,275 1,274 1,439 1,566 1,576 1,619 1,741650 Social security ......................................................................... .................. .................. .................. .................. .................. .................. .................. .................. ..................700 Veterans benefits and services .............................................. 3 3 4 4 4 4 5 6 6750 Administration of justice ......................................................... .................. .................. .................. .................. .................. .................. .................. .................. ..................800 General government ............................................................... .................. .................. .................. .................. .................. .................. .................. .................. ..................
Total grants for payments for individuals ....................... 1,036 1,257 1,324 1,325 1,490 1,611 1,623 1,674 1,802
Total Payments for Individuals:050 National defense ..................................................................... .................. .................. .................. .................. .................. .................. .................. .................. ..................150 International affairs ................................................................. .................. .................. .................. .................. .................. .................. .................. .................. ..................300 Natural resources and environment ....................................... .................. .................. .................. .................. .................. .................. .................. .................. ..................350 Agriculture ............................................................................... .................. .................. .................. .................. .................. .................. .................. .................. ..................400 Transportation ......................................................................... 12 13 16 16 18 18 20 24 25500 Education, training, employment, and social services .......... .................. .................. .................. .................. .................. .................. .................. .................. ..................550 Health ...................................................................................... 71 85 95 102 109 107 107 125 144570 Medicare ................................................................................. .................. .................. .................. .................. .................. .................. .................. .................. ..................600 Income security ....................................................................... 3,001 4,012 3,110 3,378 3,693 4,737 5,149 4,753 5,306650 Social security ......................................................................... 607 727 1,498 1,982 2,627 3,275 4,333 5,361 6,515700 Veterans benefits and services .............................................. 6,374 8,827 5,559 5,374 4,503 4,473 4,687 4,946 5,038750 Administration of justice ......................................................... * * * * * * * * *800 General government ............................................................... .................. .................. .................. .................. .................. .................. .................. .................. ..................
Total payments for individuals .......................................... 10,065 13,664 10,279 10,853 10,950 12,610 14,297 15,208 17,027
See footnotes at end of table.

175THE BUDGET FOR FISCAL YEAR 2000, HISTORICAL TABLES
Table 11.2—FUNCTIONAL COMPOSITION OF OUTLAYS FOR PAYMENTS FOR INDIVIDUALS: 1940–2004—Continued(in millions of dollars)
Category and Function 1958 1959 1960 1961 1962 1963 1964 1965
Direct Payments for Individuals:050 National defense ......................................................................................... .................. .................. .................. .................. .................. .................. .................. ..................150 International affairs ...................................................................................... .................. .................. .................. .................. .................. .................. .................. ..................300 Natural resources and environment ........................................................... .................. .................. .................. .................. .................. .................. .................. ..................350 Agriculture .................................................................................................... .................. .................. .................. .................. .................. .................. .................. ..................400 Transportation .............................................................................................. 26 28 29 30 31 32 34 37500 Education, training, employment, and social services ............................... .................. .................. .................. .................. .................. .................. .................. ..................550 Health .......................................................................................................... 102 113 119 127 126 134 152 154570 Medicare ...................................................................................................... .................. .................. .................. .................. .................. .................. .................. ..................600 Income security ........................................................................................... 5,335 5,353 4,788 6,890 6,166 6,165 6,335 6,128650 Social security ............................................................................................. 8,043 9,510 11,395 12,203 14,050 15,459 16,250 17,081700 Veterans benefits and services .................................................................. 5,304 5,389 5,350 5,657 5,614 5,887 5,887 5,984750 Administration of justice .............................................................................. * * * * * * * *800 General government ................................................................................... .................. .................. .................. .................. .................. .................. .................. ..................
Total direct payments for individuals ................................................... 18,810 20,393 21,682 24,907 25,987 27,677 28,658 29,385
Grants to States for Payments for Individuals:050 National defense ......................................................................................... .................. .................. .................. .................. .................. .................. .................. ..................150 International affairs ...................................................................................... .................. .................. .................. .................. .................. .................. .................. ..................300 Natural resources and environment ........................................................... .................. .................. .................. .................. .................. .................. .................. ..................350 Agriculture .................................................................................................... .................. .................. .................. .................. .................. .................. .................. ..................400 Transportation .............................................................................................. .................. .................. .................. .................. .................. .................. .................. ..................500 Education, training, employment, and social services ............................... .................. .................. .................. .................. .................. .................. .................. ..................550 Health .......................................................................................................... 61 64 56 87 188 249 329 420570 Medicare ...................................................................................................... .................. .................. .................. .................. .................. .................. .................. ..................600 Income security ........................................................................................... 2,054 2,294 2,418 2,523 2,756 3,024 3,222 3,290650 Social security ............................................................................................. .................. .................. .................. .................. .................. .................. .................. ..................700 Veterans benefits and services .................................................................. 6 6 6 8 7 7 8 8750 Administration of justice .............................................................................. .................. .................. .................. .................. .................. .................. .................. ..................800 General government ................................................................................... .................. .................. .................. .................. .................. .................. .................. ..................
Total grants for payments for individuals ........................................... 2,121 2,364 2,480 2,618 2,951 3,280 3,559 3,718
Total Payments for Individuals:050 National defense ......................................................................................... .................. .................. .................. .................. .................. .................. .................. ..................150 International affairs ...................................................................................... .................. .................. .................. .................. .................. .................. .................. ..................300 Natural resources and environment ........................................................... .................. .................. .................. .................. .................. .................. .................. ..................350 Agriculture .................................................................................................... .................. .................. .................. .................. .................. .................. .................. ..................400 Transportation .............................................................................................. 26 28 29 30 31 32 34 37500 Education, training, employment, and social services ............................... .................. .................. .................. .................. .................. .................. .................. ..................550 Health .......................................................................................................... 163 177 175 214 314 383 482 575570 Medicare ...................................................................................................... .................. .................. .................. .................. .................. .................. .................. ..................600 Income security ........................................................................................... 7,389 7,646 7,206 9,413 8,922 9,189 9,557 9,417650 Social security ............................................................................................. 8,043 9,510 11,395 12,203 14,050 15,459 16,250 17,081700 Veterans benefits and services .................................................................. 5,310 5,395 5,356 5,665 5,622 5,895 5,894 5,992750 Administration of justice .............................................................................. * * * * * * * *800 General government ................................................................................... .................. .................. .................. .................. .................. .................. .................. ..................
Total payments for individuals .............................................................. 20,931 22,757 24,162 27,525 28,938 30,958 32,217 33,103
See footnotes at end of table.
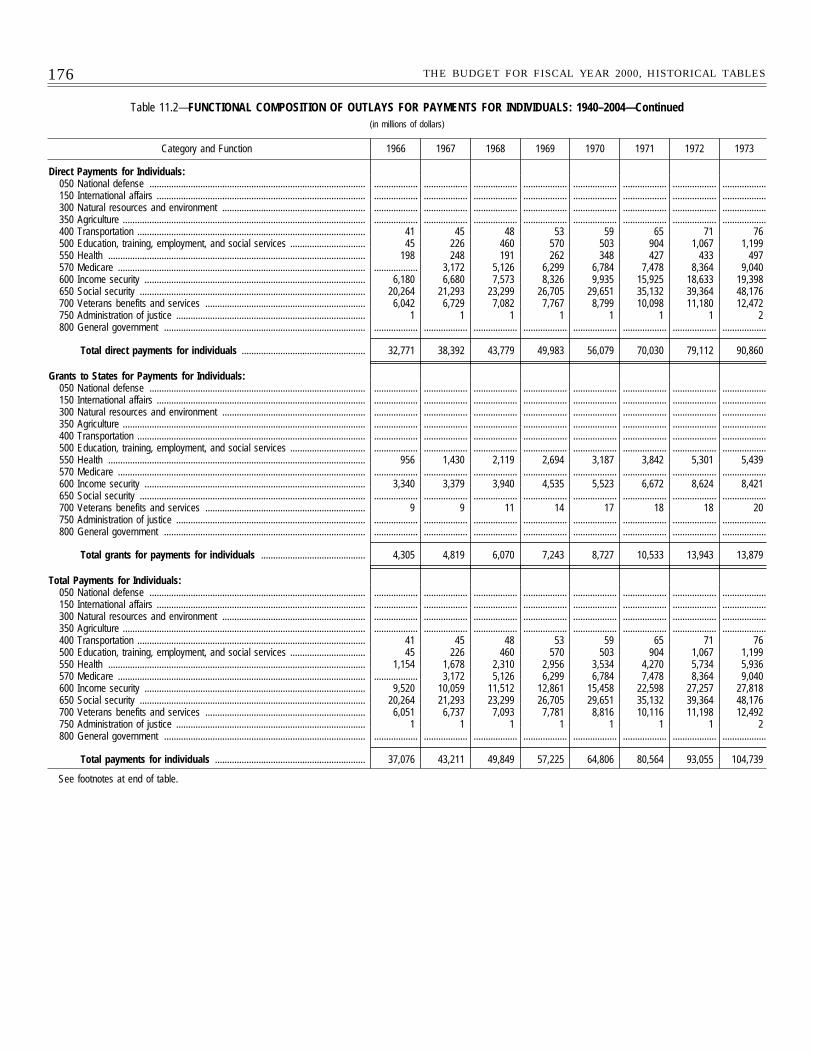
176 THE BUDGET FOR FISCAL YEAR 2000, HISTORICAL TABLES
Table 11.2—FUNCTIONAL COMPOSITION OF OUTLAYS FOR PAYMENTS FOR INDIVIDUALS: 1940–2004—Continued(in millions of dollars)
Category and Function 1966 1967 1968 1969 1970 1971 1972 1973
Direct Payments for Individuals:050 National defense ......................................................................................... .................. .................. .................. .................. .................. .................. .................. ..................150 International affairs ...................................................................................... .................. .................. .................. .................. .................. .................. .................. ..................300 Natural resources and environment ........................................................... .................. .................. .................. .................. .................. .................. .................. ..................350 Agriculture .................................................................................................... .................. .................. .................. .................. .................. .................. .................. ..................400 Transportation .............................................................................................. 41 45 48 53 59 65 71 76500 Education, training, employment, and social services ............................... 45 226 460 570 503 904 1,067 1,199550 Health .......................................................................................................... 198 248 191 262 348 427 433 497570 Medicare ...................................................................................................... .................. 3,172 5,126 6,299 6,784 7,478 8,364 9,040600 Income security ........................................................................................... 6,180 6,680 7,573 8,326 9,935 15,925 18,633 19,398650 Social security ............................................................................................. 20,264 21,293 23,299 26,705 29,651 35,132 39,364 48,176700 Veterans benefits and services .................................................................. 6,042 6,729 7,082 7,767 8,799 10,098 11,180 12,472750 Administration of justice .............................................................................. 1 1 1 1 1 1 1 2800 General government ................................................................................... .................. .................. .................. .................. .................. .................. .................. ..................
Total direct payments for individuals ................................................... 32,771 38,392 43,779 49,983 56,079 70,030 79,112 90,860
Grants to States for Payments for Individuals:050 National defense ......................................................................................... .................. .................. .................. .................. .................. .................. .................. ..................150 International affairs ...................................................................................... .................. .................. .................. .................. .................. .................. .................. ..................300 Natural resources and environment ........................................................... .................. .................. .................. .................. .................. .................. .................. ..................350 Agriculture .................................................................................................... .................. .................. .................. .................. .................. .................. .................. ..................400 Transportation .............................................................................................. .................. .................. .................. .................. .................. .................. .................. ..................500 Education, training, employment, and social services ............................... .................. .................. .................. .................. .................. .................. .................. ..................550 Health .......................................................................................................... 956 1,430 2,119 2,694 3,187 3,842 5,301 5,439570 Medicare ...................................................................................................... .................. .................. .................. .................. .................. .................. .................. ..................600 Income security ........................................................................................... 3,340 3,379 3,940 4,535 5,523 6,672 8,624 8,421650 Social security ............................................................................................. .................. .................. .................. .................. .................. .................. .................. ..................700 Veterans benefits and services .................................................................. 9 9 11 14 17 18 18 20750 Administration of justice .............................................................................. .................. .................. .................. .................. .................. .................. .................. ..................800 General government ................................................................................... .................. .................. .................. .................. .................. .................. .................. ..................
Total grants for payments for individuals ........................................... 4,305 4,819 6,070 7,243 8,727 10,533 13,943 13,879
Total Payments for Individuals:050 National defense ......................................................................................... .................. .................. .................. .................. .................. .................. .................. ..................150 International affairs ...................................................................................... .................. .................. .................. .................. .................. .................. .................. ..................300 Natural resources and environment ........................................................... .................. .................. .................. .................. .................. .................. .................. ..................350 Agriculture .................................................................................................... .................. .................. .................. .................. .................. .................. .................. ..................400 Transportation .............................................................................................. 41 45 48 53 59 65 71 76500 Education, training, employment, and social services ............................... 45 226 460 570 503 904 1,067 1,199550 Health .......................................................................................................... 1,154 1,678 2,310 2,956 3,534 4,270 5,734 5,936570 Medicare ...................................................................................................... .................. 3,172 5,126 6,299 6,784 7,478 8,364 9,040600 Income security ........................................................................................... 9,520 10,059 11,512 12,861 15,458 22,598 27,257 27,818650 Social security ............................................................................................. 20,264 21,293 23,299 26,705 29,651 35,132 39,364 48,176700 Veterans benefits and services .................................................................. 6,051 6,737 7,093 7,781 8,816 10,116 11,198 12,492750 Administration of justice .............................................................................. 1 1 1 1 1 1 1 2800 General government ................................................................................... .................. .................. .................. .................. .................. .................. .................. ..................
Total payments for individuals .............................................................. 37,076 43,211 49,849 57,225 64,806 80,564 93,055 104,739
See footnotes at end of table.
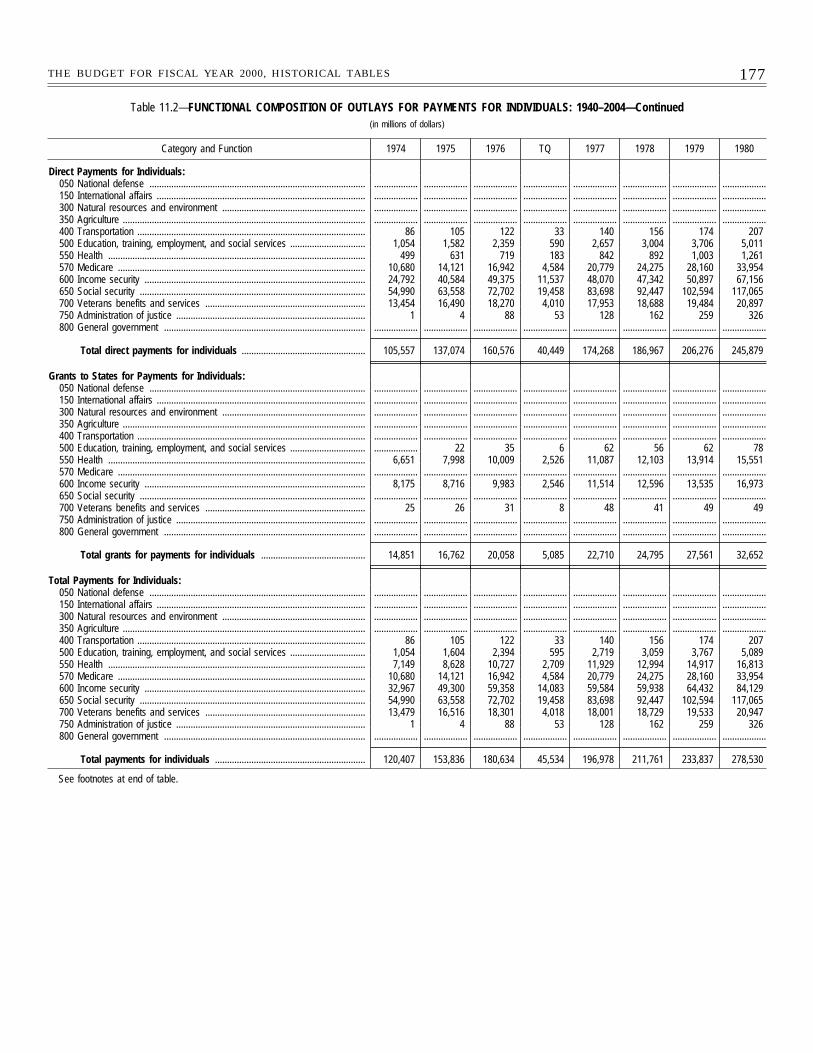
177THE BUDGET FOR FISCAL YEAR 2000, HISTORICAL TABLES
Table 11.2—FUNCTIONAL COMPOSITION OF OUTLAYS FOR PAYMENTS FOR INDIVIDUALS: 1940–2004—Continued(in millions of dollars)
Category and Function 1974 1975 1976 TQ 1977 1978 1979 1980
Direct Payments for Individuals:050 National defense ......................................................................................... .................. .................. .................. .................. .................. .................. .................. ..................150 International affairs ...................................................................................... .................. .................. .................. .................. .................. .................. .................. ..................300 Natural resources and environment ........................................................... .................. .................. .................. .................. .................. .................. .................. ..................350 Agriculture .................................................................................................... .................. .................. .................. .................. .................. .................. .................. ..................400 Transportation .............................................................................................. 86 105 122 33 140 156 174 207500 Education, training, employment, and social services ............................... 1,054 1,582 2,359 590 2,657 3,004 3,706 5,011550 Health .......................................................................................................... 499 631 719 183 842 892 1,003 1,261570 Medicare ...................................................................................................... 10,680 14,121 16,942 4,584 20,779 24,275 28,160 33,954600 Income security ........................................................................................... 24,792 40,584 49,375 11,537 48,070 47,342 50,897 67,156650 Social security ............................................................................................. 54,990 63,558 72,702 19,458 83,698 92,447 102,594 117,065700 Veterans benefits and services .................................................................. 13,454 16,490 18,270 4,010 17,953 18,688 19,484 20,897750 Administration of justice .............................................................................. 1 4 88 53 128 162 259 326800 General government ................................................................................... .................. .................. .................. .................. .................. .................. .................. ..................
Total direct payments for individuals ................................................... 105,557 137,074 160,576 40,449 174,268 186,967 206,276 245,879
Grants to States for Payments for Individuals:050 National defense ......................................................................................... .................. .................. .................. .................. .................. .................. .................. ..................150 International affairs ...................................................................................... .................. .................. .................. .................. .................. .................. .................. ..................300 Natural resources and environment ........................................................... .................. .................. .................. .................. .................. .................. .................. ..................350 Agriculture .................................................................................................... .................. .................. .................. .................. .................. .................. .................. ..................400 Transportation .............................................................................................. .................. .................. .................. .................. .................. .................. .................. ..................500 Education, training, employment, and social services ............................... .................. 22 35 6 62 56 62 78550 Health .......................................................................................................... 6,651 7,998 10,009 2,526 11,087 12,103 13,914 15,551570 Medicare ...................................................................................................... .................. .................. .................. .................. .................. .................. .................. ..................600 Income security ........................................................................................... 8,175 8,716 9,983 2,546 11,514 12,596 13,535 16,973650 Social security ............................................................................................. .................. .................. .................. .................. .................. .................. .................. ..................700 Veterans benefits and services .................................................................. 25 26 31 8 48 41 49 49750 Administration of justice .............................................................................. .................. .................. .................. .................. .................. .................. .................. ..................800 General government ................................................................................... .................. .................. .................. .................. .................. .................. .................. ..................
Total grants for payments for individuals ........................................... 14,851 16,762 20,058 5,085 22,710 24,795 27,561 32,652
Total Payments for Individuals:050 National defense ......................................................................................... .................. .................. .................. .................. .................. .................. .................. ..................150 International affairs ...................................................................................... .................. .................. .................. .................. .................. .................. .................. ..................300 Natural resources and environment ........................................................... .................. .................. .................. .................. .................. .................. .................. ..................350 Agriculture .................................................................................................... .................. .................. .................. .................. .................. .................. .................. ..................400 Transportation .............................................................................................. 86 105 122 33 140 156 174 207500 Education, training, employment, and social services ............................... 1,054 1,604 2,394 595 2,719 3,059 3,767 5,089550 Health .......................................................................................................... 7,149 8,628 10,727 2,709 11,929 12,994 14,917 16,813570 Medicare ...................................................................................................... 10,680 14,121 16,942 4,584 20,779 24,275 28,160 33,954600 Income security ........................................................................................... 32,967 49,300 59,358 14,083 59,584 59,938 64,432 84,129650 Social security ............................................................................................. 54,990 63,558 72,702 19,458 83,698 92,447 102,594 117,065700 Veterans benefits and services .................................................................. 13,479 16,516 18,301 4,018 18,001 18,729 19,533 20,947750 Administration of justice .............................................................................. 1 4 88 53 128 162 259 326800 General government ................................................................................... .................. .................. .................. .................. .................. .................. .................. ..................
Total payments for individuals .............................................................. 120,407 153,836 180,634 45,534 196,978 211,761 233,837 278,530
See footnotes at end of table.
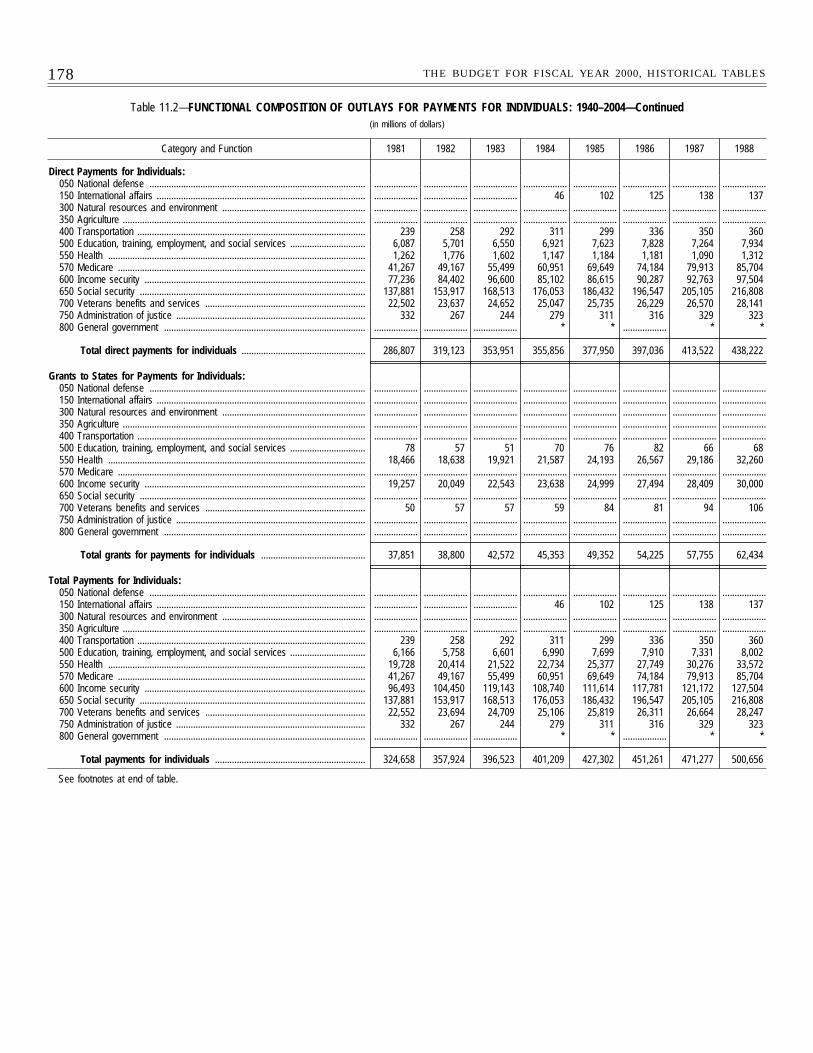
178 THE BUDGET FOR FISCAL YEAR 2000, HISTORICAL TABLES
Table 11.2—FUNCTIONAL COMPOSITION OF OUTLAYS FOR PAYMENTS FOR INDIVIDUALS: 1940–2004—Continued(in millions of dollars)
Category and Function 1981 1982 1983 1984 1985 1986 1987 1988
Direct Payments for Individuals:050 National defense ......................................................................................... .................. .................. .................. .................. .................. .................. .................. ..................150 International affairs ...................................................................................... .................. .................. .................. 46 102 125 138 137300 Natural resources and environment ........................................................... .................. .................. .................. .................. .................. .................. .................. ..................350 Agriculture .................................................................................................... .................. .................. .................. .................. .................. .................. .................. ..................400 Transportation .............................................................................................. 239 258 292 311 299 336 350 360500 Education, training, employment, and social services ............................... 6,087 5,701 6,550 6,921 7,623 7,828 7,264 7,934550 Health .......................................................................................................... 1,262 1,776 1,602 1,147 1,184 1,181 1,090 1,312570 Medicare ...................................................................................................... 41,267 49,167 55,499 60,951 69,649 74,184 79,913 85,704600 Income security ........................................................................................... 77,236 84,402 96,600 85,102 86,615 90,287 92,763 97,504650 Social security ............................................................................................. 137,881 153,917 168,513 176,053 186,432 196,547 205,105 216,808700 Veterans benefits and services .................................................................. 22,502 23,637 24,652 25,047 25,735 26,229 26,570 28,141750 Administration of justice .............................................................................. 332 267 244 279 311 316 329 323800 General government ................................................................................... .................. .................. .................. * * .................. * *
Total direct payments for individuals ................................................... 286,807 319,123 353,951 355,856 377,950 397,036 413,522 438,222
Grants to States for Payments for Individuals:050 National defense ......................................................................................... .................. .................. .................. .................. .................. .................. .................. ..................150 International affairs ...................................................................................... .................. .................. .................. .................. .................. .................. .................. ..................300 Natural resources and environment ........................................................... .................. .................. .................. .................. .................. .................. .................. ..................350 Agriculture .................................................................................................... .................. .................. .................. .................. .................. .................. .................. ..................400 Transportation .............................................................................................. .................. .................. .................. .................. .................. .................. .................. ..................500 Education, training, employment, and social services ............................... 78 57 51 70 76 82 66 68550 Health .......................................................................................................... 18,466 18,638 19,921 21,587 24,193 26,567 29,186 32,260570 Medicare ...................................................................................................... .................. .................. .................. .................. .................. .................. .................. ..................600 Income security ........................................................................................... 19,257 20,049 22,543 23,638 24,999 27,494 28,409 30,000650 Social security ............................................................................................. .................. .................. .................. .................. .................. .................. .................. ..................700 Veterans benefits and services .................................................................. 50 57 57 59 84 81 94 106750 Administration of justice .............................................................................. .................. .................. .................. .................. .................. .................. .................. ..................800 General government ................................................................................... .................. .................. .................. .................. .................. .................. .................. ..................
Total grants for payments for individuals ........................................... 37,851 38,800 42,572 45,353 49,352 54,225 57,755 62,434
Total Payments for Individuals:050 National defense ......................................................................................... .................. .................. .................. .................. .................. .................. .................. ..................150 International affairs ...................................................................................... .................. .................. .................. 46 102 125 138 137300 Natural resources and environment ........................................................... .................. .................. .................. .................. .................. .................. .................. ..................350 Agriculture .................................................................................................... .................. .................. .................. .................. .................. .................. .................. ..................400 Transportation .............................................................................................. 239 258 292 311 299 336 350 360500 Education, training, employment, and social services ............................... 6,166 5,758 6,601 6,990 7,699 7,910 7,331 8,002550 Health .......................................................................................................... 19,728 20,414 21,522 22,734 25,377 27,749 30,276 33,572570 Medicare ...................................................................................................... 41,267 49,167 55,499 60,951 69,649 74,184 79,913 85,704600 Income security ........................................................................................... 96,493 104,450 119,143 108,740 111,614 117,781 121,172 127,504650 Social security ............................................................................................. 137,881 153,917 168,513 176,053 186,432 196,547 205,105 216,808700 Veterans benefits and services .................................................................. 22,552 23,694 24,709 25,106 25,819 26,311 26,664 28,247750 Administration of justice .............................................................................. 332 267 244 279 311 316 329 323800 General government ................................................................................... .................. .................. .................. * * .................. * *
Total payments for individuals .............................................................. 324,658 357,924 396,523 401,209 427,302 451,261 471,277 500,656
See footnotes at end of table.
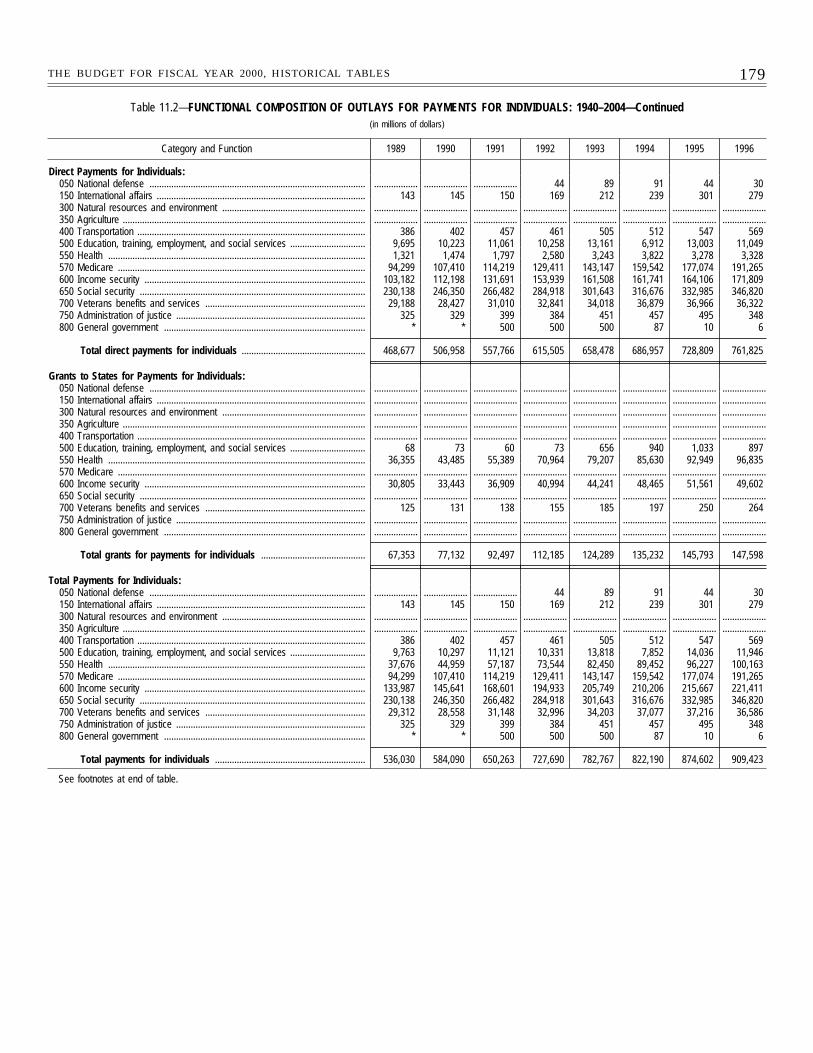
179THE BUDGET FOR FISCAL YEAR 2000, HISTORICAL TABLES
Table 11.2—FUNCTIONAL COMPOSITION OF OUTLAYS FOR PAYMENTS FOR INDIVIDUALS: 1940–2004—Continued(in millions of dollars)
Category and Function 1989 1990 1991 1992 1993 1994 1995 1996
Direct Payments for Individuals:050 National defense ......................................................................................... .................. .................. .................. 44 89 91 44 30150 International affairs ...................................................................................... 143 145 150 169 212 239 301 279300 Natural resources and environment ........................................................... .................. .................. .................. .................. .................. .................. .................. ..................350 Agriculture .................................................................................................... .................. .................. .................. .................. .................. .................. .................. ..................400 Transportation .............................................................................................. 386 402 457 461 505 512 547 569500 Education, training, employment, and social services ............................... 9,695 10,223 11,061 10,258 13,161 6,912 13,003 11,049550 Health .......................................................................................................... 1,321 1,474 1,797 2,580 3,243 3,822 3,278 3,328570 Medicare ...................................................................................................... 94,299 107,410 114,219 129,411 143,147 159,542 177,074 191,265600 Income security ........................................................................................... 103,182 112,198 131,691 153,939 161,508 161,741 164,106 171,809650 Social security ............................................................................................. 230,138 246,350 266,482 284,918 301,643 316,676 332,985 346,820700 Veterans benefits and services .................................................................. 29,188 28,427 31,010 32,841 34,018 36,879 36,966 36,322750 Administration of justice .............................................................................. 325 329 399 384 451 457 495 348800 General government ................................................................................... * * 500 500 500 87 10 6
Total direct payments for individuals ................................................... 468,677 506,958 557,766 615,505 658,478 686,957 728,809 761,825
Grants to States for Payments for Individuals:050 National defense ......................................................................................... .................. .................. .................. .................. .................. .................. .................. ..................150 International affairs ...................................................................................... .................. .................. .................. .................. .................. .................. .................. ..................300 Natural resources and environment ........................................................... .................. .................. .................. .................. .................. .................. .................. ..................350 Agriculture .................................................................................................... .................. .................. .................. .................. .................. .................. .................. ..................400 Transportation .............................................................................................. .................. .................. .................. .................. .................. .................. .................. ..................500 Education, training, employment, and social services ............................... 68 73 60 73 656 940 1,033 897550 Health .......................................................................................................... 36,355 43,485 55,389 70,964 79,207 85,630 92,949 96,835570 Medicare ...................................................................................................... .................. .................. .................. .................. .................. .................. .................. ..................600 Income security ........................................................................................... 30,805 33,443 36,909 40,994 44,241 48,465 51,561 49,602650 Social security ............................................................................................. .................. .................. .................. .................. .................. .................. .................. ..................700 Veterans benefits and services .................................................................. 125 131 138 155 185 197 250 264750 Administration of justice .............................................................................. .................. .................. .................. .................. .................. .................. .................. ..................800 General government ................................................................................... .................. .................. .................. .................. .................. .................. .................. ..................
Total grants for payments for individuals ........................................... 67,353 77,132 92,497 112,185 124,289 135,232 145,793 147,598
Total Payments for Individuals:050 National defense ......................................................................................... .................. .................. .................. 44 89 91 44 30150 International affairs ...................................................................................... 143 145 150 169 212 239 301 279300 Natural resources and environment ........................................................... .................. .................. .................. .................. .................. .................. .................. ..................350 Agriculture .................................................................................................... .................. .................. .................. .................. .................. .................. .................. ..................400 Transportation .............................................................................................. 386 402 457 461 505 512 547 569500 Education, training, employment, and social services ............................... 9,763 10,297 11,121 10,331 13,818 7,852 14,036 11,946550 Health .......................................................................................................... 37,676 44,959 57,187 73,544 82,450 89,452 96,227 100,163570 Medicare ...................................................................................................... 94,299 107,410 114,219 129,411 143,147 159,542 177,074 191,265600 Income security ........................................................................................... 133,987 145,641 168,601 194,933 205,749 210,206 215,667 221,411650 Social security ............................................................................................. 230,138 246,350 266,482 284,918 301,643 316,676 332,985 346,820700 Veterans benefits and services .................................................................. 29,312 28,558 31,148 32,996 34,203 37,077 37,216 36,586750 Administration of justice .............................................................................. 325 329 399 384 451 457 495 348800 General government ................................................................................... * * 500 500 500 87 10 6
Total payments for individuals .............................................................. 536,030 584,090 650,263 727,690 782,767 822,190 874,602 909,423
See footnotes at end of table.
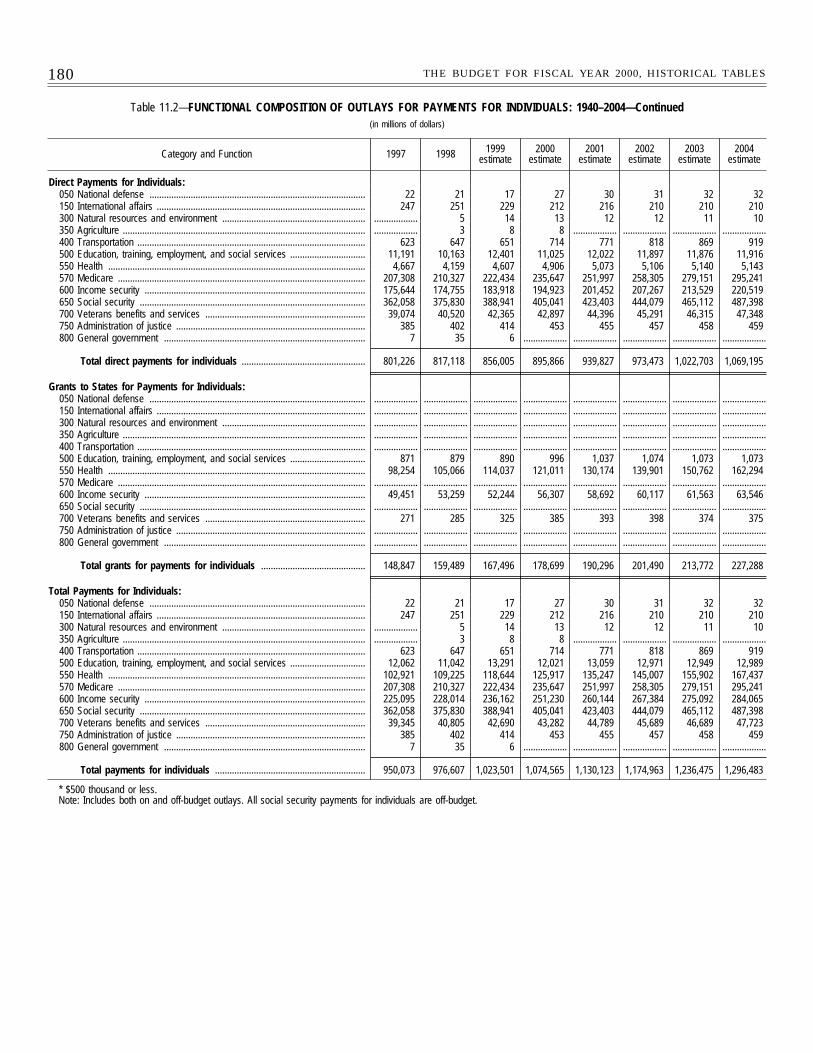
180 THE BUDGET FOR FISCAL YEAR 2000, HISTORICAL TABLES
Table 11.2—FUNCTIONAL COMPOSITION OF OUTLAYS FOR PAYMENTS FOR INDIVIDUALS: 1940–2004—Continued(in millions of dollars)
Category and Function 1997 1998 1999estimate
2000estimate
2001estimate
2002estimate
2003estimate
2004estimate
Direct Payments for Individuals:050 National defense ......................................................................................... 22 21 17 27 30 31 32 32150 International affairs ...................................................................................... 247 251 229 212 216 210 210 210300 Natural resources and environment ........................................................... .................. 5 14 13 12 12 11 10350 Agriculture .................................................................................................... .................. 3 8 8 .................. .................. .................. ..................400 Transportation .............................................................................................. 623 647 651 714 771 818 869 919500 Education, training, employment, and social services ............................... 11,191 10,163 12,401 11,025 12,022 11,897 11,876 11,916550 Health .......................................................................................................... 4,667 4,159 4,607 4,906 5,073 5,106 5,140 5,143570 Medicare ...................................................................................................... 207,308 210,327 222,434 235,647 251,997 258,305 279,151 295,241600 Income security ........................................................................................... 175,644 174,755 183,918 194,923 201,452 207,267 213,529 220,519650 Social security ............................................................................................. 362,058 375,830 388,941 405,041 423,403 444,079 465,112 487,398700 Veterans benefits and services .................................................................. 39,074 40,520 42,365 42,897 44,396 45,291 46,315 47,348750 Administration of justice .............................................................................. 385 402 414 453 455 457 458 459800 General government ................................................................................... 7 35 6 .................. .................. .................. .................. ..................
Total direct payments for individuals ................................................... 801,226 817,118 856,005 895,866 939,827 973,473 1,022,703 1,069,195
Grants to States for Payments for Individuals:050 National defense ......................................................................................... .................. .................. .................. .................. .................. .................. .................. ..................150 International affairs ...................................................................................... .................. .................. .................. .................. .................. .................. .................. ..................300 Natural resources and environment ........................................................... .................. .................. .................. .................. .................. .................. .................. ..................350 Agriculture .................................................................................................... .................. .................. .................. .................. .................. .................. .................. ..................400 Transportation .............................................................................................. .................. .................. .................. .................. .................. .................. .................. ..................500 Education, training, employment, and social services ............................... 871 879 890 996 1,037 1,074 1,073 1,073550 Health .......................................................................................................... 98,254 105,066 114,037 121,011 130,174 139,901 150,762 162,294570 Medicare ...................................................................................................... .................. .................. .................. .................. .................. .................. .................. ..................600 Income security ........................................................................................... 49,451 53,259 52,244 56,307 58,692 60,117 61,563 63,546650 Social security ............................................................................................. .................. .................. .................. .................. .................. .................. .................. ..................700 Veterans benefits and services .................................................................. 271 285 325 385 393 398 374 375750 Administration of justice .............................................................................. .................. .................. .................. .................. .................. .................. .................. ..................800 General government ................................................................................... .................. .................. .................. .................. .................. .................. .................. ..................
Total grants for payments for individuals ........................................... 148,847 159,489 167,496 178,699 190,296 201,490 213,772 227,288
Total Payments for Individuals:050 National defense ......................................................................................... 22 21 17 27 30 31 32 32150 International affairs ...................................................................................... 247 251 229 212 216 210 210 210300 Natural resources and environment ........................................................... .................. 5 14 13 12 12 11 10350 Agriculture .................................................................................................... .................. 3 8 8 .................. .................. .................. ..................400 Transportation .............................................................................................. 623 647 651 714 771 818 869 919500 Education, training, employment, and social services ............................... 12,062 11,042 13,291 12,021 13,059 12,971 12,949 12,989550 Health .......................................................................................................... 102,921 109,225 118,644 125,917 135,247 145,007 155,902 167,437570 Medicare ...................................................................................................... 207,308 210,327 222,434 235,647 251,997 258,305 279,151 295,241600 Income security ........................................................................................... 225,095 228,014 236,162 251,230 260,144 267,384 275,092 284,065650 Social security ............................................................................................. 362,058 375,830 388,941 405,041 423,403 444,079 465,112 487,398700 Veterans benefits and services .................................................................. 39,345 40,805 42,690 43,282 44,789 45,689 46,689 47,723750 Administration of justice .............................................................................. 385 402 414 453 455 457 458 459800 General government ................................................................................... 7 35 6 .................. .................. .................. .................. ..................
Total payments for individuals .............................................................. 950,073 976,607 1,023,501 1,074,565 1,130,123 1,174,963 1,236,475 1,296,483
* $500 thousand or less.Note: Includes both on and off-budget outlays. All social security payments for individuals are off-budget.
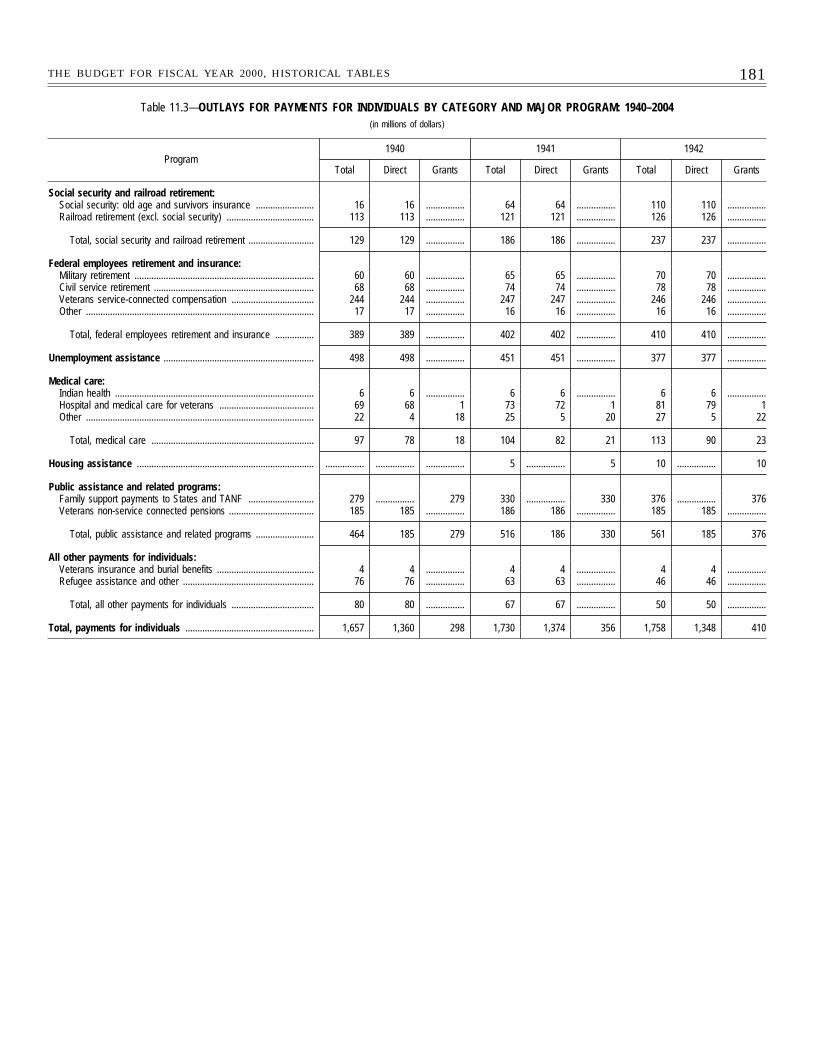
181THE BUDGET FOR FISCAL YEAR 2000, HISTORICAL TABLES
Table 11.3—OUTLAYS FOR PAYMENTS FOR INDIVIDUALS BY CATEGORY AND MAJOR PROGRAM: 1940–2004(in millions of dollars)
Program1940 1941 1942
Total Direct Grants Total Direct Grants Total Direct Grants
Social security and railroad retirement:Social security: old age and survivors insurance ........................ 16 16 ................ 64 64 ................ 110 110 ................Railroad retirement (excl. social security) .................................... 113 113 ................ 121 121 ................ 126 126 ................
Total, social security and railroad retirement ........................... 129 129 ................ 186 186 ................ 237 237 ................
Federal employees retirement and insurance:Military retirement .......................................................................... 60 60 ................ 65 65 ................ 70 70 ................Civil service retirement .................................................................. 68 68 ................ 74 74 ................ 78 78 ................Veterans service-connected compensation .................................. 244 244 ................ 247 247 ................ 246 246 ................Other .............................................................................................. 17 17 ................ 16 16 ................ 16 16 ................
Total, federal employees retirement and insurance ................ 389 389 ................ 402 402 ................ 410 410 ................
Unemployment assistance .............................................................. 498 498 ................ 451 451 ................ 377 377 ................
Medical care:Indian health .................................................................................. 6 6 ................ 6 6 ................ 6 6 ................Hospital and medical care for veterans ....................................... 69 68 1 73 72 1 81 79 1Other .............................................................................................. 22 4 18 25 5 20 27 5 22
Total, medical care ................................................................... 97 78 18 104 82 21 113 90 23
Housing assistance ......................................................................... ................ ................ ................ 5 ................ 5 10 ................ 10
Public assistance and related programs:Family support payments to States and TANF ........................... 279 ................ 279 330 ................ 330 376 ................ 376Veterans non-service connected pensions ................................... 185 185 ................ 186 186 ................ 185 185 ................
Total, public assistance and related programs ........................ 464 185 279 516 186 330 561 185 376
All other payments for individuals:Veterans insurance and burial benefits ........................................ 4 4 ................ 4 4 ................ 4 4 ................Refugee assistance and other ...................................................... 76 76 ................ 63 63 ................ 46 46 ................
Total, all other payments for individuals .................................. 80 80 ................ 67 67 ................ 50 50 ................
Total, payments for individuals ..................................................... 1,657 1,360 298 1,730 1,374 356 1,758 1,348 410
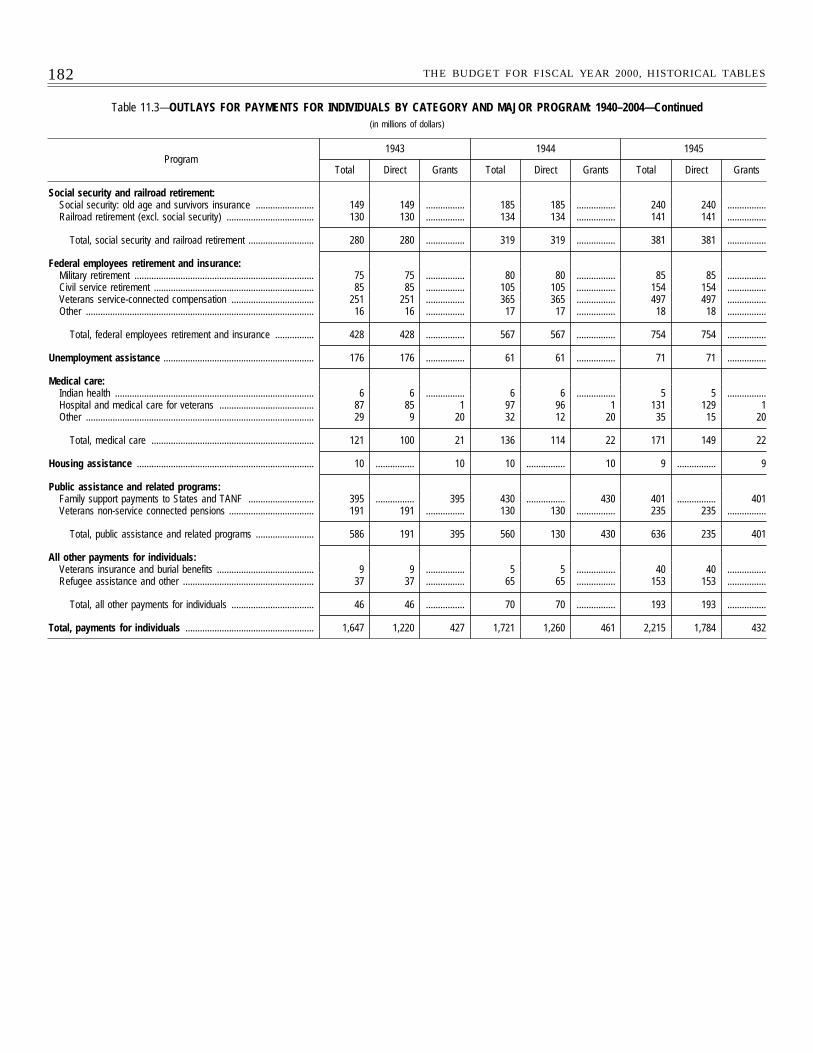
182 THE BUDGET FOR FISCAL YEAR 2000, HISTORICAL TABLES
Table 11.3—OUTLAYS FOR PAYMENTS FOR INDIVIDUALS BY CATEGORY AND MAJOR PROGRAM: 1940–2004—Continued(in millions of dollars)
Program1943 1944 1945
Total Direct Grants Total Direct Grants Total Direct Grants
Social security and railroad retirement:Social security: old age and survivors insurance ........................ 149 149 ................ 185 185 ................ 240 240 ................Railroad retirement (excl. social security) .................................... 130 130 ................ 134 134 ................ 141 141 ................
Total, social security and railroad retirement ........................... 280 280 ................ 319 319 ................ 381 381 ................
Federal employees retirement and insurance:Military retirement .......................................................................... 75 75 ................ 80 80 ................ 85 85 ................Civil service retirement .................................................................. 85 85 ................ 105 105 ................ 154 154 ................Veterans service-connected compensation .................................. 251 251 ................ 365 365 ................ 497 497 ................Other .............................................................................................. 16 16 ................ 17 17 ................ 18 18 ................
Total, federal employees retirement and insurance ................ 428 428 ................ 567 567 ................ 754 754 ................
Unemployment assistance .............................................................. 176 176 ................ 61 61 ................ 71 71 ................
Medical care:Indian health .................................................................................. 6 6 ................ 6 6 ................ 5 5 ................Hospital and medical care for veterans ....................................... 87 85 1 97 96 1 131 129 1Other .............................................................................................. 29 9 20 32 12 20 35 15 20
Total, medical care ................................................................... 121 100 21 136 114 22 171 149 22
Housing assistance ......................................................................... 10 ................ 10 10 ................ 10 9 ................ 9
Public assistance and related programs:Family support payments to States and TANF ........................... 395 ................ 395 430 ................ 430 401 ................ 401Veterans non-service connected pensions ................................... 191 191 ................ 130 130 ................ 235 235 ................
Total, public assistance and related programs ........................ 586 191 395 560 130 430 636 235 401
All other payments for individuals:Veterans insurance and burial benefits ........................................ 9 9 ................ 5 5 ................ 40 40 ................Refugee assistance and other ...................................................... 37 37 ................ 65 65 ................ 153 153 ................
Total, all other payments for individuals .................................. 46 46 ................ 70 70 ................ 193 193 ................
Total, payments for individuals ..................................................... 1,647 1,220 427 1,721 1,260 461 2,215 1,784 432
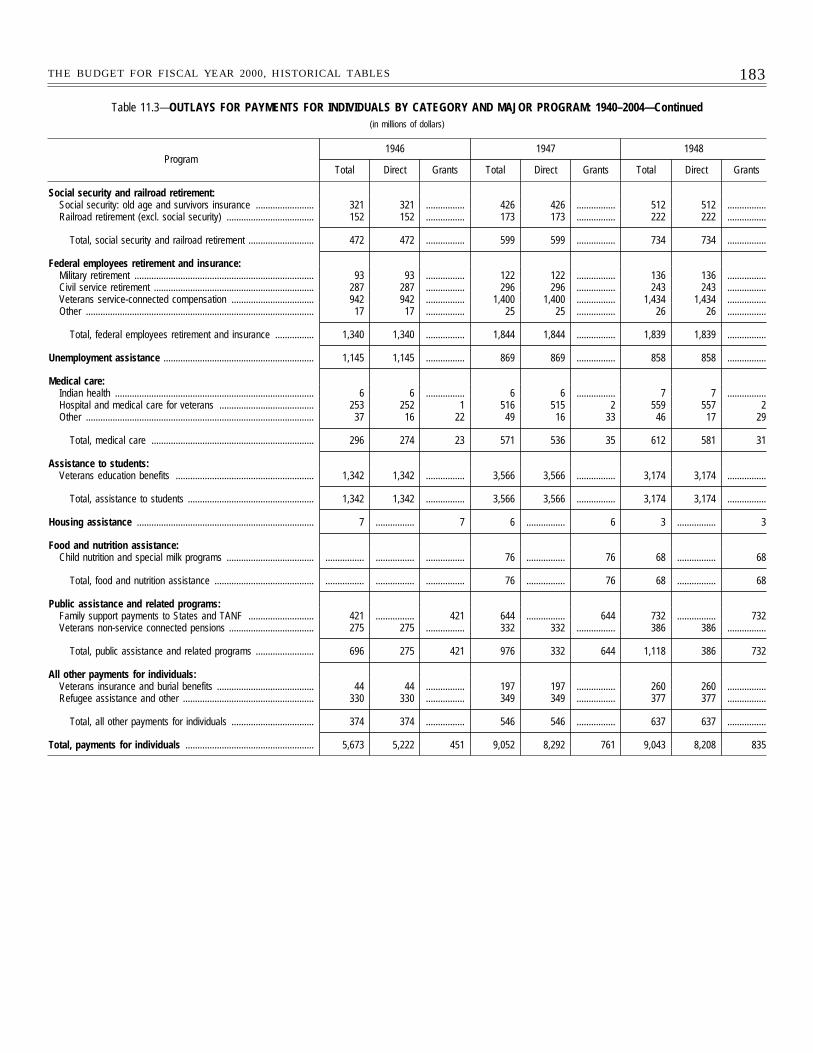
183THE BUDGET FOR FISCAL YEAR 2000, HISTORICAL TABLES
Table 11.3—OUTLAYS FOR PAYMENTS FOR INDIVIDUALS BY CATEGORY AND MAJOR PROGRAM: 1940–2004—Continued(in millions of dollars)
Program1946 1947 1948
Total Direct Grants Total Direct Grants Total Direct Grants
Social security and railroad retirement:Social security: old age and survivors insurance ........................ 321 321 ................ 426 426 ................ 512 512 ................Railroad retirement (excl. social security) .................................... 152 152 ................ 173 173 ................ 222 222 ................
Total, social security and railroad retirement ........................... 472 472 ................ 599 599 ................ 734 734 ................
Federal employees retirement and insurance:Military retirement .......................................................................... 93 93 ................ 122 122 ................ 136 136 ................Civil service retirement .................................................................. 287 287 ................ 296 296 ................ 243 243 ................Veterans service-connected compensation .................................. 942 942 ................ 1,400 1,400 ................ 1,434 1,434 ................Other .............................................................................................. 17 17 ................ 25 25 ................ 26 26 ................
Total, federal employees retirement and insurance ................ 1,340 1,340 ................ 1,844 1,844 ................ 1,839 1,839 ................
Unemployment assistance .............................................................. 1,145 1,145 ................ 869 869 ................ 858 858 ................
Medical care:Indian health .................................................................................. 6 6 ................ 6 6 ................ 7 7 ................Hospital and medical care for veterans ....................................... 253 252 1 516 515 2 559 557 2Other .............................................................................................. 37 16 22 49 16 33 46 17 29
Total, medical care ................................................................... 296 274 23 571 536 35 612 581 31
Assistance to students:Veterans education benefits ......................................................... 1,342 1,342 ................ 3,566 3,566 ................ 3,174 3,174 ................
Total, assistance to students .................................................... 1,342 1,342 ................ 3,566 3,566 ................ 3,174 3,174 ................
Housing assistance ......................................................................... 7 ................ 7 6 ................ 6 3 ................ 3
Food and nutrition assistance:Child nutrition and special milk programs .................................... ................ ................ ................ 76 ................ 76 68 ................ 68
Total, food and nutrition assistance ......................................... ................ ................ ................ 76 ................ 76 68 ................ 68
Public assistance and related programs:Family support payments to States and TANF ........................... 421 ................ 421 644 ................ 644 732 ................ 732Veterans non-service connected pensions ................................... 275 275 ................ 332 332 ................ 386 386 ................
Total, public assistance and related programs ........................ 696 275 421 976 332 644 1,118 386 732
All other payments for individuals:Veterans insurance and burial benefits ........................................ 44 44 ................ 197 197 ................ 260 260 ................Refugee assistance and other ...................................................... 330 330 ................ 349 349 ................ 377 377 ................
Total, all other payments for individuals .................................. 374 374 ................ 546 546 ................ 637 637 ................
Total, payments for individuals ..................................................... 5,673 5,222 451 9,052 8,292 761 9,043 8,208 835
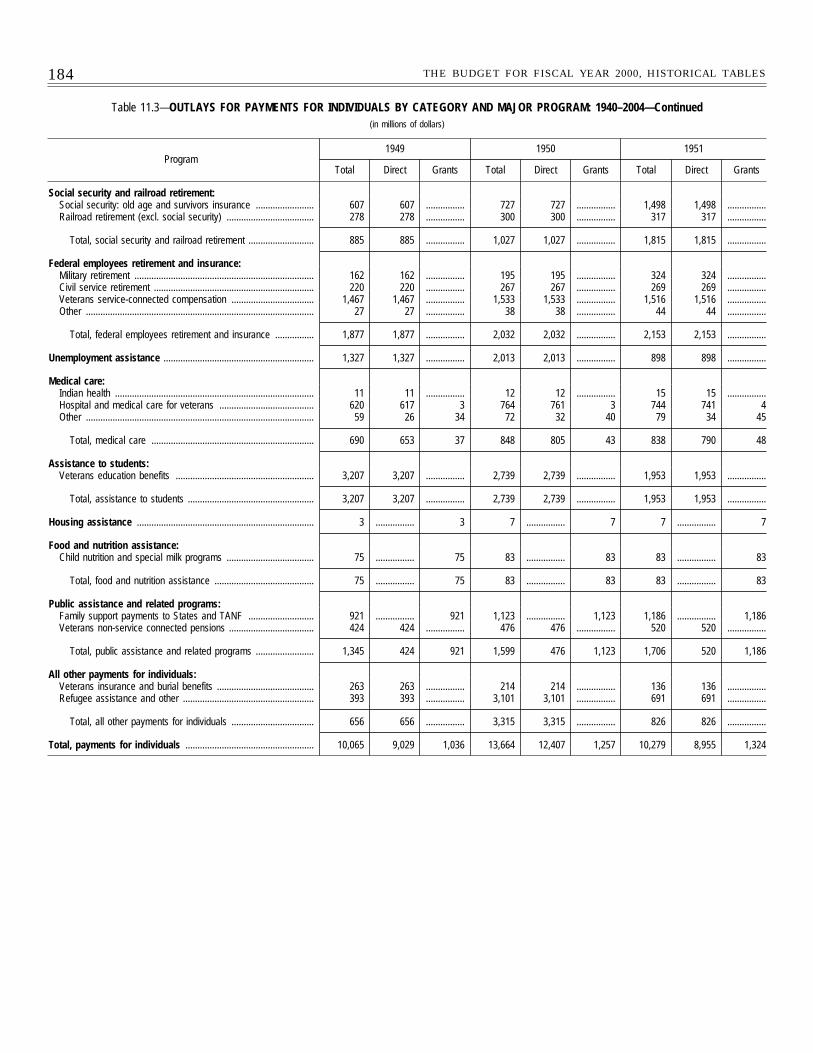
184 THE BUDGET FOR FISCAL YEAR 2000, HISTORICAL TABLES
Table 11.3—OUTLAYS FOR PAYMENTS FOR INDIVIDUALS BY CATEGORY AND MAJOR PROGRAM: 1940–2004—Continued(in millions of dollars)
Program1949 1950 1951
Total Direct Grants Total Direct Grants Total Direct Grants
Social security and railroad retirement:Social security: old age and survivors insurance ........................ 607 607 ................ 727 727 ................ 1,498 1,498 ................Railroad retirement (excl. social security) .................................... 278 278 ................ 300 300 ................ 317 317 ................
Total, social security and railroad retirement ........................... 885 885 ................ 1,027 1,027 ................ 1,815 1,815 ................
Federal employees retirement and insurance:Military retirement .......................................................................... 162 162 ................ 195 195 ................ 324 324 ................Civil service retirement .................................................................. 220 220 ................ 267 267 ................ 269 269 ................Veterans service-connected compensation .................................. 1,467 1,467 ................ 1,533 1,533 ................ 1,516 1,516 ................Other .............................................................................................. 27 27 ................ 38 38 ................ 44 44 ................
Total, federal employees retirement and insurance ................ 1,877 1,877 ................ 2,032 2,032 ................ 2,153 2,153 ................
Unemployment assistance .............................................................. 1,327 1,327 ................ 2,013 2,013 ................ 898 898 ................
Medical care:Indian health .................................................................................. 11 11 ................ 12 12 ................ 15 15 ................Hospital and medical care for veterans ....................................... 620 617 3 764 761 3 744 741 4Other .............................................................................................. 59 26 34 72 32 40 79 34 45
Total, medical care ................................................................... 690 653 37 848 805 43 838 790 48
Assistance to students:Veterans education benefits ......................................................... 3,207 3,207 ................ 2,739 2,739 ................ 1,953 1,953 ................
Total, assistance to students .................................................... 3,207 3,207 ................ 2,739 2,739 ................ 1,953 1,953 ................
Housing assistance ......................................................................... 3 ................ 3 7 ................ 7 7 ................ 7
Food and nutrition assistance:Child nutrition and special milk programs .................................... 75 ................ 75 83 ................ 83 83 ................ 83
Total, food and nutrition assistance ......................................... 75 ................ 75 83 ................ 83 83 ................ 83
Public assistance and related programs:Family support payments to States and TANF ........................... 921 ................ 921 1,123 ................ 1,123 1,186 ................ 1,186Veterans non-service connected pensions ................................... 424 424 ................ 476 476 ................ 520 520 ................
Total, public assistance and related programs ........................ 1,345 424 921 1,599 476 1,123 1,706 520 1,186
All other payments for individuals:Veterans insurance and burial benefits ........................................ 263 263 ................ 214 214 ................ 136 136 ................Refugee assistance and other ...................................................... 393 393 ................ 3,101 3,101 ................ 691 691 ................
Total, all other payments for individuals .................................. 656 656 ................ 3,315 3,315 ................ 826 826 ................
Total, payments for individuals ..................................................... 10,065 9,029 1,036 13,664 12,407 1,257 10,279 8,955 1,324
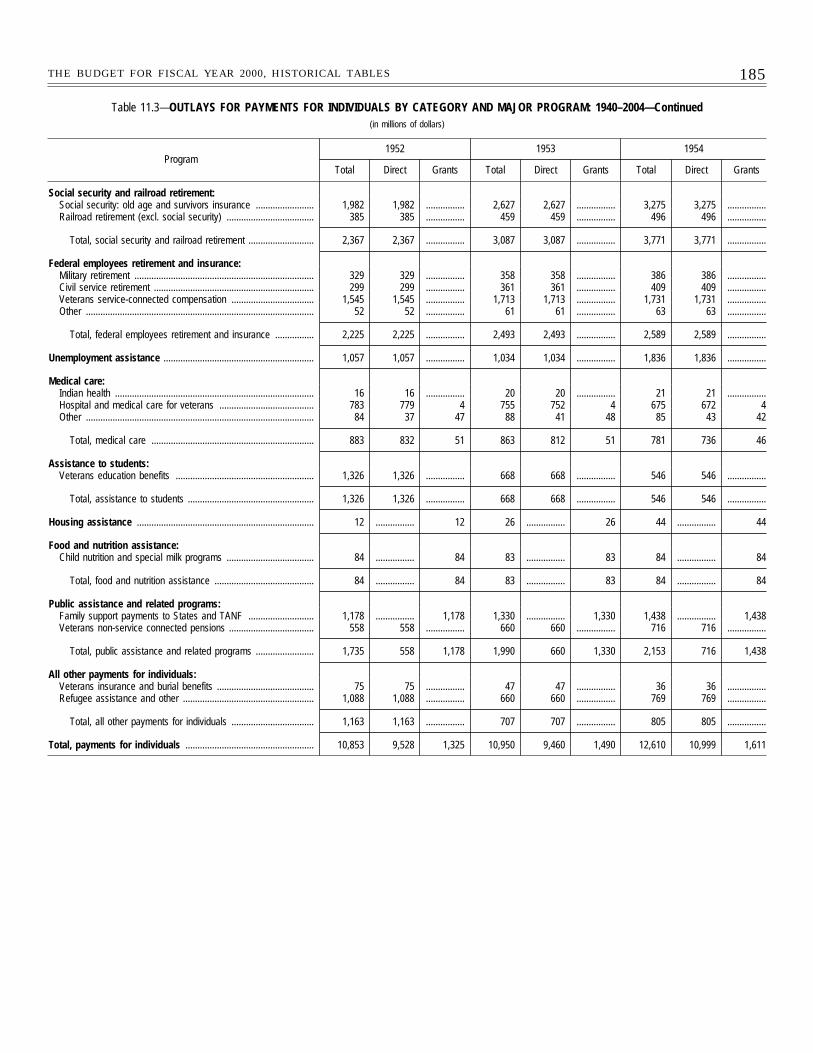
185THE BUDGET FOR FISCAL YEAR 2000, HISTORICAL TABLES
Table 11.3—OUTLAYS FOR PAYMENTS FOR INDIVIDUALS BY CATEGORY AND MAJOR PROGRAM: 1940–2004—Continued(in millions of dollars)
Program1952 1953 1954
Total Direct Grants Total Direct Grants Total Direct Grants
Social security and railroad retirement:Social security: old age and survivors insurance ........................ 1,982 1,982 ................ 2,627 2,627 ................ 3,275 3,275 ................Railroad retirement (excl. social security) .................................... 385 385 ................ 459 459 ................ 496 496 ................
Total, social security and railroad retirement ........................... 2,367 2,367 ................ 3,087 3,087 ................ 3,771 3,771 ................
Federal employees retirement and insurance:Military retirement .......................................................................... 329 329 ................ 358 358 ................ 386 386 ................Civil service retirement .................................................................. 299 299 ................ 361 361 ................ 409 409 ................Veterans service-connected compensation .................................. 1,545 1,545 ................ 1,713 1,713 ................ 1,731 1,731 ................Other .............................................................................................. 52 52 ................ 61 61 ................ 63 63 ................
Total, federal employees retirement and insurance ................ 2,225 2,225 ................ 2,493 2,493 ................ 2,589 2,589 ................
Unemployment assistance .............................................................. 1,057 1,057 ................ 1,034 1,034 ................ 1,836 1,836 ................
Medical care:Indian health .................................................................................. 16 16 ................ 20 20 ................ 21 21 ................Hospital and medical care for veterans ....................................... 783 779 4 755 752 4 675 672 4Other .............................................................................................. 84 37 47 88 41 48 85 43 42
Total, medical care ................................................................... 883 832 51 863 812 51 781 736 46
Assistance to students:Veterans education benefits ......................................................... 1,326 1,326 ................ 668 668 ................ 546 546 ................
Total, assistance to students .................................................... 1,326 1,326 ................ 668 668 ................ 546 546 ................
Housing assistance ......................................................................... 12 ................ 12 26 ................ 26 44 ................ 44
Food and nutrition assistance:Child nutrition and special milk programs .................................... 84 ................ 84 83 ................ 83 84 ................ 84
Total, food and nutrition assistance ......................................... 84 ................ 84 83 ................ 83 84 ................ 84
Public assistance and related programs:Family support payments to States and TANF ........................... 1,178 ................ 1,178 1,330 ................ 1,330 1,438 ................ 1,438Veterans non-service connected pensions ................................... 558 558 ................ 660 660 ................ 716 716 ................
Total, public assistance and related programs ........................ 1,735 558 1,178 1,990 660 1,330 2,153 716 1,438
All other payments for individuals:Veterans insurance and burial benefits ........................................ 75 75 ................ 47 47 ................ 36 36 ................Refugee assistance and other ...................................................... 1,088 1,088 ................ 660 660 ................ 769 769 ................
Total, all other payments for individuals .................................. 1,163 1,163 ................ 707 707 ................ 805 805 ................
Total, payments for individuals ..................................................... 10,853 9,528 1,325 10,950 9,460 1,490 12,610 10,999 1,611
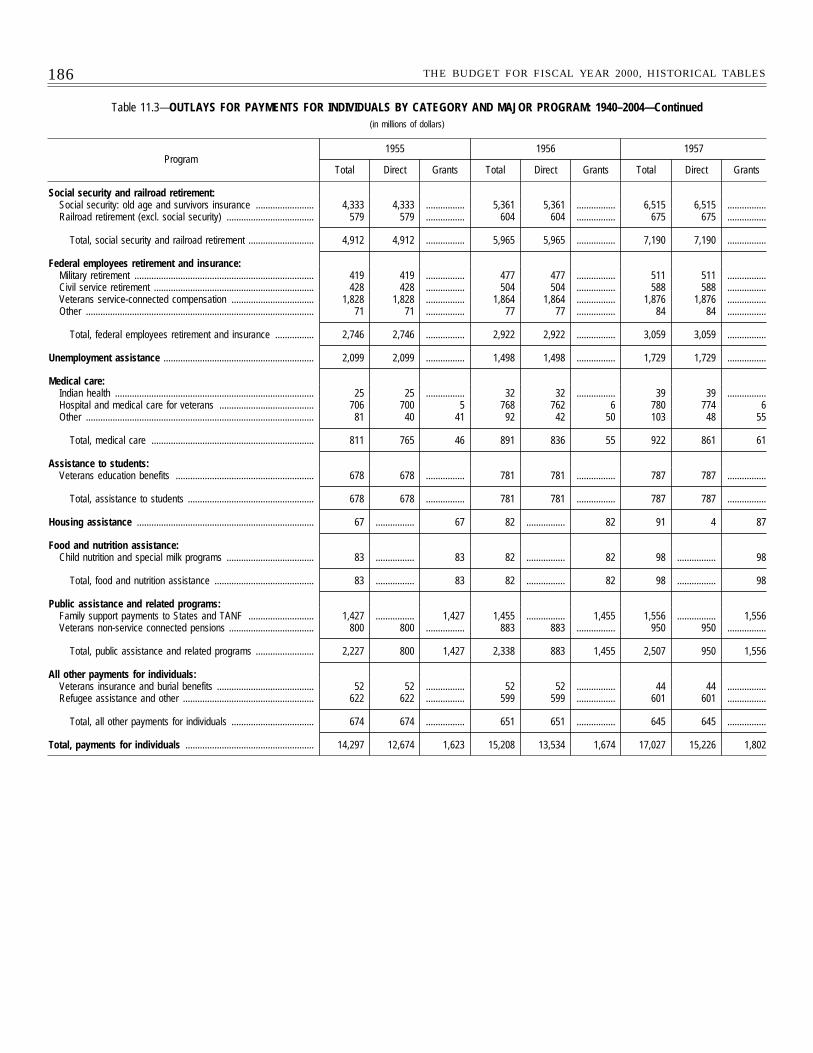
186 THE BUDGET FOR FISCAL YEAR 2000, HISTORICAL TABLES
Table 11.3—OUTLAYS FOR PAYMENTS FOR INDIVIDUALS BY CATEGORY AND MAJOR PROGRAM: 1940–2004—Continued(in millions of dollars)
Program1955 1956 1957
Total Direct Grants Total Direct Grants Total Direct Grants
Social security and railroad retirement:Social security: old age and survivors insurance ........................ 4,333 4,333 ................ 5,361 5,361 ................ 6,515 6,515 ................Railroad retirement (excl. social security) .................................... 579 579 ................ 604 604 ................ 675 675 ................
Total, social security and railroad retirement ........................... 4,912 4,912 ................ 5,965 5,965 ................ 7,190 7,190 ................
Federal employees retirement and insurance:Military retirement .......................................................................... 419 419 ................ 477 477 ................ 511 511 ................Civil service retirement .................................................................. 428 428 ................ 504 504 ................ 588 588 ................Veterans service-connected compensation .................................. 1,828 1,828 ................ 1,864 1,864 ................ 1,876 1,876 ................Other .............................................................................................. 71 71 ................ 77 77 ................ 84 84 ................
Total, federal employees retirement and insurance ................ 2,746 2,746 ................ 2,922 2,922 ................ 3,059 3,059 ................
Unemployment assistance .............................................................. 2,099 2,099 ................ 1,498 1,498 ................ 1,729 1,729 ................
Medical care:Indian health .................................................................................. 25 25 ................ 32 32 ................ 39 39 ................Hospital and medical care for veterans ....................................... 706 700 5 768 762 6 780 774 6Other .............................................................................................. 81 40 41 92 42 50 103 48 55
Total, medical care ................................................................... 811 765 46 891 836 55 922 861 61
Assistance to students:Veterans education benefits ......................................................... 678 678 ................ 781 781 ................ 787 787 ................
Total, assistance to students .................................................... 678 678 ................ 781 781 ................ 787 787 ................
Housing assistance ......................................................................... 67 ................ 67 82 ................ 82 91 4 87
Food and nutrition assistance:Child nutrition and special milk programs .................................... 83 ................ 83 82 ................ 82 98 ................ 98
Total, food and nutrition assistance ......................................... 83 ................ 83 82 ................ 82 98 ................ 98
Public assistance and related programs:Family support payments to States and TANF ........................... 1,427 ................ 1,427 1,455 ................ 1,455 1,556 ................ 1,556Veterans non-service connected pensions ................................... 800 800 ................ 883 883 ................ 950 950 ................
Total, public assistance and related programs ........................ 2,227 800 1,427 2,338 883 1,455 2,507 950 1,556
All other payments for individuals:Veterans insurance and burial benefits ........................................ 52 52 ................ 52 52 ................ 44 44 ................Refugee assistance and other ...................................................... 622 622 ................ 599 599 ................ 601 601 ................
Total, all other payments for individuals .................................. 674 674 ................ 651 651 ................ 645 645 ................
Total, payments for individuals ..................................................... 14,297 12,674 1,623 15,208 13,534 1,674 17,027 15,226 1,802
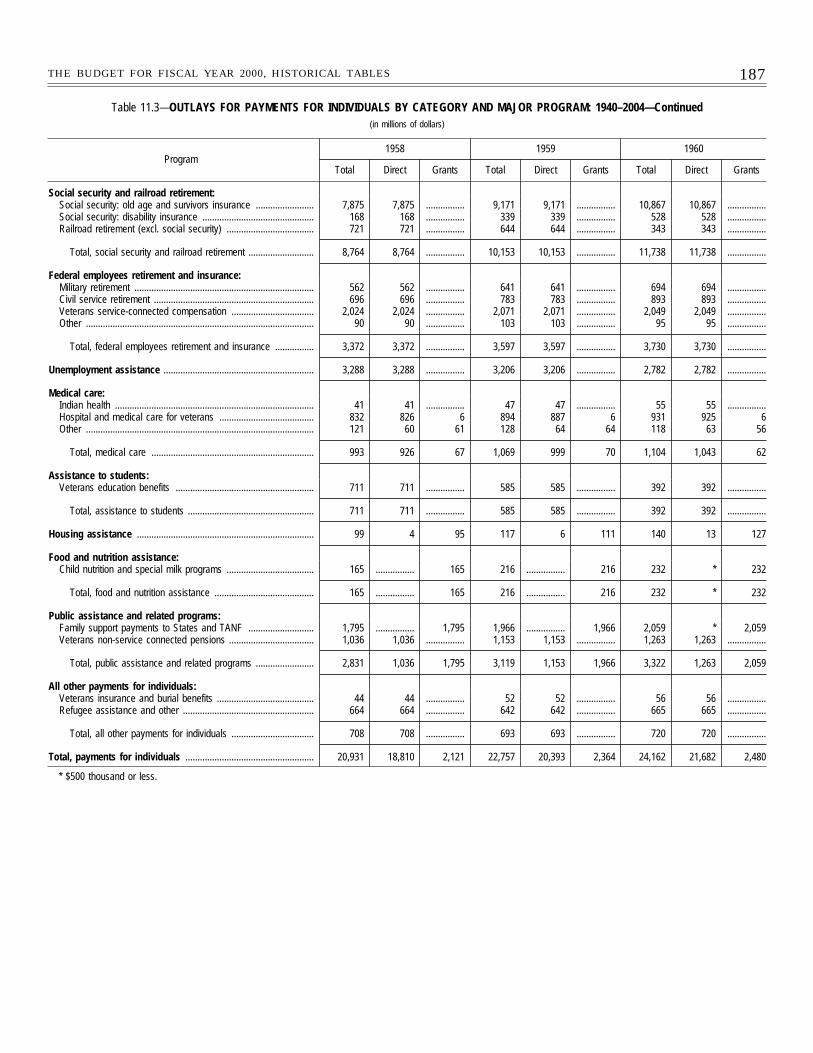
187THE BUDGET FOR FISCAL YEAR 2000, HISTORICAL TABLES
Table 11.3—OUTLAYS FOR PAYMENTS FOR INDIVIDUALS BY CATEGORY AND MAJOR PROGRAM: 1940–2004—Continued(in millions of dollars)
Program1958 1959 1960
Total Direct Grants Total Direct Grants Total Direct Grants
Social security and railroad retirement:Social security: old age and survivors insurance ........................ 7,875 7,875 ................ 9,171 9,171 ................ 10,867 10,867 ................Social security: disability insurance .............................................. 168 168 ................ 339 339 ................ 528 528 ................Railroad retirement (excl. social security) .................................... 721 721 ................ 644 644 ................ 343 343 ................
Total, social security and railroad retirement ........................... 8,764 8,764 ................ 10,153 10,153 ................ 11,738 11,738 ................
Federal employees retirement and insurance:Military retirement .......................................................................... 562 562 ................ 641 641 ................ 694 694 ................Civil service retirement .................................................................. 696 696 ................ 783 783 ................ 893 893 ................Veterans service-connected compensation .................................. 2,024 2,024 ................ 2,071 2,071 ................ 2,049 2,049 ................Other .............................................................................................. 90 90 ................ 103 103 ................ 95 95 ................
Total, federal employees retirement and insurance ................ 3,372 3,372 ................ 3,597 3,597 ................ 3,730 3,730 ................
Unemployment assistance .............................................................. 3,288 3,288 ................ 3,206 3,206 ................ 2,782 2,782 ................
Medical care:Indian health .................................................................................. 41 41 ................ 47 47 ................ 55 55 ................Hospital and medical care for veterans ....................................... 832 826 6 894 887 6 931 925 6Other .............................................................................................. 121 60 61 128 64 64 118 63 56
Total, medical care ................................................................... 993 926 67 1,069 999 70 1,104 1,043 62
Assistance to students:Veterans education benefits ......................................................... 711 711 ................ 585 585 ................ 392 392 ................
Total, assistance to students .................................................... 711 711 ................ 585 585 ................ 392 392 ................
Housing assistance ......................................................................... 99 4 95 117 6 111 140 13 127
Food and nutrition assistance:Child nutrition and special milk programs .................................... 165 ................ 165 216 ................ 216 232 * 232
Total, food and nutrition assistance ......................................... 165 ................ 165 216 ................ 216 232 * 232
Public assistance and related programs:Family support payments to States and TANF ........................... 1,795 ................ 1,795 1,966 ................ 1,966 2,059 * 2,059Veterans non-service connected pensions ................................... 1,036 1,036 ................ 1,153 1,153 ................ 1,263 1,263 ................
Total, public assistance and related programs ........................ 2,831 1,036 1,795 3,119 1,153 1,966 3,322 1,263 2,059
All other payments for individuals:Veterans insurance and burial benefits ........................................ 44 44 ................ 52 52 ................ 56 56 ................Refugee assistance and other ...................................................... 664 664 ................ 642 642 ................ 665 665 ................
Total, all other payments for individuals .................................. 708 708 ................ 693 693 ................ 720 720 ................
Total, payments for individuals ..................................................... 20,931 18,810 2,121 22,757 20,393 2,364 24,162 21,682 2,480
* $500 thousand or less.
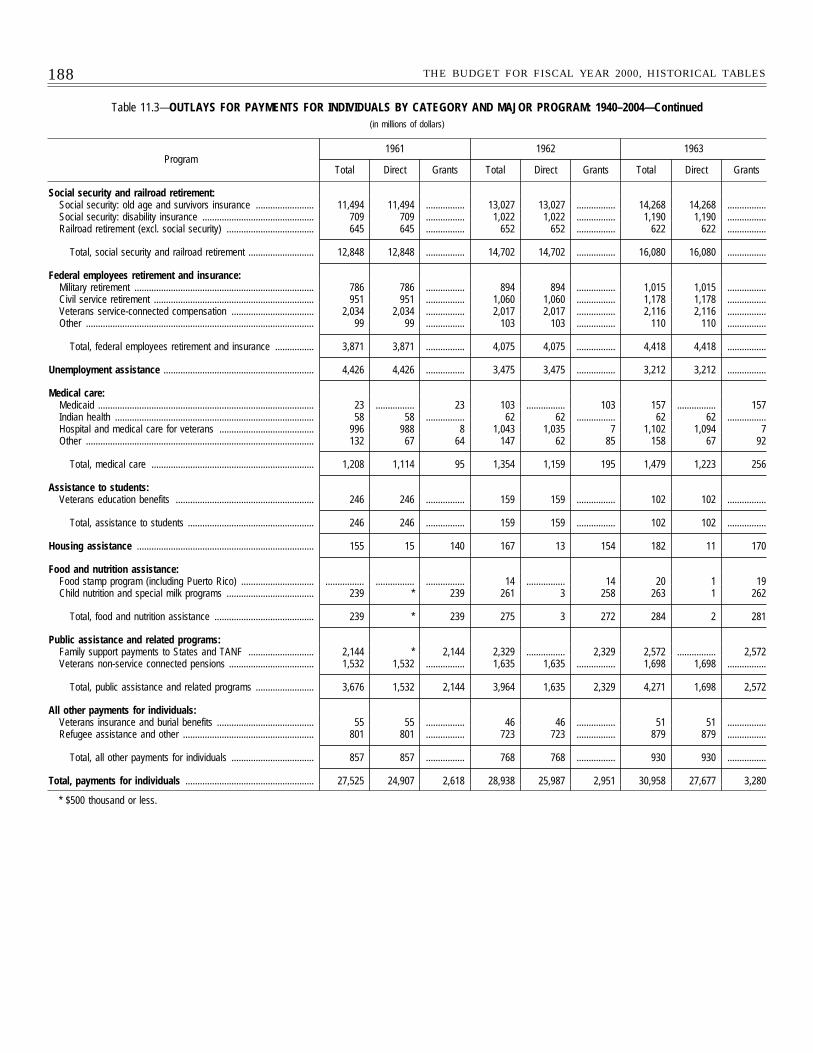
188 THE BUDGET FOR FISCAL YEAR 2000, HISTORICAL TABLES
Table 11.3—OUTLAYS FOR PAYMENTS FOR INDIVIDUALS BY CATEGORY AND MAJOR PROGRAM: 1940–2004—Continued(in millions of dollars)
Program1961 1962 1963
Total Direct Grants Total Direct Grants Total Direct Grants
Social security and railroad retirement:Social security: old age and survivors insurance ........................ 11,494 11,494 ................ 13,027 13,027 ................ 14,268 14,268 ................Social security: disability insurance .............................................. 709 709 ................ 1,022 1,022 ................ 1,190 1,190 ................Railroad retirement (excl. social security) .................................... 645 645 ................ 652 652 ................ 622 622 ................
Total, social security and railroad retirement ........................... 12,848 12,848 ................ 14,702 14,702 ................ 16,080 16,080 ................
Federal employees retirement and insurance:Military retirement .......................................................................... 786 786 ................ 894 894 ................ 1,015 1,015 ................Civil service retirement .................................................................. 951 951 ................ 1,060 1,060 ................ 1,178 1,178 ................Veterans service-connected compensation .................................. 2,034 2,034 ................ 2,017 2,017 ................ 2,116 2,116 ................Other .............................................................................................. 99 99 ................ 103 103 ................ 110 110 ................
Total, federal employees retirement and insurance ................ 3,871 3,871 ................ 4,075 4,075 ................ 4,418 4,418 ................
Unemployment assistance .............................................................. 4,426 4,426 ................ 3,475 3,475 ................ 3,212 3,212 ................
Medical care:Medicaid ......................................................................................... 23 ................ 23 103 ................ 103 157 ................ 157Indian health .................................................................................. 58 58 ................ 62 62 ................ 62 62 ................Hospital and medical care for veterans ....................................... 996 988 8 1,043 1,035 7 1,102 1,094 7Other .............................................................................................. 132 67 64 147 62 85 158 67 92
Total, medical care ................................................................... 1,208 1,114 95 1,354 1,159 195 1,479 1,223 256
Assistance to students:Veterans education benefits ......................................................... 246 246 ................ 159 159 ................ 102 102 ................
Total, assistance to students .................................................... 246 246 ................ 159 159 ................ 102 102 ................
Housing assistance ......................................................................... 155 15 140 167 13 154 182 11 170
Food and nutrition assistance:Food stamp program (including Puerto Rico) .............................. ................ ................ ................ 14 ................ 14 20 1 19Child nutrition and special milk programs .................................... 239 * 239 261 3 258 263 1 262
Total, food and nutrition assistance ......................................... 239 * 239 275 3 272 284 2 281
Public assistance and related programs:Family support payments to States and TANF ........................... 2,144 * 2,144 2,329 ................ 2,329 2,572 ................ 2,572Veterans non-service connected pensions ................................... 1,532 1,532 ................ 1,635 1,635 ................ 1,698 1,698 ................
Total, public assistance and related programs ........................ 3,676 1,532 2,144 3,964 1,635 2,329 4,271 1,698 2,572
All other payments for individuals:Veterans insurance and burial benefits ........................................ 55 55 ................ 46 46 ................ 51 51 ................Refugee assistance and other ...................................................... 801 801 ................ 723 723 ................ 879 879 ................
Total, all other payments for individuals .................................. 857 857 ................ 768 768 ................ 930 930 ................
Total, payments for individuals ..................................................... 27,525 24,907 2,618 28,938 25,987 2,951 30,958 27,677 3,280
* $500 thousand or less.
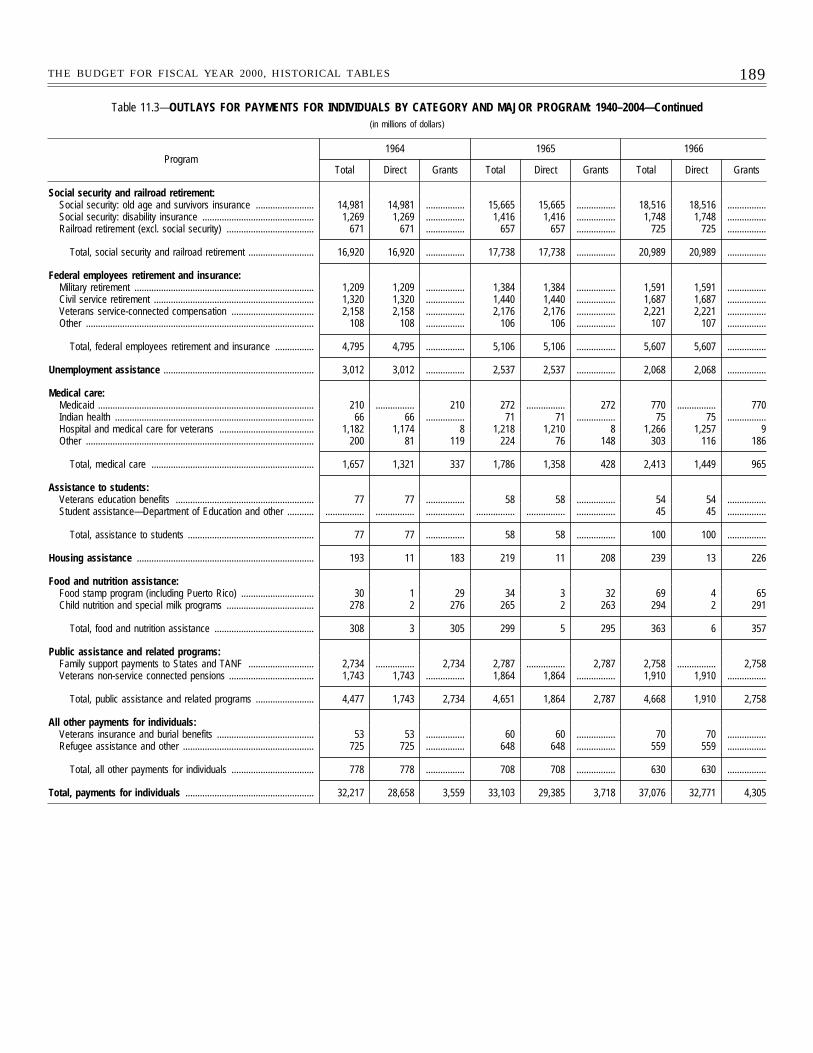
189THE BUDGET FOR FISCAL YEAR 2000, HISTORICAL TABLES
Table 11.3—OUTLAYS FOR PAYMENTS FOR INDIVIDUALS BY CATEGORY AND MAJOR PROGRAM: 1940–2004—Continued(in millions of dollars)
Program1964 1965 1966
Total Direct Grants Total Direct Grants Total Direct Grants
Social security and railroad retirement:Social security: old age and survivors insurance ........................ 14,981 14,981 ................ 15,665 15,665 ................ 18,516 18,516 ................Social security: disability insurance .............................................. 1,269 1,269 ................ 1,416 1,416 ................ 1,748 1,748 ................Railroad retirement (excl. social security) .................................... 671 671 ................ 657 657 ................ 725 725 ................
Total, social security and railroad retirement ........................... 16,920 16,920 ................ 17,738 17,738 ................ 20,989 20,989 ................
Federal employees retirement and insurance:Military retirement .......................................................................... 1,209 1,209 ................ 1,384 1,384 ................ 1,591 1,591 ................Civil service retirement .................................................................. 1,320 1,320 ................ 1,440 1,440 ................ 1,687 1,687 ................Veterans service-connected compensation .................................. 2,158 2,158 ................ 2,176 2,176 ................ 2,221 2,221 ................Other .............................................................................................. 108 108 ................ 106 106 ................ 107 107 ................
Total, federal employees retirement and insurance ................ 4,795 4,795 ................ 5,106 5,106 ................ 5,607 5,607 ................
Unemployment assistance .............................................................. 3,012 3,012 ................ 2,537 2,537 ................ 2,068 2,068 ................
Medical care:Medicaid ......................................................................................... 210 ................ 210 272 ................ 272 770 ................ 770Indian health .................................................................................. 66 66 ................ 71 71 ................ 75 75 ................Hospital and medical care for veterans ....................................... 1,182 1,174 8 1,218 1,210 8 1,266 1,257 9Other .............................................................................................. 200 81 119 224 76 148 303 116 186
Total, medical care ................................................................... 1,657 1,321 337 1,786 1,358 428 2,413 1,449 965
Assistance to students:Veterans education benefits ......................................................... 77 77 ................ 58 58 ................ 54 54 ................Student assistance—Department of Education and other ........... ................ ................ ................ ................ ................ ................ 45 45 ................
Total, assistance to students .................................................... 77 77 ................ 58 58 ................ 100 100 ................
Housing assistance ......................................................................... 193 11 183 219 11 208 239 13 226
Food and nutrition assistance:Food stamp program (including Puerto Rico) .............................. 30 1 29 34 3 32 69 4 65Child nutrition and special milk programs .................................... 278 2 276 265 2 263 294 2 291
Total, food and nutrition assistance ......................................... 308 3 305 299 5 295 363 6 357
Public assistance and related programs:Family support payments to States and TANF ........................... 2,734 ................ 2,734 2,787 ................ 2,787 2,758 ................ 2,758Veterans non-service connected pensions ................................... 1,743 1,743 ................ 1,864 1,864 ................ 1,910 1,910 ................
Total, public assistance and related programs ........................ 4,477 1,743 2,734 4,651 1,864 2,787 4,668 1,910 2,758
All other payments for individuals:Veterans insurance and burial benefits ........................................ 53 53 ................ 60 60 ................ 70 70 ................Refugee assistance and other ...................................................... 725 725 ................ 648 648 ................ 559 559 ................
Total, all other payments for individuals .................................. 778 778 ................ 708 708 ................ 630 630 ................
Total, payments for individuals ..................................................... 32,217 28,658 3,559 33,103 29,385 3,718 37,076 32,771 4,305
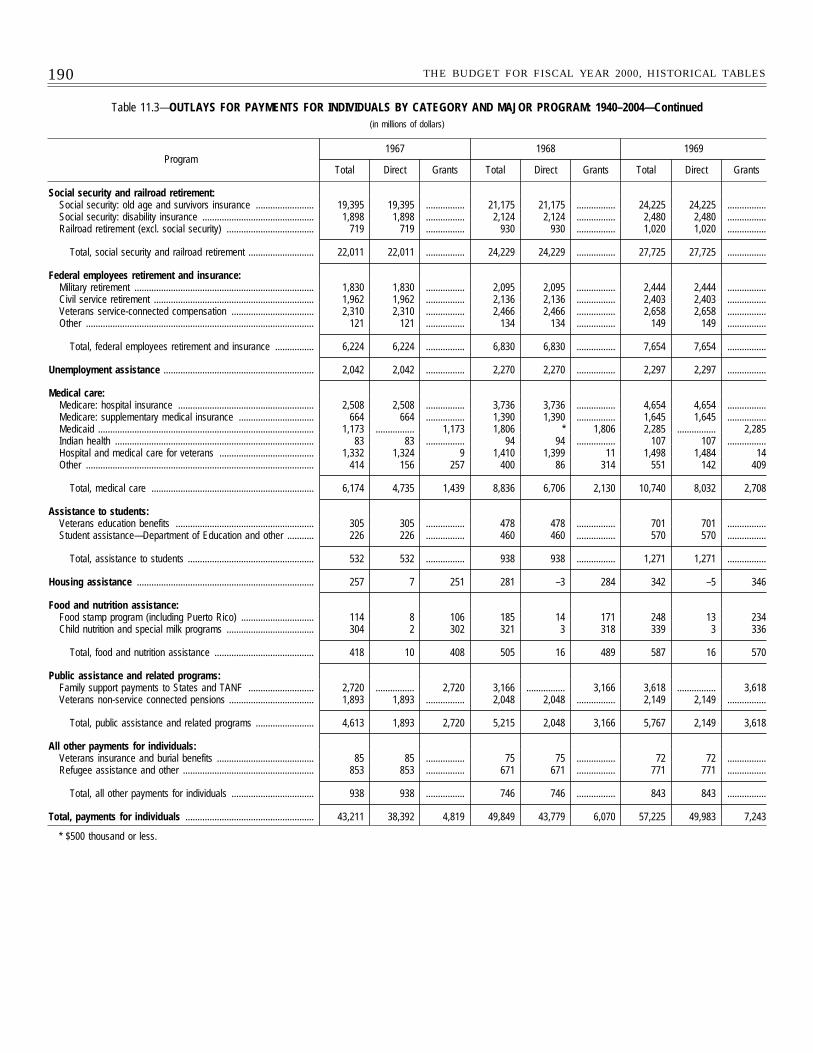
190 THE BUDGET FOR FISCAL YEAR 2000, HISTORICAL TABLES
Table 11.3—OUTLAYS FOR PAYMENTS FOR INDIVIDUALS BY CATEGORY AND MAJOR PROGRAM: 1940–2004—Continued(in millions of dollars)
Program1967 1968 1969
Total Direct Grants Total Direct Grants Total Direct Grants
Social security and railroad retirement:Social security: old age and survivors insurance ........................ 19,395 19,395 ................ 21,175 21,175 ................ 24,225 24,225 ................Social security: disability insurance .............................................. 1,898 1,898 ................ 2,124 2,124 ................ 2,480 2,480 ................Railroad retirement (excl. social security) .................................... 719 719 ................ 930 930 ................ 1,020 1,020 ................
Total, social security and railroad retirement ........................... 22,011 22,011 ................ 24,229 24,229 ................ 27,725 27,725 ................
Federal employees retirement and insurance:Military retirement .......................................................................... 1,830 1,830 ................ 2,095 2,095 ................ 2,444 2,444 ................Civil service retirement .................................................................. 1,962 1,962 ................ 2,136 2,136 ................ 2,403 2,403 ................Veterans service-connected compensation .................................. 2,310 2,310 ................ 2,466 2,466 ................ 2,658 2,658 ................Other .............................................................................................. 121 121 ................ 134 134 ................ 149 149 ................
Total, federal employees retirement and insurance ................ 6,224 6,224 ................ 6,830 6,830 ................ 7,654 7,654 ................
Unemployment assistance .............................................................. 2,042 2,042 ................ 2,270 2,270 ................ 2,297 2,297 ................
Medical care:Medicare: hospital insurance ........................................................ 2,508 2,508 ................ 3,736 3,736 ................ 4,654 4,654 ................Medicare: supplementary medical insurance ............................... 664 664 ................ 1,390 1,390 ................ 1,645 1,645 ................Medicaid ......................................................................................... 1,173 ................ 1,173 1,806 * 1,806 2,285 ................ 2,285Indian health .................................................................................. 83 83 ................ 94 94 ................ 107 107 ................Hospital and medical care for veterans ....................................... 1,332 1,324 9 1,410 1,399 11 1,498 1,484 14Other .............................................................................................. 414 156 257 400 86 314 551 142 409
Total, medical care ................................................................... 6,174 4,735 1,439 8,836 6,706 2,130 10,740 8,032 2,708
Assistance to students:Veterans education benefits ......................................................... 305 305 ................ 478 478 ................ 701 701 ................Student assistance—Department of Education and other ........... 226 226 ................ 460 460 ................ 570 570 ................
Total, assistance to students .................................................... 532 532 ................ 938 938 ................ 1,271 1,271 ................
Housing assistance ......................................................................... 257 7 251 281 –3 284 342 –5 346
Food and nutrition assistance:Food stamp program (including Puerto Rico) .............................. 114 8 106 185 14 171 248 13 234Child nutrition and special milk programs .................................... 304 2 302 321 3 318 339 3 336
Total, food and nutrition assistance ......................................... 418 10 408 505 16 489 587 16 570
Public assistance and related programs:Family support payments to States and TANF ........................... 2,720 ................ 2,720 3,166 ................ 3,166 3,618 ................ 3,618Veterans non-service connected pensions ................................... 1,893 1,893 ................ 2,048 2,048 ................ 2,149 2,149 ................
Total, public assistance and related programs ........................ 4,613 1,893 2,720 5,215 2,048 3,166 5,767 2,149 3,618
All other payments for individuals:Veterans insurance and burial benefits ........................................ 85 85 ................ 75 75 ................ 72 72 ................Refugee assistance and other ...................................................... 853 853 ................ 671 671 ................ 771 771 ................
Total, all other payments for individuals .................................. 938 938 ................ 746 746 ................ 843 843 ................
Total, payments for individuals ..................................................... 43,211 38,392 4,819 49,849 43,779 6,070 57,225 49,983 7,243
* $500 thousand or less.
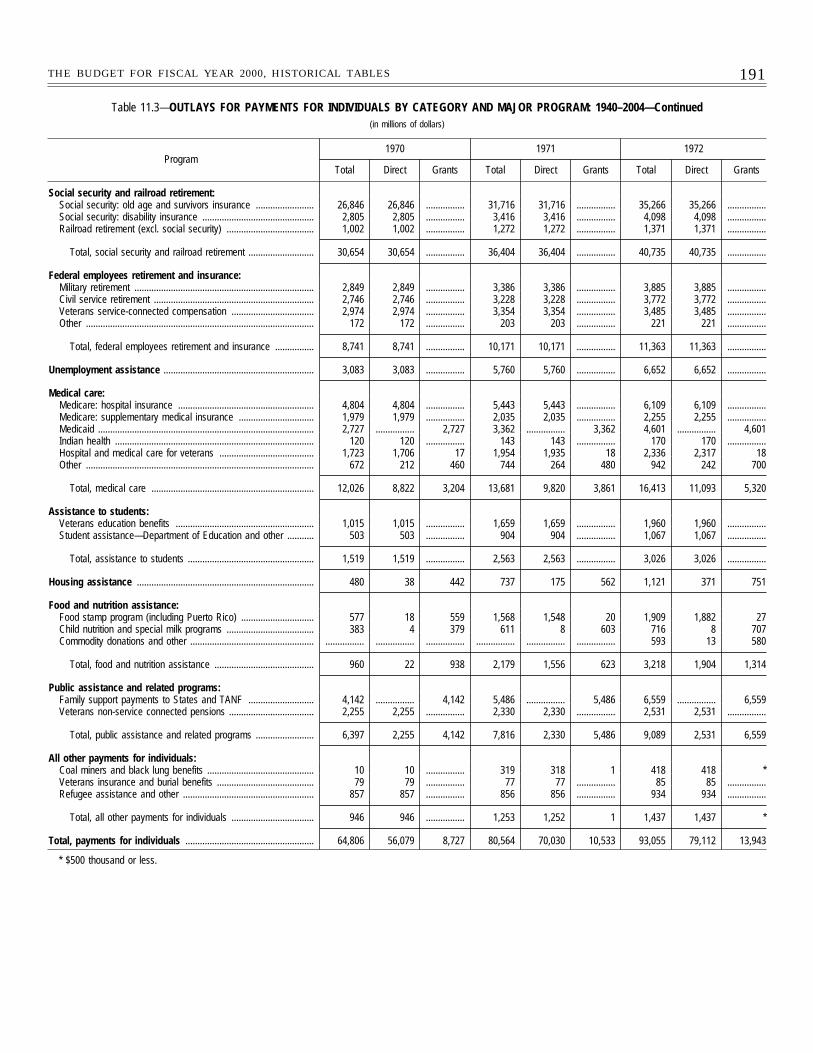
191THE BUDGET FOR FISCAL YEAR 2000, HISTORICAL TABLES
Table 11.3—OUTLAYS FOR PAYMENTS FOR INDIVIDUALS BY CATEGORY AND MAJOR PROGRAM: 1940–2004—Continued(in millions of dollars)
Program1970 1971 1972
Total Direct Grants Total Direct Grants Total Direct Grants
Social security and railroad retirement:Social security: old age and survivors insurance ........................ 26,846 26,846 ................ 31,716 31,716 ................ 35,266 35,266 ................Social security: disability insurance .............................................. 2,805 2,805 ................ 3,416 3,416 ................ 4,098 4,098 ................Railroad retirement (excl. social security) .................................... 1,002 1,002 ................ 1,272 1,272 ................ 1,371 1,371 ................
Total, social security and railroad retirement ........................... 30,654 30,654 ................ 36,404 36,404 ................ 40,735 40,735 ................
Federal employees retirement and insurance:Military retirement .......................................................................... 2,849 2,849 ................ 3,386 3,386 ................ 3,885 3,885 ................Civil service retirement .................................................................. 2,746 2,746 ................ 3,228 3,228 ................ 3,772 3,772 ................Veterans service-connected compensation .................................. 2,974 2,974 ................ 3,354 3,354 ................ 3,485 3,485 ................Other .............................................................................................. 172 172 ................ 203 203 ................ 221 221 ................
Total, federal employees retirement and insurance ................ 8,741 8,741 ................ 10,171 10,171 ................ 11,363 11,363 ................
Unemployment assistance .............................................................. 3,083 3,083 ................ 5,760 5,760 ................ 6,652 6,652 ................
Medical care:Medicare: hospital insurance ........................................................ 4,804 4,804 ................ 5,443 5,443 ................ 6,109 6,109 ................Medicare: supplementary medical insurance ............................... 1,979 1,979 ................ 2,035 2,035 ................ 2,255 2,255 ................Medicaid ......................................................................................... 2,727 ................ 2,727 3,362 ................ 3,362 4,601 ................ 4,601Indian health .................................................................................. 120 120 ................ 143 143 ................ 170 170 ................Hospital and medical care for veterans ....................................... 1,723 1,706 17 1,954 1,935 18 2,336 2,317 18Other .............................................................................................. 672 212 460 744 264 480 942 242 700
Total, medical care ................................................................... 12,026 8,822 3,204 13,681 9,820 3,861 16,413 11,093 5,320
Assistance to students:Veterans education benefits ......................................................... 1,015 1,015 ................ 1,659 1,659 ................ 1,960 1,960 ................Student assistance—Department of Education and other ........... 503 503 ................ 904 904 ................ 1,067 1,067 ................
Total, assistance to students .................................................... 1,519 1,519 ................ 2,563 2,563 ................ 3,026 3,026 ................
Housing assistance ......................................................................... 480 38 442 737 175 562 1,121 371 751
Food and nutrition assistance:Food stamp program (including Puerto Rico) .............................. 577 18 559 1,568 1,548 20 1,909 1,882 27Child nutrition and special milk programs .................................... 383 4 379 611 8 603 716 8 707Commodity donations and other ................................................... ................ ................ ................ ................ ................ ................ 593 13 580
Total, food and nutrition assistance ......................................... 960 22 938 2,179 1,556 623 3,218 1,904 1,314
Public assistance and related programs:Family support payments to States and TANF ........................... 4,142 ................ 4,142 5,486 ................ 5,486 6,559 ................ 6,559Veterans non-service connected pensions ................................... 2,255 2,255 ................ 2,330 2,330 ................ 2,531 2,531 ................
Total, public assistance and related programs ........................ 6,397 2,255 4,142 7,816 2,330 5,486 9,089 2,531 6,559
All other payments for individuals:Coal miners and black lung benefits ............................................ 10 10 ................ 319 318 1 418 418 *Veterans insurance and burial benefits ........................................ 79 79 ................ 77 77 ................ 85 85 ................Refugee assistance and other ...................................................... 857 857 ................ 856 856 ................ 934 934 ................
Total, all other payments for individuals .................................. 946 946 ................ 1,253 1,252 1 1,437 1,437 *
Total, payments for individuals ..................................................... 64,806 56,079 8,727 80,564 70,030 10,533 93,055 79,112 13,943
* $500 thousand or less.
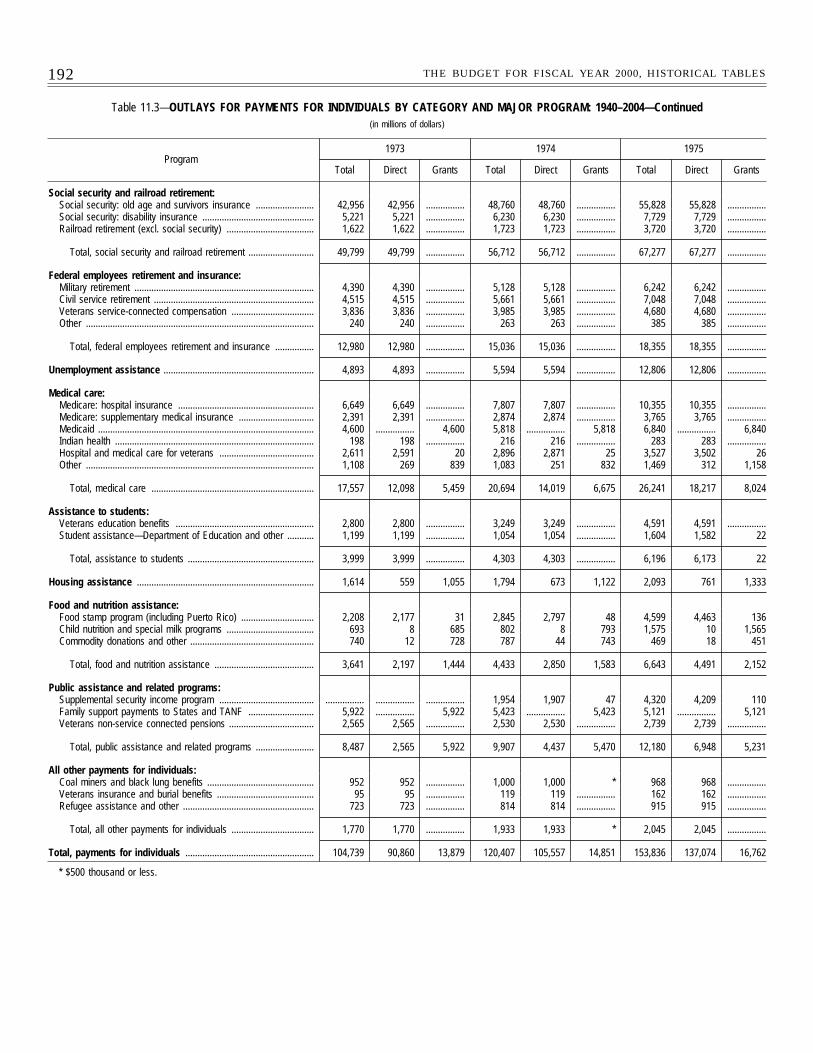
192 THE BUDGET FOR FISCAL YEAR 2000, HISTORICAL TABLES
Table 11.3—OUTLAYS FOR PAYMENTS FOR INDIVIDUALS BY CATEGORY AND MAJOR PROGRAM: 1940–2004—Continued(in millions of dollars)
Program1973 1974 1975
Total Direct Grants Total Direct Grants Total Direct Grants
Social security and railroad retirement:Social security: old age and survivors insurance ........................ 42,956 42,956 ................ 48,760 48,760 ................ 55,828 55,828 ................Social security: disability insurance .............................................. 5,221 5,221 ................ 6,230 6,230 ................ 7,729 7,729 ................Railroad retirement (excl. social security) .................................... 1,622 1,622 ................ 1,723 1,723 ................ 3,720 3,720 ................
Total, social security and railroad retirement ........................... 49,799 49,799 ................ 56,712 56,712 ................ 67,277 67,277 ................
Federal employees retirement and insurance:Military retirement .......................................................................... 4,390 4,390 ................ 5,128 5,128 ................ 6,242 6,242 ................Civil service retirement .................................................................. 4,515 4,515 ................ 5,661 5,661 ................ 7,048 7,048 ................Veterans service-connected compensation .................................. 3,836 3,836 ................ 3,985 3,985 ................ 4,680 4,680 ................Other .............................................................................................. 240 240 ................ 263 263 ................ 385 385 ................
Total, federal employees retirement and insurance ................ 12,980 12,980 ................ 15,036 15,036 ................ 18,355 18,355 ................
Unemployment assistance .............................................................. 4,893 4,893 ................ 5,594 5,594 ................ 12,806 12,806 ................
Medical care:Medicare: hospital insurance ........................................................ 6,649 6,649 ................ 7,807 7,807 ................ 10,355 10,355 ................Medicare: supplementary medical insurance ............................... 2,391 2,391 ................ 2,874 2,874 ................ 3,765 3,765 ................Medicaid ......................................................................................... 4,600 ................ 4,600 5,818 ................ 5,818 6,840 ................ 6,840Indian health .................................................................................. 198 198 ................ 216 216 ................ 283 283 ................Hospital and medical care for veterans ....................................... 2,611 2,591 20 2,896 2,871 25 3,527 3,502 26Other .............................................................................................. 1,108 269 839 1,083 251 832 1,469 312 1,158
Total, medical care ................................................................... 17,557 12,098 5,459 20,694 14,019 6,675 26,241 18,217 8,024
Assistance to students:Veterans education benefits ......................................................... 2,800 2,800 ................ 3,249 3,249 ................ 4,591 4,591 ................Student assistance—Department of Education and other ........... 1,199 1,199 ................ 1,054 1,054 ................ 1,604 1,582 22
Total, assistance to students .................................................... 3,999 3,999 ................ 4,303 4,303 ................ 6,196 6,173 22
Housing assistance ......................................................................... 1,614 559 1,055 1,794 673 1,122 2,093 761 1,333
Food and nutrition assistance:Food stamp program (including Puerto Rico) .............................. 2,208 2,177 31 2,845 2,797 48 4,599 4,463 136Child nutrition and special milk programs .................................... 693 8 685 802 8 793 1,575 10 1,565Commodity donations and other ................................................... 740 12 728 787 44 743 469 18 451
Total, food and nutrition assistance ......................................... 3,641 2,197 1,444 4,433 2,850 1,583 6,643 4,491 2,152
Public assistance and related programs:Supplemental security income program ....................................... ................ ................ ................ 1,954 1,907 47 4,320 4,209 110Family support payments to States and TANF ........................... 5,922 ................ 5,922 5,423 ................ 5,423 5,121 ................ 5,121Veterans non-service connected pensions ................................... 2,565 2,565 ................ 2,530 2,530 ................ 2,739 2,739 ................
Total, public assistance and related programs ........................ 8,487 2,565 5,922 9,907 4,437 5,470 12,180 6,948 5,231
All other payments for individuals:Coal miners and black lung benefits ............................................ 952 952 ................ 1,000 1,000 * 968 968 ................Veterans insurance and burial benefits ........................................ 95 95 ................ 119 119 ................ 162 162 ................Refugee assistance and other ...................................................... 723 723 ................ 814 814 ................ 915 915 ................
Total, all other payments for individuals .................................. 1,770 1,770 ................ 1,933 1,933 * 2,045 2,045 ................
Total, payments for individuals ..................................................... 104,739 90,860 13,879 120,407 105,557 14,851 153,836 137,074 16,762
* $500 thousand or less.
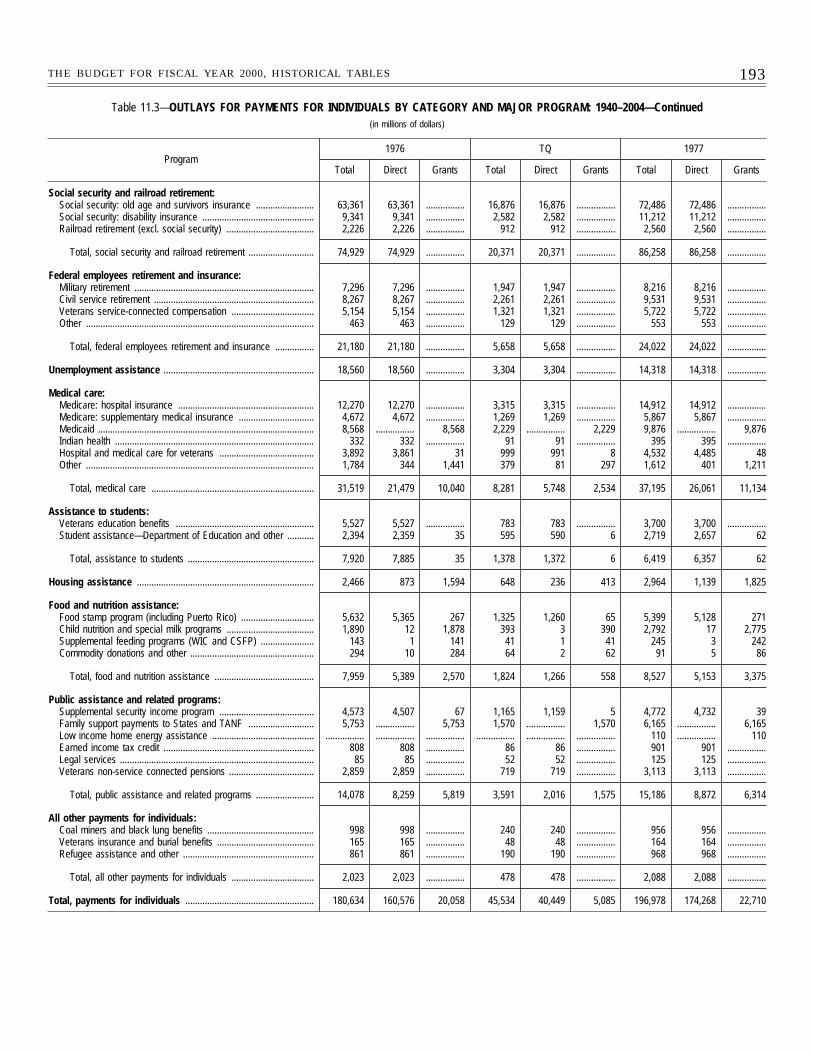
193THE BUDGET FOR FISCAL YEAR 2000, HISTORICAL TABLES
Table 11.3—OUTLAYS FOR PAYMENTS FOR INDIVIDUALS BY CATEGORY AND MAJOR PROGRAM: 1940–2004—Continued(in millions of dollars)
Program1976 TQ 1977
Total Direct Grants Total Direct Grants Total Direct Grants
Social security and railroad retirement:Social security: old age and survivors insurance ........................ 63,361 63,361 ................ 16,876 16,876 ................ 72,486 72,486 ................Social security: disability insurance .............................................. 9,341 9,341 ................ 2,582 2,582 ................ 11,212 11,212 ................Railroad retirement (excl. social security) .................................... 2,226 2,226 ................ 912 912 ................ 2,560 2,560 ................
Total, social security and railroad retirement ........................... 74,929 74,929 ................ 20,371 20,371 ................ 86,258 86,258 ................
Federal employees retirement and insurance:Military retirement .......................................................................... 7,296 7,296 ................ 1,947 1,947 ................ 8,216 8,216 ................Civil service retirement .................................................................. 8,267 8,267 ................ 2,261 2,261 ................ 9,531 9,531 ................Veterans service-connected compensation .................................. 5,154 5,154 ................ 1,321 1,321 ................ 5,722 5,722 ................Other .............................................................................................. 463 463 ................ 129 129 ................ 553 553 ................
Total, federal employees retirement and insurance ................ 21,180 21,180 ................ 5,658 5,658 ................ 24,022 24,022 ................
Unemployment assistance .............................................................. 18,560 18,560 ................ 3,304 3,304 ................ 14,318 14,318 ................
Medical care:Medicare: hospital insurance ........................................................ 12,270 12,270 ................ 3,315 3,315 ................ 14,912 14,912 ................Medicare: supplementary medical insurance ............................... 4,672 4,672 ................ 1,269 1,269 ................ 5,867 5,867 ................Medicaid ......................................................................................... 8,568 ................ 8,568 2,229 ................ 2,229 9,876 ................ 9,876Indian health .................................................................................. 332 332 ................ 91 91 ................ 395 395 ................Hospital and medical care for veterans ....................................... 3,892 3,861 31 999 991 8 4,532 4,485 48Other .............................................................................................. 1,784 344 1,441 379 81 297 1,612 401 1,211
Total, medical care ................................................................... 31,519 21,479 10,040 8,281 5,748 2,534 37,195 26,061 11,134
Assistance to students:Veterans education benefits ......................................................... 5,527 5,527 ................ 783 783 ................ 3,700 3,700 ................Student assistance—Department of Education and other ........... 2,394 2,359 35 595 590 6 2,719 2,657 62
Total, assistance to students .................................................... 7,920 7,885 35 1,378 1,372 6 6,419 6,357 62
Housing assistance ......................................................................... 2,466 873 1,594 648 236 413 2,964 1,139 1,825
Food and nutrition assistance:Food stamp program (including Puerto Rico) .............................. 5,632 5,365 267 1,325 1,260 65 5,399 5,128 271Child nutrition and special milk programs .................................... 1,890 12 1,878 393 3 390 2,792 17 2,775Supplemental feeding programs (WIC and CSFP) ...................... 143 1 141 41 1 41 245 3 242Commodity donations and other ................................................... 294 10 284 64 2 62 91 5 86
Total, food and nutrition assistance ......................................... 7,959 5,389 2,570 1,824 1,266 558 8,527 5,153 3,375
Public assistance and related programs:Supplemental security income program ....................................... 4,573 4,507 67 1,165 1,159 5 4,772 4,732 39Family support payments to States and TANF ........................... 5,753 ................ 5,753 1,570 ................ 1,570 6,165 ................ 6,165Low income home energy assistance .......................................... ................ ................ ................ ................ ................ ................ 110 ................ 110Earned income tax credit .............................................................. 808 808 ................ 86 86 ................ 901 901 ................Legal services ................................................................................ 85 85 ................ 52 52 ................ 125 125 ................Veterans non-service connected pensions ................................... 2,859 2,859 ................ 719 719 ................ 3,113 3,113 ................
Total, public assistance and related programs ........................ 14,078 8,259 5,819 3,591 2,016 1,575 15,186 8,872 6,314
All other payments for individuals:Coal miners and black lung benefits ............................................ 998 998 ................ 240 240 ................ 956 956 ................Veterans insurance and burial benefits ........................................ 165 165 ................ 48 48 ................ 164 164 ................Refugee assistance and other ...................................................... 861 861 ................ 190 190 ................ 968 968 ................
Total, all other payments for individuals .................................. 2,023 2,023 ................ 478 478 ................ 2,088 2,088 ................
Total, payments for individuals ..................................................... 180,634 160,576 20,058 45,534 40,449 5,085 196,978 174,268 22,710
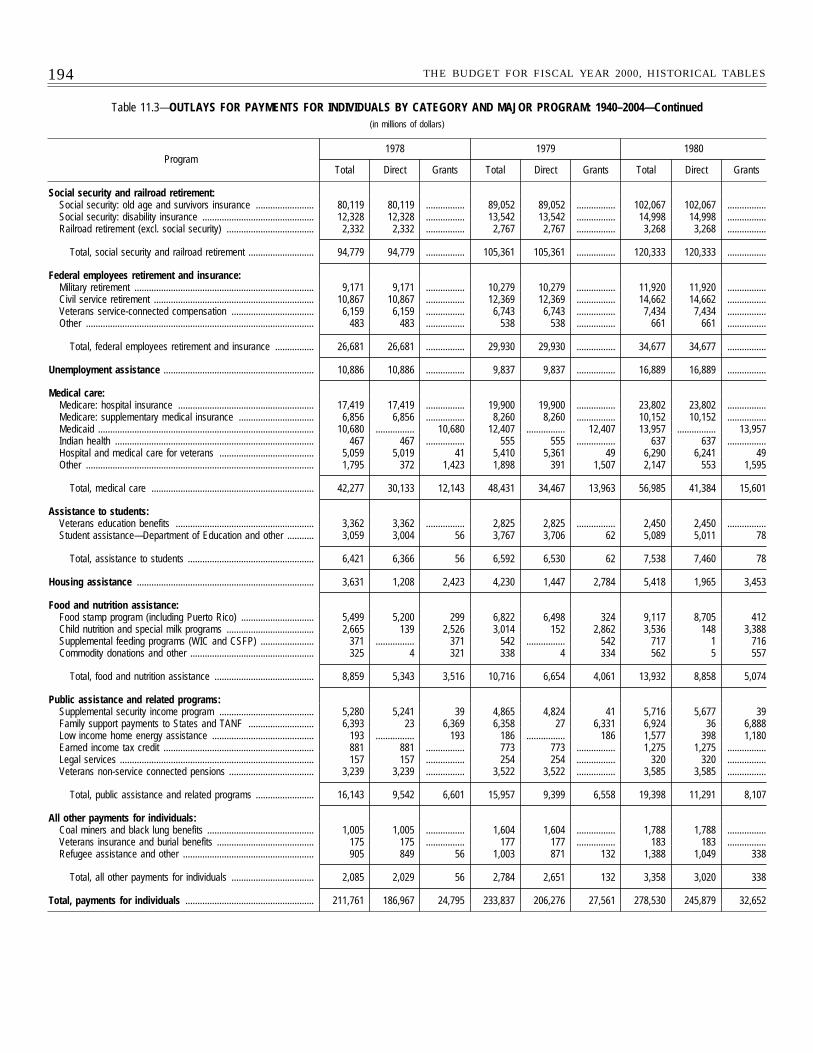
194 THE BUDGET FOR FISCAL YEAR 2000, HISTORICAL TABLES
Table 11.3—OUTLAYS FOR PAYMENTS FOR INDIVIDUALS BY CATEGORY AND MAJOR PROGRAM: 1940–2004—Continued(in millions of dollars)
Program1978 1979 1980
Total Direct Grants Total Direct Grants Total Direct Grants
Social security and railroad retirement:Social security: old age and survivors insurance ........................ 80,119 80,119 ................ 89,052 89,052 ................ 102,067 102,067 ................Social security: disability insurance .............................................. 12,328 12,328 ................ 13,542 13,542 ................ 14,998 14,998 ................Railroad retirement (excl. social security) .................................... 2,332 2,332 ................ 2,767 2,767 ................ 3,268 3,268 ................
Total, social security and railroad retirement ........................... 94,779 94,779 ................ 105,361 105,361 ................ 120,333 120,333 ................
Federal employees retirement and insurance:Military retirement .......................................................................... 9,171 9,171 ................ 10,279 10,279 ................ 11,920 11,920 ................Civil service retirement .................................................................. 10,867 10,867 ................ 12,369 12,369 ................ 14,662 14,662 ................Veterans service-connected compensation .................................. 6,159 6,159 ................ 6,743 6,743 ................ 7,434 7,434 ................Other .............................................................................................. 483 483 ................ 538 538 ................ 661 661 ................
Total, federal employees retirement and insurance ................ 26,681 26,681 ................ 29,930 29,930 ................ 34,677 34,677 ................
Unemployment assistance .............................................................. 10,886 10,886 ................ 9,837 9,837 ................ 16,889 16,889 ................
Medical care:Medicare: hospital insurance ........................................................ 17,419 17,419 ................ 19,900 19,900 ................ 23,802 23,802 ................Medicare: supplementary medical insurance ............................... 6,856 6,856 ................ 8,260 8,260 ................ 10,152 10,152 ................Medicaid ......................................................................................... 10,680 ................ 10,680 12,407 ................ 12,407 13,957 ................ 13,957Indian health .................................................................................. 467 467 ................ 555 555 ................ 637 637 ................Hospital and medical care for veterans ....................................... 5,059 5,019 41 5,410 5,361 49 6,290 6,241 49Other .............................................................................................. 1,795 372 1,423 1,898 391 1,507 2,147 553 1,595
Total, medical care ................................................................... 42,277 30,133 12,143 48,431 34,467 13,963 56,985 41,384 15,601
Assistance to students:Veterans education benefits ......................................................... 3,362 3,362 ................ 2,825 2,825 ................ 2,450 2,450 ................Student assistance—Department of Education and other ........... 3,059 3,004 56 3,767 3,706 62 5,089 5,011 78
Total, assistance to students .................................................... 6,421 6,366 56 6,592 6,530 62 7,538 7,460 78
Housing assistance ......................................................................... 3,631 1,208 2,423 4,230 1,447 2,784 5,418 1,965 3,453
Food and nutrition assistance:Food stamp program (including Puerto Rico) .............................. 5,499 5,200 299 6,822 6,498 324 9,117 8,705 412Child nutrition and special milk programs .................................... 2,665 139 2,526 3,014 152 2,862 3,536 148 3,388Supplemental feeding programs (WIC and CSFP) ...................... 371 ................ 371 542 ................ 542 717 1 716Commodity donations and other ................................................... 325 4 321 338 4 334 562 5 557
Total, food and nutrition assistance ......................................... 8,859 5,343 3,516 10,716 6,654 4,061 13,932 8,858 5,074
Public assistance and related programs:Supplemental security income program ....................................... 5,280 5,241 39 4,865 4,824 41 5,716 5,677 39Family support payments to States and TANF ........................... 6,393 23 6,369 6,358 27 6,331 6,924 36 6,888Low income home energy assistance .......................................... 193 ................ 193 186 ................ 186 1,577 398 1,180Earned income tax credit .............................................................. 881 881 ................ 773 773 ................ 1,275 1,275 ................Legal services ................................................................................ 157 157 ................ 254 254 ................ 320 320 ................Veterans non-service connected pensions ................................... 3,239 3,239 ................ 3,522 3,522 ................ 3,585 3,585 ................
Total, public assistance and related programs ........................ 16,143 9,542 6,601 15,957 9,399 6,558 19,398 11,291 8,107
All other payments for individuals:Coal miners and black lung benefits ............................................ 1,005 1,005 ................ 1,604 1,604 ................ 1,788 1,788 ................Veterans insurance and burial benefits ........................................ 175 175 ................ 177 177 ................ 183 183 ................Refugee assistance and other ...................................................... 905 849 56 1,003 871 132 1,388 1,049 338
Total, all other payments for individuals .................................. 2,085 2,029 56 2,784 2,651 132 3,358 3,020 338
Total, payments for individuals ..................................................... 211,761 186,967 24,795 233,837 206,276 27,561 278,530 245,879 32,652

195THE BUDGET FOR FISCAL YEAR 2000, HISTORICAL TABLES
Table 11.3—OUTLAYS FOR PAYMENTS FOR INDIVIDUALS BY CATEGORY AND MAJOR PROGRAM: 1940–2004—Continued(in millions of dollars)
Program1981 1982 1983
Total Direct Grants Total Direct Grants Total Direct Grants
Social security and railroad retirement:Social security: old age and survivors insurance ........................ 121,003 121,003 ................ 136,454 136,454 ................ 150,893 150,893 ................Social security: disability insurance .............................................. 16,879 16,879 ................ 17,463 17,463 ................ 17,620 17,620 ................Railroad retirement (excl. social security) .................................... 3,643 3,643 ................ 3,856 3,856 ................ 3,771 3,771 ................
Total, social security and railroad retirement ........................... 141,524 141,524 ................ 157,773 157,773 ................ 172,284 172,284 ................
Federal employees retirement and insurance:Military retirement .......................................................................... 13,729 13,729 ................ 14,938 14,938 ................ 15,945 15,945 ................Civil service retirement .................................................................. 17,597 17,597 ................ 19,405 19,405 ................ 20,717 20,717 ................Veterans service-connected compensation .................................. 8,426 8,426 ................ 9,276 9,276 ................ 9,844 9,844 ................Other .............................................................................................. 735 735 ................ 816 816 ................ 759 759 ................
Total, federal employees retirement and insurance ................ 40,487 40,487 ................ 44,436 44,436 ................ 47,265 47,265 ................
Unemployment assistance .............................................................. 18,406 18,406 ................ 22,314 22,314 ................ 29,815 29,815 ................
Medical care:Medicare: hospital insurance ........................................................ 28,916 28,916 ................ 34,354 34,354 ................ 38,005 38,005 ................Medicare: supplementary medical insurance ............................... 12,351 12,351 ................ 14,813 14,813 ................ 17,493 17,493 ................Medicaid ......................................................................................... 16,833 ................ 16,833 17,391 ................ 17,391 18,985 ................ 18,985Indian health .................................................................................. 679 679 ................ 654 654 ................ 692 692 ................Hospital and medical care for veterans ....................................... 6,732 6,683 50 7,296 7,238 57 8,044 7,987 57Other .............................................................................................. 2,135 502 1,632 2,271 1,024 1,247 1,771 835 935
Total, medical care ................................................................... 67,647 49,132 18,516 76,778 58,083 18,695 84,991 65,013 19,978
Assistance to students:Veterans education benefits ......................................................... 2,395 2,395 ................ 2,113 2,113 ................ 1,854 1,854 ................Student assistance—Department of Education and other ........... 6,166 6,087 78 5,758 5,701 57 6,601 6,550 51
Total, assistance to students .................................................... 8,561 8,482 78 7,870 7,814 57 8,455 8,404 51
Housing assistance ......................................................................... 6,775 2,716 4,059 7,960 3,038 4,922 9,366 3,648 5,718
Food and nutrition assistance:Food stamp program (including Puerto Rico) .............................. 11,253 10,764 489 11,014 10,262 752 12,653 11,210 1,444Child nutrition and special milk programs .................................... 3,543 183 3,359 3,043 167 2,875 3,293 178 3,115Supplemental feeding programs (WIC and CSFP) ...................... 930 2 928 930 1 928 1,126 3 1,123Commodity donations and other ................................................... 394 5 389 506 6 500 797 5 791
Total, food and nutrition assistance ......................................... 16,119 10,954 5,165 15,493 10,436 5,056 17,869 11,396 6,473
Public assistance and related programs:Supplemental security income program ....................................... 6,467 6,422 45 6,864 6,844 20 7,894 7,881 13Family support payments to States and TANF ........................... 7,736 42 7,694 7,530 42 7,488 7,875 31 7,844Low income home energy assistance .......................................... 1,780 126 1,653 1,687 2 1,685 1,993 3 1,991Earned income tax credit .............................................................. 1,318 1,318 ................ 1,201 1,201 ................ 1,213 1,213 ................Legal services ................................................................................ 324 324 ................ 259 259 ................ 234 234 ................Veterans non-service connected pensions ................................... 3,755 3,755 ................ 3,879 3,879 ................ 3,894 3,894 ................
Total, public assistance and related programs ........................ 21,380 11,988 9,393 21,421 12,228 9,193 23,103 13,255 9,848
All other payments for individuals:Coal miners and black lung benefits ............................................ 1,770 1,770 ................ 1,706 1,706 ................ 1,737 1,737 ................Veterans insurance and burial benefits ........................................ 208 208 ................ 140 140 ................ 122 122 ................Refugee assistance and other ...................................................... 1,780 1,140 641 2,033 1,155 878 1,517 1,013 504
Total, all other payments for individuals .................................. 3,759 3,118 641 3,879 3,001 878 3,376 2,872 504
Total, payments for individuals ..................................................... 324,658 286,807 37,851 357,924 319,123 38,800 396,523 353,951 42,572
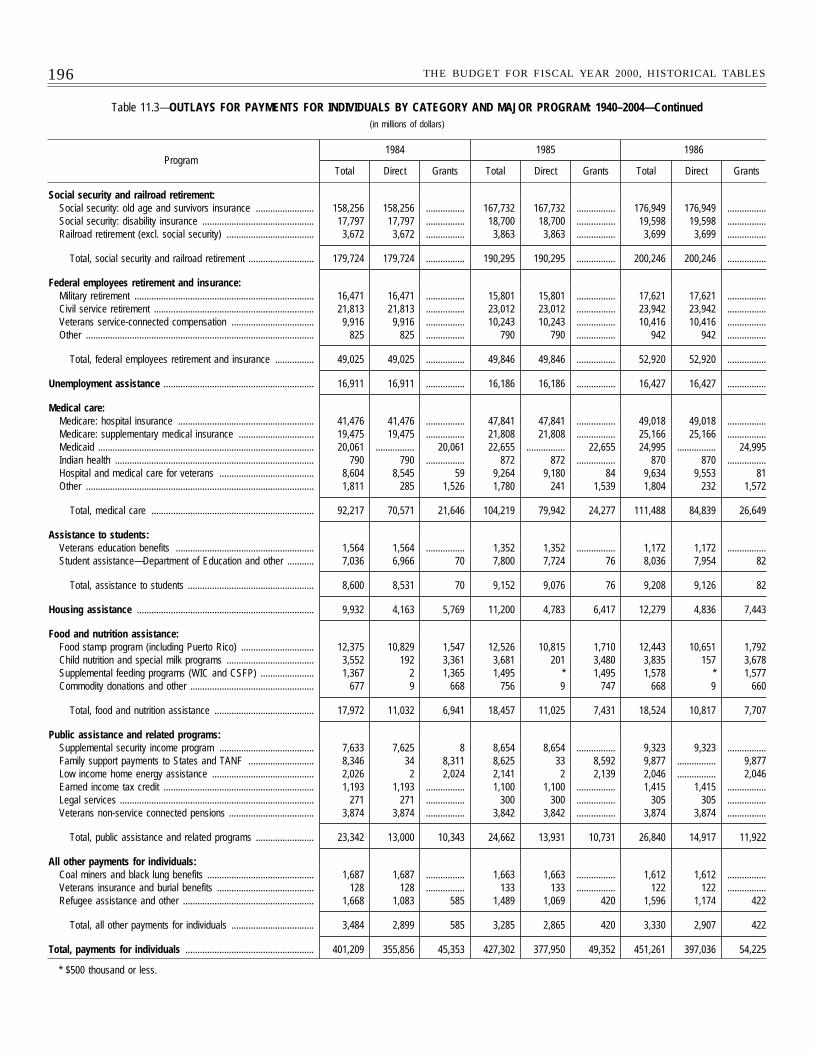
196 THE BUDGET FOR FISCAL YEAR 2000, HISTORICAL TABLES
Table 11.3—OUTLAYS FOR PAYMENTS FOR INDIVIDUALS BY CATEGORY AND MAJOR PROGRAM: 1940–2004—Continued(in millions of dollars)
Program1984 1985 1986
Total Direct Grants Total Direct Grants Total Direct Grants
Social security and railroad retirement:Social security: old age and survivors insurance ........................ 158,256 158,256 ................ 167,732 167,732 ................ 176,949 176,949 ................Social security: disability insurance .............................................. 17,797 17,797 ................ 18,700 18,700 ................ 19,598 19,598 ................Railroad retirement (excl. social security) .................................... 3,672 3,672 ................ 3,863 3,863 ................ 3,699 3,699 ................
Total, social security and railroad retirement ........................... 179,724 179,724 ................ 190,295 190,295 ................ 200,246 200,246 ................
Federal employees retirement and insurance:Military retirement .......................................................................... 16,471 16,471 ................ 15,801 15,801 ................ 17,621 17,621 ................Civil service retirement .................................................................. 21,813 21,813 ................ 23,012 23,012 ................ 23,942 23,942 ................Veterans service-connected compensation .................................. 9,916 9,916 ................ 10,243 10,243 ................ 10,416 10,416 ................Other .............................................................................................. 825 825 ................ 790 790 ................ 942 942 ................
Total, federal employees retirement and insurance ................ 49,025 49,025 ................ 49,846 49,846 ................ 52,920 52,920 ................
Unemployment assistance .............................................................. 16,911 16,911 ................ 16,186 16,186 ................ 16,427 16,427 ................
Medical care:Medicare: hospital insurance ........................................................ 41,476 41,476 ................ 47,841 47,841 ................ 49,018 49,018 ................Medicare: supplementary medical insurance ............................... 19,475 19,475 ................ 21,808 21,808 ................ 25,166 25,166 ................Medicaid ......................................................................................... 20,061 ................ 20,061 22,655 ................ 22,655 24,995 ................ 24,995Indian health .................................................................................. 790 790 ................ 872 872 ................ 870 870 ................Hospital and medical care for veterans ....................................... 8,604 8,545 59 9,264 9,180 84 9,634 9,553 81Other .............................................................................................. 1,811 285 1,526 1,780 241 1,539 1,804 232 1,572
Total, medical care ................................................................... 92,217 70,571 21,646 104,219 79,942 24,277 111,488 84,839 26,649
Assistance to students:Veterans education benefits ......................................................... 1,564 1,564 ................ 1,352 1,352 ................ 1,172 1,172 ................Student assistance—Department of Education and other ........... 7,036 6,966 70 7,800 7,724 76 8,036 7,954 82
Total, assistance to students .................................................... 8,600 8,531 70 9,152 9,076 76 9,208 9,126 82
Housing assistance ......................................................................... 9,932 4,163 5,769 11,200 4,783 6,417 12,279 4,836 7,443
Food and nutrition assistance:Food stamp program (including Puerto Rico) .............................. 12,375 10,829 1,547 12,526 10,815 1,710 12,443 10,651 1,792Child nutrition and special milk programs .................................... 3,552 192 3,361 3,681 201 3,480 3,835 157 3,678Supplemental feeding programs (WIC and CSFP) ...................... 1,367 2 1,365 1,495 * 1,495 1,578 * 1,577Commodity donations and other ................................................... 677 9 668 756 9 747 668 9 660
Total, food and nutrition assistance ......................................... 17,972 11,032 6,941 18,457 11,025 7,431 18,524 10,817 7,707
Public assistance and related programs:Supplemental security income program ....................................... 7,633 7,625 8 8,654 8,654 ................ 9,323 9,323 ................Family support payments to States and TANF ........................... 8,346 34 8,311 8,625 33 8,592 9,877 ................ 9,877Low income home energy assistance .......................................... 2,026 2 2,024 2,141 2 2,139 2,046 ................ 2,046Earned income tax credit .............................................................. 1,193 1,193 ................ 1,100 1,100 ................ 1,415 1,415 ................Legal services ................................................................................ 271 271 ................ 300 300 ................ 305 305 ................Veterans non-service connected pensions ................................... 3,874 3,874 ................ 3,842 3,842 ................ 3,874 3,874 ................
Total, public assistance and related programs ........................ 23,342 13,000 10,343 24,662 13,931 10,731 26,840 14,917 11,922
All other payments for individuals:Coal miners and black lung benefits ............................................ 1,687 1,687 ................ 1,663 1,663 ................ 1,612 1,612 ................Veterans insurance and burial benefits ........................................ 128 128 ................ 133 133 ................ 122 122 ................Refugee assistance and other ...................................................... 1,668 1,083 585 1,489 1,069 420 1,596 1,174 422
Total, all other payments for individuals .................................. 3,484 2,899 585 3,285 2,865 420 3,330 2,907 422
Total, payments for individuals ..................................................... 401,209 355,856 45,353 427,302 377,950 49,352 451,261 397,036 54,225
* $500 thousand or less.
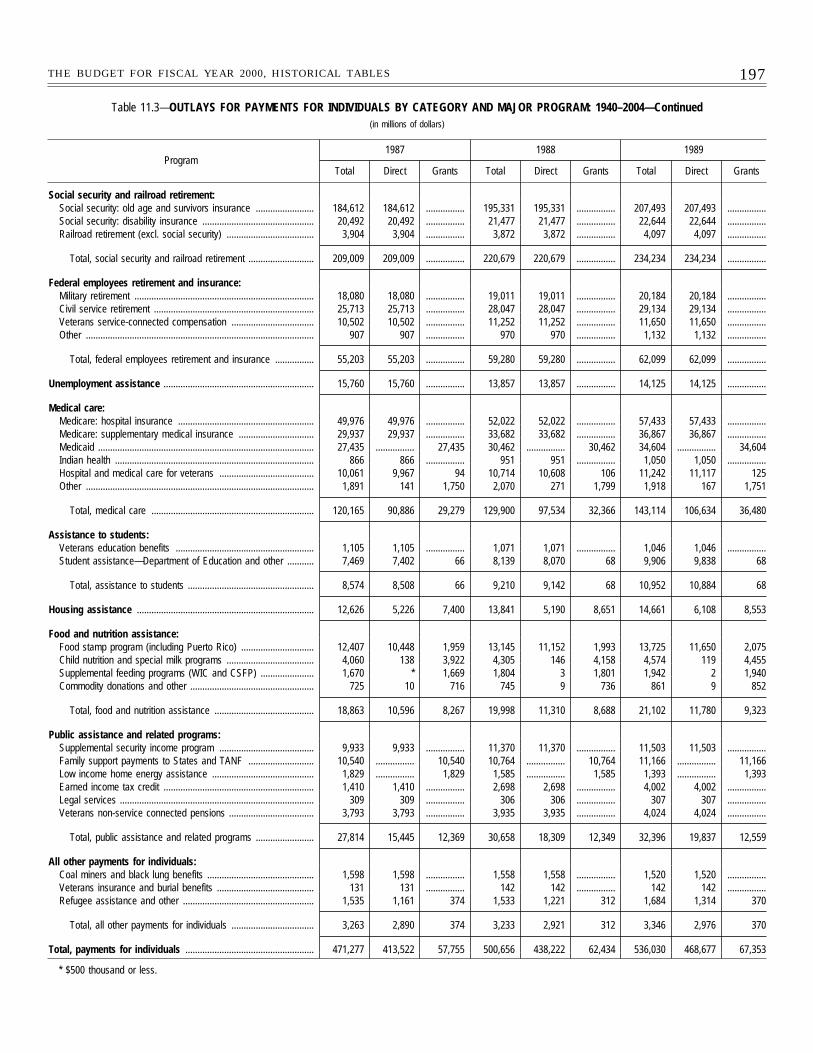
197THE BUDGET FOR FISCAL YEAR 2000, HISTORICAL TABLES
Table 11.3—OUTLAYS FOR PAYMENTS FOR INDIVIDUALS BY CATEGORY AND MAJOR PROGRAM: 1940–2004—Continued(in millions of dollars)
Program1987 1988 1989
Total Direct Grants Total Direct Grants Total Direct Grants
Social security and railroad retirement:Social security: old age and survivors insurance ........................ 184,612 184,612 ................ 195,331 195,331 ................ 207,493 207,493 ................Social security: disability insurance .............................................. 20,492 20,492 ................ 21,477 21,477 ................ 22,644 22,644 ................Railroad retirement (excl. social security) .................................... 3,904 3,904 ................ 3,872 3,872 ................ 4,097 4,097 ................
Total, social security and railroad retirement ........................... 209,009 209,009 ................ 220,679 220,679 ................ 234,234 234,234 ................
Federal employees retirement and insurance:Military retirement .......................................................................... 18,080 18,080 ................ 19,011 19,011 ................ 20,184 20,184 ................Civil service retirement .................................................................. 25,713 25,713 ................ 28,047 28,047 ................ 29,134 29,134 ................Veterans service-connected compensation .................................. 10,502 10,502 ................ 11,252 11,252 ................ 11,650 11,650 ................Other .............................................................................................. 907 907 ................ 970 970 ................ 1,132 1,132 ................
Total, federal employees retirement and insurance ................ 55,203 55,203 ................ 59,280 59,280 ................ 62,099 62,099 ................
Unemployment assistance .............................................................. 15,760 15,760 ................ 13,857 13,857 ................ 14,125 14,125 ................
Medical care:Medicare: hospital insurance ........................................................ 49,976 49,976 ................ 52,022 52,022 ................ 57,433 57,433 ................Medicare: supplementary medical insurance ............................... 29,937 29,937 ................ 33,682 33,682 ................ 36,867 36,867 ................Medicaid ......................................................................................... 27,435 ................ 27,435 30,462 ................ 30,462 34,604 ................ 34,604Indian health .................................................................................. 866 866 ................ 951 951 ................ 1,050 1,050 ................Hospital and medical care for veterans ....................................... 10,061 9,967 94 10,714 10,608 106 11,242 11,117 125Other .............................................................................................. 1,891 141 1,750 2,070 271 1,799 1,918 167 1,751
Total, medical care ................................................................... 120,165 90,886 29,279 129,900 97,534 32,366 143,114 106,634 36,480
Assistance to students:Veterans education benefits ......................................................... 1,105 1,105 ................ 1,071 1,071 ................ 1,046 1,046 ................Student assistance—Department of Education and other ........... 7,469 7,402 66 8,139 8,070 68 9,906 9,838 68
Total, assistance to students .................................................... 8,574 8,508 66 9,210 9,142 68 10,952 10,884 68
Housing assistance ......................................................................... 12,626 5,226 7,400 13,841 5,190 8,651 14,661 6,108 8,553
Food and nutrition assistance:Food stamp program (including Puerto Rico) .............................. 12,407 10,448 1,959 13,145 11,152 1,993 13,725 11,650 2,075Child nutrition and special milk programs .................................... 4,060 138 3,922 4,305 146 4,158 4,574 119 4,455Supplemental feeding programs (WIC and CSFP) ...................... 1,670 * 1,669 1,804 3 1,801 1,942 2 1,940Commodity donations and other ................................................... 725 10 716 745 9 736 861 9 852
Total, food and nutrition assistance ......................................... 18,863 10,596 8,267 19,998 11,310 8,688 21,102 11,780 9,323
Public assistance and related programs:Supplemental security income program ....................................... 9,933 9,933 ................ 11,370 11,370 ................ 11,503 11,503 ................Family support payments to States and TANF ........................... 10,540 ................ 10,540 10,764 ................ 10,764 11,166 ................ 11,166Low income home energy assistance .......................................... 1,829 ................ 1,829 1,585 ................ 1,585 1,393 ................ 1,393Earned income tax credit .............................................................. 1,410 1,410 ................ 2,698 2,698 ................ 4,002 4,002 ................Legal services ................................................................................ 309 309 ................ 306 306 ................ 307 307 ................Veterans non-service connected pensions ................................... 3,793 3,793 ................ 3,935 3,935 ................ 4,024 4,024 ................
Total, public assistance and related programs ........................ 27,814 15,445 12,369 30,658 18,309 12,349 32,396 19,837 12,559
All other payments for individuals:Coal miners and black lung benefits ............................................ 1,598 1,598 ................ 1,558 1,558 ................ 1,520 1,520 ................Veterans insurance and burial benefits ........................................ 131 131 ................ 142 142 ................ 142 142 ................Refugee assistance and other ...................................................... 1,535 1,161 374 1,533 1,221 312 1,684 1,314 370
Total, all other payments for individuals .................................. 3,263 2,890 374 3,233 2,921 312 3,346 2,976 370
Total, payments for individuals ..................................................... 471,277 413,522 57,755 500,656 438,222 62,434 536,030 468,677 67,353
* $500 thousand or less.
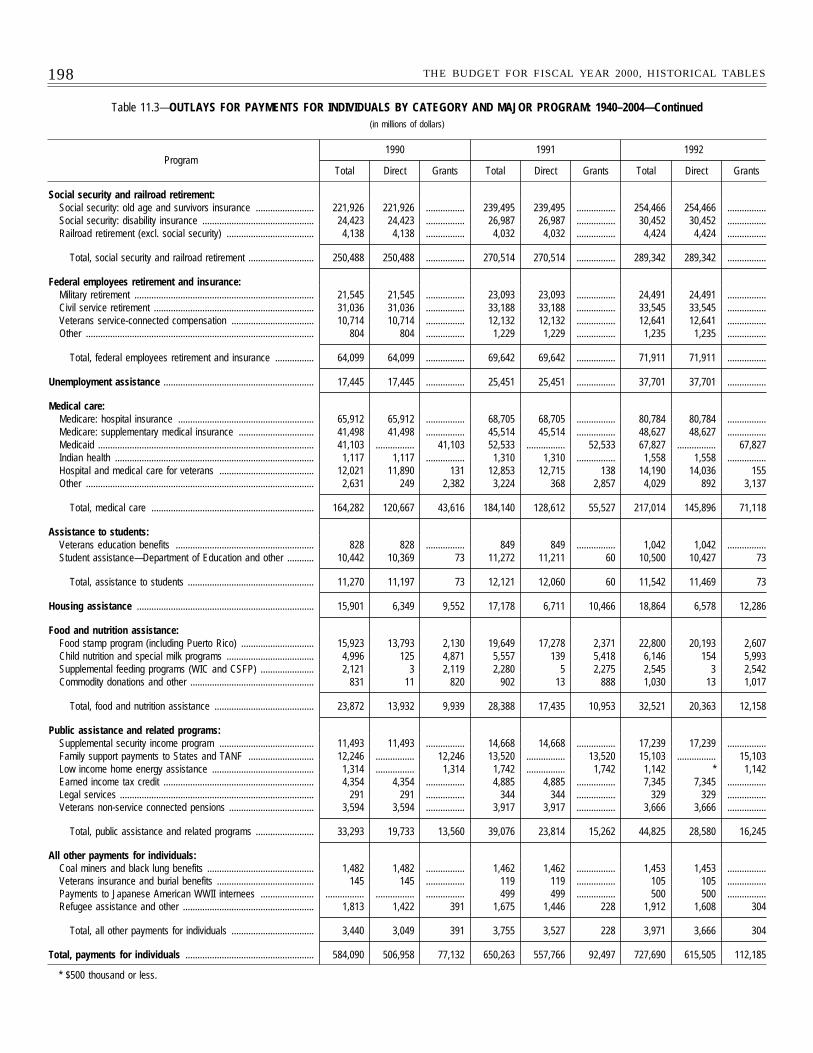
198 THE BUDGET FOR FISCAL YEAR 2000, HISTORICAL TABLES
Table 11.3—OUTLAYS FOR PAYMENTS FOR INDIVIDUALS BY CATEGORY AND MAJOR PROGRAM: 1940–2004—Continued(in millions of dollars)
Program1990 1991 1992
Total Direct Grants Total Direct Grants Total Direct Grants
Social security and railroad retirement:Social security: old age and survivors insurance ........................ 221,926 221,926 ................ 239,495 239,495 ................ 254,466 254,466 ................Social security: disability insurance .............................................. 24,423 24,423 ................ 26,987 26,987 ................ 30,452 30,452 ................Railroad retirement (excl. social security) .................................... 4,138 4,138 ................ 4,032 4,032 ................ 4,424 4,424 ................
Total, social security and railroad retirement ........................... 250,488 250,488 ................ 270,514 270,514 ................ 289,342 289,342 ................
Federal employees retirement and insurance:Military retirement .......................................................................... 21,545 21,545 ................ 23,093 23,093 ................ 24,491 24,491 ................Civil service retirement .................................................................. 31,036 31,036 ................ 33,188 33,188 ................ 33,545 33,545 ................Veterans service-connected compensation .................................. 10,714 10,714 ................ 12,132 12,132 ................ 12,641 12,641 ................Other .............................................................................................. 804 804 ................ 1,229 1,229 ................ 1,235 1,235 ................
Total, federal employees retirement and insurance ................ 64,099 64,099 ................ 69,642 69,642 ................ 71,911 71,911 ................
Unemployment assistance .............................................................. 17,445 17,445 ................ 25,451 25,451 ................ 37,701 37,701 ................
Medical care:Medicare: hospital insurance ........................................................ 65,912 65,912 ................ 68,705 68,705 ................ 80,784 80,784 ................Medicare: supplementary medical insurance ............................... 41,498 41,498 ................ 45,514 45,514 ................ 48,627 48,627 ................Medicaid ......................................................................................... 41,103 ................ 41,103 52,533 ................ 52,533 67,827 ................ 67,827Indian health .................................................................................. 1,117 1,117 ................ 1,310 1,310 ................ 1,558 1,558 ................Hospital and medical care for veterans ....................................... 12,021 11,890 131 12,853 12,715 138 14,190 14,036 155Other .............................................................................................. 2,631 249 2,382 3,224 368 2,857 4,029 892 3,137
Total, medical care ................................................................... 164,282 120,667 43,616 184,140 128,612 55,527 217,014 145,896 71,118
Assistance to students:Veterans education benefits ......................................................... 828 828 ................ 849 849 ................ 1,042 1,042 ................Student assistance—Department of Education and other ........... 10,442 10,369 73 11,272 11,211 60 10,500 10,427 73
Total, assistance to students .................................................... 11,270 11,197 73 12,121 12,060 60 11,542 11,469 73
Housing assistance ......................................................................... 15,901 6,349 9,552 17,178 6,711 10,466 18,864 6,578 12,286
Food and nutrition assistance:Food stamp program (including Puerto Rico) .............................. 15,923 13,793 2,130 19,649 17,278 2,371 22,800 20,193 2,607Child nutrition and special milk programs .................................... 4,996 125 4,871 5,557 139 5,418 6,146 154 5,993Supplemental feeding programs (WIC and CSFP) ...................... 2,121 3 2,119 2,280 5 2,275 2,545 3 2,542Commodity donations and other ................................................... 831 11 820 902 13 888 1,030 13 1,017
Total, food and nutrition assistance ......................................... 23,872 13,932 9,939 28,388 17,435 10,953 32,521 20,363 12,158
Public assistance and related programs:Supplemental security income program ....................................... 11,493 11,493 ................ 14,668 14,668 ................ 17,239 17,239 ................Family support payments to States and TANF ........................... 12,246 ................ 12,246 13,520 ................ 13,520 15,103 ................ 15,103Low income home energy assistance .......................................... 1,314 ................ 1,314 1,742 ................ 1,742 1,142 * 1,142Earned income tax credit .............................................................. 4,354 4,354 ................ 4,885 4,885 ................ 7,345 7,345 ................Legal services ................................................................................ 291 291 ................ 344 344 ................ 329 329 ................Veterans non-service connected pensions ................................... 3,594 3,594 ................ 3,917 3,917 ................ 3,666 3,666 ................
Total, public assistance and related programs ........................ 33,293 19,733 13,560 39,076 23,814 15,262 44,825 28,580 16,245
All other payments for individuals:Coal miners and black lung benefits ............................................ 1,482 1,482 ................ 1,462 1,462 ................ 1,453 1,453 ................Veterans insurance and burial benefits ........................................ 145 145 ................ 119 119 ................ 105 105 ................Payments to Japanese American WWII internees ...................... ................ ................ ................ 499 499 ................ 500 500 ................Refugee assistance and other ...................................................... 1,813 1,422 391 1,675 1,446 228 1,912 1,608 304
Total, all other payments for individuals .................................. 3,440 3,049 391 3,755 3,527 228 3,971 3,666 304
Total, payments for individuals ..................................................... 584,090 506,958 77,132 650,263 557,766 92,497 727,690 615,505 112,185
* $500 thousand or less.
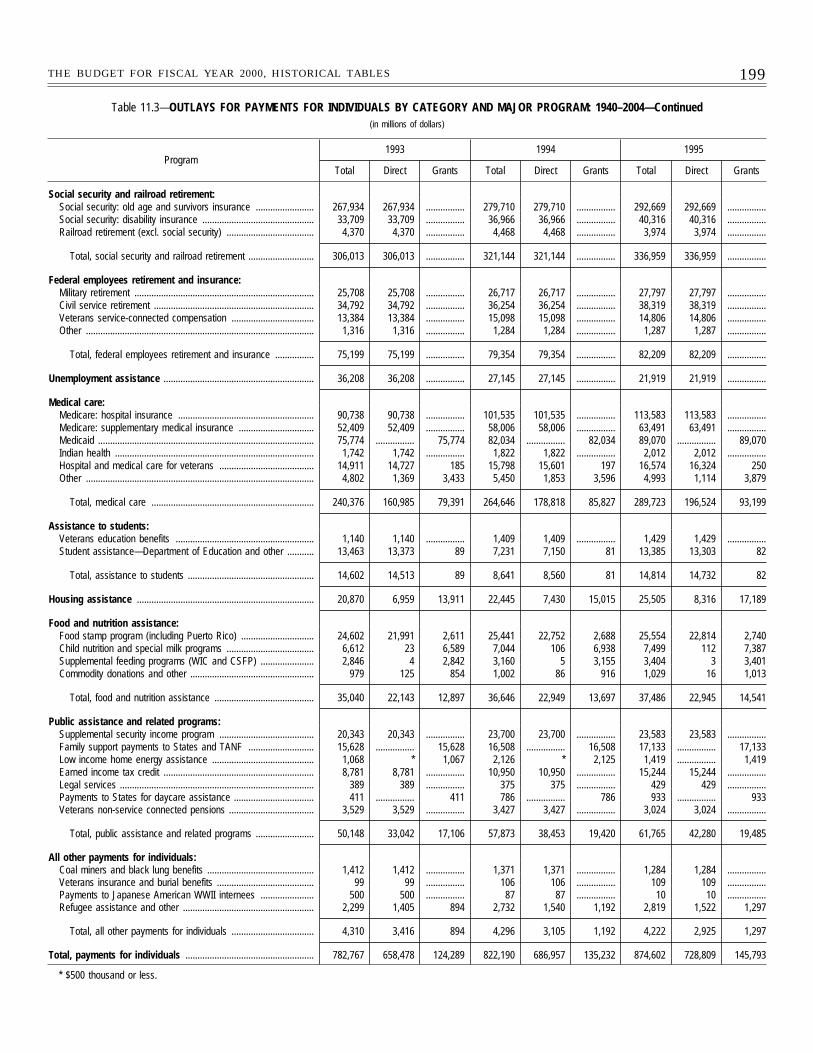
199THE BUDGET FOR FISCAL YEAR 2000, HISTORICAL TABLES
Table 11.3—OUTLAYS FOR PAYMENTS FOR INDIVIDUALS BY CATEGORY AND MAJOR PROGRAM: 1940–2004—Continued(in millions of dollars)
Program1993 1994 1995
Total Direct Grants Total Direct Grants Total Direct Grants
Social security and railroad retirement:Social security: old age and survivors insurance ........................ 267,934 267,934 ................ 279,710 279,710 ................ 292,669 292,669 ................Social security: disability insurance .............................................. 33,709 33,709 ................ 36,966 36,966 ................ 40,316 40,316 ................Railroad retirement (excl. social security) .................................... 4,370 4,370 ................ 4,468 4,468 ................ 3,974 3,974 ................
Total, social security and railroad retirement ........................... 306,013 306,013 ................ 321,144 321,144 ................ 336,959 336,959 ................
Federal employees retirement and insurance:Military retirement .......................................................................... 25,708 25,708 ................ 26,717 26,717 ................ 27,797 27,797 ................Civil service retirement .................................................................. 34,792 34,792 ................ 36,254 36,254 ................ 38,319 38,319 ................Veterans service-connected compensation .................................. 13,384 13,384 ................ 15,098 15,098 ................ 14,806 14,806 ................Other .............................................................................................. 1,316 1,316 ................ 1,284 1,284 ................ 1,287 1,287 ................
Total, federal employees retirement and insurance ................ 75,199 75,199 ................ 79,354 79,354 ................ 82,209 82,209 ................
Unemployment assistance .............................................................. 36,208 36,208 ................ 27,145 27,145 ................ 21,919 21,919 ................
Medical care:Medicare: hospital insurance ........................................................ 90,738 90,738 ................ 101,535 101,535 ................ 113,583 113,583 ................Medicare: supplementary medical insurance ............................... 52,409 52,409 ................ 58,006 58,006 ................ 63,491 63,491 ................Medicaid ......................................................................................... 75,774 ................ 75,774 82,034 ................ 82,034 89,070 ................ 89,070Indian health .................................................................................. 1,742 1,742 ................ 1,822 1,822 ................ 2,012 2,012 ................Hospital and medical care for veterans ....................................... 14,911 14,727 185 15,798 15,601 197 16,574 16,324 250Other .............................................................................................. 4,802 1,369 3,433 5,450 1,853 3,596 4,993 1,114 3,879
Total, medical care ................................................................... 240,376 160,985 79,391 264,646 178,818 85,827 289,723 196,524 93,199
Assistance to students:Veterans education benefits ......................................................... 1,140 1,140 ................ 1,409 1,409 ................ 1,429 1,429 ................Student assistance—Department of Education and other ........... 13,463 13,373 89 7,231 7,150 81 13,385 13,303 82
Total, assistance to students .................................................... 14,602 14,513 89 8,641 8,560 81 14,814 14,732 82
Housing assistance ......................................................................... 20,870 6,959 13,911 22,445 7,430 15,015 25,505 8,316 17,189
Food and nutrition assistance:Food stamp program (including Puerto Rico) .............................. 24,602 21,991 2,611 25,441 22,752 2,688 25,554 22,814 2,740Child nutrition and special milk programs .................................... 6,612 23 6,589 7,044 106 6,938 7,499 112 7,387Supplemental feeding programs (WIC and CSFP) ...................... 2,846 4 2,842 3,160 5 3,155 3,404 3 3,401Commodity donations and other ................................................... 979 125 854 1,002 86 916 1,029 16 1,013
Total, food and nutrition assistance ......................................... 35,040 22,143 12,897 36,646 22,949 13,697 37,486 22,945 14,541
Public assistance and related programs:Supplemental security income program ....................................... 20,343 20,343 ................ 23,700 23,700 ................ 23,583 23,583 ................Family support payments to States and TANF ........................... 15,628 ................ 15,628 16,508 ................ 16,508 17,133 ................ 17,133Low income home energy assistance .......................................... 1,068 * 1,067 2,126 * 2,125 1,419 ................ 1,419Earned income tax credit .............................................................. 8,781 8,781 ................ 10,950 10,950 ................ 15,244 15,244 ................Legal services ................................................................................ 389 389 ................ 375 375 ................ 429 429 ................Payments to States for daycare assistance ................................. 411 ................ 411 786 ................ 786 933 ................ 933Veterans non-service connected pensions ................................... 3,529 3,529 ................ 3,427 3,427 ................ 3,024 3,024 ................
Total, public assistance and related programs ........................ 50,148 33,042 17,106 57,873 38,453 19,420 61,765 42,280 19,485
All other payments for individuals:Coal miners and black lung benefits ............................................ 1,412 1,412 ................ 1,371 1,371 ................ 1,284 1,284 ................Veterans insurance and burial benefits ........................................ 99 99 ................ 106 106 ................ 109 109 ................Payments to Japanese American WWII internees ...................... 500 500 ................ 87 87 ................ 10 10 ................Refugee assistance and other ...................................................... 2,299 1,405 894 2,732 1,540 1,192 2,819 1,522 1,297
Total, all other payments for individuals .................................. 4,310 3,416 894 4,296 3,105 1,192 4,222 2,925 1,297
Total, payments for individuals ..................................................... 782,767 658,478 124,289 822,190 686,957 135,232 874,602 728,809 145,793
* $500 thousand or less.
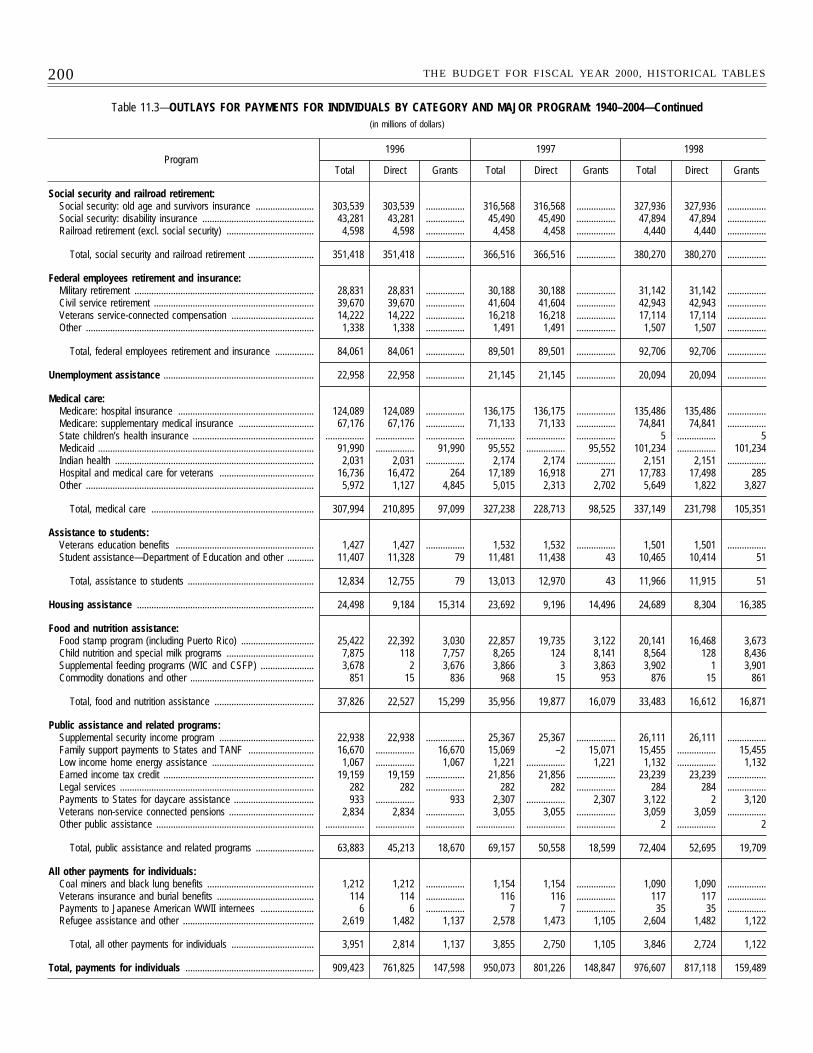
200 THE BUDGET FOR FISCAL YEAR 2000, HISTORICAL TABLES
Table 11.3—OUTLAYS FOR PAYMENTS FOR INDIVIDUALS BY CATEGORY AND MAJOR PROGRAM: 1940–2004—Continued(in millions of dollars)
Program1996 1997 1998
Total Direct Grants Total Direct Grants Total Direct Grants
Social security and railroad retirement:Social security: old age and survivors insurance ........................ 303,539 303,539 ................ 316,568 316,568 ................ 327,936 327,936 ................Social security: disability insurance .............................................. 43,281 43,281 ................ 45,490 45,490 ................ 47,894 47,894 ................Railroad retirement (excl. social security) .................................... 4,598 4,598 ................ 4,458 4,458 ................ 4,440 4,440 ................
Total, social security and railroad retirement ........................... 351,418 351,418 ................ 366,516 366,516 ................ 380,270 380,270 ................
Federal employees retirement and insurance:Military retirement .......................................................................... 28,831 28,831 ................ 30,188 30,188 ................ 31,142 31,142 ................Civil service retirement .................................................................. 39,670 39,670 ................ 41,604 41,604 ................ 42,943 42,943 ................Veterans service-connected compensation .................................. 14,222 14,222 ................ 16,218 16,218 ................ 17,114 17,114 ................Other .............................................................................................. 1,338 1,338 ................ 1,491 1,491 ................ 1,507 1,507 ................
Total, federal employees retirement and insurance ................ 84,061 84,061 ................ 89,501 89,501 ................ 92,706 92,706 ................
Unemployment assistance .............................................................. 22,958 22,958 ................ 21,145 21,145 ................ 20,094 20,094 ................
Medical care:Medicare: hospital insurance ........................................................ 124,089 124,089 ................ 136,175 136,175 ................ 135,486 135,486 ................Medicare: supplementary medical insurance ............................... 67,176 67,176 ................ 71,133 71,133 ................ 74,841 74,841 ................State children’s health insurance .................................................. ................ ................ ................ ................ ................ ................ 5 ................ 5Medicaid ......................................................................................... 91,990 ................ 91,990 95,552 ................ 95,552 101,234 ................ 101,234Indian health .................................................................................. 2,031 2,031 ................ 2,174 2,174 ................ 2,151 2,151 ................Hospital and medical care for veterans ....................................... 16,736 16,472 264 17,189 16,918 271 17,783 17,498 285Other .............................................................................................. 5,972 1,127 4,845 5,015 2,313 2,702 5,649 1,822 3,827
Total, medical care ................................................................... 307,994 210,895 97,099 327,238 228,713 98,525 337,149 231,798 105,351
Assistance to students:Veterans education benefits ......................................................... 1,427 1,427 ................ 1,532 1,532 ................ 1,501 1,501 ................Student assistance—Department of Education and other ........... 11,407 11,328 79 11,481 11,438 43 10,465 10,414 51
Total, assistance to students .................................................... 12,834 12,755 79 13,013 12,970 43 11,966 11,915 51
Housing assistance ......................................................................... 24,498 9,184 15,314 23,692 9,196 14,496 24,689 8,304 16,385
Food and nutrition assistance:Food stamp program (including Puerto Rico) .............................. 25,422 22,392 3,030 22,857 19,735 3,122 20,141 16,468 3,673Child nutrition and special milk programs .................................... 7,875 118 7,757 8,265 124 8,141 8,564 128 8,436Supplemental feeding programs (WIC and CSFP) ...................... 3,678 2 3,676 3,866 3 3,863 3,902 1 3,901Commodity donations and other ................................................... 851 15 836 968 15 953 876 15 861
Total, food and nutrition assistance ......................................... 37,826 22,527 15,299 35,956 19,877 16,079 33,483 16,612 16,871
Public assistance and related programs:Supplemental security income program ....................................... 22,938 22,938 ................ 25,367 25,367 ................ 26,111 26,111 ................Family support payments to States and TANF ........................... 16,670 ................ 16,670 15,069 –2 15,071 15,455 ................ 15,455Low income home energy assistance .......................................... 1,067 ................ 1,067 1,221 ................ 1,221 1,132 ................ 1,132Earned income tax credit .............................................................. 19,159 19,159 ................ 21,856 21,856 ................ 23,239 23,239 ................Legal services ................................................................................ 282 282 ................ 282 282 ................ 284 284 ................Payments to States for daycare assistance ................................. 933 ................ 933 2,307 ................ 2,307 3,122 2 3,120Veterans non-service connected pensions ................................... 2,834 2,834 ................ 3,055 3,055 ................ 3,059 3,059 ................Other public assistance ................................................................. ................ ................ ................ ................ ................ ................ 2 ................ 2
Total, public assistance and related programs ........................ 63,883 45,213 18,670 69,157 50,558 18,599 72,404 52,695 19,709
All other payments for individuals:Coal miners and black lung benefits ............................................ 1,212 1,212 ................ 1,154 1,154 ................ 1,090 1,090 ................Veterans insurance and burial benefits ........................................ 114 114 ................ 116 116 ................ 117 117 ................Payments to Japanese American WWII internees ...................... 6 6 ................ 7 7 ................ 35 35 ................Refugee assistance and other ...................................................... 2,619 1,482 1,137 2,578 1,473 1,105 2,604 1,482 1,122
Total, all other payments for individuals .................................. 3,951 2,814 1,137 3,855 2,750 1,105 3,846 2,724 1,122
Total, payments for individuals ..................................................... 909,423 761,825 147,598 950,073 801,226 148,847 976,607 817,118 159,489
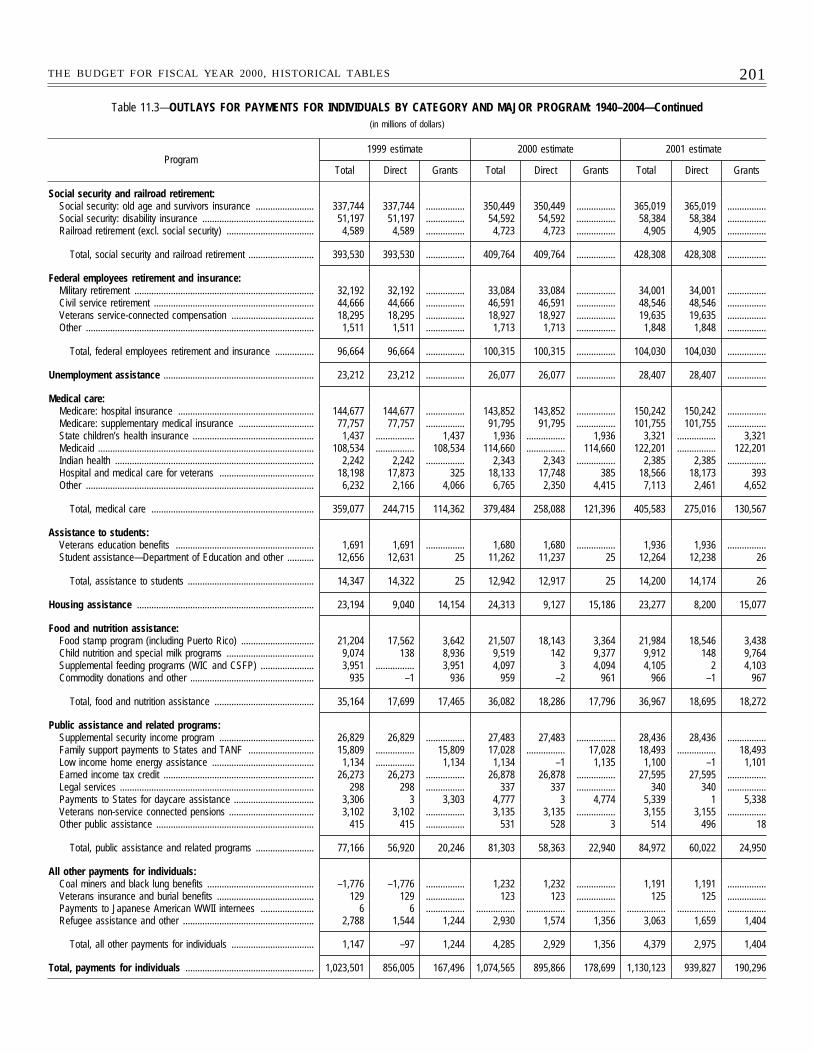
201THE BUDGET FOR FISCAL YEAR 2000, HISTORICAL TABLES
Table 11.3—OUTLAYS FOR PAYMENTS FOR INDIVIDUALS BY CATEGORY AND MAJOR PROGRAM: 1940–2004—Continued(in millions of dollars)
Program1999 estimate 2000 estimate 2001 estimate
Total Direct Grants Total Direct Grants Total Direct Grants
Social security and railroad retirement:Social security: old age and survivors insurance ........................ 337,744 337,744 ................ 350,449 350,449 ................ 365,019 365,019 ................Social security: disability insurance .............................................. 51,197 51,197 ................ 54,592 54,592 ................ 58,384 58,384 ................Railroad retirement (excl. social security) .................................... 4,589 4,589 ................ 4,723 4,723 ................ 4,905 4,905 ................
Total, social security and railroad retirement ........................... 393,530 393,530 ................ 409,764 409,764 ................ 428,308 428,308 ................
Federal employees retirement and insurance:Military retirement .......................................................................... 32,192 32,192 ................ 33,084 33,084 ................ 34,001 34,001 ................Civil service retirement .................................................................. 44,666 44,666 ................ 46,591 46,591 ................ 48,546 48,546 ................Veterans service-connected compensation .................................. 18,295 18,295 ................ 18,927 18,927 ................ 19,635 19,635 ................Other .............................................................................................. 1,511 1,511 ................ 1,713 1,713 ................ 1,848 1,848 ................
Total, federal employees retirement and insurance ................ 96,664 96,664 ................ 100,315 100,315 ................ 104,030 104,030 ................
Unemployment assistance .............................................................. 23,212 23,212 ................ 26,077 26,077 ................ 28,407 28,407 ................
Medical care:Medicare: hospital insurance ........................................................ 144,677 144,677 ................ 143,852 143,852 ................ 150,242 150,242 ................Medicare: supplementary medical insurance ............................... 77,757 77,757 ................ 91,795 91,795 ................ 101,755 101,755 ................State children’s health insurance .................................................. 1,437 ................ 1,437 1,936 ................ 1,936 3,321 ................ 3,321Medicaid ......................................................................................... 108,534 ................ 108,534 114,660 ................ 114,660 122,201 ................ 122,201Indian health .................................................................................. 2,242 2,242 ................ 2,343 2,343 ................ 2,385 2,385 ................Hospital and medical care for veterans ....................................... 18,198 17,873 325 18,133 17,748 385 18,566 18,173 393Other .............................................................................................. 6,232 2,166 4,066 6,765 2,350 4,415 7,113 2,461 4,652
Total, medical care ................................................................... 359,077 244,715 114,362 379,484 258,088 121,396 405,583 275,016 130,567
Assistance to students:Veterans education benefits ......................................................... 1,691 1,691 ................ 1,680 1,680 ................ 1,936 1,936 ................Student assistance—Department of Education and other ........... 12,656 12,631 25 11,262 11,237 25 12,264 12,238 26
Total, assistance to students .................................................... 14,347 14,322 25 12,942 12,917 25 14,200 14,174 26
Housing assistance ......................................................................... 23,194 9,040 14,154 24,313 9,127 15,186 23,277 8,200 15,077
Food and nutrition assistance:Food stamp program (including Puerto Rico) .............................. 21,204 17,562 3,642 21,507 18,143 3,364 21,984 18,546 3,438Child nutrition and special milk programs .................................... 9,074 138 8,936 9,519 142 9,377 9,912 148 9,764Supplemental feeding programs (WIC and CSFP) ...................... 3,951 ................ 3,951 4,097 3 4,094 4,105 2 4,103Commodity donations and other ................................................... 935 –1 936 959 –2 961 966 –1 967
Total, food and nutrition assistance ......................................... 35,164 17,699 17,465 36,082 18,286 17,796 36,967 18,695 18,272
Public assistance and related programs:Supplemental security income program ....................................... 26,829 26,829 ................ 27,483 27,483 ................ 28,436 28,436 ................Family support payments to States and TANF ........................... 15,809 ................ 15,809 17,028 ................ 17,028 18,493 ................ 18,493Low income home energy assistance .......................................... 1,134 ................ 1,134 1,134 –1 1,135 1,100 –1 1,101Earned income tax credit .............................................................. 26,273 26,273 ................ 26,878 26,878 ................ 27,595 27,595 ................Legal services ................................................................................ 298 298 ................ 337 337 ................ 340 340 ................Payments to States for daycare assistance ................................. 3,306 3 3,303 4,777 3 4,774 5,339 1 5,338Veterans non-service connected pensions ................................... 3,102 3,102 ................ 3,135 3,135 ................ 3,155 3,155 ................Other public assistance ................................................................. 415 415 ................ 531 528 3 514 496 18
Total, public assistance and related programs ........................ 77,166 56,920 20,246 81,303 58,363 22,940 84,972 60,022 24,950
All other payments for individuals:Coal miners and black lung benefits ............................................ –1,776 –1,776 ................ 1,232 1,232 ................ 1,191 1,191 ................Veterans insurance and burial benefits ........................................ 129 129 ................ 123 123 ................ 125 125 ................Payments to Japanese American WWII internees ...................... 6 6 ................ ................ ................ ................ ................ ................ ................Refugee assistance and other ...................................................... 2,788 1,544 1,244 2,930 1,574 1,356 3,063 1,659 1,404
Total, all other payments for individuals .................................. 1,147 –97 1,244 4,285 2,929 1,356 4,379 2,975 1,404
Total, payments for individuals ..................................................... 1,023,501 856,005 167,496 1,074,565 895,866 178,699 1,130,123 939,827 190,296
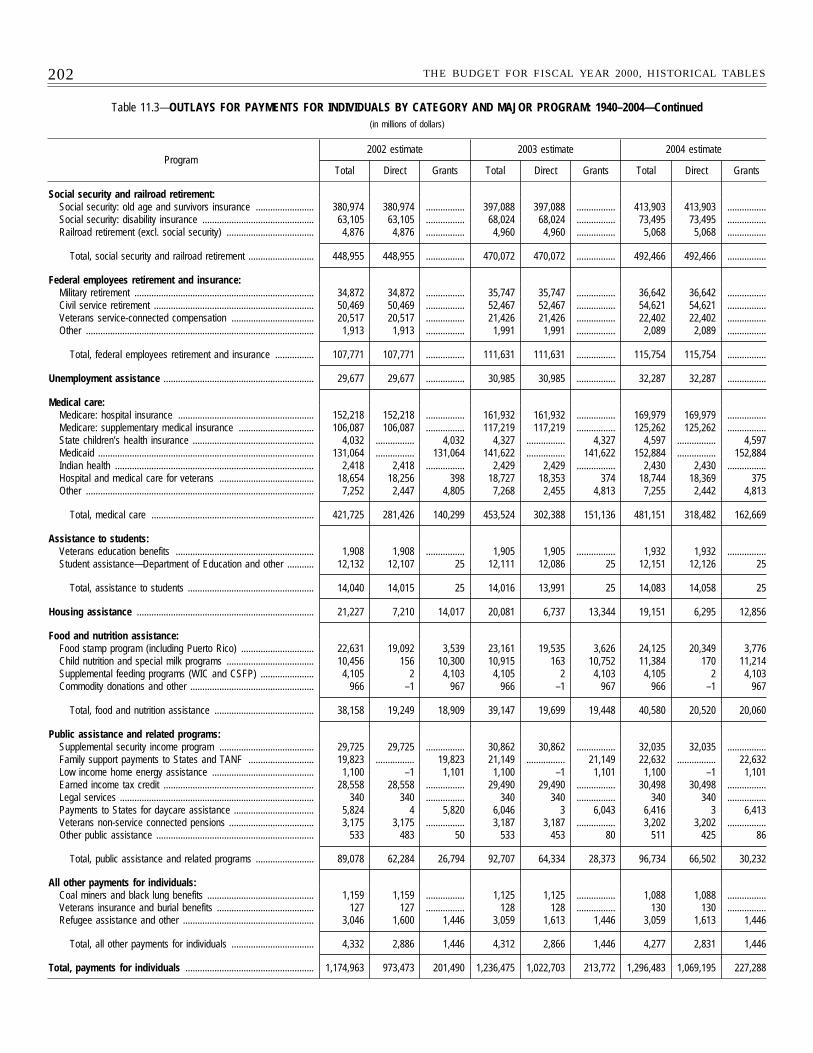
202 THE BUDGET FOR FISCAL YEAR 2000, HISTORICAL TABLES
Table 11.3—OUTLAYS FOR PAYMENTS FOR INDIVIDUALS BY CATEGORY AND MAJOR PROGRAM: 1940–2004—Continued(in millions of dollars)
Program2002 estimate 2003 estimate 2004 estimate
Total Direct Grants Total Direct Grants Total Direct Grants
Social security and railroad retirement:Social security: old age and survivors insurance ........................ 380,974 380,974 ................ 397,088 397,088 ................ 413,903 413,903 ................Social security: disability insurance .............................................. 63,105 63,105 ................ 68,024 68,024 ................ 73,495 73,495 ................Railroad retirement (excl. social security) .................................... 4,876 4,876 ................ 4,960 4,960 ................ 5,068 5,068 ................
Total, social security and railroad retirement ........................... 448,955 448,955 ................ 470,072 470,072 ................ 492,466 492,466 ................
Federal employees retirement and insurance:Military retirement .......................................................................... 34,872 34,872 ................ 35,747 35,747 ................ 36,642 36,642 ................Civil service retirement .................................................................. 50,469 50,469 ................ 52,467 52,467 ................ 54,621 54,621 ................Veterans service-connected compensation .................................. 20,517 20,517 ................ 21,426 21,426 ................ 22,402 22,402 ................Other .............................................................................................. 1,913 1,913 ................ 1,991 1,991 ................ 2,089 2,089 ................
Total, federal employees retirement and insurance ................ 107,771 107,771 ................ 111,631 111,631 ................ 115,754 115,754 ................
Unemployment assistance .............................................................. 29,677 29,677 ................ 30,985 30,985 ................ 32,287 32,287 ................
Medical care:Medicare: hospital insurance ........................................................ 152,218 152,218 ................ 161,932 161,932 ................ 169,979 169,979 ................Medicare: supplementary medical insurance ............................... 106,087 106,087 ................ 117,219 117,219 ................ 125,262 125,262 ................State children’s health insurance .................................................. 4,032 ................ 4,032 4,327 ................ 4,327 4,597 ................ 4,597Medicaid ......................................................................................... 131,064 ................ 131,064 141,622 ................ 141,622 152,884 ................ 152,884Indian health .................................................................................. 2,418 2,418 ................ 2,429 2,429 ................ 2,430 2,430 ................Hospital and medical care for veterans ....................................... 18,654 18,256 398 18,727 18,353 374 18,744 18,369 375Other .............................................................................................. 7,252 2,447 4,805 7,268 2,455 4,813 7,255 2,442 4,813
Total, medical care ................................................................... 421,725 281,426 140,299 453,524 302,388 151,136 481,151 318,482 162,669
Assistance to students:Veterans education benefits ......................................................... 1,908 1,908 ................ 1,905 1,905 ................ 1,932 1,932 ................Student assistance—Department of Education and other ........... 12,132 12,107 25 12,111 12,086 25 12,151 12,126 25
Total, assistance to students .................................................... 14,040 14,015 25 14,016 13,991 25 14,083 14,058 25
Housing assistance ......................................................................... 21,227 7,210 14,017 20,081 6,737 13,344 19,151 6,295 12,856
Food and nutrition assistance:Food stamp program (including Puerto Rico) .............................. 22,631 19,092 3,539 23,161 19,535 3,626 24,125 20,349 3,776Child nutrition and special milk programs .................................... 10,456 156 10,300 10,915 163 10,752 11,384 170 11,214Supplemental feeding programs (WIC and CSFP) ...................... 4,105 2 4,103 4,105 2 4,103 4,105 2 4,103Commodity donations and other ................................................... 966 –1 967 966 –1 967 966 –1 967
Total, food and nutrition assistance ......................................... 38,158 19,249 18,909 39,147 19,699 19,448 40,580 20,520 20,060
Public assistance and related programs:Supplemental security income program ....................................... 29,725 29,725 ................ 30,862 30,862 ................ 32,035 32,035 ................Family support payments to States and TANF ........................... 19,823 ................ 19,823 21,149 ................ 21,149 22,632 ................ 22,632Low income home energy assistance .......................................... 1,100 –1 1,101 1,100 –1 1,101 1,100 –1 1,101Earned income tax credit .............................................................. 28,558 28,558 ................ 29,490 29,490 ................ 30,498 30,498 ................Legal services ................................................................................ 340 340 ................ 340 340 ................ 340 340 ................Payments to States for daycare assistance ................................. 5,824 4 5,820 6,046 3 6,043 6,416 3 6,413Veterans non-service connected pensions ................................... 3,175 3,175 ................ 3,187 3,187 ................ 3,202 3,202 ................Other public assistance ................................................................. 533 483 50 533 453 80 511 425 86
Total, public assistance and related programs ........................ 89,078 62,284 26,794 92,707 64,334 28,373 96,734 66,502 30,232
All other payments for individuals:Coal miners and black lung benefits ............................................ 1,159 1,159 ................ 1,125 1,125 ................ 1,088 1,088 ................Veterans insurance and burial benefits ........................................ 127 127 ................ 128 128 ................ 130 130 ................Refugee assistance and other ...................................................... 3,046 1,600 1,446 3,059 1,613 1,446 3,059 1,613 1,446
Total, all other payments for individuals .................................. 4,332 2,886 1,446 4,312 2,866 1,446 4,277 2,831 1,446
Total, payments for individuals ..................................................... 1,174,963 973,473 201,490 1,236,475 1,022,703 213,772 1,296,483 1,069,195 227,288
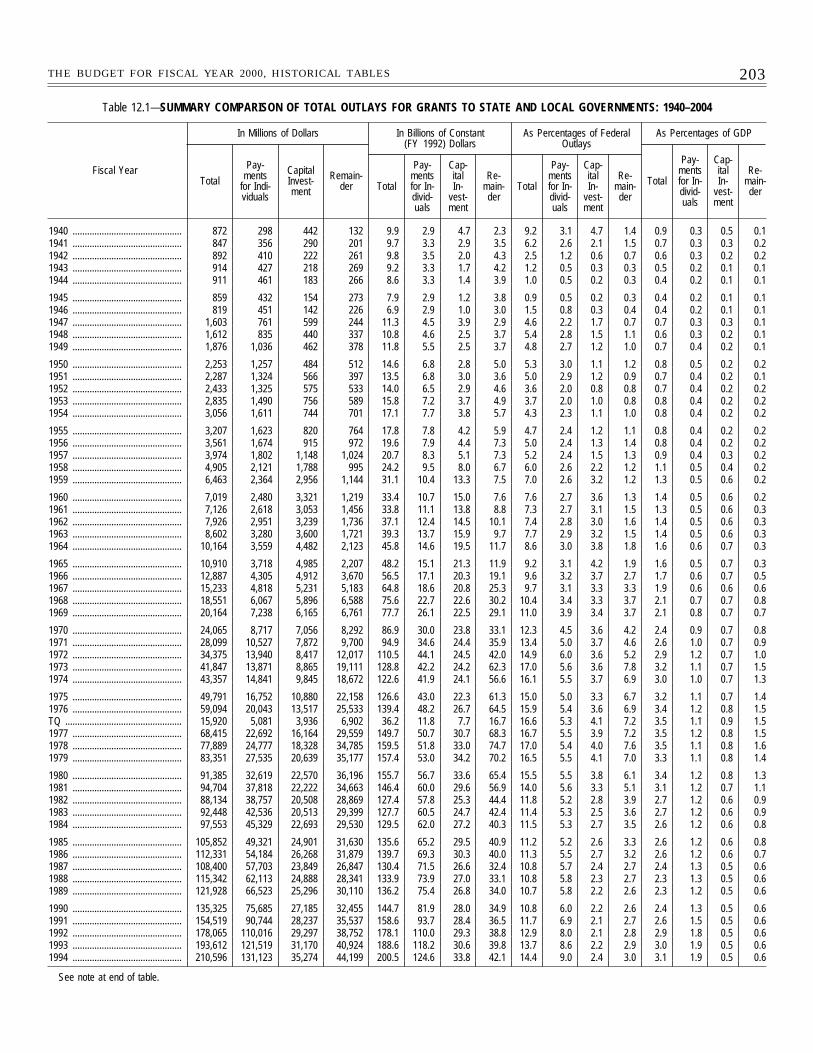
203THE BUDGET FOR FISCAL YEAR 2000, HISTORICAL TABLES
Table 12.1—SUMMARY COMPARISON OF TOTAL OUTLAYS FOR GRANTS TO STATE AND LOCAL GOVERNMENTS: 1940–2004
Fiscal Year
In Millions of Dollars In Billions of Constant(FY 1992) Dollars
As Percentages of FederalOutlays
As Percentages of GDP
Total
Pay-ments
for Indi-viduals
CapitalInvest-ment
Remain-der Total
Pay-mentsfor In-divid-uals
Cap-italIn-
vest-ment
Re-main-der
Total
Pay-mentsfor In-divid-uals
Cap-italIn-
vest-ment
Re-main-der
Total
Pay-mentsfor In-divid-uals
Cap-italIn-
vest-ment
Re-main-der
1940 ............................................. 872 298 442 132 9.9 2.9 4.7 2.3 9.2 3.1 4.7 1.4 0.9 0.3 0.5 0.11941 ............................................. 847 356 290 201 9.7 3.3 2.9 3.5 6.2 2.6 2.1 1.5 0.7 0.3 0.3 0.21942 ............................................. 892 410 222 261 9.8 3.5 2.0 4.3 2.5 1.2 0.6 0.7 0.6 0.3 0.2 0.21943 ............................................. 914 427 218 269 9.2 3.3 1.7 4.2 1.2 0.5 0.3 0.3 0.5 0.2 0.1 0.11944 ............................................. 911 461 183 266 8.6 3.3 1.4 3.9 1.0 0.5 0.2 0.3 0.4 0.2 0.1 0.1
1945 ............................................. 859 432 154 273 7.9 2.9 1.2 3.8 0.9 0.5 0.2 0.3 0.4 0.2 0.1 0.11946 ............................................. 819 451 142 226 6.9 2.9 1.0 3.0 1.5 0.8 0.3 0.4 0.4 0.2 0.1 0.11947 ............................................. 1,603 761 599 244 11.3 4.5 3.9 2.9 4.6 2.2 1.7 0.7 0.7 0.3 0.3 0.11948 ............................................. 1,612 835 440 337 10.8 4.6 2.5 3.7 5.4 2.8 1.5 1.1 0.6 0.3 0.2 0.11949 ............................................. 1,876 1,036 462 378 11.8 5.5 2.5 3.7 4.8 2.7 1.2 1.0 0.7 0.4 0.2 0.1
1950 ............................................. 2,253 1,257 484 512 14.6 6.8 2.8 5.0 5.3 3.0 1.1 1.2 0.8 0.5 0.2 0.21951 ............................................. 2,287 1,324 566 397 13.5 6.8 3.0 3.6 5.0 2.9 1.2 0.9 0.7 0.4 0.2 0.11952 ............................................. 2,433 1,325 575 533 14.0 6.5 2.9 4.6 3.6 2.0 0.8 0.8 0.7 0.4 0.2 0.21953 ............................................. 2,835 1,490 756 589 15.8 7.2 3.7 4.9 3.7 2.0 1.0 0.8 0.8 0.4 0.2 0.21954 ............................................. 3,056 1,611 744 701 17.1 7.7 3.8 5.7 4.3 2.3 1.1 1.0 0.8 0.4 0.2 0.2
1955 ............................................. 3,207 1,623 820 764 17.8 7.8 4.2 5.9 4.7 2.4 1.2 1.1 0.8 0.4 0.2 0.21956 ............................................. 3,561 1,674 915 972 19.6 7.9 4.4 7.3 5.0 2.4 1.3 1.4 0.8 0.4 0.2 0.21957 ............................................. 3,974 1,802 1,148 1,024 20.7 8.3 5.1 7.3 5.2 2.4 1.5 1.3 0.9 0.4 0.3 0.21958 ............................................. 4,905 2,121 1,788 995 24.2 9.5 8.0 6.7 6.0 2.6 2.2 1.2 1.1 0.5 0.4 0.21959 ............................................. 6,463 2,364 2,956 1,144 31.1 10.4 13.3 7.5 7.0 2.6 3.2 1.2 1.3 0.5 0.6 0.2
1960 ............................................. 7,019 2,480 3,321 1,219 33.4 10.7 15.0 7.6 7.6 2.7 3.6 1.3 1.4 0.5 0.6 0.21961 ............................................. 7,126 2,618 3,053 1,456 33.8 11.1 13.8 8.8 7.3 2.7 3.1 1.5 1.3 0.5 0.6 0.31962 ............................................. 7,926 2,951 3,239 1,736 37.1 12.4 14.5 10.1 7.4 2.8 3.0 1.6 1.4 0.5 0.6 0.31963 ............................................. 8,602 3,280 3,600 1,721 39.3 13.7 15.9 9.7 7.7 2.9 3.2 1.5 1.4 0.5 0.6 0.31964 ............................................. 10,164 3,559 4,482 2,123 45.8 14.6 19.5 11.7 8.6 3.0 3.8 1.8 1.6 0.6 0.7 0.3
1965 ............................................. 10,910 3,718 4,985 2,207 48.2 15.1 21.3 11.9 9.2 3.1 4.2 1.9 1.6 0.5 0.7 0.31966 ............................................. 12,887 4,305 4,912 3,670 56.5 17.1 20.3 19.1 9.6 3.2 3.7 2.7 1.7 0.6 0.7 0.51967 ............................................. 15,233 4,818 5,231 5,183 64.8 18.6 20.8 25.3 9.7 3.1 3.3 3.3 1.9 0.6 0.6 0.61968 ............................................. 18,551 6,067 5,896 6,588 75.6 22.7 22.6 30.2 10.4 3.4 3.3 3.7 2.1 0.7 0.7 0.81969 ............................................. 20,164 7,238 6,165 6,761 77.7 26.1 22.5 29.1 11.0 3.9 3.4 3.7 2.1 0.8 0.7 0.7
1970 ............................................. 24,065 8,717 7,056 8,292 86.9 30.0 23.8 33.1 12.3 4.5 3.6 4.2 2.4 0.9 0.7 0.81971 ............................................. 28,099 10,527 7,872 9,700 94.9 34.6 24.4 35.9 13.4 5.0 3.7 4.6 2.6 1.0 0.7 0.91972 ............................................. 34,375 13,940 8,417 12,017 110.5 44.1 24.5 42.0 14.9 6.0 3.6 5.2 2.9 1.2 0.7 1.01973 ............................................. 41,847 13,871 8,865 19,111 128.8 42.2 24.2 62.3 17.0 5.6 3.6 7.8 3.2 1.1 0.7 1.51974 ............................................. 43,357 14,841 9,845 18,672 122.6 41.9 24.1 56.6 16.1 5.5 3.7 6.9 3.0 1.0 0.7 1.3
1975 ............................................. 49,791 16,752 10,880 22,158 126.6 43.0 22.3 61.3 15.0 5.0 3.3 6.7 3.2 1.1 0.7 1.41976 ............................................. 59,094 20,043 13,517 25,533 139.4 48.2 26.7 64.5 15.9 5.4 3.6 6.9 3.4 1.2 0.8 1.5TQ ................................................ 15,920 5,081 3,936 6,902 36.2 11.8 7.7 16.7 16.6 5.3 4.1 7.2 3.5 1.1 0.9 1.51977 ............................................. 68,415 22,692 16,164 29,559 149.7 50.7 30.7 68.3 16.7 5.5 3.9 7.2 3.5 1.2 0.8 1.51978 ............................................. 77,889 24,777 18,328 34,785 159.5 51.8 33.0 74.7 17.0 5.4 4.0 7.6 3.5 1.1 0.8 1.61979 ............................................. 83,351 27,535 20,639 35,177 157.4 53.0 34.2 70.2 16.5 5.5 4.1 7.0 3.3 1.1 0.8 1.4
1980 ............................................. 91,385 32,619 22,570 36,196 155.7 56.7 33.6 65.4 15.5 5.5 3.8 6.1 3.4 1.2 0.8 1.31981 ............................................. 94,704 37,818 22,222 34,663 146.4 60.0 29.6 56.9 14.0 5.6 3.3 5.1 3.1 1.2 0.7 1.11982 ............................................. 88,134 38,757 20,508 28,869 127.4 57.8 25.3 44.4 11.8 5.2 2.8 3.9 2.7 1.2 0.6 0.91983 ............................................. 92,448 42,536 20,513 29,399 127.7 60.5 24.7 42.4 11.4 5.3 2.5 3.6 2.7 1.2 0.6 0.91984 ............................................. 97,553 45,329 22,693 29,530 129.5 62.0 27.2 40.3 11.5 5.3 2.7 3.5 2.6 1.2 0.6 0.8
1985 ............................................. 105,852 49,321 24,901 31,630 135.6 65.2 29.5 40.9 11.2 5.2 2.6 3.3 2.6 1.2 0.6 0.81986 ............................................. 112,331 54,184 26,268 31,879 139.7 69.3 30.3 40.0 11.3 5.5 2.7 3.2 2.6 1.2 0.6 0.71987 ............................................. 108,400 57,703 23,849 26,847 130.4 71.5 26.6 32.4 10.8 5.7 2.4 2.7 2.4 1.3 0.5 0.61988 ............................................. 115,342 62,113 24,888 28,341 133.9 73.9 27.0 33.1 10.8 5.8 2.3 2.7 2.3 1.3 0.5 0.61989 ............................................. 121,928 66,523 25,296 30,110 136.2 75.4 26.8 34.0 10.7 5.8 2.2 2.6 2.3 1.2 0.5 0.6
1990 ............................................. 135,325 75,685 27,185 32,455 144.7 81.9 28.0 34.9 10.8 6.0 2.2 2.6 2.4 1.3 0.5 0.61991 ............................................. 154,519 90,744 28,237 35,537 158.6 93.7 28.4 36.5 11.7 6.9 2.1 2.7 2.6 1.5 0.5 0.61992 ............................................. 178,065 110,016 29,297 38,752 178.1 110.0 29.3 38.8 12.9 8.0 2.1 2.8 2.9 1.8 0.5 0.61993 ............................................. 193,612 121,519 31,170 40,924 188.6 118.2 30.6 39.8 13.7 8.6 2.2 2.9 3.0 1.9 0.5 0.61994 ............................................. 210,596 131,123 35,274 44,199 200.5 124.6 33.8 42.1 14.4 9.0 2.4 3.0 3.1 1.9 0.5 0.6
See note at end of table.
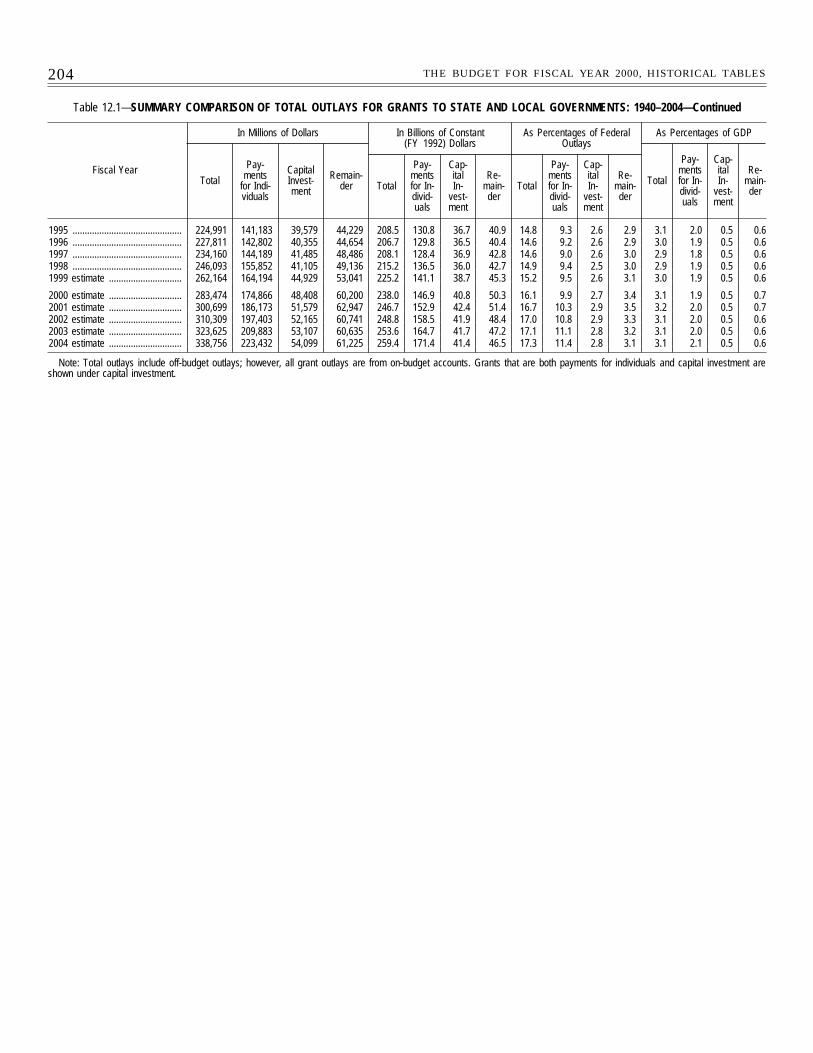
204 THE BUDGET FOR FISCAL YEAR 2000, HISTORICAL TABLES
Table 12.1—SUMMARY COMPARISON OF TOTAL OUTLAYS FOR GRANTS TO STATE AND LOCAL GOVERNMENTS: 1940–2004—Continued
Fiscal Year
In Millions of Dollars In Billions of Constant(FY 1992) Dollars
As Percentages of FederalOutlays
As Percentages of GDP
Total
Pay-ments
for Indi-viduals
CapitalInvest-ment
Remain-der Total
Pay-mentsfor In-divid-uals
Cap-italIn-
vest-ment
Re-main-der
Total
Pay-mentsfor In-divid-uals
Cap-italIn-
vest-ment
Re-main-der
Total
Pay-mentsfor In-divid-uals
Cap-italIn-
vest-ment
Re-main-der
1995 ............................................. 224,991 141,183 39,579 44,229 208.5 130.8 36.7 40.9 14.8 9.3 2.6 2.9 3.1 2.0 0.5 0.61996 ............................................. 227,811 142,802 40,355 44,654 206.7 129.8 36.5 40.4 14.6 9.2 2.6 2.9 3.0 1.9 0.5 0.61997 ............................................. 234,160 144,189 41,485 48,486 208.1 128.4 36.9 42.8 14.6 9.0 2.6 3.0 2.9 1.8 0.5 0.61998 ............................................. 246,093 155,852 41,105 49,136 215.2 136.5 36.0 42.7 14.9 9.4 2.5 3.0 2.9 1.9 0.5 0.61999 estimate .............................. 262,164 164,194 44,929 53,041 225.2 141.1 38.7 45.3 15.2 9.5 2.6 3.1 3.0 1.9 0.5 0.6
2000 estimate .............................. 283,474 174,866 48,408 60,200 238.0 146.9 40.8 50.3 16.1 9.9 2.7 3.4 3.1 1.9 0.5 0.72001 estimate .............................. 300,699 186,173 51,579 62,947 246.7 152.9 42.4 51.4 16.7 10.3 2.9 3.5 3.2 2.0 0.5 0.72002 estimate .............................. 310,309 197,403 52,165 60,741 248.8 158.5 41.9 48.4 17.0 10.8 2.9 3.3 3.1 2.0 0.5 0.62003 estimate .............................. 323,625 209,883 53,107 60,635 253.6 164.7 41.7 47.2 17.1 11.1 2.8 3.2 3.1 2.0 0.5 0.62004 estimate .............................. 338,756 223,432 54,099 61,225 259.4 171.4 41.4 46.5 17.3 11.4 2.8 3.1 3.1 2.1 0.5 0.6
Note: Total outlays include off-budget outlays; however, all grant outlays are from on-budget accounts. Grants that are both payments for individuals and capital investment areshown under capital investment.
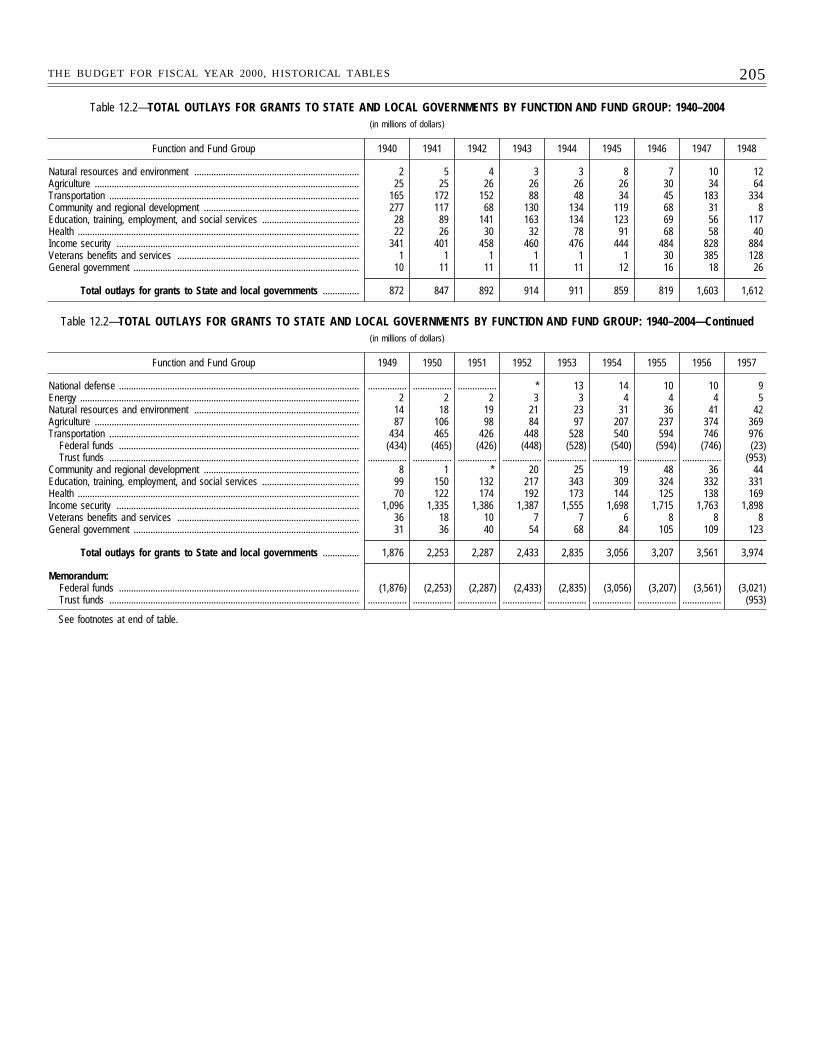
205THE BUDGET FOR FISCAL YEAR 2000, HISTORICAL TABLES
Table 12.2—TOTAL OUTLAYS FOR GRANTS TO STATE AND LOCAL GOVERNMENTS BY FUNCTION AND FUND GROUP: 1940–2004(in millions of dollars)
Function and Fund Group 1940 1941 1942 1943 1944 1945 1946 1947 1948
Natural resources and environment .................................................................... 2 5 4 3 3 8 7 10 12Agriculture ............................................................................................................. 25 25 26 26 26 26 30 34 64Transportation ....................................................................................................... 165 172 152 88 48 34 45 183 334Community and regional development ................................................................ 277 117 68 130 134 119 68 31 8Education, training, employment, and social services ........................................ 28 89 141 163 134 123 69 56 117Health .................................................................................................................... 22 26 30 32 78 91 68 58 40Income security .................................................................................................... 341 401 458 460 476 444 484 828 884Veterans benefits and services ........................................................................... 1 1 1 1 1 1 30 385 128General government ............................................................................................. 10 11 11 11 11 12 16 18 26
Total outlays for grants to State and local governments ............... 872 847 892 914 911 859 819 1,603 1,612
Table 12.2—TOTAL OUTLAYS FOR GRANTS TO STATE AND LOCAL GOVERNMENTS BY FUNCTION AND FUND GROUP: 1940–2004—Continued(in millions of dollars)
Function and Fund Group 1949 1950 1951 1952 1953 1954 1955 1956 1957
National defense ................................................................................................... ................ ................ ................ * 13 14 10 10 9Energy ................................................................................................................... 2 2 2 3 3 4 4 4 5Natural resources and environment .................................................................... 14 18 19 21 23 31 36 41 42Agriculture ............................................................................................................. 87 106 98 84 97 207 237 374 369Transportation ....................................................................................................... 434 465 426 448 528 540 594 746 976
Federal funds ................................................................................................... (434) (465) (426) (448) (528) (540) (594) (746) (23)Trust funds ....................................................................................................... ................ ................ ................ ................ ................ ................ ................ ................ (953)
Community and regional development ................................................................ 8 1 * 20 25 19 48 36 44Education, training, employment, and social services ........................................ 99 150 132 217 343 309 324 332 331Health .................................................................................................................... 70 122 174 192 173 144 125 138 169Income security .................................................................................................... 1,096 1,335 1,386 1,387 1,555 1,698 1,715 1,763 1,898Veterans benefits and services ........................................................................... 36 18 10 7 7 6 8 8 8General government ............................................................................................. 31 36 40 54 68 84 105 109 123
Total outlays for grants to State and local governments ............... 1,876 2,253 2,287 2,433 2,835 3,056 3,207 3,561 3,974
Memorandum:Federal funds ................................................................................................... (1,876) (2,253) (2,287) (2,433) (2,835) (3,056) (3,207) (3,561) (3,021)Trust funds ....................................................................................................... ................ ................ ................ ................ ................ ................ ................ ................ (953)
See footnotes at end of table.
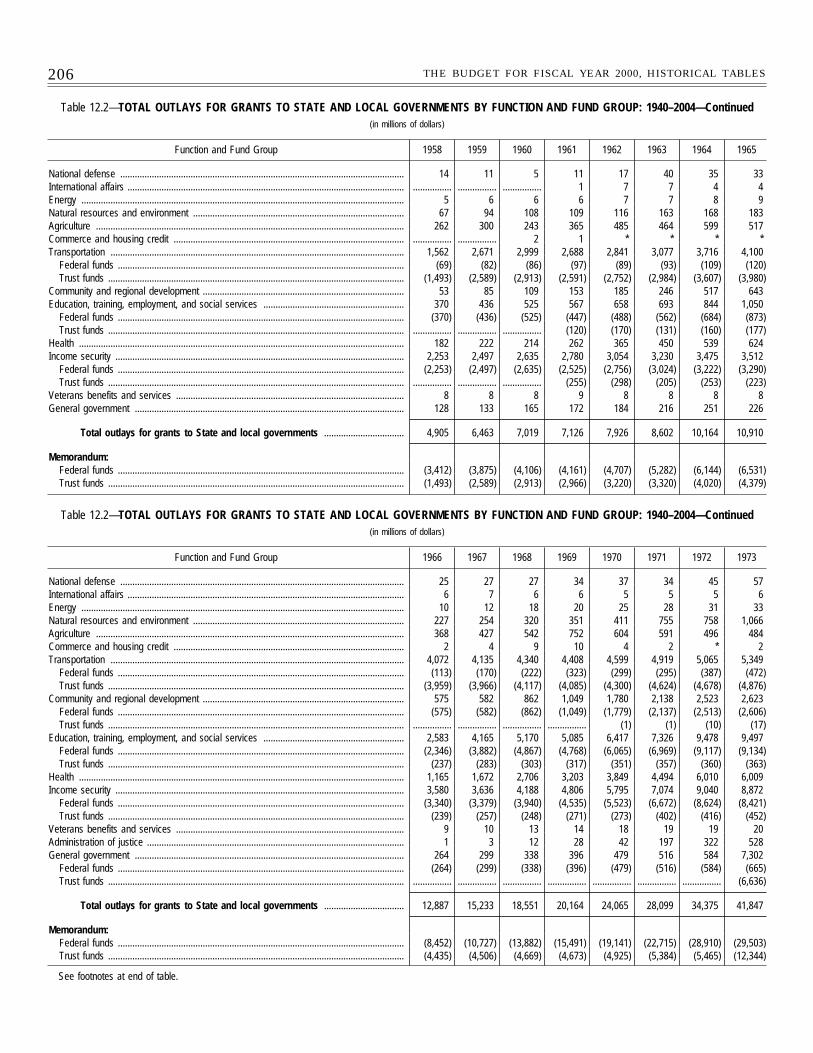
206 THE BUDGET FOR FISCAL YEAR 2000, HISTORICAL TABLES
Table 12.2—TOTAL OUTLAYS FOR GRANTS TO STATE AND LOCAL GOVERNMENTS BY FUNCTION AND FUND GROUP: 1940–2004—Continued(in millions of dollars)
Function and Fund Group 1958 1959 1960 1961 1962 1963 1964 1965
National defense ..................................................................................................................... 14 11 5 11 17 40 35 33International affairs .................................................................................................................. ................ ................ ................ 1 7 7 4 4Energy ..................................................................................................................................... 5 6 6 6 7 7 8 9Natural resources and environment ....................................................................................... 67 94 108 109 116 163 168 183Agriculture ............................................................................................................................... 262 300 243 365 485 464 599 517Commerce and housing credit ............................................................................................... ................ ................ 2 1 * * * *Transportation ......................................................................................................................... 1,562 2,671 2,999 2,688 2,841 3,077 3,716 4,100
Federal funds ...................................................................................................................... (69) (82) (86) (97) (89) (93) (109) (120)Trust funds .......................................................................................................................... (1,493) (2,589) (2,913) (2,591) (2,752) (2,984) (3,607) (3,980)
Community and regional development ................................................................................... 53 85 109 153 185 246 517 643Education, training, employment, and social services .......................................................... 370 436 525 567 658 693 844 1,050
Federal funds ...................................................................................................................... (370) (436) (525) (447) (488) (562) (684) (873)Trust funds .......................................................................................................................... ................ ................ ................ (120) (170) (131) (160) (177)
Health ...................................................................................................................................... 182 222 214 262 365 450 539 624Income security ....................................................................................................................... 2,253 2,497 2,635 2,780 3,054 3,230 3,475 3,512
Federal funds ...................................................................................................................... (2,253) (2,497) (2,635) (2,525) (2,756) (3,024) (3,222) (3,290)Trust funds .......................................................................................................................... ................ ................ ................ (255) (298) (205) (253) (223)
Veterans benefits and services .............................................................................................. 8 8 8 9 8 8 8 8General government ............................................................................................................... 128 133 165 172 184 216 251 226
Total outlays for grants to State and local governments ................................. 4,905 6,463 7,019 7,126 7,926 8,602 10,164 10,910
Memorandum:Federal funds ...................................................................................................................... (3,412) (3,875) (4,106) (4,161) (4,707) (5,282) (6,144) (6,531)Trust funds .......................................................................................................................... (1,493) (2,589) (2,913) (2,966) (3,220) (3,320) (4,020) (4,379)
Table 12.2—TOTAL OUTLAYS FOR GRANTS TO STATE AND LOCAL GOVERNMENTS BY FUNCTION AND FUND GROUP: 1940–2004—Continued(in millions of dollars)
Function and Fund Group 1966 1967 1968 1969 1970 1971 1972 1973
National defense ..................................................................................................................... 25 27 27 34 37 34 45 57International affairs .................................................................................................................. 6 7 6 6 5 5 5 6Energy ..................................................................................................................................... 10 12 18 20 25 28 31 33Natural resources and environment ....................................................................................... 227 254 320 351 411 755 758 1,066Agriculture ............................................................................................................................... 368 427 542 752 604 591 496 484Commerce and housing credit ............................................................................................... 2 4 9 10 4 2 * 2Transportation ......................................................................................................................... 4,072 4,135 4,340 4,408 4,599 4,919 5,065 5,349
Federal funds ...................................................................................................................... (113) (170) (222) (323) (299) (295) (387) (472)Trust funds .......................................................................................................................... (3,959) (3,966) (4,117) (4,085) (4,300) (4,624) (4,678) (4,876)
Community and regional development ................................................................................... 575 582 862 1,049 1,780 2,138 2,523 2,623Federal funds ...................................................................................................................... (575) (582) (862) (1,049) (1,779) (2,137) (2,513) (2,606)Trust funds .......................................................................................................................... ................ ................ ................ ................ (1) (1) (10) (17)
Education, training, employment, and social services .......................................................... 2,583 4,165 5,170 5,085 6,417 7,326 9,478 9,497Federal funds ...................................................................................................................... (2,346) (3,882) (4,867) (4,768) (6,065) (6,969) (9,117) (9,134)Trust funds .......................................................................................................................... (237) (283) (303) (317) (351) (357) (360) (363)
Health ...................................................................................................................................... 1,165 1,672 2,706 3,203 3,849 4,494 6,010 6,009Income security ....................................................................................................................... 3,580 3,636 4,188 4,806 5,795 7,074 9,040 8,872
Federal funds ...................................................................................................................... (3,340) (3,379) (3,940) (4,535) (5,523) (6,672) (8,624) (8,421)Trust funds .......................................................................................................................... (239) (257) (248) (271) (273) (402) (416) (452)
Veterans benefits and services .............................................................................................. 9 10 13 14 18 19 19 20Administration of justice .......................................................................................................... 1 3 12 28 42 197 322 528General government ............................................................................................................... 264 299 338 396 479 516 584 7,302
Federal funds ...................................................................................................................... (264) (299) (338) (396) (479) (516) (584) (665)Trust funds .......................................................................................................................... ................ ................ ................ ................ ................ ................ ................ (6,636)
Total outlays for grants to State and local governments ................................. 12,887 15,233 18,551 20,164 24,065 28,099 34,375 41,847
Memorandum:Federal funds ...................................................................................................................... (8,452) (10,727) (13,882) (15,491) (19,141) (22,715) (28,910) (29,503)Trust funds .......................................................................................................................... (4,435) (4,506) (4,669) (4,673) (4,925) (5,384) (5,465) (12,344)
See footnotes at end of table.
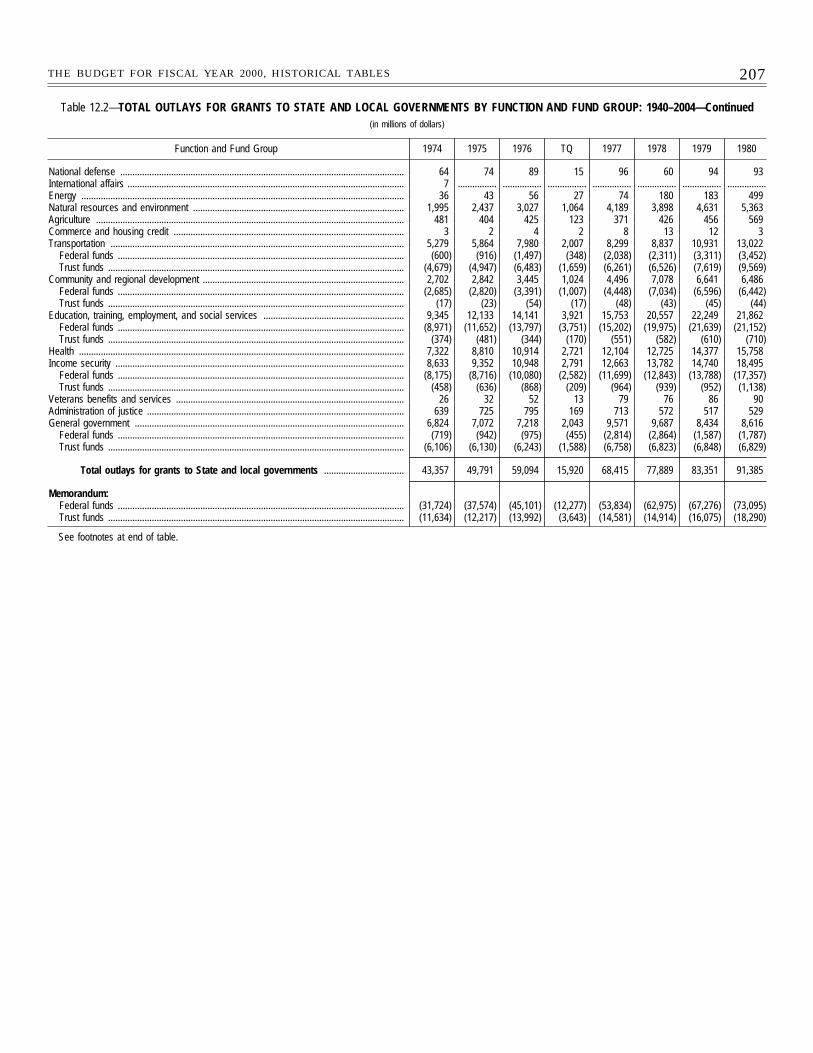
207THE BUDGET FOR FISCAL YEAR 2000, HISTORICAL TABLES
Table 12.2—TOTAL OUTLAYS FOR GRANTS TO STATE AND LOCAL GOVERNMENTS BY FUNCTION AND FUND GROUP: 1940–2004—Continued(in millions of dollars)
Function and Fund Group 1974 1975 1976 TQ 1977 1978 1979 1980
National defense ..................................................................................................................... 64 74 89 15 96 60 94 93International affairs .................................................................................................................. 7 ................ ................ ................ ................ ................ ................ ................Energy ..................................................................................................................................... 36 43 56 27 74 180 183 499Natural resources and environment ....................................................................................... 1,995 2,437 3,027 1,064 4,189 3,898 4,631 5,363Agriculture ............................................................................................................................... 481 404 425 123 371 426 456 569Commerce and housing credit ............................................................................................... 3 2 4 2 8 13 12 3Transportation ......................................................................................................................... 5,279 5,864 7,980 2,007 8,299 8,837 10,931 13,022
Federal funds ...................................................................................................................... (600) (916) (1,497) (348) (2,038) (2,311) (3,311) (3,452)Trust funds .......................................................................................................................... (4,679) (4,947) (6,483) (1,659) (6,261) (6,526) (7,619) (9,569)
Community and regional development ................................................................................... 2,702 2,842 3,445 1,024 4,496 7,078 6,641 6,486Federal funds ...................................................................................................................... (2,685) (2,820) (3,391) (1,007) (4,448) (7,034) (6,596) (6,442)Trust funds .......................................................................................................................... (17) (23) (54) (17) (48) (43) (45) (44)
Education, training, employment, and social services .......................................................... 9,345 12,133 14,141 3,921 15,753 20,557 22,249 21,862Federal funds ...................................................................................................................... (8,971) (11,652) (13,797) (3,751) (15,202) (19,975) (21,639) (21,152)Trust funds .......................................................................................................................... (374) (481) (344) (170) (551) (582) (610) (710)
Health ...................................................................................................................................... 7,322 8,810 10,914 2,721 12,104 12,725 14,377 15,758Income security ....................................................................................................................... 8,633 9,352 10,948 2,791 12,663 13,782 14,740 18,495
Federal funds ...................................................................................................................... (8,175) (8,716) (10,080) (2,582) (11,699) (12,843) (13,788) (17,357)Trust funds .......................................................................................................................... (458) (636) (868) (209) (964) (939) (952) (1,138)
Veterans benefits and services .............................................................................................. 26 32 52 13 79 76 86 90Administration of justice .......................................................................................................... 639 725 795 169 713 572 517 529General government ............................................................................................................... 6,824 7,072 7,218 2,043 9,571 9,687 8,434 8,616
Federal funds ...................................................................................................................... (719) (942) (975) (455) (2,814) (2,864) (1,587) (1,787)Trust funds .......................................................................................................................... (6,106) (6,130) (6,243) (1,588) (6,758) (6,823) (6,848) (6,829)
Total outlays for grants to State and local governments ................................. 43,357 49,791 59,094 15,920 68,415 77,889 83,351 91,385
Memorandum:Federal funds ...................................................................................................................... (31,724) (37,574) (45,101) (12,277) (53,834) (62,975) (67,276) (73,095)Trust funds .......................................................................................................................... (11,634) (12,217) (13,992) (3,643) (14,581) (14,914) (16,075) (18,290)
See footnotes at end of table.
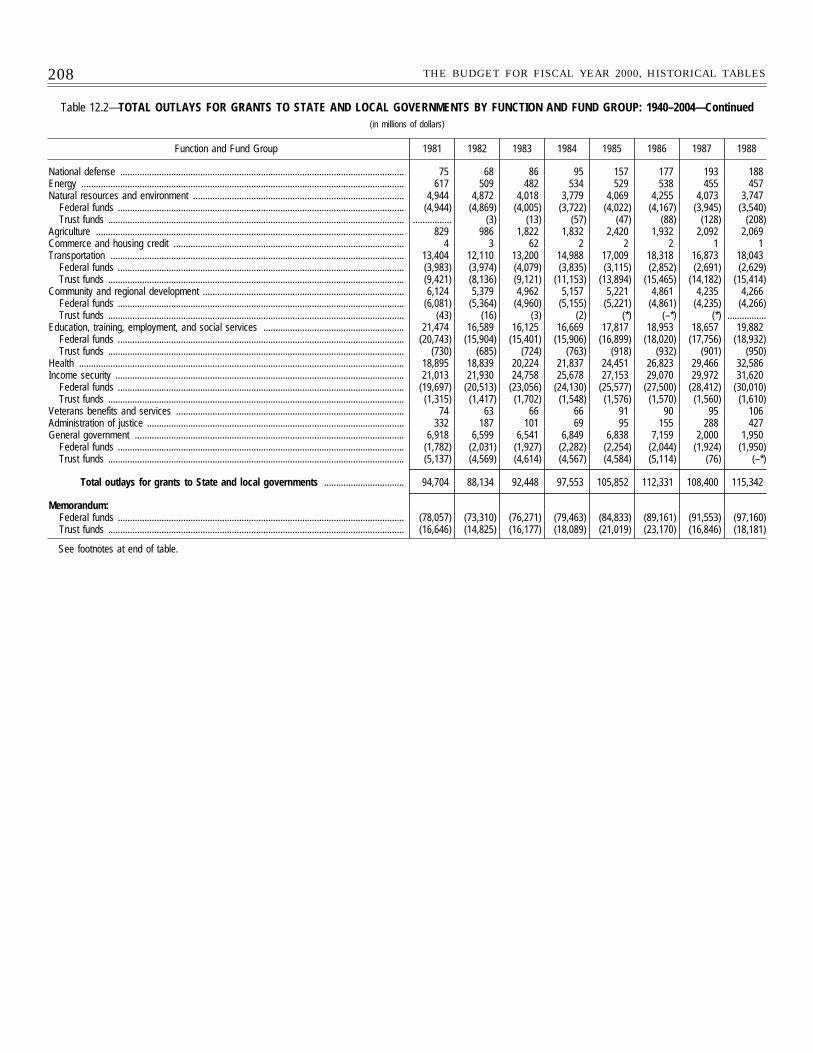
208 THE BUDGET FOR FISCAL YEAR 2000, HISTORICAL TABLES
Table 12.2—TOTAL OUTLAYS FOR GRANTS TO STATE AND LOCAL GOVERNMENTS BY FUNCTION AND FUND GROUP: 1940–2004—Continued(in millions of dollars)
Function and Fund Group 1981 1982 1983 1984 1985 1986 1987 1988
National defense ..................................................................................................................... 75 68 86 95 157 177 193 188Energy ..................................................................................................................................... 617 509 482 534 529 538 455 457Natural resources and environment ....................................................................................... 4,944 4,872 4,018 3,779 4,069 4,255 4,073 3,747
Federal funds ...................................................................................................................... (4,944) (4,869) (4,005) (3,722) (4,022) (4,167) (3,945) (3,540)Trust funds .......................................................................................................................... ................ (3) (13) (57) (47) (88) (128) (208)
Agriculture ............................................................................................................................... 829 986 1,822 1,832 2,420 1,932 2,092 2,069Commerce and housing credit ............................................................................................... 4 3 62 2 2 2 1 1Transportation ......................................................................................................................... 13,404 12,110 13,200 14,988 17,009 18,318 16,873 18,043
Federal funds ...................................................................................................................... (3,983) (3,974) (4,079) (3,835) (3,115) (2,852) (2,691) (2,629)Trust funds .......................................................................................................................... (9,421) (8,136) (9,121) (11,153) (13,894) (15,465) (14,182) (15,414)
Community and regional development ................................................................................... 6,124 5,379 4,962 5,157 5,221 4,861 4,235 4,266Federal funds ...................................................................................................................... (6,081) (5,364) (4,960) (5,155) (5,221) (4,861) (4,235) (4,266)Trust funds .......................................................................................................................... (43) (16) (3) (2) (*) (–*) (*) ................
Education, training, employment, and social services .......................................................... 21,474 16,589 16,125 16,669 17,817 18,953 18,657 19,882Federal funds ...................................................................................................................... (20,743) (15,904) (15,401) (15,906) (16,899) (18,020) (17,756) (18,932)Trust funds .......................................................................................................................... (730) (685) (724) (763) (918) (932) (901) (950)
Health ...................................................................................................................................... 18,895 18,839 20,224 21,837 24,451 26,823 29,466 32,586Income security ....................................................................................................................... 21,013 21,930 24,758 25,678 27,153 29,070 29,972 31,620
Federal funds ...................................................................................................................... (19,697) (20,513) (23,056) (24,130) (25,577) (27,500) (28,412) (30,010)Trust funds .......................................................................................................................... (1,315) (1,417) (1,702) (1,548) (1,576) (1,570) (1,560) (1,610)
Veterans benefits and services .............................................................................................. 74 63 66 66 91 90 95 106Administration of justice .......................................................................................................... 332 187 101 69 95 155 288 427General government ............................................................................................................... 6,918 6,599 6,541 6,849 6,838 7,159 2,000 1,950
Federal funds ...................................................................................................................... (1,782) (2,031) (1,927) (2,282) (2,254) (2,044) (1,924) (1,950)Trust funds .......................................................................................................................... (5,137) (4,569) (4,614) (4,567) (4,584) (5,114) (76) (–*)
Total outlays for grants to State and local governments ................................. 94,704 88,134 92,448 97,553 105,852 112,331 108,400 115,342
Memorandum:Federal funds ...................................................................................................................... (78,057) (73,310) (76,271) (79,463) (84,833) (89,161) (91,553) (97,160)Trust funds .......................................................................................................................... (16,646) (14,825) (16,177) (18,089) (21,019) (23,170) (16,846) (18,181)
See footnotes at end of table.
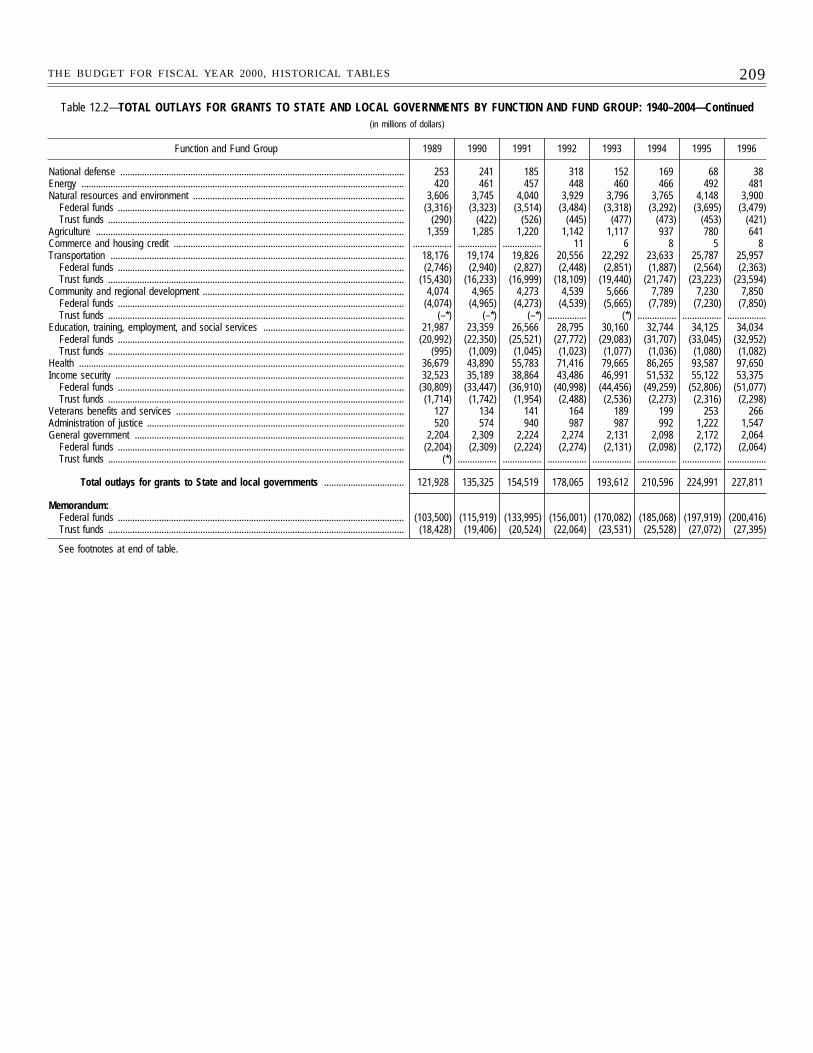
209THE BUDGET FOR FISCAL YEAR 2000, HISTORICAL TABLES
Table 12.2—TOTAL OUTLAYS FOR GRANTS TO STATE AND LOCAL GOVERNMENTS BY FUNCTION AND FUND GROUP: 1940–2004—Continued(in millions of dollars)
Function and Fund Group 1989 1990 1991 1992 1993 1994 1995 1996
National defense ..................................................................................................................... 253 241 185 318 152 169 68 38Energy ..................................................................................................................................... 420 461 457 448 460 466 492 481Natural resources and environment ....................................................................................... 3,606 3,745 4,040 3,929 3,796 3,765 4,148 3,900
Federal funds ...................................................................................................................... (3,316) (3,323) (3,514) (3,484) (3,318) (3,292) (3,695) (3,479)Trust funds .......................................................................................................................... (290) (422) (526) (445) (477) (473) (453) (421)
Agriculture ............................................................................................................................... 1,359 1,285 1,220 1,142 1,117 937 780 641Commerce and housing credit ............................................................................................... ................ ................ ................ 11 6 8 5 8Transportation ......................................................................................................................... 18,176 19,174 19,826 20,556 22,292 23,633 25,787 25,957
Federal funds ...................................................................................................................... (2,746) (2,940) (2,827) (2,448) (2,851) (1,887) (2,564) (2,363)Trust funds .......................................................................................................................... (15,430) (16,233) (16,999) (18,109) (19,440) (21,747) (23,223) (23,594)
Community and regional development ................................................................................... 4,074 4,965 4,273 4,539 5,666 7,789 7,230 7,850Federal funds ...................................................................................................................... (4,074) (4,965) (4,273) (4,539) (5,665) (7,789) (7,230) (7,850)Trust funds .......................................................................................................................... (–*) (–*) (–*) ................ (*) ................ ................ ................
Education, training, employment, and social services .......................................................... 21,987 23,359 26,566 28,795 30,160 32,744 34,125 34,034Federal funds ...................................................................................................................... (20,992) (22,350) (25,521) (27,772) (29,083) (31,707) (33,045) (32,952)Trust funds .......................................................................................................................... (995) (1,009) (1,045) (1,023) (1,077) (1,036) (1,080) (1,082)
Health ...................................................................................................................................... 36,679 43,890 55,783 71,416 79,665 86,265 93,587 97,650Income security ....................................................................................................................... 32,523 35,189 38,864 43,486 46,991 51,532 55,122 53,375
Federal funds ...................................................................................................................... (30,809) (33,447) (36,910) (40,998) (44,456) (49,259) (52,806) (51,077)Trust funds .......................................................................................................................... (1,714) (1,742) (1,954) (2,488) (2,536) (2,273) (2,316) (2,298)
Veterans benefits and services .............................................................................................. 127 134 141 164 189 199 253 266Administration of justice .......................................................................................................... 520 574 940 987 987 992 1,222 1,547General government ............................................................................................................... 2,204 2,309 2,224 2,274 2,131 2,098 2,172 2,064
Federal funds ...................................................................................................................... (2,204) (2,309) (2,224) (2,274) (2,131) (2,098) (2,172) (2,064)Trust funds .......................................................................................................................... (*) ................ ................ ................ ................ ................ ................ ................
Total outlays for grants to State and local governments ................................. 121,928 135,325 154,519 178,065 193,612 210,596 224,991 227,811
Memorandum:Federal funds ...................................................................................................................... (103,500) (115,919) (133,995) (156,001) (170,082) (185,068) (197,919) (200,416)Trust funds .......................................................................................................................... (18,428) (19,406) (20,524) (22,064) (23,531) (25,528) (27,072) (27,395)
See footnotes at end of table.

210 THE BUDGET FOR FISCAL YEAR 2000, HISTORICAL TABLES
Table 12.2—TOTAL OUTLAYS FOR GRANTS TO STATE AND LOCAL GOVERNMENTS BY FUNCTION AND FUND GROUP: 1940–2004—Continued(in millions of dollars)
Function and Fund Group 1997 1998 1999estimate
2000estimate
2001estimate
2002estimate
2003estimate
2004estimate
National defense ..................................................................................................................... ................ 12 3 ................ ................ ................ ................ ................Energy ..................................................................................................................................... 440 424 456 485 513 525 532 541Natural resources and environment ....................................................................................... 4,121 3,829 4,276 4,798 5,165 4,909 4,882 4,863
Federal funds ...................................................................................................................... (3,703) (3,429) (3,819) (4,208) (4,561) (4,309) (4,257) (4,199)Trust funds .......................................................................................................................... (418) (400) (457) (590) (604) (600) (625) (664)
Agriculture ............................................................................................................................... 634 668 746 686 678 691 681 678Commerce and housing credit ............................................................................................... 9 9 8 4 2 2 2 2Transportation ......................................................................................................................... 26,846 26,144 29,137 31,632 33,852 34,336 35,245 36,208
Federal funds ...................................................................................................................... (2,740) (2,667) (2,901) (3,245) (4,461) (5,029) (5,942) (6,528)Trust funds .......................................................................................................................... (24,106) (23,477) (26,236) (28,387) (29,391) (29,307) (29,303) (29,680)
Community and regional development ................................................................................... 8,161 7,653 8,697 8,784 8,519 8,009 7,759 7,627Education, training, employment, and social services .......................................................... 34,735 36,467 38,911 43,837 45,864 46,000 46,321 46,999
Federal funds ...................................................................................................................... (33,703) (35,509) (37,955) (42,925) (44,913) (45,052) (45,374) (46,052)Trust funds .......................................................................................................................... (1,032) (958) (956) (912) (951) (948) (947) (947)
Health ...................................................................................................................................... 98,974 105,833 114,834 121,800 131,006 140,741 151,601 163,133Income security ....................................................................................................................... 54,965 58,870 58,991 63,309 66,755 68,502 70,095 72,180
Federal funds ...................................................................................................................... (52,672) (56,543) (56,522) (60,739) (63,882) (65,442) (67,181) (69,154)Trust funds .......................................................................................................................... (2,293) (2,327) (2,469) (2,570) (2,873) (3,060) (2,914) (3,026)
Veterans benefits and services .............................................................................................. 277 288 330 393 404 408 384 385Administration of justice .......................................................................................................... 2,845 3,658 3,816 5,809 6,000 4,268 4,186 4,180General government ............................................................................................................... 2,153 2,238 1,959 1,937 1,941 1,918 1,937 1,960
Total outlays for grants to State and local governments ................................. 234,160 246,093 262,164 283,474 300,699 310,309 323,625 338,756
Memorandum:Federal funds ...................................................................................................................... (206,311) (218,931) (232,046) (251,015) (266,880) (276,394) (289,836) (304,439)Trust funds .......................................................................................................................... (27,849) (27,162) (30,118) (32,459) (33,819) (33,915) (33,789) (34,317)
* $500 thousand or less.Note: Federal funds unless otherwise stated
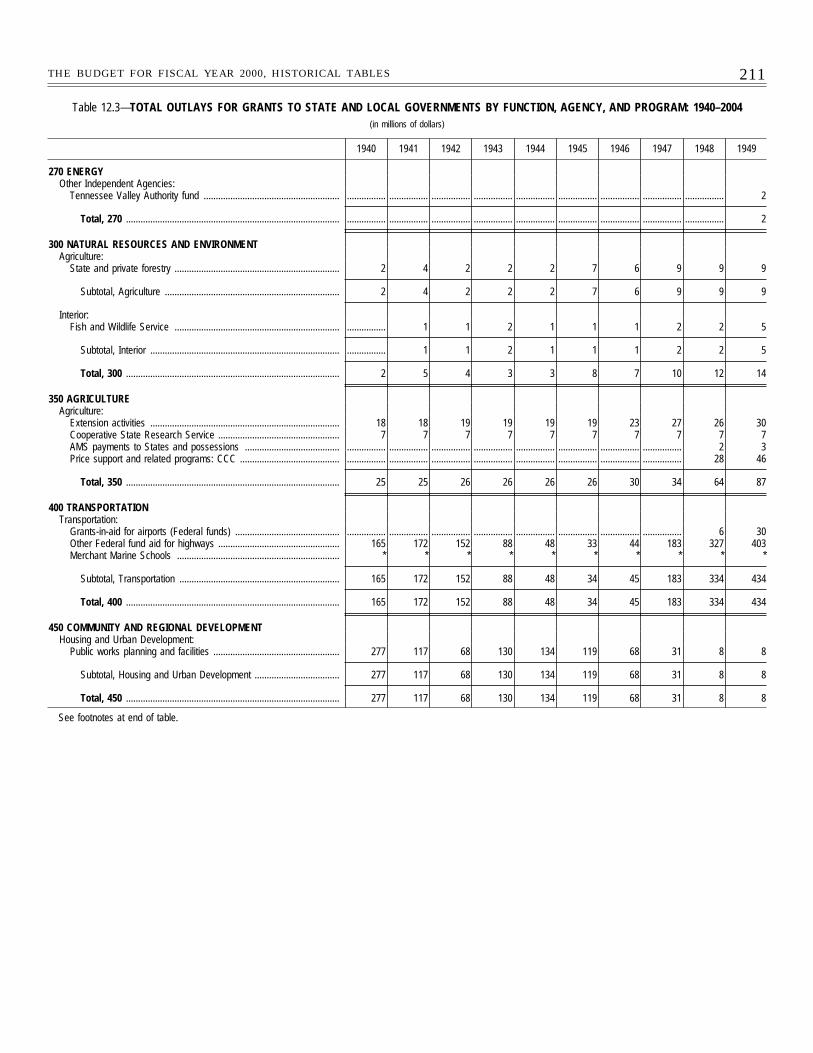
211THE BUDGET FOR FISCAL YEAR 2000, HISTORICAL TABLES
Table 12.3—TOTAL OUTLAYS FOR GRANTS TO STATE AND LOCAL GOVERNMENTS BY FUNCTION, AGENCY, AND PROGRAM: 1940–2004(in millions of dollars)
1940 1941 1942 1943 1944 1945 1946 1947 1948 1949
270 ENERGYOther Independent Agencies:
Tennessee Valley Authority fund ........................................................ ................ ................ ................ ................ ................ ................ ................ ................ ................ 2
Total, 270 ........................................................................................ ................ ................ ................ ................ ................ ................ ................ ................ ................ 2
300 NATURAL RESOURCES AND ENVIRONMENTAgriculture:
State and private forestry .................................................................... 2 4 2 2 2 7 6 9 9 9
Subtotal, Agriculture ........................................................................ 2 4 2 2 2 7 6 9 9 9
Interior:Fish and Wildlife Service .................................................................... ................ 1 1 2 1 1 1 2 2 5
Subtotal, Interior .............................................................................. ................ 1 1 2 1 1 1 2 2 5
Total, 300 ........................................................................................ 2 5 4 3 3 8 7 10 12 14
350 AGRICULTUREAgriculture:
Extension activities .............................................................................. 18 18 19 19 19 19 23 27 26 30Cooperative State Research Service .................................................. 7 7 7 7 7 7 7 7 7 7AMS payments to States and possessions ....................................... ................ ................ ................ ................ ................ ................ ................ ................ 2 3Price support and related programs: CCC ......................................... ................ ................ ................ ................ ................ ................ ................ ................ 28 46
Total, 350 ........................................................................................ 25 25 26 26 26 26 30 34 64 87
400 TRANSPORTATIONTransportation:
Grants-in-aid for airports (Federal funds) ........................................... ................ ................ ................ ................ ................ ................ ................ ................ 6 30Other Federal fund aid for highways .................................................. 165 172 152 88 48 33 44 183 327 403Merchant Marine Schools ................................................................... * * * * * * * * * *
Subtotal, Transportation .................................................................. 165 172 152 88 48 34 45 183 334 434
Total, 400 ........................................................................................ 165 172 152 88 48 34 45 183 334 434
450 COMMUNITY AND REGIONAL DEVELOPMENTHousing and Urban Development:
Public works planning and facilities .................................................... 277 117 68 130 134 119 68 31 8 8
Subtotal, Housing and Urban Development ................................... 277 117 68 130 134 119 68 31 8 8
Total, 450 ........................................................................................ 277 117 68 130 134 119 68 31 8 8
See footnotes at end of table.
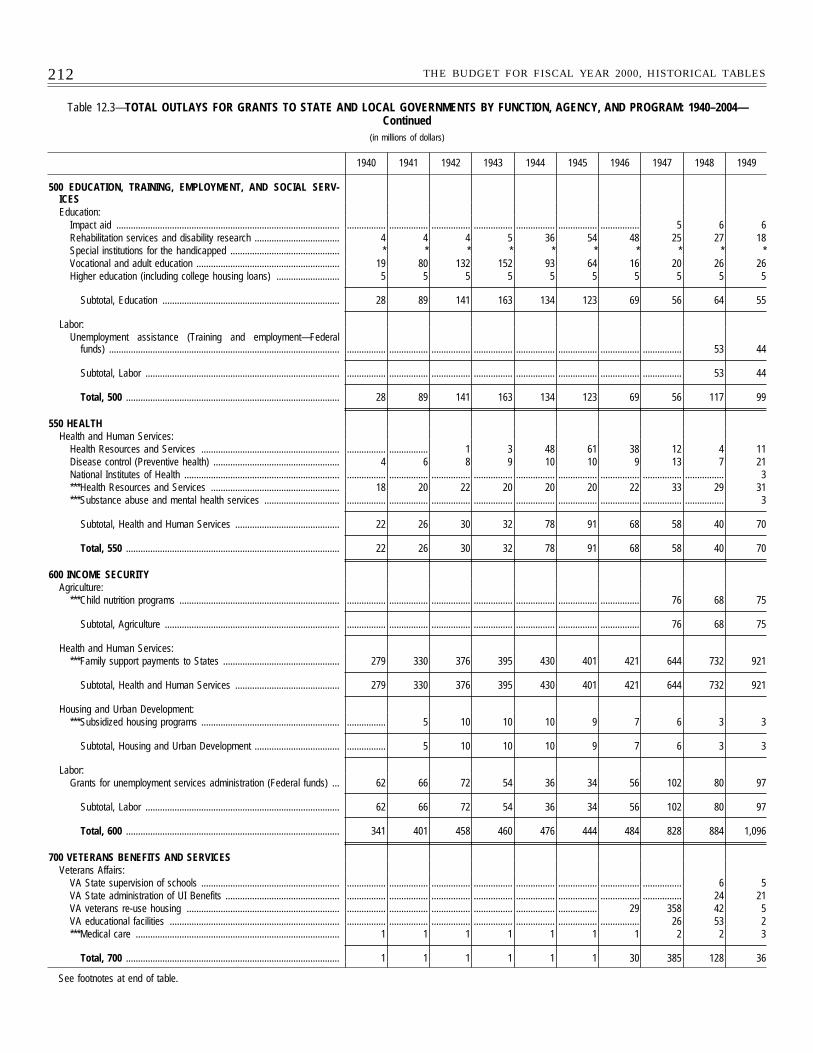
212 THE BUDGET FOR FISCAL YEAR 2000, HISTORICAL TABLES
Table 12.3—TOTAL OUTLAYS FOR GRANTS TO STATE AND LOCAL GOVERNMENTS BY FUNCTION, AGENCY, AND PROGRAM: 1940–2004—Continued
(in millions of dollars)
1940 1941 1942 1943 1944 1945 1946 1947 1948 1949
500 EDUCATION, TRAINING, EMPLOYMENT, AND SOCIAL SERV-ICESEducation:
Impact aid ............................................................................................ ................ ................ ................ ................ ................ ................ ................ 5 6 6Rehabilitation services and disability research ................................... 4 4 4 5 36 54 48 25 27 18Special institutions for the handicapped ............................................. * * * * * * * * * *Vocational and adult education ........................................................... 19 80 132 152 93 64 16 20 26 26Higher education (including college housing loans) .......................... 5 5 5 5 5 5 5 5 5 5
Subtotal, Education ......................................................................... 28 89 141 163 134 123 69 56 64 55
Labor:Unemployment assistance (Training and employment—Federal
funds) ............................................................................................... ................ ................ ................ ................ ................ ................ ................ ................ 53 44
Subtotal, Labor ................................................................................ ................ ................ ................ ................ ................ ................ ................ ................ 53 44
Total, 500 ........................................................................................ 28 89 141 163 134 123 69 56 117 99
550 HEALTHHealth and Human Services:
Health Resources and Services ......................................................... ................ ................ 1 3 48 61 38 12 4 11Disease control (Preventive health) .................................................... 4 6 8 9 10 10 9 13 7 21National Institutes of Health ................................................................ ................ ................ ................ ................ ................ ................ ................ ................ ................ 3***Health Resources and Services ..................................................... 18 20 22 20 20 20 22 33 29 31***Substance abuse and mental health services ............................... ................ ................ ................ ................ ................ ................ ................ ................ ................ 3
Subtotal, Health and Human Services ........................................... 22 26 30 32 78 91 68 58 40 70
Total, 550 ........................................................................................ 22 26 30 32 78 91 68 58 40 70
600 INCOME SECURITYAgriculture:
***Child nutrition programs .................................................................. ................ ................ ................ ................ ................ ................ ................ 76 68 75
Subtotal, Agriculture ........................................................................ ................ ................ ................ ................ ................ ................ ................ 76 68 75
Health and Human Services:***Family support payments to States ................................................ 279 330 376 395 430 401 421 644 732 921
Subtotal, Health and Human Services ........................................... 279 330 376 395 430 401 421 644 732 921
Housing and Urban Development:***Subsidized housing programs ......................................................... ................ 5 10 10 10 9 7 6 3 3
Subtotal, Housing and Urban Development ................................... ................ 5 10 10 10 9 7 6 3 3
Labor:Grants for unemployment services administration (Federal funds) ... 62 66 72 54 36 34 56 102 80 97
Subtotal, Labor ................................................................................ 62 66 72 54 36 34 56 102 80 97
Total, 600 ........................................................................................ 341 401 458 460 476 444 484 828 884 1,096
700 VETERANS BENEFITS AND SERVICESVeterans Affairs:
VA State supervision of schools ......................................................... ................ ................ ................ ................ ................ ................ ................ ................ 6 5VA State administration of UI Benefits ............................................... ................ ................ ................ ................ ................ ................ ................ ................ 24 21VA veterans re-use housing ............................................................... ................ ................ ................ ................ ................ ................ 29 358 42 5VA educational facilities ...................................................................... ................ ................ ................ ................ ................ ................ ................ 26 53 2***Medical care .................................................................................... 1 1 1 1 1 1 1 2 2 3
Total, 700 ........................................................................................ 1 1 1 1 1 1 30 385 128 36
See footnotes at end of table.
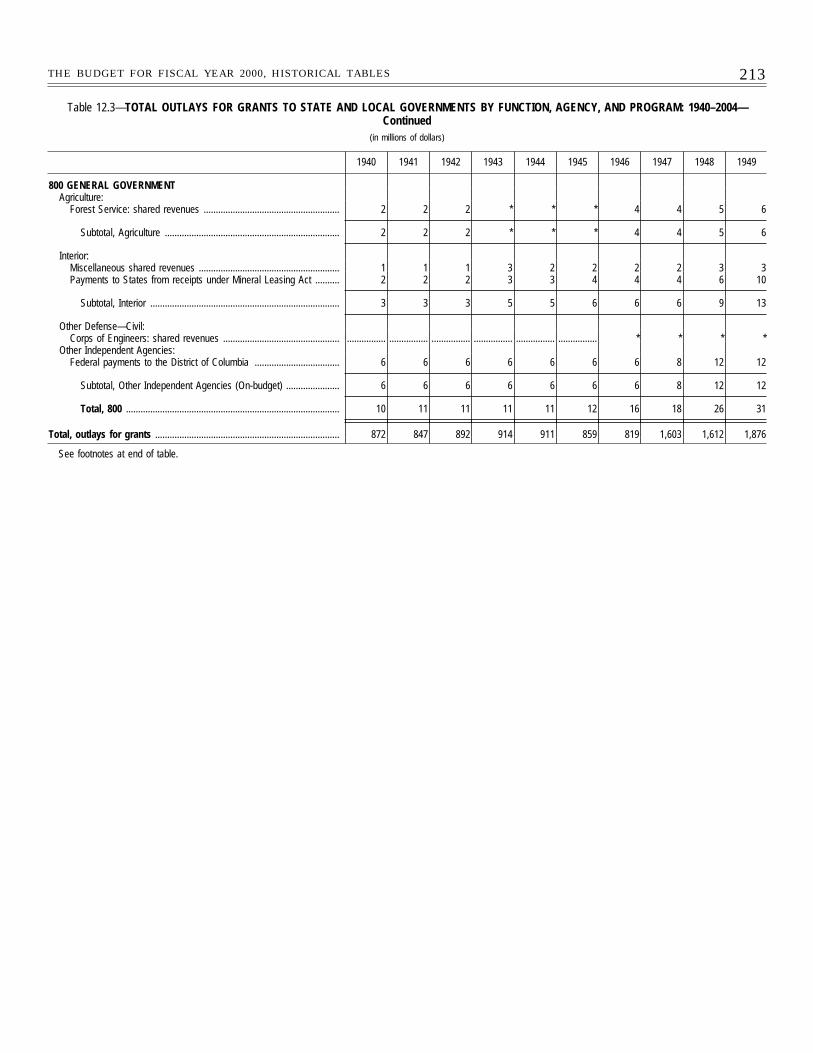
213THE BUDGET FOR FISCAL YEAR 2000, HISTORICAL TABLES
Table 12.3—TOTAL OUTLAYS FOR GRANTS TO STATE AND LOCAL GOVERNMENTS BY FUNCTION, AGENCY, AND PROGRAM: 1940–2004—Continued
(in millions of dollars)
1940 1941 1942 1943 1944 1945 1946 1947 1948 1949
800 GENERAL GOVERNMENTAgriculture:
Forest Service: shared revenues ........................................................ 2 2 2 * * * 4 4 5 6
Subtotal, Agriculture ........................................................................ 2 2 2 * * * 4 4 5 6
Interior:Miscellaneous shared revenues .......................................................... 1 1 1 3 2 2 2 2 3 3Payments to States from receipts under Mineral Leasing Act .......... 2 2 2 3 3 4 4 4 6 10
Subtotal, Interior .............................................................................. 3 3 3 5 5 6 6 6 9 13
Other Defense—Civil:Corps of Engineers: shared revenues ................................................ ................ ................ ................ ................ ................ ................ * * * *
Other Independent Agencies:Federal payments to the District of Columbia ................................... 6 6 6 6 6 6 6 8 12 12
Subtotal, Other Independent Agencies (On-budget) ...................... 6 6 6 6 6 6 6 8 12 12
Total, 800 ........................................................................................ 10 11 11 11 11 12 16 18 26 31
Total, outlays for grants ............................................................................ 872 847 892 914 911 859 819 1,603 1,612 1,876
See footnotes at end of table.
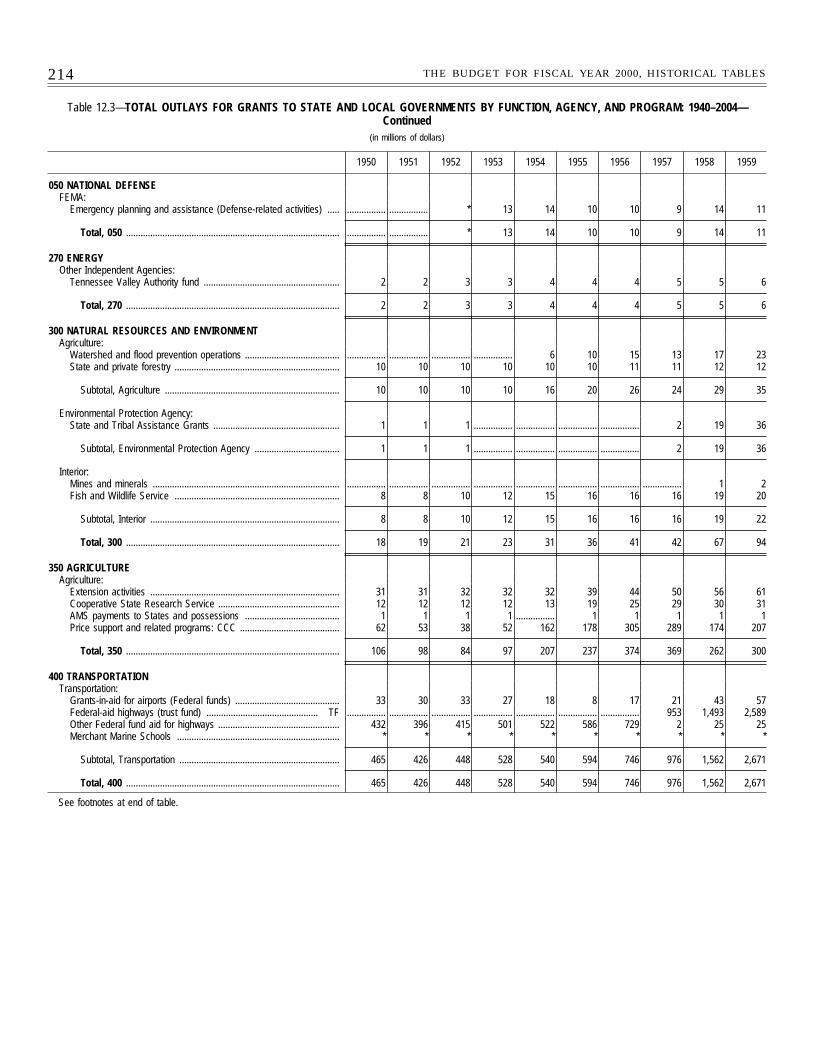
214 THE BUDGET FOR FISCAL YEAR 2000, HISTORICAL TABLES
Table 12.3—TOTAL OUTLAYS FOR GRANTS TO STATE AND LOCAL GOVERNMENTS BY FUNCTION, AGENCY, AND PROGRAM: 1940–2004—Continued
(in millions of dollars)
1950 1951 1952 1953 1954 1955 1956 1957 1958 1959
050 NATIONAL DEFENSEFEMA:
Emergency planning and assistance (Defense-related activities) ..... ................ ................ * 13 14 10 10 9 14 11
Total, 050 ........................................................................................ ................ ................ * 13 14 10 10 9 14 11
270 ENERGYOther Independent Agencies:
Tennessee Valley Authority fund ........................................................ 2 2 3 3 4 4 4 5 5 6
Total, 270 ........................................................................................ 2 2 3 3 4 4 4 5 5 6
300 NATURAL RESOURCES AND ENVIRONMENTAgriculture:
Watershed and flood prevention operations ....................................... ................ ................ ................ ................ 6 10 15 13 17 23State and private forestry .................................................................... 10 10 10 10 10 10 11 11 12 12
Subtotal, Agriculture ........................................................................ 10 10 10 10 16 20 26 24 29 35
Environmental Protection Agency:State and Tribal Assistance Grants .................................................... 1 1 1 ................ ................ ................ ................ 2 19 36
Subtotal, Environmental Protection Agency ................................... 1 1 1 ................ ................ ................ ................ 2 19 36
Interior:Mines and minerals ............................................................................. ................ ................ ................ ................ ................ ................ ................ ................ 1 2Fish and Wildlife Service .................................................................... 8 8 10 12 15 16 16 16 19 20
Subtotal, Interior .............................................................................. 8 8 10 12 15 16 16 16 19 22
Total, 300 ........................................................................................ 18 19 21 23 31 36 41 42 67 94
350 AGRICULTUREAgriculture:
Extension activities .............................................................................. 31 31 32 32 32 39 44 50 56 61Cooperative State Research Service .................................................. 12 12 12 12 13 19 25 29 30 31AMS payments to States and possessions ....................................... 1 1 1 1 ................ 1 1 1 1 1Price support and related programs: CCC ......................................... 62 53 38 52 162 178 305 289 174 207
Total, 350 ........................................................................................ 106 98 84 97 207 237 374 369 262 300
400 TRANSPORTATIONTransportation:
Grants-in-aid for airports (Federal funds) ........................................... 33 30 33 27 18 8 17 21 43 57Federal-aid highways (trust fund) .............................................. TF ................ ................ ................ ................ ................ ................ ................ 953 1,493 2,589Other Federal fund aid for highways .................................................. 432 396 415 501 522 586 729 2 25 25Merchant Marine Schools ................................................................... * * * * * * * * * *
Subtotal, Transportation .................................................................. 465 426 448 528 540 594 746 976 1,562 2,671
Total, 400 ........................................................................................ 465 426 448 528 540 594 746 976 1,562 2,671
See footnotes at end of table.
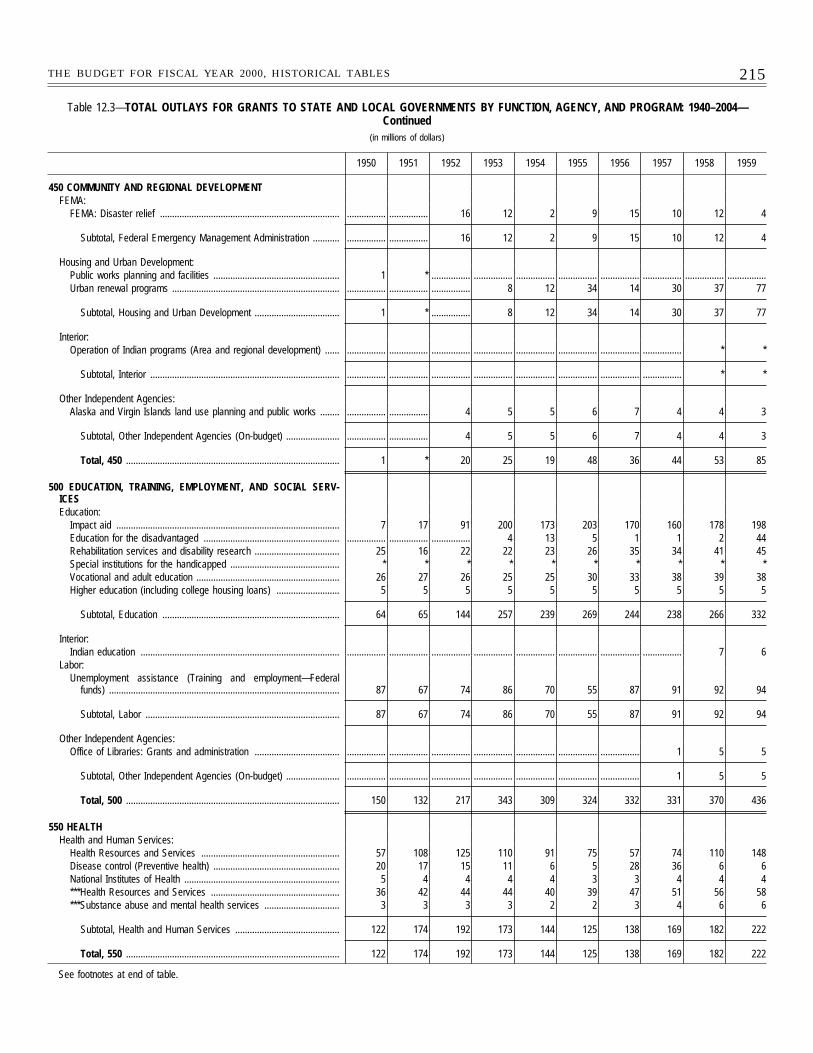
215THE BUDGET FOR FISCAL YEAR 2000, HISTORICAL TABLES
Table 12.3—TOTAL OUTLAYS FOR GRANTS TO STATE AND LOCAL GOVERNMENTS BY FUNCTION, AGENCY, AND PROGRAM: 1940–2004—Continued
(in millions of dollars)
1950 1951 1952 1953 1954 1955 1956 1957 1958 1959
450 COMMUNITY AND REGIONAL DEVELOPMENTFEMA:
FEMA: Disaster relief .......................................................................... ................ ................ 16 12 2 9 15 10 12 4
Subtotal, Federal Emergency Management Administration ........... ................ ................ 16 12 2 9 15 10 12 4
Housing and Urban Development:Public works planning and facilities .................................................... 1 * ................ ................ ................ ................ ................ ................ ................ ................Urban renewal programs ..................................................................... ................ ................ ................ 8 12 34 14 30 37 77
Subtotal, Housing and Urban Development ................................... 1 * ................ 8 12 34 14 30 37 77
Interior:Operation of Indian programs (Area and regional development) ...... ................ ................ ................ ................ ................ ................ ................ ................ * *
Subtotal, Interior .............................................................................. ................ ................ ................ ................ ................ ................ ................ ................ * *
Other Independent Agencies:Alaska and Virgin Islands land use planning and public works ........ ................ ................ 4 5 5 6 7 4 4 3
Subtotal, Other Independent Agencies (On-budget) ...................... ................ ................ 4 5 5 6 7 4 4 3
Total, 450 ........................................................................................ 1 * 20 25 19 48 36 44 53 85
500 EDUCATION, TRAINING, EMPLOYMENT, AND SOCIAL SERV-ICESEducation:
Impact aid ............................................................................................ 7 17 91 200 173 203 170 160 178 198Education for the disadvantaged ........................................................ ................ ................ ................ 4 13 5 1 1 2 44Rehabilitation services and disability research ................................... 25 16 22 22 23 26 35 34 41 45Special institutions for the handicapped ............................................. * * * * * * * * * *Vocational and adult education ........................................................... 26 27 26 25 25 30 33 38 39 38Higher education (including college housing loans) .......................... 5 5 5 5 5 5 5 5 5 5
Subtotal, Education ......................................................................... 64 65 144 257 239 269 244 238 266 332
Interior:Indian education .................................................................................. ................ ................ ................ ................ ................ ................ ................ ................ 7 6
Labor:Unemployment assistance (Training and employment—Federal
funds) ............................................................................................... 87 67 74 86 70 55 87 91 92 94
Subtotal, Labor ................................................................................ 87 67 74 86 70 55 87 91 92 94
Other Independent Agencies:Office of Libraries: Grants and administration ................................... ................ ................ ................ ................ ................ ................ ................ 1 5 5
Subtotal, Other Independent Agencies (On-budget) ...................... ................ ................ ................ ................ ................ ................ ................ 1 5 5
Total, 500 ........................................................................................ 150 132 217 343 309 324 332 331 370 436
550 HEALTHHealth and Human Services:
Health Resources and Services ......................................................... 57 108 125 110 91 75 57 74 110 148Disease control (Preventive health) .................................................... 20 17 15 11 6 5 28 36 6 6National Institutes of Health ................................................................ 5 4 4 4 4 3 3 4 4 4***Health Resources and Services ..................................................... 36 42 44 44 40 39 47 51 56 58***Substance abuse and mental health services ............................... 3 3 3 3 2 2 3 4 6 6
Subtotal, Health and Human Services ........................................... 122 174 192 173 144 125 138 169 182 222
Total, 550 ........................................................................................ 122 174 192 173 144 125 138 169 182 222
See footnotes at end of table.
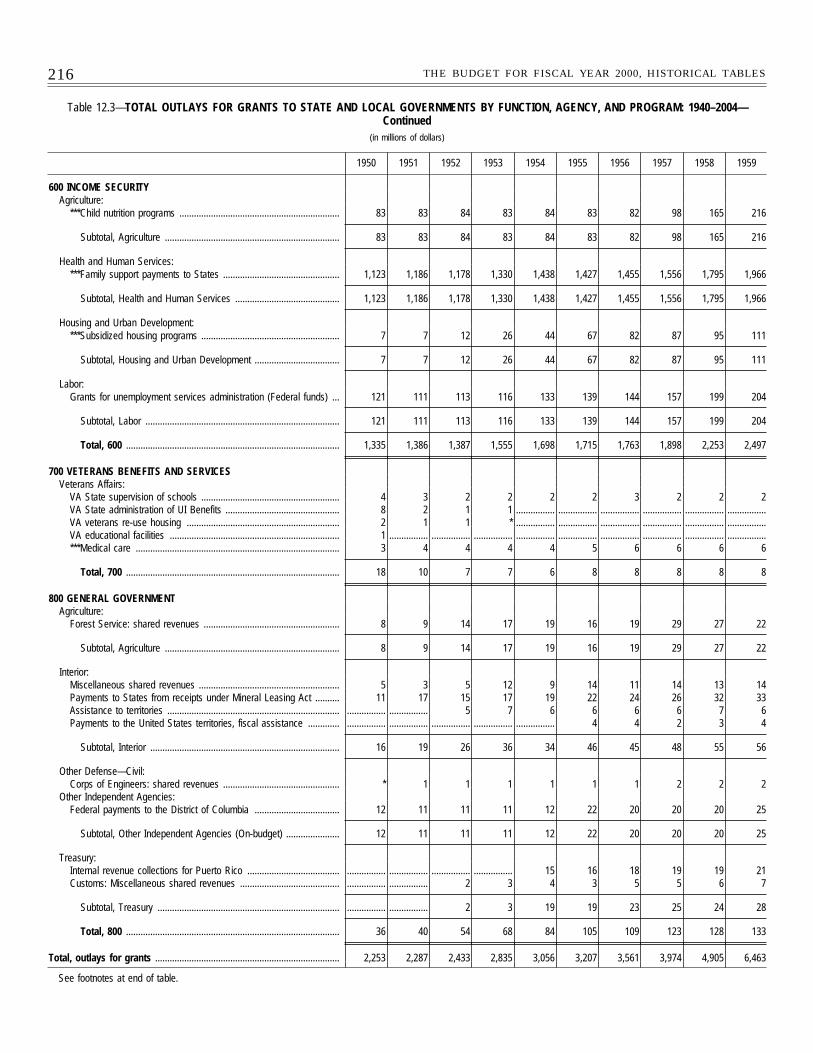
216 THE BUDGET FOR FISCAL YEAR 2000, HISTORICAL TABLES
Table 12.3—TOTAL OUTLAYS FOR GRANTS TO STATE AND LOCAL GOVERNMENTS BY FUNCTION, AGENCY, AND PROGRAM: 1940–2004—Continued
(in millions of dollars)
1950 1951 1952 1953 1954 1955 1956 1957 1958 1959
600 INCOME SECURITYAgriculture:
***Child nutrition programs .................................................................. 83 83 84 83 84 83 82 98 165 216
Subtotal, Agriculture ........................................................................ 83 83 84 83 84 83 82 98 165 216
Health and Human Services:***Family support payments to States ................................................ 1,123 1,186 1,178 1,330 1,438 1,427 1,455 1,556 1,795 1,966
Subtotal, Health and Human Services ........................................... 1,123 1,186 1,178 1,330 1,438 1,427 1,455 1,556 1,795 1,966
Housing and Urban Development:***Subsidized housing programs ......................................................... 7 7 12 26 44 67 82 87 95 111
Subtotal, Housing and Urban Development ................................... 7 7 12 26 44 67 82 87 95 111
Labor:Grants for unemployment services administration (Federal funds) ... 121 111 113 116 133 139 144 157 199 204
Subtotal, Labor ................................................................................ 121 111 113 116 133 139 144 157 199 204
Total, 600 ........................................................................................ 1,335 1,386 1,387 1,555 1,698 1,715 1,763 1,898 2,253 2,497
700 VETERANS BENEFITS AND SERVICESVeterans Affairs:
VA State supervision of schools ......................................................... 4 3 2 2 2 2 3 2 2 2VA State administration of UI Benefits ............................................... 8 2 1 1 ................ ................ ................ ................ ................ ................VA veterans re-use housing ............................................................... 2 1 1 * ................ ................ ................ ................ ................ ................VA educational facilities ...................................................................... 1 ................ ................ ................ ................ ................ ................ ................ ................ ................***Medical care .................................................................................... 3 4 4 4 4 5 6 6 6 6
Total, 700 ........................................................................................ 18 10 7 7 6 8 8 8 8 8
800 GENERAL GOVERNMENTAgriculture:
Forest Service: shared revenues ........................................................ 8 9 14 17 19 16 19 29 27 22
Subtotal, Agriculture ........................................................................ 8 9 14 17 19 16 19 29 27 22
Interior:Miscellaneous shared revenues .......................................................... 5 3 5 12 9 14 11 14 13 14Payments to States from receipts under Mineral Leasing Act .......... 11 17 15 17 19 22 24 26 32 33Assistance to territories ....................................................................... ................ ................ 5 7 6 6 6 6 7 6Payments to the United States territories, fiscal assistance ............. ................ ................ ................ ................ ................ 4 4 2 3 4
Subtotal, Interior .............................................................................. 16 19 26 36 34 46 45 48 55 56
Other Defense—Civil:Corps of Engineers: shared revenues ................................................ * 1 1 1 1 1 1 2 2 2
Other Independent Agencies:Federal payments to the District of Columbia ................................... 12 11 11 11 12 22 20 20 20 25
Subtotal, Other Independent Agencies (On-budget) ...................... 12 11 11 11 12 22 20 20 20 25
Treasury:Internal revenue collections for Puerto Rico ...................................... ................ ................ ................ ................ 15 16 18 19 19 21Customs: Miscellaneous shared revenues ......................................... ................ ................ 2 3 4 3 5 5 6 7
Subtotal, Treasury ........................................................................... ................ ................ 2 3 19 19 23 25 24 28
Total, 800 ........................................................................................ 36 40 54 68 84 105 109 123 128 133
Total, outlays for grants ............................................................................ 2,253 2,287 2,433 2,835 3,056 3,207 3,561 3,974 4,905 6,463
See footnotes at end of table.
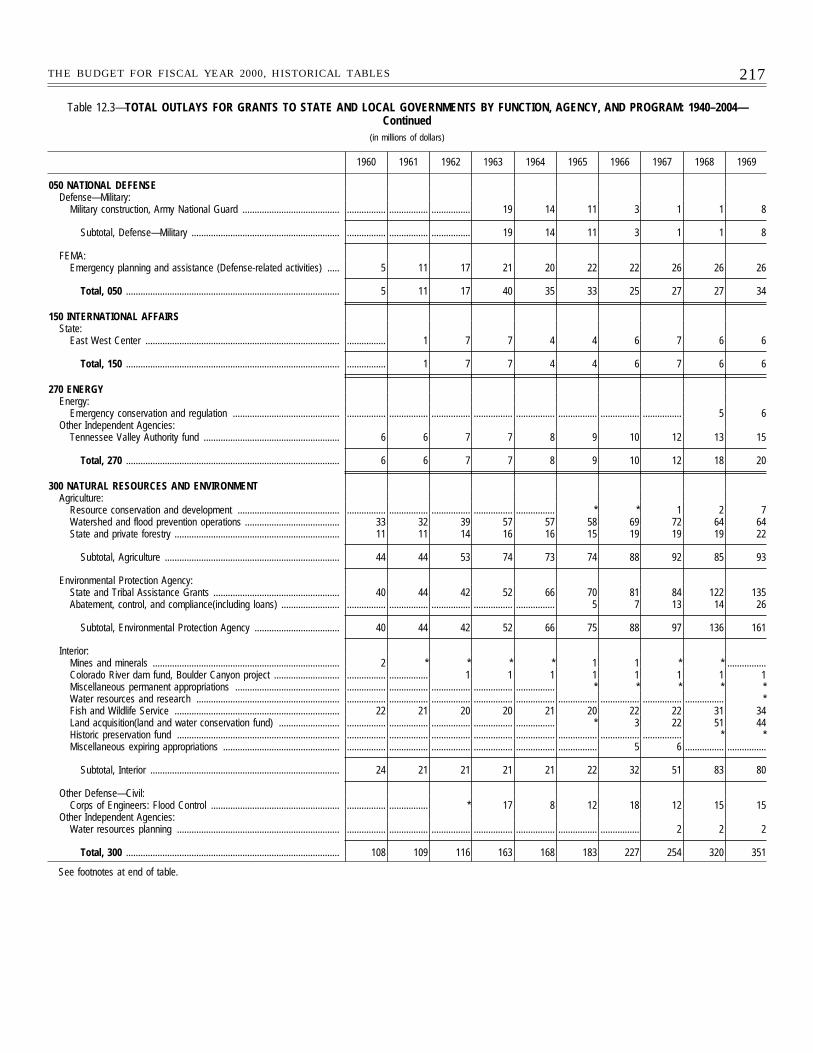
217THE BUDGET FOR FISCAL YEAR 2000, HISTORICAL TABLES
Table 12.3—TOTAL OUTLAYS FOR GRANTS TO STATE AND LOCAL GOVERNMENTS BY FUNCTION, AGENCY, AND PROGRAM: 1940–2004—Continued
(in millions of dollars)
1960 1961 1962 1963 1964 1965 1966 1967 1968 1969
050 NATIONAL DEFENSEDefense—Military:
Military construction, Army National Guard ........................................ ................ ................ ................ 19 14 11 3 1 1 8
Subtotal, Defense—Military ............................................................. ................ ................ ................ 19 14 11 3 1 1 8
FEMA:Emergency planning and assistance (Defense-related activities) ..... 5 11 17 21 20 22 22 26 26 26
Total, 050 ........................................................................................ 5 11 17 40 35 33 25 27 27 34
150 INTERNATIONAL AFFAIRSState:
East West Center ................................................................................ ................ 1 7 7 4 4 6 7 6 6
Total, 150 ........................................................................................ ................ 1 7 7 4 4 6 7 6 6
270 ENERGYEnergy:
Emergency conservation and regulation ............................................ ................ ................ ................ ................ ................ ................ ................ ................ 5 6Other Independent Agencies:
Tennessee Valley Authority fund ........................................................ 6 6 7 7 8 9 10 12 13 15
Total, 270 ........................................................................................ 6 6 7 7 8 9 10 12 18 20
300 NATURAL RESOURCES AND ENVIRONMENTAgriculture:
Resource conservation and development .......................................... ................ ................ ................ ................ ................ * * 1 2 7Watershed and flood prevention operations ....................................... 33 32 39 57 57 58 69 72 64 64State and private forestry .................................................................... 11 11 14 16 16 15 19 19 19 22
Subtotal, Agriculture ........................................................................ 44 44 53 74 73 74 88 92 85 93
Environmental Protection Agency:State and Tribal Assistance Grants .................................................... 40 44 42 52 66 70 81 84 122 135Abatement, control, and compliance(including loans) ........................ ................ ................ ................ ................ ................ 5 7 13 14 26
Subtotal, Environmental Protection Agency ................................... 40 44 42 52 66 75 88 97 136 161
Interior:Mines and minerals ............................................................................. 2 * * * * 1 1 * * ................Colorado River dam fund, Boulder Canyon project ........................... ................ ................ 1 1 1 1 1 1 1 1Miscellaneous permanent appropriations ........................................... ................ ................ ................ ................ ................ * * * * *Water resources and research ........................................................... ................ ................ ................ ................ ................ ................ ................ ................ ................ *Fish and Wildlife Service .................................................................... 22 21 20 20 21 20 22 22 31 34Land acquisition(land and water conservation fund) ......................... ................ ................ ................ ................ ................ * 3 22 51 44Historic preservation fund ................................................................... ................ ................ ................ ................ ................ ................ ................ ................ * *Miscellaneous expiring appropriations ................................................ ................ ................ ................ ................ ................ ................ 5 6 ................ ................
Subtotal, Interior .............................................................................. 24 21 21 21 21 22 32 51 83 80
Other Defense—Civil:Corps of Engineers: Flood Control ..................................................... ................ ................ * 17 8 12 18 12 15 15
Other Independent Agencies:Water resources planning ................................................................... ................ ................ ................ ................ ................ ................ ................ 2 2 2
Total, 300 ........................................................................................ 108 109 116 163 168 183 227 254 320 351
See footnotes at end of table.
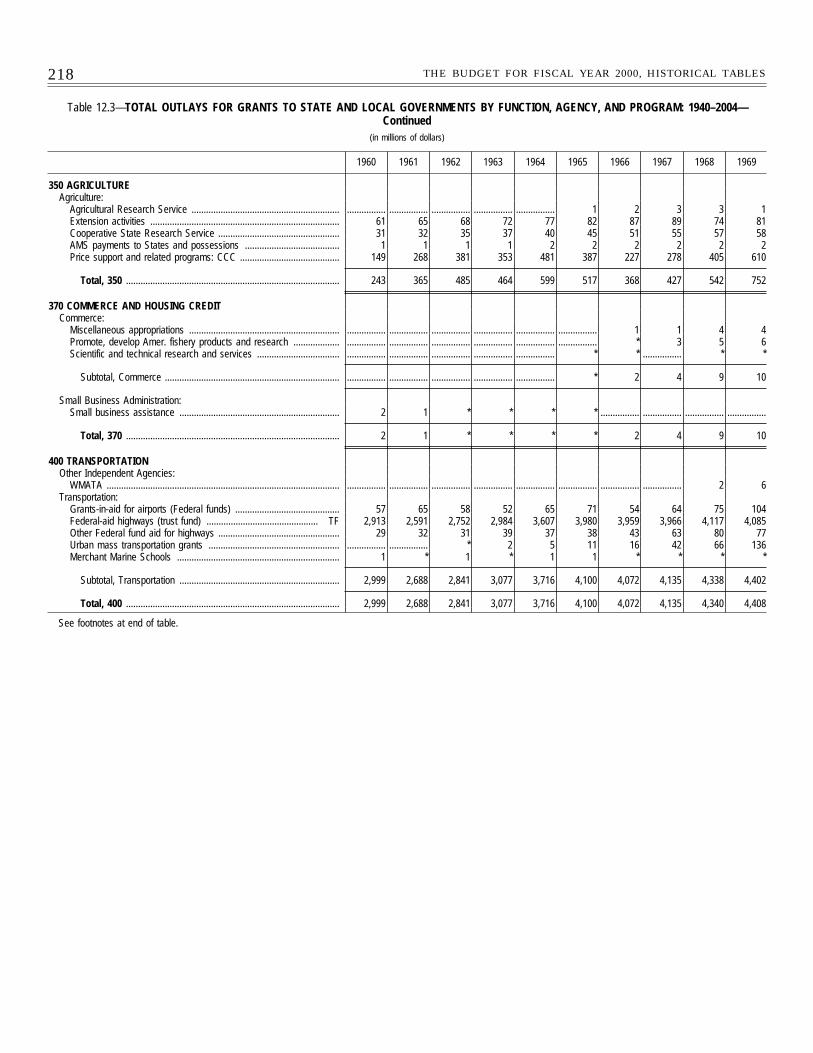
218 THE BUDGET FOR FISCAL YEAR 2000, HISTORICAL TABLES
Table 12.3—TOTAL OUTLAYS FOR GRANTS TO STATE AND LOCAL GOVERNMENTS BY FUNCTION, AGENCY, AND PROGRAM: 1940–2004—Continued
(in millions of dollars)
1960 1961 1962 1963 1964 1965 1966 1967 1968 1969
350 AGRICULTUREAgriculture:
Agricultural Research Service ............................................................. ................ ................ ................ ................ ................ 1 2 3 3 1Extension activities .............................................................................. 61 65 68 72 77 82 87 89 74 81Cooperative State Research Service .................................................. 31 32 35 37 40 45 51 55 57 58AMS payments to States and possessions ....................................... 1 1 1 1 2 2 2 2 2 2Price support and related programs: CCC ......................................... 149 268 381 353 481 387 227 278 405 610
Total, 350 ........................................................................................ 243 365 485 464 599 517 368 427 542 752
370 COMMERCE AND HOUSING CREDITCommerce:
Miscellaneous appropriations .............................................................. ................ ................ ................ ................ ................ ................ 1 1 4 4Promote, develop Amer. fishery products and research ................... ................ ................ ................ ................ ................ ................ * 3 5 6Scientific and technical research and services .................................. ................ ................ ................ ................ ................ * * ................ * *
Subtotal, Commerce ........................................................................ ................ ................ ................ ................ ................ * 2 4 9 10
Small Business Administration:Small business assistance .................................................................. 2 1 * * * * ................ ................ ................ ................
Total, 370 ........................................................................................ 2 1 * * * * 2 4 9 10
400 TRANSPORTATIONOther Independent Agencies:
WMATA ................................................................................................ ................ ................ ................ ................ ................ ................ ................ ................ 2 6Transportation:
Grants-in-aid for airports (Federal funds) ........................................... 57 65 58 52 65 71 54 64 75 104Federal-aid highways (trust fund) .............................................. TF 2,913 2,591 2,752 2,984 3,607 3,980 3,959 3,966 4,117 4,085Other Federal fund aid for highways .................................................. 29 32 31 39 37 38 43 63 80 77Urban mass transportation grants ...................................................... ................ ................ * 2 5 11 16 42 66 136Merchant Marine Schools ................................................................... 1 * 1 * 1 1 * * * *
Subtotal, Transportation .................................................................. 2,999 2,688 2,841 3,077 3,716 4,100 4,072 4,135 4,338 4,402
Total, 400 ........................................................................................ 2,999 2,688 2,841 3,077 3,716 4,100 4,072 4,135 4,340 4,408
See footnotes at end of table.
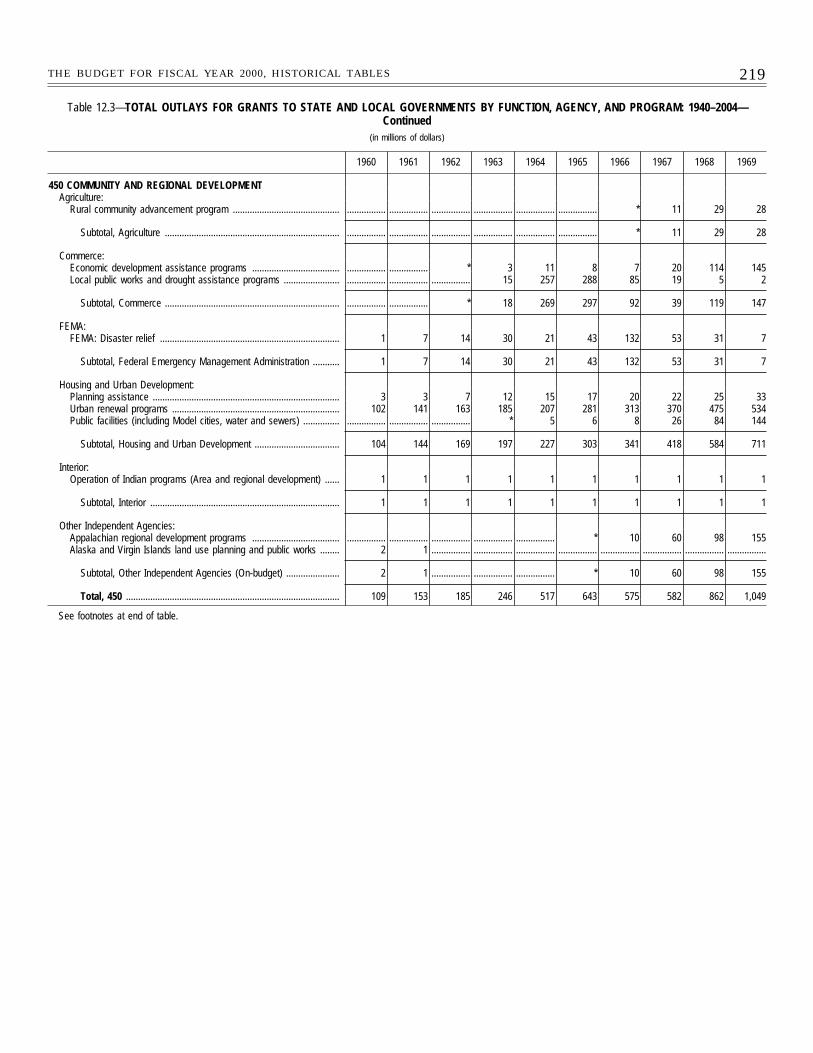
219THE BUDGET FOR FISCAL YEAR 2000, HISTORICAL TABLES
Table 12.3—TOTAL OUTLAYS FOR GRANTS TO STATE AND LOCAL GOVERNMENTS BY FUNCTION, AGENCY, AND PROGRAM: 1940–2004—Continued
(in millions of dollars)
1960 1961 1962 1963 1964 1965 1966 1967 1968 1969
450 COMMUNITY AND REGIONAL DEVELOPMENTAgriculture:
Rural community advancement program ............................................ ................ ................ ................ ................ ................ ................ * 11 29 28
Subtotal, Agriculture ........................................................................ ................ ................ ................ ................ ................ ................ * 11 29 28
Commerce:Economic development assistance programs .................................... ................ ................ * 3 11 8 7 20 114 145Local public works and drought assistance programs ....................... ................ ................ ................ 15 257 288 85 19 5 2
Subtotal, Commerce ........................................................................ ................ ................ * 18 269 297 92 39 119 147
FEMA:FEMA: Disaster relief .......................................................................... 1 7 14 30 21 43 132 53 31 7
Subtotal, Federal Emergency Management Administration ........... 1 7 14 30 21 43 132 53 31 7
Housing and Urban Development:Planning assistance ............................................................................. 3 3 7 12 15 17 20 22 25 33Urban renewal programs ..................................................................... 102 141 163 185 207 281 313 370 475 534Public facilities (including Model cities, water and sewers) ............... ................ ................ ................ * 5 6 8 26 84 144
Subtotal, Housing and Urban Development ................................... 104 144 169 197 227 303 341 418 584 711
Interior:Operation of Indian programs (Area and regional development) ...... 1 1 1 1 1 1 1 1 1 1
Subtotal, Interior .............................................................................. 1 1 1 1 1 1 1 1 1 1
Other Independent Agencies:Appalachian regional development programs .................................... ................ ................ ................ ................ ................ * 10 60 98 155Alaska and Virgin Islands land use planning and public works ........ 2 1 ................ ................ ................ ................ ................ ................ ................ ................
Subtotal, Other Independent Agencies (On-budget) ...................... 2 1 ................ ................ ................ * 10 60 98 155
Total, 450 ........................................................................................ 109 153 185 246 517 643 575 582 862 1,049
See footnotes at end of table.
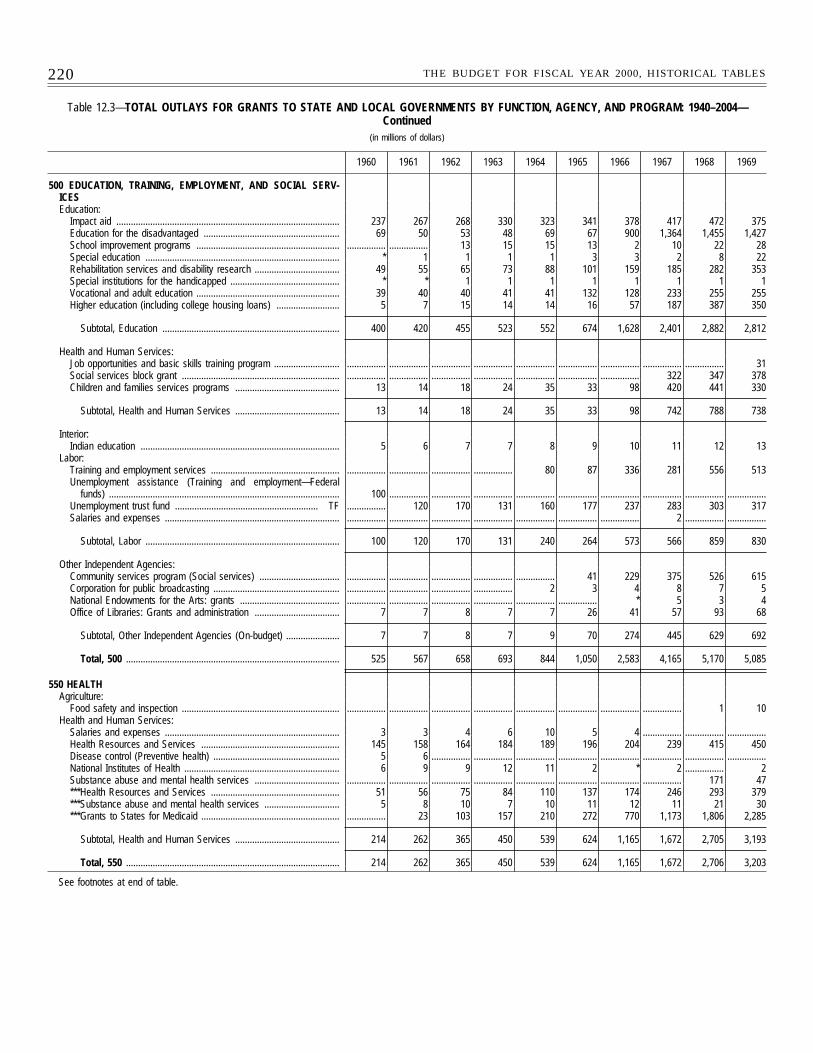
220 THE BUDGET FOR FISCAL YEAR 2000, HISTORICAL TABLES
Table 12.3—TOTAL OUTLAYS FOR GRANTS TO STATE AND LOCAL GOVERNMENTS BY FUNCTION, AGENCY, AND PROGRAM: 1940–2004—Continued
(in millions of dollars)
1960 1961 1962 1963 1964 1965 1966 1967 1968 1969
500 EDUCATION, TRAINING, EMPLOYMENT, AND SOCIAL SERV-ICESEducation:
Impact aid ............................................................................................ 237 267 268 330 323 341 378 417 472 375Education for the disadvantaged ........................................................ 69 50 53 48 69 67 900 1,364 1,455 1,427School improvement programs ........................................................... ................ ................ 13 15 15 13 2 10 22 28Special education ................................................................................ * 1 1 1 1 3 3 2 8 22Rehabilitation services and disability research ................................... 49 55 65 73 88 101 159 185 282 353Special institutions for the handicapped ............................................. * * 1 1 1 1 1 1 1 1Vocational and adult education ........................................................... 39 40 40 41 41 132 128 233 255 255Higher education (including college housing loans) .......................... 5 7 15 14 14 16 57 187 387 350
Subtotal, Education ......................................................................... 400 420 455 523 552 674 1,628 2,401 2,882 2,812
Health and Human Services:Job opportunities and basic skills training program ........................... ................ ................ ................ ................ ................ ................ ................ ................ ................ 31Social services block grant ................................................................. ................ ................ ................ ................ ................ ................ ................ 322 347 378Children and families services programs ........................................... 13 14 18 24 35 33 98 420 441 330
Subtotal, Health and Human Services ........................................... 13 14 18 24 35 33 98 742 788 738
Interior:Indian education .................................................................................. 5 6 7 7 8 9 10 11 12 13
Labor:Training and employment services ..................................................... ................ ................ ................ ................ 80 87 336 281 556 513Unemployment assistance (Training and employment—Federal
funds) ............................................................................................... 100 ................ ................ ................ ................ ................ ................ ................ ................ ................Unemployment trust fund ........................................................... TF ................ 120 170 131 160 177 237 283 303 317Salaries and expenses ........................................................................ ................ ................ ................ ................ ................ ................ ................ 2 ................ ................
Subtotal, Labor ................................................................................ 100 120 170 131 240 264 573 566 859 830
Other Independent Agencies:Community services program (Social services) ................................. ................ ................ ................ ................ ................ 41 229 375 526 615Corporation for public broadcasting .................................................... ................ ................ ................ ................ 2 3 4 8 7 5National Endowments for the Arts: grants ......................................... ................ ................ ................ ................ ................ ................ * 5 3 4Office of Libraries: Grants and administration ................................... 7 7 8 7 7 26 41 57 93 68
Subtotal, Other Independent Agencies (On-budget) ...................... 7 7 8 7 9 70 274 445 629 692
Total, 500 ........................................................................................ 525 567 658 693 844 1,050 2,583 4,165 5,170 5,085
550 HEALTHAgriculture:
Food safety and inspection ................................................................. ................ ................ ................ ................ ................ ................ ................ ................ 1 10Health and Human Services:
Salaries and expenses ........................................................................ 3 3 4 6 10 5 4 ................ ................ ................Health Resources and Services ......................................................... 145 158 164 184 189 196 204 239 415 450Disease control (Preventive health) .................................................... 5 6 ................ ................ ................ ................ ................ ................ ................ ................National Institutes of Health ................................................................ 6 9 9 12 11 2 * 2 ................ 2Substance abuse and mental health services ................................... ................ ................ ................ ................ ................ ................ ................ ................ 171 47***Health Resources and Services ..................................................... 51 56 75 84 110 137 174 246 293 379***Substance abuse and mental health services ............................... 5 8 10 7 10 11 12 11 21 30***Grants to States for Medicaid ......................................................... ................ 23 103 157 210 272 770 1,173 1,806 2,285
Subtotal, Health and Human Services ........................................... 214 262 365 450 539 624 1,165 1,672 2,705 3,193
Total, 550 ........................................................................................ 214 262 365 450 539 624 1,165 1,672 2,706 3,203
See footnotes at end of table.
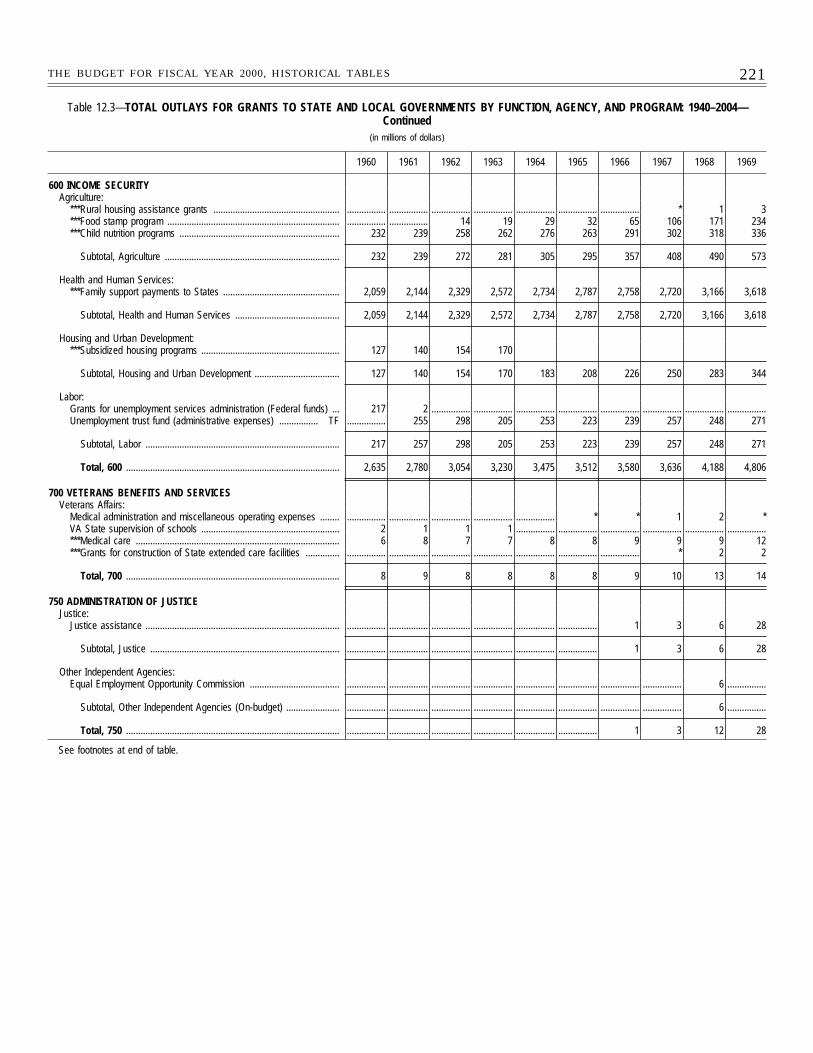
221THE BUDGET FOR FISCAL YEAR 2000, HISTORICAL TABLES
Table 12.3—TOTAL OUTLAYS FOR GRANTS TO STATE AND LOCAL GOVERNMENTS BY FUNCTION, AGENCY, AND PROGRAM: 1940–2004—Continued
(in millions of dollars)
1960 1961 1962 1963 1964 1965 1966 1967 1968 1969
600 INCOME SECURITYAgriculture:
***Rural housing assistance grants .................................................... ................ ................ ................ ................ ................ ................ ................ * 1 3***Food stamp program ....................................................................... ................ ................ 14 19 29 32 65 106 171 234***Child nutrition programs .................................................................. 232 239 258 262 276 263 291 302 318 336
Subtotal, Agriculture ........................................................................ 232 239 272 281 305 295 357 408 490 573
Health and Human Services:***Family support payments to States ................................................ 2,059 2,144 2,329 2,572 2,734 2,787 2,758 2,720 3,166 3,618
Subtotal, Health and Human Services ........................................... 2,059 2,144 2,329 2,572 2,734 2,787 2,758 2,720 3,166 3,618
Housing and Urban Development:***Subsidized housing programs ......................................................... 127 140 154 170
Subtotal, Housing and Urban Development ................................... 127 140 154 170 183 208 226 250 283 344
Labor:Grants for unemployment services administration (Federal funds) ... 217 2 ................ ................ ................ ................ ................ ................ ................ ................Unemployment trust fund (administrative expenses) ................ TF ................ 255 298 205 253 223 239 257 248 271
Subtotal, Labor ................................................................................ 217 257 298 205 253 223 239 257 248 271
Total, 600 ........................................................................................ 2,635 2,780 3,054 3,230 3,475 3,512 3,580 3,636 4,188 4,806
700 VETERANS BENEFITS AND SERVICESVeterans Affairs:
Medical administration and miscellaneous operating expenses ........ ................ ................ ................ ................ ................ * * 1 2 *VA State supervision of schools ......................................................... 2 1 1 1 ................ ................ ................ ................ ................ ................***Medical care .................................................................................... 6 8 7 7 8 8 9 9 9 12***Grants for construction of State extended care facilities .............. ................ ................ ................ ................ ................ ................ ................ * 2 2
Total, 700 ........................................................................................ 8 9 8 8 8 8 9 10 13 14
750 ADMINISTRATION OF JUSTICEJustice:
Justice assistance ................................................................................ ................ ................ ................ ................ ................ ................ 1 3 6 28
Subtotal, Justice .............................................................................. ................ ................ ................ ................ ................ ................ 1 3 6 28
Other Independent Agencies:Equal Employment Opportunity Commission ..................................... ................ ................ ................ ................ ................ ................ ................ ................ 6 ................
Subtotal, Other Independent Agencies (On-budget) ...................... ................ ................ ................ ................ ................ ................ ................ ................ 6 ................
Total, 750 ........................................................................................ ................ ................ ................ ................ ................ ................ 1 3 12 28
See footnotes at end of table.
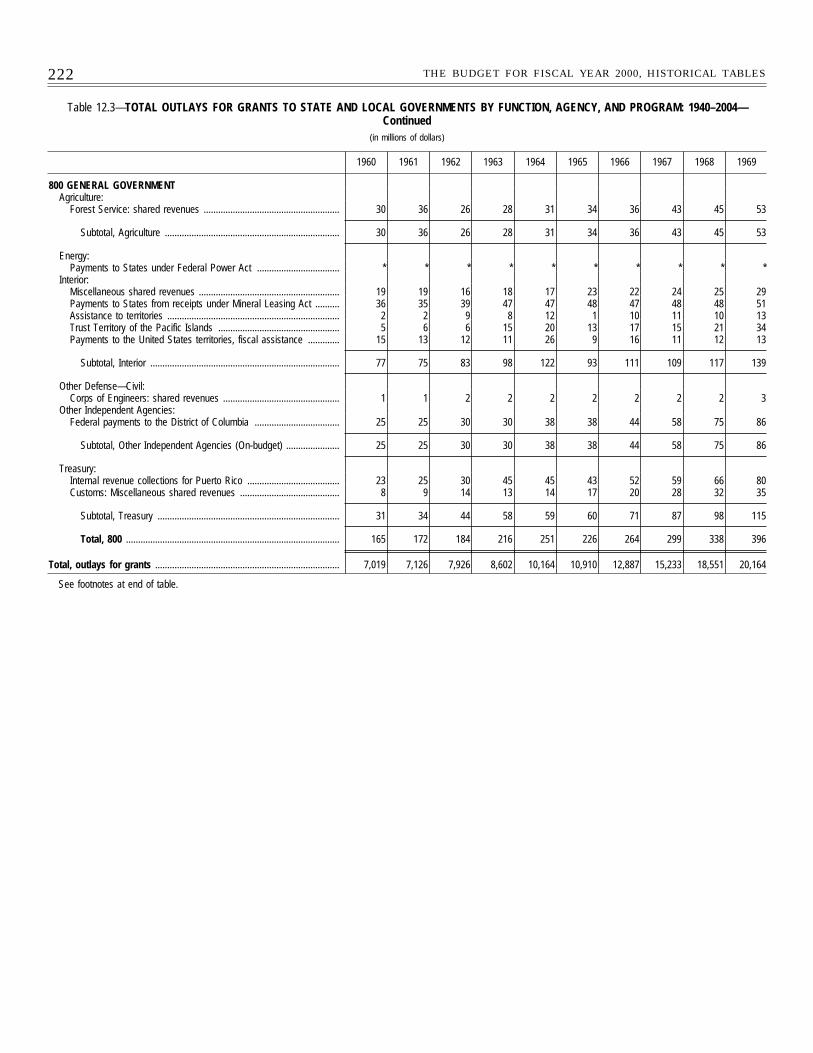
222 THE BUDGET FOR FISCAL YEAR 2000, HISTORICAL TABLES
Table 12.3—TOTAL OUTLAYS FOR GRANTS TO STATE AND LOCAL GOVERNMENTS BY FUNCTION, AGENCY, AND PROGRAM: 1940–2004—Continued
(in millions of dollars)
1960 1961 1962 1963 1964 1965 1966 1967 1968 1969
800 GENERAL GOVERNMENTAgriculture:
Forest Service: shared revenues ........................................................ 30 36 26 28 31 34 36 43 45 53
Subtotal, Agriculture ........................................................................ 30 36 26 28 31 34 36 43 45 53
Energy:Payments to States under Federal Power Act .................................. * * * * * * * * * *
Interior:Miscellaneous shared revenues .......................................................... 19 19 16 18 17 23 22 24 25 29Payments to States from receipts under Mineral Leasing Act .......... 36 35 39 47 47 48 47 48 48 51Assistance to territories ....................................................................... 2 2 9 8 12 1 10 11 10 13Trust Territory of the Pacific Islands .................................................. 5 6 6 15 20 13 17 15 21 34Payments to the United States territories, fiscal assistance ............. 15 13 12 11 26 9 16 11 12 13
Subtotal, Interior .............................................................................. 77 75 83 98 122 93 111 109 117 139
Other Defense—Civil:Corps of Engineers: shared revenues ................................................ 1 1 2 2 2 2 2 2 2 3
Other Independent Agencies:Federal payments to the District of Columbia ................................... 25 25 30 30 38 38 44 58 75 86
Subtotal, Other Independent Agencies (On-budget) ...................... 25 25 30 30 38 38 44 58 75 86
Treasury:Internal revenue collections for Puerto Rico ...................................... 23 25 30 45 45 43 52 59 66 80Customs: Miscellaneous shared revenues ......................................... 8 9 14 13 14 17 20 28 32 35
Subtotal, Treasury ........................................................................... 31 34 44 58 59 60 71 87 98 115
Total, 800 ........................................................................................ 165 172 184 216 251 226 264 299 338 396
Total, outlays for grants ............................................................................ 7,019 7,126 7,926 8,602 10,164 10,910 12,887 15,233 18,551 20,164
See footnotes at end of table.
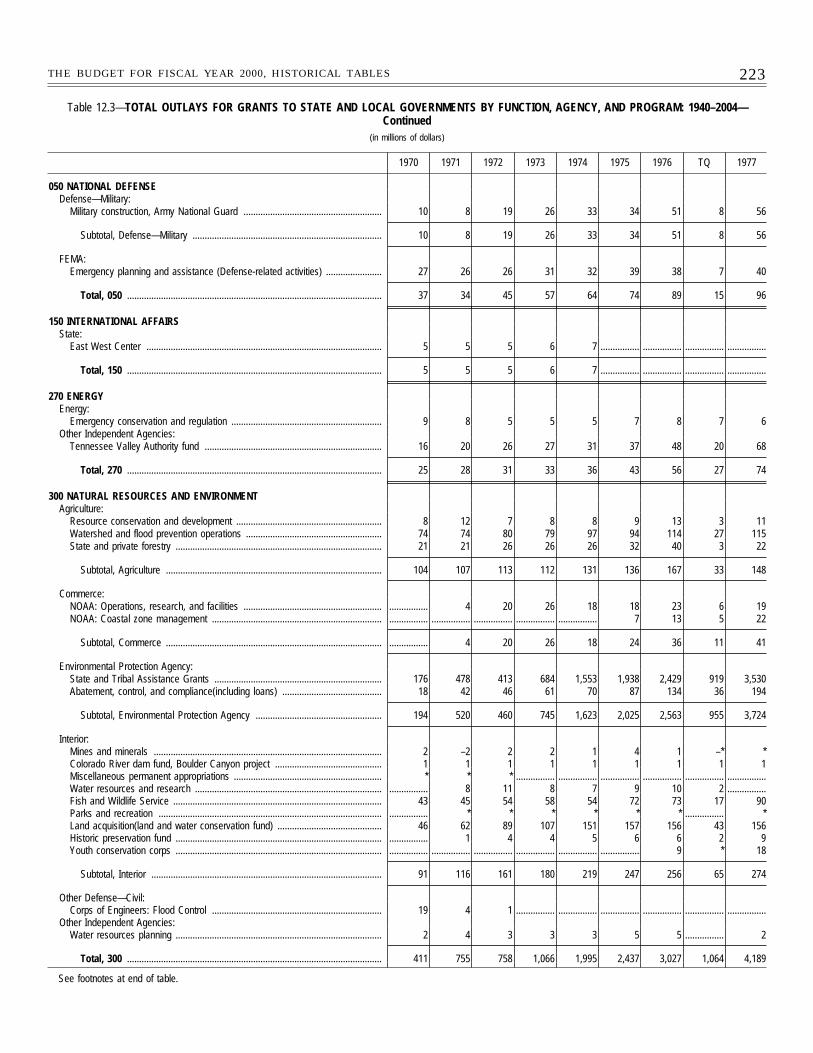
223THE BUDGET FOR FISCAL YEAR 2000, HISTORICAL TABLES
Table 12.3—TOTAL OUTLAYS FOR GRANTS TO STATE AND LOCAL GOVERNMENTS BY FUNCTION, AGENCY, AND PROGRAM: 1940–2004—Continued
(in millions of dollars)
1970 1971 1972 1973 1974 1975 1976 TQ 1977
050 NATIONAL DEFENSEDefense—Military:
Military construction, Army National Guard ......................................................... 10 8 19 26 33 34 51 8 56
Subtotal, Defense—Military .............................................................................. 10 8 19 26 33 34 51 8 56
FEMA:Emergency planning and assistance (Defense-related activities) ....................... 27 26 26 31 32 39 38 7 40
Total, 050 ......................................................................................................... 37 34 45 57 64 74 89 15 96
150 INTERNATIONAL AFFAIRSState:
East West Center ................................................................................................. 5 5 5 6 7 ................ ................ ................ ................
Total, 150 ......................................................................................................... 5 5 5 6 7 ................ ................ ................ ................
270 ENERGYEnergy:
Emergency conservation and regulation .............................................................. 9 8 5 5 5 7 8 7 6Other Independent Agencies:
Tennessee Valley Authority fund ......................................................................... 16 20 26 27 31 37 48 20 68
Total, 270 ......................................................................................................... 25 28 31 33 36 43 56 27 74
300 NATURAL RESOURCES AND ENVIRONMENTAgriculture:
Resource conservation and development ............................................................ 8 12 7 8 8 9 13 3 11Watershed and flood prevention operations ........................................................ 74 74 80 79 97 94 114 27 115State and private forestry ..................................................................................... 21 21 26 26 26 32 40 3 22
Subtotal, Agriculture ......................................................................................... 104 107 113 112 131 136 167 33 148
Commerce:NOAA: Operations, research, and facilities ......................................................... ................ 4 20 26 18 18 23 6 19NOAA: Coastal zone management ...................................................................... ................ ................ ................ ................ ................ 7 13 5 22
Subtotal, Commerce ......................................................................................... ................ 4 20 26 18 24 36 11 41
Environmental Protection Agency:State and Tribal Assistance Grants ..................................................................... 176 478 413 684 1,553 1,938 2,429 919 3,530Abatement, control, and compliance(including loans) ......................................... 18 42 46 61 70 87 134 36 194
Subtotal, Environmental Protection Agency .................................................... 194 520 460 745 1,623 2,025 2,563 955 3,724
Interior:Mines and minerals .............................................................................................. 2 –2 2 2 1 4 1 –* *Colorado River dam fund, Boulder Canyon project ............................................ 1 1 1 1 1 1 1 1 1Miscellaneous permanent appropriations ............................................................. * * * ................ ................ ................ ................ ................ ................Water resources and research ............................................................................. ................ 8 11 8 7 9 10 2 ................Fish and Wildlife Service ...................................................................................... 43 45 54 58 54 72 73 17 90Parks and recreation ............................................................................................ ................ * * * * * * ................ *Land acquisition(land and water conservation fund) ........................................... 46 62 89 107 151 157 156 43 156Historic preservation fund ..................................................................................... ................ 1 4 4 5 6 6 2 9Youth conservation corps ..................................................................................... ................ ................ ................ ................ ................ ................ 9 * 18
Subtotal, Interior ............................................................................................... 91 116 161 180 219 247 256 65 274
Other Defense—Civil:Corps of Engineers: Flood Control ...................................................................... 19 4 1 ................ ................ ................ ................ ................ ................
Other Independent Agencies:Water resources planning ..................................................................................... 2 4 3 3 3 5 5 ................ 2
Total, 300 ......................................................................................................... 411 755 758 1,066 1,995 2,437 3,027 1,064 4,189
See footnotes at end of table.
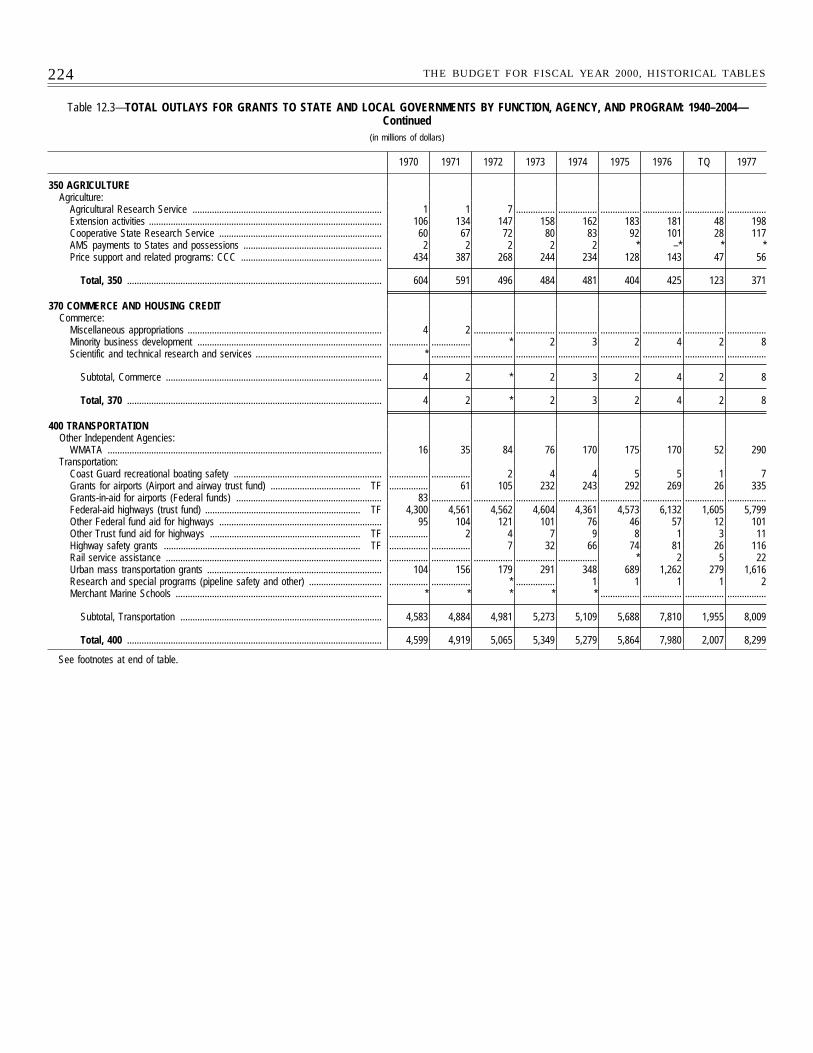
224 THE BUDGET FOR FISCAL YEAR 2000, HISTORICAL TABLES
Table 12.3—TOTAL OUTLAYS FOR GRANTS TO STATE AND LOCAL GOVERNMENTS BY FUNCTION, AGENCY, AND PROGRAM: 1940–2004—Continued
(in millions of dollars)
1970 1971 1972 1973 1974 1975 1976 TQ 1977
350 AGRICULTUREAgriculture:
Agricultural Research Service .............................................................................. 1 1 7 ................ ................ ................ ................ ................ ................Extension activities ................................................................................................ 106 134 147 158 162 183 181 48 198Cooperative State Research Service ................................................................... 60 67 72 80 83 92 101 28 117AMS payments to States and possessions ......................................................... 2 2 2 2 2 * –* * *Price support and related programs: CCC .......................................................... 434 387 268 244 234 128 143 47 56
Total, 350 ......................................................................................................... 604 591 496 484 481 404 425 123 371
370 COMMERCE AND HOUSING CREDITCommerce:
Miscellaneous appropriations ................................................................................ 4 2 ................ ................ ................ ................ ................ ................ ................Minority business development ............................................................................ ................ ................ * 2 3 2 4 2 8Scientific and technical research and services .................................................... * ................ ................ ................ ................ ................ ................ ................ ................
Subtotal, Commerce ......................................................................................... 4 2 * 2 3 2 4 2 8
Total, 370 ......................................................................................................... 4 2 * 2 3 2 4 2 8
400 TRANSPORTATIONOther Independent Agencies:
WMATA ................................................................................................................. 16 35 84 76 170 175 170 52 290Transportation:
Coast Guard recreational boating safety ............................................................. ................ ................ 2 4 4 5 5 1 7Grants for airports (Airport and airway trust fund) ..................................... TF ................ 61 105 232 243 292 269 26 335Grants-in-aid for airports (Federal funds) ............................................................ 83 ................ ................ ................ ................ ................ ................ ................ ................Federal-aid highways (trust fund) ................................................................ TF 4,300 4,561 4,562 4,604 4,361 4,573 6,132 1,605 5,799Other Federal fund aid for highways ................................................................... 95 104 121 101 76 46 57 12 101Other Trust fund aid for highways .............................................................. TF ................ 2 4 7 9 8 1 3 11Highway safety grants ................................................................................. TF ................ ................ 7 32 66 74 81 26 116Rail service assistance ......................................................................................... ................ ................ ................ ................ ................ * 2 5 22Urban mass transportation grants ........................................................................ 104 156 179 291 348 689 1,262 279 1,616Research and special programs (pipeline safety and other) .............................. ................ ................ * ................ 1 1 1 1 2Merchant Marine Schools ..................................................................................... * * * * * ................ ................ ................ ................
Subtotal, Transportation ................................................................................... 4,583 4,884 4,981 5,273 5,109 5,688 7,810 1,955 8,009
Total, 400 ......................................................................................................... 4,599 4,919 5,065 5,349 5,279 5,864 7,980 2,007 8,299
See footnotes at end of table.
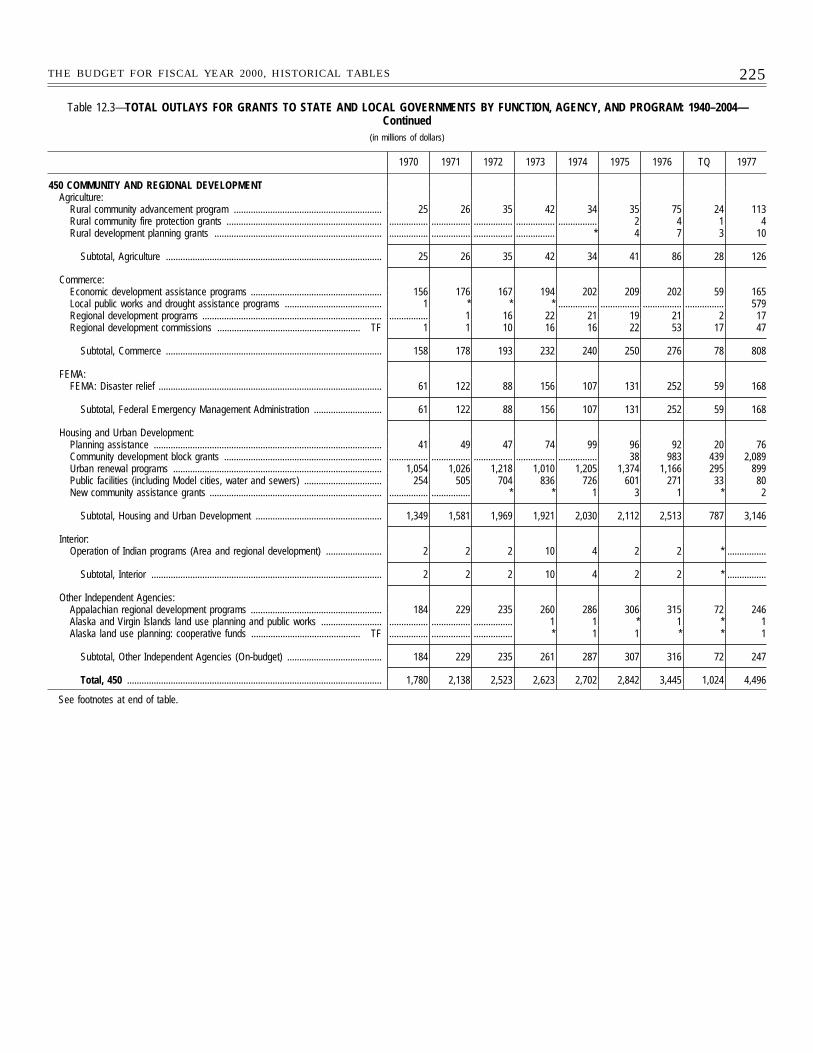
225THE BUDGET FOR FISCAL YEAR 2000, HISTORICAL TABLES
Table 12.3—TOTAL OUTLAYS FOR GRANTS TO STATE AND LOCAL GOVERNMENTS BY FUNCTION, AGENCY, AND PROGRAM: 1940–2004—Continued
(in millions of dollars)
1970 1971 1972 1973 1974 1975 1976 TQ 1977
450 COMMUNITY AND REGIONAL DEVELOPMENTAgriculture:
Rural community advancement program ............................................................. 25 26 35 42 34 35 75 24 113Rural community fire protection grants ................................................................ ................ ................ ................ ................ ................ 2 4 1 4Rural development planning grants ..................................................................... ................ ................ ................ ................ * 4 7 3 10
Subtotal, Agriculture ......................................................................................... 25 26 35 42 34 41 86 28 126
Commerce:Economic development assistance programs ...................................................... 156 176 167 194 202 209 202 59 165Local public works and drought assistance programs ........................................ 1 * * * ................ ................ ................ ................ 579Regional development programs .......................................................................... ................ 1 16 22 21 19 21 2 17Regional development commissions ........................................................... TF 1 1 10 16 16 22 53 17 47
Subtotal, Commerce ......................................................................................... 158 178 193 232 240 250 276 78 808
FEMA:FEMA: Disaster relief ............................................................................................ 61 122 88 156 107 131 252 59 168
Subtotal, Federal Emergency Management Administration ............................ 61 122 88 156 107 131 252 59 168
Housing and Urban Development:Planning assistance .............................................................................................. 41 49 47 74 99 96 92 20 76Community development block grants ................................................................. ................ ................ ................ ................ ................ 38 983 439 2,089Urban renewal programs ...................................................................................... 1,054 1,026 1,218 1,010 1,205 1,374 1,166 295 899Public facilities (including Model cities, water and sewers) ................................ 254 505 704 836 726 601 271 33 80New community assistance grants ....................................................................... ................ ................ * * 1 3 1 * 2
Subtotal, Housing and Urban Development .................................................... 1,349 1,581 1,969 1,921 2,030 2,112 2,513 787 3,146
Interior:Operation of Indian programs (Area and regional development) ....................... 2 2 2 10 4 2 2 * ................
Subtotal, Interior ............................................................................................... 2 2 2 10 4 2 2 * ................
Other Independent Agencies:Appalachian regional development programs ...................................................... 184 229 235 260 286 306 315 72 246Alaska and Virgin Islands land use planning and public works ......................... ................ ................ ................ 1 1 * 1 * 1Alaska land use planning: cooperative funds ............................................. TF ................ ................ ................ * 1 1 * * 1
Subtotal, Other Independent Agencies (On-budget) ....................................... 184 229 235 261 287 307 316 72 247
Total, 450 ......................................................................................................... 1,780 2,138 2,523 2,623 2,702 2,842 3,445 1,024 4,496
See footnotes at end of table.
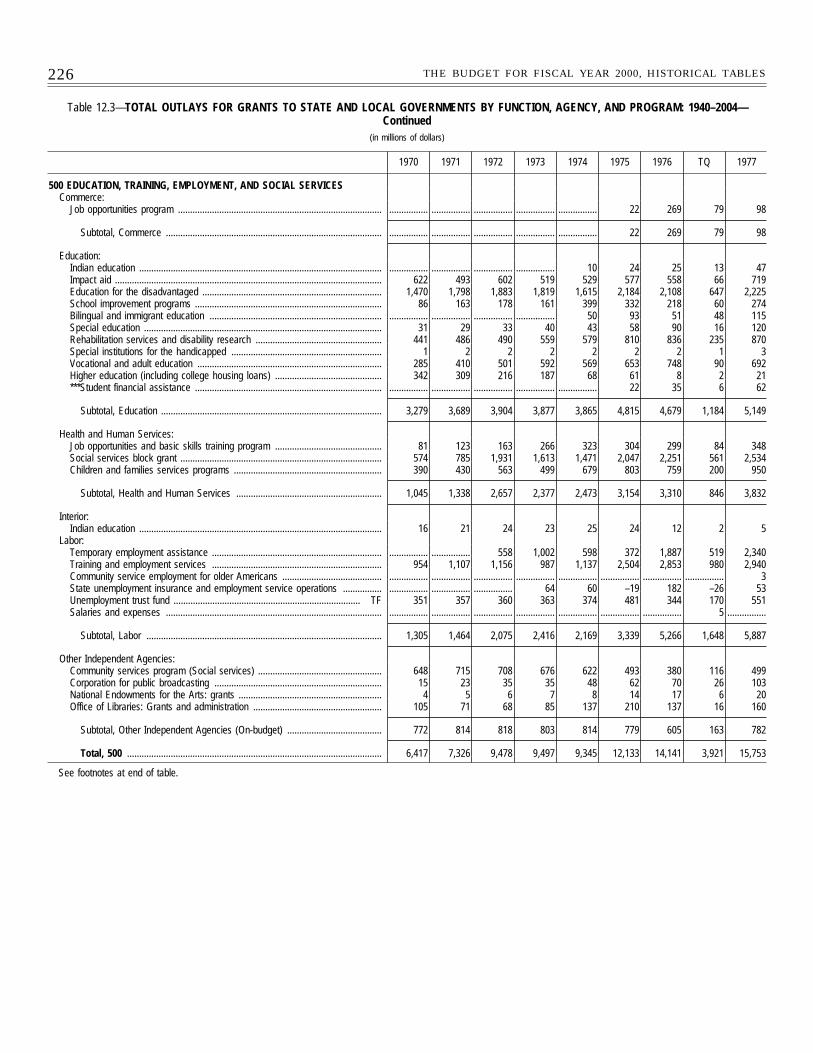
226 THE BUDGET FOR FISCAL YEAR 2000, HISTORICAL TABLES
Table 12.3—TOTAL OUTLAYS FOR GRANTS TO STATE AND LOCAL GOVERNMENTS BY FUNCTION, AGENCY, AND PROGRAM: 1940–2004—Continued
(in millions of dollars)
1970 1971 1972 1973 1974 1975 1976 TQ 1977
500 EDUCATION, TRAINING, EMPLOYMENT, AND SOCIAL SERVICESCommerce:
Job opportunities program .................................................................................... ................ ................ ................ ................ ................ 22 269 79 98
Subtotal, Commerce ......................................................................................... ................ ................ ................ ................ ................ 22 269 79 98
Education:Indian education .................................................................................................... ................ ................ ................ ................ 10 24 25 13 47Impact aid .............................................................................................................. 622 493 602 519 529 577 558 66 719Education for the disadvantaged .......................................................................... 1,470 1,798 1,883 1,819 1,615 2,184 2,108 647 2,225School improvement programs ............................................................................. 86 163 178 161 399 332 218 60 274Bilingual and immigrant education ....................................................................... ................ ................ ................ ................ 50 93 51 48 115Special education .................................................................................................. 31 29 33 40 43 58 90 16 120Rehabilitation services and disability research .................................................... 441 486 490 559 579 810 836 235 870Special institutions for the handicapped .............................................................. 1 2 2 2 2 2 2 1 3Vocational and adult education ............................................................................ 285 410 501 592 569 653 748 90 692Higher education (including college housing loans) ............................................ 342 309 216 187 68 61 8 2 21***Student financial assistance ............................................................................. ................ ................ ................ ................ ................ 22 35 6 62
Subtotal, Education ........................................................................................... 3,279 3,689 3,904 3,877 3,865 4,815 4,679 1,184 5,149
Health and Human Services:Job opportunities and basic skills training program ............................................ 81 123 163 266 323 304 299 84 348Social services block grant ................................................................................... 574 785 1,931 1,613 1,471 2,047 2,251 561 2,534Children and families services programs ............................................................. 390 430 563 499 679 803 759 200 950
Subtotal, Health and Human Services ............................................................ 1,045 1,338 2,657 2,377 2,473 3,154 3,310 846 3,832
Interior:Indian education .................................................................................................... 16 21 24 23 25 24 12 2 5
Labor:Temporary employment assistance ...................................................................... ................ ................ 558 1,002 598 372 1,887 519 2,340Training and employment services ...................................................................... 954 1,107 1,156 987 1,137 2,504 2,853 980 2,940Community service employment for older Americans ......................................... ................ ................ ................ ................ ................ ................ ................ ................ 3State unemployment insurance and employment service operations ................ ................ ................ ................ 64 60 –19 182 –26 53Unemployment trust fund ............................................................................. TF 351 357 360 363 374 481 344 170 551Salaries and expenses ......................................................................................... ................ ................ ................ ................ ................ ................ ................ 5 ................
Subtotal, Labor ................................................................................................. 1,305 1,464 2,075 2,416 2,169 3,339 5,266 1,648 5,887
Other Independent Agencies:Community services program (Social services) ................................................... 648 715 708 676 622 493 380 116 499Corporation for public broadcasting ..................................................................... 15 23 35 35 48 62 70 26 103National Endowments for the Arts: grants ........................................................... 4 5 6 7 8 14 17 6 20Office of Libraries: Grants and administration ..................................................... 105 71 68 85 137 210 137 16 160
Subtotal, Other Independent Agencies (On-budget) ....................................... 772 814 818 803 814 779 605 163 782
Total, 500 ......................................................................................................... 6,417 7,326 9,478 9,497 9,345 12,133 14,141 3,921 15,753
See footnotes at end of table.
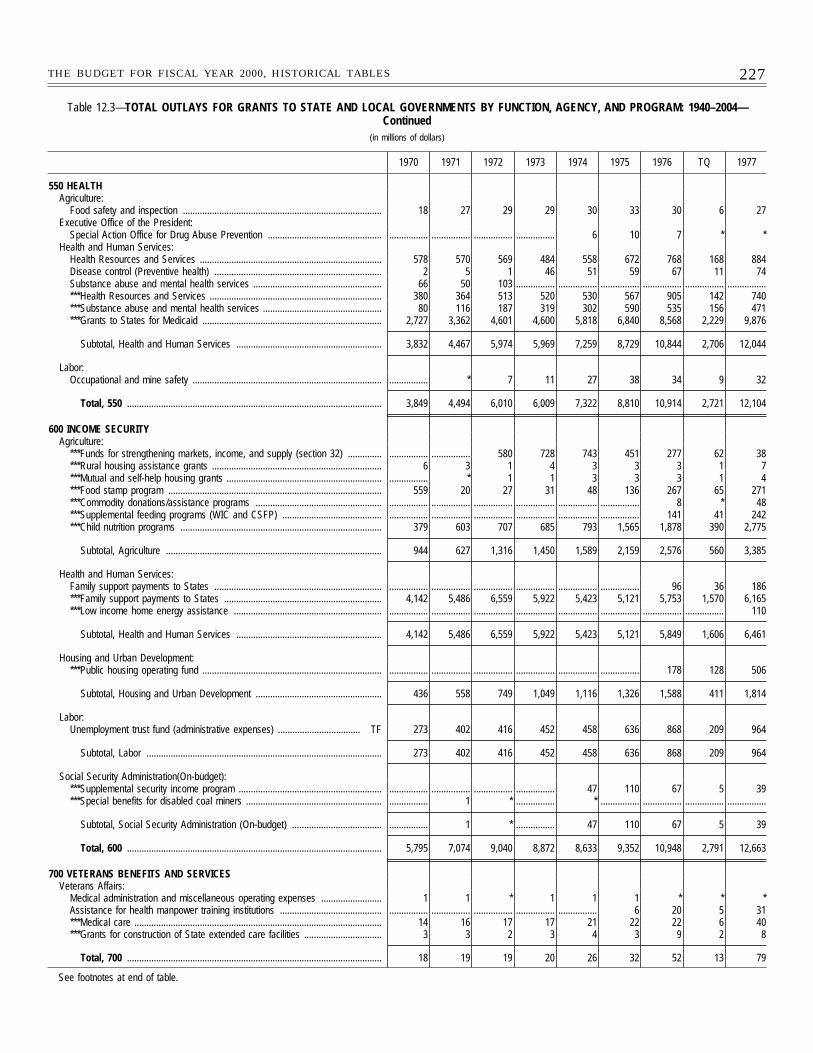
227THE BUDGET FOR FISCAL YEAR 2000, HISTORICAL TABLES
Table 12.3—TOTAL OUTLAYS FOR GRANTS TO STATE AND LOCAL GOVERNMENTS BY FUNCTION, AGENCY, AND PROGRAM: 1940–2004—Continued
(in millions of dollars)
1970 1971 1972 1973 1974 1975 1976 TQ 1977
550 HEALTHAgriculture:
Food safety and inspection .................................................................................. 18 27 29 29 30 33 30 6 27Executive Office of the President:
Special Action Office for Drug Abuse Prevention ............................................... ................ ................ ................ ................ 6 10 7 * *Health and Human Services:
Health Resources and Services ........................................................................... 578 570 569 484 558 672 768 168 884Disease control (Preventive health) ..................................................................... 2 5 1 46 51 59 67 11 74Substance abuse and mental health services ..................................................... 66 50 103 ................ ................ ................ ................ ................ ................***Health Resources and Services ....................................................................... 380 364 513 520 530 567 905 142 740***Substance abuse and mental health services ................................................. 80 116 187 319 302 590 535 156 471***Grants to States for Medicaid .......................................................................... 2,727 3,362 4,601 4,600 5,818 6,840 8,568 2,229 9,876
Subtotal, Health and Human Services ............................................................ 3,832 4,467 5,974 5,969 7,259 8,729 10,844 2,706 12,044
Labor:Occupational and mine safety .............................................................................. ................ * 7 11 27 38 34 9 32
Total, 550 ......................................................................................................... 3,849 4,494 6,010 6,009 7,322 8,810 10,914 2,721 12,104
600 INCOME SECURITYAgriculture:
***Funds for strengthening markets, income, and supply (section 32) .............. ................ ................ 580 728 743 451 277 62 38***Rural housing assistance grants ...................................................................... 6 3 1 4 3 3 3 1 7***Mutual and self-help housing grants ................................................................ ................ * 1 1 3 3 3 1 4***Food stamp program ........................................................................................ 559 20 27 31 48 136 267 65 271***Commodity donations/assistance programs .................................................... ................ ................ ................ ................ ................ ................ 8 * 48***Supplemental feeding programs (WIC and CSFP) ......................................... ................ ................ ................ ................ ................ ................ 141 41 242***Child nutrition programs ................................................................................... 379 603 707 685 793 1,565 1,878 390 2,775
Subtotal, Agriculture ......................................................................................... 944 627 1,316 1,450 1,589 2,159 2,576 560 3,385
Health and Human Services:Family support payments to States ..................................................................... ................ ................ ................ ................ ................ ................ 96 36 186***Family support payments to States ................................................................. 4,142 5,486 6,559 5,922 5,423 5,121 5,753 1,570 6,165***Low income home energy assistance ............................................................. ................ ................ ................ ................ ................ ................ ................ ................ 110
Subtotal, Health and Human Services ............................................................ 4,142 5,486 6,559 5,922 5,423 5,121 5,849 1,606 6,461
Housing and Urban Development:***Public housing operating fund .......................................................................... ................ ................ ................ ................ ................ ................ 178 128 506
Subtotal, Housing and Urban Development .................................................... 436 558 749 1,049 1,116 1,326 1,588 411 1,814
Labor:Unemployment trust fund (administrative expenses) .................................. TF 273 402 416 452 458 636 868 209 964
Subtotal, Labor ................................................................................................. 273 402 416 452 458 636 868 209 964
Social Security Administration(On-budget):***Supplemental security income program ........................................................... ................ ................ ................ ................ 47 110 67 5 39***Special benefits for disabled coal miners ........................................................ ................ 1 * ................ * ................ ................ ................ ................
Subtotal, Social Security Administration (On-budget) ..................................... ................ 1 * ................ 47 110 67 5 39
Total, 600 ......................................................................................................... 5,795 7,074 9,040 8,872 8,633 9,352 10,948 2,791 12,663
700 VETERANS BENEFITS AND SERVICESVeterans Affairs:
Medical administration and miscellaneous operating expenses ......................... 1 1 * 1 1 1 * * *Assistance for health manpower training institutions .......................................... ................ ................ ................ ................ ................ 6 20 5 31***Medical care ...................................................................................................... 14 16 17 17 21 22 22 6 40***Grants for construction of State extended care facilities ................................ 3 3 2 3 4 3 9 2 8
Total, 700 ......................................................................................................... 18 19 19 20 26 32 52 13 79
See footnotes at end of table.
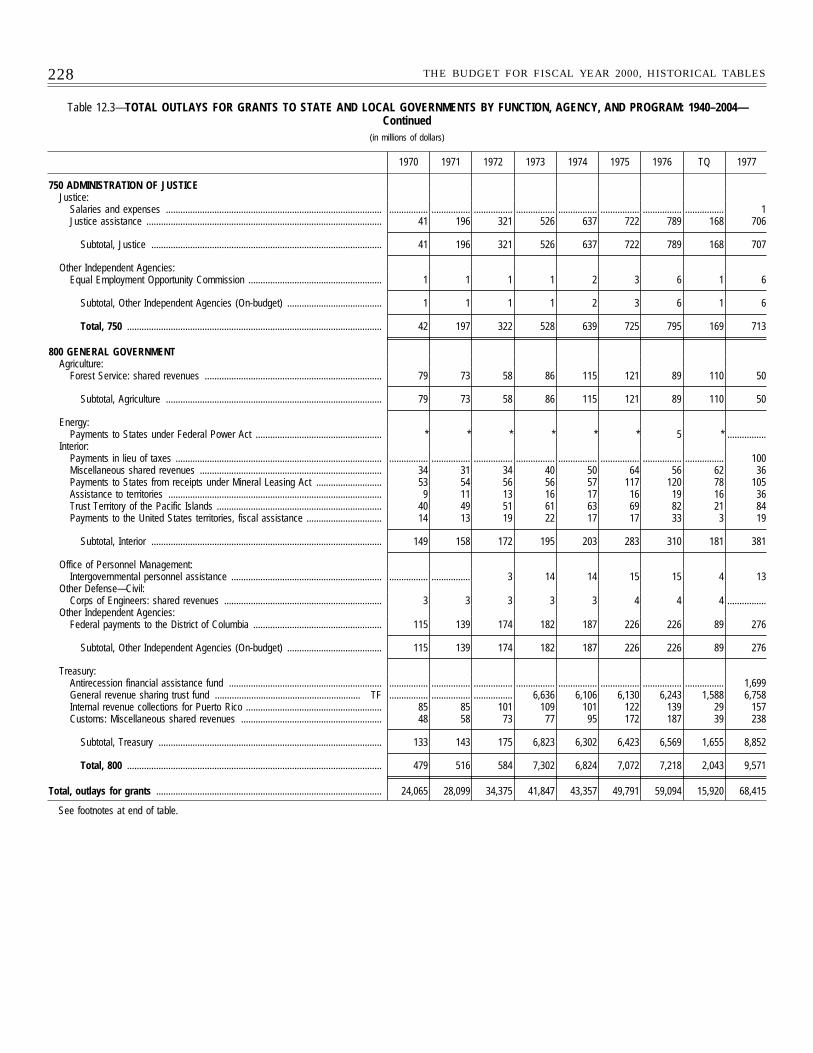
228 THE BUDGET FOR FISCAL YEAR 2000, HISTORICAL TABLES
Table 12.3—TOTAL OUTLAYS FOR GRANTS TO STATE AND LOCAL GOVERNMENTS BY FUNCTION, AGENCY, AND PROGRAM: 1940–2004—Continued
(in millions of dollars)
1970 1971 1972 1973 1974 1975 1976 TQ 1977
750 ADMINISTRATION OF JUSTICEJustice:
Salaries and expenses ......................................................................................... ................ ................ ................ ................ ................ ................ ................ ................ 1Justice assistance ................................................................................................. 41 196 321 526 637 722 789 168 706
Subtotal, Justice ............................................................................................... 41 196 321 526 637 722 789 168 707
Other Independent Agencies:Equal Employment Opportunity Commission ....................................................... 1 1 1 1 2 3 6 1 6
Subtotal, Other Independent Agencies (On-budget) ....................................... 1 1 1 1 2 3 6 1 6
Total, 750 ......................................................................................................... 42 197 322 528 639 725 795 169 713
800 GENERAL GOVERNMENTAgriculture:
Forest Service: shared revenues ......................................................................... 79 73 58 86 115 121 89 110 50
Subtotal, Agriculture ......................................................................................... 79 73 58 86 115 121 89 110 50
Energy:Payments to States under Federal Power Act .................................................... * * * * * * 5 * ................
Interior:Payments in lieu of taxes ..................................................................................... ................ ................ ................ ................ ................ ................ ................ ................ 100Miscellaneous shared revenues ........................................................................... 34 31 34 40 50 64 56 62 36Payments to States from receipts under Mineral Leasing Act ........................... 53 54 56 56 57 117 120 78 105Assistance to territories ........................................................................................ 9 11 13 16 17 16 19 16 36Trust Territory of the Pacific Islands .................................................................... 40 49 51 61 63 69 82 21 84Payments to the United States territories, fiscal assistance ............................... 14 13 19 22 17 17 33 3 19
Subtotal, Interior ............................................................................................... 149 158 172 195 203 283 310 181 381
Office of Personnel Management:Intergovernmental personnel assistance .............................................................. ................ ................ 3 14 14 15 15 4 13
Other Defense—Civil:Corps of Engineers: shared revenues ................................................................. 3 3 3 3 3 4 4 4 ................
Other Independent Agencies:Federal payments to the District of Columbia ..................................................... 115 139 174 182 187 226 226 89 276
Subtotal, Other Independent Agencies (On-budget) ....................................... 115 139 174 182 187 226 226 89 276
Treasury:Antirecession financial assistance fund ............................................................... ................ ................ ................ ................ ................ ................ ................ ................ 1,699General revenue sharing trust fund ............................................................ TF ................ ................ ................ 6,636 6,106 6,130 6,243 1,588 6,758Internal revenue collections for Puerto Rico ........................................................ 85 85 101 109 101 122 139 29 157Customs: Miscellaneous shared revenues .......................................................... 48 58 73 77 95 172 187 39 238
Subtotal, Treasury ............................................................................................ 133 143 175 6,823 6,302 6,423 6,569 1,655 8,852
Total, 800 ......................................................................................................... 479 516 584 7,302 6,824 7,072 7,218 2,043 9,571
Total, outlays for grants ............................................................................................. 24,065 28,099 34,375 41,847 43,357 49,791 59,094 15,920 68,415
See footnotes at end of table.
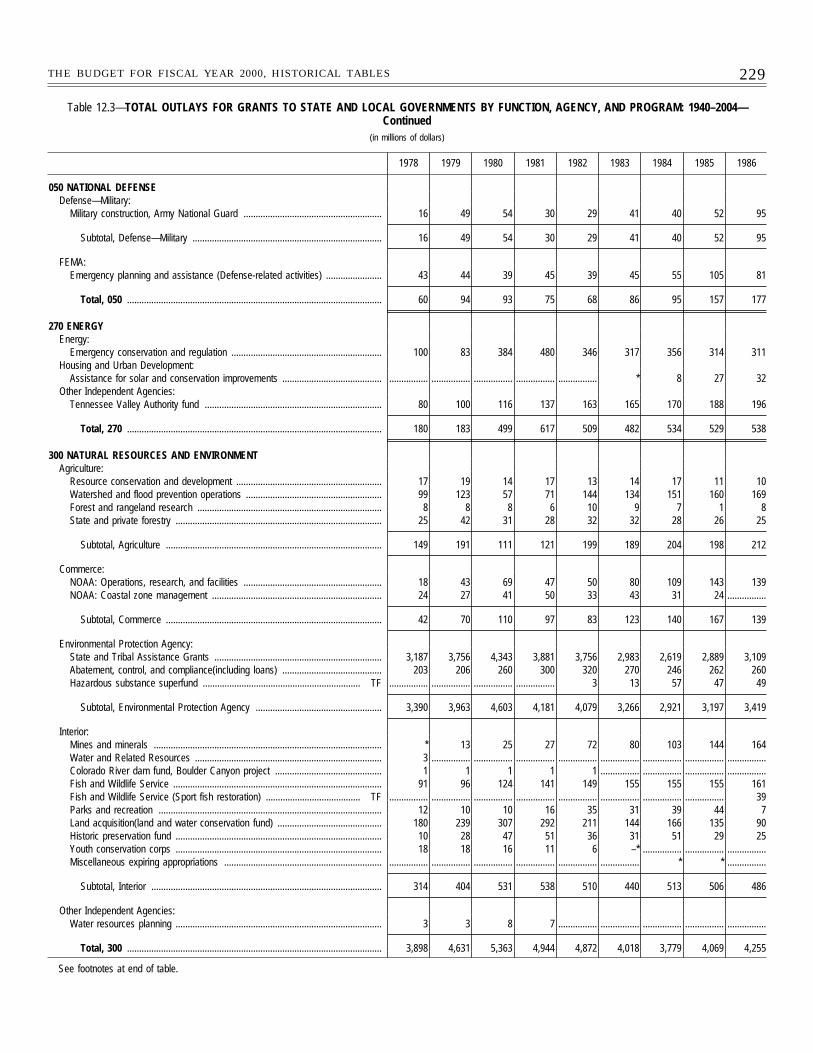
229THE BUDGET FOR FISCAL YEAR 2000, HISTORICAL TABLES
Table 12.3—TOTAL OUTLAYS FOR GRANTS TO STATE AND LOCAL GOVERNMENTS BY FUNCTION, AGENCY, AND PROGRAM: 1940–2004—Continued
(in millions of dollars)
1978 1979 1980 1981 1982 1983 1984 1985 1986
050 NATIONAL DEFENSEDefense—Military:
Military construction, Army National Guard ......................................................... 16 49 54 30 29 41 40 52 95
Subtotal, Defense—Military .............................................................................. 16 49 54 30 29 41 40 52 95
FEMA:Emergency planning and assistance (Defense-related activities) ....................... 43 44 39 45 39 45 55 105 81
Total, 050 ......................................................................................................... 60 94 93 75 68 86 95 157 177
270 ENERGYEnergy:
Emergency conservation and regulation .............................................................. 100 83 384 480 346 317 356 314 311Housing and Urban Development:
Assistance for solar and conservation improvements ......................................... ................ ................ ................ ................ ................ * 8 27 32Other Independent Agencies:
Tennessee Valley Authority fund ......................................................................... 80 100 116 137 163 165 170 188 196
Total, 270 ......................................................................................................... 180 183 499 617 509 482 534 529 538
300 NATURAL RESOURCES AND ENVIRONMENTAgriculture:
Resource conservation and development ............................................................ 17 19 14 17 13 14 17 11 10Watershed and flood prevention operations ........................................................ 99 123 57 71 144 134 151 160 169Forest and rangeland research ............................................................................ 8 8 8 6 10 9 7 1 8State and private forestry ..................................................................................... 25 42 31 28 32 32 28 26 25
Subtotal, Agriculture ......................................................................................... 149 191 111 121 199 189 204 198 212
Commerce:NOAA: Operations, research, and facilities ......................................................... 18 43 69 47 50 80 109 143 139NOAA: Coastal zone management ...................................................................... 24 27 41 50 33 43 31 24 ................
Subtotal, Commerce ......................................................................................... 42 70 110 97 83 123 140 167 139
Environmental Protection Agency:State and Tribal Assistance Grants ..................................................................... 3,187 3,756 4,343 3,881 3,756 2,983 2,619 2,889 3,109Abatement, control, and compliance(including loans) ......................................... 203 206 260 300 320 270 246 262 260Hazardous substance superfund ................................................................. TF ................ ................ ................ ................ 3 13 57 47 49
Subtotal, Environmental Protection Agency .................................................... 3,390 3,963 4,603 4,181 4,079 3,266 2,921 3,197 3,419
Interior:Mines and minerals .............................................................................................. * 13 25 27 72 80 103 144 164Water and Related Resources ............................................................................. 3 ................ ................ ................ ................ ................ ................ ................ ................Colorado River dam fund, Boulder Canyon project ............................................ 1 1 1 1 1 ................ ................ ................ ................Fish and Wildlife Service ...................................................................................... 91 96 124 141 149 155 155 155 161Fish and Wildlife Service (Sport fish restoration) ....................................... TF ................ ................ ................ ................ ................ ................ ................ ................ 39Parks and recreation ............................................................................................ 12 10 10 16 35 31 39 44 7Land acquisition(land and water conservation fund) ........................................... 180 239 307 292 211 144 166 135 90Historic preservation fund ..................................................................................... 10 28 47 51 36 31 51 29 25Youth conservation corps ..................................................................................... 18 18 16 11 6 –* ................ ................ ................Miscellaneous expiring appropriations ................................................................. ................ ................ ................ ................ ................ ................ * * ................
Subtotal, Interior ............................................................................................... 314 404 531 538 510 440 513 506 486
Other Independent Agencies:Water resources planning ..................................................................................... 3 3 8 7 ................ ................ ................ ................ ................
Total, 300 ......................................................................................................... 3,898 4,631 5,363 4,944 4,872 4,018 3,779 4,069 4,255
See footnotes at end of table.
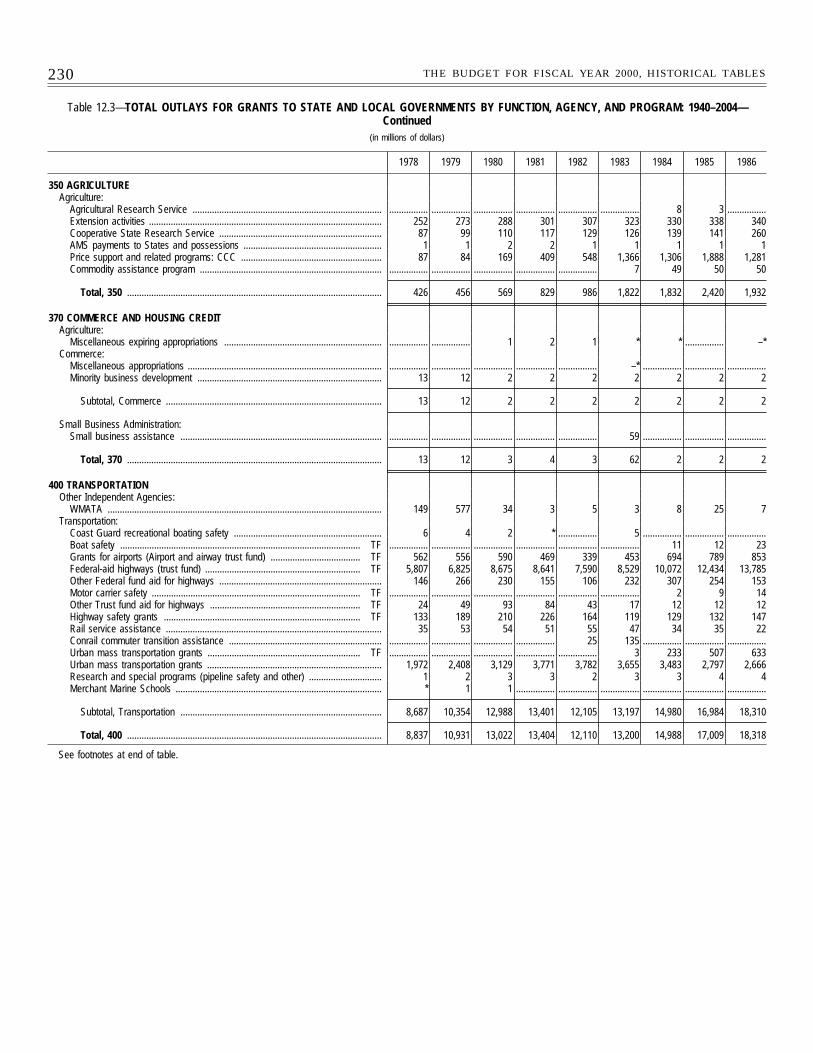
230 THE BUDGET FOR FISCAL YEAR 2000, HISTORICAL TABLES
Table 12.3—TOTAL OUTLAYS FOR GRANTS TO STATE AND LOCAL GOVERNMENTS BY FUNCTION, AGENCY, AND PROGRAM: 1940–2004—Continued
(in millions of dollars)
1978 1979 1980 1981 1982 1983 1984 1985 1986
350 AGRICULTUREAgriculture:
Agricultural Research Service .............................................................................. ................ ................ ................ ................ ................ ................ 8 3 ................Extension activities ................................................................................................ 252 273 288 301 307 323 330 338 340Cooperative State Research Service ................................................................... 87 99 110 117 129 126 139 141 260AMS payments to States and possessions ......................................................... 1 1 2 2 1 1 1 1 1Price support and related programs: CCC .......................................................... 87 84 169 409 548 1,366 1,306 1,888 1,281Commodity assistance program ........................................................................... ................ ................ ................ ................ ................ 7 49 50 50
Total, 350 ......................................................................................................... 426 456 569 829 986 1,822 1,832 2,420 1,932
370 COMMERCE AND HOUSING CREDITAgriculture:
Miscellaneous expiring appropriations ................................................................. ................ ................ 1 2 1 * * ................ –*Commerce:
Miscellaneous appropriations ................................................................................ ................ ................ ................ ................ ................ –* ................ ................ ................Minority business development ............................................................................ 13 12 2 2 2 2 2 2 2
Subtotal, Commerce ......................................................................................... 13 12 2 2 2 2 2 2 2
Small Business Administration:Small business assistance ................................................................................... ................ ................ ................ ................ ................ 59 ................ ................ ................
Total, 370 ......................................................................................................... 13 12 3 4 3 62 2 2 2
400 TRANSPORTATIONOther Independent Agencies:
WMATA ................................................................................................................. 149 577 34 3 5 3 8 25 7Transportation:
Coast Guard recreational boating safety ............................................................. 6 4 2 * ................ 5 ................ ................ ................Boat safety ................................................................................................... TF ................ ................ ................ ................ ................ ................ 11 12 23Grants for airports (Airport and airway trust fund) ..................................... TF 562 556 590 469 339 453 694 789 853Federal-aid highways (trust fund) ................................................................ TF 5,807 6,825 8,675 8,641 7,590 8,529 10,072 12,434 13,785Other Federal fund aid for highways ................................................................... 146 266 230 155 106 232 307 254 153Motor carrier safety ...................................................................................... TF ................ ................ ................ ................ ................ ................ 2 9 14Other Trust fund aid for highways .............................................................. TF 24 49 93 84 43 17 12 12 12Highway safety grants ................................................................................. TF 133 189 210 226 164 119 129 132 147Rail service assistance ......................................................................................... 35 53 54 51 55 47 34 35 22Conrail commuter transition assistance ............................................................... ................ ................ ................ ................ 25 135 ................ ................ ................Urban mass transportation grants ............................................................... TF ................ ................ ................ ................ ................ 3 233 507 633Urban mass transportation grants ........................................................................ 1,972 2,408 3,129 3,771 3,782 3,655 3,483 2,797 2,666Research and special programs (pipeline safety and other) .............................. 1 2 3 3 2 3 3 4 4Merchant Marine Schools ..................................................................................... * 1 1 ................ ................ ................ ................ ................ ................
Subtotal, Transportation ................................................................................... 8,687 10,354 12,988 13,401 12,105 13,197 14,980 16,984 18,310
Total, 400 ......................................................................................................... 8,837 10,931 13,022 13,404 12,110 13,200 14,988 17,009 18,318
See footnotes at end of table.
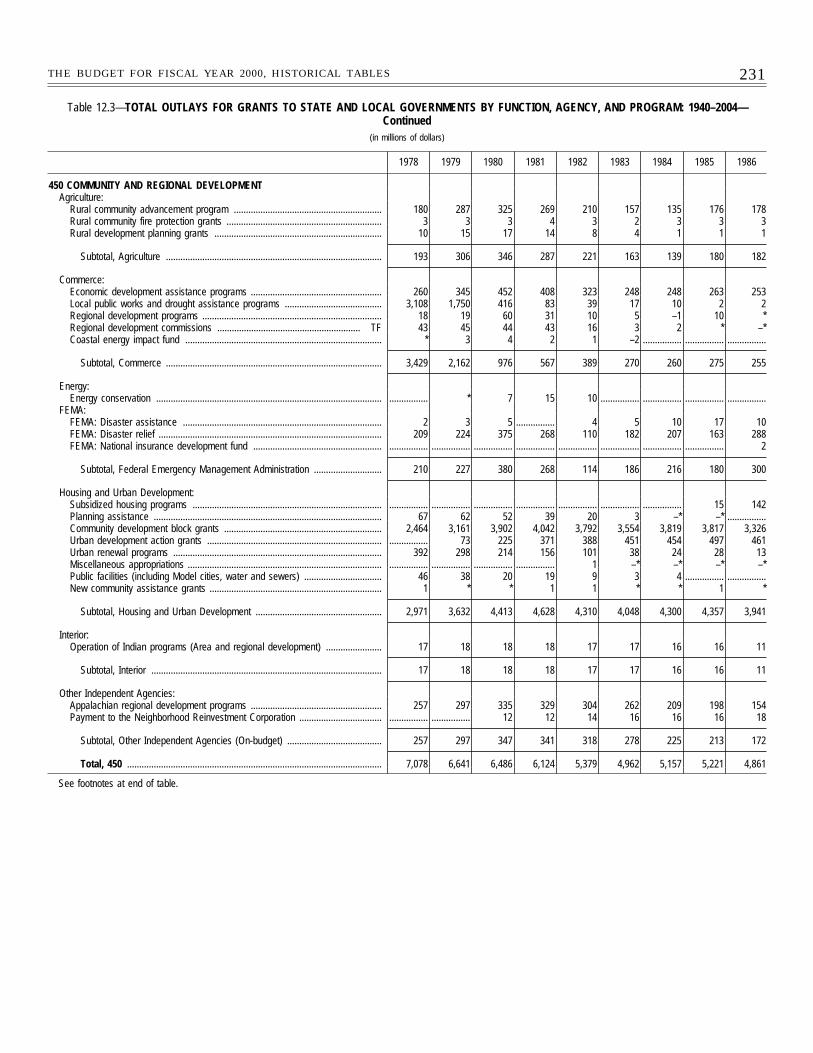
231THE BUDGET FOR FISCAL YEAR 2000, HISTORICAL TABLES
Table 12.3—TOTAL OUTLAYS FOR GRANTS TO STATE AND LOCAL GOVERNMENTS BY FUNCTION, AGENCY, AND PROGRAM: 1940–2004—Continued
(in millions of dollars)
1978 1979 1980 1981 1982 1983 1984 1985 1986
450 COMMUNITY AND REGIONAL DEVELOPMENTAgriculture:
Rural community advancement program ............................................................. 180 287 325 269 210 157 135 176 178Rural community fire protection grants ................................................................ 3 3 3 4 3 2 3 3 3Rural development planning grants ..................................................................... 10 15 17 14 8 4 1 1 1
Subtotal, Agriculture ......................................................................................... 193 306 346 287 221 163 139 180 182
Commerce:Economic development assistance programs ...................................................... 260 345 452 408 323 248 248 263 253Local public works and drought assistance programs ........................................ 3,108 1,750 416 83 39 17 10 2 2Regional development programs .......................................................................... 18 19 60 31 10 5 –1 10 *Regional development commissions ........................................................... TF 43 45 44 43 16 3 2 * –*Coastal energy impact fund ................................................................................. * 3 4 2 1 –2 ................ ................ ................
Subtotal, Commerce ......................................................................................... 3,429 2,162 976 567 389 270 260 275 255
Energy:Energy conservation ............................................................................................. ................ * 7 15 10 ................ ................ ................ ................
FEMA:FEMA: Disaster assistance .................................................................................. 2 3 5 ................ 4 5 10 17 10FEMA: Disaster relief ............................................................................................ 209 224 375 268 110 182 207 163 288FEMA: National insurance development fund ..................................................... ................ ................ ................ ................ ................ ................ ................ ................ 2
Subtotal, Federal Emergency Management Administration ............................ 210 227 380 268 114 186 216 180 300
Housing and Urban Development:Subsidized housing programs .............................................................................. ................ ................ ................ ................ ................ ................ ................ 15 142Planning assistance .............................................................................................. 67 62 52 39 20 3 –* –* ................Community development block grants ................................................................. 2,464 3,161 3,902 4,042 3,792 3,554 3,819 3,817 3,326Urban development action grants ........................................................................ ................ 73 225 371 388 451 454 497 461Urban renewal programs ...................................................................................... 392 298 214 156 101 38 24 28 13Miscellaneous appropriations ................................................................................ ................ ................ ................ ................ 1 –* –* –* –*Public facilities (including Model cities, water and sewers) ................................ 46 38 20 19 9 3 4 ................ ................New community assistance grants ....................................................................... 1 * * 1 1 * * 1 *
Subtotal, Housing and Urban Development .................................................... 2,971 3,632 4,413 4,628 4,310 4,048 4,300 4,357 3,941
Interior:Operation of Indian programs (Area and regional development) ....................... 17 18 18 18 17 17 16 16 11
Subtotal, Interior ............................................................................................... 17 18 18 18 17 17 16 16 11
Other Independent Agencies:Appalachian regional development programs ...................................................... 257 297 335 329 304 262 209 198 154Payment to the Neighborhood Reinvestment Corporation .................................. ................ ................ 12 12 14 16 16 16 18
Subtotal, Other Independent Agencies (On-budget) ....................................... 257 297 347 341 318 278 225 213 172
Total, 450 ......................................................................................................... 7,078 6,641 6,486 6,124 5,379 4,962 5,157 5,221 4,861
See footnotes at end of table.
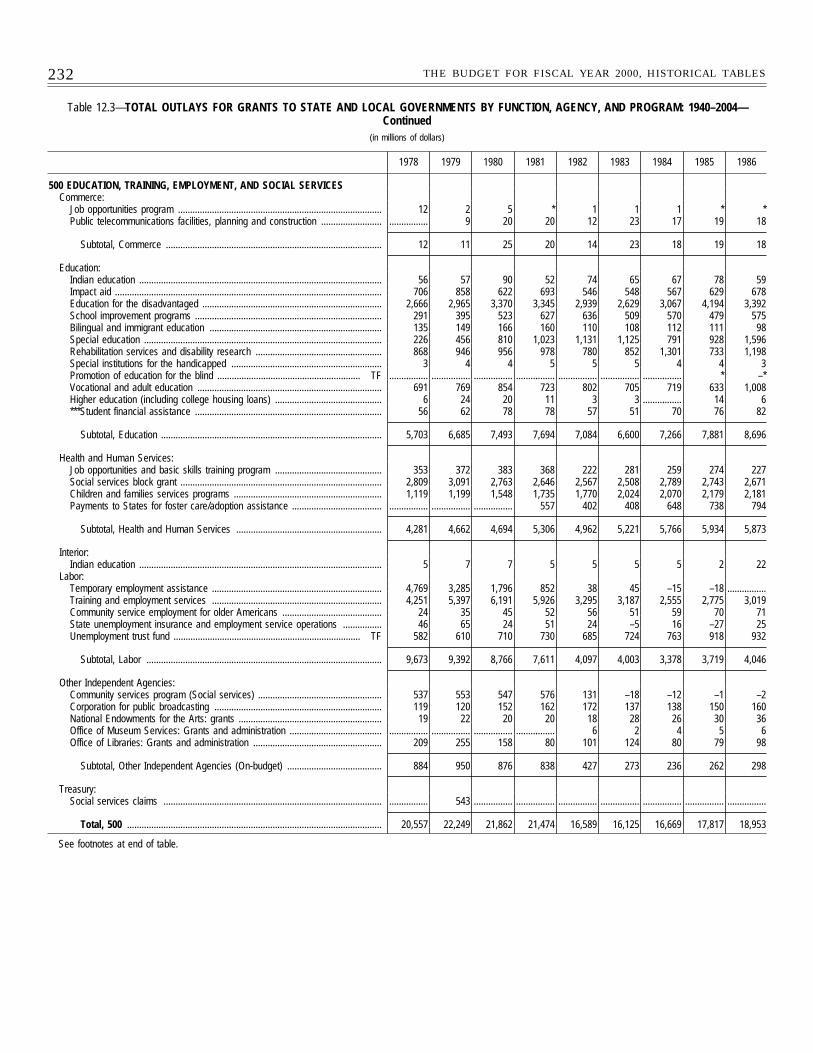
232 THE BUDGET FOR FISCAL YEAR 2000, HISTORICAL TABLES
Table 12.3—TOTAL OUTLAYS FOR GRANTS TO STATE AND LOCAL GOVERNMENTS BY FUNCTION, AGENCY, AND PROGRAM: 1940–2004—Continued
(in millions of dollars)
1978 1979 1980 1981 1982 1983 1984 1985 1986
500 EDUCATION, TRAINING, EMPLOYMENT, AND SOCIAL SERVICESCommerce:
Job opportunities program .................................................................................... 12 2 5 * 1 1 1 * *Public telecommunications facilities, planning and construction ......................... ................ 9 20 20 12 23 17 19 18
Subtotal, Commerce ......................................................................................... 12 11 25 20 14 23 18 19 18
Education:Indian education .................................................................................................... 56 57 90 52 74 65 67 78 59Impact aid .............................................................................................................. 706 858 622 693 546 548 567 629 678Education for the disadvantaged .......................................................................... 2,666 2,965 3,370 3,345 2,939 2,629 3,067 4,194 3,392School improvement programs ............................................................................. 291 395 523 627 636 509 570 479 575Bilingual and immigrant education ....................................................................... 135 149 166 160 110 108 112 111 98Special education .................................................................................................. 226 456 810 1,023 1,131 1,125 791 928 1,596Rehabilitation services and disability research .................................................... 868 946 956 978 780 852 1,301 733 1,198Special institutions for the handicapped .............................................................. 3 4 4 5 5 5 4 4 3Promotion of education for the blind ........................................................... TF ................ ................ ................ ................ ................ ................ ................ * –*Vocational and adult education ............................................................................ 691 769 854 723 802 705 719 633 1,008Higher education (including college housing loans) ............................................ 6 24 20 11 3 3 ................ 14 6***Student financial assistance ............................................................................. 56 62 78 78 57 51 70 76 82
Subtotal, Education ........................................................................................... 5,703 6,685 7,493 7,694 7,084 6,600 7,266 7,881 8,696
Health and Human Services:Job opportunities and basic skills training program ............................................ 353 372 383 368 222 281 259 274 227Social services block grant ................................................................................... 2,809 3,091 2,763 2,646 2,567 2,508 2,789 2,743 2,671Children and families services programs ............................................................. 1,119 1,199 1,548 1,735 1,770 2,024 2,070 2,179 2,181Payments to States for foster care/adoption assistance ..................................... ................ ................ ................ 557 402 408 648 738 794
Subtotal, Health and Human Services ............................................................ 4,281 4,662 4,694 5,306 4,962 5,221 5,766 5,934 5,873
Interior:Indian education .................................................................................................... 5 7 7 5 5 5 5 2 22
Labor:Temporary employment assistance ...................................................................... 4,769 3,285 1,796 852 38 45 –15 –18 ................Training and employment services ...................................................................... 4,251 5,397 6,191 5,926 3,295 3,187 2,555 2,775 3,019Community service employment for older Americans ......................................... 24 35 45 52 56 51 59 70 71State unemployment insurance and employment service operations ................ 46 65 24 51 24 –5 16 –27 25Unemployment trust fund ............................................................................. TF 582 610 710 730 685 724 763 918 932
Subtotal, Labor ................................................................................................. 9,673 9,392 8,766 7,611 4,097 4,003 3,378 3,719 4,046
Other Independent Agencies:Community services program (Social services) ................................................... 537 553 547 576 131 –18 –12 –1 –2Corporation for public broadcasting ..................................................................... 119 120 152 162 172 137 138 150 160National Endowments for the Arts: grants ........................................................... 19 22 20 20 18 28 26 30 36Office of Museum Services: Grants and administration ...................................... ................ ................ ................ ................ 6 2 4 5 6Office of Libraries: Grants and administration ..................................................... 209 255 158 80 101 124 80 79 98
Subtotal, Other Independent Agencies (On-budget) ....................................... 884 950 876 838 427 273 236 262 298
Treasury:Social services claims .......................................................................................... ................ 543 ................ ................ ................ ................ ................ ................ ................
Total, 500 ......................................................................................................... 20,557 22,249 21,862 21,474 16,589 16,125 16,669 17,817 18,953
See footnotes at end of table.
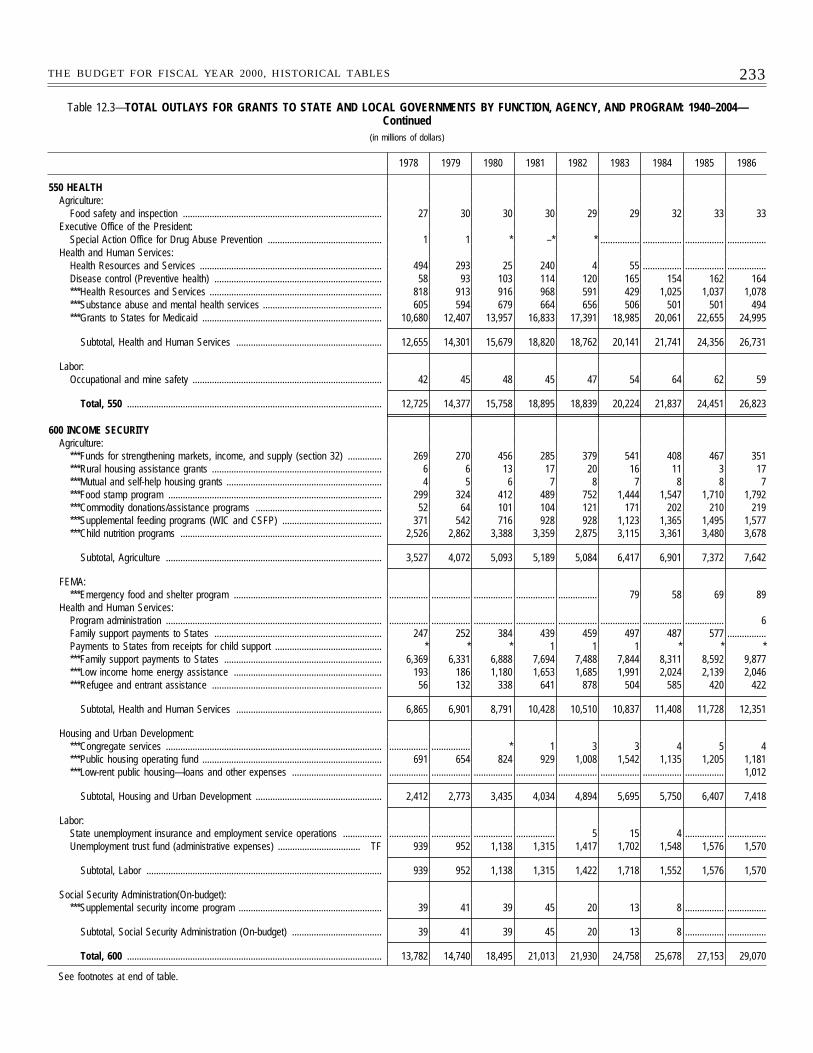
233THE BUDGET FOR FISCAL YEAR 2000, HISTORICAL TABLES
Table 12.3—TOTAL OUTLAYS FOR GRANTS TO STATE AND LOCAL GOVERNMENTS BY FUNCTION, AGENCY, AND PROGRAM: 1940–2004—Continued
(in millions of dollars)
1978 1979 1980 1981 1982 1983 1984 1985 1986
550 HEALTHAgriculture:
Food safety and inspection .................................................................................. 27 30 30 30 29 29 32 33 33Executive Office of the President:
Special Action Office for Drug Abuse Prevention ............................................... 1 1 * –* * ................ ................ ................ ................Health and Human Services:
Health Resources and Services ........................................................................... 494 293 25 240 4 55 ................ ................ ................Disease control (Preventive health) ..................................................................... 58 93 103 114 120 165 154 162 164***Health Resources and Services ....................................................................... 818 913 916 968 591 429 1,025 1,037 1,078***Substance abuse and mental health services ................................................. 605 594 679 664 656 506 501 501 494***Grants to States for Medicaid .......................................................................... 10,680 12,407 13,957 16,833 17,391 18,985 20,061 22,655 24,995
Subtotal, Health and Human Services ............................................................ 12,655 14,301 15,679 18,820 18,762 20,141 21,741 24,356 26,731
Labor:Occupational and mine safety .............................................................................. 42 45 48 45 47 54 64 62 59
Total, 550 ......................................................................................................... 12,725 14,377 15,758 18,895 18,839 20,224 21,837 24,451 26,823
600 INCOME SECURITYAgriculture:
***Funds for strengthening markets, income, and supply (section 32) .............. 269 270 456 285 379 541 408 467 351***Rural housing assistance grants ...................................................................... 6 6 13 17 20 16 11 3 17***Mutual and self-help housing grants ................................................................ 4 5 6 7 8 7 8 8 7***Food stamp program ........................................................................................ 299 324 412 489 752 1,444 1,547 1,710 1,792***Commodity donations/assistance programs .................................................... 52 64 101 104 121 171 202 210 219***Supplemental feeding programs (WIC and CSFP) ......................................... 371 542 716 928 928 1,123 1,365 1,495 1,577***Child nutrition programs ................................................................................... 2,526 2,862 3,388 3,359 2,875 3,115 3,361 3,480 3,678
Subtotal, Agriculture ......................................................................................... 3,527 4,072 5,093 5,189 5,084 6,417 6,901 7,372 7,642
FEMA:***Emergency food and shelter program ............................................................. ................ ................ ................ ................ ................ 79 58 69 89
Health and Human Services:Program administration ......................................................................................... ................ ................ ................ ................ ................ ................ ................ ................ 6Family support payments to States ..................................................................... 247 252 384 439 459 497 487 577 ................Payments to States from receipts for child support ............................................ * * * 1 1 1 * * ****Family support payments to States ................................................................. 6,369 6,331 6,888 7,694 7,488 7,844 8,311 8,592 9,877***Low income home energy assistance ............................................................. 193 186 1,180 1,653 1,685 1,991 2,024 2,139 2,046***Refugee and entrant assistance ...................................................................... 56 132 338 641 878 504 585 420 422
Subtotal, Health and Human Services ............................................................ 6,865 6,901 8,791 10,428 10,510 10,837 11,408 11,728 12,351
Housing and Urban Development:***Congregate services ......................................................................................... ................ ................ * 1 3 3 4 5 4***Public housing operating fund .......................................................................... 691 654 824 929 1,008 1,542 1,135 1,205 1,181***Low-rent public housing—loans and other expenses ..................................... ................ ................ ................ ................ ................ ................ ................ ................ 1,012
Subtotal, Housing and Urban Development .................................................... 2,412 2,773 3,435 4,034 4,894 5,695 5,750 6,407 7,418
Labor:State unemployment insurance and employment service operations ................ ................ ................ ................ ................ 5 15 4 ................ ................Unemployment trust fund (administrative expenses) .................................. TF 939 952 1,138 1,315 1,417 1,702 1,548 1,576 1,570
Subtotal, Labor ................................................................................................. 939 952 1,138 1,315 1,422 1,718 1,552 1,576 1,570
Social Security Administration(On-budget):***Supplemental security income program ........................................................... 39 41 39 45 20 13 8 ................ ................
Subtotal, Social Security Administration (On-budget) ..................................... 39 41 39 45 20 13 8 ................ ................
Total, 600 ......................................................................................................... 13,782 14,740 18,495 21,013 21,930 24,758 25,678 27,153 29,070
See footnotes at end of table.
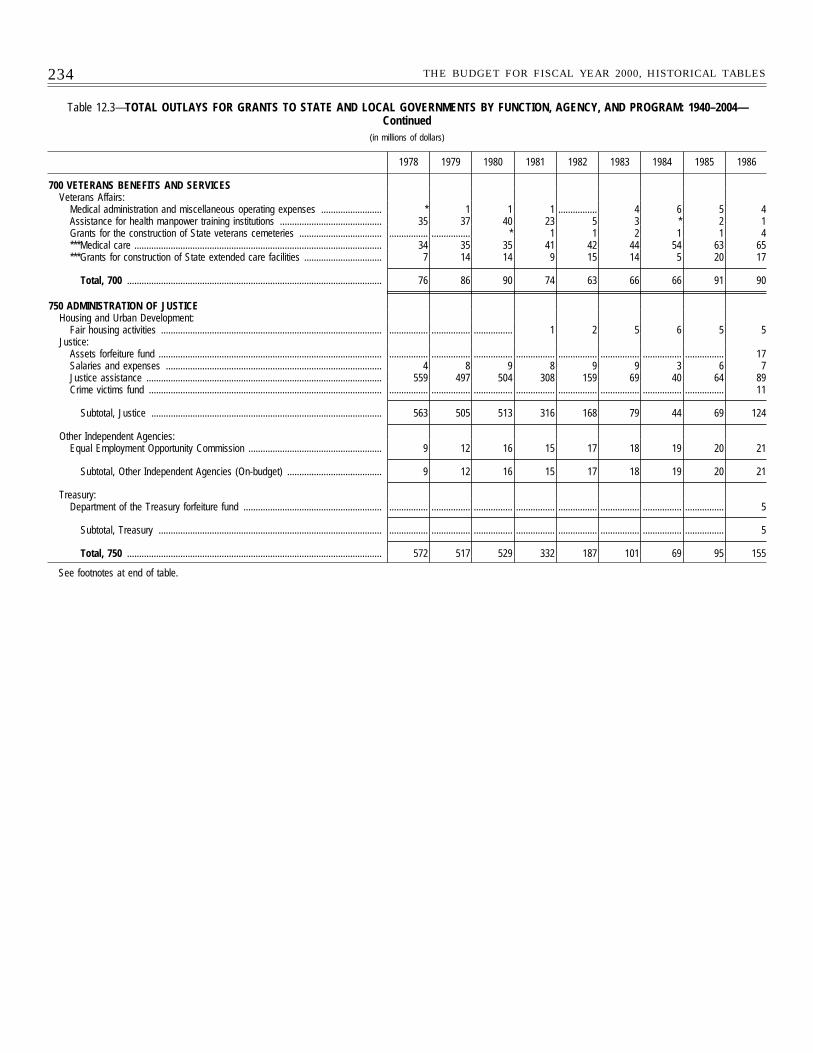
234 THE BUDGET FOR FISCAL YEAR 2000, HISTORICAL TABLES
Table 12.3—TOTAL OUTLAYS FOR GRANTS TO STATE AND LOCAL GOVERNMENTS BY FUNCTION, AGENCY, AND PROGRAM: 1940–2004—Continued
(in millions of dollars)
1978 1979 1980 1981 1982 1983 1984 1985 1986
700 VETERANS BENEFITS AND SERVICESVeterans Affairs:
Medical administration and miscellaneous operating expenses ......................... * 1 1 1 ................ 4 6 5 4Assistance for health manpower training institutions .......................................... 35 37 40 23 5 3 * 2 1Grants for the construction of State veterans cemeteries .................................. ................ ................ * 1 1 2 1 1 4***Medical care ...................................................................................................... 34 35 35 41 42 44 54 63 65***Grants for construction of State extended care facilities ................................ 7 14 14 9 15 14 5 20 17
Total, 700 ......................................................................................................... 76 86 90 74 63 66 66 91 90
750 ADMINISTRATION OF JUSTICEHousing and Urban Development:
Fair housing activities ........................................................................................... ................ ................ ................ 1 2 5 6 5 5Justice:
Assets forfeiture fund ............................................................................................ ................ ................ ................ ................ ................ ................ ................ ................ 17Salaries and expenses ......................................................................................... 4 8 9 8 9 9 3 6 7Justice assistance ................................................................................................. 559 497 504 308 159 69 40 64 89Crime victims fund ................................................................................................ ................ ................ ................ ................ ................ ................ ................ ................ 11
Subtotal, Justice ............................................................................................... 563 505 513 316 168 79 44 69 124
Other Independent Agencies:Equal Employment Opportunity Commission ....................................................... 9 12 16 15 17 18 19 20 21
Subtotal, Other Independent Agencies (On-budget) ....................................... 9 12 16 15 17 18 19 20 21
Treasury:Department of the Treasury forfeiture fund ......................................................... ................ ................ ................ ................ ................ ................ ................ ................ 5
Subtotal, Treasury ............................................................................................ ................ ................ ................ ................ ................ ................ ................ ................ 5
Total, 750 ......................................................................................................... 572 517 529 332 187 101 69 95 155
See footnotes at end of table.
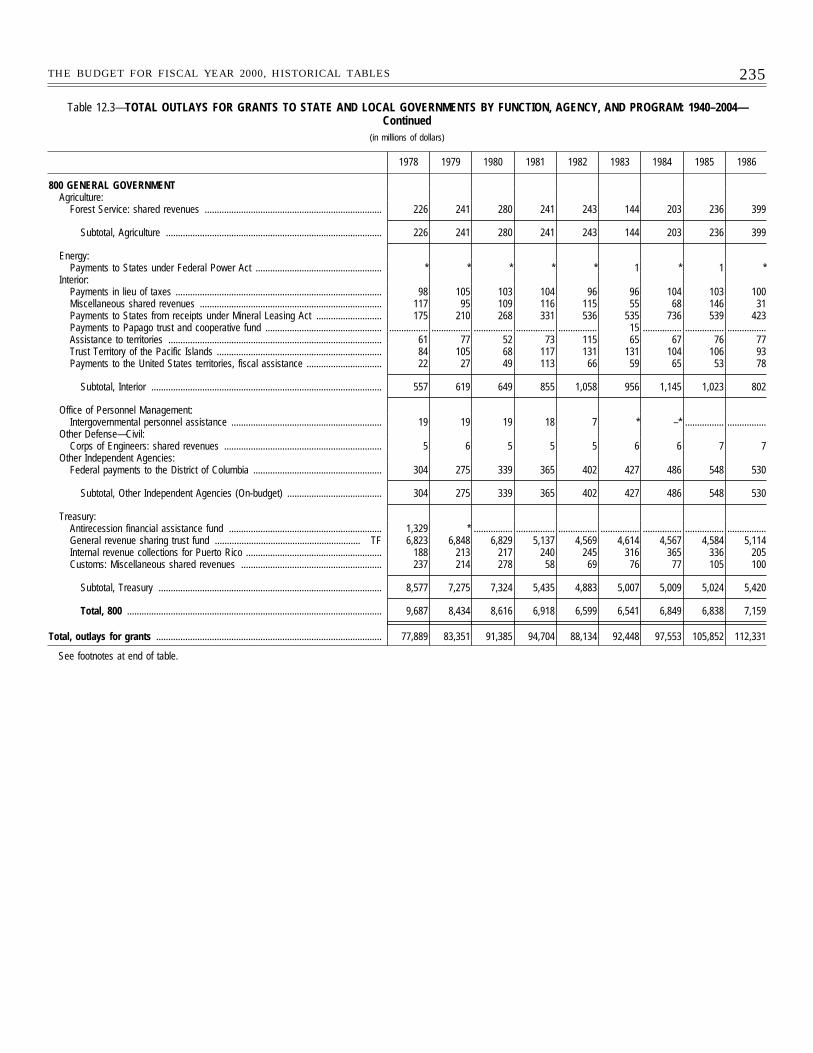
235THE BUDGET FOR FISCAL YEAR 2000, HISTORICAL TABLES
Table 12.3—TOTAL OUTLAYS FOR GRANTS TO STATE AND LOCAL GOVERNMENTS BY FUNCTION, AGENCY, AND PROGRAM: 1940–2004—Continued
(in millions of dollars)
1978 1979 1980 1981 1982 1983 1984 1985 1986
800 GENERAL GOVERNMENTAgriculture:
Forest Service: shared revenues ......................................................................... 226 241 280 241 243 144 203 236 399
Subtotal, Agriculture ......................................................................................... 226 241 280 241 243 144 203 236 399
Energy:Payments to States under Federal Power Act .................................................... * * * * * 1 * 1 *
Interior:Payments in lieu of taxes ..................................................................................... 98 105 103 104 96 96 104 103 100Miscellaneous shared revenues ........................................................................... 117 95 109 116 115 55 68 146 31Payments to States from receipts under Mineral Leasing Act ........................... 175 210 268 331 536 535 736 539 423Payments to Papago trust and cooperative fund ................................................ ................ ................ ................ ................ ................ 15 ................ ................ ................Assistance to territories ........................................................................................ 61 77 52 73 115 65 67 76 77Trust Territory of the Pacific Islands .................................................................... 84 105 68 117 131 131 104 106 93Payments to the United States territories, fiscal assistance ............................... 22 27 49 113 66 59 65 53 78
Subtotal, Interior ............................................................................................... 557 619 649 855 1,058 956 1,145 1,023 802
Office of Personnel Management:Intergovernmental personnel assistance .............................................................. 19 19 19 18 7 * –* ................ ................
Other Defense—Civil:Corps of Engineers: shared revenues ................................................................. 5 6 5 5 5 6 6 7 7
Other Independent Agencies:Federal payments to the District of Columbia ..................................................... 304 275 339 365 402 427 486 548 530
Subtotal, Other Independent Agencies (On-budget) ....................................... 304 275 339 365 402 427 486 548 530
Treasury:Antirecession financial assistance fund ............................................................... 1,329 * ................ ................ ................ ................ ................ ................ ................General revenue sharing trust fund ............................................................ TF 6,823 6,848 6,829 5,137 4,569 4,614 4,567 4,584 5,114Internal revenue collections for Puerto Rico ........................................................ 188 213 217 240 245 316 365 336 205Customs: Miscellaneous shared revenues .......................................................... 237 214 278 58 69 76 77 105 100
Subtotal, Treasury ............................................................................................ 8,577 7,275 7,324 5,435 4,883 5,007 5,009 5,024 5,420
Total, 800 ......................................................................................................... 9,687 8,434 8,616 6,918 6,599 6,541 6,849 6,838 7,159
Total, outlays for grants ............................................................................................. 77,889 83,351 91,385 94,704 88,134 92,448 97,553 105,852 112,331
See footnotes at end of table.
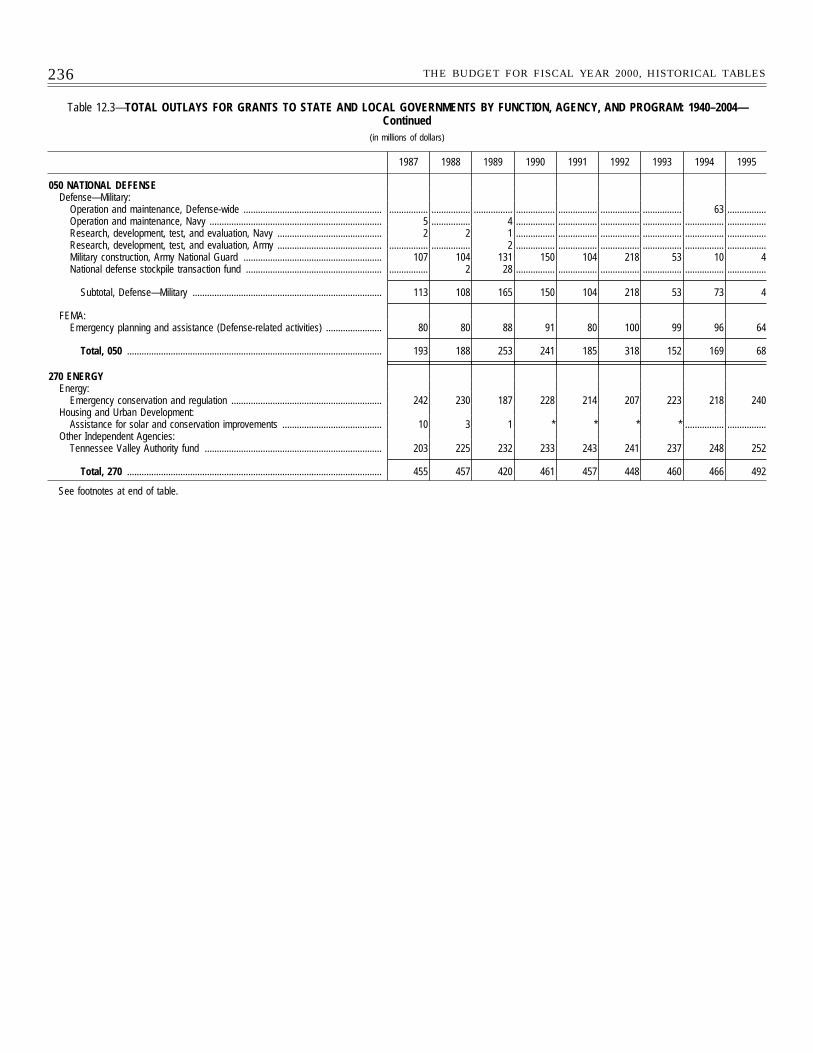
236 THE BUDGET FOR FISCAL YEAR 2000, HISTORICAL TABLES
Table 12.3—TOTAL OUTLAYS FOR GRANTS TO STATE AND LOCAL GOVERNMENTS BY FUNCTION, AGENCY, AND PROGRAM: 1940–2004—Continued
(in millions of dollars)
1987 1988 1989 1990 1991 1992 1993 1994 1995
050 NATIONAL DEFENSEDefense—Military:
Operation and maintenance, Defense-wide ......................................................... ................ ................ ................ ................ ................ ................ ................ 63 ................Operation and maintenance, Navy ....................................................................... 5 ................ 4 ................ ................ ................ ................ ................ ................Research, development, test, and evaluation, Navy ........................................... 2 2 1 ................ ................ ................ ................ ................ ................Research, development, test, and evaluation, Army ........................................... ................ ................ 2 ................ ................ ................ ................ ................ ................Military construction, Army National Guard ......................................................... 107 104 131 150 104 218 53 10 4National defense stockpile transaction fund ........................................................ ................ 2 28 ................ ................ ................ ................ ................ ................
Subtotal, Defense—Military .............................................................................. 113 108 165 150 104 218 53 73 4
FEMA:Emergency planning and assistance (Defense-related activities) ....................... 80 80 88 91 80 100 99 96 64
Total, 050 ......................................................................................................... 193 188 253 241 185 318 152 169 68
270 ENERGYEnergy:
Emergency conservation and regulation .............................................................. 242 230 187 228 214 207 223 218 240Housing and Urban Development:
Assistance for solar and conservation improvements ......................................... 10 3 1 * * * * ................ ................Other Independent Agencies:
Tennessee Valley Authority fund ......................................................................... 203 225 232 233 243 241 237 248 252
Total, 270 ......................................................................................................... 455 457 420 461 457 448 460 466 492
See footnotes at end of table.
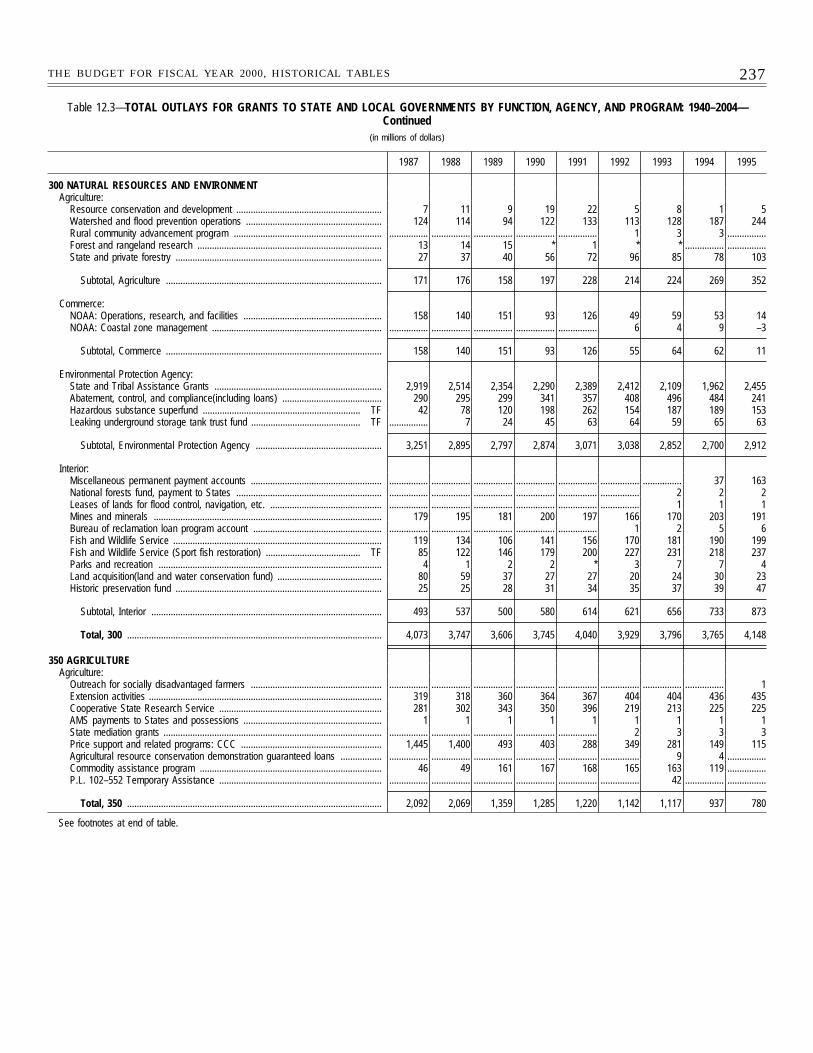
237THE BUDGET FOR FISCAL YEAR 2000, HISTORICAL TABLES
Table 12.3—TOTAL OUTLAYS FOR GRANTS TO STATE AND LOCAL GOVERNMENTS BY FUNCTION, AGENCY, AND PROGRAM: 1940–2004—Continued
(in millions of dollars)
1987 1988 1989 1990 1991 1992 1993 1994 1995
300 NATURAL RESOURCES AND ENVIRONMENTAgriculture:
Resource conservation and development ............................................................ 7 11 9 19 22 5 8 1 5Watershed and flood prevention operations ........................................................ 124 114 94 122 133 113 128 187 244Rural community advancement program ............................................................. ................ ................ ................ ................ ................ 1 3 3 ................Forest and rangeland research ............................................................................ 13 14 15 * 1 * * ................ ................State and private forestry ..................................................................................... 27 37 40 56 72 96 85 78 103
Subtotal, Agriculture ......................................................................................... 171 176 158 197 228 214 224 269 352
Commerce:NOAA: Operations, research, and facilities ......................................................... 158 140 151 93 126 49 59 53 14NOAA: Coastal zone management ...................................................................... ................ ................ ................ ................ ................ 6 4 9 –3
Subtotal, Commerce ......................................................................................... 158 140 151 93 126 55 64 62 11
Environmental Protection Agency:State and Tribal Assistance Grants ..................................................................... 2,919 2,514 2,354 2,290 2,389 2,412 2,109 1,962 2,455Abatement, control, and compliance(including loans) ......................................... 290 295 299 341 357 408 496 484 241Hazardous substance superfund ................................................................. TF 42 78 120 198 262 154 187 189 153Leaking underground storage tank trust fund ............................................. TF ................ 7 24 45 63 64 59 65 63
Subtotal, Environmental Protection Agency .................................................... 3,251 2,895 2,797 2,874 3,071 3,038 2,852 2,700 2,912
Interior:Miscellaneous permanent payment accounts ...................................................... ................ ................ ................ ................ ................ ................ ................ 37 163National forests fund, payment to States ............................................................ ................ ................ ................ ................ ................ ................ 2 2 2Leases of lands for flood control, navigation, etc. .............................................. ................ ................ ................ ................ ................ ................ 1 1 1Mines and minerals .............................................................................................. 179 195 181 200 197 166 170 203 191Bureau of reclamation loan program account ..................................................... ................ ................ ................ ................ ................ 1 2 5 6Fish and Wildlife Service ...................................................................................... 119 134 106 141 156 170 181 190 199Fish and Wildlife Service (Sport fish restoration) ....................................... TF 85 122 146 179 200 227 231 218 237Parks and recreation ............................................................................................ 4 1 2 2 * 3 7 7 4Land acquisition(land and water conservation fund) ........................................... 80 59 37 27 27 20 24 30 23Historic preservation fund ..................................................................................... 25 25 28 31 34 35 37 39 47
Subtotal, Interior ............................................................................................... 493 537 500 580 614 621 656 733 873
Total, 300 ......................................................................................................... 4,073 3,747 3,606 3,745 4,040 3,929 3,796 3,765 4,148
350 AGRICULTUREAgriculture:
Outreach for socially disadvantaged farmers ...................................................... ................ ................ ................ ................ ................ ................ ................ ................ 1Extension activities ................................................................................................ 319 318 360 364 367 404 404 436 435Cooperative State Research Service ................................................................... 281 302 343 350 396 219 213 225 225AMS payments to States and possessions ......................................................... 1 1 1 1 1 1 1 1 1State mediation grants .......................................................................................... ................ ................ ................ ................ ................ 2 3 3 3Price support and related programs: CCC .......................................................... 1,445 1,400 493 403 288 349 281 149 115Agricultural resource conservation demonstration guaranteed loans ................. ................ ................ ................ ................ ................ ................ 9 4 ................Commodity assistance program ........................................................................... 46 49 161 167 168 165 163 119 ................P.L. 102–552 Temporary Assistance ................................................................... ................ ................ ................ ................ ................ ................ 42 ................ ................
Total, 350 ......................................................................................................... 2,092 2,069 1,359 1,285 1,220 1,142 1,117 937 780
See footnotes at end of table.
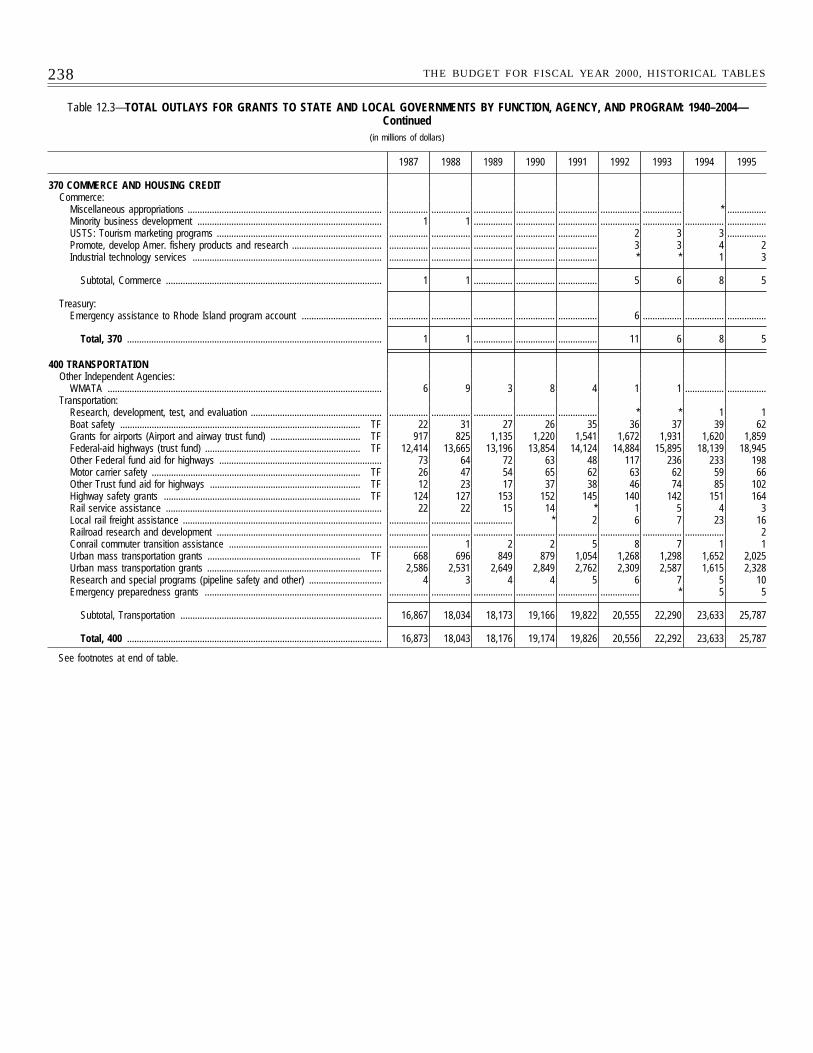
238 THE BUDGET FOR FISCAL YEAR 2000, HISTORICAL TABLES
Table 12.3—TOTAL OUTLAYS FOR GRANTS TO STATE AND LOCAL GOVERNMENTS BY FUNCTION, AGENCY, AND PROGRAM: 1940–2004—Continued
(in millions of dollars)
1987 1988 1989 1990 1991 1992 1993 1994 1995
370 COMMERCE AND HOUSING CREDITCommerce:
Miscellaneous appropriations ................................................................................ ................ ................ ................ ................ ................ ................ ................ * ................Minority business development ............................................................................ 1 1 ................ ................ ................ ................ ................ ................ ................USTS: Tourism marketing programs .................................................................... ................ ................ ................ ................ ................ 2 3 3 ................Promote, develop Amer. fishery products and research ..................................... ................ ................ ................ ................ ................ 3 3 4 2Industrial technology services .............................................................................. ................ ................ ................ ................ ................ * * 1 3
Subtotal, Commerce ......................................................................................... 1 1 ................ ................ ................ 5 6 8 5
Treasury:Emergency assistance to Rhode Island program account ................................. ................ ................ ................ ................ ................ 6 ................ ................ ................
Total, 370 ......................................................................................................... 1 1 ................ ................ ................ 11 6 8 5
400 TRANSPORTATIONOther Independent Agencies:
WMATA ................................................................................................................. 6 9 3 8 4 1 1 ................ ................Transportation:
Research, development, test, and evaluation ...................................................... ................ ................ ................ ................ ................ * * 1 1Boat safety ................................................................................................... TF 22 31 27 26 35 36 37 39 62Grants for airports (Airport and airway trust fund) ..................................... TF 917 825 1,135 1,220 1,541 1,672 1,931 1,620 1,859Federal-aid highways (trust fund) ................................................................ TF 12,414 13,665 13,196 13,854 14,124 14,884 15,895 18,139 18,945Other Federal fund aid for highways ................................................................... 73 64 72 63 48 117 236 233 198Motor carrier safety ...................................................................................... TF 26 47 54 65 62 63 62 59 66Other Trust fund aid for highways .............................................................. TF 12 23 17 37 38 46 74 85 102Highway safety grants ................................................................................. TF 124 127 153 152 145 140 142 151 164Rail service assistance ......................................................................................... 22 22 15 14 * 1 5 4 3Local rail freight assistance .................................................................................. ................ ................ ................ * 2 6 7 23 16Railroad research and development .................................................................... ................ ................ ................ ................ ................ ................ ................ ................ 2Conrail commuter transition assistance ............................................................... ................ 1 2 2 5 8 7 1 1Urban mass transportation grants ............................................................... TF 668 696 849 879 1,054 1,268 1,298 1,652 2,025Urban mass transportation grants ........................................................................ 2,586 2,531 2,649 2,849 2,762 2,309 2,587 1,615 2,328Research and special programs (pipeline safety and other) .............................. 4 3 4 4 5 6 7 5 10Emergency preparedness grants ......................................................................... ................ ................ ................ ................ ................ ................ * 5 5
Subtotal, Transportation ................................................................................... 16,867 18,034 18,173 19,166 19,822 20,555 22,290 23,633 25,787
Total, 400 ......................................................................................................... 16,873 18,043 18,176 19,174 19,826 20,556 22,292 23,633 25,787
See footnotes at end of table.
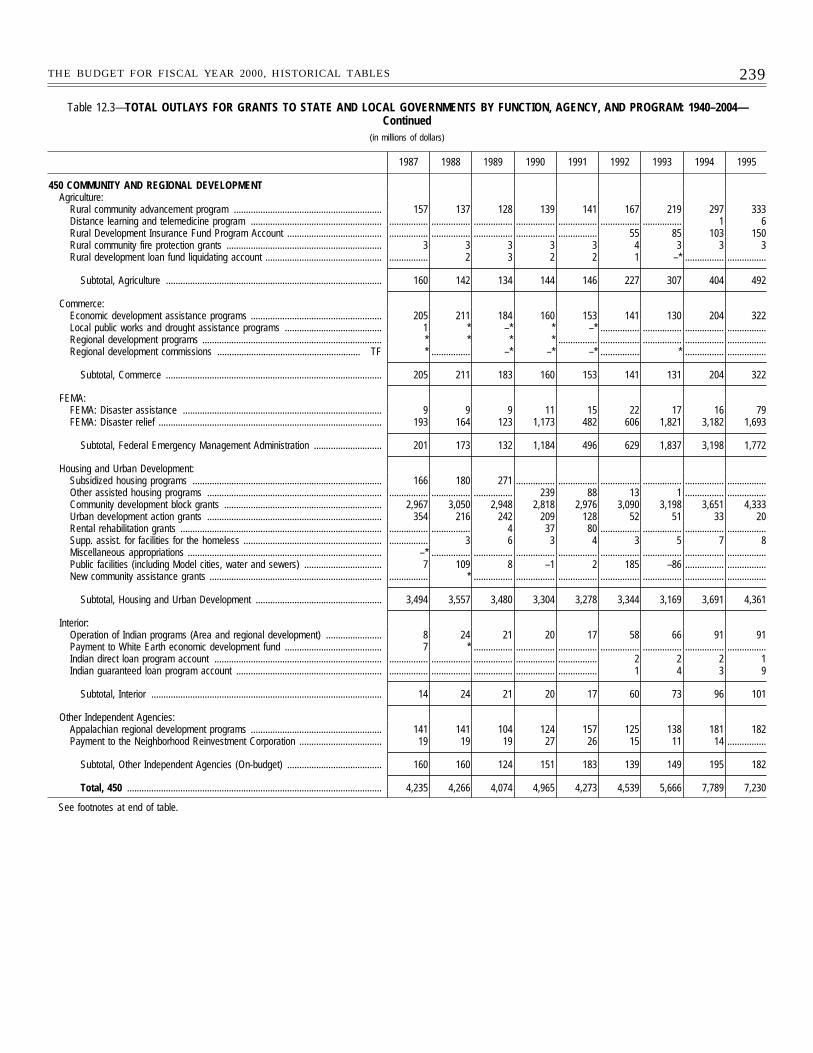
239THE BUDGET FOR FISCAL YEAR 2000, HISTORICAL TABLES
Table 12.3—TOTAL OUTLAYS FOR GRANTS TO STATE AND LOCAL GOVERNMENTS BY FUNCTION, AGENCY, AND PROGRAM: 1940–2004—Continued
(in millions of dollars)
1987 1988 1989 1990 1991 1992 1993 1994 1995
450 COMMUNITY AND REGIONAL DEVELOPMENTAgriculture:
Rural community advancement program ............................................................. 157 137 128 139 141 167 219 297 333Distance learning and telemedicine program ...................................................... ................ ................ ................ ................ ................ ................ ................ 1 6Rural Development Insurance Fund Program Account ....................................... ................ ................ ................ ................ ................ 55 85 103 150Rural community fire protection grants ................................................................ 3 3 3 3 3 4 3 3 3Rural development loan fund liquidating account ................................................ ................ 2 3 2 2 1 –* ................ ................
Subtotal, Agriculture ......................................................................................... 160 142 134 144 146 227 307 404 492
Commerce:Economic development assistance programs ...................................................... 205 211 184 160 153 141 130 204 322Local public works and drought assistance programs ........................................ 1 * –* * –* ................ ................ ................ ................Regional development programs .......................................................................... * * * * ................ ................ ................ ................ ................Regional development commissions ........................................................... TF * ................ –* –* –* ................ * ................ ................
Subtotal, Commerce ......................................................................................... 205 211 183 160 153 141 131 204 322
FEMA:FEMA: Disaster assistance .................................................................................. 9 9 9 11 15 22 17 16 79FEMA: Disaster relief ............................................................................................ 193 164 123 1,173 482 606 1,821 3,182 1,693
Subtotal, Federal Emergency Management Administration ............................ 201 173 132 1,184 496 629 1,837 3,198 1,772
Housing and Urban Development:Subsidized housing programs .............................................................................. 166 180 271 ................ ................ ................ ................ ................ ................Other assisted housing programs ........................................................................ ................ ................ ................ 239 88 13 1 ................ ................Community development block grants ................................................................. 2,967 3,050 2,948 2,818 2,976 3,090 3,198 3,651 4,333Urban development action grants ........................................................................ 354 216 242 209 128 52 51 33 20Rental rehabilitation grants ................................................................................... ................ ................ 4 37 80 ................ ................ ................ ................Supp. assist. for facilities for the homeless ......................................................... ................ 3 6 3 4 3 5 7 8Miscellaneous appropriations ................................................................................ –* ................ ................ ................ ................ ................ ................ ................ ................Public facilities (including Model cities, water and sewers) ................................ 7 109 8 –1 2 185 –86 ................ ................New community assistance grants ....................................................................... ................ * ................ ................ ................ ................ ................ ................ ................
Subtotal, Housing and Urban Development .................................................... 3,494 3,557 3,480 3,304 3,278 3,344 3,169 3,691 4,361
Interior:Operation of Indian programs (Area and regional development) ....................... 8 24 21 20 17 58 66 91 91Payment to White Earth economic development fund ........................................ 7 * ................ ................ ................ ................ ................ ................ ................Indian direct loan program account ..................................................................... ................ ................ ................ ................ ................ 2 2 2 1Indian guaranteed loan program account ............................................................ ................ ................ ................ ................ ................ 1 4 3 9
Subtotal, Interior ............................................................................................... 14 24 21 20 17 60 73 96 101
Other Independent Agencies:Appalachian regional development programs ...................................................... 141 141 104 124 157 125 138 181 182Payment to the Neighborhood Reinvestment Corporation .................................. 19 19 19 27 26 15 11 14 ................
Subtotal, Other Independent Agencies (On-budget) ....................................... 160 160 124 151 183 139 149 195 182
Total, 450 ......................................................................................................... 4,235 4,266 4,074 4,965 4,273 4,539 5,666 7,789 7,230
See footnotes at end of table.
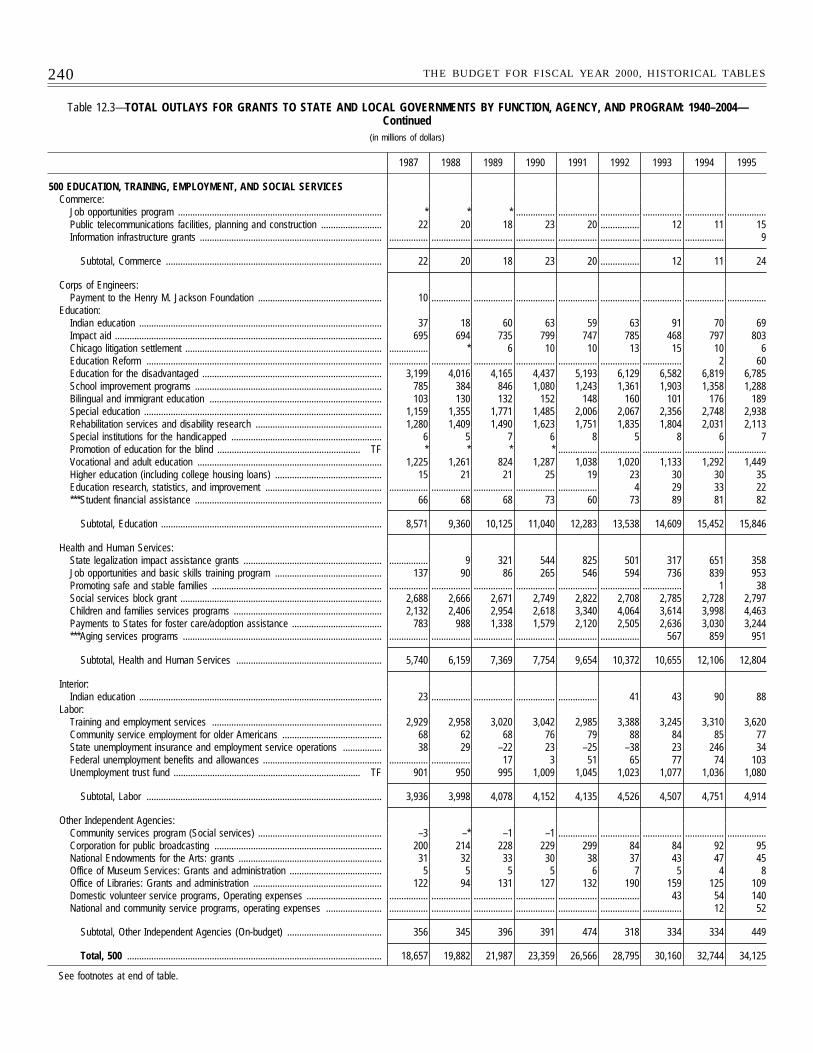
240 THE BUDGET FOR FISCAL YEAR 2000, HISTORICAL TABLES
Table 12.3—TOTAL OUTLAYS FOR GRANTS TO STATE AND LOCAL GOVERNMENTS BY FUNCTION, AGENCY, AND PROGRAM: 1940–2004—Continued
(in millions of dollars)
1987 1988 1989 1990 1991 1992 1993 1994 1995
500 EDUCATION, TRAINING, EMPLOYMENT, AND SOCIAL SERVICESCommerce:
Job opportunities program .................................................................................... * * * ................ ................ ................ ................ ................ ................Public telecommunications facilities, planning and construction ......................... 22 20 18 23 20 ................ 12 11 15Information infrastructure grants ........................................................................... ................ ................ ................ ................ ................ ................ ................ ................ 9
Subtotal, Commerce ......................................................................................... 22 20 18 23 20 ................ 12 11 24
Corps of Engineers:Payment to the Henry M. Jackson Foundation ................................................... 10 ................ ................ ................ ................ ................ ................ ................ ................
Education:Indian education .................................................................................................... 37 18 60 63 59 63 91 70 69Impact aid .............................................................................................................. 695 694 735 799 747 785 468 797 803Chicago litigation settlement ................................................................................. ................ * 6 10 10 13 15 10 6Education Reform ................................................................................................. ................ ................ ................ ................ ................ ................ ................ 2 60Education for the disadvantaged .......................................................................... 3,199 4,016 4,165 4,437 5,193 6,129 6,582 6,819 6,785School improvement programs ............................................................................. 785 384 846 1,080 1,243 1,361 1,903 1,358 1,288Bilingual and immigrant education ....................................................................... 103 130 132 152 148 160 101 176 189Special education .................................................................................................. 1,159 1,355 1,771 1,485 2,006 2,067 2,356 2,748 2,938Rehabilitation services and disability research .................................................... 1,280 1,409 1,490 1,623 1,751 1,835 1,804 2,031 2,113Special institutions for the handicapped .............................................................. 6 5 7 6 8 5 8 6 7Promotion of education for the blind ........................................................... TF * * * * ................ ................ ................ ................ ................Vocational and adult education ............................................................................ 1,225 1,261 824 1,287 1,038 1,020 1,133 1,292 1,449Higher education (including college housing loans) ............................................ 15 21 21 25 19 23 30 30 35Education research, statistics, and improvement ................................................ ................ ................ ................ ................ ................ 4 29 33 22***Student financial assistance ............................................................................. 66 68 68 73 60 73 89 81 82
Subtotal, Education ........................................................................................... 8,571 9,360 10,125 11,040 12,283 13,538 14,609 15,452 15,846
Health and Human Services:State legalization impact assistance grants ......................................................... ................ 9 321 544 825 501 317 651 358Job opportunities and basic skills training program ............................................ 137 90 86 265 546 594 736 839 953Promoting safe and stable families ...................................................................... ................ ................ ................ ................ ................ ................ ................ 1 38Social services block grant ................................................................................... 2,688 2,666 2,671 2,749 2,822 2,708 2,785 2,728 2,797Children and families services programs ............................................................. 2,132 2,406 2,954 2,618 3,340 4,064 3,614 3,998 4,463Payments to States for foster care/adoption assistance ..................................... 783 988 1,338 1,579 2,120 2,505 2,636 3,030 3,244***Aging services programs .................................................................................. ................ ................ ................ ................ ................ ................ 567 859 951
Subtotal, Health and Human Services ............................................................ 5,740 6,159 7,369 7,754 9,654 10,372 10,655 12,106 12,804
Interior:Indian education .................................................................................................... 23 ................ ................ ................ ................ 41 43 90 88
Labor:Training and employment services ...................................................................... 2,929 2,958 3,020 3,042 2,985 3,388 3,245 3,310 3,620Community service employment for older Americans ......................................... 68 62 68 76 79 88 84 85 77State unemployment insurance and employment service operations ................ 38 29 –22 23 –25 –38 23 246 34Federal unemployment benefits and allowances ................................................. ................ ................ 17 3 51 65 77 74 103Unemployment trust fund ............................................................................. TF 901 950 995 1,009 1,045 1,023 1,077 1,036 1,080
Subtotal, Labor ................................................................................................. 3,936 3,998 4,078 4,152 4,135 4,526 4,507 4,751 4,914
Other Independent Agencies:Community services program (Social services) ................................................... –3 –* –1 –1 ................ ................ ................ ................ ................Corporation for public broadcasting ..................................................................... 200 214 228 229 299 84 84 92 95National Endowments for the Arts: grants ........................................................... 31 32 33 30 38 37 43 47 45Office of Museum Services: Grants and administration ...................................... 5 5 5 5 6 7 5 4 8Office of Libraries: Grants and administration ..................................................... 122 94 131 127 132 190 159 125 109Domestic volunteer service programs, Operating expenses ............................... ................ ................ ................ ................ ................ ................ 43 54 140National and community service programs, operating expenses ....................... ................ ................ ................ ................ ................ ................ ................ 12 52
Subtotal, Other Independent Agencies (On-budget) ....................................... 356 345 396 391 474 318 334 334 449
Total, 500 ......................................................................................................... 18,657 19,882 21,987 23,359 26,566 28,795 30,160 32,744 34,125
See footnotes at end of table.
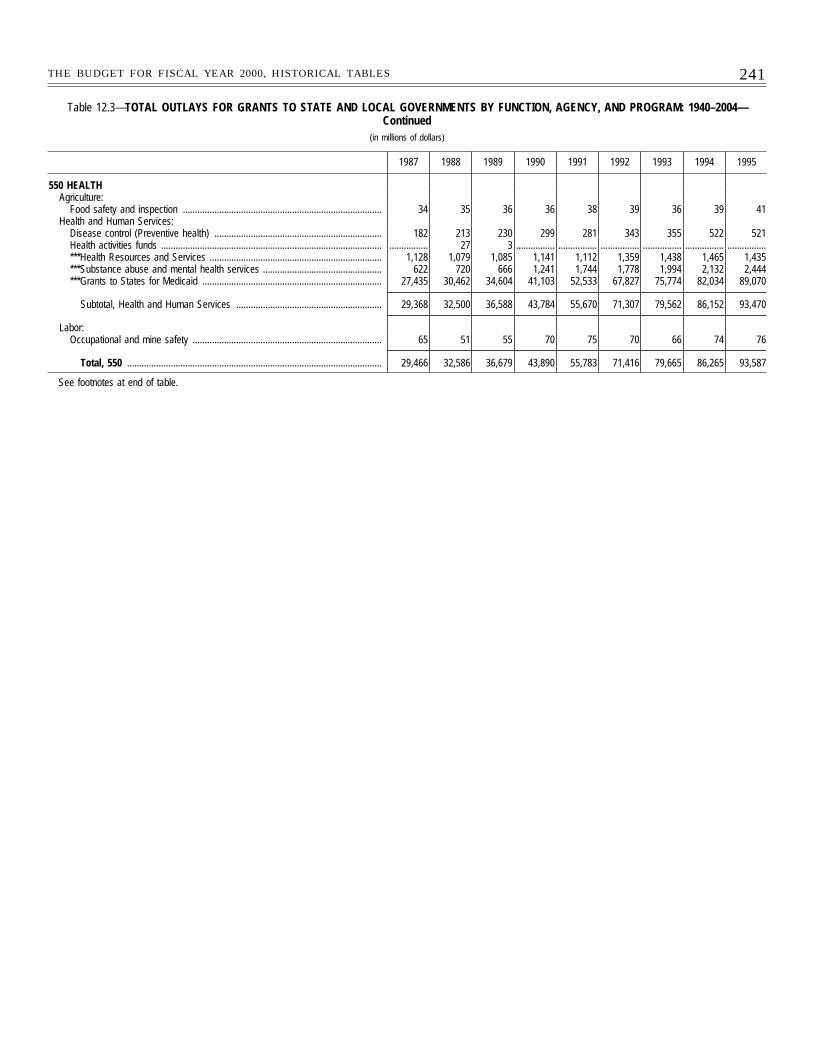
241THE BUDGET FOR FISCAL YEAR 2000, HISTORICAL TABLES
Table 12.3—TOTAL OUTLAYS FOR GRANTS TO STATE AND LOCAL GOVERNMENTS BY FUNCTION, AGENCY, AND PROGRAM: 1940–2004—Continued
(in millions of dollars)
1987 1988 1989 1990 1991 1992 1993 1994 1995
550 HEALTHAgriculture:
Food safety and inspection .................................................................................. 34 35 36 36 38 39 36 39 41Health and Human Services:
Disease control (Preventive health) ..................................................................... 182 213 230 299 281 343 355 522 521Health activities funds ........................................................................................... ................ 27 3 ................ ................ ................ ................ ................ ................***Health Resources and Services ....................................................................... 1,128 1,079 1,085 1,141 1,112 1,359 1,438 1,465 1,435***Substance abuse and mental health services ................................................. 622 720 666 1,241 1,744 1,778 1,994 2,132 2,444***Grants to States for Medicaid .......................................................................... 27,435 30,462 34,604 41,103 52,533 67,827 75,774 82,034 89,070
Subtotal, Health and Human Services ............................................................ 29,368 32,500 36,588 43,784 55,670 71,307 79,562 86,152 93,470
Labor:Occupational and mine safety .............................................................................. 65 51 55 70 75 70 66 74 76
Total, 550 ......................................................................................................... 29,466 32,586 36,679 43,890 55,783 71,416 79,665 86,265 93,587
See footnotes at end of table.
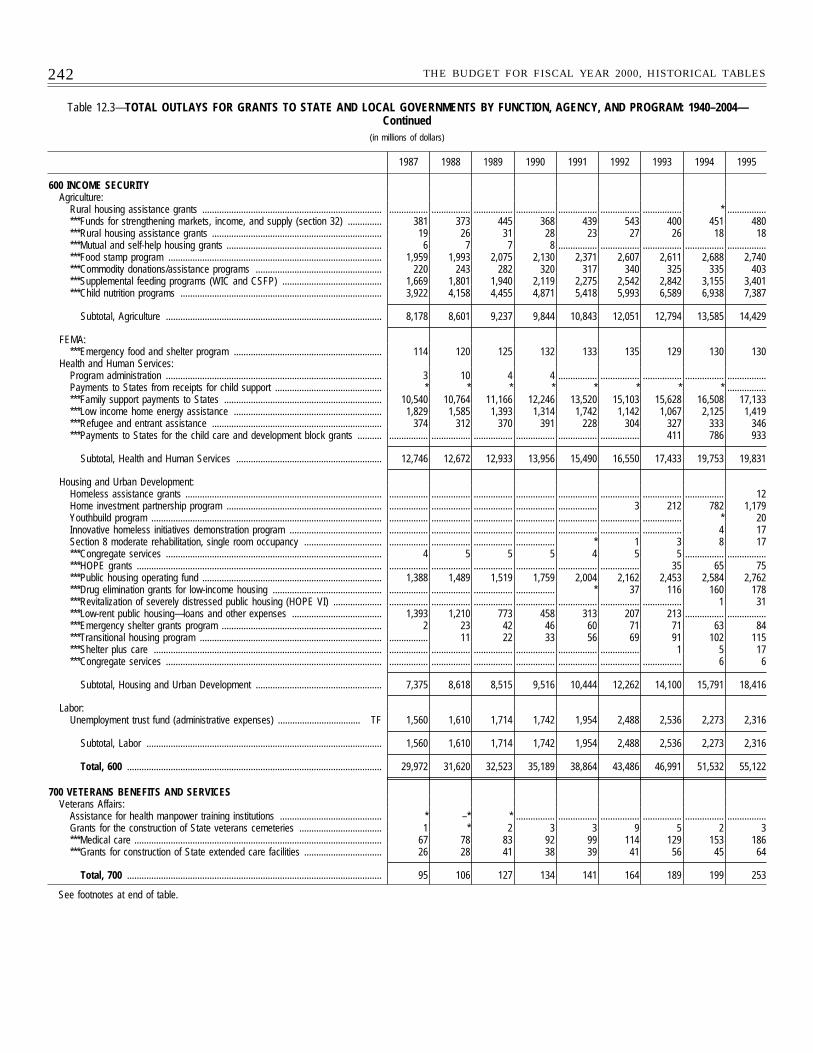
242 THE BUDGET FOR FISCAL YEAR 2000, HISTORICAL TABLES
Table 12.3—TOTAL OUTLAYS FOR GRANTS TO STATE AND LOCAL GOVERNMENTS BY FUNCTION, AGENCY, AND PROGRAM: 1940–2004—Continued
(in millions of dollars)
1987 1988 1989 1990 1991 1992 1993 1994 1995
600 INCOME SECURITYAgriculture:
Rural housing assistance grants .......................................................................... ................ ................ ................ ................ ................ ................ ................ * ................***Funds for strengthening markets, income, and supply (section 32) .............. 381 373 445 368 439 543 400 451 480***Rural housing assistance grants ...................................................................... 19 26 31 28 23 27 26 18 18***Mutual and self-help housing grants ................................................................ 6 7 7 8 ................ ................ ................ ................ ................***Food stamp program ........................................................................................ 1,959 1,993 2,075 2,130 2,371 2,607 2,611 2,688 2,740***Commodity donations/assistance programs .................................................... 220 243 282 320 317 340 325 335 403***Supplemental feeding programs (WIC and CSFP) ......................................... 1,669 1,801 1,940 2,119 2,275 2,542 2,842 3,155 3,401***Child nutrition programs ................................................................................... 3,922 4,158 4,455 4,871 5,418 5,993 6,589 6,938 7,387
Subtotal, Agriculture ......................................................................................... 8,178 8,601 9,237 9,844 10,843 12,051 12,794 13,585 14,429
FEMA:***Emergency food and shelter program ............................................................. 114 120 125 132 133 135 129 130 130
Health and Human Services:Program administration ......................................................................................... 3 10 4 4 ................ ................ ................ ................ ................Payments to States from receipts for child support ............................................ * * * * * * * * ................***Family support payments to States ................................................................. 10,540 10,764 11,166 12,246 13,520 15,103 15,628 16,508 17,133***Low income home energy assistance ............................................................. 1,829 1,585 1,393 1,314 1,742 1,142 1,067 2,125 1,419***Refugee and entrant assistance ...................................................................... 374 312 370 391 228 304 327 333 346***Payments to States for the child care and development block grants .......... ................ ................ ................ ................ ................ ................ 411 786 933
Subtotal, Health and Human Services ............................................................ 12,746 12,672 12,933 13,956 15,490 16,550 17,433 19,753 19,831
Housing and Urban Development:Homeless assistance grants ................................................................................. ................ ................ ................ ................ ................ ................ ................ ................ 12Home investment partnership program ................................................................ ................ ................ ................ ................ ................ 3 212 782 1,179Youthbuild program ............................................................................................... ................ ................ ................ ................ ................ ................ ................ * 20Innovative homeless initiatives demonstration program ...................................... ................ ................ ................ ................ ................ ................ ................ 4 17Section 8 moderate rehabilitation, single room occupancy ................................ ................ ................ ................ ................ * 1 3 8 17***Congregate services ......................................................................................... 4 5 5 5 4 5 5 ................ ................***HOPE grants ..................................................................................................... ................ ................ ................ ................ ................ ................ 35 65 75***Public housing operating fund .......................................................................... 1,388 1,489 1,519 1,759 2,004 2,162 2,453 2,584 2,762***Drug elimination grants for low-income housing ............................................. ................ ................ ................ ................ * 37 116 160 178***Revitalization of severely distressed public housing (HOPE VI) .................... ................ ................ ................ ................ ................ ................ ................ 1 31***Low-rent public housing—loans and other expenses ..................................... 1,393 1,210 773 458 313 207 213 ................ ................***Emergency shelter grants program .................................................................. 2 23 42 46 60 71 71 63 84***Transitional housing program ........................................................................... ................ 11 22 33 56 69 91 102 115***Shelter plus care .............................................................................................. ................ ................ ................ ................ ................ ................ 1 5 17***Congregate services ......................................................................................... ................ ................ ................ ................ ................ ................ ................ 6 6
Subtotal, Housing and Urban Development .................................................... 7,375 8,618 8,515 9,516 10,444 12,262 14,100 15,791 18,416
Labor:Unemployment trust fund (administrative expenses) .................................. TF 1,560 1,610 1,714 1,742 1,954 2,488 2,536 2,273 2,316
Subtotal, Labor ................................................................................................. 1,560 1,610 1,714 1,742 1,954 2,488 2,536 2,273 2,316
Total, 600 ......................................................................................................... 29,972 31,620 32,523 35,189 38,864 43,486 46,991 51,532 55,122
700 VETERANS BENEFITS AND SERVICESVeterans Affairs:
Assistance for health manpower training institutions .......................................... * –* * ................ ................ ................ ................ ................ ................Grants for the construction of State veterans cemeteries .................................. 1 * 2 3 3 9 5 2 3***Medical care ...................................................................................................... 67 78 83 92 99 114 129 153 186***Grants for construction of State extended care facilities ................................ 26 28 41 38 39 41 56 45 64
Total, 700 ......................................................................................................... 95 106 127 134 141 164 189 199 253
See footnotes at end of table.
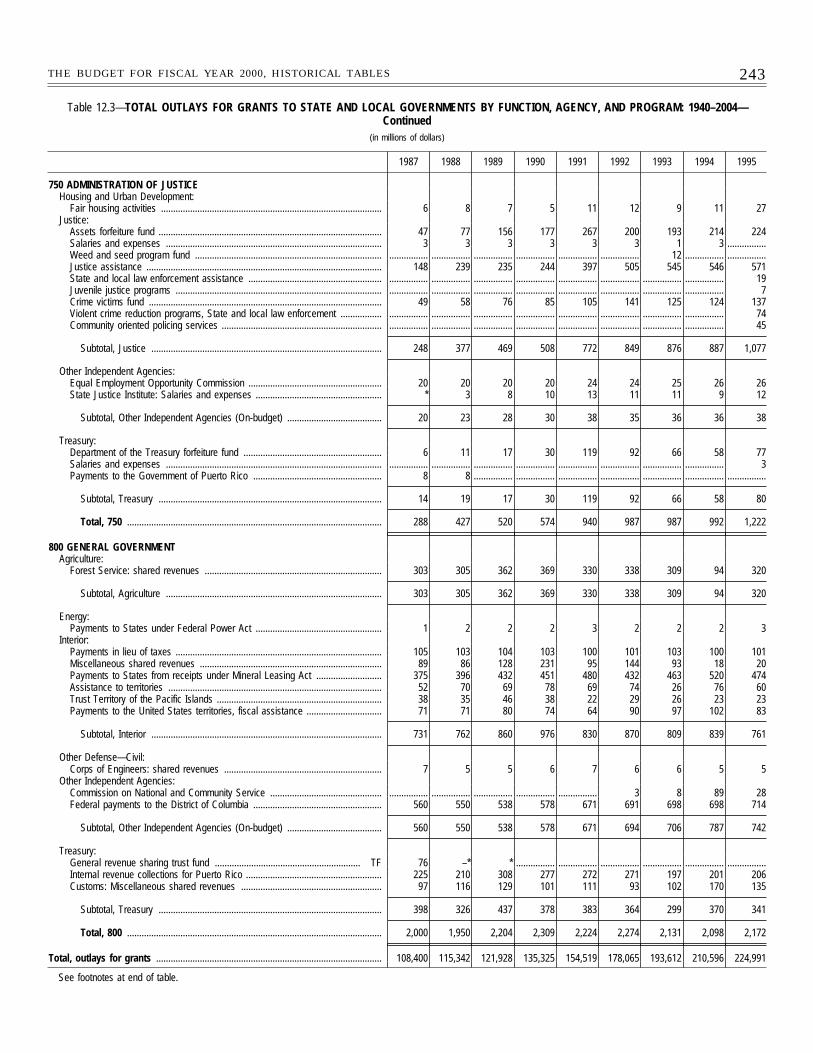
243THE BUDGET FOR FISCAL YEAR 2000, HISTORICAL TABLES
Table 12.3—TOTAL OUTLAYS FOR GRANTS TO STATE AND LOCAL GOVERNMENTS BY FUNCTION, AGENCY, AND PROGRAM: 1940–2004—Continued
(in millions of dollars)
1987 1988 1989 1990 1991 1992 1993 1994 1995
750 ADMINISTRATION OF JUSTICEHousing and Urban Development:
Fair housing activities ........................................................................................... 6 8 7 5 11 12 9 11 27Justice:
Assets forfeiture fund ............................................................................................ 47 77 156 177 267 200 193 214 224Salaries and expenses ......................................................................................... 3 3 3 3 3 3 1 3 ................Weed and seed program fund ............................................................................. ................ ................ ................ ................ ................ ................ 12 ................ ................Justice assistance ................................................................................................. 148 239 235 244 397 505 545 546 571State and local law enforcement assistance ....................................................... ................ ................ ................ ................ ................ ................ ................ ................ 19Juvenile justice programs ..................................................................................... ................ ................ ................ ................ ................ ................ ................ ................ 7Crime victims fund ................................................................................................ 49 58 76 85 105 141 125 124 137Violent crime reduction programs, State and local law enforcement ................. ................ ................ ................ ................ ................ ................ ................ ................ 74Community oriented policing services .................................................................. ................ ................ ................ ................ ................ ................ ................ ................ 45
Subtotal, Justice ............................................................................................... 248 377 469 508 772 849 876 887 1,077
Other Independent Agencies:Equal Employment Opportunity Commission ....................................................... 20 20 20 20 24 24 25 26 26State Justice Institute: Salaries and expenses .................................................... * 3 8 10 13 11 11 9 12
Subtotal, Other Independent Agencies (On-budget) ....................................... 20 23 28 30 38 35 36 36 38
Treasury:Department of the Treasury forfeiture fund ......................................................... 6 11 17 30 119 92 66 58 77Salaries and expenses ......................................................................................... ................ ................ ................ ................ ................ ................ ................ ................ 3Payments to the Government of Puerto Rico ..................................................... 8 8 ................ ................ ................ ................ ................ ................ ................
Subtotal, Treasury ............................................................................................ 14 19 17 30 119 92 66 58 80
Total, 750 ......................................................................................................... 288 427 520 574 940 987 987 992 1,222
800 GENERAL GOVERNMENTAgriculture:
Forest Service: shared revenues ......................................................................... 303 305 362 369 330 338 309 94 320
Subtotal, Agriculture ......................................................................................... 303 305 362 369 330 338 309 94 320
Energy:Payments to States under Federal Power Act .................................................... 1 2 2 2 3 2 2 2 3
Interior:Payments in lieu of taxes ..................................................................................... 105 103 104 103 100 101 103 100 101Miscellaneous shared revenues ........................................................................... 89 86 128 231 95 144 93 18 20Payments to States from receipts under Mineral Leasing Act ........................... 375 396 432 451 480 432 463 520 474Assistance to territories ........................................................................................ 52 70 69 78 69 74 26 76 60Trust Territory of the Pacific Islands .................................................................... 38 35 46 38 22 29 26 23 23Payments to the United States territories, fiscal assistance ............................... 71 71 80 74 64 90 97 102 83
Subtotal, Interior ............................................................................................... 731 762 860 976 830 870 809 839 761
Other Defense—Civil:Corps of Engineers: shared revenues ................................................................. 7 5 5 6 7 6 6 5 5
Other Independent Agencies:Commission on National and Community Service .............................................. ................ ................ ................ ................ ................ 3 8 89 28Federal payments to the District of Columbia ..................................................... 560 550 538 578 671 691 698 698 714
Subtotal, Other Independent Agencies (On-budget) ....................................... 560 550 538 578 671 694 706 787 742
Treasury:General revenue sharing trust fund ............................................................ TF 76 –* * ................ ................ ................ ................ ................ ................Internal revenue collections for Puerto Rico ........................................................ 225 210 308 277 272 271 197 201 206Customs: Miscellaneous shared revenues .......................................................... 97 116 129 101 111 93 102 170 135
Subtotal, Treasury ............................................................................................ 398 326 437 378 383 364 299 370 341
Total, 800 ......................................................................................................... 2,000 1,950 2,204 2,309 2,224 2,274 2,131 2,098 2,172
Total, outlays for grants ............................................................................................. 108,400 115,342 121,928 135,325 154,519 178,065 193,612 210,596 224,991
See footnotes at end of table.
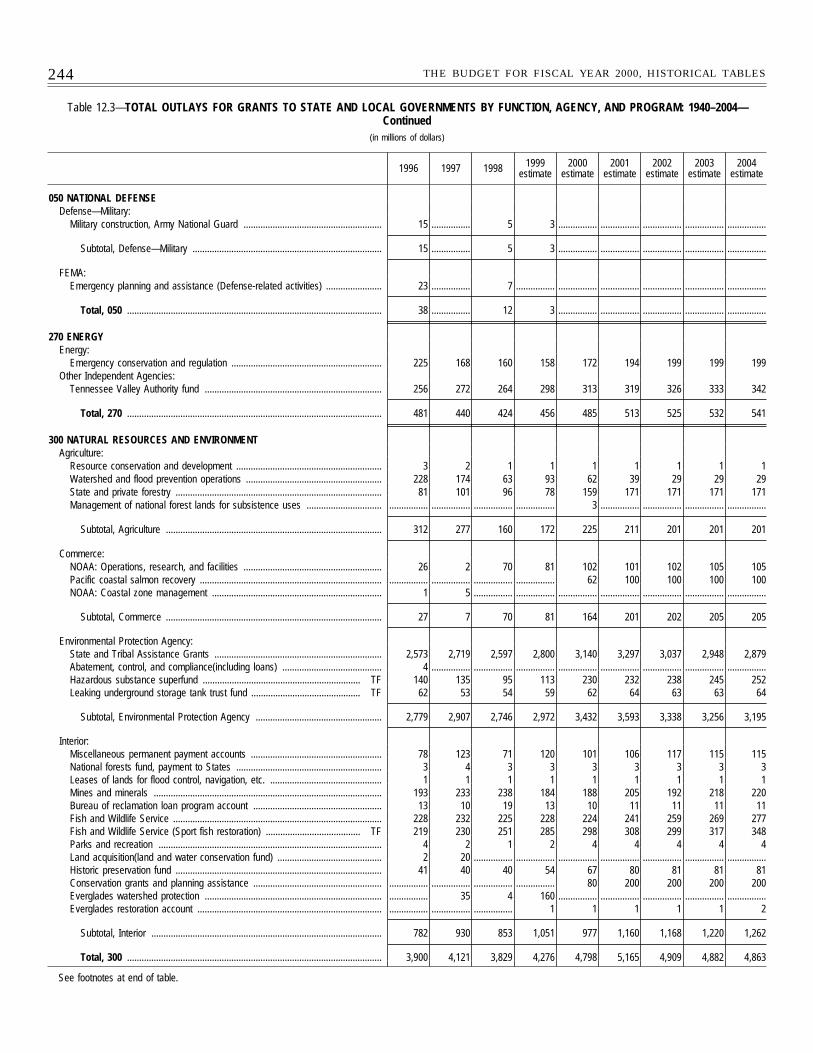
244 THE BUDGET FOR FISCAL YEAR 2000, HISTORICAL TABLES
Table 12.3—TOTAL OUTLAYS FOR GRANTS TO STATE AND LOCAL GOVERNMENTS BY FUNCTION, AGENCY, AND PROGRAM: 1940–2004—Continued
(in millions of dollars)
1996 1997 1998 1999estimate
2000estimate
2001estimate
2002estimate
2003estimate
2004estimate
050 NATIONAL DEFENSEDefense—Military:
Military construction, Army National Guard ......................................................... 15 ................ 5 3 ................ ................ ................ ................ ................
Subtotal, Defense—Military .............................................................................. 15 ................ 5 3 ................ ................ ................ ................ ................
FEMA:Emergency planning and assistance (Defense-related activities) ....................... 23 ................ 7 ................ ................ ................ ................ ................ ................
Total, 050 ......................................................................................................... 38 ................ 12 3 ................ ................ ................ ................ ................
270 ENERGYEnergy:
Emergency conservation and regulation .............................................................. 225 168 160 158 172 194 199 199 199Other Independent Agencies:
Tennessee Valley Authority fund ......................................................................... 256 272 264 298 313 319 326 333 342
Total, 270 ......................................................................................................... 481 440 424 456 485 513 525 532 541
300 NATURAL RESOURCES AND ENVIRONMENTAgriculture:
Resource conservation and development ............................................................ 3 2 1 1 1 1 1 1 1Watershed and flood prevention operations ........................................................ 228 174 63 93 62 39 29 29 29State and private forestry ..................................................................................... 81 101 96 78 159 171 171 171 171Management of national forest lands for subsistence uses ............................... ................ ................ ................ ................ 3 ................ ................ ................ ................
Subtotal, Agriculture ......................................................................................... 312 277 160 172 225 211 201 201 201
Commerce:NOAA: Operations, research, and facilities ......................................................... 26 2 70 81 102 101 102 105 105Pacific coastal salmon recovery ........................................................................... ................ ................ ................ ................ 62 100 100 100 100NOAA: Coastal zone management ...................................................................... 1 5 ................ ................ ................ ................ ................ ................ ................
Subtotal, Commerce ......................................................................................... 27 7 70 81 164 201 202 205 205
Environmental Protection Agency:State and Tribal Assistance Grants ..................................................................... 2,573 2,719 2,597 2,800 3,140 3,297 3,037 2,948 2,879Abatement, control, and compliance(including loans) ......................................... 4 ................ ................ ................ ................ ................ ................ ................ ................Hazardous substance superfund ................................................................. TF 140 135 95 113 230 232 238 245 252Leaking underground storage tank trust fund ............................................. TF 62 53 54 59 62 64 63 63 64
Subtotal, Environmental Protection Agency .................................................... 2,779 2,907 2,746 2,972 3,432 3,593 3,338 3,256 3,195
Interior:Miscellaneous permanent payment accounts ...................................................... 78 123 71 120 101 106 117 115 115National forests fund, payment to States ............................................................ 3 4 3 3 3 3 3 3 3Leases of lands for flood control, navigation, etc. .............................................. 1 1 1 1 1 1 1 1 1Mines and minerals .............................................................................................. 193 233 238 184 188 205 192 218 220Bureau of reclamation loan program account ..................................................... 13 10 19 13 10 11 11 11 11Fish and Wildlife Service ...................................................................................... 228 232 225 228 224 241 259 269 277Fish and Wildlife Service (Sport fish restoration) ....................................... TF 219 230 251 285 298 308 299 317 348Parks and recreation ............................................................................................ 4 2 1 2 4 4 4 4 4Land acquisition(land and water conservation fund) ........................................... 2 20 ................ ................ ................ ................ ................ ................ ................Historic preservation fund ..................................................................................... 41 40 40 54 67 80 81 81 81Conservation grants and planning assistance ..................................................... ................ ................ ................ ................ 80 200 200 200 200Everglades watershed protection ......................................................................... ................ 35 4 160 ................ ................ ................ ................ ................Everglades restoration account ............................................................................ ................ ................ ................ 1 1 1 1 1 2
Subtotal, Interior ............................................................................................... 782 930 853 1,051 977 1,160 1,168 1,220 1,262
Total, 300 ......................................................................................................... 3,900 4,121 3,829 4,276 4,798 5,165 4,909 4,882 4,863
See footnotes at end of table.
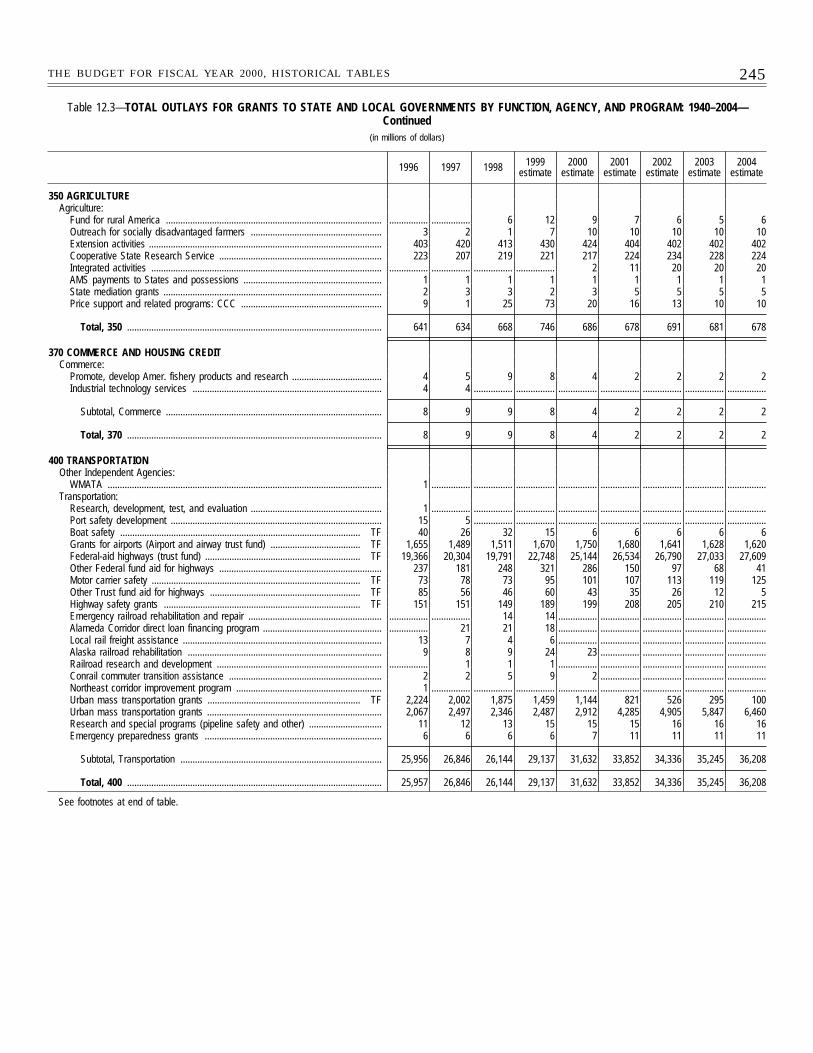
245THE BUDGET FOR FISCAL YEAR 2000, HISTORICAL TABLES
Table 12.3—TOTAL OUTLAYS FOR GRANTS TO STATE AND LOCAL GOVERNMENTS BY FUNCTION, AGENCY, AND PROGRAM: 1940–2004—Continued
(in millions of dollars)
1996 1997 1998 1999estimate
2000estimate
2001estimate
2002estimate
2003estimate
2004estimate
350 AGRICULTUREAgriculture:
Fund for rural America ......................................................................................... ................ ................ 6 12 9 7 6 5 6Outreach for socially disadvantaged farmers ...................................................... 3 2 1 7 10 10 10 10 10Extension activities ................................................................................................ 403 420 413 430 424 404 402 402 402Cooperative State Research Service ................................................................... 223 207 219 221 217 224 234 228 224Integrated activities ............................................................................................... ................ ................ ................ ................ 2 11 20 20 20AMS payments to States and possessions ......................................................... 1 1 1 1 1 1 1 1 1State mediation grants .......................................................................................... 2 3 3 2 3 5 5 5 5Price support and related programs: CCC .......................................................... 9 1 25 73 20 16 13 10 10
Total, 350 ......................................................................................................... 641 634 668 746 686 678 691 681 678
370 COMMERCE AND HOUSING CREDITCommerce:
Promote, develop Amer. fishery products and research ..................................... 4 5 9 8 4 2 2 2 2Industrial technology services .............................................................................. 4 4 ................ ................ ................ ................ ................ ................ ................
Subtotal, Commerce ......................................................................................... 8 9 9 8 4 2 2 2 2
Total, 370 ......................................................................................................... 8 9 9 8 4 2 2 2 2
400 TRANSPORTATIONOther Independent Agencies:
WMATA ................................................................................................................. 1 ................ ................ ................ ................ ................ ................ ................ ................Transportation:
Research, development, test, and evaluation ...................................................... 1 ................ ................ ................ ................ ................ ................ ................ ................Port safety development ....................................................................................... 15 5 ................ ................ ................ ................ ................ ................ ................Boat safety ................................................................................................... TF 40 26 32 15 6 6 6 6 6Grants for airports (Airport and airway trust fund) ..................................... TF 1,655 1,489 1,511 1,670 1,750 1,680 1,641 1,628 1,620Federal-aid highways (trust fund) ................................................................ TF 19,366 20,304 19,791 22,748 25,144 26,534 26,790 27,033 27,609Other Federal fund aid for highways ................................................................... 237 181 248 321 286 150 97 68 41Motor carrier safety ...................................................................................... TF 73 78 73 95 101 107 113 119 125Other Trust fund aid for highways .............................................................. TF 85 56 46 60 43 35 26 12 5Highway safety grants ................................................................................. TF 151 151 149 189 199 208 205 210 215Emergency railroad rehabilitation and repair ....................................................... ................ ................ 14 14 ................ ................ ................ ................ ................Alameda Corridor direct loan financing program ................................................. ................ 21 21 18 ................ ................ ................ ................ ................Local rail freight assistance .................................................................................. 13 7 4 6 ................ ................ ................ ................ ................Alaska railroad rehabilitation ................................................................................ 9 8 9 24 23 ................ ................ ................ ................Railroad research and development .................................................................... ................ 1 1 1 ................ ................ ................ ................ ................Conrail commuter transition assistance ............................................................... 2 2 5 9 2 ................ ................ ................ ................Northeast corridor improvement program ............................................................ 1 ................ ................ ................ ................ ................ ................ ................ ................Urban mass transportation grants ............................................................... TF 2,224 2,002 1,875 1,459 1,144 821 526 295 100Urban mass transportation grants ........................................................................ 2,067 2,497 2,346 2,487 2,912 4,285 4,905 5,847 6,460Research and special programs (pipeline safety and other) .............................. 11 12 13 15 15 15 16 16 16Emergency preparedness grants ......................................................................... 6 6 6 6 7 11 11 11 11
Subtotal, Transportation ................................................................................... 25,956 26,846 26,144 29,137 31,632 33,852 34,336 35,245 36,208
Total, 400 ......................................................................................................... 25,957 26,846 26,144 29,137 31,632 33,852 34,336 35,245 36,208
See footnotes at end of table.
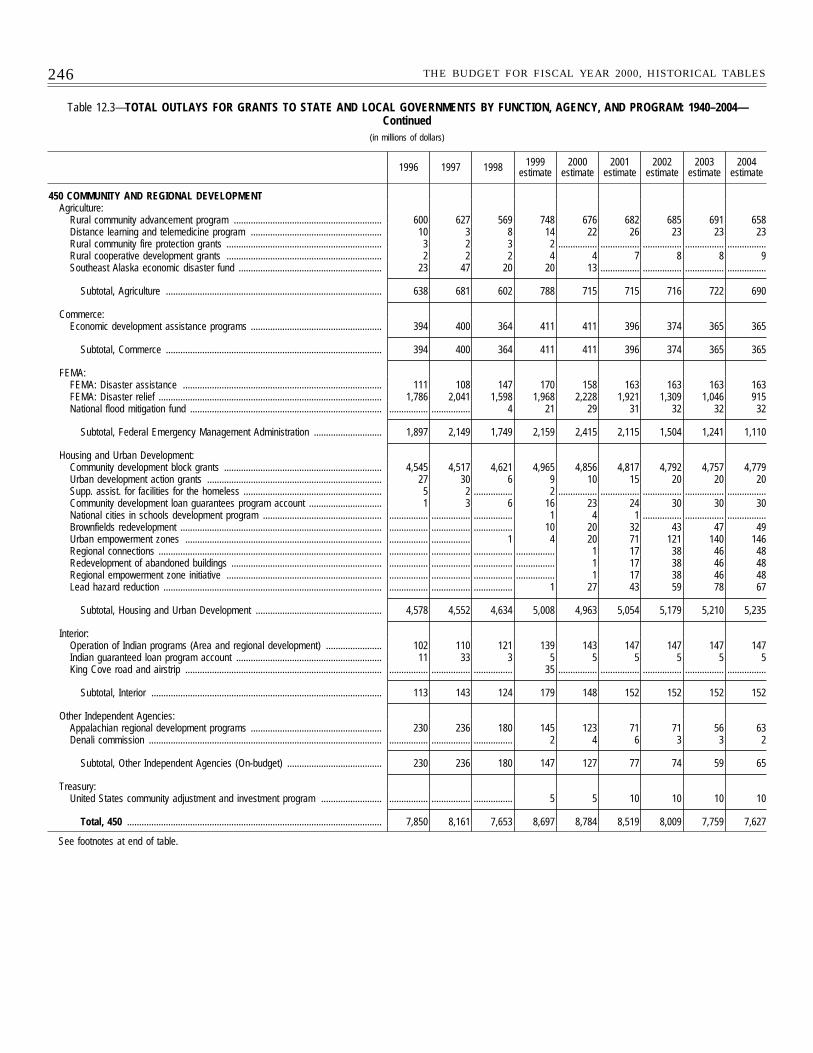
246 THE BUDGET FOR FISCAL YEAR 2000, HISTORICAL TABLES
Table 12.3—TOTAL OUTLAYS FOR GRANTS TO STATE AND LOCAL GOVERNMENTS BY FUNCTION, AGENCY, AND PROGRAM: 1940–2004—Continued
(in millions of dollars)
1996 1997 1998 1999estimate
2000estimate
2001estimate
2002estimate
2003estimate
2004estimate
450 COMMUNITY AND REGIONAL DEVELOPMENTAgriculture:
Rural community advancement program ............................................................. 600 627 569 748 676 682 685 691 658Distance learning and telemedicine program ...................................................... 10 3 8 14 22 26 23 23 23Rural community fire protection grants ................................................................ 3 2 3 2 ................ ................ ................ ................ ................Rural cooperative development grants ................................................................ 2 2 2 4 4 7 8 8 9Southeast Alaska economic disaster fund ........................................................... 23 47 20 20 13 ................ ................ ................ ................
Subtotal, Agriculture ......................................................................................... 638 681 602 788 715 715 716 722 690
Commerce:Economic development assistance programs ...................................................... 394 400 364 411 411 396 374 365 365
Subtotal, Commerce ......................................................................................... 394 400 364 411 411 396 374 365 365
FEMA:FEMA: Disaster assistance .................................................................................. 111 108 147 170 158 163 163 163 163FEMA: Disaster relief ............................................................................................ 1,786 2,041 1,598 1,968 2,228 1,921 1,309 1,046 915National flood mitigation fund ............................................................................... ................ ................ 4 21 29 31 32 32 32
Subtotal, Federal Emergency Management Administration ............................ 1,897 2,149 1,749 2,159 2,415 2,115 1,504 1,241 1,110
Housing and Urban Development:Community development block grants ................................................................. 4,545 4,517 4,621 4,965 4,856 4,817 4,792 4,757 4,779Urban development action grants ........................................................................ 27 30 6 9 10 15 20 20 20Supp. assist. for facilities for the homeless ......................................................... 5 2 ................ 2 ................ ................ ................ ................ ................Community development loan guarantees program account .............................. 1 3 6 16 23 24 30 30 30National cities in schools development program ................................................. ................ ................ ................ 1 4 1 ................ ................ ................Brownfields redevelopment ................................................................................... ................ ................ ................ 10 20 32 43 47 49Urban empowerment zones ................................................................................. ................ ................ 1 4 20 71 121 140 146Regional connections ............................................................................................ ................ ................ ................ ................ 1 17 38 46 48Redevelopment of abandoned buildings .............................................................. ................ ................ ................ ................ 1 17 38 46 48Regional empowerment zone initiative ................................................................ ................ ................ ................ ................ 1 17 38 46 48Lead hazard reduction .......................................................................................... ................ ................ ................ 1 27 43 59 78 67
Subtotal, Housing and Urban Development .................................................... 4,578 4,552 4,634 5,008 4,963 5,054 5,179 5,210 5,235
Interior:Operation of Indian programs (Area and regional development) ....................... 102 110 121 139 143 147 147 147 147Indian guaranteed loan program account ............................................................ 11 33 3 5 5 5 5 5 5King Cove road and airstrip ................................................................................. ................ ................ ................ 35 ................ ................ ................ ................ ................
Subtotal, Interior ............................................................................................... 113 143 124 179 148 152 152 152 152
Other Independent Agencies:Appalachian regional development programs ...................................................... 230 236 180 145 123 71 71 56 63Denali commission ................................................................................................ ................ ................ ................ 2 4 6 3 3 2
Subtotal, Other Independent Agencies (On-budget) ....................................... 230 236 180 147 127 77 74 59 65
Treasury:United States community adjustment and investment program ......................... ................ ................ ................ 5 5 10 10 10 10
Total, 450 ......................................................................................................... 7,850 8,161 7,653 8,697 8,784 8,519 8,009 7,759 7,627
See footnotes at end of table.
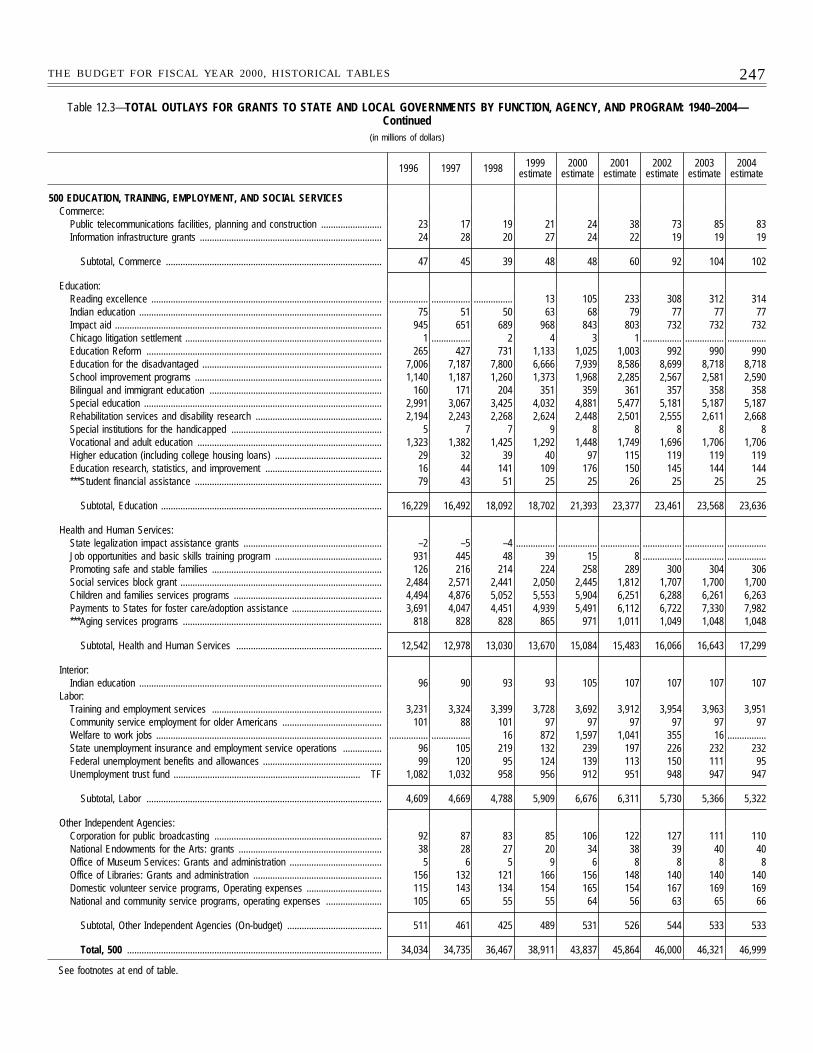
247THE BUDGET FOR FISCAL YEAR 2000, HISTORICAL TABLES
Table 12.3—TOTAL OUTLAYS FOR GRANTS TO STATE AND LOCAL GOVERNMENTS BY FUNCTION, AGENCY, AND PROGRAM: 1940–2004—Continued
(in millions of dollars)
1996 1997 1998 1999estimate
2000estimate
2001estimate
2002estimate
2003estimate
2004estimate
500 EDUCATION, TRAINING, EMPLOYMENT, AND SOCIAL SERVICESCommerce:
Public telecommunications facilities, planning and construction ......................... 23 17 19 21 24 38 73 85 83Information infrastructure grants ........................................................................... 24 28 20 27 24 22 19 19 19
Subtotal, Commerce ......................................................................................... 47 45 39 48 48 60 92 104 102
Education:Reading excellence ............................................................................................... ................ ................ ................ 13 105 233 308 312 314Indian education .................................................................................................... 75 51 50 63 68 79 77 77 77Impact aid .............................................................................................................. 945 651 689 968 843 803 732 732 732Chicago litigation settlement ................................................................................. 1 ................ 2 4 3 1 ................ ................ ................Education Reform ................................................................................................. 265 427 731 1,133 1,025 1,003 992 990 990Education for the disadvantaged .......................................................................... 7,006 7,187 7,800 6,666 7,939 8,586 8,699 8,718 8,718School improvement programs ............................................................................. 1,140 1,187 1,260 1,373 1,968 2,285 2,567 2,581 2,590Bilingual and immigrant education ....................................................................... 160 171 204 351 359 361 357 358 358Special education .................................................................................................. 2,991 3,067 3,425 4,032 4,881 5,477 5,181 5,187 5,187Rehabilitation services and disability research .................................................... 2,194 2,243 2,268 2,624 2,448 2,501 2,555 2,611 2,668Special institutions for the handicapped .............................................................. 5 7 7 9 8 8 8 8 8Vocational and adult education ............................................................................ 1,323 1,382 1,425 1,292 1,448 1,749 1,696 1,706 1,706Higher education (including college housing loans) ............................................ 29 32 39 40 97 115 119 119 119Education research, statistics, and improvement ................................................ 16 44 141 109 176 150 145 144 144***Student financial assistance ............................................................................. 79 43 51 25 25 26 25 25 25
Subtotal, Education ........................................................................................... 16,229 16,492 18,092 18,702 21,393 23,377 23,461 23,568 23,636
Health and Human Services:State legalization impact assistance grants ......................................................... –2 –5 –4 ................ ................ ................ ................ ................ ................Job opportunities and basic skills training program ............................................ 931 445 48 39 15 8 ................ ................ ................Promoting safe and stable families ...................................................................... 126 216 214 224 258 289 300 304 306Social services block grant ................................................................................... 2,484 2,571 2,441 2,050 2,445 1,812 1,707 1,700 1,700Children and families services programs ............................................................. 4,494 4,876 5,052 5,553 5,904 6,251 6,288 6,261 6,263Payments to States for foster care/adoption assistance ..................................... 3,691 4,047 4,451 4,939 5,491 6,112 6,722 7,330 7,982***Aging services programs .................................................................................. 818 828 828 865 971 1,011 1,049 1,048 1,048
Subtotal, Health and Human Services ............................................................ 12,542 12,978 13,030 13,670 15,084 15,483 16,066 16,643 17,299
Interior:Indian education .................................................................................................... 96 90 93 93 105 107 107 107 107
Labor:Training and employment services ...................................................................... 3,231 3,324 3,399 3,728 3,692 3,912 3,954 3,963 3,951Community service employment for older Americans ......................................... 101 88 101 97 97 97 97 97 97Welfare to work jobs ............................................................................................. ................ ................ 16 872 1,597 1,041 355 16 ................State unemployment insurance and employment service operations ................ 96 105 219 132 239 197 226 232 232Federal unemployment benefits and allowances ................................................. 99 120 95 124 139 113 150 111 95Unemployment trust fund ............................................................................. TF 1,082 1,032 958 956 912 951 948 947 947
Subtotal, Labor ................................................................................................. 4,609 4,669 4,788 5,909 6,676 6,311 5,730 5,366 5,322
Other Independent Agencies:Corporation for public broadcasting ..................................................................... 92 87 83 85 106 122 127 111 110National Endowments for the Arts: grants ........................................................... 38 28 27 20 34 38 39 40 40Office of Museum Services: Grants and administration ...................................... 5 6 5 9 6 8 8 8 8Office of Libraries: Grants and administration ..................................................... 156 132 121 166 156 148 140 140 140Domestic volunteer service programs, Operating expenses ............................... 115 143 134 154 165 154 167 169 169National and community service programs, operating expenses ....................... 105 65 55 55 64 56 63 65 66
Subtotal, Other Independent Agencies (On-budget) ....................................... 511 461 425 489 531 526 544 533 533
Total, 500 ......................................................................................................... 34,034 34,735 36,467 38,911 43,837 45,864 46,000 46,321 46,999
See footnotes at end of table.
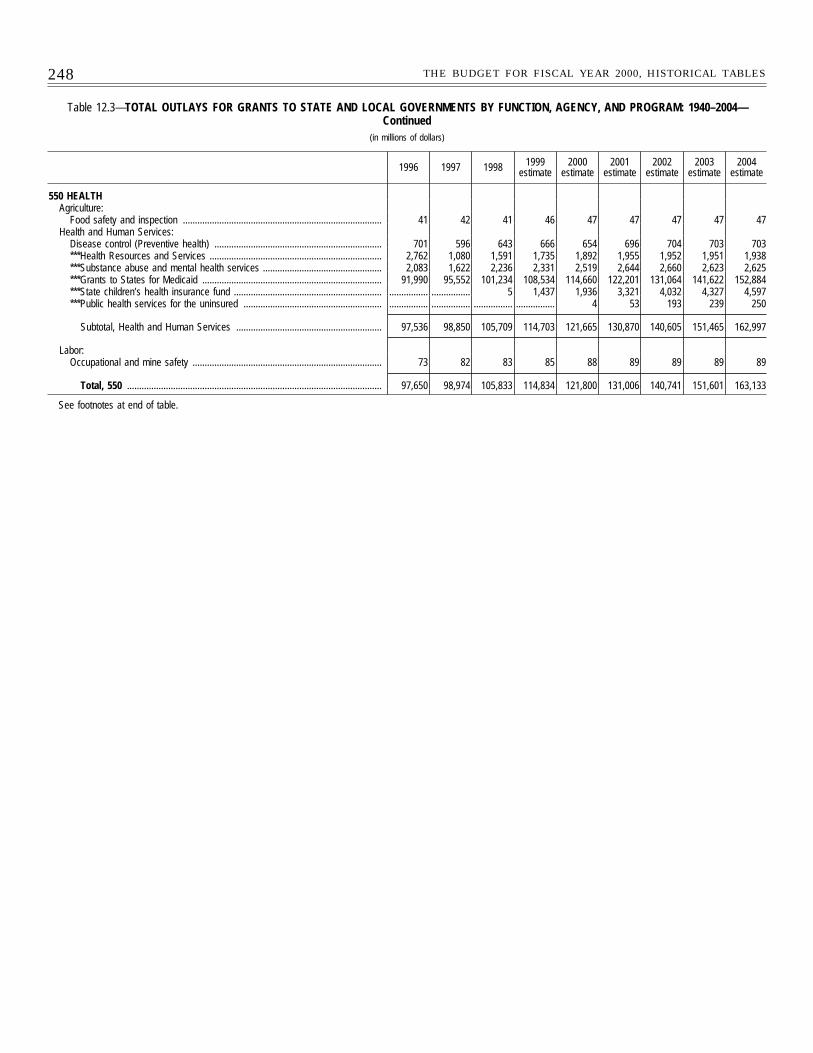
248 THE BUDGET FOR FISCAL YEAR 2000, HISTORICAL TABLES
Table 12.3—TOTAL OUTLAYS FOR GRANTS TO STATE AND LOCAL GOVERNMENTS BY FUNCTION, AGENCY, AND PROGRAM: 1940–2004—Continued
(in millions of dollars)
1996 1997 1998 1999estimate
2000estimate
2001estimate
2002estimate
2003estimate
2004estimate
550 HEALTHAgriculture:
Food safety and inspection .................................................................................. 41 42 41 46 47 47 47 47 47Health and Human Services:
Disease control (Preventive health) ..................................................................... 701 596 643 666 654 696 704 703 703***Health Resources and Services ....................................................................... 2,762 1,080 1,591 1,735 1,892 1,955 1,952 1,951 1,938***Substance abuse and mental health services ................................................. 2,083 1,622 2,236 2,331 2,519 2,644 2,660 2,623 2,625***Grants to States for Medicaid .......................................................................... 91,990 95,552 101,234 108,534 114,660 122,201 131,064 141,622 152,884***State children’s health insurance fund ............................................................. ................ ................ 5 1,437 1,936 3,321 4,032 4,327 4,597***Public health services for the uninsured ......................................................... ................ ................ ................ ................ 4 53 193 239 250
Subtotal, Health and Human Services ............................................................ 97,536 98,850 105,709 114,703 121,665 130,870 140,605 151,465 162,997
Labor:Occupational and mine safety .............................................................................. 73 82 83 85 88 89 89 89 89
Total, 550 ......................................................................................................... 97,650 98,974 105,833 114,834 121,800 131,006 140,741 151,601 163,133
See footnotes at end of table.
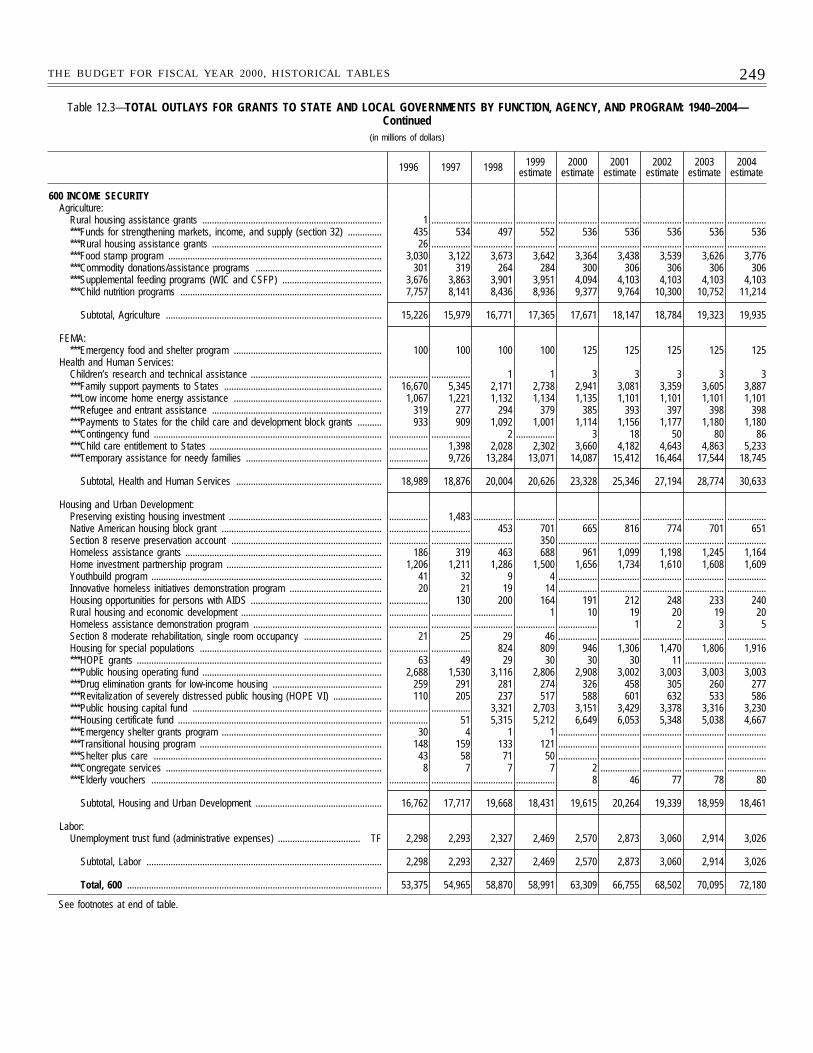
249THE BUDGET FOR FISCAL YEAR 2000, HISTORICAL TABLES
Table 12.3—TOTAL OUTLAYS FOR GRANTS TO STATE AND LOCAL GOVERNMENTS BY FUNCTION, AGENCY, AND PROGRAM: 1940–2004—Continued
(in millions of dollars)
1996 1997 1998 1999estimate
2000estimate
2001estimate
2002estimate
2003estimate
2004estimate
600 INCOME SECURITYAgriculture:
Rural housing assistance grants .......................................................................... 1 ................ ................ ................ ................ ................ ................ ................ ................***Funds for strengthening markets, income, and supply (section 32) .............. 435 534 497 552 536 536 536 536 536***Rural housing assistance grants ...................................................................... 26 ................ ................ ................ ................ ................ ................ ................ ................***Food stamp program ........................................................................................ 3,030 3,122 3,673 3,642 3,364 3,438 3,539 3,626 3,776***Commodity donations/assistance programs .................................................... 301 319 264 284 300 306 306 306 306***Supplemental feeding programs (WIC and CSFP) ......................................... 3,676 3,863 3,901 3,951 4,094 4,103 4,103 4,103 4,103***Child nutrition programs ................................................................................... 7,757 8,141 8,436 8,936 9,377 9,764 10,300 10,752 11,214
Subtotal, Agriculture ......................................................................................... 15,226 15,979 16,771 17,365 17,671 18,147 18,784 19,323 19,935
FEMA:***Emergency food and shelter program ............................................................. 100 100 100 100 125 125 125 125 125
Health and Human Services:Children’s research and technical assistance ...................................................... ................ ................ 1 1 3 3 3 3 3***Family support payments to States ................................................................. 16,670 5,345 2,171 2,738 2,941 3,081 3,359 3,605 3,887***Low income home energy assistance ............................................................. 1,067 1,221 1,132 1,134 1,135 1,101 1,101 1,101 1,101***Refugee and entrant assistance ...................................................................... 319 277 294 379 385 393 397 398 398***Payments to States for the child care and development block grants .......... 933 909 1,092 1,001 1,114 1,156 1,177 1,180 1,180***Contingency fund .............................................................................................. ................ ................ 2 ................ 3 18 50 80 86***Child care entitlement to States ....................................................................... ................ 1,398 2,028 2,302 3,660 4,182 4,643 4,863 5,233***Temporary assistance for needy families ........................................................ ................ 9,726 13,284 13,071 14,087 15,412 16,464 17,544 18,745
Subtotal, Health and Human Services ............................................................ 18,989 18,876 20,004 20,626 23,328 25,346 27,194 28,774 30,633
Housing and Urban Development:Preserving existing housing investment ............................................................... ................ 1,483 ................ ................ ................ ................ ................ ................ ................Native American housing block grant .................................................................. ................ ................ 453 701 665 816 774 701 651Section 8 reserve preservation account .............................................................. ................ ................ ................ 350 ................ ................ ................ ................ ................Homeless assistance grants ................................................................................. 186 319 463 688 961 1,099 1,198 1,245 1,164Home investment partnership program ................................................................ 1,206 1,211 1,286 1,500 1,656 1,734 1,610 1,608 1,609Youthbuild program ............................................................................................... 41 32 9 4 ................ ................ ................ ................ ................Innovative homeless initiatives demonstration program ...................................... 20 21 19 14 ................ ................ ................ ................ ................Housing opportunities for persons with AIDS ...................................................... ................ 130 200 164 191 212 248 233 240Rural housing and economic development .......................................................... ................ ................ ................ 1 10 19 20 19 20Homeless assistance demonstration program ..................................................... ................ ................ ................ ................ ................ 1 2 3 5Section 8 moderate rehabilitation, single room occupancy ................................ 21 25 29 46 ................ ................ ................ ................ ................Housing for special populations ........................................................................... ................ ................ 824 809 946 1,306 1,470 1,806 1,916***HOPE grants ..................................................................................................... 63 49 29 30 30 30 11 ................ ................***Public housing operating fund .......................................................................... 2,688 1,530 3,116 2,806 2,908 3,002 3,003 3,003 3,003***Drug elimination grants for low-income housing ............................................. 259 291 281 274 326 458 305 260 277***Revitalization of severely distressed public housing (HOPE VI) .................... 110 205 237 517 588 601 632 533 586***Public housing capital fund .............................................................................. ................ ................ 3,321 2,703 3,151 3,429 3,378 3,316 3,230***Housing certificate fund .................................................................................... ................ 51 5,315 5,212 6,649 6,053 5,348 5,038 4,667***Emergency shelter grants program .................................................................. 30 4 1 1 ................ ................ ................ ................ ................***Transitional housing program ........................................................................... 148 159 133 121 ................ ................ ................ ................ ................***Shelter plus care .............................................................................................. 43 58 71 50 ................ ................ ................ ................ ................***Congregate services ......................................................................................... 8 7 7 7 2 ................ ................ ................ ................***Elderly vouchers ............................................................................................... ................ ................ ................ ................ 8 46 77 78 80
Subtotal, Housing and Urban Development .................................................... 16,762 17,717 19,668 18,431 19,615 20,264 19,339 18,959 18,461
Labor:Unemployment trust fund (administrative expenses) .................................. TF 2,298 2,293 2,327 2,469 2,570 2,873 3,060 2,914 3,026
Subtotal, Labor ................................................................................................. 2,298 2,293 2,327 2,469 2,570 2,873 3,060 2,914 3,026
Total, 600 ......................................................................................................... 53,375 54,965 58,870 58,991 63,309 66,755 68,502 70,095 72,180
See footnotes at end of table.
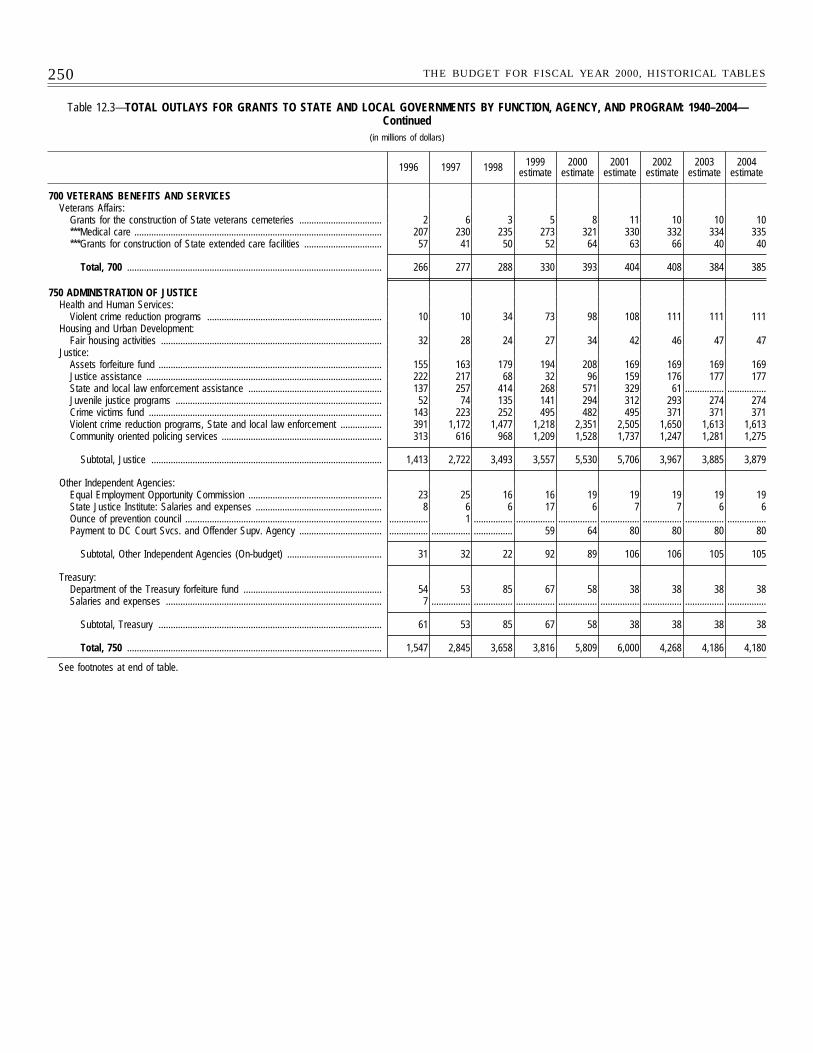
250 THE BUDGET FOR FISCAL YEAR 2000, HISTORICAL TABLES
Table 12.3—TOTAL OUTLAYS FOR GRANTS TO STATE AND LOCAL GOVERNMENTS BY FUNCTION, AGENCY, AND PROGRAM: 1940–2004—Continued
(in millions of dollars)
1996 1997 1998 1999estimate
2000estimate
2001estimate
2002estimate
2003estimate
2004estimate
700 VETERANS BENEFITS AND SERVICESVeterans Affairs:
Grants for the construction of State veterans cemeteries .................................. 2 6 3 5 8 11 10 10 10***Medical care ...................................................................................................... 207 230 235 273 321 330 332 334 335***Grants for construction of State extended care facilities ................................ 57 41 50 52 64 63 66 40 40
Total, 700 ......................................................................................................... 266 277 288 330 393 404 408 384 385
750 ADMINISTRATION OF JUSTICEHealth and Human Services:
Violent crime reduction programs ........................................................................ 10 10 34 73 98 108 111 111 111Housing and Urban Development:
Fair housing activities ........................................................................................... 32 28 24 27 34 42 46 47 47Justice:
Assets forfeiture fund ............................................................................................ 155 163 179 194 208 169 169 169 169Justice assistance ................................................................................................. 222 217 68 32 96 159 176 177 177State and local law enforcement assistance ....................................................... 137 257 414 268 571 329 61 ................ ................Juvenile justice programs ..................................................................................... 52 74 135 141 294 312 293 274 274Crime victims fund ................................................................................................ 143 223 252 495 482 495 371 371 371Violent crime reduction programs, State and local law enforcement ................. 391 1,172 1,477 1,218 2,351 2,505 1,650 1,613 1,613Community oriented policing services .................................................................. 313 616 968 1,209 1,528 1,737 1,247 1,281 1,275
Subtotal, Justice ............................................................................................... 1,413 2,722 3,493 3,557 5,530 5,706 3,967 3,885 3,879
Other Independent Agencies:Equal Employment Opportunity Commission ....................................................... 23 25 16 16 19 19 19 19 19State Justice Institute: Salaries and expenses .................................................... 8 6 6 17 6 7 7 6 6Ounce of prevention council ................................................................................. ................ 1 ................ ................ ................ ................ ................ ................ ................Payment to DC Court Svcs. and Offender Supv. Agency .................................. ................ ................ ................ 59 64 80 80 80 80
Subtotal, Other Independent Agencies (On-budget) ....................................... 31 32 22 92 89 106 106 105 105
Treasury:Department of the Treasury forfeiture fund ......................................................... 54 53 85 67 58 38 38 38 38Salaries and expenses ......................................................................................... 7 ................ ................ ................ ................ ................ ................ ................ ................
Subtotal, Treasury ............................................................................................ 61 53 85 67 58 38 38 38 38
Total, 750 ......................................................................................................... 1,547 2,845 3,658 3,816 5,809 6,000 4,268 4,186 4,180
See footnotes at end of table.
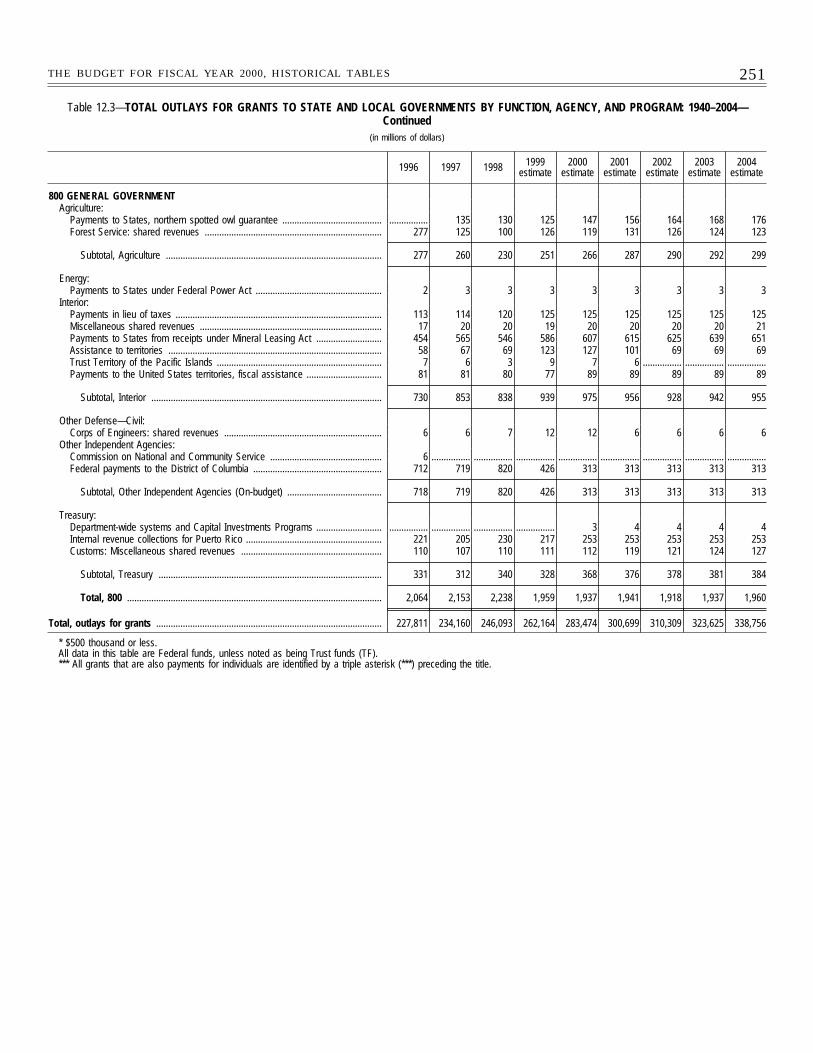
251THE BUDGET FOR FISCAL YEAR 2000, HISTORICAL TABLES
Table 12.3—TOTAL OUTLAYS FOR GRANTS TO STATE AND LOCAL GOVERNMENTS BY FUNCTION, AGENCY, AND PROGRAM: 1940–2004—Continued
(in millions of dollars)
1996 1997 1998 1999estimate
2000estimate
2001estimate
2002estimate
2003estimate
2004estimate
800 GENERAL GOVERNMENTAgriculture:
Payments to States, northern spotted owl guarantee ......................................... ................ 135 130 125 147 156 164 168 176Forest Service: shared revenues ......................................................................... 277 125 100 126 119 131 126 124 123
Subtotal, Agriculture ......................................................................................... 277 260 230 251 266 287 290 292 299
Energy:Payments to States under Federal Power Act .................................................... 2 3 3 3 3 3 3 3 3
Interior:Payments in lieu of taxes ..................................................................................... 113 114 120 125 125 125 125 125 125Miscellaneous shared revenues ........................................................................... 17 20 20 19 20 20 20 20 21Payments to States from receipts under Mineral Leasing Act ........................... 454 565 546 586 607 615 625 639 651Assistance to territories ........................................................................................ 58 67 69 123 127 101 69 69 69Trust Territory of the Pacific Islands .................................................................... 7 6 3 9 7 6 ................ ................ ................Payments to the United States territories, fiscal assistance ............................... 81 81 80 77 89 89 89 89 89
Subtotal, Interior ............................................................................................... 730 853 838 939 975 956 928 942 955
Other Defense—Civil:Corps of Engineers: shared revenues ................................................................. 6 6 7 12 12 6 6 6 6
Other Independent Agencies:Commission on National and Community Service .............................................. 6 ................ ................ ................ ................ ................ ................ ................ ................Federal payments to the District of Columbia ..................................................... 712 719 820 426 313 313 313 313 313
Subtotal, Other Independent Agencies (On-budget) ....................................... 718 719 820 426 313 313 313 313 313
Treasury:Department-wide systems and Capital Investments Programs ........................... ................ ................ ................ ................ 3 4 4 4 4Internal revenue collections for Puerto Rico ........................................................ 221 205 230 217 253 253 253 253 253Customs: Miscellaneous shared revenues .......................................................... 110 107 110 111 112 119 121 124 127
Subtotal, Treasury ............................................................................................ 331 312 340 328 368 376 378 381 384
Total, 800 ......................................................................................................... 2,064 2,153 2,238 1,959 1,937 1,941 1,918 1,937 1,960
Total, outlays for grants ............................................................................................. 227,811 234,160 246,093 262,164 283,474 300,699 310,309 323,625 338,756
* $500 thousand or less.All data in this table are Federal funds, unless noted as being Trust funds (TF).*** All grants that are also payments for individuals are identified by a triple asterisk (***) preceding the title.
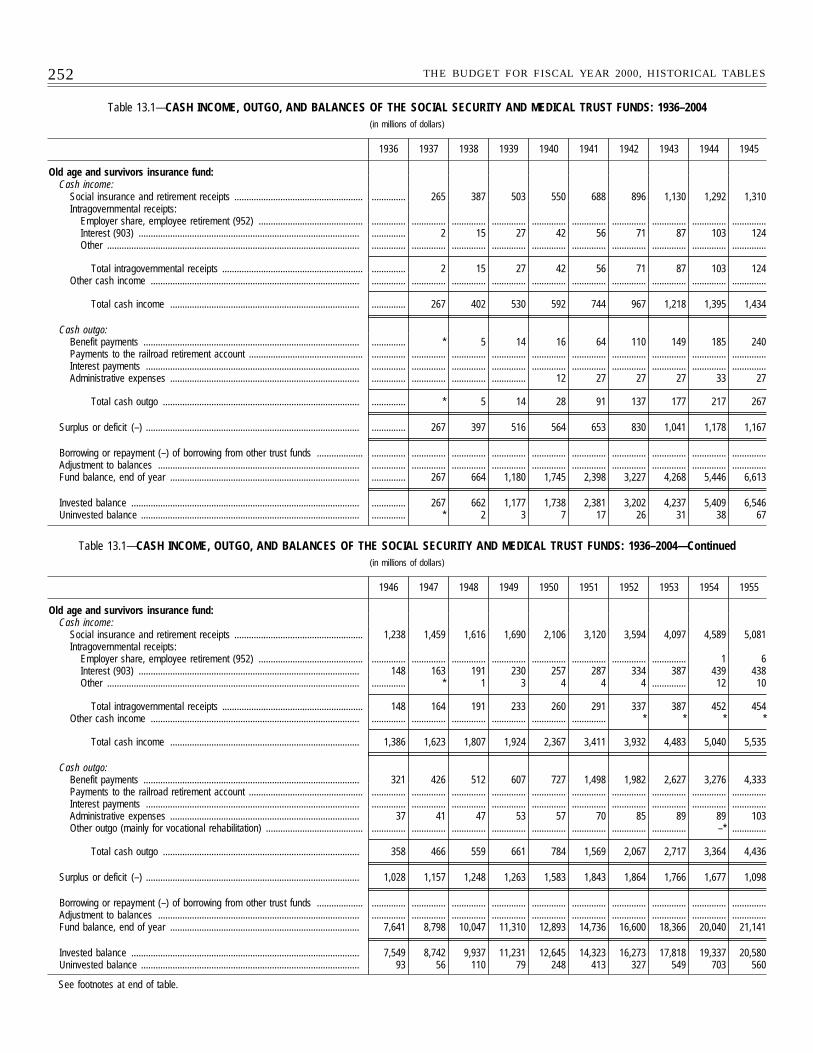
252 THE BUDGET FOR FISCAL YEAR 2000, HISTORICAL TABLES
Table 13.1—CASH INCOME, OUTGO, AND BALANCES OF THE SOCIAL SECURITY AND MEDICAL TRUST FUNDS: 1936–2004(in millions of dollars)
1936 1937 1938 1939 1940 1941 1942 1943 1944 1945
Old age and survivors insurance fund:Cash income:
Social insurance and retirement receipts ..................................................... .............. 265 387 503 550 688 896 1,130 1,292 1,310Intragovernmental receipts:
Employer share, employee retirement (952) ........................................... .............. .............. .............. .............. .............. .............. .............. .............. .............. ..............Interest (903) ........................................................................................... .............. 2 15 27 42 56 71 87 103 124Other ........................................................................................................ .............. .............. .............. .............. .............. .............. .............. .............. .............. ..............
Total intragovernmental receipts .......................................................... .............. 2 15 27 42 56 71 87 103 124Other cash income ...................................................................................... .............. .............. .............. .............. .............. .............. .............. .............. .............. ..............
Total cash income .............................................................................. .............. 267 402 530 592 744 967 1,218 1,395 1,434
Cash outgo:Benefit payments ......................................................................................... .............. * 5 14 16 64 110 149 185 240Payments to the railroad retirement account ............................................... .............. .............. .............. .............. .............. .............. .............. .............. .............. ..............Interest payments ........................................................................................ .............. .............. .............. .............. .............. .............. .............. .............. .............. ..............Administrative expenses .............................................................................. .............. .............. .............. .............. 12 27 27 27 33 27
Total cash outgo ................................................................................. .............. * 5 14 28 91 137 177 217 267
Surplus or deficit (–) ........................................................................................ .............. 267 397 516 564 653 830 1,041 1,178 1,167
Borrowing or repayment (–) of borrowing from other trust funds ................... .............. .............. .............. .............. .............. .............. .............. .............. .............. ..............Adjustment to balances ................................................................................... .............. .............. .............. .............. .............. .............. .............. .............. .............. ..............Fund balance, end of year .............................................................................. .............. 267 664 1,180 1,745 2,398 3,227 4,268 5,446 6,613
Invested balance .............................................................................................. .............. 267 662 1,177 1,738 2,381 3,202 4,237 5,409 6,546Uninvested balance .......................................................................................... .............. * 2 3 7 17 26 31 38 67
Table 13.1—CASH INCOME, OUTGO, AND BALANCES OF THE SOCIAL SECURITY AND MEDICAL TRUST FUNDS: 1936–2004—Continued(in millions of dollars)
1946 1947 1948 1949 1950 1951 1952 1953 1954 1955
Old age and survivors insurance fund:Cash income:
Social insurance and retirement receipts ..................................................... 1,238 1,459 1,616 1,690 2,106 3,120 3,594 4,097 4,589 5,081Intragovernmental receipts:
Employer share, employee retirement (952) ........................................... .............. .............. .............. .............. .............. .............. .............. .............. 1 6Interest (903) ........................................................................................... 148 163 191 230 257 287 334 387 439 438Other ........................................................................................................ .............. * 1 3 4 4 4 .............. 12 10
Total intragovernmental receipts .......................................................... 148 164 191 233 260 291 337 387 452 454Other cash income ...................................................................................... .............. .............. .............. .............. .............. .............. * * * *
Total cash income .............................................................................. 1,386 1,623 1,807 1,924 2,367 3,411 3,932 4,483 5,040 5,535
Cash outgo:Benefit payments ......................................................................................... 321 426 512 607 727 1,498 1,982 2,627 3,276 4,333Payments to the railroad retirement account ............................................... .............. .............. .............. .............. .............. .............. .............. .............. .............. ..............Interest payments ........................................................................................ .............. .............. .............. .............. .............. .............. .............. .............. .............. ..............Administrative expenses .............................................................................. 37 41 47 53 57 70 85 89 89 103Other outgo (mainly for vocational rehabilitation) ........................................ .............. .............. .............. .............. .............. .............. .............. .............. –* ..............
Total cash outgo ................................................................................. 358 466 559 661 784 1,569 2,067 2,717 3,364 4,436
Surplus or deficit (–) ........................................................................................ 1,028 1,157 1,248 1,263 1,583 1,843 1,864 1,766 1,677 1,098
Borrowing or repayment (–) of borrowing from other trust funds ................... .............. .............. .............. .............. .............. .............. .............. .............. .............. ..............Adjustment to balances ................................................................................... .............. .............. .............. .............. .............. .............. .............. .............. .............. ..............Fund balance, end of year .............................................................................. 7,641 8,798 10,047 11,310 12,893 14,736 16,600 18,366 20,040 21,141
Invested balance .............................................................................................. 7,549 8,742 9,937 11,231 12,645 14,323 16,273 17,818 19,337 20,580Uninvested balance .......................................................................................... 93 56 110 79 248 413 327 549 703 560
See footnotes at end of table.
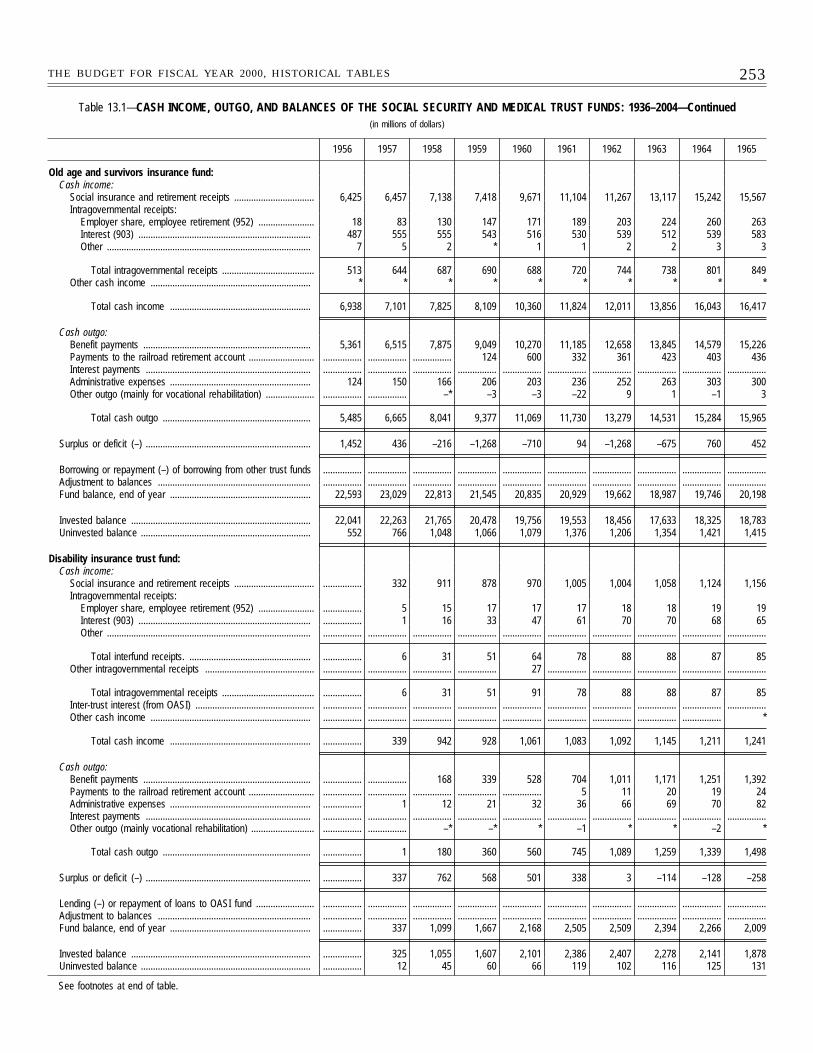
253THE BUDGET FOR FISCAL YEAR 2000, HISTORICAL TABLES
Table 13.1—CASH INCOME, OUTGO, AND BALANCES OF THE SOCIAL SECURITY AND MEDICAL TRUST FUNDS: 1936–2004—Continued(in millions of dollars)
1956 1957 1958 1959 1960 1961 1962 1963 1964 1965
Old age and survivors insurance fund:Cash income:
Social insurance and retirement receipts ................................. 6,425 6,457 7,138 7,418 9,671 11,104 11,267 13,117 15,242 15,567Intragovernmental receipts:
Employer share, employee retirement (952) ....................... 18 83 130 147 171 189 203 224 260 263Interest (903) ....................................................................... 487 555 555 543 516 530 539 512 539 583Other .................................................................................... 7 5 2 * 1 1 2 2 3 3
Total intragovernmental receipts ...................................... 513 644 687 690 688 720 744 738 801 849Other cash income .................................................................. * * * * * * * * * *
Total cash income .......................................................... 6,938 7,101 7,825 8,109 10,360 11,824 12,011 13,856 16,043 16,417
Cash outgo:Benefit payments ..................................................................... 5,361 6,515 7,875 9,049 10,270 11,185 12,658 13,845 14,579 15,226Payments to the railroad retirement account ........................... ................ ................ ................ 124 600 332 361 423 403 436Interest payments .................................................................... ................ ................ ................ ................ ................ ................ ................ ................ ................ ................Administrative expenses .......................................................... 124 150 166 206 203 236 252 263 303 300Other outgo (mainly for vocational rehabilitation) .................... ................ ................ –* –3 –3 –22 9 1 –1 3
Total cash outgo ............................................................. 5,485 6,665 8,041 9,377 11,069 11,730 13,279 14,531 15,284 15,965
Surplus or deficit (–) .................................................................... 1,452 436 –216 –1,268 –710 94 –1,268 –675 760 452
Borrowing or repayment (–) of borrowing from other trust funds ................ ................ ................ ................ ................ ................ ................ ................ ................ ................Adjustment to balances ............................................................... ................ ................ ................ ................ ................ ................ ................ ................ ................ ................Fund balance, end of year .......................................................... 22,593 23,029 22,813 21,545 20,835 20,929 19,662 18,987 19,746 20,198
Invested balance .......................................................................... 22,041 22,263 21,765 20,478 19,756 19,553 18,456 17,633 18,325 18,783Uninvested balance ...................................................................... 552 766 1,048 1,066 1,079 1,376 1,206 1,354 1,421 1,415
Disability insurance trust fund:Cash income:
Social insurance and retirement receipts ................................. ................ 332 911 878 970 1,005 1,004 1,058 1,124 1,156Intragovernmental receipts:
Employer share, employee retirement (952) ....................... ................ 5 15 17 17 17 18 18 19 19Interest (903) ....................................................................... ................ 1 16 33 47 61 70 70 68 65Other .................................................................................... ................ ................ ................ ................ ................ ................ ................ ................ ................ ................
Total interfund receipts. .................................................. ................ 6 31 51 64 78 88 88 87 85Other intragovernmental receipts ............................................. ................ ................ ................ ................ 27 ................ ................ ................ ................ ................
Total intragovernmental receipts ...................................... ................ 6 31 51 91 78 88 88 87 85Inter-trust interest (from OASI) ................................................. ................ ................ ................ ................ ................ ................ ................ ................ ................ ................Other cash income .................................................................. ................ ................ ................ ................ ................ ................ ................ ................ ................ *
Total cash income .......................................................... ................ 339 942 928 1,061 1,083 1,092 1,145 1,211 1,241
Cash outgo:Benefit payments ..................................................................... ................ ................ 168 339 528 704 1,011 1,171 1,251 1,392Payments to the railroad retirement account ........................... ................ ................ ................ ................ ................ 5 11 20 19 24Administrative expenses .......................................................... ................ 1 12 21 32 36 66 69 70 82Interest payments .................................................................... ................ ................ ................ ................ ................ ................ ................ ................ ................ ................Other outgo (mainly vocational rehabilitation) .......................... ................ ................ –* –* * –1 * * –2 *
Total cash outgo ............................................................. ................ 1 180 360 560 745 1,089 1,259 1,339 1,498
Surplus or deficit (–) .................................................................... ................ 337 762 568 501 338 3 –114 –128 –258
Lending (–) or repayment of loans to OASI fund ........................ ................ ................ ................ ................ ................ ................ ................ ................ ................ ................Adjustment to balances ............................................................... ................ ................ ................ ................ ................ ................ ................ ................ ................ ................Fund balance, end of year .......................................................... ................ 337 1,099 1,667 2,168 2,505 2,509 2,394 2,266 2,009
Invested balance .......................................................................... ................ 325 1,055 1,607 2,101 2,386 2,407 2,278 2,141 1,878Uninvested balance ...................................................................... ................ 12 45 60 66 119 102 116 125 131
See footnotes at end of table.
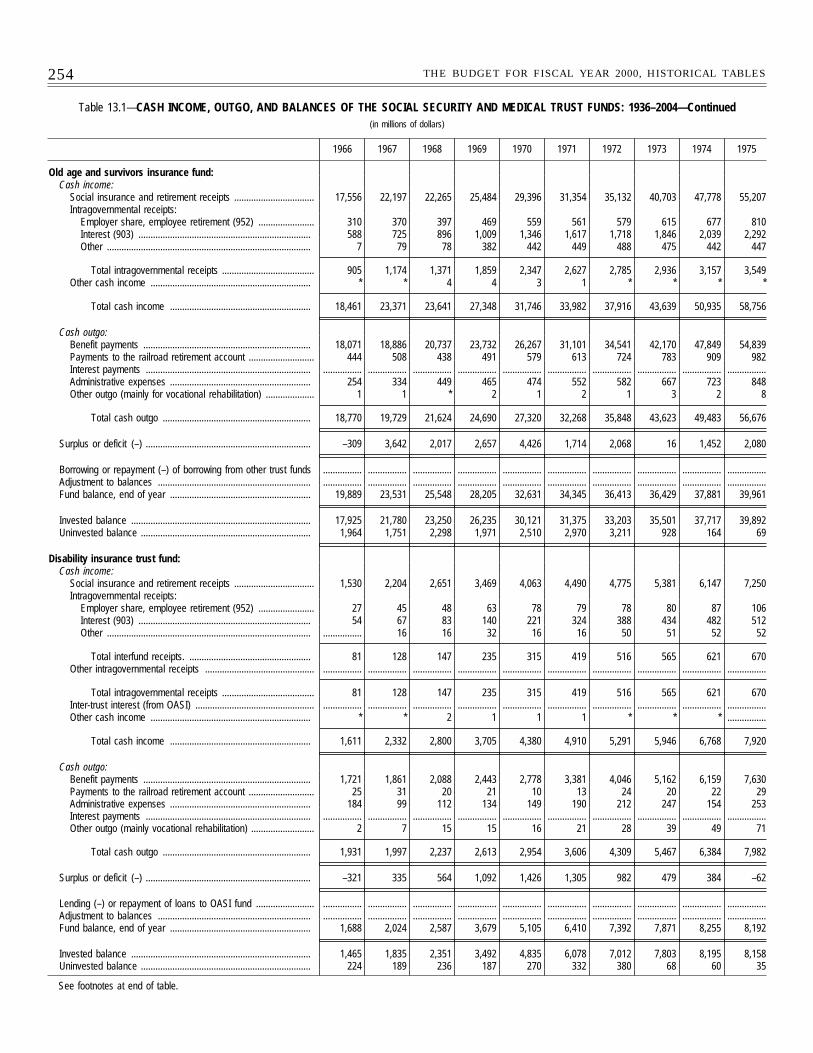
254 THE BUDGET FOR FISCAL YEAR 2000, HISTORICAL TABLES
Table 13.1—CASH INCOME, OUTGO, AND BALANCES OF THE SOCIAL SECURITY AND MEDICAL TRUST FUNDS: 1936–2004—Continued(in millions of dollars)
1966 1967 1968 1969 1970 1971 1972 1973 1974 1975
Old age and survivors insurance fund:Cash income:
Social insurance and retirement receipts ................................. 17,556 22,197 22,265 25,484 29,396 31,354 35,132 40,703 47,778 55,207Intragovernmental receipts:
Employer share, employee retirement (952) ....................... 310 370 397 469 559 561 579 615 677 810Interest (903) ....................................................................... 588 725 896 1,009 1,346 1,617 1,718 1,846 2,039 2,292Other .................................................................................... 7 79 78 382 442 449 488 475 442 447
Total intragovernmental receipts ...................................... 905 1,174 1,371 1,859 2,347 2,627 2,785 2,936 3,157 3,549Other cash income .................................................................. * * 4 4 3 1 * * * *
Total cash income .......................................................... 18,461 23,371 23,641 27,348 31,746 33,982 37,916 43,639 50,935 58,756
Cash outgo:Benefit payments ..................................................................... 18,071 18,886 20,737 23,732 26,267 31,101 34,541 42,170 47,849 54,839Payments to the railroad retirement account ........................... 444 508 438 491 579 613 724 783 909 982Interest payments .................................................................... ................ ................ ................ ................ ................ ................ ................ ................ ................ ................Administrative expenses .......................................................... 254 334 449 465 474 552 582 667 723 848Other outgo (mainly for vocational rehabilitation) .................... 1 1 * 2 1 2 1 3 2 8
Total cash outgo ............................................................. 18,770 19,729 21,624 24,690 27,320 32,268 35,848 43,623 49,483 56,676
Surplus or deficit (–) .................................................................... –309 3,642 2,017 2,657 4,426 1,714 2,068 16 1,452 2,080
Borrowing or repayment (–) of borrowing from other trust funds ................ ................ ................ ................ ................ ................ ................ ................ ................ ................Adjustment to balances ............................................................... ................ ................ ................ ................ ................ ................ ................ ................ ................ ................Fund balance, end of year .......................................................... 19,889 23,531 25,548 28,205 32,631 34,345 36,413 36,429 37,881 39,961
Invested balance .......................................................................... 17,925 21,780 23,250 26,235 30,121 31,375 33,203 35,501 37,717 39,892Uninvested balance ...................................................................... 1,964 1,751 2,298 1,971 2,510 2,970 3,211 928 164 69
Disability insurance trust fund:Cash income:
Social insurance and retirement receipts ................................. 1,530 2,204 2,651 3,469 4,063 4,490 4,775 5,381 6,147 7,250Intragovernmental receipts:
Employer share, employee retirement (952) ....................... 27 45 48 63 78 79 78 80 87 106Interest (903) ....................................................................... 54 67 83 140 221 324 388 434 482 512Other .................................................................................... ................ 16 16 32 16 16 50 51 52 52
Total interfund receipts. .................................................. 81 128 147 235 315 419 516 565 621 670Other intragovernmental receipts ............................................. ................ ................ ................ ................ ................ ................ ................ ................ ................ ................
Total intragovernmental receipts ...................................... 81 128 147 235 315 419 516 565 621 670Inter-trust interest (from OASI) ................................................. ................ ................ ................ ................ ................ ................ ................ ................ ................ ................Other cash income .................................................................. * * 2 1 1 1 * * * ................
Total cash income .......................................................... 1,611 2,332 2,800 3,705 4,380 4,910 5,291 5,946 6,768 7,920
Cash outgo:Benefit payments ..................................................................... 1,721 1,861 2,088 2,443 2,778 3,381 4,046 5,162 6,159 7,630Payments to the railroad retirement account ........................... 25 31 20 21 10 13 24 20 22 29Administrative expenses .......................................................... 184 99 112 134 149 190 212 247 154 253Interest payments .................................................................... ................ ................ ................ ................ ................ ................ ................ ................ ................ ................Other outgo (mainly vocational rehabilitation) .......................... 2 7 15 15 16 21 28 39 49 71
Total cash outgo ............................................................. 1,931 1,997 2,237 2,613 2,954 3,606 4,309 5,467 6,384 7,982
Surplus or deficit (–) .................................................................... –321 335 564 1,092 1,426 1,305 982 479 384 –62
Lending (–) or repayment of loans to OASI fund ........................ ................ ................ ................ ................ ................ ................ ................ ................ ................ ................Adjustment to balances ............................................................... ................ ................ ................ ................ ................ ................ ................ ................ ................ ................Fund balance, end of year .......................................................... 1,688 2,024 2,587 3,679 5,105 6,410 7,392 7,871 8,255 8,192
Invested balance .......................................................................... 1,465 1,835 2,351 3,492 4,835 6,078 7,012 7,803 8,195 8,158Uninvested balance ...................................................................... 224 189 236 187 270 332 380 68 60 35
See footnotes at end of table.
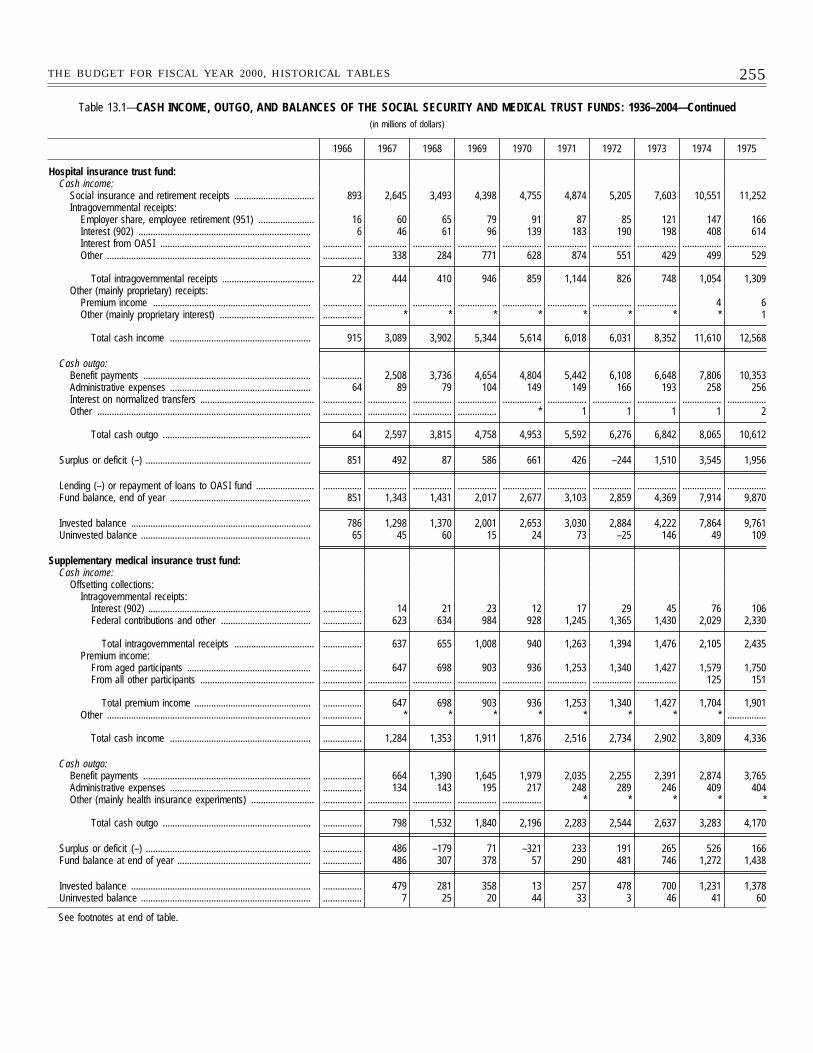
255THE BUDGET FOR FISCAL YEAR 2000, HISTORICAL TABLES
Table 13.1—CASH INCOME, OUTGO, AND BALANCES OF THE SOCIAL SECURITY AND MEDICAL TRUST FUNDS: 1936–2004—Continued(in millions of dollars)
1966 1967 1968 1969 1970 1971 1972 1973 1974 1975
Hospital insurance trust fund:Cash income:
Social insurance and retirement receipts ................................. 893 2,645 3,493 4,398 4,755 4,874 5,205 7,603 10,551 11,252Intragovernmental receipts:
Employer share, employee retirement (951) ....................... 16 60 65 79 91 87 85 121 147 166Interest (902) ....................................................................... 6 46 61 96 139 183 190 198 408 614Interest from OASI .............................................................. ................ ................ ................ ................ ................ ................ ................ ................ ................ ................Other .................................................................................... ................ 338 284 771 628 874 551 429 499 529
Total intragovernmental receipts ...................................... 22 444 410 946 859 1,144 826 748 1,054 1,309Other (mainly proprietary) receipts:
Premium income ................................................................. ................ ................ ................ ................ ................ ................ ................ ................ 4 6Other (mainly proprietary interest) ....................................... ................ * * * * * * * * 1
Total cash income .......................................................... 915 3,089 3,902 5,344 5,614 6,018 6,031 8,352 11,610 12,568
Cash outgo:Benefit payments ..................................................................... ................ 2,508 3,736 4,654 4,804 5,442 6,108 6,648 7,806 10,353Administrative expenses .......................................................... 64 89 79 104 149 149 166 193 258 256Interest on normalized transfers ............................................... ................ ................ ................ ................ ................ ................ ................ ................ ................ ................Other ........................................................................................ ................ ................ ................ ................ * 1 1 1 1 2
Total cash outgo ............................................................. 64 2,597 3,815 4,758 4,953 5,592 6,276 6,842 8,065 10,612
Surplus or deficit (–) .................................................................... 851 492 87 586 661 426 –244 1,510 3,545 1,956
Lending (–) or repayment of loans to OASI fund ........................ ................ ................ ................ ................ ................ ................ ................ ................ ................ ................Fund balance, end of year .......................................................... 851 1,343 1,431 2,017 2,677 3,103 2,859 4,369 7,914 9,870
Invested balance .......................................................................... 786 1,298 1,370 2,001 2,653 3,030 2,884 4,222 7,864 9,761Uninvested balance ...................................................................... 65 45 60 15 24 73 –25 146 49 109
Supplementary medical insurance trust fund:Cash income:
Offsetting collections:Intragovernmental receipts:
Interest (902) ................................................................... ................ 14 21 23 12 17 29 45 76 106Federal contributions and other ..................................... ................ 623 634 984 928 1,245 1,365 1,430 2,029 2,330
Total intragovernmental receipts ................................. ................ 637 655 1,008 940 1,263 1,394 1,476 2,105 2,435Premium income:
From aged participants ................................................... ................ 647 698 903 936 1,253 1,340 1,427 1,579 1,750From all other participants ............................................... ................ ................ ................ ................ ................ ................ ................ ................ 125 151
Total premium income ................................................ ................ 647 698 903 936 1,253 1,340 1,427 1,704 1,901Other .................................................................................... ................ * * * * * * * * ................
Total cash income .......................................................... ................ 1,284 1,353 1,911 1,876 2,516 2,734 2,902 3,809 4,336
Cash outgo:Benefit payments ..................................................................... ................ 664 1,390 1,645 1,979 2,035 2,255 2,391 2,874 3,765Administrative expenses .......................................................... ................ 134 143 195 217 248 289 246 409 404Other (mainly health insurance experiments) .......................... ................ ................ ................ ................ ................ * * * * *
Total cash outgo ............................................................. ................ 798 1,532 1,840 2,196 2,283 2,544 2,637 3,283 4,170
Surplus or deficit (–) .................................................................... ................ 486 –179 71 –321 233 191 265 526 166Fund balance at end of year ....................................................... ................ 486 307 378 57 290 481 746 1,272 1,438
Invested balance .......................................................................... ................ 479 281 358 13 257 478 700 1,231 1,378Uninvested balance ...................................................................... ................ 7 25 20 44 33 3 46 41 60
See footnotes at end of table.
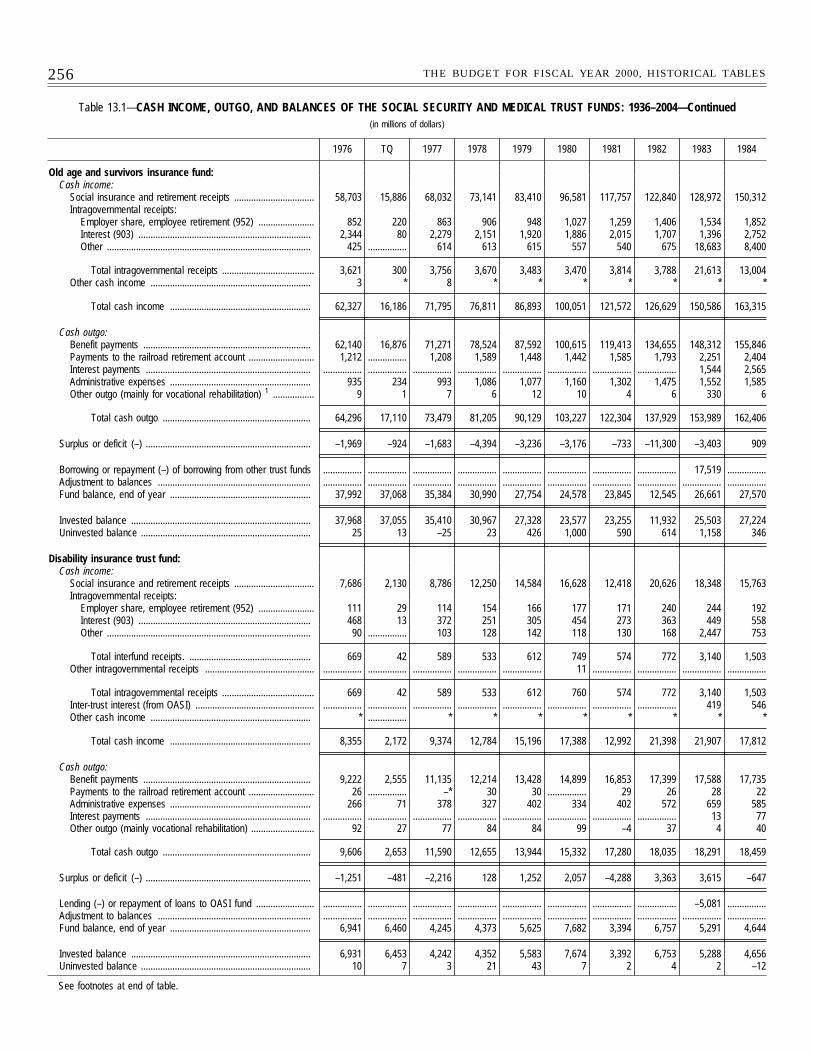
256 THE BUDGET FOR FISCAL YEAR 2000, HISTORICAL TABLES
Table 13.1—CASH INCOME, OUTGO, AND BALANCES OF THE SOCIAL SECURITY AND MEDICAL TRUST FUNDS: 1936–2004—Continued(in millions of dollars)
1976 TQ 1977 1978 1979 1980 1981 1982 1983 1984
Old age and survivors insurance fund:Cash income:
Social insurance and retirement receipts ................................. 58,703 15,886 68,032 73,141 83,410 96,581 117,757 122,840 128,972 150,312Intragovernmental receipts:
Employer share, employee retirement (952) ....................... 852 220 863 906 948 1,027 1,259 1,406 1,534 1,852Interest (903) ....................................................................... 2,344 80 2,279 2,151 1,920 1,886 2,015 1,707 1,396 2,752Other .................................................................................... 425 ................ 614 613 615 557 540 675 18,683 8,400
Total intragovernmental receipts ...................................... 3,621 300 3,756 3,670 3,483 3,470 3,814 3,788 21,613 13,004Other cash income .................................................................. 3 * 8 * * * * * * *
Total cash income .......................................................... 62,327 16,186 71,795 76,811 86,893 100,051 121,572 126,629 150,586 163,315
Cash outgo:Benefit payments ..................................................................... 62,140 16,876 71,271 78,524 87,592 100,615 119,413 134,655 148,312 155,846Payments to the railroad retirement account ........................... 1,212 ................ 1,208 1,589 1,448 1,442 1,585 1,793 2,251 2,404Interest payments .................................................................... ................ ................ ................ ................ ................ ................ ................ ................ 1,544 2,565Administrative expenses .......................................................... 935 234 993 1,086 1,077 1,160 1,302 1,475 1,552 1,585Other outgo (mainly for vocational rehabilitation) 1 ................. 9 1 7 6 12 10 4 6 330 6
Total cash outgo ............................................................. 64,296 17,110 73,479 81,205 90,129 103,227 122,304 137,929 153,989 162,406
Surplus or deficit (–) .................................................................... –1,969 –924 –1,683 –4,394 –3,236 –3,176 –733 –11,300 –3,403 909
Borrowing or repayment (–) of borrowing from other trust funds ................ ................ ................ ................ ................ ................ ................ ................ 17,519 ................Adjustment to balances ............................................................... ................ ................ ................ ................ ................ ................ ................ ................ ................ ................Fund balance, end of year .......................................................... 37,992 37,068 35,384 30,990 27,754 24,578 23,845 12,545 26,661 27,570
Invested balance .......................................................................... 37,968 37,055 35,410 30,967 27,328 23,577 23,255 11,932 25,503 27,224Uninvested balance ...................................................................... 25 13 –25 23 426 1,000 590 614 1,158 346
Disability insurance trust fund:Cash income:
Social insurance and retirement receipts ................................. 7,686 2,130 8,786 12,250 14,584 16,628 12,418 20,626 18,348 15,763Intragovernmental receipts:
Employer share, employee retirement (952) ....................... 111 29 114 154 166 177 171 240 244 192Interest (903) ....................................................................... 468 13 372 251 305 454 273 363 449 558Other .................................................................................... 90 ................ 103 128 142 118 130 168 2,447 753
Total interfund receipts. .................................................. 669 42 589 533 612 749 574 772 3,140 1,503Other intragovernmental receipts ............................................. ................ ................ ................ ................ ................ 11 ................ ................ ................ ................
Total intragovernmental receipts ...................................... 669 42 589 533 612 760 574 772 3,140 1,503Inter-trust interest (from OASI) ................................................. ................ ................ ................ ................ ................ ................ ................ ................ 419 546Other cash income .................................................................. * ................ * * * * * * * *
Total cash income .......................................................... 8,355 2,172 9,374 12,784 15,196 17,388 12,992 21,398 21,907 17,812
Cash outgo:Benefit payments ..................................................................... 9,222 2,555 11,135 12,214 13,428 14,899 16,853 17,399 17,588 17,735Payments to the railroad retirement account ........................... 26 ................ –* 30 30 ................ 29 26 28 22Administrative expenses .......................................................... 266 71 378 327 402 334 402 572 659 585Interest payments .................................................................... ................ ................ ................ ................ ................ ................ ................ ................ 13 77Other outgo (mainly vocational rehabilitation) .......................... 92 27 77 84 84 99 –4 37 4 40
Total cash outgo ............................................................. 9,606 2,653 11,590 12,655 13,944 15,332 17,280 18,035 18,291 18,459
Surplus or deficit (–) .................................................................... –1,251 –481 –2,216 128 1,252 2,057 –4,288 3,363 3,615 –647
Lending (–) or repayment of loans to OASI fund ........................ ................ ................ ................ ................ ................ ................ ................ ................ –5,081 ................Adjustment to balances ............................................................... ................ ................ ................ ................ ................ ................ ................ ................ ................ ................Fund balance, end of year .......................................................... 6,941 6,460 4,245 4,373 5,625 7,682 3,394 6,757 5,291 4,644
Invested balance .......................................................................... 6,931 6,453 4,242 4,352 5,583 7,674 3,392 6,753 5,288 4,656Uninvested balance ...................................................................... 10 7 3 21 43 7 2 4 2 –12
See footnotes at end of table.
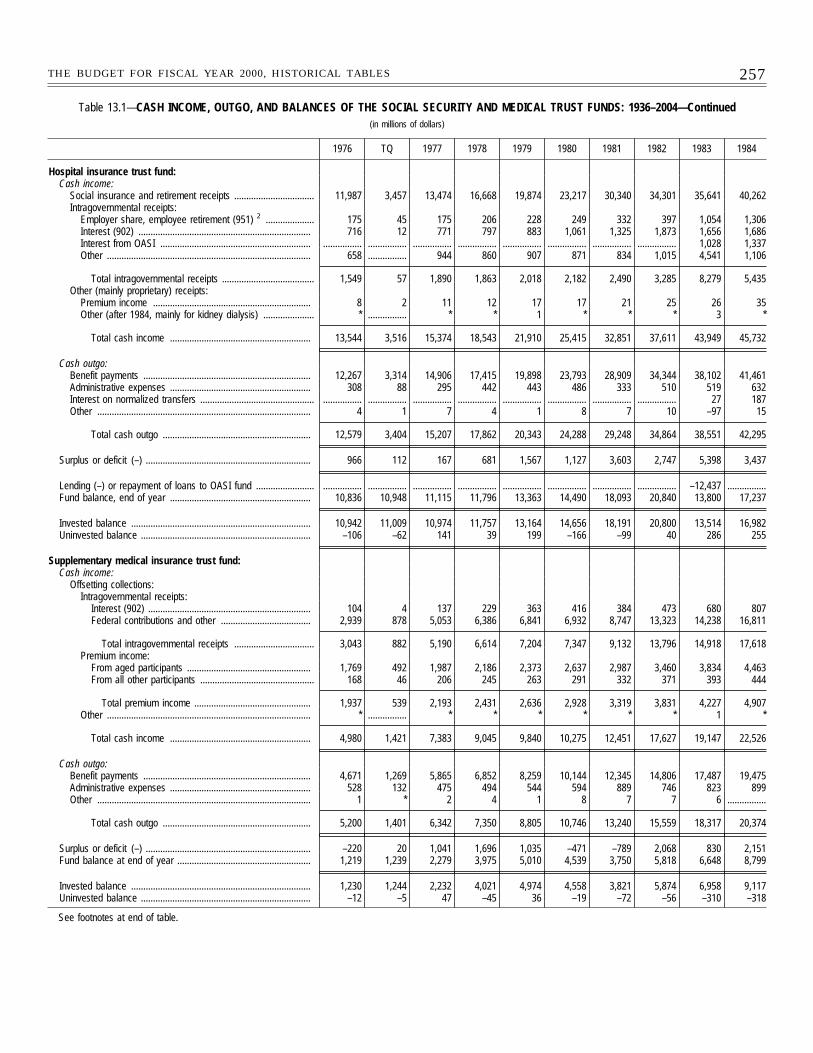
257THE BUDGET FOR FISCAL YEAR 2000, HISTORICAL TABLES
Table 13.1—CASH INCOME, OUTGO, AND BALANCES OF THE SOCIAL SECURITY AND MEDICAL TRUST FUNDS: 1936–2004—Continued(in millions of dollars)
1976 TQ 1977 1978 1979 1980 1981 1982 1983 1984
Hospital insurance trust fund:Cash income:
Social insurance and retirement receipts ................................. 11,987 3,457 13,474 16,668 19,874 23,217 30,340 34,301 35,641 40,262Intragovernmental receipts:
Employer share, employee retirement (951) 2 .................... 175 45 175 206 228 249 332 397 1,054 1,306Interest (902) ....................................................................... 716 12 771 797 883 1,061 1,325 1,873 1,656 1,686Interest from OASI .............................................................. ................ ................ ................ ................ ................ ................ ................ ................ 1,028 1,337Other .................................................................................... 658 ................ 944 860 907 871 834 1,015 4,541 1,106
Total intragovernmental receipts ...................................... 1,549 57 1,890 1,863 2,018 2,182 2,490 3,285 8,279 5,435Other (mainly proprietary) receipts:
Premium income ................................................................. 8 2 11 12 17 17 21 25 26 35Other (after 1984, mainly for kidney dialysis) ..................... * ................ * * 1 * * * 3 *
Total cash income .......................................................... 13,544 3,516 15,374 18,543 21,910 25,415 32,851 37,611 43,949 45,732
Cash outgo:Benefit payments ..................................................................... 12,267 3,314 14,906 17,415 19,898 23,793 28,909 34,344 38,102 41,461Administrative expenses .......................................................... 308 88 295 442 443 486 333 510 519 632Interest on normalized transfers ............................................... ................ ................ ................ ................ ................ ................ ................ ................ 27 187Other ........................................................................................ 4 1 7 4 1 8 7 10 –97 15
Total cash outgo ............................................................. 12,579 3,404 15,207 17,862 20,343 24,288 29,248 34,864 38,551 42,295
Surplus or deficit (–) .................................................................... 966 112 167 681 1,567 1,127 3,603 2,747 5,398 3,437
Lending (–) or repayment of loans to OASI fund ........................ ................ ................ ................ ................ ................ ................ ................ ................ –12,437 ................Fund balance, end of year .......................................................... 10,836 10,948 11,115 11,796 13,363 14,490 18,093 20,840 13,800 17,237
Invested balance .......................................................................... 10,942 11,009 10,974 11,757 13,164 14,656 18,191 20,800 13,514 16,982Uninvested balance ...................................................................... –106 –62 141 39 199 –166 –99 40 286 255
Supplementary medical insurance trust fund:Cash income:
Offsetting collections:Intragovernmental receipts:
Interest (902) ................................................................... 104 4 137 229 363 416 384 473 680 807Federal contributions and other ..................................... 2,939 878 5,053 6,386 6,841 6,932 8,747 13,323 14,238 16,811
Total intragovernmental receipts ................................. 3,043 882 5,190 6,614 7,204 7,347 9,132 13,796 14,918 17,618Premium income:
From aged participants ................................................... 1,769 492 1,987 2,186 2,373 2,637 2,987 3,460 3,834 4,463From all other participants ............................................... 168 46 206 245 263 291 332 371 393 444
Total premium income ................................................ 1,937 539 2,193 2,431 2,636 2,928 3,319 3,831 4,227 4,907Other .................................................................................... * ................ * * * * * * 1 *
Total cash income .......................................................... 4,980 1,421 7,383 9,045 9,840 10,275 12,451 17,627 19,147 22,526
Cash outgo:Benefit payments ..................................................................... 4,671 1,269 5,865 6,852 8,259 10,144 12,345 14,806 17,487 19,475Administrative expenses .......................................................... 528 132 475 494 544 594 889 746 823 899Other ........................................................................................ 1 * 2 4 1 8 7 7 6 ................
Total cash outgo ............................................................. 5,200 1,401 6,342 7,350 8,805 10,746 13,240 15,559 18,317 20,374
Surplus or deficit (–) .................................................................... –220 20 1,041 1,696 1,035 –471 –789 2,068 830 2,151Fund balance at end of year ....................................................... 1,219 1,239 2,279 3,975 5,010 4,539 3,750 5,818 6,648 8,799
Invested balance .......................................................................... 1,230 1,244 2,232 4,021 4,974 4,558 3,821 5,874 6,958 9,117Uninvested balance ...................................................................... –12 –5 47 –45 36 –19 –72 –56 –310 –318
See footnotes at end of table.
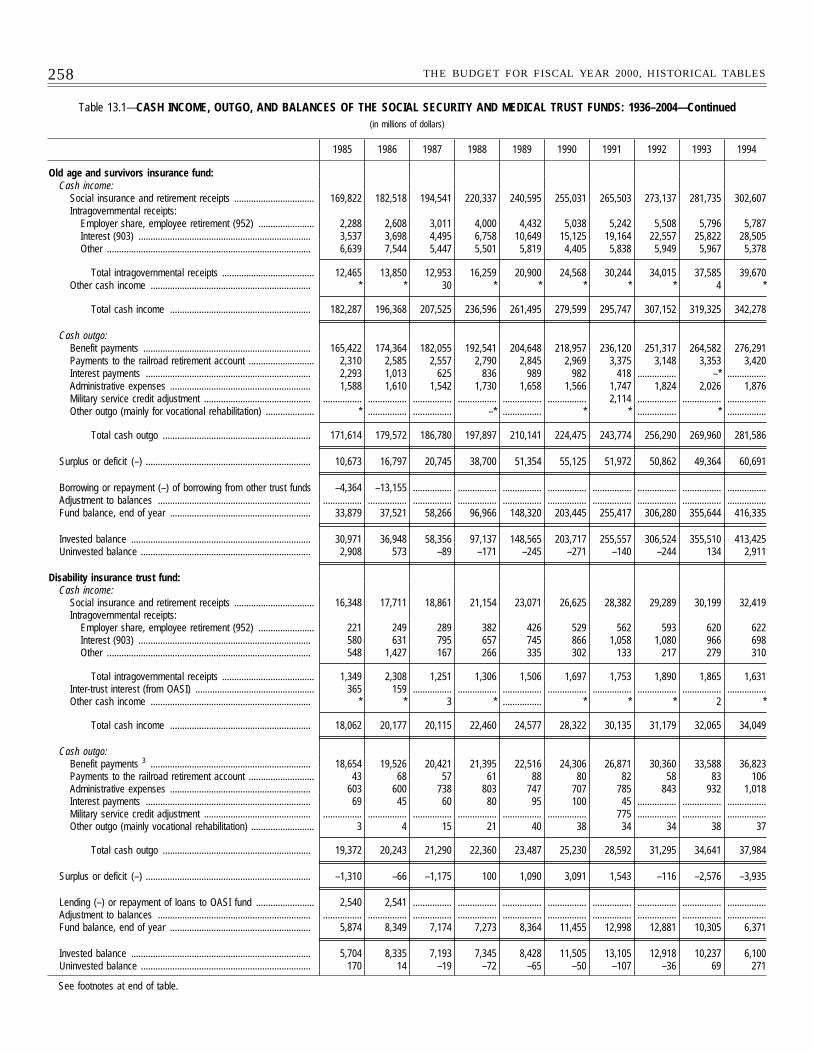
258 THE BUDGET FOR FISCAL YEAR 2000, HISTORICAL TABLES
Table 13.1—CASH INCOME, OUTGO, AND BALANCES OF THE SOCIAL SECURITY AND MEDICAL TRUST FUNDS: 1936–2004—Continued(in millions of dollars)
1985 1986 1987 1988 1989 1990 1991 1992 1993 1994
Old age and survivors insurance fund:Cash income:
Social insurance and retirement receipts ................................. 169,822 182,518 194,541 220,337 240,595 255,031 265,503 273,137 281,735 302,607Intragovernmental receipts:
Employer share, employee retirement (952) ....................... 2,288 2,608 3,011 4,000 4,432 5,038 5,242 5,508 5,796 5,787Interest (903) ....................................................................... 3,537 3,698 4,495 6,758 10,649 15,125 19,164 22,557 25,822 28,505Other .................................................................................... 6,639 7,544 5,447 5,501 5,819 4,405 5,838 5,949 5,967 5,378
Total intragovernmental receipts ...................................... 12,465 13,850 12,953 16,259 20,900 24,568 30,244 34,015 37,585 39,670Other cash income .................................................................. * * 30 * * * * * 4 *
Total cash income .......................................................... 182,287 196,368 207,525 236,596 261,495 279,599 295,747 307,152 319,325 342,278
Cash outgo:Benefit payments ..................................................................... 165,422 174,364 182,055 192,541 204,648 218,957 236,120 251,317 264,582 276,291Payments to the railroad retirement account ........................... 2,310 2,585 2,557 2,790 2,845 2,969 3,375 3,148 3,353 3,420Interest payments .................................................................... 2,293 1,013 625 836 989 982 418 ................ –* ................Administrative expenses .......................................................... 1,588 1,610 1,542 1,730 1,658 1,566 1,747 1,824 2,026 1,876Military service credit adjustment ............................................ ................ ................ ................ ................ ................ ................ 2,114 ................ ................ ................Other outgo (mainly for vocational rehabilitation) .................... * ................ ................ –* ................ * * ................ * ................
Total cash outgo ............................................................. 171,614 179,572 186,780 197,897 210,141 224,475 243,774 256,290 269,960 281,586
Surplus or deficit (–) .................................................................... 10,673 16,797 20,745 38,700 51,354 55,125 51,972 50,862 49,364 60,691
Borrowing or repayment (–) of borrowing from other trust funds –4,364 –13,155 ................ ................ ................ ................ ................ ................ ................ ................Adjustment to balances ............................................................... ................ ................ ................ ................ ................ ................ ................ ................ ................ ................Fund balance, end of year .......................................................... 33,879 37,521 58,266 96,966 148,320 203,445 255,417 306,280 355,644 416,335
Invested balance .......................................................................... 30,971 36,948 58,356 97,137 148,565 203,717 255,557 306,524 355,510 413,425Uninvested balance ...................................................................... 2,908 573 –89 –171 –245 –271 –140 –244 134 2,911
Disability insurance trust fund:Cash income:
Social insurance and retirement receipts ................................. 16,348 17,711 18,861 21,154 23,071 26,625 28,382 29,289 30,199 32,419Intragovernmental receipts:
Employer share, employee retirement (952) ....................... 221 249 289 382 426 529 562 593 620 622Interest (903) ....................................................................... 580 631 795 657 745 866 1,058 1,080 966 698Other .................................................................................... 548 1,427 167 266 335 302 133 217 279 310
Total intragovernmental receipts ...................................... 1,349 2,308 1,251 1,306 1,506 1,697 1,753 1,890 1,865 1,631Inter-trust interest (from OASI) ................................................. 365 159 ................ ................ ................ ................ ................ ................ ................ ................Other cash income .................................................................. * * 3 * ................ * * * 2 *
Total cash income .......................................................... 18,062 20,177 20,115 22,460 24,577 28,322 30,135 31,179 32,065 34,049
Cash outgo:Benefit payments 3 .................................................................. 18,654 19,526 20,421 21,395 22,516 24,306 26,871 30,360 33,588 36,823Payments to the railroad retirement account ........................... 43 68 57 61 88 80 82 58 83 106Administrative expenses .......................................................... 603 600 738 803 747 707 785 843 932 1,018Interest payments .................................................................... 69 45 60 80 95 100 45 ................ ................ ................Military service credit adjustment ............................................ ................ ................ ................ ................ ................ ................ 775 ................ ................ ................Other outgo (mainly vocational rehabilitation) .......................... 3 4 15 21 40 38 34 34 38 37
Total cash outgo ............................................................. 19,372 20,243 21,290 22,360 23,487 25,230 28,592 31,295 34,641 37,984
Surplus or deficit (–) .................................................................... –1,310 –66 –1,175 100 1,090 3,091 1,543 –116 –2,576 –3,935
Lending (–) or repayment of loans to OASI fund ........................ 2,540 2,541 ................ ................ ................ ................ ................ ................ ................ ................Adjustment to balances ............................................................... ................ ................ ................ ................ ................ ................ ................ ................ ................ ................Fund balance, end of year .......................................................... 5,874 8,349 7,174 7,273 8,364 11,455 12,998 12,881 10,305 6,371
Invested balance .......................................................................... 5,704 8,335 7,193 7,345 8,428 11,505 13,105 12,918 10,237 6,100Uninvested balance ...................................................................... 170 14 –19 –72 –65 –50 –107 –36 69 271
See footnotes at end of table.
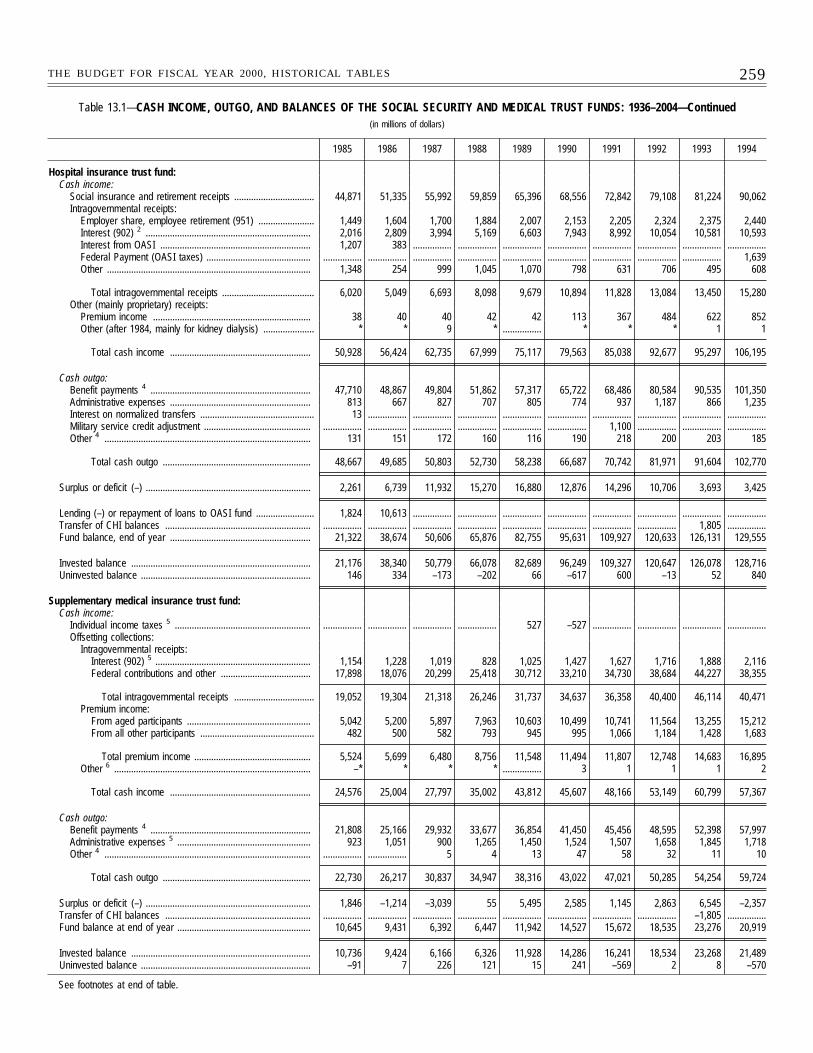
259THE BUDGET FOR FISCAL YEAR 2000, HISTORICAL TABLES
Table 13.1—CASH INCOME, OUTGO, AND BALANCES OF THE SOCIAL SECURITY AND MEDICAL TRUST FUNDS: 1936–2004—Continued(in millions of dollars)
1985 1986 1987 1988 1989 1990 1991 1992 1993 1994
Hospital insurance trust fund:Cash income:
Social insurance and retirement receipts ................................. 44,871 51,335 55,992 59,859 65,396 68,556 72,842 79,108 81,224 90,062Intragovernmental receipts:
Employer share, employee retirement (951) ....................... 1,449 1,604 1,700 1,884 2,007 2,153 2,205 2,324 2,375 2,440Interest (902) 2 .................................................................... 2,016 2,809 3,994 5,169 6,603 7,943 8,992 10,054 10,581 10,593Interest from OASI .............................................................. 1,207 383 ................ ................ ................ ................ ................ ................ ................ ................Federal Payment (OASI taxes) ........................................... ................ ................ ................ ................ ................ ................ ................ ................ ................ 1,639Other .................................................................................... 1,348 254 999 1,045 1,070 798 631 706 495 608
Total intragovernmental receipts ...................................... 6,020 5,049 6,693 8,098 9,679 10,894 11,828 13,084 13,450 15,280Other (mainly proprietary) receipts:
Premium income ................................................................. 38 40 40 42 42 113 367 484 622 852Other (after 1984, mainly for kidney dialysis) ..................... * * 9 * ................ * * * 1 1
Total cash income .......................................................... 50,928 56,424 62,735 67,999 75,117 79,563 85,038 92,677 95,297 106,195
Cash outgo:Benefit payments 4 .................................................................. 47,710 48,867 49,804 51,862 57,317 65,722 68,486 80,584 90,535 101,350Administrative expenses .......................................................... 813 667 827 707 805 774 937 1,187 866 1,235Interest on normalized transfers ............................................... 13 ................ ................ ................ ................ ................ ................ ................ ................ ................Military service credit adjustment ............................................ ................ ................ ................ ................ ................ ................ 1,100 ................ ................ ................Other 4 ..................................................................................... 131 151 172 160 116 190 218 200 203 185
Total cash outgo ............................................................. 48,667 49,685 50,803 52,730 58,238 66,687 70,742 81,971 91,604 102,770
Surplus or deficit (–) .................................................................... 2,261 6,739 11,932 15,270 16,880 12,876 14,296 10,706 3,693 3,425
Lending (–) or repayment of loans to OASI fund ........................ 1,824 10,613 ................ ................ ................ ................ ................ ................ ................ ................Transfer of CHI balances ............................................................ ................ ................ ................ ................ ................ ................ ................ ................ 1,805 ................Fund balance, end of year .......................................................... 21,322 38,674 50,606 65,876 82,755 95,631 109,927 120,633 126,131 129,555
Invested balance .......................................................................... 21,176 38,340 50,779 66,078 82,689 96,249 109,327 120,647 126,078 128,716Uninvested balance ...................................................................... 146 334 –173 –202 66 –617 600 –13 52 840
Supplementary medical insurance trust fund:Cash income:
Individual income taxes 5 ........................................................ ................ ................ ................ ................ 527 –527 ................ ................ ................ ................Offsetting collections:
Intragovernmental receipts:Interest (902) 5 ................................................................ 1,154 1,228 1,019 828 1,025 1,427 1,627 1,716 1,888 2,116Federal contributions and other ..................................... 17,898 18,076 20,299 25,418 30,712 33,210 34,730 38,684 44,227 38,355
Total intragovernmental receipts ................................. 19,052 19,304 21,318 26,246 31,737 34,637 36,358 40,400 46,114 40,471Premium income:
From aged participants ................................................... 5,042 5,200 5,897 7,963 10,603 10,499 10,741 11,564 13,255 15,212From all other participants ............................................... 482 500 582 793 945 995 1,066 1,184 1,428 1,683
Total premium income ................................................ 5,524 5,699 6,480 8,756 11,548 11,494 11,807 12,748 14,683 16,895Other 6 ................................................................................. –* * * * ................ 3 1 1 1 2
Total cash income .......................................................... 24,576 25,004 27,797 35,002 43,812 45,607 48,166 53,149 60,799 57,367
Cash outgo:Benefit payments 4 .................................................................. 21,808 25,166 29,932 33,677 36,854 41,450 45,456 48,595 52,398 57,997Administrative expenses 5 ....................................................... 923 1,051 900 1,265 1,450 1,524 1,507 1,658 1,845 1,718Other 4 ..................................................................................... ................ ................ 5 4 13 47 58 32 11 10
Total cash outgo ............................................................. 22,730 26,217 30,837 34,947 38,316 43,022 47,021 50,285 54,254 59,724
Surplus or deficit (–) .................................................................... 1,846 –1,214 –3,039 55 5,495 2,585 1,145 2,863 6,545 –2,357Transfer of CHI balances ............................................................ ................ ................ ................ ................ ................ ................ ................ ................ –1,805 ................Fund balance at end of year ....................................................... 10,645 9,431 6,392 6,447 11,942 14,527 15,672 18,535 23,276 20,919
Invested balance .......................................................................... 10,736 9,424 6,166 6,326 11,928 14,286 16,241 18,534 23,268 21,489Uninvested balance ...................................................................... –91 7 226 121 15 241 –569 2 8 –570
See footnotes at end of table.
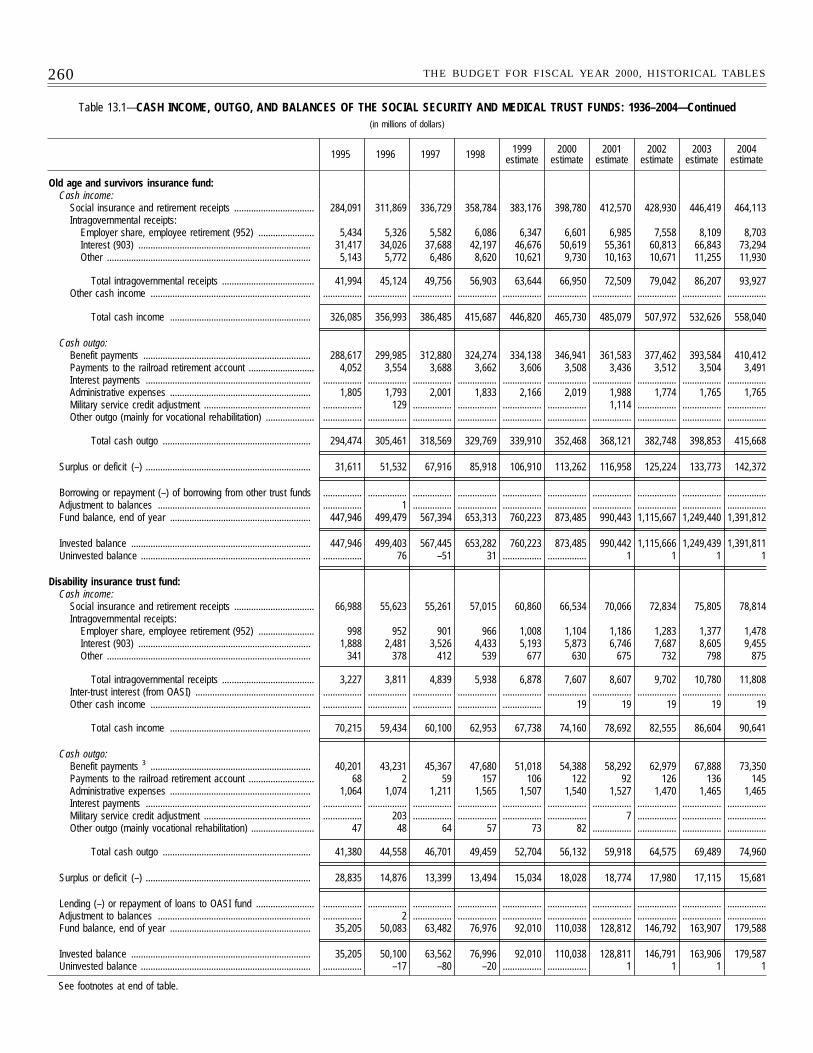
260 THE BUDGET FOR FISCAL YEAR 2000, HISTORICAL TABLES
Table 13.1—CASH INCOME, OUTGO, AND BALANCES OF THE SOCIAL SECURITY AND MEDICAL TRUST FUNDS: 1936–2004—Continued(in millions of dollars)
1995 1996 1997 1998 1999estimate
2000estimate
2001estimate
2002estimate
2003estimate
2004estimate
Old age and survivors insurance fund:Cash income:
Social insurance and retirement receipts ................................. 284,091 311,869 336,729 358,784 383,176 398,780 412,570 428,930 446,419 464,113Intragovernmental receipts:
Employer share, employee retirement (952) ....................... 5,434 5,326 5,582 6,086 6,347 6,601 6,985 7,558 8,109 8,703Interest (903) ....................................................................... 31,417 34,026 37,688 42,197 46,676 50,619 55,361 60,813 66,843 73,294Other .................................................................................... 5,143 5,772 6,486 8,620 10,621 9,730 10,163 10,671 11,255 11,930
Total intragovernmental receipts ...................................... 41,994 45,124 49,756 56,903 63,644 66,950 72,509 79,042 86,207 93,927Other cash income .................................................................. ................ ................ ................ ................ ................ ................ ................ ................ ................ ................
Total cash income .......................................................... 326,085 356,993 386,485 415,687 446,820 465,730 485,079 507,972 532,626 558,040
Cash outgo:Benefit payments ..................................................................... 288,617 299,985 312,880 324,274 334,138 346,941 361,583 377,462 393,584 410,412Payments to the railroad retirement account ........................... 4,052 3,554 3,688 3,662 3,606 3,508 3,436 3,512 3,504 3,491Interest payments .................................................................... ................ ................ ................ ................ ................ ................ ................ ................ ................ ................Administrative expenses .......................................................... 1,805 1,793 2,001 1,833 2,166 2,019 1,988 1,774 1,765 1,765Military service credit adjustment ............................................ ................ 129 ................ ................ ................ ................ 1,114 ................ ................ ................Other outgo (mainly for vocational rehabilitation) .................... ................ ................ ................ ................ ................ ................ ................ ................ ................ ................
Total cash outgo ............................................................. 294,474 305,461 318,569 329,769 339,910 352,468 368,121 382,748 398,853 415,668
Surplus or deficit (–) .................................................................... 31,611 51,532 67,916 85,918 106,910 113,262 116,958 125,224 133,773 142,372
Borrowing or repayment (–) of borrowing from other trust funds ................ ................ ................ ................ ................ ................ ................ ................ ................ ................Adjustment to balances ............................................................... ................ 1 ................ ................ ................ ................ ................ ................ ................ ................Fund balance, end of year .......................................................... 447,946 499,479 567,394 653,313 760,223 873,485 990,443 1,115,667 1,249,440 1,391,812
Invested balance .......................................................................... 447,946 499,403 567,445 653,282 760,223 873,485 990,442 1,115,666 1,249,439 1,391,811Uninvested balance ...................................................................... ................ 76 –51 31 ................ ................ 1 1 1 1
Disability insurance trust fund:Cash income:
Social insurance and retirement receipts ................................. 66,988 55,623 55,261 57,015 60,860 66,534 70,066 72,834 75,805 78,814Intragovernmental receipts:
Employer share, employee retirement (952) ....................... 998 952 901 966 1,008 1,104 1,186 1,283 1,377 1,478Interest (903) ....................................................................... 1,888 2,481 3,526 4,433 5,193 5,873 6,746 7,687 8,605 9,455Other .................................................................................... 341 378 412 539 677 630 675 732 798 875
Total intragovernmental receipts ...................................... 3,227 3,811 4,839 5,938 6,878 7,607 8,607 9,702 10,780 11,808Inter-trust interest (from OASI) ................................................. ................ ................ ................ ................ ................ ................ ................ ................ ................ ................Other cash income .................................................................. ................ ................ ................ ................ ................ 19 19 19 19 19
Total cash income .......................................................... 70,215 59,434 60,100 62,953 67,738 74,160 78,692 82,555 86,604 90,641
Cash outgo:Benefit payments 3 .................................................................. 40,201 43,231 45,367 47,680 51,018 54,388 58,292 62,979 67,888 73,350Payments to the railroad retirement account ........................... 68 2 59 157 106 122 92 126 136 145Administrative expenses .......................................................... 1,064 1,074 1,211 1,565 1,507 1,540 1,527 1,470 1,465 1,465Interest payments .................................................................... ................ ................ ................ ................ ................ ................ ................ ................ ................ ................Military service credit adjustment ............................................ ................ 203 ................ ................ ................ ................ 7 ................ ................ ................Other outgo (mainly vocational rehabilitation) .......................... 47 48 64 57 73 82 ................ ................ ................ ................
Total cash outgo ............................................................. 41,380 44,558 46,701 49,459 52,704 56,132 59,918 64,575 69,489 74,960
Surplus or deficit (–) .................................................................... 28,835 14,876 13,399 13,494 15,034 18,028 18,774 17,980 17,115 15,681
Lending (–) or repayment of loans to OASI fund ........................ ................ ................ ................ ................ ................ ................ ................ ................ ................ ................Adjustment to balances ............................................................... ................ 2 ................ ................ ................ ................ ................ ................ ................ ................Fund balance, end of year .......................................................... 35,205 50,083 63,482 76,976 92,010 110,038 128,812 146,792 163,907 179,588
Invested balance .......................................................................... 35,205 50,100 63,562 76,996 92,010 110,038 128,811 146,791 163,906 179,587Uninvested balance ...................................................................... ................ –17 –80 –20 ................ ................ 1 1 1 1
See footnotes at end of table.
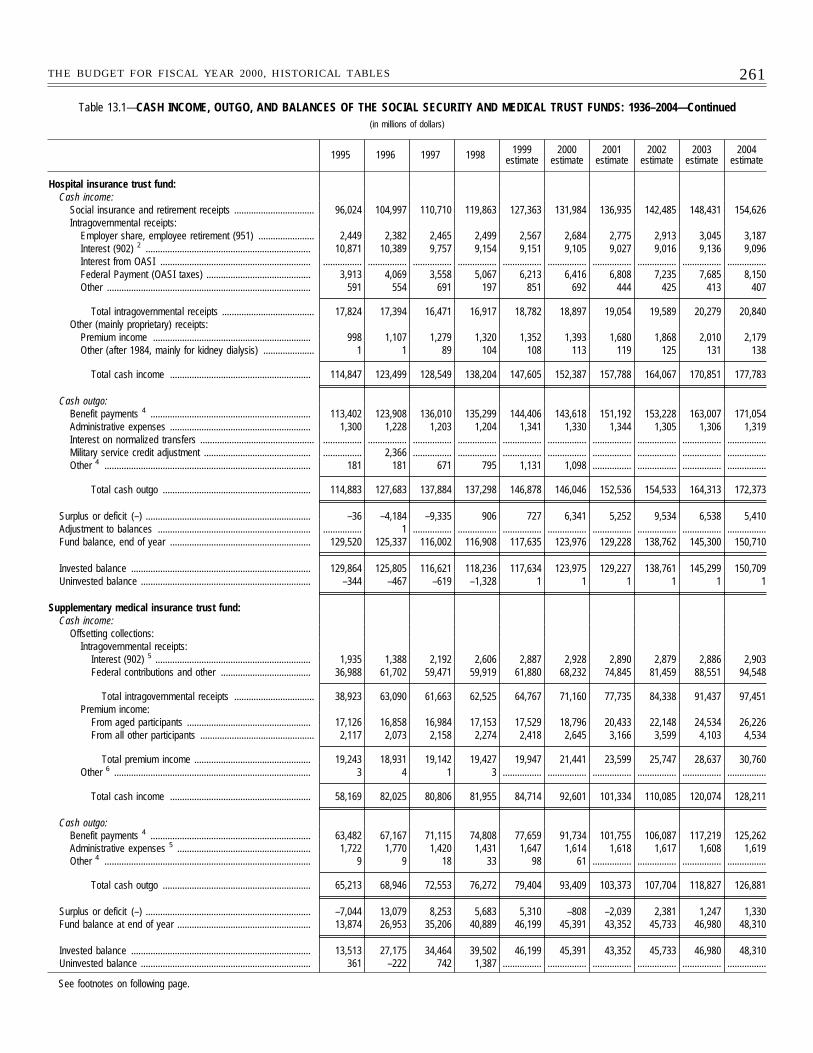
261THE BUDGET FOR FISCAL YEAR 2000, HISTORICAL TABLES
Table 13.1—CASH INCOME, OUTGO, AND BALANCES OF THE SOCIAL SECURITY AND MEDICAL TRUST FUNDS: 1936–2004—Continued(in millions of dollars)
1995 1996 1997 1998 1999estimate
2000estimate
2001estimate
2002estimate
2003estimate
2004estimate
Hospital insurance trust fund:Cash income:
Social insurance and retirement receipts ................................. 96,024 104,997 110,710 119,863 127,363 131,984 136,935 142,485 148,431 154,626Intragovernmental receipts:
Employer share, employee retirement (951) ....................... 2,449 2,382 2,465 2,499 2,567 2,684 2,775 2,913 3,045 3,187Interest (902) 2 .................................................................... 10,871 10,389 9,757 9,154 9,151 9,105 9,027 9,016 9,136 9,096Interest from OASI .............................................................. ................ ................ ................ ................ ................ ................ ................ ................ ................ ................Federal Payment (OASI taxes) ........................................... 3,913 4,069 3,558 5,067 6,213 6,416 6,808 7,235 7,685 8,150Other .................................................................................... 591 554 691 197 851 692 444 425 413 407
Total intragovernmental receipts ...................................... 17,824 17,394 16,471 16,917 18,782 18,897 19,054 19,589 20,279 20,840Other (mainly proprietary) receipts:
Premium income ................................................................. 998 1,107 1,279 1,320 1,352 1,393 1,680 1,868 2,010 2,179Other (after 1984, mainly for kidney dialysis) ..................... 1 1 89 104 108 113 119 125 131 138
Total cash income .......................................................... 114,847 123,499 128,549 138,204 147,605 152,387 157,788 164,067 170,851 177,783
Cash outgo:Benefit payments 4 .................................................................. 113,402 123,908 136,010 135,299 144,406 143,618 151,192 153,228 163,007 171,054Administrative expenses .......................................................... 1,300 1,228 1,203 1,204 1,341 1,330 1,344 1,305 1,306 1,319Interest on normalized transfers ............................................... ................ ................ ................ ................ ................ ................ ................ ................ ................ ................Military service credit adjustment ............................................ ................ 2,366 ................ ................ ................ ................ ................ ................ ................ ................Other 4 ..................................................................................... 181 181 671 795 1,131 1,098 ................ ................ ................ ................
Total cash outgo ............................................................. 114,883 127,683 137,884 137,298 146,878 146,046 152,536 154,533 164,313 172,373
Surplus or deficit (–) .................................................................... –36 –4,184 –9,335 906 727 6,341 5,252 9,534 6,538 5,410Adjustment to balances ............................................................... ................ 1 ................ ................ ................ ................ ................ ................ ................ ................Fund balance, end of year .......................................................... 129,520 125,337 116,002 116,908 117,635 123,976 129,228 138,762 145,300 150,710
Invested balance .......................................................................... 129,864 125,805 116,621 118,236 117,634 123,975 129,227 138,761 145,299 150,709Uninvested balance ...................................................................... –344 –467 –619 –1,328 1 1 1 1 1 1
Supplementary medical insurance trust fund:Cash income:
Offsetting collections:Intragovernmental receipts:
Interest (902) 5 ................................................................ 1,935 1,388 2,192 2,606 2,887 2,928 2,890 2,879 2,886 2,903Federal contributions and other ..................................... 36,988 61,702 59,471 59,919 61,880 68,232 74,845 81,459 88,551 94,548
Total intragovernmental receipts ................................. 38,923 63,090 61,663 62,525 64,767 71,160 77,735 84,338 91,437 97,451Premium income:
From aged participants ................................................... 17,126 16,858 16,984 17,153 17,529 18,796 20,433 22,148 24,534 26,226From all other participants ............................................... 2,117 2,073 2,158 2,274 2,418 2,645 3,166 3,599 4,103 4,534
Total premium income ................................................ 19,243 18,931 19,142 19,427 19,947 21,441 23,599 25,747 28,637 30,760Other 6 ................................................................................. 3 4 1 3 ................ ................ ................ ................ ................ ................
Total cash income .......................................................... 58,169 82,025 80,806 81,955 84,714 92,601 101,334 110,085 120,074 128,211
Cash outgo:Benefit payments 4 .................................................................. 63,482 67,167 71,115 74,808 77,659 91,734 101,755 106,087 117,219 125,262Administrative expenses 5 ....................................................... 1,722 1,770 1,420 1,431 1,647 1,614 1,618 1,617 1,608 1,619Other 4 ..................................................................................... 9 9 18 33 98 61 ................ ................ ................ ................
Total cash outgo ............................................................. 65,213 68,946 72,553 76,272 79,404 93,409 103,373 107,704 118,827 126,881
Surplus or deficit (–) .................................................................... –7,044 13,079 8,253 5,683 5,310 –808 –2,039 2,381 1,247 1,330Fund balance at end of year ....................................................... 13,874 26,953 35,206 40,889 46,199 45,391 43,352 45,733 46,980 48,310
Invested balance .......................................................................... 13,513 27,175 34,464 39,502 46,199 45,391 43,352 45,733 46,980 48,310Uninvested balance ...................................................................... 361 –222 742 1,387 ................ ................ ................ ................ ................ ................
See footnotes on following page.

262 THE BUDGET FOR FISCAL YEAR 2000, HISTORICAL TABLES
* $500 thousand or less.1 In 1983, includes $329.3 million loss on sale of securities.2 Starting in 1983, includes amounts from Postal Service.3 For years after 2000, includes outlays for vocational rehabilitation.4 For years after 2000, outlays for peer review organizations are included in the benefit payments line.5 For 1989 and 1990, includes transactions and balances of the HI and SMI Catastrophic Insurance trust funds, which began in 1989 and were abolished in 1990.6 For years after 1986, receipts for kidney dialysis.Note: Offsetting collections from Federal sources that are credited to the Old Age and Survivors insurance account are treated as offsets to cash outgo rather than as cash
income. For years after 2000, reimbursements to Treasury for administrative services to each of the four Social Security trust funds are included in the benefit payments line, rath-er than in the administrative expenses line.
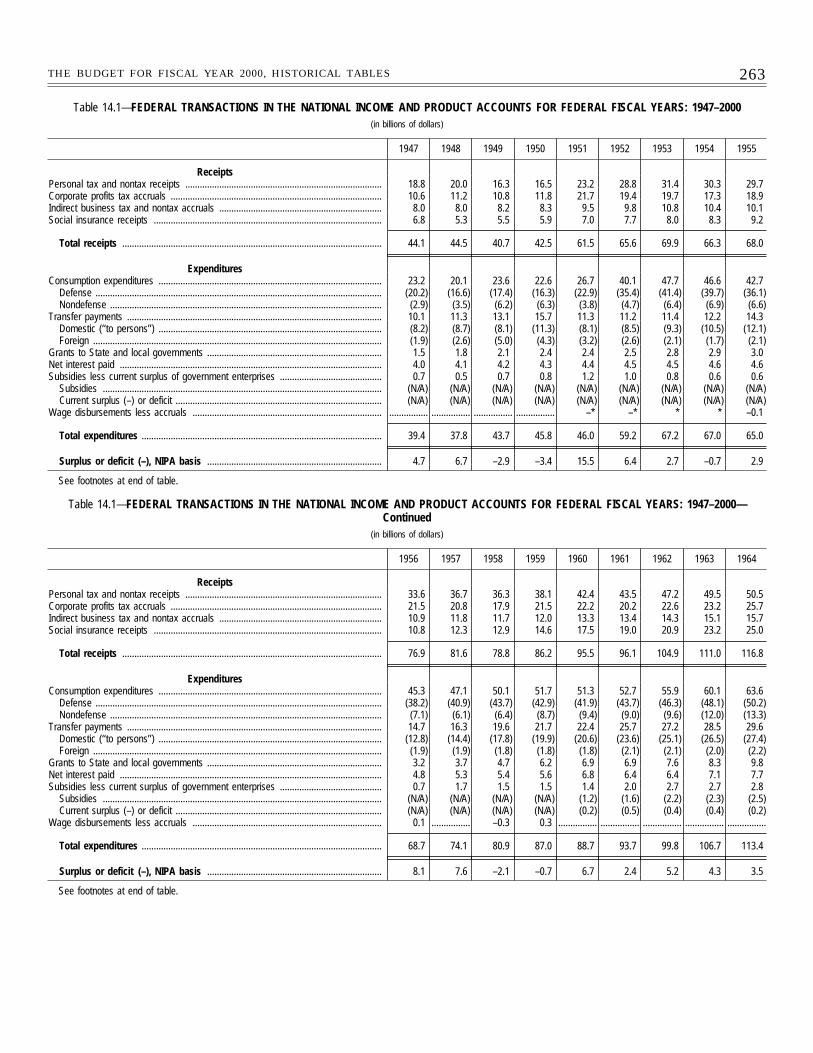
263THE BUDGET FOR FISCAL YEAR 2000, HISTORICAL TABLES
Table 14.1—FEDERAL TRANSACTIONS IN THE NATIONAL INCOME AND PRODUCT ACCOUNTS FOR FEDERAL FISCAL YEARS: 1947–2000(in billions of dollars)
1947 1948 1949 1950 1951 1952 1953 1954 1955
ReceiptsPersonal tax and nontax receipts ................................................................................. 18.8 20.0 16.3 16.5 23.2 28.8 31.4 30.3 29.7Corporate profits tax accruals ....................................................................................... 10.6 11.2 10.8 11.8 21.7 19.4 19.7 17.3 18.9Indirect business tax and nontax accruals ................................................................... 8.0 8.0 8.2 8.3 9.5 9.8 10.8 10.4 10.1Social insurance receipts .............................................................................................. 6.8 5.3 5.5 5.9 7.0 7.7 8.0 8.3 9.2
Total receipts ........................................................................................................... 44.1 44.5 40.7 42.5 61.5 65.6 69.9 66.3 68.0
ExpendituresConsumption expenditures ............................................................................................ 23.2 20.1 23.6 22.6 26.7 40.1 47.7 46.6 42.7
Defense ...................................................................................................................... (20.2) (16.6) (17.4) (16.3) (22.9) (35.4) (41.4) (39.7) (36.1)Nondefense ................................................................................................................ (2.9) (3.5) (6.2) (6.3) (3.8) (4.7) (6.4) (6.9) (6.6)
Transfer payments ......................................................................................................... 10.1 11.3 13.1 15.7 11.3 11.2 11.4 12.2 14.3Domestic (‘‘to persons’’) ............................................................................................ (8.2) (8.7) (8.1) (11.3) (8.1) (8.5) (9.3) (10.5) (12.1)Foreign ....................................................................................................................... (1.9) (2.6) (5.0) (4.3) (3.2) (2.6) (2.1) (1.7) (2.1)
Grants to State and local governments ........................................................................ 1.5 1.8 2.1 2.4 2.4 2.5 2.8 2.9 3.0Net interest paid ............................................................................................................ 4.0 4.1 4.2 4.3 4.4 4.5 4.5 4.6 4.6Subsidies less current surplus of government enterprises .......................................... 0.7 0.5 0.7 0.8 1.2 1.0 0.8 0.6 0.6
Subsidies ................................................................................................................... (N/A) (N/A) (N/A) (N/A) (N/A) (N/A) (N/A) (N/A) (N/A)Current surplus (–) or deficit ..................................................................................... (N/A) (N/A) (N/A) (N/A) (N/A) (N/A) (N/A) (N/A) (N/A)
Wage disbursements less accruals .............................................................................. ................ ................ ................ ................ –* –* * * –0.1
Total expenditures ................................................................................................... 39.4 37.8 43.7 45.8 46.0 59.2 67.2 67.0 65.0
Surplus or deficit (–), NIPA basis ........................................................................ 4.7 6.7 –2.9 –3.4 15.5 6.4 2.7 –0.7 2.9
See footnotes at end of table.
Table 14.1—FEDERAL TRANSACTIONS IN THE NATIONAL INCOME AND PRODUCT ACCOUNTS FOR FEDERAL FISCAL YEARS: 1947–2000—Continued
(in billions of dollars)
1956 1957 1958 1959 1960 1961 1962 1963 1964
ReceiptsPersonal tax and nontax receipts ................................................................................. 33.6 36.7 36.3 38.1 42.4 43.5 47.2 49.5 50.5Corporate profits tax accruals ....................................................................................... 21.5 20.8 17.9 21.5 22.2 20.2 22.6 23.2 25.7Indirect business tax and nontax accruals ................................................................... 10.9 11.8 11.7 12.0 13.3 13.4 14.3 15.1 15.7Social insurance receipts .............................................................................................. 10.8 12.3 12.9 14.6 17.5 19.0 20.9 23.2 25.0
Total receipts ........................................................................................................... 76.9 81.6 78.8 86.2 95.5 96.1 104.9 111.0 116.8
ExpendituresConsumption expenditures ............................................................................................ 45.3 47.1 50.1 51.7 51.3 52.7 55.9 60.1 63.6
Defense ...................................................................................................................... (38.2) (40.9) (43.7) (42.9) (41.9) (43.7) (46.3) (48.1) (50.2)Nondefense ................................................................................................................ (7.1) (6.1) (6.4) (8.7) (9.4) (9.0) (9.6) (12.0) (13.3)
Transfer payments ......................................................................................................... 14.7 16.3 19.6 21.7 22.4 25.7 27.2 28.5 29.6Domestic (‘‘to persons’’) ............................................................................................ (12.8) (14.4) (17.8) (19.9) (20.6) (23.6) (25.1) (26.5) (27.4)Foreign ....................................................................................................................... (1.9) (1.9) (1.8) (1.8) (1.8) (2.1) (2.1) (2.0) (2.2)
Grants to State and local governments ........................................................................ 3.2 3.7 4.7 6.2 6.9 6.9 7.6 8.3 9.8Net interest paid ............................................................................................................ 4.8 5.3 5.4 5.6 6.8 6.4 6.4 7.1 7.7Subsidies less current surplus of government enterprises .......................................... 0.7 1.7 1.5 1.5 1.4 2.0 2.7 2.7 2.8
Subsidies ................................................................................................................... (N/A) (N/A) (N/A) (N/A) (1.2) (1.6) (2.2) (2.3) (2.5)Current surplus (–) or deficit ..................................................................................... (N/A) (N/A) (N/A) (N/A) (0.2) (0.5) (0.4) (0.4) (0.2)
Wage disbursements less accruals .............................................................................. 0.1 ................ –0.3 0.3 ................ ................ ................ ................ ................
Total expenditures ................................................................................................... 68.7 74.1 80.9 87.0 88.7 93.7 99.8 106.7 113.4
Surplus or deficit (–), NIPA basis ........................................................................ 8.1 7.6 –2.1 –0.7 6.7 2.4 5.2 4.3 3.5
See footnotes at end of table.
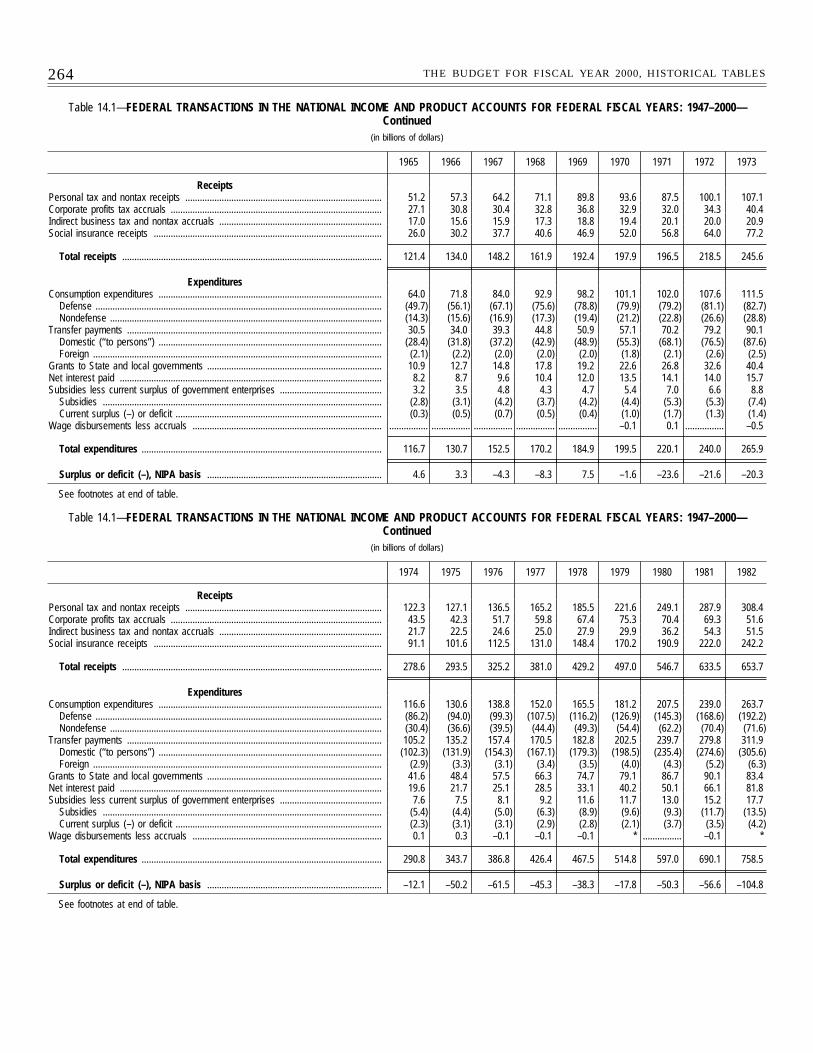
264 THE BUDGET FOR FISCAL YEAR 2000, HISTORICAL TABLES
Table 14.1—FEDERAL TRANSACTIONS IN THE NATIONAL INCOME AND PRODUCT ACCOUNTS FOR FEDERAL FISCAL YEARS: 1947–2000—Continued
(in billions of dollars)
1965 1966 1967 1968 1969 1970 1971 1972 1973
ReceiptsPersonal tax and nontax receipts ................................................................................. 51.2 57.3 64.2 71.1 89.8 93.6 87.5 100.1 107.1Corporate profits tax accruals ....................................................................................... 27.1 30.8 30.4 32.8 36.8 32.9 32.0 34.3 40.4Indirect business tax and nontax accruals ................................................................... 17.0 15.6 15.9 17.3 18.8 19.4 20.1 20.0 20.9Social insurance receipts .............................................................................................. 26.0 30.2 37.7 40.6 46.9 52.0 56.8 64.0 77.2
Total receipts ........................................................................................................... 121.4 134.0 148.2 161.9 192.4 197.9 196.5 218.5 245.6
ExpendituresConsumption expenditures ............................................................................................ 64.0 71.8 84.0 92.9 98.2 101.1 102.0 107.6 111.5
Defense ...................................................................................................................... (49.7) (56.1) (67.1) (75.6) (78.8) (79.9) (79.2) (81.1) (82.7)Nondefense ................................................................................................................ (14.3) (15.6) (16.9) (17.3) (19.4) (21.2) (22.8) (26.6) (28.8)
Transfer payments ......................................................................................................... 30.5 34.0 39.3 44.8 50.9 57.1 70.2 79.2 90.1Domestic (‘‘to persons’’) ............................................................................................ (28.4) (31.8) (37.2) (42.9) (48.9) (55.3) (68.1) (76.5) (87.6)Foreign ....................................................................................................................... (2.1) (2.2) (2.0) (2.0) (2.0) (1.8) (2.1) (2.6) (2.5)
Grants to State and local governments ........................................................................ 10.9 12.7 14.8 17.8 19.2 22.6 26.8 32.6 40.4Net interest paid ............................................................................................................ 8.2 8.7 9.6 10.4 12.0 13.5 14.1 14.0 15.7Subsidies less current surplus of government enterprises .......................................... 3.2 3.5 4.8 4.3 4.7 5.4 7.0 6.6 8.8
Subsidies ................................................................................................................... (2.8) (3.1) (4.2) (3.7) (4.2) (4.4) (5.3) (5.3) (7.4)Current surplus (–) or deficit ..................................................................................... (0.3) (0.5) (0.7) (0.5) (0.4) (1.0) (1.7) (1.3) (1.4)
Wage disbursements less accruals .............................................................................. ................ ................ ................ ................ ................ –0.1 0.1 ................ –0.5
Total expenditures ................................................................................................... 116.7 130.7 152.5 170.2 184.9 199.5 220.1 240.0 265.9
Surplus or deficit (–), NIPA basis ........................................................................ 4.6 3.3 –4.3 –8.3 7.5 –1.6 –23.6 –21.6 –20.3
See footnotes at end of table.
Table 14.1—FEDERAL TRANSACTIONS IN THE NATIONAL INCOME AND PRODUCT ACCOUNTS FOR FEDERAL FISCAL YEARS: 1947–2000—Continued
(in billions of dollars)
1974 1975 1976 1977 1978 1979 1980 1981 1982
ReceiptsPersonal tax and nontax receipts ................................................................................. 122.3 127.1 136.5 165.2 185.5 221.6 249.1 287.9 308.4Corporate profits tax accruals ....................................................................................... 43.5 42.3 51.7 59.8 67.4 75.3 70.4 69.3 51.6Indirect business tax and nontax accruals ................................................................... 21.7 22.5 24.6 25.0 27.9 29.9 36.2 54.3 51.5Social insurance receipts .............................................................................................. 91.1 101.6 112.5 131.0 148.4 170.2 190.9 222.0 242.2
Total receipts ........................................................................................................... 278.6 293.5 325.2 381.0 429.2 497.0 546.7 633.5 653.7
ExpendituresConsumption expenditures ............................................................................................ 116.6 130.6 138.8 152.0 165.5 181.2 207.5 239.0 263.7
Defense ...................................................................................................................... (86.2) (94.0) (99.3) (107.5) (116.2) (126.9) (145.3) (168.6) (192.2)Nondefense ................................................................................................................ (30.4) (36.6) (39.5) (44.4) (49.3) (54.4) (62.2) (70.4) (71.6)
Transfer payments ......................................................................................................... 105.2 135.2 157.4 170.5 182.8 202.5 239.7 279.8 311.9Domestic (‘‘to persons’’) ............................................................................................ (102.3) (131.9) (154.3) (167.1) (179.3) (198.5) (235.4) (274.6) (305.6)Foreign ....................................................................................................................... (2.9) (3.3) (3.1) (3.4) (3.5) (4.0) (4.3) (5.2) (6.3)
Grants to State and local governments ........................................................................ 41.6 48.4 57.5 66.3 74.7 79.1 86.7 90.1 83.4Net interest paid ............................................................................................................ 19.6 21.7 25.1 28.5 33.1 40.2 50.1 66.1 81.8Subsidies less current surplus of government enterprises .......................................... 7.6 7.5 8.1 9.2 11.6 11.7 13.0 15.2 17.7
Subsidies ................................................................................................................... (5.4) (4.4) (5.0) (6.3) (8.9) (9.6) (9.3) (11.7) (13.5)Current surplus (–) or deficit ..................................................................................... (2.3) (3.1) (3.1) (2.9) (2.8) (2.1) (3.7) (3.5) (4.2)
Wage disbursements less accruals .............................................................................. 0.1 0.3 –0.1 –0.1 –0.1 * ................ –0.1 *
Total expenditures ................................................................................................... 290.8 343.7 386.8 426.4 467.5 514.8 597.0 690.1 758.5
Surplus or deficit (–), NIPA basis ........................................................................ –12.1 –50.2 –61.5 –45.3 –38.3 –17.8 –50.3 –56.6 –104.8
See footnotes at end of table.
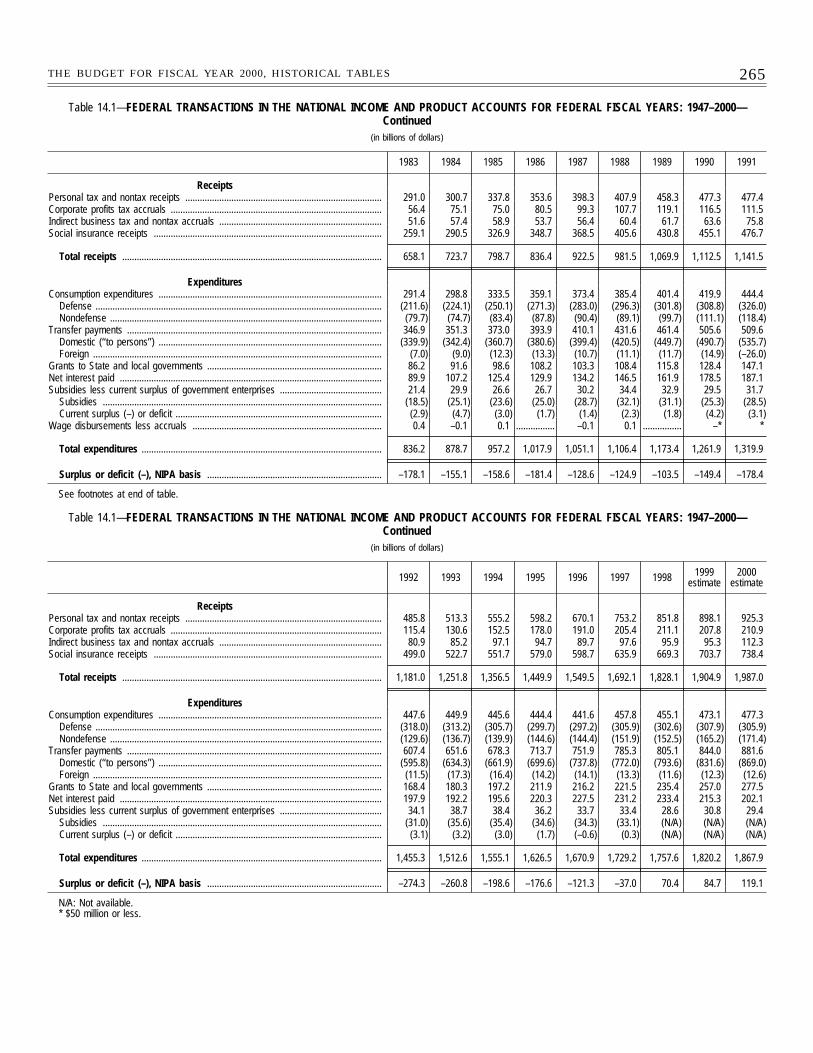
265THE BUDGET FOR FISCAL YEAR 2000, HISTORICAL TABLES
Table 14.1—FEDERAL TRANSACTIONS IN THE NATIONAL INCOME AND PRODUCT ACCOUNTS FOR FEDERAL FISCAL YEARS: 1947–2000—Continued
(in billions of dollars)
1983 1984 1985 1986 1987 1988 1989 1990 1991
ReceiptsPersonal tax and nontax receipts ................................................................................. 291.0 300.7 337.8 353.6 398.3 407.9 458.3 477.3 477.4Corporate profits tax accruals ....................................................................................... 56.4 75.1 75.0 80.5 99.3 107.7 119.1 116.5 111.5Indirect business tax and nontax accruals ................................................................... 51.6 57.4 58.9 53.7 56.4 60.4 61.7 63.6 75.8Social insurance receipts .............................................................................................. 259.1 290.5 326.9 348.7 368.5 405.6 430.8 455.1 476.7
Total receipts ........................................................................................................... 658.1 723.7 798.7 836.4 922.5 981.5 1,069.9 1,112.5 1,141.5
ExpendituresConsumption expenditures ............................................................................................ 291.4 298.8 333.5 359.1 373.4 385.4 401.4 419.9 444.4
Defense ...................................................................................................................... (211.6) (224.1) (250.1) (271.3) (283.0) (296.3) (301.8) (308.8) (326.0)Nondefense ................................................................................................................ (79.7) (74.7) (83.4) (87.8) (90.4) (89.1) (99.7) (111.1) (118.4)
Transfer payments ......................................................................................................... 346.9 351.3 373.0 393.9 410.1 431.6 461.4 505.6 509.6Domestic (‘‘to persons’’) ............................................................................................ (339.9) (342.4) (360.7) (380.6) (399.4) (420.5) (449.7) (490.7) (535.7)Foreign ....................................................................................................................... (7.0) (9.0) (12.3) (13.3) (10.7) (11.1) (11.7) (14.9) (–26.0)
Grants to State and local governments ........................................................................ 86.2 91.6 98.6 108.2 103.3 108.4 115.8 128.4 147.1Net interest paid ............................................................................................................ 89.9 107.2 125.4 129.9 134.2 146.5 161.9 178.5 187.1Subsidies less current surplus of government enterprises .......................................... 21.4 29.9 26.6 26.7 30.2 34.4 32.9 29.5 31.7
Subsidies ................................................................................................................... (18.5) (25.1) (23.6) (25.0) (28.7) (32.1) (31.1) (25.3) (28.5)Current surplus (–) or deficit ..................................................................................... (2.9) (4.7) (3.0) (1.7) (1.4) (2.3) (1.8) (4.2) (3.1)
Wage disbursements less accruals .............................................................................. 0.4 –0.1 0.1 ................ –0.1 0.1 ................ –* *
Total expenditures ................................................................................................... 836.2 878.7 957.2 1,017.9 1,051.1 1,106.4 1,173.4 1,261.9 1,319.9
Surplus or deficit (–), NIPA basis ........................................................................ –178.1 –155.1 –158.6 –181.4 –128.6 –124.9 –103.5 –149.4 –178.4
See footnotes at end of table.
Table 14.1—FEDERAL TRANSACTIONS IN THE NATIONAL INCOME AND PRODUCT ACCOUNTS FOR FEDERAL FISCAL YEARS: 1947–2000—Continued
(in billions of dollars)
1992 1993 1994 1995 1996 1997 1998 1999estimate
2000estimate
ReceiptsPersonal tax and nontax receipts ................................................................................. 485.8 513.3 555.2 598.2 670.1 753.2 851.8 898.1 925.3Corporate profits tax accruals ....................................................................................... 115.4 130.6 152.5 178.0 191.0 205.4 211.1 207.8 210.9Indirect business tax and nontax accruals ................................................................... 80.9 85.2 97.1 94.7 89.7 97.6 95.9 95.3 112.3Social insurance receipts .............................................................................................. 499.0 522.7 551.7 579.0 598.7 635.9 669.3 703.7 738.4
Total receipts ........................................................................................................... 1,181.0 1,251.8 1,356.5 1,449.9 1,549.5 1,692.1 1,828.1 1,904.9 1,987.0
ExpendituresConsumption expenditures ............................................................................................ 447.6 449.9 445.6 444.4 441.6 457.8 455.1 473.1 477.3
Defense ...................................................................................................................... (318.0) (313.2) (305.7) (299.7) (297.2) (305.9) (302.6) (307.9) (305.9)Nondefense ................................................................................................................ (129.6) (136.7) (139.9) (144.6) (144.4) (151.9) (152.5) (165.2) (171.4)
Transfer payments ......................................................................................................... 607.4 651.6 678.3 713.7 751.9 785.3 805.1 844.0 881.6Domestic (‘‘to persons’’) ............................................................................................ (595.8) (634.3) (661.9) (699.6) (737.8) (772.0) (793.6) (831.6) (869.0)Foreign ....................................................................................................................... (11.5) (17.3) (16.4) (14.2) (14.1) (13.3) (11.6) (12.3) (12.6)
Grants to State and local governments ........................................................................ 168.4 180.3 197.2 211.9 216.2 221.5 235.4 257.0 277.5Net interest paid ............................................................................................................ 197.9 192.2 195.6 220.3 227.5 231.2 233.4 215.3 202.1Subsidies less current surplus of government enterprises .......................................... 34.1 38.7 38.4 36.2 33.7 33.4 28.6 30.8 29.4
Subsidies ................................................................................................................... (31.0) (35.6) (35.4) (34.6) (34.3) (33.1) (N/A) (N/A) (N/A)Current surplus (–) or deficit ..................................................................................... (3.1) (3.2) (3.0) (1.7) (–0.6) (0.3) (N/A) (N/A) (N/A)
Total expenditures ................................................................................................... 1,455.3 1,512.6 1,555.1 1,626.5 1,670.9 1,729.2 1,757.6 1,820.2 1,867.9
Surplus or deficit (–), NIPA basis ........................................................................ –274.3 –260.8 –198.6 –176.6 –121.3 –37.0 70.4 84.7 119.1
N/A: Not available.* $50 million or less.
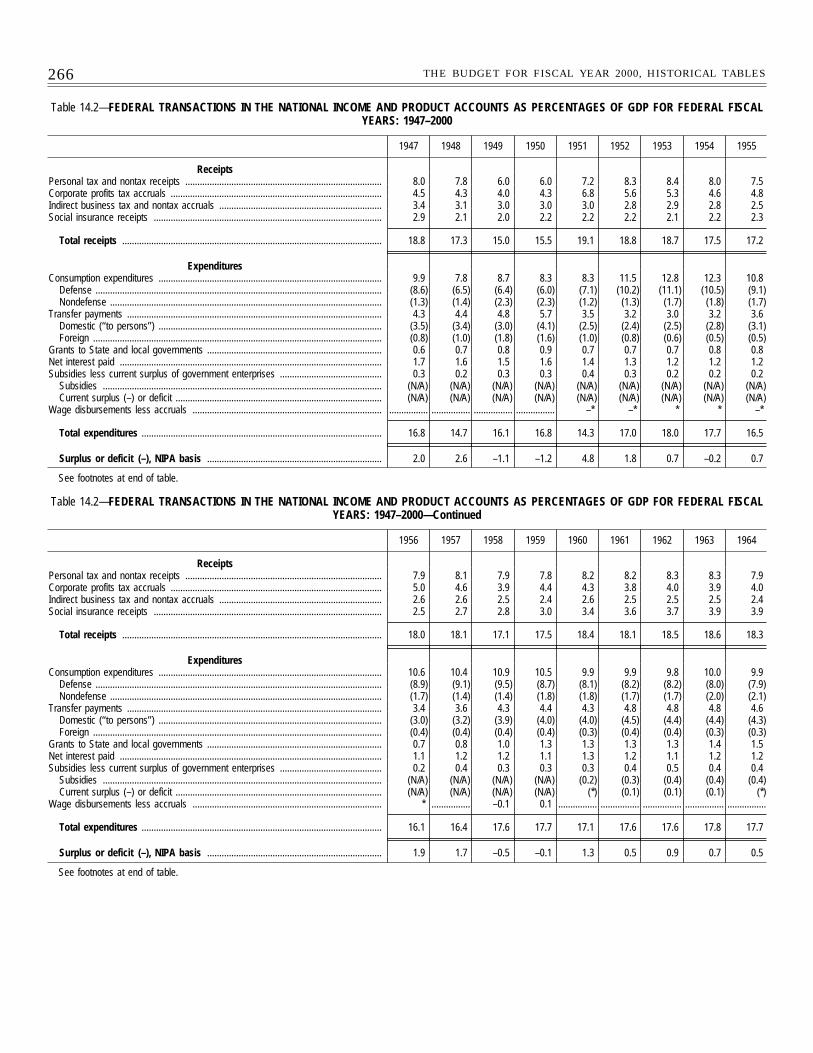
266 THE BUDGET FOR FISCAL YEAR 2000, HISTORICAL TABLES
Table 14.2—FEDERAL TRANSACTIONS IN THE NATIONAL INCOME AND PRODUCT ACCOUNTS AS PERCENTAGES OF GDP FOR FEDERAL FISCALYEARS: 1947–2000
1947 1948 1949 1950 1951 1952 1953 1954 1955
ReceiptsPersonal tax and nontax receipts ................................................................................. 8.0 7.8 6.0 6.0 7.2 8.3 8.4 8.0 7.5Corporate profits tax accruals ....................................................................................... 4.5 4.3 4.0 4.3 6.8 5.6 5.3 4.6 4.8Indirect business tax and nontax accruals ................................................................... 3.4 3.1 3.0 3.0 3.0 2.8 2.9 2.8 2.5Social insurance receipts .............................................................................................. 2.9 2.1 2.0 2.2 2.2 2.2 2.1 2.2 2.3
Total receipts ........................................................................................................... 18.8 17.3 15.0 15.5 19.1 18.8 18.7 17.5 17.2
ExpendituresConsumption expenditures ............................................................................................ 9.9 7.8 8.7 8.3 8.3 11.5 12.8 12.3 10.8
Defense ...................................................................................................................... (8.6) (6.5) (6.4) (6.0) (7.1) (10.2) (11.1) (10.5) (9.1)Nondefense ................................................................................................................ (1.3) (1.4) (2.3) (2.3) (1.2) (1.3) (1.7) (1.8) (1.7)
Transfer payments ......................................................................................................... 4.3 4.4 4.8 5.7 3.5 3.2 3.0 3.2 3.6Domestic (‘‘to persons’’) ............................................................................................ (3.5) (3.4) (3.0) (4.1) (2.5) (2.4) (2.5) (2.8) (3.1)Foreign ....................................................................................................................... (0.8) (1.0) (1.8) (1.6) (1.0) (0.8) (0.6) (0.5) (0.5)
Grants to State and local governments ........................................................................ 0.6 0.7 0.8 0.9 0.7 0.7 0.7 0.8 0.8Net interest paid ............................................................................................................ 1.7 1.6 1.5 1.6 1.4 1.3 1.2 1.2 1.2Subsidies less current surplus of government enterprises .......................................... 0.3 0.2 0.3 0.3 0.4 0.3 0.2 0.2 0.2
Subsidies ................................................................................................................... (N/A) (N/A) (N/A) (N/A) (N/A) (N/A) (N/A) (N/A) (N/A)Current surplus (–) or deficit ..................................................................................... (N/A) (N/A) (N/A) (N/A) (N/A) (N/A) (N/A) (N/A) (N/A)
Wage disbursements less accruals .............................................................................. ................ ................ ................ ................ –* –* * * –*
Total expenditures ................................................................................................... 16.8 14.7 16.1 16.8 14.3 17.0 18.0 17.7 16.5
Surplus or deficit (–), NIPA basis ........................................................................ 2.0 2.6 –1.1 –1.2 4.8 1.8 0.7 –0.2 0.7
See footnotes at end of table.
Table 14.2—FEDERAL TRANSACTIONS IN THE NATIONAL INCOME AND PRODUCT ACCOUNTS AS PERCENTAGES OF GDP FOR FEDERAL FISCALYEARS: 1947–2000—Continued
1956 1957 1958 1959 1960 1961 1962 1963 1964
ReceiptsPersonal tax and nontax receipts ................................................................................. 7.9 8.1 7.9 7.8 8.2 8.2 8.3 8.3 7.9Corporate profits tax accruals ....................................................................................... 5.0 4.6 3.9 4.4 4.3 3.8 4.0 3.9 4.0Indirect business tax and nontax accruals ................................................................... 2.6 2.6 2.5 2.4 2.6 2.5 2.5 2.5 2.4Social insurance receipts .............................................................................................. 2.5 2.7 2.8 3.0 3.4 3.6 3.7 3.9 3.9
Total receipts ........................................................................................................... 18.0 18.1 17.1 17.5 18.4 18.1 18.5 18.6 18.3
ExpendituresConsumption expenditures ............................................................................................ 10.6 10.4 10.9 10.5 9.9 9.9 9.8 10.0 9.9
Defense ...................................................................................................................... (8.9) (9.1) (9.5) (8.7) (8.1) (8.2) (8.2) (8.0) (7.9)Nondefense ................................................................................................................ (1.7) (1.4) (1.4) (1.8) (1.8) (1.7) (1.7) (2.0) (2.1)
Transfer payments ......................................................................................................... 3.4 3.6 4.3 4.4 4.3 4.8 4.8 4.8 4.6Domestic (‘‘to persons’’) ............................................................................................ (3.0) (3.2) (3.9) (4.0) (4.0) (4.5) (4.4) (4.4) (4.3)Foreign ....................................................................................................................... (0.4) (0.4) (0.4) (0.4) (0.3) (0.4) (0.4) (0.3) (0.3)
Grants to State and local governments ........................................................................ 0.7 0.8 1.0 1.3 1.3 1.3 1.3 1.4 1.5Net interest paid ............................................................................................................ 1.1 1.2 1.2 1.1 1.3 1.2 1.1 1.2 1.2Subsidies less current surplus of government enterprises .......................................... 0.2 0.4 0.3 0.3 0.3 0.4 0.5 0.4 0.4
Subsidies ................................................................................................................... (N/A) (N/A) (N/A) (N/A) (0.2) (0.3) (0.4) (0.4) (0.4)Current surplus (–) or deficit ..................................................................................... (N/A) (N/A) (N/A) (N/A) (*) (0.1) (0.1) (0.1) (*)
Wage disbursements less accruals .............................................................................. * ................ –0.1 0.1 ................ ................ ................ ................ ................
Total expenditures ................................................................................................... 16.1 16.4 17.6 17.7 17.1 17.6 17.6 17.8 17.7
Surplus or deficit (–), NIPA basis ........................................................................ 1.9 1.7 –0.5 –0.1 1.3 0.5 0.9 0.7 0.5
See footnotes at end of table.
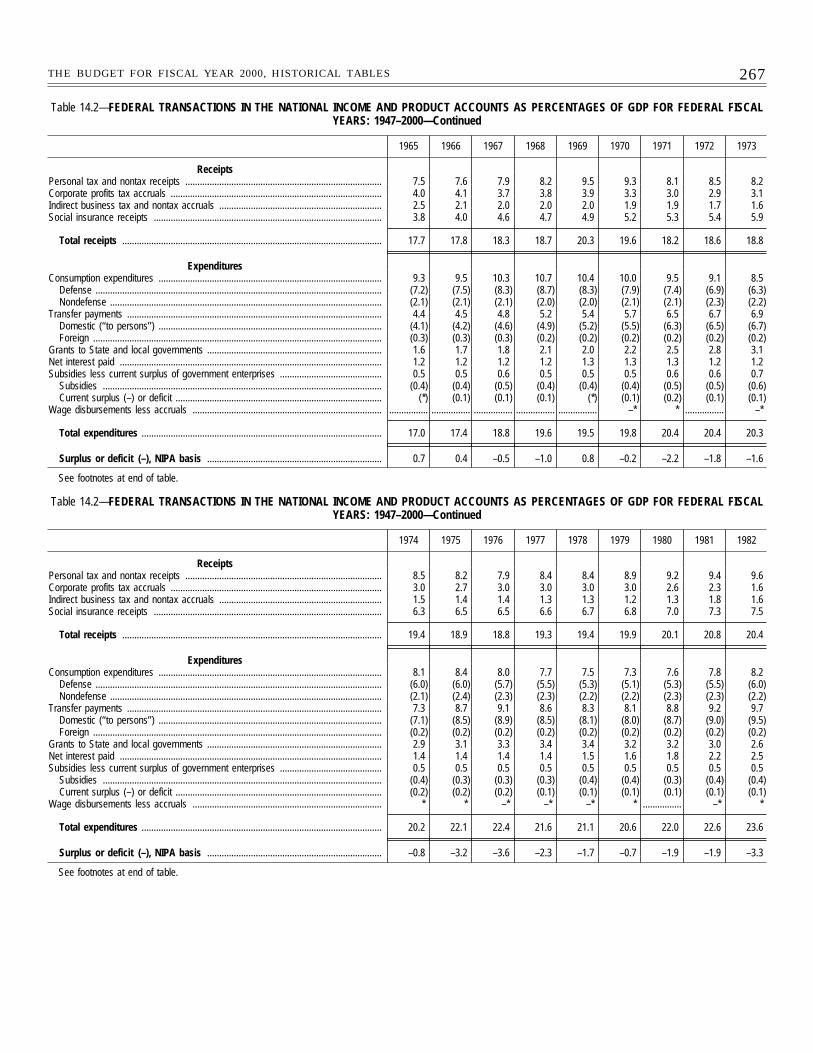
267THE BUDGET FOR FISCAL YEAR 2000, HISTORICAL TABLES
Table 14.2—FEDERAL TRANSACTIONS IN THE NATIONAL INCOME AND PRODUCT ACCOUNTS AS PERCENTAGES OF GDP FOR FEDERAL FISCALYEARS: 1947–2000—Continued
1965 1966 1967 1968 1969 1970 1971 1972 1973
ReceiptsPersonal tax and nontax receipts ................................................................................. 7.5 7.6 7.9 8.2 9.5 9.3 8.1 8.5 8.2Corporate profits tax accruals ....................................................................................... 4.0 4.1 3.7 3.8 3.9 3.3 3.0 2.9 3.1Indirect business tax and nontax accruals ................................................................... 2.5 2.1 2.0 2.0 2.0 1.9 1.9 1.7 1.6Social insurance receipts .............................................................................................. 3.8 4.0 4.6 4.7 4.9 5.2 5.3 5.4 5.9
Total receipts ........................................................................................................... 17.7 17.8 18.3 18.7 20.3 19.6 18.2 18.6 18.8
ExpendituresConsumption expenditures ............................................................................................ 9.3 9.5 10.3 10.7 10.4 10.0 9.5 9.1 8.5
Defense ...................................................................................................................... (7.2) (7.5) (8.3) (8.7) (8.3) (7.9) (7.4) (6.9) (6.3)Nondefense ................................................................................................................ (2.1) (2.1) (2.1) (2.0) (2.0) (2.1) (2.1) (2.3) (2.2)
Transfer payments ......................................................................................................... 4.4 4.5 4.8 5.2 5.4 5.7 6.5 6.7 6.9Domestic (‘‘to persons’’) ............................................................................................ (4.1) (4.2) (4.6) (4.9) (5.2) (5.5) (6.3) (6.5) (6.7)Foreign ....................................................................................................................... (0.3) (0.3) (0.3) (0.2) (0.2) (0.2) (0.2) (0.2) (0.2)
Grants to State and local governments ........................................................................ 1.6 1.7 1.8 2.1 2.0 2.2 2.5 2.8 3.1Net interest paid ............................................................................................................ 1.2 1.2 1.2 1.2 1.3 1.3 1.3 1.2 1.2Subsidies less current surplus of government enterprises .......................................... 0.5 0.5 0.6 0.5 0.5 0.5 0.6 0.6 0.7
Subsidies ................................................................................................................... (0.4) (0.4) (0.5) (0.4) (0.4) (0.4) (0.5) (0.5) (0.6)Current surplus (–) or deficit ..................................................................................... (*) (0.1) (0.1) (0.1) (*) (0.1) (0.2) (0.1) (0.1)
Wage disbursements less accruals .............................................................................. ................ ................ ................ ................ ................ –* * ................ –*
Total expenditures ................................................................................................... 17.0 17.4 18.8 19.6 19.5 19.8 20.4 20.4 20.3
Surplus or deficit (–), NIPA basis ........................................................................ 0.7 0.4 –0.5 –1.0 0.8 –0.2 –2.2 –1.8 –1.6
See footnotes at end of table.
Table 14.2—FEDERAL TRANSACTIONS IN THE NATIONAL INCOME AND PRODUCT ACCOUNTS AS PERCENTAGES OF GDP FOR FEDERAL FISCALYEARS: 1947–2000—Continued
1974 1975 1976 1977 1978 1979 1980 1981 1982
ReceiptsPersonal tax and nontax receipts ................................................................................. 8.5 8.2 7.9 8.4 8.4 8.9 9.2 9.4 9.6Corporate profits tax accruals ....................................................................................... 3.0 2.7 3.0 3.0 3.0 3.0 2.6 2.3 1.6Indirect business tax and nontax accruals ................................................................... 1.5 1.4 1.4 1.3 1.3 1.2 1.3 1.8 1.6Social insurance receipts .............................................................................................. 6.3 6.5 6.5 6.6 6.7 6.8 7.0 7.3 7.5
Total receipts ........................................................................................................... 19.4 18.9 18.8 19.3 19.4 19.9 20.1 20.8 20.4
ExpendituresConsumption expenditures ............................................................................................ 8.1 8.4 8.0 7.7 7.5 7.3 7.6 7.8 8.2
Defense ...................................................................................................................... (6.0) (6.0) (5.7) (5.5) (5.3) (5.1) (5.3) (5.5) (6.0)Nondefense ................................................................................................................ (2.1) (2.4) (2.3) (2.3) (2.2) (2.2) (2.3) (2.3) (2.2)
Transfer payments ......................................................................................................... 7.3 8.7 9.1 8.6 8.3 8.1 8.8 9.2 9.7Domestic (‘‘to persons’’) ............................................................................................ (7.1) (8.5) (8.9) (8.5) (8.1) (8.0) (8.7) (9.0) (9.5)Foreign ....................................................................................................................... (0.2) (0.2) (0.2) (0.2) (0.2) (0.2) (0.2) (0.2) (0.2)
Grants to State and local governments ........................................................................ 2.9 3.1 3.3 3.4 3.4 3.2 3.2 3.0 2.6Net interest paid ............................................................................................................ 1.4 1.4 1.4 1.4 1.5 1.6 1.8 2.2 2.5Subsidies less current surplus of government enterprises .......................................... 0.5 0.5 0.5 0.5 0.5 0.5 0.5 0.5 0.5
Subsidies ................................................................................................................... (0.4) (0.3) (0.3) (0.3) (0.4) (0.4) (0.3) (0.4) (0.4)Current surplus (–) or deficit ..................................................................................... (0.2) (0.2) (0.2) (0.1) (0.1) (0.1) (0.1) (0.1) (0.1)
Wage disbursements less accruals .............................................................................. * * –* –* –* * ................ –* *
Total expenditures ................................................................................................... 20.2 22.1 22.4 21.6 21.1 20.6 22.0 22.6 23.6
Surplus or deficit (–), NIPA basis ........................................................................ –0.8 –3.2 –3.6 –2.3 –1.7 –0.7 –1.9 –1.9 –3.3
See footnotes at end of table.
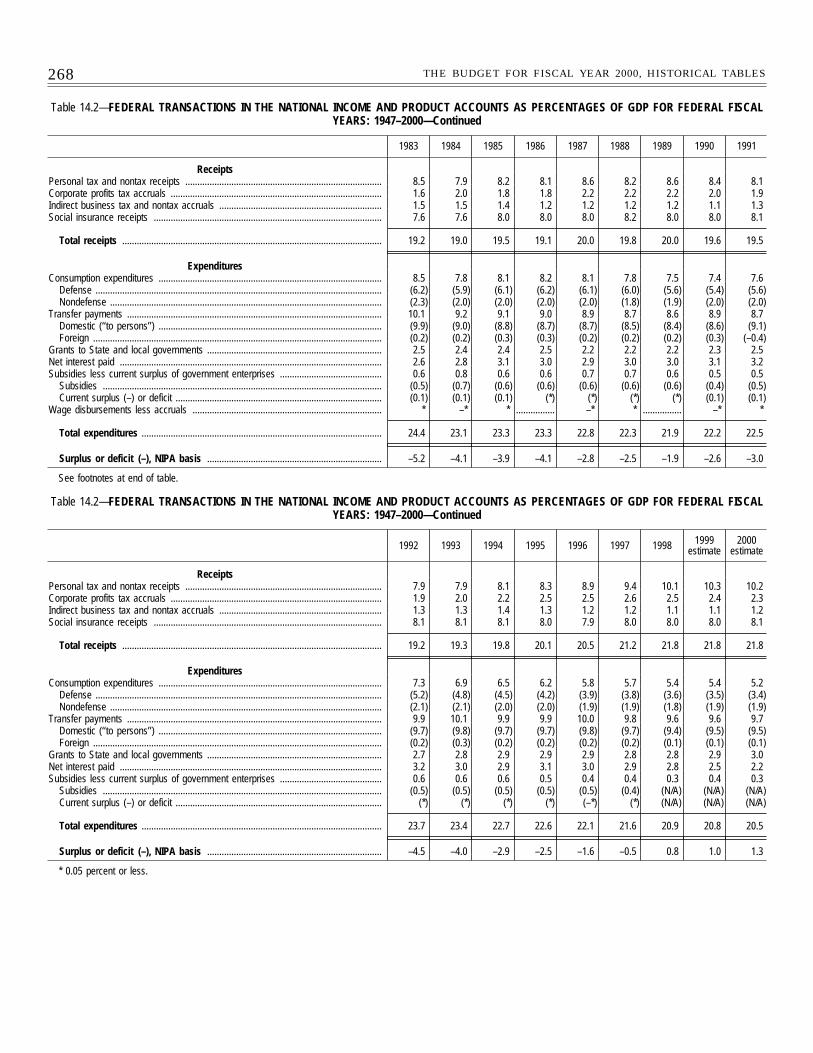
268 THE BUDGET FOR FISCAL YEAR 2000, HISTORICAL TABLES
Table 14.2—FEDERAL TRANSACTIONS IN THE NATIONAL INCOME AND PRODUCT ACCOUNTS AS PERCENTAGES OF GDP FOR FEDERAL FISCALYEARS: 1947–2000—Continued
1983 1984 1985 1986 1987 1988 1989 1990 1991
ReceiptsPersonal tax and nontax receipts ................................................................................. 8.5 7.9 8.2 8.1 8.6 8.2 8.6 8.4 8.1Corporate profits tax accruals ....................................................................................... 1.6 2.0 1.8 1.8 2.2 2.2 2.2 2.0 1.9Indirect business tax and nontax accruals ................................................................... 1.5 1.5 1.4 1.2 1.2 1.2 1.2 1.1 1.3Social insurance receipts .............................................................................................. 7.6 7.6 8.0 8.0 8.0 8.2 8.0 8.0 8.1
Total receipts ........................................................................................................... 19.2 19.0 19.5 19.1 20.0 19.8 20.0 19.6 19.5
ExpendituresConsumption expenditures ............................................................................................ 8.5 7.8 8.1 8.2 8.1 7.8 7.5 7.4 7.6
Defense ...................................................................................................................... (6.2) (5.9) (6.1) (6.2) (6.1) (6.0) (5.6) (5.4) (5.6)Nondefense ................................................................................................................ (2.3) (2.0) (2.0) (2.0) (2.0) (1.8) (1.9) (2.0) (2.0)
Transfer payments ......................................................................................................... 10.1 9.2 9.1 9.0 8.9 8.7 8.6 8.9 8.7Domestic (‘‘to persons’’) ............................................................................................ (9.9) (9.0) (8.8) (8.7) (8.7) (8.5) (8.4) (8.6) (9.1)Foreign ....................................................................................................................... (0.2) (0.2) (0.3) (0.3) (0.2) (0.2) (0.2) (0.3) (–0.4)
Grants to State and local governments ........................................................................ 2.5 2.4 2.4 2.5 2.2 2.2 2.2 2.3 2.5Net interest paid ............................................................................................................ 2.6 2.8 3.1 3.0 2.9 3.0 3.0 3.1 3.2Subsidies less current surplus of government enterprises .......................................... 0.6 0.8 0.6 0.6 0.7 0.7 0.6 0.5 0.5
Subsidies ................................................................................................................... (0.5) (0.7) (0.6) (0.6) (0.6) (0.6) (0.6) (0.4) (0.5)Current surplus (–) or deficit ..................................................................................... (0.1) (0.1) (0.1) (*) (*) (*) (*) (0.1) (0.1)
Wage disbursements less accruals .............................................................................. * –* * ................ –* * ................ –* *
Total expenditures ................................................................................................... 24.4 23.1 23.3 23.3 22.8 22.3 21.9 22.2 22.5
Surplus or deficit (–), NIPA basis ........................................................................ –5.2 –4.1 –3.9 –4.1 –2.8 –2.5 –1.9 –2.6 –3.0
See footnotes at end of table.
Table 14.2—FEDERAL TRANSACTIONS IN THE NATIONAL INCOME AND PRODUCT ACCOUNTS AS PERCENTAGES OF GDP FOR FEDERAL FISCALYEARS: 1947–2000—Continued
1992 1993 1994 1995 1996 1997 1998 1999estimate
2000estimate
ReceiptsPersonal tax and nontax receipts ................................................................................. 7.9 7.9 8.1 8.3 8.9 9.4 10.1 10.3 10.2Corporate profits tax accruals ....................................................................................... 1.9 2.0 2.2 2.5 2.5 2.6 2.5 2.4 2.3Indirect business tax and nontax accruals ................................................................... 1.3 1.3 1.4 1.3 1.2 1.2 1.1 1.1 1.2Social insurance receipts .............................................................................................. 8.1 8.1 8.1 8.0 7.9 8.0 8.0 8.0 8.1
Total receipts ........................................................................................................... 19.2 19.3 19.8 20.1 20.5 21.2 21.8 21.8 21.8
ExpendituresConsumption expenditures ............................................................................................ 7.3 6.9 6.5 6.2 5.8 5.7 5.4 5.4 5.2
Defense ...................................................................................................................... (5.2) (4.8) (4.5) (4.2) (3.9) (3.8) (3.6) (3.5) (3.4)Nondefense ................................................................................................................ (2.1) (2.1) (2.0) (2.0) (1.9) (1.9) (1.8) (1.9) (1.9)
Transfer payments ......................................................................................................... 9.9 10.1 9.9 9.9 10.0 9.8 9.6 9.6 9.7Domestic (‘‘to persons’’) ............................................................................................ (9.7) (9.8) (9.7) (9.7) (9.8) (9.7) (9.4) (9.5) (9.5)Foreign ....................................................................................................................... (0.2) (0.3) (0.2) (0.2) (0.2) (0.2) (0.1) (0.1) (0.1)
Grants to State and local governments ........................................................................ 2.7 2.8 2.9 2.9 2.9 2.8 2.8 2.9 3.0Net interest paid ............................................................................................................ 3.2 3.0 2.9 3.1 3.0 2.9 2.8 2.5 2.2Subsidies less current surplus of government enterprises .......................................... 0.6 0.6 0.6 0.5 0.4 0.4 0.3 0.4 0.3
Subsidies ................................................................................................................... (0.5) (0.5) (0.5) (0.5) (0.5) (0.4) (N/A) (N/A) (N/A)Current surplus (–) or deficit ..................................................................................... (*) (*) (*) (*) (–*) (*) (N/A) (N/A) (N/A)
Total expenditures ................................................................................................... 23.7 23.4 22.7 22.6 22.1 21.6 20.9 20.8 20.5
Surplus or deficit (–), NIPA basis ........................................................................ –4.5 –4.0 –2.9 –2.5 –1.6 –0.5 0.8 1.0 1.3
* 0.05 percent or less.
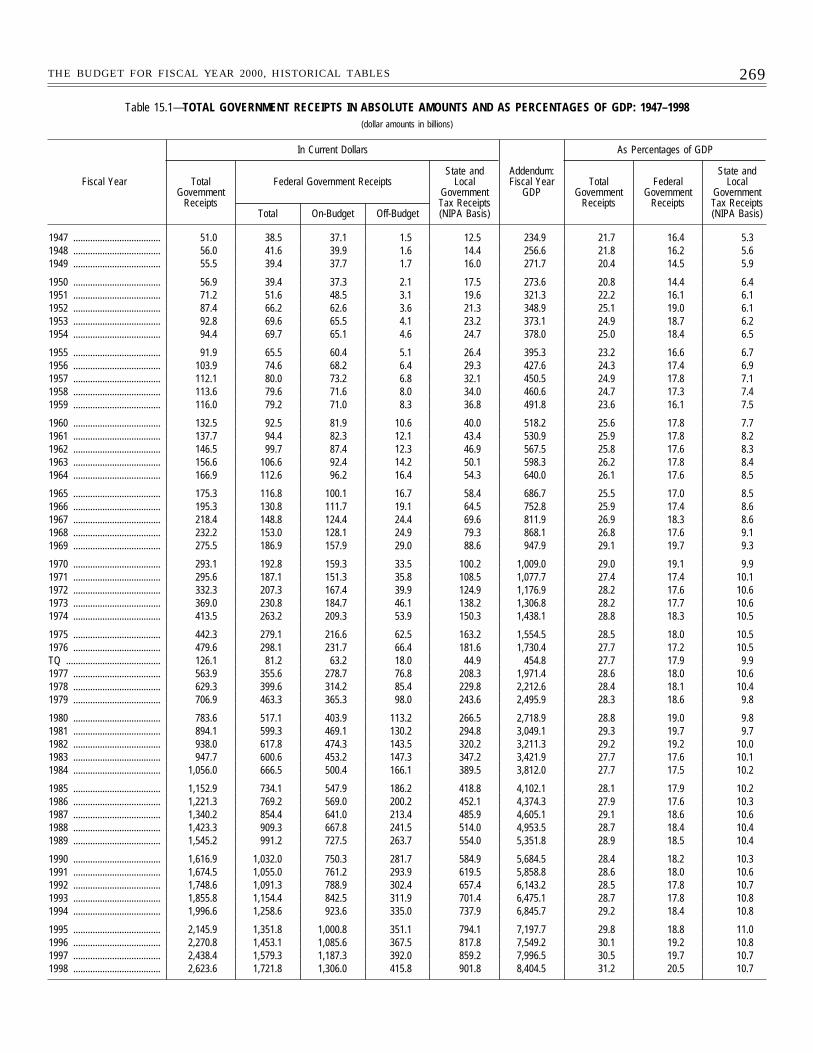
269THE BUDGET FOR FISCAL YEAR 2000, HISTORICAL TABLES
Table 15.1—TOTAL GOVERNMENT RECEIPTS IN ABSOLUTE AMOUNTS AND AS PERCENTAGES OF GDP: 1947–1998(dollar amounts in billions)
Fiscal Year
In Current Dollars
Addendum:Fiscal Year
GDP
As Percentages of GDP
TotalGovernment
Receipts
Federal Government ReceiptsState and
LocalGovernmentTax Receipts(NIPA Basis)
TotalGovernment
Receipts
FederalGovernment
Receipts
State andLocal
GovernmentTax Receipts(NIPA Basis)Total On-Budget Off-Budget
1947 .................................... 51.0 38.5 37.1 1.5 12.5 234.9 21.7 16.4 5.31948 .................................... 56.0 41.6 39.9 1.6 14.4 256.6 21.8 16.2 5.61949 .................................... 55.5 39.4 37.7 1.7 16.0 271.7 20.4 14.5 5.9
1950 .................................... 56.9 39.4 37.3 2.1 17.5 273.6 20.8 14.4 6.41951 .................................... 71.2 51.6 48.5 3.1 19.6 321.3 22.2 16.1 6.11952 .................................... 87.4 66.2 62.6 3.6 21.3 348.9 25.1 19.0 6.11953 .................................... 92.8 69.6 65.5 4.1 23.2 373.1 24.9 18.7 6.21954 .................................... 94.4 69.7 65.1 4.6 24.7 378.0 25.0 18.4 6.5
1955 .................................... 91.9 65.5 60.4 5.1 26.4 395.3 23.2 16.6 6.71956 .................................... 103.9 74.6 68.2 6.4 29.3 427.6 24.3 17.4 6.91957 .................................... 112.1 80.0 73.2 6.8 32.1 450.5 24.9 17.8 7.11958 .................................... 113.6 79.6 71.6 8.0 34.0 460.6 24.7 17.3 7.41959 .................................... 116.0 79.2 71.0 8.3 36.8 491.8 23.6 16.1 7.5
1960 .................................... 132.5 92.5 81.9 10.6 40.0 518.2 25.6 17.8 7.71961 .................................... 137.7 94.4 82.3 12.1 43.4 530.9 25.9 17.8 8.21962 .................................... 146.5 99.7 87.4 12.3 46.9 567.5 25.8 17.6 8.31963 .................................... 156.6 106.6 92.4 14.2 50.1 598.3 26.2 17.8 8.41964 .................................... 166.9 112.6 96.2 16.4 54.3 640.0 26.1 17.6 8.5
1965 .................................... 175.3 116.8 100.1 16.7 58.4 686.7 25.5 17.0 8.51966 .................................... 195.3 130.8 111.7 19.1 64.5 752.8 25.9 17.4 8.61967 .................................... 218.4 148.8 124.4 24.4 69.6 811.9 26.9 18.3 8.61968 .................................... 232.2 153.0 128.1 24.9 79.3 868.1 26.8 17.6 9.11969 .................................... 275.5 186.9 157.9 29.0 88.6 947.9 29.1 19.7 9.3
1970 .................................... 293.1 192.8 159.3 33.5 100.2 1,009.0 29.0 19.1 9.91971 .................................... 295.6 187.1 151.3 35.8 108.5 1,077.7 27.4 17.4 10.11972 .................................... 332.3 207.3 167.4 39.9 124.9 1,176.9 28.2 17.6 10.61973 .................................... 369.0 230.8 184.7 46.1 138.2 1,306.8 28.2 17.7 10.61974 .................................... 413.5 263.2 209.3 53.9 150.3 1,438.1 28.8 18.3 10.5
1975 .................................... 442.3 279.1 216.6 62.5 163.2 1,554.5 28.5 18.0 10.51976 .................................... 479.6 298.1 231.7 66.4 181.6 1,730.4 27.7 17.2 10.5TQ ....................................... 126.1 81.2 63.2 18.0 44.9 454.8 27.7 17.9 9.91977 .................................... 563.9 355.6 278.7 76.8 208.3 1,971.4 28.6 18.0 10.61978 .................................... 629.3 399.6 314.2 85.4 229.8 2,212.6 28.4 18.1 10.41979 .................................... 706.9 463.3 365.3 98.0 243.6 2,495.9 28.3 18.6 9.8
1980 .................................... 783.6 517.1 403.9 113.2 266.5 2,718.9 28.8 19.0 9.81981 .................................... 894.1 599.3 469.1 130.2 294.8 3,049.1 29.3 19.7 9.71982 .................................... 938.0 617.8 474.3 143.5 320.2 3,211.3 29.2 19.2 10.01983 .................................... 947.7 600.6 453.2 147.3 347.2 3,421.9 27.7 17.6 10.11984 .................................... 1,056.0 666.5 500.4 166.1 389.5 3,812.0 27.7 17.5 10.2
1985 .................................... 1,152.9 734.1 547.9 186.2 418.8 4,102.1 28.1 17.9 10.21986 .................................... 1,221.3 769.2 569.0 200.2 452.1 4,374.3 27.9 17.6 10.31987 .................................... 1,340.2 854.4 641.0 213.4 485.9 4,605.1 29.1 18.6 10.61988 .................................... 1,423.3 909.3 667.8 241.5 514.0 4,953.5 28.7 18.4 10.41989 .................................... 1,545.2 991.2 727.5 263.7 554.0 5,351.8 28.9 18.5 10.4
1990 .................................... 1,616.9 1,032.0 750.3 281.7 584.9 5,684.5 28.4 18.2 10.31991 .................................... 1,674.5 1,055.0 761.2 293.9 619.5 5,858.8 28.6 18.0 10.61992 .................................... 1,748.6 1,091.3 788.9 302.4 657.4 6,143.2 28.5 17.8 10.71993 .................................... 1,855.8 1,154.4 842.5 311.9 701.4 6,475.1 28.7 17.8 10.81994 .................................... 1,996.6 1,258.6 923.6 335.0 737.9 6,845.7 29.2 18.4 10.8
1995 .................................... 2,145.9 1,351.8 1,000.8 351.1 794.1 7,197.7 29.8 18.8 11.01996 .................................... 2,270.8 1,453.1 1,085.6 367.5 817.8 7,549.2 30.1 19.2 10.81997 .................................... 2,438.4 1,579.3 1,187.3 392.0 859.2 7,996.5 30.5 19.7 10.71998 .................................... 2,623.6 1,721.8 1,306.0 415.8 901.8 8,404.5 31.2 20.5 10.7
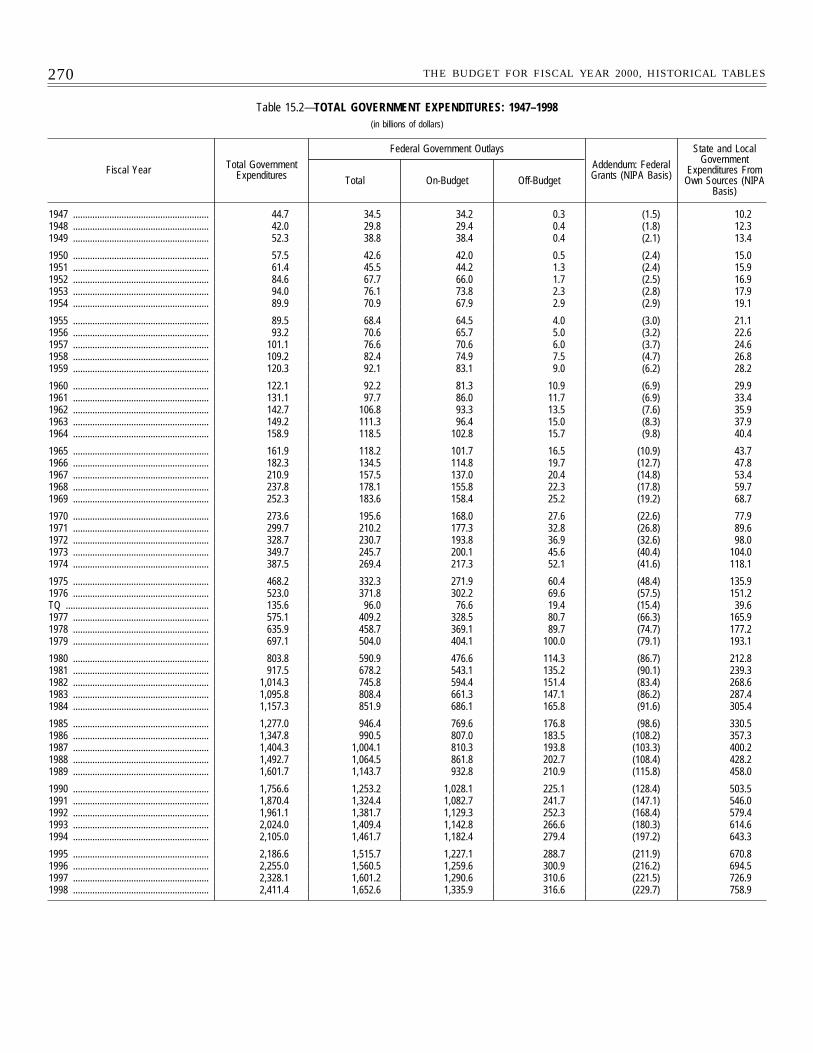
270 THE BUDGET FOR FISCAL YEAR 2000, HISTORICAL TABLES
Table 15.2—TOTAL GOVERNMENT EXPENDITURES: 1947–1998(in billions of dollars)
Fiscal Year Total GovernmentExpenditures
Federal Government Outlays
Addendum: FederalGrants (NIPA Basis)
State and LocalGovernment
Expenditures FromOwn Sources (NIPA
Basis)Total On-Budget Off-Budget
1947 ........................................................ 44.7 34.5 34.2 0.3 (1.5) 10.21948 ........................................................ 42.0 29.8 29.4 0.4 (1.8) 12.31949 ........................................................ 52.3 38.8 38.4 0.4 (2.1) 13.4
1950 ........................................................ 57.5 42.6 42.0 0.5 (2.4) 15.01951 ........................................................ 61.4 45.5 44.2 1.3 (2.4) 15.91952 ........................................................ 84.6 67.7 66.0 1.7 (2.5) 16.91953 ........................................................ 94.0 76.1 73.8 2.3 (2.8) 17.91954 ........................................................ 89.9 70.9 67.9 2.9 (2.9) 19.1
1955 ........................................................ 89.5 68.4 64.5 4.0 (3.0) 21.11956 ........................................................ 93.2 70.6 65.7 5.0 (3.2) 22.61957 ........................................................ 101.1 76.6 70.6 6.0 (3.7) 24.61958 ........................................................ 109.2 82.4 74.9 7.5 (4.7) 26.81959 ........................................................ 120.3 92.1 83.1 9.0 (6.2) 28.2
1960 ........................................................ 122.1 92.2 81.3 10.9 (6.9) 29.91961 ........................................................ 131.1 97.7 86.0 11.7 (6.9) 33.41962 ........................................................ 142.7 106.8 93.3 13.5 (7.6) 35.91963 ........................................................ 149.2 111.3 96.4 15.0 (8.3) 37.91964 ........................................................ 158.9 118.5 102.8 15.7 (9.8) 40.4
1965 ........................................................ 161.9 118.2 101.7 16.5 (10.9) 43.71966 ........................................................ 182.3 134.5 114.8 19.7 (12.7) 47.81967 ........................................................ 210.9 157.5 137.0 20.4 (14.8) 53.41968 ........................................................ 237.8 178.1 155.8 22.3 (17.8) 59.71969 ........................................................ 252.3 183.6 158.4 25.2 (19.2) 68.7
1970 ........................................................ 273.6 195.6 168.0 27.6 (22.6) 77.91971 ........................................................ 299.7 210.2 177.3 32.8 (26.8) 89.61972 ........................................................ 328.7 230.7 193.8 36.9 (32.6) 98.01973 ........................................................ 349.7 245.7 200.1 45.6 (40.4) 104.01974 ........................................................ 387.5 269.4 217.3 52.1 (41.6) 118.1
1975 ........................................................ 468.2 332.3 271.9 60.4 (48.4) 135.91976 ........................................................ 523.0 371.8 302.2 69.6 (57.5) 151.2TQ ........................................................... 135.6 96.0 76.6 19.4 (15.4) 39.61977 ........................................................ 575.1 409.2 328.5 80.7 (66.3) 165.91978 ........................................................ 635.9 458.7 369.1 89.7 (74.7) 177.21979 ........................................................ 697.1 504.0 404.1 100.0 (79.1) 193.1
1980 ........................................................ 803.8 590.9 476.6 114.3 (86.7) 212.81981 ........................................................ 917.5 678.2 543.1 135.2 (90.1) 239.31982 ........................................................ 1,014.3 745.8 594.4 151.4 (83.4) 268.61983 ........................................................ 1,095.8 808.4 661.3 147.1 (86.2) 287.41984 ........................................................ 1,157.3 851.9 686.1 165.8 (91.6) 305.4
1985 ........................................................ 1,277.0 946.4 769.6 176.8 (98.6) 330.51986 ........................................................ 1,347.8 990.5 807.0 183.5 (108.2) 357.31987 ........................................................ 1,404.3 1,004.1 810.3 193.8 (103.3) 400.21988 ........................................................ 1,492.7 1,064.5 861.8 202.7 (108.4) 428.21989 ........................................................ 1,601.7 1,143.7 932.8 210.9 (115.8) 458.0
1990 ........................................................ 1,756.6 1,253.2 1,028.1 225.1 (128.4) 503.51991 ........................................................ 1,870.4 1,324.4 1,082.7 241.7 (147.1) 546.01992 ........................................................ 1,961.1 1,381.7 1,129.3 252.3 (168.4) 579.41993 ........................................................ 2,024.0 1,409.4 1,142.8 266.6 (180.3) 614.61994 ........................................................ 2,105.0 1,461.7 1,182.4 279.4 (197.2) 643.3
1995 ........................................................ 2,186.6 1,515.7 1,227.1 288.7 (211.9) 670.81996 ........................................................ 2,255.0 1,560.5 1,259.6 300.9 (216.2) 694.51997 ........................................................ 2,328.1 1,601.2 1,290.6 310.6 (221.5) 726.91998 ........................................................ 2,411.4 1,652.6 1,335.9 316.6 (229.7) 758.9
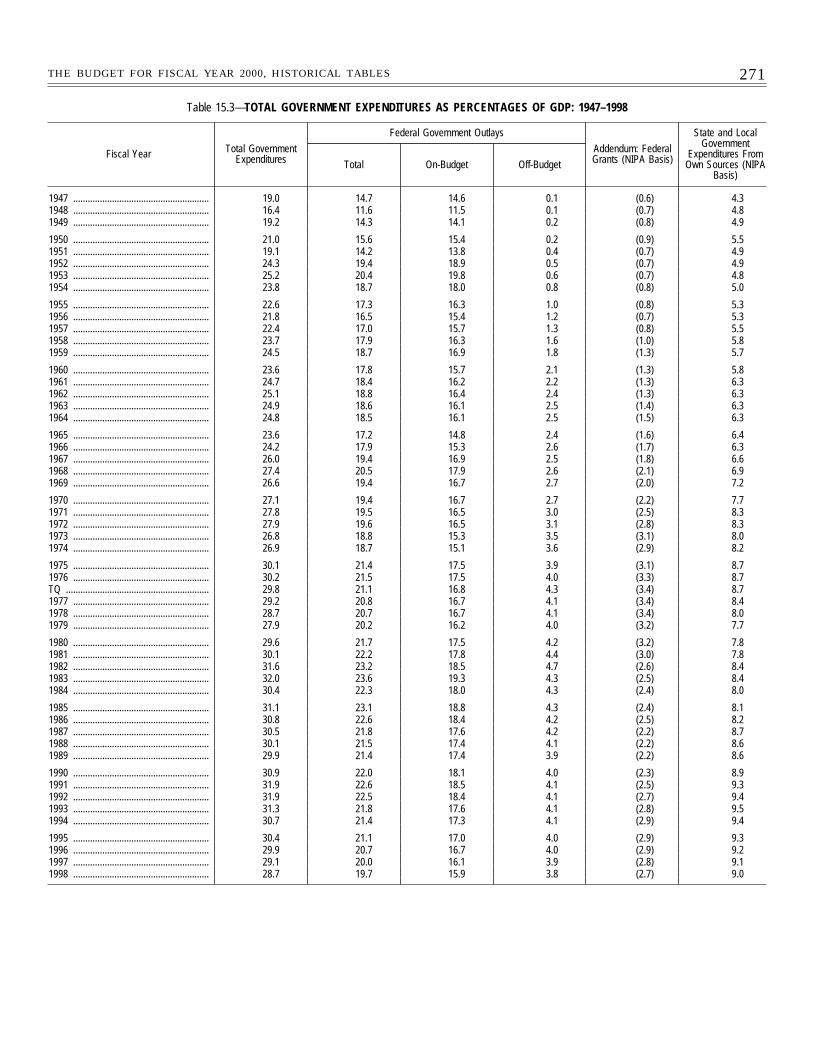
271THE BUDGET FOR FISCAL YEAR 2000, HISTORICAL TABLES
Table 15.3—TOTAL GOVERNMENT EXPENDITURES AS PERCENTAGES OF GDP: 1947–1998
Fiscal Year Total GovernmentExpenditures
Federal Government Outlays
Addendum: FederalGrants (NIPA Basis)
State and LocalGovernment
Expenditures FromOwn Sources (NIPA
Basis)Total On-Budget Off-Budget
1947 ........................................................ 19.0 14.7 14.6 0.1 (0.6) 4.31948 ........................................................ 16.4 11.6 11.5 0.1 (0.7) 4.81949 ........................................................ 19.2 14.3 14.1 0.2 (0.8) 4.9
1950 ........................................................ 21.0 15.6 15.4 0.2 (0.9) 5.51951 ........................................................ 19.1 14.2 13.8 0.4 (0.7) 4.91952 ........................................................ 24.3 19.4 18.9 0.5 (0.7) 4.91953 ........................................................ 25.2 20.4 19.8 0.6 (0.7) 4.81954 ........................................................ 23.8 18.7 18.0 0.8 (0.8) 5.0
1955 ........................................................ 22.6 17.3 16.3 1.0 (0.8) 5.31956 ........................................................ 21.8 16.5 15.4 1.2 (0.7) 5.31957 ........................................................ 22.4 17.0 15.7 1.3 (0.8) 5.51958 ........................................................ 23.7 17.9 16.3 1.6 (1.0) 5.81959 ........................................................ 24.5 18.7 16.9 1.8 (1.3) 5.7
1960 ........................................................ 23.6 17.8 15.7 2.1 (1.3) 5.81961 ........................................................ 24.7 18.4 16.2 2.2 (1.3) 6.31962 ........................................................ 25.1 18.8 16.4 2.4 (1.3) 6.31963 ........................................................ 24.9 18.6 16.1 2.5 (1.4) 6.31964 ........................................................ 24.8 18.5 16.1 2.5 (1.5) 6.3
1965 ........................................................ 23.6 17.2 14.8 2.4 (1.6) 6.41966 ........................................................ 24.2 17.9 15.3 2.6 (1.7) 6.31967 ........................................................ 26.0 19.4 16.9 2.5 (1.8) 6.61968 ........................................................ 27.4 20.5 17.9 2.6 (2.1) 6.91969 ........................................................ 26.6 19.4 16.7 2.7 (2.0) 7.2
1970 ........................................................ 27.1 19.4 16.7 2.7 (2.2) 7.71971 ........................................................ 27.8 19.5 16.5 3.0 (2.5) 8.31972 ........................................................ 27.9 19.6 16.5 3.1 (2.8) 8.31973 ........................................................ 26.8 18.8 15.3 3.5 (3.1) 8.01974 ........................................................ 26.9 18.7 15.1 3.6 (2.9) 8.2
1975 ........................................................ 30.1 21.4 17.5 3.9 (3.1) 8.71976 ........................................................ 30.2 21.5 17.5 4.0 (3.3) 8.7TQ ........................................................... 29.8 21.1 16.8 4.3 (3.4) 8.71977 ........................................................ 29.2 20.8 16.7 4.1 (3.4) 8.41978 ........................................................ 28.7 20.7 16.7 4.1 (3.4) 8.01979 ........................................................ 27.9 20.2 16.2 4.0 (3.2) 7.7
1980 ........................................................ 29.6 21.7 17.5 4.2 (3.2) 7.81981 ........................................................ 30.1 22.2 17.8 4.4 (3.0) 7.81982 ........................................................ 31.6 23.2 18.5 4.7 (2.6) 8.41983 ........................................................ 32.0 23.6 19.3 4.3 (2.5) 8.41984 ........................................................ 30.4 22.3 18.0 4.3 (2.4) 8.0
1985 ........................................................ 31.1 23.1 18.8 4.3 (2.4) 8.11986 ........................................................ 30.8 22.6 18.4 4.2 (2.5) 8.21987 ........................................................ 30.5 21.8 17.6 4.2 (2.2) 8.71988 ........................................................ 30.1 21.5 17.4 4.1 (2.2) 8.61989 ........................................................ 29.9 21.4 17.4 3.9 (2.2) 8.6
1990 ........................................................ 30.9 22.0 18.1 4.0 (2.3) 8.91991 ........................................................ 31.9 22.6 18.5 4.1 (2.5) 9.31992 ........................................................ 31.9 22.5 18.4 4.1 (2.7) 9.41993 ........................................................ 31.3 21.8 17.6 4.1 (2.8) 9.51994 ........................................................ 30.7 21.4 17.3 4.1 (2.9) 9.4
1995 ........................................................ 30.4 21.1 17.0 4.0 (2.9) 9.31996 ........................................................ 29.9 20.7 16.7 4.0 (2.9) 9.21997 ........................................................ 29.1 20.0 16.1 3.9 (2.8) 9.11998 ........................................................ 28.7 19.7 15.9 3.8 (2.7) 9.0
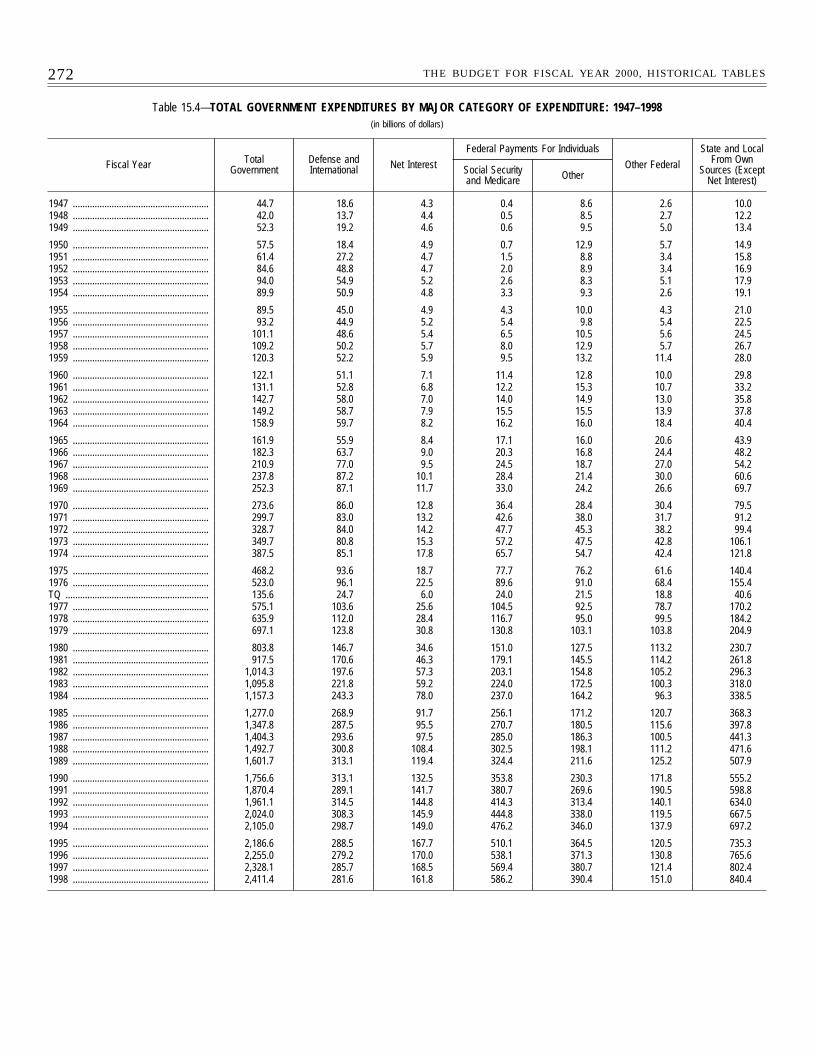
272 THE BUDGET FOR FISCAL YEAR 2000, HISTORICAL TABLES
Table 15.4—TOTAL GOVERNMENT EXPENDITURES BY MAJOR CATEGORY OF EXPENDITURE: 1947–1998(in billions of dollars)
Fiscal Year TotalGovernment
Defense andInternational Net Interest
Federal Payments For Individuals
Other Federal
State and LocalFrom Own
Sources (ExceptNet Interest)
Social Securityand Medicare Other
1947 ........................................................ 44.7 18.6 4.3 0.4 8.6 2.6 10.01948 ........................................................ 42.0 13.7 4.4 0.5 8.5 2.7 12.21949 ........................................................ 52.3 19.2 4.6 0.6 9.5 5.0 13.4
1950 ........................................................ 57.5 18.4 4.9 0.7 12.9 5.7 14.91951 ........................................................ 61.4 27.2 4.7 1.5 8.8 3.4 15.81952 ........................................................ 84.6 48.8 4.7 2.0 8.9 3.4 16.91953 ........................................................ 94.0 54.9 5.2 2.6 8.3 5.1 17.91954 ........................................................ 89.9 50.9 4.8 3.3 9.3 2.6 19.1
1955 ........................................................ 89.5 45.0 4.9 4.3 10.0 4.3 21.01956 ........................................................ 93.2 44.9 5.2 5.4 9.8 5.4 22.51957 ........................................................ 101.1 48.6 5.4 6.5 10.5 5.6 24.51958 ........................................................ 109.2 50.2 5.7 8.0 12.9 5.7 26.71959 ........................................................ 120.3 52.2 5.9 9.5 13.2 11.4 28.0
1960 ........................................................ 122.1 51.1 7.1 11.4 12.8 10.0 29.81961 ........................................................ 131.1 52.8 6.8 12.2 15.3 10.7 33.21962 ........................................................ 142.7 58.0 7.0 14.0 14.9 13.0 35.81963 ........................................................ 149.2 58.7 7.9 15.5 15.5 13.9 37.81964 ........................................................ 158.9 59.7 8.2 16.2 16.0 18.4 40.4
1965 ........................................................ 161.9 55.9 8.4 17.1 16.0 20.6 43.91966 ........................................................ 182.3 63.7 9.0 20.3 16.8 24.4 48.21967 ........................................................ 210.9 77.0 9.5 24.5 18.7 27.0 54.21968 ........................................................ 237.8 87.2 10.1 28.4 21.4 30.0 60.61969 ........................................................ 252.3 87.1 11.7 33.0 24.2 26.6 69.7
1970 ........................................................ 273.6 86.0 12.8 36.4 28.4 30.4 79.51971 ........................................................ 299.7 83.0 13.2 42.6 38.0 31.7 91.21972 ........................................................ 328.7 84.0 14.2 47.7 45.3 38.2 99.41973 ........................................................ 349.7 80.8 15.3 57.2 47.5 42.8 106.11974 ........................................................ 387.5 85.1 17.8 65.7 54.7 42.4 121.8
1975 ........................................................ 468.2 93.6 18.7 77.7 76.2 61.6 140.41976 ........................................................ 523.0 96.1 22.5 89.6 91.0 68.4 155.4TQ ........................................................... 135.6 24.7 6.0 24.0 21.5 18.8 40.61977 ........................................................ 575.1 103.6 25.6 104.5 92.5 78.7 170.21978 ........................................................ 635.9 112.0 28.4 116.7 95.0 99.5 184.21979 ........................................................ 697.1 123.8 30.8 130.8 103.1 103.8 204.9
1980 ........................................................ 803.8 146.7 34.6 151.0 127.5 113.2 230.71981 ........................................................ 917.5 170.6 46.3 179.1 145.5 114.2 261.81982 ........................................................ 1,014.3 197.6 57.3 203.1 154.8 105.2 296.31983 ........................................................ 1,095.8 221.8 59.2 224.0 172.5 100.3 318.01984 ........................................................ 1,157.3 243.3 78.0 237.0 164.2 96.3 338.5
1985 ........................................................ 1,277.0 268.9 91.7 256.1 171.2 120.7 368.31986 ........................................................ 1,347.8 287.5 95.5 270.7 180.5 115.6 397.81987 ........................................................ 1,404.3 293.6 97.5 285.0 186.3 100.5 441.31988 ........................................................ 1,492.7 300.8 108.4 302.5 198.1 111.2 471.61989 ........................................................ 1,601.7 313.1 119.4 324.4 211.6 125.2 507.9
1990 ........................................................ 1,756.6 313.1 132.5 353.8 230.3 171.8 555.21991 ........................................................ 1,870.4 289.1 141.7 380.7 269.6 190.5 598.81992 ........................................................ 1,961.1 314.5 144.8 414.3 313.4 140.1 634.01993 ........................................................ 2,024.0 308.3 145.9 444.8 338.0 119.5 667.51994 ........................................................ 2,105.0 298.7 149.0 476.2 346.0 137.9 697.2
1995 ........................................................ 2,186.6 288.5 167.7 510.1 364.5 120.5 735.31996 ........................................................ 2,255.0 279.2 170.0 538.1 371.3 130.8 765.61997 ........................................................ 2,328.1 285.7 168.5 569.4 380.7 121.4 802.41998 ........................................................ 2,411.4 281.6 161.8 586.2 390.4 151.0 840.4
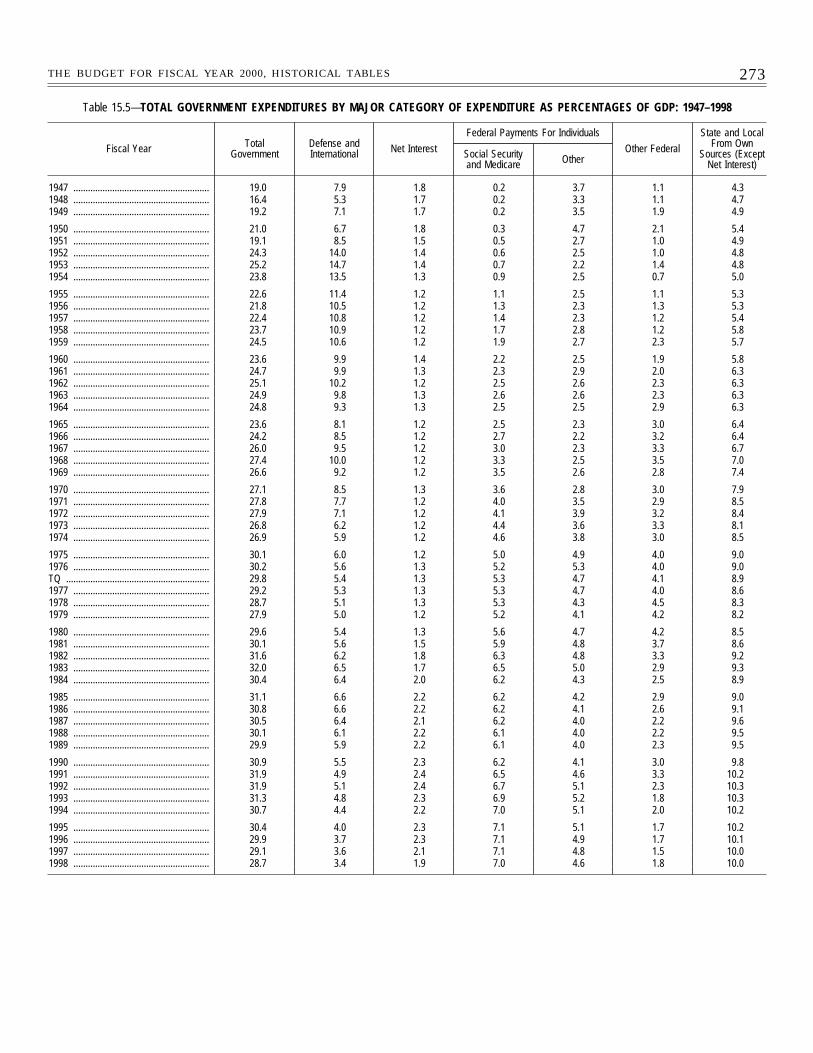
273THE BUDGET FOR FISCAL YEAR 2000, HISTORICAL TABLES
Table 15.5—TOTAL GOVERNMENT EXPENDITURES BY MAJOR CATEGORY OF EXPENDITURE AS PERCENTAGES OF GDP: 1947–1998
Fiscal Year TotalGovernment
Defense andInternational Net Interest
Federal Payments For Individuals
Other Federal
State and LocalFrom Own
Sources (ExceptNet Interest)
Social Securityand Medicare Other
1947 ........................................................ 19.0 7.9 1.8 0.2 3.7 1.1 4.31948 ........................................................ 16.4 5.3 1.7 0.2 3.3 1.1 4.71949 ........................................................ 19.2 7.1 1.7 0.2 3.5 1.9 4.9
1950 ........................................................ 21.0 6.7 1.8 0.3 4.7 2.1 5.41951 ........................................................ 19.1 8.5 1.5 0.5 2.7 1.0 4.91952 ........................................................ 24.3 14.0 1.4 0.6 2.5 1.0 4.81953 ........................................................ 25.2 14.7 1.4 0.7 2.2 1.4 4.81954 ........................................................ 23.8 13.5 1.3 0.9 2.5 0.7 5.0
1955 ........................................................ 22.6 11.4 1.2 1.1 2.5 1.1 5.31956 ........................................................ 21.8 10.5 1.2 1.3 2.3 1.3 5.31957 ........................................................ 22.4 10.8 1.2 1.4 2.3 1.2 5.41958 ........................................................ 23.7 10.9 1.2 1.7 2.8 1.2 5.81959 ........................................................ 24.5 10.6 1.2 1.9 2.7 2.3 5.7
1960 ........................................................ 23.6 9.9 1.4 2.2 2.5 1.9 5.81961 ........................................................ 24.7 9.9 1.3 2.3 2.9 2.0 6.31962 ........................................................ 25.1 10.2 1.2 2.5 2.6 2.3 6.31963 ........................................................ 24.9 9.8 1.3 2.6 2.6 2.3 6.31964 ........................................................ 24.8 9.3 1.3 2.5 2.5 2.9 6.3
1965 ........................................................ 23.6 8.1 1.2 2.5 2.3 3.0 6.41966 ........................................................ 24.2 8.5 1.2 2.7 2.2 3.2 6.41967 ........................................................ 26.0 9.5 1.2 3.0 2.3 3.3 6.71968 ........................................................ 27.4 10.0 1.2 3.3 2.5 3.5 7.01969 ........................................................ 26.6 9.2 1.2 3.5 2.6 2.8 7.4
1970 ........................................................ 27.1 8.5 1.3 3.6 2.8 3.0 7.91971 ........................................................ 27.8 7.7 1.2 4.0 3.5 2.9 8.51972 ........................................................ 27.9 7.1 1.2 4.1 3.9 3.2 8.41973 ........................................................ 26.8 6.2 1.2 4.4 3.6 3.3 8.11974 ........................................................ 26.9 5.9 1.2 4.6 3.8 3.0 8.5
1975 ........................................................ 30.1 6.0 1.2 5.0 4.9 4.0 9.01976 ........................................................ 30.2 5.6 1.3 5.2 5.3 4.0 9.0TQ ........................................................... 29.8 5.4 1.3 5.3 4.7 4.1 8.91977 ........................................................ 29.2 5.3 1.3 5.3 4.7 4.0 8.61978 ........................................................ 28.7 5.1 1.3 5.3 4.3 4.5 8.31979 ........................................................ 27.9 5.0 1.2 5.2 4.1 4.2 8.2
1980 ........................................................ 29.6 5.4 1.3 5.6 4.7 4.2 8.51981 ........................................................ 30.1 5.6 1.5 5.9 4.8 3.7 8.61982 ........................................................ 31.6 6.2 1.8 6.3 4.8 3.3 9.21983 ........................................................ 32.0 6.5 1.7 6.5 5.0 2.9 9.31984 ........................................................ 30.4 6.4 2.0 6.2 4.3 2.5 8.9
1985 ........................................................ 31.1 6.6 2.2 6.2 4.2 2.9 9.01986 ........................................................ 30.8 6.6 2.2 6.2 4.1 2.6 9.11987 ........................................................ 30.5 6.4 2.1 6.2 4.0 2.2 9.61988 ........................................................ 30.1 6.1 2.2 6.1 4.0 2.2 9.51989 ........................................................ 29.9 5.9 2.2 6.1 4.0 2.3 9.5
1990 ........................................................ 30.9 5.5 2.3 6.2 4.1 3.0 9.81991 ........................................................ 31.9 4.9 2.4 6.5 4.6 3.3 10.21992 ........................................................ 31.9 5.1 2.4 6.7 5.1 2.3 10.31993 ........................................................ 31.3 4.8 2.3 6.9 5.2 1.8 10.31994 ........................................................ 30.7 4.4 2.2 7.0 5.1 2.0 10.2
1995 ........................................................ 30.4 4.0 2.3 7.1 5.1 1.7 10.21996 ........................................................ 29.9 3.7 2.3 7.1 4.9 1.7 10.11997 ........................................................ 29.1 3.6 2.1 7.1 4.8 1.5 10.01998 ........................................................ 28.7 3.4 1.9 7.0 4.6 1.8 10.0
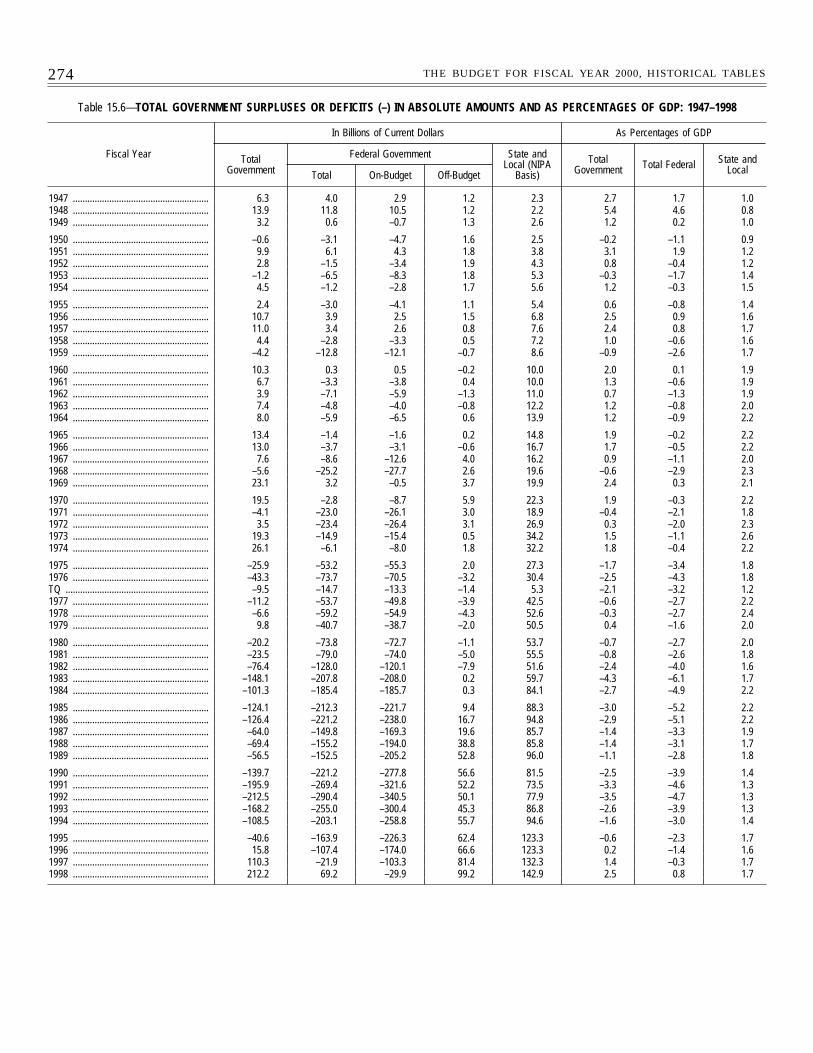
274 THE BUDGET FOR FISCAL YEAR 2000, HISTORICAL TABLES
Table 15.6—TOTAL GOVERNMENT SURPLUSES OR DEFICITS (–) IN ABSOLUTE AMOUNTS AND AS PERCENTAGES OF GDP: 1947–1998
Fiscal Year
In Billions of Current Dollars As Percentages of GDP
TotalGovernment
Federal Government State andLocal (NIPA
Basis)
TotalGovernment Total Federal State and
LocalTotal On-Budget Off-Budget
1947 ........................................................ 6.3 4.0 2.9 1.2 2.3 2.7 1.7 1.01948 ........................................................ 13.9 11.8 10.5 1.2 2.2 5.4 4.6 0.81949 ........................................................ 3.2 0.6 –0.7 1.3 2.6 1.2 0.2 1.0
1950 ........................................................ –0.6 –3.1 –4.7 1.6 2.5 –0.2 –1.1 0.91951 ........................................................ 9.9 6.1 4.3 1.8 3.8 3.1 1.9 1.21952 ........................................................ 2.8 –1.5 –3.4 1.9 4.3 0.8 –0.4 1.21953 ........................................................ –1.2 –6.5 –8.3 1.8 5.3 –0.3 –1.7 1.41954 ........................................................ 4.5 –1.2 –2.8 1.7 5.6 1.2 –0.3 1.5
1955 ........................................................ 2.4 –3.0 –4.1 1.1 5.4 0.6 –0.8 1.41956 ........................................................ 10.7 3.9 2.5 1.5 6.8 2.5 0.9 1.61957 ........................................................ 11.0 3.4 2.6 0.8 7.6 2.4 0.8 1.71958 ........................................................ 4.4 –2.8 –3.3 0.5 7.2 1.0 –0.6 1.61959 ........................................................ –4.2 –12.8 –12.1 –0.7 8.6 –0.9 –2.6 1.7
1960 ........................................................ 10.3 0.3 0.5 –0.2 10.0 2.0 0.1 1.91961 ........................................................ 6.7 –3.3 –3.8 0.4 10.0 1.3 –0.6 1.91962 ........................................................ 3.9 –7.1 –5.9 –1.3 11.0 0.7 –1.3 1.91963 ........................................................ 7.4 –4.8 –4.0 –0.8 12.2 1.2 –0.8 2.01964 ........................................................ 8.0 –5.9 –6.5 0.6 13.9 1.2 –0.9 2.2
1965 ........................................................ 13.4 –1.4 –1.6 0.2 14.8 1.9 –0.2 2.21966 ........................................................ 13.0 –3.7 –3.1 –0.6 16.7 1.7 –0.5 2.21967 ........................................................ 7.6 –8.6 –12.6 4.0 16.2 0.9 –1.1 2.01968 ........................................................ –5.6 –25.2 –27.7 2.6 19.6 –0.6 –2.9 2.31969 ........................................................ 23.1 3.2 –0.5 3.7 19.9 2.4 0.3 2.1
1970 ........................................................ 19.5 –2.8 –8.7 5.9 22.3 1.9 –0.3 2.21971 ........................................................ –4.1 –23.0 –26.1 3.0 18.9 –0.4 –2.1 1.81972 ........................................................ 3.5 –23.4 –26.4 3.1 26.9 0.3 –2.0 2.31973 ........................................................ 19.3 –14.9 –15.4 0.5 34.2 1.5 –1.1 2.61974 ........................................................ 26.1 –6.1 –8.0 1.8 32.2 1.8 –0.4 2.2
1975 ........................................................ –25.9 –53.2 –55.3 2.0 27.3 –1.7 –3.4 1.81976 ........................................................ –43.3 –73.7 –70.5 –3.2 30.4 –2.5 –4.3 1.8TQ ........................................................... –9.5 –14.7 –13.3 –1.4 5.3 –2.1 –3.2 1.21977 ........................................................ –11.2 –53.7 –49.8 –3.9 42.5 –0.6 –2.7 2.21978 ........................................................ –6.6 –59.2 –54.9 –4.3 52.6 –0.3 –2.7 2.41979 ........................................................ 9.8 –40.7 –38.7 –2.0 50.5 0.4 –1.6 2.0
1980 ........................................................ –20.2 –73.8 –72.7 –1.1 53.7 –0.7 –2.7 2.01981 ........................................................ –23.5 –79.0 –74.0 –5.0 55.5 –0.8 –2.6 1.81982 ........................................................ –76.4 –128.0 –120.1 –7.9 51.6 –2.4 –4.0 1.61983 ........................................................ –148.1 –207.8 –208.0 0.2 59.7 –4.3 –6.1 1.71984 ........................................................ –101.3 –185.4 –185.7 0.3 84.1 –2.7 –4.9 2.2
1985 ........................................................ –124.1 –212.3 –221.7 9.4 88.3 –3.0 –5.2 2.21986 ........................................................ –126.4 –221.2 –238.0 16.7 94.8 –2.9 –5.1 2.21987 ........................................................ –64.0 –149.8 –169.3 19.6 85.7 –1.4 –3.3 1.91988 ........................................................ –69.4 –155.2 –194.0 38.8 85.8 –1.4 –3.1 1.71989 ........................................................ –56.5 –152.5 –205.2 52.8 96.0 –1.1 –2.8 1.8
1990 ........................................................ –139.7 –221.2 –277.8 56.6 81.5 –2.5 –3.9 1.41991 ........................................................ –195.9 –269.4 –321.6 52.2 73.5 –3.3 –4.6 1.31992 ........................................................ –212.5 –290.4 –340.5 50.1 77.9 –3.5 –4.7 1.31993 ........................................................ –168.2 –255.0 –300.4 45.3 86.8 –2.6 –3.9 1.31994 ........................................................ –108.5 –203.1 –258.8 55.7 94.6 –1.6 –3.0 1.4
1995 ........................................................ –40.6 –163.9 –226.3 62.4 123.3 –0.6 –2.3 1.71996 ........................................................ 15.8 –107.4 –174.0 66.6 123.3 0.2 –1.4 1.61997 ........................................................ 110.3 –21.9 –103.3 81.4 132.3 1.4 –0.3 1.71998 ........................................................ 212.2 69.2 –29.9 99.2 142.9 2.5 0.8 1.7
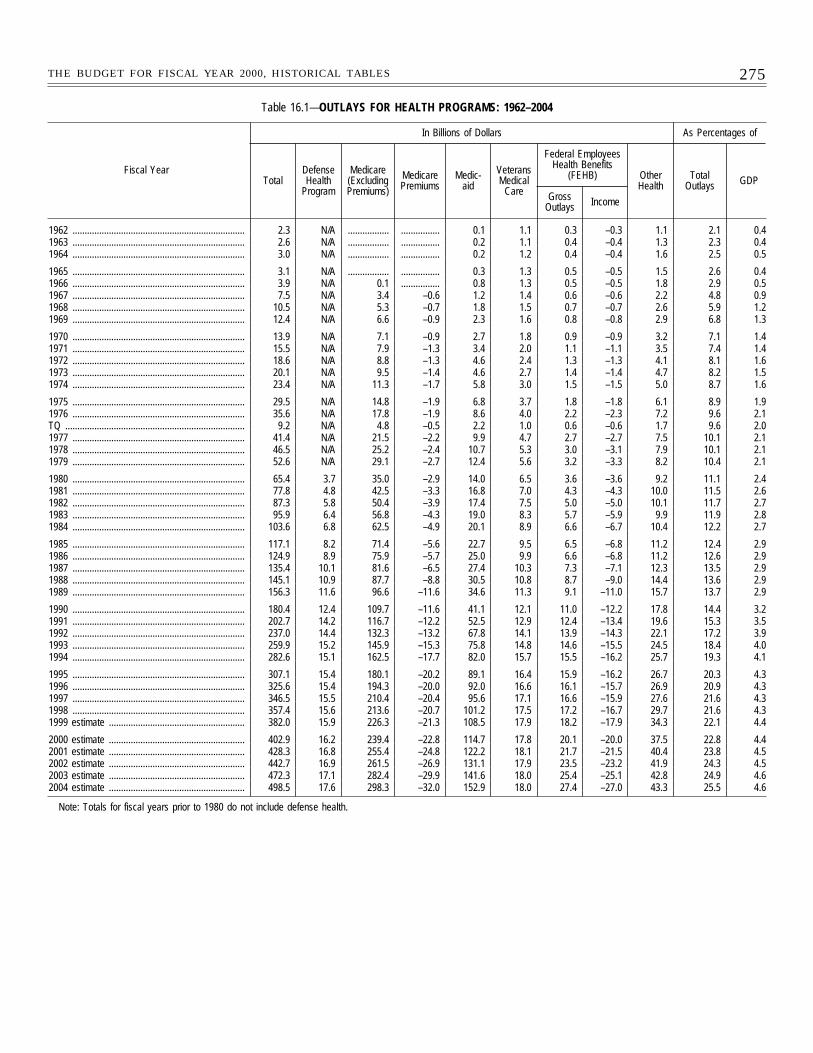
275THE BUDGET FOR FISCAL YEAR 2000, HISTORICAL TABLES
Table 16.1—OUTLAYS FOR HEALTH PROGRAMS: 1962–2004
Fiscal Year
In Billions of Dollars As Percentages of
TotalDefenseHealth
Program
Medicare(ExcludingPremiums)
MedicarePremiums
Medic-aid
VeteransMedical
Care
Federal EmployeesHealth Benefits
(FEHB) OtherHealth
TotalOutlays GDP
GrossOutlays Income
1962 ....................................................................... 2.3 N/A ................. ................ 0.1 1.1 0.3 –0.3 1.1 2.1 0.41963 ....................................................................... 2.6 N/A ................. ................ 0.2 1.1 0.4 –0.4 1.3 2.3 0.41964 ....................................................................... 3.0 N/A ................. ................ 0.2 1.2 0.4 –0.4 1.6 2.5 0.5
1965 ....................................................................... 3.1 N/A ................. ................ 0.3 1.3 0.5 –0.5 1.5 2.6 0.41966 ....................................................................... 3.9 N/A 0.1 ................ 0.8 1.3 0.5 –0.5 1.8 2.9 0.51967 ....................................................................... 7.5 N/A 3.4 –0.6 1.2 1.4 0.6 –0.6 2.2 4.8 0.91968 ....................................................................... 10.5 N/A 5.3 –0.7 1.8 1.5 0.7 –0.7 2.6 5.9 1.21969 ....................................................................... 12.4 N/A 6.6 –0.9 2.3 1.6 0.8 –0.8 2.9 6.8 1.3
1970 ....................................................................... 13.9 N/A 7.1 –0.9 2.7 1.8 0.9 –0.9 3.2 7.1 1.41971 ....................................................................... 15.5 N/A 7.9 –1.3 3.4 2.0 1.1 –1.1 3.5 7.4 1.41972 ....................................................................... 18.6 N/A 8.8 –1.3 4.6 2.4 1.3 –1.3 4.1 8.1 1.61973 ....................................................................... 20.1 N/A 9.5 –1.4 4.6 2.7 1.4 –1.4 4.7 8.2 1.51974 ....................................................................... 23.4 N/A 11.3 –1.7 5.8 3.0 1.5 –1.5 5.0 8.7 1.6
1975 ....................................................................... 29.5 N/A 14.8 –1.9 6.8 3.7 1.8 –1.8 6.1 8.9 1.91976 ....................................................................... 35.6 N/A 17.8 –1.9 8.6 4.0 2.2 –2.3 7.2 9.6 2.1TQ .......................................................................... 9.2 N/A 4.8 –0.5 2.2 1.0 0.6 –0.6 1.7 9.6 2.01977 ....................................................................... 41.4 N/A 21.5 –2.2 9.9 4.7 2.7 –2.7 7.5 10.1 2.11978 ....................................................................... 46.5 N/A 25.2 –2.4 10.7 5.3 3.0 –3.1 7.9 10.1 2.11979 ....................................................................... 52.6 N/A 29.1 –2.7 12.4 5.6 3.2 –3.3 8.2 10.4 2.1
1980 ....................................................................... 65.4 3.7 35.0 –2.9 14.0 6.5 3.6 –3.6 9.2 11.1 2.41981 ....................................................................... 77.8 4.8 42.5 –3.3 16.8 7.0 4.3 –4.3 10.0 11.5 2.61982 ....................................................................... 87.3 5.8 50.4 –3.9 17.4 7.5 5.0 –5.0 10.1 11.7 2.71983 ....................................................................... 95.9 6.4 56.8 –4.3 19.0 8.3 5.7 –5.9 9.9 11.9 2.81984 ....................................................................... 103.6 6.8 62.5 –4.9 20.1 8.9 6.6 –6.7 10.4 12.2 2.7
1985 ....................................................................... 117.1 8.2 71.4 –5.6 22.7 9.5 6.5 –6.8 11.2 12.4 2.91986 ....................................................................... 124.9 8.9 75.9 –5.7 25.0 9.9 6.6 –6.8 11.2 12.6 2.91987 ....................................................................... 135.4 10.1 81.6 –6.5 27.4 10.3 7.3 –7.1 12.3 13.5 2.91988 ....................................................................... 145.1 10.9 87.7 –8.8 30.5 10.8 8.7 –9.0 14.4 13.6 2.91989 ....................................................................... 156.3 11.6 96.6 –11.6 34.6 11.3 9.1 –11.0 15.7 13.7 2.9
1990 ....................................................................... 180.4 12.4 109.7 –11.6 41.1 12.1 11.0 –12.2 17.8 14.4 3.21991 ....................................................................... 202.7 14.2 116.7 –12.2 52.5 12.9 12.4 –13.4 19.6 15.3 3.51992 ....................................................................... 237.0 14.4 132.3 –13.2 67.8 14.1 13.9 –14.3 22.1 17.2 3.91993 ....................................................................... 259.9 15.2 145.9 –15.3 75.8 14.8 14.6 –15.5 24.5 18.4 4.01994 ....................................................................... 282.6 15.1 162.5 –17.7 82.0 15.7 15.5 –16.2 25.7 19.3 4.1
1995 ....................................................................... 307.1 15.4 180.1 –20.2 89.1 16.4 15.9 –16.2 26.7 20.3 4.31996 ....................................................................... 325.6 15.4 194.3 –20.0 92.0 16.6 16.1 –15.7 26.9 20.9 4.31997 ....................................................................... 346.5 15.5 210.4 –20.4 95.6 17.1 16.6 –15.9 27.6 21.6 4.31998 ....................................................................... 357.4 15.6 213.6 –20.7 101.2 17.5 17.2 –16.7 29.7 21.6 4.31999 estimate ........................................................ 382.0 15.9 226.3 –21.3 108.5 17.9 18.2 –17.9 34.3 22.1 4.4
2000 estimate ........................................................ 402.9 16.2 239.4 –22.8 114.7 17.8 20.1 –20.0 37.5 22.8 4.42001 estimate ........................................................ 428.3 16.8 255.4 –24.8 122.2 18.1 21.7 –21.5 40.4 23.8 4.52002 estimate ........................................................ 442.7 16.9 261.5 –26.9 131.1 17.9 23.5 –23.2 41.9 24.3 4.52003 estimate ........................................................ 472.3 17.1 282.4 –29.9 141.6 18.0 25.4 –25.1 42.8 24.9 4.62004 estimate ........................................................ 498.5 17.6 298.3 –32.0 152.9 18.0 27.4 –27.0 43.3 25.5 4.6
Note: Totals for fiscal years prior to 1980 do not include defense health.
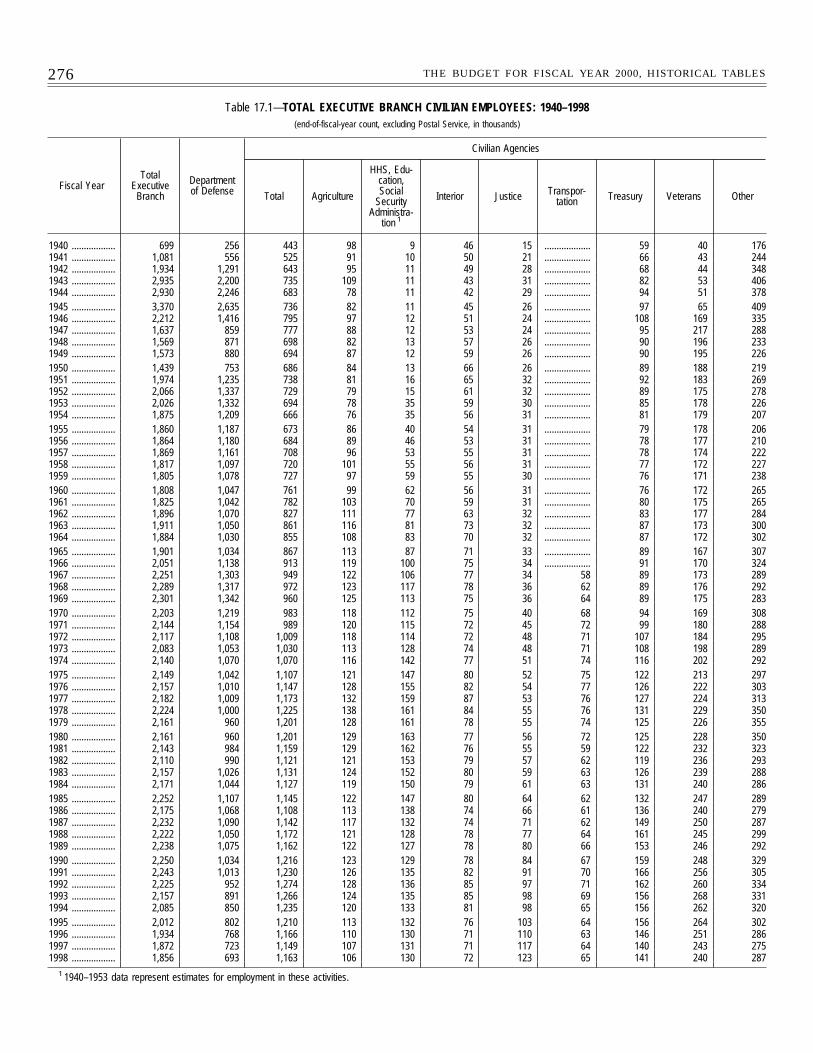
276 THE BUDGET FOR FISCAL YEAR 2000, HISTORICAL TABLES
Table 17.1—TOTAL EXECUTIVE BRANCH CIVILIAN EMPLOYEES: 1940–1998(end-of-fiscal-year count, excluding Postal Service, in thousands)
Fiscal YearTotal
ExecutiveBranch
Departmentof Defense
Civilian Agencies
Total Agriculture
HHS, Edu-cation,Social
SecurityAdministra-
tion 1
Interior Justice Transpor-tation Treasury Veterans Other
1940 .................. 699 256 443 98 9 46 15 ................... 59 40 1761941 .................. 1,081 556 525 91 10 50 21 ................... 66 43 2441942 .................. 1,934 1,291 643 95 11 49 28 ................... 68 44 3481943 .................. 2,935 2,200 735 109 11 43 31 ................... 82 53 4061944 .................. 2,930 2,246 683 78 11 42 29 ................... 94 51 3781945 .................. 3,370 2,635 736 82 11 45 26 ................... 97 65 4091946 .................. 2,212 1,416 795 97 12 51 24 ................... 108 169 3351947 .................. 1,637 859 777 88 12 53 24 ................... 95 217 2881948 .................. 1,569 871 698 82 13 57 26 ................... 90 196 2331949 .................. 1,573 880 694 87 12 59 26 ................... 90 195 2261950 .................. 1,439 753 686 84 13 66 26 ................... 89 188 2191951 .................. 1,974 1,235 738 81 16 65 32 ................... 92 183 2691952 .................. 2,066 1,337 729 79 15 61 32 ................... 89 175 2781953 .................. 2,026 1,332 694 78 35 59 30 ................... 85 178 2261954 .................. 1,875 1,209 666 76 35 56 31 ................... 81 179 2071955 .................. 1,860 1,187 673 86 40 54 31 ................... 79 178 2061956 .................. 1,864 1,180 684 89 46 53 31 ................... 78 177 2101957 .................. 1,869 1,161 708 96 53 55 31 ................... 78 174 2221958 .................. 1,817 1,097 720 101 55 56 31 ................... 77 172 2271959 .................. 1,805 1,078 727 97 59 55 30 ................... 76 171 2381960 .................. 1,808 1,047 761 99 62 56 31 ................... 76 172 2651961 .................. 1,825 1,042 782 103 70 59 31 ................... 80 175 2651962 .................. 1,896 1,070 827 111 77 63 32 ................... 83 177 2841963 .................. 1,911 1,050 861 116 81 73 32 ................... 87 173 3001964 .................. 1,884 1,030 855 108 83 70 32 ................... 87 172 3021965 .................. 1,901 1,034 867 113 87 71 33 ................... 89 167 3071966 .................. 2,051 1,138 913 119 100 75 34 ................... 91 170 3241967 .................. 2,251 1,303 949 122 106 77 34 58 89 173 2891968 .................. 2,289 1,317 972 123 117 78 36 62 89 176 2921969 .................. 2,301 1,342 960 125 113 75 36 64 89 175 2831970 .................. 2,203 1,219 983 118 112 75 40 68 94 169 3081971 .................. 2,144 1,154 989 120 115 72 45 72 99 180 2881972 .................. 2,117 1,108 1,009 118 114 72 48 71 107 184 2951973 .................. 2,083 1,053 1,030 113 128 74 48 71 108 198 2891974 .................. 2,140 1,070 1,070 116 142 77 51 74 116 202 2921975 .................. 2,149 1,042 1,107 121 147 80 52 75 122 213 2971976 .................. 2,157 1,010 1,147 128 155 82 54 77 126 222 3031977 .................. 2,182 1,009 1,173 132 159 87 53 76 127 224 3131978 .................. 2,224 1,000 1,225 138 161 84 55 76 131 229 3501979 .................. 2,161 960 1,201 128 161 78 55 74 125 226 3551980 .................. 2,161 960 1,201 129 163 77 56 72 125 228 3501981 .................. 2,143 984 1,159 129 162 76 55 59 122 232 3231982 .................. 2,110 990 1,121 121 153 79 57 62 119 236 2931983 .................. 2,157 1,026 1,131 124 152 80 59 63 126 239 2881984 .................. 2,171 1,044 1,127 119 150 79 61 63 131 240 2861985 .................. 2,252 1,107 1,145 122 147 80 64 62 132 247 2891986 .................. 2,175 1,068 1,108 113 138 74 66 61 136 240 2791987 .................. 2,232 1,090 1,142 117 132 74 71 62 149 250 2871988 .................. 2,222 1,050 1,172 121 128 78 77 64 161 245 2991989 .................. 2,238 1,075 1,162 122 127 78 80 66 153 246 2921990 .................. 2,250 1,034 1,216 123 129 78 84 67 159 248 3291991 .................. 2,243 1,013 1,230 126 135 82 91 70 166 256 3051992 .................. 2,225 952 1,274 128 136 85 97 71 162 260 3341993 .................. 2,157 891 1,266 124 135 85 98 69 156 268 3311994 .................. 2,085 850 1,235 120 133 81 98 65 156 262 3201995 .................. 2,012 802 1,210 113 132 76 103 64 156 264 3021996 .................. 1,934 768 1,166 110 130 71 110 63 146 251 2861997 .................. 1,872 723 1,149 107 131 71 117 64 140 243 2751998 .................. 1,856 693 1,163 106 130 72 123 65 141 240 287
1 1940–1953 data represent estimates for employment in these activities.
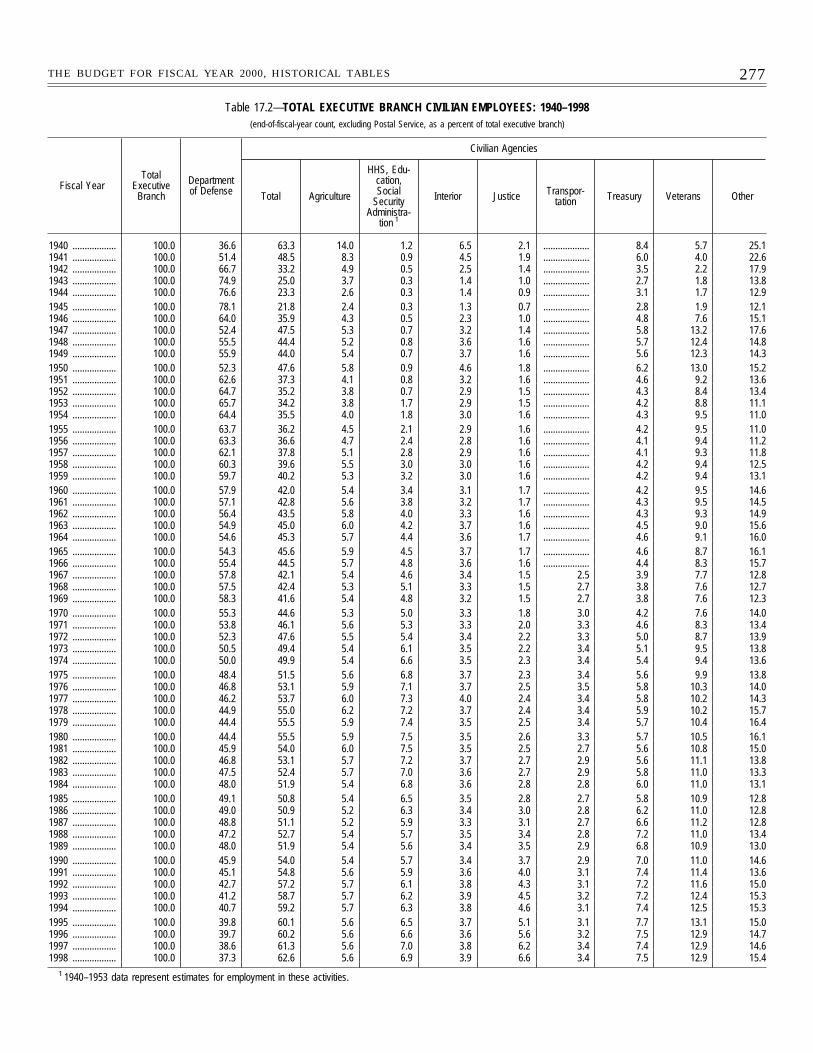
277THE BUDGET FOR FISCAL YEAR 2000, HISTORICAL TABLES
Table 17.2—TOTAL EXECUTIVE BRANCH CIVILIAN EMPLOYEES: 1940–1998(end-of-fiscal-year count, excluding Postal Service, as a percent of total executive branch)
Fiscal YearTotal
ExecutiveBranch
Departmentof Defense
Civilian Agencies
Total Agriculture
HHS, Edu-cation,Social
SecurityAdministra-
tion 1
Interior Justice Transpor-tation Treasury Veterans Other
1940 .................. 100.0 36.6 63.3 14.0 1.2 6.5 2.1 ................... 8.4 5.7 25.11941 .................. 100.0 51.4 48.5 8.3 0.9 4.5 1.9 ................... 6.0 4.0 22.61942 .................. 100.0 66.7 33.2 4.9 0.5 2.5 1.4 ................... 3.5 2.2 17.91943 .................. 100.0 74.9 25.0 3.7 0.3 1.4 1.0 ................... 2.7 1.8 13.81944 .................. 100.0 76.6 23.3 2.6 0.3 1.4 0.9 ................... 3.1 1.7 12.91945 .................. 100.0 78.1 21.8 2.4 0.3 1.3 0.7 ................... 2.8 1.9 12.11946 .................. 100.0 64.0 35.9 4.3 0.5 2.3 1.0 ................... 4.8 7.6 15.11947 .................. 100.0 52.4 47.5 5.3 0.7 3.2 1.4 ................... 5.8 13.2 17.61948 .................. 100.0 55.5 44.4 5.2 0.8 3.6 1.6 ................... 5.7 12.4 14.81949 .................. 100.0 55.9 44.0 5.4 0.7 3.7 1.6 ................... 5.6 12.3 14.31950 .................. 100.0 52.3 47.6 5.8 0.9 4.6 1.8 ................... 6.2 13.0 15.21951 .................. 100.0 62.6 37.3 4.1 0.8 3.2 1.6 ................... 4.6 9.2 13.61952 .................. 100.0 64.7 35.2 3.8 0.7 2.9 1.5 ................... 4.3 8.4 13.41953 .................. 100.0 65.7 34.2 3.8 1.7 2.9 1.5 ................... 4.2 8.8 11.11954 .................. 100.0 64.4 35.5 4.0 1.8 3.0 1.6 ................... 4.3 9.5 11.01955 .................. 100.0 63.7 36.2 4.5 2.1 2.9 1.6 ................... 4.2 9.5 11.01956 .................. 100.0 63.3 36.6 4.7 2.4 2.8 1.6 ................... 4.1 9.4 11.21957 .................. 100.0 62.1 37.8 5.1 2.8 2.9 1.6 ................... 4.1 9.3 11.81958 .................. 100.0 60.3 39.6 5.5 3.0 3.0 1.6 ................... 4.2 9.4 12.51959 .................. 100.0 59.7 40.2 5.3 3.2 3.0 1.6 ................... 4.2 9.4 13.11960 .................. 100.0 57.9 42.0 5.4 3.4 3.1 1.7 ................... 4.2 9.5 14.61961 .................. 100.0 57.1 42.8 5.6 3.8 3.2 1.7 ................... 4.3 9.5 14.51962 .................. 100.0 56.4 43.5 5.8 4.0 3.3 1.6 ................... 4.3 9.3 14.91963 .................. 100.0 54.9 45.0 6.0 4.2 3.7 1.6 ................... 4.5 9.0 15.61964 .................. 100.0 54.6 45.3 5.7 4.4 3.6 1.7 ................... 4.6 9.1 16.01965 .................. 100.0 54.3 45.6 5.9 4.5 3.7 1.7 ................... 4.6 8.7 16.11966 .................. 100.0 55.4 44.5 5.7 4.8 3.6 1.6 ................... 4.4 8.3 15.71967 .................. 100.0 57.8 42.1 5.4 4.6 3.4 1.5 2.5 3.9 7.7 12.81968 .................. 100.0 57.5 42.4 5.3 5.1 3.3 1.5 2.7 3.8 7.6 12.71969 .................. 100.0 58.3 41.6 5.4 4.8 3.2 1.5 2.7 3.8 7.6 12.31970 .................. 100.0 55.3 44.6 5.3 5.0 3.3 1.8 3.0 4.2 7.6 14.01971 .................. 100.0 53.8 46.1 5.6 5.3 3.3 2.0 3.3 4.6 8.3 13.41972 .................. 100.0 52.3 47.6 5.5 5.4 3.4 2.2 3.3 5.0 8.7 13.91973 .................. 100.0 50.5 49.4 5.4 6.1 3.5 2.2 3.4 5.1 9.5 13.81974 .................. 100.0 50.0 49.9 5.4 6.6 3.5 2.3 3.4 5.4 9.4 13.61975 .................. 100.0 48.4 51.5 5.6 6.8 3.7 2.3 3.4 5.6 9.9 13.81976 .................. 100.0 46.8 53.1 5.9 7.1 3.7 2.5 3.5 5.8 10.3 14.01977 .................. 100.0 46.2 53.7 6.0 7.3 4.0 2.4 3.4 5.8 10.2 14.31978 .................. 100.0 44.9 55.0 6.2 7.2 3.7 2.4 3.4 5.9 10.2 15.71979 .................. 100.0 44.4 55.5 5.9 7.4 3.5 2.5 3.4 5.7 10.4 16.41980 .................. 100.0 44.4 55.5 5.9 7.5 3.5 2.6 3.3 5.7 10.5 16.11981 .................. 100.0 45.9 54.0 6.0 7.5 3.5 2.5 2.7 5.6 10.8 15.01982 .................. 100.0 46.8 53.1 5.7 7.2 3.7 2.7 2.9 5.6 11.1 13.81983 .................. 100.0 47.5 52.4 5.7 7.0 3.6 2.7 2.9 5.8 11.0 13.31984 .................. 100.0 48.0 51.9 5.4 6.8 3.6 2.8 2.8 6.0 11.0 13.11985 .................. 100.0 49.1 50.8 5.4 6.5 3.5 2.8 2.7 5.8 10.9 12.81986 .................. 100.0 49.0 50.9 5.2 6.3 3.4 3.0 2.8 6.2 11.0 12.81987 .................. 100.0 48.8 51.1 5.2 5.9 3.3 3.1 2.7 6.6 11.2 12.81988 .................. 100.0 47.2 52.7 5.4 5.7 3.5 3.4 2.8 7.2 11.0 13.41989 .................. 100.0 48.0 51.9 5.4 5.6 3.4 3.5 2.9 6.8 10.9 13.01990 .................. 100.0 45.9 54.0 5.4 5.7 3.4 3.7 2.9 7.0 11.0 14.61991 .................. 100.0 45.1 54.8 5.6 5.9 3.6 4.0 3.1 7.4 11.4 13.61992 .................. 100.0 42.7 57.2 5.7 6.1 3.8 4.3 3.1 7.2 11.6 15.01993 .................. 100.0 41.2 58.7 5.7 6.2 3.9 4.5 3.2 7.2 12.4 15.31994 .................. 100.0 40.7 59.2 5.7 6.3 3.8 4.6 3.1 7.4 12.5 15.31995 .................. 100.0 39.8 60.1 5.6 6.5 3.7 5.1 3.1 7.7 13.1 15.01996 .................. 100.0 39.7 60.2 5.6 6.6 3.6 5.6 3.2 7.5 12.9 14.71997 .................. 100.0 38.6 61.3 5.6 7.0 3.8 6.2 3.4 7.4 12.9 14.61998 .................. 100.0 37.3 62.6 5.6 6.9 3.9 6.6 3.4 7.5 12.9 15.4
1 1940–1953 data represent estimates for employment in these activities.
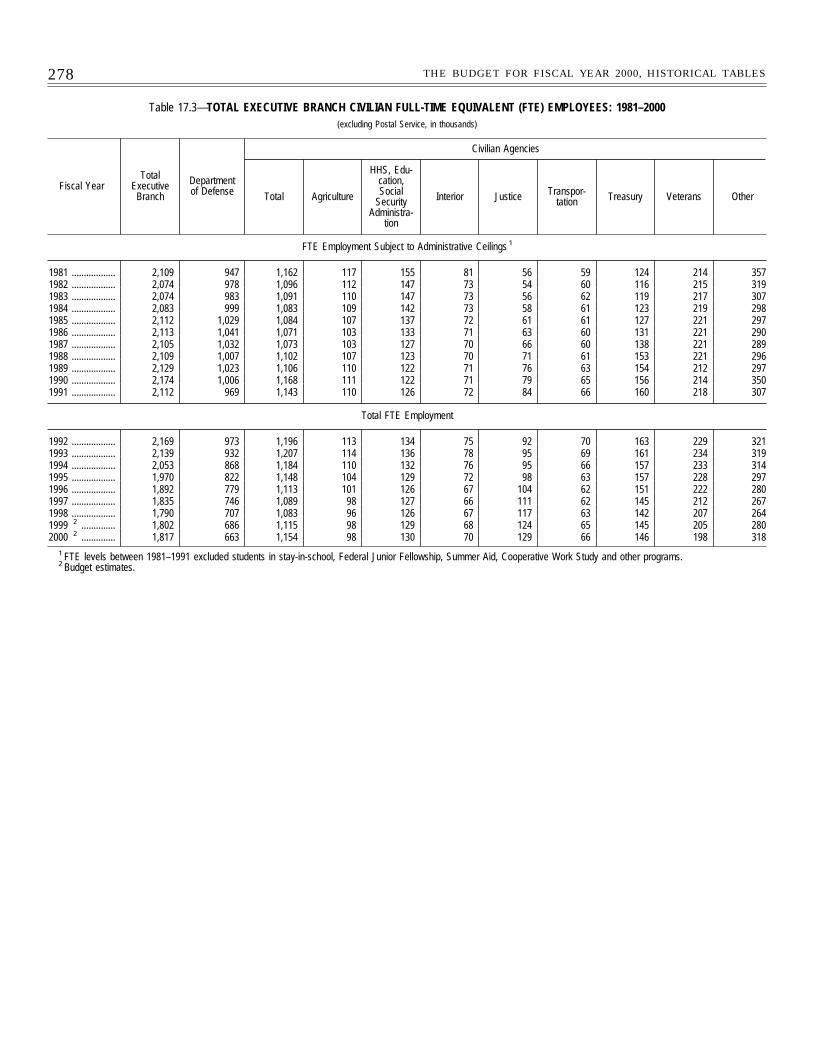
278 THE BUDGET FOR FISCAL YEAR 2000, HISTORICAL TABLES
Table 17.3—TOTAL EXECUTIVE BRANCH CIVILIAN FULL-TIME EQUIVALENT (FTE) EMPLOYEES: 1981–2000(excluding Postal Service, in thousands)
Fiscal YearTotal
ExecutiveBranch
Departmentof Defense
Civilian Agencies
Total Agriculture
HHS, Edu-cation,Social
SecurityAdministra-
tion
Interior Justice Transpor-tation Treasury Veterans Other
FTE Employment Subject to Administrative Ceilings 1
1981 .................. 2,109 947 1,162 117 155 81 56 59 124 214 3571982 .................. 2,074 978 1,096 112 147 73 54 60 116 215 3191983 .................. 2,074 983 1,091 110 147 73 56 62 119 217 3071984 .................. 2,083 999 1,083 109 142 73 58 61 123 219 2981985 .................. 2,112 1,029 1,084 107 137 72 61 61 127 221 2971986 .................. 2,113 1,041 1,071 103 133 71 63 60 131 221 2901987 .................. 2,105 1,032 1,073 103 127 70 66 60 138 221 2891988 .................. 2,109 1,007 1,102 107 123 70 71 61 153 221 2961989 .................. 2,129 1,023 1,106 110 122 71 76 63 154 212 2971990 .................. 2,174 1,006 1,168 111 122 71 79 65 156 214 3501991 .................. 2,112 969 1,143 110 126 72 84 66 160 218 307
Total FTE Employment
1992 .................. 2,169 973 1,196 113 134 75 92 70 163 229 3211993 .................. 2,139 932 1,207 114 136 78 95 69 161 234 3191994 .................. 2,053 868 1,184 110 132 76 95 66 157 233 3141995 .................. 1,970 822 1,148 104 129 72 98 63 157 228 2971996 .................. 1,892 779 1,113 101 126 67 104 62 151 222 2801997 .................. 1,835 746 1,089 98 127 66 111 62 145 212 2671998 .................. 1,790 707 1,083 96 126 67 117 63 142 207 2641999 2 .............. 1,802 686 1,115 98 129 68 124 65 145 205 2802000 2 .............. 1,817 663 1,154 98 130 70 129 66 146 198 318
1 FTE levels between 1981–1991 excluded students in stay-in-school, Federal Junior Fellowship, Summer Aid, Cooperative Work Study and other programs.2 Budget estimates.
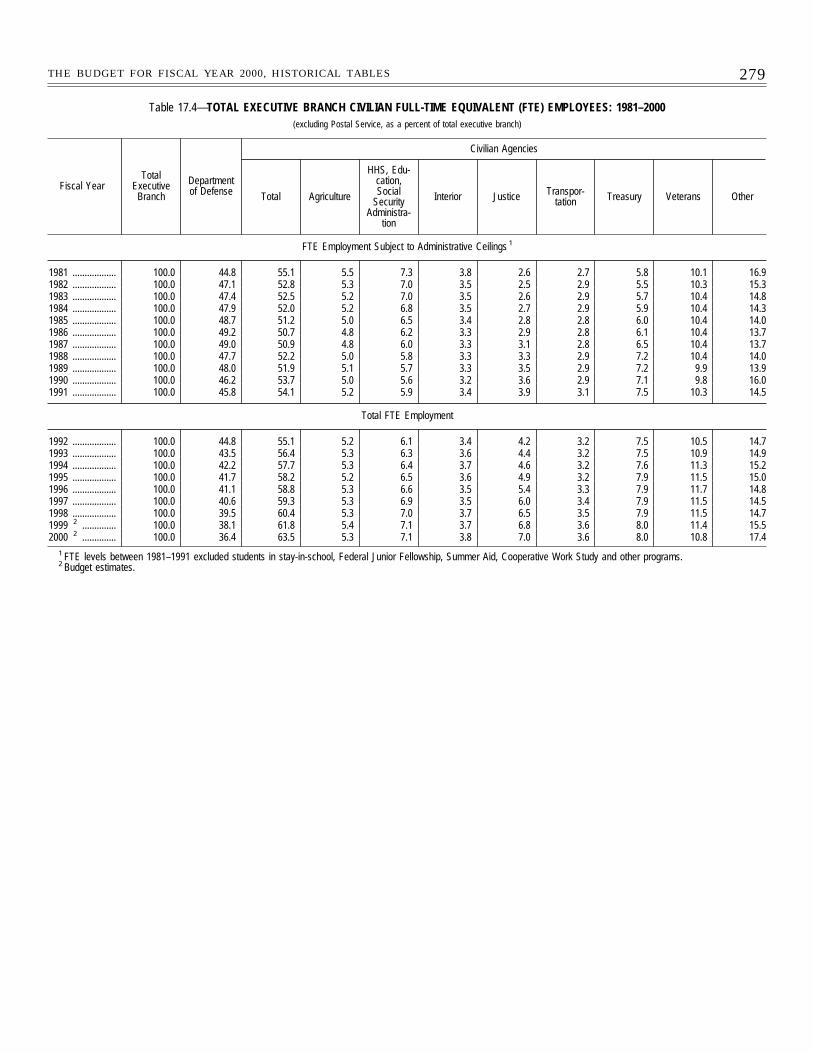
279THE BUDGET FOR FISCAL YEAR 2000, HISTORICAL TABLES
Table 17.4—TOTAL EXECUTIVE BRANCH CIVILIAN FULL-TIME EQUIVALENT (FTE) EMPLOYEES: 1981–2000(excluding Postal Service, as a percent of total executive branch)
Fiscal YearTotal
ExecutiveBranch
Departmentof Defense
Civilian Agencies
Total Agriculture
HHS, Edu-cation,Social
SecurityAdministra-
tion
Interior Justice Transpor-tation Treasury Veterans Other
FTE Employment Subject to Administrative Ceilings 1
1981 .................. 100.0 44.8 55.1 5.5 7.3 3.8 2.6 2.7 5.8 10.1 16.91982 .................. 100.0 47.1 52.8 5.3 7.0 3.5 2.5 2.9 5.5 10.3 15.31983 .................. 100.0 47.4 52.5 5.2 7.0 3.5 2.6 2.9 5.7 10.4 14.81984 .................. 100.0 47.9 52.0 5.2 6.8 3.5 2.7 2.9 5.9 10.4 14.31985 .................. 100.0 48.7 51.2 5.0 6.5 3.4 2.8 2.8 6.0 10.4 14.01986 .................. 100.0 49.2 50.7 4.8 6.2 3.3 2.9 2.8 6.1 10.4 13.71987 .................. 100.0 49.0 50.9 4.8 6.0 3.3 3.1 2.8 6.5 10.4 13.71988 .................. 100.0 47.7 52.2 5.0 5.8 3.3 3.3 2.9 7.2 10.4 14.01989 .................. 100.0 48.0 51.9 5.1 5.7 3.3 3.5 2.9 7.2 9.9 13.91990 .................. 100.0 46.2 53.7 5.0 5.6 3.2 3.6 2.9 7.1 9.8 16.01991 .................. 100.0 45.8 54.1 5.2 5.9 3.4 3.9 3.1 7.5 10.3 14.5
Total FTE Employment
1992 .................. 100.0 44.8 55.1 5.2 6.1 3.4 4.2 3.2 7.5 10.5 14.71993 .................. 100.0 43.5 56.4 5.3 6.3 3.6 4.4 3.2 7.5 10.9 14.91994 .................. 100.0 42.2 57.7 5.3 6.4 3.7 4.6 3.2 7.6 11.3 15.21995 .................. 100.0 41.7 58.2 5.2 6.5 3.6 4.9 3.2 7.9 11.5 15.01996 .................. 100.0 41.1 58.8 5.3 6.6 3.5 5.4 3.3 7.9 11.7 14.81997 .................. 100.0 40.6 59.3 5.3 6.9 3.5 6.0 3.4 7.9 11.5 14.51998 .................. 100.0 39.5 60.4 5.3 7.0 3.7 6.5 3.5 7.9 11.5 14.71999 2 .............. 100.0 38.1 61.8 5.4 7.1 3.7 6.8 3.6 8.0 11.4 15.52000 2 .............. 100.0 36.4 63.5 5.3 7.1 3.8 7.0 3.6 8.0 10.8 17.4
1 FTE levels between 1981–1991 excluded students in stay-in-school, Federal Junior Fellowship, Summer Aid, Cooperative Work Study and other programs.2 Budget estimates.
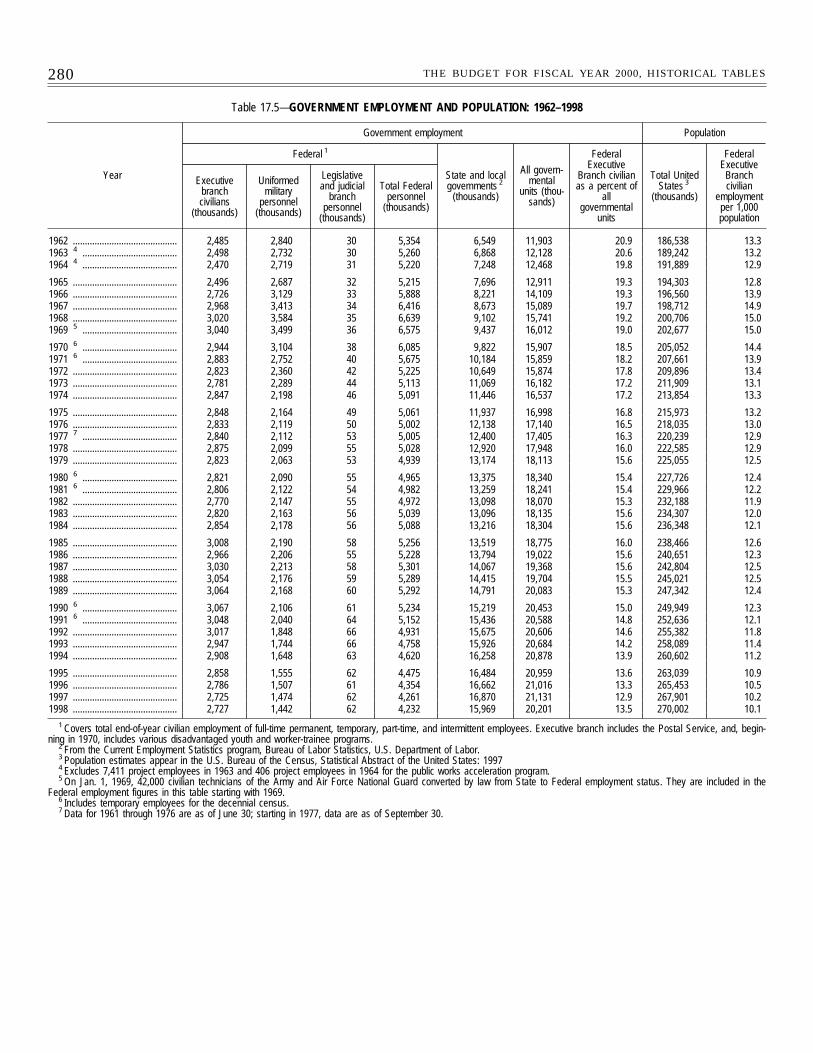
280 THE BUDGET FOR FISCAL YEAR 2000, HISTORICAL TABLES
Table 17.5—GOVERNMENT EMPLOYMENT AND POPULATION: 1962–1998
Year
Government employment Population
Federal 1
State and localgovernments 2
(thousands)
All govern-mental
units (thou-sands)
FederalExecutive
Branch civilianas a percent of
allgovernmental
units
Total UnitedStates 3
(thousands)
FederalExecutive
Branchcivilian
employmentper 1,000population
Executivebranchcivilians
(thousands)
Uniformedmilitary
personnel(thousands)
Legislativeand judicial
branchpersonnel
(thousands)
Total Federalpersonnel
(thousands)
1962 ........................................... 2,485 2,840 30 5,354 6,549 11,903 20.9 186,538 13.31963 4 ....................................... 2,498 2,732 30 5,260 6,868 12,128 20.6 189,242 13.21964 4 ....................................... 2,470 2,719 31 5,220 7,248 12,468 19.8 191,889 12.9
1965 ........................................... 2,496 2,687 32 5,215 7,696 12,911 19.3 194,303 12.81966 ........................................... 2,726 3,129 33 5,888 8,221 14,109 19.3 196,560 13.91967 ........................................... 2,968 3,413 34 6,416 8,673 15,089 19.7 198,712 14.91968 ........................................... 3,020 3,584 35 6,639 9,102 15,741 19.2 200,706 15.01969 5 ....................................... 3,040 3,499 36 6,575 9,437 16,012 19.0 202,677 15.0
1970 6 ....................................... 2,944 3,104 38 6,085 9,822 15,907 18.5 205,052 14.41971 6 ....................................... 2,883 2,752 40 5,675 10,184 15,859 18.2 207,661 13.91972 ........................................... 2,823 2,360 42 5,225 10,649 15,874 17.8 209,896 13.41973 ........................................... 2,781 2,289 44 5,113 11,069 16,182 17.2 211,909 13.11974 ........................................... 2,847 2,198 46 5,091 11,446 16,537 17.2 213,854 13.3
1975 ........................................... 2,848 2,164 49 5,061 11,937 16,998 16.8 215,973 13.21976 ........................................... 2,833 2,119 50 5,002 12,138 17,140 16.5 218,035 13.01977 7 ....................................... 2,840 2,112 53 5,005 12,400 17,405 16.3 220,239 12.91978 ........................................... 2,875 2,099 55 5,028 12,920 17,948 16.0 222,585 12.91979 ........................................... 2,823 2,063 53 4,939 13,174 18,113 15.6 225,055 12.5
1980 6 ....................................... 2,821 2,090 55 4,965 13,375 18,340 15.4 227,726 12.41981 6 ....................................... 2,806 2,122 54 4,982 13,259 18,241 15.4 229,966 12.21982 ........................................... 2,770 2,147 55 4,972 13,098 18,070 15.3 232,188 11.91983 ........................................... 2,820 2,163 56 5,039 13,096 18,135 15.6 234,307 12.01984 ........................................... 2,854 2,178 56 5,088 13,216 18,304 15.6 236,348 12.1
1985 ........................................... 3,008 2,190 58 5,256 13,519 18,775 16.0 238,466 12.61986 ........................................... 2,966 2,206 55 5,228 13,794 19,022 15.6 240,651 12.31987 ........................................... 3,030 2,213 58 5,301 14,067 19,368 15.6 242,804 12.51988 ........................................... 3,054 2,176 59 5,289 14,415 19,704 15.5 245,021 12.51989 ........................................... 3,064 2,168 60 5,292 14,791 20,083 15.3 247,342 12.4
1990 6 ....................................... 3,067 2,106 61 5,234 15,219 20,453 15.0 249,949 12.31991 6 ....................................... 3,048 2,040 64 5,152 15,436 20,588 14.8 252,636 12.11992 ........................................... 3,017 1,848 66 4,931 15,675 20,606 14.6 255,382 11.81993 ........................................... 2,947 1,744 66 4,758 15,926 20,684 14.2 258,089 11.41994 ........................................... 2,908 1,648 63 4,620 16,258 20,878 13.9 260,602 11.2
1995 ........................................... 2,858 1,555 62 4,475 16,484 20,959 13.6 263,039 10.91996 ........................................... 2,786 1,507 61 4,354 16,662 21,016 13.3 265,453 10.51997 ........................................... 2,725 1,474 62 4,261 16,870 21,131 12.9 267,901 10.21998 ........................................... 2,727 1,442 62 4,232 15,969 20,201 13.5 270,002 10.1
1 Covers total end-of-year civilian employment of full-time permanent, temporary, part-time, and intermittent employees. Executive branch includes the Postal Service, and, begin-ning in 1970, includes various disadvantaged youth and worker-trainee programs.
2 From the Current Employment Statistics program, Bureau of Labor Statistics, U.S. Department of Labor.3 Population estimates appear in the U.S. Bureau of the Census, Statistical Abstract of the United States: 19974 Excludes 7,411 project employees in 1963 and 406 project employees in 1964 for the public works acceleration program.5 On Jan. 1, 1969, 42,000 civilian technicians of the Army and Air Force National Guard converted by law from State to Federal employment status. They are included in the
Federal employment figures in this table starting with 1969.6 Includes temporary employees for the decennial census.7 Data for 1961 through 1976 are as of June 30; starting in 1977, data are as of September 30.
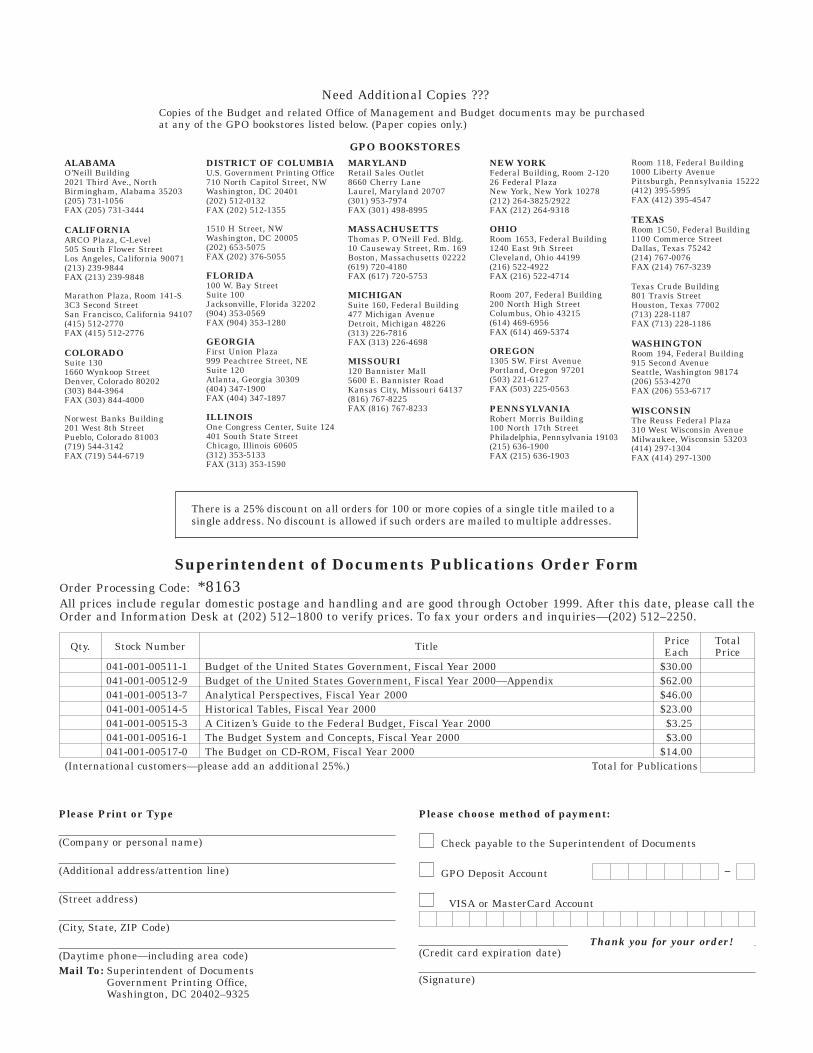
Need Additional Copies ???Copies of the Budget and related Office of Management and Budget documents may be purchasedat any of the GPO bookstores listed below. (Paper copies only.)
GPO BOOKSTORESALABAMAO’Neill Building2021 Third Ave., NorthBirmingham, Alabama 35203(205) 731-1056FAX (205) 731-3444
CALIFORNIAARCO Plaza, C-Level505 South Flower StreetLos Angeles, California 90071(213) 239-9844FAX (213) 239-9848
Marathon Plaza, Room 141-S3C3 Second StreetSan Francisco, California 94107(415) 512-2770FAX (415) 512-2776
COLORADOSuite 1301660 Wynkoop StreetDenver, Colorado 80202(303) 844-3964FAX (303) 844-4000
Norwest Banks Building201 West 8th StreetPueblo, Colorado 81003(719) 544-3142FAX (719) 544-6719
DISTRICT OF COLUMBIAU.S. Government Printing Office710 North Capitol Street, NWWashington, DC 20401(202) 512-0132FAX (202) 512-1355
1510 H Street, NWWashington, DC 20005(202) 653-5075FAX (202) 376-5055
FLORIDA100 W. Bay StreetSuite 100Jacksonville, Florida 32202(904) 353-0569FAX (904) 353-1280
GEORGIAFirst Union Plaza999 Peachtree Street, NESuite 120Atlanta, Georgia 30309(404) 347-1900FAX (404) 347-1897
ILLINOISOne Congress Center, Suite 124401 South State StreetChicago, Illinois 60605(312) 353-5133FAX (313) 353-1590
MARYLANDRetail Sales Outlet8660 Cherry LaneLaurel, Maryland 20707(301) 953-7974FAX (301) 498-8995
MASSACHUSETTSThomas P. O’Neill Fed. Bldg.10 Causeway Street, Rm. 169Boston, Massachusetts 02222(619) 720-4180FAX (617) 720-5753
MICHIGANSuite 160, Federal Building477 Michigan AvenueDetroit, Michigan 48226(313) 226-7816FAX (313) 226-4698
MISSOURI120 Bannister Mall5600 E. Bannister RoadKansas City, Missouri 64137(816) 767-8225FAX (816) 767-8233
NEW YORKFederal Building, Room 2-12026 Federal PlazaNew York, New York 10278(212) 264-3825/2922FAX (212) 264-9318
OHIORoom 1653, Federal Building1240 East 9th StreetCleveland, Ohio 44199(216) 522-4922FAX (216) 522-4714
Room 207, Federal Building200 North High StreetColumbus, Ohio 43215(614) 469-6956FAX (614) 469-5374
OREGON1305 SW. First AvenuePortland, Oregon 97201(503) 221-6127FAX (503) 225-0563
PENNSYLVANIARobert Morris Building100 North 17th StreetPhiladelphia, Pennsylvania 19103(215) 636-1900FAX (215) 636-1903
Room 118, Federal Building1000 Liberty AvenuePittsburgh, Pennsylvania 15222(412) 395-5995FAX (412) 395-4547
TEXASRoom 1C50, Federal Building1100 Commerce StreetDallas, Texas 75242(214) 767-0076FAX (214) 767-3239
Texas Crude Building801 Travis StreetHouston, Texas 77002(713) 228-1187FAX (713) 228-1186
WASHINGTONRoom 194, Federal Building915 Second AvenueSeattle, Washington 98174(206) 553-4270FAX (206) 553-6717
WISCONSINThe Reuss Federal Plaza310 West Wisconsin AvenueMilwaukee, Wisconsin 53203(414) 297-1304FAX (414) 297-1300
There is a 25% discount on all orders for 100 or more copies of a single title mailed to asingle address. No discount is allowed if such orders are mailed to multiple addresses.
Superintendent of Documents Publications Order FormOrder Processing Code: *8163All prices include regular domestic postage and handling and are good through October 1999. After this date, please call theOrder and Information Desk at (202) 512–1800 to verify prices. To fax your orders and inquiries—(202) 512–2250.
Qty. Stock Number Title PriceEach
TotalPrice
041-001-00511-1 Budget of the United States Government, Fiscal Year 2000 $30.00041-001-00512-9 Budget of the United States Government, Fiscal Year 2000—Appendix $62.00041-001-00513-7 Analytical Perspectives, Fiscal Year 2000 $46.00041-001-00514-5 Historical Tables, Fiscal Year 2000 $23.00041-001-00515-3 A Citizen’s Guide to the Federal Budget, Fiscal Year 2000 $3.25041-001-00516-1 The Budget System and Concepts, Fiscal Year 2000 $3.00041-001-00517-0 The Budget on CD-ROM, Fiscal Year 2000 $14.00
(International customers—please add an additional 25%.) Total for Publications
Please Print or Type
(Company or personal name)
(Additional address/attention line)
(Street address)
(City, State, ZIP Code)
(Daytime phone—including area code)Mail To: Superintendent of DocumentsMail To: Government Printing Office,Mail To: Washington, DC 20402–9325
Please choose method of payment:
Check payable to the Superintendent of Documents
GPO Deposit Account
VISA or MasterCard Account
(Credit card expiration date)
(Signature)
–
Thank you for your order!