Embed Size (px)
Citation preview
STATE BUDGET2000-2001
BUDGET OVERVIEW
Budget Paper No. 2

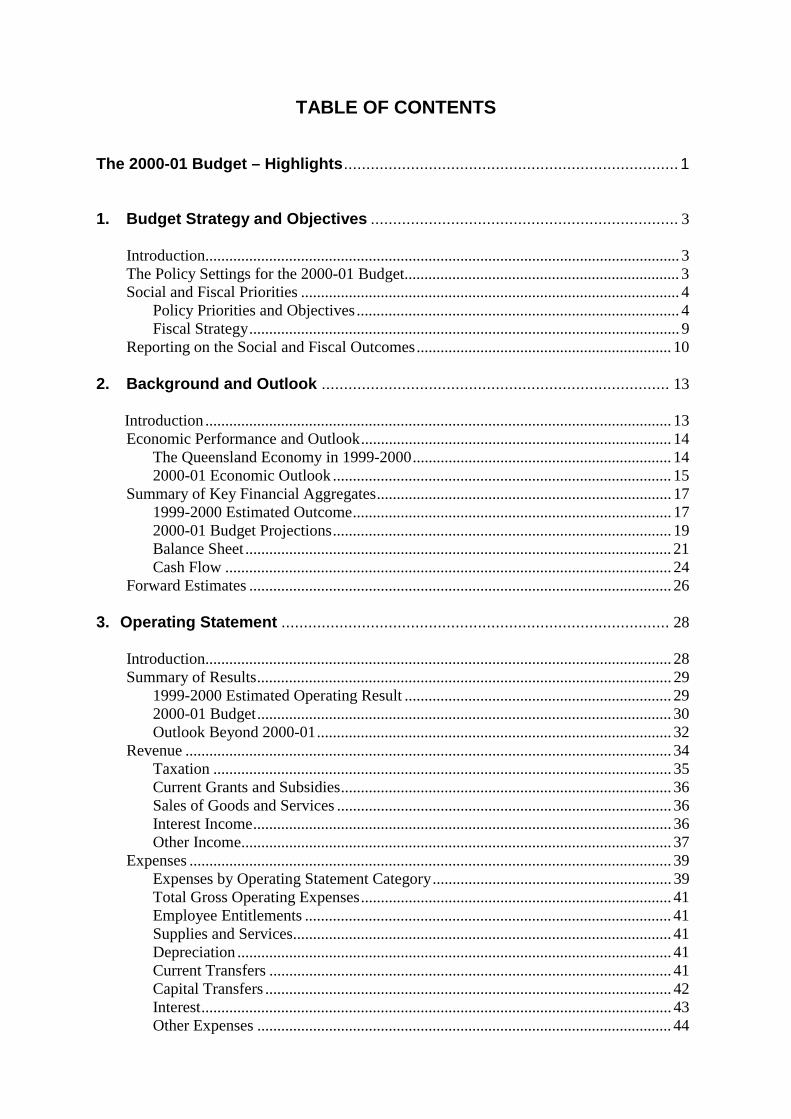
TABLE OF CONTENTS
The 2000-01 Budget – Highlights........................................................................... 1
1. Budget Strategy and Objectives ..................................................................... 3
Introduction....................................................................................................................... 3The Policy Settings for the 2000-01 Budget..................................................................... 3Social and Fiscal Priorities ............................................................................................... 4
Policy Priorities and Objectives ................................................................................. 4Fiscal Strategy............................................................................................................ 9
Reporting on the Social and Fiscal Outcomes................................................................ 10
2. Background and Outlook .............................................................................. 13
Introduction ..................................................................................................................... 13Economic Performance and Outlook.............................................................................. 14
The Queensland Economy in 1999-2000................................................................. 142000-01 Economic Outlook ..................................................................................... 15
Summary of Key Financial Aggregates.......................................................................... 171999-2000 Estimated Outcome................................................................................ 172000-01 Budget Projections..................................................................................... 19Balance Sheet ........................................................................................................... 21Cash Flow ................................................................................................................ 24
Forward Estimates .......................................................................................................... 26
3. Operating Statement ....................................................................................... 28
Introduction..................................................................................................................... 28Summary of Results........................................................................................................ 29
1999-2000 Estimated Operating Result ................................................................... 292000-01 Budget........................................................................................................ 30Outlook Beyond 2000-01......................................................................................... 32
Revenue .......................................................................................................................... 34Taxation ................................................................................................................... 35Current Grants and Subsidies................................................................................... 36Sales of Goods and Services .................................................................................... 36Interest Income......................................................................................................... 36Other Income............................................................................................................ 37
Expenses ......................................................................................................................... 39Expenses by Operating Statement Category............................................................ 39Total Gross Operating Expenses.............................................................................. 41Employee Entitlements ............................................................................................ 41Supplies and Services............................................................................................... 41Depreciation ............................................................................................................. 41Current Transfers ..................................................................................................... 41Capital Transfers ...................................................................................................... 42Interest...................................................................................................................... 43Other Expenses ........................................................................................................ 44
Operating Expenses by Purpose............................................................................... 44
4. Statement of Financial Position ..................................................................... 46
Introduction..................................................................................................................... 46Financial Reporting Measures ........................................................................................ 46
Net Worth................................................................................................................. 46Net Financial Assets................................................................................................. 47
General Government Sector ........................................................................................... 48Net Worth................................................................................................................. 48Financial Assets and Liabilities ............................................................................... 50
Public Trading Enterprise Sector.................................................................................... 53Total State Position......................................................................................................... 54
Net Worth................................................................................................................. 54
5. Statement of Cash Flows ................................................................................ 56
Introduction..................................................................................................................... 56Background..................................................................................................................... 56Budgeted Statement of Cash Flow Summary................................................................. 57Cash Flows from Operating Activities ........................................................................... 58Cash Flows from Investments ........................................................................................ 59Cash Flows from Financing Activities ........................................................................... 60Reconciliation of Operating Cash Flows to the Operating Statement............................ 61
6. Capital Program ............................................................................................... 62
Introduction..................................................................................................................... 62Definitions................................................................................................................ 62Coverage .................................................................................................................. 62
Fiscal Strategy and Capital Policy.................................................................................. 63Capital Outlays ............................................................................................................... 63
Funding .................................................................................................................... 65Employment Generation................................................................................................. 67Service Priorities............................................................................................................. 67
7. Long Term Fiscal Trends ................................................................................ 72
Introduction..................................................................................................................... 72Social and Economic Environment ................................................................................ 72Trends in Recurrent Expenditure.................................................................................... 74
Efficiency in Service Delivery................................................................................. 75Trends in Capital Expenditure ........................................................................................ 77Funding Capital Expenditure.......................................................................................... 78Trends in State Government Revenue ............................................................................ 82Impact of Past Trends on Future Fiscal Performance..................................................... 87
APPENDIX A .......................................................................................................... 89
Government Finance Statistics ....................................................................................... 89Introduction..................................................................................................................... 89
Operating Position .......................................................................................................... 89Net Operating Results .............................................................................................. 89General Government ................................................................................................ 89Public Trading Enterprises....................................................................................... 89State Non-PFE Sector .............................................................................................. 89
Balance Sheet Position ................................................................................................... 92General Government ................................................................................................ 93Public Trading Enterprises....................................................................................... 93
Statement of Cash Flows ................................................................................................ 97General Government ................................................................................................ 97Public Trading Enterprises....................................................................................... 98
Other GFS Data ............................................................................................................ 102Loan Council Allocation............................................................................................... 103
APPENDIX B ........................................................................................................ 104
Financial Statements – General Purpose Financial Report Presentation ...................... 104Introduction ................................................................................................................... 104
Basis of Reports ..................................................................................................... 104Scope of Statements ............................................................................................... 105
General Government Sector.......................................................................................... 106General Government Sector – Budgeted Statement of Financial Performance..... 106General Government Sector – Budgeted Statement of Financial Position ............ 110General Government Sector – Budgeted Statement of Cash Flows ...................... 114
Public Trading Enterprises Sector................................................................................. 116Public Trading Enterprises Sector – Budgeted Statement of Financial
Performance....................................................................................................... 116Public Trading Enterprises Sector – Budgeted Statement of Financial Position... 120Public Trading Enterprises Sector – Budgeted Statement of Cash flows .............. 124
Total (Non-PFE) State Sector ....................................................................................... 126Total (Non-PFE) State Sector – Budgeted Statement of Financial Performance .. 126Total (Non-PFE) State Sector – Budgeted Statement of Financial Position.......... 130Total (Non-PFE) State Sector – Budgeted Statement of Cash Flows.................... 134
APPENDIX C ........................................................................................................ 138
Statement of Risks ........................................................................................................ 138Introduction................................................................................................................... 138
Economic ............................................................................................................... 138Revenue and Expenses........................................................................................... 139Net Worth............................................................................................................... 142
Contingent Assets and Liabilities.................................................................................. 142Contingent Liabilities............................................................................................. 142Contingent Assets .................................................................................................. 144
APPENDIX D ........................................................................................................ 146Background and Interpretation of Government Finance Statistics ............................... 146Introduction ................................................................................................................... 146Background ................................................................................................................... 146
Recent Developments in GFS Reporting ............................................................... 146Relationship with Standard Accounting Treatment ............................................... 147
Interpretation of GFS ............................................................................................. 147Relationship with ABS Statistics ........................................................................... 148Differences between GFS and GPFR’s.................................................................. 148Definition of GFS Sectors...................................................................................... 150Main GFS Aggregates............................................................................................ 151
GFS Operating Statement Glossary of Terms............................................................... 153Revenue.................................................................................................................. 153Expenses................................................................................................................. 153
Reporting Entities.......................................................................................................... 155General Government .............................................................................................. 155Public Trading Enterprises..................................................................................... 156
Budget Overview 2000-2001 1
THE 2000-01 BUDGET - HIGHLIGHTS
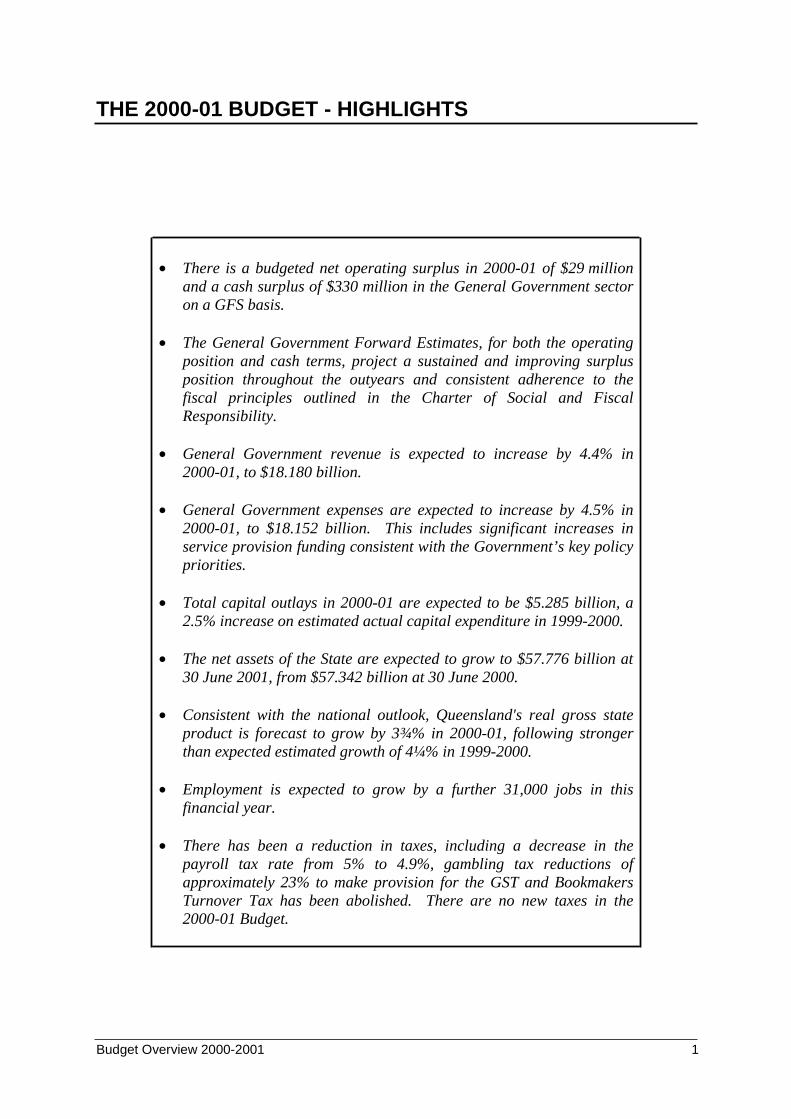
• There is a budgeted net operating surplus in 2000-01 of $29 millionand a cash surplus of $330 million in the General Government sectoron a GFS basis.
• The General Government Forward Estimates, for both the operatingposition and cash terms, project a sustained and improving surplusposition throughout the outyears and consistent adherence to thefiscal principles outlined in the Charter of Social and FiscalResponsibility.
• General Government revenue is expected to increase by 4.4% in2000-01, to $18.180 billion.
• General Government expenses are expected to increase by 4.5% in2000-01, to $18.152 billion. This includes significant increases inservice provision funding consistent with the Government’s key policypriorities.
• Total capital outlays in 2000-01 are expected to be $5.285 billion, a2.5% increase on estimated actual capital expenditure in 1999-2000.
• The net assets of the State are expected to grow to $57.776 billion at30 June 2001, from $57.342 billion at 30 June 2000.
• Consistent with the national outlook, Queensland's real gross stateproduct is forecast to grow by 3¾% in 2000-01, following strongerthan expected estimated growth of 4¼% in 1999-2000.
• Employment is expected to grow by a further 31,000 jobs in thisfinancial year.
• There has been a reduction in taxes, including a decrease in thepayroll tax rate from 5% to 4.9%, gambling tax reductions ofapproximately 23% to make provision for the GST and BookmakersTurnover Tax has been abolished. There are no new taxes in the2000-01 Budget.

Budget Overview 2000-2001 2
Budget Overview 2000-2001 3
1. BUDGET STRATEGY AND OBJECTIVES
INTRODUCTIONThis chapter details:
• the Government’s policy settings and priorities which underpin the 2000-01 Budget; and
• the Budget accountabilities under the Charter of Social and Fiscal Responsibility.
THE POLICY SETTINGS FOR THE 2000-01 BUDGETThe policy settings used to develop the 2000-01 Budget are guided by continued adherence tothe Charter of Social and Fiscal Responsibility and the Government’s seven key policypriorities. In line with the Charter’s fiscal principles, ongoing operating surpluses willcontinue, with the 2000-01 Budget estimated to achieve a $29 million surplus and an increaseof $434 million in the State’s net worth in 2000-01 to $57.776 billion.
The Queensland economy is forecast to continue to grow at a solid pace in 2000-01, withgross state product expected to rise by 3¾%. State economic growth is forecast to be broadlybased during 2000-01. Net exports are expected to contribute to growth for the first timesince the Asian crisis in 1997-98, while growth in domestic demand is forecast to moderate toa more sustainable pace, following the historically high rates of increase in recent years.Labour market conditions are expected to remain firm over the course of 2000-01, withemployment forecast to increase by 2%. However, sustained growth in the supply of labourand a continuing high labour force participation rate are expected to result in the year averageunemployment rate in Queensland remaining unchanged at 8%.
Economic growth is again expected to contribute to Queensland’s employment growth whichis forecast to increase by 2% for 2000-01, producing 31,000 new jobs. Inflation inQueensland is expected to be 5¾%, consistent with that forecast in the CommonwealthBudget papers for Australia.
Historically, Queensland has maintained a very strong fiscal position relative to the otherAustralian States. Queensland consistently has maintained a cash surplus budget over time,whereas the other States, on average, only have moved recently to strengthen their fiscalpositions. Consistently achieving cash surpluses has ensured Queensland maintains a strongbalance sheet position and is the only State to achieve a negative net debt position and tofully fund employee entitlements.
The Queensland Government has embarked on significant capital expenditure programs toenhance the State’s infrastructure and drive employment creation. According to theAustralian Bureau of Statistics, in its recent General Finance Statistics (GFS) publication for1999-2000, capital expenditure in Queensland accounted for over 30% of all capitalexpenditure by Australian States and Territories. This result has been achieved despite thehigh levels of capital expenditure in NSW associated with staging the Olympic Games.
Further information on the main budget aggregates for 2000-01 is detailed in Chapter 2 andlonger-term fiscal trends are discussed in Chapter 7.

Budget Overview 2000-2001 4
This Budget is being presented against a backdrop of the introduction of the CommonwealthGovernment’s Goods and Services Tax (GST). Queenslanders have consistently paid lesstaxes than residents of other States and Territories; however, they will be disadvantaged bynational tax reform relative to other taxpayers. Effectively, Queenslanders willcross-subsidise significant cuts in State taxes in high taxing jurisdictions and will receive thelowest relative share of Budget Balancing Assistance of all jurisdictions.
Further information on the impact of national taxation reform is discussed in Budget Paper 3.
SOCIAL AND FISCAL PRIORITIESPOLICY PRIORITIES AND OBJECTIVES
The Government has identified seven key policy priorities which have been designed tocomplement one another. The services or outputs provided by Queensland agenciesgenerally contribute to more than one priority.
The key policy priorities focus on areas where the Government is seeking significant progressin its current term to improve the quality of life and standard of living for Queenslanders,wherever they reside in the State. With the introduction of the outcomes focus to budgetingand resource management in the 1999-2000 Budget, these seven key policy priorities providethe broader framework for the specification of policy and service delivery across all portfolioareas for the longer term.
Essentially, spending to achieve these priorities falls into two categories: operating andcapital. Operating expenses are costs incurred in providing services including salaries, suchas for health professionals, teachers, emergency workers and road maintenance personnel,and the cost of running and maintaining assets. Operating expenses are addressed inChapter 3.
Apart from capital grants, capital expenditure in the GFS context relates almost exclusively tothe purchase and construction of assets that are used to support the delivery of services to thepeople of Queensland. Examples of these assets include hospitals, schools, courthouses,police stations, fire and ambulance stations and roads. Capital is discussed in Chapter 6 ofthis Budget Paper, and in greater detail in Budget Paper 5.
Capital grants, which are paid to persons and organisations outside the State Government toprovide assets to support services for the Queensland public, are treated as operatingexpenses for GFS purposes and are included in Chapter 3.
The seven key policy priorities are detailed in Box 1.1.

Budget Overview 2000-2001 5
Box 1.1: The Queensland Government’s Key Policy Priorities
More jobs for Queenslanders
Employment is the primary source of income for the vast majority of Queenslanders and isthe most important means for people to participate in community life. Employment is alsoessential for a productive and robust economy.
Building Queensland’s regions
Queensland is a highly decentralised State. Supporting regional life and developmentcontributes to the richness, creativity and diversity of our communities.
Skilling Queensland – The Smart State
Education and training ensure a better educated, highly skilled and more flexibleworkforce. We need to be responsive to the increasing demand for new and better skills,consistent with a developing global society.
Safer and more supportive communities
Investing in the social development of Queensland enables individuals to contribute moreequally to the richness of our communities. We want sustainable communities inQueensland where people are safe and respected, where children are protected from harmand where diversity and social justice are supported. We also want a system of justice thatis fair, reasonable and applied without prejudice.
Better quality of life
Families, individuals and communities should be supported to maintain and improve theirquality of life. Encouraging all people to participate in the cultural, social and economiclife of Queensland ensures vibrant, diverse and sustainable communities and a high qualityof life.
Valuing the environment
A clean environment with fresh air and safe water is essential. We need to protect ourenvironment and its biodiversity for current and future generations and manage thedevelopment of our natural resources in an ecologically sustainable way.
Strong Government leadership
It is important for transparency and accountability that the Government articulates a strongvision for the future that identifies policy directions and areas for direct government action.
More Jobs for Queenslanders
The Government recognises that secure employment is the key to economic independence,better health, less threat of crime, reduced family violence and improved future prospects.The Government remains fully committed to reducing unemployment to ensure that allQueenslanders enjoy a secure future. This Budget builds on the Government’s significantachievements in actively seeking to attract industry and jobs to Queensland.
Budget Overview 2000-2001 6
The 2000-01 Budget continues the Breaking the Unemployment Cycle initiative. It isanticipated that this initiative will create 10,850 training and employment places in 2000-01.In addition, a number of employment initiatives will be undertaken, including communitytraining, improvements to the industrial relations system, better workplace health and safetyand apprentice training undertaken by Q-Build will continue throughout the State.
Capital investment is a major source of employment growth. It is estimated that theGovernment’s record $5.285 billion capital works program in 2000-01 will contribute to theprovision of some 61,034 full-time jobs. In 2000-01, $1.833 billion will be spent onTransport and Main Roads infrastructure, the largest capital expenditure of any portfolio.$1.372 billion is allocated to the Mines and Energy portfolio to facilitate investments by theState’s electricity Government Owned Corporations, such as the Swanbank E Power Station.
Building Queensland’s Regions
In framing this Budget, the Government has recognised the importance of rural communitiesand their need for appropriate infrastructure. In the 2000-01 Budget, the Government isseeking to expand export markets, encourage value-adding industries and fund infrastructure,tourism and agriculture projects to support regional economies.
Approximately 64% of capital expenditure in 2000-01 will be undertaken outside theBrisbane region. Capital investment highlights which contribute to this priority include$762 million in 2000-01 for roads funding which supports rural and regional development,population growth and industry development throughout Queensland. For instance,$32.5 million has been provided to widen the Bruce Highway between Yandina and Cooroyand $26 million has been allocated to improve the Barkly Highway between Cloncurry andthe Northern Territory border. $443 million will be provided to local governments in grantsand subsidies, including $16 million over four years to continue the Rural LivingInfrastructure Program. $120 million is to be spent in 2000-01, as part of a $422 millionproject, for passenger rolling stock including the Cairns Tilt Train. $25.4 million has beenallocated for the Cairns Cityport Development.
Recurrent expenditure, including the running costs of schools, hospitals, policing, waterinfrastructure and assistance to rural industry and tourism, coupled with the flow-onemployment effects of major capital works, contribute to a secure and prosperous future forrural and regional Queensland.
Skilling Queensland - The Smart State
In framing the 2000-01 Budget, the Government has maintained a strong emphasis ondeveloping a skilled workforce and preparing the State for a world with increasingly complexand rapidly changing technology. The Government’s Smart State blueprint positionsQueensland to take advantage of its human and natural resource attributes to move into theinformation age.
Queensland’s ability to meet the challenges of, and to thrive and prosper in, the globaleconomy will depend largely on the quality of its workforce. Countries and states witheducated, highly skilled and flexible workforces are more likely to attract investment,particularly from new and high technology industries.
Budget Overview 2000-2001 7
A sound education in childhood and access to lifelong learning and training are vital forachieving a sustained positive employment outlook for Queenslanders. The Government isinvesting in a range of initiatives for young Queenslanders to provide a strong foundation fora successful future. This year, the Government will provide $3.4 billion to the primary andsecondary education of State school children. In addition, significant assistance will beprovided to non-State schools and tertiary institutions.
Capital investment highlights which contribute to this priority include $102.6 million for theconstruction of four new schools and further staged work at nine new schools; an increase inthe number of schools that teach students from preschool to Year 12 (P-12 schools); andmore than 200 additional classrooms at existing schools in growth areas of the State.
TAFE Queensland will receive infrastructure support to enhance the delivery of training inQueensland through the investment of $28.6 million in major capital works projects during2000-01. Additional support is also provided through the investment of $15.2 million toupgrade and enhance the information technology systems across TAFE Queensland.
Safer and More Supportive Communities
One of the Government’s key priorities is to support, develop and respond to the emergingand diverse needs and aspirations of Queensland’s communities. The Government aims topromote individual, family and community vitality, including working with Aboriginal andTorres Strait Islander people to find practical ways to progress reconciliation and improvewell being and quality of life.
In 2000-01, the Government’s focus will be on Putting Families First, particularly byaddressing the needs of young people by enacting Child Protection legislation and expandingfamily support and counselling services. Aboriginal and Torres Strait Islander communitieswill be provided with infrastructure and business opportunities.
The Government is committed to addressing the social and economic causes of crime throughan integrated approach to unemployment, education, training and crime prevention. Fundingis provided for 357 new police officers as part of the Queensland Police Service’s 10 yearstaffing plan.
Capital investment highlights which contribute to this priority include $82.6 million in2000-01 for police capital infrastructure. New stations will be built in some areas where thedemand for police services is increasing. In other areas, current police facilities will berefurbished or replaced. $7.1 million is provided in 2000-01 for courthouse upgrades whichwill provide improved services to courthouse staff, the judiciary and clients of the courts.
Better Quality of Life
The Government aims to deliver services that enable people to maintain and improve thequality of their lives.
The Government is committed to improving access to the health system particularly for thechronically ill and people living in rural and remote communities. In 2000-01, the focus willbe on rebuilding projects for health services and improving fire, ambulance and emergencyservices.
Budget Overview 2000-2001 8
Capital investment highlights which contribute to this priority include $473 million for anumber of community health, hospitals, mental health, and residential care projects,pathology and scientific services, state of the art technology and equipment replacement.
Work will commence in 2000-01 on the redevelopment of several Torres Strait PrimaryHealth Centres and the Brisbane North Community Health Centre. Significant progress willcontinue on the redevelopment of the Royal Brisbane, Princess Alexandra, Caloundra, GoldCoast, Cairns and Townsville hospitals.
$64.7 million will be spent on Aboriginal and Torres Strait Islander (ATSI) housing includingGrants to Aboriginal and Torres Strait Island Councils and building 85 new dwellings,upgrading 150 existing houses throughout Queensland, estate redevelopment andimprovement on Thursday Island and land purchases.
Valuing The Environment
The Government is committed to ecologically sustainable development and aims to achieveboth intra and inter-generational equity. In 2000-01, the focus will be on ensuring scarcenatural resources are used sustainably, protecting coasts and waterways through theacquisition of coastal lands and improved environmental management, encouraging the use ofenergy efficient technologies and improving visitor facilities in protected areas.
Major enhancements include $31.9 million over four years for vegetation management and$81 million over five years for the implementation of the South East Queensland RegionalForestry Agreement.
Capital investment highlights which contribute to this priority include $5.1 million for thepublic acquisition of critical lands of high conservation value, to protect key coastal resourcesalong Queensland’s extensive coastline. Natural Heritage Trust funding of $4 million toenhance and expand the network of protected areas on the Cape York Peninsula through landacquisitions and other capital works.
Strong Government Leadership
The Charter of Social and Fiscal Responsibility provides a framework for accountabilitythrough the endorsement of key policy priorities and performance indicators. In 2000-01, theGovernment will continue to focus on exploring and implementing new ways to improve thedelivery of services and also on strengthening the openness, accountability and integrity ofgovernment operations.
Key initiatives include ensuring a smooth transition to the Goods and Services Tax regime,implementing processes to reduce backlogs for the Offices of the ParliamentaryCommissioner for Administrative Investigations and the Information Commissioner and thecontinued development of on-line government services.
More information on the Government’s key policy priorities is provided in Budget Paper 4(Portfolio Services), Budget Paper 5 (Capital Statement) and in the Ministerial PortfolioStatements.
Budget Overview 2000-2001 9
FISCAL STRATEGY
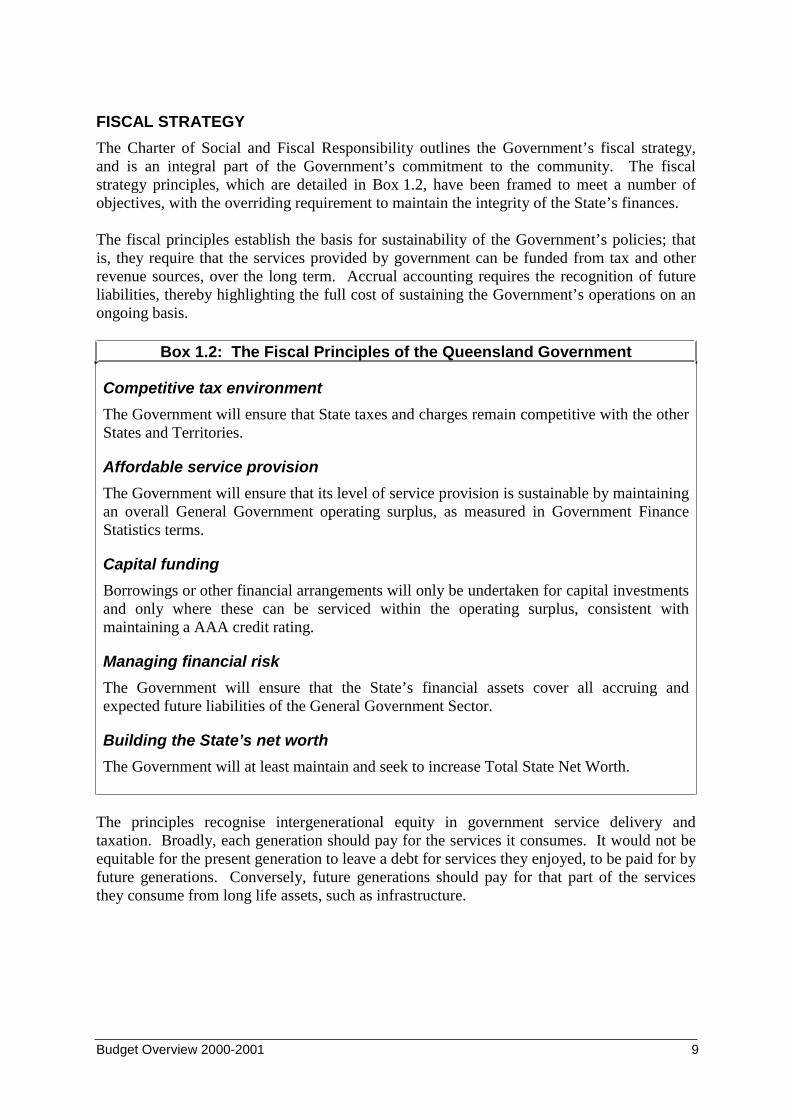
The Charter of Social and Fiscal Responsibility outlines the Government’s fiscal strategy,and is an integral part of the Government’s commitment to the community. The fiscalstrategy principles, which are detailed in Box 1.2, have been framed to meet a number ofobjectives, with the overriding requirement to maintain the integrity of the State’s finances.
The fiscal principles establish the basis for sustainability of the Government’s policies; thatis, they require that the services provided by government can be funded from tax and otherrevenue sources, over the long term. Accrual accounting requires the recognition of futureliabilities, thereby highlighting the full cost of sustaining the Government’s operations on anongoing basis.
Box 1.2: The Fiscal Principles of the Queensland Government
Competitive tax environment
The Government will ensure that State taxes and charges remain competitive with the otherStates and Territories.
Affordable service provision
The Government will ensure that its level of service provision is sustainable by maintainingan overall General Government operating surplus, as measured in Government FinanceStatistics terms.
Capital funding
Borrowings or other financial arrangements will only be undertaken for capital investmentsand only where these can be serviced within the operating surplus, consistent withmaintaining a AAA credit rating.
Managing financial risk
The Government will ensure that the State’s financial assets cover all accruing andexpected future liabilities of the General Government Sector.
Building the State’s net worth
The Government will at least maintain and seek to increase Total State Net Worth.
The principles recognise intergenerational equity in government service delivery andtaxation. Broadly, each generation should pay for the services it consumes. It would not beequitable for the present generation to leave a debt for services they enjoyed, to be paid for byfuture generations. Conversely, future generations should pay for that part of the servicesthey consume from long life assets, such as infrastructure.
Budget Overview 2000-2001 10
Finally, the principles recognise the importance of a strong financial position for the State. AState government, because of its more limited tax base, does not have the same capacity as anational government to cushion economic and financial shocks. At the same time, Stategovernments have a responsibility to provide continuity of services, such as health, policeand education. A strong financial position, as indicated by a AAA credit rating, provides theGovernment with the greatest flexibility, if needed, to deal with adverse financial shocks andother exogenous factors. It also enables lower borrowing costs. That is, a AAA credit ratingis an indication of the soundness of the financial position and policies of the Government,rather than a goal in itself.
REPORTING ON THE SOCIAL AND FISCAL OUTCOMESA critical part of government accountability is the requirement to publish regular, informativereports on the outcomes of the Government’s activities, against previously announcedobjectives. The Charter details the reports and information the Government will provide onits performance against its objectives for the community and its financial commitments.
In the coming months, the Government will release its first annual report on the efficiencyand effectiveness of its activities in meeting its objectives for the community during1999-2000. The report will:
• detail the performance of the Government across a range of qualitative and quantitativeindicators and outcomes, each applying to one of the seven key policy priorities;
• summarise evaluations undertaken during the preceding year, identifying the basis of andmethodologies applied in the evaluations, stating what steps will be taken as a result ofthe evaluations and nominating the goals for the next financial year; and
• outline legislative and policy changes recently made as a result of reviews andevaluations, explaining how these changes will assist in achieving Governmentobjectives.
Evaluation in the report will be undertaken on a whole-of-Government basis, althoughindividual government agencies will be responsible for reporting on specified outputs.
The Charter also makes clear the importance placed by the Government on financialtransparency and details a range of financial information the Government is required toproduce. Much of this information is contained in this Budget’s documentation, as outlinedin Box 1.3.
Budget Overview 2000-2001 11
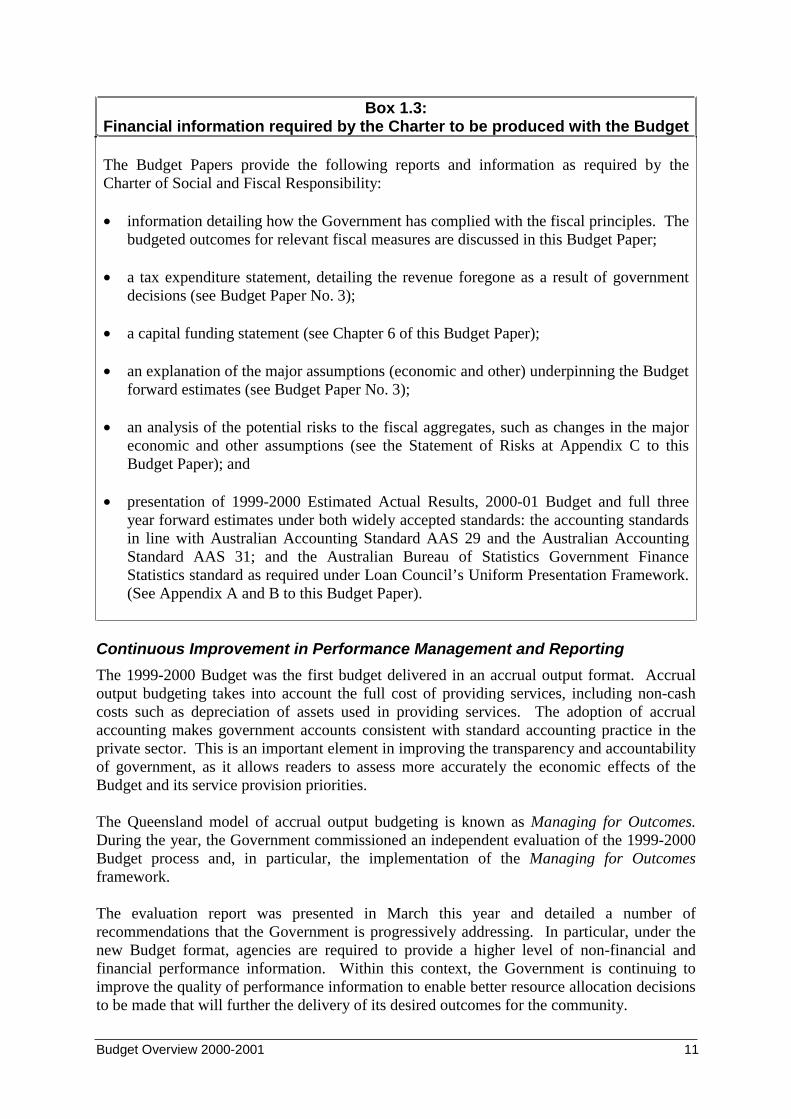
Box 1.3:Financial information required by the Charter to be produced with the Budget
The Budget Papers provide the following reports and information as required by theCharter of Social and Fiscal Responsibility:
• information detailing how the Government has complied with the fiscal principles. Thebudgeted outcomes for relevant fiscal measures are discussed in this Budget Paper;
• a tax expenditure statement, detailing the revenue foregone as a result of governmentdecisions (see Budget Paper No. 3);
• a capital funding statement (see Chapter 6 of this Budget Paper);
• an explanation of the major assumptions (economic and other) underpinning the Budgetforward estimates (see Budget Paper No. 3);
• an analysis of the potential risks to the fiscal aggregates, such as changes in the majoreconomic and other assumptions (see the Statement of Risks at Appendix C to thisBudget Paper); and
• presentation of 1999-2000 Estimated Actual Results, 2000-01 Budget and full threeyear forward estimates under both widely accepted standards: the accounting standardsin line with Australian Accounting Standard AAS 29 and the Australian AccountingStandard AAS 31; and the Australian Bureau of Statistics Government FinanceStatistics standard as required under Loan Council’s Uniform Presentation Framework.(See Appendix A and B to this Budget Paper).
Continuous Improvement in Performance Management and Reporting
The 1999-2000 Budget was the first budget delivered in an accrual output format. Accrualoutput budgeting takes into account the full cost of providing services, including non-cashcosts such as depreciation of assets used in providing services. The adoption of accrualaccounting makes government accounts consistent with standard accounting practice in theprivate sector. This is an important element in improving the transparency and accountabilityof government, as it allows readers to assess more accurately the economic effects of theBudget and its service provision priorities.
The Queensland model of accrual output budgeting is known as Managing for Outcomes.During the year, the Government commissioned an independent evaluation of the 1999-2000Budget process and, in particular, the implementation of the Managing for Outcomesframework.
The evaluation report was presented in March this year and detailed a number ofrecommendations that the Government is progressively addressing. In particular, under thenew Budget format, agencies are required to provide a higher level of non-financial andfinancial performance information. Within this context, the Government is continuing toimprove the quality of performance information to enable better resource allocation decisionsto be made that will further the delivery of its desired outcomes for the community.
Budget Overview 2000-2001 12
The Budget focus is principally on the performance of Ministerial portfolios in deliveringoutputs within the financial parameters set in the Budget each year. The focus on both thenon-financial and financial aspects of service delivery to the community highlights theimportance of planning, budgeting and measuring performance in an integrated manner toachieve targeted results.
Over the Budget planning horizon, elements of performance management, including internaland external reporting, non-financial and financial performance management and decisionmaking within agencies and by the Government, will be the subject of further development.
As part of this process, agencies will need to evaluate extensively their performance, basedon their particular circumstances. In this way, measures and targets developed by agencieswill reflect benchmarked best practice or an agreed substitute, or continuous improvementtowards it.
Budget Overview 2000-2001 13
2. BACKGROUND AND OUTLOOK
KEY POINTS
• The 1999-2000 General Government operating outcome, on a GFS basis, is a estimatedactual surplus of $40 million. The Total State outcome is a estimated actual surplus of$239 million, reflecting a sound performance by the State’s Public Trading Enterprises.
• In underlying terms in 1999-2000, there is an estimated actual GFS cash surplus in theGeneral Government Sector of $18 million.
• For 2000-01, there is a budgeted surplus of revenue over operating expenses, on a GFSbasis, of $29 million, and a budgeted cash surplus of $330 million in the GeneralGovernment sector.
• Economic growth in 2000-01 is expected to be broadly consistent with national trends,resulting in the continuation of solid employment growth and the generation of31,000 jobs.
• Total revenue on a GFS basis in the General Government Sector is expected to grow by$773 million or 4.4%, and total expenses are expected to increase by $785 million or4.5%.
• The Forward Estimates in the General Government Sector, for both the operatingposition and in cash terms, project a sustained and improving surplus positionthroughout the outyears.
• The capital program in 2000-01 is budgeted to be $5.285 billion, a 2.5% increase on the1999-2000 estimated outcome of $5.159 billion. 64% of the capital program will be spentoutside the Brisbane region.
INTRODUCTIONThis Chapter discusses:
• the economic and financial background to the Budget, including the Queensland economyin 1999-2000 and the outlook for 2000-01;
• the summary financial aggregates of the 2000-01 Budget; and
• key elements of the 2000-01 Budget, highlighting how the Budget delivers theGovernment’s key policy priorities and improved service delivery to Queenslanders.
Budget Overview 2000-2001 14
ECONOMIC PERFORMANCE AND OUTLOOKTHE QUEENSLAND ECONOMY IN 1999-2000
State economic activity in 1999-2000 grew slightly faster than forecast in last year’s BudgetPapers, with gross state product estimated to have increased by 4¼%. The key driver ofgrowth in Queensland was again household consumption activity, which continued to grow atabove average rates despite only moderate growth in household income. However, aresurgence in overseas exports of goods and services in 1999-2000 resulted in a lowerdetraction from growth by net exports than in 1998-99.
Key Components of Growth
Domestic demand continued to provide the basis for growth in State economic activity in1999-2000, with the household sector, in particular, contributing 3.0 percentage points togrowth in Queensland. Public final demand is estimated to have made a contribution togrowth of 1½ percentage points, following a similar contribution in 1998-99.
Despite only modest growth in household incomes in 1999-2000, the household sector wasthe major source of growth in gross state product. Household consumption expenditure isestimated to have grown by 5% in 1999-2000, moderating slightly from the very rapid ratesof growth experienced over recent years.
Dwelling investment is estimated to have grown strongly in 1999-2000, by 7½%, recoveringstrongly from a poor performance in the previous year. The recovery in dwelling investmentwas largely in response to the pull-forward effect of the GST, with households bringingforward planned activity into 1999-2000 in order to avoid the price rises anticipated with thenew tax system in 2000-01.
Activity in the business sector in Queensland was subdued in 1999-2000, with the level ofbusiness investment easing after several years of sustained growth. Both components ofbusiness investment are estimated to have fallen, with investment in other building andstructures easing by less than machinery and equipment (-2½% and -4¾%, respectively).
Employment conditions in the State continued to improve, with the year-averageunemployment rate falling by 0.3% point to 8.0%. The improved unemployment outcomeresulted from solid employment growth of 2.2%, being partly offset by labour force growthof 1.9%. The labour market participation rate remained relatively unchanged over the year,averaging 65.0% over the year. This remains substantially higher than in the rest ofAustralia, where participation rates increased slightly to 63.0%. The sustained employmentgrowth resulted in the creation of an additional 36,100 jobs in Queensland, in year-averageterms.
Wage pressures remained subdued in Queensland in 1999-2000, with average earningsestimated to have increased by only 1¼%. Inflation increased from its historically low levelsof the past two years. Headline inflation was estimated to be 1¾% in Brisbane, comparedwith 2½% for the nation as a whole.
A more detailed analysis of Queensland's economic performance in 1999-2000 is provided inChapter 1 of Budget Paper 3.
Budget Overview 2000-2001 15
2000-01 ECONOMIC OUTLOOK
The Economic Framework for the 2000-01 State Budget
Consistent with expectations for economic growth nationally, the Queensland economy isforecast to grow by 3¾% in 2000-01, somewhat below estimated growth of 4¼% in1999-2000. The composition of growth is expected to change substantially during the fiscalyear, with easing growth in domestic demand largely offset by a recovery in Queensland's netexports position. Continued strong improvement in exports of goods and services is forecast,with a moderation in imports growth flowing from the lower growth in gross stateexpenditure.
Key Components of the Forecasts
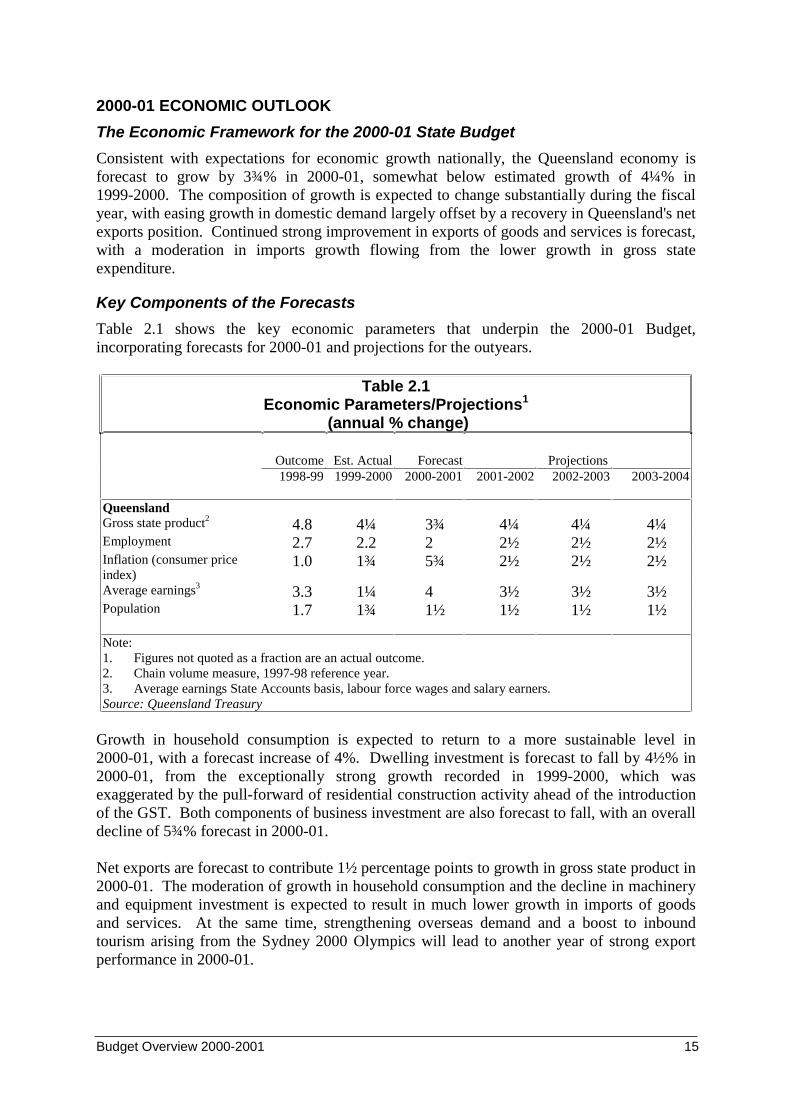
Table 2.1 shows the key economic parameters that underpin the 2000-01 Budget,incorporating forecasts for 2000-01 and projections for the outyears.
Table 2.1Economic Parameters/Projections1
(annual % change)
Outcome Est. Actual Forecast Projections1998-99 1999-2000 2000-2001 2001-2002 2002-2003 2003-2004
QueenslandGross state product2 4.8 4¼ 3¾ 4¼ 4¼ 4¼Employment 2.7 2.2 2 2½ 2½ 2½Inflation (consumer priceindex)
1.0 1¾ 5¾ 2½ 2½ 2½
Average earnings3 3.3 1¼ 4 3½ 3½ 3½Population 1.7 1¾ 1½ 1½ 1½ 1½
Note:1. Figures not quoted as a fraction are an actual outcome.2. Chain volume measure, 1997-98 reference year.3. Average earnings State Accounts basis, labour force wages and salary earners.Source: Queensland Treasury
Growth in household consumption is expected to return to a more sustainable level in2000-01, with a forecast increase of 4%. Dwelling investment is forecast to fall by 4½% in2000-01, from the exceptionally strong growth recorded in 1999-2000, which wasexaggerated by the pull-forward of residential construction activity ahead of the introductionof the GST. Both components of business investment are also forecast to fall, with an overalldecline of 5¾% forecast in 2000-01.
Net exports are forecast to contribute 1½ percentage points to growth in gross state product in2000-01. The moderation of growth in household consumption and the decline in machineryand equipment investment is expected to result in much lower growth in imports of goodsand services. At the same time, strengthening overseas demand and a boost to inboundtourism arising from the Sydney 2000 Olympics will lead to another year of strong exportperformance in 2000-01.
Budget Overview 2000-2001 16
Employment growth is expected to moderate in 2000-01, with forecast growth of 2%matching expected growth in the labour force. As a result, the average unemployment rate in2000-01 is expected to remain unchanged at 8%.
Inflation will be substantially affected by the one-off impact on consumer prices associatedwith the introduction of the GST, with year-average headline inflation of 5¾% forecast.However, underlying inflation in the State is forecast to rise 2¼% in 2000-01, up from anestimated 1¾% in 1999-2000. In line with an increase in the superannuation guaranteecharge, growth in average earnings is forecast to rise by 4% in 2000-01.
Implicit in the forecasts are a number of assumptions concerning Queensland’s externaleconomic environment, both overseas and in the rest of Australia. The critical assumptionsfor the 2000-01 forecasts are:
• sustained economic growth and relatively low inflation in Queensland’s trading partners;
• no further tightening in monetary policy by the Reserve Bank of Australia; and
• a moderate appreciation of the $A exchange rate by around 5-10% by June 2001.
Risks to the Economic Outlook for 2000-01
The following key risk factors may affect the above assumptions and, consequently, theeconomic forecasts:
• Recent adjustments to monetary policy settings in the US have been directed at slowingthe rate of economic growth to more sustainable levels. An excessive tightening ofmonetary policy may result in a more pronounced slowing in US economic activity. Thiswould have major implications for economic growth in Queensland's major tradingpartners and consequently this State's trade performance.
• Recent increases in mortgage and credit card interest rates are likely to partly offset theboost to discretionary incomes arising from the personal income tax cuts which appliedfrom 1 July 2000. Further, price confusion associated with the introduction of the GST isexpected to have an impact on underlying consumption patterns, at least in the first half of2000-01, as consumers adjust to new pricing and taxation arrangements.
• The Queensland economy is highly integrated with the rest of the Australian economy.Any significant policy changes which are implemented by the CommonwealthGovernment, in particular, over the forecast horizon or any unanticipated change in theeconomic performance in the rest of Australia would be expected to have an impact oneconomic conditions in Queensland.
In keeping with the requirement in the Charter of Social and Fiscal Responsibility, theseassumptions are presented in detail in Chapter 1 of Budget Paper 3, together with a fullanalysis of the forecasts and an assessment of the key risk factors.
Budget Overview 2000-2001 17
SUMMARY OF KEY FINANCIAL AGGREGATES1999-2000 ESTIMATED OUTCOME
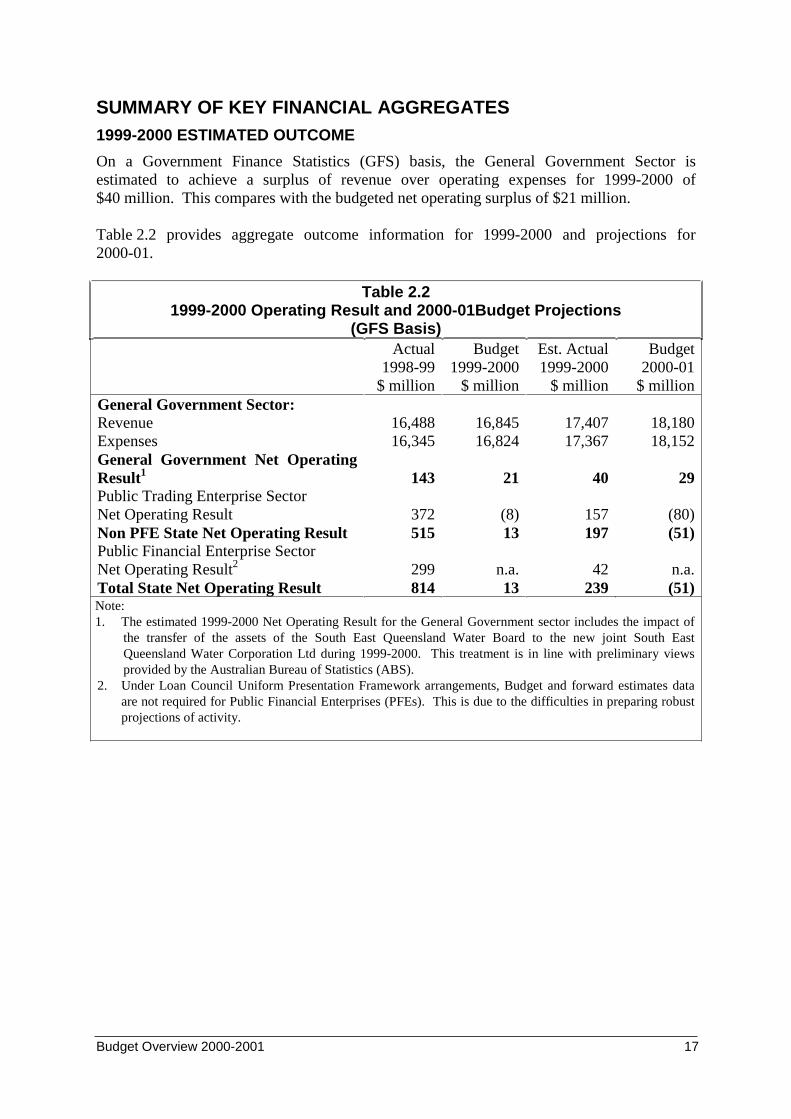
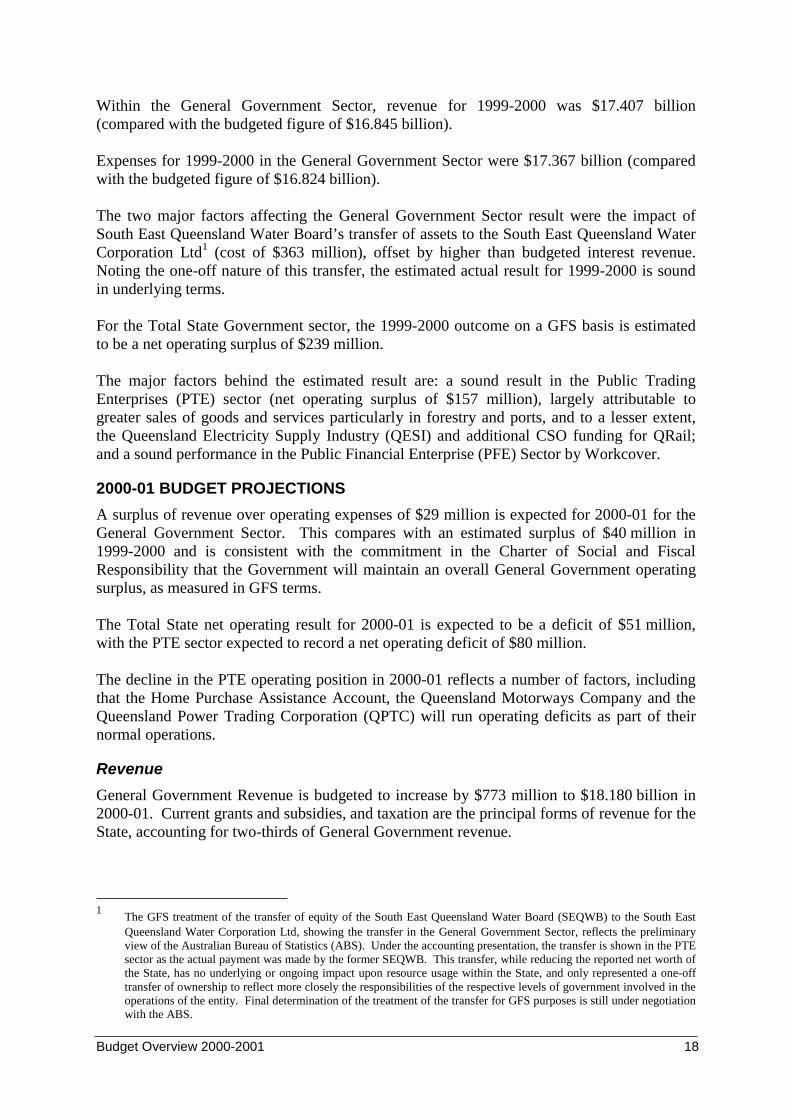
On a Government Finance Statistics (GFS) basis, the General Government Sector isestimated to achieve a surplus of revenue over operating expenses for 1999-2000 of$40 million. This compares with the budgeted net operating surplus of $21 million.
Table 2.2 provides aggregate outcome information for 1999-2000 and projections for2000-01.
Table 2.21999-2000 Operating Result and 2000-01Budget Projections
(GFS Basis)Actual
1998-99$ million
Budget1999-2000
$ million
Est. Actual1999-2000
$ million
Budget2000-01
$ millionGeneral Government Sector:Revenue 16,488 16,845 17,407 18,180Expenses 16,345 16,824 17,367 18,152General Government Net OperatingResult1 143 21 40 29Public Trading Enterprise SectorNet Operating Result 372 (8) 157 (80)Non PFE State Net Operating Result 515 13 197 (51)Public Financial Enterprise SectorNet Operating Result2 299 n.a. 42 n.a.Total State Net Operating Result 814 13 239 (51)Note:1. The estimated 1999-2000 Net Operating Result for the General Government sector includes the impact of
the transfer of the assets of the South East Queensland Water Board to the new joint South EastQueensland Water Corporation Ltd during 1999-2000. This treatment is in line with preliminary viewsprovided by the Australian Bureau of Statistics (ABS).
2. Under Loan Council Uniform Presentation Framework arrangements, Budget and forward estimates dataare not required for Public Financial Enterprises (PFEs). This is due to the difficulties in preparing robustprojections of activity.
Budget Overview 2000-2001 18
Within the General Government Sector, revenue for 1999-2000 was $17.407 billion(compared with the budgeted figure of $16.845 billion).
Expenses for 1999-2000 in the General Government Sector were $17.367 billion (comparedwith the budgeted figure of $16.824 billion).
The two major factors affecting the General Government Sector result were the impact ofSouth East Queensland Water Board’s transfer of assets to the South East Queensland WaterCorporation Ltd1 (cost of $363 million), offset by higher than budgeted interest revenue.Noting the one-off nature of this transfer, the estimated actual result for 1999-2000 is soundin underlying terms.
For the Total State Government sector, the 1999-2000 outcome on a GFS basis is estimatedto be a net operating surplus of $239 million.
The major factors behind the estimated result are: a sound result in the Public TradingEnterprises (PTE) sector (net operating surplus of $157 million), largely attributable togreater sales of goods and services particularly in forestry and ports, and to a lesser extent,the Queensland Electricity Supply Industry (QESI) and additional CSO funding for QRail;and a sound performance in the Public Financial Enterprise (PFE) Sector by Workcover.
2000-01 BUDGET PROJECTIONS
A surplus of revenue over operating expenses of $29 million is expected for 2000-01 for theGeneral Government Sector. This compares with an estimated surplus of $40 million in1999-2000 and is consistent with the commitment in the Charter of Social and FiscalResponsibility that the Government will maintain an overall General Government operatingsurplus, as measured in GFS terms.
The Total State net operating result for 2000-01 is expected to be a deficit of $51 million,with the PTE sector expected to record a net operating deficit of $80 million.
The decline in the PTE operating position in 2000-01 reflects a number of factors, includingthat the Home Purchase Assistance Account, the Queensland Motorways Company and theQueensland Power Trading Corporation (QPTC) will run operating deficits as part of theirnormal operations.
Revenue
General Government Revenue is budgeted to increase by $773 million to $18.180 billion in2000-01. Current grants and subsidies, and taxation are the principal forms of revenue for theState, accounting for two-thirds of General Government revenue.
1The GFS treatment of the transfer of equity of the South East Queensland Water Board (SEQWB) to the South EastQueensland Water Corporation Ltd, showing the transfer in the General Government Sector, reflects the preliminaryview of the Australian Bureau of Statistics (ABS). Under the accounting presentation, the transfer is shown in the PTEsector as the actual payment was made by the former SEQWB. This transfer, while reducing the reported net worth ofthe State, has no underlying or ongoing impact upon resource usage within the State, and only represented a one-offtransfer of ownership to reflect more closely the responsibilities of the respective levels of government involved in theoperations of the entity. Final determination of the treatment of the transfer for GFS purposes is still under negotiationwith the ABS.
Budget Overview 2000-2001 19
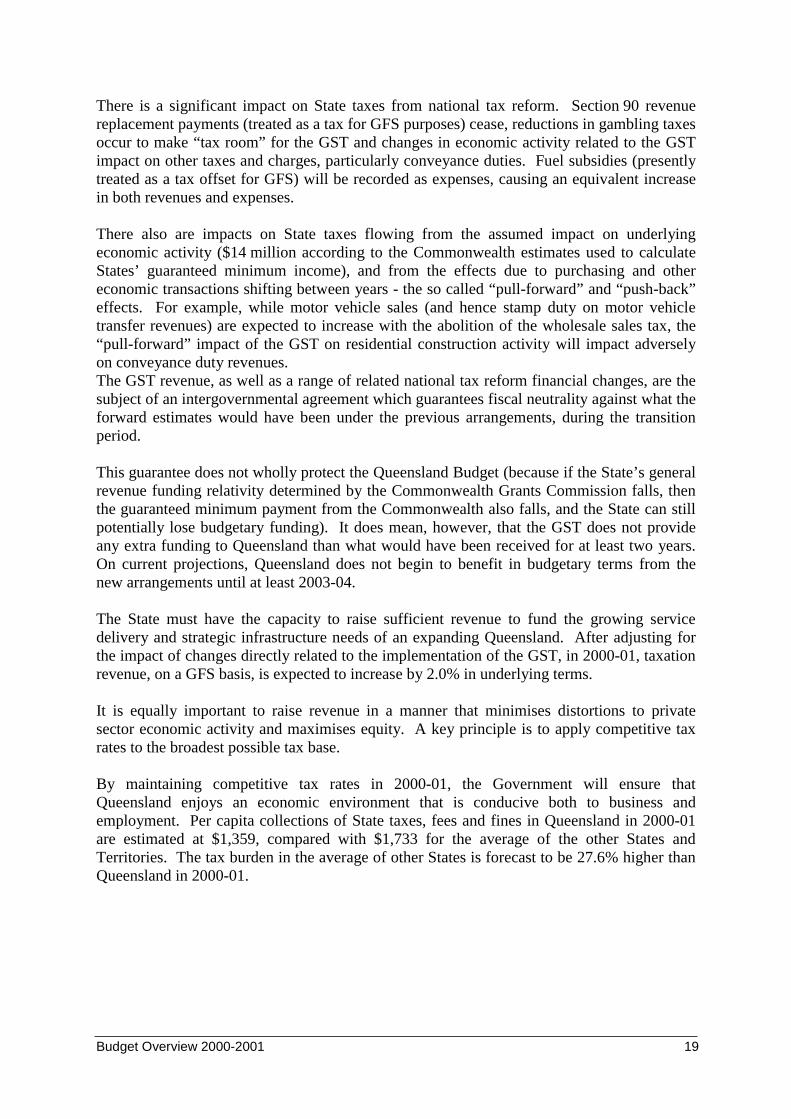
There is a significant impact on State taxes from national tax reform. Section 90 revenuereplacement payments (treated as a tax for GFS purposes) cease, reductions in gambling taxesoccur to make “tax room” for the GST and changes in economic activity related to the GSTimpact on other taxes and charges, particularly conveyance duties. Fuel subsidies (presentlytreated as a tax offset for GFS) will be recorded as expenses, causing an equivalent increasein both revenues and expenses.
There also are impacts on State taxes flowing from the assumed impact on underlyingeconomic activity ($14 million according to the Commonwealth estimates used to calculateStates’ guaranteed minimum income), and from the effects due to purchasing and othereconomic transactions shifting between years - the so called “pull-forward” and “push-back”effects. For example, while motor vehicle sales (and hence stamp duty on motor vehicletransfer revenues) are expected to increase with the abolition of the wholesale sales tax, the“pull-forward” impact of the GST on residential construction activity will impact adverselyon conveyance duty revenues.The GST revenue, as well as a range of related national tax reform financial changes, are thesubject of an intergovernmental agreement which guarantees fiscal neutrality against what theforward estimates would have been under the previous arrangements, during the transitionperiod.
This guarantee does not wholly protect the Queensland Budget (because if the State’s generalrevenue funding relativity determined by the Commonwealth Grants Commission falls, thenthe guaranteed minimum payment from the Commonwealth also falls, and the State can stillpotentially lose budgetary funding). It does mean, however, that the GST does not provideany extra funding to Queensland than what would have been received for at least two years.On current projections, Queensland does not begin to benefit in budgetary terms from thenew arrangements until at least 2003-04.
The State must have the capacity to raise sufficient revenue to fund the growing servicedelivery and strategic infrastructure needs of an expanding Queensland. After adjusting forthe impact of changes directly related to the implementation of the GST, in 2000-01, taxationrevenue, on a GFS basis, is expected to increase by 2.0% in underlying terms.
It is equally important to raise revenue in a manner that minimises distortions to privatesector economic activity and maximises equity. A key principle is to apply competitive taxrates to the broadest possible tax base.
By maintaining competitive tax rates in 2000-01, the Government will ensure thatQueensland enjoys an economic environment that is conducive both to business andemployment. Per capita collections of State taxes, fees and fines in Queensland in 2000-01are estimated at $1,359, compared with $1,733 for the average of the other States andTerritories. The tax burden in the average of other States is forecast to be 27.6% higher thanQueensland in 2000-01.
Budget Overview 2000-2001 20
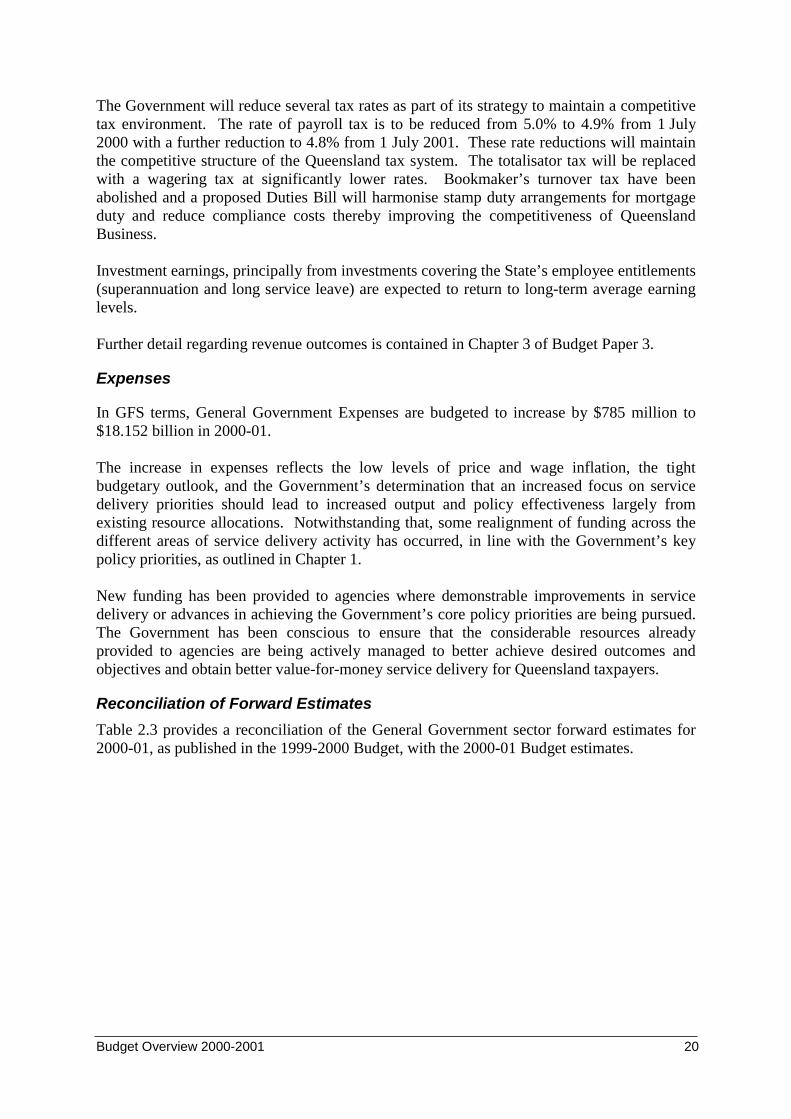
The Government will reduce several tax rates as part of its strategy to maintain a competitivetax environment. The rate of payroll tax is to be reduced from 5.0% to 4.9% from 1 July2000 with a further reduction to 4.8% from 1 July 2001. These rate reductions will maintainthe competitive structure of the Queensland tax system. The totalisator tax will be replacedwith a wagering tax at significantly lower rates. Bookmaker’s turnover tax have beenabolished and a proposed Duties Bill will harmonise stamp duty arrangements for mortgageduty and reduce compliance costs thereby improving the competitiveness of QueenslandBusiness.
Investment earnings, principally from investments covering the State’s employee entitlements(superannuation and long service leave) are expected to return to long-term average earninglevels.
Further detail regarding revenue outcomes is contained in Chapter 3 of Budget Paper 3.
Expenses
In GFS terms, General Government Expenses are budgeted to increase by $785 million to$18.152 billion in 2000-01.
The increase in expenses reflects the low levels of price and wage inflation, the tightbudgetary outlook, and the Government’s determination that an increased focus on servicedelivery priorities should lead to increased output and policy effectiveness largely fromexisting resource allocations. Notwithstanding that, some realignment of funding across thedifferent areas of service delivery activity has occurred, in line with the Government’s keypolicy priorities, as outlined in Chapter 1.
New funding has been provided to agencies where demonstrable improvements in servicedelivery or advances in achieving the Government’s core policy priorities are being pursued.The Government has been conscious to ensure that the considerable resources alreadyprovided to agencies are being actively managed to better achieve desired outcomes andobjectives and obtain better value-for-money service delivery for Queensland taxpayers.
Reconciliation of Forward Estimates
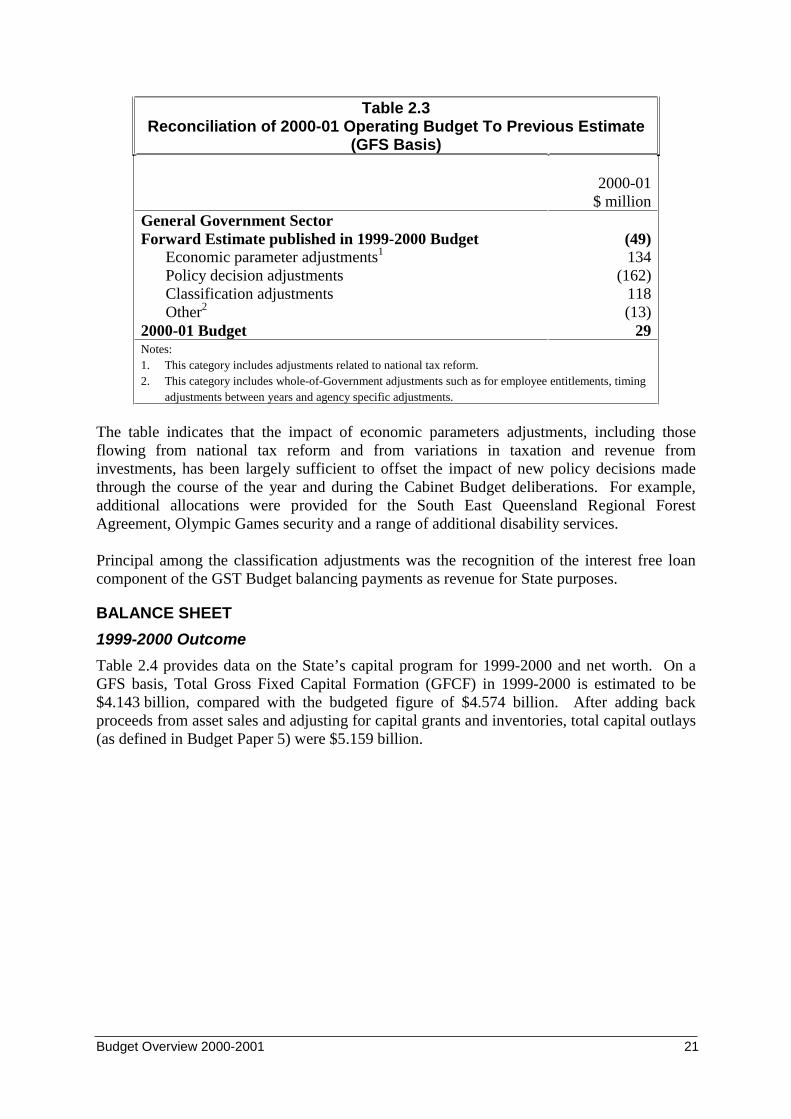
Table 2.3 provides a reconciliation of the General Government sector forward estimates for2000-01, as published in the 1999-2000 Budget, with the 2000-01 Budget estimates.
Budget Overview 2000-2001 21
Table 2.3Reconciliation of 2000-01 Operating Budget To Previous Estimate
(GFS Basis)
2000-01$ million
General Government SectorForward Estimate published in 1999-2000 Budget (49)
Economic parameter adjustments1 134Policy decision adjustments (162)Classification adjustments 118Other2 (13)
2000-01 Budget 29Notes:1. This category includes adjustments related to national tax reform.2. This category includes whole-of-Government adjustments such as for employee entitlements, timing
adjustments between years and agency specific adjustments.
The table indicates that the impact of economic parameters adjustments, including thoseflowing from national tax reform and from variations in taxation and revenue frominvestments, has been largely sufficient to offset the impact of new policy decisions madethrough the course of the year and during the Cabinet Budget deliberations. For example,additional allocations were provided for the South East Queensland Regional ForestAgreement, Olympic Games security and a range of additional disability services.
Principal among the classification adjustments was the recognition of the interest free loancomponent of the GST Budget balancing payments as revenue for State purposes.
BALANCE SHEET
1999-2000 Outcome
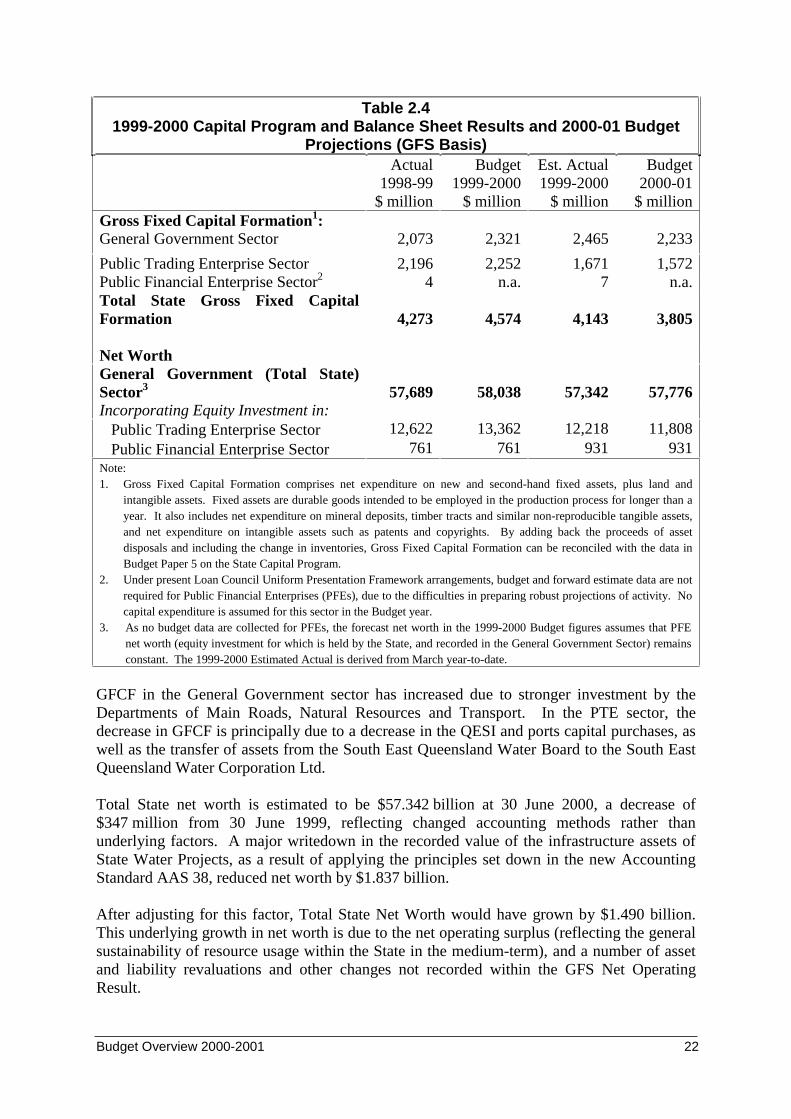
Table 2.4 provides data on the State’s capital program for 1999-2000 and net worth. On aGFS basis, Total Gross Fixed Capital Formation (GFCF) in 1999-2000 is estimated to be$4.143 billion, compared with the budgeted figure of $4.574 billion. After adding backproceeds from asset sales and adjusting for capital grants and inventories, total capital outlays(as defined in Budget Paper 5) were $5.159 billion.
Budget Overview 2000-2001 22
Table 2.41999-2000 Capital Program and Balance Sheet Results and 2000-01 Budget
Projections (GFS Basis)Actual
1998-99$ million
Budget1999-2000
$ million
Est. Actual1999-2000
$ million
Budget2000-01
$ millionGross Fixed Capital Formation1:General Government Sector 2,073 2,321 2,465 2,233
Public Trading Enterprise Sector 2,196 2,252 1,671 1,572Public Financial Enterprise Sector2 4 n.a. 7 n.a.Total State Gross Fixed CapitalFormation 4,273 4,574 4,143 3,805
Net WorthGeneral Government (Total State)Sector3 57,689 58,038 57,342 57,776Incorporating Equity Investment in:• Public Trading Enterprise Sector 12,622 13,362 12,218 11,808• Public Financial Enterprise Sector 761 761 931 931Note:1. Gross Fixed Capital Formation comprises net expenditure on new and second-hand fixed assets, plus land and
intangible assets. Fixed assets are durable goods intended to be employed in the production process for longer than ayear. It also includes net expenditure on mineral deposits, timber tracts and similar non-reproducible tangible assets,and net expenditure on intangible assets such as patents and copyrights. By adding back the proceeds of assetdisposals and including the change in inventories, Gross Fixed Capital Formation can be reconciled with the data inBudget Paper 5 on the State Capital Program.
2. Under present Loan Council Uniform Presentation Framework arrangements, budget and forward estimate data are notrequired for Public Financial Enterprises (PFEs), due to the difficulties in preparing robust projections of activity. Nocapital expenditure is assumed for this sector in the Budget year.
3. As no budget data are collected for PFEs, the forecast net worth in the 1999-2000 Budget figures assumes that PFEnet worth (equity investment for which is held by the State, and recorded in the General Government Sector) remainsconstant. The 1999-2000 Estimated Actual is derived from March year-to-date.
GFCF in the General Government sector has increased due to stronger investment by theDepartments of Main Roads, Natural Resources and Transport. In the PTE sector, thedecrease in GFCF is principally due to a decrease in the QESI and ports capital purchases, aswell as the transfer of assets from the South East Queensland Water Board to the South EastQueensland Water Corporation Ltd.
Total State net worth is estimated to be $57.342 billion at 30 June 2000, a decrease of$347 million from 30 June 1999, reflecting changed accounting methods rather thanunderlying factors. A major writedown in the recorded value of the infrastructure assets ofState Water Projects, as a result of applying the principles set down in the new AccountingStandard AAS 38, reduced net worth by $1.837 billion.
After adjusting for this factor, Total State Net Worth would have grown by $1.490 billion.This underlying growth in net worth is due to the net operating surplus (reflecting the generalsustainability of resource usage within the State in the medium-term), and a number of assetand liability revaluations and other changes not recorded within the GFS Net OperatingResult.
Budget Overview 2000-2001 23
Net financial assets (including equity held in public enterprise subsidiaries) in the GeneralGovernment sector are estimated to reach $15.731 billion, as at 30 June 2000, compared with$15.128 billion a year earlier.
• Liabilities increased by $62 million to $16.393 billion, principally due to borrowingsundertaken by the Department of Main Roads to fund road infrastructure.
• Financial assets in 1999-2000 increased by $665 million to $32.124 billion, mainly due toincreases in equity investments and other non-equity assets.
After excluding the value of equity investments of public enterprises, financial assets in theGeneral Government sector are still more than sufficient to meet all the liabilities of thesector. Accordingly, the financial position of the State remains very strong, with sufficientfinancial assets available to meet liabilities as they fall due, in accordance with therequirements of the Government’s Charter of Social and Fiscal Responsibility.
2000-01 Budget Projections
State net worth is projected to increase from $57.342 billion at 30 June 2000 to$57.776 billion at 30 June 2001 (see Table 2.4). This increase is due to a range of factorsincluding anticipated revaluations, net gains from asset sales, net additions to stock and thebudgeted net operating result.
The budgeted decrease in General Government GFCF in 2000-01 reflects in part the impactof several capital bring forwards in 1999-2000, including by the Departments of Main Roads,Transport and Education.
The change in GFCF for the PTE sector for 2000-01 reflects budgeted increases in assetpurchases by ports and the QESI being offset by the proceeds from the anticipated long termlease of the Dalrymple Bay Coal Terminal. On an underlying basis, GFCF will increase bysome 10.8% in 2000-01.
2000-01 Capital Program
The State’s capital program, in aggregate, comprises Property, Plant and Equipment Outlays,Other Capital Expenditure and Capital Grants for specified entities. Specified entities includeall Government Departments and Statutory Authorities2, but exclude Public FinancialEnterprises.
The State’s capital program for 2000-01 is budgeted to be $5.285 billion. As in previousyears, a capital contingency reserve to allow for slippage in projects due to inclementweather, planning and contractual delays, etc., has been included at the whole-of-Governmentlevel.
The 2000-01 capital program maintains the current historically high capital works budgets forQueensland, both in nominal and real per capita terms. In 2000-01, Total State Gross FixedCapital Formation on a GFS basis is budgeted to be $3.805 billion, maintaining the relativelyhigh levels of recent years.
2 Only Statutory Authorities with capital outlays in excess of $250,000 per annum are included.
Budget Overview 2000-2001 24
More information on State’s net worth, assets and liabilities is at Chapter 4, and more detailon the capital program is at Chapter 6 and in Budget Paper 5.
CASH FLOW
1999-2000 Outcome
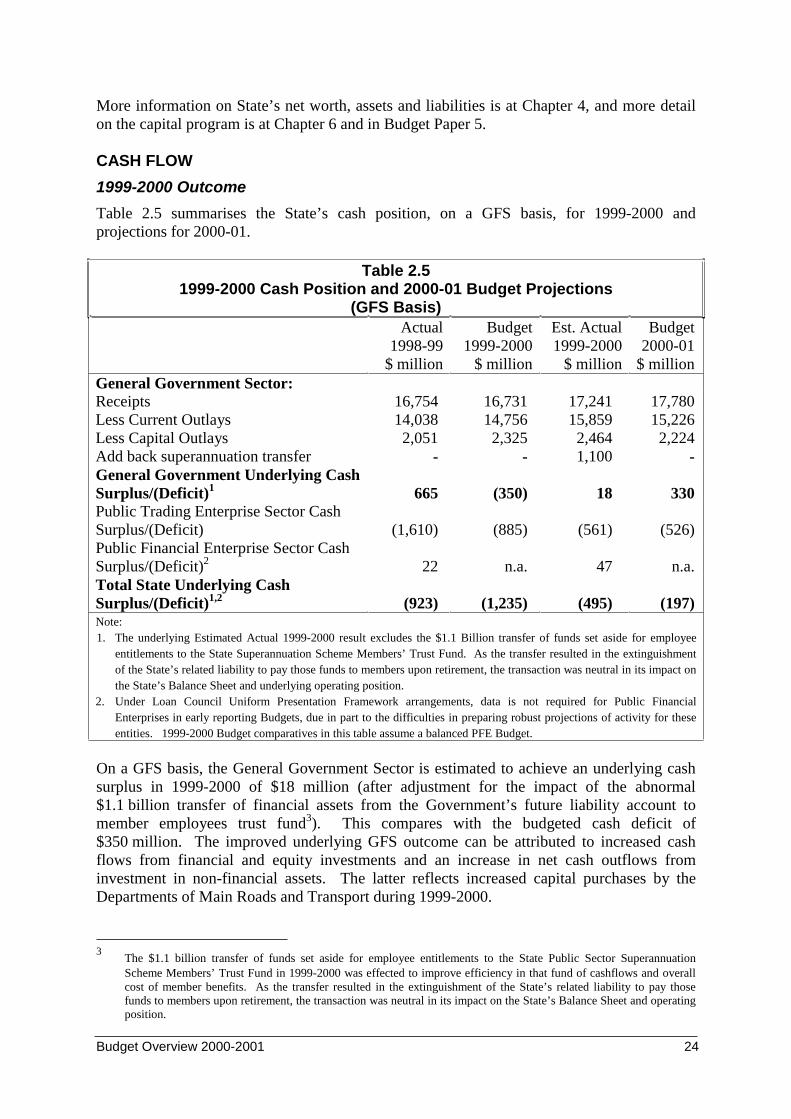
Table 2.5 summarises the State’s cash position, on a GFS basis, for 1999-2000 andprojections for 2000-01.
Table 2.51999-2000 Cash Position and 2000-01 Budget Projections
(GFS Basis)Actual
1998-99$ million
Budget1999-2000
$ million
Est. Actual1999-2000
$ million
Budget2000-01
$ millionGeneral Government Sector:Receipts 16,754 16,731 17,241 17,780Less Current Outlays 14,038 14,756 15,859 15,226Less Capital Outlays 2,051 2,325 2,464 2,224Add back superannuation transfer - - 1,100 -General Government Underlying CashSurplus/(Deficit)1 665 (350) 18 330Public Trading Enterprise Sector CashSurplus/(Deficit) (1,610) (885) (561) (526)Public Financial Enterprise Sector CashSurplus/(Deficit)2 22 n.a. 47 n.a.Total State Underlying CashSurplus/(Deficit)1,2 (923) (1,235) (495) (197)Note:1. The underlying Estimated Actual 1999-2000 result excludes the $1.1 Billion transfer of funds set aside for employee
entitlements to the State Superannuation Scheme Members’ Trust Fund. As the transfer resulted in the extinguishmentof the State’s related liability to pay those funds to members upon retirement, the transaction was neutral in its impact onthe State’s Balance Sheet and underlying operating position.
2. Under Loan Council Uniform Presentation Framework arrangements, data is not required for Public FinancialEnterprises in early reporting Budgets, due in part to the difficulties in preparing robust projections of activity for theseentities. 1999-2000 Budget comparatives in this table assume a balanced PFE Budget.
On a GFS basis, the General Government Sector is estimated to achieve an underlying cashsurplus in 1999-2000 of $18 million (after adjustment for the impact of the abnormal$1.1 billion transfer of financial assets from the Government’s future liability account tomember employees trust fund3). This compares with the budgeted cash deficit of$350 million. The improved underlying GFS outcome can be attributed to increased cashflows from financial and equity investments and an increase in net cash outflows frominvestment in non-financial assets. The latter reflects increased capital purchases by theDepartments of Main Roads and Transport during 1999-2000.
3The $1.1 billion transfer of funds set aside for employee entitlements to the State Public Sector SuperannuationScheme Members’ Trust Fund in 1999-2000 was effected to improve efficiency in that fund of cashflows and overallcost of member benefits. As the transfer resulted in the extinguishment of the State’s related liability to pay thosefunds to members upon retirement, the transaction was neutral in its impact on the State’s Balance Sheet and operatingposition.
Budget Overview 2000-2001 25
2000-01 Budget Projections
On a GFS basis, a cash surplus of $330 million is expected in 2000-01 for the GeneralGovernment sector. This compares with the estimated 1999-2000 underlying result of$18 million surplus (after excluding the impact of $1.1 billion superannuation transfer).
The improvement in the cash position largely reflects the improvement in the operating cashposition and the receipt of enhanced investment returns.
Increased cash receipts ($539 million) from operating activities are forecast for 2000-01. Inparticular, grants and subsidies receipts are expected to increase by $1.776 billion, reflectingthe introduction of GST payments from the Commonwealth. This increase is partially offsetby a decrease in taxation receipts ($798 million), resulting from the reduced State’s taxationbase and the cessation of the Section 90 safety net payment arrangements following theintroduction of the GST. Other receipts are expected to decrease in 2000-01 by $373 million,reflecting in part, the receipt of interest on the Government’s superannuation andConsolidated Fund investments.
Cash payments from operating activities are forecast to increase by $467 million in 2000-01after adjustment for the one-off transfer of superannuation in 1999-2000, primarily due toestimated growth in wages and expenditure on other goods and services, and an increase inother payments largely reflecting the introduction of the First Home Owner Grant scheme.
Budget cash payments to General Government related to the proposed long term lease of theDalrymple Bay coal Terminal and Ports recapitalisation have been treated as cashflows frominvestments in financial assets for policy purposes (commonly referred to as advances), andhave been excluded from the GFS cash surplus result in the General Government sector.
More information on the GFS cash position is provided in Chapter 5.
Budget Overview 2000-2001 26
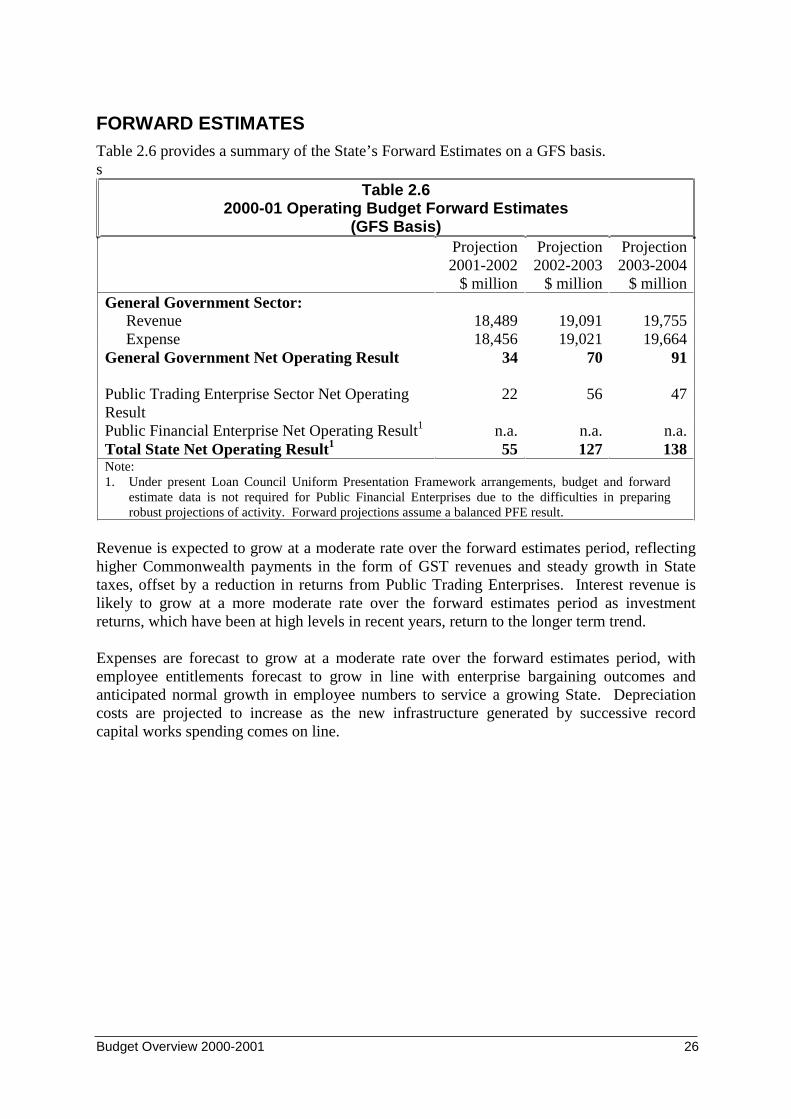
FORWARD ESTIMATESTable 2.6 provides a summary of the State’s Forward Estimates on a GFS basis.s
Table 2.62000-01 Operating Budget Forward Estimates
(GFS Basis)Projection2001-2002
$ million
Projection2002-2003
$ million
Projection2003-2004
$ millionGeneral Government Sector:
Revenue 18,489 19,091 19,755Expense 18,456 19,021 19,664
General Government Net Operating Result 34 70 91
Public Trading Enterprise Sector Net OperatingResult
22 56 47
Public Financial Enterprise Net Operating Result1 n.a. n.a. n.a.Total State Net Operating Result1 55 127 138Note:1. Under present Loan Council Uniform Presentation Framework arrangements, budget and forward
estimate data is not required for Public Financial Enterprises due to the difficulties in preparingrobust projections of activity. Forward projections assume a balanced PFE result.
Revenue is expected to grow at a moderate rate over the forward estimates period, reflectinghigher Commonwealth payments in the form of GST revenues and steady growth in Statetaxes, offset by a reduction in returns from Public Trading Enterprises. Interest revenue islikely to grow at a more moderate rate over the forward estimates period as investmentreturns, which have been at high levels in recent years, return to the longer term trend.
Expenses are forecast to grow at a moderate rate over the forward estimates period, withemployee entitlements forecast to grow in line with enterprise bargaining outcomes andanticipated normal growth in employee numbers to service a growing State. Depreciationcosts are projected to increase as the new infrastructure generated by successive recordcapital works spending comes on line.

Budget Overview 2000-2001 27
Budget Overview 2000-2001 28
3. OPERATING STATEMENT
KEY POINTS
• The 2000-01 budgeted position for the General Government Sector is an operatingsurplus of $29 million in GFS terms, compared with an estimated actual operating resultof $40 million for 1999-2000.
• Total General Government revenue is expected to increase by $773 million (or 4.4%) to$18.180 billion in 2000-01, reflecting growth in Commonwealth grant revenues, offset inpart by expected falls in investment earnings and taxation revenue.
• Total General Government expenses are budgeted to increase by $785 million (or 4.5%)to $18.152 billion in 2000-01 reflecting increases in employee entitlements, supplies andservices and current transfers.
• The General Government Sector is budgeted to achieve increased operating surpluses forthe outyears.
INTRODUCTIONThis Chapter provides an overview of the Government Finance Statistics (GFS) OperatingStatement for the General Government Sector.
The GFS Operating Statement is prepared on an accrual basis. The main differences betweenthe GFS presentation and the presentation under accounting standards are that GFS excludesrevaluations of assets, gains and losses on sales of assets, and bad and doubtful debtsexpense.
A reconciliation of the variations between the two presentations is included in Appendix Dwhich also includes a glossary of the terms used in the Operating Statement.
In essence, the GFS Operating Statement is an aggregation of all the revenues of the GeneralGovernment Sector and of all the recurrent costs of delivering services to the people ofQueensland. The GFS Operating Statement shows the allocation of resources into a numberof broad categories and provides a high level indicator of whether or not the Government isliving within its means.
In keeping with its commitment under the Charter of Social and Fiscal Responsibility toensure sustainable levels of service provision, the Government has budgeted for an operatingsurplus of $29 million. However, budgeting for an operating surplus is not an end in itself. Itis a way of enabling the Government to ensure the sustainability of service delivery withinthe context of its key policy priorities, as outlined in Chapter 1.
The budgeted GFS Operating Statement for 2000-01 forecasts revenues of $18.180 billionand provides for $18.152 billion to be spent on services for Queenslanders.
Budget Overview 2000-2001 29
The Operating Statement is a financial record of expenses by broad expense categories. Assuch, it does not show specific initiatives or services relating to the Government’s priorities.Nevertheless, these expenditures are embedded in the Statement. For example:
• the depreciation expense of $1.461 billion includes funds to replace old school buildingsused to educate the workforce of the future who will need to maintain and increaseQueensland's technological edge (linking to the “Smart State” initiatives aimed atattracting investors);
• included in the gross operating expenses of $12.550 billion is the wages and salaries ofthe police, emergency, social services and health professionals who help to provide safeand more supportive communities, foster a better quality of life, and the environment; and
• among current and capital transfers are subsidies to provide more jobs for Queenslanders,and grants to assist the economic development of the regions. Transfers also includegrants to local councils, private schools and hospitals and various other non-governmentorganisations which play a vital role in delivering services to Queenslanders.
Budget Paper 4 and Ministerial Portfolio Statements provide details on outlays for eachportfolio.
SUMMARY OF RESULTS1999-2000 ESTIMATED OPERATING RESULT
The Estimated Actual General Government net operating result on a GFS basis for1999-2000 is a $40 million surplus, compared with a budgeted operating surplus of$21 million.
The 1999-2000 estimated actual result was influenced by:
• significantly stronger than expected investment returns by Queensland InvestmentCorporation (QIC)1, with an earnings rate of approximately 14% achieved for the year;and
• the impact of a one-off capital transfer of $363 million, reflecting the Australian Bureauof Statistics' advice on the treatment of the transfer of the equity of the former South EastQueensland Water Board to the new joint venture with local government (South EastQueensland Water Corporation).2
1 Queensland Investment Corporation holds significant financial assets on behalf of the General Governmentsector. These include those assets set aside to provide for employee entitlements and other known futureliabilities, as well as the funds set aside to ensure the ongoing revenue stream lost through the Suncorp-Metway merger (dividends and tax equivalent payments) is replaced.
2 See Chapter 2 for further explanation of this transaction.
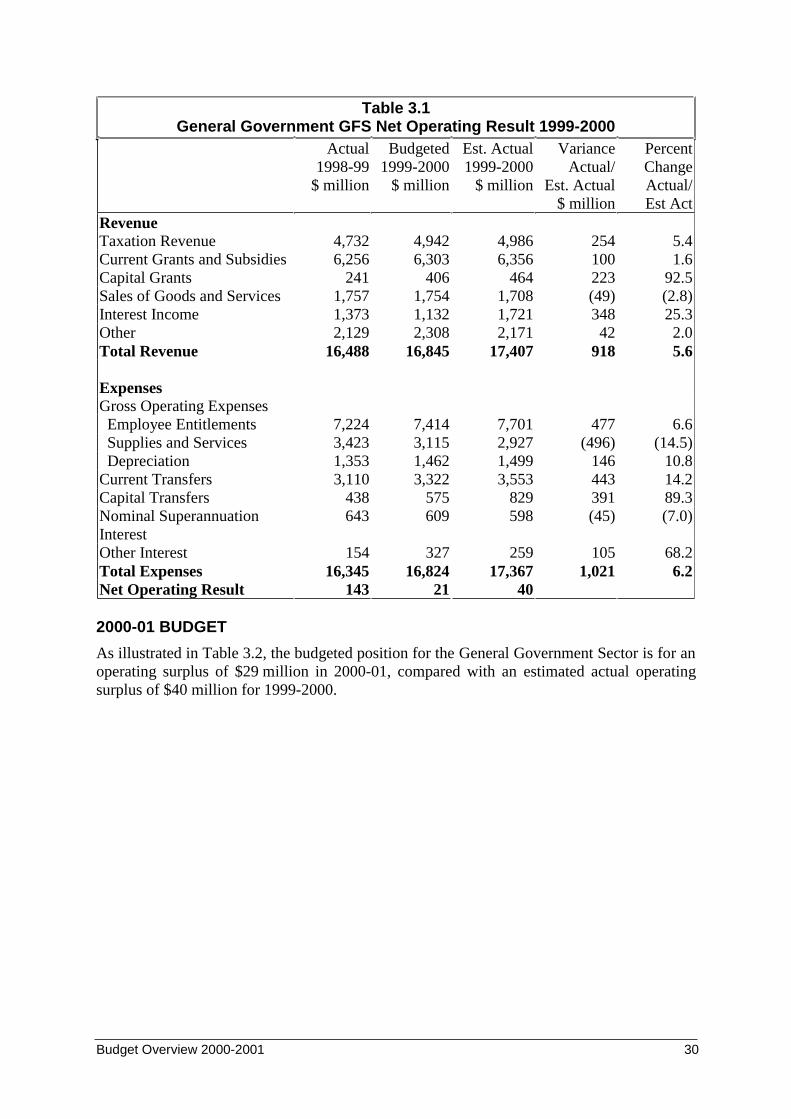
Budget Overview 2000-2001 30
Table 3.1General Government GFS Net Operating Result 1999-2000
Actual1998-99
$ million
Budgeted1999-2000
$ million
Est. Actual1999-2000
$ million
VarianceActual/
Est. Actual$ million
PercentChangeActual/Est Act
RevenueTaxation Revenue 4,732 4,942 4,986 254 5.4Current Grants and Subsidies 6,256 6,303 6,356 100 1.6Capital Grants 241 406 464 223 92.5Sales of Goods and Services 1,757 1,754 1,708 (49) (2.8)Interest Income 1,373 1,132 1,721 348 25.3Other 2,129 2,308 2,171 42 2.0Total Revenue 16,488 16,845 17,407 918 5.6
ExpensesGross Operating Expenses Employee Entitlements 7,224 7,414 7,701 477 6.6 Supplies and Services 3,423 3,115 2,927 (496) (14.5) Depreciation 1,353 1,462 1,499 146 10.8Current Transfers 3,110 3,322 3,553 443 14.2Capital Transfers 438 575 829 391 89.3Nominal SuperannuationInterest
643 609 598 (45) (7.0)
Other Interest 154 327 259 105 68.2Total Expenses 16,345 16,824 17,367 1,021 6.2Net Operating Result 143 21 40
2000-01 BUDGET
As illustrated in Table 3.2, the budgeted position for the General Government Sector is for anoperating surplus of $29 million in 2000-01, compared with an estimated actual operatingsurplus of $40 million for 1999-2000.
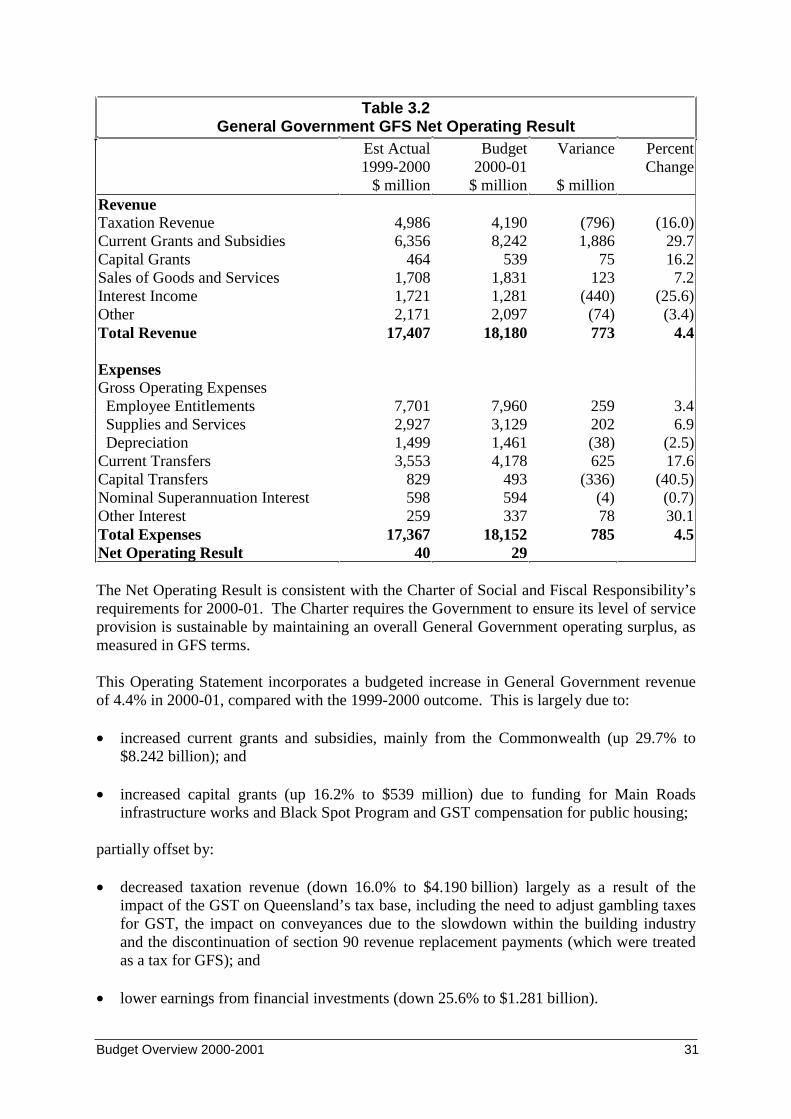
Budget Overview 2000-2001 31
Table 3.2General Government GFS Net Operating Result
Est Actual1999-2000
$ million
Budget2000-01
$ million
Variance
$ million
PercentChange
RevenueTaxation Revenue 4,986 4,190 (796) (16.0)Current Grants and Subsidies 6,356 8,242 1,886 29.7Capital Grants 464 539 75 16.2Sales of Goods and Services 1,708 1,831 123 7.2Interest Income 1,721 1,281 (440) (25.6)Other 2,171 2,097 (74) (3.4)Total Revenue 17,407 18,180 773 4.4
ExpensesGross Operating Expenses Employee Entitlements 7,701 7,960 259 3.4 Supplies and Services 2,927 3,129 202 6.9 Depreciation 1,499 1,461 (38) (2.5)Current Transfers 3,553 4,178 625 17.6Capital Transfers 829 493 (336) (40.5)Nominal Superannuation Interest 598 594 (4) (0.7)Other Interest 259 337 78 30.1Total Expenses 17,367 18,152 785 4.5Net Operating Result 40 29
The Net Operating Result is consistent with the Charter of Social and Fiscal Responsibility’srequirements for 2000-01. The Charter requires the Government to ensure its level of serviceprovision is sustainable by maintaining an overall General Government operating surplus, asmeasured in GFS terms.
This Operating Statement incorporates a budgeted increase in General Government revenueof 4.4% in 2000-01, compared with the 1999-2000 outcome. This is largely due to:
• increased current grants and subsidies, mainly from the Commonwealth (up 29.7% to$8.242 billion); and
• increased capital grants (up 16.2% to $539 million) due to funding for Main Roadsinfrastructure works and Black Spot Program and GST compensation for public housing;
partially offset by:
• decreased taxation revenue (down 16.0% to $4.190 billion) largely as a result of theimpact of the GST on Queensland’s tax base, including the need to adjust gambling taxesfor GST, the impact on conveyances due to the slowdown within the building industryand the discontinuation of section 90 revenue replacement payments (which were treatedas a tax for GFS); and
• lower earnings from financial investments (down 25.6% to $1.281 billion).
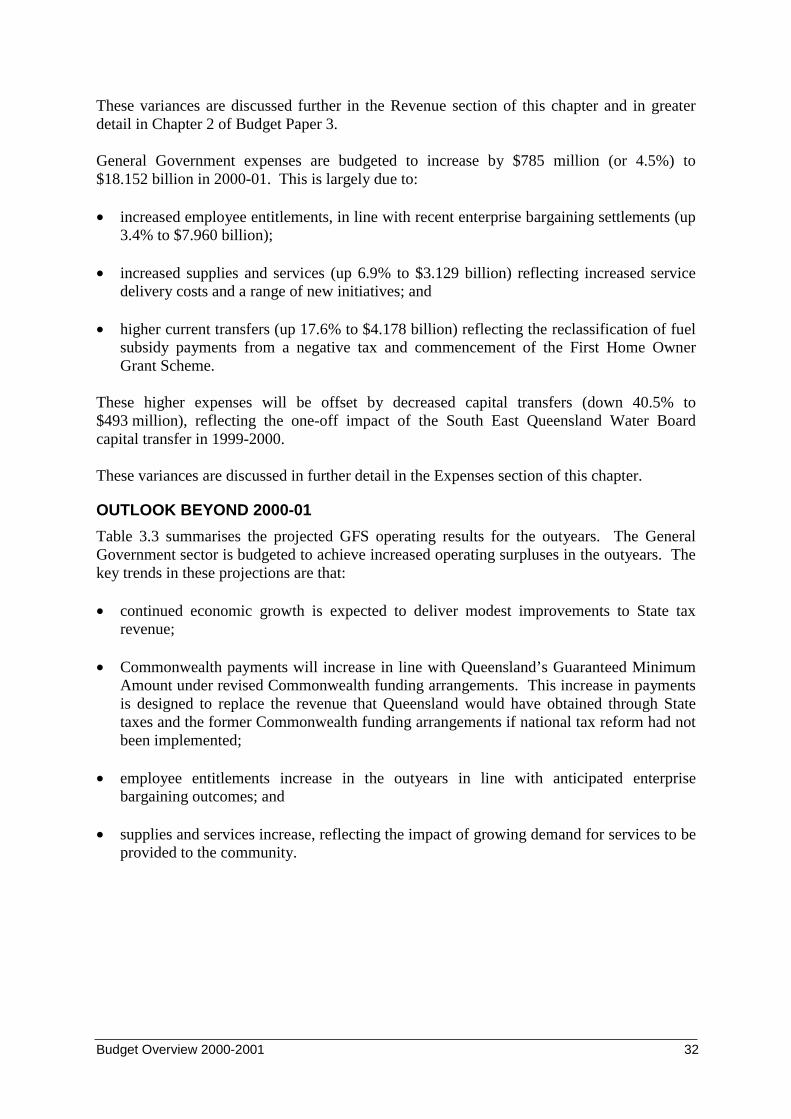
Budget Overview 2000-2001 32
These variances are discussed further in the Revenue section of this chapter and in greaterdetail in Chapter 2 of Budget Paper 3.
General Government expenses are budgeted to increase by $785 million (or 4.5%) to$18.152 billion in 2000-01. This is largely due to:
• increased employee entitlements, in line with recent enterprise bargaining settlements (up3.4% to $7.960 billion);
• increased supplies and services (up 6.9% to $3.129 billion) reflecting increased servicedelivery costs and a range of new initiatives; and
• higher current transfers (up 17.6% to $4.178 billion) reflecting the reclassification of fuelsubsidy payments from a negative tax and commencement of the First Home OwnerGrant Scheme.
These higher expenses will be offset by decreased capital transfers (down 40.5% to$493 million), reflecting the one-off impact of the South East Queensland Water Boardcapital transfer in 1999-2000.
These variances are discussed in further detail in the Expenses section of this chapter.
OUTLOOK BEYOND 2000-01
Table 3.3 summarises the projected GFS operating results for the outyears. The GeneralGovernment sector is budgeted to achieve increased operating surpluses in the outyears. Thekey trends in these projections are that:
• continued economic growth is expected to deliver modest improvements to State taxrevenue;
• Commonwealth payments will increase in line with Queensland’s Guaranteed MinimumAmount under revised Commonwealth funding arrangements. This increase in paymentsis designed to replace the revenue that Queensland would have obtained through Statetaxes and the former Commonwealth funding arrangements if national tax reform had notbeen implemented;
• employee entitlements increase in the outyears in line with anticipated enterprisebargaining outcomes; and
• supplies and services increase, reflecting the impact of growing demand for services to beprovided to the community.
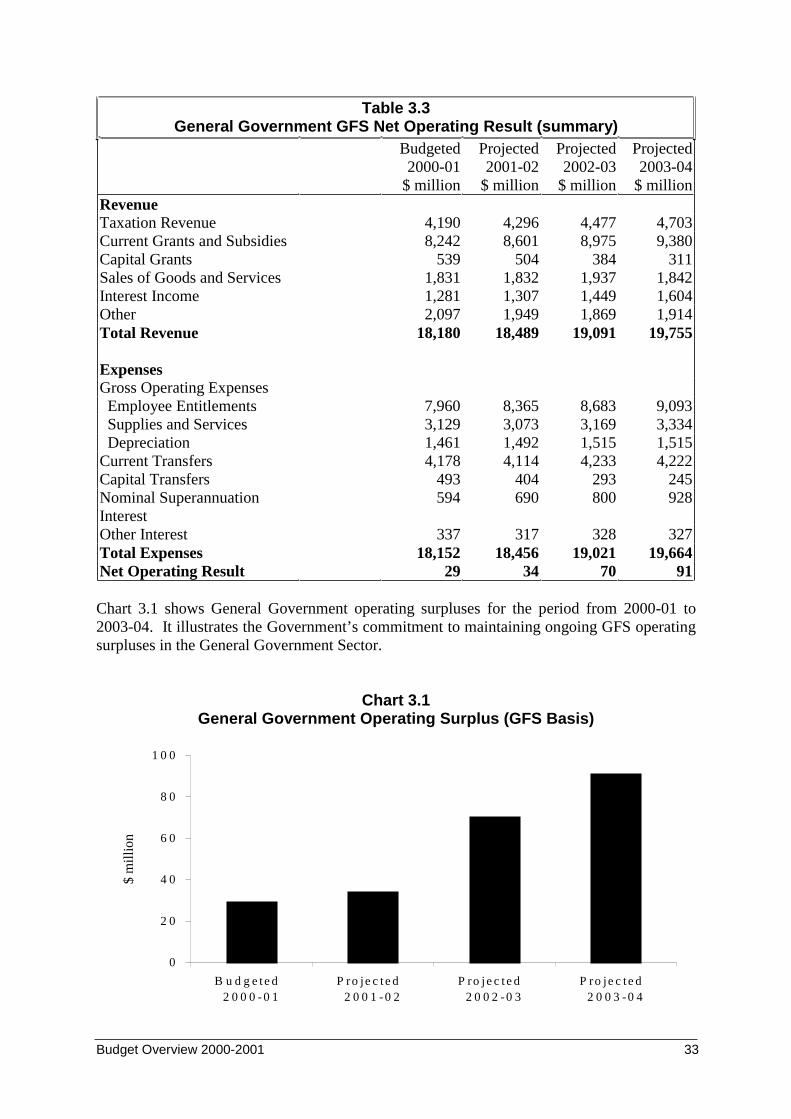
Budget Overview 2000-2001 33
Table 3.3General Government GFS Net Operating Result (summary)
Budgeted2000-01
$ million
Projected2001-02
$ million
Projected2002-03
$ million
Projected2003-04
$ millionRevenueTaxation Revenue 4,190 4,296 4,477 4,703Current Grants and Subsidies 8,242 8,601 8,975 9,380Capital Grants 539 504 384 311Sales of Goods and Services 1,831 1,832 1,937 1,842Interest Income 1,281 1,307 1,449 1,604Other 2,097 1,949 1,869 1,914Total Revenue 18,180 18,489 19,091 19,755
ExpensesGross Operating Expenses Employee Entitlements 7,960 8,365 8,683 9,093 Supplies and Services 3,129 3,073 3,169 3,334 Depreciation 1,461 1,492 1,515 1,515Current Transfers 4,178 4,114 4,233 4,222Capital Transfers 493 404 293 245Nominal SuperannuationInterest
594 690 800 928
Other Interest 337 317 328 327Total Expenses 18,152 18,456 19,021 19,664Net Operating Result 29 34 70 91
Chart 3.1 shows General Government operating surpluses for the period from 2000-01 to2003-04. It illustrates the Government’s commitment to maintaining ongoing GFS operatingsurpluses in the General Government Sector.
Chart 3.1General Government Operating Surplus (GFS Basis)
0
2 0
4 0
6 0
8 0
1 0 0
B u d g e t e d 2 0 0 0 - 0 1
P ro je c t e d 2 0 0 1 -0 2
P ro j e c t e d 2 0 0 2 -0 3
P ro je c t e d 2 0 0 3 -0 4
$ m
illio
n
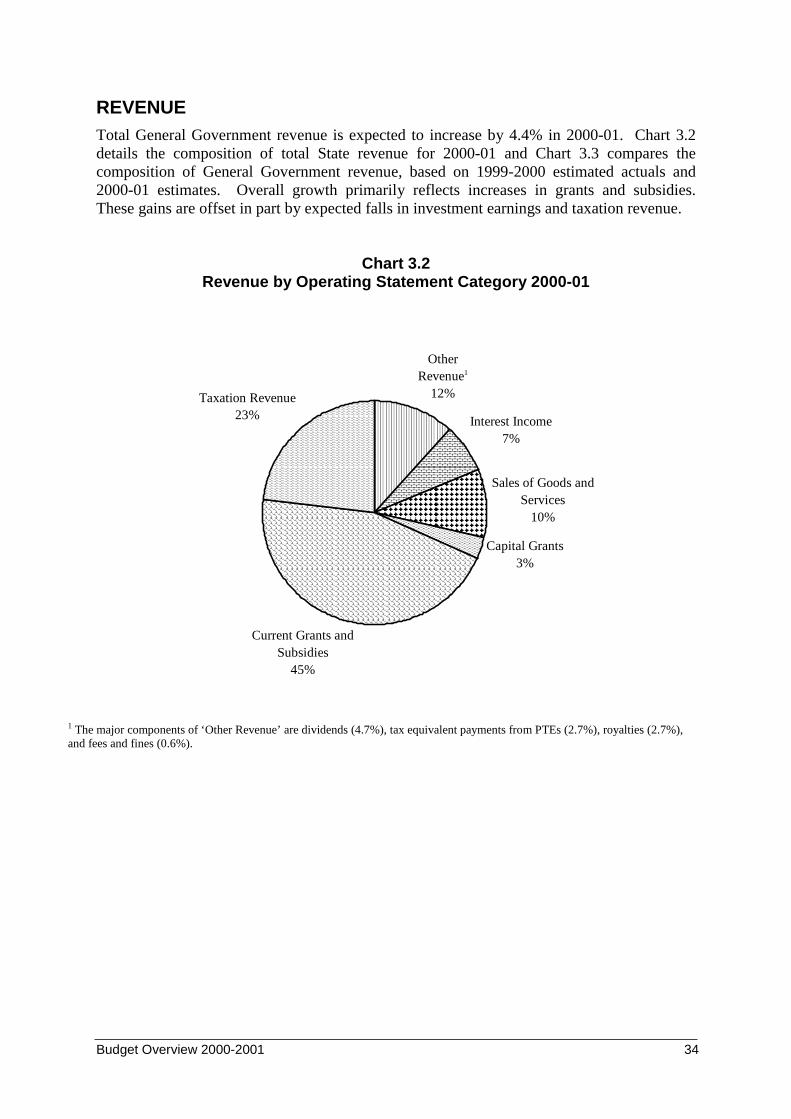
Budget Overview 2000-2001 34
REVENUETotal General Government revenue is expected to increase by 4.4% in 2000-01. Chart 3.2details the composition of total State revenue for 2000-01 and Chart 3.3 compares thecomposition of General Government revenue, based on 1999-2000 estimated actuals and2000-01 estimates. Overall growth primarily reflects increases in grants and subsidies.These gains are offset in part by expected falls in investment earnings and taxation revenue.
Chart 3.2Revenue by Operating Statement Category 2000-01
Interest Income7%
Sales of Goods and Services
10%
Capital Grants3%
Current Grants and Subsidies
45%
Taxation Revenue23%
OtherRevenue1
12%
1 The major components of ‘Other Revenue’ are dividends (4.7%), tax equivalent payments from PTEs (2.7%), royalties (2.7%),and fees and fines (0.6%).
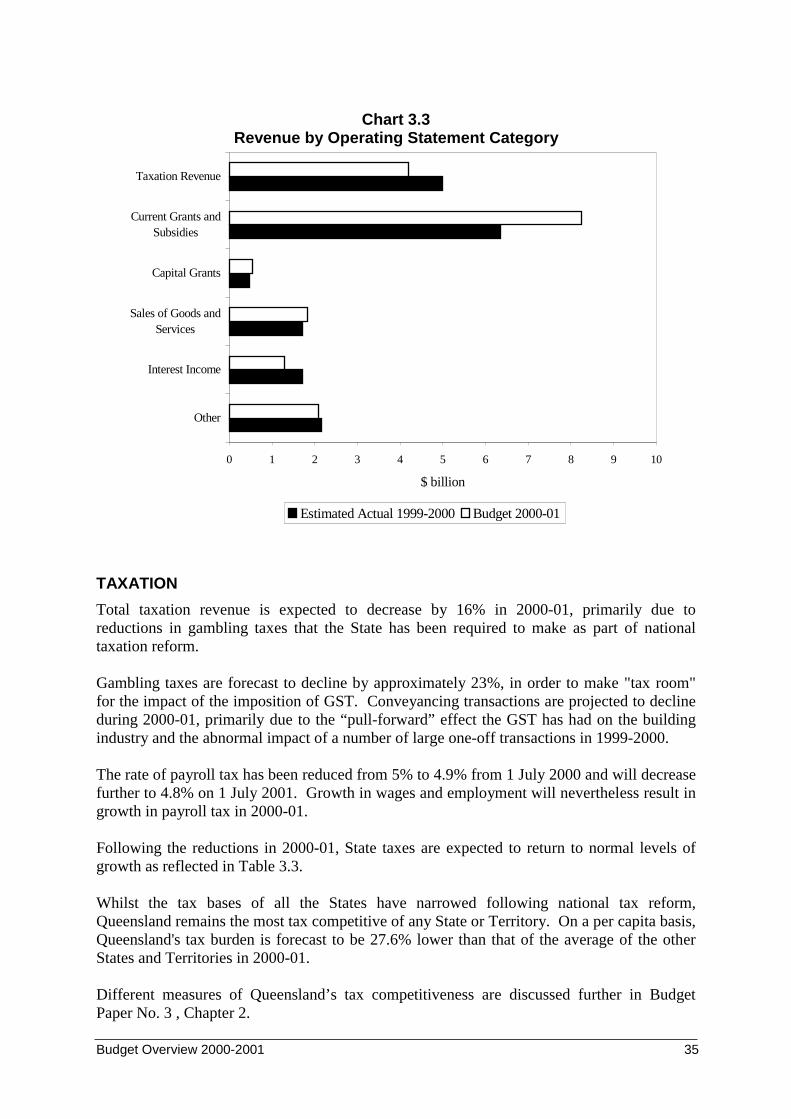
Budget Overview 2000-2001 35
Chart 3.3Revenue by Operating Statement Category
0 1 2 3 4 5 6 7 8 9 10
Other
Interest Income
Sales of Goods andServices
Capital Grants
Current Grants andSubsidies
Taxation Revenue
$ billion
Estimated Actual 1999-2000 Budget 2000-01
TAXATION
Total taxation revenue is expected to decrease by 16% in 2000-01, primarily due toreductions in gambling taxes that the State has been required to make as part of nationaltaxation reform.
Gambling taxes are forecast to decline by approximately 23%, in order to make "tax room"for the impact of the imposition of GST. Conveyancing transactions are projected to declineduring 2000-01, primarily due to the “pull-forward” effect the GST has had on the buildingindustry and the abnormal impact of a number of large one-off transactions in 1999-2000.
The rate of payroll tax has been reduced from 5% to 4.9% from 1 July 2000 and will decreasefurther to 4.8% on 1 July 2001. Growth in wages and employment will nevertheless result ingrowth in payroll tax in 2000-01.
Following the reductions in 2000-01, State taxes are expected to return to normal levels ofgrowth as reflected in Table 3.3.
Whilst the tax bases of all the States have narrowed following national tax reform,Queensland remains the most tax competitive of any State or Territory. On a per capita basis,Queensland's tax burden is forecast to be 27.6% lower than that of the average of the otherStates and Territories in 2000-01.
Different measures of Queensland’s tax competitiveness are discussed further in BudgetPaper No. 3 , Chapter 2.
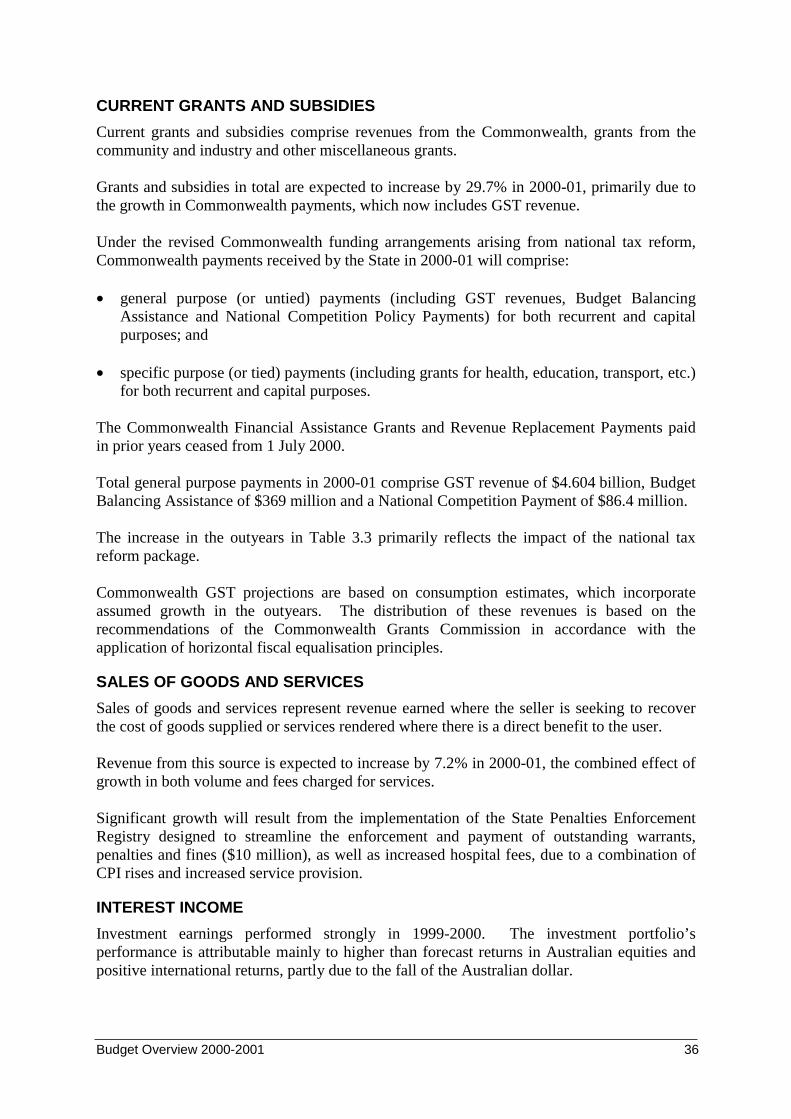
Budget Overview 2000-2001 36
CURRENT GRANTS AND SUBSIDIES
Current grants and subsidies comprise revenues from the Commonwealth, grants from thecommunity and industry and other miscellaneous grants.
Grants and subsidies in total are expected to increase by 29.7% in 2000-01, primarily due tothe growth in Commonwealth payments, which now includes GST revenue.
Under the revised Commonwealth funding arrangements arising from national tax reform,Commonwealth payments received by the State in 2000-01 will comprise:
• general purpose (or untied) payments (including GST revenues, Budget BalancingAssistance and National Competition Policy Payments) for both recurrent and capitalpurposes; and
• specific purpose (or tied) payments (including grants for health, education, transport, etc.)for both recurrent and capital purposes.
The Commonwealth Financial Assistance Grants and Revenue Replacement Payments paidin prior years ceased from 1 July 2000.
Total general purpose payments in 2000-01 comprise GST revenue of $4.604 billion, BudgetBalancing Assistance of $369 million and a National Competition Payment of $86.4 million.
The increase in the outyears in Table 3.3 primarily reflects the impact of the national taxreform package.
Commonwealth GST projections are based on consumption estimates, which incorporateassumed growth in the outyears. The distribution of these revenues is based on therecommendations of the Commonwealth Grants Commission in accordance with theapplication of horizontal fiscal equalisation principles.
SALES OF GOODS AND SERVICES
Sales of goods and services represent revenue earned where the seller is seeking to recoverthe cost of goods supplied or services rendered where there is a direct benefit to the user.
Revenue from this source is expected to increase by 7.2% in 2000-01, the combined effect ofgrowth in both volume and fees charged for services.
Significant growth will result from the implementation of the State Penalties EnforcementRegistry designed to streamline the enforcement and payment of outstanding warrants,penalties and fines ($10 million), as well as increased hospital fees, due to a combination ofCPI rises and increased service provision.
INTEREST INCOME
Investment earnings performed strongly in 1999-2000. The investment portfolio’sperformance is attributable mainly to higher than forecast returns in Australian equities andpositive international returns, partly due to the fall of the Australian dollar.
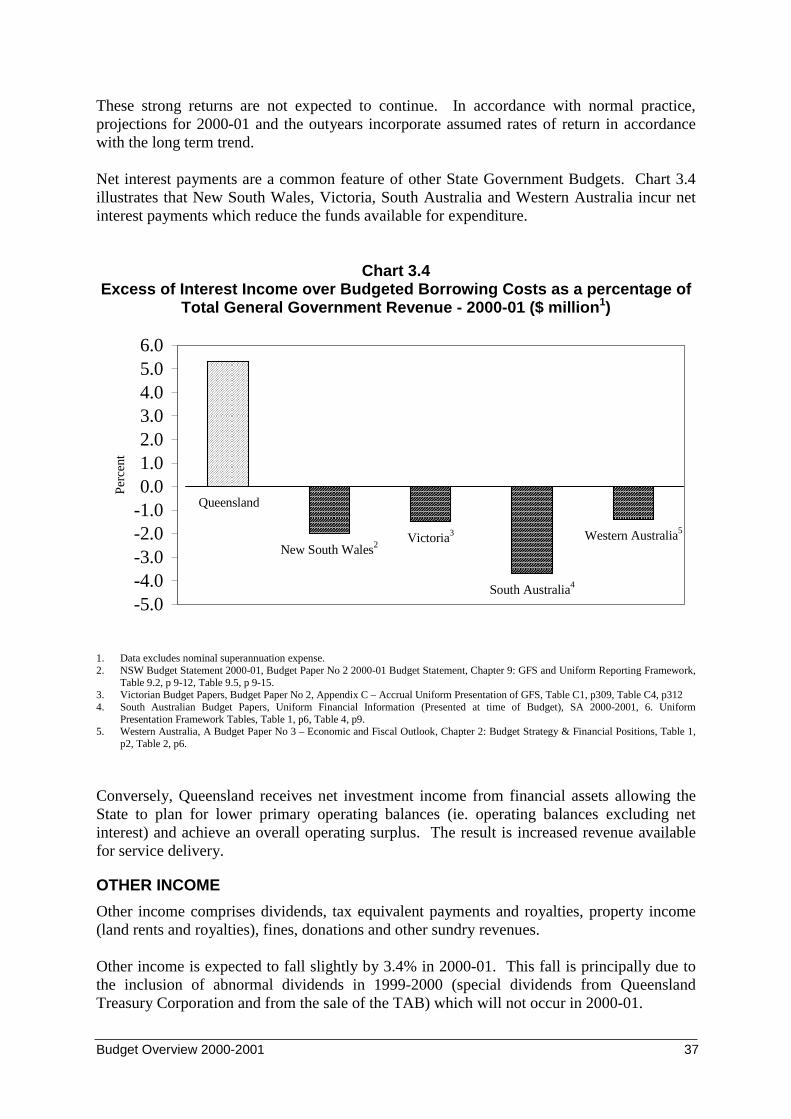
Budget Overview 2000-2001 37
These strong returns are not expected to continue. In accordance with normal practice,projections for 2000-01 and the outyears incorporate assumed rates of return in accordancewith the long term trend.
Net interest payments are a common feature of other State Government Budgets. Chart 3.4illustrates that New South Wales, Victoria, South Australia and Western Australia incur netinterest payments which reduce the funds available for expenditure.
Chart 3.4Excess of Interest Income over Budgeted Borrowing Costs as a percentage of
Total General Government Revenue - 2000-01 ($ million1)
Western Australia5
South Australia4
Victoria3
New South Wales2
Queensland
-5.0-4.0-3.0-2.0-1.00.01.02.03.04.05.06.0
Per
cent
1. Data excludes nominal superannuation expense.2. NSW Budget Statement 2000-01, Budget Paper No 2 2000-01 Budget Statement, Chapter 9: GFS and Uniform Reporting Framework,
Table 9.2, p 9-12, Table 9.5, p 9-15.3. Victorian Budget Papers, Budget Paper No 2, Appendix C – Accrual Uniform Presentation of GFS, Table C1, p309, Table C4, p3124. South Australian Budget Papers, Uniform Financial Information (Presented at time of Budget), SA 2000-2001, 6. Uniform
Presentation Framework Tables, Table 1, p6, Table 4, p9.5. Western Australia, A Budget Paper No 3 – Economic and Fiscal Outlook, Chapter 2: Budget Strategy & Financial Positions, Table 1,
p2, Table 2, p6.
Conversely, Queensland receives net investment income from financial assets allowing theState to plan for lower primary operating balances (ie. operating balances excluding netinterest) and achieve an overall operating surplus. The result is increased revenue availablefor service delivery.
OTHER INCOME
Other income comprises dividends, tax equivalent payments and royalties, property income(land rents and royalties), fines, donations and other sundry revenues.
Other income is expected to fall slightly by 3.4% in 2000-01. This fall is principally due tothe inclusion of abnormal dividends in 1999-2000 (special dividends from QueenslandTreasury Corporation and from the sale of the TAB) which will not occur in 2000-01.
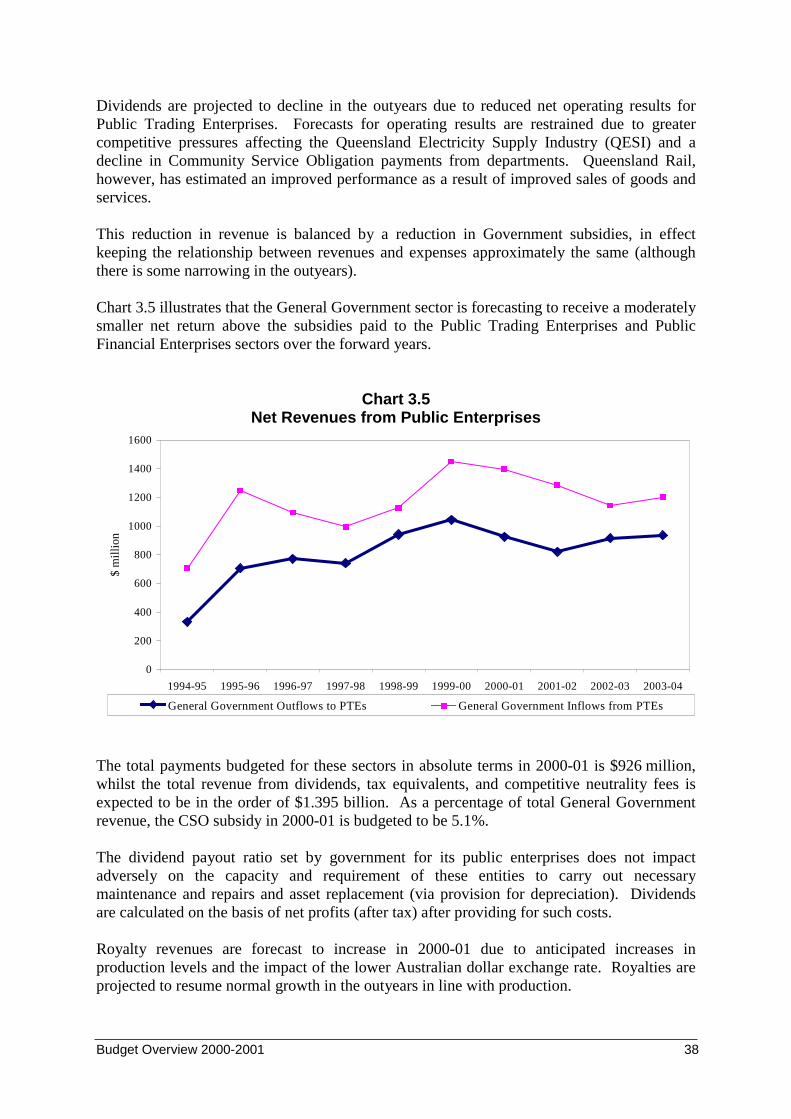
Budget Overview 2000-2001 38
Dividends are projected to decline in the outyears due to reduced net operating results forPublic Trading Enterprises. Forecasts for operating results are restrained due to greatercompetitive pressures affecting the Queensland Electricity Supply Industry (QESI) and adecline in Community Service Obligation payments from departments. Queensland Rail,however, has estimated an improved performance as a result of improved sales of goods andservices.
This reduction in revenue is balanced by a reduction in Government subsidies, in effectkeeping the relationship between revenues and expenses approximately the same (althoughthere is some narrowing in the outyears).
Chart 3.5 illustrates that the General Government sector is forecasting to receive a moderatelysmaller net return above the subsidies paid to the Public Trading Enterprises and PublicFinancial Enterprises sectors over the forward years.
Chart 3.5Net Revenues from Public Enterprises
0
200
400
600
800
1000
1200
1400
1600
1994-95 1995-96 1996-97 1997-98 1998-99 1999-00 2000-01 2001-02 2002-03 2003-04
$ m
illi
on
General Government Outflows to PTEs General Government Inflows from PTEs
The total payments budgeted for these sectors in absolute terms in 2000-01 is $926 million,whilst the total revenue from dividends, tax equivalents, and competitive neutrality fees isexpected to be in the order of $1.395 billion. As a percentage of total General Governmentrevenue, the CSO subsidy in 2000-01 is budgeted to be 5.1%.
The dividend payout ratio set by government for its public enterprises does not impactadversely on the capacity and requirement of these entities to carry out necessarymaintenance and repairs and asset replacement (via provision for depreciation). Dividendsare calculated on the basis of net profits (after tax) after providing for such costs.
Royalty revenues are forecast to increase in 2000-01 due to anticipated increases inproduction levels and the impact of the lower Australian dollar exchange rate. Royalties areprojected to resume normal growth in the outyears in line with production.
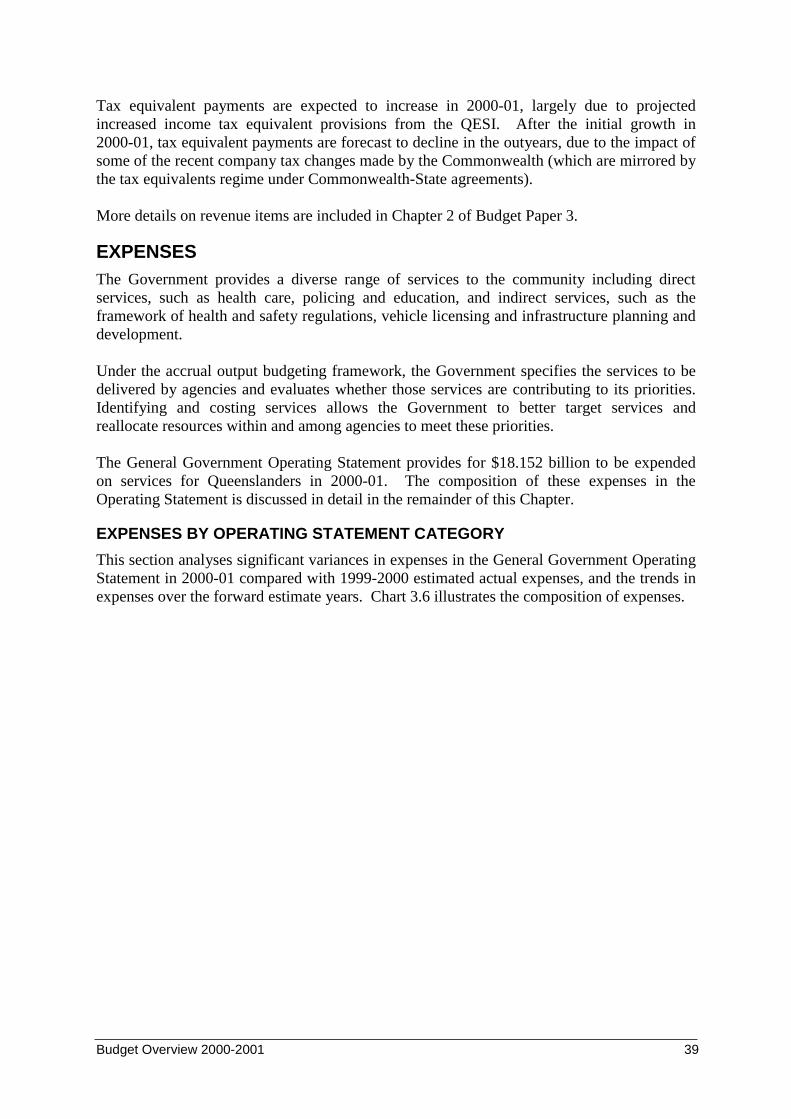
Budget Overview 2000-2001 39
Tax equivalent payments are expected to increase in 2000-01, largely due to projectedincreased income tax equivalent provisions from the QESI. After the initial growth in2000-01, tax equivalent payments are forecast to decline in the outyears, due to the impact ofsome of the recent company tax changes made by the Commonwealth (which are mirrored bythe tax equivalents regime under Commonwealth-State agreements).
More details on revenue items are included in Chapter 2 of Budget Paper 3.
EXPENSESThe Government provides a diverse range of services to the community including directservices, such as health care, policing and education, and indirect services, such as theframework of health and safety regulations, vehicle licensing and infrastructure planning anddevelopment.
Under the accrual output budgeting framework, the Government specifies the services to bedelivered by agencies and evaluates whether those services are contributing to its priorities.Identifying and costing services allows the Government to better target services andreallocate resources within and among agencies to meet these priorities.
The General Government Operating Statement provides for $18.152 billion to be expendedon services for Queenslanders in 2000-01. The composition of these expenses in theOperating Statement is discussed in detail in the remainder of this Chapter.
EXPENSES BY OPERATING STATEMENT CATEGORY
This section analyses significant variances in expenses in the General Government OperatingStatement in 2000-01 compared with 1999-2000 estimated actual expenses, and the trends inexpenses over the forward estimate years. Chart 3.6 illustrates the composition of expenses.
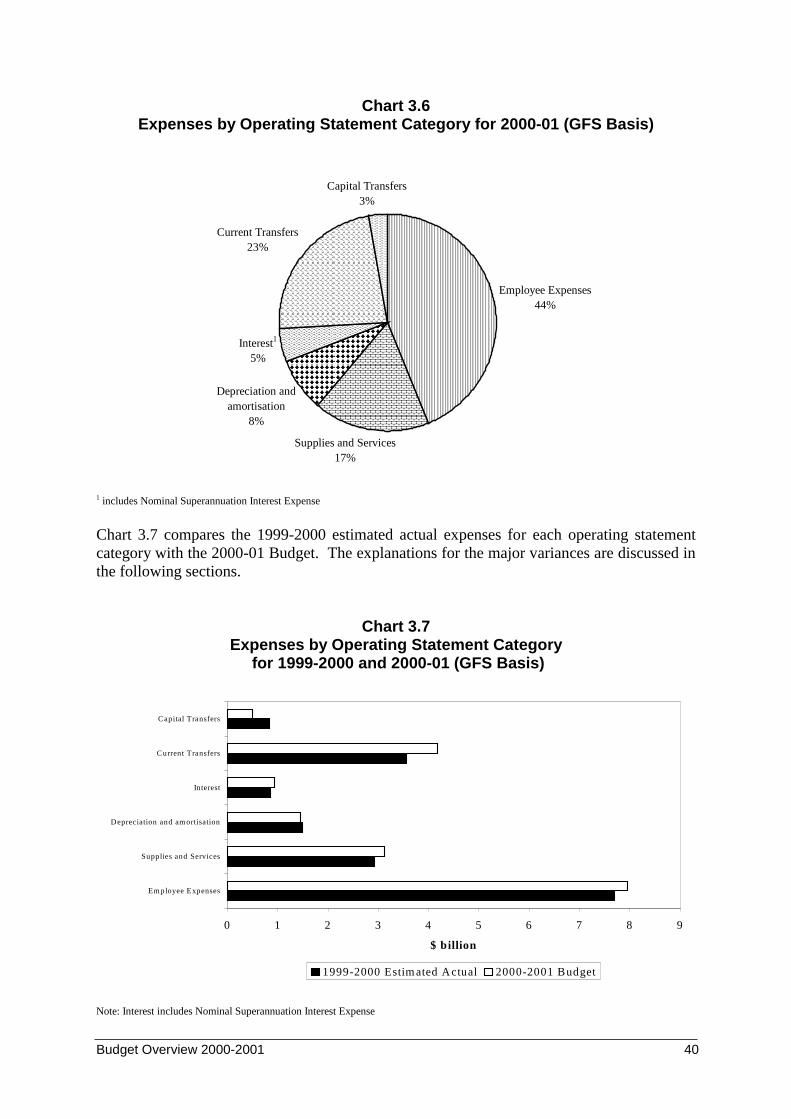
Budget Overview 2000-2001 40
Chart 3.6Expenses by Operating Statement Category for 2000-01 (GFS Basis)
Employee Expenses44%
Supplies and Services17%
Depreciation and amortisation
8%
Capital Transfers3%
Current Transfers23%
Interest1
5%
1 includes Nominal Superannuation Interest Expense
Chart 3.7 compares the 1999-2000 estimated actual expenses for each operating statementcategory with the 2000-01 Budget. The explanations for the major variances are discussed inthe following sections.
Chart 3.7Expenses by Operating Statement Category
for 1999-2000 and 2000-01 (GFS Basis)
0 1 2 3 4 5 6 7 8 9
Em ployee Expenses
Supplies and Services
D epreciation and am ortisation
Interest
Current Transfers
Capital Transfers
$ billion
1999-2000 Estim ated Actual 2000-2001 Budget
Note: Interest includes Nominal Superannuation Interest Expense
Budget Overview 2000-2001 41
TOTAL GROSS OPERATING EXPENSES
Total gross operating expenses comprise employee entitlements (including superannuation),supplies and services and depreciation. Table 3.2 shows the components of Total GrossOperating Expenses over the forward estimate years.
EMPLOYEE ENTITLEMENTS
Employee entitlements include salaries and wages, annual leave, long service leave andsuperannuation contributions and payments.
The increase over the forward estimate years is generally a result of anticipated growth inemployee costs due to the provision of additional services to the community and to enterprisebargaining costs.
Superannuation expense represents the employer’s contribution to the superannuation ofgovernment employees in the General Government Sector.
SUPPLIES AND SERVICES
Supplies and services comprise the non-labour costs of providing services to Queenslanders,such as repairs and maintenance, consultancies, contractors, equipment, communications andmarketing. The moderate increases in the forward years reflects projected increases inservice delivery costs and a range of new initiatives.
Budget Paper 4 and Ministerial Portfolio Statements provide details on new and existingservices for each portfolio.
DEPRECIATION
The budgeted depreciation expense is an estimate of the progressive consumption of theState’s assets through normal usage, wear, tear and obsolescence. Queensland's depreciationexpense as a percentage of fixed assets is generally higher than that of other States, reflectinga more realistic provision for asset replacement over time.
Chapter 7 provides further analysis of this issue.
CURRENT TRANSFERS
Current transfers include grants to the community, including to schools, hospitals andbenevolent institutions, local governments, personal benefit payments and Commonwealthtaxes including fringe benefits tax. Chart 3.8 indicates the composition of current grants byrecipient.
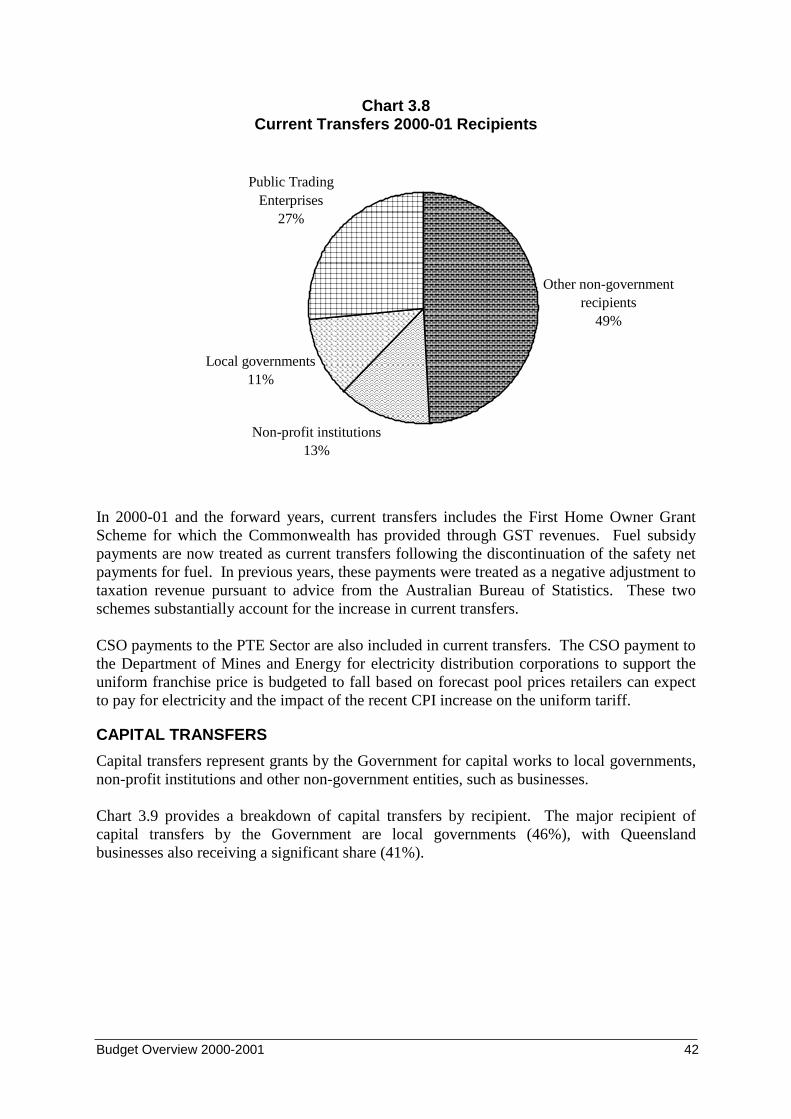
Budget Overview 2000-2001 42
Chart 3.8Current Transfers 2000-01 Recipients
Other non-government recipients
49%
Non-profit institutions13%
Local governments11%
Public Trading Enterprises
27%
In 2000-01 and the forward years, current transfers includes the First Home Owner GrantScheme for which the Commonwealth has provided through GST revenues. Fuel subsidypayments are now treated as current transfers following the discontinuation of the safety netpayments for fuel. In previous years, these payments were treated as a negative adjustment totaxation revenue pursuant to advice from the Australian Bureau of Statistics. These twoschemes substantially account for the increase in current transfers.
CSO payments to the PTE Sector are also included in current transfers. The CSO payment tothe Department of Mines and Energy for electricity distribution corporations to support theuniform franchise price is budgeted to fall based on forecast pool prices retailers can expectto pay for electricity and the impact of the recent CPI increase on the uniform tariff.
CAPITAL TRANSFERS
Capital transfers represent grants by the Government for capital works to local governments,non-profit institutions and other non-government entities, such as businesses.
Chart 3.9 provides a breakdown of capital transfers by recipient. The major recipient ofcapital transfers by the Government are local governments (46%), with Queenslandbusinesses also receiving a significant share (41%).
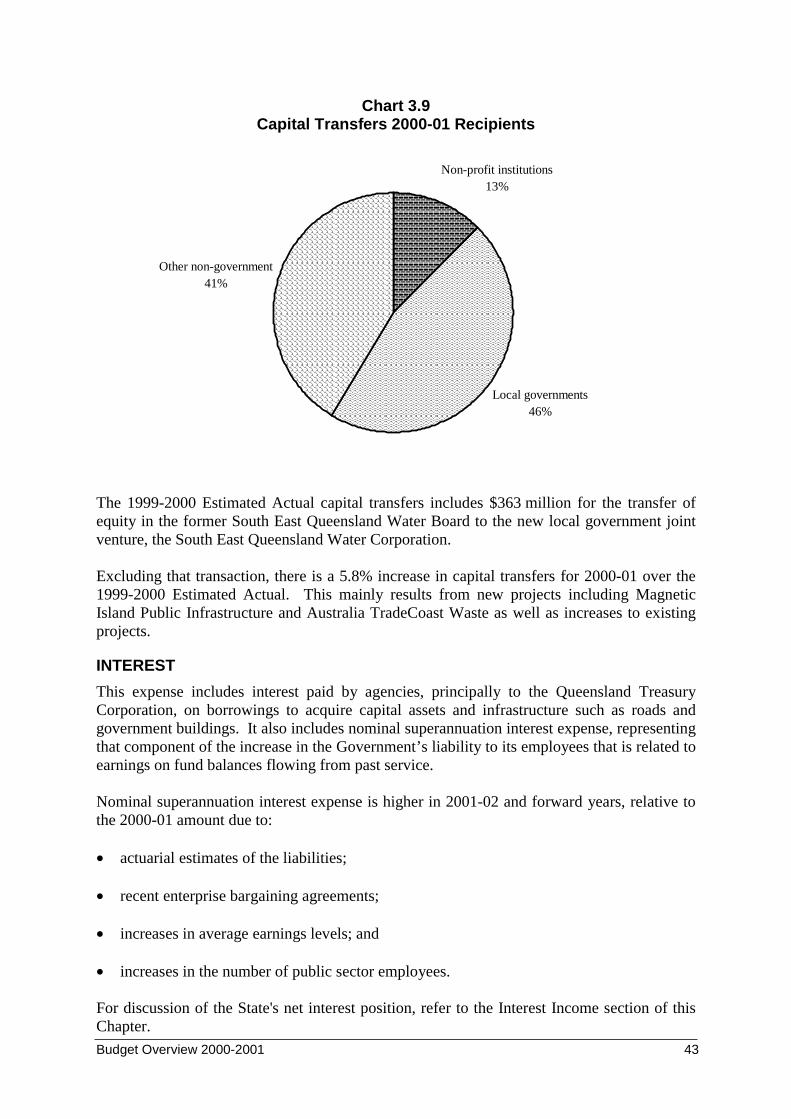
Budget Overview 2000-2001 43
Chart 3.9Capital Transfers 2000-01 Recipients
Non-profit institutions13%
Local governments46%
Other non-government41%
The 1999-2000 Estimated Actual capital transfers includes $363 million for the transfer ofequity in the former South East Queensland Water Board to the new local government jointventure, the South East Queensland Water Corporation.
Excluding that transaction, there is a 5.8% increase in capital transfers for 2000-01 over the1999-2000 Estimated Actual. This mainly results from new projects including MagneticIsland Public Infrastructure and Australia TradeCoast Waste as well as increases to existingprojects.
INTEREST
This expense includes interest paid by agencies, principally to the Queensland TreasuryCorporation, on borrowings to acquire capital assets and infrastructure such as roads andgovernment buildings. It also includes nominal superannuation interest expense, representingthat component of the increase in the Government’s liability to its employees that is related toearnings on fund balances flowing from past service.
Nominal superannuation interest expense is higher in 2001-02 and forward years, relative tothe 2000-01 amount due to:
• actuarial estimates of the liabilities;
• recent enterprise bargaining agreements;
• increases in average earnings levels; and
• increases in the number of public sector employees.
For discussion of the State's net interest position, refer to the Interest Income section of thisChapter.
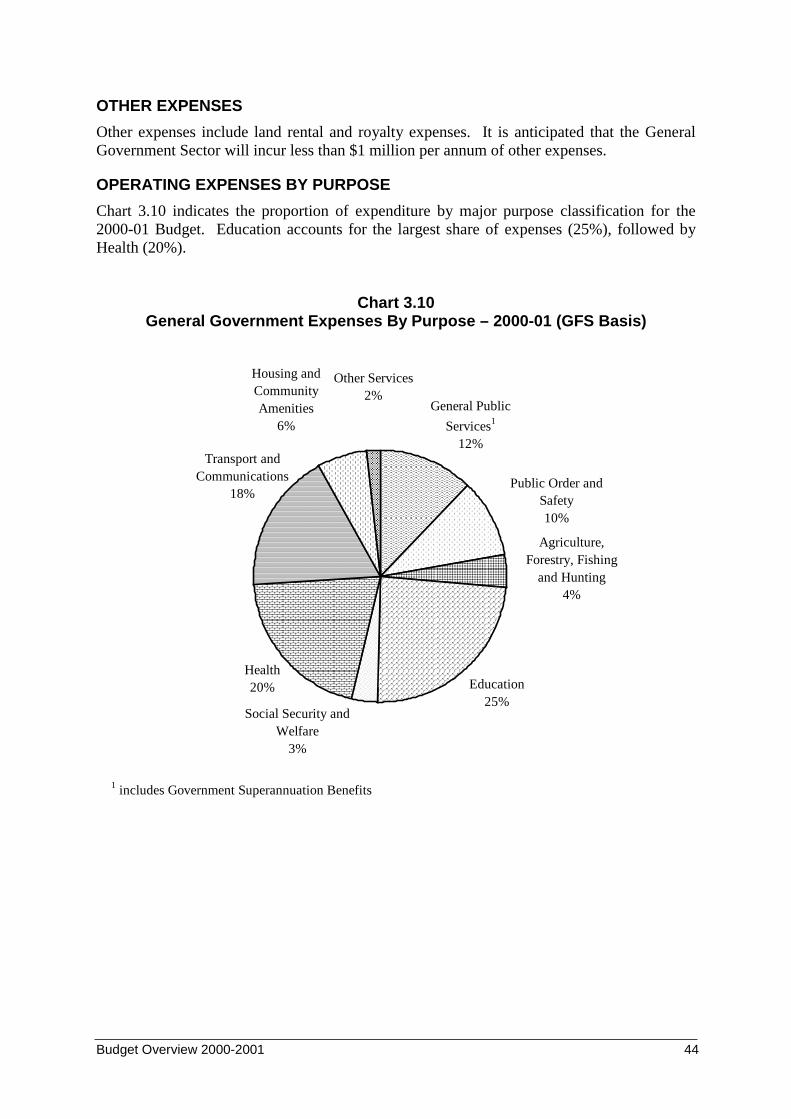
Budget Overview 2000-2001 44
OTHER EXPENSES
Other expenses include land rental and royalty expenses. It is anticipated that the GeneralGovernment Sector will incur less than $1 million per annum of other expenses.
OPERATING EXPENSES BY PURPOSE
Chart 3.10 indicates the proportion of expenditure by major purpose classification for the2000-01 Budget. Education accounts for the largest share of expenses (25%), followed byHealth (20%).
Chart 3.10General Government Expenses By Purpose – 2000-01 (GFS Basis)
1 includes Government Superannuation Benefits
Public Order and Safety10%
Agriculture, Forestry, Fishing
and Hunting4%
Education25%
Health20%
Transport and Communications
18%
Social Security and Welfare
3%
General Public
Services1
12%
Other Services2%
Housing and Community Amenities
6%

Budget Overview 2000-2001 45
Budget Overview 2000-2001 46
4. STATEMENT OF FINANCIAL POSITION
KEY POINTS
• The Queensland Government’s strong financial position is expected to be enhanced in2000-01. State net worth is projected to rise by $434 million through the year to$57.776 billion.
• Net worth is forecast to increase each year over the forward estimates period, meetingthe Government’s commitment to maintain and seek to increase total State net worth.
• The State is well placed to meet all its present, accruing and future liabilities. Financialassets are projected to exceed liabilities by $15.139 billion in the General Governmentsector as at 30 June 2001, in accordance with the requirements of the Government’sCharter of Social and Fiscal Responsibility.
INTRODUCTIONThe budgeted Statement of Financial Position, or Balance Sheet, shows the projected assets,liabilities and equity of the General Government Sector as at 30 June 2001. It is importantfor the Queensland Government to maintain a strong and growing balance sheet whichprovides stability, flexibility and the capacity to cope with financial and economic exigencies.
The assets and liabilities in the balance sheet presented here are defined according to theGovernment Finance Statistics (GFS) standard of the Australian Bureau of Statistics. In theCharter of Social and Fiscal Responsibility, the Government made certain commitments interms of the State’s net worth and its ability to meet emerging liabilities. The continuedachievement of these commitments is discussed in this chapter.
FINANCIAL REPORTING MEASURESNET WORTH
The net worth, or equity, of the State is the amount by which the State’s assets exceed itsliabilities. This is the value of the investment held on behalf of the people of Queensland bypublic sector instrumentalities. Changes in the State’s net worth occur for a number ofreasons including:
• operating surpluses or deficits that increase or decrease the Government’s equity.Queensland has a long history of reinvesting operating surpluses in productive assets orcapital projects used to provide additional or improved public services;
• revaluation of assets as required under accounting standards;
• revaluation of liabilities. Some financial liabilities are revalued on a regular basis. Forexample the Government’s accruing liabilities for employee superannuation, long serviceleave and Workcover, which are determined by actuarial assessments; and
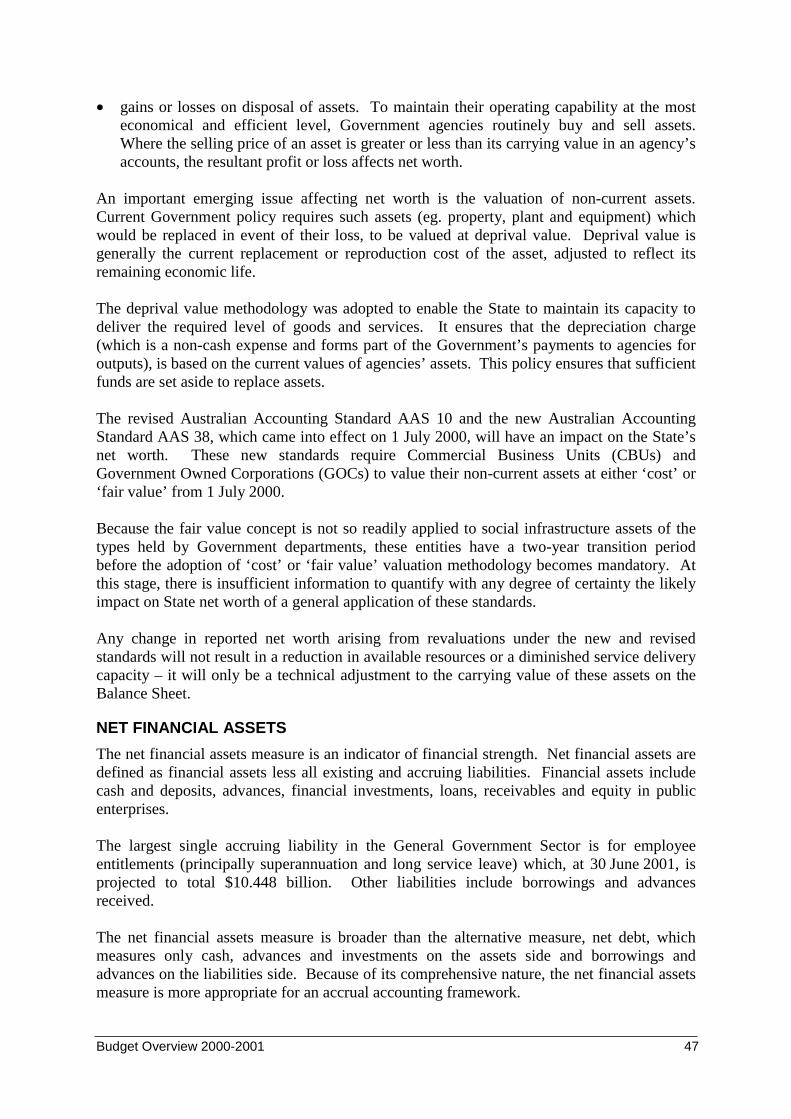
Budget Overview 2000-2001 47
• gains or losses on disposal of assets. To maintain their operating capability at the mosteconomical and efficient level, Government agencies routinely buy and sell assets.Where the selling price of an asset is greater or less than its carrying value in an agency’saccounts, the resultant profit or loss affects net worth.
An important emerging issue affecting net worth is the valuation of non-current assets.Current Government policy requires such assets (eg. property, plant and equipment) whichwould be replaced in event of their loss, to be valued at deprival value. Deprival value isgenerally the current replacement or reproduction cost of the asset, adjusted to reflect itsremaining economic life.
The deprival value methodology was adopted to enable the State to maintain its capacity todeliver the required level of goods and services. It ensures that the depreciation charge(which is a non-cash expense and forms part of the Government’s payments to agencies foroutputs), is based on the current values of agencies’ assets. This policy ensures that sufficientfunds are set aside to replace assets.
The revised Australian Accounting Standard AAS 10 and the new Australian AccountingStandard AAS 38, which came into effect on 1 July 2000, will have an impact on the State’snet worth. These new standards require Commercial Business Units (CBUs) andGovernment Owned Corporations (GOCs) to value their non-current assets at either ‘cost’ or‘fair value’ from 1 July 2000.
Because the fair value concept is not so readily applied to social infrastructure assets of thetypes held by Government departments, these entities have a two-year transition periodbefore the adoption of ‘cost’ or ‘fair value’ valuation methodology becomes mandatory. Atthis stage, there is insufficient information to quantify with any degree of certainty the likelyimpact on State net worth of a general application of these standards.
Any change in reported net worth arising from revaluations under the new and revisedstandards will not result in a reduction in available resources or a diminished service deliverycapacity – it will only be a technical adjustment to the carrying value of these assets on theBalance Sheet.
NET FINANCIAL ASSETS
The net financial assets measure is an indicator of financial strength. Net financial assets aredefined as financial assets less all existing and accruing liabilities. Financial assets includecash and deposits, advances, financial investments, loans, receivables and equity in publicenterprises.
The largest single accruing liability in the General Government Sector is for employeeentitlements (principally superannuation and long service leave) which, at 30 June 2001, isprojected to total $10.448 billion. Other liabilities include borrowings and advancesreceived.
The net financial assets measure is broader than the alternative measure, net debt, whichmeasures only cash, advances and investments on the assets side and borrowings andadvances on the liabilities side. Because of its comprehensive nature, the net financial assetsmeasure is more appropriate for an accrual accounting framework.
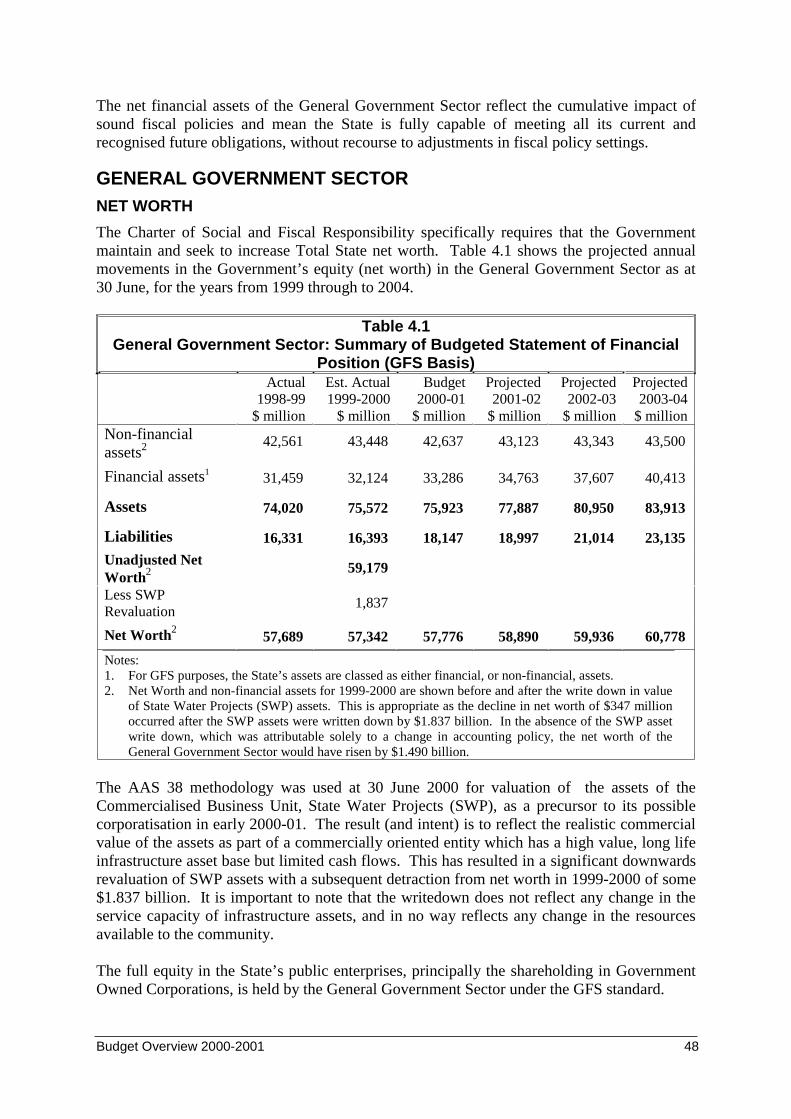
Budget Overview 2000-2001 48
The net financial assets of the General Government Sector reflect the cumulative impact ofsound fiscal policies and mean the State is fully capable of meeting all its current andrecognised future obligations, without recourse to adjustments in fiscal policy settings.
GENERAL GOVERNMENT SECTORNET WORTH
The Charter of Social and Fiscal Responsibility specifically requires that the Governmentmaintain and seek to increase Total State net worth. Table 4.1 shows the projected annualmovements in the Government’s equity (net worth) in the General Government Sector as at30 June, for the years from 1999 through to 2004.
Table 4.1General Government Sector: Summary of Budgeted Statement of Financial
Position (GFS Basis)Actual
1998-99$ million
Est. Actual1999-2000
$ million
Budget2000-01
$ million
Projected2001-02
$ million
Projected2002-03
$ million
Projected2003-04
$ millionNon-financialassets2 42,561 43,448 42,637 43,123 43,343 43,500
Financial assets1 31,459 32,124 33,286 34,763 37,607 40,413
Assets 74,020 75,572 75,923 77,887 80,950 83,913
Liabilities 16,331 16,393 18,147 18,997 21,014 23,135
Unadjusted NetWorth2 59,179
Less SWPRevaluation
1,837
Net Worth257,689 57,342 57,776 58,890 59,936 60,778
Notes:1. For GFS purposes, the State’s assets are classed as either financial, or non-financial, assets.2. Net Worth and non-financial assets for 1999-2000 are shown before and after the write down in value
of State Water Projects (SWP) assets. This is appropriate as the decline in net worth of $347 millionoccurred after the SWP assets were written down by $1.837 billion. In the absence of the SWP assetwrite down, which was attributable solely to a change in accounting policy, the net worth of theGeneral Government Sector would have risen by $1.490 billion.
The AAS 38 methodology was used at 30 June 2000 for valuation of the assets of theCommercialised Business Unit, State Water Projects (SWP), as a precursor to its possiblecorporatisation in early 2000-01. The result (and intent) is to reflect the realistic commercialvalue of the assets as part of a commercially oriented entity which has a high value, long lifeinfrastructure asset base but limited cash flows. This has resulted in a significant downwardsrevaluation of SWP assets with a subsequent detraction from net worth in 1999-2000 of some$1.837 billion. It is important to note that the writedown does not reflect any change in theservice capacity of infrastructure assets, and in no way reflects any change in the resourcesavailable to the community.
The full equity in the State’s public enterprises, principally the shareholding in GovernmentOwned Corporations, is held by the General Government Sector under the GFS standard.
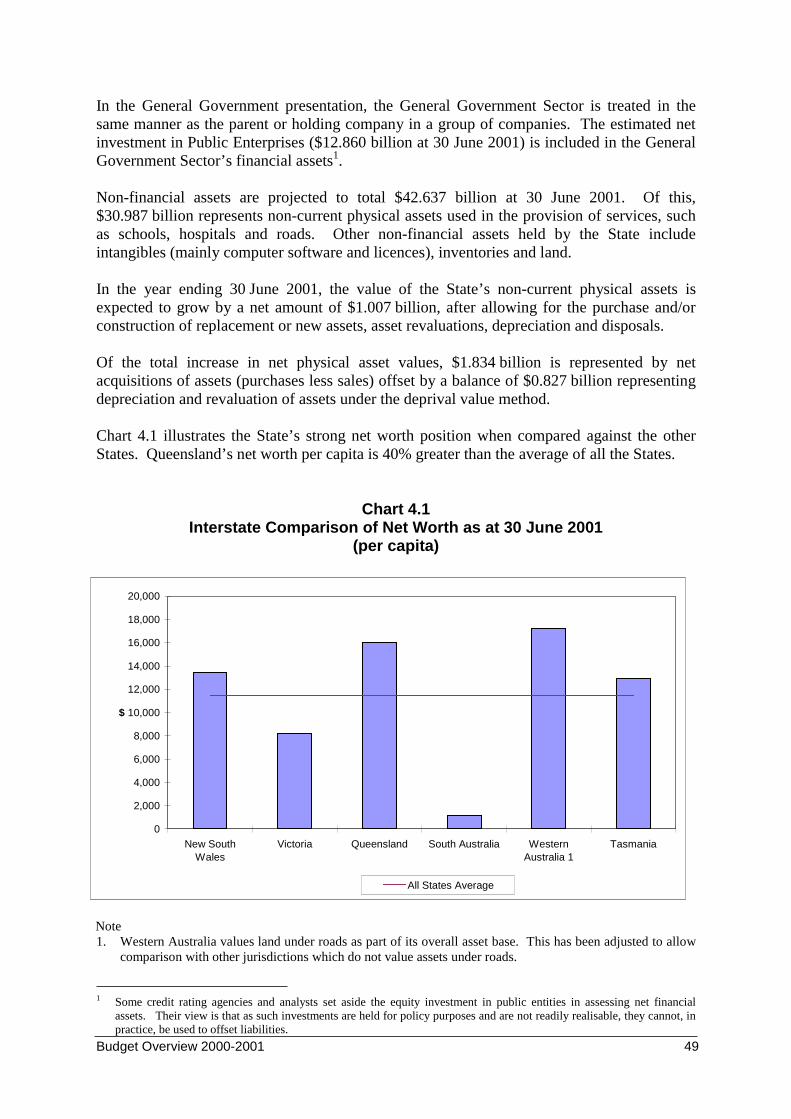
Budget Overview 2000-2001 49
In the General Government presentation, the General Government Sector is treated in thesame manner as the parent or holding company in a group of companies. The estimated netinvestment in Public Enterprises ($12.860 billion at 30 June 2001) is included in the GeneralGovernment Sector’s financial assets1.
Non-financial assets are projected to total $42.637 billion at 30 June 2001. Of this,$30.987 billion represents non-current physical assets used in the provision of services, suchas schools, hospitals and roads. Other non-financial assets held by the State includeintangibles (mainly computer software and licences), inventories and land.
In the year ending 30 June 2001, the value of the State’s non-current physical assets isexpected to grow by a net amount of $1.007 billion, after allowing for the purchase and/orconstruction of replacement or new assets, asset revaluations, depreciation and disposals.
Of the total increase in net physical asset values, $1.834 billion is represented by netacquisitions of assets (purchases less sales) offset by a balance of $0.827 billion representingdepreciation and revaluation of assets under the deprival value method.
Chart 4.1 illustrates the State’s strong net worth position when compared against the otherStates. Queensland’s net worth per capita is 40% greater than the average of all the States.
Chart 4.1Interstate Comparison of Net Worth as at 30 June 2001
(per capita)
Note1. Western Australia values land under roads as part of its overall asset base. This has been adjusted to allow
comparison with other jurisdictions which do not value assets under roads.
1 Some credit rating agencies and analysts set aside the equity investment in public entities in assessing net financialassets. Their view is that as such investments are held for policy purposes and are not readily realisable, they cannot, inpractice, be used to offset liabilities.
0
2,000
4,000
6,000
8,000
10,000
12,000
14,000
16,000
18,000
20,000
New SouthWales
Victoria Queensland South Australia WesternAustralia 1
Tasmania
$
All States Average
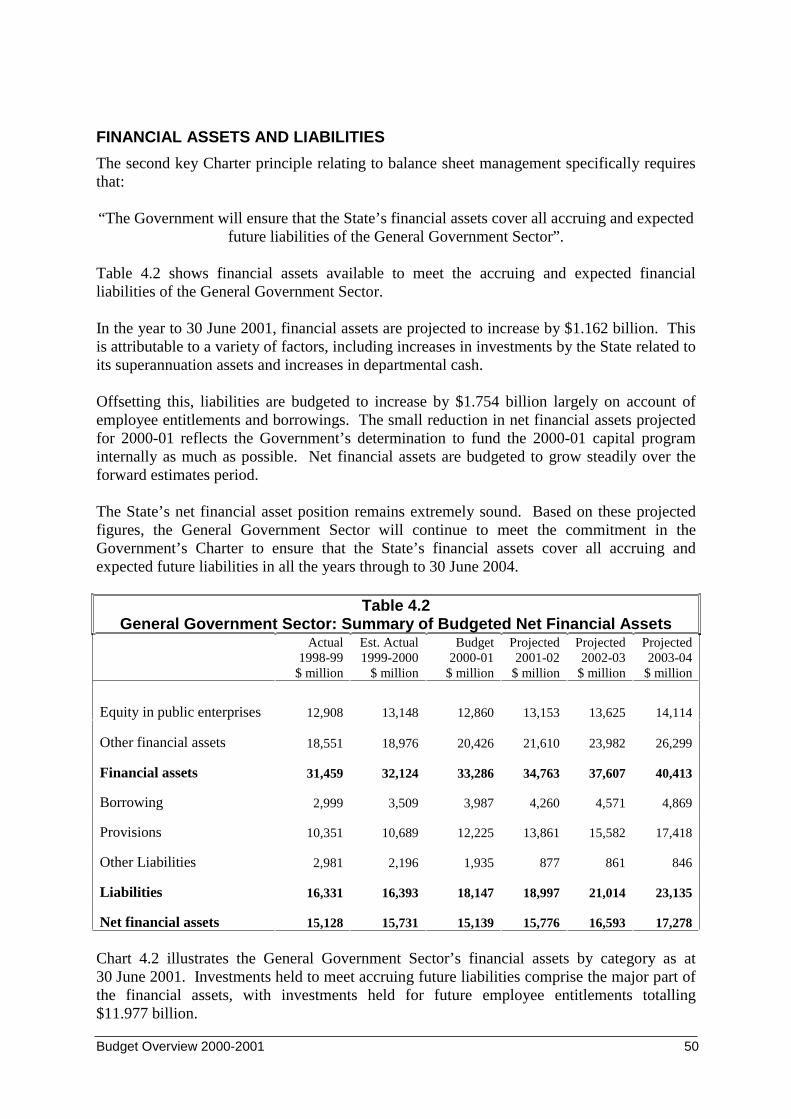
Budget Overview 2000-2001 50
FINANCIAL ASSETS AND LIABILITIES
The second key Charter principle relating to balance sheet management specifically requiresthat:
“The Government will ensure that the State’s financial assets cover all accruing and expectedfuture liabilities of the General Government Sector”.
Table 4.2 shows financial assets available to meet the accruing and expected financialliabilities of the General Government Sector.
In the year to 30 June 2001, financial assets are projected to increase by $1.162 billion. Thisis attributable to a variety of factors, including increases in investments by the State related toits superannuation assets and increases in departmental cash.
Offsetting this, liabilities are budgeted to increase by $1.754 billion largely on account ofemployee entitlements and borrowings. The small reduction in net financial assets projectedfor 2000-01 reflects the Government’s determination to fund the 2000-01 capital programinternally as much as possible. Net financial assets are budgeted to grow steadily over theforward estimates period.
The State’s net financial asset position remains extremely sound. Based on these projectedfigures, the General Government Sector will continue to meet the commitment in theGovernment’s Charter to ensure that the State’s financial assets cover all accruing andexpected future liabilities in all the years through to 30 June 2004.
Table 4.2General Government Sector: Summary of Budgeted Net Financial Assets
Actual1998-99
$ million
Est. Actual1999-2000
$ million
Budget2000-01
$ million
Projected2001-02
$ million
Projected2002-03
$ million
Projected2003-04
$ million
Equity in public enterprises 12,908 13,148 12,860 13,153 13,625 14,114
Other financial assets 18,551 18,976 20,426 21,610 23,982 26,299
Financial assets 31,459 32,124 33,286 34,763 37,607 40,413
Borrowing 2,999 3,509 3,987 4,260 4,571 4,869
Provisions 10,351 10,689 12,225 13,861 15,582 17,418
Other Liabilities 2,981 2,196 1,935 877 861 846
Liabilities 16,331 16,393 18,147 18,997 21,014 23,135
Net financial assets 15,128 15,731 15,139 15,776 16,593 17,278
Chart 4.2 illustrates the General Government Sector’s financial assets by category as at30 June 2001. Investments held to meet accruing future liabilities comprise the major part ofthe financial assets, with investments held for future employee entitlements totalling$11.977 billion.
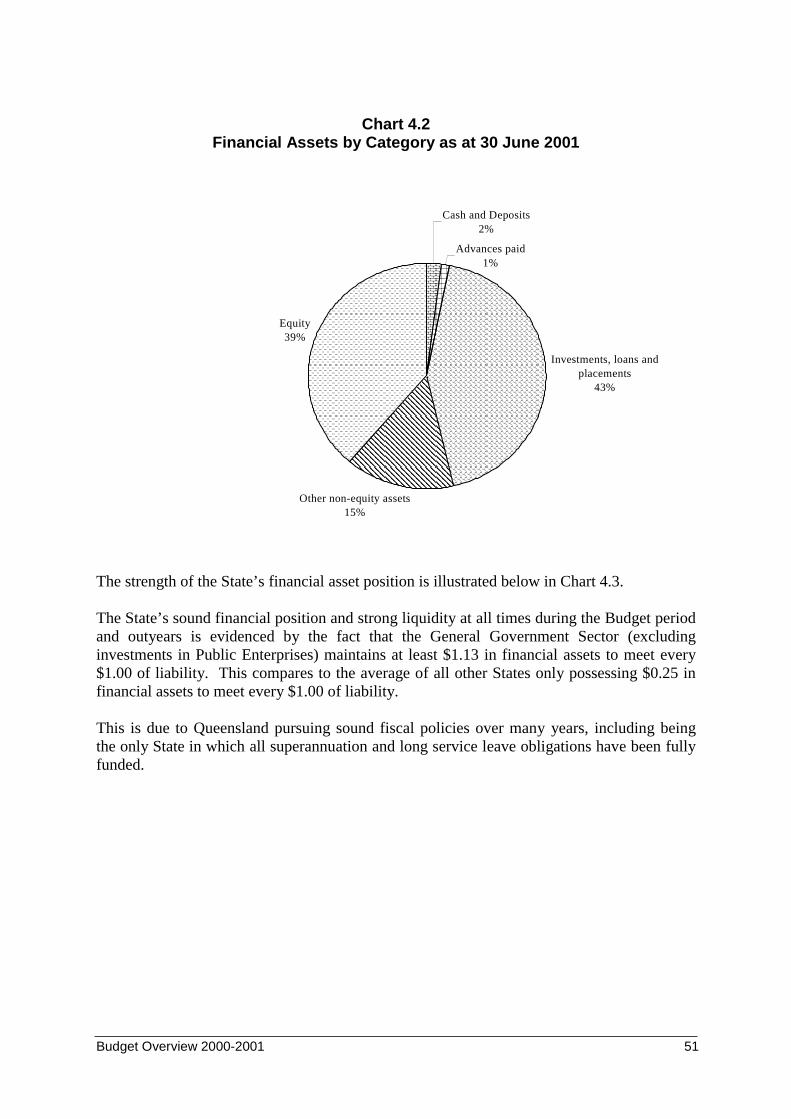
Budget Overview 2000-2001 51
Chart 4.2Financial Assets by Category as at 30 June 2001
Cash and Deposits2%
Advances paid1%
Investments, loans and placements
43%
Other non-equity assets15%
Equity39%
The strength of the State’s financial asset position is illustrated below in Chart 4.3.
The State’s sound financial position and strong liquidity at all times during the Budget periodand outyears is evidenced by the fact that the General Government Sector (excludinginvestments in Public Enterprises) maintains at least $1.13 in financial assets to meet every$1.00 of liability. This compares to the average of all other States only possessing $0.25 infinancial assets to meet every $1.00 of liability.
This is due to Queensland pursuing sound fiscal policies over many years, including beingthe only State in which all superannuation and long service leave obligations have been fullyfunded.
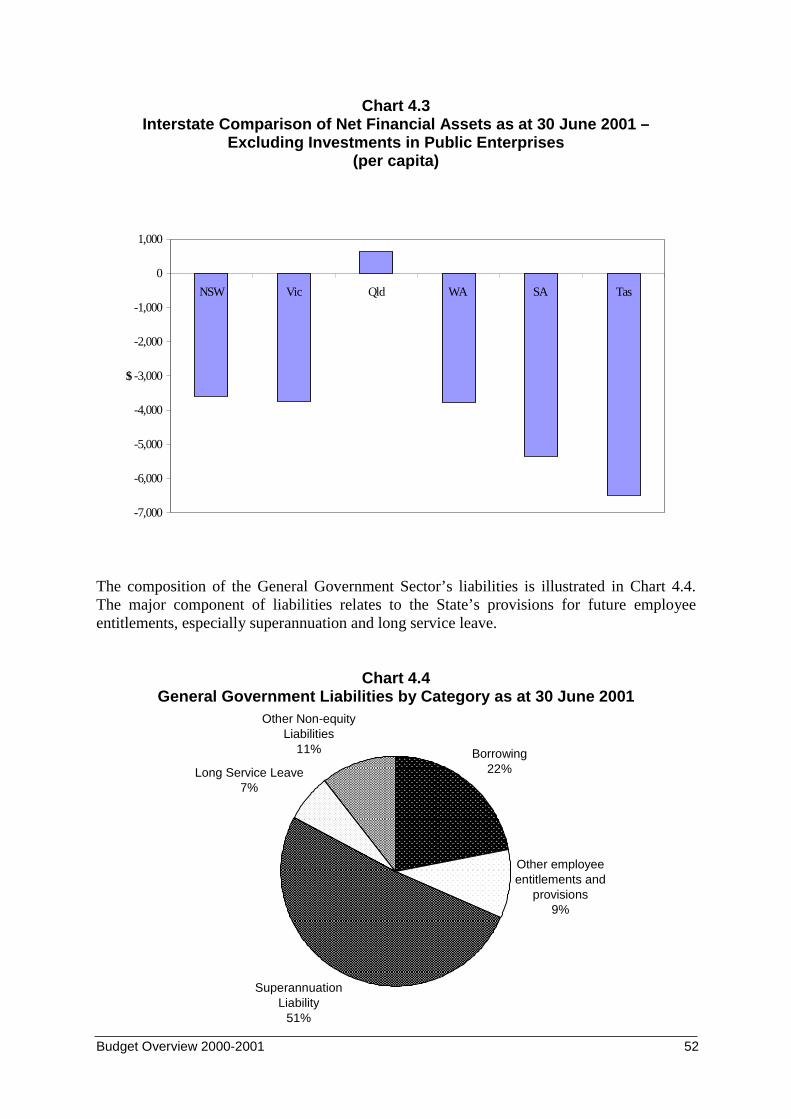
Budget Overview 2000-2001 52
Chart 4.3Interstate Comparison of Net Financial Assets as at 30 June 2001 –
Excluding Investments in Public Enterprises(per capita)
-7,000
-6,000
-5,000
-4,000
-3,000
-2,000
-1,000
0
1,000
NSW Vic Qld WA SA Tas
$
The composition of the General Government Sector’s liabilities is illustrated in Chart 4.4.The major component of liabilities relates to the State’s provisions for future employeeentitlements, especially superannuation and long service leave.
Chart 4.4General Government Liabilities by Category as at 30 June 2001
Borrowing22%Long Service Leave
7%
Other Non-equity Liabilities
11%
Superannuation Liability
51%
Other employee entitlements and
provisions9%
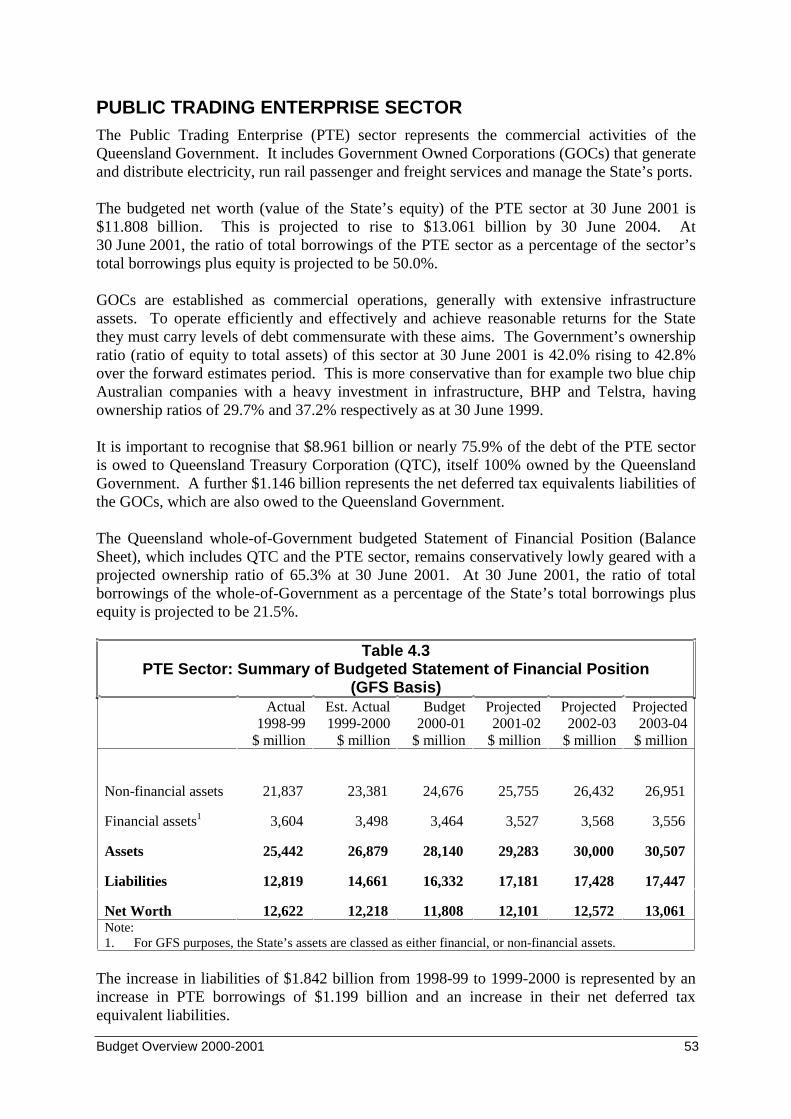
Budget Overview 2000-2001 53
PUBLIC TRADING ENTERPRISE SECTORThe Public Trading Enterprise (PTE) sector represents the commercial activities of theQueensland Government. It includes Government Owned Corporations (GOCs) that generateand distribute electricity, run rail passenger and freight services and manage the State’s ports.
The budgeted net worth (value of the State’s equity) of the PTE sector at 30 June 2001 is$11.808 billion. This is projected to rise to $13.061 billion by 30 June 2004. At30 June 2001, the ratio of total borrowings of the PTE sector as a percentage of the sector’stotal borrowings plus equity is projected to be 50.0%.
GOCs are established as commercial operations, generally with extensive infrastructureassets. To operate efficiently and effectively and achieve reasonable returns for the Statethey must carry levels of debt commensurate with these aims. The Government’s ownershipratio (ratio of equity to total assets) of this sector at 30 June 2001 is 42.0% rising to 42.8%over the forward estimates period. This is more conservative than for example two blue chipAustralian companies with a heavy investment in infrastructure, BHP and Telstra, havingownership ratios of 29.7% and 37.2% respectively as at 30 June 1999.
It is important to recognise that $8.961 billion or nearly 75.9% of the debt of the PTE sectoris owed to Queensland Treasury Corporation (QTC), itself 100% owned by the QueenslandGovernment. A further $1.146 billion represents the net deferred tax equivalents liabilities ofthe GOCs, which are also owed to the Queensland Government.
The Queensland whole-of-Government budgeted Statement of Financial Position (BalanceSheet), which includes QTC and the PTE sector, remains conservatively lowly geared with aprojected ownership ratio of 65.3% at 30 June 2001. At 30 June 2001, the ratio of totalborrowings of the whole-of-Government as a percentage of the State’s total borrowings plusequity is projected to be 21.5%.
Table 4.3PTE Sector: Summary of Budgeted Statement of Financial Position
(GFS Basis)Actual
1998-99$ million
Est. Actual1999-2000
$ million
Budget2000-01
$ million
Projected2001-02
$ million
Projected2002-03
$ million
Projected2003-04
$ million
Non-financial assets 21,837 23,381 24,676 25,755 26,432 26,951
Financial assets1 3,604 3,498 3,464 3,527 3,568 3,556
Assets 25,442 26,879 28,140 29,283 30,000 30,507
Liabilities 12,819 14,661 16,332 17,181 17,428 17,447
Net Worth 12,622 12,218 11,808 12,101 12,572 13,061Note:1. For GFS purposes, the State’s assets are classed as either financial, or non-financial assets.
The increase in liabilities of $1.842 billion from 1998-99 to 1999-2000 is represented by anincrease in PTE borrowings of $1.199 billion and an increase in their net deferred taxequivalent liabilities.
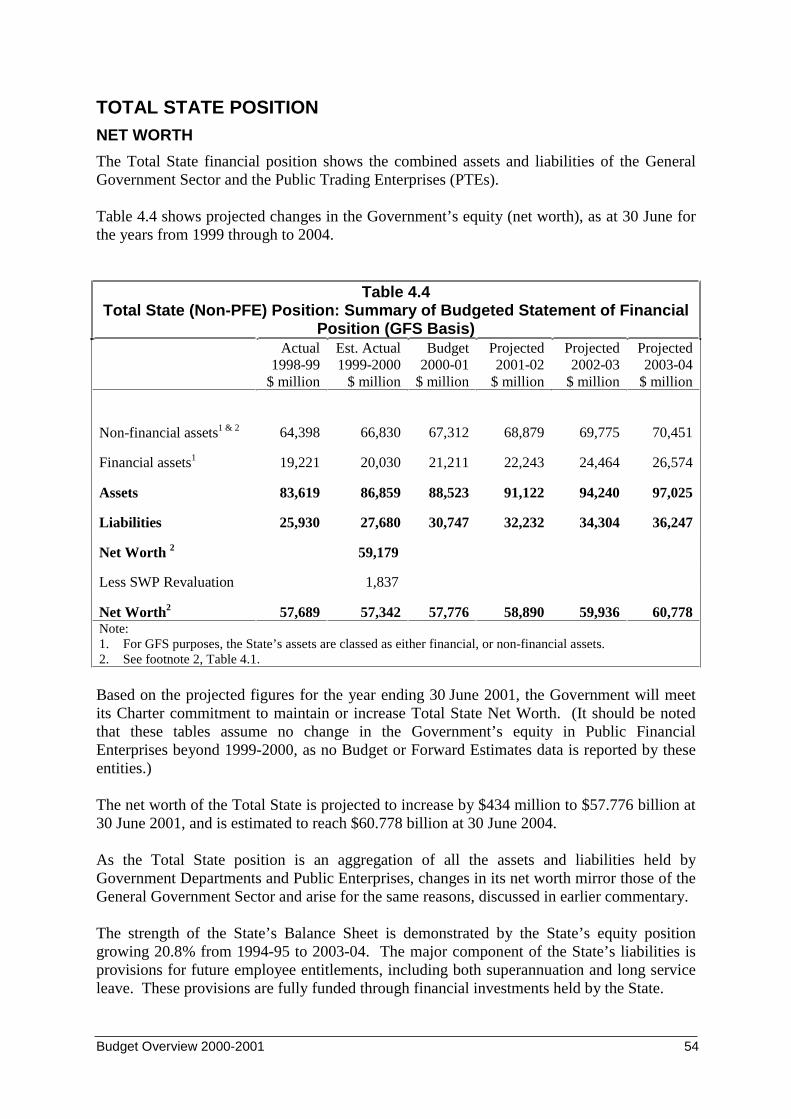
Budget Overview 2000-2001 54
TOTAL STATE POSITIONNET WORTH
The Total State financial position shows the combined assets and liabilities of the GeneralGovernment Sector and the Public Trading Enterprises (PTEs).
Table 4.4 shows projected changes in the Government’s equity (net worth), as at 30 June forthe years from 1999 through to 2004.
Table 4.4Total State (Non-PFE) Position: Summary of Budgeted Statement of Financial
Position (GFS Basis)Actual
1998-99$ million
Est. Actual1999-2000
$ million
Budget2000-01
$ million
Projected2001-02
$ million
Projected2002-03
$ million
Projected2003-04
$ million
Non-financial assets1 & 2 64,398 66,830 67,312 68,879 69,775 70,451
Financial assets1 19,221 20,030 21,211 22,243 24,464 26,574
Assets 83,619 86,859 88,523 91,122 94,240 97,025
Liabilities 25,930 27,680 30,747 32,232 34,304 36,247
Net Worth 2 59,179
Less SWP Revaluation 1,837
Net Worth2 57,689 57,342 57,776 58,890 59,936 60,778Note:1. For GFS purposes, the State’s assets are classed as either financial, or non-financial assets.2. See footnote 2, Table 4.1.
Based on the projected figures for the year ending 30 June 2001, the Government will meetits Charter commitment to maintain or increase Total State Net Worth. (It should be notedthat these tables assume no change in the Government’s equity in Public FinancialEnterprises beyond 1999-2000, as no Budget or Forward Estimates data is reported by theseentities.)
The net worth of the Total State is projected to increase by $434 million to $57.776 billion at30 June 2001, and is estimated to reach $60.778 billion at 30 June 2004.
As the Total State position is an aggregation of all the assets and liabilities held byGovernment Departments and Public Enterprises, changes in its net worth mirror those of theGeneral Government Sector and arise for the same reasons, discussed in earlier commentary.
The strength of the State’s Balance Sheet is demonstrated by the State’s equity positiongrowing 20.8% from 1994-95 to 2003-04. The major component of the State’s liabilities isprovisions for future employee entitlements, including both superannuation and long serviceleave. These provisions are fully funded through financial investments held by the State.
Budget Overview 2000-2001 55
5. STATEMENT OF CASH FLOWS
KEY POINTS
• The General Government sector is estimated to record a cash surplus of $330 million in2000-01, following an estimated underlying cash surplus of $18 million in 1999-2000.
• The General Government sector is estimated to record a surplus of $2.554 billion fromoperating activities, more than sufficient to fund an estimated $2.224 billion in investmentin non-financial assets.
• The General Government sector investment in financial assets of $1.040 billion in2000-01 largely reflects the re-investment of contributions and earnings to be set aside tofinance the Government’s superannuation employee entitlements liability.
INTRODUCTIONThe cash flow statement provides information on the Government’s estimated cash flowsfrom its operating, financing and investing activities. In particular, the GFS cash flowstatement provides information on the type of financing and investing activity undertaken bythe Government and also provides the GFS cash surplus (deficit) measure.
Detailed cash flow tables on a GFS basis are included in Appendix A.
BACKGROUNDGFS data is conceptually different from the General Purpose Financial Reports included inAppendix B. A discussion of these differences is included in Appendix D.
The cash flow statement records estimated cash receipts and disbursements associated withthe Government’s operating, investing and financing activities. The cash flows reflect theactual payment and receipt of cash and hence differ from accrual revenue and expensesrecorded in the operating statement. In particular, the operating statement often recordsrevenues and expenses that do not have an associated cash flow (for example, depreciationexpense). Also, the timing of recognition of the accrual revenue or expense in the operatingstatement may differ from the actual cash disbursement or receipt (for example, taxequivalents).
The cash flow statement also records cash flows associated with investing and financingactivity that is otherwise reflected in the balance sheet. For example, purchases of capitalequipment are recorded in the cash flow statement and impact on the balance sheet throughan increase in physical assets. A detailed reconciliation between the cash flows fromoperations and the operating statement is provided later in this chapter.
The cash flow statement therefore provides useful information on the cash flow position ofthe Government, particularly from the perspective of cash and asset management.
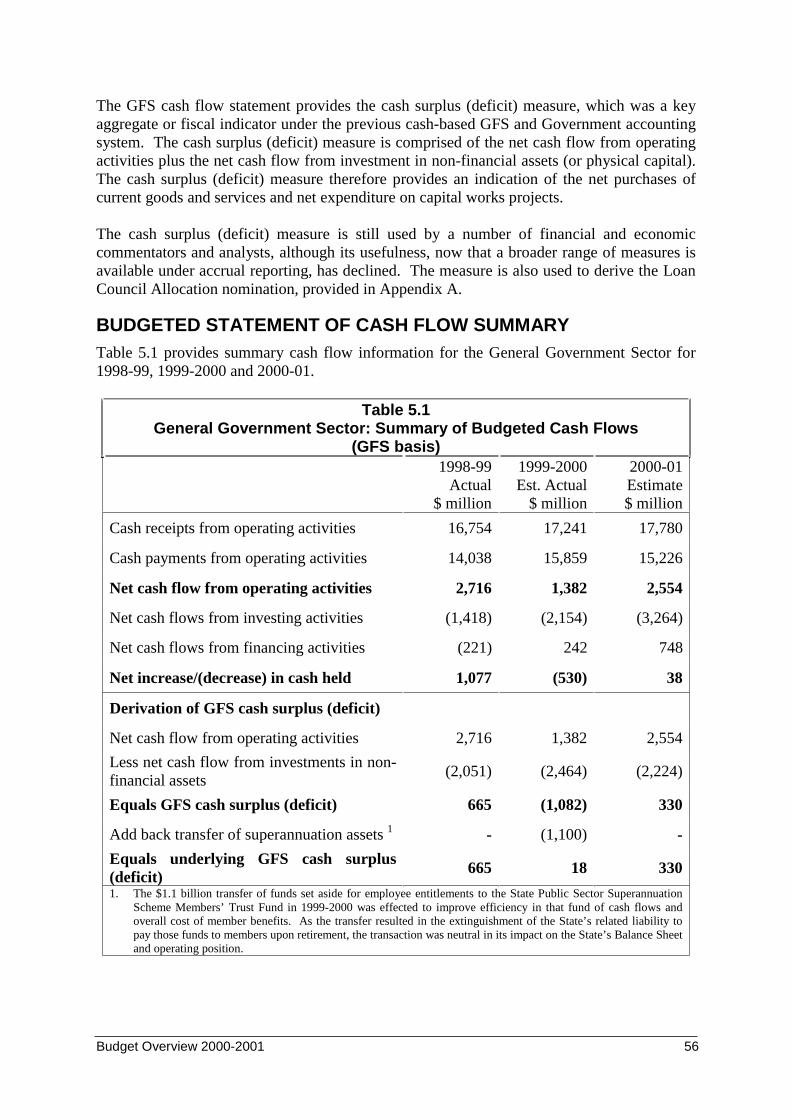
Budget Overview 2000-2001 56
The GFS cash flow statement provides the cash surplus (deficit) measure, which was a keyaggregate or fiscal indicator under the previous cash-based GFS and Government accountingsystem. The cash surplus (deficit) measure is comprised of the net cash flow from operatingactivities plus the net cash flow from investment in non-financial assets (or physical capital).The cash surplus (deficit) measure therefore provides an indication of the net purchases ofcurrent goods and services and net expenditure on capital works projects.
The cash surplus (deficit) measure is still used by a number of financial and economiccommentators and analysts, although its usefulness, now that a broader range of measures isavailable under accrual reporting, has declined. The measure is also used to derive the LoanCouncil Allocation nomination, provided in Appendix A.
BUDGETED STATEMENT OF CASH FLOW SUMMARYTable 5.1 provides summary cash flow information for the General Government Sector for1998-99, 1999-2000 and 2000-01.
Table 5.1General Government Sector: Summary of Budgeted Cash Flows
(GFS basis)1998-99
Actual$ million
1999-2000Est. Actual
$ million
2000-01Estimate$ million
Cash receipts from operating activities 16,754 17,241 17,780
Cash payments from operating activities 14,038 15,859 15,226
Net cash flow from operating activities 2,716 1,382 2,554
Net cash flows from investing activities (1,418) (2,154) (3,264)
Net cash flows from financing activities (221) 242 748
Net increase/(decrease) in cash held 1,077 (530) 38
Derivation of GFS cash surplus (deficit)
Net cash flow from operating activities 2,716 1,382 2,554
Less net cash flow from investments in non-financial assets
(2,051) (2,464) (2,224)
Equals GFS cash surplus (deficit) 665 (1,082) 330
Add back transfer of superannuation assets 1 - (1,100) -
Equals underlying GFS cash surplus(deficit)
665 18 330
1. The $1.1 billion transfer of funds set aside for employee entitlements to the State Public Sector SuperannuationScheme Members’ Trust Fund in 1999-2000 was effected to improve efficiency in that fund of cash flows andoverall cost of member benefits. As the transfer resulted in the extinguishment of the State’s related liability topay those funds to members upon retirement, the transaction was neutral in its impact on the State’s Balance Sheetand operating position.
Budget Overview 2000-2001 57
The GFS cash surplus of $330 million in 2000-01 represents a significant improvement onthe estimated underlying cash surplus of $18 million for 1999-2000, which adjusts for thetransfer of superannuation assets from the Government’s consolidated fund to an employeesuperannuation fund. Under GFS this transfer is treated as an employee expenditure;however, it merely represents a transfer of previously accrued assets and the associatedliability. Under the Australian Loan Council’s Loan Council Reporting framework, the cashflow associated with the transfer of assets is being treated as a negative memorandum item,which means that the transfer will not count towards Queensland’s LCA position. For moreinformation on the LCA, see Appendix A.
CASH FLOWS FROM OPERATING ACTIVITESCash flows from operating activities incorporate cash receipts and disbursements for theGovernment’s current operating transactions.
Cash inflows from operating activities include receipts from taxes, grants from theCommonwealth Government, fees and charges levied on the provision of goods and services,interest receipts from investments and dividend and tax receipts from Government ownedtrading enterprises. The largest source of cash receipts is from Commonwealth grants, whichare now in the form of GST payments, which account for 49.0% of total cash receipts in2000-01.
Taxes received by the General Government sector are forecast to decrease by 16.0% to$4.189 billion in 2000-01. This is mainly due to the reduction in the State’s taxation basewith the introduction of the GST and the impact of changes in recording the safety net grants.
Grants and subsidies receipts are expected to increase by 25.5% in 2000-01 to $8.729 billion.This reflects the introduction of GST payments from the Commonwealth and the impact ofthe recording of grant receipts under the GFS basis. Prior to 2000-01, in GFS, cash receiptsfrom the Commonwealth representing the safety net payments for the previous businessfranchise fees (fuel, liquor and tobacco) were recorded as tax receipts. Under the GSTarrangements the safety net payments cease, but are implicitly included in the grants receivedfrom the Commonwealth. Removing this distortion from the cash flow reveals that cashgrants will increase 5.2% in 2000-01.
Other receipts include investment earnings, dividends and tax equivalents received fromGOCs and royalties. Other receipts are expected to decrease in 2000-01 by 11.1% to$2.983 billion, largely reflecting lower forecast investment earnings.
Cash outflows represent payment for supplies and services, wages and salaries, finance costsand grants and subsidies paid to households, businesses and other Government agencies. Thelargest cash disbursement is employee expenses at $6.979 billion.
The 2000-01 estimate for payments for goods and services, which includes wages andsalaries, is expected to decline 7.5% to $11.019 billion, reflecting the transfer ofsuperannuation assets in 1999-2000 which is recorded in GFS as an employee expense.Adjusting for this one-off transfer, payments for goods and services are estimated to increase1.9% in 2000-01, reflecting underlying estimated growth in wages and expenditure on othergoods and services.
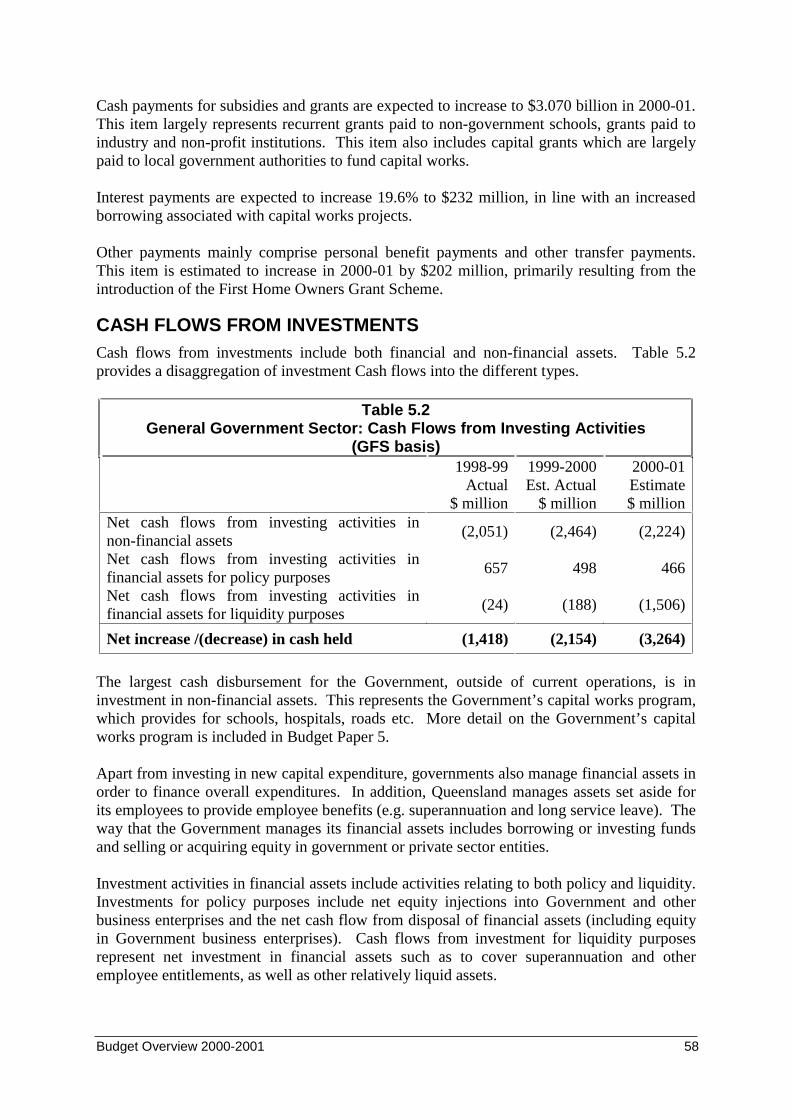
Budget Overview 2000-2001 58
Cash payments for subsidies and grants are expected to increase to $3.070 billion in 2000-01.This item largely represents recurrent grants paid to non-government schools, grants paid toindustry and non-profit institutions. This item also includes capital grants which are largelypaid to local government authorities to fund capital works.
Interest payments are expected to increase 19.6% to $232 million, in line with an increasedborrowing associated with capital works projects.
Other payments mainly comprise personal benefit payments and other transfer payments.This item is estimated to increase in 2000-01 by $202 million, primarily resulting from theintroduction of the First Home Owners Grant Scheme.
CASH FLOWS FROM INVESTMENTSCash flows from investments include both financial and non-financial assets. Table 5.2provides a disaggregation of investment Cash flows into the different types.
Table 5.2General Government Sector: Cash Flows from Investing Activities
(GFS basis)1998-99
Actual$ million
1999-2000Est. Actual
$ million
2000-01Estimate$ million
Net cash flows from investing activities innon-financial assets
(2,051) (2,464) (2,224)
Net cash flows from investing activities infinancial assets for policy purposes
657 498 466
Net cash flows from investing activities infinancial assets for liquidity purposes
(24) (188) (1,506)
Net increase /(decrease) in cash held (1,418) (2,154) (3,264)
The largest cash disbursement for the Government, outside of current operations, is ininvestment in non-financial assets. This represents the Government’s capital works program,which provides for schools, hospitals, roads etc. More detail on the Government’s capitalworks program is included in Budget Paper 5.
Apart from investing in new capital expenditure, governments also manage financial assets inorder to finance overall expenditures. In addition, Queensland manages assets set aside forits employees to provide employee benefits (e.g. superannuation and long service leave). Theway that the Government manages its financial assets includes borrowing or investing fundsand selling or acquiring equity in government or private sector entities.
Investment activities in financial assets include activities relating to both policy and liquidity.Investments for policy purposes include net equity injections into Government and otherbusiness enterprises and the net cash flow from disposal of financial assets (including equityin Government business enterprises). Cash flows from investment for liquidity purposesrepresent net investment in financial assets such as to cover superannuation and otheremployee entitlements, as well as other relatively liquid assets.
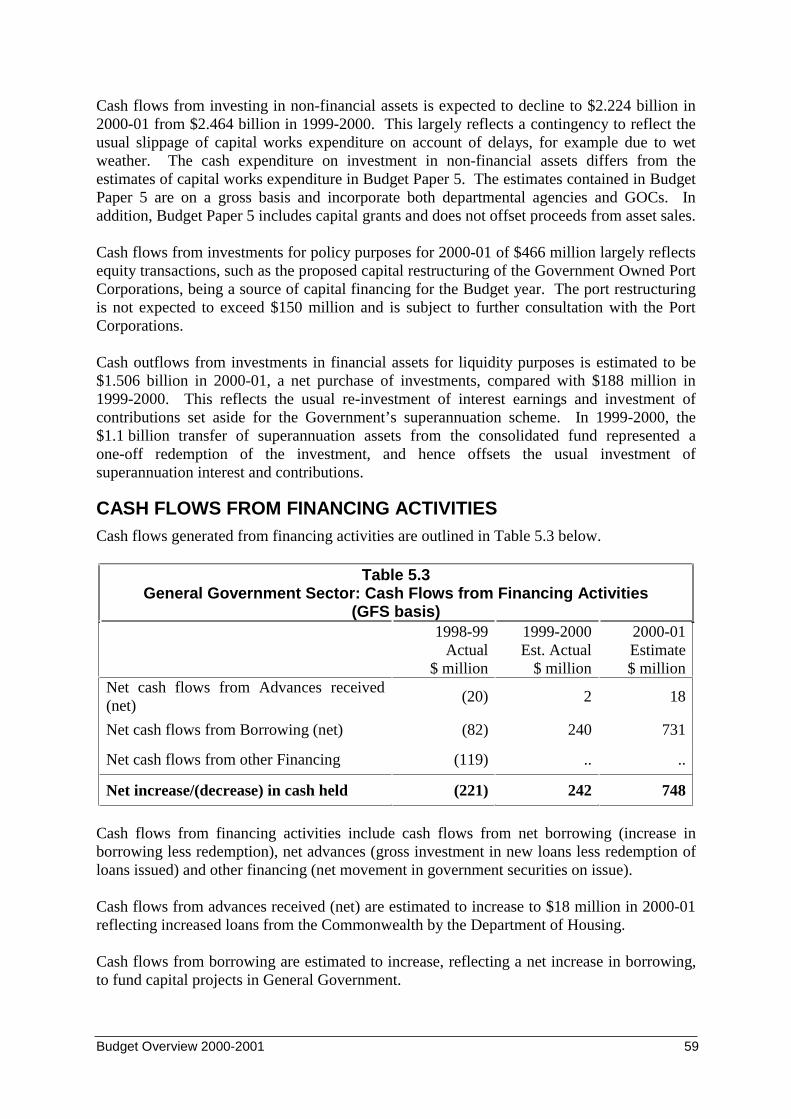
Budget Overview 2000-2001 59
Cash flows from investing in non-financial assets is expected to decline to $2.224 billion in2000-01 from $2.464 billion in 1999-2000. This largely reflects a contingency to reflect theusual slippage of capital works expenditure on account of delays, for example due to wetweather. The cash expenditure on investment in non-financial assets differs from theestimates of capital works expenditure in Budget Paper 5. The estimates contained in BudgetPaper 5 are on a gross basis and incorporate both departmental agencies and GOCs. Inaddition, Budget Paper 5 includes capital grants and does not offset proceeds from asset sales.
Cash flows from investments for policy purposes for 2000-01 of $466 million largely reflectsequity transactions, such as the proposed capital restructuring of the Government Owned PortCorporations, being a source of capital financing for the Budget year. The port restructuringis not expected to exceed $150 million and is subject to further consultation with the PortCorporations.
Cash outflows from investments in financial assets for liquidity purposes is estimated to be$1.506 billion in 2000-01, a net purchase of investments, compared with $188 million in1999-2000. This reflects the usual re-investment of interest earnings and investment ofcontributions set aside for the Government’s superannuation scheme. In 1999-2000, the$1.1 billion transfer of superannuation assets from the consolidated fund represented aone-off redemption of the investment, and hence offsets the usual investment ofsuperannuation interest and contributions.
CASH FLOWS FROM FINANCING ACTIVITIESCash flows generated from financing activities are outlined in Table 5.3 below.
Table 5.3General Government Sector: Cash Flows from Financing Activities
(GFS basis)1998-99
Actual$ million
1999-2000Est. Actual
$ million
2000-01Estimate$ million
Net cash flows from Advances received(net)
(20) 2 18
Net cash flows from Borrowing (net) (82) 240 731
Net cash flows from other Financing (119) .. ..
Net increase/(decrease) in cash held (221) 242 748
Cash flows from financing activities include cash flows from net borrowing (increase inborrowing less redemption), net advances (gross investment in new loans less redemption ofloans issued) and other financing (net movement in government securities on issue).
Cash flows from advances received (net) are estimated to increase to $18 million in 2000-01reflecting increased loans from the Commonwealth by the Department of Housing.
Cash flows from borrowing are estimated to increase, reflecting a net increase in borrowing,to fund capital projects in General Government.
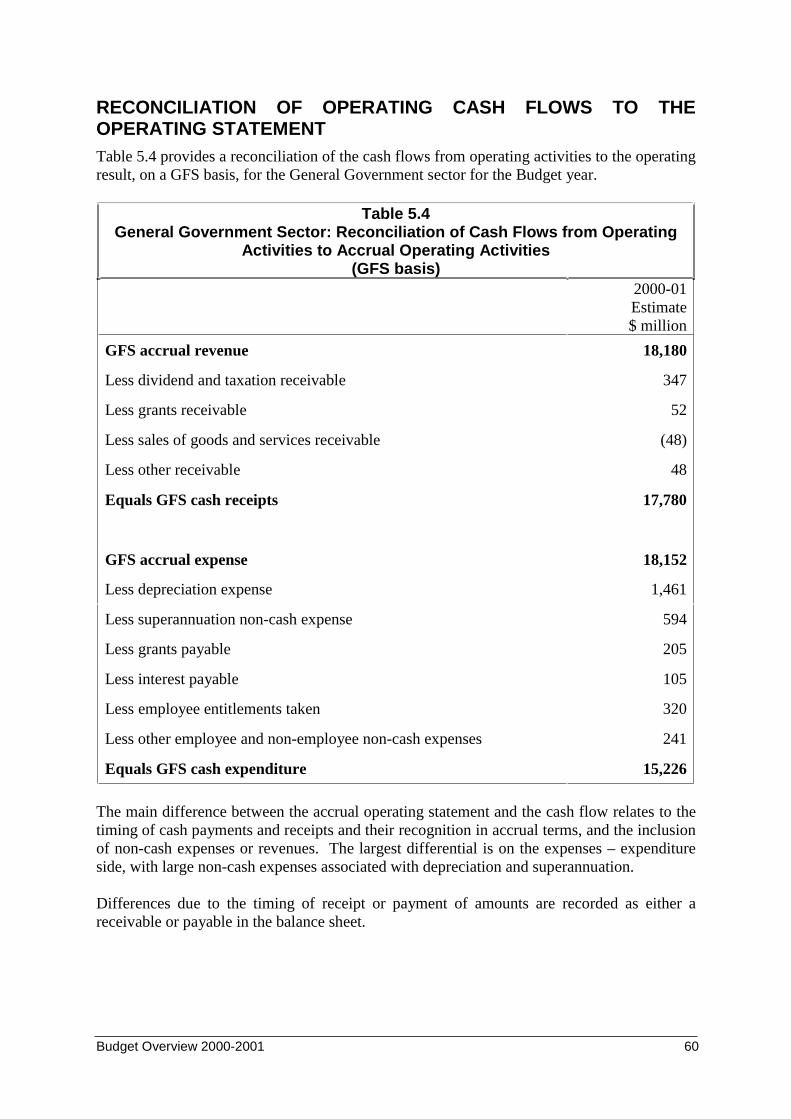
Budget Overview 2000-2001 60
RECONCILIATION OF OPERATING CASH FLOWS TO THEOPERATING STATEMENTTable 5.4 provides a reconciliation of the cash flows from operating activities to the operatingresult, on a GFS basis, for the General Government sector for the Budget year.
Table 5.4General Government Sector: Reconciliation of Cash Flows from Operating
Activities to Accrual Operating Activities(GFS basis)
2000-01Estimate$ million
GFS accrual revenue 18,180
Less dividend and taxation receivable 347
Less grants receivable 52
Less sales of goods and services receivable (48)
Less other receivable 48
Equals GFS cash receipts 17,780
GFS accrual expense 18,152
Less depreciation expense 1,461
Less superannuation non-cash expense 594
Less grants payable 205
Less interest payable 105
Less employee entitlements taken 320
Less other employee and non-employee non-cash expenses 241
Equals GFS cash expenditure 15,226
The main difference between the accrual operating statement and the cash flow relates to thetiming of cash payments and receipts and their recognition in accrual terms, and the inclusionof non-cash expenses or revenues. The largest differential is on the expenses – expenditureside, with large non-cash expenses associated with depreciation and superannuation.
Differences due to the timing of receipt or payment of amounts are recorded as either areceivable or payable in the balance sheet.
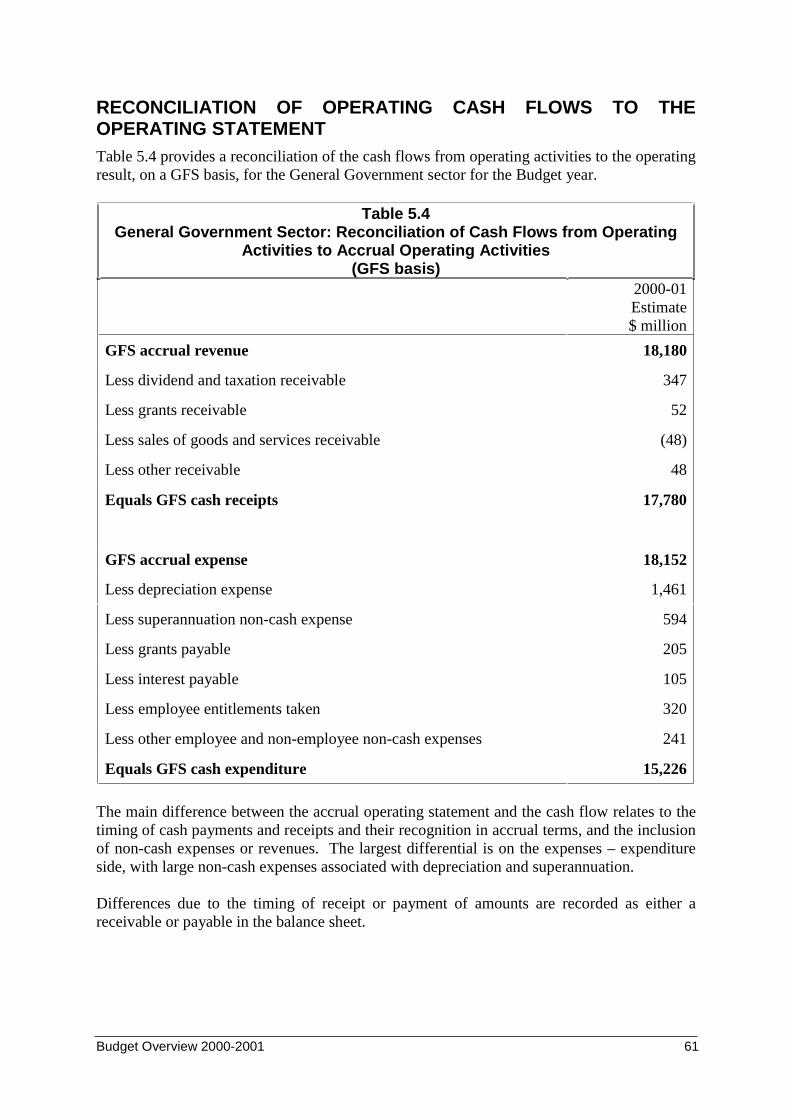
Budget Overview 2000-2001 61
RECONCILIATION OF OPERATING CASH FLOWS TO THEOPERATING STATEMENTTable 5.4 provides a reconciliation of the cash flows from operating activities to the operatingresult, on a GFS basis, for the General Government sector for the Budget year.
Table 5.4General Government Sector: Reconciliation of Cash Flows from Operating
Activities to Accrual Operating Activities(GFS basis)
2000-01Estimate$ million
GFS accrual revenue 18,180
Less dividend and taxation receivable 347
Less grants receivable 52
Less sales of goods and services receivable (48)
Less other receivable 48
Equals GFS cash receipts 17,780
GFS accrual expense 18,152
Less depreciation expense 1,461
Less superannuation non-cash expense 594
Less grants payable 205
Less interest payable 105
Less employee entitlements taken 320
Less other employee and non-employee non-cash expenses 241
Equals GFS cash expenditure 15,226
The main difference between the accrual operating statement and the cash flow relates to thetiming of cash payments and receipts and their recognition in accrual terms, and the inclusionof non-cash expenses or revenues. The largest differential is on the expenses – expenditureside, with large non-cash expenses associated with depreciation and superannuation.
Differences due to the timing of receipt or payment of amounts are recorded as either areceivable or payable in the balance sheet.
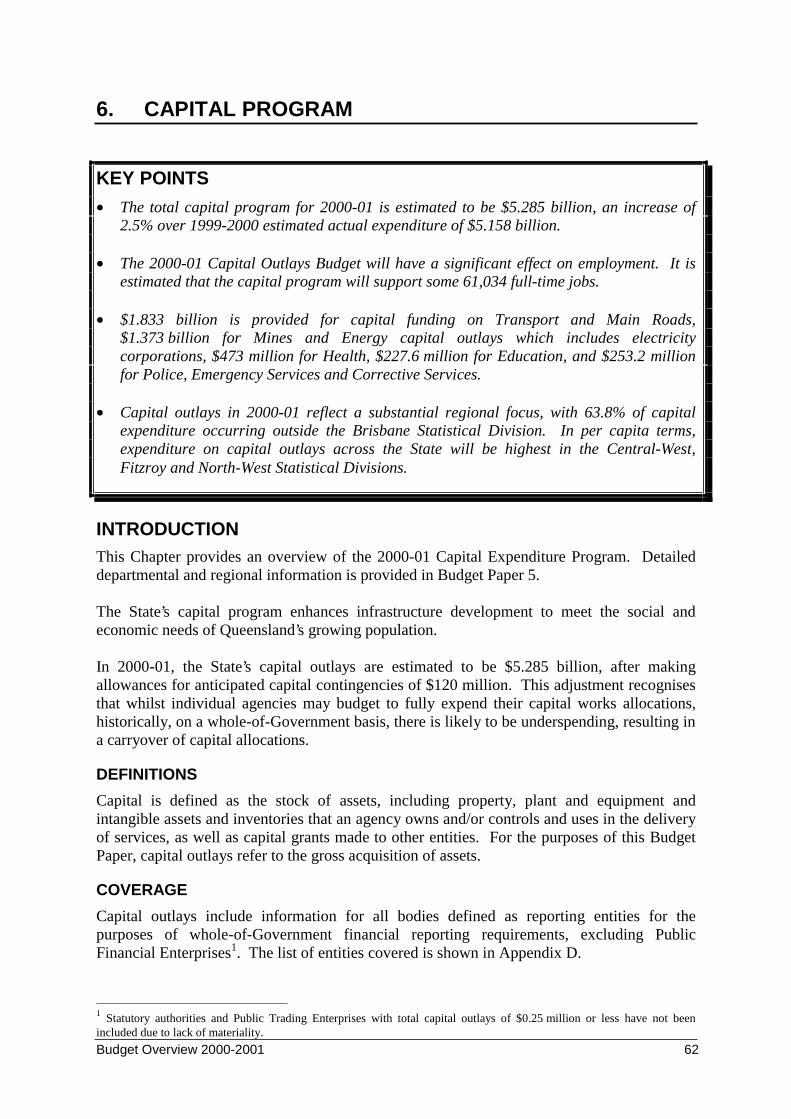
Budget Overview 2000-2001 62
6. CAPITAL PROGRAM
KEY POINTS
• The total capital program for 2000-01 is estimated to be $5.285 billion, an increase of2.5% over 1999-2000 estimated actual expenditure of $5.158 billion.
• The 2000-01 Capital Outlays Budget will have a significant effect on employment. It isestimated that the capital program will support some 61,034 full-time jobs.
• $1.833 billion is provided for capital funding on Transport and Main Roads,$1.373 billion for Mines and Energy capital outlays which includes electricitycorporations, $473 million for Health, $227.6 million for Education, and $253.2 millionfor Police, Emergency Services and Corrective Services.
• Capital outlays in 2000-01 reflect a substantial regional focus, with 63.8% of capitalexpenditure occurring outside the Brisbane Statistical Division. In per capita terms,expenditure on capital outlays across the State will be highest in the Central-West,Fitzroy and North-West Statistical Divisions.
INTRODUCTIONThis Chapter provides an overview of the 2000-01 Capital Expenditure Program. Detaileddepartmental and regional information is provided in Budget Paper 5.
The State’s capital program enhances infrastructure development to meet the social andeconomic needs of Queensland’s growing population.
In 2000-01, the State’s capital outlays are estimated to be $5.285 billion, after makingallowances for anticipated capital contingencies of $120 million. This adjustment recognisesthat whilst individual agencies may budget to fully expend their capital works allocations,historically, on a whole-of-Government basis, there is likely to be underspending, resulting ina carryover of capital allocations.
DEFINITIONS
Capital is defined as the stock of assets, including property, plant and equipment andintangible assets and inventories that an agency owns and/or controls and uses in the deliveryof services, as well as capital grants made to other entities. For the purposes of this BudgetPaper, capital outlays refer to the gross acquisition of assets.
COVERAGE
Capital outlays include information for all bodies defined as reporting entities for thepurposes of whole-of-Government financial reporting requirements, excluding PublicFinancial Enterprises1. The list of entities covered is shown in Appendix D.
1 Statutory authorities and Public Trading Enterprises with total capital outlays of $0.25 million or less have not beenincluded due to lack of materiality.
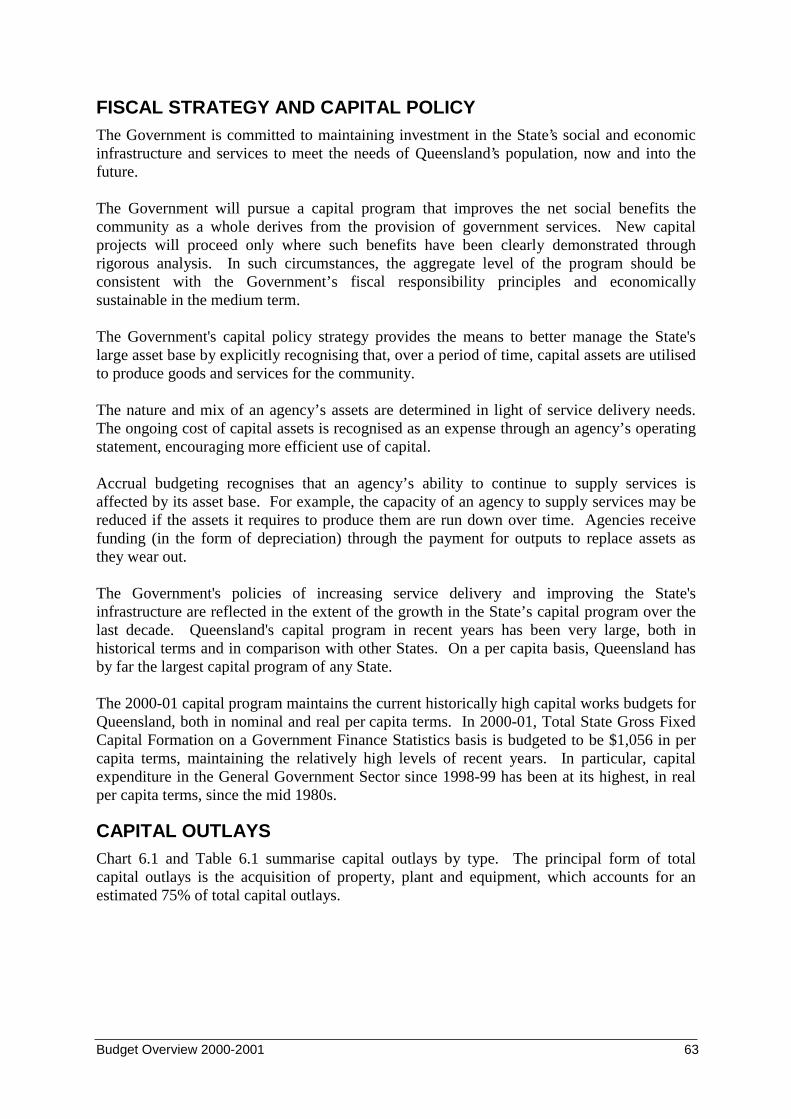
Budget Overview 2000-2001 63
FISCAL STRATEGY AND CAPITAL POLICYThe Government is committed to maintaining investment in the State’s social and economicinfrastructure and services to meet the needs of Queensland’s population, now and into thefuture.
The Government will pursue a capital program that improves the net social benefits thecommunity as a whole derives from the provision of government services. New capitalprojects will proceed only where such benefits have been clearly demonstrated throughrigorous analysis. In such circumstances, the aggregate level of the program should beconsistent with the Government’s fiscal responsibility principles and economicallysustainable in the medium term.
The Government's capital policy strategy provides the means to better manage the State'slarge asset base by explicitly recognising that, over a period of time, capital assets are utilisedto produce goods and services for the community.
The nature and mix of an agency’s assets are determined in light of service delivery needs.The ongoing cost of capital assets is recognised as an expense through an agency’s operatingstatement, encouraging more efficient use of capital.
Accrual budgeting recognises that an agency’s ability to continue to supply services isaffected by its asset base. For example, the capacity of an agency to supply services may bereduced if the assets it requires to produce them are run down over time. Agencies receivefunding (in the form of depreciation) through the payment for outputs to replace assets asthey wear out.
The Government's policies of increasing service delivery and improving the State'sinfrastructure are reflected in the extent of the growth in the State’s capital program over thelast decade. Queensland's capital program in recent years has been very large, both inhistorical terms and in comparison with other States. On a per capita basis, Queensland hasby far the largest capital program of any State.
The 2000-01 capital program maintains the current historically high capital works budgets forQueensland, both in nominal and real per capita terms. In 2000-01, Total State Gross FixedCapital Formation on a Government Finance Statistics basis is budgeted to be $1,056 in percapita terms, maintaining the relatively high levels of recent years. In particular, capitalexpenditure in the General Government Sector since 1998-99 has been at its highest, in realper capita terms, since the mid 1980s.
CAPITAL OUTLAYSChart 6.1 and Table 6.1 summarise capital outlays by type. The principal form of totalcapital outlays is the acquisition of property, plant and equipment, which accounts for anestimated 75% of total capital outlays.
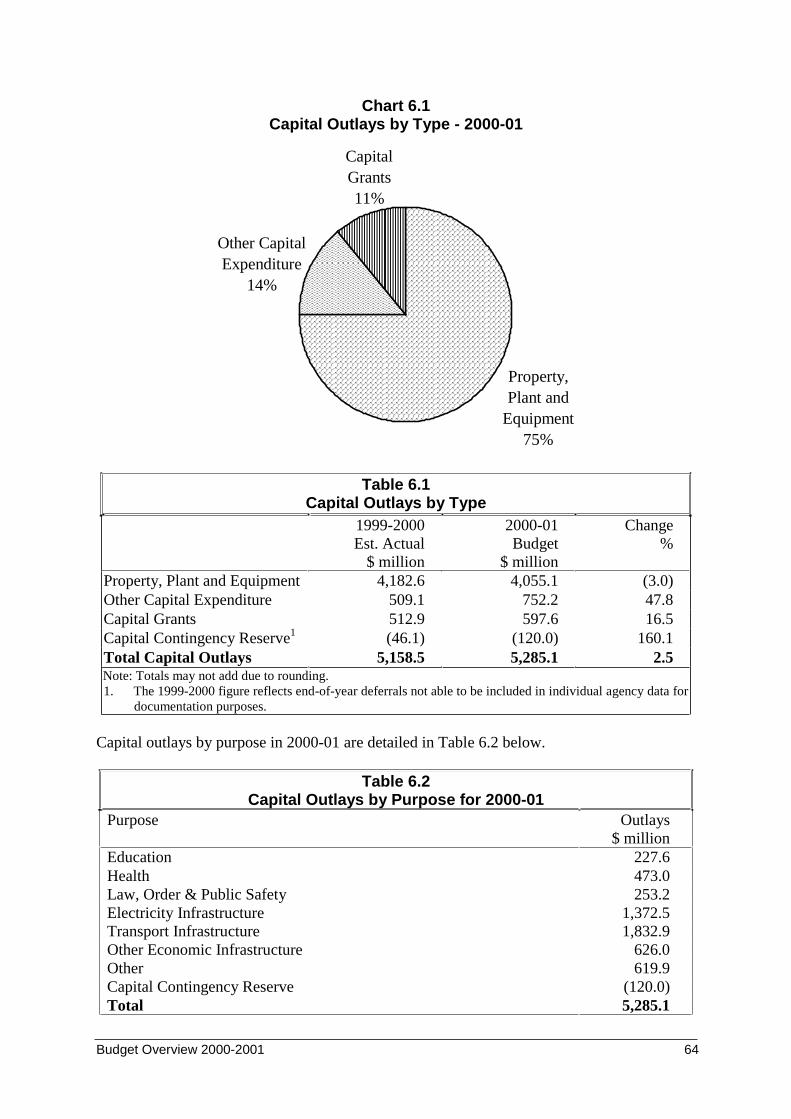
Budget Overview 2000-2001 64
Chart 6.1Capital Outlays by Type - 2000-01
Other Capital Expenditure
14%
Property, Plant and
Equipment75%
Capital Grants11%
Table 6.1Capital Outlays by Type
1999-2000Est. Actual
$ million
2000-01Budget
$ million
Change%
Property, Plant and Equipment 4,182.6 4,055.1 (3.0)Other Capital Expenditure 509.1 752.2 47.8Capital Grants 512.9 597.6 16.5Capital Contingency Reserve1 (46.1) (120.0) 160.1Total Capital Outlays 5,158.5 5,285.1 2.5Note: Totals may not add due to rounding.1. The 1999-2000 figure reflects end-of-year deferrals not able to be included in individual agency data for
documentation purposes.
Capital outlays by purpose in 2000-01 are detailed in Table 6.2 below.
Table 6.2Capital Outlays by Purpose for 2000-01
Purpose Outlays$ million
Education 227.6Health 473.0Law, Order & Public Safety 253.2Electricity Infrastructure 1,372.5Transport Infrastructure 1,832.9Other Economic Infrastructure 626.0Other 619.9Capital Contingency Reserve (120.0)Total 5,285.1
Budget Overview 2000-2001 65
Capital outlays by Region in 2000-01 are estimated in Table 6.3 below. Around 63.8% ofexpenditure will occur outside the Brisbane Statistical Division. As shown in more detail inBudget Paper 5, per capita expenditure is highest in non-metropolitan areas, including theCentral-West, Fitzroy, North-West and South-West Statistical Divisions.
Table 6.3Capital Outlays by Region for 2000-01
Region Outlays$ million
Outlays per capita$
Brisbane 1,958.9 1,223Moreton 946.9 1,401Wide Bay-Burnett 430.0 1,845Darling Downs and South-West 298.9 1,316Fitzroy and Central-West 622.2 3,216Mackay and Northern 602.6 1,864Far North and North-West 545.6 2,114Capital Contingency Reserve (120.0) n.a.Total 5,285.1 1,539
FUNDING
Under Managing for Outcomes, there is no specific appropriation for capital. Instead,responsibility for capital management has been devolved to agencies, which must developCapital Investment Plans that include sources of funding for assets. Funding sources caninclude equity injections from the Government as owner (where considered appropriate),output funding provided to cover the consumption of capital (depreciation and amortisation),asset sales, borrowings, retained earnings and own sourced revenue.
Chart 6.2 and Table 6.4 detail the composition of capital outlays for Property, Plant andEquipment and Other Capital Expenditure by sources of funding. In 2000-01, 9% of grosscapital outlays for these categories will be funded from equity contributions by the State,while provisions for depreciation will fund some 53%.
Under accrual output budgeting, agencies are required to raise a periodic depreciationexpense to recognise that certain non-current assets have a limited life span. Agencies areable to utilise the funds provided in this manner as a source of capital funding.
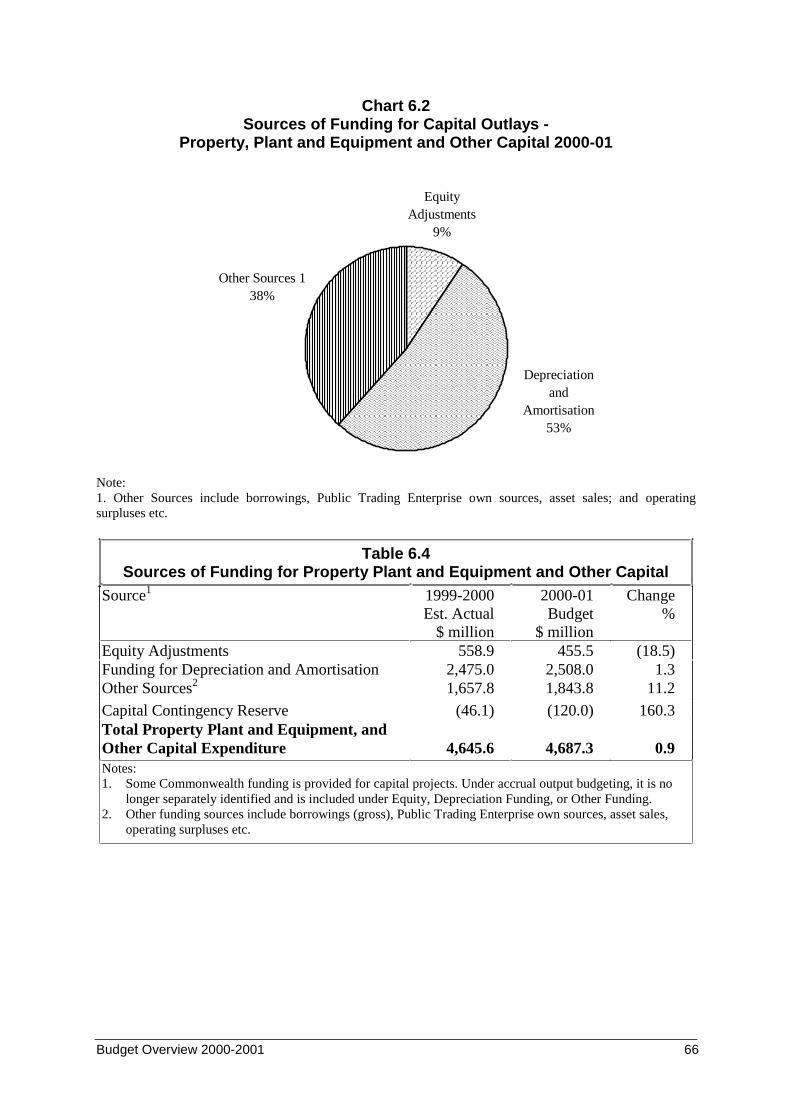
Budget Overview 2000-2001 66
Chart 6.2Sources of Funding for Capital Outlays -
Property, Plant and Equipment and Other Capital 2000-01
Depreciation and
Amortisation53%
Equity Adjustments
9%
Other Sources 138%
Note:1. Other Sources include borrowings, Public Trading Enterprise own sources, asset sales; and operatingsurpluses etc.
Table 6.4Sources of Funding for Property Plant and Equipment and Other Capital
Source1 1999-2000Est. Actual
$ million
2000-01Budget
$ million
Change%
Equity Adjustments 558.9 455.5 (18.5)Funding for Depreciation and Amortisation 2,475.0 2,508.0 1.3Other Sources2 1,657.8 1,843.8 11.2
Capital Contingency Reserve (46.1) (120.0) 160.3Total Property Plant and Equipment, andOther Capital Expenditure 4,645.6 4,687.3 0.9Notes:1. Some Commonwealth funding is provided for capital projects. Under accrual output budgeting, it is no
longer separately identified and is included under Equity, Depreciation Funding, or Other Funding.2. Other funding sources include borrowings (gross), Public Trading Enterprise own sources, asset sales,
operating surpluses etc.
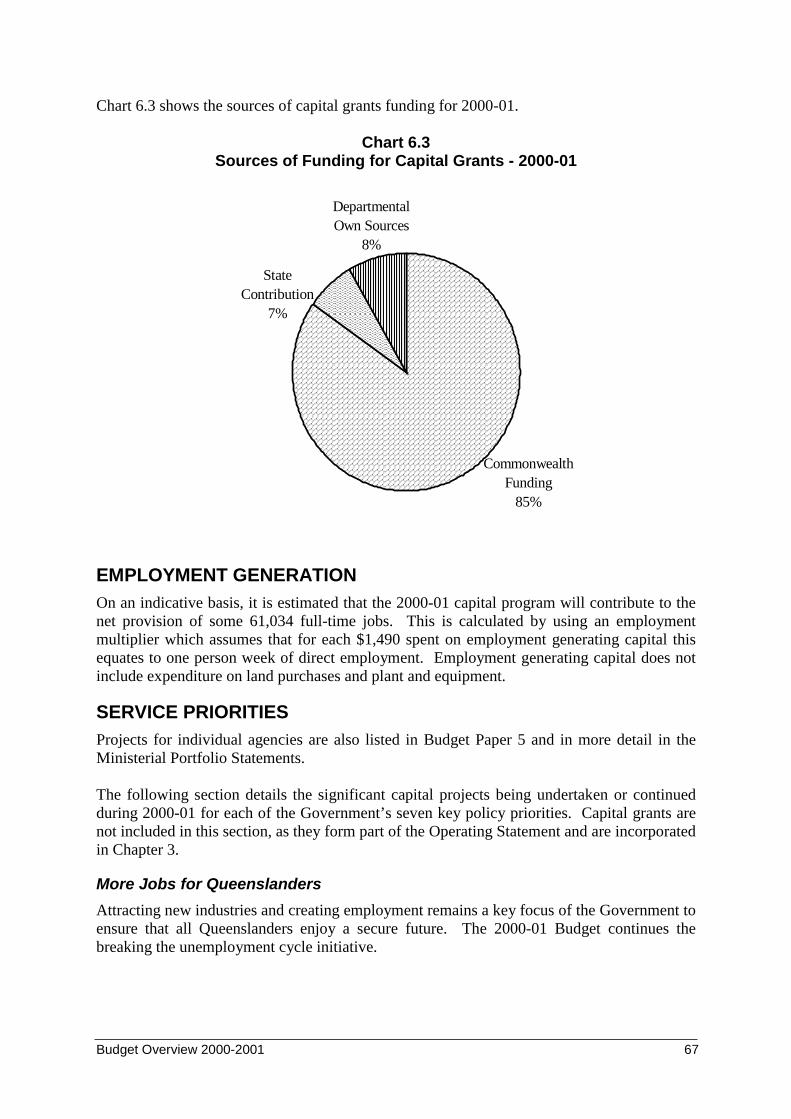
Budget Overview 2000-2001 67
Chart 6.3 shows the sources of capital grants funding for 2000-01.
Chart 6.3Sources of Funding for Capital Grants - 2000-01
Departmental Own Sources
8%
Commonwealth Funding
85%
State Contribution
7%
EMPLOYMENT GENERATIONOn an indicative basis, it is estimated that the 2000-01 capital program will contribute to thenet provision of some 61,034 full-time jobs. This is calculated by using an employmentmultiplier which assumes that for each $1,490 spent on employment generating capital thisequates to one person week of direct employment. Employment generating capital does notinclude expenditure on land purchases and plant and equipment.
SERVICE PRIORITIESProjects for individual agencies are also listed in Budget Paper 5 and in more detail in theMinisterial Portfolio Statements.
The following section details the significant capital projects being undertaken or continuedduring 2000-01 for each of the Government’s seven key policy priorities. Capital grants arenot included in this section, as they form part of the Operating Statement and are incorporatedin Chapter 3.
More Jobs for Queenslanders
Attracting new industries and creating employment remains a key focus of the Government toensure that all Queenslanders enjoy a secure future. The 2000-01 Budget continues thebreaking the unemployment cycle initiative.
Budget Overview 2000-2001 68
Capital investment highlights which contribute to this priority include:
• $87.9 million in 2000-01 for the construction and/or acquisition of 500 housing units.This funding is provided for ongoing and targeted housing solutions for those in housingneed. This commitment is reflected in the Department of Housing’s 2000-01 Budget of$289.9 million for capital projects;
• $150 million in 2000-01 for the Swanbank E Power Station Project, which will include anew 385 megawatt, gas fired electricity generator;
• $19 million to be spent in 2000-01 on the Northern Busway out of a total project cost of$76 million and $156 million for the South East Transit Project;
• A number of major rail initiatives including $238 million to be spent on the developmentand maintenance of the rail track network, $68.4 million on upgrading coal and mainlinefreight locomotives and rolling stock and $6 million to upgrade coal and mainline freightdepots;
• $101 million on upgrading Port Authority facilities; and
• $13.6 million to complete the establishment of the Carole Park Energy Park, designed toprovide an industrial estate that will principally host food manufacturing industries andthose industries that support primary food manufacturing activities.
Building Queensland’s Regions
In the 2000-01 Budget, the Government is seeking to expand export markets and encouragevalue-adding industries and has provided funds for regional infrastructure, tourism andagriculture projects to support regional economies.
Capital investment highlights which contribute to this priority include:
• $762 million in 2000-01 for roads capital funding including $26 million forimprovements to the Barkly Highway, $11 million to convert the Marburg bypass from 2to 4 lanes and $32.5 million to convert the Yandina to Cooroy bypass from 2 to 4 lanes.This supports rural and regional development, population growth and industrydevelopment throughout Queensland;
• $120 million in 2000-01 as part of a $422 million project for passenger rolling stockincluding the Cairns Tilt Train; and
• $25.4 million in 2000-01 for the Cairns Cityport Development.
Skilling Queensland – The Smart State
In 2000-01, the Government has continued to maintain a strong emphasis on achievingemployment growth and preparing the State for a world with increasingly complex andrapidly changing technology.
Budget Overview 2000-2001 69
Capital investment highlights which contribute to this priority include:
• $102.6 million for the construction of four new schools and further staged work at ninenew schools, an increase in the number of schools that teach students from preschool toYear 12 (P-12 schools), and more than 200 additional classrooms at existing schools ingrowth areas of the State;
• $25.5 million ($114 million over three years) for the Secondary School Renewal program,which will reinvigorate older secondary schools, starting with eight schools in 2000-01;
• $18.2 million for Cooler Schools projects to air condition facilities at various Stateschools; and
• $28.6 million for TAFE Queensland infrastructure to enhance the delivery of training inQueensland. This will be supported by the investment of $15.2 million to upgrade andenhance the Information Technology systems across TAFE Queensland.
Safer and More Supportive Communities
In 2000-01, the Government’s focus will be on the needs of young people. These needs willbe addressed through Child Protection legislation and the expansion of family support andcounselling services. Aboriginal and Torres Strait Islander communities will be providedwith infrastructure and business opportunities.
Capital investment highlights which contribute to this priority include:
• $82.5 million in 2000-01 for the Police capital infrastructure project. New stations willbe built in some areas where the demand for police services is increasing. In other areas,current police facilities will be refurbished or replaced. Assets will be purchased toimprove the efficiency and effectiveness of policing services;
This initiative provides funding for several projects including upgrading theRockhampton District and Regional Head Quarters ($4 million in 2000-01) and replacingthe Mount Isa District Head Quarters and Watchhouse ($2.5 million in 2000-01). Newprojects expected to commence in 2000-01 include replacing the Ipswich District HeadQuarters ($1.1 million in 2000-01); and
• $7.1 million is provided in 2000-01 for Courthouse upgrades at Mount Isa, Wynnum,Maryborough, Inala and Mackay. The upgrades will provide improved services tocourthouse staff, the judiciary and clients of the courts.
Better Quality of Life
The Government is improving access to the health system particularly for the chronically illand people living in rural and remote communities. In 2000-01, the focus will be onrebuilding projects for health services and improving fire, ambulance and emergencyservices.
Budget Overview 2000-2001 70
Capital investment highlights which contribute to this priority include:
• $473 million for a number of community health, hospitals, mental health, and residentialcare projects, pathology and scientific services, state of the art technology and equipmentreplacement.
- Community projects planned for completion in 2000-01 include the CommunityHealth Centres at Goodna ($2.3 million) and Centenary Square, the Herston ChildCare Centre and the Dental Clinics at Nambour and Mareeba.
- Major hospital projects to be finalised in 2000-01 include the Logan and Mackayhospital redevelopments, and the Royal Women’s component of the Herston HospitalRedevelopment ($52.6 million);
• In 2000-01, rebates totalling $4.6 million will be provided to remote area residents whoinstall power systems, as an alternative to being connected to the State electricity grid,under the Remote Area Power Supply scheme; and
• $64.7 million will be spent on Aboriginal and Torres Strait Islander housing includingcapital grants to Aboriginal and Torres Strait Islander Councils and the construction of 85new dwellings, the upgrade of 150 existing houses throughout Queensland, estateredevelopment and Thursday Island land purchases.
Valuing the Environment
In 2000-01, the focus will be on ensuring scarce natural resources are used sustainably,protecting coasts and waterways through the acquisition of coastal lands and improvedenvironmental management, encouraging the use of energy efficient technologies andimproving visitor facilities in protected areas.
Capital investment highlights which contribute to this priority include:
• $5.1 million for the public acquisition of critical lands of high conservation value,protecting key coastal resources along Queensland's extensive coastline;
• $4 million for the acquisition of 1,000 hectares of land at Trinity Inlet near Cairns andland in the Brigalow Belt and Desert Uplands biographic areas ($1.5 million);
• Natural Heritage Trust funding of $4 million to enhance and expand the network ofprotected areas on the Cape York Peninsula through land acquisitions and other capitalworks; and
• $0.5 million towards the joint New South Wales and Queensland Tweed River SandBypassing Project, which is designed to relieve the sand build up at the Tweed Riverentrance and replenish Gold Coast beaches.
Budget Overview 2000-2001 71
Strong Government Leadership
The Charter of Social and Fiscal Responsibility provides a framework for accountabilitythrough the endorsement of, and the identification of policy priorities and performanceindicators. In 2000-01, the Government will continue to focus on exploring andimplementing new ways to improve the delivery of services and also on strengthening theopenness, accountability and integrity of Government operations.
Capital investment highlights which contribute to this priority include:
• $7.5 million over four years to develop electronic service delivery projects which willenable a range of Government services to be available on-line; and
• $2.4 million to complete the refurbishment of the Parliamentary Annexe.
Budget Overview 2000-2001 72
7. LONG TERM FISCAL TRENDS
KEY POINTS
• The long term fiscal trends affecting the State reflect the combined impact of social anddemographic factors and the various policies adopted by successive governments.
• Trends in the State’s financial position are characterised by expenditure effortapproaching the average of the other States, increases in the size of the capital program,the maintenance of low taxation levels, and increases in other revenue.
• The State’s strong balance sheet position and commitment to sound fiscal managementprovide a high degree of flexibility to adapt to externally driven changes. National taxreform arrangements erode some of this fiscal flexibility.
INTRODUCTIONThis chapter discusses the long term fiscal trends impacting on the fiscal position inQueensland.
The long term trends impacting on the State’s fiscal position reflect the evolutionary changeto the social and economic environment in which the State exists. These underlying fiscaltrends have not changed leading into the 2000-01 Budget. These trends include:
• State taxes still being maintained at lower levels than the average of the other States; and
• recurrent expenditure effort in key service delivery areas approaching the average of theother States.
The fiscal position achieved in recent years is a reflection both of these ongoing trends andthe commitments made by the Government in the Charter. In particular, the Charter requiresthe Government to ensure that State taxes and charges remain competitive with the otherStates and Territories, maintain an overall General Government operating surplus (in GFSterms) and build net worth. The trends impacting on this Budget mostly, however, are areflection both of underlying social and demographic factors and the cumulative impact ofpolicy decisions taken by successive Governments over many years.
SOCIAL AND ECONOMIC ENVIRONMENTTrends in the activities of Government reflect the general social and economic trendsaffecting the State. An example of the social trends impacting Government service deliveryover the last 20 years is the significant demographic changes in Queensland.
Budget Overview 2000-2001 73
The main demographic change affecting all Australian States is the ageing of the population.Australia’s population, with the “baby boomer” generation (born between 1946 and 1960),suggests strongly that governments should be building the capacity now to deliver socialservices to this population cohort as they move into retirement (utilising taxes collectedlargely from this generation while they are of working age). The 1946-1960 birth-rangecohort will form the largest ever retirement age cohort, as they make the transition into thatlifecycle stage in the next decade. From June 1979 to June 1999, the number of people aged65 years and over has increased by 70%1. The ageing of the population will place demandson Government services, particularly health and community services, for the next 20-30 yearssubstantially in excess of past service levels.
In addition, Queensland’s population has other characteristics that are not common to allStates, including:
• high levels of population growth, primarily from interstate and overseas migration2;
• high growth in the number of children in comparison to other States3; and
• geographic diversity – 54% of Queenslanders live outside the capital city, whereas in theother States combined only 32% of the population live outside the capital.4
These population characteristics have created challenges in Government service delivery overthe last 20 years, including:
• growing demand for Government services, with particular emphasis on:
− the educational needs of young people; and
− health and community care requirements associated with an ageing population;
• ensuring high quality services in rural and remote areas where there are small populationgroups; and
• growing demand for energy, transport, communication and other basic infrastructure.
While this is just one of several long term social and economic trends that impact on theactivities of the Government, it provides an example of the effect that such trends have on theGovernment’s service delivery activities, as reflected through the State Budget.
The response of successive Governments to the range of social and economic challengesaffecting the State, including those outlined above, are reflected in the trends that havecharacterised the State’s expenditure. There has been increased expenditure over the last tenyears on social services and a large capital program in recent years focused on improvinginfrastructure and the capacity of the State to deliver social and economic services.
1 ABS Cat. No. 3201.0.2 Population growth in the five years to 1998. Source: ABS publication “Australia Now – A Statistical Profile”.3 Population group 0-14 years – June 1998 to June 1999. Source: ABS Cat. No. 3201.0, June 1999.4 Percentage of population outside the capital city statistical division (1997 Statistical Local Area boundaries). Queensland54% - Australian average 36%. Source: ABS publication “Australia Now – A Statistical Profile”.
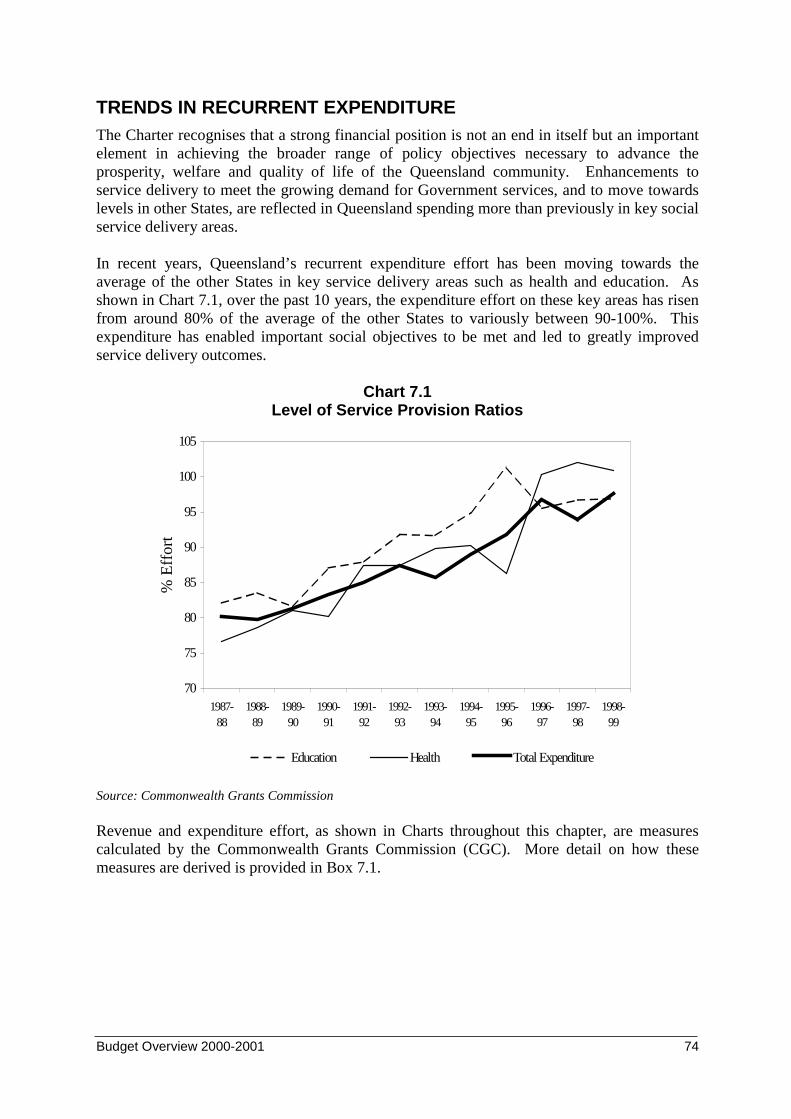
Budget Overview 2000-2001 74
TRENDS IN RECURRENT EXPENDITUREThe Charter recognises that a strong financial position is not an end in itself but an importantelement in achieving the broader range of policy objectives necessary to advance theprosperity, welfare and quality of life of the Queensland community. Enhancements toservice delivery to meet the growing demand for Government services, and to move towardslevels in other States, are reflected in Queensland spending more than previously in key socialservice delivery areas.
In recent years, Queensland’s recurrent expenditure effort has been moving towards theaverage of the other States in key service delivery areas such as health and education. Asshown in Chart 7.1, over the past 10 years, the expenditure effort on these key areas has risenfrom around 80% of the average of the other States to variously between 90-100%. Thisexpenditure has enabled important social objectives to be met and led to greatly improvedservice delivery outcomes.
Chart 7.1Level of Service Provision Ratios
70
75
80
85
90
95
100
105
1987-88
1988-89
1989-90
1990-91
1991-92
1992-93
1993-94
1994-95
1995-96
1996-97
1997-98
1998-99
% E
ffor
t
Education Health Total Expenditure
Source: Commonwealth Grants Commission
Revenue and expenditure effort, as shown in Charts throughout this chapter, are measurescalculated by the Commonwealth Grants Commission (CGC). More detail on how thesemeasures are derived is provided in Box 7.1.
Budget Overview 2000-2001 75
Box 7.1Commonwealth Grants Commission’s Revenue Raising Effort and Level of
Service Provision Ratios
The Commonwealth Grants Commission (CGC) assesses a State’s need for Commonwealthfinancial assistance by taking into account its revenue capacities and expenditure needs (whata State is required to spend to provide an Australian average level of service). Theseassessments are prepared on a policy neutral basis, which means that only those factors thatare beyond a State’s control are considered.
CGC measures used in this paper are:
• the revenue raising effort ratio, which measures the severity of State taxes and efficiencyin ensuring compliance, relative to the Australian average effort; and
• the level of service provision ratio, which measures both the level of services provided ina State relative to the Australian average and the relative efficiency with which they areprovided.
These measures compare actual data with capacities and needs, rather than using simpleAustralian averages. They therefore offer a more informed view of fiscal policy settings overa specified time period by taking account of factors that are beyond a State’s control. As theAustralian average is by definition 100 per cent, ratios of less than 100 per cent indicate lowtax policies or below average levels of service provision.
EFFICIENCY IN SERVICE DELIVERY
Evidence from independent sources is that Queensland is one of the more efficient providersof government services among the States. As an example, analysis by the ProductivityCommission5 outlined in Chart 7.2 below shows that Queensland is relatively more efficientin a range of areas such as providing hospital care, corrective services, courts and publichousing.
While expenditure effort has increased over time, Queensland continues to be a very efficientprovider of social services. This efficiency, combined with the increase in expenditure effort,has resulted in Queensland leading the way in actual service levels in many areas.
Efficiency in service delivery is expected to further improve within the framework of theState’s Managing For Outcomes (MFO) program. The MFO program, incorporating accrualaccounting and output based budgeting, will assist the Government to determine fundingpriorities and manage competing community demands in the most efficient manner.
5 Productivity Commission Report on Government Services 2000
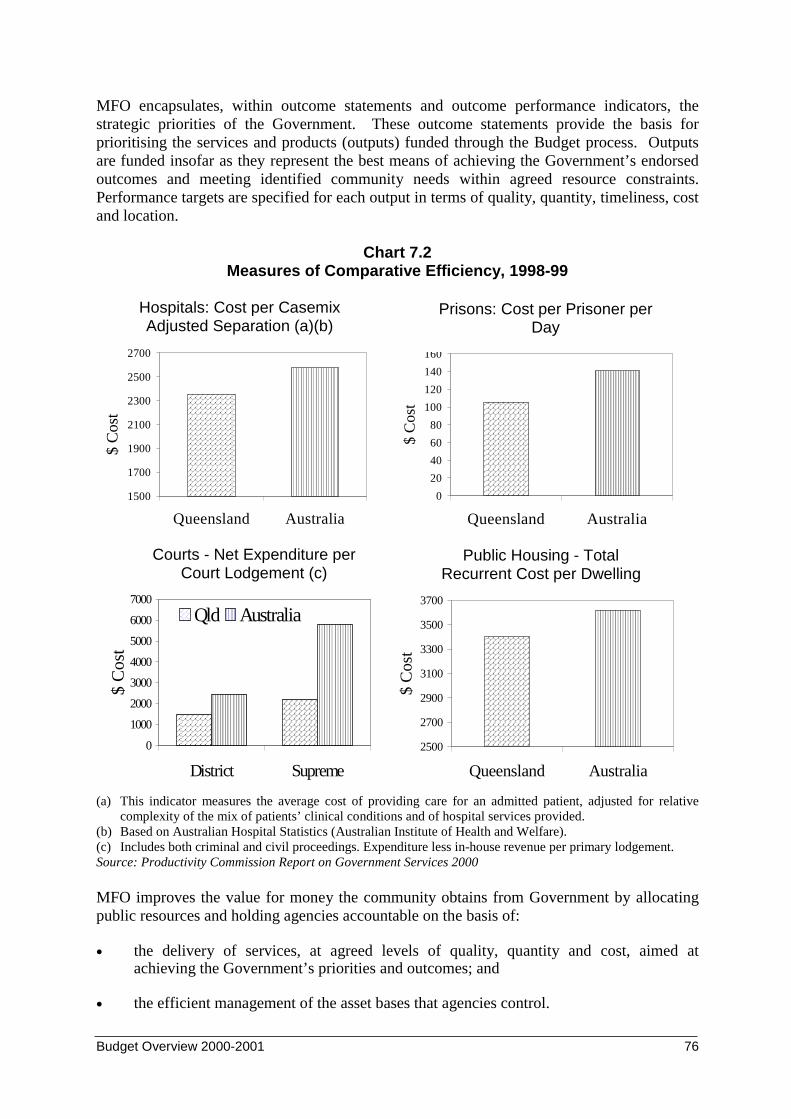
Budget Overview 2000-2001 76
MFO encapsulates, within outcome statements and outcome performance indicators, thestrategic priorities of the Government. These outcome statements provide the basis forprioritising the services and products (outputs) funded through the Budget process. Outputsare funded insofar as they represent the best means of achieving the Government’s endorsedoutcomes and meeting identified community needs within agreed resource constraints.Performance targets are specified for each output in terms of quality, quantity, timeliness, costand location.
Chart 7.2Measures of Comparative Efficiency, 1998-99
0
1000
2000
3000
4000
5000
6000
7000
District Supreme
$ C
ost
Qld Australia
2500
2700
2900
3100
3300
3500
3700
Queensland Australia
$ C
ost
(a) This indicator measures the average cost of providing care for an admitted patient, adjusted for relativecomplexity of the mix of patients’ clinical conditions and of hospital services provided.
(b) Based on Australian Hospital Statistics (Australian Institute of Health and Welfare).(c) Includes both criminal and civil proceedings. Expenditure less in-house revenue per primary lodgement.Source: Productivity Commission Report on Government Services 2000
MFO improves the value for money the community obtains from Government by allocatingpublic resources and holding agencies accountable on the basis of:
• the delivery of services, at agreed levels of quality, quantity and cost, aimed atachieving the Government’s priorities and outcomes; and
• the efficient management of the asset bases that agencies control.
1500
1700
1900
2100
2300
2500
2700
Queensland Australia
$ C
ost
Hospitals: Cost per CasemixAdjusted Separation (a)(b)
0
20
40
60
80
100
120
140
160
Queensland Australia
$ C
ost
Prisons: Cost per Prisoner perDay
Courts - Net Expenditure perCourt Lodgement (c)
Public Housing - TotalRecurrent Cost per Dwelling
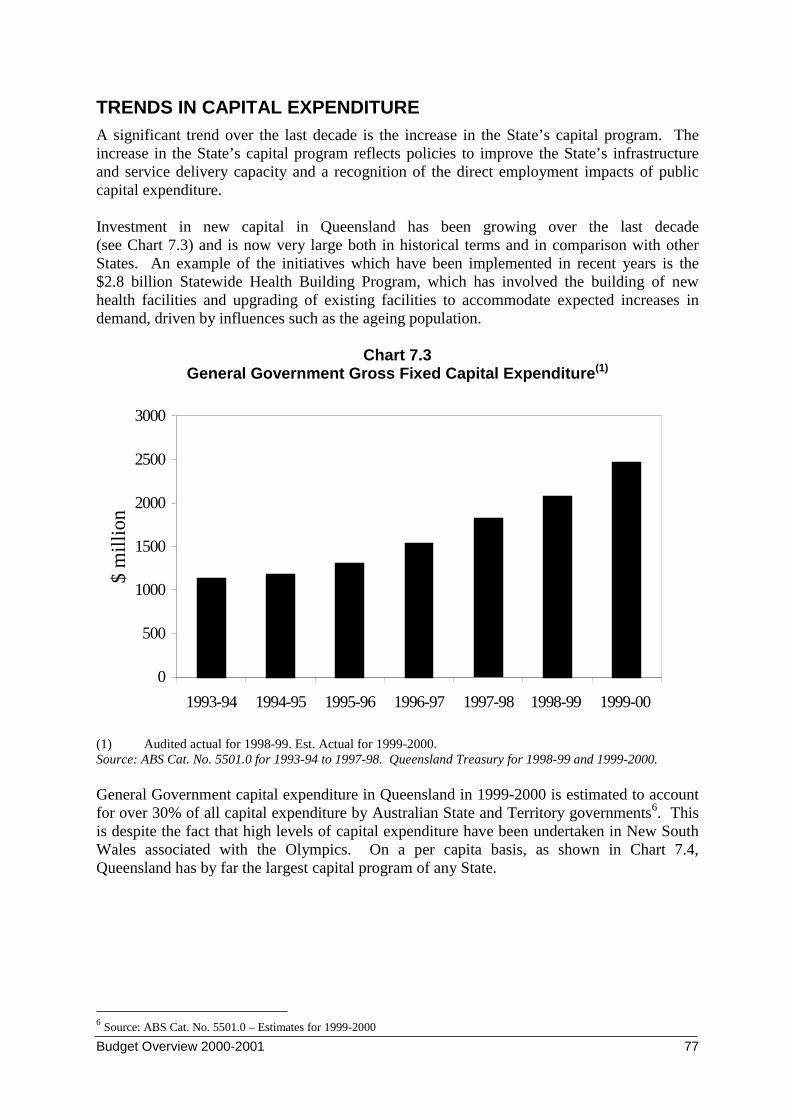
Budget Overview 2000-2001 77
TRENDS IN CAPITAL EXPENDITUREA significant trend over the last decade is the increase in the State’s capital program. Theincrease in the State’s capital program reflects policies to improve the State’s infrastructureand service delivery capacity and a recognition of the direct employment impacts of publiccapital expenditure.
Investment in new capital in Queensland has been growing over the last decade(see Chart 7.3) and is now very large both in historical terms and in comparison with otherStates. An example of the initiatives which have been implemented in recent years is the$2.8 billion Statewide Health Building Program, which has involved the building of newhealth facilities and upgrading of existing facilities to accommodate expected increases indemand, driven by influences such as the ageing population.
Chart 7.3General Government Gross Fixed Capital Expenditure(1)
0
500
1000
1500
2000
2500
3000
1993-94 1994-95 1995-96 1996-97 1997-98 1998-99 1999-00
$ m
illio
n
(1) Audited actual for 1998-99. Est. Actual for 1999-2000.Source: ABS Cat. No. 5501.0 for 1993-94 to 1997-98. Queensland Treasury for 1998-99 and 1999-2000.
General Government capital expenditure in Queensland in 1999-2000 is estimated to accountfor over 30% of all capital expenditure by Australian State and Territory governments6. Thisis despite the fact that high levels of capital expenditure have been undertaken in New SouthWales associated with the Olympics. On a per capita basis, as shown in Chart 7.4,Queensland has by far the largest capital program of any State.
6 Source: ABS Cat. No. 5501.0 – Estimates for 1999-2000
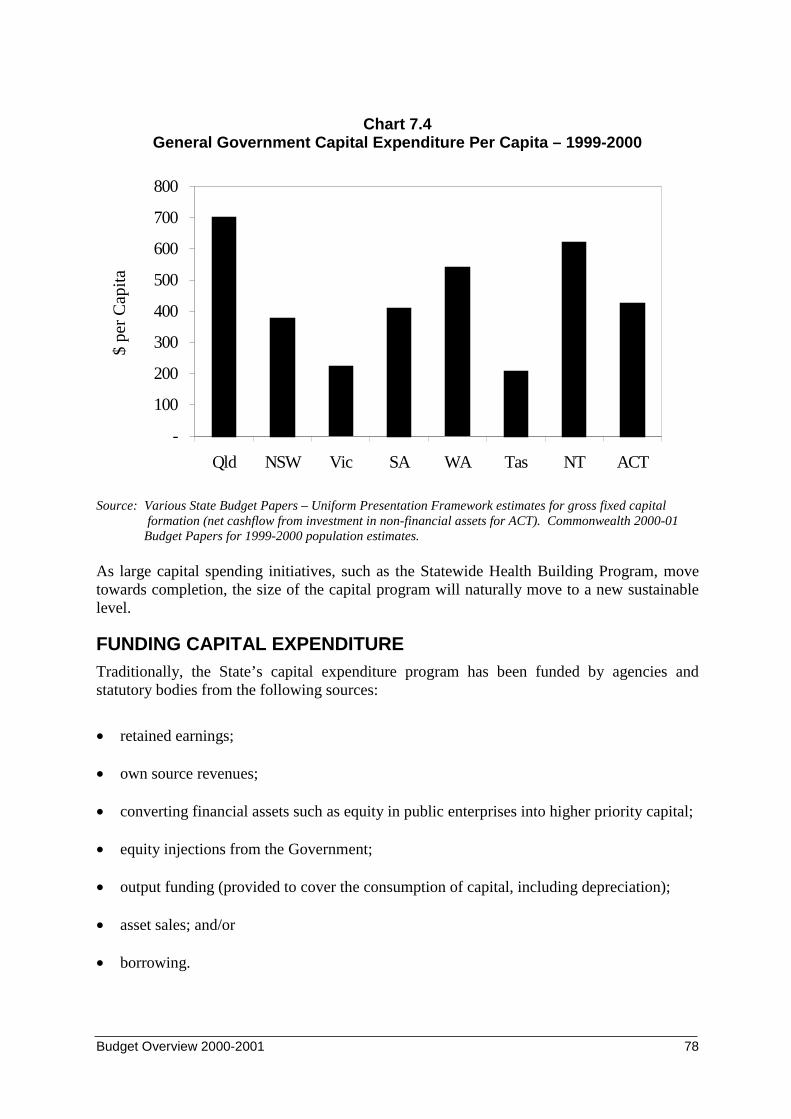
Budget Overview 2000-2001 78
Chart 7.4General Government Capital Expenditure Per Capita – 1999-2000
-
100
200
300
400
500
600
700
800
Qld NSW Vic SA WA Tas NT ACT
$ pe
r C
apita
Source: Various State Budget Papers – Uniform Presentation Framework estimates for gross fixed capital formation (net cashflow from investment in non-financial assets for ACT). Commonwealth 2000-01Budget Papers for 1999-2000 population estimates.
As large capital spending initiatives, such as the Statewide Health Building Program, movetowards completion, the size of the capital program will naturally move to a new sustainablelevel.
FUNDING CAPITAL EXPENDITURETraditionally, the State’s capital expenditure program has been funded by agencies andstatutory bodies from the following sources:
• retained earnings;
• own source revenues;
• converting financial assets such as equity in public enterprises into higher priority capital;
• equity injections from the Government;
• output funding (provided to cover the consumption of capital, including depreciation);
• asset sales; and/or
• borrowing.
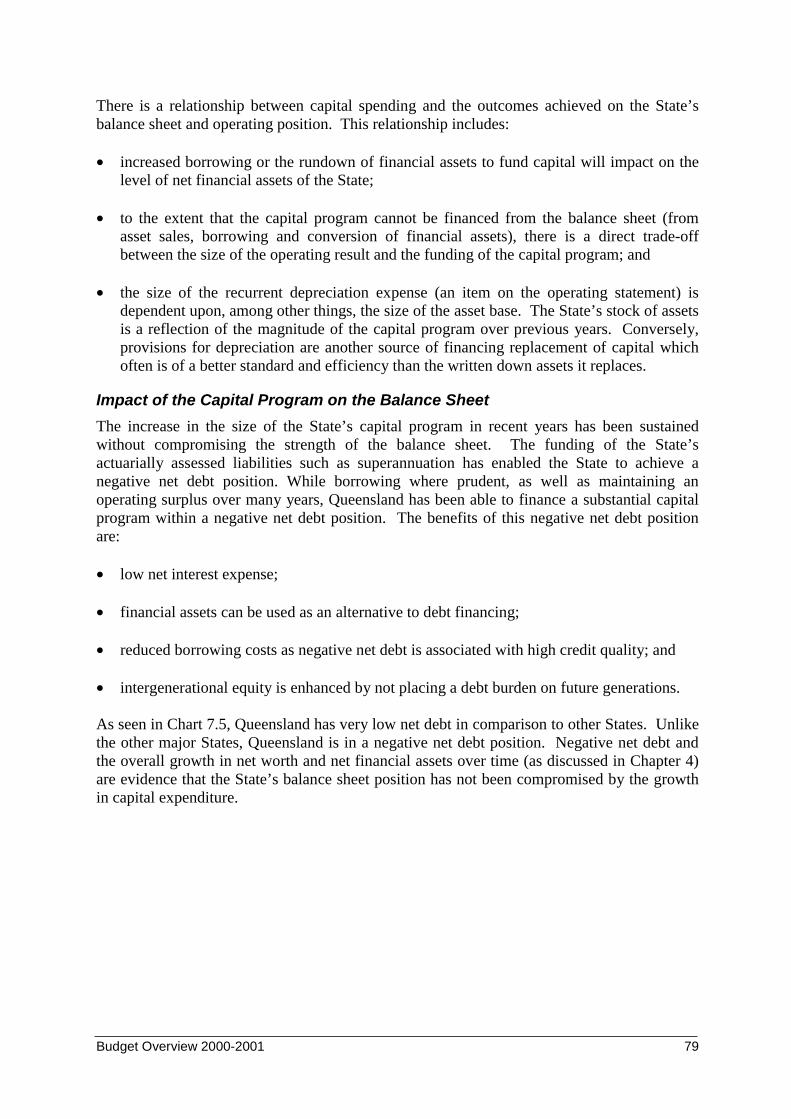
Budget Overview 2000-2001 79
There is a relationship between capital spending and the outcomes achieved on the State’sbalance sheet and operating position. This relationship includes:
• increased borrowing or the rundown of financial assets to fund capital will impact on thelevel of net financial assets of the State;
• to the extent that the capital program cannot be financed from the balance sheet (fromasset sales, borrowing and conversion of financial assets), there is a direct trade-offbetween the size of the operating result and the funding of the capital program; and
• the size of the recurrent depreciation expense (an item on the operating statement) isdependent upon, among other things, the size of the asset base. The State’s stock of assetsis a reflection of the magnitude of the capital program over previous years. Conversely,provisions for depreciation are another source of financing replacement of capital whichoften is of a better standard and efficiency than the written down assets it replaces.
Impact of the Capital Program on the Balance Sheet
The increase in the size of the State’s capital program in recent years has been sustainedwithout compromising the strength of the balance sheet. The funding of the State’sactuarially assessed liabilities such as superannuation has enabled the State to achieve anegative net debt position. While borrowing where prudent, as well as maintaining anoperating surplus over many years, Queensland has been able to finance a substantial capitalprogram within a negative net debt position. The benefits of this negative net debt positionare:
• low net interest expense;
• financial assets can be used as an alternative to debt financing;
• reduced borrowing costs as negative net debt is associated with high credit quality; and
• intergenerational equity is enhanced by not placing a debt burden on future generations.
As seen in Chart 7.5, Queensland has very low net debt in comparison to other States. Unlikethe other major States, Queensland is in a negative net debt position. Negative net debt andthe overall growth in net worth and net financial assets over time (as discussed in Chapter 4)are evidence that the State’s balance sheet position has not been compromised by the growthin capital expenditure.
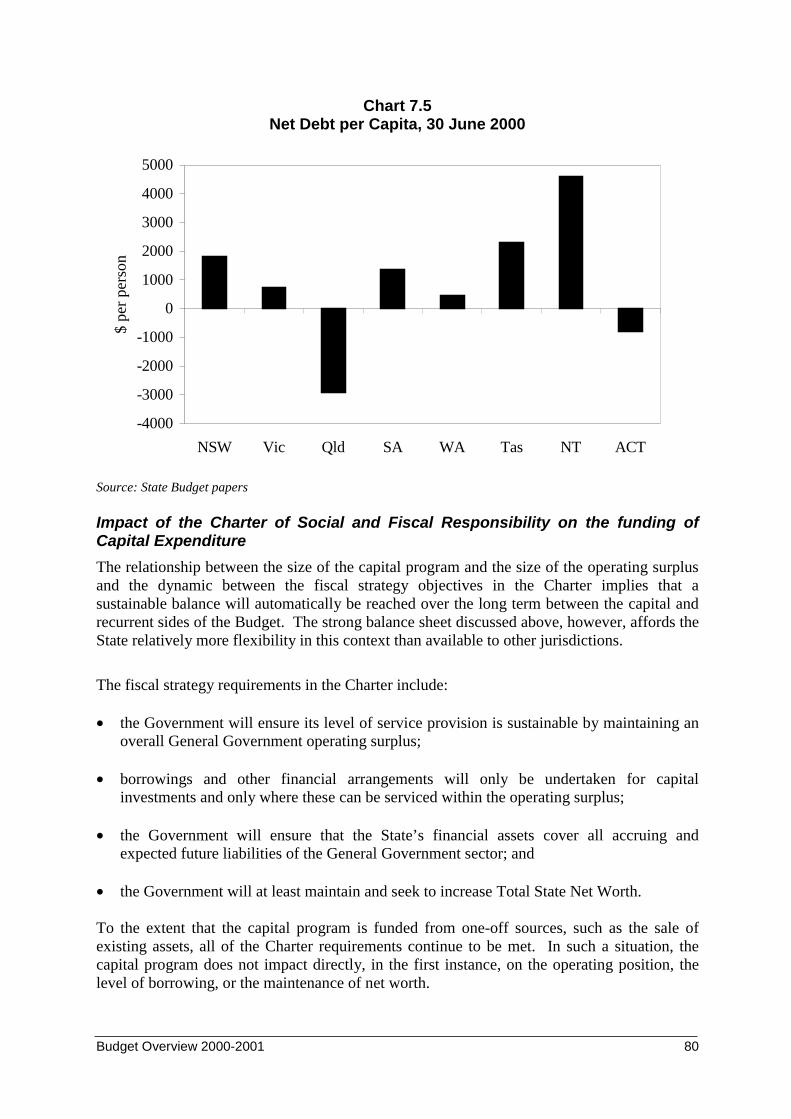
Budget Overview 2000-2001 80
Chart 7.5Net Debt per Capita, 30 June 2000
-4000
-3000
-2000
-1000
0
1000
2000
3000
4000
5000
NSW Vic Qld SA WA Tas NT ACT
$ pe
r pe
rson
Source: State Budget papers
Impact of the Charter of Social and Fiscal Responsibility on the funding ofCapital Expenditure
The relationship between the size of the capital program and the size of the operating surplusand the dynamic between the fiscal strategy objectives in the Charter implies that asustainable balance will automatically be reached over the long term between the capital andrecurrent sides of the Budget. The strong balance sheet discussed above, however, affords theState relatively more flexibility in this context than available to other jurisdictions.
The fiscal strategy requirements in the Charter include:
• the Government will ensure its level of service provision is sustainable by maintaining anoverall General Government operating surplus;
• borrowings and other financial arrangements will only be undertaken for capitalinvestments and only where these can be serviced within the operating surplus;
• the Government will ensure that the State’s financial assets cover all accruing andexpected future liabilities of the General Government sector; and
• the Government will at least maintain and seek to increase Total State Net Worth.
To the extent that the capital program is funded from one-off sources, such as the sale ofexisting assets, all of the Charter requirements continue to be met. In such a situation, thecapital program does not impact directly, in the first instance, on the operating position, thelevel of borrowing, or the maintenance of net worth.
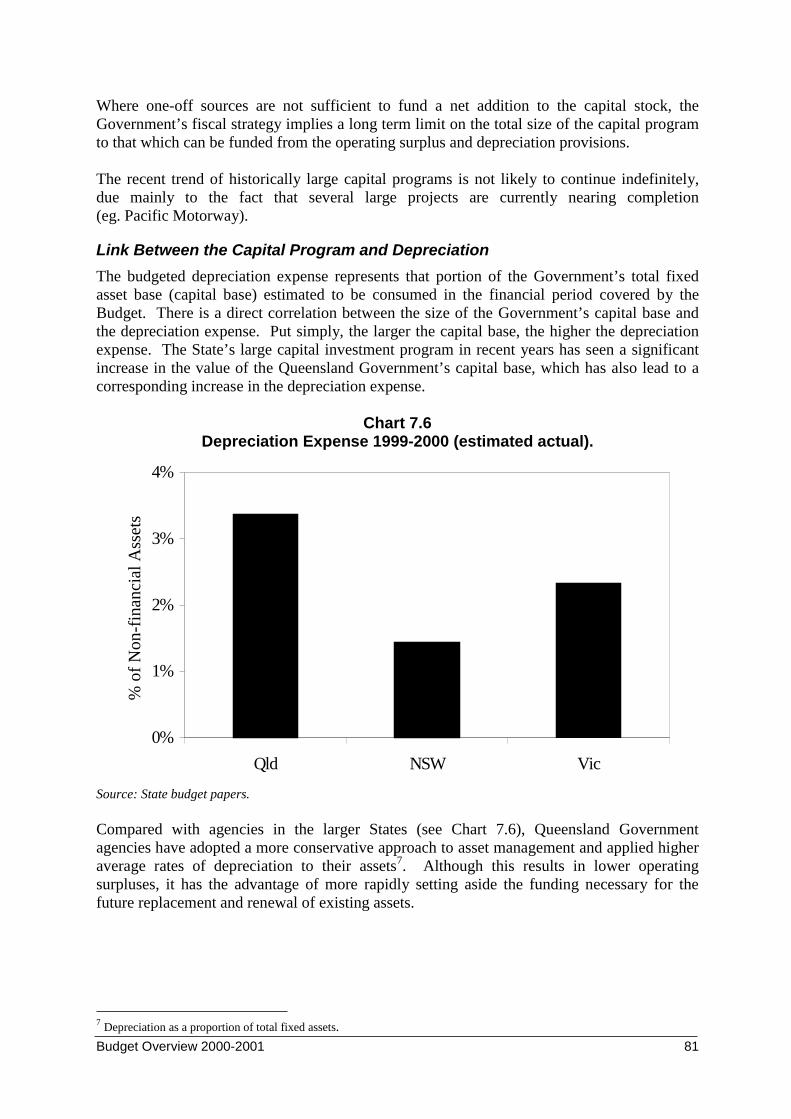
Budget Overview 2000-2001 81
Where one-off sources are not sufficient to fund a net addition to the capital stock, theGovernment’s fiscal strategy implies a long term limit on the total size of the capital programto that which can be funded from the operating surplus and depreciation provisions.
The recent trend of historically large capital programs is not likely to continue indefinitely,due mainly to the fact that several large projects are currently nearing completion(eg. Pacific Motorway).
Link Between the Capital Program and Depreciation
The budgeted depreciation expense represents that portion of the Government’s total fixedasset base (capital base) estimated to be consumed in the financial period covered by theBudget. There is a direct correlation between the size of the Government’s capital base andthe depreciation expense. Put simply, the larger the capital base, the higher the depreciationexpense. The State’s large capital investment program in recent years has seen a significantincrease in the value of the Queensland Government’s capital base, which has also lead to acorresponding increase in the depreciation expense.
Chart 7.6Depreciation Expense 1999-2000 (estimated actual).
0%
1%
2%
3%
4%
Qld NSW Vic
% o
f N
on-f
inan
cial
Ass
ets
Source: State budget papers.
Compared with agencies in the larger States (see Chart 7.6), Queensland Governmentagencies have adopted a more conservative approach to asset management and applied higheraverage rates of depreciation to their assets7. Although this results in lower operatingsurpluses, it has the advantage of more rapidly setting aside the funding necessary for thefuture replacement and renewal of existing assets.
7 Depreciation as a proportion of total fixed assets.
Budget Overview 2000-2001 82
It is anticipated that, over time, there will be a number of benefits from this approach. Thebudgetary impact of funding replacement assets will be smaller with less capital fundingrequired from other sources. Furthermore, shorter depreciation timeframes will mean that ifapplication of the valuation principles set forth in AAS 38 (which becomes mandatory forGovernment departments on 1 July 2002) results in significant decrements in the value ofexisting assets, the impact of this will have already been absorbed, to some extent, in earlieroperating statements.
TRENDS IN STATE GOVERNMENT REVENUEThe State’s revenue is comprised of taxation revenue, other own-source revenue andCommonwealth Government funding. Further details of the composition of the State’srevenue is contained in Budget Paper 3. Trends in the size and composition of State revenuehave been as important as those changes in expenditure outlined above in shaping theevolution of Queensland’s fiscal position over recent decades.
Taxation Revenue
The State has experienced increasing expenditure effort and the large capital program outlinedabove without a commensurate increase in taxation revenue raising effort (as assessed by theCGC). Although total taxation revenue has increased due to factors such as economic andpopulation growth, the State has low tax levels in relation to other States. This reflects boththe fiscal flexibility offered by the State’s strong balance sheet position and the Government’sCharter commitment to ensure that State taxes and charges remain competitive with the otherStates and Territories.
As shown in Chart 7.7 below, Queensland’s taxation revenue raising effort, as assessed by theCGC, has remained well below the Australian average (represented as 100%) in recent years.Revenue effort is the ratio of the actual revenue raised to that which a State could have raisedhad it applied Australian average tax rates to its assessed tax base. This graph confirms thatQueensland’s favourable tax status is due to the Government’s tax policies rather than anyunderlying weakness in its capacity to raise revenue.
By maintaining competitive tax rates, Queensland provides a competitive advantage tobusiness and a reduced tax burden for its citizens. The maintenance of Queensland’scompetitive tax status is fundamental to the Government’s commitment to job creation andeconomic development.
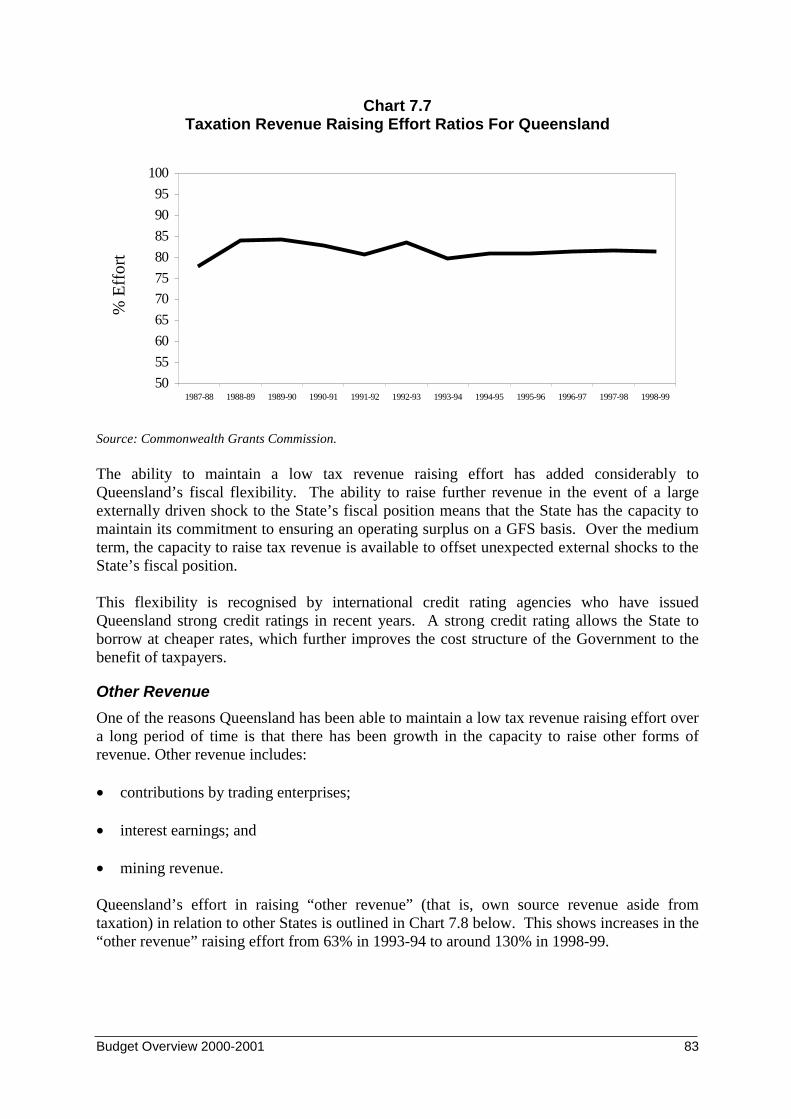
Budget Overview 2000-2001 83
Chart 7.7Taxation Revenue Raising Effort Ratios For Queensland
Source: Commonwealth Grants Commission.
The ability to maintain a low tax revenue raising effort has added considerably toQueensland’s fiscal flexibility. The ability to raise further revenue in the event of a largeexternally driven shock to the State’s fiscal position means that the State has the capacity tomaintain its commitment to ensuring an operating surplus on a GFS basis. Over the mediumterm, the capacity to raise tax revenue is available to offset unexpected external shocks to theState’s fiscal position.
This flexibility is recognised by international credit rating agencies who have issuedQueensland strong credit ratings in recent years. A strong credit rating allows the State toborrow at cheaper rates, which further improves the cost structure of the Government to thebenefit of taxpayers.
Other Revenue
One of the reasons Queensland has been able to maintain a low tax revenue raising effort overa long period of time is that there has been growth in the capacity to raise other forms ofrevenue. Other revenue includes:
• contributions by trading enterprises;
• interest earnings; and
• mining revenue.
Queensland’s effort in raising “other revenue” (that is, own source revenue aside fromtaxation) in relation to other States is outlined in Chart 7.8 below. This shows increases in the“other revenue” raising effort from 63% in 1993-94 to around 130% in 1998-99.
50
55
60
65
70
75
80
85
90
95
100
1987-88 1988-89 1989-90 1990-91 1991-92 1992-93 1993-94 1994-95 1995-96 1996-97 1997-98 1998-99
% E
ffor
t
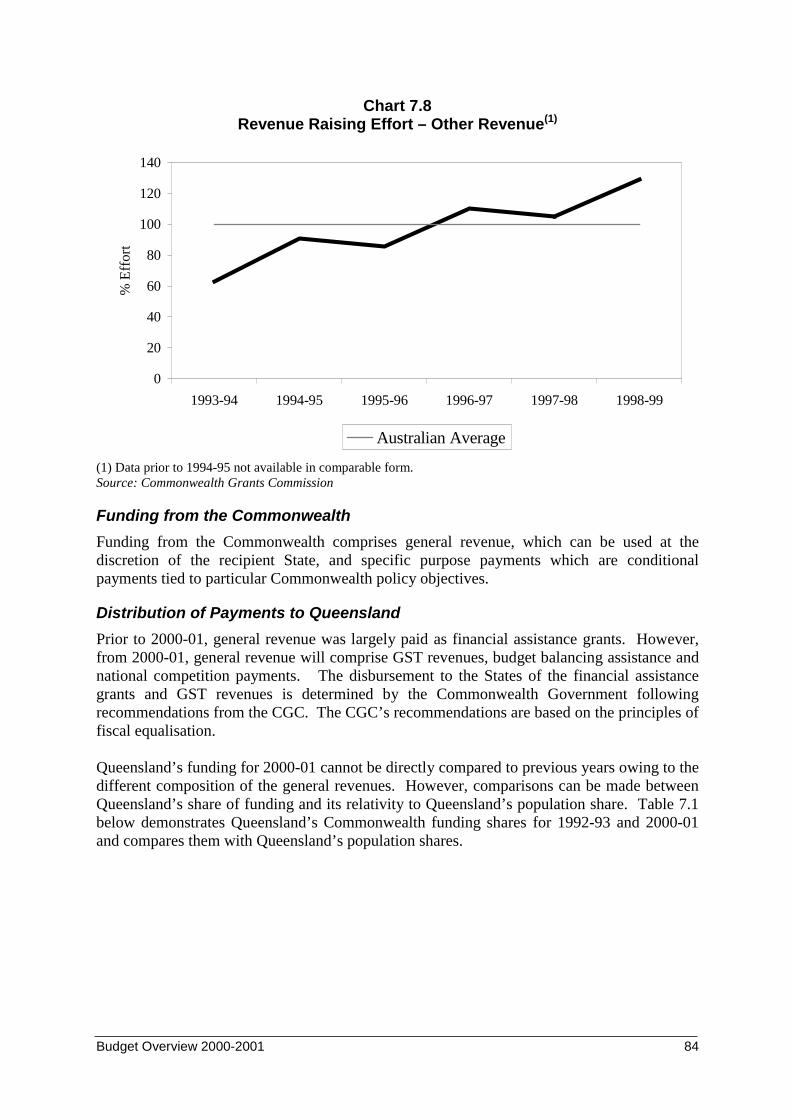
Budget Overview 2000-2001 84
Chart 7.8Revenue Raising Effort – Other Revenue(1)
0
20
40
60
80
100
120
140
1993-94 1994-95 1995-96 1996-97 1997-98 1998-99
% E
ffor
t
Australian Average
(1) Data prior to 1994-95 not available in comparable form.Source: Commonwealth Grants Commission
Funding from the Commonwealth
Funding from the Commonwealth comprises general revenue, which can be used at thediscretion of the recipient State, and specific purpose payments which are conditionalpayments tied to particular Commonwealth policy objectives.
Distribution of Payments to Queensland
Prior to 2000-01, general revenue was largely paid as financial assistance grants. However,from 2000-01, general revenue will comprise GST revenues, budget balancing assistance andnational competition payments. The disbursement to the States of the financial assistancegrants and GST revenues is determined by the Commonwealth Government followingrecommendations from the CGC. The CGC’s recommendations are based on the principles offiscal equalisation.
Queensland’s funding for 2000-01 cannot be directly compared to previous years owing to thedifferent composition of the general revenues. However, comparisons can be made betweenQueensland’s share of funding and its relativity to Queensland’s population share. Table 7.1below demonstrates Queensland’s Commonwealth funding shares for 1992-93 and 2000-01and compares them with Queensland’s population shares.
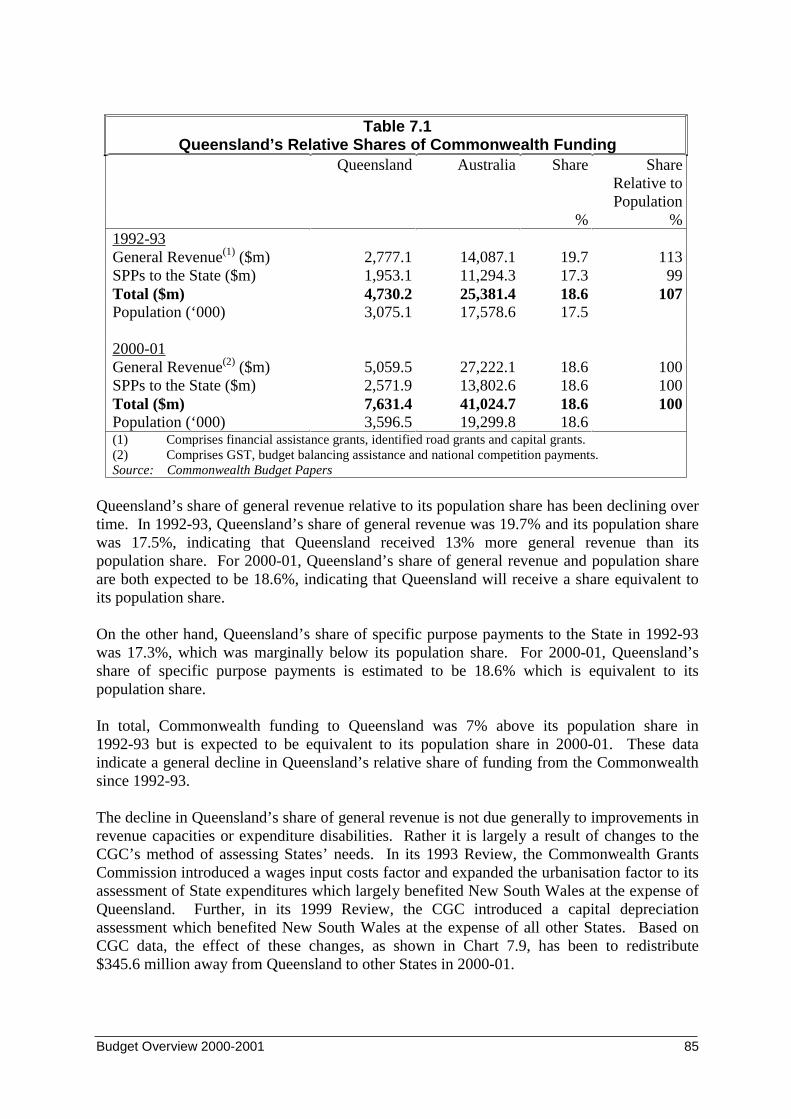
Budget Overview 2000-2001 85
Table 7.1Queensland’s Relative Shares of Commonwealth Funding
Queensland Australia Share ShareRelative toPopulation
% %1992-93General Revenue(1) ($m) 2,777.1 14,087.1 19.7 113SPPs to the State ($m) 1,953.1 11,294.3 17.3 99Total ($m) 4,730.2 25,381.4 18.6 107Population (‘000) 3,075.1 17,578.6 17.5
2000-01General Revenue(2) ($m) 5,059.5 27,222.1 18.6 100SPPs to the State ($m) 2,571.9 13,802.6 18.6 100Total ($m) 7,631.4 41,024.7 18.6 100Population (‘000) 3,596.5 19,299.8 18.6(1) Comprises financial assistance grants, identified road grants and capital grants.(2) Comprises GST, budget balancing assistance and national competition payments.Source: Commonwealth Budget Papers
Queensland’s share of general revenue relative to its population share has been declining overtime. In 1992-93, Queensland’s share of general revenue was 19.7% and its population sharewas 17.5%, indicating that Queensland received 13% more general revenue than itspopulation share. For 2000-01, Queensland’s share of general revenue and population shareare both expected to be 18.6%, indicating that Queensland will receive a share equivalent toits population share.
On the other hand, Queensland’s share of specific purpose payments to the State in 1992-93was 17.3%, which was marginally below its population share. For 2000-01, Queensland’sshare of specific purpose payments is estimated to be 18.6% which is equivalent to itspopulation share.
In total, Commonwealth funding to Queensland was 7% above its population share in1992-93 but is expected to be equivalent to its population share in 2000-01. These dataindicate a general decline in Queensland’s relative share of funding from the Commonwealthsince 1992-93.
The decline in Queensland’s share of general revenue is not due generally to improvements inrevenue capacities or expenditure disabilities. Rather it is largely a result of changes to theCGC’s method of assessing States’ needs. In its 1993 Review, the Commonwealth GrantsCommission introduced a wages input costs factor and expanded the urbanisation factor to itsassessment of State expenditures which largely benefited New South Wales at the expense ofQueensland. Further, in its 1999 Review, the CGC introduced a capital depreciationassessment which benefited New South Wales at the expense of all other States. Based onCGC data, the effect of these changes, as shown in Chart 7.9, has been to redistribute$345.6 million away from Queensland to other States in 2000-01.
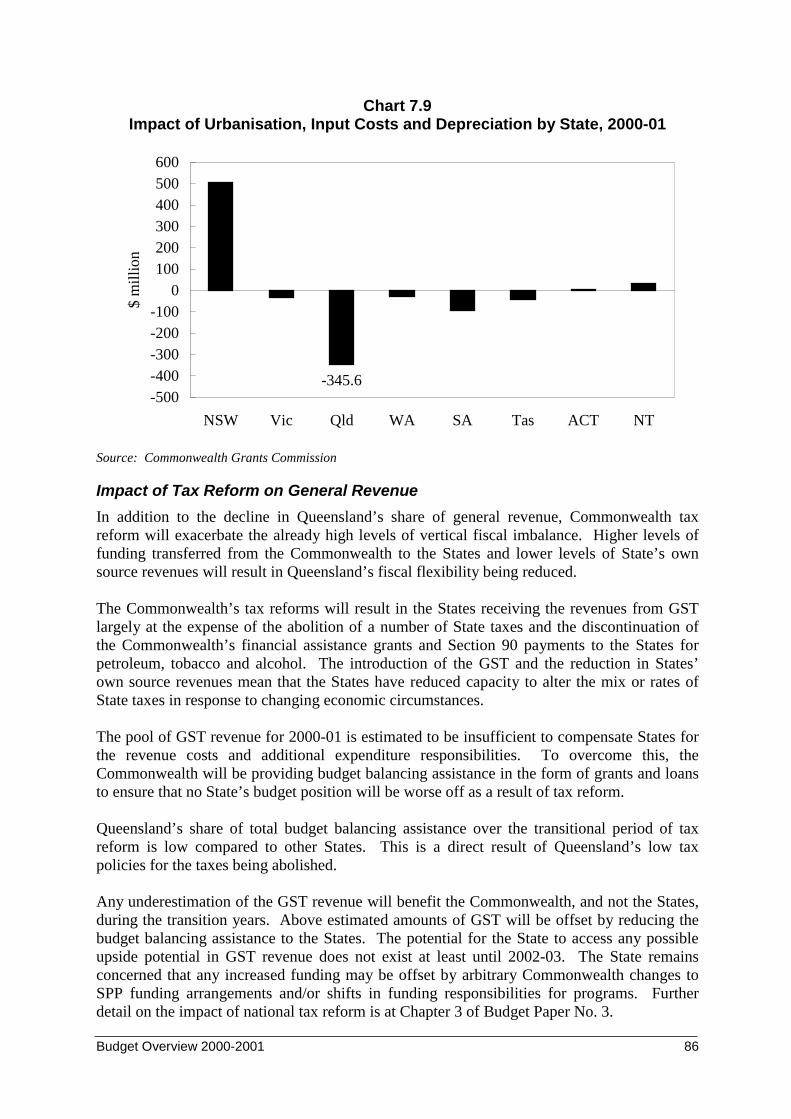
Budget Overview 2000-2001 86
Chart 7.9Impact of Urbanisation, Input Costs and Depreciation by State, 2000-01
-345.6-500-400-300-200-100
0100200300400500600
NSW Vic Qld WA SA Tas ACT NT
$ m
illio
n
Source: Commonwealth Grants Commission
Impact of Tax Reform on General Revenue
In addition to the decline in Queensland’s share of general revenue, Commonwealth taxreform will exacerbate the already high levels of vertical fiscal imbalance. Higher levels offunding transferred from the Commonwealth to the States and lower levels of State’s ownsource revenues will result in Queensland’s fiscal flexibility being reduced.
The Commonwealth’s tax reforms will result in the States receiving the revenues from GSTlargely at the expense of the abolition of a number of State taxes and the discontinuation ofthe Commonwealth’s financial assistance grants and Section 90 payments to the States forpetroleum, tobacco and alcohol. The introduction of the GST and the reduction in States’own source revenues mean that the States have reduced capacity to alter the mix or rates ofState taxes in response to changing economic circumstances.
The pool of GST revenue for 2000-01 is estimated to be insufficient to compensate States forthe revenue costs and additional expenditure responsibilities. To overcome this, theCommonwealth will be providing budget balancing assistance in the form of grants and loansto ensure that no State’s budget position will be worse off as a result of tax reform.
Queensland’s share of total budget balancing assistance over the transitional period of taxreform is low compared to other States. This is a direct result of Queensland’s low taxpolicies for the taxes being abolished.
Any underestimation of the GST revenue will benefit the Commonwealth, and not the States,during the transition years. Above estimated amounts of GST will be offset by reducing thebudget balancing assistance to the States. The potential for the State to access any possibleupside potential in GST revenue does not exist at least until 2002-03. The State remainsconcerned that any increased funding may be offset by arbitrary Commonwealth changes toSPP funding arrangements and/or shifts in funding responsibilities for programs. Furtherdetail on the impact of national tax reform is at Chapter 3 of Budget Paper No. 3.
Budget Overview 2000-2001 87
Specific Purpose Payments
Overall, there has been some growth in specific purpose payments to Queensland since1992-93. However, specific purpose payments do not provide full funding of servicesgenerally. Growth in specific purpose payments is generally accompanied by increasedexpenditure responsibilities which ultimately increase demands on the State Budget.
In calculating its relativities, the CGC includes the majority of specific purpose payments inits assessments. This results in offsetting interactions between a State’s level of specificpurpose payments and its general revenue share. In other words, increases in a State’sspecific purpose payments are generally offset by decreases in its share of general revenue.
There are insufficient Commonwealth guarantees on the overall amount of specific purposepayments. In addition, annual growth parameters apply only to a limited number of paymentagreements. The Commonwealth has agreed not to reduce specific purpose payments to theStates as a result of national tax reform. However, this does not prevent the Commonwealthfrom reducing specific purpose payments for reasons other than tax reform.
IMPACT OF PAST TRENDS ON FUTURE FISCAL PERFORMANCEFuture trends in the State’s fiscal position will continue to be affected by external influencessuch as demographic and economic impacts. The Statement of Risks at Attachment Cprovides greater detail on some of the underlying Budget assumptions and specific factors thatcould impact during 2000-01 or in later years, giving an indication as to why the State needsto retain a prudent measure of fiscal flexibility within its Budget.
The State’s strong balance sheet position and commitment to sound fiscal managementprinciples in the Government’s Charter of Social and Fiscal Responsibility will dictate thefiscal outcomes achieved. Based on the long term fiscal trends, the following conclusions canbe drawn regarding Queensland’s future fiscal position:
• the capital program will continue to be framed to meet the service needs of the State,while finding an equilibrium at a level that is sustainable in the long term, consistent withthe Charter principles; and
• the effort to improve the efficiency of Government service delivery and consistent growthin revenue will assist to maintain operating surpluses in the long term.
Queensland’s ability to cope with unexpected external changes is enhanced by the flexibilityoffered by the State’s strong balance sheet position and low tax status. However, underNational Tax Reform, Queensland has been penalised for its low tax status and thearrangements as a whole will reduce the flexibility of the State’s taxation arrangements. IfQueensland is to maintain its strong fiscal position into the long term, it will need to betreated equitably under the arrangements for distribution of GST and other Commonwealthfunding, to allow the State’s growing service and infrastructure demands to be met.

Budget Overview 2000-2001 88
Budget Overview 2000-2001 89
APPENDIX A
GOVERNMENT FINANCE STATISTICSINTRODUCTIONThis appendix contains financial statements for the Queensland Public Sector based onAustralian Bureau of Statistics (ABS) Government Finance Statistics (GFS) standards. Thetables herein provide the detailed Uniform Presentation Framework data required under theAustralian Loan Council arrangements for uniform financial reporting. In line with theserequirements, detailed information for the Public Financial Enterprise sector is not included,however estimated balances are included in General Government and Non-Financial Statesector tables for comparability purposes.
An overview of GFS concepts and the differences between GFS and the General PurposeFinancial Reports (GPFR), as well as a GFS and GPFR reconciliation, is provided inAppendix D. Detailed analysis of the data is provided in Chapters 3, 4 & 5. The tables alsoinclude 1998-99 comparative data which is derived from the 1998-99 audited ConsolidatedFinancial Statements. In some cases, these data have been reclassified to conform with theaccounting treatments applying in the Budget and outyears.
OPERATING POSITIONNET OPERATING RESULTS
The following tables present operating statements for the General Government, PublicTrading Enterprise (PTE) and State Non-PFE sectors on an accrual GFS basis.
The State Non-PFE sector recorded an estimated net operating surplus of $197 million in1999-2000, mainly due to the PTE sector which recorded a net operating surplus of$157 million in 1999-2000.
GENERAL GOVERNMENT
The General Government sector operating result for 2000-01 is a surplus of $29 million($40 million surplus in 1999-2000). Over the forward estimates period, the GeneralGovernment sector is projected to maintain surpluses.
PUBLIC TRADING ENTERPRISES
The PTE sector is projected to have a GFS deficit of $80 million in 2000-01 ($157 millionsurplus in 1999-2000). The sector is projected to record operating surpluses over the forwardestimates period.
STATE NON-PFE SECTOR
The consolidated operating result for the State sector in 2000-01 is a deficit of $51 million($197 million surplus in 1999-2000).
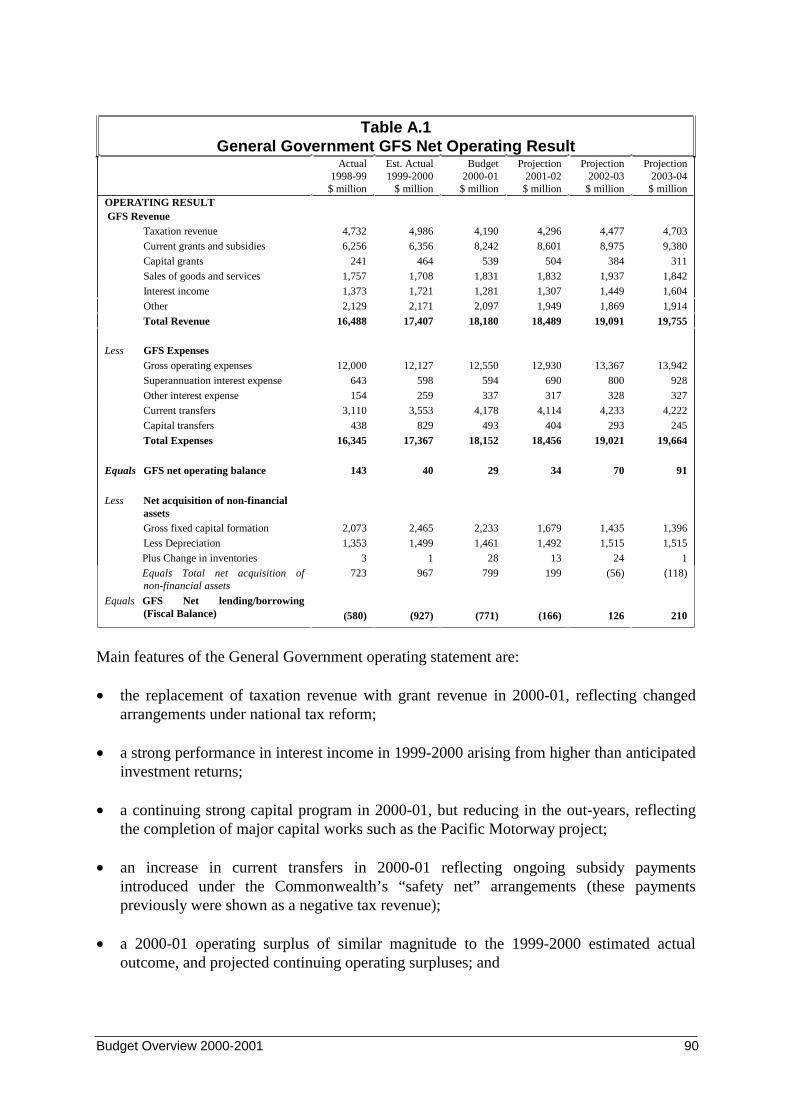
Budget Overview 2000-2001 90
Table A.1General Government GFS Net Operating Result
Actual1998-99
$ million
Est. Actual1999-2000
$ million
Budget2000-01
$ million
Projection2001-02
$ million
Projection2002-03
$ million
Projection2003-04
$ millionOPERATING RESULT GFS Revenue
Taxation revenue 4,732 4,986 4,190 4,296 4,477 4,703
Current grants and subsidies 6,256 6,356 8,242 8,601 8,975 9,380
Capital grants 241 464 539 504 384 311
Sales of goods and services 1,757 1,708 1,831 1,832 1,937 1,842
Interest income 1,373 1,721 1,281 1,307 1,449 1,604
Other 2,129 2,171 2,097 1,949 1,869 1,914
Total Revenue 16,488 17,407 18,180 18,489 19,091 19,755
Less GFS ExpensesGross operating expenses 12,000 12,127 12,550 12,930 13,367 13,942
Superannuation interest expense 643 598 594 690 800 928
Other interest expense 154 259 337 317 328 327
Current transfers 3,110 3,553 4,178 4,114 4,233 4,222
Capital transfers 438 829 493 404 293 245
Total Expenses 16,345 17,367 18,152 18,456 19,021 19,664
Equals GFS net operating balance 143 40 29 34 70 91
Less Net acquisition of non-financialassetsGross fixed capital formation 2,073 2,465 2,233 1,679 1,435 1,396
Less Depreciation 1,353 1,499 1,461 1,492 1,515 1,515
Plus Change in inventories 3 1 28 13 24 1
Equals Total net acquisition ofnon-financial assets
723 967 799 199 (56) (118)
Equals GFS Net lending/borrowing(Fiscal Balance) (580) (927) (771) (166) 126 210
Main features of the General Government operating statement are:
• the replacement of taxation revenue with grant revenue in 2000-01, reflecting changedarrangements under national tax reform;
• a strong performance in interest income in 1999-2000 arising from higher than anticipatedinvestment returns;
• a continuing strong capital program in 2000-01, but reducing in the out-years, reflectingthe completion of major capital works such as the Pacific Motorway project;
• an increase in current transfers in 2000-01 reflecting ongoing subsidy paymentsintroduced under the Commonwealth’s “safety net” arrangements (these paymentspreviously were shown as a negative tax revenue);
• a 2000-01 operating surplus of similar magnitude to the 1999-2000 estimated actualoutcome, and projected continuing operating surpluses; and
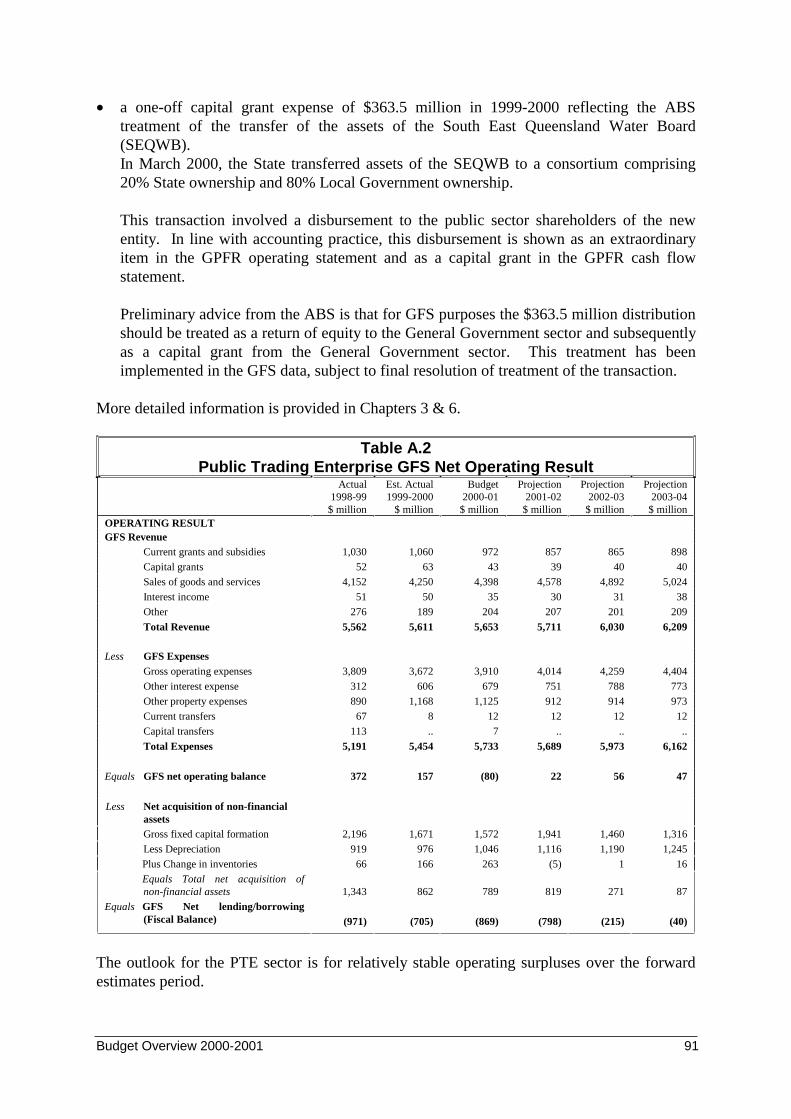
Budget Overview 2000-2001 91
• a one-off capital grant expense of $363.5 million in 1999-2000 reflecting the ABStreatment of the transfer of the assets of the South East Queensland Water Board(SEQWB).In March 2000, the State transferred assets of the SEQWB to a consortium comprising20% State ownership and 80% Local Government ownership.
This transaction involved a disbursement to the public sector shareholders of the newentity. In line with accounting practice, this disbursement is shown as an extraordinaryitem in the GPFR operating statement and as a capital grant in the GPFR cash flowstatement.
Preliminary advice from the ABS is that for GFS purposes the $363.5 million distributionshould be treated as a return of equity to the General Government sector and subsequentlyas a capital grant from the General Government sector. This treatment has beenimplemented in the GFS data, subject to final resolution of treatment of the transaction.
More detailed information is provided in Chapters 3 & 6.
Table A.2Public Trading Enterprise GFS Net Operating Result
Actual1998-99
$ million
Est. Actual1999-2000
$ million
Budget2000-01
$ million
Projection2001-02
$ million
Projection2002-03
$ million
Projection2003-04
$ millionOPERATING RESULTGFS Revenue
Current grants and subsidies 1,030 1,060 972 857 865 898
Capital grants 52 63 43 39 40 40
Sales of goods and services 4,152 4,250 4,398 4,578 4,892 5,024
Interest income 51 50 35 30 31 38
Other 276 189 204 207 201 209
Total Revenue 5,562 5,611 5,653 5,711 6,030 6,209
Less GFS ExpensesGross operating expenses 3,809 3,672 3,910 4,014 4,259 4,404
Other interest expense 312 606 679 751 788 773
Other property expenses 890 1,168 1,125 912 914 973
Current transfers 67 8 12 12 12 12
Capital transfers 113 .. 7 .. .. ..
Total Expenses 5,191 5,454 5,733 5,689 5,973 6,162
Equals GFS net operating balance 372 157 (80) 22 56 47
Less Net acquisition of non-financialassetsGross fixed capital formation 2,196 1,671 1,572 1,941 1,460 1,316
Less Depreciation 919 976 1,046 1,116 1,190 1,245
Plus Change in inventories 66 166 263 (5) 1 16
Equals Total net acquisition ofnon-financial assets 1,343 862 789 819 271 87
Equals GFS Net lending/borrowing(Fiscal Balance) (971) (705) (869) (798) (215) (40)
The outlook for the PTE sector is for relatively stable operating surpluses over the forwardestimates period.
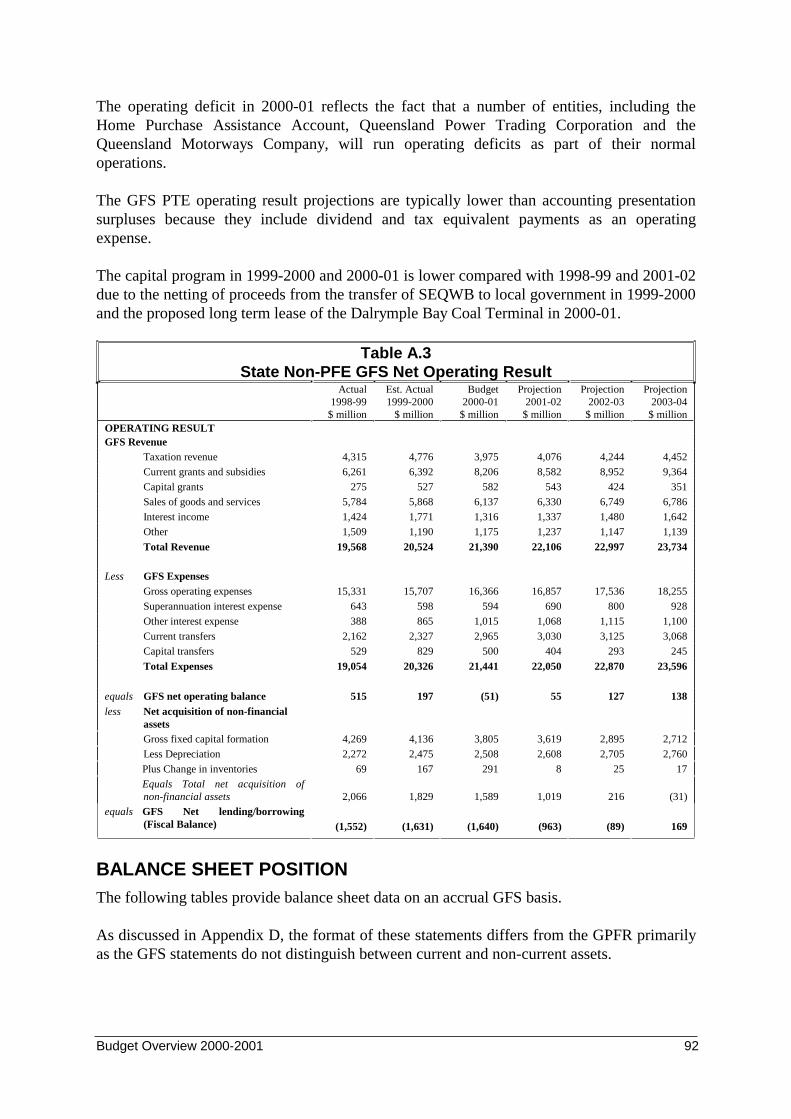
Budget Overview 2000-2001 92
The operating deficit in 2000-01 reflects the fact that a number of entities, including theHome Purchase Assistance Account, Queensland Power Trading Corporation and theQueensland Motorways Company, will run operating deficits as part of their normaloperations.
The GFS PTE operating result projections are typically lower than accounting presentationsurpluses because they include dividend and tax equivalent payments as an operatingexpense.
The capital program in 1999-2000 and 2000-01 is lower compared with 1998-99 and 2001-02due to the netting of proceeds from the transfer of SEQWB to local government in 1999-2000and the proposed long term lease of the Dalrymple Bay Coal Terminal in 2000-01.
Table A.3State Non-PFE GFS Net Operating Result
Actual1998-99
$ million
Est. Actual1999-2000
$ million
Budget2000-01
$ million
Projection2001-02
$ million
Projection2002-03
$ million
Projection2003-04
$ millionOPERATING RESULTGFS Revenue
Taxation revenue 4,315 4,776 3,975 4,076 4,244 4,452
Current grants and subsidies 6,261 6,392 8,206 8,582 8,952 9,364
Capital grants 275 527 582 543 424 351
Sales of goods and services 5,784 5,868 6,137 6,330 6,749 6,786
Interest income 1,424 1,771 1,316 1,337 1,480 1,642
Other 1,509 1,190 1,175 1,237 1,147 1,139
Total Revenue 19,568 20,524 21,390 22,106 22,997 23,734
Less GFS ExpensesGross operating expenses 15,331 15,707 16,366 16,857 17,536 18,255
Superannuation interest expense 643 598 594 690 800 928
Other interest expense 388 865 1,015 1,068 1,115 1,100
Current transfers 2,162 2,327 2,965 3,030 3,125 3,068
Capital transfers 529 829 500 404 293 245
Total Expenses 19,054 20,326 21,441 22,050 22,870 23,596
equals GFS net operating balance 515 197 (51) 55 127 138less Net acquisition of non-financial
assetsGross fixed capital formation 4,269 4,136 3,805 3,619 2,895 2,712
Less Depreciation 2,272 2,475 2,508 2,608 2,705 2,760
Plus Change in inventories 69 167 291 8 25 17
Equals Total net acquisition ofnon-financial assets 2,066 1,829 1,589 1,019 216 (31)
equals GFS Net lending/borrowing(Fiscal Balance) (1,552) (1,631) (1,640) (963) (89) 169
BALANCE SHEET POSITIONThe following tables provide balance sheet data on an accrual GFS basis.
As discussed in Appendix D, the format of these statements differs from the GPFR primarilyas the GFS statements do not distinguish between current and non-current assets.
Budget Overview 2000-2001 93
Equity that the State holds in the PTE sector has been included as an investment asset in theGeneral Government sector, reflecting its ownership role. Accordingly, net worth of theGeneral Government sector is the same as the net worth of the State Non-PFE Sector. This isthe major difference between the accounting and GFS data.
The other major difference in the balance sheet data is that borrowings are shown on a marketvalue basis in the GFS statements whereas in the GPFR statements borrowings are recordedat book value.
GENERAL GOVERNMENT
General Government estimated net worth for 1999-2000 is $57.342 billion, a decrease of$347 million over actual 1998-99 figures. This decrease is a result of the $1.837 billion writedown of the State Water Projects (SWP) assets.
In the absence of the SWP asset write down, which was attributable solely to a change inaccounting policy, the net worth of the General Government sector would have risen by$1.490 billion. A more detailed explanation of the effect of the accounting policy change isprovided in Chapter 4.
PUBLIC TRADING ENTERPRISES
PTE estimated net worth for 2000-01 is $11.808 billion, a decrease of $410 million over the1999-2000 estimated actual. This decrease is due to an expected increase in borrowings byGovernment Owned Corporations as part of the planned capital restructuring of certain PTEs.
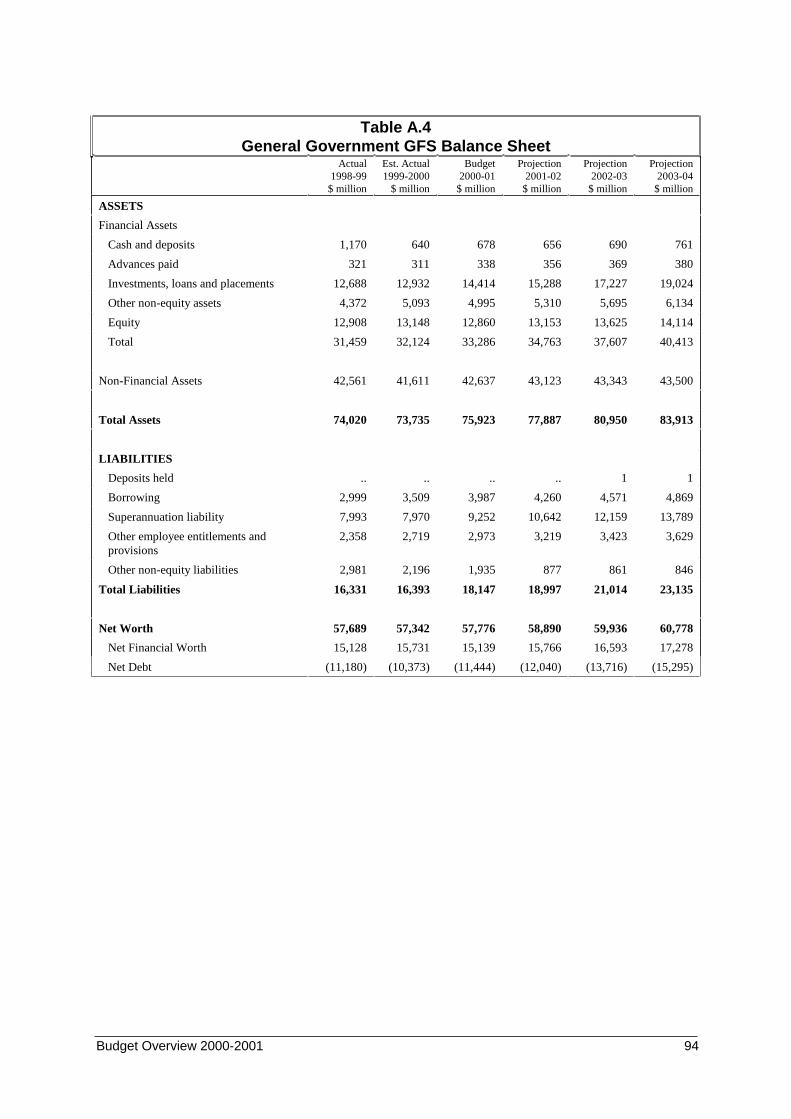
Budget Overview 2000-2001 94
Table A.4General Government GFS Balance Sheet
Actual1998-99
$ million
Est. Actual1999-2000
$ million
Budget2000-01
$ million
Projection2001-02
$ million
Projection2002-03
$ million
Projection2003-04
$ million
ASSETS
Financial Assets
Cash and deposits 1,170 640 678 656 690 761
Advances paid 321 311 338 356 369 380
Investments, loans and placements 12,688 12,932 14,414 15,288 17,227 19,024
Other non-equity assets 4,372 5,093 4,995 5,310 5,695 6,134
Equity 12,908 13,148 12,860 13,153 13,625 14,114
Total 31,459 32,124 33,286 34,763 37,607 40,413
Non-Financial Assets 42,561 41,611 42,637 43,123 43,343 43,500
Total Assets 74,020 73,735 75,923 77,887 80,950 83,913
LIABILITIES
Deposits held .. .. .. .. 1 1
Borrowing 2,999 3,509 3,987 4,260 4,571 4,869
Superannuation liability 7,993 7,970 9,252 10,642 12,159 13,789
Other employee entitlements and provisions
2,358 2,719 2,973 3,219 3,423 3,629
Other non-equity liabilities 2,981 2,196 1,935 877 861 846
Total Liabilities 16,331 16,393 18,147 18,997 21,014 23,135
Net Worth 57,689 57,342 57,776 58,890 59,936 60,778
Net Financial Worth 15,128 15,731 15,139 15,766 16,593 17,278
Net Debt (11,180) (10,373) (11,444) (12,040) (13,716) (15,295)
Budget Overview 2000-2001 95
Main features of the General Government balance sheet are:
• a run-down in cash balances in 1999-2000 to fund capital works;
• a smaller than normal increase in investments in 1999-2000 reflecting the transfer of$1.1 billion of assets from the Government’s future liability accounts to the employees’superannuation funds. This is also reflected in a reduction in superannuation liability in1999-2000; and
• a strong increase in investments in 2000-01 reflecting higher than expectedsuperannuation fund earnings for 1999-2000.
Overall, the General Government balance sheet is exceptionally strong with sufficientinvestments to more than offset all liabilities. Net financial worth is positive and improvingin the outyears. The decrease in net worth in 1999-2000 reflects a $1.837 billion asset writedown in State Water Projects asset values.
Net debt in the sector is negative, with the decrease in 1999-2000 reflecting the transfer of$1.1 billion in investment assets from the Government’s future liability accounts toemployees’ superannuation funds.
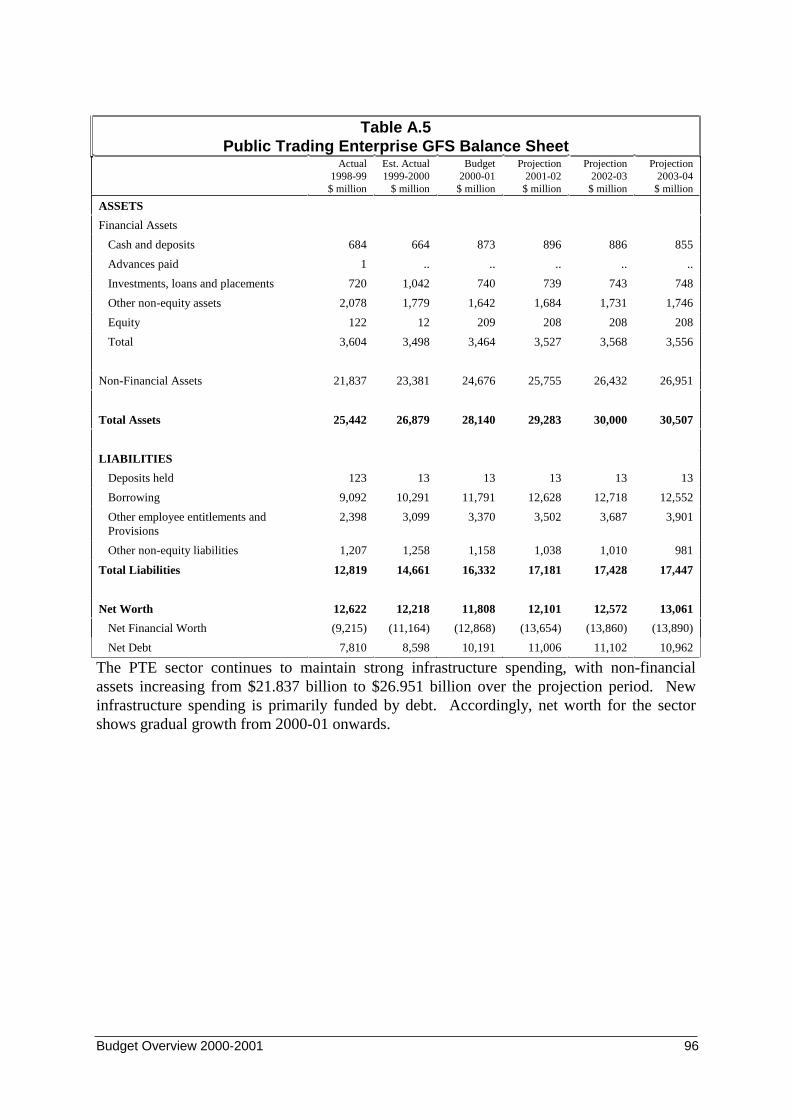
Budget Overview 2000-2001 96
Table A.5Public Trading Enterprise GFS Balance Sheet
Actual1998-99
$ million
Est. Actual1999-2000
$ million
Budget2000-01
$ million
Projection2001-02
$ million
Projection2002-03
$ million
Projection2003-04
$ million
ASSETS
Financial Assets
Cash and deposits 684 664 873 896 886 855
Advances paid 1 .. .. .. .. ..
Investments, loans and placements 720 1,042 740 739 743 748
Other non-equity assets 2,078 1,779 1,642 1,684 1,731 1,746
Equity 122 12 209 208 208 208
Total 3,604 3,498 3,464 3,527 3,568 3,556
Non-Financial Assets 21,837 23,381 24,676 25,755 26,432 26,951
Total Assets 25,442 26,879 28,140 29,283 30,000 30,507
LIABILITIES
Deposits held 123 13 13 13 13 13
Borrowing 9,092 10,291 11,791 12,628 12,718 12,552
Other employee entitlements and Provisions
2,398 3,099 3,370 3,502 3,687 3,901
Other non-equity liabilities 1,207 1,258 1,158 1,038 1,010 981
Total Liabilities 12,819 14,661 16,332 17,181 17,428 17,447
Net Worth 12,622 12,218 11,808 12,101 12,572 13,061
Net Financial Worth (9,215) (11,164) (12,868) (13,654) (13,860) (13,890)
Net Debt 7,810 8,598 10,191 11,006 11,102 10,962
The PTE sector continues to maintain strong infrastructure spending, with non-financialassets increasing from $21.837 billion to $26.951 billion over the projection period. Newinfrastructure spending is primarily funded by debt. Accordingly, net worth for the sectorshows gradual growth from 2000-01 onwards.
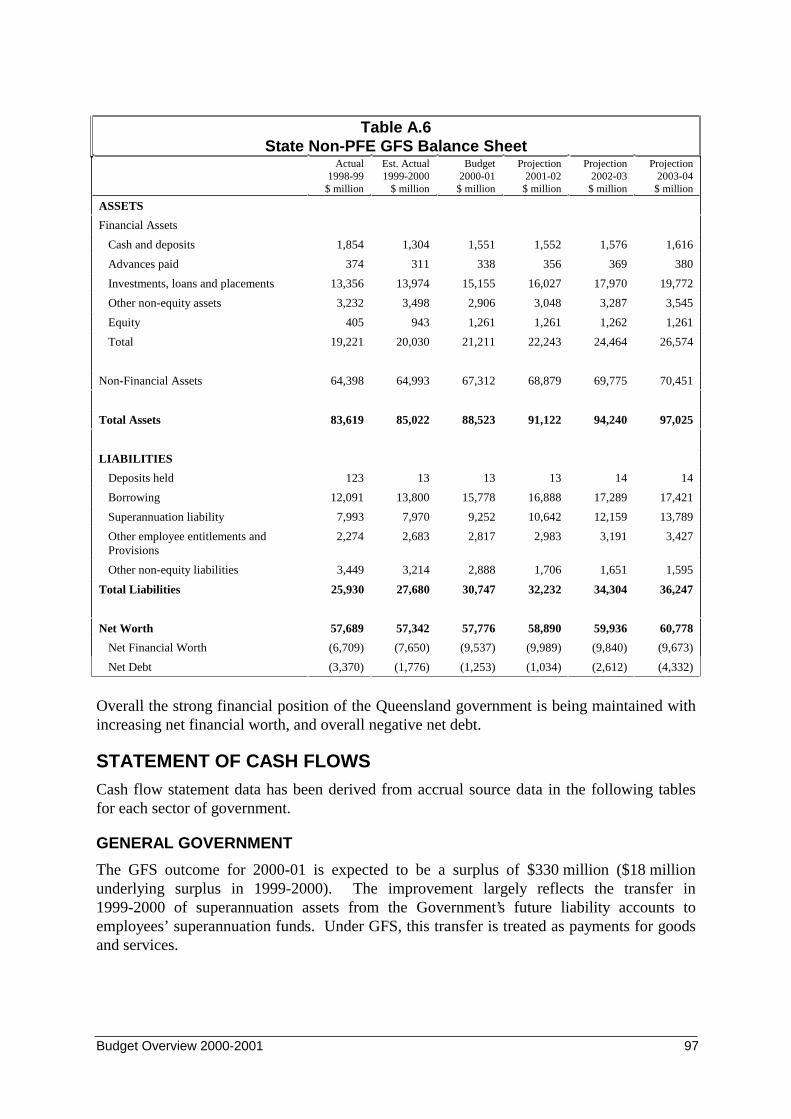
Budget Overview 2000-2001 97
Table A.6State Non-PFE GFS Balance Sheet
Actual1998-99
$ million
Est. Actual1999-2000
$ million
Budget2000-01
$ million
Projection2001-02
$ million
Projection2002-03
$ million
Projection2003-04
$ million
ASSETS
Financial Assets
Cash and deposits 1,854 1,304 1,551 1,552 1,576 1,616
Advances paid 374 311 338 356 369 380
Investments, loans and placements 13,356 13,974 15,155 16,027 17,970 19,772
Other non-equity assets 3,232 3,498 2,906 3,048 3,287 3,545
Equity 405 943 1,261 1,261 1,262 1,261
Total 19,221 20,030 21,211 22,243 24,464 26,574
Non-Financial Assets 64,398 64,993 67,312 68,879 69,775 70,451
Total Assets 83,619 85,022 88,523 91,122 94,240 97,025
LIABILITIES
Deposits held 123 13 13 13 14 14
Borrowing 12,091 13,800 15,778 16,888 17,289 17,421
Superannuation liability 7,993 7,970 9,252 10,642 12,159 13,789
Other employee entitlements and Provisions
2,274 2,683 2,817 2,983 3,191 3,427
Other non-equity liabilities 3,449 3,214 2,888 1,706 1,651 1,595
Total Liabilities 25,930 27,680 30,747 32,232 34,304 36,247
Net Worth 57,689 57,342 57,776 58,890 59,936 60,778
Net Financial Worth (6,709) (7,650) (9,537) (9,989) (9,840) (9,673)
Net Debt (3,370) (1,776) (1,253) (1,034) (2,612) (4,332)
Overall the strong financial position of the Queensland government is being maintained withincreasing net financial worth, and overall negative net debt.
STATEMENT OF CASH FLOWSCash flow statement data has been derived from accrual source data in the following tablesfor each sector of government.
GENERAL GOVERNMENT
The GFS outcome for 2000-01 is expected to be a surplus of $330 million ($18 millionunderlying surplus in 1999-2000). The improvement largely reflects the transfer in1999-2000 of superannuation assets from the Government’s future liability accounts toemployees’ superannuation funds. Under GFS, this transfer is treated as payments for goodsand services.
Budget Overview 2000-2001 98
Lower expenditure on non-financial assets due to the completion of recent major capitalworks projects and an improvement in the operating cash position also contribute to theprojected surplus in 2000-01 (particularly interest earnings from the State’s superannuationinvestments).
In the outyears, the situation is expected to improve, with a surplus of $1.611 billion expectedby 2003-04. This improving trend largely reflects lower levels of capital expenditure in theoutyears, aided by a stronger operating surplus.
PUBLIC TRADING ENTERPRISES
The expected GFS outcome for 2000-01 is a deficit of $526 million ($561 million deficit in1999-2000).
The sector also shows an improving trend in the outyears due largely to projected lower levelsof capital expenditure.
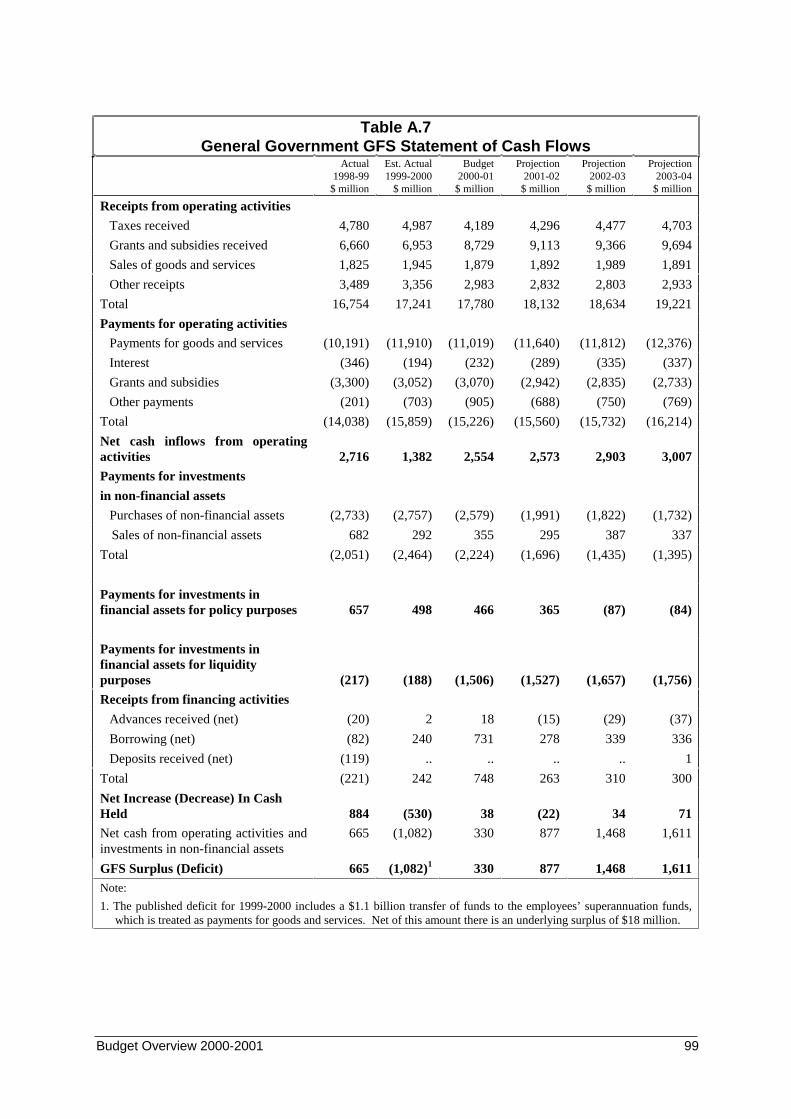
Budget Overview 2000-2001 99
Table A.7General Government GFS Statement of Cash Flows
Actual1998-99
$ million
Est. Actual1999-2000
$ million
Budget2000-01
$ million
Projection2001-02
$ million
Projection2002-03
$ million
Projection2003-04
$ million
Receipts from operating activities
Taxes received 4,780 4,987 4,189 4,296 4,477 4,703
Grants and subsidies received 6,660 6,953 8,729 9,113 9,366 9,694
Sales of goods and services 1,825 1,945 1,879 1,892 1,989 1,891
Other receipts 3,489 3,356 2,983 2,832 2,803 2,933
Total 16,754 17,241 17,780 18,132 18,634 19,221
Payments for operating activities
Payments for goods and services (10,191) (11,910) (11,019) (11,640) (11,812) (12,376)
Interest (346) (194) (232) (289) (335) (337)
Grants and subsidies (3,300) (3,052) (3,070) (2,942) (2,835) (2,733)
Other payments (201) (703) (905) (688) (750) (769)
Total (14,038) (15,859) (15,226) (15,560) (15,732) (16,214)
Net cash inflows from operatingactivities 2,716 1,382 2,554 2,573 2,903 3,007
Payments for investments
in non-financial assets
Purchases of non-financial assets (2,733) (2,757) (2,579) (1,991) (1,822) (1,732)
Sales of non-financial assets 682 292 355 295 387 337
Total (2,051) (2,464) (2,224) (1,696) (1,435) (1,395)
Payments for investments infinancial assets for policy purposes 657 498 466 365 (87) (84)
Payments for investments infinancial assets for liquiditypurposes (217) (188) (1,506) (1,527) (1,657) (1,756)
Receipts from financing activities
Advances received (net) (20) 2 18 (15) (29) (37)
Borrowing (net) (82) 240 731 278 339 336
Deposits received (net) (119) .. .. .. .. 1
Total (221) 242 748 263 310 300
Net Increase (Decrease) In CashHeld 884 (530) 38 (22) 34 71
Net cash from operating activities andinvestments in non-financial assets
665 (1,082) 330 877 1,468 1,611
GFS Surplus (Deficit) 665 (1,082)1 330 877 1,468 1,611Note:
1. The published deficit for 1999-2000 includes a $1.1 billion transfer of funds to the employees’ superannuation funds,which is treated as payments for goods and services. Net of this amount there is an underlying surplus of $18 million.
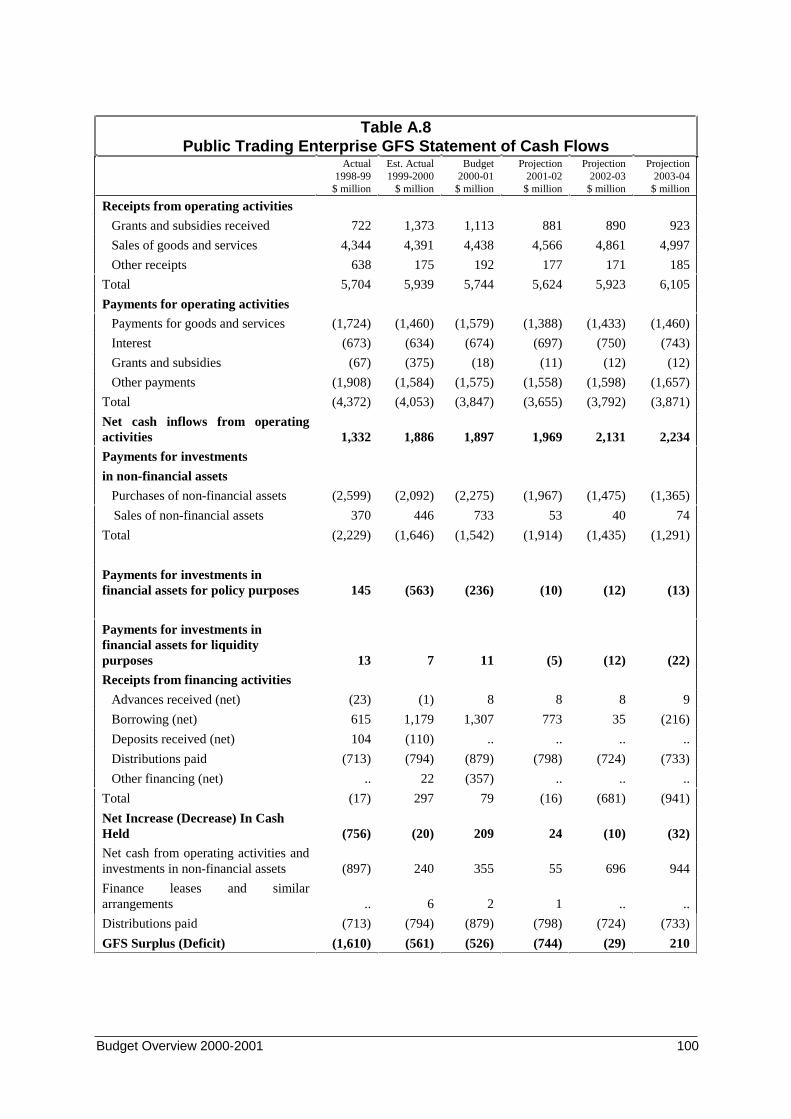
Budget Overview 2000-2001 100
Table A.8Public Trading Enterprise GFS Statement of Cash Flows
Actual1998-99
$ million
Est. Actual1999-2000
$ million
Budget2000-01
$ million
Projection2001-02
$ million
Projection2002-03
$ million
Projection2003-04
$ million
Receipts from operating activities
Grants and subsidies received 722 1,373 1,113 881 890 923
Sales of goods and services 4,344 4,391 4,438 4,566 4,861 4,997
Other receipts 638 175 192 177 171 185
Total 5,704 5,939 5,744 5,624 5,923 6,105
Payments for operating activities
Payments for goods and services (1,724) (1,460) (1,579) (1,388) (1,433) (1,460)
Interest (673) (634) (674) (697) (750) (743)
Grants and subsidies (67) (375) (18) (11) (12) (12)
Other payments (1,908) (1,584) (1,575) (1,558) (1,598) (1,657)
Total (4,372) (4,053) (3,847) (3,655) (3,792) (3,871)
Net cash inflows from operatingactivities 1,332 1,886 1,897 1,969 2,131 2,234
Payments for investments
in non-financial assets
Purchases of non-financial assets (2,599) (2,092) (2,275) (1,967) (1,475) (1,365)
Sales of non-financial assets 370 446 733 53 40 74
Total (2,229) (1,646) (1,542) (1,914) (1,435) (1,291)
Payments for investments infinancial assets for policy purposes 145 (563) (236) (10) (12) (13)
Payments for investments infinancial assets for liquiditypurposes 13 7 11 (5) (12) (22)
Receipts from financing activities
Advances received (net) (23) (1) 8 8 8 9
Borrowing (net) 615 1,179 1,307 773 35 (216)
Deposits received (net) 104 (110) .. .. .. ..
Distributions paid (713) (794) (879) (798) (724) (733)
Other financing (net) .. 22 (357) .. .. ..
Total (17) 297 79 (16) (681) (941)
Net Increase (Decrease) In CashHeld (756) (20) 209 24 (10) (32)
Net cash from operating activities andinvestments in non-financial assets (897) 240 355 55 696 944
Finance leases and similararrangements .. 6 2 1 .. ..
Distributions paid (713) (794) (879) (798) (724) (733)
GFS Surplus (Deficit) (1,610) (561) (526) (744) (29) 210
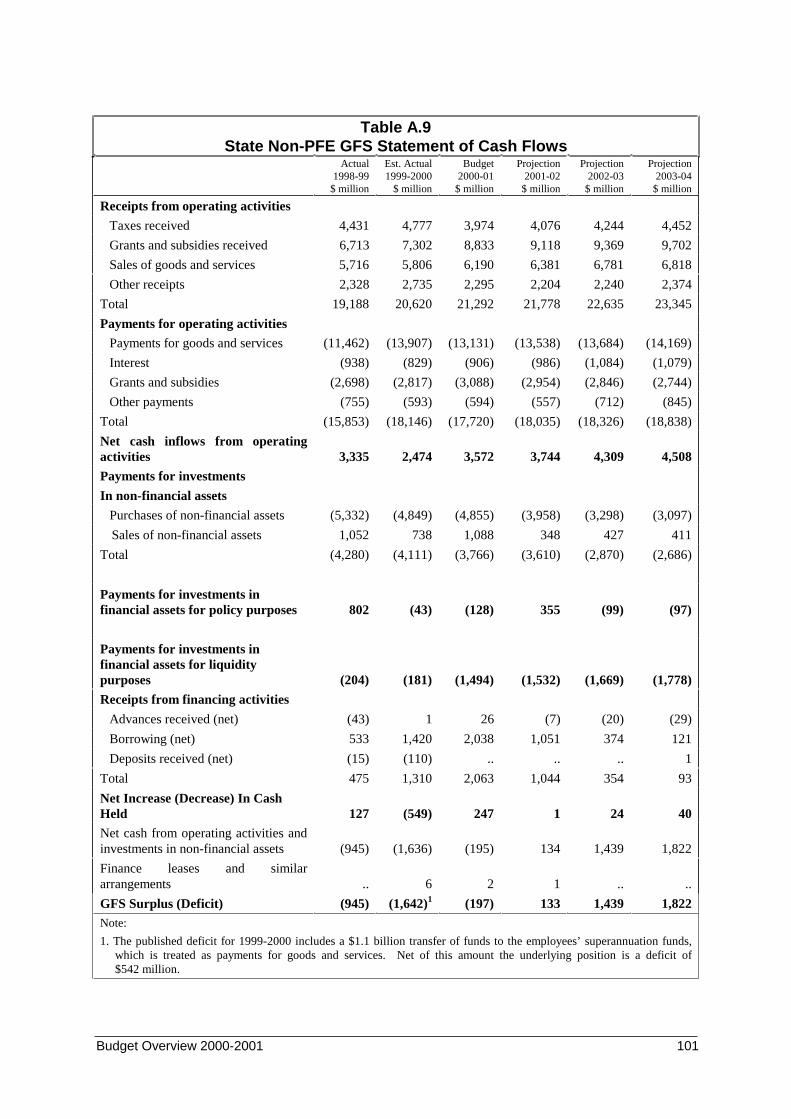
Budget Overview 2000-2001 101
Table A.9State Non-PFE GFS Statement of Cash Flows
Actual1998-99
$ million
Est. Actual1999-2000
$ million
Budget2000-01
$ million
Projection2001-02
$ million
Projection2002-03
$ million
Projection2003-04
$ million
Receipts from operating activities
Taxes received 4,431 4,777 3,974 4,076 4,244 4,452
Grants and subsidies received 6,713 7,302 8,833 9,118 9,369 9,702
Sales of goods and services 5,716 5,806 6,190 6,381 6,781 6,818
Other receipts 2,328 2,735 2,295 2,204 2,240 2,374
Total 19,188 20,620 21,292 21,778 22,635 23,345
Payments for operating activities
Payments for goods and services (11,462) (13,907) (13,131) (13,538) (13,684) (14,169)
Interest (938) (829) (906) (986) (1,084) (1,079)
Grants and subsidies (2,698) (2,817) (3,088) (2,954) (2,846) (2,744)
Other payments (755) (593) (594) (557) (712) (845)
Total (15,853) (18,146) (17,720) (18,035) (18,326) (18,838)
Net cash inflows from operatingactivities 3,335 2,474 3,572 3,744 4,309 4,508
Payments for investments
In non-financial assets
Purchases of non-financial assets (5,332) (4,849) (4,855) (3,958) (3,298) (3,097)
Sales of non-financial assets 1,052 738 1,088 348 427 411
Total (4,280) (4,111) (3,766) (3,610) (2,870) (2,686)
Payments for investments infinancial assets for policy purposes 802 (43) (128) 355 (99) (97)
Payments for investments infinancial assets for liquiditypurposes (204) (181) (1,494) (1,532) (1,669) (1,778)
Receipts from financing activities
Advances received (net) (43) 1 26 (7) (20) (29)
Borrowing (net) 533 1,420 2,038 1,051 374 121
Deposits received (net) (15) (110) .. .. .. 1
Total 475 1,310 2,063 1,044 354 93
Net Increase (Decrease) In CashHeld 127 (549) 247 1 24 40
Net cash from operating activities andinvestments in non-financial assets (945) (1,636) (195) 134 1,439 1,822
Finance leases and similararrangements .. 6 2 1 .. ..
GFS Surplus (Deficit) (945) (1,642)1 (197) 133 1,439 1,822Note:
1. The published deficit for 1999-2000 includes a $1.1 billion transfer of funds to the employees’ superannuation funds,which is treated as payments for goods and services. Net of this amount the underlying position is a deficit of$542 million.
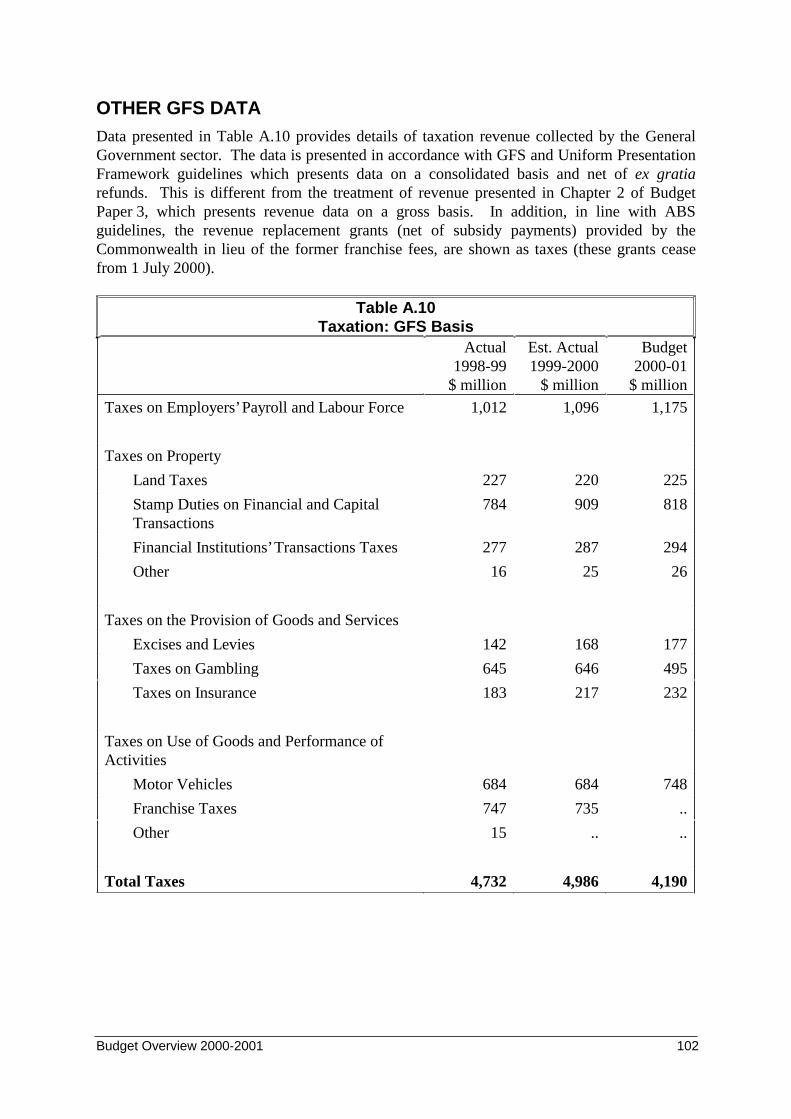
Budget Overview 2000-2001 102
OTHER GFS DATAData presented in Table A.10 provides details of taxation revenue collected by the GeneralGovernment sector. The data is presented in accordance with GFS and Uniform PresentationFramework guidelines which presents data on a consolidated basis and net of ex gratiarefunds. This is different from the treatment of revenue presented in Chapter 2 of BudgetPaper 3, which presents revenue data on a gross basis. In addition, in line with ABSguidelines, the revenue replacement grants (net of subsidy payments) provided by theCommonwealth in lieu of the former franchise fees, are shown as taxes (these grants ceasefrom 1 July 2000).
Table A.10Taxation: GFS Basis
Actual1998-99
$ million
Est. Actual1999-2000
$ million
Budget2000-01
$ million
Taxes on Employers’ Payroll and Labour Force 1,012 1,096 1,175
Taxes on Property
Land Taxes 227 220 225
Stamp Duties on Financial and CapitalTransactions
784 909 818
Financial Institutions’ Transactions Taxes 277 287 294
Other 16 25 26
Taxes on the Provision of Goods and Services
Excises and Levies 142 168 177
Taxes on Gambling 645 646 495
Taxes on Insurance 183 217 232
Taxes on Use of Goods and Performance ofActivities
Motor Vehicles 684 684 748
Franchise Taxes 747 735 ..
Other 15 .. ..
Total Taxes 4,732 4,986 4,190
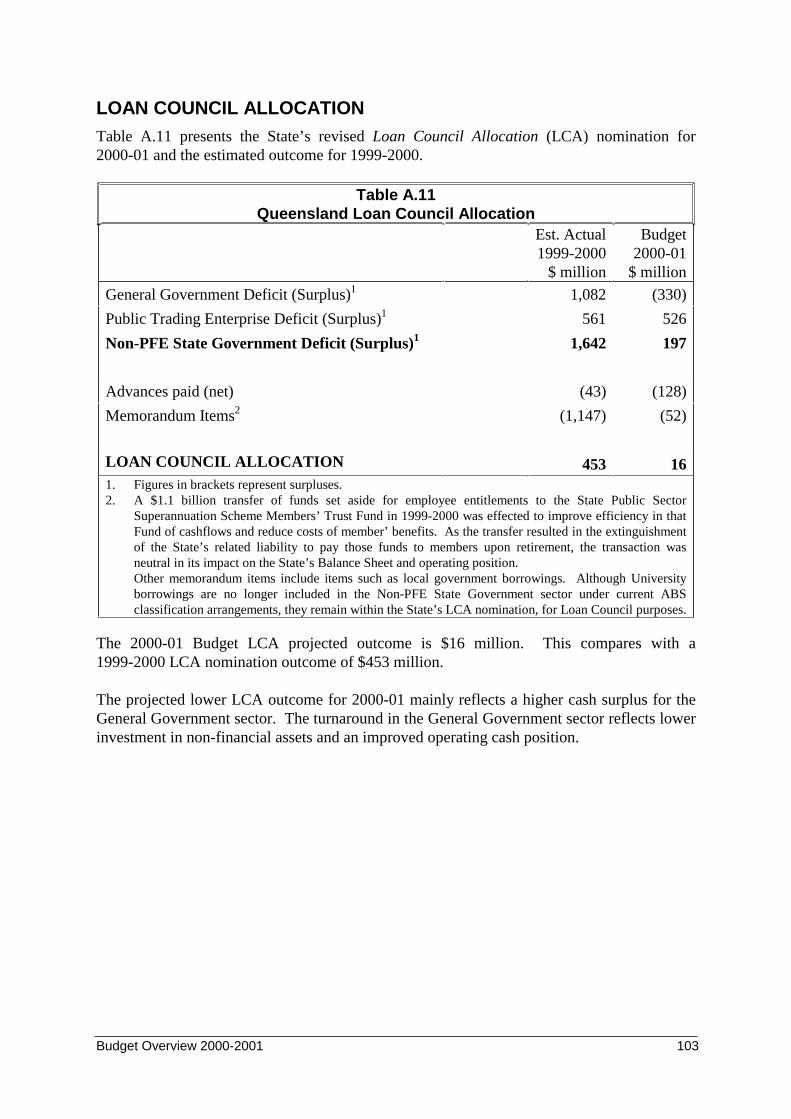
Budget Overview 2000-2001 103
LOAN COUNCIL ALLOCATIONTable A.11 presents the State’s revised Loan Council Allocation (LCA) nomination for2000-01 and the estimated outcome for 1999-2000.
Table A.11Queensland Loan Council Allocation
Est. Actual1999-2000
$ million
Budget2000-01
$ million
General Government Deficit (Surplus)1 1,082 (330)
Public Trading Enterprise Deficit (Surplus)1 561 526
Non-PFE State Government Deficit (Surplus)1 1,642 197
Advances paid (net) (43) (128)
Memorandum Items2 (1,147) (52)
LOAN COUNCIL ALLOCATION 453 161. Figures in brackets represent surpluses.2. A $1.1 billion transfer of funds set aside for employee entitlements to the State Public Sector
Superannuation Scheme Members’ Trust Fund in 1999-2000 was effected to improve efficiency in thatFund of cashflows and reduce costs of member’ benefits. As the transfer resulted in the extinguishmentof the State’s related liability to pay those funds to members upon retirement, the transaction wasneutral in its impact on the State’s Balance Sheet and operating position.Other memorandum items include items such as local government borrowings. Although Universityborrowings are no longer included in the Non-PFE State Government sector under current ABSclassification arrangements, they remain within the State’s LCA nomination, for Loan Council purposes.
The 2000-01 Budget LCA projected outcome is $16 million. This compares with a1999-2000 LCA nomination outcome of $453 million.
The projected lower LCA outcome for 2000-01 mainly reflects a higher cash surplus for theGeneral Government sector. The turnaround in the General Government sector reflects lowerinvestment in non-financial assets and an improved operating cash position.
Budget Overview 2000-2001 104
APPENDIX B
FINANCIAL STATEMENTS – GENERAL PURPOSEFINANCIAL REPORT PRESENTATIONINTRODUCTIONThe budgeted financial statements in this appendix comprise a Statement of FinancialPerformance, Statement of Financial Position and a Statement of Cash Flows for the GeneralGovernment, Public Trading Enterprises and Total (Non-Public Financial Enterprises) StateSectors for the year 2000-01 together with outyear projections to 2003-04. Comparativeinformation, representing 1998-99 actual figures and 1999-2000 estimated actual figures alsoare shown.
BASIS OF REPORTS
The General Purpose Financial Report (GPFR) statements contained in this appendix havebeen prepared in accordance with generally accepted accounting principles, including AAS24 Consolidated Financial Reports.
They differ from the statements contained in Appendix A, which are prepared in terms ofGovernment Finance Statistics (GFS) Standards and the Accrual Uniform PresentationFramework of the Australian Loan Council.
For this reason, the operating results as per the GPFR presentation in this appendix differfrom the operating results recorded in the GFS presentation.
Reconciliation between the two perspectives and further explanation as to the differencesbetween the GPFR and GFS presentations are provided in Appendix D.
The accounting policies adopted in the preparation of the 2000-01 budgeted statements andoutyear projections generally are consistent with those used for the 1999-2000 estimatedactual results. However, the format of the Budgeted Statements of Financial Performance hasbeen varied to conform to revised Australian Accounting Standard AAS1 Statement ofFinancial Performance.
In terms of that standard, abnormal items no longer are disclosed separately on the face of theStatements of Financial Performance but form part of revenues and expenses from ordinaryactivities. In addition, borrowing costs now are shown separately on the face of thestatements.
The 1998-99 actual figures and 1999-2000 estimated actual figures have been restated, whereappropriate, to conform to the new format and to ensure valid comparisons.
All estimates and projections assume a continuation of the policies reflected in the outputsproposed to be delivered by agencies, including new initiatives.
Budget Overview 2000-2001 105
In the Government’s capacity as a taxpayer under the Commonwealth’s Goods and ServicesTax (GST) arrangements, which applied from 1 July 2000, the budgeted financial statementsdo not include any estimates relating to GST, as there is insufficient historical data availableto calculate these amounts. A similar reporting position also has been adopted by a numberof other State jurisdictions.Allowance has been made, however, for higher expenses in the case of public housing andfinancial services as these items are input taxed and therefore, GST paid by State BudgetSector entities will not be recoverable.
For disclosure purposes, inter and intra-entity transactions and balances have been eliminatedin the financial statements, where they are material and to the extent practicable.
Only those agencies considered material by virtue of the size of their financial operations orbalances are consolidated for the purposes of this appendix. These agencies are listed inAppendix D.
The Budgeted Statements of Financial Position adopt historical cost accounting principlesexcept for certain assets and liabilities, principally non-current physical assets and loanborrowings that generally, are at valuation.
In terms of Queensland Treasury’s Guidelines for the Recording and Valuation ofNon-Current Physical Assets in the Queensland Public Sector, all non-current physical assetsare valued using ‘deprival value’ methodology except for certain State water infrastructureassets that now are carried at ‘fair value’.
All comparatives in the commentary sections of this appendix relate to 1999-2000 estimatedactual figures.
Also included in this appendix is a range of notes to the financial statements to facilitatebetter the analysis of data contained in the statements.
SCOPE OF STATEMENTS
The anticipated revenues, expenses and net operating results for each sector are shown in theBudgeted Statements of Financial Performance. The projected assets and liabilities and theGovernment’s equity in the respective sectors are detailed in the Budgeted Statements ofFinancial Position.
The Budgeted Statements of Cash Flows indicate the ability of the respective sectors togenerate sufficient cash flows to meet their financial commitments as they fall due. Theyalso indicate the ability of the respective sectors to fund changes in the scope and/or nature oftheir activities and to obtain external finance, where this is necessary.
The contingent assets and liabilities of the various sectors are not recognised in the BudgetedStatements of Financial Position as they represent items where there is significant uncertaintyat balance date, as to the necessity for the Government to receive or make payments inrespect of them.
Budget Overview 2000-2001 106
The value of certain assets, including State quarry resources, State native forestry resources(but not self-generating and regenerating assets such as the State’s commercial forests), landunder roads and railway corridor land also are not included in the Statements of FinancialPosition. This is due to the difficulty in determining a reliable deprival value for these assets.
Although the value of the collections held by the State Art Gallery, State Museum and StateLibrary are valued and recognised in the Budgeted Statements of Financial Position, certainother manuscripts, historical artifacts and heritage assets are excluded because of the uniquenature of the items and/or the difficulty in determining a reliable deprival value. Based on awhole of Government position, it is considered that the value of these items is not material.
From 1 July 1999, new intangible assets with a value greater than an asset recognitionthreshold (maximum of $50,000) must be recognised by public sector agencies. In a numberof instances, intangibles prior to this date have been expensed.
GENERAL GOVERNMENT SECTORThe primary function of General Government Sector (GGS) agencies is to provide publicservices that are non-trading in nature and that are for the collective benefit of thecommunity, involve the transfer or redistribution of income and are financed largely by wayof grants, taxes, fees and other compulsory charges.
The sector comprises the core ministerial departments as well as a number of statutory bodiesthat deliver services of a General Government nature.
GENERAL GOVERNMENT SECTOR - BUDGETED STATEMENT OF FINANCIALPERFORMANCE
This statement, Table B.1, sets out the estimated actual and budgeted revenues and expensesof the sector for the years shown, together with anticipated extraordinary items.
The net operating result of the sector, which represents the surplus/deficit of revenues lessexpenses and extraordinary items, also forms part of the movement in the accumulatedsurpluses and general equity of the sector for the year as shown in the Statement of FinancialPosition, Table B.2.
As indicated previously, a reconciliation between the GPFR operating results as indicated inthis appendix and the GFS operating results shown in Appendix A is contained inAppendix D.
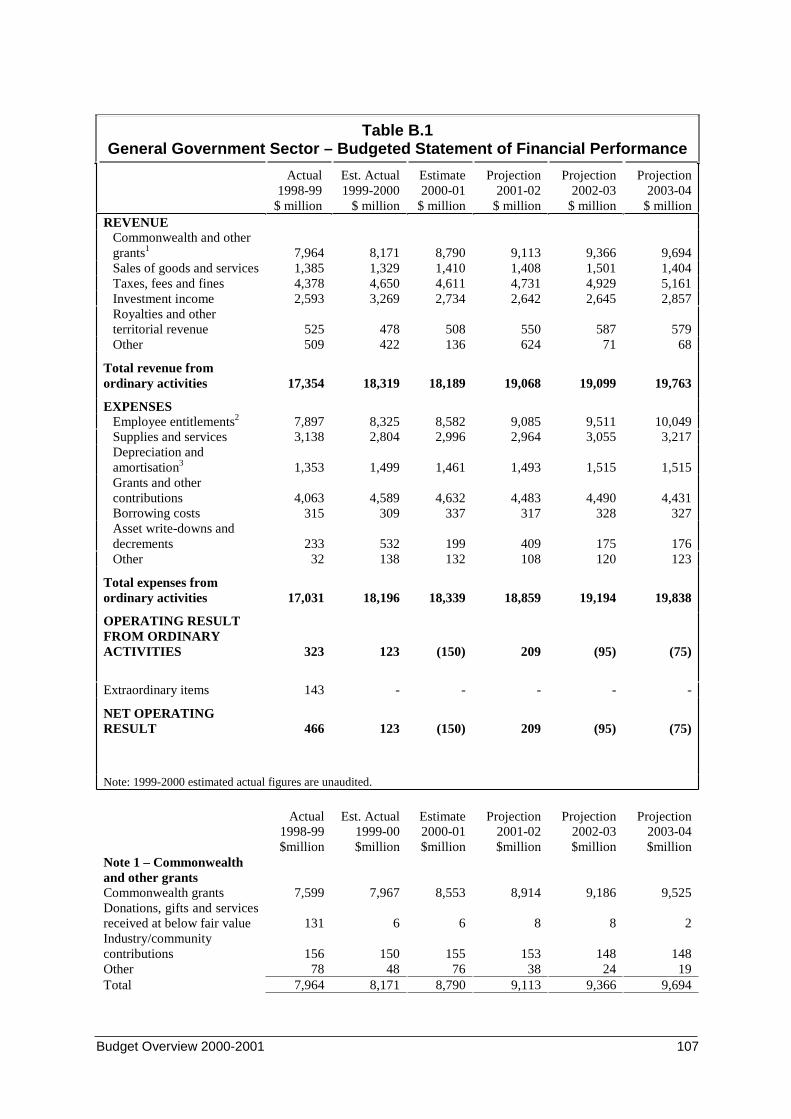
Budget Overview 2000-2001 107
Table B.1General Government Sector – Budgeted Statement of Financial Performance
Actual1998-99
$ million
Est. Actual1999-2000
$ million
Estimate2000-01
$ million
Projection2001-02
$ million
Projection2002-03
$ million
Projection2003-04
$ millionREVENUE
Commonwealth and othergrants1 7,964 8,171 8,790 9,113 9,366 9,694Sales of goods and services 1,385 1,329 1,410 1,408 1,501 1,404Taxes, fees and fines 4,378 4,650 4,611 4,731 4,929 5,161Investment income 2,593 3,269 2,734 2,642 2,645 2,857Royalties and otherterritorial revenue 525 478 508 550 587 579Other 509 422 136 624 71 68
Total revenue fromordinary activities 17,354 18,319 18,189 19,068 19,099 19,763
EXPENSESEmployee entitlements2 7,897 8,325 8,582 9,085 9,511 10,049Supplies and services 3,138 2,804 2,996 2,964 3,055 3,217Depreciation andamortisation3 1,353 1,499 1,461 1,493 1,515 1,515Grants and othercontributionsBorrowing costs
4,063315
4,589309
4,632337
4,483317
4,490328
4,431327
Asset write-downs anddecrements 233 532 199 409 175 176Other 32 138 132 108 120 123
Total expenses fromordinary activities 17,031 18,196 18,339 18,859 19,194 19,838
OPERATING RESULTFROM ORDINARYACTIVITIES 323 123 (150) 209 (95) (75)
Extraordinary items 143 - - - - -
NET OPERATINGRESULT 466 123 (150) 209 (95) (75)
Note: 1999-2000 estimated actual figures are unaudited.
Actual 1998-99 $million
Est. Actual 1999-00 $million
Estimate 2000-01 $million
Projection 2001-02 $million
Projection 2002-03 $million
Projection 2003-04 $million
Note 1 – Commonwealthand other grantsCommonwealth grants 7,599 7,967 8,553 8,914 9,186 9,525Donations, gifts and servicesreceived at below fair value 131 6 6 8 8 2Industry/communitycontributions 156 150 155 153 148 148Other 78 48 76 38 24 19Total 7,964 8,171 8,790 9,113 9,366 9,694
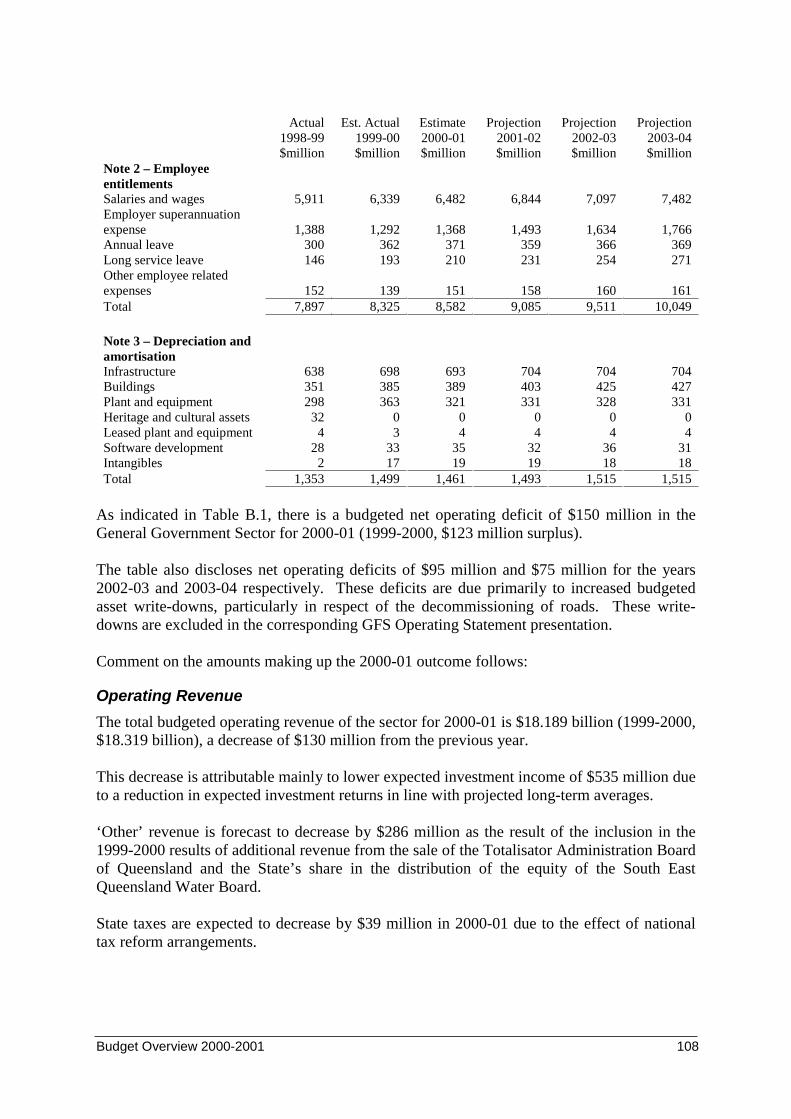
Budget Overview 2000-2001 108
Actual 1998-99 $million
Est. Actual 1999-00 $million
Estimate 2000-01 $million
Projection 2001-02 $million
Projection 2002-03 $million
Projection 2003-04 $million
Note 2 – EmployeeentitlementsSalaries and wages 5,911 6,339 6,482 6,844 7,097 7,482Employer superannuationexpense 1,388 1,292 1,368 1,493 1,634 1,766Annual leave 300 362 371 359 366 369Long service leave 146 193 210 231 254 271Other employee relatedexpenses 152 139 151 158 160 161Total 7,897 8,325 8,582 9,085 9,511 10,049
Note 3 – Depreciation andamortisationInfrastructure 638 698 693 704 704 704Buildings 351 385 389 403 425 427Plant and equipment 298 363 321 331 328 331Heritage and cultural assets 32 0 0 0 0 0Leased plant and equipment 4 3 4 4 4 4Software development 28 33 35 32 36 31Intangibles 2 17 19 19 18 18Total 1,353 1,499 1,461 1,493 1,515 1,515
As indicated in Table B.1, there is a budgeted net operating deficit of $150 million in theGeneral Government Sector for 2000-01 (1999-2000, $123 million surplus).
The table also discloses net operating deficits of $95 million and $75 million for the years2002-03 and 2003-04 respectively. These deficits are due primarily to increased budgetedasset write-downs, particularly in respect of the decommissioning of roads. These write-downs are excluded in the corresponding GFS Operating Statement presentation.
Comment on the amounts making up the 2000-01 outcome follows:
Operating Revenue
The total budgeted operating revenue of the sector for 2000-01 is $18.189 billion (1999-2000,$18.319 billion), a decrease of $130 million from the previous year.
This decrease is attributable mainly to lower expected investment income of $535 million dueto a reduction in expected investment returns in line with projected long-term averages.
‘Other’ revenue is forecast to decrease by $286 million as the result of the inclusion in the1999-2000 results of additional revenue from the sale of the Totalisator Administration Boardof Queensland and the State’s share in the distribution of the equity of the South EastQueensland Water Board.
State taxes are expected to decrease by $39 million in 2000-01 due to the effect of nationaltax reform arrangements.
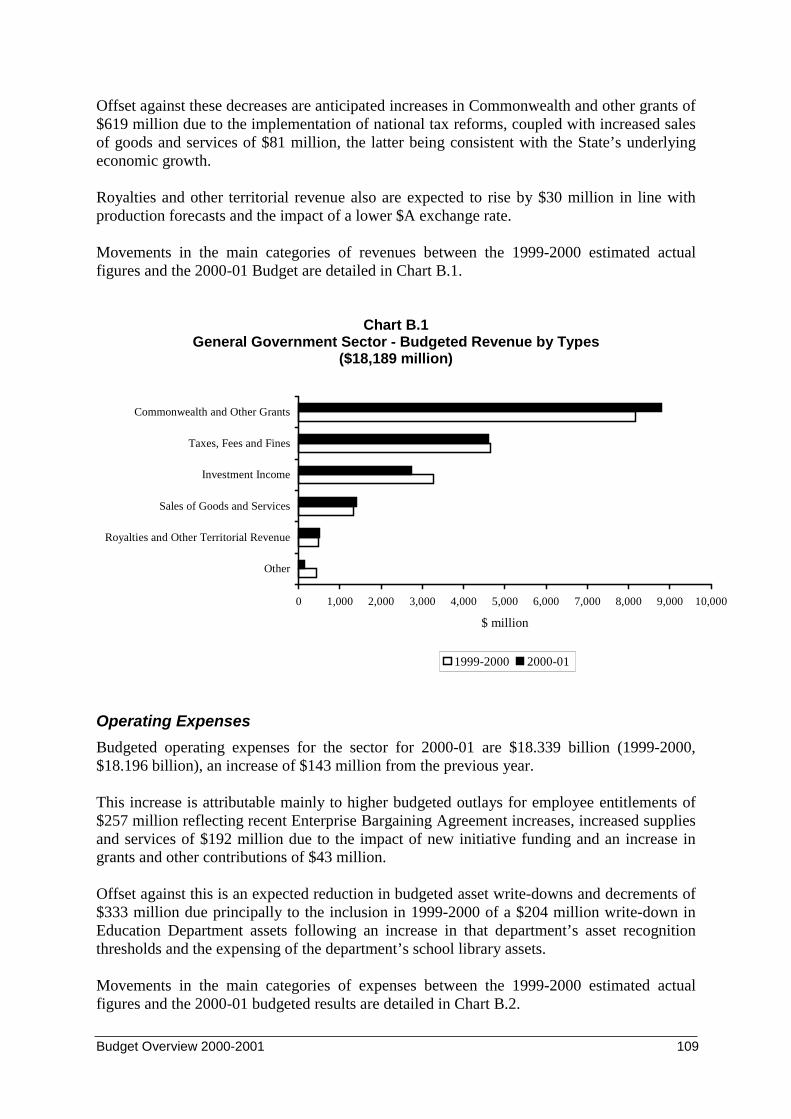
Budget Overview 2000-2001 109
Offset against these decreases are anticipated increases in Commonwealth and other grants of$619 million due to the implementation of national tax reforms, coupled with increased salesof goods and services of $81 million, the latter being consistent with the State’s underlyingeconomic growth.
Royalties and other territorial revenue also are expected to rise by $30 million in line withproduction forecasts and the impact of a lower $A exchange rate.
Movements in the main categories of revenues between the 1999-2000 estimated actualfigures and the 2000-01 Budget are detailed in Chart B.1.
Chart B.1General Government Sector - Budgeted Revenue by Types
($18,189 million)
Operating Expenses
Budgeted operating expenses for the sector for 2000-01 are $18.339 billion (1999-2000,$18.196 billion), an increase of $143 million from the previous year.
This increase is attributable mainly to higher budgeted outlays for employee entitlements of$257 million reflecting recent Enterprise Bargaining Agreement increases, increased suppliesand services of $192 million due to the impact of new initiative funding and an increase ingrants and other contributions of $43 million.
Offset against this is an expected reduction in budgeted asset write-downs and decrements of$333 million due principally to the inclusion in 1999-2000 of a $204 million write-down inEducation Department assets following an increase in that department’s asset recognitionthresholds and the expensing of the department’s school library assets.
Movements in the main categories of expenses between the 1999-2000 estimated actualfigures and the 2000-01 budgeted results are detailed in Chart B.2.
0 1,000 2,000 3,000 4,000 5,000 6,000 7,000 8,000 9,000 10,000
Other
Royalties and Other Territorial Revenue
Sales of Goods and Services
Investment Income
Taxes, Fees and Fines
Commonwealth and Other Grants
$ million
1999-2000 2000-01
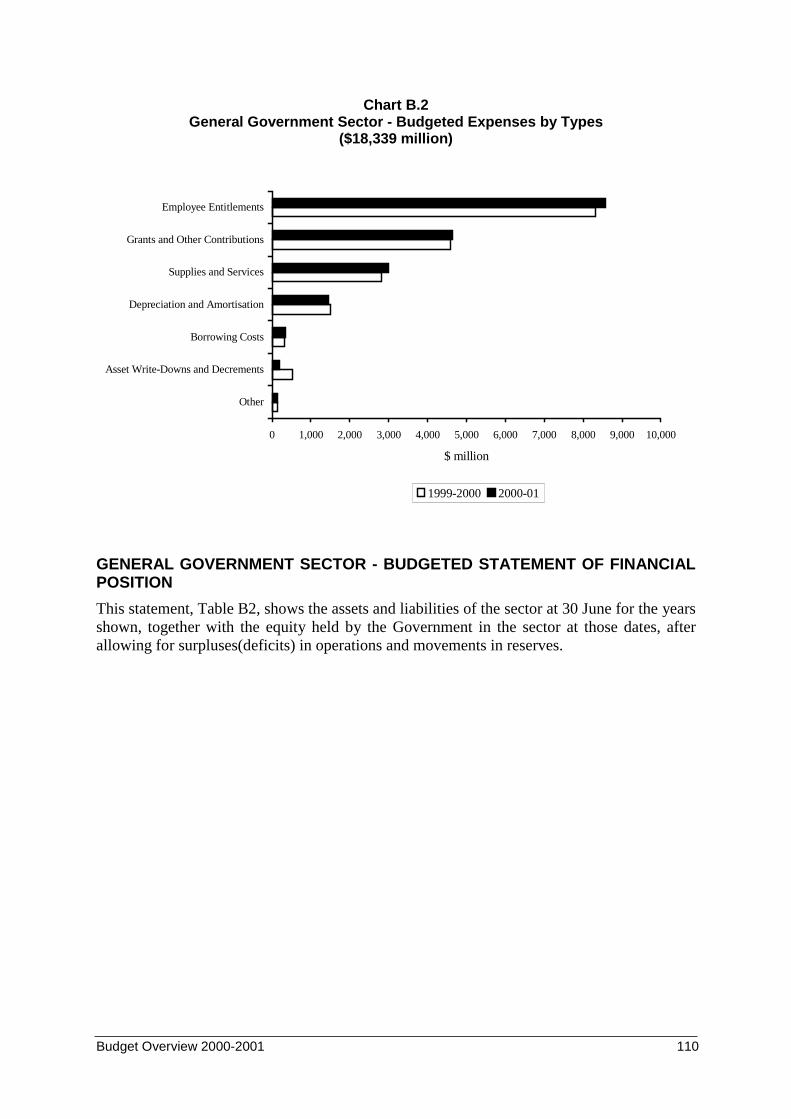
Budget Overview 2000-2001 110
Chart B.2General Government Sector - Budgeted Expenses by Types
($18,339 million)
GENERAL GOVERNMENT SECTOR - BUDGETED STATEMENT OF FINANCIALPOSITION
This statement, Table B2, shows the assets and liabilities of the sector at 30 June for the yearsshown, together with the equity held by the Government in the sector at those dates, afterallowing for surpluses(deficits) in operations and movements in reserves.
0 1,000 2,000 3,000 4,000 5,000 6,000 7,000 8,000 9,000 10,000
Other
Asset Write-Downs and Decrements
Borrowing Costs
Depreciation and Amortisation
Supplies and Services
Grants and Other Contributions
Employee Entitlements
$ million
1999-2000 2000-01
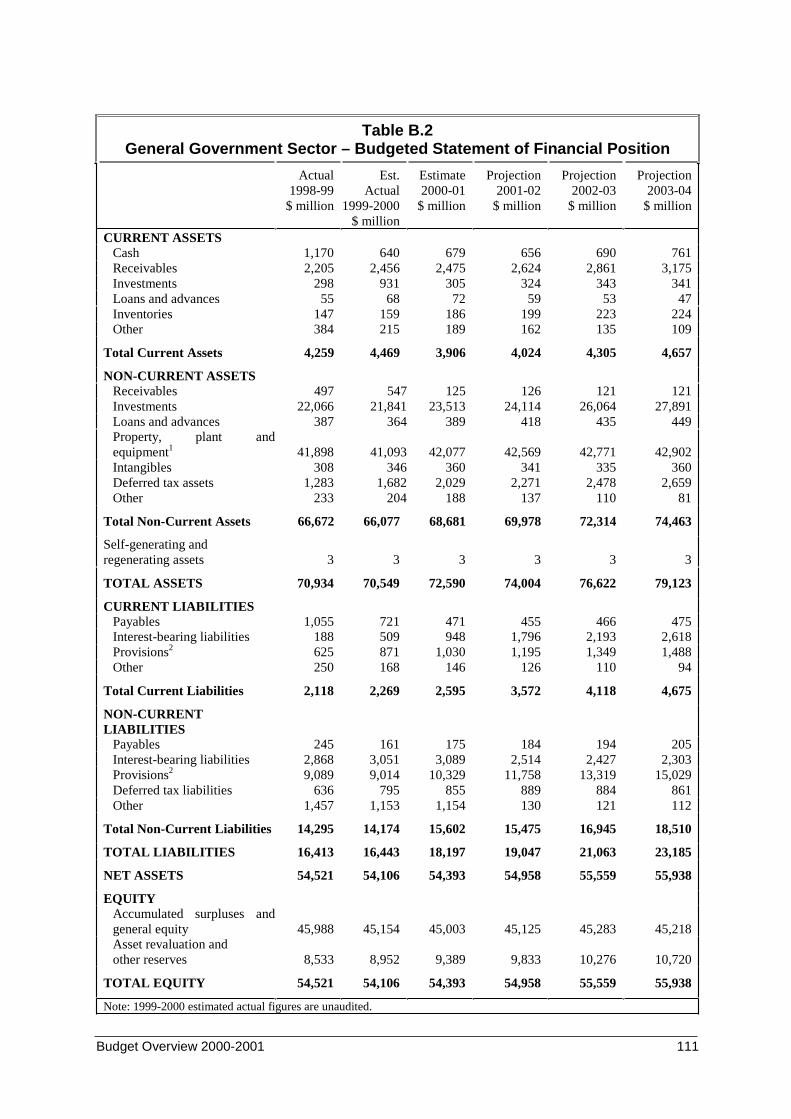
Budget Overview 2000-2001 111
Table B.2General Government Sector – Budgeted Statement of Financial Position
Actual1998-99
$ million
Est.Actual
1999-2000$ million
Estimate2000-01
$ million
Projection2001-02
$ million
Projection2002-03
$ million
Projection2003-04
$ million
CURRENT ASSETSCash 1,170 640 679 656 690 761Receivables 2,205 2,456 2,475 2,624 2,861 3,175Investments 298 931 305 324 343 341Loans and advances 55 68 72 59 53 47Inventories 147 159 186 199 223 224Other 384 215 189 162 135 109
Total Current Assets 4,259 4,469 3,906 4,024 4,305 4,657
NON-CURRENT ASSETSReceivables 497 547 125 126 121 121Investments 22,066 21,841 23,513 24,114 26,064 27,891Loans and advances 387 364 389 418 435 449Property, plant andequipment1 41,898 41,093 42,077 42,569 42,771 42,902IntangiblesDeferred tax assetsOther
3081,283
233
3461,682
204
3602,029
188
3412,271
137
3352,478
110
3602,659
81
Total Non-Current Assets 66,672 66,077 68,681 69,978 72,314 74,463
Self-generating andregenerating assets 3 3 3 3 3 3
TOTAL ASSETS 70,934 70,549 72,590 74,004 76,622 79,123
CURRENT LIABILITIESPayables 1,055 721 471 455 466 475Interest-bearing liabilities 188 509 948 1,796 2,193 2,618Provisions2 625 871 1,030 1,195 1,349 1,488Other 250 168 146 126 110 94
Total Current Liabilities 2,118 2,269 2,595 3,572 4,118 4,675
NON-CURRENTLIABILITIES
Payables 245 161 175 184 194 205Interest-bearing liabilities 2,868 3,051 3,089 2,514 2,427 2,303Provisions2
Deferred tax liabilities9,089
6369,014
79510,329
85511,758
88913,319
88415,029
861Other 1,457 1,153 1,154 130 121 112
Total Non-Current Liabilities 14,295 14,174 15,602 15,475 16,945 18,510
TOTAL LIABILITIES 16,413 16,443 18,197 19,047 21,063 23,185
NET ASSETS 54,521 54,106 54,393 54,958 55,559 55,938
EQUITYAccumulated surpluses andgeneral equity 45,988 45,154 45,003 45,125 45,283 45,218Asset revaluation andother reserves 8,533 8,952 9,389 9,833 10,276 10,720
TOTAL EQUITY 54,521 54,106 54,393 54,958 55,559 55,938
Note: 1999-2000 estimated actual figures are unaudited.
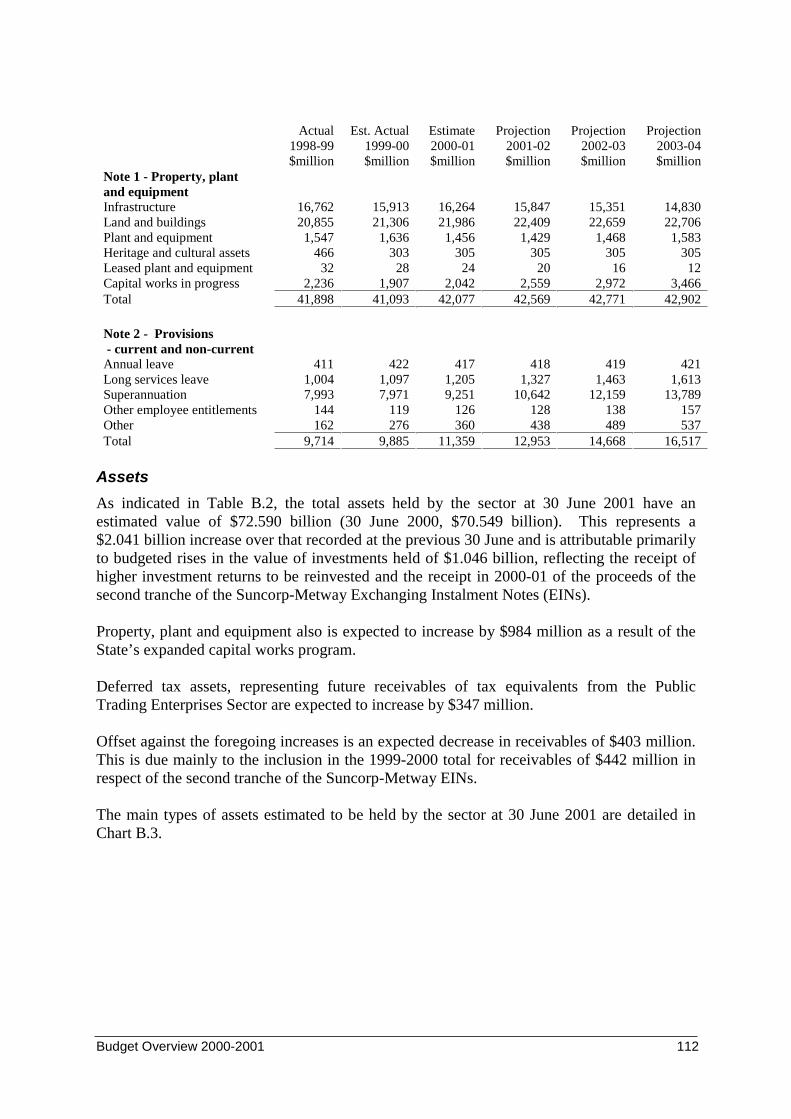
Budget Overview 2000-2001 112
Actual 1998-99 $million
Est. Actual 1999-00 $million
Estimate 2000-01 $million
Projection 2001-02 $million
Projection 2002-03 $million
Projection 2003-04 $million
Note 1 - Property, plantand equipmentInfrastructure 16,762 15,913 16,264 15,847 15,351 14,830Land and buildings 20,855 21,306 21,986 22,409 22,659 22,706Plant and equipment 1,547 1,636 1,456 1,429 1,468 1,583Heritage and cultural assets 466 303 305 305 305 305Leased plant and equipment 32 28 24 20 16 12Capital works in progress 2,236 1,907 2,042 2,559 2,972 3,466Total 41,898 41,093 42,077 42,569 42,771 42,902
Note 2 - Provisions - current and non-currentAnnual leave 411 422 417 418 419 421Long services leave 1,004 1,097 1,205 1,327 1,463 1,613Superannuation 7,993 7,971 9,251 10,642 12,159 13,789Other employee entitlements 144 119 126 128 138 157Other 162 276 360 438 489 537Total 9,714 9,885 11,359 12,953 14,668 16,517
Assets
As indicated in Table B.2, the total assets held by the sector at 30 June 2001 have anestimated value of $72.590 billion (30 June 2000, $70.549 billion). This represents a$2.041 billion increase over that recorded at the previous 30 June and is attributable primarilyto budgeted rises in the value of investments held of $1.046 billion, reflecting the receipt ofhigher investment returns to be reinvested and the receipt in 2000-01 of the proceeds of thesecond tranche of the Suncorp-Metway Exchanging Instalment Notes (EINs).
Property, plant and equipment also is expected to increase by $984 million as a result of theState’s expanded capital works program.
Deferred tax assets, representing future receivables of tax equivalents from the PublicTrading Enterprises Sector are expected to increase by $347 million.
Offset against the foregoing increases is an expected decrease in receivables of $403 million.This is due mainly to the inclusion in the 1999-2000 total for receivables of $442 million inrespect of the second tranche of the Suncorp-Metway EINs.
The main types of assets estimated to be held by the sector at 30 June 2001 are detailed inChart B.3.
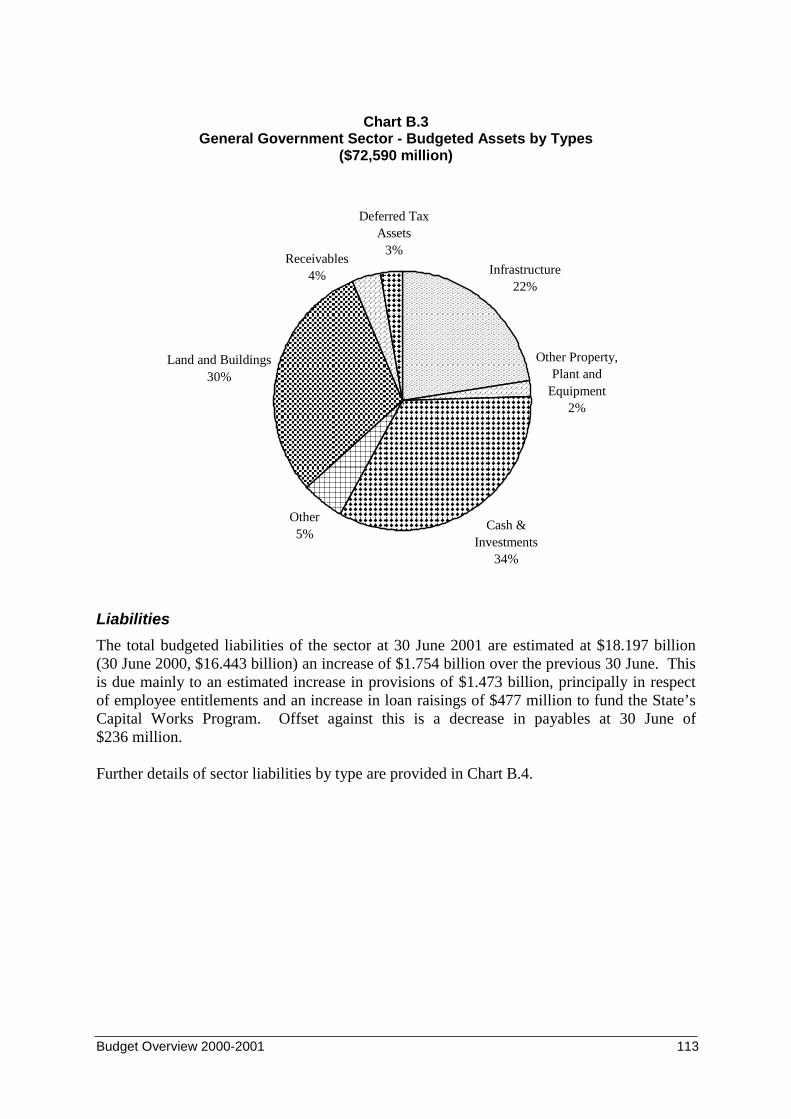
Budget Overview 2000-2001 113
Chart B.3General Government Sector - Budgeted Assets by Types
($72,590 million)
Infrastructure22%
Other Property, Plant and
Equipment2%
Other5%
Land and Buildings30%
Cash & Investments
34%
Receivables4%
Deferred Tax Assets
3%
Liabilities
The total budgeted liabilities of the sector at 30 June 2001 are estimated at $18.197 billion(30 June 2000, $16.443 billion) an increase of $1.754 billion over the previous 30 June. Thisis due mainly to an estimated increase in provisions of $1.473 billion, principally in respectof employee entitlements and an increase in loan raisings of $477 million to fund the State’sCapital Works Program. Offset against this is a decrease in payables at 30 June of$236 million.
Further details of sector liabilities by type are provided in Chart B.4.
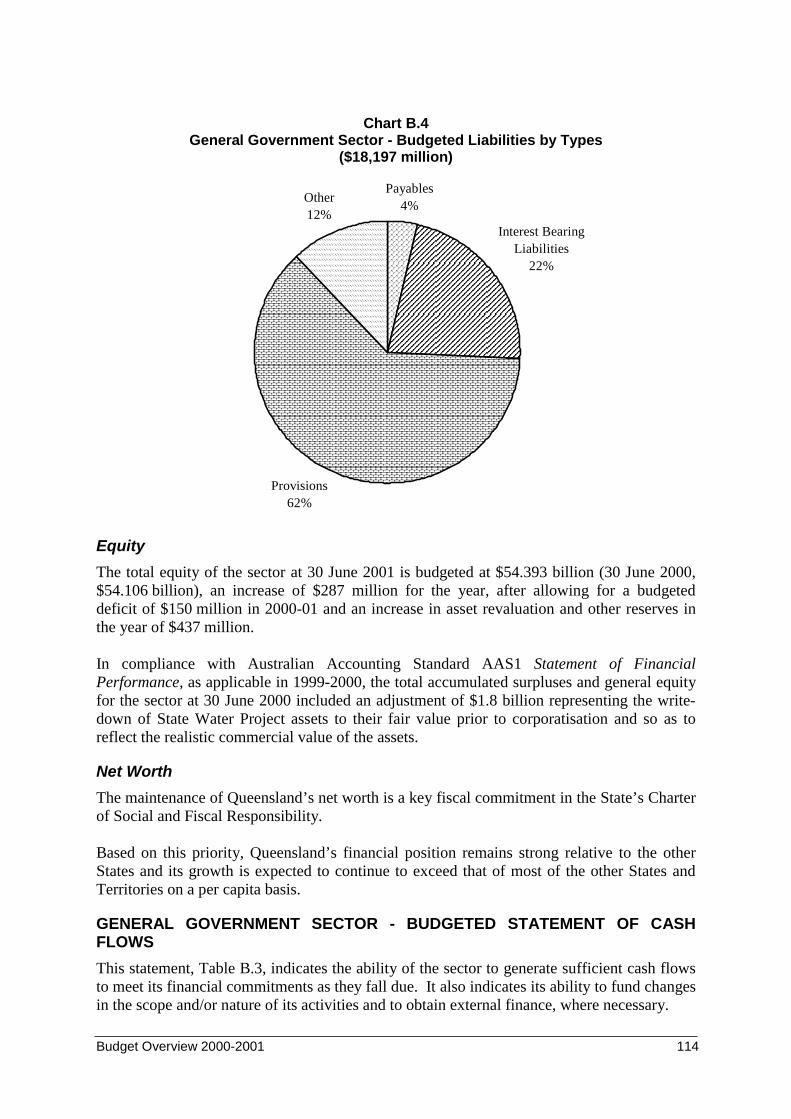
Budget Overview 2000-2001 114
Chart B.4General Government Sector - Budgeted Liabilities by Types
($18,197 million)
Payables4%
Interest Bearing Liabilities
22%
Provisions62%
Other12%
Equity
The total equity of the sector at 30 June 2001 is budgeted at $54.393 billion (30 June 2000,$54.106 billion), an increase of $287 million for the year, after allowing for a budgeteddeficit of $150 million in 2000-01 and an increase in asset revaluation and other reserves inthe year of $437 million.
In compliance with Australian Accounting Standard AAS1 Statement of FinancialPerformance, as applicable in 1999-2000, the total accumulated surpluses and general equityfor the sector at 30 June 2000 included an adjustment of $1.8 billion representing the write-down of State Water Project assets to their fair value prior to corporatisation and so as toreflect the realistic commercial value of the assets.
Net Worth
The maintenance of Queensland’s net worth is a key fiscal commitment in the State’s Charterof Social and Fiscal Responsibility.
Based on this priority, Queensland’s financial position remains strong relative to the otherStates and its growth is expected to continue to exceed that of most of the other States andTerritories on a per capita basis.
GENERAL GOVERNMENT SECTOR - BUDGETED STATEMENT OF CASHFLOWS
This statement, Table B.3, indicates the ability of the sector to generate sufficient cash flowsto meet its financial commitments as they fall due. It also indicates its ability to fund changesin the scope and/or nature of its activities and to obtain external finance, where necessary.
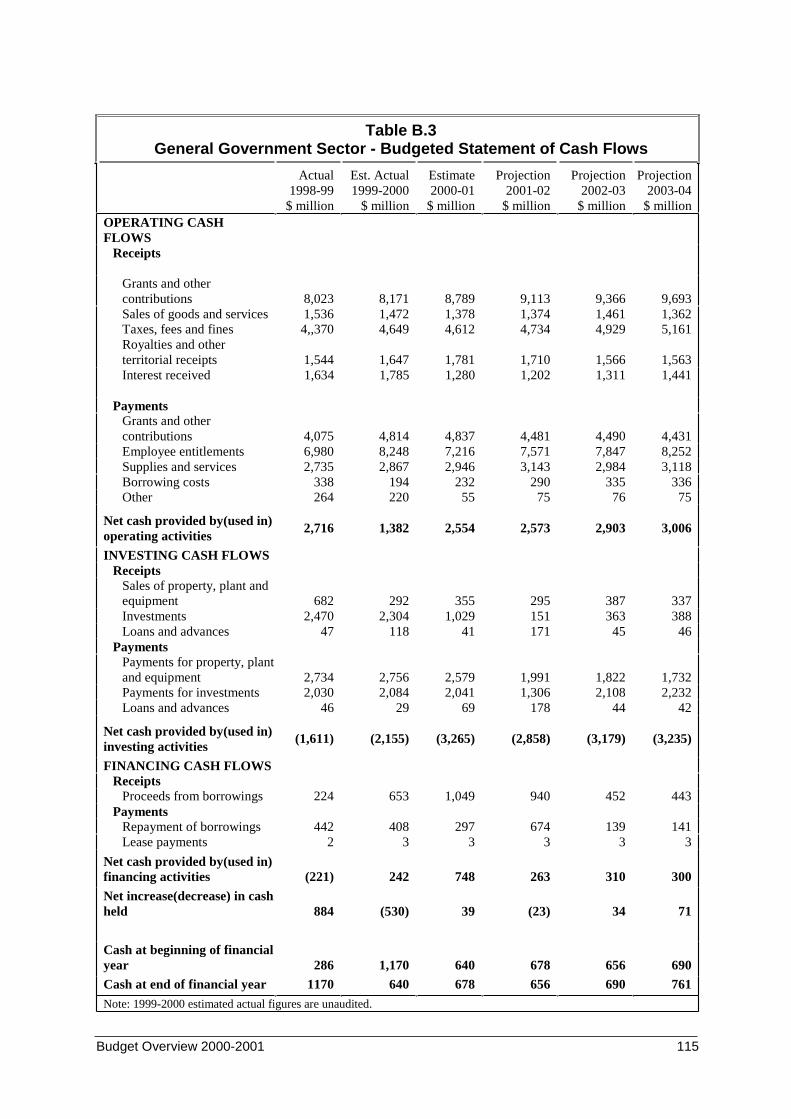
Budget Overview 2000-2001 115
Table B.3General Government Sector - Budgeted Statement of Cash Flows
Actual1998-99
$ million
Est. Actual1999-2000
$ million
Estimate2000-01
$ million
Projection2001-02
$ million
Projection2002-03
$ million
Projection2003-04
$ millionOPERATING CASHFLOWS
Receipts
Grants and othercontributions 8,023 8,171 8,789 9,113 9,366 9,693Sales of goods and servicesTaxes, fees and finesRoyalties and otherterritorial receipts
1,5364,,370
1,544
1,4724,649
1,647
1,3784,612
1,781
1,3744,734
1,710
1,4614,929
1,566
1,3625,161
1,563Interest received 1,634 1,785 1,280 1,202 1,311 1,441
PaymentsGrants and othercontributions 4,075 4,814 4,837 4,481 4,490 4,431Employee entitlements 6,980 8,248 7,216 7,571 7,847 8,252Supplies and services 2,735 2,867 2,946 3,143 2,984 3,118Borrowing costs 338 194 232 290 335 336Other 264 220 55 75 76 75
Net cash provided by(used in)operating activities
2,716 1,382 2,554 2,573 2,903 3,006
INVESTING CASH FLOWSReceipts
Sales of property, plant andequipment 682 292 355 295 387 337Investments 2,470 2,304 1,029 151 363 388Loans and advances 47 118 41 171 45 46
PaymentsPayments for property, plantand equipment 2,734 2,756 2,579 1,991 1,822 1,732Payments for investments 2,030 2,084 2,041 1,306 2,108 2,232Loans and advances 46 29 69 178 44 42
Net cash provided by(used in)investing activities
(1,611) (2,155) (3,265) (2,858) (3,179) (3,235)
FINANCING CASH FLOWSReceipts
Proceeds from borrowings 224 653 1,049 940 452 443Payments
Repayment of borrowings 442 408 297 674 139 141Lease payments 2 3 3 3 3 3
Net cash provided by(used in)financing activities (221) 242 748 263 310 300
Net increase(decrease) in cashheld 884 (530) 39 (23) 34 71
Cash at beginning of financialyear 286 1,170 640 678 656 690
Cash at end of financial year 1170 640 678 656 690 761
Note: 1999-2000 estimated actual figures are unaudited.
Budget Overview 2000-2001 116
Cash Flows
Total budgeted cash inflows from operating, investing and financing activities are expected toexceed cash outflows in 2000-01, resulting in a $39 million increase in cash held between thebeginning and end of the 2000-01 year (1999-2000, $530 million decrease in cash held). Thelarge decrease in cash on hand at the close of the year 2000 is attributable largely toexpenditure on capital works in excess of net receipts from operating activities andborrowings in that year, funded primarily from previous years’ cash surpluses.
PUBLIC TRADING ENTERPRISES SECTORThe primary function of agencies in the Public Trading Enterprises (PTE) Sector is to providegoods and services that are trading, non-regulatory or non-financial in nature and that arefinanced by way of sales of these goods and services to consumers.
The sector includes entities such as Queensland Rail, the various Port Authorities and thecorporations that comprise Queensland’s Electricity Industry.
PUBLIC TRADING ENTERPRISES SECTOR - BUDGETED STATEMENT OFFINANCIAL PERFORMANCE
This statement, Table B.4, sets out the budgeted and actual revenues and expenses of thesector for the years shown, together with anticipated extraordinary items.
The budgeted net operating result for each year, representing the surplus(deficit) of revenuesover expenses after allowing for any income tax equivalents and dividends, also forms part ofthe movement in accumulated surpluses and general equity as shown in the BudgetedStatement of Financial Position of the sector, Table B.5.
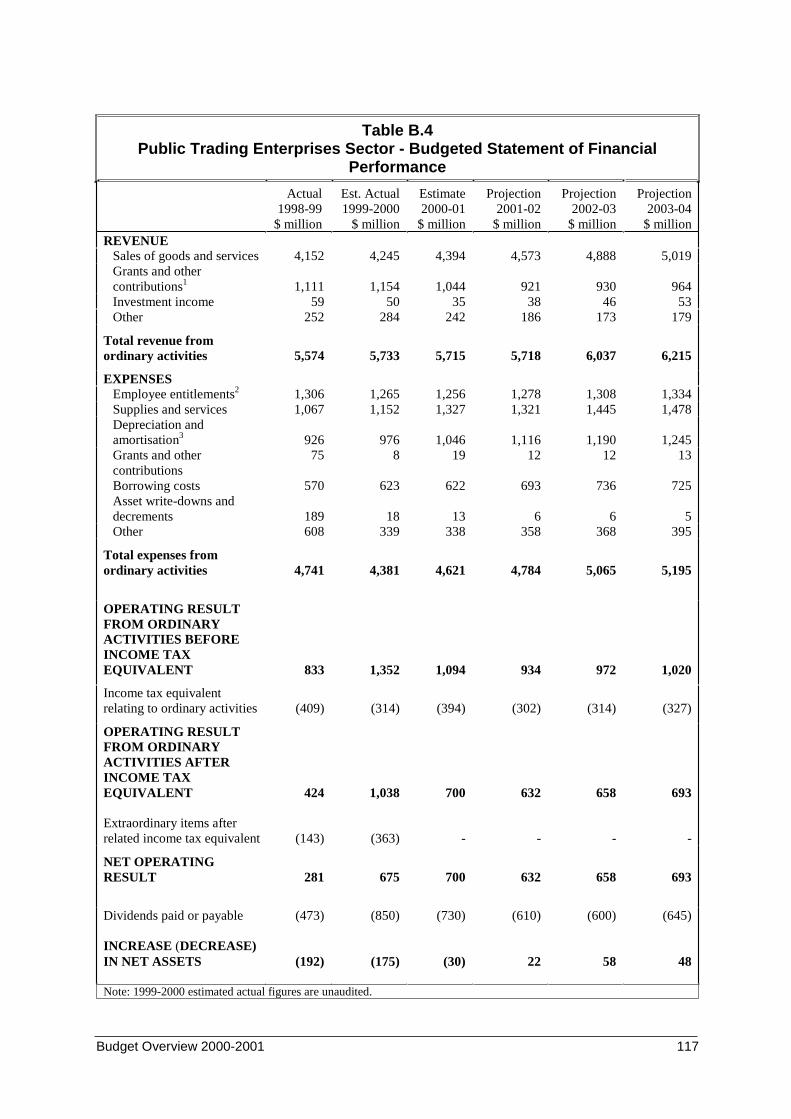
Budget Overview 2000-2001 117
Table B.4Public Trading Enterprises Sector - Budgeted Statement of Financial
Performance
Actual1998-99
$ million
Est. Actual1999-2000
$ million
Estimate2000-01
$ million
Projection2001-02
$ million
Projection2002-03
$ million
Projection2003-04
$ millionREVENUE
Sales of goods and services 4,152 4,245 4,394 4,573 4,888 5,019Grants and othercontributions1 1,111 1,154 1,044 921 930 964Investment income 59 50 35 38 46 53Other 252 284 242 186 173 179
Total revenue fromordinary activities 5,574 5,733 5,715 5,718 6,037 6,215
EXPENSESEmployee entitlements2 1,306 1,265 1,256 1,278 1,308 1,334Supplies and services 1,067 1,152 1,327 1,321 1,445 1,478Depreciation andamortisation3 926 976 1,046 1,116 1,190 1,245Grants and othercontributionsBorrowing costsAsset write-downs anddecrements
75
570
189
8
623
18
19
622
13
12
693
6
12
736
6
13
725
5Other 608 339 338 358 368 395
Total expenses fromordinary activities 4,741 4,381 4,621 4,784 5,065 5,195
OPERATING RESULTFROM ORDINARYACTIVITIES BEFOREINCOME TAXEQUIVALENT 833 1,352 1,094 934 972 1,020
Income tax equivalentrelating to ordinary activities (409) (314) (394) (302) (314) (327)
OPERATING RESULTFROM ORDINARYACTIVITIES AFTERINCOME TAXEQUIVALENT
Extraordinary items afterrelated income tax equivalent
424
(143)
1,038
(363)
700
-
632
-
658
-
693
-
NET OPERATINGRESULT 281 675 700 632 658 693
Dividends paid or payable
INCREASE (DECREASE)IN NET ASSETS
(473)
(192)
(850)
(175)
(730)
(30)
(610)
22
(600)
58
(645)
48
Note: 1999-2000 estimated actual figures are unaudited.
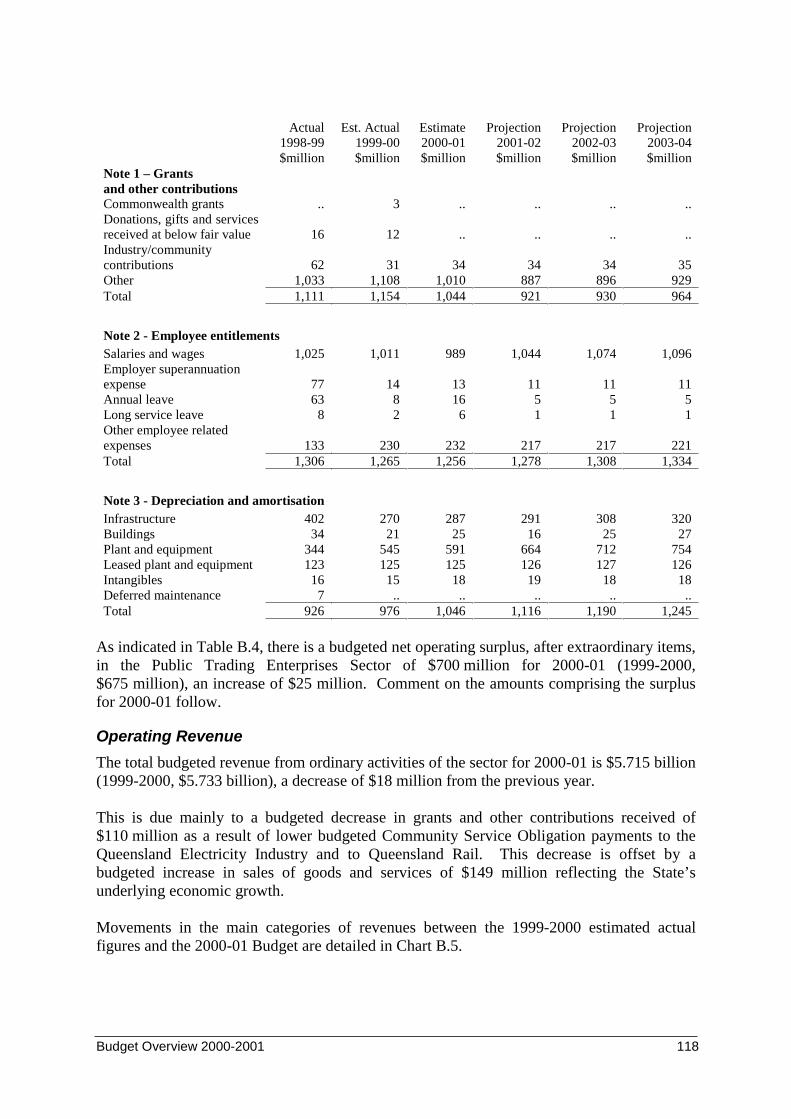
Budget Overview 2000-2001 118
Actual 1998-99 $million
Est. Actual 1999-00 $million
Estimate 2000-01 $million
Projection 2001-02 $million
Projection 2002-03 $million
Projection 2003-04 $million
Note 1 – Grantsand other contributionsCommonwealth grants .. 3 .. .. .. ..Donations, gifts and servicesreceived at below fair value 16 12 .. .. .. ..Industry/communitycontributions 62 31 34 34 34 35Other 1,033 1,108 1,010 887 896 929Total 1,111 1,154 1,044 921 930 964
Note 2 - Employee entitlementsSalaries and wages 1,025 1,011 989 1,044 1,074 1,096Employer superannuationexpense 77 14 13 11 11 11Annual leave 63 8 16 5 5 5Long service leave 8 2 6 1 1 1Other employee relatedexpenses 133 230 232 217 217 221Total 1,306 1,265 1,256 1,278 1,308 1,334
Note 3 - Depreciation and amortisationInfrastructure 402 270 287 291 308 320Buildings 34 21 25 16 25 27Plant and equipment 344 545 591 664 712 754Leased plant and equipment 123 125 125 126 127 126Intangibles 16 15 18 19 18 18Deferred maintenance 7 .. .. .. .. ..Total 926 976 1,046 1,116 1,190 1,245
As indicated in Table B.4, there is a budgeted net operating surplus, after extraordinary items,in the Public Trading Enterprises Sector of $700 million for 2000-01 (1999-2000,$675 million), an increase of $25 million. Comment on the amounts comprising the surplusfor 2000-01 follow.
Operating Revenue
The total budgeted revenue from ordinary activities of the sector for 2000-01 is $5.715 billion(1999-2000, $5.733 billion), a decrease of $18 million from the previous year.
This is due mainly to a budgeted decrease in grants and other contributions received of$110 million as a result of lower budgeted Community Service Obligation payments to theQueensland Electricity Industry and to Queensland Rail. This decrease is offset by abudgeted increase in sales of goods and services of $149 million reflecting the State’sunderlying economic growth.
Movements in the main categories of revenues between the 1999-2000 estimated actualfigures and the 2000-01 Budget are detailed in Chart B.5.
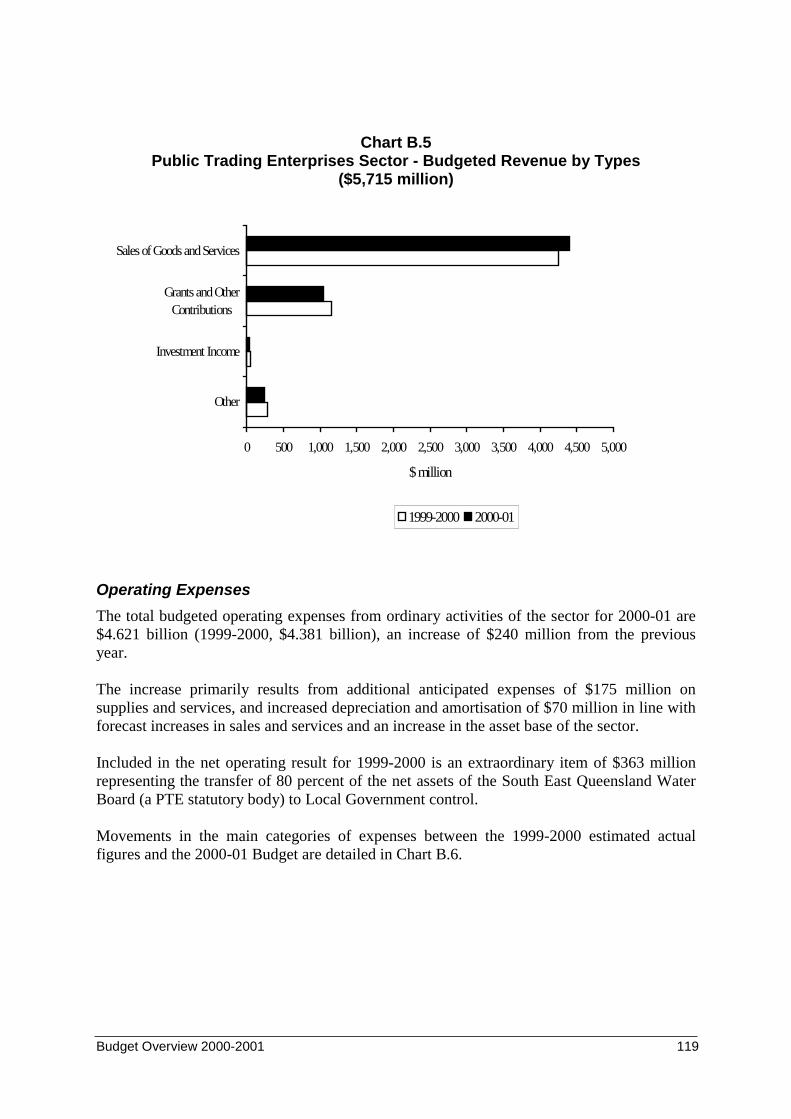
Budget Overview 2000-2001 119
Chart B.5Public Trading Enterprises Sector - Budgeted Revenue by Types
($5,715 million)
0 500 1,000 1,500 2,000 2,500 3,000 3,500 4,000 4,500 5,000
Other
Investment Income
Grants and OtherContributions
Sales of Goods and Services
$ million
1999-2000 2000-01
Operating Expenses
The total budgeted operating expenses from ordinary activities of the sector for 2000-01 are$4.621 billion (1999-2000, $4.381 billion), an increase of $240 million from the previousyear.
The increase primarily results from additional anticipated expenses of $175 million onsupplies and services, and increased depreciation and amortisation of $70 million in line withforecast increases in sales and services and an increase in the asset base of the sector.
Included in the net operating result for 1999-2000 is an extraordinary item of $363 millionrepresenting the transfer of 80 percent of the net assets of the South East Queensland WaterBoard (a PTE statutory body) to Local Government control.
Movements in the main categories of expenses between the 1999-2000 estimated actualfigures and the 2000-01 Budget are detailed in Chart B.6.
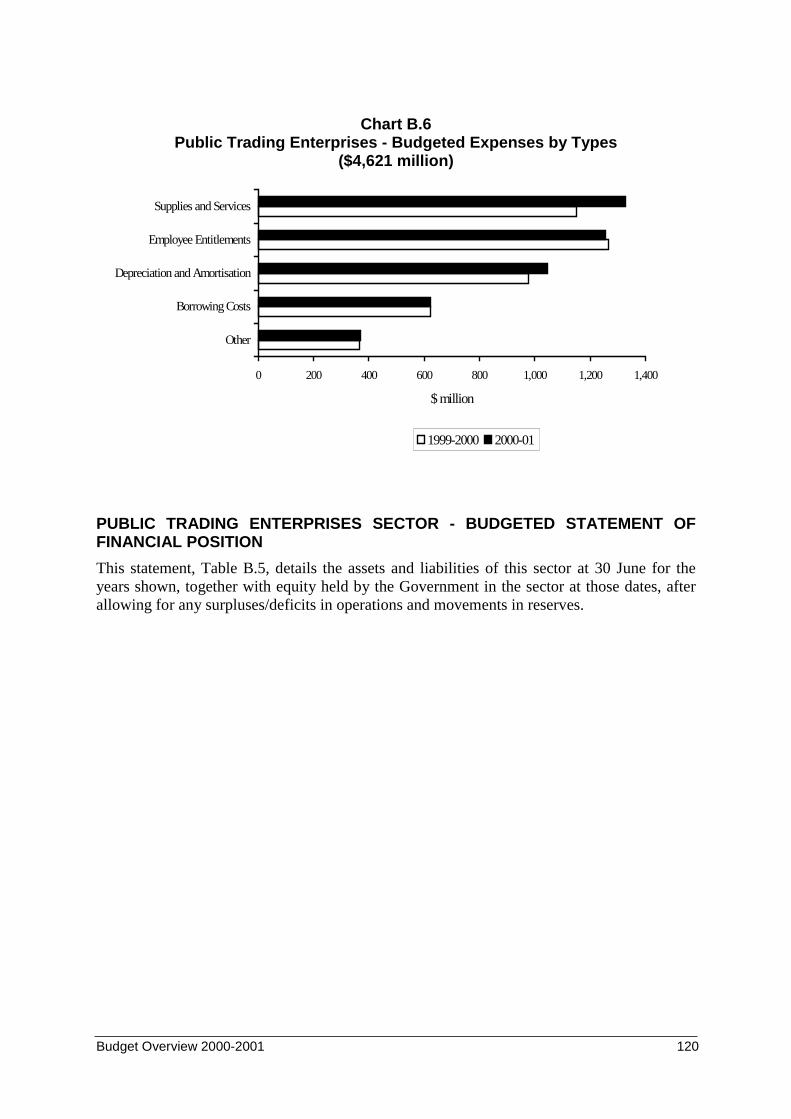
Budget Overview 2000-2001 120
Chart B.6Public Trading Enterprises - Budgeted Expenses by Types
($4,621 million)
0 200 400 600 800 1,000 1,200 1,400
Other
Borrowing Costs
Depreciation and Amortisation
Employee Entitlements
Supplies and Services
$ million
1999-2000 2000-01
PUBLIC TRADING ENTERPRISES SECTOR - BUDGETED STATEMENT OFFINANCIAL POSITION
This statement, Table B.5, details the assets and liabilities of this sector at 30 June for theyears shown, together with equity held by the Government in the sector at those dates, afterallowing for any surpluses/deficits in operations and movements in reserves.
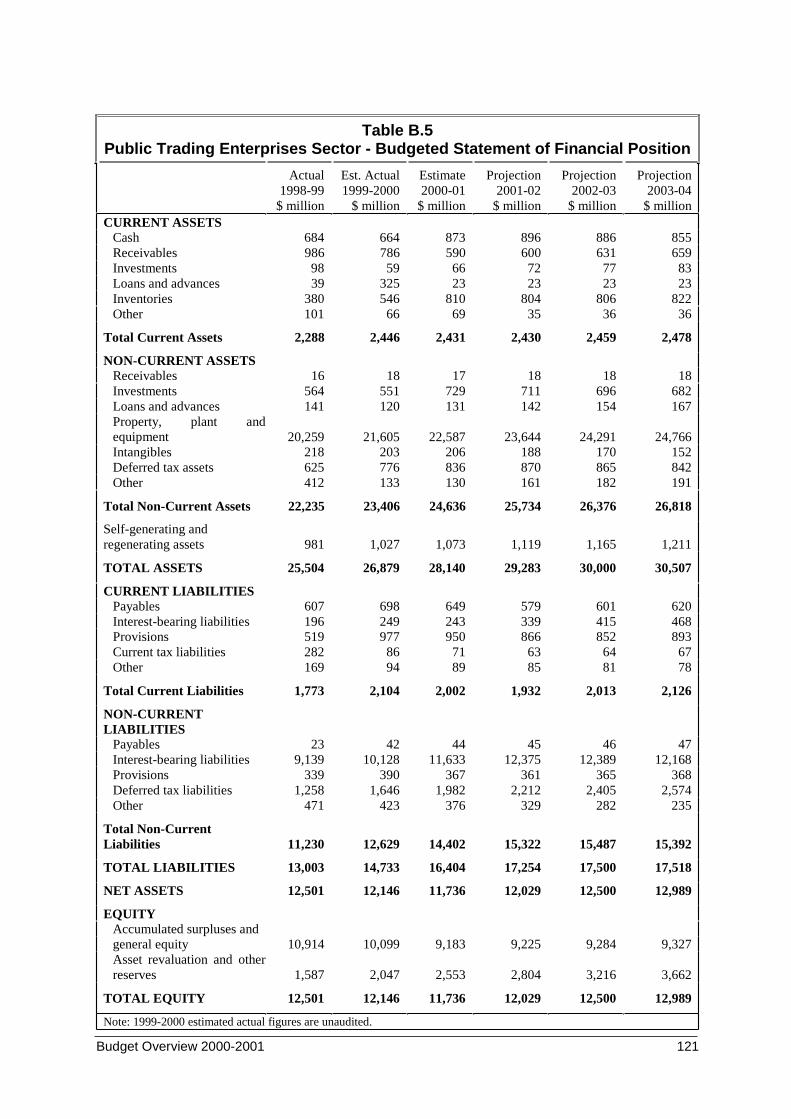
Budget Overview 2000-2001 121
Table B.5Public Trading Enterprises Sector - Budgeted Statement of Financial Position
Actual1998-99
$ million
Est. Actual1999-2000
$ million
Estimate2000-01
$ million
Projection2001-02
$ million
Projection2002-03
$ million
Projection2003-04
$ millionCURRENT ASSETS
Cash 684 664 873 896 886 855Receivables 986 786 590 600 631 659Investments 98 59 66 72 77 83Loans and advances 39 325 23 23 23 23Inventories 380 546 810 804 806 822Other 101 66 69 35 36 36
Total Current Assets 2,288 2,446 2,431 2,430 2,459 2,478
NON-CURRENT ASSETSReceivables 16 18 17 18 18 18Investments 564 551 729 711 696 682Loans and advances 141 120 131 142 154 167Property, plant andequipment 20,259 21,605 22,587 23,644 24,291 24,766IntangiblesDeferred tax assets
218625
203776
206836
188870
170865
152842
Other 412 133 130 161 182 191
Total Non-Current Assets 22,235 23,406 24,636 25,734 26,376 26,818
Self-generating andregenerating assets 981 1,027 1,073 1,119 1,165 1,211
TOTAL ASSETS 25,504 26,879 28,140 29,283 30,000 30,507
CURRENT LIABILITIESPayables 607 698 649 579 601 620Interest-bearing liabilities 196 249 243 339 415 468ProvisionsCurrent tax liabilities
519282
97786
95071
86663
85264
89367
Other 169 94 89 85 81 78
Total Current Liabilities 1,773 2,104 2,002 1,932 2,013 2,126
NON-CURRENTLIABILITIES
Payables 23 42 44 45 46 47Interest-bearing liabilities 9,139 10,128 11,633 12,375 12,389 12,168ProvisionsDeferred tax liabilities
3391,258
3901,646
3671,982
3612,212
3652,405
3682,574
Other 471 423 376 329 282 235
Total Non-CurrentLiabilities 11,230 12,629 14,402 15,322 15,487 15,392
TOTAL LIABILITIES 13,003 14,733 16,404 17,254 17,500 17,518
NET ASSETS 12,501 12,146 11,736 12,029 12,500 12,989
EQUITYAccumulated surpluses andgeneral equity 10,914 10,099 9,183 9,225 9,284 9,327Asset revaluation and otherreserves 1,587 2,047 2,553 2,804 3,216 3,662
TOTAL EQUITY 12,501 12,146 11,736 12,029 12,500 12,989
Note: 1999-2000 estimated actual figures are unaudited.
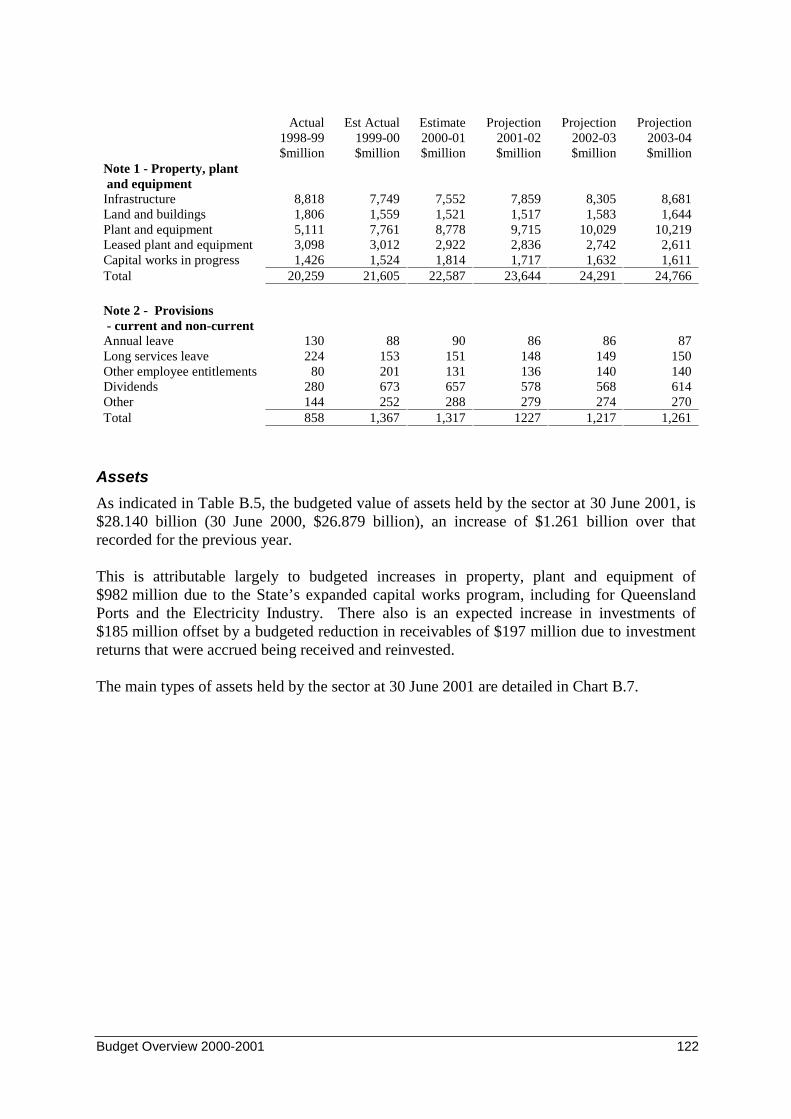
Budget Overview 2000-2001 122
Actual 1998-99 $million
Est Actual 1999-00 $million
Estimate 2000-01 $million
Projection 2001-02 $million
Projection 2002-03 $million
Projection 2003-04 $million
Note 1 - Property, plant and equipmentInfrastructure 8,818 7,749 7,552 7,859 8,305 8,681Land and buildings 1,806 1,559 1,521 1,517 1,583 1,644Plant and equipment 5,111 7,761 8,778 9,715 10,029 10,219Leased plant and equipment 3,098 3,012 2,922 2,836 2,742 2,611Capital works in progress 1,426 1,524 1,814 1,717 1,632 1,611Total 20,259 21,605 22,587 23,644 24,291 24,766
Note 2 - Provisions - current and non-currentAnnual leave 130 88 90 86 86 87Long services leave 224 153 151 148 149 150Other employee entitlements 80 201 131 136 140 140Dividends 280 673 657 578 568 614Other 144 252 288 279 274 270Total 858 1,367 1,317 1227 1,217 1,261
Assets
As indicated in Table B.5, the budgeted value of assets held by the sector at 30 June 2001, is$28.140 billion (30 June 2000, $26.879 billion), an increase of $1.261 billion over thatrecorded for the previous year.
This is attributable largely to budgeted increases in property, plant and equipment of$982 million due to the State’s expanded capital works program, including for QueenslandPorts and the Electricity Industry. There also is an expected increase in investments of$185 million offset by a budgeted reduction in receivables of $197 million due to investmentreturns that were accrued being received and reinvested.
The main types of assets held by the sector at 30 June 2001 are detailed in Chart B.7.
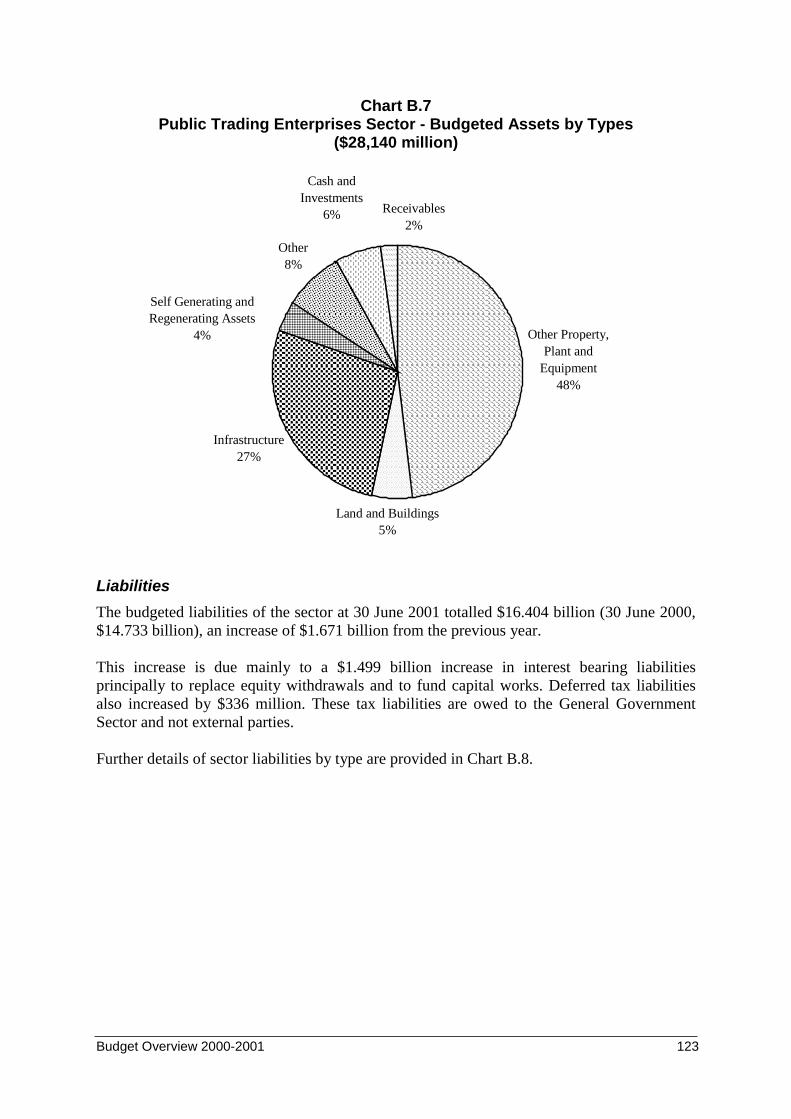
Budget Overview 2000-2001 123
Chart B.7Public Trading Enterprises Sector - Budgeted Assets by Types
($28,140 million)
Liabilities
The budgeted liabilities of the sector at 30 June 2001 totalled $16.404 billion (30 June 2000,$14.733 billion), an increase of $1.671 billion from the previous year.
This increase is due mainly to a $1.499 billion increase in interest bearing liabilitiesprincipally to replace equity withdrawals and to fund capital works. Deferred tax liabilitiesalso increased by $336 million. These tax liabilities are owed to the General GovernmentSector and not external parties.
Further details of sector liabilities by type are provided in Chart B.8.
Other Property, Plant and
Equipment48%
Land and Buildings5%
Infrastructure27%
Other8%
Receivables2%
Cash and Investments
6%
Self Generating and Regenerating Assets
4%
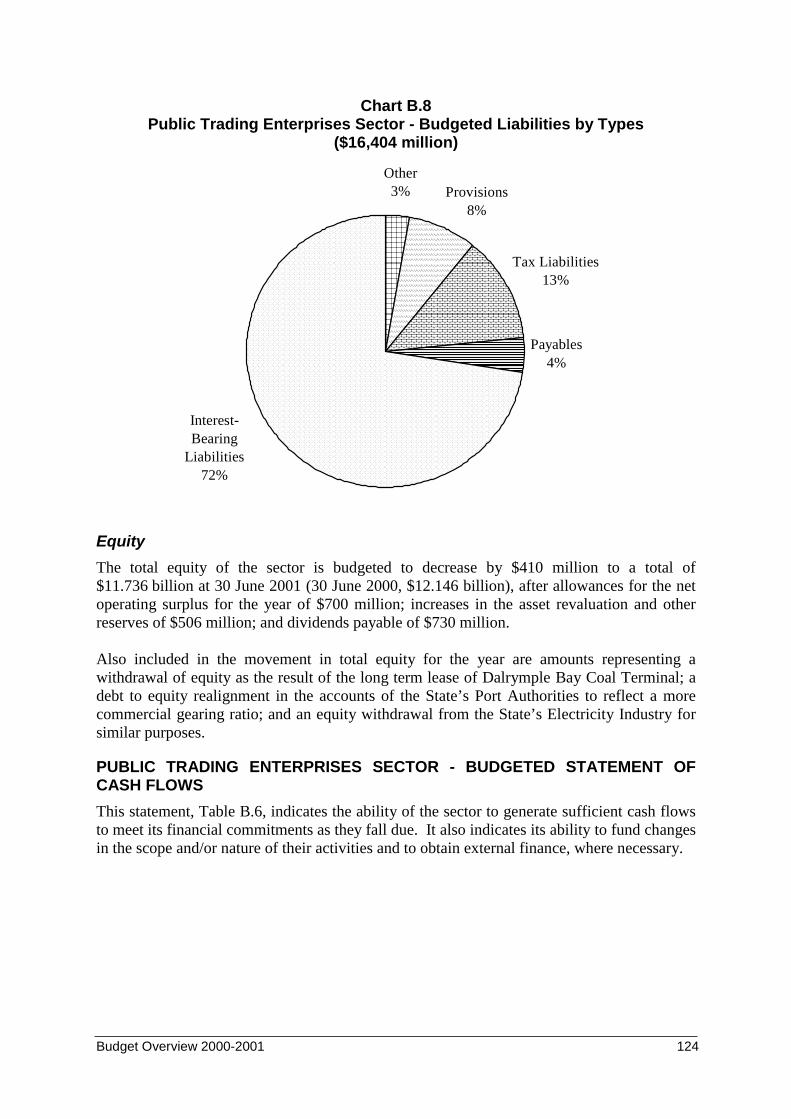
Budget Overview 2000-2001 124
Chart B.8Public Trading Enterprises Sector - Budgeted Liabilities by Types
($16,404 million)
Provisions8%
Tax Liabilities13%
Payables4%
Other3%
Interest-Bearing
Liabilities72%
Equity
The total equity of the sector is budgeted to decrease by $410 million to a total of$11.736 billion at 30 June 2001 (30 June 2000, $12.146 billion), after allowances for the netoperating surplus for the year of $700 million; increases in the asset revaluation and otherreserves of $506 million; and dividends payable of $730 million.
Also included in the movement in total equity for the year are amounts representing awithdrawal of equity as the result of the long term lease of Dalrymple Bay Coal Terminal; adebt to equity realignment in the accounts of the State’s Port Authorities to reflect a morecommercial gearing ratio; and an equity withdrawal from the State’s Electricity Industry forsimilar purposes.
PUBLIC TRADING ENTERPRISES SECTOR - BUDGETED STATEMENT OFCASH FLOWS
This statement, Table B.6, indicates the ability of the sector to generate sufficient cash flowsto meet its financial commitments as they fall due. It also indicates its ability to fund changesin the scope and/or nature of their activities and to obtain external finance, where necessary.
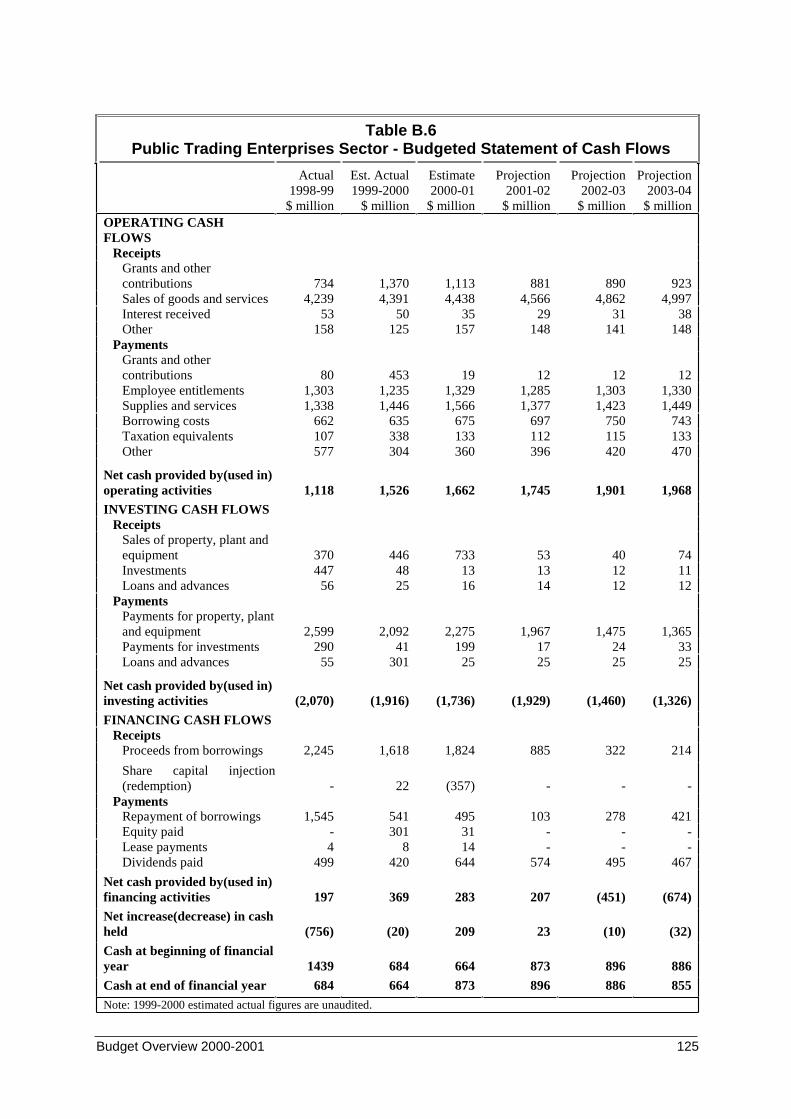
Budget Overview 2000-2001 125
Table B.6Public Trading Enterprises Sector - Budgeted Statement of Cash Flows
Actual1998-99
$ million
Est. Actual1999-2000
$ million
Estimate2000-01
$ million
Projection2001-02
$ million
Projection2002-03
$ million
Projection2003-04
$ millionOPERATING CASHFLOWS
ReceiptsGrants and othercontributions 734 1,370 1,113 881 890 923Sales of goods and services 4,239 4,391 4,438 4,566 4,862 4,997Interest received 53 50 35 29 31 38Other 158 125 157 148 141 148
PaymentsGrants and othercontributions 80 453 19 12 12 12Employee entitlements 1,303 1,235 1,329 1,285 1,303 1,330Supplies and services 1,338 1,446 1,566 1,377 1,423 1,449Borrowing costs 662 635 675 697 750 743Taxation equivalents 107 338 133 112 115 133Other 577 304 360 396 420 470
Net cash provided by(used in)operating activities 1,118 1,526 1,662 1,745 1,901 1,968
INVESTING CASH FLOWSReceipts
Sales of property, plant andequipment 370 446 733 53 40 74Investments 447 48 13 13 12 11Loans and advances 56 25 16 14 12 12
PaymentsPayments for property, plantand equipment 2,599 2,092 2,275 1,967 1,475 1,365Payments for investments 290 41 199 17 24 33Loans and advances 55 301 25 25 25 25
Net cash provided by(used in)investing activities (2,070) (1,916) (1,736) (1,929) (1,460) (1,326)
FINANCING CASH FLOWSReceipts
Proceeds from borrowings 2,245 1,618 1,824 885 322 214
Share capital injection(redemption) - 22 (357) - - -
PaymentsRepayment of borrowings 1,545 541 495 103 278 421Equity paid - 301 31 - - -Lease payments 4 8 14 - - -Dividends paid 499 420 644 574 495 467
Net cash provided by(used in)financing activities 197 369 283 207 (451) (674)
Net increase(decrease) in cashheld (756) (20) 209 23 (10) (32)
Cash at beginning of financialyear 1439 684 664 873 896 886
Cash at end of financial year 684 664 873 896 886 855Note: 1999-2000 estimated actual figures are unaudited.
Budget Overview 2000-2001 126
Cash Flows
Total cash inflows from operating, investing and financing activities are expected to exceedcash outflows resulting in a $209 million increase in cash held by the sector between thebeginning and end of the 2000-2001 year (1999-2000, $20 million decrease).
TOTAL (NON-PFE) STATE SECTORThe Total (Non-PFE State Sector is a consolidation of the General Government and PublicTrading Enterprises Sectors and includes all departments, their commercialised businessunits, the various Public Trading Enterprises and any of their controlled entities. However, itexcludes agencies that form part of the Public Financial Enterprises Sector.
TOTAL (NON-PFE) STATE SECTOR - BUDGETED STATEMENT OF FINANCIALPERFORMANCE
This statement, Table B.7, sets out the budgeted and estimated actual revenues and expensesof the sector for the years shown, together with anticipated extraordinary items.
The budgeted net operating result for the year, representing the net increase or decrease inassets held by the sector as a result of delivering agency outputs and the conduct of tradingactivities, also forms part of the movement in accumulated surpluses and general equity in theBudgeted Statement of Financial Position, Table B.8.
Although the net operating result of the Total (Non-PFE) State Sector, equals the combinedtotals for this line item in the Budgeted Statement of Financial Performance of the GeneralGovernment and Public Trading Enterprises Sectors, after dividends, the individual line itemsfor revenues and expenses do not total.
This is because dividends and tax equivalent payments from the Public Trading EnterprisesSector are recognised as revenue in the General Government Sector and the Total (Non-PFE)State Sector but not as an expense in the Public Trading Enterprises Sector. Individual lineitems for revenues and expenses also are affected by the elimination of inter-sector revenuesand expenses on consolidation.
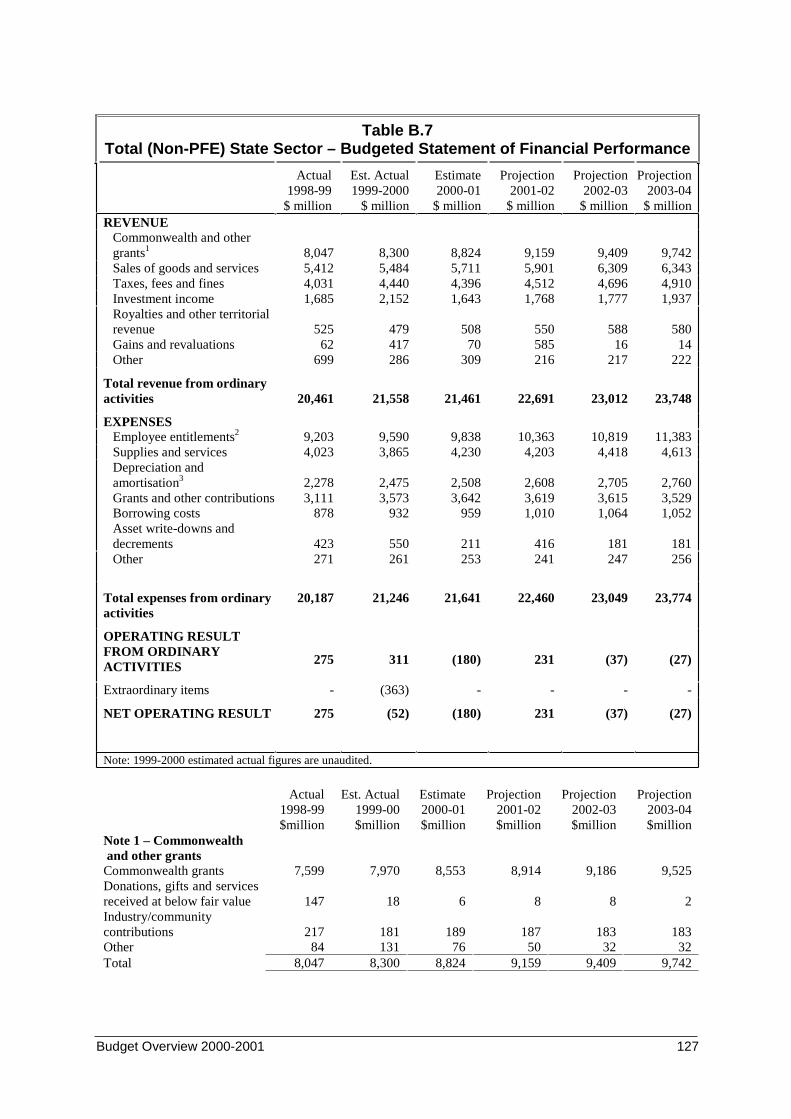
Budget Overview 2000-2001 127
Table B.7Total (Non-PFE) State Sector – Budgeted Statement of Financial Performance
Actual1998-99
$ million
Est. Actual1999-2000
$ million
Estimate2000-01
$ million
Projection2001-02
$ million
Projection2002-03
$ million
Projection2003-04
$ millionREVENUE
Commonwealth and othergrants1 8,047 8,300 8,824 9,159 9,409 9,742Sales of goods and services 5,412 5,484 5,711 5,901 6,309 6,343Taxes, fees and fines 4,031 4,440 4,396 4,512 4,696 4,910Investment income 1,685 2,152 1,643 1,768 1,777 1,937Royalties and other territorialrevenueGains and revaluations
52562
479417
50870
550585
58816
58014
Other 699 286 309 216 217 222
Total revenue from ordinaryactivities 20,461 21,558 21,461 22,691 23,012 23,748
EXPENSESEmployee entitlements2 9,203 9,590 9,838 10,363 10,819 11,383Supplies and services 4,023 3,865 4,230 4,203 4,418 4,613Depreciation andamortisation3
Grants and other contributionsBorrowing costsAsset write-downs anddecrements
2,2783,111
878
423
2,4753,573
932
550
2,5083,642
959
211
2,6083,6191,010
416
2,7053,6151,064
181
2,7603,5291,052
181Other 271 261 253 241 247 256
Total expenses from ordinaryactivities
20,187 21,246 21,641 22,460 23,049 23,774
OPERATING RESULTFROM ORDINARYACTIVITIES 275 311 (180) 231 (37) (27)
Extraordinary items - (363) - - - -
NET OPERATING RESULT 275 (52) (180) 231 (37) (27)
Note: 1999-2000 estimated actual figures are unaudited.
Actual 1998-99 $million
Est. Actual 1999-00 $million
Estimate 2000-01 $million
Projection 2001-02 $million
Projection 2002-03 $million
Projection 2003-04 $million
Note 1 – Commonwealth and other grantsCommonwealth grants 7,599 7,970 8,553 8,914 9,186 9,525Donations, gifts and servicesreceived at below fair value 147 18 6 8 8 2Industry/communitycontributions 217 181 189 187 183 183Other 84 131 76 50 32 32Total 8,047 8,300 8,824 9,159 9,409 9,742
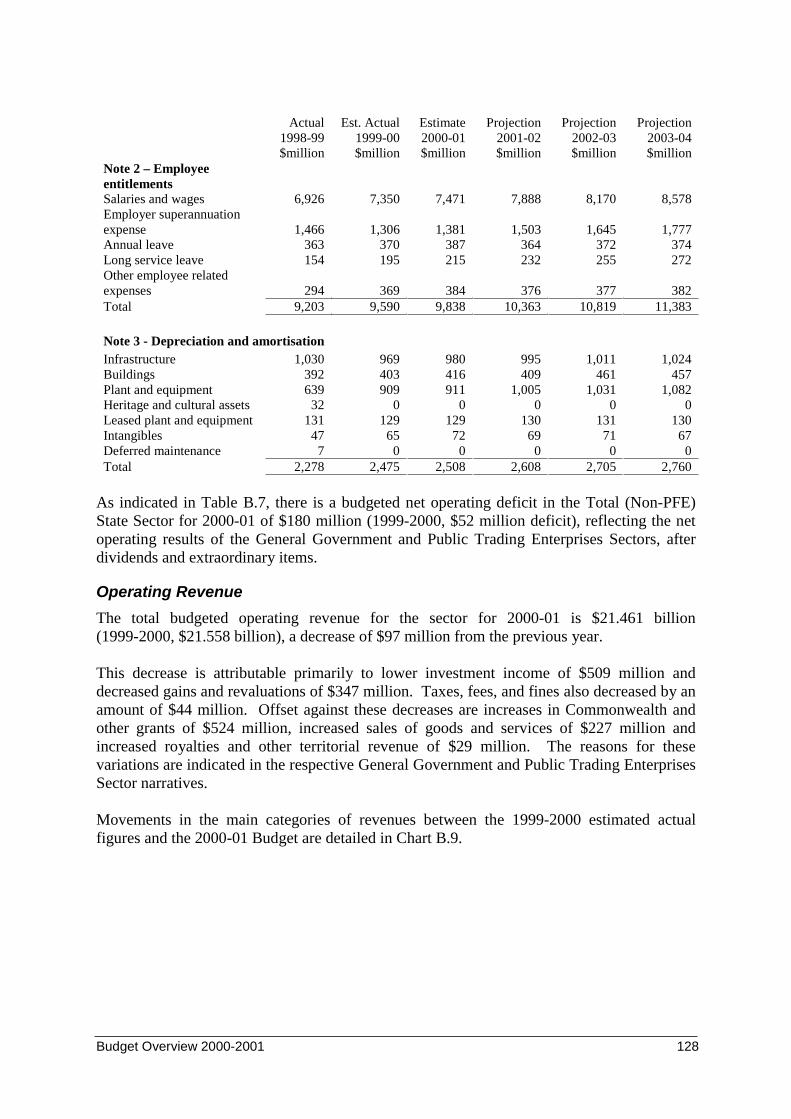
Budget Overview 2000-2001 128
Actual 1998-99 $million
Est. Actual 1999-00 $million
Estimate 2000-01 $million
Projection 2001-02 $million
Projection 2002-03 $million
Projection 2003-04 $million
Note 2 – EmployeeentitlementsSalaries and wages 6,926 7,350 7,471 7,888 8,170 8,578Employer superannuationexpense 1,466 1,306 1,381 1,503 1,645 1,777Annual leave 363 370 387 364 372 374Long service leave 154 195 215 232 255 272Other employee relatedexpenses 294 369 384 376 377 382Total 9,203 9,590 9,838 10,363 10,819 11,383
Note 3 - Depreciation and amortisationInfrastructure 1,030 969 980 995 1,011 1,024Buildings 392 403 416 409 461 457Plant and equipment 639 909 911 1,005 1,031 1,082Heritage and cultural assets 32 0 0 0 0 0Leased plant and equipment 131 129 129 130 131 130Intangibles 47 65 72 69 71 67Deferred maintenance 7 0 0 0 0 0Total 2,278 2,475 2,508 2,608 2,705 2,760
As indicated in Table B.7, there is a budgeted net operating deficit in the Total (Non-PFE)State Sector for 2000-01 of $180 million (1999-2000, $52 million deficit), reflecting the netoperating results of the General Government and Public Trading Enterprises Sectors, afterdividends and extraordinary items.
Operating Revenue
The total budgeted operating revenue for the sector for 2000-01 is $21.461 billion(1999-2000, $21.558 billion), a decrease of $97 million from the previous year.
This decrease is attributable primarily to lower investment income of $509 million anddecreased gains and revaluations of $347 million. Taxes, fees, and fines also decreased by anamount of $44 million. Offset against these decreases are increases in Commonwealth andother grants of $524 million, increased sales of goods and services of $227 million andincreased royalties and other territorial revenue of $29 million. The reasons for thesevariations are indicated in the respective General Government and Public Trading EnterprisesSector narratives.
Movements in the main categories of revenues between the 1999-2000 estimated actualfigures and the 2000-01 Budget are detailed in Chart B.9.
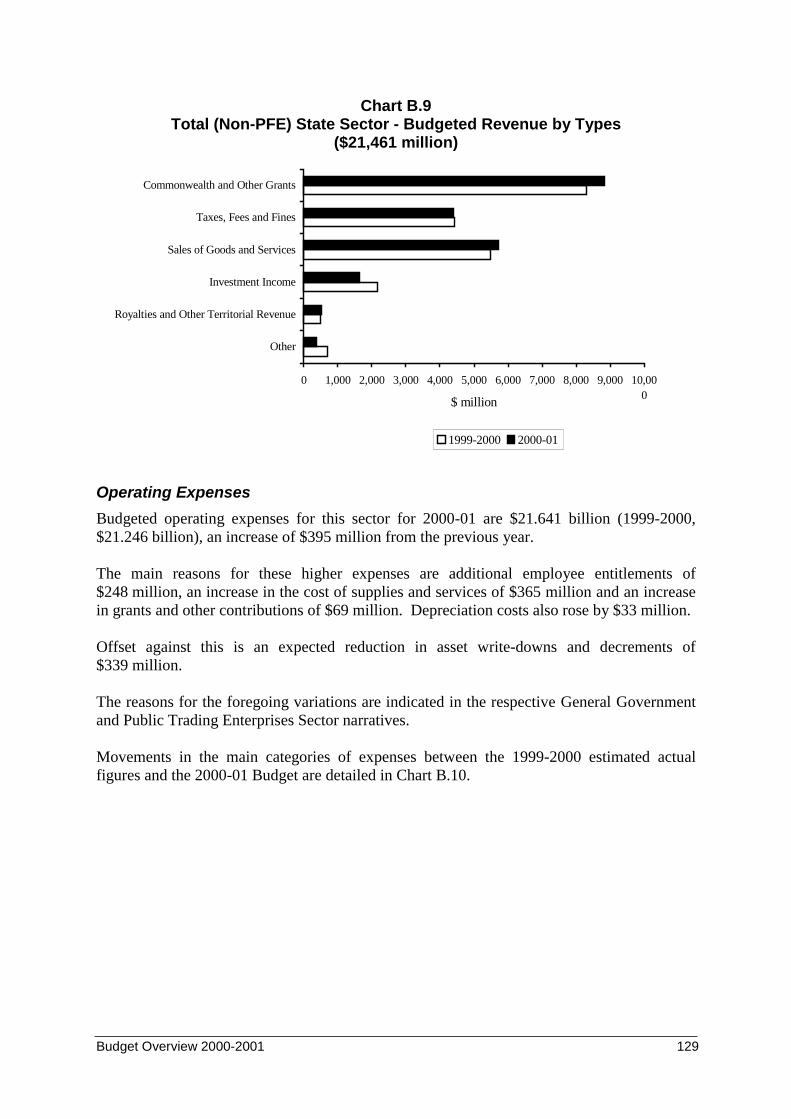
Budget Overview 2000-2001 129
Chart B.9Total (Non-PFE) State Sector - Budgeted Revenue by Types
($21,461 million)
0 1,000 2,000 3,000 4,000 5,000 6,000 7,000 8,000 9,000 10,000
Other
Royalties and Other Territorial Revenue
Investment Income
Sales of Goods and Services
Taxes, Fees and Fines
Commonwealth and Other Grants
$ million
1999-2000 2000-01
Operating Expenses
Budgeted operating expenses for this sector for 2000-01 are $21.641 billion (1999-2000,$21.246 billion), an increase of $395 million from the previous year.
The main reasons for these higher expenses are additional employee entitlements of$248 million, an increase in the cost of supplies and services of $365 million and an increasein grants and other contributions of $69 million. Depreciation costs also rose by $33 million.
Offset against this is an expected reduction in asset write-downs and decrements of$339 million.
The reasons for the foregoing variations are indicated in the respective General Governmentand Public Trading Enterprises Sector narratives.
Movements in the main categories of expenses between the 1999-2000 estimated actualfigures and the 2000-01 Budget are detailed in Chart B.10.
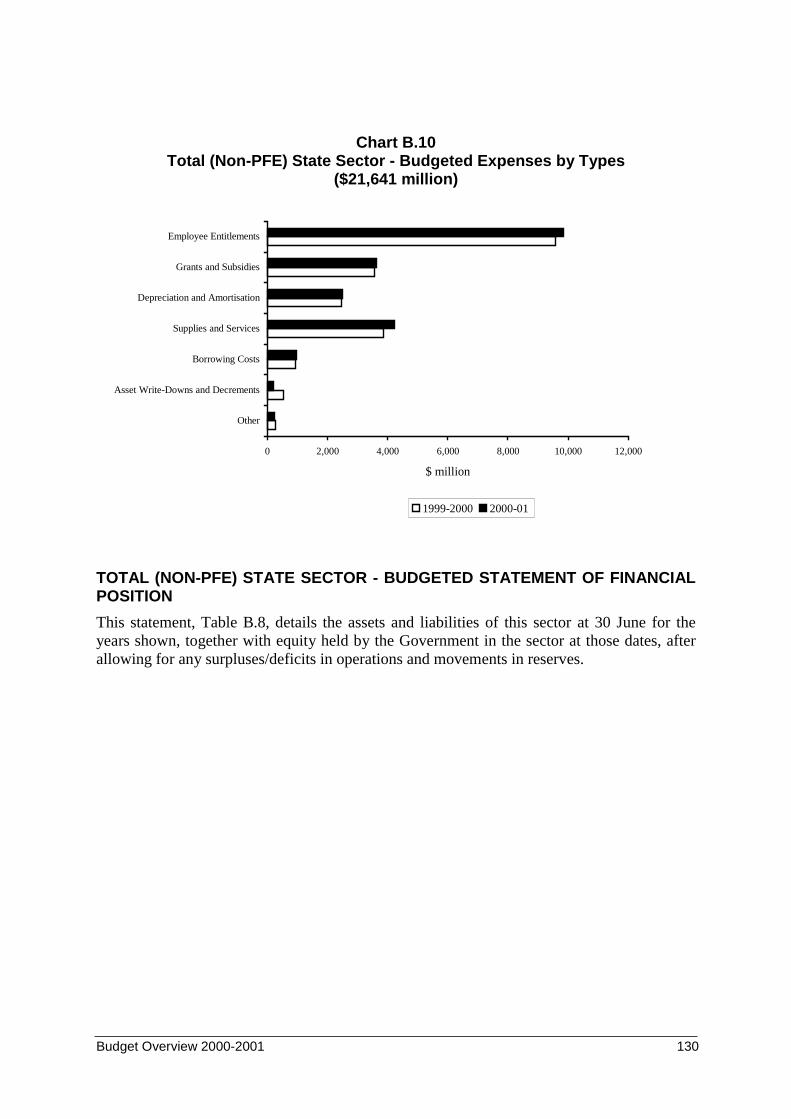
Budget Overview 2000-2001 130
Chart B.10Total (Non-PFE) State Sector - Budgeted Expenses by Types
($21,641 million)
0 2,000 4,000 6,000 8,000 10,000 12,000
Other
Asset Write-Downs and Decrements
Borrowing Costs
Supplies and Services
Depreciation and Amortisation
Grants and Subsidies
Employee Entitlements
$ million
1999-2000 2000-01
TOTAL (NON-PFE) STATE SECTOR - BUDGETED STATEMENT OF FINANCIALPOSITION
This statement, Table B.8, details the assets and liabilities of this sector at 30 June for theyears shown, together with equity held by the Government in the sector at those dates, afterallowing for any surpluses/deficits in operations and movements in reserves.
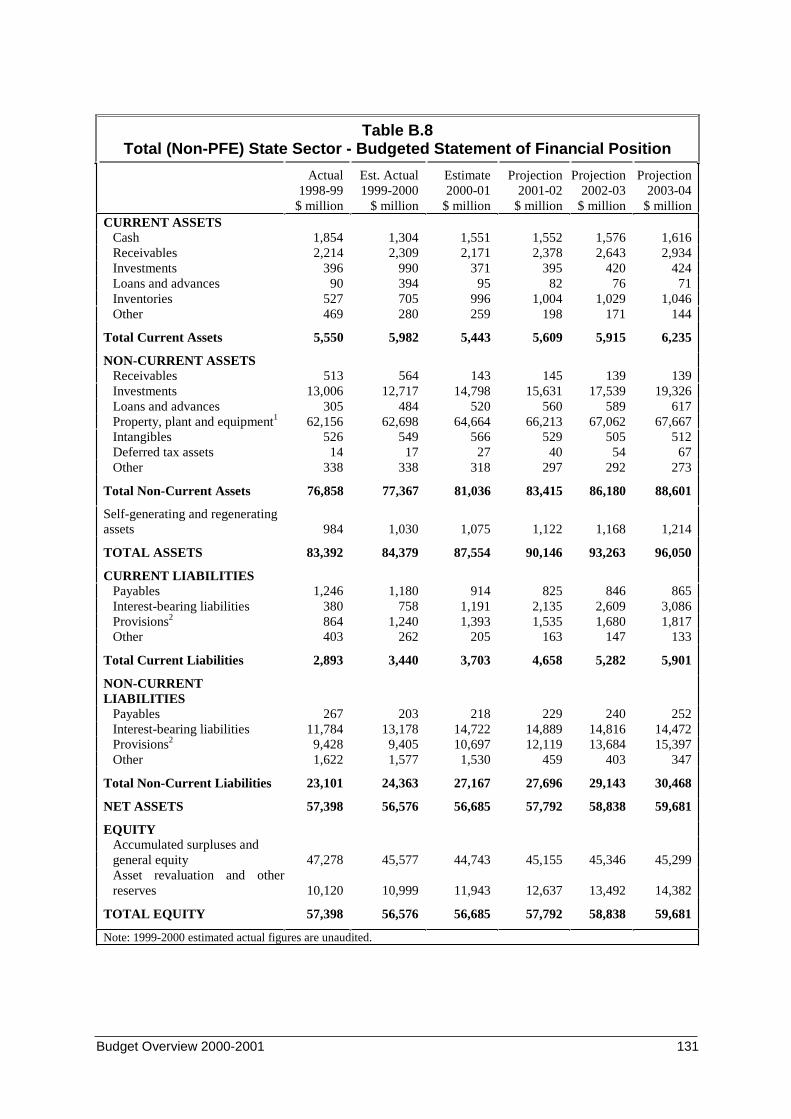
Budget Overview 2000-2001 131
Table B.8Total (Non-PFE) State Sector - Budgeted Statement of Financial Position
Actual1998-99
$ million
Est. Actual1999-2000
$ million
Estimate2000-01
$ million
Projection2001-02
$ million
Projection2002-03
$ million
Projection2003-04
$ millionCURRENT ASSETS
Cash 1,854 1,304 1,551 1,552 1,576 1,616Receivables 2,214 2,309 2,171 2,378 2,643 2,934Investments 396 990 371 395 420 424Loans and advances 90 394 95 82 76 71Inventories 527 705 996 1,004 1,029 1,046Other 469 280 259 198 171 144
Total Current Assets 5,550 5,982 5,443 5,609 5,915 6,235
NON-CURRENT ASSETSReceivables 513 564 143 145 139 139Investments 13,006 12,717 14,798 15,631 17,539 19,326Loans and advances 305 484 520 560 589 617Property, plant and equipment1 62,156 62,698 64,664 66,213 67,062 67,667IntangiblesDeferred tax assets
52614
54917
56627
52940
50554
51267
Other 338 338 318 297 292 273
Total Non-Current Assets 76,858 77,367 81,036 83,415 86,180 88,601
Self-generating and regeneratingassets 984 1,030 1,075 1,122 1,168 1,214
TOTAL ASSETS 83,392 84,379 87,554 90,146 93,263 96,050
CURRENT LIABILITIESPayables 1,246 1,180 914 825 846 865Interest-bearing liabilities 380 758 1,191 2,135 2,609 3,086Provisions2 864 1,240 1,393 1,535 1,680 1,817Other 403 262 205 163 147 133
Total Current Liabilities 2,893 3,440 3,703 4,658 5,282 5,901
NON-CURRENTLIABILITIES
Payables 267 203 218 229 240 252Interest-bearing liabilities 11,784 13,178 14,722 14,889 14,816 14,472Provisions2 9,428 9,405 10,697 12,119 13,684 15,397Other 1,622 1,577 1,530 459 403 347
Total Non-Current Liabilities 23,101 24,363 27,167 27,696 29,143 30,468
NET ASSETS 57,398 56,576 56,685 57,792 58,838 59,681
EQUITYAccumulated surpluses andgeneral equity 47,278 45,577 44,743 45,155 45,346 45,299Asset revaluation and otherreserves 10,120 10,999 11,943 12,637 13,492 14,382
TOTAL EQUITY 57,398 56,576 56,685 57,792 58,838 59,681
Note: 1999-2000 estimated actual figures are unaudited.
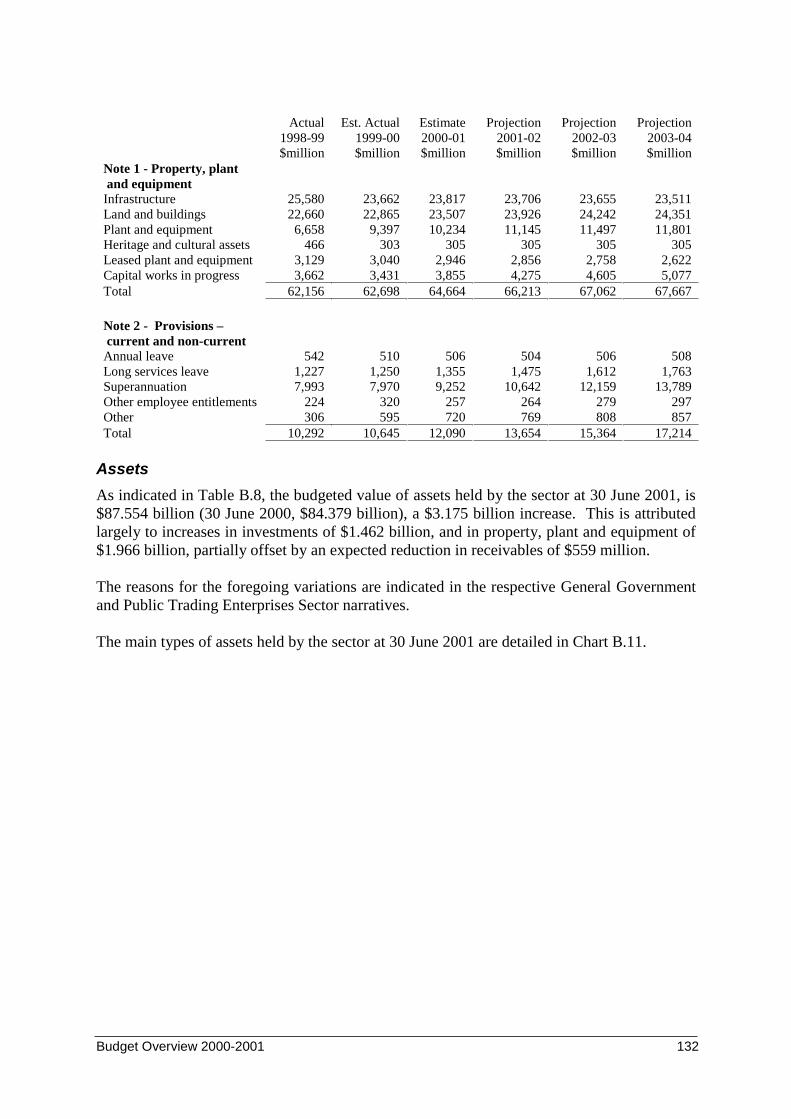
Budget Overview 2000-2001 132
Actual 1998-99 $million
Est. Actual 1999-00 $million
Estimate 2000-01 $million
Projection 2001-02 $million
Projection 2002-03 $million
Projection 2003-04 $million
Note 1 - Property, plant and equipmentInfrastructure 25,580 23,662 23,817 23,706 23,655 23,511Land and buildings 22,660 22,865 23,507 23,926 24,242 24,351Plant and equipment 6,658 9,397 10,234 11,145 11,497 11,801Heritage and cultural assets 466 303 305 305 305 305Leased plant and equipment 3,129 3,040 2,946 2,856 2,758 2,622Capital works in progress 3,662 3,431 3,855 4,275 4,605 5,077Total 62,156 62,698 64,664 66,213 67,062 67,667
Note 2 - Provisions – current and non-currentAnnual leave 542 510 506 504 506 508Long services leave 1,227 1,250 1,355 1,475 1,612 1,763Superannuation 7,993 7,970 9,252 10,642 12,159 13,789Other employee entitlements 224 320 257 264 279 297Other 306 595 720 769 808 857Total 10,292 10,645 12,090 13,654 15,364 17,214
Assets
As indicated in Table B.8, the budgeted value of assets held by the sector at 30 June 2001, is$87.554 billion (30 June 2000, $84.379 billion), a $3.175 billion increase. This is attributedlargely to increases in investments of $1.462 billion, and in property, plant and equipment of$1.966 billion, partially offset by an expected reduction in receivables of $559 million.
The reasons for the foregoing variations are indicated in the respective General Governmentand Public Trading Enterprises Sector narratives.
The main types of assets held by the sector at 30 June 2001 are detailed in Chart B.11.
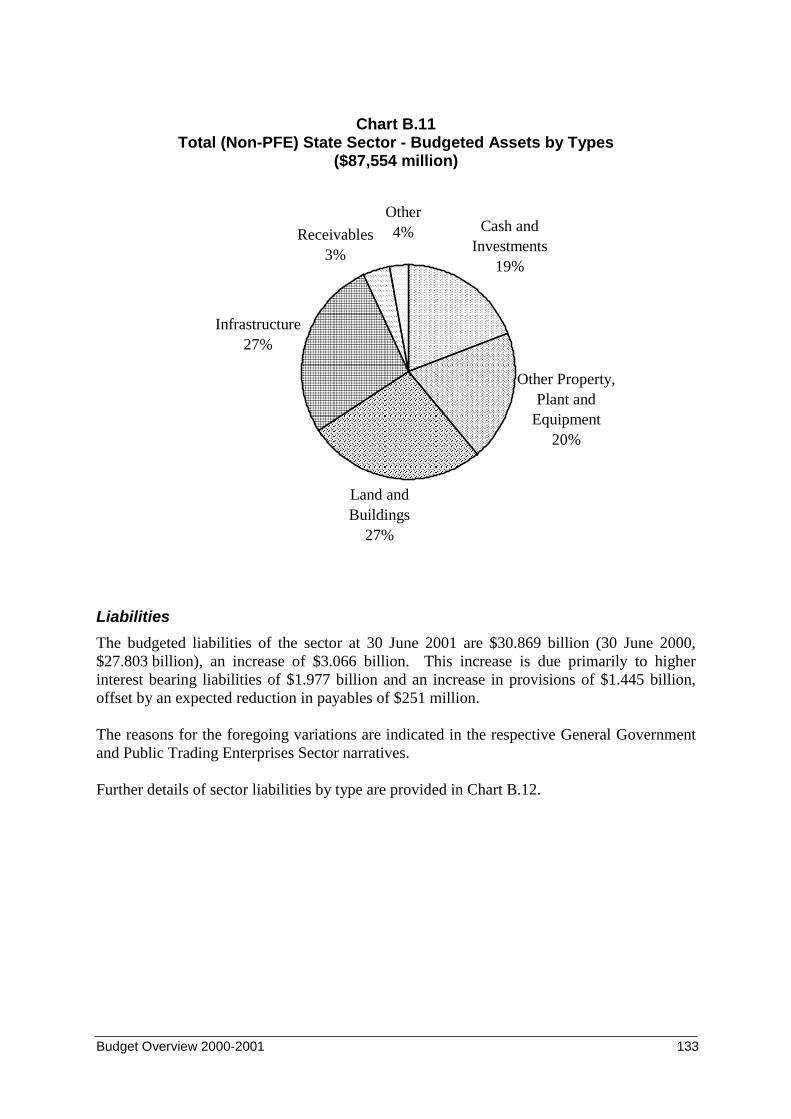
Budget Overview 2000-2001 133
Chart B.11Total (Non-PFE) State Sector - Budgeted Assets by Types
($87,554 million)
Liabilities
The budgeted liabilities of the sector at 30 June 2001 are $30.869 billion (30 June 2000,$27.803 billion), an increase of $3.066 billion. This increase is due primarily to higherinterest bearing liabilities of $1.977 billion and an increase in provisions of $1.445 billion,offset by an expected reduction in payables of $251 million.
The reasons for the foregoing variations are indicated in the respective General Governmentand Public Trading Enterprises Sector narratives.
Further details of sector liabilities by type are provided in Chart B.12.
Cash and Investments
19%
Other Property, Plant and
Equipment20%
Land and Buildings
27%
Infrastructure27%
Other4%Receivables
3%
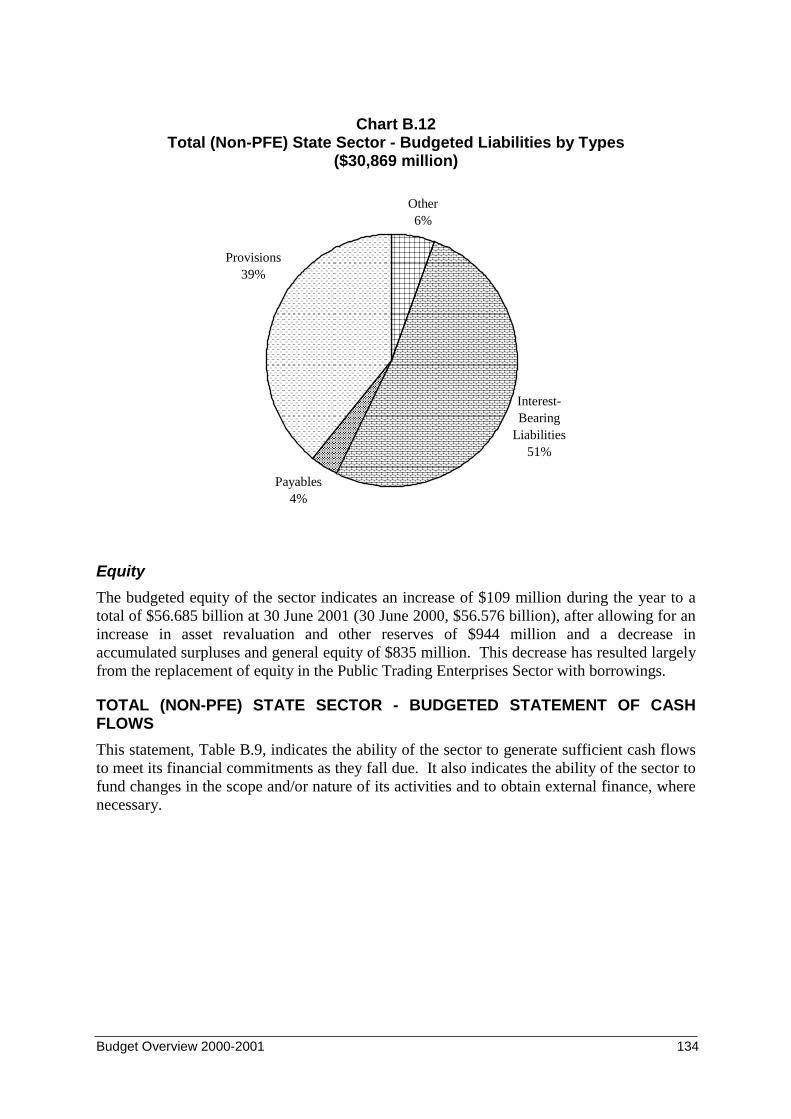
Budget Overview 2000-2001 134
Chart B.12Total (Non-PFE) State Sector - Budgeted Liabilities by Types
($30,869 million)
Equity
The budgeted equity of the sector indicates an increase of $109 million during the year to atotal of $56.685 billion at 30 June 2001 (30 June 2000, $56.576 billion), after allowing for anincrease in asset revaluation and other reserves of $944 million and a decrease inaccumulated surpluses and general equity of $835 million. This decrease has resulted largelyfrom the replacement of equity in the Public Trading Enterprises Sector with borrowings.
TOTAL (NON-PFE) STATE SECTOR - BUDGETED STATEMENT OF CASHFLOWS
This statement, Table B.9, indicates the ability of the sector to generate sufficient cash flowsto meet its financial commitments as they fall due. It also indicates the ability of the sector tofund changes in the scope and/or nature of its activities and to obtain external finance, wherenecessary.
Other6%
Interest-Bearing
Liabilities51%
Payables4%
Provisions39%
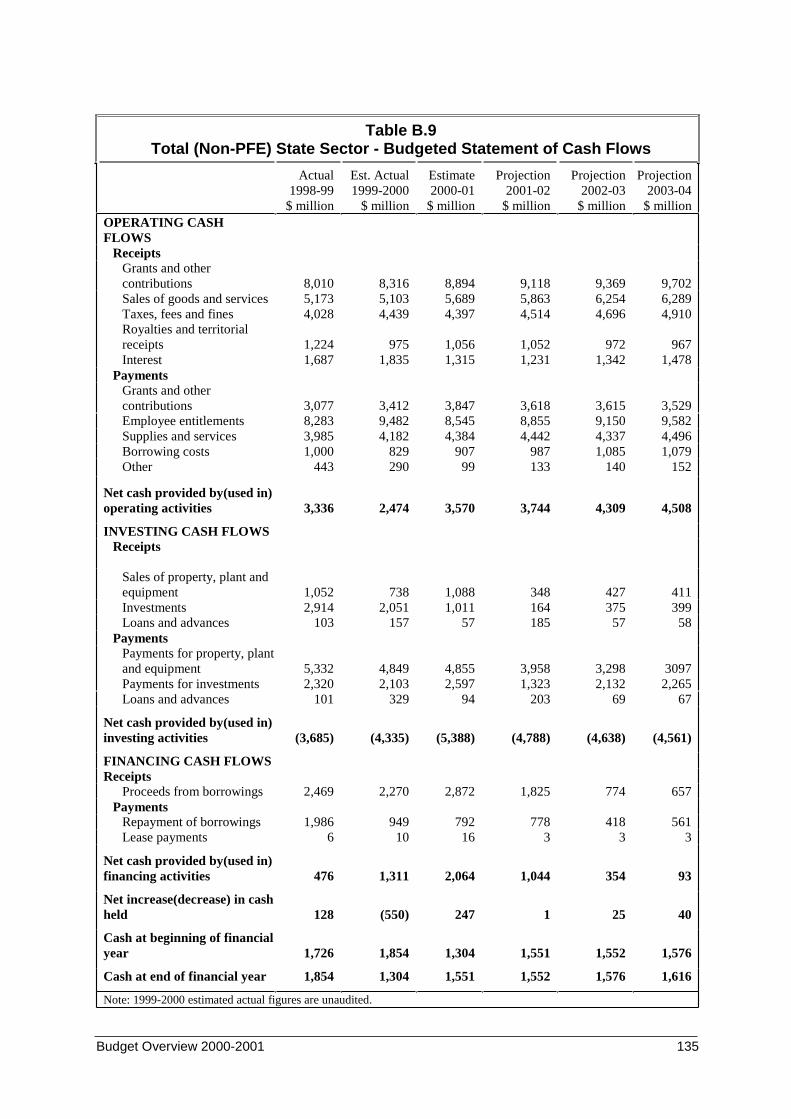
Budget Overview 2000-2001 135
Table B.9Total (Non-PFE) State Sector - Budgeted Statement of Cash Flows
Actual1998-99
$ million
Est. Actual1999-2000
$ million
Estimate2000-01
$ million
Projection2001-02
$ million
Projection2002-03
$ million
Projection2003-04
$ millionOPERATING CASHFLOWS
ReceiptsGrants and othercontributions 8,010 8,316 8,894 9,118 9,369 9,702Sales of goods and servicesTaxes, fees and finesRoyalties and territorialreceiptsInterest
5,1734,028
1,2241,687
5,1034,439
9751,835
5,6894,397
1,0561,315
5,8634,514
1,0521,231
6,2544,696
9721,342
6,2894,910
9671,478
PaymentsGrants and othercontributions 3,077 3,412 3,847 3,618 3,615 3,529Employee entitlements 8,283 9,482 8,545 8,855 9,150 9,582Supplies and services 3,985 4,182 4,384 4,442 4,337 4,496Borrowing costs 1,000 829 907 987 1,085 1,079Other 443 290 99 133 140 152
Net cash provided by(used in)operating activities 3,336 2,474 3,570 3,744 4,309 4,508
INVESTING CASH FLOWSReceipts
Sales of property, plant andequipment 1,052 738 1,088 348 427 411Investments 2,914 2,051 1,011 164 375 399Loans and advances 103 157 57 185 57 58
PaymentsPayments for property, plantand equipmentPayments for investments
5,3322,320
4,8492,103
4,8552,597
3,9581,323
3,2982,132
30972,265
Loans and advances 101 329 94 203 69 67
Net cash provided by(used in)investing activities (3,685) (4,335) (5,388) (4,788) (4,638) (4,561)
FINANCING CASH FLOWSReceipts
Proceeds from borrowings 2,469 2,270 2,872 1,825 774 657Payments
Repayment of borrowings 1,986 949 792 778 418 561Lease payments 6 10 16 3 3 3
Net cash provided by(used in)financing activities 476 1,311 2,064 1,044 354 93
Net increase(decrease) in cashheld 128 (550) 247 1 25 40
Cash at beginning of financialyear 1,726 1,854 1,304 1,551 1,552 1,576
Cash at end of financial year 1,854 1,304 1,551 1,552 1,576 1,616
Note: 1999-2000 estimated actual figures are unaudited.
Budget Overview 2000-2001 136
Cash Flows
Total cash inflows from operating, investing and financing activities are expected to exceedcash outflows, resulting in a $247 million increase in cash held between the beginning andend of the 2000-01 year (1999-2000, $550 million decrease in cash held).

Budget Overview 2000-2001 137
Budget Overview 2000-2001 138
APPENDIX C
STATEMENT OF RISKSINTRODUCTION
Consistent with the Charter of Social and Fiscal Responsibility, the following analysis isprovided of the sensitivity of the fiscal estimates to changes in the major economic and otherassumptions used in estimating the Budget and forward estimates. This analysis is provided,as required under the Charter, to enhance the level of transparency and accountability of theGovernment.
The Queensland State Budget, like those of other States and Territories, is based in part onassumptions made about future elements of uncertainty which are both internal and externalto the State operating environment, but which can impact directly, either positively ornegatively, on the Budget outcome and forward years.
The forward estimates of revenue and expenses in the 2000-01 Budget are based on a numberof major economic and other assumptions about the future state of the economy inQueensland.
Notwithstanding the risks associated with the Budget, Queensland is in the best position ofany State or Territory to absorb unforeseen adjustment developments. Queensland’s AAAcredit rating, based on its relative low tax status, strong balance sheet and negative net debtposition (including fully funded employee entitlements of superannuation and long serviceleave) means it has greater capacity than any other jurisdiction in Australia to withstand therisks that are normally associated with any State or Territory Budget.
ECONOMIC
The forward estimates of revenue and expenses are sensitive to the assumptions made inregard to the economic environment within which the Budget is positioned. The risks to theeconomic outlook for the State in 2000-01, both positive and negative, are discussed in detailin Chapter 1 of Budget Paper 3. This Appendix identifies some key risks in the context oftheir potential impact on the budget position.
The rate of growth in tax revenues is dependent on the rate of growth in economic activity inthe State, with some taxes being closely related to activity in particular sectors of theeconomy, while others are broadly related to the general rate of economic growth.
Payroll tax is a major source of tax revenue for the State Government, with growth in payrolltax revenue related to employment and wages growth. If the expected outcome for growth ingross state product is lower than forecast, there is a risk that employment growth also will belower than forecast, with an ensuing adverse impact on payroll tax revenue. Equally, shouldemployment growth be stronger than forecast, there will be a positive impact on Staterevenues.
Budget Overview 2000-2001 139
State Government expenditure can be more closely associated with socio-demographicfactors, such as the number of school age children or the number of elderly residents, thanwith economic activity. The rate of inflation impacts on nominal government expenditurethrough the effect of price movements on wage settlements and costs of providing services,with labour being a major component of current outlays. Offsetting this is the effect thatrising prices have on some components of revenue, such as stamp and conveyance duties.
There is some risk to State expenditure should the impact of the GST on inflation be greaterthan expected. If this eventuates and results in general national wage pressures, there may beadded risks to real economic activity and revenues from further, but currently unanticipated,monetary tightening.
Key economic variables in the context of the budget position are therefore the rate ofinflation, the rate of growth in gross state product, and the rate of growth in gross stateexpenditure (which abstracts external trade flows from gross state product).
Further information on economic risks is contained in Chapter 1 of Budget Paper 3.
REVENUE AND EXPENSES
Government Policy
The forward estimates in the Budget are framed on a no policy change basis. That is, theexpenditure and revenue policies in place at the time of the Budget (including thoseannounced in the Budget) are applied consistently through the forward estimates period.
Many factors can influence the demand for goods and services, and therefore the cost ofmaintaining existing policies, including the broader social, demographic and economic trendsand flow on effects of policy changes. This is particularly evident in the health, education,community services and criminal justice sectors. For example, demand for public healthservices is directly influenced by the take up of private health insurance, which is aCommonwealth Government policy objective.
While these impacts have been estimated and allowances made in the Budget and forwardestimates to accommodate them, the actual outcome may differ from the estimates calculatedfor the Budget.
Commonwealth National Taxation Reform
The Commonwealth Government’s national tax reform package was introduced with effectfrom 1 July 2000. As part of this package, the Commonwealth and all State and TerritoryGovernments signed an Intergovernmental Agreement on the Reform ofCommonwealth-State Financial Relations (IGA). Under this agreement, there have beensubstantial changes to the funding arrangements for States and Territories, includingcompensation for certain costs and revenue foregone.

Budget Overview 2000-2001 140
Estimates of Commonwealth GST Revenue grants to States and Territories are dependent onGST revenue collections. The Commonwealth Government has provided estimates of GSTcollections in its Budget Papers. Over time, GST collections are likely to be closelycorrelated with the general level of economic activity, especially household finalconsumption expenditure. In the early years of operation of the GST, there is likely to be agreater degree of uncertainty as to the level of revenue collections. As a result, under theIGA, the Commonwealth has agreed to provide transitional assistance, so that States andTerritories’ budgetary positions are no worse or better off. This ameliorates risks pertainingto Commonwealth general revenue for the first two years following the introduction of theGST. Following that, Queensland’s budget will bear the risks of fluctuations in GSTrevenues and the other components of the package (First Home Owner Grant, administrativecosts associated with the GST, gambling tax losses, etc).
However, not all costs and foregone revenues were recognised by the Commonwealth innegotiating the IGA. Significant set-up costs are being incurred by government agencies. Tothe extent that the actual set-up costs vary from the estimates, or agencies’ preparations forthe GST prove inadequate, there may be an adverse budgetary impact. A GSTImplementation Unit has been established in Queensland Treasury to assist agencies toprepare for the GST and minimise ongoing compliance costs.
The IGA does not wholly protect the Queensland Budget (because if the State’s generalrevenue funding relativity determined by the Commonwealth Grants Commission falls, thenthe guaranteed minimum payment from the Commonwealth also falls, and the State can stillpotentially lose budgetary funding). The IGA does ensure, however, that the GST does notprovide any extra funding to Queensland over what it would have received for at least twoyears.
Commonwealth Grants (Specific Purpose Payments)
Specific Purpose Payments (SPPs) are payments made by the Commonwealth to promote itspolicy objectives. Indexation arrangements and distribution among the States vary for eachSPP. The Commonwealth reviews the payments each year and while it has guaranteed it willnot reduce SPPs as a result of national tax reform, the State has insufficient certainty thatSPPs will not be reduced for other purposes by the Commonwealth.
Royalties
Estimates of mining royalties are sensitive to movements in the $A/$US exchange rate andcommodity prices. Given the multiplicity of minerals, estimating the impact of commodityprice fluctuations is inherently difficult. However, a significant movement in the order offive cents, on average, in the $A/$US exchange rate would be required to have any materialimpact on royalties revenue.
Government Owned Corporations (GOCs)
Forecasts for dividends, tax equivalents and community service obligations (CSOs) for theGOCs are derived from best available information at the time the Budget figures arecompiled. GOCs generally are operating in highly competitive markets where tradingconditions may be subject to volatile fluctuations. As a result, ongoing volatility may resultin variations in the earnings of GOCs, which in turn impacts on dividends and taxequivalents. This volatility may also impact on CSO requirements. The impact may bepositive or negative depending on prevailing market conditions.
Budget Overview 2000-2001 141
Investment Returns
Investment earnings are based on the assumption of long-term average returns for anacceptable level of risk. These investments principally cover the superannuation investmentfunds. The Government’s financial investments are held in a balanced portfolio comprisingcash, property, domestic and offshore equities and fixed interest.
A fluctuation in investment returns from the projected long-term average returns will affectrevenues. The net impact on the Budget, however, depends on the extent to which thoseadditional revenues must be passed onto employees as part of their superannuationentitlements – a matter for actuarial assessment by the State Actuary in accordance with theprovisions of the State’s superannuation schemes.
Actuarial Estimates of Superannuation and Long Service Leave
Liabilities for superannuation and long service leave are estimated actuarially with referenceto, among other things, assumed rates of real investment return and costings of the State’sdefined and accumulation benefit schemes for superannuation. These liabilities are thereforesubject to the risk that the real investment returns achieved over time by the underlying assetswill differ from those assumed. Similarly, the long service leave liabilities are subject to therisk that the actual rates of employee retention will vary from those assumed in the liabilitycalculation.
Depreciation
The Queensland Government requires all General Government Sector agencies tocomprehensively revalue their non-current assets at five year intervals, with interimrevaluations conducted annually using the deprival value methodology. Based on past years’experience, this has usually resulted in modest increases in asset values which are eithercommensurate with, or slightly more than, the general rate of inflation. However, it cannotnecessarily be assumed that this will always be the case and should there be significantincreases or decreases in the values of major infrastructure assets there will be acorresponding impact on depreciation expense (see also Net Worth below).
Public Sector wage costs
The impact of enterprise bargaining agreements for the general public sector and QueenslandRail has been included in the Budget and forward estimates. These EB agreements includescope for the parties to discuss the wage increases should there be any significant inflationarydevelopments due to the introduction of the GST, across the life of the agreement, whichnegatively impacts on employees generally (taking into account compensation providedthrough tax cuts or transfer payments).
The Budget does not allow for the potential for further wage increases for the life of theagreements recently ratified or anticipated in the near future. A contingency provision forwage increases beyond the current agreements has been provided in the outyear forwardestimates.
Budget Overview 2000-2001 142
NET WORTH
A key performance indicator in the Charter is Total State Net Worth. The operating outcomeof the General Government Sector will have an impact on Total State Net Worth, as will anysignificant changes in asset values resulting in from the application of the State’s assetvaluation policy. At present, the State uses the deprival value methodology, which isequivalent to depreciated current replacement cost. However, from 1 July 2000, the revisedAustralian Accounting Standard AAS 10 will be applied generally and the new AustralianAccounting Standard AAS 38 will be introduced, although departments will have until30 June 2002 before full implementation becomes mandatory.
The Commonwealth Department of Finance is presently evaluating the relationship betweendeprival value and fair value and will make the results of its studies available to the Statesand Territories. At this stage, there is insufficient information to quantify with any degree ofcertainty the likely impact of applying these standards. Nevertheless, there is somelikelihood that the application of these new asset valuation standards will have a materialimpact on net worth in all jurisdictions, including Queensland, over the next few years.
CONTINGENT ASSETS AND LIABILITIESContingent assets and liabilities represent items that are not included in the Budget assignificant uncertainty existed as to whether the Government would receive or sacrifice futureeconomic benefits in respect of these items. Nevertheless, such contingencies need to berecognised and managed wherever possible in terms of their potential impact on theGovernment’s financial position in the future.
CONTINGENT LIABILITIES
Guarantees
These mainly comprise guarantees by the State Government in respect of borrowings by localgovernments from the Queensland Treasury Corporation.
Queensland Treasury Corporation (QTC) – Stock Loans
In support of an active trading and pricing market for QTC stock, the Corporation lends stockto various financial institutions on the basis that it forms part of its total exposure to theinstitution concerned.
Queensland Power Trading Corporation - Power Purchase Agreements
The Corporation has a number of long-term contractual commitments through PowerPurchase Agreements that impose upon the Corporation future obligations to purchaseelectricity from independent power producers.
Suncorp, QIDC and Metway Bank Merger
To facilitate the merger of the former State-owned financial institutions, Suncorp Insuranceand Finance and Queensland Industry Development Corporation with Metway Bank Ltd, theState Government provided guarantees relating to certain obligations of the QueenslandGovernment and Suncorp General Insurance Ltd. The most significant guarantees expiredwithin twelve months of the merger, while remaining guarantees continue to reduce eachyear.
Budget Overview 2000-2001 143
Legal Proceedings and Disputes
A number of legal actions have been brought against the State Government and its agencies.Notification also has been received of a number of other cases that are not yet subject to courtaction but which may result in litigation. Due to the wide variety and nature of the claimsand the uncertainty of any potential liability, no value has been attributed to the claims.
Native Title
In excess of 200 native title claims that affect the Queensland Government have been filedwith the Federal Court under the Commonwealth Native Title Act 1993 (the Act). The Actprovides for payment of compensation to native title holders for a variety of acts that mayaffect native title. It is possible that the Queensland Government may face future litigationand liability in respect of these claims and acts. Given the subjectivity of the issue, it isinappropriate to attempt to determine the likely success of such claims or to quantify anypotential liability for these acts.
Aborigines Welfare Fund and Associated Accounts
Until the 1970s, the State controlled most aspects of Indigenous people’s lives under a seriesof Acts which provided for work, wages and savings schemes. A 1991 report to Governmentwas critical of the administration of the property and wages regime.
Since 1992, successive Labor Governments have made public commitments to resolving theissue by negotiation. In June 2000, Cabinet agreed to a negotiating framework, rather thandefending legal action likely to be brought by claimants under a number of classes oflitigation.
Whilst there have been some estimates of likely impacts on the Budget should thenegotiations be successful, the quantum of any reparations payments, the number ofclaimants and the administrative arrangements that need to be established in association withthis process have yet to be determined with any degree of reliability.
WorkCover
The WorkCover Queensland Act 1996 provides that every WorkCover policy or otherinsurance contract with WorkCover Queensland (a statutory body) is guaranteed by the Stateof Queensland. Given the nature of this contingency, it is not possible to estimate theliability, if any, due under this heading.
Queensland Investment Corporation
The Queensland Investment Corporation acts as trustee of certain property and other trustsand is potentially liable for any unsettled liabilities of these trusts. However, under therespective Trust Deeds, the Corporation is entitled to be indemnified out of the assets of theTrusts against any losses or outgoings sustained in its role as Trustee.
The State Government has assessed the recoverable amounts of the assets of the Trusts andconcluded that, currently, they have excess assets over liabilities.
Budget Overview 2000-2001 144
Cross Border Lease Transactions
Certain agencies have entered into cross border lease transactions resulting in a contingentliability to the State Government. QTC has assumed responsibility for a significant portionof the transaction risk relating to these leases, and if certain events occur, could be liable tomake additional payments in terms of the lease agreements. QTC has made explicitprovisions to cover the risks involved, which have been approved by the Auditor-General.However, external advice and history to date indicate that the likelihood of liability is remote.
In addition, QTC has provided certain guarantees and indemnities to various participants inthe cross border lease transactions. External advice is that, unless exceptional circumstancesarise, QTC will not be required to make material payments under these guarantees andindemnities.
Cost of Greenhouse Emissions Permits for Electricity Generators
The Kyoto Protocol to the Framework Convention on Climate Change includes a provisionfor trading in greenhouse emissions between world jurisdictions. The CommonwealthGovernment is considering the introduction of a domestic greenhouse emissions tradingscheme to facilitate Australia’s participation in this international trade. It is expected to makean in-principle decision on the adoption of domestic emissions trading in 2000, although itcould be several years before the details of such a scheme are finalised.
A requirement to hold permits to cover greenhouse emissions will have implications anumber of GOCs, particularly the electricity generation corporations (CS Energy, TarongEnergy and Stanwell Corporation) as the energy sector is the largest source of greenhouseemissions. The cost to these corporations will depend on the system of permit allocationadopted, but it is likely that they will need to purchase permits for emissions in excess of thefree allowance agreed by the Commonwealth Government. Queensland Rail may also beaffected, as would DPI Forestry, which could earn credits for carbon dioxide offsets.However, any potential impacts are likely to be incurred in the outyears and not in 2000-01.
CONTINGENT ASSETS
Suncorp and Metway Bank Merger
During the year ended 30 June 1997, Suncorp General Insurance Limited (formerly SuncorpInsurance and Finance) transferred a contingent asset to Queensland Treasury Holdings PtyLtd related to the proceeds from objections lodged with the Australian Taxation Office(‘ATO’) regarding income tax assessments for the years ended 30 June 1991 to 30 June 1996inclusive. This matter remains under consideration by the ATO.
Also, during the year ended 30 June 1997, Suncorp Group Holdings Ltd (formerly SuncorpBuilding Society Ltd) transferred a contingent asset to Queensland Treasury Holdings Pty Ltdin relation to an objection lodged with the ATO relating to an income tax assessment for theyear 30 June 1994. The ATO has disallowed the objection. The Government is currentlyappealing the matter before the High Court.

Budget Overview 2000-2001 145
Budget Overview 2000-2001 146
APPENDIX D
BACKGROUND AND INTERPRETATION OF GOVERNMENTFINANCE STATISTICSINTRODUCTIONGovernment Finance Statistics (GFS) data is used extensively in the presentation of financialstatement information in the Budget papers. This appendix provides background informationon GFS, including the conceptual basis for GFS and its relationship with accountingstandards and presentation.
In addition the appendix includes sector definitions, an explanation of main terms, and a listof reporting entities.
BACKGROUNDThe concepts underlying GFS financial information are developed by the Australian Bureauof Statistics (ABS). ABS GFS standards are largely based on international statisticalstandards (the International Monetary Fund Manual on Government Finance Statistics andthe United Nations System of National Accounts). GFS are widely used by governments,commentators, academics and ratings agencies as a consistent and uniform standard by whichto compare the fiscal performance of a jurisdiction both over time and with otherjurisdictions.
GFS have been the basis for the Australian Loan Council’s Uniform Presentation Framework(UPF) since its introduction in 1991. The UPF is an agreement by members of the AustralianLoan Council to present financial information for each jurisdiction on a consistent anduniform basis to assist in the comparative analysis of the fiscal performance of jurisdictions.
GFS concepts are also used to prepare the Loan Council Allocation nomination, an importantindicator of the net borrowing requirement of governments, which requires Loan Councilapproval.
RECENT DEVELOPMENTS IN GFS REPORTING
Accrual Uniform Presentation Framework
In March 2000, the Australian Loan Council agreed to an accrual GFS framework developedby the Australian Bureau of Statistics in close consultation with Commonwealth, State andTerritory Governments.
Under this agreement, jurisdictions have until 2002-03 Budget year to fully implementreporting on an accrual UPF basis, although most jurisdictions will have implemented this intheir 2000-01 Budgets.
As Queensland’s 1999-2000 Budget was presented on an accrual GFS basis, this is the secondyear in which Queensland has reported accrual GFS data.
Budget Overview 2000-2001 147
RELATIONSHIP WITH STANDARD ACCOUNTING TREATMENT
Financial information prepared in accordance with accounting standards and GFS, while bothutilising the new accrual accounting systems developed by governments, in effect provide twodifferent, but complementary, views of the financial positions of governments.
Financial statements prepared in accordance with accounting standards measure the operatingresult and net worth of government, using a standard presentation which is compatible withprivate sector standards (General Purpose Financial Reports - GPFR). This allowscomparability with like statements in the private sector and also with other governments.
GFS, on the other hand, measures the economic impact of government activity by excludingthe impact of changes to asset values that are deemed to be outside the control of government.
GFS is derived from the same source data as used in the GPFR. In the accrual GFSpresentation, financial information generally is presented in a format similar to standardaccounting statements. In a number of cases, different interpretations or presentations areused to highlight particular aggregates that are relevant to macro-economic analysis of theState’s financial position.
The major ways in which the GFS presentation differs from the GPFR include:
• the inclusion of dividends and taxation equivalent provisions in the calculation of the netoperating result;
• the exclusion of asset valuation changes, eg profit/loss in sale of assets and write-offs,from the operating result calculation;
• the availability of an extension of the operating statement that explains the application ofthe net operating result; and
• a balance sheet presentation that provides information on financial and non-financialassets, and does not distinguish between current and non-current assets and liabilities.
INTERPRETATION OF GFS
GFS provides a consistent and uniform framework to analyse and measure the impact ofgovernment activity on the rest of the economy, to gauge the sustainability of governmentfiscal policy, and to monitor the efficiency of the allocation and use of government resources.
The accrual GFS series measures both stocks and flows. Stocks are economic aggregatesmeasured at a point in time, reflecting the position or holding of assets and liabilities at thatpoint in time, generally measured at market prices. Flows represent the movement in thestock of assets and liabilities between two points in time. In GFS, flows comprise twoseparate types. Flows can represent a transaction, and/or a revaluation or other change in thevolume of net assets.
Budget Overview 2000-2001 148
The transaction component of flows is separated from revaluations and ‘other change in thevolume of assets' flows, in order to gauge the impact of government decisions on the rest ofthe economy. It is argued that any revaluation or other change in the volume of assets (suchas destruction, depletion or discovery of assets) is not within the control of government.Hence, in the GFS operating statement, any revenue or expense recognising thesenon-transaction flows is excluded and does not affect the net operating result.
RELATIONSHIP WITH ABS STATISTICS
Whilst there is generally strong alignment between Treasury and ABS data, there are twoareas where differences arise:
• GST ‘transitional assistance payments’. The ABS considers these payments to be either aloan or grant depending on how they are provided. Treasury with the advice of theQueensland Auditor General and in accordance with the treatment adopted by otherStates, has decided that the amount within the budget balancing assistance paymentsshould be treated as revenue.
• Queensland Sugar Corporation. The ABS includes the Queensland Sugar Corporation inits GFS statistics. Treasury and the Queensland Auditor General have reviewed the statusof the Queensland Sugar Corporation and have determined that it is not a controlled entityand hence is appropriately excluded from Treasury GFS data.
DIFFERENCES BETWEEN GFS AND GPFR’S
The major areas of difference are discussed below.
Bad and Doubtful Debts
Provisions for bad debts that are expensed in a standard accounting presentation are notregarded as a flow in GFS, as they do not represent an economic transaction. Theseprovisions are excluded from GFS operating expenses and are reflected as an adjustment tothe level of accounts receivable in the balance sheet.
Bad debts written off either from prior provisions or without prior provisioning are includedin GFS operating expense. This type of transaction is included as the bad debt written off isthe result of an economic transaction.
Distributions to Owners (Dividends)
Distributions to owners or shareholders, in the form of dividends or distributions are notnormally considered part of expenses in GPFR, and are reported as a payment from after taxprofits.
In GFS, dividend payments are treated as an expense and are therefore included in thecalculation of the net operating result.
Extraordinary Items
Extraordinary items occur outside the scope of normal operations, are non-recurring in nature,and have a significant impact on the operating result.
These items are disclosed separately in AAS31 statements and may impact on the operatingresult at different levels.
Budget Overview 2000-2001 149
In GFS, items are recorded against the revenue or expense item that they relate to. Where anextraordinary item represents an adjustment for past period expenses or revenue, GFS willonly record that portion applicable to the current period. Adjustments will therefore benecessary to past periods, or future periods, if the case is appropriate.
Fees and Fines
GFS records fees as user charges or sales of goods and services. Fines are now recorded aspart of other revenue. In the GPFR, fees and fines are recorded under the broad category oftaxes, fees and fines.
Market Valuation Adjustments
GFS presents debt servicing costs and borrowings on a market value basis. In the GPFR,market valuations effects are taken up at whole of government level and consequently do notappear in the sector level data. This creates differences in the operating statement betweeninterest expense and the operating surplus.
Similarly, the borrowing figures, and consequently gross liabilities and net assets, differbetween the two presentations.
Non-Share Equity in Public Enterprises
Under the GFS presentation, General Government sector gross assets include non-shareequity (net assets less share capital) of Public Trading Enterprises and Public FinancialEnterprises. As a result, General Government gross and net assets are typically higher thanunder the GPFR presentation. Because this asset is eliminated upon consolidation, GeneralGovernment Net Worth (Net Assets) is equal to State Non-Financial sector Net Worth.
Revaluations
Revaluations (including profit or loss on asset sales) represent a change in the value of anasset or liability arising from a change in market prices.
In the GPFR, revaluations representing decrements in asset values are usually brought toaccount as an expense in the operating statement or are recognised within the balance sheet inthe revaluation reserve (subsequent revaluation increments also can be brought to theoperating statement as revenue).
In GFS, revaluations that affect the GPFR operating statement are excluded from revenue andexpense, and hence do not impact on the GFS net operating result. Revaluations normallyincluded in the balance sheet are retained in the GFS net worth measure.
Superannuation
GFS distinguishes between those expenses relating to liabilities incurred in the current periodand those relating to liabilities accumulated in previous periods. Only the former is includedin the net operating balance.
Changes in liability due to an actuarial reassessment are either amortised over all periodsaffected or are treated as a revaluation.
Budget Overview 2000-2001 150
Treatment of the Revenue Replacement Grants
Following the invalidation of State Business Franchise Fees by the High Court in 1997, theCommonwealth Government implemented safety net arrangements on behalf of the States tosafeguard State revenue. This arrangement involved the Commonwealth collecting additionalexcise revenue on alcohol, tobacco and fuel and on-passing this to the States.
In GPFR, the receipt of these monies from the Commonwealth is treated as grant revenue andsubsequent subsidy payments to distributors is shown as expense.
In GFS, the receipt of these monies from the Commonwealth is shown as a tax revenue, andsubsequent subsidy payments to distributors treated as a negative tax revenue.
Reconciliation of GFS and GPFR Operating Results
Table D.1 provides a reconciliation for the General Government sector between the GFS andGPFR net operating result.
Table D.1Reconciliation of Main GFS General Government Measures to the Budget
Sector Operating ResultsActual
1998-99$ million
Est. Actual1999-00
$ million
Budget2000-01
$ million
Projection2001-02
$ million
Projection2002-03
$ million
Projection2003-04
$ million
GFS Net Operating Result 143 40 29 34 70 91
Plus Gains/losses on assets,including derivatives 347 (230) (178) 178 (162) (162)
Plus SEQWB grant .. 363 .. .. .. ..
Minus Book to MarketInterest adjustments 161 50 .. .. .. ..
Minus Provision for bad anddoubtful debts 6 .. 1 3 3 3
Equals GPFR OperatingSurplus (Deficit) 323 123 (150) 209 (95) (74)
In any given year, many different transactions and revaluations may be required to be takenup to derive the gains and losses on asset adjustment for the GFS net operation result. Theprincipal factor behind the adjustments is the anticipated depletion of assets by agencies (inparticular, the Department of Main Roads) each year. In 1998-99, however, it was more thanoffset by the actuarial re-assessment of the State’s superannuation scheme liability; and in2001-02, it is more than offset by the anticipated net gain for the State on theSuncorp-Metway Exchanging Instalment Notes Series 2 (which mature in that year andconvert to shares).
DEFINITION OF GFS SECTORS
The GFS presentation provides both a sectoral view of Queensland's financial position as wellas a consolidated view of the non-financial State public sector.
The scope and coverage of the GFS is identical to that of the GPFR contained in Appendix B.
Budget Overview 2000-2001 151
GFS presents financial statements for three sub-sectors of government: General Government,Public Trading Enterprise and Public Financial Enterprise.
General Government
The General Government sector comprises government departments, departmental businessunits and certain statutory agencies which provide goods and services of a non-market nature,that are charged at less than cost or at no cost or provide regulatory services.
The General Government sector is usually referred to as the core of government that isfinanced by general revenue (taxation).
Public Trading Enterprises
The PTE sector comprises various statutory authorities, government business enterprises andmarketing bodies which provide goods and services usually at cost or below cost through anexplicit government subsidy (community service obligation).
PTEs usually provide goods and services of a market nature, examples include QueenslandRail and the Queensland Electricity Supply Industry.
Public Financial Enterprises
The PFE sector comprises publicly owned financial institutions such as Queensland TreasuryCorporation, Queensland Investment Corporation and Workcover.
These entities provide financial services to the community or government, and usuallyprovide these services on a commercial basis.
Consolidated State sector
GFS also presents consolidated state sector financial statements, which represent the total ofall transactions of each sub-sector of government, with any inter-sector transactionseliminated. GFS follows the standard accounting methodology for performing eliminations.
Eliminations are necessary so as to avoid double counting of transactions between differentsectors of government, such as dividend payments by PTEs to General Government.
MAIN GFS AGGREGATES
GFS presents three main accrual-based measures: Net Operating Result, Net Lending andIncrease in Net Worth (INW).
Net Operating Result
Net Operating Result is defined as the excess of revenue over expenses, plus net transfers (egnet transfer payments to households).
GFS revenue excludes any gain or loss on assets brought to account in the profit and lossstatement. GFS expenses exclude provisions for bad and doubtful debts.
The Net Operating Result is arguably the best summary measure of a Government’s fiscalperformance, as it abstracts from valuation effects and focuses on financial impacts whichGovernment has the ability to manage.
Budget Overview 2000-2001 152
Net Operating Result is equivalent to the INW measure (see below), less the effects ofrevaluations.
Net Lending
The Net Lending measure is defined as Net Operating Revenue, less net acquisition ofnon-financial assets, plus consumption of fixed capital.
The measure effectively excludes depreciation as a measure of fixed assets consumed in aperiod from expenses and includes gross fixed capital expenditure, which represents the netcost of non-financial assets acquired. It therefore represents an increase in the net financialasset position, not including revaluations.
The accrual concept of Net Lending is broadly equivalent to the previous cash-based GFSdeficit measure.
In practical terms, Net Lending is the combination of the operating result, plus net transactionflows in the balance sheet, which together give an indication of the net financial resourcesrequired by Government.
Conceptually, Net Lending may be viewed as the net financial resources that governmenteffectively makes available for use by other sectors of the economy, or additional resourcesthat a government requires.
Increase in Net Worth
The INW measure may be measured from the balance sheet as the increase in the net assetposition, including non-financial assets (stock measure). It also may be measured as the NetOperating Result, plus revaluations.
INW represents the overall change in financial position, including financial and non-financialflows.
Budget Overview 2000-2001 153
GFS OPERATING STATEMENT GLOSSARY OF TERMS
REVENUETAXATION REVENUE
Income arising from levies imposed by the State that is mainly designed to raise revenue, andare prescribed under State tax legislation.
CURRENT GRANTS AND SUBSIDIES
Largely comprise payments received from the Commonwealth and industry and communitycontributions for the provision of State Government services.
SALES OF GOODS AND SERVICES
Represents revenue earned where the seller is seeking to recover the cost of goods supplied orservices rendered where there is a direct benefit to the user.
INTEREST INCOME
Represents the interest earned on Queensland’s superannuation investments.
OTHER
Other revenue comprises revenue from dividends, royalties and other property income, fines,revenue from financial and intangible assets, donations and grants received and miscellaneousrevenue.
EXPENSESGROSS OPERATING EXPENSES
Comprises depreciation, superannuation, and other operating expenses (employeeentitlements and supplies and services).
Depreciation represents the recognition of the cost of the estimated diminution in the state’sassets through wear, tear and obsolescence.
Superannuation expense represents the growth in the Government’s superannuationliabilities.
Employee entitlements include salaries and wages, annual and long service leave and workerscompensation expense.
Supplies and services comprises the costs of providing services to the community, andincludes administration costs, consultancies, payments to contractors and other overheadcosts such as electricity and other consumables.
CURRENT TRANSFERS
Includes Community Service Obligation (CSO) payments to Public Trading Enterprises andgrants to community, including schools, hospitals and benevolent institutions, personalbenefit payments and Commonwealth taxes including fringe benefits tax.
Budget Overview 2000-2001 154
CAPITAL TRANSFERS
Represents grants paid by the Government for capital works to the private sector and to otherpublic enterprises.
INTEREST
Comprises of interest paid by agencies, principally paid to the Queensland TreasuryCorporation on borrowings to acquire capital assets and infrastructure such as roads andgovernment buildings and also includes Nominal superannuation interest expense.
NOMINAL SUPERANNUATION INTEREST EXPENSE
This represents that component of the increase in the Government’s liability to its employeesthat is related to earnings on superannuation fund balances.
OTHER
Other expenses comprise items such as land rental and royalty expenses.
Budget Overview 2000-2001 155
REPORTING ENTITIESThe reporting entities included in the General Government and PTE sectors are detailedbelow.
GENERAL GOVERNMENT
Departments
Aboriginal and Torres Strait Islander Policy and Development
Communication and Information, Local Government, Planningand Sport
Corrective Services
Disability Services Queensland
Education
Electoral Commission of Queensland
Emergency Services
Employment, Training and Industrial Relations
Environmental Protection Agency
Equity and Fair Trading
Families, Youth and Community Care
Health
Housing
Housing Department (excluding Housing Trusts)
Justice and Attorney General
Legislative Assembly of Queensland
Main Roads
Mines and Energy
Natural Resources
Office of the Governor
Ombudsman
Police
Premier and Cabinet
Primary Industries (excluding Forestry)
Public Trust Office
Public Works
Queensland Ambulance Service
Queensland Audit Office
Queensland Fire & Rescue Authority
State Development
Tourism and Racing
Transport
Treasury
Statutory Authorities
Anti-Discrimination Commission Queensland
Board of Senior Secondary School Studies
Budget Overview 2000-2001 156
Bureau of Sugar Experiment Stations
Children’s Commissioner
Council of the Queensland Institute of Medical Research
Criminal Justice Commission
Legal Aid Queensland
Library Board of Queensland
Nickel Resources North Queensland
Queensland Art Gallery
Queensland Building Services Authority
Queensland Crime Commission
Queensland Events Corporation Pty Ltd
Queensland Fruit and Vegetable Growers
Queensland Infrastructure Financing Fund (QIFF) Trust
Queensland Institute of Medical Research Trust
Queensland Museum
Queensland Performing Arts Trust (QPAT)
Queensland Rural Adjustment Authority (QRAA)
Queensland School Curriculum Council
Queensland Theatre Company
Queensland Treasury Holdings (QTH)
Residential Tenancy Authority
Royal Children’s Hospital Foundation
SGH Limited
Southbank Corporation
Tertiary Entrance Procedures Authority
Tourism Queensland
Treasury Special Purpose Trust No. 1
PUBLIC TRADING ENTERPRISESBrisbane Cricket Ground Trust
Brisbane Market Authority
Bundaberg Port Authority
Cairns Port Authority
DPI Forestry
Eungella Water Pipeline Pty Limited
Gladstone Area Water Board
Gladstone Port Authority
Gold Coast Events Corporation
Golden Casket Lottery Corporation Limited
2001 Goodwill Games Brisbane Ltd
Home Purchase Assistance Account
Lang Park Trust
Mackay Port Authority
Budget Overview 2000-2001 157
Mt Isa Water Board
North West Queensland Water Pipeline Pty Limited
Pioneer Valley Water Board
Port of Brisbane Corporation
Ports Corporation of Queensland
Queensland Abattoir Corporation
Queensland Electricity Supply Industry
Queensland Motorways Limited
Queensland Rail
Rockhampton Port Authority
South East Queensland Water Board 1
Totalisator Administration Board of Qld (TAB) 2
Townsville Port Authority
Townsville Thuringowa Water Supply Board
Trustees of the Albion Park Paceway
1 The assets and equity of the South East Queensland Water Board were transferred to local Government jointventure company, South East Queensland Water Company, in March 2000.2 The TAB transferred to private ownership in November 1999.


![[XLS] · Web view2001 2 2003 4 2004 1 2006 1 1995 1 1990 1993 1998 1999 1999 1999 1999 2000 2000 2000 2000 2000 2001 2001 2001 2001 2001 2001 2001 2001 2001 2001 2001 2001 2001 2002](https://img.pdfslide.us/doc/110x75/5bdc2d6f09d3f2bc1c8d6ace/xls-web-view2001-2-2003-4-2004-1-2006-1-1995-1-1990-1993-1998-1999-1999-1999.jpg)